Methylene blue adsorption from aqueous solution by dehydrated peanut hull
Upload
khangminh22Category
view
0download
0
THE UNIVERSITY OF HULL
A QUESTIONNAIRE SURVEY OF THE TEACHING OF COMPUTER STUDIES, PUPILSATTITUDES TOWARD COMPUTERS AND PERCEPTIONS OF THE LEARNING ENVIRONMENT
being a Thesis submitted for the Degree of
Doctor of Philosophy
in the University of Hull
by
Jeffery Logan MOORE, BSc (Hons)(Birmingham), MSc(Hull)MPhil(Nottingham)
February 1988
A QUESTIONNAIRE SURVEY OF THE TEACHING OF COMPUTER STUDIES, PUPILS ATTITUDESTOWARD COMPUTERS AND PERCEPTIONS OF THE LEARNING ENVIRONMENT
Summary
Chapters 1 to 4 summarise previous studies of pupils' use of computers in
school and at home, attitudes of pupils toward computers, and correlates of
affective learning. Results from previous research were used to guide the
selection of the objectives of the study and its methodology set out in
Chapter 5. The development of the 206-item Checklist and other scales included
in the teacher instrument is described in Chapter 6 and the selection of scales
for the pupil questionnaire in Chapter 7.
Checklist responses from 253 teachers were used to identify 19 teaching
Activities and subsequently five Styles of Teaching. The characteristics of the
Styles were described in terms of the level of teachers' use of types of
resources and their classroom interactions with pupils and were found to be
associated with specific teacher variables. Pupil questionnaires were completed
by 2200 pupils in 102 classes. Boys, pupils with experience of using a computer
at home or at school, and those choosing science-based courses were shown to
have more favourable attitudes toward computers. Multiple regression analysis
was used to identify relationships between teacher and pupil characteristics,
teachers' Activities, perceptions of the classroom environment and attitudes
toward computers. A separate analysis was used to seek possible relationships
between Teaching Style and the 21 attitude and classroom environment scales. A
sample of 61 teachers provided information on their Computer Studies lessons. It
was found that most lessons belonged to one of a few patterns and used a narrow
range of resources. The relationships between lesson format, resource use,
teacher characteristics and pupil ability were studied.
The findings of the study are interpreted in terms of the pressures of
external examinations. Some implications of the findings for the teaching of
Information Technology or similar courses are given with a suggestion for
follow-up study.
Acknowledgements
The author gratefully acknowledges the support of all those who
have facilitated or helped with the production of this work.
He thanks the ESRC for a grant for the printing and distribution
of questionnaires. He is grateful to Professor R. Lewis of the
University of Lancaster and Coordinator of the ESRC-ITE programme for
his support and the calling of a half-day seminar to discuss the
proposed research at a formative stage. A list of the persons invited to
the seminar is given in the Appendix.
The cooperation of the teachers and pupils who completed
questionnaires and made useful suggestions is recognised. The research
would have been impossible without their help.
I thank my wife for her unfailing support and constructive
criticisms throughout the study and the preparation of this report.

Publications
Accounts of parts of the research described in this thesis have
appeared in the publications listed below. No offprints or direct
quotations from the published materials are included in the thesis.
Computer Education Activities and Pupils' Attitudes to Computers. ESRCEnd of Award Report C00232254, 1986.
Computer Education Activities and Pupils' Attitudes to Computers.Occasional paper ITE/18/87, ESRC-ITE, 1987.
Is using a computer at home more valuable than using a computer atschool? Computer Education 56, 13-14, 1986.
Teaching Computer Studies: teachers' attitudes and their effects onpupils. Computer Education, 57, 18-19, 1987.
The Identification of Teacher-style in Computer Studies: an analysis ofteachers' activities. Educational Studies, 13, 203-212, 1987.
Teaching Computer Studies: an investigation based on teachers' lessondiaries. Journal of Computer Assisted Learning, in press.
A study of the relationship between Teachers' Activities in ComputerEducation lessons and Pupils' Attitudes toward Computers. Paper acceptedfor International Conference on Pupils' Attitudes Toward Technology,University of Eindhoven, April 1988.
A QUESTIONNAIRE SURVEY OF THE TEACHING OF COMPUTER STUDIES, PUPILS'ATTITUDES TOWARD COMPUTERS AND PERCEPTIONS OF THE LEARNING ENVIRONMENT
Contents
1. Introduction, aims and scope of the study 1
2. A survey of research on attitudes toward computers 13
3. Some correlates of learning 35
4. The effects and measurement of classroom environment 47
5. The objectives of the study 62
6. The measurement of teacher behaviour: instrument selection anddevelopment 72
7. The measurement of pupil characteristics and learning: instrumentselection and design 91
8. Distribution of the teachers' booklet and analysis of responses 102
9. Descriptive analysis of the pupil data 132
10. The effect of teacher and pupil variables on pupils' attitudesand perceptions of the Computer Studies classroom environment 151
11. The Diary Study 183
12. Summary, discussion and suggestions for further research 205
References 217
Appendix 228

CHAPTER 1
INTRODUCTION, AIMS AND SCOPE OF THE STUDY
Introduction
The 1981 launch of the microcomputer into all schools in Britain was
accompanied by a flood of expressed hopes for the vocational significance
of the new initiative. Kenneth Baker, then the new Minister for Information
Technology said "I want youngsters, boys and girls leaving school at
sixteen, to be actually able to operate a computer." (Baker, 1981).
The DTI Micros in Schools scheme enabled every primary and secondary
school in the country to purchase a British made computer at half list-
price. Within three years virtually every school in the country had at
least one microcomputer, by 1987 some secondary schools had as many as
sixty (Wellington, 1987).
Prior to the DTI scheme Computer Studies was a fringe subject with
examination entry figures at a similar level to Spanish, Geology and Music.
By 1984, entries had tripled to raise Computer Studies to 12th place in the
league table of examination entries.
Year Girls Boys Total
1976 892 2296 31881977 1701 4593 62941978 2198 5674 78721979 3024 7483 105071980 6692 10036 167281981 8952 15000 239521982 10346 22918 332641983 13322 30527 438491984 16570 39055 556251985 18538 43947 62485
Table 1.1 0-level entries by gender and total 1976-85(Source DES statistics)
Computer Studies is a two-year specialist course dealing with the
operation and applications of computers, especially microcomputers, taught
1
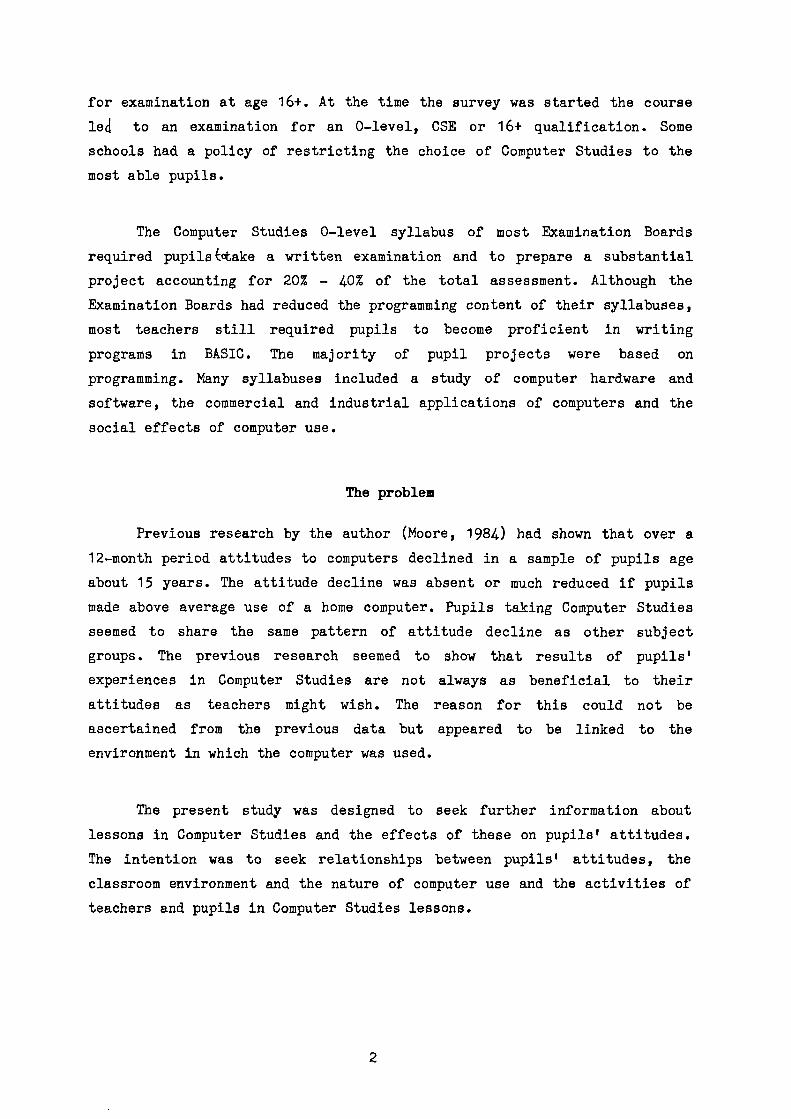
for examination at age 16+. At the time the survey was started the course
lea to an examination for an 0-level, CSE or 16+ qualification. Some
schools had a policy of restricting the choice of Computer Studies to the
most able pupils.
The Computer Studies 0-level syllabus of most Examination Boards
required pupilstitake a written examination and to prepare a substantial
project accounting for 20% - 40% of the total assessment. Although the
Examination Boards had reduced the programming content of their syllabuses,
most teachers still required pupils to become proficient in writing
programs in BASIC. The majority of pupil projects were based on
programming. Many syllabuses included a study of computer hardware and
software, the commercial and industrial applications of computers and the
social effects of computer use.
The problem
Previous research by the author (Moore, 1984) had shown that over a
12-month period attitudes to computers declined in a sample of pupils age
about 15 years. The attitude decline was absent or much reduced if pupils
made above average use of a home computer. Pupils taking Computer Studies
seemed to share the same pattern of attitude decline as other subject
groups. The previous research seemed to show that results of pupils'
experiences in Computer Studies are not always as beneficial to their
attitudes as teachers might wish. The reason for this could not be
ascertained from the previous data but appeared to be linked to the
environment in which the computer was used.
The present study was designed to seek further information about
lessons in Computer Studies and the effects of these on pupils' attitudes.
The intention was to seek relationships between pupils' attitudes, the
classroom environment and the nature of computer use and the activities of
teachers and pupils in Computer Studies lessons.
2
Aims of the study
Because of the uniformity of examination syllabuses and the need for
the production of assessed project work, it is likely that the amounts of
time spent in computer use by examination pupils in different schools
varies by much less than the 15:1 ratio found in a Hertfordshire survey of
non-examination pupils (Mohamedali et al, 1987). The new research focused
on the nature and range of computer use in Computer Studies lessons. It was
hypothesised that lesson activities would be determined by characteristics
of the teacher, characteristics of the pupils and the physical resources
available and that their effects on pupils' attitudes could be mediated by
other computer experiences at home, by the use of CAL at school and by
pupils' perceptions of the classroom environment.
The primary aim of the survey was to provide information about
pupils' attitudes toward computers and toward a job or career requiring
computer use and to discover what styles of teaching or computer related
experiences fostered positive opinions about computers and their use.
The second aim was to provide information about pupils' perceptions
of the Computer Studies classroom environment and how these were related to
teachers' and pupils' activities.
The third aim was to provide data on the teaching of Computer
Studies. Part of this study collected data on the context of Computer
Studies teaching, i.e.the length of lessons, the type of room available,
the size of the class and the ability of the pupils. Data was also
collected on the resources used by teacher and pupils and the use of
different teaching and learning activities including homework.
3
The variables measured
The study was based on written questionnaires completed by teachers
of Computer Studies and classes of their pupils.
Teacher personal variables
Data was collected on the teacher personal variables of gender, totalteaching experience, Computer Studies teaching experience, academicqualification in computing, educational (teacher training) qualification inComputer Studies, industrial experience with computers, other teachingsubject, type and age-range of school.
Pupil personal variables
The pupil personal variables used in the study were gender, school subjectscurrently being studied, frequency and type of experience of using a home-computer, school experience of computer assisted learning by subjects andinterest in Computer Studies at time of choosing the subject and at thetime of the survey.
Teacher teaching variables
Teaching style was measured by means of 19 composite variables derived froma checklist of 206 teaching and teaching-related behaviours. Teachers alsoused a 29 scale semantic differential instrument to report theirperceptions of The Job of a Computer Studies Teacher.
Pupil affective variables
Pupils completed four affective domain instruments;1. Attitudes toward computers (Eight scales)2. Perceptions of the classroom environment (Ten scales)3. Perceptions of A Job using a Computer (29 semantic differential scales)4. Computer anxiety (One scale).
Lesson variables
The following variables were studied to show the context, structure and useof resources of Computer Studies lessons.
1. Contextual variables of lesson duration, room-type, and the number andability of pupils
2. Style of the lesson chosen from a list supplied3. Resources used by teacher4. Resources used by pupils5 Type of homework set6, The Lesson activities in the first, middle and final third of the lesson
4
The scope of the study
The study was restricted to the affective domain and assessed pupils'
attitudes and feelings only. No measurements were made of students'
cognitive learning or abilities in Computer Studies or other subjects. Thus
it is not possible to comment on or draw inferences about teacher
effectiveness in the cognitive domain. All pupil data was collected
anonymously and the unit of analysis for the teacher-pupil activity-
attitude studies was the class. No investigation was made of the
differential effects of teaching behaviours on pupils of different
backgrounds, attitudes or perceptions. The study made no attempt to probe
teacher background variables of training, knowledge of computing and
educational aims.
Limitations
The nature of the samples places one of the most severe restrictions
on the generalisation of the findings of the study. The sample of Computer
Studies teachers comprised those who responded to a countrywide postal
survey. Although the sample was sufficiently large for sound statistical
analysis, there must be some reservation in applying results of a self-
selected sample to the whole population of Computer Studies teachers.
The pupils sampled in the survey were complete classes of some of the
teachers completing the teacher-questionnaire. Although the teachers of
these classes appeared to be a representative sample of the responding
teachers, it is neceisary to be cautious in interpreting pupil results as
being applicable to all classes.
Although the study included assessments of the reliabilities and
validities of the scales used, there is an underlying assumption that
written response instruments are applicable to the measurement of
behaviours, attitudes and perceptions. As with all studies based on the use
of self-report instruments, the research relied on the willingness of
teachers and pupils to give full and honest answers to the questionnaire
items.
5

Background to the study
In a project of this nature which attempts to provide an overview of
a relatively unresearched field, it is necessary to locate the methods and
findings in the context of current practices and previous studies. The
validity of a study has to be established through demonstration of
consistent relationships between its findings and these backgrounds. This
section gives summaries of recent studies of the frequency of Computer
Studies teaching in schools, the use of computer assisted learning and
pupils' use of a home-computer.
Computer Studies in Secondary schools
The frequency and type of computer-based courses offered in secondary
schools has been investigated by Wellington (1987). The part of his survey
reported here was conducted through The Times Network Service (TTNS). A
letter and questionnaire were sent electronically to all 1010 LEA secondary
schools registered as TTNS users (this number is 27% of the 3745 maintained
secondary schools in Great Britain) and to a further 66 private schools.
Complete replies were received from about 90 schools, 25 of these were TVEI
schools.
The average number of computers per school was 23 with a range from
to 63. In schools that had received TVEI funding, the average number ofpupils per computer was 26, in non-TVEI schools it was 47. Two-thirds of
the computers were in specialist rooms, presumably for use in the teaching
of Computer Studies or similar courses. Examination courses based on
computer use were offered in 91% of the schools, 78% of these courses were
for 0-level or CSE examinations. Computer Awareness courses were given in
72% of the schools, half these courses were for Year 1 pupils. Open
comments from schools indicated two trends. First, the desire to move away
from examination courses in computing toward the more widespread use of
computers for computer assisted learning (CAL) across the curriculum.
Second, the trend to teach Information Technology (IT) and basic courses in
Information Technology awareness rather than Computer Studies and computer
awareness.
6
TTNS is a database system for education that also offers messaging
facilities (electronic mail). The school pays an annual subscription to use
the service and local rate telephone call charges throughout the time the
school system is on-line to the network. TTNS has been criticised as being
more difficult and more expensive to use than PRESTEL (Anonymous, 1987). It
is apparent that TTNS users probably represent schools with above average
commitment to the provision and use of computer resources. For this reason,
the data obtained by Wellington probably represent the maximum levels of
computer involvement in schools at that time.
Some serious questions about the educational value of Computer
Studies have been raised (see for example the Times Educational Supplement
Extra of November 4th, 1984). It has been pointed out that much of the CS
syllabus is neither educationally worthwhile nor vocationally relevant.Computer Studies is not favoured by Universities for entry to degree
courses in Computer Science, at least equal preference continues to be
given to traditional '0' and 'A' level subjects. The Alvey Report (1982)
went further suggesting that school (computer) education of the wrong kind
might actually do harm and, by implication, prejudice a student's chances
of doing well in higher education.
"...it is no good just providing schools withmicrocomputers. This will merely produce a generation ofpoor BASIC programmers. Universities in fact are having togive remedial education to entrants with t A l level computerscience" Alvey Report p.62.
Perhaps a still more serious indictment of Computer Studies is that .
it has hindered the spread of computer use across the curriculum.
Computer Assisted Learning across the curriculum
One of the major aims of The Microelectronics in Education Project
(MEP) which ran from 1980 to 1986 was to encourage the use of computers as
aids to teaching and learning across the school curriculum. Two studies in
1986 indicated that despite MEP encouragement and additional funding from
DES and DTI, school use of computers was not widespread and was rarely
integrated into good classroom practice (Jackson et al, 1986, Ellam &
Wellington, 1986).
7
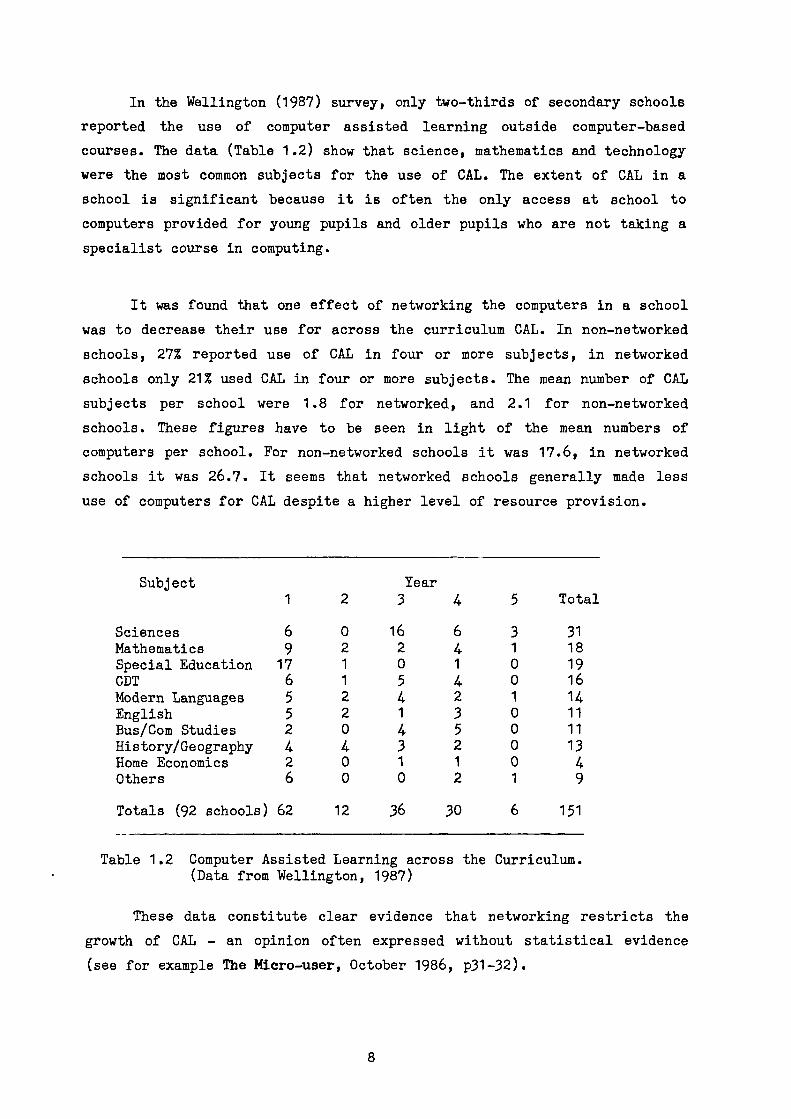
In the Wellington (1987) survey, only two-thirds of secondary schools
reported the use of computer assisted learning outside computer-based
courses. The data (Table 1.2) show that science, mathematics and technology
were the most common subjects for the use of CAL. The extent of CAL in a
school is significant because it is often the only access at school to
computers provided for young pupils and older pupils who are not taking a
specialist course in computing.
It was found that one effect of networking the computers in a school
was to decrease their use for across the curriculum CAL. In non-networked
schools, 27% reported use of CAL in four or more subjects, in networked
schools only 21% used CAL in four or more subjects. The mean number of CAL
subjects per school were 1.8 for networked, and 2.1 for non-networked
schools. These figures have to be seen in light of the mean numbers of
computers per school. For non-networked schools it was 17.6, in networked
schools it was 26.7. It seems that networked schools generally made less
use of computers for CAL despite a higher level of resource provision.
Subject Year1 2 3 4 5 Total
Sciences 6 0 16 6 3 31Mathematics 9 2 2 4 1 18Special Education 17 1 0 1 0 19CDT 6 1 5 4 0 16Modern Languages 5 2 4 2 1 14English 5 2 1 3 0 11Bus/Corn Studies 2 0 4 5 0 11History/Geography 4 4 3 2 0 13Home Economics 2 0 1 1 0 4Others 6 0 0 2 1 9
Totals (92 schools) 62 12 36 30 6 151
Table 1.2 Computer Assisted Learning across the Curriculum.(Data from Wellington, 1987)
These data constitute clear evidence that networking restricts the
growth of CAL - an opinion often expressed without statistical evidence
(see for example The Micro-user, October 1986, p31-32).
8
The low-level of computer access at school available to most pupils
found in the Wellington 1987 survey was in agreement with the results of
other studies. In the MPhil study 65% of pupils in the fourth year of
secondary education reported they had never used nor seen the teacher use
CAL in any subject. A secondary school study by Fife-Schaw et al (1986)
found only 20% of pupils age 13-18 years reporting use of a computer at
school within the previous four weeks. At all ages girls reported less
frequent use of the school computer than boys. This suggests that either
much computer use was within science and technology subjects that are less
popular with girls, or that some school use was obtained through computer
clubs and out of lesson activities. A questionnaire study of pupils aged
12-13 years in five Hertfordshire secondary schools (Mohamedali et al,
1987) found that on average only 29% of them had used a school computer.
The values in different schools varied from 5 to 75%. Here pupils reported
computer use had been chiefly in groups during lesson-time, this is the
common practice in primary schools (Jackson et al, 1986).
The locating of a school's computer resources in a "computer room"
under the charge of a single teacher, often from mathematics or science,
isolates them from the majority of both staff and pupils. This prevents
both the "physical diffusion" of computers into other parts of the school
and their "mental diffusion" into the curriculum and everyday practice of
other teachers. A further obstacle to the more widespread use of computers
across the curriculum may be the lack of teacher-training and technical
support. Taking on the tasks of technician, in-service training organiser
and software consultant in addition to normal duties may not be to the
liking of all Computer Studies teachers. Ellam and Wellington (1986)
suggest that the "human factor" in introducing educational computing has
been ignored with over-concentration on providing software and hardware.
Access to and use of home computers
Microcomputers have become a common part of the home lives of
children and adole4.ents. In 1984 Crisp estimated that one in ten homes had
a microcomputer and that the number was rising. Subsequently a million more
homes acquired a microcomputer so that by 1986 it could be claimed (TES
'Home Truths', 7.3.86) that one-third of all households with children had a
home computer. This was welcomed as "a major step towards the universal
9

computer competence required by the coming information society." The MPhil
study conducted in 1983 found that 52% of the sample of 15 year olds had
used a home computer "Often" or more frequently. A pronounced gender
difference was observed, 66% of boys compared with 40% of girls being
placed in the high-use category. Fife-Schaw et al (1985) found that 62% of
boys and 39% of girls had used a computer at home.
Mohamedali at al (1987) found that 56% of boys and 44% of girls in
their sample had a microcomputer at home, in agreement with results quoted
above. In their sample, 93% of pupils with home access used their computer
for playing games. The data (Table 1.3) show that boys report spending
significantly longer periods in this activity. For the use of educational
software, although more girls than boys report this type of use five times
as many boys claimed to use educational software for four or more hours per
week. Although 80% of boys with a home-computer claimed to use it for
programming compared with 55% of girls, the difference in the time spent
on the activity was not significant. The earlier survey by Fife-Schaw et al
(1986) had found broadly the same pattern of home-use and gender
differences.
Type of Use Duration/hour week
-1Percentage
Total Female Male
Playing 0 - 3 39 66 18Games 3 - 6 18 14 21
6 - 9 12 11 139+ 31 8 48
Educational 0 - 2 75 84 59Software 2 - 4 12 11 14
4+ 13 5 27
Programming 0 - 2 64 73 602 - 4 20 17 214+ 16 10 19
Table 1.3 The percentage of children who reported different uses anddurations of use of a home computer (From Mohamedali et al, 1987)
The gender factor enters into many facets of computer use and
attitudes (Turkle, 1984). Its effects are clearly evident in the data for
pupils' home use of a microcomputer. Kelly (1981) has suggested that girls
10
are disadvantaged in computers whilst both Hoyles(1985) and Harvey & Wilson
(1985) suggest that parents are more likely to buy a home computer for a
son than for a daughter. Glyn-Jones (1986) found computer ownership was
associated with the presence of young children in the household and with
boys. In her sample of 137 computer owning households there were 152 boys
to 93 girls; of the 114 households reporting the gender of the children, 60
were mixed, 39 were boys only and 15 were girls only.
The survey of Mohamedali et al (1987) showed that children who had
access to a home computer had significantly higher programming ability than
those who did not. High ability pupils in comparison to those of medium and
low ability were significantly more likely to use educational software and
to use a home machine for programming. The amount of time spent playing
games did not vary with programming ability but good programmers were more
likely to rate themselves as good at computer games.
Overview
The study is described in eleven further chapters.
Chapters 2, 3 and 4 survey the literature relevant to the study.
Chapter 2 surveys and summarises studies of pupils' attitudes toward
computers. The results of the survey are used to identify scales suitable
for assessing the attitudes of pupils studying Computer Studies. Chapter 3
identifies some kinds of teachers' behaviours and the classroom environment
as important endogenous variables of the learning context. Chapter 4
outlines the meaning of Classroom Environment and its measurement. The
accounts of instrument development and research summarised in this chapter
were used to guide the choice of classroom environment scales for use in
the main study.
Chapter 5 states and explains the objectives and methodology of the
study. The main instruments used by teachers are decribed fully in Chapter
6. Chapter 7 explains how the pupil questionnaire was constructed almost
entirely from existing scales and justifies the choices made.
11
Results of the empirical study are presented and described in
Chapters 8 to 11 inclusive. Chapter 8 gives summary statistics of the
teacher sample and describes the derivation of 19 teaching activities and
the studies of the reliability and validity of these measures. Chapter 9
gives the basic descriptive statistics of the pupil sample, statistics
summarising pupils' attitudes toward computers and statistics of their
perceptions of the classroom environment. Results of the Anxiety and
Attitudes to a Computer-Job scales are also given in this chapter.
Chapter 10. describes how the data were analysed to seek relation-
ships between teacher and pupil background variables, teachers' classroom
activities and pupils' attitudes and perceptions.
Chapter 11 describes how the context, structure, content and some
other features of Computer Studies teaching were derived from accounts of
nearly 700 lessons.
Chapter 12 attempts to link findings from the attitude survey, the
teachers' and pupils' questionnaires and the Lesson parts of the study.
Some implications of the findings for the teaching of Computer Studies or
similar courses and for the training of teachers for these courses are
pointed out and suggestions for action research are given.
12

CHAPTER 2
A SURVEY OF RESEARCH ON ATTITUDES TOWARD COMPUTERS
"It is almost universally acknowledged that educational objectives in
the affective domain - those dealing with attitudes, interests and value -
are of great importance " (Choppin & Frankel, 1976, p.57).
One reason for wishing pupils to acquire favourable attitudes to
computers and microelectronics is to obtain wider acceptance of new
technology in society, at work, and in the home. Thus although attitude
studies have so far played an insignificant part in computer education
research, there is some evidence that curriculum developers are interested
in setting up and assessing attitude goals for computer education. This
interest is evidenced by the increased number of computer attitude studies
reported since microcomputers were first introduced to schools in the early
1980s. Often these studies have developed new attitude instruments; some of
these instruments and the results obtained with them are reviewed in this
chapter.
The measurement of attitudes
Several works describing the techniques of attitude scale
construction are available; (Edwards, 1957; Oppenheim, 1966; Thomas, 1978;
Youngman, 1979a). The steps of identification of constructs to be assessed,
choice of instrument type, item preparation and testing followed by the
determination of instrument reliability and validity with selected
populations are well known and need not be repeated here.
Likert scales are widely used to measure attitudes to science, to
mathematics and to other school subjects. Psychometric methods to establish
the reliability and validity of scales are now well established and should
be used to supply data to accompany all reports. Munby (1980) in an
examination of fifty attitude instruments found only eight that could be
described as psychometrically sound. Schibeci (1984) calls on journal
editors to urge their reviewers to be more critical in their reading of
13
attitude studies. He says they should summarily reject those not including
data about the reliability and validity of the attitude instrument.
The reliability of an instrument or scale is a measure of our
confidence that it would yield the same results if by some means it could
be used to make the same measurements on the same population on another
occasion. Techniques for measuring reliability fall into two groups; those
that yield a measure of self or internal consistency and others that
predict consistency of behaviour from one administration to another.
Reported reliability values for science attitude instruments range from
about 0.6 to above 0.95 (Munby, 1980, Table 6). The value of the
reliability required depends on the intended use; for work with groups a
value as low as 0.7 may be acceptable. For work with individuals a value of
0.9 or above is desirable. The reliability of a scale is bound up with its
sensitivity, that is its ability to discriminate between respondents or
groups of respondents. Discrimination is enhanced if respondents' scores
are spread as widely as possible across the possible range of scores. If
most of the items in a scale are scored "high" or "low" then the majority
of scores will be high (or low) and the scale will be insensitive.
The spectrum of attitude objects is very wide and requires
researchers to specify precisely which attitude object(s) is(are) being
assessed in any particular study. The use of a scale implies an act of
measurement on some attribute of the object to which the scale may usefully
be applied. Gardner (1975a) gives examples of instruments that have no
perceivable underlying construct and of others in which psychologically
distinct variables were simply summed to give a single score. Since the
purpose of an attitude scale is to give a measure of a respondent's
position on a defined scale relating to a single attitude object, it
follows that none of the scales cited by Gardner can yield an interpretable
value. Nagy (1978) has noted that the global construct "positive attitude"
has limited usefulness.
Gardner (1975a) argues that when a suitable instrument already
exists, this should be used in preference to developing another instrument.
Gardner's strictures do not appear to have an immediate effect. Munby
14

(1980) in his review of 50 attitude instruments found that 32 had
been used once only and a further 3 had never been used - not even by the
instrument developer!
At the trial stage of questionnaire development, responses from a
sample representing the target group may be used to confirm the validity of
the instrument. Some researchers subject the responses to factor analysis
in order to derive scales from the total pool of items within the
questionnaire. These scales then form the basis of the resulting instrument
even though they may not accord with the researcher's initial theoretical
constructs; examples of this practice will be given in the following
section. Although the use of empirical analysis can lead to the
identification of reliable scales, it cannot give meaning or validity to
the scales. It should not be claimed that a scale established by empirical
analysis is for this reason any more or less valid than one established by
theoretical argument.
Brown & Davis (1979) specifically rejected the use of factor analysis
for the identification of instrument scales. They argued that because
empirical analysis was unlikely to give uniform scales each relating to a
single identifiable construct, it was preferable to rely on the
researcher's a priori constructs and allocation of items.
Studies of attitudes toward computers
Surveys carried out before 1982 (Ah1,1976; Lee, 1970; Lichtman,1979;
Mathews & Wolf, 1979; Smeltzer, 1981) pre-dated the boom in sales of micro-
computers to schools and homes. Because the early questionnaires and
surveys were set in the context of the remote large "mainframe" computer,
neither the instruments nor the results obtained with them are directly
relevant to the present study.
Two more recent surveys of computer attitudes, one by Morrison (1983)
the other by Bannon et al (1985) were also concerned with large computers.
Morrison's survey was of students at a single university in Australia. He
used an attitude questionnaire developed thirteen years previously (Lee,
1970). According to Lee this instrument contained two empirically
15

established scales, "Beneficial tool of man" (positive), and "Awesome
thinking machine" (negative). Morrison failed to replicate Lee's results.
He found five, rather than two, factors; these did not include a strong
positive factor. The lack of agreement between the two uses of the same
questionnaire might be due to the changed social context of computer use or
to other differences between the two samples; that of Lee was taken from
the general adult population in North America.
The survey by Bannon et al (1985) used eleven items from the 1976 Ahl
survey with six others devised by the research team. Nine of the items were
described as cognitive, the remainder were said to be affective. The basis
of the classification of items is not clear; the statement "Computers will
Improve education" was described as a cognitive item whilst the similar
statement "Computers will displace teachers" was said to be an affective
item. The questionnaire was answered by 1811 university students and 714
educators; their ages ranged from under 19 to over 30 years. Factor
analysis identified two factors. The first factor was made up of seven
cognitive" items, all the items loading to this factor were positively
worded. The second factor contained seven "affective" items, all these-
items were negatively worded. Bannon does not report the percentage of the
score variance loading on the factors. The two groups of items were used as
subscales. This appears to be an example of factor analysis being used to
Impose a statistical structure on an attitude instrument. No breakdown of
scores by age, gender or occupation is given.
Wagman (1983) used the 100 item Cybernetics Attitude Scale to study
the attitudes of undergraduates toward the use of computers in ten specific
sectors of society. The results were said to show that the undergraduates
were in favour of using computers for administering the justice system and
for statistical purposes, they were critical of their use in counselling
and medicine. T-tests showed significant gender differences on five of the
subscales - society, values, cognition, education and criminal justice. For
each of the scales, men held the more favourable attitudes toward computer
use in that sector. Inter-scale correlations were quite high and for this
reason Wagman warns that the extent of gender differences in attitudes may
be much less than the raw correlation data suggest.
16
Griswold (1983) used a questionnaire of 20 Likert-type items to study
computer awareness amongst undergraduate and post-graduate education
students. The questionnaire items were judged to cover four categories: (i)
concrete implications of the computer, (b) abstract implications,
(c) computer abilities, (d) education applications (Griswold, 1985). A
composite awareness score was calculated by summing responses to all 20
items. The alpha reliability of the composite scale was 0.75. The computer
awareness scores were significantly correlated with three variables: age,
arithmetic skill, and locus of control. Computer awareness was generally
greater in older, arithmetically skilled, and internally-oriented
individuals. Computer awareness was not significantly correlated with
length of mathematics experience, nor with gender.
Griswold (1985) used the same 20-item questionnaire in a comparison
of groups of university students of education (N = 207) and business
(N = 210). On this occasion the same composite score was described as a
measure of computer attitudes. For 18 of the 20 items, business students
responded more favourably than education students, nine of the differences
were statistically significant. Education students were less likely to have
had previous experience of using a computer, had less favourable opinions
about abstract implications, and were less likely to view the computer as a
tool. In a multiple regression analysis, age was the best predictor
followed by subject. Gender was not a significant predictor.
Several of the items included in the Griswold instrument appear to
have a cognitive component within them. Thus statements such as
"Computers can teach reading (mathematics)"
can be answered without reference to the respondent's opinion of
whether computers should be used to teach reading (mathematics). Such items
appear more related to respondents awareness of the uses of computers than
to their opinions about these uses. It is not clear that they are
appropriate to the measurement of computer attitudes as was claimed in the
1985 study.
17
Reece & Gable (1979) report properties of an instrument developed to
monitor student attitudes towards microcomputers in schools. In its
original form the instrument contained 10 affective, 10 behavioural and 10
cognitive items concerning microcomputers and their use. A total of 199
responses to the questionnaire were obtained from students aged 13+ and 14+
years. Factor analysis showed only one interpretable factor; this contained
10 items; five affective, four behavioural and one cognitive. Reece and
Gable called this 10-item scale the General Attitude Toward Computers
(GATC). The adoption of the single multi-domain factor as a measure of
attitude appears to negate the authors' original theoretical concepts of
attitude structure. Scale reliability was moderately high at 0.87, a
benefit of the use of factor analysis for item selection. The paper of
Reece & Gable reports only the statistical properties of their scale, it
contains no information on students' attitudes.
The GATC scale was used by Enochs (1985) to assess the attitudes of
(US) middle school students toward computers. All the students were
involved with the instructional use of computers at school for the purpose
of drill and practice. The overall general attitude towards computers was
high with a mean of 39.03 on a range 10 - 50. No significant differences
were found between male and female students or between seventh and eighth
graders. A significantly higher mean score (p<.001) was obtained by the
group of students with a home computer.
Enochs (1984) also studied the attitudes of pupils shortly after
beginning a course of instruction in the use of computers. Students (26M,
23F) were in the fifth grade, 17 of them had a computer at home. The
computing exercises lasted about two hours with students working in pairs
at a machine. The exercises were designed to introduce students to some
computer terminology, to familiarise them with computer hardware and
operation, and to teach simple programming. T-tests were used to test for
effects of the instruction and for differences between gender and home-
ownership groups. A significant (p = 0.03) difference was found between pre
and posttest scores on the GATC instrument. No significant gender or home-
ownership differences were found.
18

The results are interesting but inconclusive. Closer examination of
Enoch's data shows mean scores in excess of 40 on a scale 10 to 50 were
obtained by all groups in both pre- and posttests. This suggests the GATC
scale may have lacked sufficient discrimination for use in this
application. Conclusions were also limited by sample sizes. The differences
between pretest mean scores obtained by the groups of boys and girls, and
the differences between the pretest scores of groups of computer owners and
non-owners were both greater than the pretest to posttest differences for
the whole sample. Because of sample size effects, the last difference was
said to be statistically significant and the former two not.
Richards et al (1986) claimed that few psychometrically sound
instruments were available for use in the area of attitudes toward
computers. To develop the Computer Attitude Scale they rewrote 27 items
from a science attitude scale. The items covered four general attitude
dimensions of Liking; Necessity of studying computers for career success;
Self-confidence in using computers; and Belief that computers are a Male
domain. These items were used with 192F and 178M students in seventh grade
classes. Factor analysis identified three scales made up of 23 items;
Liking (12 items, alpha = 0.88), Male domain (5 items, alpha = 0.84),
Career-necessity (6 items, alpha = 0.72). No gender difference was found on
the Liking scale. Males scored higher on the Male domain and Career-
necessity scales. In a similar study with eleventh grade students, males
and females did not differ on the Liking and Necessity scales. On the Male
domain scale, males scored significantly higher than females.
The study also included an investigation of possible age and ability
relationships with computer attitudes. In the Junior school study, a
reading test was used as a measure of general ability. Reading ability was
not correlated with scores on the Liking scale. Students with higher
reading scores were less likely to see the computer as being "for men". The
correlation between reading ability and Career-necessity showed that
better-reading students were more aware of the career potential of
computers. The scores of junior high school and senior high school students
were compared on the three scales of Liking, Career-necessity and Male
domain. The scores of the two groups did not differ on the Career-necessity
scale. Although both groups were favourable to computers, the junior pupils
19

had a significantly higher score on the Liking scale. On the Male domain
scale senior pupils were less likely to see the computer as male-dominated.
In this sense the older pupils had the more favourable attitude.
A study of sex-correlated differences in attitudes toward computers
was made by Dambrot et al (1985). Subjects were 342F and 198M first-year
psychology under-graduates at a North American university. Subjects
answered the Computer Attitude Scale (CATT), the Fennema-Sherman Maths
Anxiety Scale (1976), and the Computer Aptitude Scale of Konvalina et al
(1983). The CATT was a 20-item instrument specially developed for the study
because other existing measures of computer attitude were (it was said)
designed for elementary or middle school pupils or teachers. The rationale
used for item selection is not stated.
Results showed more males had completed a computer course and knew a
computer language. Males had higher computer aptitude scores and more
favourable computer attitudes. Significant gender differences were found in
responses to 11 of the 20 CATT items. Generally females felt more
threatened and intimidated by computers, and thought them less useful.
Total scores on the CATT were significantly lower (p<0.001) for women. The
correlation between computer aptitude and computer attitude was stronger
for men than for women, r =0.27 vs r = 0.17. In a multiple regression
analysis, only maths anxiety predicted computer attitude for women, while
for men, computer aptitude and maths anxiety were significant predictors of
computer attitude. The variables of mathematics experience and general
college achievement were not significant predictors of computer attitude.
The proportion of the attitude score variance predicted by the significant
variables was quite small, 0.05 for women and 0.09 for men.
Loyd and Gressard (1984a) developed an instrument to evaluate
attitude changes and identify potential problems connected with the
introduction of computer-based teaching programmes in US schools. The
instrument contained 30 items, 10 each from the attitude domains of Anxiety
about (fear of) computers, Enjoyment of using computers, and Confidence in
using computers. All the items included either "I" or "me" and tapped
attitudes rather than knowledge, no prior experience of using a computer
was assumed in the framing of the items. Subjects were 104F and 51M aged 13
20
to 18 years in a computer-based education programme. Factor analysis of the
responses confirmed the three factors accounting for 55% of the variance.
The high inter-scale correlations and the loading of items from two scales
on the same factor showed the scales shared a considerable proportion of
common variance.
The instrument was used by Loyd and Gressard (1984b) in a study of
354 students aged 13 to 20+ years. Attitudes were positive, for each of the
three scales they averaged about 30 on a range 10 - 40. Results were
analysed for the effects of computer experience (categorised at three
levels; less than 1 week, up to 6 months, over 6 months), gender, and age
on the scales of Anxiety, Confidence and Enjoyment. No gender effect was
found for any scale. An age effect was found only for the Enjoyment scale;
younger students generally expressing greater enjoyment. Computer
Experience was a significant variable for all three scales; greater
experience was associated with more positive attitudes.
Williams et al (1983) were concerned that previous evidence of young
pupils' attitudes toward the use of computers had been based on studies in
which CAI was used to impart cognitive skills. They suggested little was
known at that time about young children's attitudes toward the small home
computers which in the future were likely to be their first and most
frequent encounter with computing. The study used a semantic differential
attitude instrument based on 24 bi-polar scales. The adjective-pairs were
obtained from recordings of interviews held with other children prior to
the main study. The study sample were 106 attendees at one-day summer
computer-camps held in an upper-middle class area of Los Angeles. The age
range of the sample was from 6 to 18 years although most were age 10-14
years; 71% of the sample were male. The questionnaire was answered about
halfway through the single 6-hour session. Analysis of responses was
restricted to students without previous experience of using a computer.
Factor analysis showed four interpretable factors; General evaluation
(e.g. good-bad), Quality (new-old), Ease of use (easy-hard), and Expense
(cheap-expensive, little-big). On scales with an evaluative connotation,
the children generally indicated generally favourable attitudes. It is
interesting that they rated the microcomputers neither as small nor
21
inexpensive - a clear sign they lacked knowledge of mainframe computers.
The factors of General evaluation and Expense were unrelated to gender and
age. On the Ease of use and Qulaity scales , females and younger children
tended to give less favourable ratings The features of voluntary paid
attendance at the camp and not having a home-computer may restrict the
generality of the findings.
A 20-scale version of the instrument of Williams et al has been used
with primary and secondary school pupils in the UK (Harvey & Wilson, 1985).
The pupils age 10-12 years were asked if they owned a microcomputer, if
they would like to spend more time on the computer at school, and what they
most liked doing on the microcomputer. They also wrote an essay "What I
think about microcomputers". Pupils' attitudes were generally favourable.
Only four of the twenty scales showed significant differences between
primary and secondary pupils. Primary pupils thought the microcomputers
more friendly, more understandable, newer, and bigger. Three items produced
significant gender differences; boys thought microcomputers more fun and
smarter whilst the girls thought them relatively more expensive. Although
there were few gender differences in attitudes, twice as many boys as girls
owned a micro. Harvey and Wilson speculate that it may be because the girls
were too young to have been affected by parental socialisation.
Eleven scales showed a significant difference between owners and
non-owners. In general owners had more favourable attitudes. The essays and
free-response questions both contained a predominance of supportive
material. Computers were regarded as "fun" with 72% of children giving
"playing games" as their most enjoyable computer experience.
In the study of Mohamedali et al (1987) children were asked about
their conceptions of computers and how they felt about using them. Pupils
were classed as "experienced" if they had used the school computer or had
used a computer at home or had used a friend's computer. Pupils were
classed as "lacking experience" if they had done none of these.
Significantly more children with experience believed they were "part
of the computer age" (p<0.001)and that computers could improve education
(p< 0.01)than children who lacked experience. The group with experience
22

were also more willing to use computers to relieve routine work (p<0.01).
Males and females were also compared on the same variables. Fifty-six
percent of males thought they were "part of the computer age" compared with
42% of females (p<0.02), males were also more willing to use computers to
relieve routine work (p<0.01). No gender difference was found in responses
to the question "Do you believe computers can improve education?".
Effects of computer assisted instruction
Generally, studies of students' attitudes in environments where
computer-assisted instruction was used to teach cognitive skills are not
included in this review of attitudes toward computers because in most cases
the focus of the studies has been on the cognitive and affective outcomes
related to the subject and the method of delivery rather than to the
computer per se. A review of investigations of attitudes towards the use of
computers for teaching and computer assisted instruction reported between
1976 and 1982 has been given by Lawton & Gerschner (1982). They found few
studies of children's attitudes toward computers. In conclusion they state
"overall the data appear mixed. It is noted that some students liked
computers, that some students apparently learnt from computers, that other
students apparently did not learn from computers" (page 51).
Clarke (1985) measured children's general ability and their attitudes
toward mathematics before and after a one-year programme of using LOGO
turtle-graphics for 40 minutes per week. The LOGO experiences included the
development of problem-solving skills, playing games, and free-exploration
sessions in which the children could create their own patterns and
pictures. The sample consisted of 43 girls in years 1, 3 and 5 of an
Australian girls' school. The data showed a significant increase in
students' general ability and in the mathematics component of a
standardised attitudes toward school questionnaire. Within the limits of
the small sample size, the results support the belief that LOGO experience
can enhance general ability and stimulate interest in associated subject
matter. Although the work of Clarke deals with attitudes toward mathematics
(and not computers), it merits description because it is one of the few
studies in which students have used the computer other than in a
programmed-learning context. Her work suggests that free-activity
experience with a computer may have a favourable effect on attitudes.
23
An attitude study by Anderson et al (1981) was based on pupils'
reactions to a unit of science material presented as an interactive
simulation via a microcomputer. The lesson unit took pupils from 10 to 30
minutes to complete with a mean time of 20 minutes. The sample of 340
pupils age 15 to 17 years from a single US high school contained an equal
number of male and female students, approximately equal percentages of each
gender group had previous non-CAI exposure to computers. Two additional
treatments were introduced into the experimental groups. One-third of the
sample used a program with enriched graphics; these consisted of animated
diagrams and the use of coloured lines on graphs. Another third of the
groups experienced a simulated computer malfunction. Remaining students
used the program without enhancement or malfunction. All students were
given pre- and posttests of computer knowledge and three dimensions of
attitudes toward computers; enjoyment, anxiety, and self-efficacy.
The three attitude scales showed positive changes immediately
following the CAI experience; most of these gains disappeared over the next
six months. The two treatments, enhanced graphics and malfunction, had no
effect on computer knowledge or attitudes except for an interaction between
malfunction and computer self-efficacy. Although all CAI groups showed an
immediate gain in this variable, the gain was significantly greater in
pupils not experiencing the malfunction. At the end of a six-month period,
the CAI and control groups showed no difference on the enjoyment dimension.
The CAI groups showed less anxiety and greater efficacy. The lower self-
efficacy of the malfunction sub-group was still detectable at the end of
the six month period.
The experiment indicates that pupils' attitudes toward computers may
be affected by hands-on experience of using computers even though the CAI
materials have no overt computer-related objectives. It appears that as
little as 20 minutes use of interactive CAI materials may be sufficient to
produce effects that are both significant and endure over some months.
Computer attitudes survey in Sweden
In 1982 a revised national curriculum was introduced into the Swedish
9-year comprehensive school, this was accompanied by a three year programme
to introduce the concepts of udatalara ll to all secondary pupils age 13-16..
24
It was planned that each pupil should have 75-80 hours of computing as an
integrated part of the teaching of mathematics, natural sciences and social
sciences. Three features of the Swedish programme are of significance:
first, the study of datalara is compulsory for all students; second, the
subject has been introduced as a practical study via use of the hardware;
and third the concepts of "datalara" include much of what in the UK would
be termed "Information Technology", ie it is a study about the computer as
well as a study of the computer.
The implementation of the first year of the three-year programme has
been studied (Nissen & Riis, 1985). Results showed that in practice the
programme was modest in content and in scope. Questionnaire responses
indicated that in the year since the start of the programme, about 70% of
the pupils had received some computer science lessons, 90% of these pupils
indicated the lessons had included practical work with the computer. Only a
small minority of the lessons had been integrated with a subject other than
mathematics.
Responses to attitude statements such as:
1. What is your opinion about computer science at school?2. In our society we seem to become increasingly dependent on computer-
technology. What is your opinion of this?3. In an international comparison our country is highly technologically
developed. What is your opinion of this?
showed significant gender differences, males showed the more
favourable attitudes. The question "How much have you been using computers
outside school?" also showed a considerable gender difference. To this
question 42% of boys replied "Very much" or "Somewhat" compared with 8% of
girls. The results are interesting because they show a year-long programme
of compulsory computer education for all does not succeed in eliminating
gender differences in attitudes and choice of activities.
The Computers and Robots Attitude Questionnaire
A study by the present author (Moore, 1984, 1985a) developed and
validated a multi-dimensional attitude instrument, the Computers and Robots
Attitude Questionnaire (CARAQ). Discussions with pupils were used to
UniversityL'-arY25
In the future nearlyeveryone will have some-thing to do with computers
Computers have done moreharm than good in theworld
I should like to work fora firm that uses computers
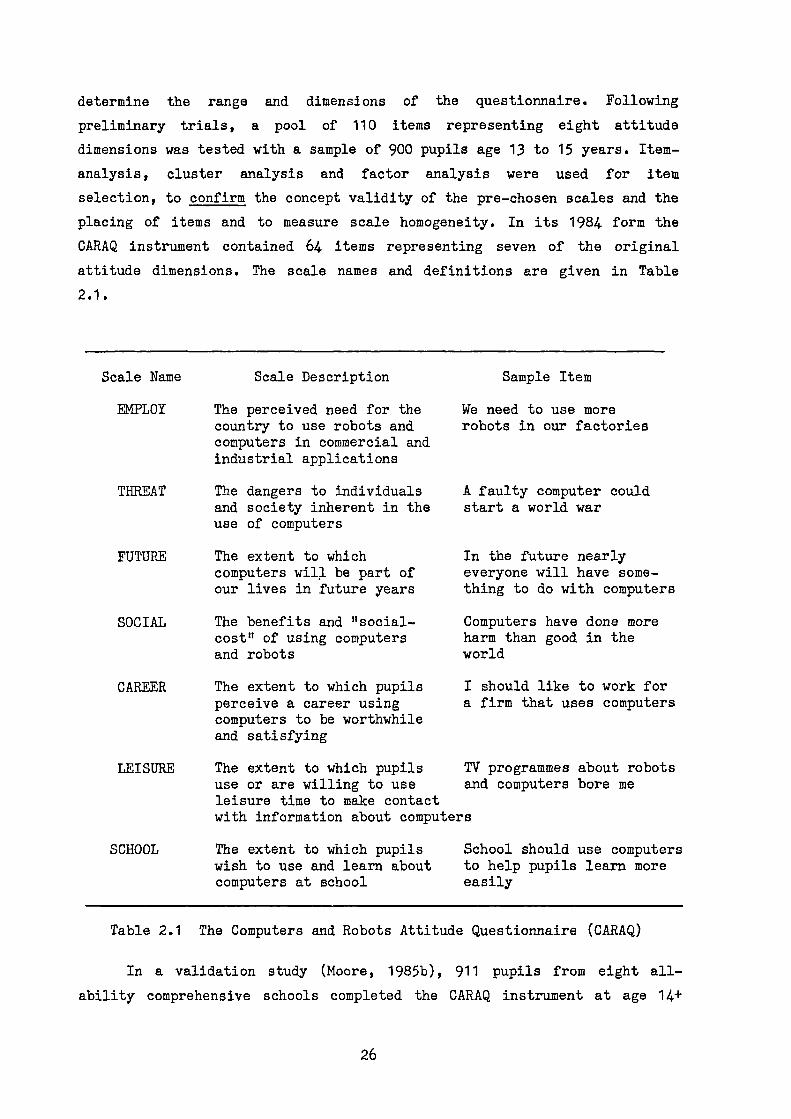
determine the range and dimensions of the questionnaire. Following
preliminary trials, a pool of 110 items representing eight attitude
dimensions was tested with a sample of 900 pupils age 13 to 15 years. Item-
analysis, cluster analysis and factor analysis were used for item
selection, to confirm the concept validity of the pre-chosen scales and the
placing of items and to measure scale homogeneity. In its 1984 form the
CARAQ instrument contained 64 items representing seven of the original
attitude dimensions. The scale names and definitions are given in Table
2.1.
Scale Name
Scale Description Sample Item
EMPLOY The perceived need for the We need to use morecountry to use robots and
robots in our factoriescomputers in commercial andindustrial applications
THREAT
The dangers to individuals
A faulty computer couldand society inherent in the start a world waruse of computers
FUTURE The extent to whichcomputers will be part ofour lives in future years
SOCIAL The benefits and "social-cost" of using computersand robots
CAREER The extent to which pupilsperceive a career usingcomputers to be worthwhileand satisfying
LEISURE The extent to which pupils TV programmes about robotsuse or are willing to use and computers bore meleisure time to make contactwith information about computers
SCHOOL The extent to which pupils
School should use computerswish to use and learn about
to help pupils learn morecomputers at school
easily
Table 2.1 The Computers and Robots Attitude Questionnaire (CARAQ)
In a validation study (Moore, 1985b), 911 pupils from eight all-
ability comprehensive schools completed the CARAQ instrument at age 14+
26
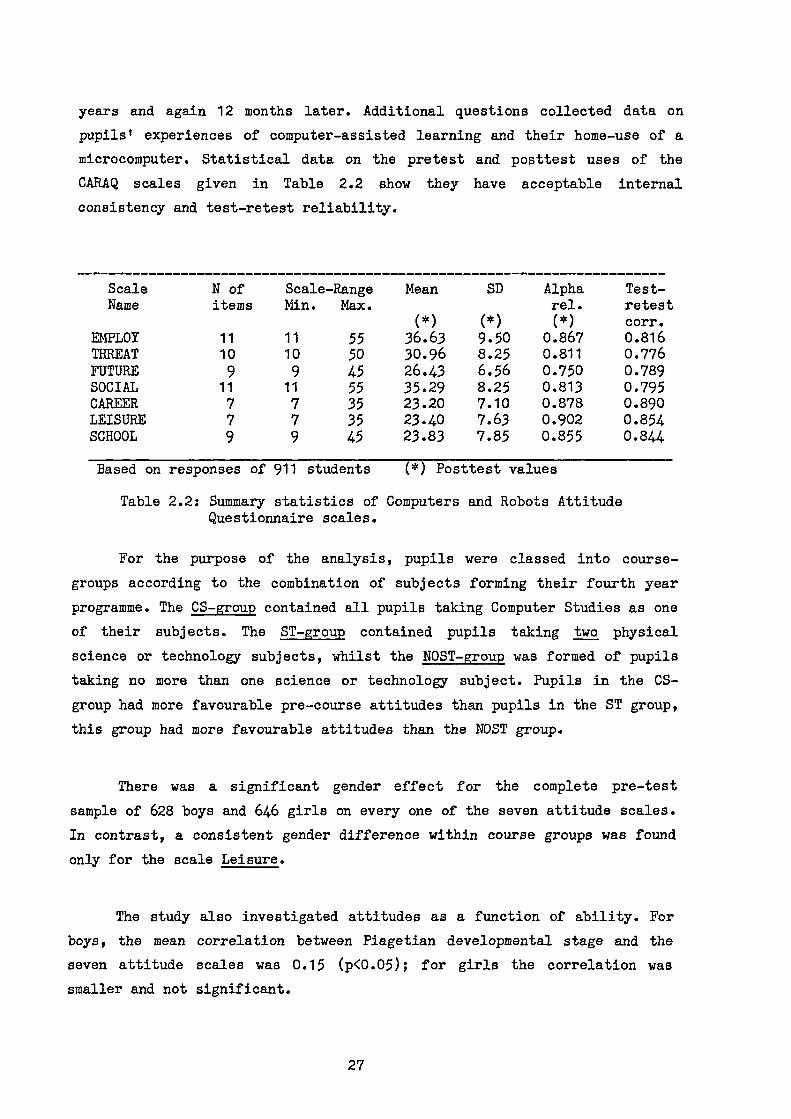
years and again 12 months later. Additional questions collected data on
pupils' experiences of computer-assisted learning and their home-use of a
microcomputer. Statistical data on the pretest and posttest uses of the
CARAQ scales given in Table 2.2 show they have acceptable internal
consistency and test-retest reliability.
Scale N of Scale-Range Mean SD Alpha Test-Name items Min. Max. rel. retest
(*) (*) (*) corr.EMPLOY 11 11 55 36.63 9.50 0.867 0.816THREAT 10 10 50 30.96 8.25 0.811 0.776FUTURE 9 9 45 26.43 6.56 0.750 0.789SOCIAL 11 11 55 35.29 8.25 0.813 0.795CAREER 7 7 35 23.20 7.10 0.878 0.890LEISURE 7 7 35 23.40 7.63 0.902 0.854SCHOOL 9 9 45 23.83 7.85 0.855 0.844
Based on responses of 911 students (*) Posttest values
Table 2.2: Summary statistics of Computers and Robots AttitudeQuestionnaire scales.
For the purpose of the analysis, pupils were classed into course-
groups according to the combination of subjects forming their fourth year
programme. The CS-group contained all pupils taking Computer Studies as one
of their subjects. The ST-group contained pupils taking two physical
science or technology subjects, whilst the NOST-group was formed of pupils
taking no more than one science or technology subject. Pupils in the CS-
group had more favourable pre-course attitudes than pupils in the ST group,
this group had more favourable attitudes than the NOST group.
There was a significant gender effect for the complete pre-test
sample of 628 boys and 646 girls on every one of the seven attitude scales.
In contrast, a consistent gender difference within course groups was found
only for the scale Leisure.
The study also investigated attitudes as a function of ability. For
boys, the mean correlation between Piagetian developmental stage and the
seven attitude scales was 0.15 (p<0.05); for girls the correlation was
smaller and not significant.
27
In another analysis, pupils were divided into two groups according to
their reported use of a home microcomputer. Pupils reporting they had used
a microcomputer at home "Quite often", "Many times", or "Very many times"
were placed in the High- use group, others reporting they had used a micro
at home "Never" or "A few times" were placed in the Low-use group. The
post-test means of pupils in the High-use group were significantly more
favourable than pupils in the Low-use group. This result held for all
scales for the complete sample, for pupils taking Computer Studies and also
for pupils not taking Computer Studies.
Part of the study was concerned with the change in pupils' attitudes
over the 12-month period from pre- to posttest. The pattern of change
within each course group was very similar for boys and girls. In all
course-groups, pupils who had not made significant use of a microcomputer
at home or at school showed a decline in attitudes that was absent or much
reduced amongst pupils reporting High-use of a home microcomputer. Further
analysis showed that in the group of pupils who did not use a computer at
home, Computer Studies lessons did not prevent the decline in computer
attitudes. From these data it appears that in the groups of pupils with the
most favourable computer attitudes, a 12-month period of Computer Studies
lessons had a smaller attitudinal effect than their home-use of a
microcomputer. For both the whole sample and the subsample of those not
taking Computer Studies, the general decline in attitudes toward computers
during the 12-month period was eliminated or significantly reduced when
pupils reported a high level of computer assisted learning (CAL) experience
at school.
Some generalisations from the survey
Generalisation from results of the studies described is restricted by
the varied and frequently non-random selection of experimental subjects as
illustrated by the study by Dambrot et al (1985). In some studies
apparently based on more nearly random selection of subjects, the
description of the sample may not be complete. For example, in the study of
Harvey & Wilson little information is given about the ability range of the
classes; the social or ethnic backgrounds of the schools and the pupils,
and of any previous microcomputer experiences pupils may have had at
school.
28
Results from the studies reviewed repeatedly show the importance of
the study subjects, degree course or interest background of the sample.
Griswold (1985) found course of study (education or business) was a
significant predictor of attitudes for his university sample. At school
level, a study using the CARAQ instrument showed highly significant pre and
posttest differences between three course groups.
In both these studies, when subject (course) group was controlled, no
significant gender-attitude relation was found. Raw correlations between
gender and attitudes appear to reflect both group composition, as in the
two studies cited, and more complex relationships between variables. Even
when course group is not strictly controlled or isolated, as in studies by
Wagman, Enochs, Harvey & Wilson, and Richards et al, there is general
agreement that gender differences are either non-significant or restricted
to one or two from several instrument subscales.
Griswold (1985) and Dambrot et al (1985) found that ability was not
significantly correlated with students' attitudes toward computers. The
finding of the CARAQ study of a barely significant correlation between
ability and attitudes is consistent with the findings of Richards et al
which showed some significant and some non-significant correlations between
attitudes and reading skills. It is perhaps worth stressing that these four
studies came to very similar conclusions about the lack of a marked
ability-attitude relationship although they worked with four different
measures of ability and four different attitude instruments.
A number of studies investigated the relationship between age and
attitudes. Harvey & Wilson found a just significant fall in attitudes
between a sample of primary school pupils age 10+ and a sample of secondary
school pupils who were one year older. Because pupils suffer many changes
in moving from primary to secondary education, it is impossible to conclude
that the small attitude changes found are simply an age-effect. Enochs
found no attitude differences between students in seventh and eighth
grades. Studies over wider age spans have also shown small or inconclusive
effects. Loyd & Gressard found a significant age correlation with only one
of the three scales in their attitude instrument. Similar results were
reported by Richards et al from their comparison of seventh and eleventh
29
grade students. The CARAQ study produced data showing that, in the absence
of additional computer experience, secondary school pupils suffered an
attitude loss over a 12-month period. Some part of this loss may have been
a manifestation of the general attitude decline commonly observed amongst
pupils of this age. On the total evidence available, the relationship
between attitudes toward computers and age appears to be complex and to
change direction between school-age and adult populations. More
sophisticated studies will be needed to separate possible changes in
pupils' attitudes to computers from more general changes in attitudes to
school and society.
In contrast to gender and age/ability, computer experience, including
home experience, is shown to be a significant variable in most studies.
Previous computer experience was shown to be a significant predictor of
students' attitudes in an analysis based on three categories of length of
experience (Loyd & Gressard, 1984b). Owning a home-computer was positively
correlated with attitudes to computers in all studies investigating this
variable. The CARAQ-based study showed a relative improvement in attitudes
amongst pupils reporting a high level of use of a home-computer. The survey
of Mohamedali et al (1987) showed that pupils with experience of computers,
at home or school, had more favourable attitudes than those without
experience.
Although there has been no planned study of the effects of different
types of computer education programme, it is likely that, as in science,
these have different attitudinal outcomes. Passive use of CAI materials was
found to have no attitudinal effect (Griswold, 1984). This is not a
surprising result as in much CAI the computer is used only as a
sophisticated page-turner and test-machine. From the student's view, this
material and type of application fail to utilise or reveal the potentials
of the computer. Quite different results for the effects of computer based
learning are obtained when students are actively involved in using the
machine as a tool. The work of Anderson (1981), Clarke (1985), Enochs
(1984), and Moore (1984) all indicate that practical activities have
positive effects on attitudes.
30

It can be concluded that computer assisted learning in which the
focus is on the subject and away from the computer has insignificant
effects on computer attitudes. On the other hand, practical use of the
computer in schools for LOGO or interactive-CAL materials can have positive
effects on pupils' attitudes toward computers.
Discussion
The global construct "attitudes to computers" measured by some
questionnaires is less useful than information about attitudes related to
specific constructs such as leisure, career and anxiety. Researchers should
specify precisely which attitude objects are being assessed in a specific
scale or instrument. It may be preferable to specify scale constructs a
priori rather than to rely on factor analysis to group items according to
their statistical properties.
The review has shown that the four variables most often studied as
correlates of computer attitudes have been age, gender, ability, and home-
ownership. The marked effect of computer ownership on pupils' attitudes and
the lack of an equal effect that can be attributed to Computer Studies
lessons suggest that school influences on attitudes are small but give no
clue as to why this is so. The four variables are not directly under the
control of the teacher, this means that results from the studies are of
little help to teachers seeking to improve the attitudinal outcomes of
their classes.
Summary
Attention has been drawn to the need for attitude scales to be
reliable and to have the power to discriminate between different groups.
Each scale of an instrument should yield a score giving the respondent's
position with respect to a single attitude object.
A review has been given of some studies of attitudes toward computers
with particular attention to studies carried out after about 1982, the time
when micro-computers became more common in schools and homes. The studies
described in the text are summarised in Table 2.3. A blank in the table
Indicates no investigation was reported.
31
Despite differences in the format of the instruments and the
attitude-dimensions reviewed, the results obtained a degree of consistency
which is remarkable when the age-span and origins of the different samples
are also considered. Although the main concern of this thesis will be the
attitudes held by secondary school pupils, the general similarity of
results across all studies suggests it is worthwhile to consider also
measurements made on both younger and older groups.
The discussion has pointed out that based on the findings of the
Swedish and CARAQ studies, it appears that Computer Studies lessons have
less effect on pupils' attitudes toward computers than some other variables
included in the reviewed studies. This finding points to the need for
further study of the teaching of Computer Studies and the accompanying
classroom environment.
32

03
3
ta0
1:1,4ca
8
cau)
Eu c, WE Z LI
-0 5w-0
14U3 a)CU 13E
41=
+
11)3
Min
(8
n.1.0.-I044
-if 436...... a.0 4-4.3 0--II-I 0)CC a
31
i.a in ......41 >.4) i-i
6 oE o 41O 8 ''41 'CI .§ .5
.8
3 .0 W 41CO43(13 4-3 Ca) II) 41 (..) I4 0 (4U U) > .--I Cf) a) o ea
..-1 >_>_>. i4 a)13'ILL CC) 01 LIU) +3co" .......o" 4.. >.A g:
Cf) 41... 2 E 4,C c o ..cr-o .- ....z.a) ,-.
6 r)) .--i 1> ••ri E 7 -o r)
13 s-.g 2 & -11 .-1 1.-. 8 v..
03 CO 41 LIT- CS) V
C)r-la
0)
-o a) a)
0)
41 41 -Y,4 To QS r-• 075 tn. 0. ...,B CD tO CD
-§ 201co a) -.4•-0 r-4.64 •-• 44 •-• L) CU .0 C •-•Li 4.I (0 M 1.11
L3 L3 CC 1.3
6 041 4)43 UCO a)_0 4_C 4-a) a)
,14 a)4.4I 14o a)u -0
C1-1°' 01a)
1.1.IaQ.
uLO 41
4-3E
E°u
(-I U)0 CU
I-Ia) .0E 03 '0CO 44 031.1 I-I 4-3
44- 03 -1
0 •( 1) U)
14 -00., 0.0C LO
•f-1 E
Ma,-.4I-4
mU
a)C > a..-I .c .Xal co 6.-.1co
co2 6E-1
.1.3 14 6 1
u al L'. -o E
4 L3-a) A ....1 01 a3 0.P.) 5 I-1
C11 4)IL. IS 01 14 U)E
.0
-0..4"0 .$3...i>"
0 CmU49 ...4 C 43 0
13 ...1 1.1 CO0. 41
C3 Ucoa CO X 41 4- 11) Ul41 03 .0 a)
.se, .-403 .1cE)X ..0 CU
4- 1-P 0.
CO (.3 W 4.) coa) cr) )4 ca 0 8
i
4-
ED
2
co1
"4-5nin
U01 1*-1
0E 8°
-I E9 CC 03 4.. L4
0
.I.4.) 010 14 °a)7 0
1‘.4-
al §CD Q.
0 0101
0 cL3 a
u a)
(f) CO 4...11) co 4 u.1-, Er) -0 In 13 n
4) n-1 3)4 c -o 4-) 7 *...I CO
CO CU CU U Li 43 LI ,... 11203 IQ. 13 v-I 8 4:1 o a) ...-I
0
.°11-1 ..rn....0 .......
+U) Z >. 01
....... ...... .0 13) .0
awto -i
Ow
-1..4.-1.0ai ::43 .......-g.CO
U r-I ..... Ifl 03 8>. U) -C"0 .0D 4.) cr 2 c
Mu,
I-1
..,(.,)
u U)
CT) Cr,
53 EE)E 7 41 4- 4) 4.. 0. 43q0343 CL. 4-) 4- X 4) 2 5 6 it5U cn u Lai CO Lai 13) CO
137
4-)CI) tu 07> Ug CU)
0
80"
44 41 6-1 41 WC).Cte4to
4ma)1
43 43C U133 CO
CO 4341
UCO
4-3 4-341 41
Cl 4.. L. 0 n4 0 0LS
04-L3 cc
1.0 r-I E N
1.1w 133,-4 00.•- CO
D CU 0
OC 07 044C03+-o
4.,Ca)
7 M(1) 4-) I
r-1 1/1 CD43U) E
I 014.) s....
C03 ..-I I-. > 00.11)
-0-4c0 U)"-I
0 - ).•c .6) •0- ..-/ LO
>. •. -I4.) Dl.4
a 301
•.03 CO4-7 E ac's
c.2 cc--1 l'-i' tilE:, 03 .0DU> c.)
CO 4.)'al E>
I .-f-1 Wa) -o.0
(S.0 g 1•(01 g :4; tio97
LI)
tr3• -o.-1
03 0)
C0C LI)
Cc ciEr.
1 rico a)
.0 E 43 C CO CO 03 41 4..-to 0)03 (0 0) U) C) 14
a 0 03 s- ,- LI
..,-ia
a) 0) CU
41 .--1tO ea 4
Li ,L) 4.,
C-3 C.J EI- (.7
ct cc
Li ca
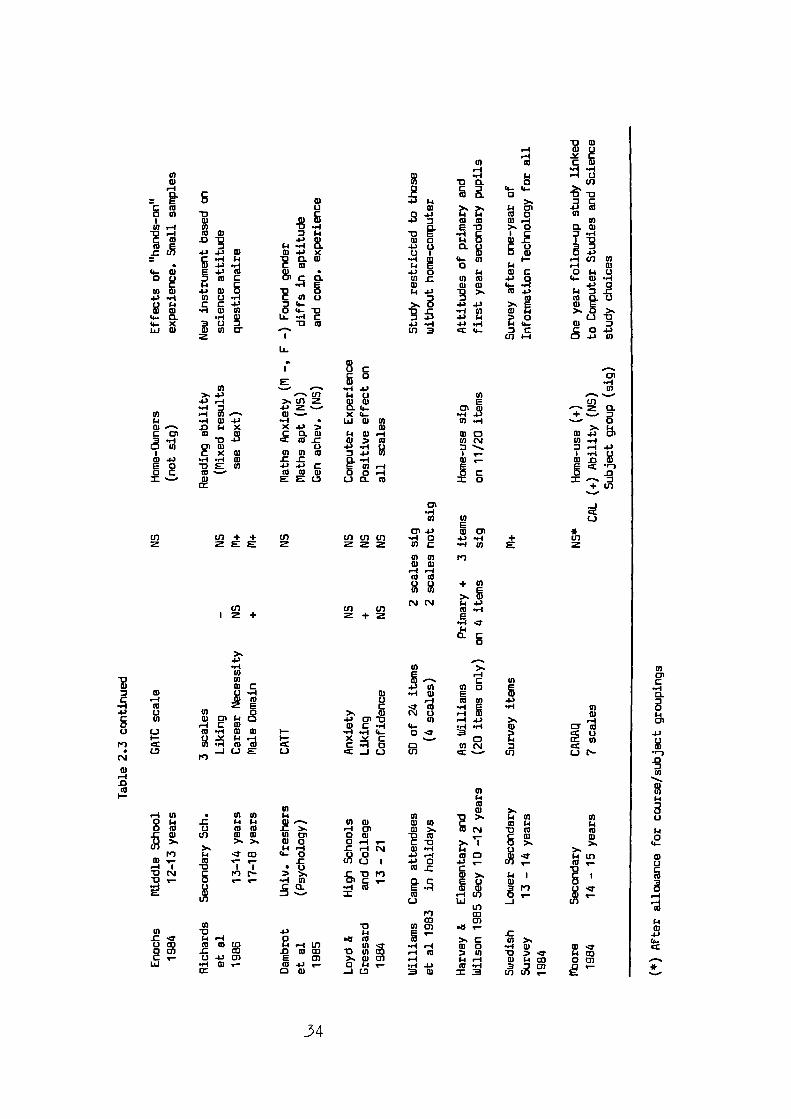
-JcCL-)
D a)
I-I 03.-403
TJI
01 k
a) 13 I/ 0 LII•-I 2 5 2. 46 4- -8s -o
E 6 a) 4.314 T.U 0) I.4C11 43 5-1:11) E 49 4o3 a, o InE
l I a) u al tu ...4
nus
41 r-.I w -0 -11 E 13 T. 0 CL al
-0 1 (13 ID 7 14 -0 E I c = .-I.4 E I 13E E
ff U1
.0 -07
.1-1 1.1 a)14 *1-14-) a
a, -P x03 01.3 ? CL U U
0) g Z
a, 2 47),.-
.- c ..-1 34 2 fe w 4- al I-. o--1 U7 U)• a) +3 .1 I. a)
r.1 o .-IIs.. a) E 4-) ta
g4-) 0 34 03 03 01400
o 7 10 c 4 g- ca r m 10 4-) 0 (1.. 0) .1-1(1) 0303 ,,- .. 430
11) g14.., a, 6 0 k .1-1 13 7, 03 4.3 L.4 7 .5
4-1 .1.1 01 -1 ...-1 2 ca u ,a a)
us. cc ( +, >. B 4.7 .4.) >.E a)>. g >
m cu ...-) a, if) 2 44: -o a.) (.4
,,-. o. •.H a, ILL. c 2 5 p, 4 4 o L.1 -0(1..)(U 7 13 01 -1-1 ...1 a) 7
L.LJ 13) a, u) a U,3 CC (1.. 7 C Z 0 4-12 I U7 1-1 D+3 LO
LL.
.. WI Ll cE o o,...in ....... ..-1 .1.) CU
T. 4.3 0-... (.13 14 8Ein ..-..u., .4.>.-, -1 . cr, 2
4.) 2 ...... E. 0... 07 0107 .-1 co a, .....• X 4- ....1 .1.31 -14 ...4 a) ..P .. • I.1.10) (1) 01 ..-I
'''''. 2 (3.
0) ..-, .0 I-1 X X .1-) 7 a)+ >....... 8
. k1. a) .-1C 03)as
4Tc o_ a) a) co a) 4.1 01
a 10- ca .c0, 03....
U B --4
a, 4) (NI 0) ,a-1
7 \ 7 .-1 411 C X 13) La 11) IC 7 4-1 ill I e-. I .1-.1 L)a) 4-) w-I "-I 03 r .0 a) , a) .o a)E 0 13 a (0 .1-3 4-) c g- 41 ,-.1
O C co ..-.. 03 (C1 0) 0 •-I 603 6 < "m= •-• a, E a LI u a co x o = ..-.. =cc + In
.......
01
..-1
10 U1
014e
.0 t* al *co m + + m LSI CII (r) ... o -, or 4*a Lf)2 2 E z 222z 111 C ... la E 2
0303 r)03 (13.-1 o-1(13038 8 +0)
>. 6N N 144.3co co Ul 03 0.1I 2+ 2 + 2 E•.-I .0'kCL C0
>4., ---.•-, to >.CI) .-.U) S ....... .
c . . 0
0 .... 0)...... CU E2 itiEU
C a, ger-Iu) >.. a) N U
0) 01 k 2 .0 01 -0 (I) .-1 .1.)..-4 .-II-1 c a,
al -1 a) a) I- -Ha) -1-IC CT-I 4-0L) .Y k .--I I-. X .X C ...... 0
(I) ..-1 03 (0 cZ C .,-.1 0 0 U) C'1
-I (-) E f-1 ct ....I L) U7 cr ,-...r)
01k(0V) 111T.'-4 (1) • (3) 0) k14
O (0L4 1403 01
a) .....-C T. r--9 MID
a)U)
co •..t >. I. coco ,-, vi0 14-C al cu a, m 0, o 03 19 ?c,"
-o 03 03hi . 0T . T . 03 0 r-1 C -0
tO
T. I 6 `>'•Cr),
T14 .-1 C ,-1 N a) ..-4 14 L.) T >.01 ..1* 03 4- oa) gr .0 • 8 I .0 0 .1-1 -.
.1.) .--4 cmA 14 ‘ 133 •-...1 1 0 I I • U (0 .0-0 (11
-0 t-r) Lsa. a.. ...I II) C
r)-07 i.. E T. k I
-g IE 4 2 A a)V °- ... 032 CO ..-1 8 In 8 .cr
C-) W__I u)m
N, co
m cocr, -o u) Cn .U-U) M 44 k.0 ...1' (.1 .--I *CI 03 i T. -CU CD al 03 E E ... m 11) ,1* -IA ,-.1 0) 0 ...I (1) a) ....7
T. C 07 >,O 0) -C .0 133 03 -0 u co 41.-1 la > 4 03C a- 0 4.3 0) e cri >, a) 07 .-1 k .-1
13 7 ..7 103 14 03 0 CT)Li-1 •el 03 v..CC e0 WCO 4-1 .- .-I L3O P ..-4t 4-4
M 01 2 M01._I07(1) U7 •-•3 7 2 a-
-34
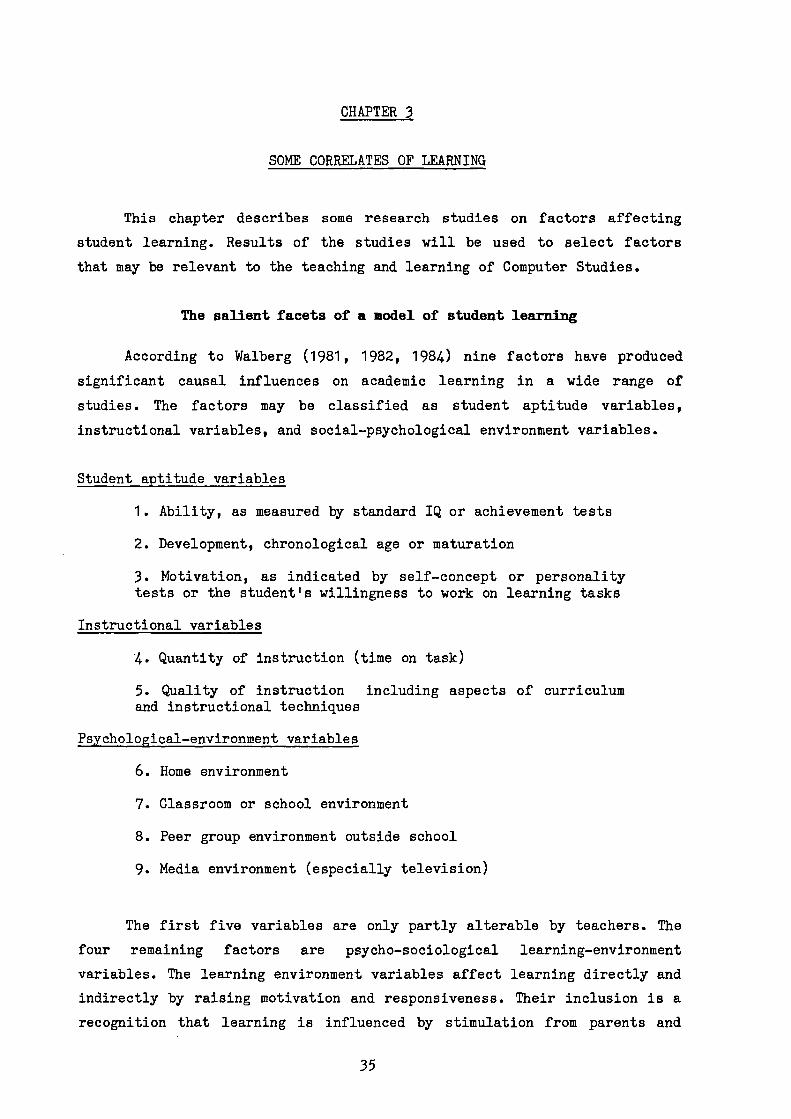
CHAPTER 3
SOME CORRELATES OF LEARNING
This chapter describes some research studies on factors affecting
student learning. Results of the studies will be used to select factors
that may be relevant to the teaching and learning of Computer Studies.
The salient facets of a model of student learning
According to Walberg (1981, 1982, 1984) nine factors have produced
significant causal influences on academic learning in a wide range of
studies. The factors may be classified as student aptitude variables,
Instructional variables, and social-psychological environment variables.
Student aptitude variables
1. Ability, as measured by standard IQ or achievement tests
2. Development, chronological age or maturation
3. Motivation, as indicated by self-concept or personalitytests or the student's willingness to work on learning tasks
Instructional variables
4. Quantity of instruction (time on task)
5. Quality of instruction including aspects of curriculumand instructional techniques
Psychological-environment variables
6. Home environment
7. Classroom or school environment
8. Peer group environment outside school
9. Media environment (especially television)
The first five variables are only partly alterable by teachers. The
four remaining factors are psycho-sociological learning-environment
variables. The learning environment variables affect learning directly and
indirectly by raising motivation and responsiveness. Their inclusion is a
recognition that learning is influenced by stimulation from parents and
35

others at home, the classsroom environment, and by out-of-school contacts
with peers and diverse social forces.
The relative importance of factors in the model
Although the large number of variables involved in learning has
effectively prevented direct research on the relative effects of the
components of models of teaching, the technique of meta-analysis (Glass
1977; Glass et al, 1981) can be used to combine results from many studies
and thus obtain an overall value of the relationships between variables.
The major advantage of meta-analysis is that because it combines data from
a large number of people, conditions, curricula, classrooms, and so on, the
conclusions are more generalisable.
Fraser (1987) has brought together the results of 134 meta-analyses
each of which related some facet of learning to either cognitive or
affective learning outcomes. The findings of the meta-analysis synthesis
are consistent with Walberg's nine-factor model of educational
productivity. He found that thirteen variables which had a correlation ofund4r
0.20 or greater with academic achievement could all be classified the
headingsheadings of the learner, the instructor, the environment and the use of
learning strategies. Some of the factors found to have low or negligible
relationships with achievement included pupils' affective characteristics,
gender differences, teacher enthusiasm, and individualisation. Learning
environment variables and most instructional variables were shown to have
less impact on affective outcomes than on cognitive ones. The mean
correlation between affective outcomes and the range of instructional
factors was 0.11 compared with 0.14 for the correlation between achievement
outcomes and the same factors.
Further support for the Walberg nine-factor model was obtained from a
survey of 17-year old students carried out in the US by the National
Science Foundation in 1981-82. Results showed many significant correlations
between a wide range of educational productivity factors and cognitive and
affective learning outcomes in science. Amount of science previously
studied was a significant predictor of cognitive achievement but not of
attitude. Homework, classroom environment and home environment were found
36

to be highly significant (p<0.01) predictors of both achievement and
attitudes.
RESULTS FOR SPECIFIC EFFECTS
The significance of science studies
In this section, results from previous studies of relationships
between learning variables and outcomes are reviewed. The purpose of the
review is to identify promising lines of enquiry for research in computer
education.
Because few studies have been made of affective outcomes in computer
education, it is necessary to look to other subjects for clues for likely
relationships between variables and outcomes. It is thought studies of the
outcomes of science teaching are most likely offer clues about the most
effective techniques of computer education as there have been more studies
of the determinants of attitudes in science than in any other subject. Also
there are a number of similarities between the teaching of science and the
teaching of computer studies in secondary schools. These include:
1. Both are taught by specialist staff2. Both subjects have specialist rooms and equipment that is seen as
"belonging" to that room3. Both subjects have links with mathematics4. Teachers in both subjects can make reference to phenomena, events and
objects in everyday life to illustrate principles and applications5. During lessons pupils engage in practical exercises individually, in
pairs or in small groups.
The NSF Survey showed that although the strength of the effects is
different, affective and cognitive outcomes show a broadly similar pattern
of relationships with a wide range of learning variables. It was decided to
use the results of studies of both affective and cognitive learning outcome
effects in science to act as indicators to promising investigations into
the attitude-related effects of computer education.
37

LEARNER VARIABLES
The effect of pupil ability and achievement on attitudes
There is substantial evidence that pupil ability affects learning
performance. Bloom (1976) reported a correlation of 0.77 between
performance on course entry and cognitive achievement one year later.
Achievement has been found to have a correlation of 0.51 with IQ (Hattie &
Hansford, 1982), and 0.42 with Piagetian stage (Jordon & Brownlee, 1981).
Intuitively it would seem that students with the ability to do
science would show a stronger liking for science, in which case the data on
attitudes and ability would show a significant positive correlation. This
expected relationship was not found in a meta-analysis carried out by
Steinkamp & Maehr (1983). In this study the correlations between ability
and attitudes of 0.07 for boys (n = 268) and 0.02 for girls (n = 225) did
not reach the 0.05 level of significance. The researchers point out that
the failure to find the expected relationship cannot be attributed to
inadequate attitude instruments, overall these had reliabilities close to
those of the cognitive instruments.
A meta-analysis of relationships between student characteristics and
student cognitive and affective outcomes was conducted by Fleming & Malone
(1983). Measures of general ability showed moderately strong positive
relationships with achievement (correlations in the range 0.25 to 0.59,
mean 0.43) but a much weaker relationship to attitudes (range 0.08 to 0.21,
mean 0.15). Hough & Piper (1982) investigated the relationship between
elementary school pupils' attitudes to science and their science
achievement. A correlation of 0.45 was found for 583 elementary pupils in
30 classes. A much less strong relationship was found by Willson (1983) in
a meta-analysis of 34 studies. For students at secondary level the mean
correlation between achievement and attitudes was approximately 0.12.
The results of these science related studies showing there is no more
than a weak and possibly variable relationship between science attitudes
and pupils' ability are in agreement with the findings of studies of
ability and computer attitudes reported in the previous chapter. The
38

conclusion that ability is probably not a strong determinant of pupils'
attitudes toward computers suggests that this variable might be omitted
from a survey of the attitudinal effects of Computer Studies teaching.
The effect of gender on attitudes
Previous research has generally indicated significant gender
differences in both science achievement and attitude. In the Fleming &
Malone (1983) study, there appeared to be a reversal of the ability-
attitude relationships for boys and girls with age. In middle school, the
science performance of males exceeded that of females of equal ability;
whilst the females had the more positive attitudes. In high school, the
reverse was the case.
Gender differences were also investigated in the study by Steinkamp &
Maehr. Mean correlations between achievement and ability were statistically
significant for both sexes and the difference was significant at p = 0.001.
The result agrees with findings of Comber & Keeves (1973) who obtained
higher science scores for males in 19 developed and developing countries.
In contrast, although the NSF study on 17-year olds reported by Fraser
(1987) indicated a significant gender effect when raw correlations were
considered, gender differences in science attitudes disappeared when other
factors were controlled.
As described in Chapter 2, several studies have investigated gender
differences in attitudes to computers. In general populations, the gender
difference has been significant with males having the more favourable
attitude. When studies were restricted to one course group or pupils
choosing a particular combination of subjects, gender effects on computer
attitudes were generally non-significant. Thus the relationships of gender
with attitudes toward science and attitudes toward computers appear to be
closely similar.
The effect of pupil anxiety on achievement and attitudes
Mallow & Greenburg (1982) regarded science anxiety as "a phenomenon
of national scope that is well known but little understood". They report
its effects are most serious on women and disadvantaged (minority) groups.
39
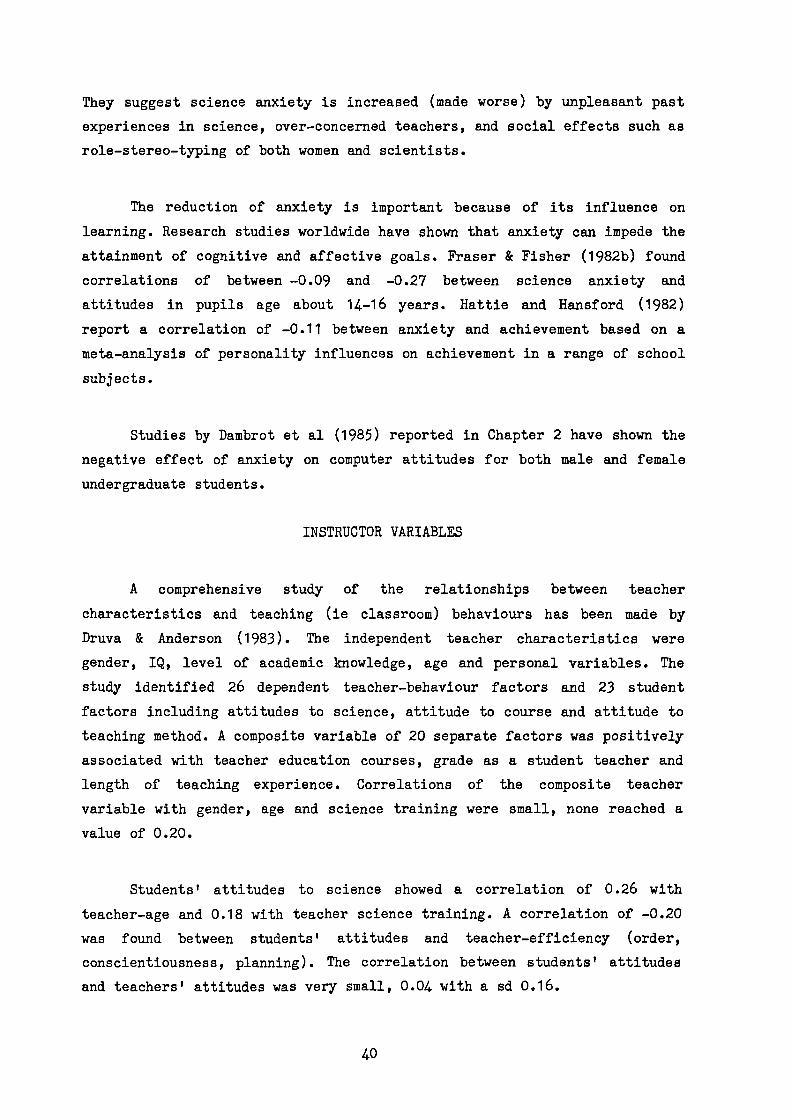
They suggest science anxiety is increased (made worse) by unpleasant past
experiences in science, over-concerned teachers, and social effects such as
role-stereo-typing of both women and scientists.
The reduction of anxiety is important because of its influence on
learning. Research studies worldwide have shown that anxiety can impede the
attainment of cognitive and affective goals. Fraser & Fisher (1982b) found
correlations of between -0.09 and -0.27 between science anxiety and
attitudes in pupils age about 14-16 years. Hattie and Hansford (1982)
report a correlation of -0.11 between anxiety and achievement based on a
meta-analysis of personality influences on achievement in a range of school
subjects.
Studies by Dambrot et al (1985) reported in Chapter 2 have shown the
negative effect of anxiety on computer attitudes for both male and female
undergraduate students.
INSTRUCTOR VARIABLES
A comprehensive study of the relationships between teacher
characteristics and teaching (ie classroom) behaviours has been made by
Druva & Anderson (1983). The independent teacher characteristics were
gender, IQ, level of academic knowledge, age and personal variables. The
study identified 26 dependent teacher-behaviour factors and 23 student
factors including attitudes to science, attitude to course and attitude to
teaching method. A composite variable of 20 separate factors was positively
associated with teacher education courses, grade as a student teacher and
length of teaching experience. Correlations of the composite teacher
variable with gender, age and science training were small, none reached a
value of 0.20.
Students' attitudes to science showed a correlation of 0.26 with
teacher-age and 0.18 with teacher science training. A correlation of -0.20
was found between students' attitudes and teacher-efficiency (order,
conscientiousness, planning). The correlation between students' attitudes
and teachers' attitudes was very small, 0.04 with a sd 0.16.
40

Sweitzer & Anderson (1983) carried out a meta-analysis of the
effectiveness of science-teacher training programmes and short courses. In
153 studies teachers who received the training consistently outperformed
the control group on various teacher-criteria measures. According to Joslin
(1981), although inservice courses are effective in enhancing teachers'
achievement, classroom skills, and attitudes they show smaller and mostly
non-significant effects on student outcomes.
This result casts doubt on the assumption that science knowledge is
highly related to teaching effectiveness. Although in the Druva & Anderson
investigation science knowledge (measured as length of science study) had
one of the highest correlations with both cognitive and affective student
outcomes, the empirical value of 0.19 represents less than four percent of
the student outcome score variance. In a review of the effects of new
curriculum programmes (see next section), Shymansky et al (1983) found that
overall student outcome performances were less positive in studies where
teachers reported having received content-focused inservice training.
No equivalent study of the relationship between teacher
characteristics and pupils' attitudes toward computers was found.
Lilley & Wilkinson (1983) studied the effect of teacher variables on
their verbal behaviours in Further Education classrooms. They argued that
since verbal interactions between teacher and pupil occur at an early stage
in the teaching process, they should be more sensitive to teacher
characteristics than are student learning outcomes. The study examined 27
teacher classroom variables and 15 teacher characteristics including
gender, age, qualifications and a number of personality variables. Overall
there was a lack of significant relationships. In particular it was found
that whether a teacher chose a 'direct' or 'indirect' verbal approach in
the classroom had little to do with teacher characteristics.
These studies suggest that few teacher personal characteristics have
a significant effect on teaching behaviour and on student outcomes. The
measurement of a wide range of teacher personal characteristics therefore
need not be given high priority in a survey of Computer Studies teaching.
41
INSTRUCTIONAL VARIABLES
Under this heading are considered curriculum materials, methods of
instruction, teaching methods and perceived classroom environment.
The effect of curriculum materials on attitudes
New science curricula are characterised by emphasis on processes
rather than products, the use of a wide range of teaching resources, pupil-
controlled practical activity and the inclusion of a consideration of
applications and social effects of science in addition to normal theory.
Weinstein et al (1982) analysed 33 curriculum schemes from Great
Britain, the US and Israel. In 151 separate comparisons results favoured
the new curricula. Shymansky et al (1983) made a meta-analysis of 105
studies that had compared the effectiveness of the National Science
Foundation curricula with traditional curricula. In every instance, the NSF
curricula were favoured on attitude outcomes. In a meta-analysis of
research on three major activity-based elementary (US) science programmes,
Bredderman (1983) found they favoured both science process skills and
affective outcomes. Because the effects were largely independent of the
nature or design of the study and the instruments used to measure outcomes,
it seems reasonably certain that the new science curricula are associated
with improvements in both cognitive and affective outcomes.
In studies of attitudes to computers, the findings of Clarke (1985)
and Enochs (1985) that groups engaging in practical activities with
computers showed more favourable attitudes have been mentioned previously.
The effects of methods of instruction and teaching method on attitudes
Willett et al (1983) tackled the question "What are the effects of
different instructional systems used in science teaching?". An
instructional system was defined as "a general plan for conducting a course
over an extended period of time. It is general in that it encompasses many
aspects of a course" (Page 406). From a meta-analysis of 130 studies in
which an innovative or alternative instructional system was compared with
42
traditional teaching, they showed that most instructional systems operate
at or near to the level of traditional teaching.
Wise & Okey (1983) identified 12 categories of teaching method. They
described teaching methods as
"...narrower, less encompassing than instructional systems.Whereas the latter might plausibly guide a great manydecisions about the organisation and conduct of teaching ascience course, teaching methods refer to more limitedaspects of a teaching plan (e.g. the method of testing, typeof questionning, wait-time and the like). (Page 420).
The overall mean effect size of the various methods on achievement
and attitudes was modest but Wise & Okey suggest that further research
might identify combinations of teaching behaviours that would give larger
effects.
McGarity & Butts (1984) investigated the relationship between teacher
classroom management behaviour, student engagement, and student achievement
in middle and high school science classes. Results showed that teacher
management behaviour was related to student engagement (r = 0.69) and to
student achievement (r = 0.51). These relationships were consistent across
differing levels of ability. They conclude:
"All aptitude levels achieved more when taught by teacherswho exhibited competency in classroom management." (page 60)
The particular management behaviours studied included help for
individual students, encouraging learner involvement and providing
feedback.
The importance of time as an instructional variable is shown in
results of a meta-analysis of the relationships between homework and
achievement (Paschal et al, 1984). In this study, 85% of the relationships
favoured homework (p<0.0001). Any homework was preferable to no homework,
traditional types of homework showed larger effects than non-traditional
types.
43

Results in this section suggest that any study of the effects of
Computer Studies teaching should be concerned with classroom teaching
methods and classroom management activities and not with more general
teaching concerns such as course planning.
The effects of classroom environment perceptions on attitudes
Johnson et al (1981) showed that cooperative classroom structures
were almost always more effective than competitive or individualised
structures. Individual settings were least effective when compared to
'cooperative with intergroup competition' and 'interpersonal competitive'
settings. Systems that provideaclose student supervision and support, goal
orientation and a high level of teacher interaction were more effective.
The negligible effect of individualisation is important because even in the
typical non-individualised classroom, pupils spend a considerable part of
their time working alone.
Classroom environment is the label used to describe the complex
psycho-sociological climate of the classroom as perceived by students.
Considerable research has taken place on the effect of classroom climate on
the cognitive and affective outcomes of science education (see Fraser,
1986; Fraser & Walberg, 1981). Because many studies have shown that
classroom environment variables account for an appreciable part of the
attitude score variance, the measurement and application of these scales is
discussed more fully in Chapter 4.
Discussion
The usefulness of the review lies in the application of the findings
to computer education. If the results from science studies are applicable
to computer education it would be expected that higher levels of affective
outcomes might be obtained by appropriate choice of lesson activities and
strategies showing particular concern to
(1) Increase the percentage of students' "time-on-task"(2) Use specific teaching activities and combinations of these activities.
(The most useful activities still remain to be identified)(3) Increase the number of practical student activities(4) Improve their classroom management skills(5) Improve pupils' perceptions of the classroom climate.
44

TeacherPersonalCharacteristics
Experience,Quals, gender
Students'ClassroomEnvironmentPerceptions
StudentLearningOutcomes
Attitudes,Anxiety
TeacherClassroomBehaviours
Studentcharacteristics
Gender, courseExperience
Walberg's nine factors include some that are outside the control of
the classroom teacher. Recognising the existence of two sorts of factors,
Haladyna et al (1983) have proposed a model of attitude learning based on
the dimensions of content and focus. Content refers to one of the three
constructs of learner, teacher and learning environment. The focus of
variables may be described as exogenous, lying outside the institution, or
endogenous, within the institution. Endogenous variables are under the
control of the school or teacher, exogenous variables by definition are
not. For example, the teacher has no control over any of the learner
variables such as gender, ability, maturation, and personality. Nor can the
teacher determine the home, peer-group, and media environments of the
learners. The influence of the teacher is restricted to the quantity and
quality of the instruction he provides and certain influences on the
classroom environment.
Exogenous Endogenousvariables variables
Figure 3.1 Model used to denote objectives of the study(Adapted from Haladyna & Shaughnessy (1982))
45
The studies described in this chapter lead to the expectation that of
the endogenous variables, teachers' classroom activities and pupils'
perceptions of the classroom environment are amongst the most important
determinants of pupils' attitudes toward computers. It is, therefore,
worthwhile to make these the principal subjects of a survey of computer
education. In this study information will be obtained about teacher, pupil
and learning environment variables that might determine learning outcomes
in Computer Studies. The variables and interactions to be studied am shown
in Figure 3.1. This is a form of the model of Haladyna & Shaughnessy (1982)
modified to highlight the variables which, according to the studies
reviewed in this chapter, are strongly associated with affective learning.
Summary
Attention has been drawn to Walberg's model which identifies nine
factors which influence learning. These can be grouped into three
categories; learner variables, instructor variables and instructional
variables. Support for the model is obtained from results of meta-analysis
and separate studies in which variables in the three categories were shown
to have significant correlations with both cognitive and affective
outcomes. A justified decision was made to look to science education
studies for help with identifying factors likely to influence outcomes in
computer education. Teacher variables concerned with instructional methods
and pupils' perceptions of the classroom environment appeared to be the
most significant.
46

CHAPTER 4.
THE MEASUREMENT AND EMCTS OF PUPILS PERCEPTIONS OF THE CLASSROOMENVIRONMENT
Introduction
The powerful effects of the learning environment on human behaviour
have been shown in a wide variety of settings including the home, schools
and colleges, the community, and social institutions (Walberg &
Marjoribanks, 1976; Pace & Stern, 1958; Anderson, 1970; Marjoribanks, 1974;
Moos, 1974). Research over more tha.na decade has shown that student
perceptions of the classroom environment account for substantial amounts of
variance in learning outcomes. This research has been replicated at
different educational levels, in several countries and through use of a
variety of classroom environment measuring instruments. Reviews of research
relating classroom environment to learning outcomes have been given by
Anderson & Walberg, 1974; Walberg, 1976; Fraser 1981a, b; Fraser & Walberg,
1981; Fraser, 1986. Fraser (1986) refers to "compelling evidence that the
classroom environment is such a potent determinant of student outcomes that
it should not be ignored by those wishing to improve the effectiveness of
schools" (page 1).
Definition of classroom environment
According to Walberg classroom environment refers to students' and
teachers' perceptions of all psychosocial aspects of the learning
environment that influence learning. Classroom environment perceptions
include interpersonal relationships amongst pupils, pupil-teacher
relationships, the material provisions of the classroom and pupils' liking
for the subject and method of teaching. Classroom environment perceptions
characterise the learning environment as seen by the participants, this may
be different from the impressions of the teacher and of an outside
observer.
From a study of environments in a wide range of social institutions,
Moos (1974, 1979) derived three categories, or dimensions, of environments
that bear on behaviour. The three dimensions are:
47

Relationships: which identify the nature and intensity of personalrelationships including person-person support within the environment
Personal development: the direction(s) along which personal growth andself-enhancement will tend to occur and the extent to which the environmentprovides for and encourages such development
System maintenance and system change: the extent to which the environmentis perceived as orderly, has clear goals and expectations and is responsiveto change.
Moos concluded all three dimensions must be assessed to provide a
complete understanding of any environment (Moos, 1974). This principle has
had an important influence on the development of instruments to measure
classroom environment. In these dimensions the role of teachers in learning
is implictly included through their effects on the classroom psychosocial
environment.
The assessment of psychosocial classroom characteristics
Questionnaires to teachers and pupils are convenient for tapping
psycho-social perceptions of the learning environment. When used in this
way, the items are high inference measures requiring the respondent to
evaluate the meaning of classroom behaviours. For example a response to the
item "The teacher is friendly to students" on a scale from Strongly Agree
to Strongly Disagree requires students to make judgements based% synthesis
of a range of past events. Measures of this kind contrast with the low
inference measures found in observation schedules.
Proponents of the use of students' responses to high inference items
advance a number of arguments to support their use in preference to low
inference observation studies. The arguments may be summarised as follows:
1. paper and pencil tests are more economical than the use of trainedobservers,2. students' perceptions are based on experiences over several lessons; anobserver may see only one or at most a few lessons for a particular classor teacher,3. questionnaires tap the perceptions of all members of the class incontrast to observation by (usually) a single observer
Students' perceptions are real to them and may be more important than
"true" events as determined by an objective and non-involved observer.
Mintzes (1982) points out "It is quite possible that outside observers do
48

not share the assumptions of students whose learning outcomes are being
monitored...students may have their own normative and idiosyncratic
assumptions about teaching behaviours and these assumptions may be as
important to learning as the behaviours themselves." (p.790). It is
possibly for this reason that perceptual measures of classroom environments
have been found to account for more learning outcome variance than
classroom observation variables (Fiedler, 1975).
In common with other questionnaire-based studies, classroom
environment research has the problem that teachers' and students' answers
may be over generalised and biased towards views thought to be socially
desirable. Despite this difficulty, the convenience and demonstrated
validity of perceptual measures of classroom psychosocial environments have
led to significant research in many countries. Several instruments are now
available for these studies and some of them have been used in a
sufficiently wide range of classrooms for their statistical properties to
be known.
The following sections give an account of three of these instruments
and investigational methods that might be applied to a survey of computer
education classrooms.
Three classroom environment instruments
Instrument
Number of Items
Scoringscales per scale
Learning Environment 15 7 SD, D, A, SAInventory (LEI) (1) (1, 2, 3, 4)
Classroom Environment 9 10 True/FalseScale (CES) (2) (1/0)
Individualised 5 10 SD,D,NS,A,SAClassroom Environment (1,2,3,4,5)Questionnaire (ICEQ) (3)
References: (1) Fraser, Anderson & Walberg, 1982(2) Moos & Trickett, 1974(3) Rentoul & Fraser 1978
Table 4.1: Overview of three classroom environment instruments
49
Table 4.1 gives an overview of three instruments that have been used
in a range of secondary school level classroom environment research. They
are the Learning Environment Inventory (LEI) (Fraser, Anderson & Walberg,
1982), the Classroom Environment Scale (CES) (Moos & Trickett, 1974) and
the Individualised Classroom Environment Questionnaire (ICEQ) (Rentoul &
Fraser, 1978).
Table 4.2 gives descriptions of the 29 separate scales contained in
the LEI, CES and ICEQ instruments. The classification of the scales given
in the table is that of Moos (1974, 1979). In agreement with Moos'
requirement each instrument contains one or more scales classified with
each of his three categories.
The sample items show the three instruments are concerned with
different aspects of the classroom environment. Although even within each
instrument, the scales are not wholly separate, some broad trends can be
distinguished. The LEI instrument focuses principally on the actions of the
class, the CES scales are divided between class and the teacher's control
of the class, whilst the ICEQ items ask for perceptions of teaching and
learning activities.
Development procedures for the three instruments have been described
in the references given. An overview is available in Fraser (1986, pages
22- 30). Briefly, for all the instruments the stages of development were:
1. Identification of the salient dimensions which characterise the style ofclassroom of interest to the study. The dimensions chosen have to providecoverage of all aspects of interest whilst remaining conceptually distinct.
2. Items for the dimensions (scales) were written
3. Test items were pilot-tested with samples of students; responses weresubjected to a range of item analyses to remove faulty items and soobtained enhanced reliability and discriminant validity
4. Statistics of scales comprising the retained items were eithercalculated from sample responses or determined using a fresh sample ofrespondents.
50
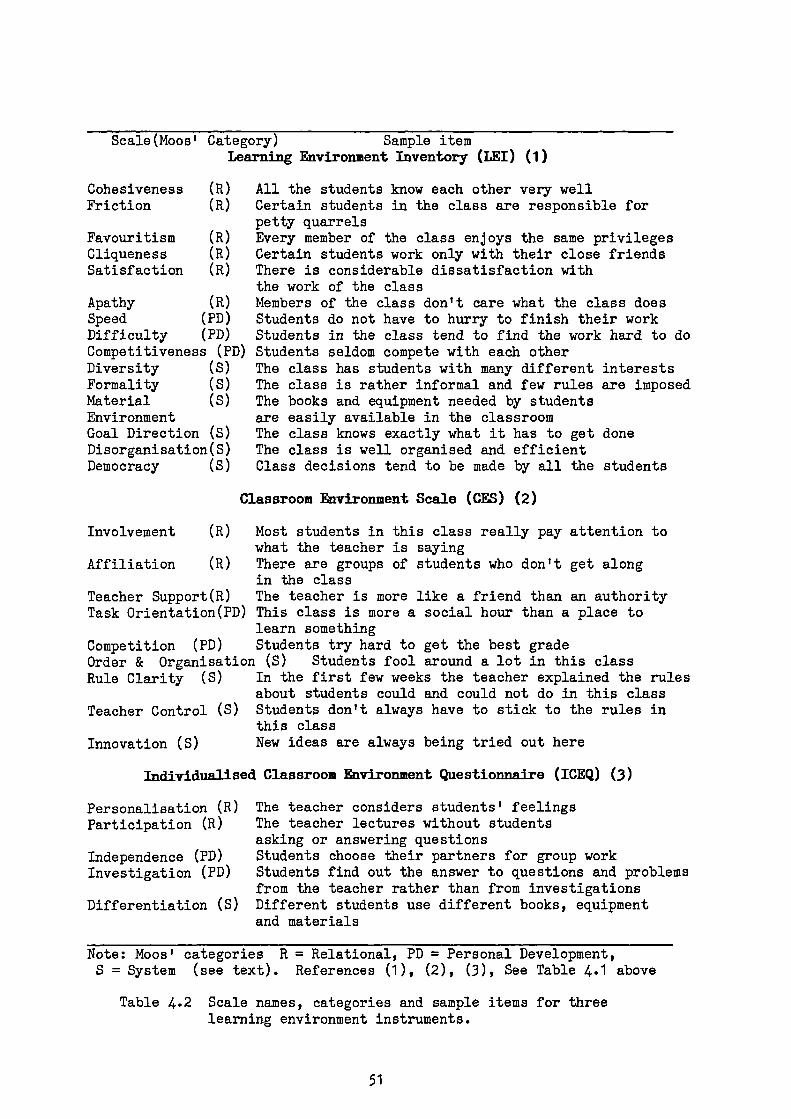
Scale(Moos' Category) Sample itemLearning Environment Inventory (LEI) (1)
Cohesiveness (R)Friction (R)
Favouritism (R)Cliqueness (R)Satisfaction (R)
Apathy (R)Speed (PD)Difficulty (PD)Competitiveness (PD)Diversity (S)Formality (S)Material (S)EnvironmentGoal Direction (S)Disorganisation(S)Democracy (S)
All the students know each other very wellCertain students in the class are responsible forpetty quarrelsEvery member of the class enjoys the same privilegesCertain students work only with their close friendsThere is considerable dissatisfaction withthe work of the classMembers of the class don't care what the class doesStudents do not have to hurry to finish their workStudents in the class tend to find the work hard to doStudents seldom compete with each otherThe class has students with many different interestsThe class is rather informal and few rules are imposedThe books and equipment needed by studentsare easily available in the classroomThe class knows exactly what it has to get doneThe class is well organised and efficientClass decisions tend to be made by all the students
Classroom Environment Scale (CES) (2)
Involvement (R) Most students in this class really pay attention towhat the teacher is saying
Affiliation (R) There are groups of students who don't get alongin the class
Teacher Support(R) The teacher is more like a friend than an authorityTask Orientation(PD) This class is more a social hour than a place to
learn somethingCompetition (PD) Students try hard to get the best gradeOrder & Organisation (S) Students fool around a lot in this classRule Clarity (S) In the first few weeks the teacher explained the rules
about students could and could not do in this classTeacher Control (S) Students don't always have to stick to the rules in
this classNew ideas are always being tried out here
Individualised Classroom Environment Questionnaire (ICEQ) (3)
Innovation (S)
Personalisation (R)Participation (R)
Independence (PD)Investigation (PD)
Differentiation (S)
The teacher considers students' feelingsThe teacher lectures without studentsasking or answering questionsStudents choose their partners for group workStudents find out the answer to questions and problemsfrom the teacher rather than from investigationsDifferent students use different books, equipmentand materials
Note: Moos' categories R = Relational, PD = Personal Development,S = System (see text). References (1), (2), (3), See Table 4.1 above
Table 4.2 Scale names, categories and sample items for threelearning environment instruments.
51

The Learning Environment Inventory (LEI)
The LEI was originally developed for evaluation of the Harvard
Project Physics programme (Walberg, 1968). Based on experiences with an
earlier instrument known as the Classroom Climate Questionnaire, Anderson &
Walberg (1974) were able to choose for the LEI "concepts previously
identified as good predictors of learning" and others " considered relevant
to social psychological theory and research... (and) concepts intuitively
judged relevant " (p.3).
In the most recent version of the LEI (Fraser et al, 1982) the mean
values of the alpha internal reliabilites of the scales obtained from a
variety of subject areas were in the range 0.56 - 0.85 whilst the inter-
scale correlation values were low, in the range 0.08 to 0.40, indicating
they probably measure distinct environment dimensions.
The Classroom Ehviromment Scale (CES)
In developing the CES, Trickett & Moos (1973) reviewed literature in
educational and organisational psychology, read descriptions of classroom
environments, conducted interviews with teachers and observed classes in
contrasting schools. The dimensions chosen for the CES were consistent with
the three basic categories described by Moos.
The final version of the CES contains nine scales with 10 items of
True-False format in each. A version of the CES similar to that of Trickett
& Moos is mentioned by Fraser & Fisher (1983a). Their instrument contains
87 items only because removal of 3 items resulted in a noticeable
improvement in scale statistics. This illustrates the continuing
development of classroom environment scales when each application of an
Instrument may also be used as an opportunity to reappraise the scale
content and to redetermine scale reliabilities.
The values of the scale internal reliabilities and
intercorrelationsof the CES instrument were similar to those of the LEI
being in the range 0.67 to 0.86, and from 0.09 to 0.31 respectively.
52
The Individualised Classroom Environment Questionnaire (ICEQ)
The ICEQ was developed to measure the environment of classroom
settings (predominantly science classr000ms) commmonly described as "open",
"individualised" or "enquiry-based" (Rentoul & Fraser, 1979). Development
of the instrument was guided by the wish to produce an economical
instrument of a few scales only. Dimensions for the ICEQ were chosen after
a review of the literature on open classrooms and individualised curricula;
the views of teachers and educators were also obtained. Ideas for items and
scales were also obtained from existing instruments, Rentoul & Fraser
list 17 scales that were consulted as relevant to the study. The final form
of the instrument contains 50 items arranged in five equal scales. The
wording of the items is said to be appropriate to secondary school
students.
The mean alpha coefficient of the ICEQ scales is 0.70. The scale
inter-correlations range from 0.16 to 0.36 with a mean of 0.27 showing the
scales are statistically distinct though somewhat overlapping.
Other forms of the LEI,CES and ICEQ instruments
Tisher & Power (1975) reported that 14 year olds had difficulty with
some items of the original LEI. Partly for this reason and partly for
reasons of test economy, a simplified version of the LEI known as the Nil!
Class Inventory (MCI) was produced (Anderson, 1971b) and further developed
for use with pupils age 8-12 years (Fisher & Fraser, 1981; Fraser, Anderson
& Walberg, 1982). The MCI retains only five of the 15 LEI scales; in the
short form of the instrument there are five items per scale; all the items
have a YES/NO response format and a reduced level of reading difficulty.
Although the CES and ICEQ instruments have been used successfully in
the forms described above, some applications require a more rapid
assessment of classroom environment. For this purpose, Fraser and Fisher
developed short forms of the CES and ICEQ instruments (Fraser 1982a, Fraser
& Fisher, 1983). The short form of the CES contains only six (instead of
nine) scales and each scale is reduced to 4 items. The short form of the
ICEQ contains 25 items with 5 items for each of the five scales contained
53
in the full instrument. Thus, in contrast to the modified LEI and CES
instruments, the short form of the ICEQ does not reduce the range of
classroom environment variables that are assessed.
Fraser & Fisher (1986) give statistical data on the short forms of
the MCI, CES and ICEQ instruments using data collected from large and
representative samples of classes in the USA and Australia. The data
provide evidence of the reliability and validity of the short forms of each
scale. The correlations between the long and short forms of the CES and
ICEQ scales were quite high ranging from from 0.78 to 0.97. These values
are interpreted as showing that in the two forms of the instruments, the
scales measure the same constructs. The internal reliability of the
shortened scales was lower in line with the reduction in the number of
items.
Review of studies of the association between student outcomes and classroomenvironment
Early research on the social climate of learning concentrated on the
relationships between perceived classroom environment and cognitive
outcomes (e.g. Anderson, 1970, 1971a; Walberg, 1969). Lawrenz (1976a,
1976b) was one of the first to investigate a suggestion due to Bloom (1971)
that students/ perceptions of the classroom environment should also affect
outcomes in the affective domain. In the study of Lawrenz (1976a), high
school students of Physics, Chemistry and Biology completed a Science
Attitude Inventory and the 10-scale LEI. Three separate analyses were used
to find which LEI scales acted as predictors of attitude to science for
students of biology, of chemistry and of physics.
Linear regression equations accounted for 29-39% of the attitude
score variance. In biology classes Favouritism was the best predictor of
attitude to science. In chemistry classes the scales of Friction,
Difficulty and Diversity were predictors of attitude. In physics classes
none of the LEI scales was a significant predictor of attitude to science.
Lawrenz suggests this result may be a consequence of the greater maturity
of physics students who had already spent two years studying first biology
and then chemistry.
54
Learning outcome
Social implications of scienceEnjoyment of science lessonsNormality of scientists
Attitude to InquiryAdoption of scientific
attitudesLeisure interest
Generalisations
Fraser (1979) examined the relationships between four cognitive and
three affective science outcomes and a version of the LEI modified to make
it more relevant to seventh grade science classrooms in Melbourne,
Australia. Multiple regression analysis showed that after controlling for
pretest scores, socioeconomic status, general ability and gender, the
classroom environment scales accounted for between 3% and 22% (mean 8%) of
the mean score variance.
A comprehensive study of science classroom environments based on the
CES was carried out by Fraser & Fisher (1983b). The sample consisted of
2175 students in 116 Grade 8 and Grade 9 science classes in Tasmania,Australia. Tests of three cognitive and six affective outcomes were given
at both the beginning and end of the year, the CES instrument was used at
mid-year. Results showed that, after correction for pretest scores, the the
number of significant outcome-environment correlations was about four times
that expected by chance. Multiple regression equation coefficients were
used to suggest which environment variables were most strongly associated
with particular learning outcomes. The results were:
Favoured by:
Order & organisation (+)Order & organisation (+)Teacher support (+),Innovation (-)Rule clarity (+)Affiliation (-OpInnovation (-)Order & organisation (+),Innovation (+)Teacher support (+),Task orientation (-OpInnovation (-)
Note + (-) indicates that outcome scores are increased bygreater (lesser) scores on the environment variable.
The same study explored relationships between the nine learning
outcomes and the 5 ICEQ scales. The scales of Participation, Involvement
and Investigation were positively associated with outcomes of Social
implications, Attitude to scientists and Generalisations. The block of 5
ICEQ scale scores accounted for 7.1% of the posttest attitude score
variance, the ICEQ scores were not significantly related to the achievement
55

score variance. The communality and uniqueness of the CES and ICEQ scales
were also calculated from the data. It was shown the two instruments
measure different dimensions and that it may be worthwhile to use both in
the same study of outcome-environment relationships.
The study of environment-outcome relationships has not been confined
to use of the LEI, CES and ICEQ instruments. Gardner (1976) used eight
classroom environment scales derived from a college level questionnaire to
predict four attitude criteria. He found the number of significant
correlations between an attitudinal outcome and an environment measure was
five times that expected by chance. A meta-analysis of studies relating
classroom environment to student outcomes in eight subjects and four
countries has been made by Haertel, Walberg and Haertel (1981). Their
results agree with earlier findings by Anderson & Walberg (1974) that
student perceptions of the learning environment account for about 30% of
the variance in learning outcomes beyond that accounted for by appropriate
pre-test measures.
The results quoted in this section together with others in reviews
and elsewhere support the view that the classroom environment has important
effects on student learning. Although the relationships are correlational
and therefore not proof of causality, they are sufficiently strong and
widespread to suggest that assessments of students' perceptions of the
classroom environment should be included in any comprehensive survey of
Computer Studies teaching.
Review of determinants of classroom environment
In the studies sampled in this section classroom environment scores
were used as dependent (criterion) measures. Fraser (1986) summarises work
on classroom environments as criteria under three headings: curricula,
differences between teachers and students, and other variables. The present
discussion is limited to research studies concerned with the effects of
variables wholly or partly under the control or selection of the teacher.
In an evaluation of science facilities in Australian schools, Ainley
(1978) examined the relationship between the provision of science
56
facilities and a specially devised classroom environment scale, Stimulation
through variety. This variable included students' perceptions of provision
for independent inquiry and of the range and variety of resources. The
independent variables were science room occupancy, science room quality,
apparatus provision, and technical support. From a study of 105 classrooms
only one significant result was obtained, scores on the Stimulation through
variety scale were greater in classrooms that had more apparatus.
Talmage and Hart (1977) used the short form of My Class Inventory
(MCI) instrument in an evaluation study of a one-year in-service programme
on investigative approaches to the teaching of mathematics. The
experimental group consisted of 23 classes of pupils taught by teachers who
had attended the programme, they were compared with a control group of 23
classes taught by non-programme teachers. It was shown that, after allowing
for pretest scores, class level mean scores on only the cohesiveness scale
were significantly higher in the group taught by programme-trained
teachers.
Fraser (1986) reports a study of effects arising from teacher
competency in USA elementary schools made by Ellett et al (1978). Teacher
competency was measured by 20 indicators of planning, managing,
instructing, etc. using data collected from observers, peer-group teachers,
school administrators and students. Students' perceptions were measured
using the MCI instrument. Twenty per cent of the correlations between
classroom environment variables and teacher competency scores were
statistically significant. More competent teachers had classrooms that were
perceived by students as having less friction and a higher level of
satisfaction. Lawrenz & Welch found in comparison with classes taught by
male teachers, classes of female teachers were perceived as higher in
diversity, goal direction and formality and lower in difficulty.
The studies described in this section show teachers may help to
determine the classroom environment through their personal characteristics,
training, or choice of resources. The studies by Ainley and by Talmage &
Hart suggest that relationships in which classroom environment scores are
criterion variables are, in general, weaker than the relationships found
using the same variables as predictors.
57
The Choice of Classroom environment measures for studies in ComputerEducation
Several studies have shown that one or more scales of the MCI, LEI,
CES and ICEQ instruments are correlated with cognitive or affective
learning scores. Results such as those reported above may, however, not be
applicable to all subjects and to all pupils. Fraser & Fisher (1982b)
advise
"some caution is needed before generalising from theseresults. Those specific classroom environmentcharacteristics found conducive to the achievement ofoutcomes in science classes are not necessarily those likelyto enhance the attainment of aims valued in classes studyingother school subjects (e.g. English). Results found among asample of Australian students at junior high school levelare not necessarily generalisable to other cultures andgrade levels." (p.515).
The need for caution expressesd in this paragraph is slightly reduced
by the later report (Fraser, 1983) that the ICEQ scales gave statistically
similar results when used with science and social science classes of pupils
age 13-16 years.
In other words, although it is likely that use of a group of
classroom environment measures will show significant relationships between
learning and environment scores in most school subjects, the particular
scales and strengths of the relationships could differ from study to study.
Lawrenz (1976a) showed how different scales can be associated with
superficially similar groups of students and environments.
The difficulty of applying the results of one study to the design of
another stems from the lack of a basic educational or psychological theory
of the relationships between classroom environment as measured by existing
scales and learning. The lack of a basic theory leaves the choice of scales
and of items for the scales to the subjective decisions of the researcher.
Thus it is partly a matter of choice whether the study uses an established
instrument or whether a new instrument is devised and developed. As
Computer Studies is a relatively new entrant to the school curriculum there
has not been time to build up a substantial body of research in the
teaching of the subject. The lack of information about activities in
58

Computer Studies classrooms effectively prevented the development of new
learning environment scales for this subject. Thus it seemed worthwhile to
use one or more of the established scales to obtain pupils' perceptions of
the classroom environment in a survey of Computer Studies teaching.
Because one aim of the research was to provide a description of
Computer Studies teaching, the choice of scales was restricted to those
focused on teaching, lessons and the behaviours of pupils and teachers
which effectively ruled out the LEI scales because almost all of these have
the class as the scale subject. The same criterion also cast doubt on the
usefulness of the CES scales of Affiliation and Competition. It was also
decided to favour the use of scales that had shown significant
relationships with outcomes in science classes. To preserve validity it was
decided to use the full (long) form of each selected scale.
Instrument and Raw correlation withScale name (£) Affective learning outcome
SocImp LeisInt EnjLsn
CESInvolvement 0.22* 0.28** 0.42**Affiliation 0.16 0.22* 0.20*Teacher support 0.16 0.11 0.27**Task orientationCompetition
0.25** 0.25** 0:1;0.20* 0.08
0
Order & organisation 0.30** 0.41** 0.45**Rule clarity 0.24* 0.25** 0.25**Teacher control 0.02 0.04 -0.02InnovationICEQ
0.:
0.20* -0.20*
Personalisation 0 0.09 0.29**Participation 0.30** 0.22** 0.32**Independence . 010.05 0 0.11InvestigationDifferentiation
0.15
0.20* 1-0.03 -0.02
Notes: (£) Long forms of all scales.* sig at p < 0.05, ** sig at p < 0.01Outcomes key: SociImp = Social implications,LeisInt = Leisure interest, EnjLsn = Enjoyment of lessonsAdapted from Fraser & Fisher (1982)
Table 4.3: Correlations of CES and ICEQ classroomenvironment scales with affective outcomes
59
Data from a study of science classrooms is shown in Table 4.3 (Fraser
& Fisher, 1982a). The attitude scales of Social implications, Leisure
interest and Enjoyment of Lessons have been selected for inclusion in the
table because they are apparently similar to the CARAQ scales of SOCIAL,
LEISURE and SCHOOL.
It was decided to use all five scales of the ICEQ. Although two
scales lack significant correlations with science outcomes, their inclusion
in the computer studies survey seemed justified. Intuitively, the scale
INDEPENDENCE has face validity with a subject in which pupils with a home
computer may be expected to do some work at home. The scale DIFFERENTIATION
is included because it was recognised that the inclusion of the student
project requires Computer Studies to have a higher level of differentiation
than, say, science. Many CS teachers say they pay particular attention to
the matching of students' projects to their capability.
From the CES instrument it was decided to select the scales
INVOLVEMENT, TASK-ORIENTATION, ORDER & ORGANISATION, and INNOVATION. The
first three scales have high correlations with affective outcomes in
science and their selection is probably justified on these grounds. The
fourth scale, INNOVATION, has fewer significant correlations with affective
outcomes but seems appropriate in a subject that has a variety of new
equipment. It might be expected that some teachers would use these
resources to try out new teaching approaches, for demonstrations or other
purposes. The four scales from the CES that were not used were less
concerned with classroom events. Their omission was thought necessay to
permit students to provide some personal information and to answer other
scales in addition to the CE scales within a 35-minute period.
Chapter 7 will refer to the relationships found by Fraser et al
(1983) between Science Anxiety and the ICEQ scales of PERSONALISATION and
PARTICIPATION and the CES scales of INVOLVEMENT, ORDER & ORGANISATION, and
INNOVATION. A later decision to include the assessment of pupils' level of
Computer Anxiety in the study also argues for the inclusion of these scales
in a classroom environment questionnaire for Computer Studies.
60
SumsarY
This chapter has described the LEI, CES and ICEQ instruments that
have been widely used for the assessment of pupils' perceptions of the
classroom environment. Previous research has shown pupils' perceptions are
significantly related to affective learning outcomes; typically from 3 to
25% of the attitude score variance may be explained by classroom
environment scores.
Criticisms of the proliferation of scales and lack of information
about Computer Studies teaching led to a decision to employ scales from
existing instruments. The use of existing scales would permit comparisons
with previous studies and would also help the study to avoid the criticism
that the researcher's personal choice of items might in some way pre—empt
the findings of the survey. Properties of the CES and ICEQ scales and their
association with outcomes in science attitude studies were used to guide
the selection of scales for the assessment of Computer Studies classrooms.
61

CHAPTER 5
OBJECTIVES, METHODOLOGY, AND RELATED ISSUES
The objectives of the study
The objectives given below were contained within the research
described in the following chapters.
1. To describe the characteristics of a sample of pupils engaged inComputer Studies.
2. To identify scales or instruments suitable for the measurement ofattitudes toward computers held by Computer Studies pupils.
3. To seek relationships between pupil characteristics and attitudes tocomputers in the sample of Computer Studies pupils.
4. To describe the characteristics of a sample of Computer Studies teachers
5. To identify and measure variables that correspond to stablecharacteristics of teachers' behaviours in Computer Studies lessons.
6. To seek relationships between the behaviour variables of ComputerStudies teachers and pupils' attitudes toward computers.
7. To identify scales or instruments to measure pupils' perceptions of theComputer Studies classsroom environment.
8. To seek relationships between pupil characteristics and perceptions ofthe Computer Studies classroom environment.
9. To seek relationships between the behaviour variables of ComputerStudies teachers and pupils' perceptions of the Computer Studies classroomenvironment.
10. To seek relationships between pupils perceptions of the ComputerStudies classroom environment and their attitudes toward computers.
11. To determine the lesson styles, activities and resources used byteachers and 14-16 year old pupils in Computer Studies lessons.
12. To determine whether lesson styles and resource use in Computer Studieslessons are related to characteristics of the teacher, pupil and classroomenvironment.
The boundaries of the study
Modern syllabuses are crowded and leave teachers and pupils with
little or no time to undertake additional classroom activities. Hence it
62

was decided that the study should make minimum demands on the time of
teachers and interrupt classrooms for no more than a single lesson period.
This time was probably the maximum teachers would feel able to spare from
the programme of pupils in the final stage of their two-year examination
course.
Teachers were assured their replies and all the information obtained
from them and their pupils would be treated in confidence. They were told
no teacher or school would be named or otherwise identified in any report.
For this reason teachers would be given the opportunity to respond
anonymously if they wished. It was thought desirable that pupils too should
give their responses anonymously.
Potentially there is a very large number of variables relevant to
teaching and learning in Computer Studies. Some attempt was made to
restrict their number or range. The pupil study was restricted to fifth
year pupils studying Computer Studies as an examination subject (0-level,
16+ or CSE). It was hoped that the restriction to this group would reduce
between school variability of course content, time allowance, access to
resources, and the expertise of staff. The choice of a single year-group
removed pupil-age as a variable. Fifth year pupils were chosen to ensure
that all pupils in the sample had covered a substantial part of the content
of their two-year course. In addition, obtaining data from pupils in the
second year should have the effect of diminishing the importance of pre-
course school experiences of computers.
The discussion of Chapter 3 has shown any correlations between
teaching style, lesson activities and computer attitudes were likely to be
rather weak. Large samples of teachers and pupils were therefore desirable.
This requirement ruled out an approach based on direct observation of a
small number of classrooms and interviews with teachers and pupils.
Instead, a postal survey was chosen; this gave access to a larger pool of
teachers and permitted a wider geographical spread of the sample.
63

The survey technique
Survey research is a means by which new knowledge about "what is" can
be generated. New knowledge is needed in Computer Studies, a curriculum
area in which we know little of the context in which students develop
attitudes and interests and the role of teachers and classroom activities.
A significant decision in the design of a survey is the choice of the
sample as generalisations from a survey are limited to the population that
the sample represents. Consideration has to be given as to whether the
sample should be a weighted cross-section of the whole population of
teachers or simply encompass the full range of different styles of Computer
Studies teaching. A weighted random sample of teachers drawn on a national
basis is the ideal sampling model, but is rarely possible on grounds of
limited knowledge, availability of resources and the cost of staffing.
These limitations applied to the present study. It was decided to try to
obtain a sample that included all types of Computer Studies teaching though
not necessarily in proportion to their frequency in the total population.
Accordingly a postal survey based on a random sample of schools from
different types of Local Education Authority was used to sample the full
range of computer education policies, levels of resource provision and
teacher support.
The identification of significant measures of teacher behaviour
In attempt to find stable measures of teacher behaviour, Shaveleson &
Dempsey-Atwood (1976) examined different studies that investigated the same
teacher variables but differed in other respects. They concluded that an
unreasonable number of raters and occasions are required to measure
individual variables reliably. They discovered that stable measures having
high correlations with student outcomes could be obtained by grouping
variables relating to the same behaviour. Moderately stable measures of
teachers' behaviours included presentation, feedback, and direct control.
One of the deficiencies of studies of teacher effectiveness has been
over-reliance on dichotomies of teaching style whereby all teachers have
been classified as either progressive or traditional, formal or informal,
democratic or authoritarian. Therefore a naturalistic approach was sought
64

that would identify intrinsic teaching operations as opposed to confirming
expectations. The term /intrinsic' emphasises that the identification of
the activities rests with the teachers rather than with an external
observer or category system. Cluster analysis was seen as an appropriate
statistical procedure for the identification of groups of teaching
activities subject to subsequent demonstration of the validity of the
resultant classifications. Cluster analysis has been used in several
studies since Barker Lunn's (1969) investigation of streaming in primary
schools recognised the value of grouping people (teachers) rather than
grouping variables (classroom events) (Bennett, 1976; Galton & Eggleston,
1979; Youngman, 1983).
Answers to the Bennett questionnaire were subjected to cluster
analysis in order to group together teachers who had a similar profile of
responses to all the questionnaire items. These groupings were denoted as
types or teaching-styles. Analysis of responses from 468 fourth year
primary teachers showed twelve teaching-styles. Each style was
characterised by the use or non-use of a number of teaching behaviours.
Bennett and others had the benefit of a considerable body of
literature from which they could extract characteristics and categories of
primary school teaching. There is no matching body of literature on the
teaching of Computer Studies. Discussion and criticism of subject content,
examinations, and the curriculum role of Computer Studies are available but
these do not cover descriptions of what teachers do nor suggestions of what
they might do in the classroom. Thus there is no adequate basis for the a
priori identification of teaching categories for a survey questionnaire.
Any selection that was made would be very likely to reflect the bias of the
researcher or the small group of persons he was able to consult.
65
The requirements of this study of teaching style were identified as:
1. Absence of a priori descriptions or classifications in favour ofanalysis of intrinsic data.
2. Descriptions of teaching style to be multidimensional, i.e. eachdescriptor should combine a number of separate teaching activities.
3. Validation of teaching style groups to be obtained through correlationswith other data.
The use of cluster analysis permits requirements 1 and 2 to be
satisfied. The results of cluster analysis should be treated as valid only
when they show understandable correlations with other group
characteristics.
The choice of pupil learning outcomes
Learning outcomes fall into the psychomotor, cognitive and affective
domains. The psychomotor domain has little relevance to the present study.
It is not part of the content of Computer Studies, an academic subject,
that pupils should become, for example, proficient keyboard operators or be
able to demonstrate motor skills in the handling of computer equipment.
It seemed unlikely that a cognitive test could be accoAdated within
the study as the devising and validation of an acceptable cognitive test
for use with a wide population was judged to require time, skills and
resources beyond those available. As many research studies have shown the
achievement-attitude relationship to be rather weak, assessment was
restricted to the affective domain.
The principle of anonymous responses was desirable in order to
maintain the validity of the research at the highest possible level. Any
other format could encourage pupils to give the answers they thought were
wanted, or those thought acceptable to their teacher, rather than their own
opinions. Adopting the principle of anonymous pupil responses had two
important consequences for the design and methods of analysis of the study.
Firstly, the design was limited to a posttest-only design. Secondly, it
predicated the choice of the class as the unit of analysis.
66
The use of a pretest
Whilst the pretest is commonly used in educational research to ensure
equivalence (or a measured lack of equivalence) between experimental and
control groups, it is not actually necessary to experimental design
provided that randomisation ensures lack of initial biases in the samples.
It was already known that the study of pupil outcomes would have to be
based on intact classes offered by teachers rather than chosen according to
the needs of systematic sampling. Because intact classes were used true
randomisation was not possible and the methodology became what Campbell and
Stanley (1963) have termed "quasi-experimental".
Campbell & Stanley (1963) mention the possible effect of pretesting
on posttest scores. Studies of this effect have been reviewed by Bracht &
Glass (1968), Welch and Walberg (1970) and Willson and Putnam (1982). The
Willson and Putnam study was a meta-analysis of 33 studies in which only
part of the total sample had taken a pre-test. They conclude there is a
significant general pretest effect which has most serious implications for
interpretation of findings in nonrandomised studies. The effects of pretest
sensitisation are different for cognitive and affective outcomes. Cognitive
gains might be made due to familiarity with testing procedure. For
affective outcomes there may be halo effects in which everyone feels better
on the second testing.
Omitting the pretest would also remove a major source of sample
attrition. In a previous study (Moore, 1984) based on a 12-month interval
between initial and final testing, from an original sample of 1240 pupils
only 911 were located at the posttest stage. The loss of over 30% of the
sample occurred in eight local schools that could be visited by the
researcher at convenient times. The prospective sample loss was likely to
be much greater if (i) the pretest to posttest interval was increased to
almost two years (the duration of the Computer Studies course), and
(ii) the sample of schools were to be spread nationally.
67
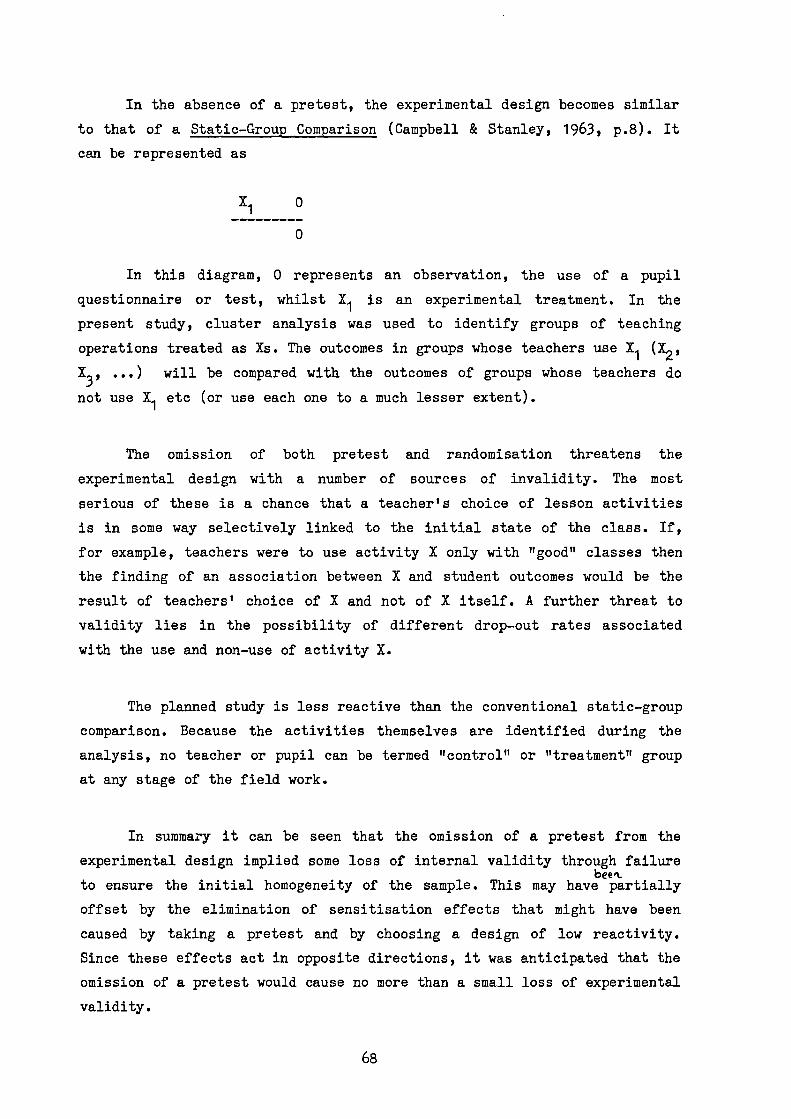
In the absence of a pretest, the experimental design becomes similar
to that of a Static-Group Comparison (Campbell & Stanley, 1963, p.8). It
can be represented as
0
In this diagram, 0 represents an observation, the use of a pupil
questionnaire or test, whilst X i is an experimental treatment. In the
present study, cluster analysis was used to identify groups of teaching
operations treated as Xs. The outcomes in groups whose teachers use X 1 (X
2,
X3'
...) will be compared with the outcomes of groups whose teachers do
not use X1 etc (or use each one to a much lesser extent).
The omission of both pretest and randomisation threatens the
experimental design with a number of sources of invalidity. The most
serious of these is a chance that a teacher's choice of lesson activities
is in some way selectively linked to the initial state of the class. If,
for example, teachers were to use activity X only with "good" classes then
the finding of an association between X and student outcomes would be the
result of teachers' choice of X and not of X itself. A further threat to
validity lies in the possibility of different drop-out rates associated
with the use and non-use of activity X.
The planned study is less reactive than the conventional static-group
comparison. Because the activities themselves are identified during the
analysis, no teacher or pupil can be termed "control" or "treatment" group
at any stage of the field work.
In summary it can be seen that the omission of a pretest from the
experimental design implied some loss of internal validity through failurebee fL
to ensure the initial homogeneity of the sample. This may have partially
offset by the elimination of sensitisation effects that might have been
caused by taking a pretest and by choosing a design of low reactivity.
Since these effects act in opposite directions, it was anticipated that the
omission of a pretest would cause no more than a small loss of experimental
validity.
68

The aggregation of data and the choice of the unit of analysis
Lindquist (1940) recognised a problem that still arouses concern in
the analysis of many educational and behavioural experiments; the question
of whether to use individuals or classes (groups) as the statistical unit
of analysis when the treatment is applied to classes.
Arguments for pupils or groups as the units of analysis have been
made (Burstein & Linn, 1976; Cronbach, 1976). Hopkins (1982) states that
the argument over the choice of class or individual as unit of analysis
arises from a failure to distinguish between the experimental unit and the
observational unit. The experimental unit is the entity allocated to a
treatment independent of other units. In studies of teacher effects and
classroom environment research generally the experimental unit is most
often the class. The class works with a teacher independently of other
classes and other teachers. The class (experimental unit) may contain
several observational units (students). In a class-level analysis, the data
from the individual observational units is aggregated and used as a single
value, the class mean. It seems evident that when the class receives the
treatment as a whole, the class must be used as the unit of analysis.
However studies with fewer observational units have less power to detect
differences. Hence in a class-level study it is preferable to have data
from many classes of a few students rather than from a few classes each
containing many students.
In practice quite different effect sizes are found from analyses
conducted at the two different levels. The study of classroom perceptions
and learning outcomes by Fraser and Fisher (1982a) illustrates the ranges
of values obtained. When the individual was used as the unit of analysis,
the mean correlation between the environment and outcome variables was
0.38, it was 0.50 when the class was used as the analysis unit. Finding
significantly larger values for the class unit is consistent with results
of a meta-analysis study by Haertel et al (1981).
It is now commonly understood that the use of different units of
analysis involves testing conceptually distinct hypotheses (Cronbach, 1976;
Burstein et al, 1978). For example, a question about the relationship
69

between classroom environment perceptions and learning outcomes can be
asked in three conceptually different forms.
1. Does the student who scores higher on classroom environment scales alsoscore higher on outcome measures (class membership being disregarded)?
2. Do students who have different levels of classroom environmentperception from their peers also show different learning outcomes?
3. Do students in classes with high performance on learning outcomes alsohave higher classroom perceptions?
The three analyses required to answer these questions are based
respectively on the scores of individuals only, on the scores of
individuals and class means, and on class means only.
The unavailability of data at one or more of the levels has motivated
much of the literature on the unit of analysis problem. Lack of complete
data prevents researchers from applying the methods and formulae of
Burstein et al (1978) to obtain estimates of the full set of interaction
terms. In the present study the decision to collect only one set of
anonymous data from each student restricted the analysis to the class
level. The questions that could be asked about teacher-student interactions
were therefore restricted to those referring to whole class units as shown
in Example 3 above. Although this restriction was undesirable, there was a
further advantage in pursuing class-level analyses only. Since a class-
level analysis is relatively insensitive to the number of students in each
class, it was practicable to arrange that the two halves of each class
answered different instruments. In this way each class could provide data
on perceptions of the learning environment and on attitudes toward
computers within a single-lesson.
70

SulmiarY
In this chapter, an account has been given of the aims, methodology
and experimental design of the survey.
It is hoped that the range of variables and interactions included in
the study would be considered sufficiently broad and comprehensive to avoid
criticisms of classroom studies expressed by Bennett (1976),
"investigators have commonly observed a narrow range of thebehaviour of a small and unrepresentative sample of teachersdrawn from a population of unknown parameters, and havecategorised them according to some global, ill-defineddichotomy, unrelated to any theoretical perspective"(page 32).
71

CHAPTER 6
THE MEASUREMENT OF TEACHER BEHAVIOUR: INSTRUMENT SELECTION AND DESIGN
Introduction
The principal instrument used to obtain data from teachers was a
booklet "Activities in Computer Studies Teaching". It contained:
A brief statement of the purpose of the research studyInstructions for checklist completionA Checklist of 206 teaching behavioursBiographical data questionnaireExplanation of the Rating MatrixRating Matrix of 17 teaching behavioursQuestionnaire on "The Job of a Computer Studies Teacher"Invitation and space for comments/suggestionsA request for teachers to take part in the pupil questionnaire or teacherdiary parts of the study.
A copy of the booklet is included in the end papers and in the Appendix.
This chapter describes the purpose and development of the
questionnaires and scales included in the teacher instrument.
Three methods of studying teacher classroom behaviour were considered
for the present study; (1) systematic classroom observation, (2) pupil-
report questionnaires and rating scales, and (3) teacher self-report forms
and diaries. Each method will be described briefly in order to indicate its
likely potential as a means of obtaining objective information about the
teaching of computer studies, and why the first two of these methodologies
could not be applied in the present study.
A short review of teacher self-report instruments is given to explain
how such instruments may be used to give valid descriptions of classroom
events. The development of the Activities Checklist is explained in
some detail because the checklist was the principal data-gathering
instrument used with teachers and also because checklists have been
relatively less used in classroom based research. The other questionnaires
and scales used in the teacher booklet are also described.
72
Systematic observation
Systematic observation involves the use by the observer of a
predetermined schedule to code events and behaviours as they occur in the
classroom in preparation for later quantification and analysis. The
'objective' data so collected can be used to generate and test the
hypothetico-deductive type of theory that is characteristic of the natural
sciences. Studies based on systematic classroom observation have been
extensively reviewed (Medley & Mitzel, 1963; Biddle, 1967; Rosenshine,
1971; Rosenshine & Furst 1973; Eggleston et al, 1975, Hamilton & Delamont,
1976; Power, 1977).
About 200 such classroom observation systems are now available (Simon
& Boyer, 1968, 1974; Rosenshine & Furst, 1973; Calton, 1978). The major
criticism of such instruments is based on the danger that preconceived and
structured observation instruments may attend to only a small fraction of
classsroom events ( Hamilton & Delamont, 1976) although McIntyre & Macleod
(1978) have defended systematic observation.
The use of observation schedules suffers from three kinds of
difficulties; conceptual, analytical and practical.
Conceptual difficulties
The conceptual difficulties associated with observation schedules
arise from the methods used to produce them. The categories comprising the
schedules are derived in one of three ways; (1) from theory linked to
previous research, (2) by modification of existing schedules, or (3) wholly
empirically from observations in situations similar to those in which the
instrument(s) will be used.
Slater & Thompson (1977) observed science lesson activities of pupils
age 11-15 years by means of a pupil-behaviour schedule of 16 "learning-
activities" selected by the researchers from the educational literature.
Eggleston et al (1976) developed the Science Teaching Observation
Schedule (STOS) to study interactions in science classrooms. The schedule
73
seems to have evolved empirically from observations of science lessons. The
major rationale of STOS was that it should record intellectual transactions
of pupils with teachers, other pupils and resources. It was also
designed to distinguish between the types of questions asked in science
lessons.
Schedules may be linked with a particular conception of the
instructional process or the need to obtain a particular range of data.
Since one purpose of the present study was to obtain an objective
description of the teaching of Computer Studies it was necessary to avoid
the reservations that might be associated with the use of an imposed
classification in a subject with a wide range of possible activities and
where few parameters have been identified.
Analytical problems
Most observation schedule systems employ one-zero sampling where any
occurrence of a behaviour within the observation interval is recorded.
Altmann (1974) and Dunkerton & Guy (1981) have pointed out that one-zero
sampling imposes distortions on the observed frequencies of different
behaviours that have different durations compared with the length of the
observation period. One-zero sampling fails to give correct estimates of
both the frequency of behaviours and the time spent on different behaviours
unless the sampling interval is small compared with the time spent in the
behaviour. The STOS, which uses a sampling interval of three minutes, has
been critcised on these grounds (Dunkerton & Guy, 1981; Neill, 1983).
Eggleston & Galton's (1981) argument that one-zero sampling gives
minimum frequencies for all behaviours is valid but unconvincing. Since
one-zero sampling gives minimum frequencies, the tendency is for all
teachers to show similar frequencies for common actions. This means that
teachers will be most easily distinguished by their rare actions. It is
probably not appropriate to distinguish between teachers on the basis of
rare and possibly insignificant actions. Although this analytical pitfall
might be avoided in a well-documented subject such as science teaching, it
could be more difficult to distinguish between significant and non-
significant activities in less-researched areas.
74
Resource difficulties
There are also practical difficulties associated with the use of
observation methods. To obtain an adequate sample of classroom behaviours
it is usually necessary to visit a considerable number of teachers and,
because events within lessons are not independent, to visit each on more
than one occasion. The training of observers and the visiting of classrooms
is time-consuming and therefore expensive.
The role of observation schedules in the present study
For the three groups of reasons mentioned, it was decided to neither
develop a new schedule nor adapt an -existing schedule, so the study made no
direct use of classroom observation.
Instruments utilising students' perceptions
Instead of using an outside observer to report on classroom
processes, the students may be asked to report on occurrence of specific
teaching activities or the use of tactics such as individualised
instruction. Student self-report instruments hold the advantage over other
observational techniques in their efficiency in gathering a large amount of
data in a short time.
Steele, House and Kerins (1971) have shown that students' perceptions
of teachers' behaviours agree significantly with judgments of experienced
observers although both differ from those of the teachers' reports (Ehman,
1970; Steele, House & Kerins, 1971). Peck, Fox & Blattstein (1979) found
that elementary school pupils' perceptions of teachers were reliable and
stable across different classes. Waxman & Eash (1983) used a student-report
instrument to capture data on eight classroom process variables. The study
found that some teacher behaviours were significantly positively
associated with student achievement. These results further substantiate the
possibility of utilising students' perceptions of teachers as part of
classroom research.
75
Despite the demonstrated stability and usefulness of students'
perceptions of classroom events in previous research, this investigational
technique was not used in the present study. One reason was that the
categories on which students can report do not include teacher preparation
and other out-of-the-classroom teaching activities. Further, the
preparation of a student report schedule suffers from many of the
conceptual problems described in connection with construction or selection
of a teacher observation schedule. The deciding factor against use of this
type of instrument was that of student load. Students taking part in the
survey would be asked to provide a considerable amount of data relating to
attitudes, perceptions of the classroom environment and some personal
variables. It seemed unreasonable to ask the same students to also provide
a detailed report on lesson activities.
Research on Teacher self-report instruments
In studies based-on self-report instruments teachers are interviewed
or asked to complete a structured document or to write an account of their
lesson immediately after its completion.
Hook & Rosenshine (1979) reviewed studies which compared teachers'
estimates of their classroom behaviour with independent observations and
concluded that "one is not advised to accept teacher reports of specific
behaviours as particularly accurate" (page 10). Certainly from six studies
which investigated the correspondence between teachers' and observers'
reports of specific classroom activities, agreement was not good. In one
study by Weiss (1973) it was shown that teachers tend to over-estimate
their use of socially desirable teaching behaviours such as discovery
learning and to under-estimate their use of less desirable behaviours.
In three further studies Hook & Rosenshine found evidence of greater
correspondence between teachers' responses and observations when the
investigation grouped both responses and observations into scales or
dimensions. The finding that grouped activities are more reliable
indicators of teaching behaviour had previously been reported by Shavelson
& Dempsey-Attwood (1976).
76

Newfield (1980) has critically reviewed the work of Hook & Rosenshine
and has offered fresh data supporting the value of teacher self-reports. He
pointed out that they had chosen not to comment on evidence (quoted in
their paper) of instances when teachers' and observers' rankings of
behaviours were in close agreement. He concedes some of the studies
reviewed casts doubt on the accuracy of teacher self-reports but not, he
argues, to the extent of complete abandonment as Hook & Rosenshine suggest.
Newfield describes two studies of self-report instruments that used a
large number of relatively specific items. In one of these 18 teachers used
68 specific items to describe teaching time behaviours relevant to a
Reading/English project for Junior High School pupils. In the other study
31 teachers reported their lessons by means of 59 items written to
represent specific activities of an elementary school programme of Movement
Education. In both studies each teacher was seen for at least 30 minutes by
an observer using the appropriate set of 68 or 59 items. At the end of the
observed lesson the teacher was given the same list of items and asked to
indicate which behaviours had occurred during the period. The teacher
understood that the sole purpose of the exercise was to see if his report
would agree with the observer's judgements. This was done to focus
attention on the teachers' ability to describe their lesson presentation
and to reduce the effects of social desirability of certain responses.
In the English programme, 47 of the 68 items showed significant
correlations or teacher-observer agreements in excess of 80%. In the
Movement Education study, 32 of the 59 items showed significant
correlations or observer-teacher agreement in excess of 80%. These figures
represent an almost ten-fold improvement over comparable data quoted by
Hook & Rosenshine.
Newfield pointed out that although the level of teacher-observer
agreement found in the two new empirical studies was encouraging, the
magnitude of the correlations was still quite low. He suggests further item
development might increase these values. He also stresses the unusual
instructions given to the teachers who completed the self-report form.
Although the study provides evidence that teachers have the ability to
estimate their behaviours, it does not show they would be willing to do so
77

if there was a possibility that the data might reflect unfavourably on
their teaching. Thus the general issue of social desirability still needs
to be considered when assessing the potential of teacher self-reports.
Summary of research on Teacher Self-Report instruments
The results found in the studies mentioned above are pertinent to the
development and application of the checklist and diary instruments used in
the current research. The work of Hook & Rosenshine (1979), Newfield
(1980), and Shavelson & Dempsey-Atwood (1976) can be summarised thus:
1. Teachers' self-reports of their use of specific behaviours should beused with caution,
2. The behaviours used to describe teachers' classroom style should be asmany and as subject-specific as possible
3. Behaviour statements ("items") should be pretested or otherwise examinedfor consistent use by teachers and independent observers,
4. The accuracy of teachers' descriptions is markedly improved if they arebased on scales, each scale being made up of a number of items,
These findings indicate that by paying attention to design and
application a teacher completed self-report instrument can be a useful
means of obtaining data about classroom processes.
Development of a checklist of Computer Studies activities
Previous checklist research
Checklists contain many brief items capable of being read and
answered quickly. Response speed can be further increased by using
behavioural items and requiring respondents to give only a YES/NO type of
response. Thus a checklist can contain many more items than would be
feasible in an attitude questionnaire or personality inventory. The feature
of being able to use many items is particularly valuable when a wide-
ranging subject has to be covered.
Christal (1970) has shown that it is practicable to use a checklist
to analyse the task content of jobs and thus avoid the use of extended
observation or other methods based on pre-emptive classifications. The
78
other feature of Christal's work was the use of cluster analysis to
categorise first operations and then workers. Youngman et al (1978)
developed a similar methodology for the analysis of engineering jobs and,
later, for the description of teachers' jobs (Youngman, 1982).
Youngman's development of the checklist methodology is available from
his report (Youngman, 1979b). A brief consideration of his study follows as
it was partly on the evidence of the quality of his findings that it was
decided to use a checklist instrument for the investigation of Computer
Studies teaching.
Youngman's study of Teachers' Jobs
Youngman (1979b) used a checklist of 245 items which were separate
and identifiable teaching operations. From teachers' responses Youngman
derived 14 distinct teaching activities containing from six to 13
operations in each. Four of the activities described classroom procedures.
and the remainder covered activities involving organisational and
administrative aspects of the teacher's job. The alpha reliability
coefficients of scales based on the teaching activities were in the range
0.67 to 0.92, their validity was assessed by examining the correlation
betweeen the activity-scale scores and teachers' ratings of their
involvement with the activities. These ratings were obtained from teachers'
responses to a separate matrix. Five of the 14 activities achieved a
correlation of 0.7 or above with the corresponding rating. A comparison of
teachers' activity scores with their biographic data showed the instrument
discriminated between teachers of different subjects, between teachers at
different levels of responsibility and between groups of teachers with and
without pastoral duties (Youngman, 1983).
Youngman's results show that reliable and valid measures of teachers'
jobs may be derived from a wide-ranging checklist. There appears to be no
theoretical obstacle to using the same approach to study the work of one
selected group of teachers. By adopting a naturalistic stance it should be
possible to identify intrinsic roles of teachers as opposed to confirming
imposed perceptions or expectations. The naturalistic stance of the
checklist approach was thought especially valuable in a subject
characterised by a wide range of possible activities and relatively little
79
previous research. On these grounds it was judged that a checklist offered
a practicable and valid means of studying the teaching of Computer Studies.
The study itself would provide an opportunity to evaluate the effectiveness
of this approach.
Development of the Pilot Activities Checklist
Because no previous study of Computer Studies teaching was available
to act as a guide, teachers themselves were used to supply the information
needed to construct the checklist items. Twenty teachers of Computer
Studies were individually interviewed in their own schools for 35-45
minutes. The teachers were drawn from three different LEAs. The sample
included both male and female teachers, a number of school types (single
sex, mixed, 11-16, 11-18, 13-18) and teachers with a range of training,
qualifications and experience.
At the start of each interview the teacher was assured of the
confidentiality of the interview and the information obtained. He or she
was then invited to talk about their classroom activities, their methods of
teaching, and any subject-related or other activity arising from
involvement with Computer Studies. Emphasis was placed on the need for a
description of what was done, not roles, duties or responsibilities. The
interviewer intervened only when it was necessary, for example, to elicit a
more precise description of a teaching operation. Each interview was
recorded and later analysed to give a list of teaching operations for that
teacher. Individual interviews produced from 39 to 96 teaching operations;
from the twenty interviews a total of 1184 operations was derived. Because
this number of operations is much larger than any acceptable checklist
could accoSbdate, some selection and refinement was necessary.
The first stage of the revision comprised a classification of the
operations from each interview using the eleven categories listed in
Table 6.1. The purpose of the classification was to assist the
identification of similar operations so that a reduction in the initial
number could be made. For each category duplicated and very similar
operations were eliminated.
80

Category Total operationsrecorded
1 Computer assisted learning 812 Teacher personal development 1103 Programming 1794 Subject matter 445 Resources (provision & care) 1736 Equipment (provison and care) 777 Direction of pupil activities 1908 Use of audio-visual equipment 569 Syllabus, examinations, projects 3410 Out of lesson operations 8011 Classroom organisation 8412 Unclassified 76
Total 1108
Table 6.1 Categories used for initial sorting of teaching operationsidentified in teachers' recorded interviews
In the next stage, items were retained, or combined with a closely
similar item, or several items were absorbed into a more general item.
After completion of this reduction stage the checklist contained 348 items
and was shown to an LEA Advisor for Computer Studies and three experienced
teachers who had not taken part in the interview phase. The four were asked
to review the list for overlapping or unclear items and to suggest any
further operations pertinent to Computer Studies teaching. As a result of
their comments and suggestions, twenty items were reworded or split into
two items, and four new items were added to give a checklist of 361 items.
The checklist was arranged as an AS booklet with about 28 items per
page. A photo-reduced format was chosen as a means of diminishing the
apparent size of the booklet and reducing printing costs whilst maintaining
a clear appearance. As in the booklet Activities in Computer Studies
Teaching used in the main study, it contained a one-page statement about
the research and instructions for answering the checklist.
The 361-item Pilot Activities Checklist was distributed to teachers
in 24 LEAs. One copy was sent addressed to The teacher of computer studies
in 300 schools chosen randomly from the Education Year Book (1983). In the
following six weeks 128 replies were received. A further 13 replies were
received later but were not included in the analysis.
81

Analysis of the Pilot Checklist responses
The purpose of the analysis was to generate a classification of the
checklist operations that could be used to describe the pattern of teaching
adopted by different teachers. A full account of the method of analysis is
given in Chapter 8. The description here is confined to the essentials
required to show how results from the Pilot Checklist were used to develop
the final form of the instrument.
Cluster analysis of the responses showed 20 groups containing from 7
to 37 behaviours. Each group of items represented a Teaching Activity.
Table 6.2 records a description of each Activity and the number of
operations within it. No more than a broad description can be given for
some of the larger groups.
Activity description Number of itemsInitial Retained
1 General teaching (common activities) 28 142 General teaching (uncommon activities) 24 103 Classroom organisation 12 94 Use and care of resources 16 125 Software resources and CAL 17 96 Informality, out of lesson contacts 30 117 Outside help, pupil individualisation 29 10 + 108 Information and computer abilities 18 129 Teacher as programmer 6 610 Microelectronics 21 1111 Formality and control in lessons 19 1012 General teaching 12 1013 Use of textbooks 6 614 Project work 18 915 Pupil individualisation 16 1016 Use of audio-visual aids 37 1117 Teacher seeks/gives technical help 10 918 Pupils engage in individual work 24 1119 Use of wordprocessor 7 720 General teaching 11 11
Totals 361 206
Table 6.2 Description of Activities derived from the Pilot Checklist
82

For each teacher 20 Activity scores were calculated to show his or
her use of these Activities. Cluster analysis of the 128 sets of Activity
scores, indicated four groups of teachers. A Scheffe test using the
Activity scores showed 18 of the 20 scales discriminated between the four
teacher groups. All scales were retained.
Development of final form of the checklist
Although no respondent had commented adversely on the length of the
361-item Pilot Checklist, it was felt this would be too onerous when
respondents were also required to provide other information or to complete
any other questionnaire. For this reason some reduction was desirable.
First, the face validity of groups of operations clustered together
as a teaching activity was examined. Operations not having face validity
with other operations in the group were discarded. Operations failing to
discriminate between the teacher groups were also discarded. At this stage
204 items of the original 361 remained in the checklist. Two additional
teaching behaviours suggested by respondents were added. The distribution
of the retained operations between the scales is given in Table 6.2
The 206 item version of the checklist was used in the main study
described in Chapter 8 onwards, a copy is included in the Appendix.
Merits of the CS Teaching Checklist
The likely usefulness of the checklist as a means for obtaining valid
and reliable data about Computer Studies teaching can be assessed with the
aid of the 5-point summary of research on self-report instruments given
earlier.
The checklist contains 206 subject-specific items and therefore meets
Point 2 of the research findings summary. Operations (items) included in
the checklist were obtained from practising teachers, were subjected to
scrutiny and to pilot testing before further selection. This development
process fully meets the requirements of Point 3.
83
Cluster analysis was used to group the Pilot study behaviours into
Activities each containing about 10 items. These Activities have shown
moderately high reliability and meet the requirements of Point 4.
As will be described later, in the main study the validity of
checklist Activities was assessed through correlations with an Importance-
rating matrix and through relationships between teaching style and teacher
personal variables. The stress placed on establishing the validity of the
derived measures is in keeping with cautious approach advocated in Point 1.
The rating matrix
Because cluster analysis will always find groups within data, it was
important to have some means to establish the validity of the Activities
found in the checklist analysis. For this purpose teachers were asked to
rate the importance in Computer Studies teaching of given statements of
teaching behaviour. To avoid imposing external notions of Computer Studies
teaching, the behaviours to be rated were descriptions of 17 Activities
derived from the pilot form of the checklist.
The format and purpose of the 17-item Rating matrix were discussed at
the July Forum. The panel agreed that teachers should be asked to rate the
importance of each Activity on a three point scale; Above average, Average
and Below average. A separate category of No importance was also provided.
Teachers were asked to place about equal numbers of the 17 Activities in
each of the three importance ratings. Correlations between Importance
ratings and teachers' Activity scores would be used to validate the cluster
groupings.
The Job questionnaire
The rationale of studying teachers' attitudes
Although, as reported in Chapter 3, results of research on the
relationships between teacher characteristics and pupils' attitudes have
often been inconclusive and contradictory, Haladyna et al (1983) found
significant correlations between pupils' attitudes toward science and
teachers' attitudes and interest in science teaching. On this evidence it
was thought possible that teachers' attitudes towards computers and
84

teaching about computers might be conveyed to pupils during discussions
held in lessons and at other times, Also job perceptions might influence the
choice of teaching activities and the length of time spent on preparing and
using them. Therefore a study of teachers' attitudes toward the teaching of
Computer Studies was thought desirable.
The semantic differential technique
A semantic differential format was chosen for the assessment of
teachers' attitudes to their job because this type of instrument is
relatively easy to devise and complete. As the answer format of the
instrument contrasts with that of the checklist it was hoped that it would
provide respondents with some mental relief and improve their motivation to
continue.
The semantic differential instrument (Osgood, 1952; Osgood, Suci &
Tannenbaum, 1957) consists of seven-point rating scales that are bipolar,
each end of the scale or 'pole' being defined by an adjective or adjectival
phrase (eg weak-strong, practical-theoretical). Analysis of data from
studies using semantic differential instruments has consistently shown that
three factors account for a major proportion of the score variance. The
three EPA factors are evaluation (important-unimportant, exciting-boring),
potency (hard-soft, easy-difficult) and activity (fast-slow, sharp-blunt).
In the current study teachers were asked to rate the concept "The job
of a computer studies teacher" on an inventory of 29 bipolar scales. The
scales were selected from a pool of 150 items found in the literature on
semantic differential studies (Osgood, Suci & Tannebaum, 1957), others used
in a study of engineering jobs (Youngman, Oxtoby, Monk & Heywood, 1978).
The three EPA factors were represented in the 29 scales. Because the scales
had been used in previous studies, it was thought unnecessary to carry out
pilot trials of the questionnaire, and so not "use-up" teachers who might
otherwise be willing to take part in the main study.
85
Analysis of Semantic Differential responses
Traditionally semantic differential instruments have been analysed by
factor analysis and this procedure was used in the present study and the
resulting scales were examined for reliability and validity.
Background and biographic data
One page of the teacher instrument was used to collect some
biographic data about the respondent. The review of research on teaching
and learning given in Chapter 3 showed the absence of significant
relationships between teacher personality variables and pupils' learning
outcomes. These general results determined the nature and quantity of
personal and biographical data collected in the study.
No data of a psychological or similar nature was sought. The personal
information requested was restricted to non-intrusive items such as gender,
teaching experience and qualifications. These were:
Sex of teacherLength of teaching experienceLength of teaching experience, in Computer StudiesLength of industrial experience in computingAcademic qualification in computingTeacher training in Computer StudiesOther teaching subject(s)School type and age-range.
This information was collected on a single page placed in the booklet
after the checklist. The respondent's name and school were not requested.
The Invitation to teachers
The final page of the Teacher Booklet was used to invite teachers to
take a further part in the research. Teachers were asked
(1) to allow one or more of their fifth year Computer Studies classes toanswer the pupil questionnaire, and/or
(2) to complete a lesson diary for a short sequence of CS lessons.
Teachers wishing to take a further part ticked the appropriate
box(es) and filled in their name and school address.
86
Diary instruments
Previous diary research
The diary is another form of self-report instrument. Diaries have
been used in the study of tasks performed by managers (Stewart, 1967,1975)
and in a study of engineers' jobs (Youngman et al, 1978). The concept of
the diary is familiar enough for the problems of interpreting or
summarising free-format accounts to be evident. In Stewart's study the
managers described their work on pre-coded pads. It is perhaps significant
that in a study of teachers' activities throughout the working day, Hilsum
and Cane (1971) and Hilsum and Strong (1978) preferred the difficulties and
expense of using observers to a diary-based study.
Tamir (1983) advocates the use of a part-structured questionnaire -
the Self Lesson Report Form (SLRF) - as a means of obtaining valid
descriptions of science lessons. The structured portion of the SLRF seeks
information about the lesson-time use of audio-visual aids and other
resources and the management of the lesson. The unstructured part of the
SLRF was described by Tamir as the "heart" of the instrument. It requires
the teacher to describe, in chronological order, what happened in the
class. The SLRF is in effect a one-lesson diary report form. The part-
structured nature of the instrument appears to try to combine an objective
study of some non-controversial facets of science teaching with a
naturalistic report of actual events as perceived by the teacher.
Teachers used the SLRF to report on 250 science lessons in junior and
senior high schools in Israel. To establish instrument reliability, 40 of
these lessons were observed by an independent observer who also used the
SLRF. The level of agreement between teachers' reports and those of the
observer on the frequency of classroom events varied according to the
nature of the activity, the average was about 80%. The 250 reports were
analysed to indicate the pattern of science education in Israel within the
limits of the sample schools.
87

Tamir opines that the reliability and validity of the SLRF are high
because teachers are asked to report on one specific lesson and are
therefore less prone to make generalisations. He concludes that lesson
reports obtained by use of the SLRF are sufficiently reliable to serve as
indicators of curriculum practices.
The lesson diary report form (LDRF)
A structured diary-like instrument, the Lesson Diary Report Form
(LDRF), was designed to facilitate teachers' reporting of Computer Studies
lessons. The instrument was designed to enable teachers to record quickly
the teaching and learning tactics adopted in the lesson, the resources used
by teachers and pupils and how the pattern of activities varied during the
session. In contrast to Tamir's instrument a structured format was used for
the whole of the LDRF in the hope that a structured instrument would gather
more reliable information about classroom events. The increased reliability
would come in several ways because:
(a) more operations could be covered in a given response time;(b) compared to a free account a list is less open to the effects of social
bias; and(c) all teachers would report on the same activities.
The items included in the LDRF embodied the author's experience as a
teacher trainer in Computer Studies. Use was also made of the information
gained from practising teachers during the production and Pilot trial of
the checklist. To establish instrument validity, an early version of the
LDRF was examined by three experienced teachers studying for a post-
graduate award in the teaching of Computer Studies. Their comments and
suggestions were incorporated in a subsequent revision.
88
Each LDRF is contained on one double-sided A4 sheet without the use
of photo-reduction, a copy is given in Appendix B. The LDRF has sections
asking for information about:
Lesson type (9 are listed plus "other").Resources used by the teacher (10 listed).Resources used by the pupils (7 listed).Type of homework set ("None" plus 8 types).Teacher satisfaction with the lesson (a five point scale).Teaching and learning activities (14 listed) used in the first, secondand final third of the lessons.
It also has a space for teachers to give a brief description of thelesson or comments about special features if they wish to do so.
Because all the LDRF items are closed and require only a simple tick
or circled indication, the form takes only a few minutes to use. Teachers
were asked to complete it as soon as possible after the end of the lesson.
A Diary Booklet consisted of seven LDRFs fastened together with a
cover sheet for some basic information about the teacher, the number,
gender and ability range of the pupils, the classroom facilities, and
the date and duration of the lesson.
Although the Diary Booklet of the present study and the SLRF of Tamir
are both teacher self-report instruments, they differ in their structure
and application. In the LDRF study no analysis or quantitative use was made
of the teacher's comments or unstructured account of the lesson and,
because each Diary Booklet contained seven LDRFs for teachers to report a
sequence of lessons, it was more likely that the resulting record would be
representative of their classroom activities. Because it contains many
subject specific items approved by teachers the Diary Booklet appears to
meet the requirements of self-report instruments established earlier.
89

SwomarY
This chapter has described the purpose and development of the four
test instruments included in the Teacher Booklet. A fifth instrument, the
Lesson Diary Report Form, which was sent only to teachers indicating their
willingness to take a further part in the study, has also been described.
The analysis of teachers' responses to the Booklet scales is
described in Chapter 8. The information obtained in the Diary Study is
analysed and discussed in Chapter 11.
90

CHAPTER 7
THE MEASUREMENT OF PUPIL CHARACTERISTICS AND LEARNING: INSTRUMENT SELECTIONAND DESIGN
The research objectives set out in Chapter 5 required pupils to be
assessed for:
1. learning outcomes in Computer Studies,2. their perceptions of the classroom environment.
Overview of the Pupil Booklets
Because it would be unreasonable to ask a pupil to provide all the
information required in a single sitting, and Lsit had been decided to ask
schools to release pupils on one occasion only, the pupil booklet was
arranged in two parts. One half of each class would complete Part A whilst
the other half answered Part B. The two parts were colour coded for ease of
reference and to help teachers achieve a spread of booklets around the
class. Each part of the booklet was of 16 A5-size pages.
Part A (Blue) contained
The CARAQ instrument: 72 Likert-type items assessing eight dimensions ofattitudes toward computers.
An Anxiety scale: pupils were instructed to select words from&list of 60 todescribe their feelings about "A Job using a Computer".
The Job questionnaire: a semantic differential instrument of 29 bipolarscales used to judge "A Job or Career using a Computer"
A Personal Data Survey: pupils were asked about their gender, choice ofschool subjects, use of a home-computer, experience of computer assistedlearning, and interest in Computer Studies.
Part B (Pink) contained
A classroom environment questionnaire: 95 items to assess ten dimensions ofthe classroom environment
The Anxiety scale: as in Part AThe Job questionnaire: as in Part AThe Personal data survey: as in Part A.
This chapter explains the choice of instruments used in the pupil
booklet and, where necessary, gives a description of each.
9 1
Choice of attitude instrument
For the proposed study, there were three paths to obtaining the
required attitude measure:
1. To develop a new Likert format instrument.2. To develop a new SD format instrument3. To use an existing computer attitude instrument
Production of a Likert Scale
The production of a wholly new Likert scale is a lengthy, multi-stage
process. When a new attitude dimension is to be assessed it is generally
necessary to start with the identification, writing and selection of a
pool of suitable items. This is followed by trials, evaluation and possibly
further trials. The development, testing and validation of the CARAQ
followed these procedures (Moore, 1984).
The Semantic Differential technique.
The format and basic properties of the semantic differential
technique have been mentioned previously in Chapter 6.
The development of a semantic differential questionnaire is made
easier by the considerable amount of research data that has been
accumulated on the use of a large pool of adjectival pairs. Scales for a
semantic differential instrument may be selected from those used in
published studies.
Comparisons of the Likert and semantic differential techniques have
been made. Some studies, McCallon and Brown (1971), Schofield and Start
(1978), who used both techniques to assess college students' attitudes to
mathematics, found correlations of 0.70 or higher between corresponding
concepts on the two instruments. Schibeci (1977, 1982) working with science
students age 14-16 years in Western Australia found correlations in the
range 0.06 to 0.52 for five pairs of concepts in semantic differential and
Likert-type instruments. His results indicate that the semantic
differential and Likert techniques may not always be interchangeable. The
scales used in SD questionnaires are usually non subject specific. This
92

makes it possible to use the same scales to rate several or many concepts,
hence attitudes on these concepts may be compared.
The lack of specificity is both a strength and a weakness of the SD
format. The use of simple, non-specific items, simplifies administration of
the instrument with younger or less-able students. It may be for this
reason that Williams et al (1983) and Harvey & Wilson (1985) used the
Semantic Differential format to investigate the attitudes toward computers
held by 10-year olds. However, the lack of specificity probably results in
some loss of clarity of the concept or attitude dimension being assessed.
Thus the SD may not be as sensitive to small differences of attitudes as
Likert instruments.
It was decided not to develop a semantic differential questionnaire
to assess pupils' attitudes for three reasons.
1. It was not planned to compare pupils' attitudes on many diverseconcepts. Therefore the flexibility of the scales was of no significance.
2. The study was with older and more able groups who should have noproblems of reading or comprehension. Hence the simplicity of the scaleswas not of great value.
3. A semantic differential instrument might lack the precision needed todistinguish between the attitudes of pupils having slightly differentclassroom or other experiences. The need for the highest possiblediscrimination seemed to outweigh any possible greater ease of constructionattached to this format.
Choice of attitude scales (from existing instruments)
Reasons of economy of time and effort argued for the use of one or
more existing attitude instruments and against the development of fresh
scales. Guidelines for the measurement of attitudes in science education
given by Gardner (1975a) and Munby (1980) were written for the development
of new attitude instruments but apply equally to the selection of a scale
or scales from among available instruments.
93
The guidelines may be summarised as follows:
1. There should be a clear specification of the single theoreticalconstruct underlying each scale. All items within one scale should relateto a single attitude object. Attitudes toward logically or psychologicallydistinct concepts should be measured and reported as separate scales.
2. Instruments should be trialled on a sample which is comparable to thetarget population for which the instrument is intended. Results of thetrial use should be used to show the properties of the separate scales ofthe instrument and items within the scales.
3. Results of the trial should be examined to determine whether thesensitivity and discrimination of the scale(s) are likely to be adequatefor the proposed application.
The guidelines can be applied to aid the choice of scales from those
• described in Chapter 2. The requirement that each scale should be based on
a single clearly identified theoretical construct argues against
instruments in which scales have been derived by factor analysis. The GATC
scale of Reece & Gable (1982) falls into this category as it was derived by
factor analysis from a pool of thirty items representing affective,
behavioural and cognitive domains. The ten items retained in the GATC are
drawn from all three domains and refer to a number of different constructs,
thus the scale possesses empirical rather than theoretical validity.
The studies of Bannon et al, Griswold and Wagman were all carried out
with samples of undergraduate and postgraduate students in the United
States. For this reason their results may not be applicable to use of the
same questionnaire with school-age pupils in England and Wales. In
contrast, the CARAQ instrument was trialled on samples of secondary level
comprehensive school pupils age 14-15 years which is a close match to the
target population of the current study.
Gardner (1975a,) suggests that scale reliabilties (alpha values)
should be around 0.8 for use with groups. The three computer attitude
scales used by Richards et al (1986) had reliabilities from 0.72 to 0.88.
These scales were, however, determined by factor analysis rather than on
theoretical grounds. The reliabilities of the CARAQ scales generally lie
within the range recommended for studies based on groups. The alpha values
ranged from 0.69 to 0.87 at pretest and 0.75 to 0.90 at the posttest. The
alpha values might have been higher if factor analysis had been used in
94

their derivation. When constructing the CARAQ scales, items were
deliberately chosen in such a way as to ensure that scales were broadly
based (Moore, 1984, Chapter 6). In determining the item content of the
scales, scale validity through breadth was rated as more important than
achieving the highest possible value of internal reliability through item
selection.
Finally, as Gardner suggests, results of previous studies should be
examined to see which instrument scale(s) discriminate between different
sub-groups of the study samples. Table 2.3 shows several computer attitude
scales discriminated successfully between groups of different ages, between
pupils with and those without a home computer and, sometimes, between males
and females. In addition the CARAQ instrument also detected the effects of
computer assisted learning and the different attitudes held by pupils in
"science" and "non-science" subject groups.
The CARAQ scales meet Gardner's three guidelines of theoretically
based constructs, previous research with a sample of a similar age and
background to the final target population, and demonstrated discrimination
between sub-groups. The CARAQ instrument has the additional advantage of
using seven scales, THREAT, SCHOOL, CAREER, LEISURE, SOCIAL, EMPLOY and
FUTURE, a greater number than any other computer attitude instrument listed
in the table. An instrument with a large number of scales has the potential
to provide a more complete description of pupils' attitudes.
On the grounds of construct validity, trials experience,
discriminating power and number of scales the CARAQ instrument was equal or
superior to other instruments and appeared suitable for the proposed study.
The SATISFACTION scale
At the July Forum it was suggested that pupils' pleasure and
satisfaction in using a computer, seeing a program work sucessfully or
controlling a robot-like device would be an important outcome of some
Computer Studies lessons.
95

Acting on this suggestion, en Likert-type items expressing
SATISFACTION were prepared and added to the CARAQ instrument. A statement
of the SATISFACTION scale and a typical item is shown in Table 7.1. All the
items from this scale can be found in the full form of the pupil
questionnaire shown in the Appendix.
Name
Description Sample Item
SATISFACTION Pupils' satisfaction in Programming a computerusing or programming a to do new tasks can be acomputer or microcomputer satisfying challenge
Table 7.1 Description of SATISFACTION scale (New CARAQ scale)
Computer anxiety: concept and measurement
The term anxiety is interpreted as "dread and foreboding based on
some diffuse or specific expectation of harm, rather than an obvious
external threat" (Sieber et al, 1977 p.13). An additional attitude
dimension anxiety was identified from a study of the literature on
attitudes to computers, mathematics and science. Pupil confidence and
efficacy in using computers implies absence of anxiety. Thus whether
explicitly stated or not, the reduction of anxiety is an important
affective goal in courses of Computer Studies. The meaning of Computer
Anxiety and its measurement are the subjects of this section.
Two references to the measurement of Anxiety were given in Chapter 2.
Dambrot et al (1985) found that maths anxiety was a predictor of computer
attitude scores for both male and female undergraduates. Lloyd & Gressard
(1984b) included 10 anxiety items in a questionnaire used by students age
13 to 20+. They found Computer Anxiety was negatively associated with
experience, no gender difference was detected. The results are not directly
applicable to the present study because the students were learning from
computers and not learning about computers.
Studies have shown that teachers' classroom behaviours and teaching
activities can affect levels of student anxiety. Student anxiety is reduced
by positive reinforcement and an increased level of direction during
96
learning (Zimmerman, 1970); by greater communication and teacher support
(Cameron, 1975); and the use of individualised instruction (Lewis & Adank,
1975). A study of anxiety in science classrooms was made by Fraser et al
(1983). The level of anxiety in 116 classes of Australian pupils age 14-15
years was studied in relationship to pupils' perceptions of the classroom
environment. Anxiety levels were found to be lower in classrooms perceived
as having greater PERSONALISATION, PARTICIPATION, INVOLVEMENT, AFFILIATION,
TEACHER SUPPORT, ORDER & ORGANISATION, RULE CLARITY and INNOVATION. Anxiety
was also reduced by ensuring a lower level of Teacher control. Fraser et al
draw attention to the unexpected result that higher levels of classroom
investigation were linked with increased student anxiety.
This current study of Computer Anxiety had three aims:
1. To investigate the reliability and usefulness of a measure of studentanxiety when used with students of computer studies.
2. To investigate relationships between pupils' anxiety about computers andteachers' activities in computer studies lessons.
3. To investigate relationships between pupils' anxiety about computers andperceptions of the computer studies classroom environment.
Some similarities between pupils' attitudes toward science and their
attitudes toward computers have been noted. For this reason it was decided
that the investigation of pupils' anxiety about computers would be modelled
on the study of science anxiety carried out by Fraser et al (1983) using a
questionnaire due to Zuckermann (1960) and modified by Docking (1978). The
instrument (Table 7.2) consists of a checklist of 21 key words embedded in
an alphabetically arranged list of 60 adjectives. The respondent's anxiety
score is obtained by summing the scores for the 21 words marked + and -.
This scale is answered easily and quickly and is said to be subtle
and robust. Docking & Thornton (1979) suggest the subtlety of the measure
makes it less likely that respondents will hide anxiety. The same
researchers suggest the scale is robust with regard to test situation and
the order of presentation within a battery of instruments. When used by
Fraser et al, (1983) the internal consistency was 0.83, the mean anxiety
score was 8.7 (range 0-21) and the standard deviation 3.6.
97

Instructions: The words below could describe how you feel about a job orcareer using a computer. Read through the list of words and underline thosewhich describe how you generally feel about a job of this kind. You mayunderline as many or as few words as you wish.
absorbed afraid(+) aimless ambitious annoyedaware bored calm(-) careless cautiouschallenged cheerful(-) cheated comfortable confusedcontented(-) creative curious dedicated desperate(+)disappointed efficient entertained excited fearful (+)fortunate frightened(+) happy(-) hopeless impatientincapable inspired interested joyful(-) lazyloving(-) miserable misplaced nervous(+) organisedoverloaded panicky(+) pleasant(-) pleased productivepushed refreshed regretful rewarded satisfiedsecure(-) serious shaky(+) steady(-) tense(+)terrified(+) thoughtful(-) upset (+) weary worried(+)
Table 7.2 Instrument for measuring anxiety. From Zuckerman (1960) and
Docking (1978) via Fraser et al (1983). The positive and negative signs
are not shown in the respondent's copy.
Measurement of perceptions of a computer-job
Table 2.2 shows the CARAQ scale of CAREER assesses students' attitude
toward a job or career in computing. In the validation study (Moore, 1985b)
students taking Computer Studies expressed a significantly greater interest
in a computer-based career than other student groups. In the new study,
however, the whole sample would be of students taking Computer Studies and
who might therefore have very favourable attitudes toward a computer
career. There was a possibility that a scale of only seven items would not
easily discriminate within a group of students all of whom had at least
moderately favourable attitudes.
Because of this doubt and because encouraging pupils to consider a
computer-based career is an important aim of computer education, it seemed
worthwhile to develop a new test of pupils' attitudes to the "job" concept.
Based on the discussion of the previous section, a semantic differential
instrument was chosen. This type of instrument could be developed quite
quickly by selecting scales that had been used in previous studies, could
be answered in a short time and has many scales thus increasing the
possibility that a link with classroom activities will be shown. Semantic
98
differential responses may be subjected to factor analysis to reveal sets
of scales that pupils have answered similarly. These sets of scales (or
factors) may themselves reveal further information about pupils'
conceptions of "A Computer-Job". This analysis would form a useful contrast
with the a priori approach used to establish the CARAQ scale CAREER.
Preliminary selection of scales for the pupil instrument showed that
many of them were the same as those included in the teacher SD instrument
for the concept "The Job of a Computer Studies Teacher". It was realised
that use of the same set of scales would make it possible (though not
necessarily useful) to compare pupils' and teachers' responses to the two
similar concepts. For this reason the decision was taken to use exactly the
same set of 29 scales in the two instruments. The semantic differential
questionnaire on the concept "A Job or Career using a Computer" was the
only instrument in the pupil booklet using this format.
Classroom environment measures
The meaning and measurement of pupils'perceptions of the classroom
environment and the choice of five scales from the ICEQ and four from the
CES instruments have been described and explained in Chapter 4. It washoped that the nine chosen scales would assess almost all important
dimensions of the Computer Studies classroom environment. The nine scales
have teaching and learning activities by teachers and pupils as their main
focus.
A decision was made to include a scale assessing pupils' perceptions
of the level of resource provision because the teaching of Computer Studies
may be linked to the equipment available. Several speakers at the July
Forum endorsed the inclusion of a RESOURCES scale in the pupil
questionnaire.
A scale Materials usage is contained in The Inventory of Affective
Aspects of Schooling (Haladyna & Shaughnessy, 1982). A typical item "There
99
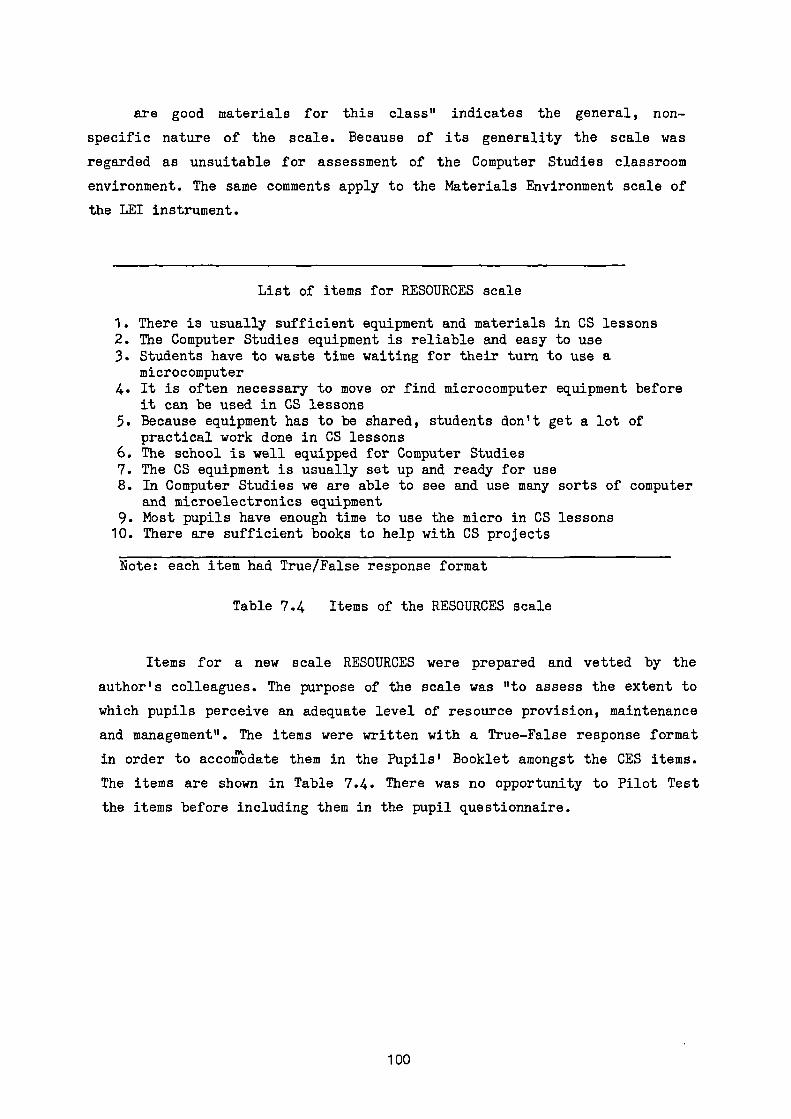
are good materials for this class" indicates the general, non-
specific nature of the scale. Because of its generality the scale was
regarded as unsuitable for assessment of the Computer Studies classroom
environment. The same comments apply to the Materials Environment scale of
the LEI instrument.
List of items for RESOURCES scale
1. There is usually sufficient equipment and materials in CS lessons2. The Computer Studies equipment is reliable and easy to use3. Students have to waste time waiting for their turn to use a
microcomputer4. It is often necessary to move or find microcomputer equipment before
it can be used in CS lessons5. Because equipment has to be shared, students don't get a lot of
practical work done in CS lessons6. The school is well equipped for Computer Studies7. The CS equipment is usually set up and ready for use8. In Computer Studies we are able to see and use many sorts of computer
and microelectronics equipment9. Most pupils have enough time to use the micro in CS lessons10. There are sufficient books to help with CS projects
Note: each item had True/False response format
Table 7.4 Items of the RESOURCES scale
Items for a new scale RESOURCES were prepared and vetted by the
author's colleagues. The purpose of the scale was "to assess the extent to
which pupils perceive an adequate level of resource provision, maintenance
and management". The items were written with a True-False response format
in order to accoMOdate them in the Pupils' Booklet amongst the CES items.
The items are shown in Table 7.4. There was no opportunity to Pilot Test
the items before including them in the pupil questionnaire.
100

Personal data questionnaire
Some pupil personal data was required to assess the validity and
discriminating properties of the teacher and pupil scales. For these
reasons pupils were asked to supply information about their gender, choice
of school-subjects, home-use of a microcomputer and experience of computer
assisted learning. Home-use of a micro was split into four categories;
games, educational materials, school-work and revision, programming. CAL-
experience was requested according to five subject groups; maths, science
and technical subjects, languages, arts subjects, and craft subjects.
Pupils were also asked to indicate their level of interest in Computer
Studies as they remembered it at the start of the course and how it had
changed.
SumnarY
This chapter has described the purpose, choice and development of the
scales included in the two-part pupil questionnaire. For the assessment of
pupils' attitudes toward computers it was decided to use the CARAQ
instrument,the seven scales of which have been shown to have satisfactory
concept validity, acceptable internal consistency reliability and to
discriminate between groups of pupils according to independent variables.
Although existing scales of the CARAQ were to be used without modification,
an additional scale SATISFACTION was added.
An additional scale RESOURCES was added to a battery of nine clasroom
environment scales chosen from the ICEQ and CES instruments. These scales
were chosen because of their proven relationships with affective outcomes
in science education or for their face validity with the author's
impressions of Computer Studies teaching in schools.
The pupil tests also included a scale to measure Computer Anxiety and
another to assess pupils' concepts of "A Job or Career using a Computer".
The personal data section of the pupil questionnaire was restricted to five
items, gender, choice of school subjects, home-use of a microcomputer,
experience of CAL, and level of interest in Computer Studies.
101
CHAPTER 8
DISTRIBUTION OF THE TEACHERS' BOOKLET AND ANALYSIS OF THE RESPONSES
Distribution of the Teachers' Booklet
Copies of the Teachers' Booklet were distributed in September 1985 by
post as follows
To named teachers who had taken part in the Pilot Study 105To named teachers of Computer Studies in schools of Humberside LEA 95To The Teacher in charge of CS in non-metropolitan LEA schools (*) 350To The Teacher in charge of CS in metropolitan LEA schools (*) 290
Total 840
Notes: (*) Within each LEA schools were randomly chosen from the EducationYearbookNo booklet was sent to any ILEA establishmentSchools who had been contacted in the Pilot study but who had nottaken part (or had done so anonymously) were not included.
Each booklet was accompanied by a letter setting out the purpose of
the study and a reply-paid envelope for the return of the booklet. All
booklets were posted in the period 13-23 September 1985. Reminder requests
were sent as necessary to Humberside teachers whose replies had not been
received on December 1st. To the end of March 1986, 253 completed b000klet
were received, a raw response rate close to 30%.
Data from Wellington (1987) can be applied to the raw response rate
in order to allow for schools who received a booklet but did not teach
Computer Studies. Even in the rather unusual sample used by Wellington,
only 71% of schools taught Computer Studies for 0-level or CSE
examinations. If Wellington's data is applied to the random sample
contacted in the present study, the estimated response rate from eligible
schools is 42%. It will be higher if the Wellington figure is an over
estimate of the percentage of all schools teaching Computer Studies.
About 20% of the responses were made anonymously possibly because
some individuals wished to avoid taking any further part in the study, or
to be certain that no statement or answer could be attributed to a named
102
source. Alternatively, and this is thought to be the most likely
explanation, teachers might have returned an unnamed booklet for reasons
connected with the industrial action in schools (see below).
The effects of the industrial action in schools
The period of the empirical work in schools, from September 1985 to
March 1986, coincided with the longest and most bitter period of industrial
action known in the teaching profession. The action in schools had marked
effects on the study. In October and November very many teachers
telephoned, wrote or returned the unused Booklet saying they could not
consider completing it during the period of the industrial dispute. The
most intense phase of the action finished in the second half of the Spring
term and a few further Booklets were returned at this time. Unfortunately
it was then too late to distribute further questionnaires. Teachers said
they were very busy trying to catch up with work missed during the earlier
part of the year.
The return of 253 Teacher Booklets has to be judged against the
background of a difficult period in schools. Although the
representativeness of the teacher sample may have suffered as a consequence
of the low return rate, both teacher and pupil samples were sufficiently
large to permit detailed analyses to be made. It was hoped that the teacher
sample would include representatives of all styles of teaching.
The original research design included provision for interviews with a
sample of the teachers who completed the questionnaire. It proved
impossible to undertake these interviews for reasons stemming directly from
the industrial action in schools. For the period immediately after sending
out the booklets, the teachers were unavailable during school hours. When
conditions were more normal in March onwards, it was too late, the teachers
by then had only a hazy recollection both of the booklet and their
reactions to the items. For the same reason it was too late to interview
sufficient teachers to undertake a test-retest reliability study.
103
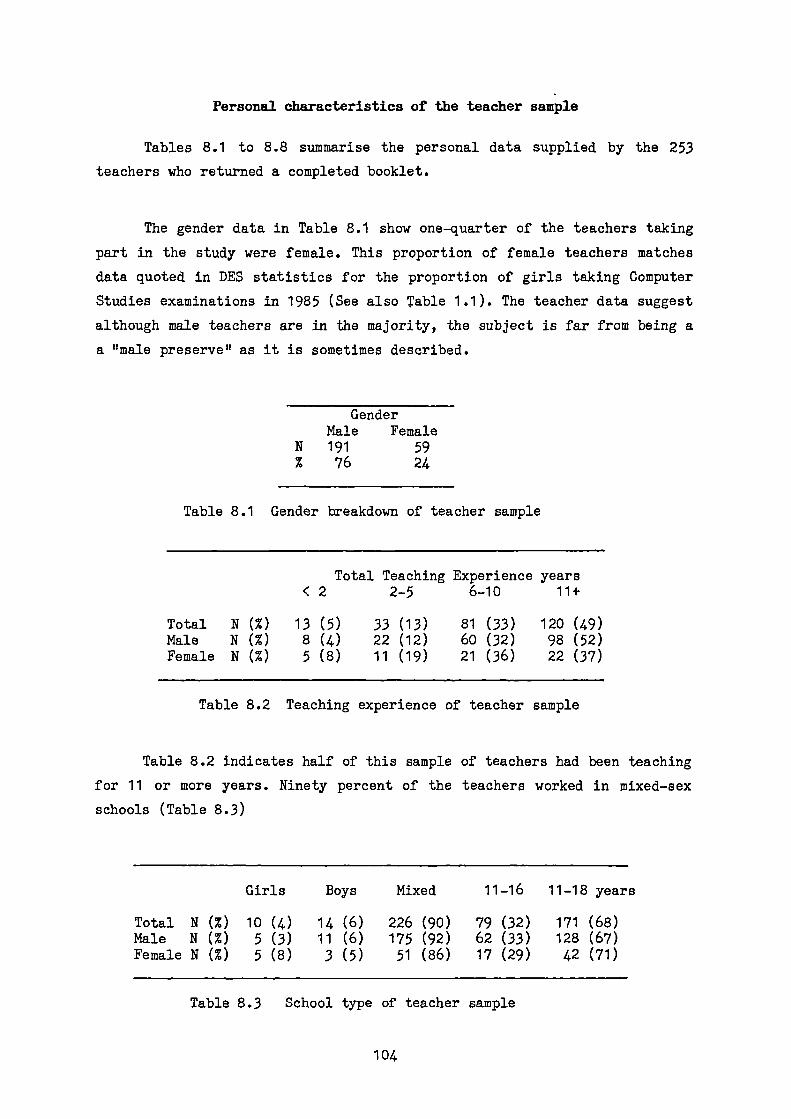
Personal characteristics of the teacher sample
Tables 8.1 to 8.8 summarise the personal data supplied by the 253
teachers who returned a completed booklet.
The gender data in Table 8.1 show one-quarter of the teachers taking
part in the study were female. This proportion of female teachers matches
data quoted in DES statistics for the proportion of girls taking Computer
Studies examinations in 1985 (See also Table 1.1). The teacher data suggest
although male teachers are in the majority, the subject is far from being a
a "male preserve" as it is sometimes described.
GenderMale Female
N 191 59% 76 24
Table 8.1 Gender breakdown of teacher sample
Total Teaching Experience years< 2 2-5 6-10 11+
Total N (%) 13 (5) 33 (13) 81 (33) 120 (49)Male N (%) 8 (4) 22 (12) 60 (32) 98 (52)Female N (%) 5 (8) 11 (19) 21 (36) 22 (37)
Table 8.2 Teaching experience of teacher sample
Table 8.2 indicates half of this sample of teachers had been teaching
for 11 or more years. Ninety percent of the teachers worked in mixed-sex
schools (Table 8.3)
Girls Boys Mixed 11-16 11-18 years
Total N (%) 10 (4) 14 (6) 226 (90) 79 (32) 171 (68)Male N (%) 5 (3) 11 (6) 175 (92) 62 (33) 128 (67)Female N (%) 5 (8) 3 (5) 51 (86) 17 (29) 42 (71)
Table 8.3 School type of teacher sample
104

Data in Table 8.4 show about half the sample had from 2 to 5 years
experience of teaching Computer Studies; the median experience was about 5
years. This contrasts with the data for total teaching experience where the
median is about 9 years. These data suggest many teachers began teaching
Computer Studies after some years of teaching another subject.
CS Teaching Experience years< 2 2-5 6-10 11+
Total N (%) 30 (12) 129 (51) 66 (26) 24 (10)Male N (%) 23 (12) 99 (52) 47 (25) 11 (21)Female N (%) 7 (12) 30 (51) 19 (32) 3 (5)
Table 8.4 Computer Studies Teaching experience of teacher sample
Data on the other subject taught by these Computer Studies teachers
are given in Table 8.5. Four-fifths of the sample gave mathematics as their
other teaching subject.
Teaching subject (in addition to Computer Studies)Maths Sciences Technical Arts Languages Other.
Total N (%) 190(81) 21(9) 8(3) 10(4) 2(1) 3(1)Male N (%) 141(79) 20(11) 7(4) 6(3) 2(1) 2(1)Female N (%) 49(87) 1(2) 1(2) 4(7) 0(0) 1(2)
Table 8.5 Additional subject taught by teacher sample
The academic and teacher training qualifications of the teachers are
summarised in Tables 8.6 and 8.7. Only a small percentage of the sample had
a degree or equivalent in Computer Science. This contrasts with theAkre
situation in secondary school science a majority of teachers have a degree
in their teaching subject. The proportion of teachers who had undertaken an
award-bearing course of teacher training was also quite small, it was
around one-fifth taking fulltime and parttime together.
105
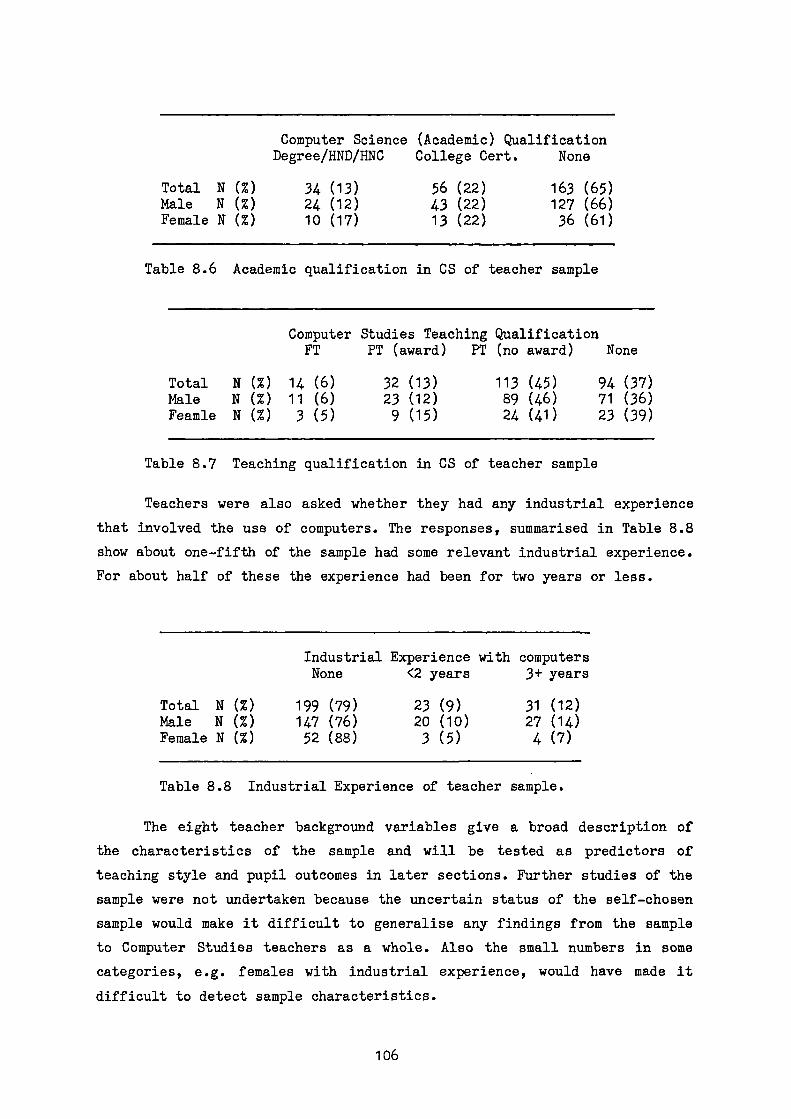
Computer Studies Teaching QualificationFT PT (award) PT (no award) None
Total N (%) 14 (6) 32 (13) 113 (45) 94 (37)Male N (%) 11 (6) 23 (12) 89 (46) 71 (36)Feamle N (%) 3 (5) 9 (15) 24 (41) 23 (39)
Computer Science (Academic) QualificationDegree/HND/HNC College Cert. None
Total N (%) 34 (13) 56 (22) 163 (65)Male N (%) 24 (12) 43 (22) 127 (66)Female N (%) 10 (17) 13 (22) 36 (61)
Table 8.6 Academic qualification in CS of teacher sample
Table 8.7 Teaching qualification in CS of teacher sample
Teachers were also asked whether they had any industrial experience
that involved the use of computers. The responses, summarised in Table 8.8
show about one-fifth of the sample had some relevant industrial experience.
For about half of these the experience had been for two years or less.
Industrial Experience with computersNone <2 years 3+ years
Total N (%)
199 (79)
23 (9)
31 (12)Male N (%)
147 (76)
20 (10)
27 (14)Female N (%)
52 (88)
3 (5)
4 (7)
Table 8.8 Industrial Experience of teacher sample.
The eight teacher background variables give a broad description of
the characteristics of the sample and will be tested as predictors of
teaching style and pupil outcomes in later sections. Further studies of the
sample were not undertaken because the uncertain status of the self-chosen
sample would make it difficult to generalise any findings from the sample
to Computer Studies teachers as a whole. Also the small numbers in some
categories, e.g. females with industrial experience, would have made it
difficult to detect sample characteristics.
106

Identification of Teaching Activities from the Checklist responses
Teachers' responses to the 206 checklist items were either 1,
indicating the respondent made use of the behaviour, or zero indicating
non-use. Cluster analysis was used to search this binary data for groups of
behaviours having similar use-patterns. The clustering technique used was
that of hierarchical, centroid fusion in which the 206 individual
behaviours were successively combined into 205, 204, 203, .... 3, 2, 1
group(s) by joining together the individual items or groups with most
nearly similar response patterns. A simple distance coefficient was used as
the measure of similarity between use profiles. Following procedures
outlined by Everett (1974), an optimal configuration of 19 groups was
derived by inspection from the fusion graph or data representing the
clustering process. Each of the 19 distinct groups of teaching behaviours
represents a Teaching Activity. The number of behaviours in each Activity
ranged from six to eighteen.
Examination of the checklist behaviours grouped together by the
cluster analysis showed a high degree of similarity, in almost all cases it
was possible to identify just one or two themes that embraced all or nearly
all the behaviours within an Activity cluster. Fifeteen items of the
original 206 lacked face validity with the other behaviours in their
cluster and were dropped from the cluster and all further analysis. No
relocation of items between clusters (Activity groups) was made.
The descriptions of the Teaching Activities were confirmed by a panel
of four experienced teachers who were in complete agreement that the
descriptions given by the researcher were both adequate and accurate.
Table 8.9 lists the descriptions of the 19 Teaching Activities and gives a
typical checklist behaviour for each. A complete list of the behaviours
within each Teaching Activity is given in the Appendix.
107
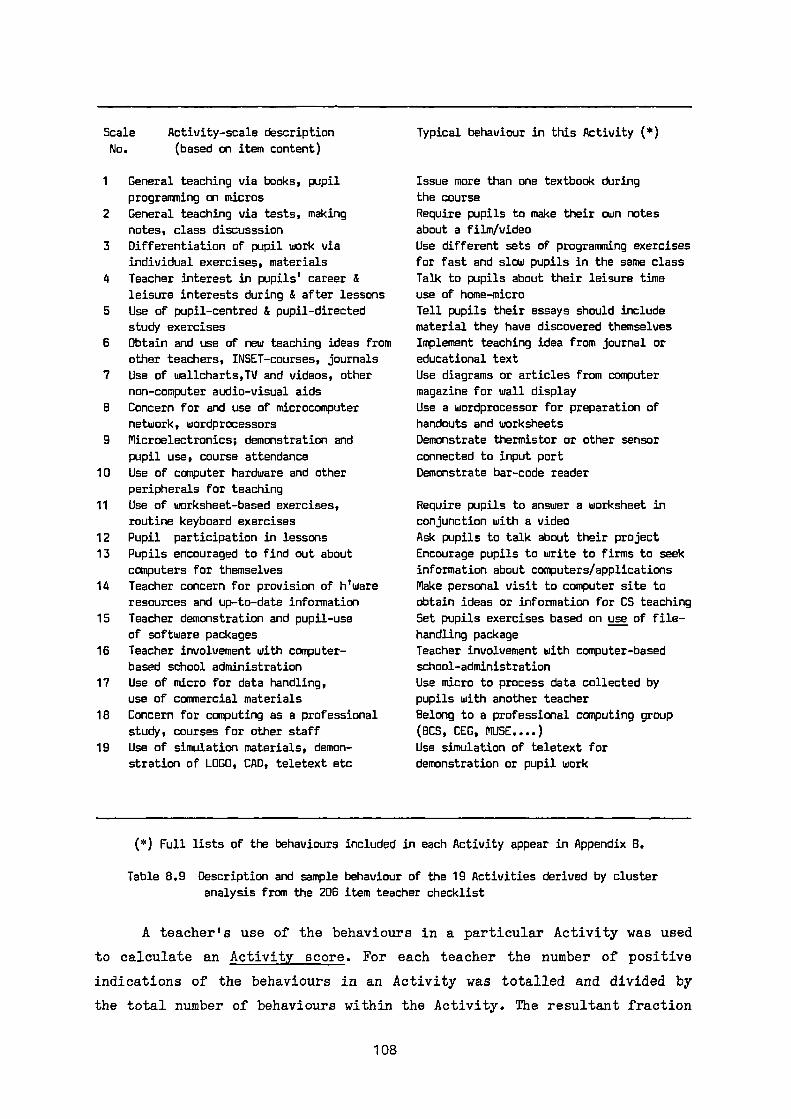
Scale Activity-scale description
No. (based on item content)
1 General teaching via books, pupil
programming on micros
2 General teaching via tests, making
notes, class discusssion
3 Differentiation of pupil work via
individual exercises, materials
4 Teacher interest in pupils' career &
leisure interests during & after lessons
5 Use of pupil-centred & pupil-directed
study exercises
6 Obtain and use of new teaching ideas from
other teachers, INSET-courses, journals
7 Use of wallcharts,TV and videos, other
non-computer audio-visual aids
8 Concern for and use of microcomputer
network, wordprocessors
9 Microelectronics; demonstration and
pupil use, course attendance
10 Use of computer hardware and other
peripherals for teaching
11 Use of worksheet-based exercises,
routine keyboard exercises
12 Pupil participation in lessons
13 Pupils encouraged to find out about
computers for themselves
14 Teacher concern for provision of hlware
resources and up-to-date information
15 Teacher demonstration and pupil-use
of software packages
16 Teacher involvement with computer-
based school administration
17 Use of micro for data handling,
use of commercial materials
18 Concern for computing as a professional
study, courses for other staff
19 Use of simulation materials, demon-
stration of LOGO, CAD, teletext etc
Typical behaviour in this Activity (*)
Issue more than one textbook during
the course
Require pupils to make their own notes
about a film/video
Use different sets of programming exercises
for fast and slow pupils in the same class
Talk to pupils about their leisure time
use of home-micro
Tell pupils their essays should include
material they have discovered themselves
Implement teaching idea from journal or
educational text
Use diagrams or articles from computer
magazine for wall display
Use a wordprocessor for preparation of
handouts and worksheets
Demonstrate thermistor or other sensor
connected to input port
Demonstrate bar-code reader
Require pupils to answer a worksheet in
conjunction with a video
Ask pupils to talk about their project
Encourage pupils to write to firms to seek
information about computers/applications
Make personal visit to computer site to
obtain ideas or information for CS teaching
Set pupils exercises based on use of file-
handling package
Teacher involvement with computer-based
school-administration
Use micro to process data collected by
pupils with another teacher
Belong to a professional computing group
(BCS, CEG, MUSE....)
Use simulation of teletext for
demonstration or pupil work
(*) Full lists of the behaviours included in each Activity appear in Appendix B.
Table 8.9 Description and sample behaviour of the 19 Activities derived by cluster
analysis from the 206 item teacher checklist
A teacher's use of the behaviours in a particular Activity was used
to calculate an Activity score. For each teacher the number of positive
indications of the behaviours in an Activity was totalled and divided by
the total number of behaviours within the Activity. The resultant fraction
108
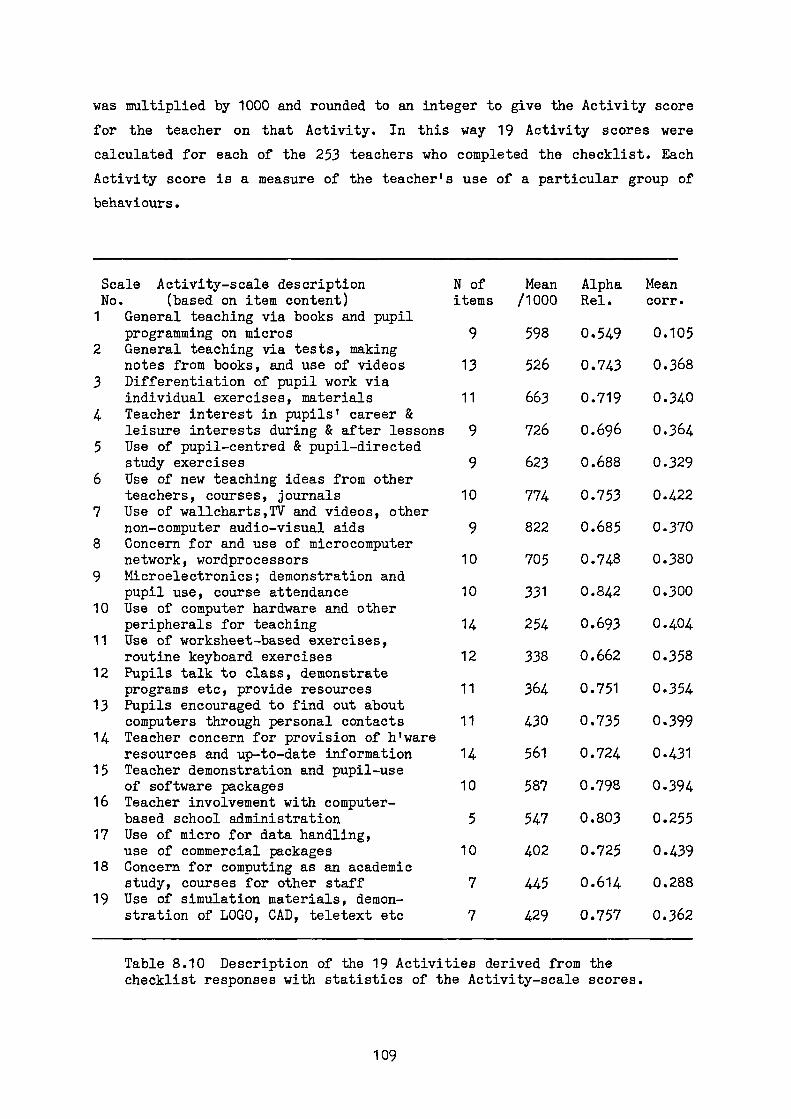
was multiplied by 1000 and rounded to an integer to give the Activity score
for the teacher on that Activity. In this way 19 Activity scores were
calculated for each of the 253 teachers who completed the checklist. Each
Activity score is a measure of the teacher's use of a particular group of
behaviours.
Scale Activity-scale descriptionNo. (based on item content)1 General teaching via books and pupil
programming on micros2 General teaching via tests, making
notes from books, and use of videos3 Differentiation of pupil work via
individual exercises, materials4 Teacher interest in pupils' career &
leisure interests during & after lessons5 Use of pupil-centred & pupil-directed
study exercises6 Use of new teaching ideas from other
teachers, courses, journals7 Use of wallcharts,TV and videos, other
non-computer audio-visual aids8 Concern for and use of microcomputer
network, wordprocessors9 Microelectronics; demonstration and
pupil use, course attendance10 Use of computer hardware and other
peripherals for teaching11 Use of worksheet-based exercises,
routine keyboard exercises12 Pupils talk to class, demonstrate
programs etc, provide resources13 Pupils encouraged to find out about
computers through personal contacts14 Teacher concern for provision of hlware
resources and up-to-date information15 Teacher demonstration and pupil-use
of software packages16 Teacher involvement with computer-
based school administration17 Use of micro for data handling,
use of commercial packages18 Concern for computing as an academic
study, courses for other staff19 Use of simulation materials, demon-
stration of LOGO, CAD, teletext etc
N ofitems
Mean/1000
AlphaRel.
Meancorr.
9 598 0.549 0.105
13 526 0.743 0.368
11 663 0.719 0.340
9 726 0.696 0.364
9 623 0.688 0.329
10 774 0.753 0.422
9 822 0.685 0.370
10 705 0.748 0.380
10 331 0.842 0.300
14 254 0.693 0.404
12 338 0.662 0.358
11 364 0.751 0.354
11 430 0.735 0.399
14 561 0.724 0.431
10 587 0.798 0.394
5 547 0.803 0.255
10 402 0.725 0.439
7 445 0.614 0.288
7 429 0.757 0.362
Table 8.10 Description of the 19 Activities derived from thechecklist responses with statistics of the Activity-scale scores.
109

Table 8.10 shows the Activity-scale description, mean score and
internal reliability (Cronbach alpha value) of the 19 Activity scores. The
mean scores cover the range 252/1000 (Activity 10, Use of computer hardware
for teaching) to 822/1000 (Activity 7, Use of non-computer AV-aids). These
are "mid-range" values suggesting that the 19 scales have sufficient range
to discriminate between the preferences of different teachers. The
reliability values are moderately high for scales of about 10 items and
indicate the likely usefulness of the 19 Activities as measures of teacher
behaviour. The results are in agreement with the finding of Shavelson &
Dempsey-Attwood (1976) that composite (grouped) measures are stable
indicators of teaching behaviour.
The communality of the scales as measures of a single construct, i.e.
teaching behaviour, was investigated by the use of factor analysis. A
simple varimax-rotation analysis identified two orthogonal factors
accounting for 40% and 12% of the score variance. Only the score for
Activities Nos. 1 and 16 failed to have a factor loading of at least 0.4.
The simplicity of the factor structure together with the high percentage of
the score variance associated with the first factor are interpreted as
showing the scales measure a single construct.
The independence of the 19 Activities could be estimated from the
matrix of interscale correlations. Because of the size of the matrix, it is
more convenient to examine the mean correlation of each Activity score with
the other 18 Activity scores. The mean correlations (Table 8.10) range from
0.11 to 0.45. These are not high values, they are consistent with the view
that the Activities measure different dimensions of a common construct.
T-tests were carried out to see whether the scales discriminated
between sub-groups of the sample according to six variables of gender,
experience and qualifications with the results shown in Table 8.11. The
number of discriminations significant at p <= 0.05 is 25, over four times
that expected by chance alone. The results show that 13 of the 19 scales
discriminated between one or more of the subgroups.
110
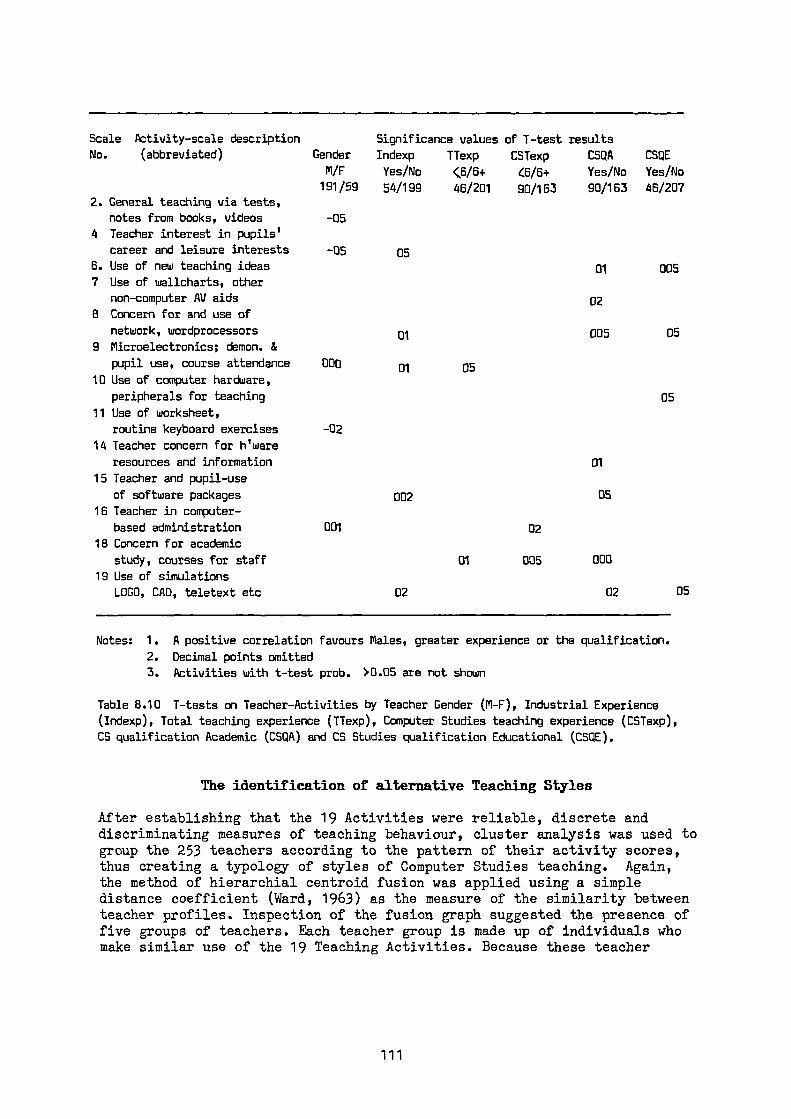
Scale Pctivity-scale description Significance values of 1-test resultsNo. (abbreviated) Gender Indexp TTexp CSTexp CSQA CSQE
M/F Yes/No <8/6+ 46/6+ Yes/No Yes/No191/59 54/199 46/201 90/163 90/163 46/207
2. General teaching via tests,notes from books, videos -05
4 Teacher interest in pupils'
career and leisure interests -05 056. Use of new teaching ideas 01 0057 Use of wallcharts, other
non-computer AV aids 028 Concern for and use of
network, wordprocessors 01 005 059 Microelectronics; demon. &
pupil use, course attendance DOD 01 0510 Use of computer hardware,
peripherals for teaching 0511 Use of worksheet,
routine keyboard exercises -02
14 Teacher concern for h'ware
resources and information 0115 Teacher and pupil-use
of software packages 002 05
16 Teacher in computer-
based administration 001 0218 Concern for academic
study, courses for staff 01 005 000
19 Use of simulations
LOGO, CAD, teletext etc 02 02 05
Notes: 1. A positive correlation favours Males, greater experience or the qualification.
2. Decimal points omitted3. Activities with t-test prob. >0.05 are not shown
Table 8.10 T-tests on Teacher-Activities by Teacher Gender (M-F), Industrial Experience
(Indexp), Total teaching experience (TTexp), Computer Studies teaching experience (CSTexp),
CS qualification Academic (CSQA) and CS Studies qualification Educational (CSQE).
The identification of alternative Teaching Styles
After establishing that the 19 Activities were reliable, discrete anddiscriminating measures of teaching behaviour, cluster analysis was used togroup the 253 teachers according to the pattern of their activity scores,thus creating a typology of styles of Computer Studies teaching. Again,the method of hierarchial centroid fusion was applied using a simpledistance coefficient (Ward, 1963) as the measure of the similarity betweenteacher profiles. Inspection of the fusion graph suggested the presence offive groups of teachers. Each teacher group is made up of individuals whomake similar use of the 19 Teaching Activities. Because these teacher
111

Scale Activity-scale description Teaching Style GroupNo. (based on item content) 1 2 3 4 5
1 General teaching via books and pupilprogramming on micros
2 General teaching via tests, makingnotes from books, and use of videos + +
3 Differentiation of pupil work viaindividual exercises, materials + + _*
4 Teacher interest in pupils' career &leisure interests during & after lessons + +
5 Use of pupil-centred & pupil-directedstudy exercises + +
6 Use of new teaching ideas from otherteachers, courses, journals
7 Use of wallcharts,TV and videos, othernon-computer audio-visual aids + +
8 Concern for and use of microcomputernetwork, wordprocessors
9 Microelectronics; demonstration andpupil use, course attendance
10 Use of computer hardware and otherperipherals for teaching
11 Use of worksheet-based exercises,routine keyboard exercises + +
12 Pupils talk to class, demonstrateprograms etc, provide resources + +
13 Pupils encouraged to find out aboutcomputers through personal contacts + +
14 Teacher concern for provision of h'wareresources and up-to-date information
15 Teacher demonstration and pupil-useof software packages
16 Teacher involvement with computer-based school administration
17 Use of micro for data handling,use of commercial packages
18 Concern for computing as an academicstudy, courses for other staff
19 Use of simulation materials, demon-stration of LOGO, CAD, teletext etc
N in Teaching-style group 99 61 17 44 32
Note: * indicates Activity use in Style 5 is significantlyless than use in Style 4.
Table 8.12 High and low use of Activities within the fiveTeaching-Style groups. Data for 253 teachers.
groupings were derived from an analysis of the pattern of use of
teaching activities, they are interpreted as five distinct Styles of
112

Computer Studies teaching. These five Styles were innate, i.e.
derived from the data without reference to any external classification or
category system at either the Activity or behaviour level.
Descriptions of the five teaching styles were obtained by analysing
use of the 19 Activities within each style. One-way analysis of variance
was used to identify significantly high or low use of an Activity within
each style. The Scheffe procedure was used to reduce the risk of Type I
errors. Table 8.12 shows the results of this analysis. Based on Table 8.12
the five Styles can be described as follows:
Type 1 (99 teachers, 39% of the sample)
This group shows the lowest number of departures from "average" teaching.The teachers record higher than average use only for Activities 6, 7 and 15indicating use of new teaching ideas, audio-visual aids, and softwarepackages respectively. This Style makes less than average use of worksheetsand routine keyboard exercises (Activity 11) and personal contacts bypupils (Activity 13).
Type 2 (61 teachers, 24% of the sample)
This group shows higher than average use of all Activities except ActivityNo. 1 (General teaching based on textbooks). The group is unique in showinghigher than average use of eight Activities, Nos. 8, 9, 10, 14, 16, 17, 18and 19. Teachers in this Style-group have a very "positive-style" and makeextensive use of all types of teaching Activities and resources.
Type 3 (17 teachers, 7% of the sample)
Teachers in this group show higher than average use of several Activitiesbut fewer than teachers in Style Group 2. Teachers in Style Group 3 makeunique use of Activity No. 1 (General teaching based on textbooks). Thisstyle is distinguished from Style Group 2 by less use of microelectronics(Activity No. 9), non-involvement with computer-based school administration(No. 16), less interest in professional concerns (No. 18), and less use ofsimulations etc (No. 19). This style may be summarised as showing apositive approach to teaching activities except those that require theteacher to be involved with microcomputer use.
Type 4 (44 teachers, 17% of the sample)
This group of teachers record lower than average use on 16 of the 19Activities. The group is unique in recording lower than average use ofActivity No. 8 (concern for microcomputer networks and wordprocessors). Adetailed comparison of this Style with Style 5 (below) shows that Style 4has the lowest use of Activity 16 (computer-based school administration)and also of Activity 7 (use of non-computer audio-visual aids).
113
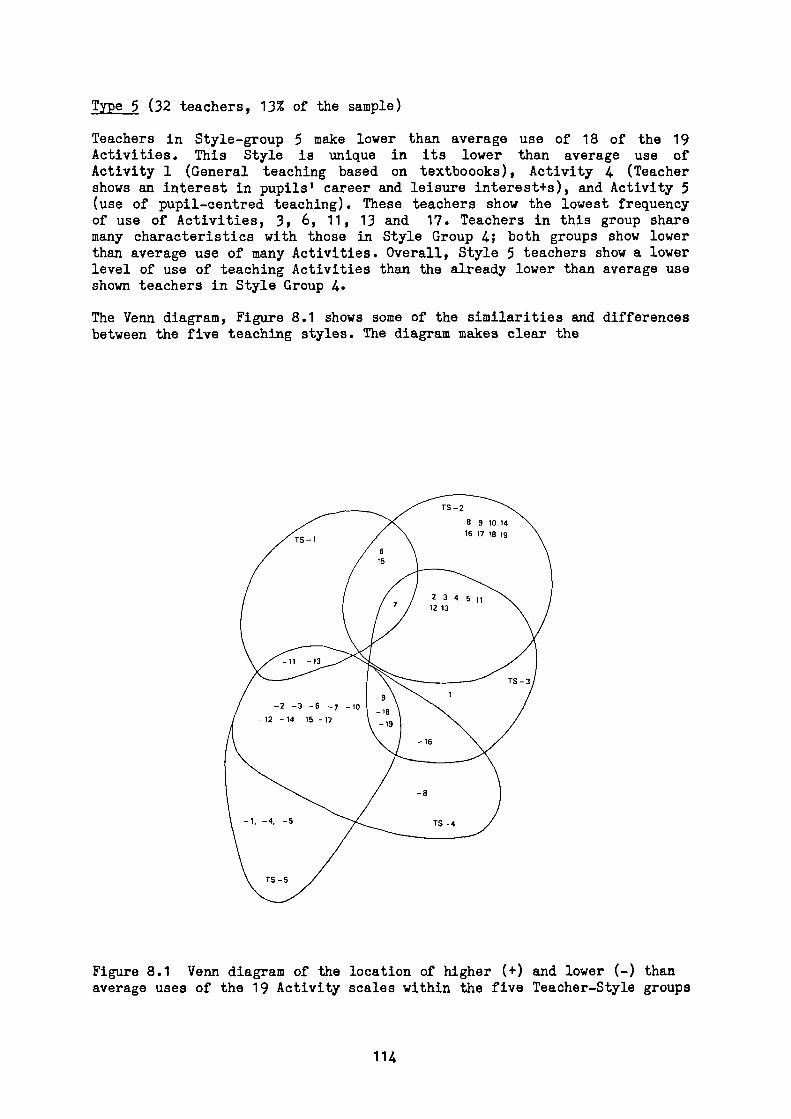
Type 5 (32 teachers, 13% of the sample)
Teachers in Style-group 5 make lower than average use of 18 of the 19Activities. This Style is unique in its lower than average use ofActivity 1 (General teaching based on textb000ks), Activity 4 (Teachershows an interest in pupils' career and leisure interest+s), and Activity 5(use of pupil-centred teaching). These teachers show the lowest frequencyof use of Activities, 3, 6, 11, 13 and 17. Teachers in this group sharemany characteristics with those in Style Group 4; both groups show lowerthan average use of many Activities. Overall, Style 5 teachers show a lowerlevel of use of teaching Activities than the already lower than average useshown teachers in Style Group 4.
The Venn diagram, Figure 8.1 shows some of the similarities and differencesbetween the five teaching styles. The diagram makes clear the
Figure 8.1 Venn diagram of the location of higher (+) and lower (-) thanaverage uses of the 19 Activity scales within the five Teacher-Style groups
114
close similarities between the two "positive" teaching Styles,
Types 2 and 3, and between the two "negative" Styles, Types 4 and 5. The
diagram reinforces the view that Style-groups 2 and 3 are distinguished by
the teachers' attitude to their own use of the micro (Activities 9, 16, 18,
19). The diagram also indicates that the two negative Styles 4 & 5 are
distinguished by teachers' use of Activities 1, 4 and 5. All these involve
pupils. Group 5 teachers have a lower use of pupil-related activities.
Correspondingly, Group 4 teachers have the lower use of the machine-
oriented activity number 8.
Confirmation of the five teaching styles
Although the interpretation of the cluster analysis and the analysis
of variance results left little doubt as to the existence of five distinct
Styles of teaching, some additional support for the grouping was sought.
Discriminant analysis was chosen as a technique appropriate for confirming
the allocation of each of the 253 teachers to one of the five Teaching-
Style groups.
The discriminant analysis used the sets of 19 Activity scores as the
independent variables to confirm the placing of the teachers into one of
the five Style groups. In discriminant analysis new uncorrelated variables,
termed canonical discriminant functions (CDFs), are formed from linear
combinations of the independent variables. It was found that three CDFs
were sufficient to place 92% of the teacher sample in the same Style group
as found in the original cluster analysis thus confirming the identi-
fication of five Styles of Computer Studies teaching.
Table 8.13 gives the weighting of each Teaching Activity within the
three functions and shows that two Activities, No.2 (General teaching -
tests), and No.14 (Teacher concern for resources), had weightings of zero
in all three functions. That is, these two Activities were not of
significance in discriminating between the five Teaching Styles. Since the
two Activities do not have zero level of use the result shows that they are
used equally in the different Style groups.
115
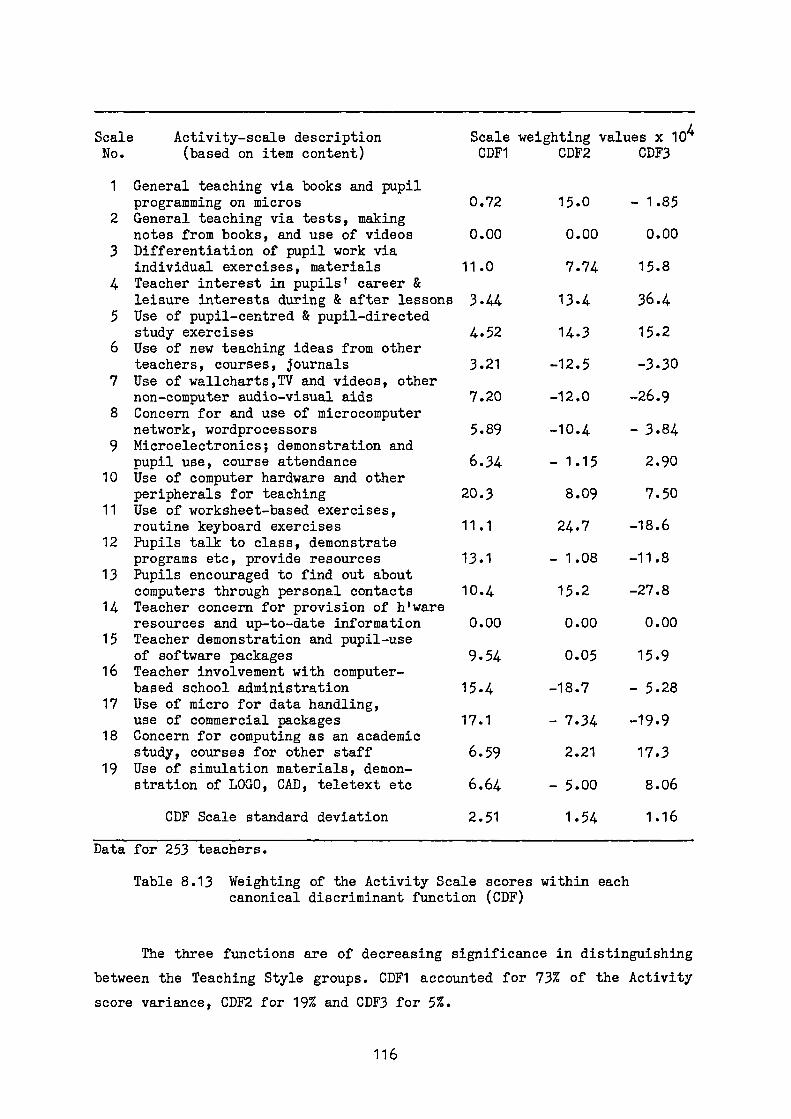
No. (based on item content)
1 General teaching via books and pupilprogramming on micros
2 General teaching via tests, makingnotes from books, and use of videos
3 Differentiation of pupil work viaindividual exercises, materials
4 Teacher interest in pupils' career &leisure interests during & after lessons
5 Use of pupil-centred & pupil-directedstudy exercises
6 Use of new teaching ideas from otherteachers, courses, journals
7 Use of wallcharts,TV and videos, othernon-computer audio-visual aids
8 Concern for and use of microcomputernetwork, wordprocessors
9 Microelectronics; demonstration andpupil use, course attendance
10 Use of computer hardware and otherperipherals for teaching
11 Use of worksheet-based exercises,routine keyboard exercises
12 Pupils talk to class, demonstrateprograms etc, provide resources
13 Pupils encouraged to find out aboutcomputers through personal contacts
14 Teacher concern for provision of h'wareresources and up-to-date information
15 Teacher demonstration and pupil-useof software packages
16 Teacher involvement with computer-based school administration
17 Use of micro for data handling,use of commercial packages
18 Concern for computing as an academicstudy, courses for other staff
19 Use of simulation materials, demon-stration of LOGO, CAD, teletext etc
CDF Scale standard deviation
Scale Activity-scale description Scale weighting values x 104CDF1 CDF2 CDF3
0.72 15.0 - 1.85
0.00 0.00 0.00
11.0 7.74 15.8
3.44 13.4 36.4
4.52 14-3 15.2
3.21 -12.5 -3.30
7.20 -12.0 -26.9
5.89 -10.4 - 3.84
6.34 - 1.15 2.90
20.3 8.09 7.50
11.1 24.7 -18.6
13.1 - 1.08 -11.8
10.4 15.2 -27.8
0.00 0.00 0.00
9.54 0.05 15.9
15.4 -18.7 - 5.28
17.1 - 7.34 -19.9
6.59 2.21 17.3
6.64 - 5.00 8.06
2.51 1.54 1.16
Data for 253 teachers.
Table 8.13 Weighting of the Activity Scale scores within eachcanonical discriminant function (CDF)
The three functions are of decreasing significance in distinguishing
between the Teaching Style groups. CDF1 accounted for 73% of the Activity
score variance, CDF2 for 19% and CDF3 for 5%.
116

Because of their relationship to teaching activities, the CDFs are
alternative measures of Teaching Style. Because the three functions include
above-average (+) and below-average (-) weightings of the 19 Activities,
they could also be used to describe the characteristics of teachers.
A teacher will receive a high score on CDF1 if he or she
limits pupil involvement to resource concernsmakes use of ideas from books, other teachers
(+12, +13)(+6)
makes use of a wide range of computer-based andother teaching aids (+7, +8, +9, +10, +17)is involved with computer-based school administration (+16)is involved with computer-use by other teachers (+15, +18)
These are the characteristics of a teacher who has a high level of
computer interest, who makes use of a range of teaching aids.
A teacher obtains a high score on CDF2 for
frequent use of textbooks and worksheets (+1, +11)less than average use of microcomputers,microelectronics, software, hardware (-8, -9, -17, -19)is not often involved with other teachers (-6, -16, -18)encourages pupils to find about computers privately (+13)takes an interest in pupils' leisure and learning ( +4, +5)
These are the characteristics of a teacher who prefers to use books
and worksheets, who takes an interest in pupils but prefers to avoid the
use of computer based resources both alone and with other teachers.
Teachers obtains high scores on the third discriminant function,
CDF3, if they
avoid use of books and worksheetsmake frequent contact with pupilsprefer unstructured pupil workmake minimal use of class-level aidsencourage pupils to use softwarehelp other staff
These are the characteristics of a teacher interested in pupil-
centred teaching.
117

Oneway analysis of variance of the teachers' scores on the three
canonical functions produced the results shown in Table 8.14, the table
shows the coordinates of the Teaching Style group centroids on the CDF axes
and indicates high (+) and low (-) use of the three functions within the
five Teaching Styles. The table shows how the CDFs distinguish between the
"positive" styles of teachers in Groups 2 and 3, and between the "negative"
styles of those in Groups 4 and 5. When interpreting the table it is
necessary to recall that the three functions CDF1, CDF2, and CDF3 are in
decreasing order of importance in establishing group membership.
CDF Characteristics of teachers withNo. high scores on this function (*)
1 Teacher concerned with contentand professional interests; usesnew methods; wide range of aids.
2 Teacher shows preference forbooks and worksheets; tends toavoid computer hardware.
3 Teacher prefers pupil-centredteaching, low use of class-levelresources; unstructured lessons.
Teaching-style Group1 2 3 4 5
0.20 3.28 0.34 -3.23 -2.60
-0.66 0.28 2.45 1.46 -1.81
0.48 -0.17 -1.21 0.38 -1.04
(*) See text for full description of teacher characteristics
+ (-) indicates a significantly higher (lower) score on this function
Table 8.14 Description of the five Teaching-style groups by means ofthe three canonical discriminant functions and location ofTeaching Style group centroids.
Table 8.14 may be compared with the Venn diagram of Figure 8.1. The
first line of the table shows that the most important function, CDF1,
distinguishes a strongly positive style (No. 2), two negative styles (4
and 5) and two neutral styles (1 and 3). These three groups of Teaching
Styles can also be found on the Venn diagram. The next function, CDF2 which
places emphasis on computer-based activities, distinguishes between
Styles 1 and 3 with Style 3 as the more positive. The third function CDF3
makes further distinctions between the Teaching-Style groups mostly on the
basis of pupil contact and pupil-centred activities.
118

The close correspondence of the Venn diagram to the summary of the
discriminant analysis shown in Table 8.14 does not extend understanding of
the Teaching Styles already given but lends considerable support to the
validity of the analyses.
Relationships between Teaching-style and Teacher Background Variables
Table 8.15 gives a summary of chi2 tests carried out on cross-
tabulation tables of teacher background variables of gender, years of
teaching, qualifications and industrial experience arranged according to
Teaching Style. The data show that, in this sample, a teacher's Style is
related to gender, academic and teacher training qualifications and
teaching subject. Style seems to be unrelated to industrial experience,
length of teaching experience both total and in CS, and school-type.
Teacher Teaching-style Group Chi2
TestVariable 1 2 3 4 5 Value Sig.
(N= 99 61 17 44 32)
Gender Female 15 14 6 18 7 13.4 0.01Male 84 47 11 26 25
Teaching 0-5 years 19 9 3 11 4 2.73 NSExperience 6+ years 78 51 14 30 28
Academic Qual. Yes 45 25 4 10 6 13.1 0.02in computing No 54 36 13 34 26
Teacher training Yes 69 43 11 19 17 15.7 0.01Qual. in CS No 30 18 6 25 15
Industrial Yes 23 17 3 7 4 4.36 NSExperience No 76 44 14 37 28
Other teaching Maths 72 40 12 38 28 9.4 0.05subject Other 27 21 5 6 4
School Mixed 86 56 17 36 31 6.13 NSType Single Sex 13 5 0 8 1
CS-teaching 0-5 years 62 39 10 35 17 7.46 NSexperience 6+ years 37 22 7 9 15
Table 8.15: Crosstabulation of teacher variables by Teaching-style group
119

Male teachers predominate in Style Group 1 whilst females are
relatively more common in Groups 3 and 4. Teachers with a degree or college
qualification in computing are more likely to be found in Styles 1 and 2.
Although teachers of mathematics were in a majority in all Style-groups,
the ratio of their superiority was lowest in Style 2.
T-tests were made on the means of the three canonical discriminant
functions between sub-groups of the sample formed according to gender,
teaching experience, qualifications, industrial experience, other teaching
subject, and school-type. From the results shown in Table 16 it can be seen
that each teacher personal variable is significantly related to one CDF.
This suggests that the canonical functions are associated with specific
teacher characteristics.
TeacherVariable
Significance of level of t-testCDF1 CDF2 CDF3
Gender Female NS -0.001(*) NSMale
Teaching 0-5 years NS -0.05 NSExperience 6+ years
Academic Qual. Yesin computing No
NS NS -0.01
Teacher training Yes NS -0.05 NSQual. in CS No
Industrial Yes 0.05 NS NSExperience No
Other teaching Mathssubject Other
-0.05(A) NS NS
School Mixed NS NS NSType Single Sex
CS-teaching 0-5 yearsexperience 6+ years
NS NS NS
(*) Negative sign shows females have the higher mean score(•) Negative sign shows non-maths have the higher mean score
Table 8.16: Summary of results of t-tests on canonicaldiscriminant functions by teacher variables.
120
The table shows high scores on CDF1 are positively associated with
industrial experience Using this result with the descriptions of the CDFs
given in Table 8.12 shows teachers with industrial experience in computing
are more likely to use a wide range of computer hardware and teaching aids.
High scores on CDF2 are associated with female teachers. The negative
correlation with general teaching experience and Computer Studies teaching
qualifications confirms that teachers who are trained or experienced in the
teaching of Computer Studies are more likely to use computer resources in
preference to books and worksheets. The third function, CDF3 1 is associated
only with academic qualifications. A teacher with an academic qualification
in computing is less likely to engage in pupil-centred activities, will
make use of class-level aids books and worksheets, and is less likely to
ask pupils about their career and leisure interests.
No previous survey of Computer Studies teachers is available for the
comparison of data. Therefore it is impossible to say whether the
relationships between teacher variables and Teaching Style agree with other
findings. The results are however understandable at a naive level. It is
reasonable that a person with industrial experience of computers should
show a preference for working with resources and also that a trained
teacher with some experience will make more use of resources. To this
extent the findings give further support to the validity of the checklist
and the subsequent analyses.
The "activity"-importance rating matrix
In the Teachers/ Booklet the items included in the Rating Matrix were
described as Activities in order to avoid the use of the more technical
term behaviours. Inverted commas will be used to distinguish the matrix
"activities" from the 19 Teaching Activities derived from the checklist.
One reason for including the importance matrix in the teacher booklet
was to obtain an additional measure of the checklist validity. Unlike the
internal consistency validity pointed out previously, the rating-matrix
provides an external source of validation.
121

The "activity" matrix is shown in Table 8.17 with the number of
responses received in each response category. The means shown were obtained
by assigning values of
Above average = 1, Average = 2, Below average = 3, No value = 4
(This method of scoring gives a scale mean of 2 iC the "No value"
category is ignored, a mean of 2.5 if this category is included.)
The data show that one "activity", Writing programs for
administration and other teachers (Activity 7), was thought of No value to
Computer Studies teaching by over one-third of respondents. Three other
"activities", No.2 (Encourage pupils to provide resources), No.8
(Incorporate microelectronics) and No.14 (Allow pupils to participate in
and choose teaching activities) were thought of little importance in
Computer Studies teaching, all three had means of 2.5 and above. The
"activities" rated as most important by teachers were No.1 (organisation
and supervision), No.16 (Actively seek new teaching ideas), No.15 (Link
teaching to industry/commerce) and No.10 (Clear and precise tasks). Three
of these four are general teaching techniques and are not specific to
Computer Studies. The "activities" linked to computers, software and
technology (Nos 6, 3, 8 and 13) obtained rankings of 5th, 6th, 15th,
and 13th.
T-tests were made on matrix responses to determine whether they were
related to the five teacher variables of industrial experience, academic
and teacher training qualifications in computing, and teaching experience
both total and in Computer Studies. Of the 85 separate t-tests, only two
showed a significance value at the 0.05 level or above. As this number is
expected to occur by chance alone, it is concluded that the teachers'
ratings of the "activities" is independent of their personal
characteristics.
122
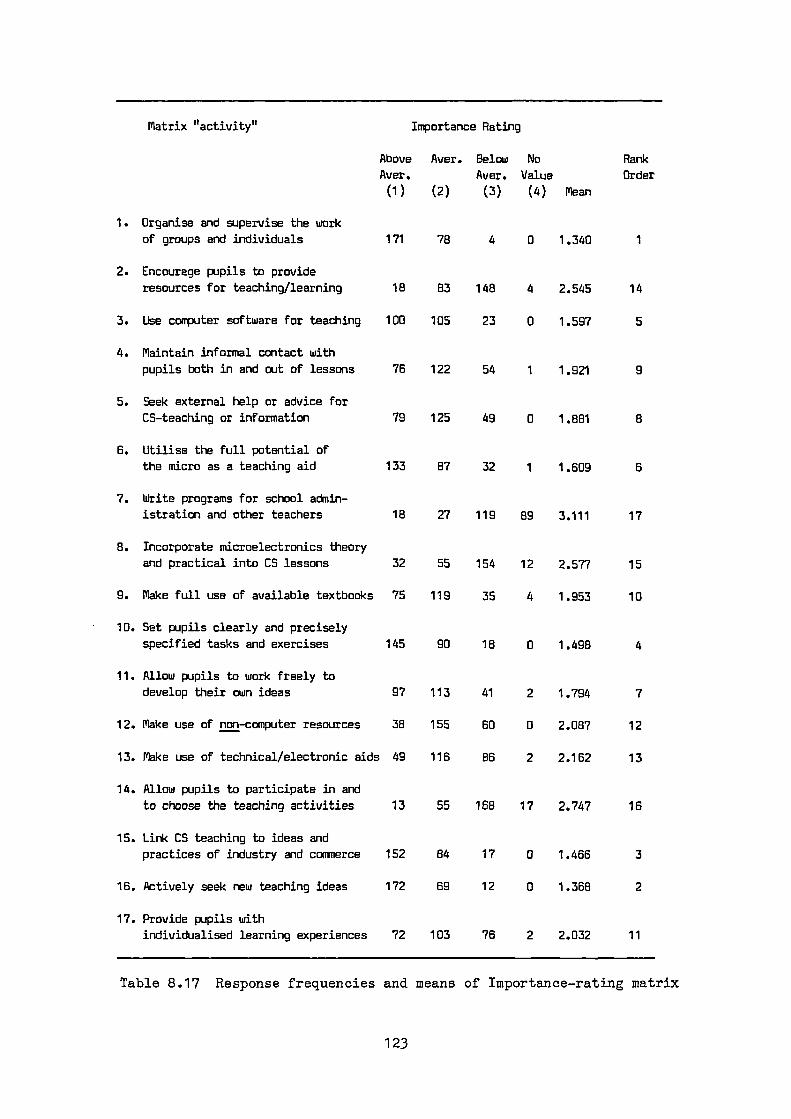
Matrix "activity"
Above
Aver.
Importance Rating
Aver. Below No
Aver. Value
RankOrder
(1) (2) (3) (4) Mean
1. Organise and supervise the work
of groups and individuals 171 78 4 0 1.340 1
2. Encourage pupils to provide
resources for teaching/learning 18 83 148 4 2.545 14
3. Use computer software for teaching 100 105 23 0 1.597 5
4. Maintain informal contact with
pupils both in and out of lessons 76 122 54 1 1.921 9
5. Seek external help or advice for
CS-teaching or information 79 125 49 0 1.881 8
6. Utilise the full potential of
the micro as a teaching aid 133 87 32 1 1.609 6
7. Write programs for school admin-
istration and other teachers 18 27 119 89 3.111 17
8. Incorporate microelectronics theory
and practical into CS lessons 32 55 154 12 2.577 15
9. Make full use of available textbooks 75 119 35 4 1.953 10
10. Set pupils clearly and precisely
specified tasks and exercises 145 90 18 0 1.498 4
11. Allow pupils to work freely to
develop their own ideas 97 113 41 2 1.794 7
12. Make use of non-computer resources 38 155 60 0 2.087 12
13. Make use of technical/electronic aids 49 116 86 2 2.162 13
14. Allow pupils to participate in and
to choose the teaching activities 13 55 168 17 2.747 16
15. Link CS teaching to ideas and
practices of industry and commerce 152 84 17 0 1.466 3
16. Actively seek new teaching ideas 172 69 12 0 1.368 2
17. Provide pupils with
individualised learning experiences 72 103 76 2 2.032 11
Table 8.17 Response frequencies and means of Importance-rating matrix
123
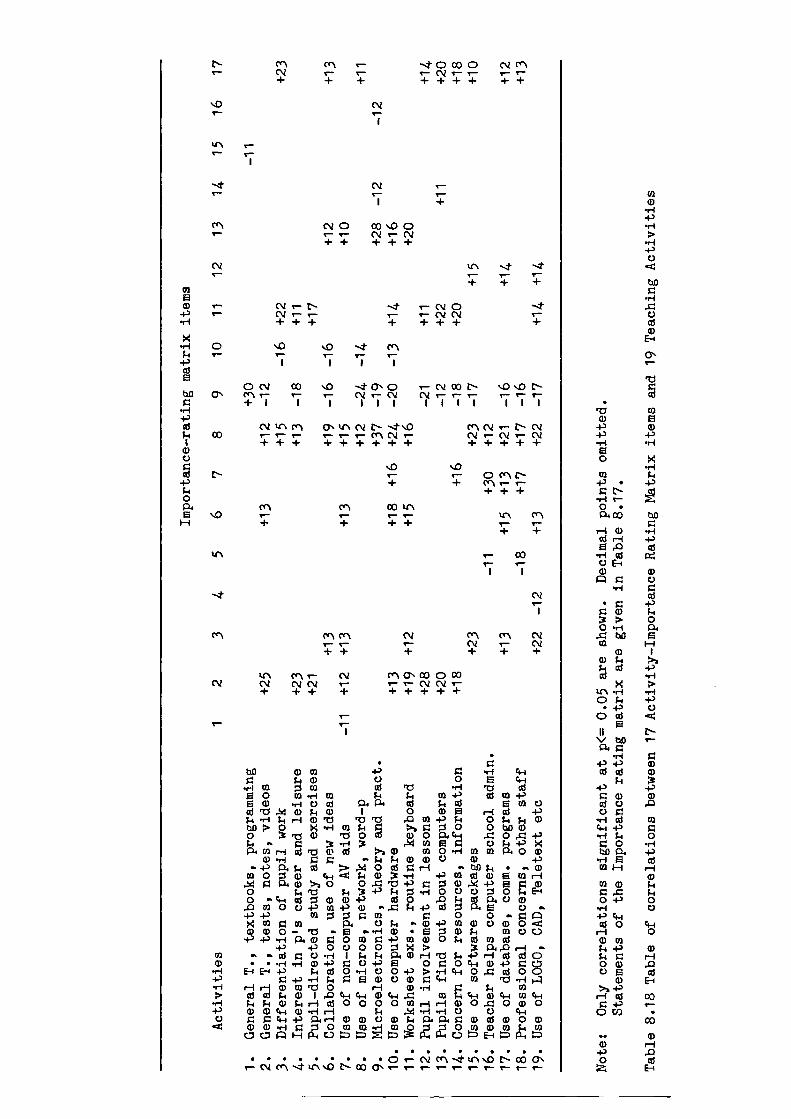
Cr \ Cr‘ "4. 0 00 0 Cq CrlCV
T-17 -7- 7 7 ++
•0
crs, CN 0CV
00 %.0 07 7. CV 1-
+++
P I- 1--4-) 7 I I IcdE
0 CV CO_ .0 --d- 0, 0 .- CV CO N nC) .0 Nhp ON C\r r- CV VO + I I 7 III ii 7 7 7 7 7 7
-f-I4.,Cd CV If\ cn 0n kn cv E--- -4- %.0 crl CV•- N- CNt1.4 CO
TI I+++ -++ ++ ++- 7-: ` 1--c./ ..- (V-• CV
a)+++++
C)Cd N
.0 .00 Cc \ C--
-I-) 71.-- II-. cn T- .--c-, + + +cOl.
ccl cil co tr.E .0
I--1 + 7- i-T 7 t4"\ CrN
4- +
cen c•-n cn cc\ (NZc•/,
7 7 + + +
kr\ cc\ A-- Cr ON CO 0 00CV CV CV CV r- CV CV I--
▪ + +++ +
•• 0
Zap 0 ca 4-3 0 +4 440r-i 0) cal.
0
cd 1:10
oE c•
+I rdig 0 0/ •n-i ca F-4 $.1 0) 4.' cd CCI 1-)O (1) +1 0 cd 04 P• cd F. 0 El U) C)cd rd .11 a) C-1 cD I 0 a) e H al -PF-s +I F-1 H CD '0 .0 "0 ,0 0 +3 ;-1 0 F1 k CI)b.O . 0 44U) PI 0 >sZ 0 0 0 hi) cDO 3 'd a) ro 0 ad o 0 P.. cf-I .0 o .0 +)P - 0 3 ,-.1 3 .s4 calE0 0E-44-354P. 0) 1--1 al '0 0 cd ›.• 0 ca 0 +I ca ca P. 0 0
a) •,-1 0 0 m P. ;4 0) CD 0 CD 4-,•• -I-) 04 aS .s4 0 cd 0 1-1 - OD ry • -W
0) 0 0)0 Q) Co-I .4 C4 a) 3 +I +3 ca cd a) E 0) r--I.-- 0 P. c1) >, 0 0 .0 r0 -4-) Z 0 CD ,W +3 la 0 a)o 1.., 1:1 ;..1 -I-3 r-4 0 +-I 0 0 c) 0 0 N E-I0 •'• G-t cd 0 a) a) -I-) Cd 0 rip ;-I Cd fal 0 CD,0 rn 0 c.) -P cc 4-3 0 - .0 Pi -P cd 0 CZ ta 0 ..-P +3 ra000 02 Z 0 0 " 0 fa)X Ircl 0 a) P. 0 r•-. 4. a) 4-) (0 0) 0 (D 0 -c4
4S Z .2 -p. 7, 4' g 4. .ri :I)) 4 g 8 2 'id' co :3' '°+, .p0c.)000x› pi, .0 ,-4 ...- .. al g 0r-4 I P4 FA 04 0 H '0 T.4 4-3 H cd cd 0• • .,--1 .,-.1 cD +D g c) +3 E 0 0 0 4-1 a) 4-) Z 0
E-I E-I -P k cd 0 •ri 0 0 +3 > .1-1 44 0 -g cd o c)0 a o 0 0 0 44 u) '0 -1-i
irVii rC-Cil '14) Caill rrli 2 cH cc-4 roil 4-i 2 .i4
co ,.... til q... :3 cHN k CD $4 H cd 0 000 aa 1-1 H CD 0 4 0 a) oa) 0 44 a) .14 H T.4 M •r-t •ri 0 0 44Z 0 44 -P CI. 1---1 a)CD 0 a) r.4 P4 P4 0 CD cd a) 0 a)a) (DH- 4 4 3 co iio ti, i 4 4 00) 0 g i: e
caG) c‘t N (v 0
4-) r-+++
+I 0 crn
r- CV \ \ t•-• CO a,0 CV Cr\ --.4" kr\ N CO ON
C
0
4-) • 4-)N
0 •04 CO 6.13
H -I-ICdr-(El ,r) cd
+-IC) E-4a) a)A 0 o
Cd
•r4•
O a)oO
•
r1 0.4CLO
1--1
0 4.)Cd
X >141 er-f0 $4 4-)
• 4-) 00 cd
II NEi
V CID.H
4-) 4-) a)al QS 0
F-44-) -P• a) 0)cd0 0
•ri cd cf24-4 +3 g+I C.4 0• 0 +Itio +)
e cdca I--1
a)(a F-1O .0 C4O 4-' 0
Cd
▪
0 4-i0
0) 0)t4 4-)
H00) •0O cd>aH• -P
co •co
•• CD
-PO cd
El
Importance ratings can be used as an indicator of the validity of the
checklist and the subsequent analysis if it is assumed that teachers will,
when circumstances allow, use activities they regard as important and will
not use activities they regard as unimportant. In other words, validity of
the Teaching Activities is supported by significant correlations between
teachers' ratings of statements on the Rating-matrix and their scores on
corresponding Activities.
Table 8.18 shows the correlations between teachers' scores on the 17
Importance-matrix items and scores on the 19 (checklist) Activities. As
already explained, the two sets of activities do not correspond exactly
because the matrix items were derived from the Pilot Study which used a
different form of the checklist. The lack of exact correspondence between
the rows and columns of the tables requires that each matrix "activity" has
to be compared with two or more of the list of 19 checklist Activities. To
aid clarity, correlations with a significance of less than 0.05 have been
omitted. Significant correlations are obtained only when the matrix items
and cluster-analysis Activities are similar. Similar results were obtained
by means of oneway analysis of variance between Activities and matrix
items. A table showing the significale of the relationships established
through analysis of variance is given in Appendix C. Although both tables
give the same view of the relationships between the two sets of variables,
it is convenient to work with the table of correlations since this also
contains the sign of the direction of the relationship.
A few examples will be used to show the extent of the agreement
between teachers' scores on the 19 Activities and the 17 matrix items.
Considering first Activity 3, Differentiation of pupil work, this is found
to have significant positive correlations with three Matrix items. No. 8 is
Microelectronics for which pupils often do practical work in small groups;
No.11 is Pupils work freely to develop their own ideas; No.17 (with the
highest correlation) makes direct mention of invidualised learning
experiences. Thus all these pairs of correlations are meaningful. The
remaining correlation of r = -0.16 between Differentiation and Matrix
Activity 10, Set pupils clearly specified tasks, is also meaningful and in
124
the expected direction. Thus on this Activity there is complete
agreement between the checklist analysis and teachers' responses to the
Importance-rating matrix.
Matrix "activity" 9, Make full use of available textbooks, has a
positive correlation with Teaching Activity 1 (General teaching based on
textbooks) and a negative correlation with 13 of the remaining 18
Activities. This is as expected, teachers who differentiate pupil work, who
use new ideas, utilise computer hardware and software as teaching aids,
encourage pupil involvement and are concerned about a wide range of
resources, are teachers who will (usually) make less use of textbooks.
Other rows and columns of the table may be used to show the
correspondence between the 19 checklist-derived list Activities and items
in the Importance-matrix. The finding of very few significant correlations
between Activities and the three items rated as most important (Nos.1 1 15
and 16) may be a statistical effect. When 60% or more of teachers give the
same response, the range of scores is restricted and it becomes difficult
to obtain a significant correlation.
The finding of significant correlations between matching activities
and very few other pairs supports the validity of the checklist instrument
and the scales of Teaching Activities as measures of teachers' classroom
behaviours.
Analysis of the Job-of-a Computer-Studies-Teacher attitude questionnaire
Teachers were asked to use a 29-scale semantic differential
instrument to describe their feelings about The Job of a Computer Studies
Teacher. A condensed form of the instrument and a breakdown of responses
are given in Table 8.19.
125
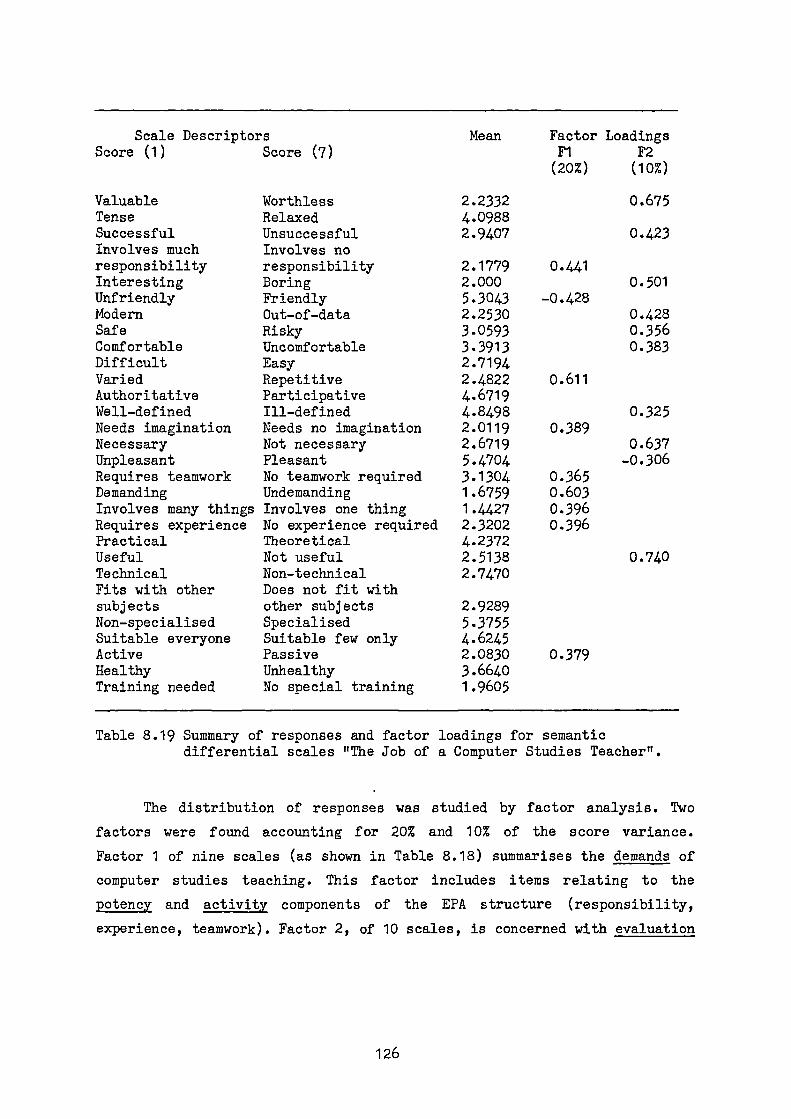
Scale DescriptorsScore (1) Score (7)
Mean Factor LoadingsF1 F2(20%) (10%)
Valuable Worthless 2.2332 0.675Tense Relaxed 4.0988Successful Unsuccessful 2.9407 0.423Involves much Involves noresponsibility responsibility 2.1779 0.441Interesting Boring 2.000 0.501Unfriendly Friendly 5.3043 -0.428Modern Out-of-data 2.2530 0.428Safe Risky 3.0593 0.356Comfortable Uncomfortable 3.3913 0.383Difficult Easy 2.7194Varied Repetitive 2.4822 0.611Authoritative Participative 4.6719Well-defined Ill-defined 4 .8498 0.325Needs imagination Needs no imagination 2.0119 0.389Necessary Not necessary 2.6719 0.637Unpleasant Pleasant 5.4704 -0.306Requires teamwork No teamwork required 3.1304 0.365Demanding Undemanding 1.6759 0.603Involves many things Involves one thing 1.4427 0.396Requires experience No experience required 2.3202 0.396Practical Theoretical 4.2372Useful Not useful 2.5138 0.740Technical Non-technical 2.7470Fits with other Does not fit withsubjects other subjects 2.9289Non-specialised Specialised 5.3755Suitable everyone Suitable few only 4.6245Active Passive 2.0830 0.379Healthy Unhealthy 3.6640Training needed No special training 1.9605
Table 8.19 Summary of responses and factor loadings for semanticdifferential scales "The Job of a Computer Studies Teacher".
The distribution of responses was studied by factor analysis. Two
factors were found accounting for 20% and 10% of the score variance.
Factor 1 of nine scales (as shown in Table 8.18) summarises the demands of
computer studies teaching. This factor includes items relating to the
potency and activity components of the EPA structure (responsibility,
experience, teamwork). Factor 2, of 10 scales, is concerned with evaluation
126
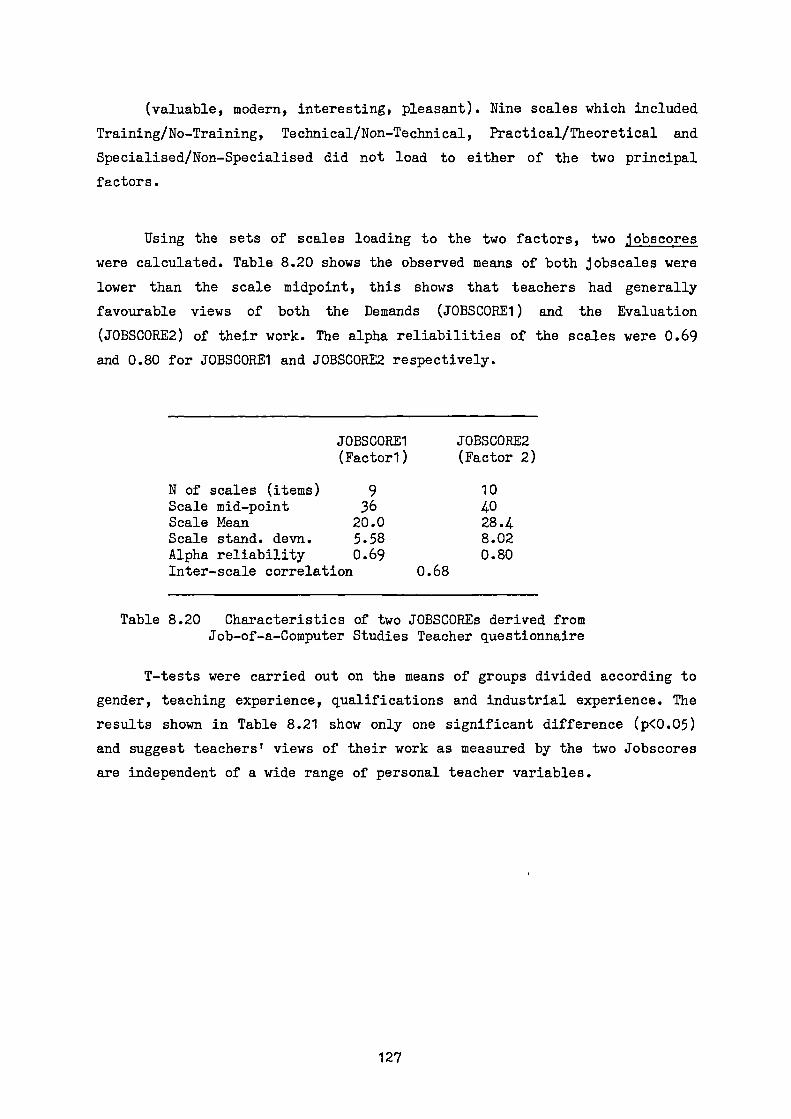
(valuable, modern, interesting, pleasant). Nine scales which included
Training/No-Training, Technical/Non-Technical, Practical/Theoretical and
Specialised/Non-Specialised did not load to either of the two principal
factors.
Using the sets of scales loading to the two factors, two 'obscores•
were calculated. Table 8.20 shows the observed means of both jobscales were
lower than the scale midpoint, this shows that teachers had generally
favourable views of both the Demands (JOBSCORE1) and the Evaluation
(JOBSCORE2) of their work. The alpha reliabilities of the scales were 0.69
and 0.80 for JOBSCORE1 and JOBSCORE2 respectively.
JOBSCORE1(Factor1)
N of scales (items) 9Scale mid-point 36Scale Mean 20.0Scale stand. devn. 5.58Alpha reliability 0.69Inter-scale correlation
JOBSCORE2(Factor 2)
104028.48.020.80
0.68
Table 8.20 Characteristics of two JOBSCOREs derived fromJob-of-a-Computer Studies Teacher questionnaire
T-tests were carried out on the means of groups divided according to
gender, teaching experience, qualifications and industrial experience. The
results shown in Table 8.21 show only one significant difference (p<0.05)
and suggest teachers' views of their work as measured by the two Jobscores
are independent of a wide range of personal teacher variables.
127
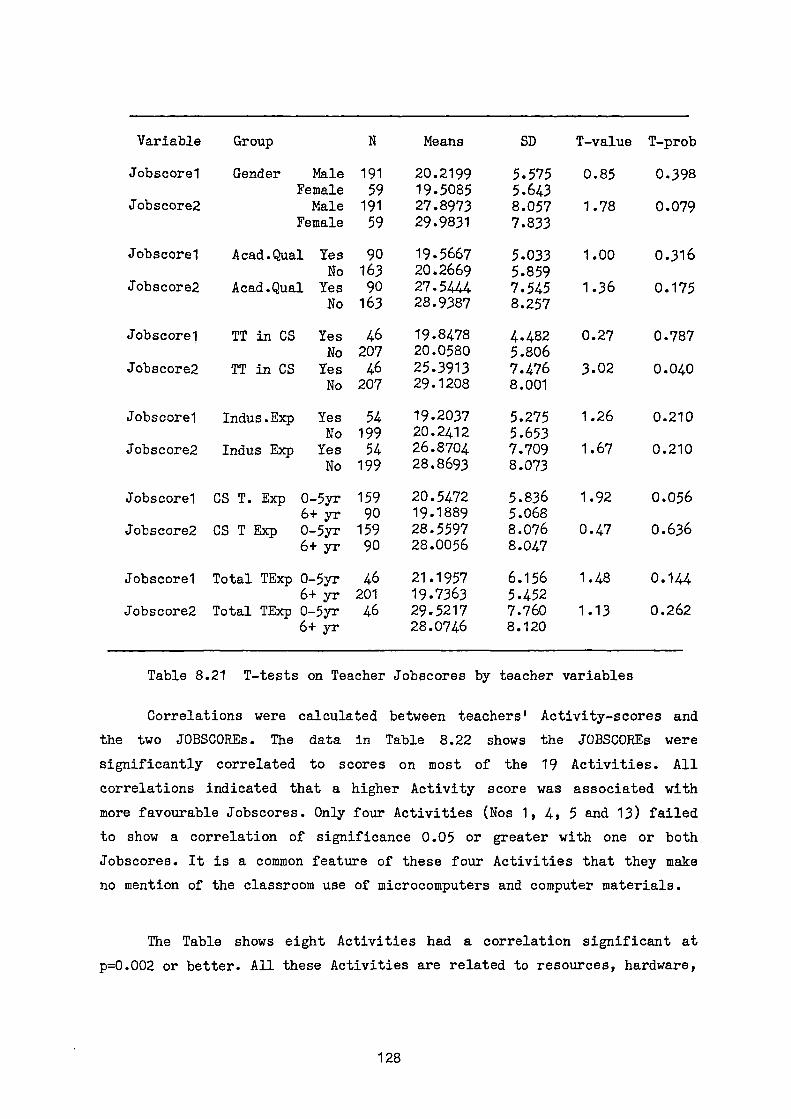
Variable Group Means SD T-value T-prob
Jobscore1 Gender Male 191 20.2199 5.575 0.85 0.398Female 59 19.5085 5.643
Jobscore2 Male 191 27.8973 8.057 1.78 0.079Female 59 29.9831 7.833
Jobscore1 Acad.Qual Yes 90 19.5667 5.033 1.00 0.316No 163 20.2669 5.859
Jobscore2 Acad.Qual Yes 90 27.5444 7.545 1.36 0.175No 163 28.9387 8.257
Jobscore1 TT in CS Yes 46 19.8478 4.482 0.27 0.787No 207 20.0580 5.806
Jobscore2 TT in CS Yes 46 25.3913 7.476 3.02 0.040No 207 29.1208 8.001
Jobscore1 Indus.Exp Yes 54 19.2037 5.275 1.26 0.210No 199 20.2412 5.653
Jobscore2 Indus Exp Yes 54 26.8704 7.709 1.67 0.210No 199 28.8693 8.073
Jobscore1 CS T. Exp 0-5yr 159 20.5472 5.836 1.92 0.0566+ yr 90 19.1889 5.068
Jobscore2 CS T Exp 0-5yr 159 28.5597 8.076 0.47 0.6366+ yr 90 28.0056 8.047
Jobscore1 Total TExp 0-Syr 46 21.1957 6.156 1.48 0.1446+ yr 201 19.7363 5.452
Jobscore2 Total TExp 0-Syr 46 29.5217 7.760 1.13 0.2626+ yr 28.0746 8.120
Table 8.21 T-tests on Teacher Jobscores by teacher variables
Correlations were calculated between teachers' Activity-scores and
the two JOBSOOREs. The data in Table 8.22 shows the JOBSCOREs were
significantly correlated to scores on most of the 19 Activities. All
correlations indicated that a higher Activity score was associated with
more favourable Jobscores. Only four Activities (Nos 1, 4, 5 and 13) failed
to show a correlation of significance 0.05 or greater with one or both
Jobscores. It is a common feature of these four Activities that they make
no mention of the classroom use of microcomputers and computer materials.
The Table shows eight Activities had a correlation significant at
p=0.002 or better. All these Activities are related to resources, hardware,
128

software and the use of computer equipment. The high and low levels
of associations between the 19 Activity scores and the Jobscores show
teachers' feelings about their job are expressed in the level of computer
resource use in their classrooms.
Activity No. Pearson Corr. valueJobscore1 Jobscore2
1
7 00709155924 ****
140656
2
3 1186 **
00111 ::
067645
6:
87
1924
9***
ii i:2032 ***
F **5 i
10
11 1605 **
041412 1613 **
13 0850
14 2381 *** 2539 ***152482
2801***
16 1058 *2146 ***
17 1866 ***
18 2085 *** 1885 * **
19 1991 *** 2271 ***
*, **, ***, Sig. at p = 0.05, 0.01, <0.002
Table 8.22 Correlations between Jobscores and Activity-scores
Although the Jobscores are related to teachers' behaviours as
measured by other variables, they may nevertheless be useful additional
measures of teachers' characteristics. Because the Jobscores are
attitudinal in origin, they may be significantly correlated to one or more
dimensions of pupils' attitudes to computers or to their perceptions of the
classroom environment.
129
Summary
Completed questionnaires were obtained from 253 teachers, the return
rate of about 40% is attributed to coincidence between the study and a
period of industrial dispute in schools. The sample of teachers reported a
range of length of teaching, academic and professional qualifications and
industrial experience. It is thought reasonable to assume that the sample
represents all major teaching variables pertinent to Computer Studies
teaching.
Cluster analysis of teachers' responses to the 206-item checklist
demonstrated 19 groups of Teaching Activities. The use of cluster analysis
made it unnecessary to refer to any external classification or grouping.
Teachers' Activities measured by the checklist of behaviours showed
significant correlations with responses to the importance-rating of similar
items presented as a separate matrix. These correlations were interpreted
as demonstrating the validity of the checklist method of measuring Computer
Studies teaching activities.
Teachers were grouped into five Teaching Styles according to their
pattern of use of the 19 Activities. The five Styles could be simply
described in terms of the above average, average and below average use of
the Activities. A teacher's Style was found to be associated with the four
variables of gender, teaching subject and academic and professional
qualifications in Computing.
Discriminant analysis was used to confirm the placing of individual
teachers into the appropriate Teaching Style group. The 92% correspondence
between placings made by the two methods supports both the validity of the
concept of Teaching Style in Computer Studies and its identification via
the Checklist. The discriminant function analysis provided three additional
variables which may be useful as measures of teaching behaviour.
Teachers also used a semantic differential instrument of 29 scales to
describe their feelings about The Job of Computer Studies Teacher. From the
130
responses factor analysis derived two factors accounting for 29% of
the score variance. One factor could be equated to the Activity and Potency
dimensions of the EPA structure whilst the other represented the Evaluation
dimension.
These two factors which were used as Jobscores had moderate alpha
reliabilities and mean values indicating teachers' had generally favourable
views of their work. The Jobscores were found to be unrelated to teacher
personal characteristics but were positively associated with 15 of the 19
Teaching Activities. The four omitted Activities were those unrelated to
computer use whilst the eight Activities showing highest correlations made
specific mention of the use of hardware and software. It appears that
teachers' feelings about their work are expressed in the level of computer-
related resources used in their classsrooms.
The descriptive statistics described in this chapter have established
the characteristics of the teacher sample and have been used to derive a
number of scales. The 19 Activities, three Canonical Discriminant Functions
and two Jobscores Variables will be used to study relationships between
teachers' behaviours and pupil outcomes.
131

CHAPTER 9
DESCRIPTIVE ANALYSIS OF THE PUPIL DATA
Distribution of the Pupils' Booklet
A total of 158 teachers responded to the invitation to take a further
part in research and were sent pupil booklets. Before the closing date at
the end of the Spring Term 102 sets of completed questionnaires were
received. Applying the data from Wellington as described in Chapter 8, it
is found that the 102 returns represent about 1 in 5 of the eligible
teachers receiving a Teachers' Booklet. Information provided by the
teachers showed the questionnaires had been used between the end of
November 1985 and the end of February 1986. Teachers who were contacted
about non-return of the questionnaires said that, much as they would like
to help the research, they felt all pupils' school time should be used to
make up for lessons lost during the industrial dispute. Thus the return
rate of 60% for the pupil booklets is a further consequence of the
teachers' industrial action of 1985-86.
The 102 sets of questionnaires included 1163 Part A and 1198 Part B
portions. Tables 9.1 to 9.4 show the gender, subject choices, use of a home
computer and computer assisted learning experience of the pupils completing
the questionnaire.
Description of the pupil sample
Number Percent
Boys 1573 68Girls 747 32Total 2320 100
Table 9.1 Gender breakdown of pupil sample
Table 9.1 shows that 68% of the sample were boys; this is a little
lower than the figure of 70% given in Table 1.1 based on DES statistics for
Computer Studies examinations in 1984 and 1985.
132

The subject choices of pupils is summarised in Table 9.2. The
impression given by the data is of a wide spread of subjects accompanying
Computer Studies. The high figures for separate science subjects and CDT/TD
with the low figure for General/Modular Science are consistent with the
policy of making Computer Studies available only to average and above
average pupils observed in some schools during the 1984 study.
Subject All Boys Girls% %
Physics 60.2 77 - 29Chemistry 41.5 46 32Biology 37.6 28 60General Sci. 9.0 9 10CDT/TD 30.9 44 7For. Languages 46.3 37 63History Geography 75.7 78 68Art Music Drama 27.1 25 33Domestic Science 7.9 4 18Office Practice 11.5 5 28Craft subjects 33.1 37 28
Table 9.2 Subject choice of pupil sample
The majority of pupils reported some experience of using a home
computer. In Table 9.3 the playing of arcade-type games is shown as the
most common use, more "educational" uses are much less frequent. Boys
report more frequent use than girls in all categories except "Educational
Games" for which there is no significant gender difference. Both these
findings are in close agreement with data quoted by Mohamedali et al (1987)from a survey of a general school population.
133

UseVeryOften
Frequency
Quite A fewOften times
Occas-ionally
Never
Arcade games All % 25 29 18 21 7Boys % 32 33 17 15 4Girls% 12 21 22 32 13
Educational All % <1 5 17 38 40games Boys % <1 5 18 39 37
Girls% <1 5 15 36 44
Schoolwork All % 4 14,
15 25 42& revision Boys % 4 15 18 26 37
Girls% 4 12 10 23 51
Programming All % 14 26 22 21 18Boys % 17 29 22 20 12Girls% 8 19 20 23 30
Table 9.3: Pupils' use of a home computer
In accordance with the wishes of teachers, pupils were not asked if
they owned a home microcomputer. However, an estimate of the number who had
easy-access to a machine at home can be made from the data in Table 9.3.
The top line of the table indicates that more than 50% of the sample had
access to a home computer "Quite Often" or "Very Often". This is matched by
the figures for programming which show that 40% of the sample used a micro
for programming "Quite Often" or "Very Often", and a further 20% indicated
some programming. On this data it is hypothesised that about 50% of the
sample had easy access to a home microcomputer. This estimate matches the
results of Mohamedali et al (1987) who found that 50% of the general school
population in their survey schools had a microcomputer at home.
An ownership level of around 50% does not appear to be unduly high
for a sample of pupils all of whom were taking Computer Studies as an
examination subject. The data for School work and revision show less than
20% of responses in the "Very Often" or "Quite Often" frequencies combined.
This value is less than half that for "Programming".
134
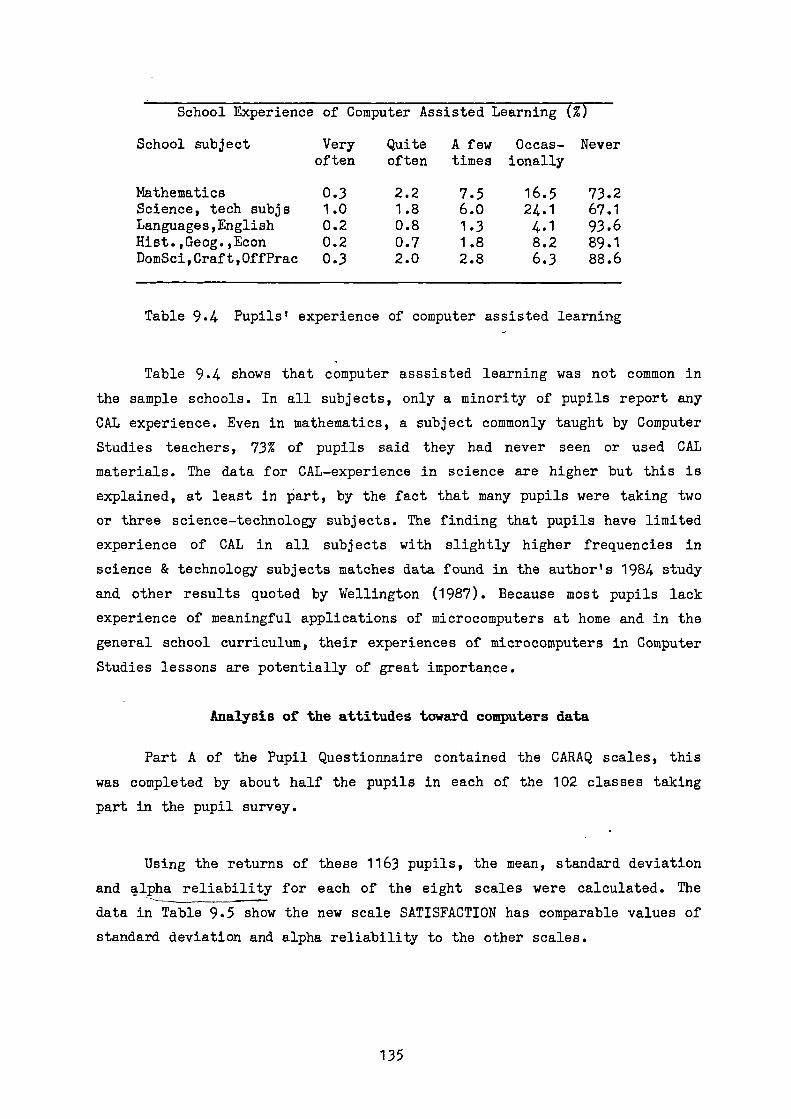
School Experience of Computer Assisted Learning (%)
School subject Very Quite A few Occas- Neveroften often times ionally
Mathematics 0.3 2.2 7.5 16.5 73.2Science, tech subjs 1.0 1.8 6.0 24.1 67.1Languages,English 0.2 0.8 1.3 4.1 93.6Hist.,Geog.,Econ 0.2 0.7 1.8 8.2 89.1DomSci,Craft,OffPrac 0.3 2.0 2.8 6.3 88.6
Table 9.4 Pupils' experience of computer assisted learning
Table 9.4 shows that computer asssisted learning was not common in
the sample schools. In all subjects, only a minority of pupils report any
CAL experience. Even in mathematics, a subject commonly taught by Computer
Studies teachers, 73% of pupils said they had never seen or used CAL
materials. The data for CAL-experience in science are higher but this is
explained, at least in part, by the fact that many pupils were taking two
or three science-technology subjects. The finding that pupils have limited
experience of CAL in all subjects with slightly higher frequencies in
science & technology subjects matches data found in the author's 1984 study
and other results quoted by Wellington (1987). Because most pupils lack
experience of meaningful applications of microcomputers at home and in the
general school curriculum, their experiences of microcomputers in Computer
Studies lessons are potentially of great importance.
Analysis of the attitudes toward computers data
Part A of the Pupil Questionnaire contained the CARAQ scales, this
was completed by about half the pupils in each of the 102 classes taking
part in the pupil survey.
Using the returns of these 1163 pupils, the mean, standard deviation
and alpha reliability for each of the eight scales were calculated. The
data in Table 9.5 show the new scale SATISFACTION has comparable values of
standard deviation and alpha reliability to the other scales.
135
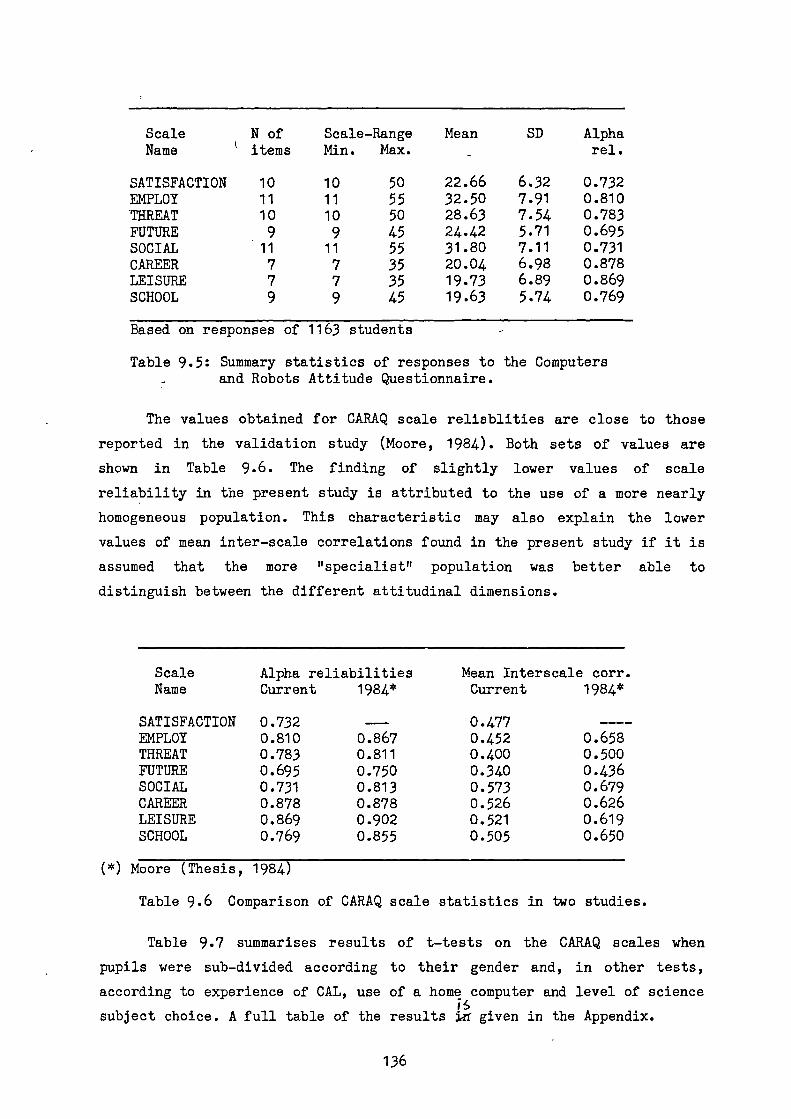
ScaleName
N ofitems
Scale-RangeMin. Max.
Mean SD Alpharel.
SATISFACTION 10 10 50 22.66 6.32 0.732EMPLOY 11 11 55 32.50 7.91 0.810'THREAT 10 10 50 28.63 7.54 0.783FUTURE 9 9 45 24.42 5.71 0.695SOCIAL 11 11 55 31.80 7.11 0.731CAREER 7 7 35 20.04 6.98 0.878LEISURE 7 7 35 19.73 6.89 0.869SCHOOL 9 9 45 19.63 5.74 0.769
Based on responses of 1163 students
Table 9.5: Summary statistics of responses to the Computersand Robots Attitude Questionnaire.
The values obtained for CARAQ scale relisblities are close to those
reported in the validation study (Moore, 1984). Both sets of values are
shown in Table 9.6. The finding of slightly lower values of scale
reliability in the present study is attributed to the use of a more nearly
homogeneous population. This characteristic may also explain the lower
values of mean inter-scale correlations found in the present study if it is
assumed that the more "specialist" population was better able to
distinguish between the different attitudinal dimensions.
Scale Alpha reliabilities Mean Inters cale corr.Name Current 1984* Current 1984*
SATISFACTION 0.732 0.477EMPLOY 0.810 0.867 0.452 0.658THREAT 0.783 0.811 0.400 0.500FUTURE 0.695 0.750 0.340 0.436SOCIAL 0.731 0.813 0.573 0.679CAREER 0.878 0.878 0.526 0.626LEISURE 0.869 0.902 0.521 0.619SCHOOL 0.769 0.855 0.505 0.650
(*) Moore (Thesis, 1984)
Table 9.6 Comparison of CARAQ scale statistics in two studies.
Table 9.7 summarises results of t-tests on the CARAQ scales when
pupils were sub-divided according to their gender and, in other tests,
according to experience of CAL, use of a home computer and level of sciencet6
subject choice. A full table of the results j,:tT given in the Appendix.
136
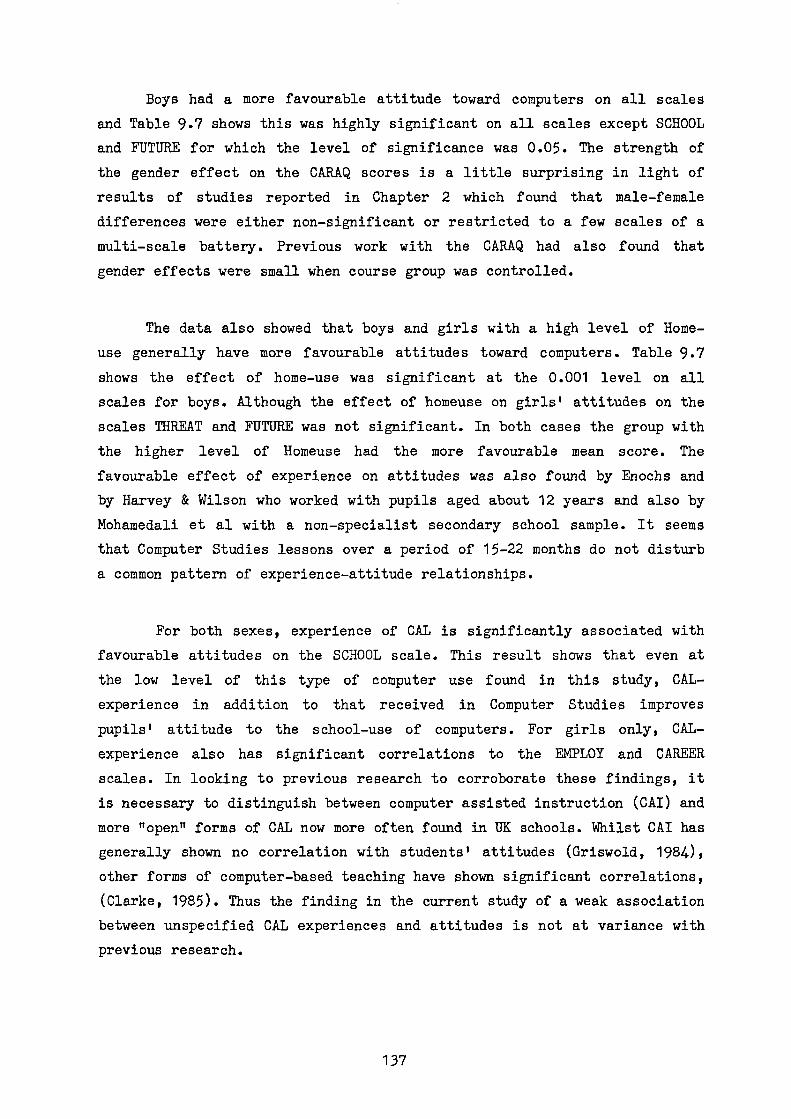
Boys had a more favourable attitude toward computers on all scales
and Table 9.7 shows this was highly significant on all scales except SCHOOLand FUTURE for which the level of significance was 0.05. The strength of
the gender effect on the CARAQ scores is a little surprising in light of
results of studies reported in Chapter 2 which found that male-female
differences were either non-significant or restricted to a few scales of a
multi-scale battery. Previous work with the CARAQ had also found that
gender effects were small when course group was controlled.
The data also showed that boys and girls with a high level of Home-
use generally have more favourable attitudes toward computers. Table 9.7shows the effect of home-use was significant at the 0.001 level on all
scales for boys. Although the effect of homeuse on girls' attitudes on the
scales THREAT and FUTURE was not significant. In both cases the group with
the higher level of Homeuse had the more favourable mean score. The
favourable effect of experience on attitudes was also found by Enochs and
by Harvey & Wilson who worked with pupils aged about 12 years and also by
Mohamedali et al with a non-specialist secondary school sample. It seems
that Computer Studies lessons over a period of 15-22 months do not disturb
a common pattern of experience-attitude relationships.
For both sexes, experience of CAL is significantly associated with
favourable attitudes on the SCHOOL scale. This result shows that even at
the low level of this type of computer use found in this study, CAL-
experience in addition to that received in Computer Studies improves
pupils' attitude to the school-use of computers. For girls only, CAL-
experience also has significant correlations to the EMPLOY and CAREER
scales. In looking to previous research to corroborate these findings, it
is necessary to distinguish between computer assisted instruction (CAI) and
more "open" forms of CAL now more often found in UK schools. Whilst CAI has
generally shown no correlation with students' attitudes (Griswold, 1984),other forms of computer-based teaching have shown significant correlations,
(Clarke, 1985). Thus the finding in the current study of a weak associationbetween unspecified CAL experiences and attitudes is not at variance with
previous research.
137

CARAQ
T-test and Scheffe test results for sample subgroupsScale
GenderG
778 357
Home-use ofBoysHigh/Low625/153
microGirls
High/Low179/178
CAL-experienceBoys GirlsHigh/Low High/Low258/520 107/250
ScienceGrouptest
SATISF. 0.001 0.001 0.01 NS NS 3>2 2>1
EMPLOY 0.001 0.001 0.002 NS 0.001 3>2 2>1
THREAT 0.001 0.001 NS NS NS 3>1 2>1
FUTURE 0.05 0.001 NS NS NS 3>1 2>1
SOCIAL 0.001 0.001 0.005 NS NS 3>2 2>1
CAREER 0.001 0.001 0.001 NS 0.001 3>2 2>1
LEISURE 0.001 0.001 0.001 NS NS 3>2 2>1
SCHOOL 0.05 0.001 0.001 0.01 0.05 3>1 2>1
Note: Scheffe testGroup 1 PupilsGroup 2 PupilsGroup 3 Pupils> indicates "has
CAL ExperienceHigh Exp group
Low Exp group
taking neither Physics nor CDT/TDtaking either Physics or CDT/TD (not both)taking both Physics and CDT/TDa more favourable attitude than"
if at least one reponse of A few times,Quite Often or Very Oftenotherwise
Home-useHigh Use group
Low Use group
Table 9.7 Summary
if Arcade-gamesor Programmingotherwise
= Quite Often or Very Often= Quite Often or Very Often
of results of sub-group tests on CARAQ scales
Table 9.7 also shows the results of an analysis of variance (Scheffe
procedure) of the attitudes of groups formed according to pupils' level of
science & technology study. Three levels of sci-tech study were identified
as (1) No sci-tech, in this group were placed pupils taking neither Physics
nor CDT/TD, (2) Average sci-tech, this group contained pupils taking either
Physics or CDT/TD, (3) High sci-tech, a group of pupils taking both Physics
and CDT/TD. The results show that within the limits imposed by this
conservative test, pupils in the high sci-tech group have the most
138

favourable attitudes whilst "no sci-tech" pupils have the least favourable
attitudes. These results agree with previous results obtained with the
CARAQ mentioned in Chapter 2.
Analysis of the classroom environment data
A total of 1198 Part B booklets containing the ten classroom
environment scales were obtained from the 102 classes involved in this part
of the study. Because of an error in the printing of the Part B booklets
six items were omitted from the classroom environment scales. Three items
were from the scale INNOVATION and one from each ofthe scales INVOLVEMENT,
TASK ORIENTATION and ORDER & ORGANISATION.
N of
Scale-Range Mean SD Alpha Rel.Scale Name items
Min MaxPERSONALISATION 10 10 50 29.65 6.80 0.785PARTICIPATION 10 10 50 30.15 6.31 0.737INDEPENDENCE 10 10 50 31.16 6.04 0.675INVESTIGATION 10 10 50 25.33 5.88 0.746DIFFERENTIATION 10 10 50 23.85 6.45 0.724RESOURCES 10 10 30 22.41 5.08 0.744INVOLVEMENT 9 9 27 17.34 4.89 0.588TASK ORIENTATION 9 9 27 20.55 3.79 0.527ORDER&ORGANISATION 9 9 27 18.50 5.57 0.807INNOVATION 7 7 21 12.35 3.10 0.430
Data is based on responses of 1198 students.
Table 9.8: Summary statistics of responses toClassroom Environment Questionnaire
The mean, standard deviation and alpha reliability values for each
of the ten CE scales are given in Table 9.8. The measured reliability
values range from 0.43 to 0.81 with most values being around 0.7.
Table 9.9. shows that the reliability data obtained for the ICEQ and CES
scales in the current study are very similar to those obtained by Fraser &
Fisher (1983) when the scales were used with 116 classes of Australian
science students aged 14-16 years.
139

The data for the RESOURCES scale are comparable with those of the
other scales; in particular the mean correlation with the other scales
probably justifies treating this scale as a further measure of pupils'
perceptions of the Computer Studies classroom.
Scale NameAlpha ReliabilityCurrent Fraser*
Mean Inter-scale corr.Current Fraser*
PERSONALISATION 0.785 0.82 0.46 0.36PARTICIPATION 0.737 0.78 0.42 0.35INDEPENDENCE 0.675 0.78 0.16 0.16INVESTIGATION 0.746 0.74 0.36 0.32DIFFERENTIATION 0.724 0.72 0.21 0.29RESOURCES 0.744 ---- 0.27 ----INVOLVEMENT 0.588 0.65 0.47 0.43TASK-ORIENTATION 0.527 0.59 0.34 0.33ORDER & ORGANISATION 0.807 0.74 0.45 0.40INNOVATION 0.430 0.52 0.20 0.19
* Fraser, B.J. & Fisher, D.L. (1983), Assessment of Classroom Psychosocial Environment,Western Australia Institute of Technology.
Table 9.9 Comparison of statistics of Classroom Environment scales
Table 9.10 shows that gender differences in perceptions of the
Computer Studies classroom environment were not large. Boys had more
favourable perceptions on the RESOURCES and TASK ORIENTATION scales but
these were significant only at the 0.05 level.
The Table also shows the effects of home-use of a microcomputer on
pupils' perceptions of the classroom environment are different for boys and
girls. For boys, Homeuse increases the level of perception of the
PARTICIPATION and INVOLVEMENT dimensions. For girls, Homeuse is positively
associated with the dimensions of INVESTIGATION, INVOLVEMENT and
INNOVATION.
140
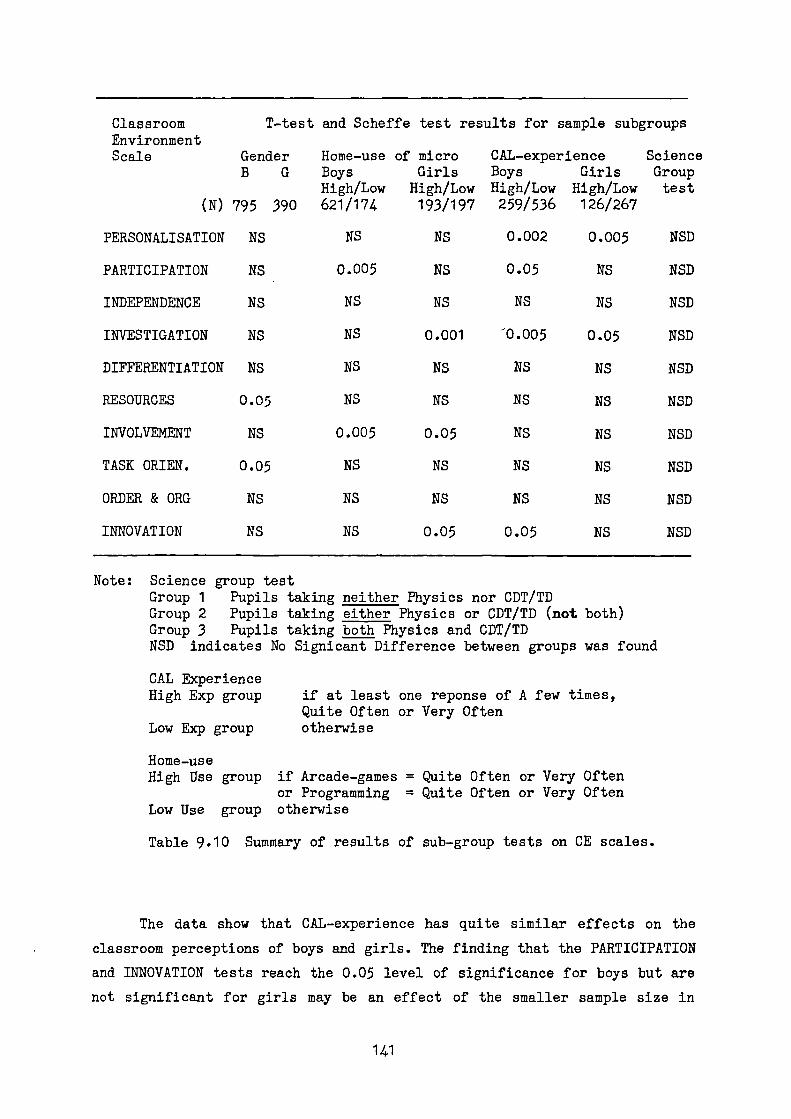
T-test and Scheffe test results for sample subgroupsClassroomEnvironmentScale Gender Home-use of micro
B G Boys GirlsHigh/Low High/Low
CAL-experience
ScienceBoys Girls
GroupHigh/Low High/Low test
(N) 795 390 621/174 193/197 259/536 126/267
PERSONALISATION NS NS NS 0.002 0.005 NSD
PARTICIPATION NS 0.005 NS 0.05 NS NSD
INDEPENDENCE NS NS NS NS NS NSD
INVESTIGATION NS NS 0.001 0.005 0.05 NSD
DIFFERENTIATION NS NS NS NS NS NSD
RESOURCES 0.05 NS NS NS NS NSD
INVOLVEMENT NS 0.005 0.05 NS NS NSD
TASK ORIEN. 0.05 NS NS NS NS NSD
ORDER & ORG NS NS NS NS NS NSD
INNOVATION NS NS 0.05 0.05 NS NSD
Note: Science group testGroup 1 Pupils taking neither Physics nor CDT/TDGroup 2 Pupils taking either Physics or CDT/TD (not both)Group 3 Pupils taking both Physics and CDT/TDNSD indicates No Signicant Difference between groups was found
CAL ExperienceHigh Exp group if at least one reponse of A few times,
Quite Often or Very OftenLow Exp group otherwise
Home-useHigh Use group if Arcade-games = Quite Often or Very Often
or Programming = Quite Often or Very OftenLow Use group otherwise
Table 9.10 Summary of results of sub-group tests on CE scales.
The data show that CAL-experience has quite similar effects on the
classroom perceptions of boys and girls. The finding that the PARTICIPATION
and INNOVATION tests reach the 0.05 level of significance for boys but are
not significant for girls may be an effect of the smaller sample size in
141

the girls' test. Although the differences do not reach the 0.05 level, in
both cases, the group of girls with the higher CAL-experience had the
higher mean scale-score. Table 9.10 also shows the results of Scheffe tests
carried out on the ten scales according to pupils' membership of the
science-technology groups defined above. No discrimination between the
three groups was found by this test. It was concluded that in this sample
and on these ten scales, the choice of science-technology subjects has no
significant association with pupils' perceptions of the Computer Studies
classroom environment.
The data described in this section show pupils' perceptions of the
Computer Studies environment are largely independent of the variables of
gender, home-use of a microcomputer, experience of CAL and the pupil's
choice of science-technology subjects. These are significant results. If
pupils' opinions about Computer Studies lessons are largely independent of
external factors, it may be easier to detect differences arising from
events within lessons.
Analysis of the Anxiety scale data
Word Sign
absorbedambitiousboredcautiouscheatedcontenteddedicatedefficientfearfulhappy -incapablejoyfulmiserableorganisedpleasantpushedrewardedserioustenseupset
Freq
224534266
2629366
191114154028133530248
Word Sign
afraidannoyedcalmchallengedcomfortablecreativedesperateentertainedfortunatehopelessinspiredlazymisplacedoverloadedpleasedrefreshedsatisfiedshakyterrifiedweary
+
Freq
814214930421018171423201117208
35119
18
Word Sign
aimlessawarecarelesscheerfulconfusedcuriousdisappointedexcitedfrightenedimpatientinterestedlovingnervouspanickyproductiveregretfulsecuresteadythoughtfulworried
++
+
Freq
12238
1624281418718547
1715371423233816
Table 9.11 Data from Anxiety questionnaire (Parts A and B responses)
142

Table 9.11 shows the frequency of use of each of the 60 words in the
Anxiety questionnaire. For each pupil, 1 mark was added to the Positive-
Anxiety score each time a (+) word was underlined. One mark was added to
the pupil's Negative-Anxiety score when a (-) word was underlined. Each
pupil's Total-Anxiety score was calculated by the expression
(Total) Anxiety = (Positive-Anxiety) - (Negative-Anxiety) + 10
The table shows a wide range of frequencies of use of the active
words in the list. The highest value is 42% for creative, this is closely
matched by the 38% recorded for thoughtful. Both these are 'negative' words
indicating absence of anxiety. Some positive anxiety words record quite low
frequencies of use; these include fearful (6%), frightened (7%), and
afraid and upset at 8%.
The Anxiety scale differs from many other questionnaires in that
respondents are under little pressure to respond to each word on the list.
Hence if a list is returned with very few words underlined it is not
apparent whether this is a true reflection of the respondent's anxiety or
is the result of lack of attention to the questionnaire. Lack of attention
could arise through time-pressure or the use of an over-long test-battery.
In light of the low frequencies observed for some words in the list,
it is worth considering the effect of extremes of pupil behaviour on the
resulting Anxiety Score. Four types of behaviour can be imagined.
Type 1 A pupil underlines all words in the list. This pupil receives atotal of 11 for Positive-Anxiety from the ten + words, and a score of 10for Negative-Anxiety for the ten - words. The pupil receives an Anxietyscore of 11 - 10 + 10 = 11.
Type 2 A pupil ignores all words. This pupil has an Anxiety Score of 10
Type 3 A pupil underlines only the + words. The Anxiety score is 21.
Type 4 A pupil underlines only the - words. The Anxiety score is zero.
These examples serve to show that the Anxiety scale runs from zero
indicating complete lack of anxiety to 21 1 representing extreme Anxiety.
The scale mean is 10.5 and this is also the score that would be obtained
143

from a random set of responses. Pupils who choose to ignore or to use all
words also receive scores near the scale mean.
Source N Mean SD Max Min KR20
Part A 1135 9.266 3.242 21 0 0.798Part B 1186 9.146 3.356 21 0 0.794
Table 9.12 Summary statistics for Anxiety scale
Table 9.12 gives the range of scores and the mean score for groups of
pupils answering the Anxiety scale in Part A and Part B of the Pupil
Instrument. In both groups the full range of possible scores is obtained
and the observed means are close to the scale mid-point. The scale
reliabilities (KR20 values) are similar to those of other scales in the
pupil instrument. The mean reliability value of almost 0.80 is close to the
value of 0.83 obtained by Fraser et al (1983) working with middle school
science students. The mean score at 9.2 is higher than the 8.3 found by
Fraser et al whilst the value of 3.3 for the current standard deviation
compared with 3.6 is lower. The results may indicate that 16 year olds are
more worried about computers than 14-year olds are about science.
Further analyses of the Anxiety data were carried out on the Part A
and Part B responses combined. T-tests were carried out on the mean scores
of sample groups formed according to gender, home-use of a microcomputer
and CAL-experience. The summary data in Table 9.13 show that boys have a
lower level of Computer Anxiety than girls.
Table 9.13 shows for both boys and girls a higher level of Homeuse is
associated with a lower level of Anxiety. This means that for both genders,
the self-chosen activities of using a computer at home to play games or for
extra programming have significant association with pupils' level of
Computer Anxiety. It is perhaps surprising that this association is
sufficiently strong to be detected in a sample of pupils all of whom have
spent 15-20 months on Computer Studies and when the time spent in home-use
may be quite short.
144

Variable Group N Mean S.D. T-value Sig.
Gender Boys 1574 8.8977 3.378 -6.32 0.001Girls 747 9.8474 3.379
HomeUse High 1246 8.6953 3.304 -11.14 0.001(Boys) Low 327 9.6843 3.135
HomeUse High 372 9.3333 3.376 -4.18 0.001(Girls) Low 375 10.3573 3.307
CAL-Exp High 517 8.7676 3.520 -0.86 NS(Boys) Low 1056 8.9300 3.545
CAL-Exp High 230 9.2304 3.195 -3.28 0.01(Girls) Low 517 10.1219 3.531
Table 9.13 Group comparisons on the Anxiety Scale
The data in Table 9.13 show that for boys experience of CAL is
without much effect on their level of anxiety. In this instance the
additional computer experience gained at school during CAL sessions is not
detectable. For girls, additional CAL experience is associated with reduced
levels of anxiety. The greater effect of CAL on girls' attitudes was noted
previously in the data shown in Table 9.7.
Analysis of the attitude-to-job data
The analysis of the pupils' responses to the 29-scale semantic
differential questionnaire on A Job or Career using a Computer followed the
same pattern as for the teacher data. In the factor analysis of the pupil
data, two factors were found accounting for 22% and 10% of the score
variance. Table 9.14 shows the highest item loadings to the two factors.
145

Scale Descriptors(1) (7)
Mean Factor LoadingsF1 F2
(22%) (10%)
Valuable Worthless 2.6811 0.566Tense Relaxed 3.9725Successful Unsuccessful 2.7654 0.568Involves much Involves noresponsibility responsibility 2.5616 0.419Interesting Boring 3.4371 0.399Unfriendly Friendly 4.3435 -0.345Modern Out-of-data 1.6362 0.563Safe Risky 2.4371 0.534Comfortable Uncomfortable 3.0119 0.528Difficult Easy 3.4070Varied Repetitive 3.8992 0.500Authoritative Participative 2.4977 0.300Well-defined Ill-defined 3.3537 0.396Needs imagination Needs no imagination 3.5282 0.448Necessary Not necessary 3.2961 0.422Unpleasant Pleasant 4.5108 -0.287Requires teamwork No teamwork required 3.7421 0.324Demanding Undemanding 2.9869 0.398Involves many things Involves one thing 2.7713 0.520Requires experience No experience required 2.6984 0.586Practical Theoretical 4.2829Useful Not useful 2.5565 0.569Technical Non-technical 2.6938 0.376Fits with other Does not fit withsubjects other subjects 3.2850 0.410Non-specialised Specialised 5.1643 -0.468Suitable everyone Suitable few only 4.2397Active Passive 4.5485 0.582Healthy Unhealthy 4.6785 0.431Training needed No special training 2.4182 0.596
Sample size 2361
Table 9.14 Summary of pupil responses and factor loadings for semanticdifferential scales "A Job or Career using a Computer"
Factor 1 is an evaluative factor, it includes valuable, modern,
useful, and other value-judgement scales. Factor 2 includes both activity
scales (such as healthy, many things) and potency scales (responsibility,
experience, teamwork). It is worth noticing that although pupils included a
total of 25 scales in the two factors compared with the 19 scales used by
the teachers, the percentage of factored variance was almost the same. Both
groups omitted the scales of Practical/Theoretical, Suitable
Everyone/Suitable for few and Difficult/Easy
146

Statistics for the two JOBSCALES based on the factors are shown in
Table 9.15. On both scales the mean score is less than the scale midpoint
showing that pupils generally have a favourable opinion of a job or career
that requires use of a computer. A similar result was found for the two
Jobscores calculated from the teachers' responses. The reliabilities of the
two jobscales of 0.84 and 0.74 are comparable with those of other scales in
the pupil questionnaire. They are slightly higher than the reliabilities
found for the two teacher jobscales, the difference is attributed to the
greater number of bipolar scales included within each pupil factor.
JOBSCORE1(Factor1)
JOBSCORE2(Factor 2)
N of scales (items) 12 13Scale mid-point 48 52Scale Mean 35.6 41.9Scale stand. devn. 10.9 9.64Alpha reliability 0.84 0.74Inter-scale correlation 0.59
Data from 2361 pupils
Table 9.15 Characteristics of two JOBSCOREs derived frompupil questionnaire "A Job or Career using a Computer"
A t-test was carried out on the JOBSCORE data to discover whether
boys and girls have different conceptions of A Job or Career using a
Computer. The results in Table 9.16 show boys and girls have very different
views of a computer-related career or job when these are measured on the
Evaluative factor (JOBSCORE1) but do not differ significantly in their
views on the Potency & Activity factor (JOBSCORE2).
Variable Group N Means SD T-value Prob.
JOBSCORE1 Boys 778 36.0835 11.227 -3.51 0.000Girls 357 38.5238 10.729
JOBSCORE2 Boys 778 41.7879 9.704 -0.78 0.433Girls 357 42.2549 9.136
Table 9.16 T—test results for JOBSCORES of gender groups
147

Because the CAREER scale of the CARAQ instrument also measures
pupils' ideas about working with a computer, it is of some interest to
examine the correlations between pupils' scores on the two sets of scales.
Table 9.17 shows all the correlations were positive confirming that a more
favourable attitude on each CARAQ scale is associated with a more
favourable concept of a job working with a computer. Generally the
correlations between the JOBSCORES and the CARAQ scales are similar to the
inter-scale correlations of the CARAQ instrument. The confirms that the two
JOBSCORES belong to the same "attitude-space" as the scales of the CARAQ.
The highest correlation in Table 9.17 is between the CAREER and
JOBSCORE1 scales. The observed correlation of 0.671 shows that a fraction
of (0.671)2 = 0.45 of the score variance is common to the two scales. This
confirms that JOBSCORE1 is a valid but alternative measure of pupils'career
aspirations. The CARAQ scale of SATISFACTION has the highest correlation
with the JOBSCORE2 scale, i.e. the Potency-Activity dimension. This is an
understanable association that confirms JOBSCORE2 as an additional attitude
dimension.
Correlations with CARAQ Scales (N = 1161)SAT EMP TER FUT SOC CAR LEI SCH
Jobscore1 616 498 389 347 593 671 609 533Jobscore2 412 247 162 288 351 380 356 352
Decimal points omitted. All correlations were significant p<0.001
Table 9.17 Correlations between Jobscore and CARAQ scales
The Interest in Computer-Studies data
Pupils were asked to complete a two-part item to indicate the level
of their interest in Computer Studies at the time they selected the subject
and how this interest had changed over the period of the course. The first
part of the item asked pupils to indicate their interest in computer
studies at the time they selected their optional subjects. For most pupils
this would have been almost two years previously. For their response,
pupils were asked to select one answer from "Very Keen", "Quite keen",
"Didn't mind", "Not very interested", and "There wasn't another choice".
148
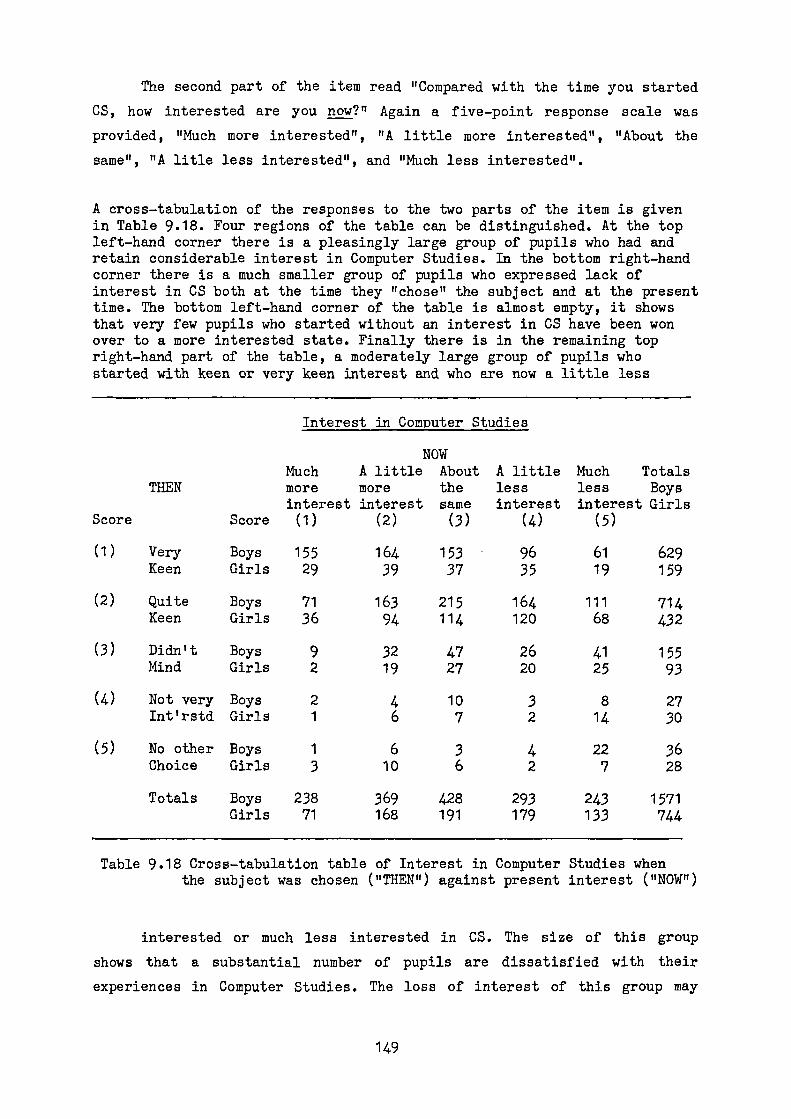
The second part of the item read "Compared with the time you started
CS, how interested are you now?" Again a five-point response scale was
provided, "Much more interested", "A little more interested", "About the
same", "A litle less interested", and "Much less interested".
A cross-tabulation of the responses to the two parts of the item is givenin Table 9.18. Four regions of the table can be distinguished. At the topleft-hand corner there is a pleasingly large group of pupils who had andretain considerable interest in Computer Studies. In the bottom right-handcorner there is a much smaller group of pupils who expressed lack ofinterest in CS both at the time they "chose" the subject and at the presenttime. The bottom left-hand corner of the table is almost empty, it showsthat very few pupils who started without an interest in CS have been wonover to a more interested state. Finally there is in the remaining topright-hand part of the table, a moderately large group of pupils whostarted with keen or very keen interest and who are now a little less
Interest in Computer Studies
NOW
Much A little AboutTHEN more more the
interest interest sameScore Score (1) (2) (3)
A little Much Totalsless less Boysinterest interest Girls
(4) (5)
(1) Very Boys 155 164 153 96 61 629Keen Girls 29 39 37 35 19 159
(2) Quite Boys 71 163 215 164 111 714Keen Girls 36 94 114 120 68 432
(3) Didn't Boys 9 32 47 26 41 155Mind Girls 2 19 27 20 25 93
(4) Not very Boys 2 4 10 3 8 27Int'rstd Girls 1 6 7 2 14 30
(5) No other Boys 1 6 3 4 22 36Choice Girls 3 10 6 2 7 28
Totals Boys 238 369 428 293 243 1571Girls 71 168 191 179 133 744
Table 9.18 Cross-tabulation table of Interest in Computer Studies whenthe subject was chosen ("THEN") against present interest ("NOW")
interested or much less interested in CS. The size of this group
shows that a substantial number of pupils are dissatisfied with their
experiences in Computer Studies. The loss of interest of this group may
149
simply be an expression of the well-known loss in pupils' attitudes to all
subjects as they move through the secondary school. There is however a
possibility that the decline may be linked to one or more of the measured
pupil, classroom or teacher variables.
Summary
Completed questionnaires were obtained from 2300 pupils in 102
classes. Data on the frequency and type of pupils' Homelise of a
microcomputer and experience of CAL at school agreed with data for more
general school populations quoted elsewhere. Descriptive statistics for the
eight CARAQ scales and the ten classroom environment scales indicated they
gave reliable and valid measures of Computer Studies pupils' attitudes and
perceptions. The Anxiety scale and the two JOBSCOREs were also shown to
give valid and reliable assessments of pupils' attitudes.
From the CARAQ scores boys were shown to have more favourable
attitudes toward computers on all scales. Use of a homecomputer and
experience of CAL at school generally improved the attitudes of both boys
and girls though in some instances the differences in the group means were
not significant. For girls only, experience of CAL had a highly signficant
effect on the CAREER scale. On the scale of Computer Anxiety boys had lower
scores than girls. Pupils' perceptions of the classroom environment were
found to be largely independent of gender, Homeuse, CAL-experience and
choice of science subjects.
Analysis of responses to the job questionnaire showed a two factor
structure. On one factor, evaluation, boys had a significantly more
favourable score whilst on the other factor, potency-activity, there was no
gender difference. It was shown that over the time pupils had being taking
Computer Studies a large group of pupiI5 had retained or increased their
initial interest in the subject whilst another moderately large group
showed a decline in interest.
150
CHAPTER 10
THE E.KbECT OF TEACHER AND PUPIL VARIABLES ON PUPILS , ATTITUDES TOWARDCOMPUTERS AND PERCEPTIONS OF THE COMPUTER STUDIES CLASSROOM ENVIRONMENT
Multiple regression analysis
Multiple regression analysis was used to study possible relationships
between teacher, classroom and pupil variables. Multiple regression
analysis seeks to predict one or more criterion variables (here the various
dimensions of pupils' attitudes) on the basis of a number of independent
predictor variables (teacher characteristics, teaching style and pupil
characteristics). Classroom environment variables were criterion variables
in some investigations and predictor variables in others.
All the analyses employed the technique of backward elimination which
commences with all variables included in a trial regression equation that
predicts a value of the criterion variable. Variables not making a
significant contribution to the predicted value of the criterion score
variance are then successively removed from the equation. At each step the
least significant variable is removed until all remaining variables reach
the pre-chosen significance level with the adjusted equation. The
significance of the final regression equation is estimated from the R2
value, the fraction of the criterion variable score that is matched by the
value calculated from the regression equation.
Because the regression equations include the effects of inter-
variable correlations a variable may be omitted from the final regression
equation if it has a high correlation with other variables. If two
predictors are highly correlated with each other, one will necessarily
attract a low importance in the regression equation because some its effect
will be have been included with the other. Interaction effects sometimes
make it difficult to identify the relative importance of variables within
an equation.
Each regression equation is an interdependent structure and it is
necessary to be cautious when attempting to identify the importance of
151

individual predictors within it. In the present study analysis was
limited to identifying the variables included in the equations of several
criterion variables. It is suggested that these are the variables that
should be investigated when considering how attitude changes may be brought
about.
Conversion of variables
Nominal and categoric data were converted to dichotomous (binary)
form before being included in the regression analysis.
Pupils' choice of school subjects was used to generate two
dichotomous variables SCGP (representing science group membership) and
ARTSGP (for arts group membership). The new variables were defined by the
equations
SCGP = 1 if pupil chooses two or more from physics, chemistry, CDT= 2 otherwise
ARTSGP = 1 if pupil chooses two or more from Hist/Geog, Art, DomSci,Craft= 2 otherwise
Pupils' home-use of a micro was also converted to binary form
BHUSE1 = 2 if the home-use of a micro for games was given as Never= 1 otherwise
Variables of BHUSE2, BHUSE3 and BHUSE4 were similarly defined
according to the home-use of a micro for educational games, school work and
programming respectively.
Similarly, pupils' experience of CAL in mathematics, science,
languages, art and crafts were used to define variables, BCAL1, BCAL2,
BCAL3, BCAL4 and BCAL5. A further variable BTCAL (total CAL as a binary
152
variable) was computed to represent total experience of CAL.
BTCAL = 1 if the pupil responded A few times, Quite often, or Very oftento any CAL item
BTCAL = 1 if the pupil gave two or more responses of Occasionally
BTCAL = 2 otherwise
Because the study of Office Practice frequently includes the use of a
word processor, pupils' responses of 0 or 1 to this subject category were
included as a binary variable OFFPR in some of the regression analyses.
The effect of pupil and teacher variables on pupils' attitudes towardcomputers
In these analyses the criterion variables were the pupils' scores on
the eight computer attitude scales of SATISFACTION, EMPLOY, FUTURE, THREAT,
SOCIAL, CAREER, LEISURE and SCHOOL. In each analysis the predictor
variables were teacher and pupil personal characteristics. For the teachers
these were gender and the three canonical discriminant functions CDF1,2,3.
The pupil variables used were gender, subject choice as SCGP, ARTSGP and
OFFPR and the nine binary variables showing use of a home computer and
experience of CAL.
Table 10.1 shows the results of the eight regression analyses, one
for each criterion variable. The table shows a considerable number of
significant correlations between teacher and pupil characteristics and
pupils' scores on the eight attitude scales. The maximum correlation shown
in the table is 0.342 between BHUSE4 (Use of a home-computer for
programming) and the scale LEISURE. The pupil variable BHUSE4 also has
significant values of correlations with all other attitude scales. The CAL-
variables have smaller correlations with the eight criterion variables. The
table also shows that generally the teacher variables have low correlations
with pupils' attitudes.
153

Predictor
Criterion variables: Pupils' attitudes to computers (*)Variables
SAT EMF THR FUT SOC CAR LEI SCH
PSEX 179 200 162 043 147 175 272 060TSEX 013 -005 -016 -021 -017 037 050 037CDF1 073 -028 -017 048 009 043 059 062CDF2 -072 -071 -074 000 -039 007 -024 -060CDF3 058 -044 -015 021 -024 025 015 018BHUSE1 072 124 071 062 067 082 074 070BHUSE2 143 123 093 095 128 190 226 152BHUSE3 220 214 144 131 213 290 316 210BHUSE4BCAL1
280-015
278012
166-014
165021 -01
2497
3111 342033
275017
BCAL2 065 107 046 012 046 067 120 080BCAL3 -083 -060 -037 022 -058 -050 -050 014BcAL4 009 007 006 -003 016 016 001 030BCAL5 013 011 005 020 -008 042 000 063SCGP 220 236 175 081 195 198 252 132ARTSGP 069 119 073 -001 096 118 071 027OFFPR -008 -057 -043 046 -027 -029 021 021BTCAL 043 061 015 031 021 051 048 096
2R2%
' initial eqn 16 15 7 4 12 18 25 12R %, final eqn 15 15 6 4 11 18 24 10
Notes: Decimal points omittedSee text for definitions of variables BHUSE1 to BTCALVariables used in the final regression equation shown in bold(*) Variables are SATISFACTION, EMPLOY, THREAT, FUTURE, SOCIAL,CAREER, LEISURE and SCHOOLN = 1006, correlations with an absolute value > 0.081 aresig. at p < 0.01, correlations >0.062 are sig. at p < 0.05.
Table 10.1 Table of correlations between eight dimensions of pupils'attitudes toward computers and 18 teacher and pupil variables
Table 10.2 shows the variables included in the final regression
equation. Positive (negative) signs are used to indicate that an increase
(decrease) in the predictor variable (LH-side) is associated with a more
(less) favourable attitude on the criterion variable. In the gender rows, a
positive sign indicates male, in the group variables SCGP, ARTSGP, OFFPR
and BTCAL, a + sign indicates membership of that group/subject. A blank in
the table shows the predictor variable is not included in the final
regression equation of the criterion variable.
154
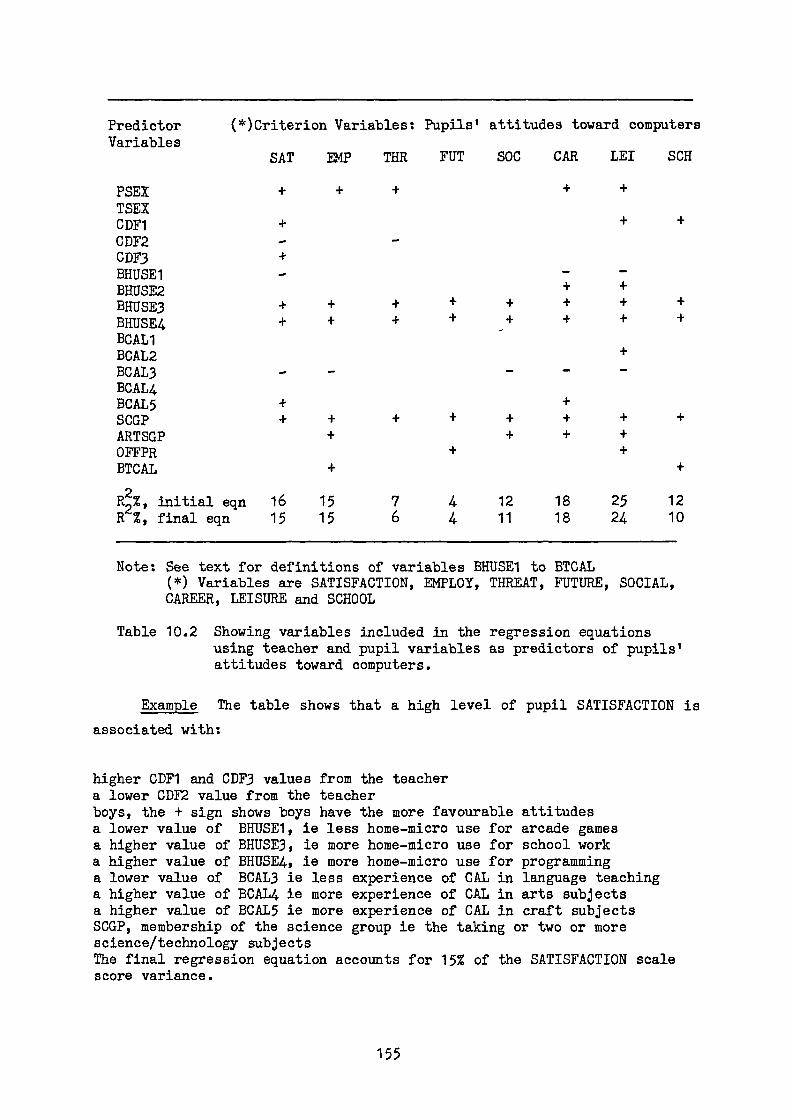
Predictor (*)Criterion Variables: Pupils' attitudes toward computersVariables
SAT EMP THR FUT SOC CAR LEI SCH
PSEX + + + + +TSEXCDF1 + + +CDF2 - -CDF3 +BHUSE1 - - -BHUSE2 + +
BHUSE3 + + + + + + + +
BHUSE4 + + + + + + + +
BCAL1BCAL2 +
BCAL3 - _ _ - -BCAL4BCAL5 + +SCGP + + + + + + + +ARTSGP + + + +OFFPR + +BTCAL + +
2R2%, initial eqn 16 15 7 4 12 18 25 12R %, final eqn 15 15 6 4 11 18 24 10
Note: See text for definitions of variables BHUSE1 to BTCAL(*) Variables are SATISFACTION, EMPLOY, THREAT, FUTURE, SOCIAL,CAREER, LEISURE and SCHOOL
Table 10.2 Showing variables included in the regression equationsusing teacher and pupil variables as predictors of pupils'attitudes toward computers.
Example The table shows that a high level of pupil SATISFACTION is
associated with:
higher CDF1 and CDF3 values from the teachera lower CDP2 value from the teacherboys, the + sign shows boys have the more favourable attitudesa lower value of BHUSE1, ie less home-micro use for arcade gamesa higher value of BHUSE3, ie more home-micro use for school worka higher value of BHUSE4, le more home-micro use for programminga lower value of BCAL3 ie less experience of CAL in language teachinga higher value of BCAL4 le more experience of CAL in arts subjectsa higher value of BCAL5 ie more experience of CAL in craft subjectsSCGP, membership of the science group ie the taking or two or morescience/technology subjectsThe final regression equation accounts for 15% of the SATISFACTION scalescore variance.
155

Some features of Tables 10.1 and 10.2 merit comment.
1. The most significant variables across all eight attitude
dimensions are BHUSE3, BHUSE4 and SCGP as these are included in the final
regression equation of every one of the eight attitude scales. The results
show significant associations between use of a home computer for school
work and for programming, the studying of science and technical subjects
and having favourable attitudes toward computers. The tables of regression
equation data (Appendix) show these variables have the highest weightings
in the final equations. The importance of these three variables was also
noticed in the t-test tables given in Chapter 9.
2. The finding that boys have more favourable attitudes than girls
agrees with previous research on attitudes toward computers. It is however
a little surprising that in the regresion equations of five attitude scales
(SATISFACTION, EMPLOY, THREAT, CAREER and LEISURE) both pupil gender and
science group membership are included. Previous research quoted in
Chapter 2, including that with the CARAQ scales, has shown that pupil
gender is not significant when group membership is controlled. This is not
the case here. Although the inclusion of the variable SCGP in the
regression equation might be expected to take account of group membership,
pupil gender still makes a significant contribution to the prediction.
3. The significance of the inclusion of variable BCAL3 in five
equations is not understood since only 6.4% of pupils report experience of
CAL in languages and the higher percentages of CAL use in science and
mathematics are without equivalent effects.
4. Teacher gender was included in none of the regression equations
predicting pupils' scores on the eight attitude scales. The absence of an
association between gender, a basic teacher variable, and pupils' attitudes
supports the findings of Druva & Anderson (1983) that teacher variables
have only weak or insignificant associations with pupil learning outcomes.
It also justifies the decision not to include a study of other teacher
personal variables in the current research.
156

Teachers' characteristics as measured by the three CDF variables were
found to play only a small part in the determination of pupils' attitudes
other than that of SATISFACTION for which all three CDFs are included in
the regression equation. Pupils' attitudes on this scale are improved if
teachers:
are concerned about their subject and use a wide range of teaching aids(+CDF1)
make use of computer hardware and relatively less use of books andworksheets (-CDF2)
use pupil-centred activities and are concerned about pupils' career andleisure interests (+CDF3).
Pupils have more favourable attitudes on the scale THREAT (i.e. they
feel less threatened by computers) if the teacher has a lower score on
CDF2, i.e. if the teacher makes more use of computer hardware.
The low values of the correlation coefficients shown in Table 10.1
suggest that the CDFs play only a minor part in the regression equations
for pupils' attitudes. This was confirmed by carrying out separate analyses
that excluded these variables. For the scale SATISFACTION the value of R2
fell from 0.14 to 0.13 whilst for the scales THREAT, CAREER and LEISURE it
remained at the same value.
5. The variable ARTSGP (pupil is taking two or more Arts subjects)
was positively correlated with pupils' attitudes toward computers. Thus
ARTSGP is not an opposite of Science Group.
6. The predictive power of the final regression equation varies
across the attitude dimensions, it is not very strong in any case. For the
four scales of THREAT, FUTURE, SOCIAL and SCHOOL the R2
value is at or
below the 10% level, it appears that these dimensions of pupils' attitudes
are only slightly related to the teacher and pupil characteristics
considered here.
157

The effect of teacher and pupil characteristics on pupils' perceptions ofthe computer studies classroom environment
In these analyses the criterion variables were the ten dimensions of
classroom environment whilst the predictor variables were the same 18
teacher and pupil characteristics used in the previous section. The results
of the analyses are shown in Tables 10.3 and 10.4.
(*) Criterion variables: Pupils' classroom perceptionsPredictorVariables RES INV T-0 O&O INN PER - PAR IND VES DIF
PSEX -038 071 -056 049 007 -008 051 036 057 010TSEX 099 050 -114 043 052 010 052 160 -050 130CDF1 057 087 049 142 079 096 039 104 098 039CDF2 -197 030 -017 -073 046 ' 093 041 023 039 119CDF3 026 054 022 045 049 050 054 -082 066 097BHUSE1 061 051 026 034 022 024 075 028 066 030BHUSE2 040 163 091 092 104 110 164 020 190 016BHUSE3 031 143 080 088 108 165 156 073 170 021BHUSE4 043 136 072 105 064 086 151 029 163 075MALI -004 -046 -014 -085 086 046 037 -050 085 043BCAL2 -018 051 -003 042 012 075 069 020 034 001BCAL3 080 011 019 -013 060 027 005 012 042 -014BCAL4 -016 034 -006 033 031 086 050 061 018 031BCAL5 056 058 036 033 074 101 071 -058 117 044SCGP -061 091 -021 057 014 007 059 073 016 -040ARTSGP -028 032 -019 -026 025 -006 029 040 -037 019OFFPR 049 -040 011 009 -026 012 -013 -002 037 -004BTCAL 014 019 -007 -028 078 114 067 -013 100 033
% initialR2
'2 R %, final
66
76
44
66
43
77
66
76
109
76
Notes: Decimal points omittedSee text for definitions of variables BHUSE1 to BTCALVariables used in the final regression equation shown in bold(*) Classroom environment scales are RESOURCES, INVOLVEMENT, TASK-ORIENTATION, ORDER & ORGANISATION, INNOVATION, PERSONALISATION,PARTICIPATION, INDEPENDENCE, INVESTIGATION and DIFFERENTIATIONN = 1031, correlations with an absolute value > 0.081 aresig. at p < 0.01, correlations >0.062 are sig. at p < 0.05.
Table 10.3 Table of correlations between ten dimensions of pupils'classroom environment perceptions and 18 teacher and pupil variables
Table 10.3 shows that most correlations between teacher and pupil
characteristics and perceptions of the classroom environment have a small
value. The maximum value in the table is approximately 0.200 compared with
158

values in excess of 0.3 found in Table 10.1. .In contrast to Table 10.1
Table 10.3 shows that variables associated with the teacher have
correlation values comparable with those of variables measuring pupils' use
of a home computer and their experience of CAL.
Table 10.4 shows only the variables retained in the regression
equations. The signs have the same significance as given for Table 10.2.
(*) Criterion variables: Pupils' classroom perceptionsPredictorVariables RES INV T-0 O&O INN PER PAR IND VES DIF
PSEX - +
TSEX + - + + - +
CDF1 + + + + + + +CDF2 - - + + + +
CDF3 + + + + + _ + +
BHUSE1 +BHUSE2 + + + + + + +
BHUSE3 + + + + + _ +
BHUSE4 + + + + + _
BOAL1 - - + -BOAL2 +BCAL3 +BCAL4 + +
BCAL5 + + + +
SCGP - + + -ARTSGPOFFPRBTCAL + +
R2
'% initial2 R1/4 ' final
66
76
44
66
43
77
66
76
109
762
R %, Ex-CDFs 3 5 3 2.5 3 4.5 5 5 7 2.5
Note: See text for definitions of variables BHUSE1 to BTCALVariables used in the final regression equation shown in bold(*) Classroom environment scales are RESOURCES, INVOLVEMENT, TASK-ORIENTATION, ORDER & ORGANISATION, INNOVATION, PERSONALISATION,PARTICIPATION, INDEPENDENCE, INVESTIGATION and DIFFERENTIATION
Table 10.4 Showing teacher and pupil variables included in theregression equations predicting pupils' perceptions ofthe classroom environment.
159
Example: in the case of the TASK-ORIENTATION scale, Table 10.4 shows
that pupils perceive the classroom as more task-oriented when:
the pupil is femalethe teacher is femalethe teacher has a high CDF1 scorethe pupil makes more use of a home-micro for educational games (BHUSE2)the pupil makes more use of a home-micro for school work (BHUSE3)
These five variables make up the final regression equation; this
equation predicts 4% of the score variance on the TASK-ORIENTATION scale.
Some other features of Tables 10.3 and 10.4 merit comment.
1. One or more variables of Homeuse of a microcomputer is correlated
with each of the classroom environment dimensions. Playing games (BHUSE1)
is the least important home-use variable.
2. The variables BCAL1 (CAL for mathematics)and BCAL5 (CAL for
crafts) are each associated with four classroom environment variables. This
pattern contrasts with that for pupils' attitudes toward computers (Table
10.2) for which only BCAL3 (CAL for languages) was related to several
scales. Although increased use of CAL in mathematics increases pupils'
perception of the level of INNOVATION, it reduces perceived levels of
INVOLVEMENT, ORDER & ORGANISATION, and INDEPENDENCE. The variable BCAL5,
use of CAL in craft subjects, has a positive correlation with four scales.
The difference between the effects of CAL in mathematics and in craft
subjects may be linked to a marked difference in the mode of use of the
resource in these subjects.
3. Pupils' perceptions on the scales of RESOURCES, PARTICIPATION,
INDEPENDENCE and DIFFERENTIATION are increased by male teachers whilst
female teachers are associated with higher perceptions of TASK ORIENTATION
and INVESTIGATION.
4. Teachers who have a high weighting on the composite variable CDF1
are associated with high pupil scores on all but three classroom
160
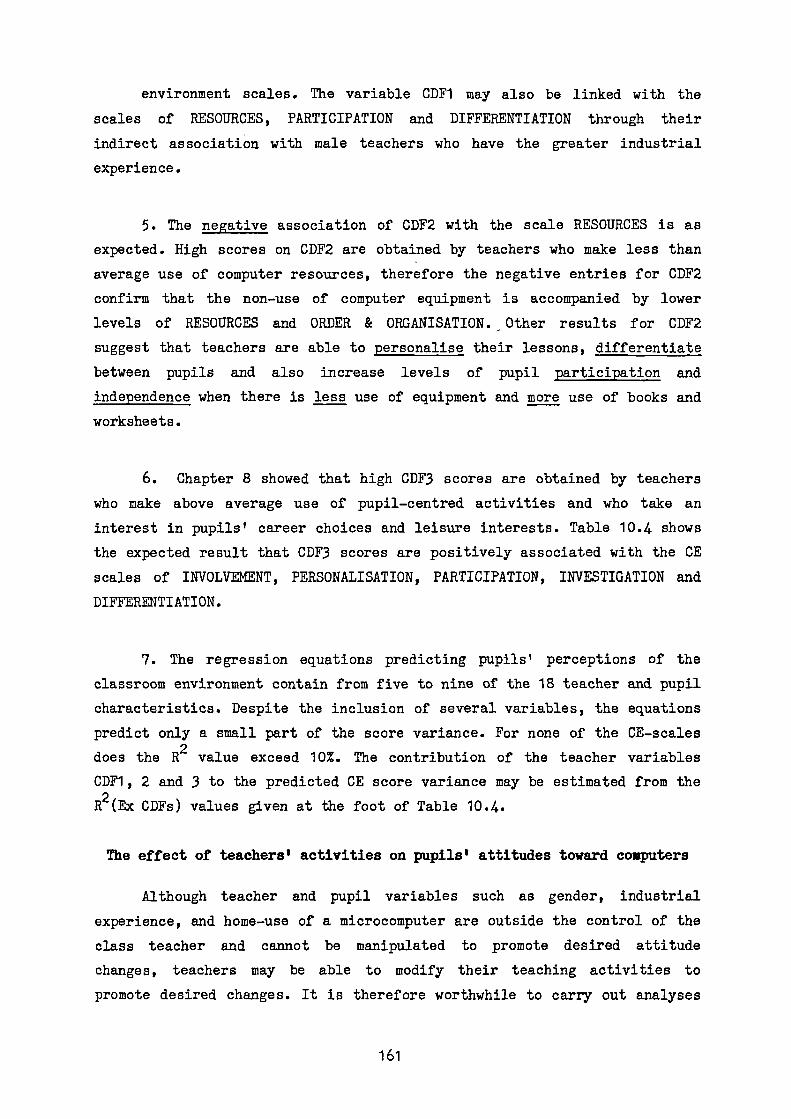
environment scales. The variable CDF1 may also be linked with the
scales of RESOURCES, PARTICIPATION and DIFFERENTIATION through their
indirect association with male teachers who have the greater industrial
experience.
5. The negative association of CDF2 with the scale RESOURCES is as
expected. High scores on CDF2 are obtained by teachers who make less than
average use of computer resources, therefore the negative entries for CDF2
confirm that the non-use of computer equipment is accompanied by lower
levels of RESOURCES and ORDER & ORGANISATION. _Other results for CDF2
suggest that teachers are able to personalise their lessons, differentiate
between pupils and also increase levels of pupil participation and
independence when there is less use of equipment and more use of books and
worksheets.
6. Chapter 8 showed that high CDF3 scores are obtained by teachers
who make above average use of pupil-centred activities and who take an
interest in pupils' career choices and leisure interests. Table 10.4 shows
the expected result that CDF3 scores are positively associated with the CE
scales of INVOLVEMENT, PERSONALISATION, PARTICIPATION, INVESTIGATION and
DIFFERENTIATION.
7. The regression equations predicting pupils' perceptions of the
classroom environment contain from five to nine of the 18 teacher and pupil
characteristics. Despite the inclusion of several variables, the equations
predict only a small part of the score variance. For none of the CE-scales
does the R2 value exceed 10%. The contribution of the teacher variables
CDF1, 2 and 3 to the predicted CE score variance may be estimated from the
R2(Ex CDFs) values given at the foot of Table 10.4.
The effect of teachers' activities on pupils' attitudes toward computers
Although teacher and pupil variables such as gender, industrial
experience, and home-use of a microcomputer are outside the control of the
class teacher and cannot be manipulated to promote desired attitude
changes, teachers may be able to modify their teaching activities to
promote desired changes. It is therefore worthwhile to carry out analyses
161

using teachers' activities as the predictor variables. In these analyses
the criterion variables were the means of the attitude scores for each
class whilst the predictor variables were the 19 Activity-scores of the
individual teachers. The sample size was 102, the number of teachers who
completed a teacher booklet and also allowed one or more of their classes
to answer the pupil questionnaire. A class-level approach is conceptually
correct since all the pupils in a class receive the benefit of the same
teaching activities.
Teachers' Activity
scales SATIS.
Pupils' Attitudes to computers
EMPLOY. THREAT FUTURE SOCIAL CAREER LEISURE SCHOOL
01 Gen.Tch; books -106 -136 -068 -014 -015 -053 017 -046
02 Gen.Tch; notes -011 -081 -021 -044 -033 -059 +048 -040
03 Diffrn of work -004 -181* -074 -023 -096 044 004 028
04 Interest in C/L 131 -082 -196* 318** -055 038 095 085
05 St.controlled exs 044 -128 -132 -077 -106 105 094 -023
06 Ideas from other T 110 -105 -066 072 -024 053 080 161
07 Non-comp AV aids -001 -002 039 -005 085 026 -040 -030
08 Use of micro,networks 140 -092 -084 -018 -030 -085 -012 048
09 Microelectronics 212* 026 274** -057 215* 060 073 026
10 Computer hardware 124 008 087 086 156 111 065 077
11 Worksheet exs -111 -187* -179* 049 -099 -023 054 -077
12 Student involvement 118 099 -056 160 050 118 112 061
13 Student contacts 015 -098 -151 085 -095 -048 007 -009
14 T resource concern 159 028 -027 200* 076 081 083 140
15 Use of CAL packages 171* -132 039 030 035 069 076 132
16 T. does sch admin 196* -075 -008 099 -032 -039 135 173*
17 Use of dp packages 128 -149 -017 023 -013 098 103 094
18 INSET,help other T 214* -011 027 071 085 080 079 205*
19 LOGO, CAD,teletext 048 -151 -107 -018 -025 -030 -019 020
R2 regression equation % 10 15 16 22 7 zero zero 4
Multiple correlation 315 392 400 465 270 000 000 205
F-value of regress. eqn 016 006 i001 i001 024 040
Notes: Decimal points omitted.* significant at p = 0.05, ** p = 0.01 N = 102
Variables retained in the regression equation shown in bold
Table 10.5 Correlations between pupils' attitudes toward computersand teachers' Activity-scale scores.
Tables 10.5 and 10.6 show the results of these analyses. Table 10.5
shows the values of the correlations between teachers' scores on the 19
Teaching Activities and pupils' scores on the eight CARAQ scales. The table
shows that only 14 of the 152 correlations reach the 0.05 level of
162
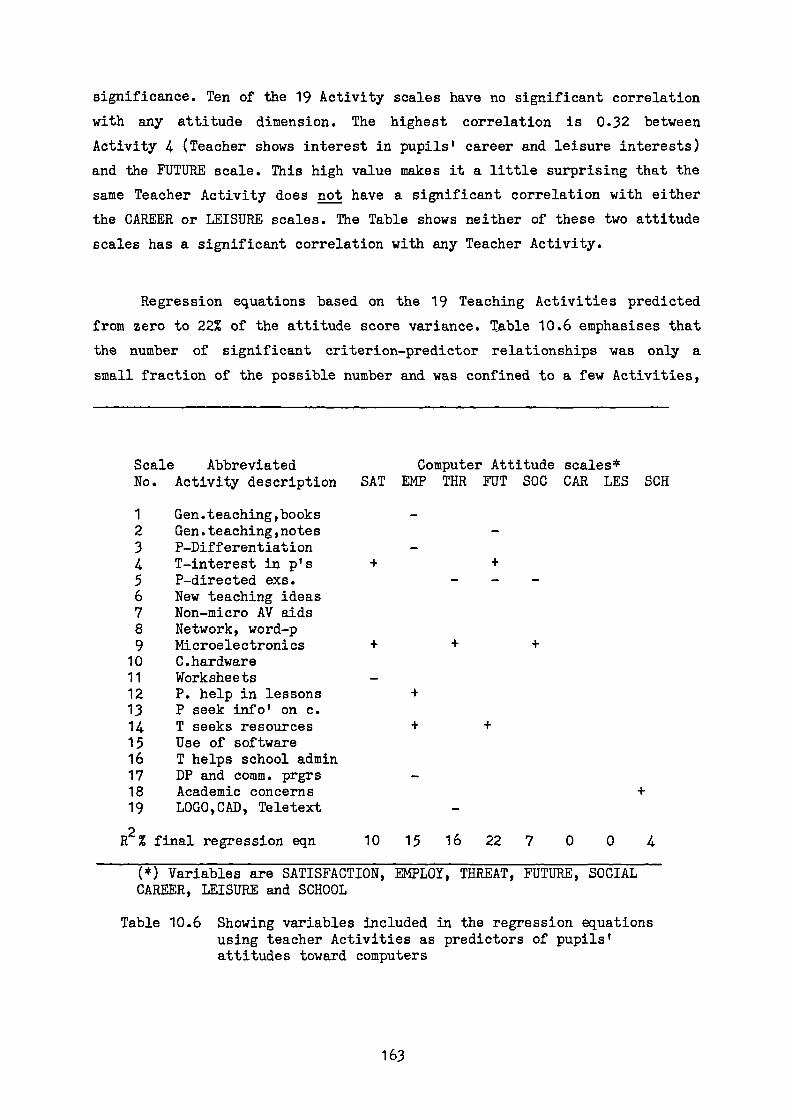
significance. Ten of the 19 Activity scales have no significant correlation
with any attitude dimension. The highest correlation is 0.32 between
Activity 4 (Teacher shows interest in pupils' career and leisure interests)
and the FUTURE scale. This high value makes it a little surprising that the
same Teacher Activity does not have a significant correlation with either
the CAREER or LEISURE scales. The Table shows neither of these two attitude
scales has a significant correlation with any Teacher Activity.
Regression equations based on the 19 Teaching Activities predicted
from zero to 22% of the attitude score variance. Table 10.6 emphasises that
the number of significant criterion-predictor relationships was only a
small fraction of the possible number and was confined to a few Activities,
Scale Abbreviated Computer Attitude scales*No. Activity description SAT EMP THR FUT SOC CAR LES SCH
1 Gen.teaching,books2 Gen.teaching,notes3 P-Differentiation4 T-interest in p's5 P-directed exs.6 New teaching ideas7 Non-micro AV aids8 Network, word-p9 Microelectronics
10 C.hardware11 Worksheets12 P. help in lessons13 P seek info' on c.14 T seeks resources15 Use of software16 T helps school admin17 DP and comm. prgrs18 Academic concerns19 LOGOICAD, Teletext
R2% final regression eqn 10 15 16 22 7 0 0 4
(*) Variables are SATISFACTION, EMPLOY, THREAT, FUTURE, SOCIALCAREER, LEISURE and SCHOOL
Table 10.6 Showing variables included in the regression equationsusing teacher Activities as predictors of pupils'attitudes toward computers
163

only four had significant associations with two or more attitude
dimensions. Two of the four Activities were concerned with use of
resources. The other two, Direction of pupil work and Teacher interest in
pupils, were mentioned as significant in the findings of McGarity & Butts
(1984). The zero R2 value of CAREER and LEISURE shows these two attitudes
are not predictable from the Teachers' Activity scores although they had
the highest percentages of predicted variance when teacher and pupil
personal characteristics were used as the predictors (in Table 10.2). It is
Interesting to notice that the two highest R2 values in Table 10.6 were for
the dimensions of FUTURE and THREAT which showed the lowest values when
teacher and pupil personal characteristics were employed as the predictor
variables (Table 10.2).
The regression equations account for 10% or less of the score
variance on five of the eight attitude dimensions. This agrees with the
finding of Sweitzer & Anderson (1983) that the effects of teachers'
classroom activities on pupil outcomes are small and often insignificant.
The effects of teachers' classroom activities on pupils' perceptions of thecomputer studies classroom environment
The interactions between teachers' activities and pupils' perceptions
of the classroom environment are represented in Tables 10.7 and 10.8.
Table 10.7 shows that Teachers' Activities have 37 significant interactions
with classroom environment variables of the possible number of 190. Two
Activities (Nos 2 and 19) are without a significant correlation and one
classroom environment measure, PARTICIPATION, is related to none of the 19
Teacher Activities. Table 10.8 shows only the interactions of variables
retained in the final regression equation of each classroom perception
scale.
164

Teachers' Activity (*) Classroom environment scales
Scale scores Rsrcs. Invol. TaskOrn Ord&Org Innov Pers. Part. Indep. Inves. Diff.
1 Gen.Tch; books -181* 013 094 -017 -025 -058 -106 002 028 -108
2 Gen.Tch; notes -036 022 032 096 -013 -004 -006 091 138 021
3 Diffrn of work -081 108 -061 021 128 176* 063 133 080 282**
4 Interest in C/L -098 108 024 096 183* 218* 117 004 187* 058
5 St.controlled exs -038 190M 061 164* 228* 221* 162 109 207* 320#*6 Ideas from other T 171* 153 032 141 235#* 148 068 123 100 0917 Non-comp AV aids 175* 175* 207* 261** 051 076 072 017 148 -0168 Use of micro,ntwks 2165* 065 141 169* 257** 118 076 042 184* 0959 Microelectronics 155 119 174* 195* 060 094 094 -0313 185* 00510 Computer hardware 070 123 081 146 181* 112 082 031 25214 11111 Worksheet exs -078 062 064 -010 198* 111 057 020 135 14112 Student involvment-236#* -011 -031 091 020 058 005 092 124 09213 Student contacts -109 -040 -098 001 106 075 -021 201* 019 07314 T resource concern-078 044 093 133 148 136 -006 076 200* 07915 Use of CAL packages178* 074 147 243** 148 168* 050 -092 198* -01416 T. does sch admin 188* -030 004 112 -062 -077 -095 024 -028 00917 Use of dp packages 113 097 086 166* 152 091 041 078 136 00118 INSET,help otherT 143 040 007 174* 010 -061 -036 218* 008 00119 LOGO,CAD,teletext 148 -034 143 096 141 -059 -084 -038 036 -084
R2 reg. equation % 16 9 7 7 19 10 zero 11 6 21
Multiple corr. 398 294 269 261 434 324 000 326 252 461F-value reg. eqn (:)01 030 024 008 001 012 --- 011 011 i001
Notes: Decimal points omitted.* significant at p = 0.05, ** p = 0.01 N = 102Variables retained in the regression equation shown in bold(*) Classroom environment scales are RESOURCES, INVOLVEMENT, TASK-ORIENTATION, ORDER & ORGANISATION, INNOVATION, PERSONALISATION,PARTICIPATION, INDEPENDENCE, INVESTIGATION and DIFFERENTIATION
Table 10.7 Correlations between pupils' classroom environmentperceptions and teachers' Activity-scale scores.
Some of the activity-perception relationships shown in Tables 10.7
and 10.8 agree with prior expectation. For example
Activity No. 1 "use of textbooks" has a negative effect on DIFFERENTIATION
Activity No. 4 "teachers' interest in pupils' careers...effect on PERSONALISATION
Activity No. 5 "use of pupil-directed ..."is positivelyDIFFERENTIATION and INVOLVEMENT
Activity No. 10 "use of hardware..." is associated withINVESTIGATION
' has a positive
associated with
higher levels of
165

Activity No. 13 "pupils seek information for themselves..." is positivelyassociated with INDEPENDENCE and negatively associatedwith TASK ORIENTATION.
This last Activity has a negative association with INVOLVEMENT.
Scale Abbreviated Classroom perception scales*No. Scale description RES INV TO O&O INN PER PAR IND VES DIF
1 Gen.teachinglbooks2 Gen.teaching,notes3 P-Differentiation4 T-interest in p's5 P-directed exs.6 New teaching ideas7 Non-micro AV aids8 Network, word-p9 Microelectronics10 C.hardware11 Worksheets12 P. help in lesson13 P seek info' on c. - _14 T seeks resources15 Use of software16 T helps school admin17 DP and comm. prgrs18 Academic concerns19 LOGO, CAD, Teletext
R2% final regression eqn 16 9 7 7 19 10 0 11 6 21
(*) Classroom environment scales are RESOURCES, INVOLVEMENT, TASK -ORIENTATION, ORDER & ORGANISATION, INNOVATION, PERSONALISATION,PARTICIPATION, INDEPENDENCE, INVESTIGATION and DIFFERENTIATION
Table 10.8: Regression analysis of teacher activity-scale scores aspredictors of pupils' perceptions of the Computer Studiesclassroom environment.
Only a few Teaching Activities were associated with more than one CE
dimension. It is interesting that one of the most significant predictors of
CE scores was Activity No. 7, 'Use of non-micro A-V aids'. This activity
was positively associated with more CE dimensions than any other single
Teaching Activity showing that in Computer Studies classrooms pupils'
attention focuses on non-computer resources, possibly because most schools
are now satisfactorily equipped with computers. The result agrees with the
finding of Ainley (1978) that classroom environment scores were higher in
science classrooms that had more resources.
166
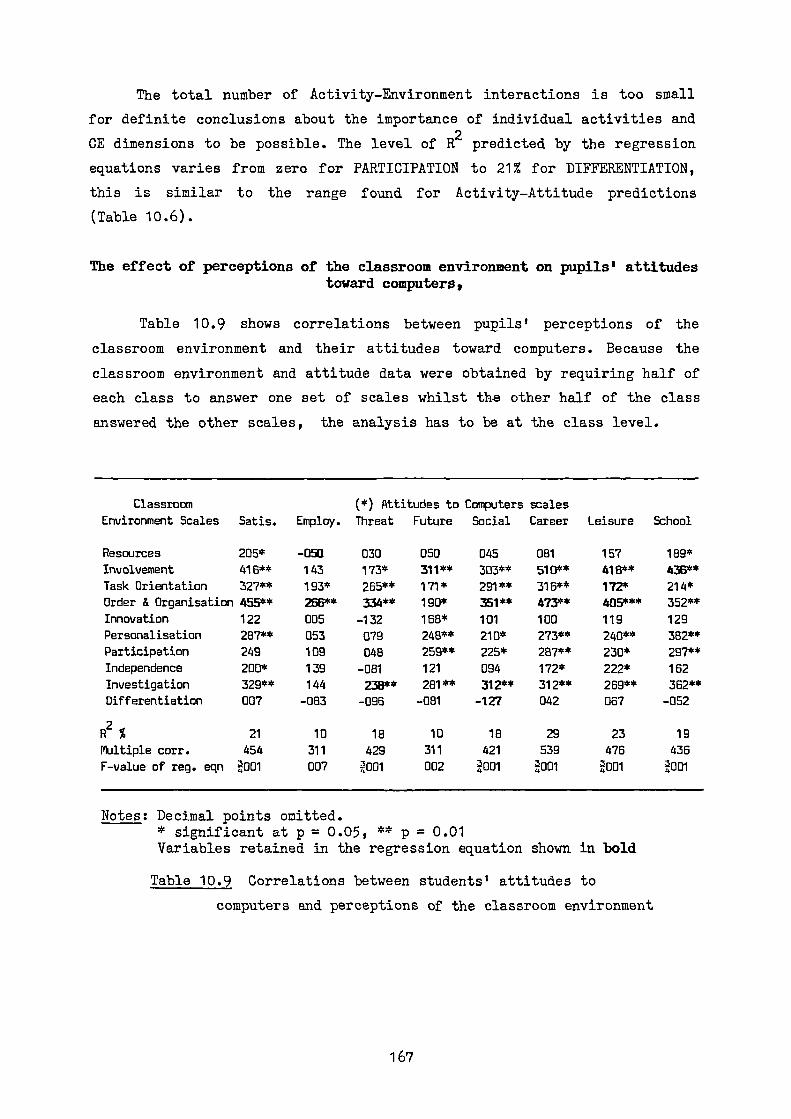
The total number of Activity-Environment interactions is too small
for definite conclusions about the importance of individual activities and
CE dimensions to be possible. The level of R2
predicted by the regression
equations varies from zero for PARTICIPATION to 21% for DIFFERENTIATION,
this is similar to the range found for Activity-Attitude predictions
(Table 10.6).
The effect of perceptions of the classroom environment on pupils' attitudestoward computers,
Table 10.9 shows correlations between pupils' perceptions of the
classroom environment and their attitudes toward computers. Because the
classroom environment and attitude data were obtained by requiring half of
each class to answer one set of scales whilst the other half of the class
answered the other scales, the analysis has to be at the class level.
Classroom
Environment Scales Sat is. Employ.
(*) Attitudes to Computers scales
Threat Future Social Career Leisure School
Resources 205* -050 030 050 045 081 157 189*
Involvement 416** 143 173* 311** 303** 510** 418** 436**
Task Orientation 327** 193* 265** 171* 291** 316** 172* 214*Order & Organisation 455** 266** 334** 190* 351** 473** 405*** 352**
Innovation 122 005 -132 168* 101 100 119 129Personalisation 287** 053 079 248** 210* 273** 240** 382**Participation 249 109 048 259** 225* 287** 230* 297**Independence 200* 139 -081 121 094 172* 222* 162Investigation 329** 144 236** 281** 312** 312** 269** 362**Differentiation 007 -083 -096 -081 -127 042 067 -052
R2
% 21 10 18 10 18 29 23 19
Multiple corr. 454 311 429 311 421 539 476 436
F-value of reg. eqn i001 007 2001 002 2001 i001 P,001 i0D1
Notes: Decimal points omitted.* significant at p = 0.05, ** p = 0.01Variables retained in the regression equation shown in bold
Table 10.9 Correlations between students' attitudes to
computers and perceptions of the classroom environment
167

10.9 are significant at the
with the findings of Ainley
perceptions of the Computer
in the formation of their
confirmed by the alternative
Many of the correlations shown in Table
0.01 or 0.05 level. This suggests, in keeping
(1978) and Talmage & Hart (1977) that pupils'
Studies classroom play a significant part
attitudes toward computers. This impression is
view of the same data shown in Table 10.10.
The R2 values of the final regression
29%, these values are similar to those found
scales and in a meta-analysis by Anderson &
dimensions of CAREER and LEISURE are the most
environment effects.
equations range from 10% to
by Lawrenz (1976b) using LEI
Walberg (1974). The attitude
strongly related to classroom
Classroom Environment Computer Attitude scales*Scales SAT EMP THR FUT SOC CAR LES SCH
ResourcesInvolvementTask-OrientationOrder&Organisation +InnovationPersonalisationParticipationIndependenceInvestigationDifferentiation
2R % final eqn 21 10 18 10 18 29 23 19
(*) Variables are SATISFACTION, EMPLOY, THREAT, FUTURE, SOCIALCAREER, LEISURE and SCHOOL
Table 10.10: Regression analysis of classroom environment scoresas predictors of pupils' attitudes to computers
A feature of the results shown in Table 10.10 is that the variables
of ORDER & ORGANISATION and INVOLVEMENT are included in the regression
equation of several attitude scales. Of the 16 significant interactions
shown in the table, ten involve these variables. The importance of these
two dimensions was implicit in the recommendation by McGarity & Butts
(1984) that, in order to improve learning outcomes, teachers should pay
attention to class management and aim for higher levels of pupil
involvement in classsroom activities.
168
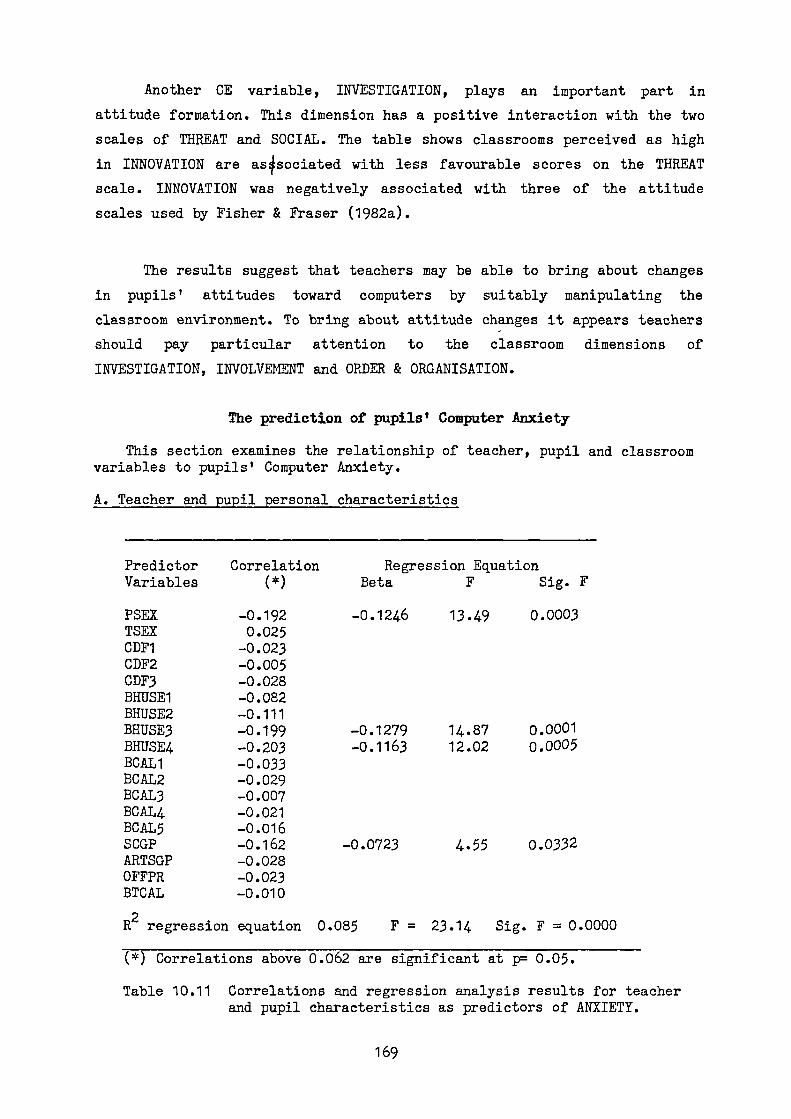
Another CE variable, INVESTIGATION, plays an important part in
attitude formation. This dimension has a positive interaction with the two
scales of THREAT and SOCIAL. The table shows classrooms perceived as high
in INNOVATION are associated with less favourable scores on the THREAT
scale. INNOVATION was negatively associated with three of the attitude
scales used by Fisher & Fraser (1982a).
The results suggest that teachers may be able to bring about changes
in pupils' attitudes toward computers by suitably manipulating the
classroom environment. To bring about attitude changes it appears teachers
should pay particular attention to the classroom dimensions of
INVESTIGATION, INVOLVEMENT and ORDER & ORGANISATION.
The prediction of pupils' Computer Anxiety
This section examines the relationship of teacher, pupil and classroomvariables to pupils' Computer Anxiety.
A. Teacher and pupil personal characteristics
Predictor Correlation Regression EquationVariables (*) Beta F Sig. F
PSEX -0.192 -0.1246 13.49 0.0003TSEX 0.025CDF1 -0.023CDF2 -0.005CDF3 -0.028BHUSE1 -0.082BHUSE2 -0.111BHUSE3 -0.199 -0.1279 14.87 0.0001BHUSE4 -0.203 -0.1163 12.02 0.0005BCAL1 -0.033BCAL2 -0.029BCAL3 -0.007BCAL4 -0.021BCAL5 -0.016SCGP -0.162 -0.0723 4.55 0.0332ARTSGP -0.028OFFPR -0.023BTCAL -0.010
R2 regression equation 0.085 F = 23.14 Sig. F = 0.0000
(*) Correlations above 0.062 are significant at p = 0.05.
Table 10.11 Correlations and regression analysis results for teacherand pupil characteristics as predictors of ANXIETY.
169

(In Table 10.11 a negative correlation indicates that less Anxiety,
le a more favourable state, is associated with an increase in the quantity
of the predictor variable.)
The table shows that lower levels of Anxiety are associated with
males, with the taking of two or more science subjects and higher levels of
home-use of a computer for school-work and programming. No computer
assisted learning variable and no teacher variable was included in the
regression equation for Anxiety and none of the correlations of these
variables reached the 0.05 level of significance.
B. Teacher Activities
Table 10.12 summarises relationships between the 19 Teacher-
Activities and pupil Anxiety. All the correlations between Activities and
Anxiety are of a low value, none reaches the 0.05 significance level.
Predictor Variable
CorrelationTeachers' Activities
(*)
1 General teaching, books -0.0732 General teaching, notes -0.0713 Differentiation of pupil work -0.0574 Interest in p. career leisure -0.0115 Student controlled exercises -0.0156 Use ideas from other teachers -0.0377 Use non-computer AV-aids -0.0288 Use and care of network, micros
0.0929 Microelectronics theory and PW
0.04110 Use of peripherals, comp. h'ware
0.00411 Worksheet-based exercises -0.04312 Student involvement in lessons
0.00413 Students make own contacts
0.12214 Teacher concerned about resources -0.01315 Use of CAL packages -0.03016 Teacher helps comp school admin
0.06017 Use of data-process packages
0.00518 INSET, professional concerns
0.07019 Use of LOGO,CAD, Teletext -0.046
(*) A correlation value of 0.195 is significant at p = 0.05
Table 10.12 Correlations between Teacher-Activitiesand pupil Anxiety
170
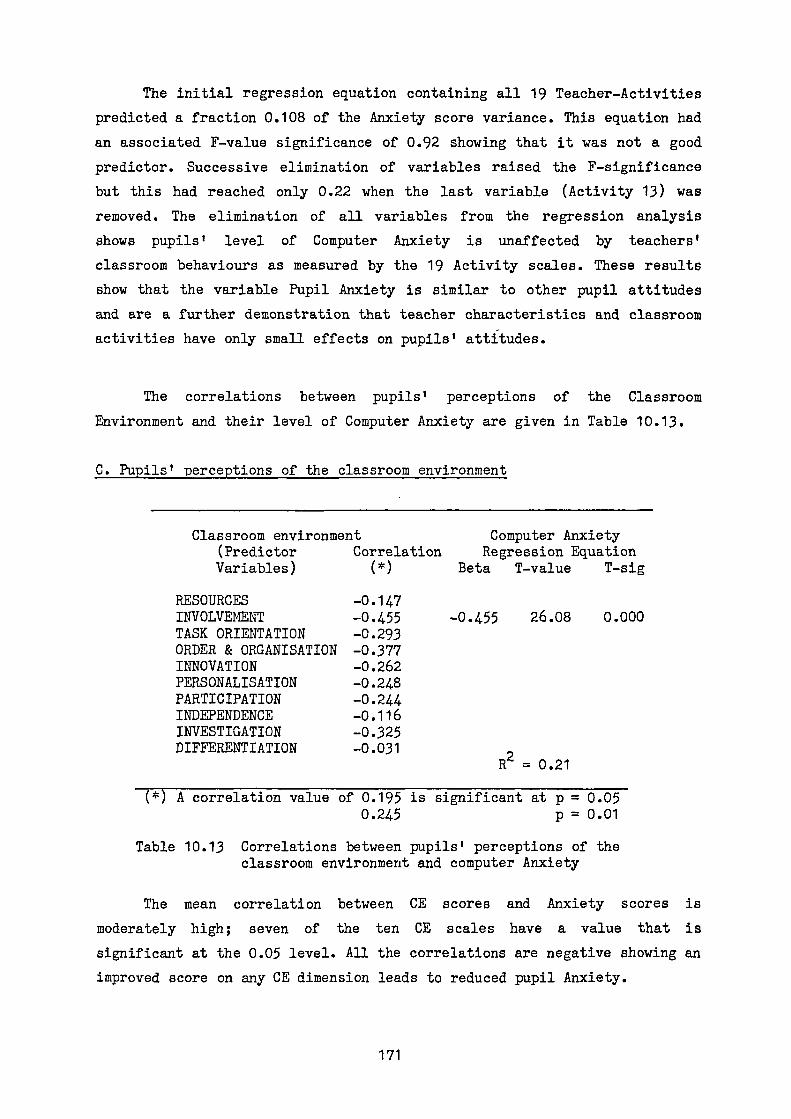
The initial regression equation containing all 19 Teacher-Activities
predicted a fraction 0.108 of the Anxiety score variance. This equation had
an associated F-value significance of 0.92 showing that it was not a good
predictor. Successive elimination of variables raised the F-significance
but this had reached only 0.22 when the last variable (Activity 13) was
removed. The elimination of all variables from the regression analysis
shows pupils' level of Computer Anxiety is unaffected by teachers'
classroom behaviours as measured by the 19 Activity scales. These results
show that the variable Pupil Anxiety is similar to other pupil attitudes
and are a further demonstration that teacher characteristics and classroom
activities have only small effects on pupils' attitudes.
The correlations between pupils' perceptions of the Classroom
Environment and their level of Computer Anxiety are given in Table 10.13.
C. Pupils' perceptions of the classroom environment
Classroom environment Computer Anxiety(Predictor Correlation Regression EquationVariables) (*) Beta T-value T-sig
RESOURCES -0.147INVOLVEMENT -0.455 -0.455 26.08 0.000
TASK ORIENTATION -0.293ORDER & ORGANISATION -0.377INNOVATION -0.262PERSONALISATION -0.248PARTICIPATION -0.244INDEPENDENCE -0.116INVESTIGATION -0.325DIFFERENTIATION -0.031
R2 = 0.21
(*) A correlation value of 0.195 is significant at p = 0.050.245 p = 0.01
Table 10.13 Correlations between pupils' perceptions of theclassroom environment and computer Anxiety
The mean correlation between CE scores and Anxiety scores is
moderately high; seven of the ten CE scales have a value that is
significant at the 0.05 level. All the correlations are negative showing an
improved score on any CE dimension leads to reduced pupil Anxiety.
171
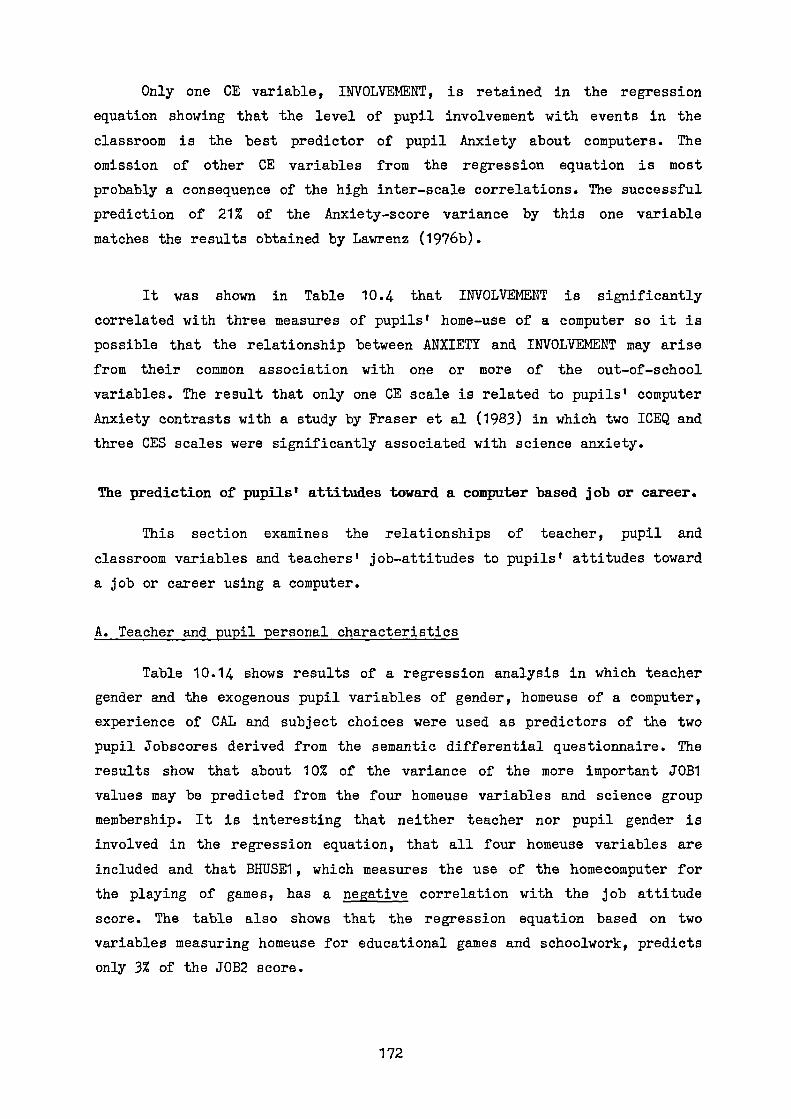
Only one CE variable, INVOLVEMENT, is retained in the regression
equation showing that the level of pupil involvement with events in the
classroom is the best predictor of pupil Anxiety about computers. The
omission of other CE variables from the regression equation is most
probably a consequence of the high inter-scale correlations. The successful
prediction of 21% of the Anxiety-score variance by this one variable
matches the results obtained by Lawrenz (1976b).
It was shown in Table 10.4 that INVOLVEMENT is significantly
correlated with three measures of pupils' home-use of a computer so it is
possible that the relationship between ANXIETY and INVOLVEMENT may arise
from their common association with one or more of the out-of-school
variables. The result that only one CE scale is related to pupils' computer
Anxiety contrasts with a study by Fraser et al (1983) in which two ICEQ and
three CES scales were significantly associated with science anxiety.
The prediction of pupils' attitudes toward a computer based job or career.
This section examines the relationships of teacher, pupil and
classroom variables and teachers' job-attitudes to pupils' attitudes toward
a job or career using a computer.
A. Teacher and pupil personal characteristics
Table 10.14 shows results of a regression analysis in which teacher
gender and the exogenous pupil variables of gender, homeuse of a computer,
experience of CAL and subject choices were used as predictors of the two
pupil Jobscores derived from the semantic differential questionnaire. The
results show that about 10% of the variance of the more important JOB1
values may be predicted from the four homeuse variables and science group
membership. It is interesting that neither teacher nor pupil gender is
involved in the regression equation, that all four homeuse variables are
included and that BHUSE1, which measures the use of the homecomputer for
the playing of games, has a negative correlation with the job attitude
score. The table also shows that the regression equation based on two
variables measuring homeuse for educational games and schoolwork, predicts
only 3% of the JOB2 score.
172

Predictor Correlations(*) Regression Equation P3OB1 Regression Equation P30B2
Variables P3061 P3082 Beta F Sig.F Beta F Sig.F
PSEX 104 027TSEX 017 -013BHUSE1 038 043 -0.064596 4.029 0.0450
BHUSE2 161 136 0.066230 4.163 0.0416 0.109834 11.310 0.0008
BHUSE3 249 121 0.160427 23.047 0.0000 0.087869 7.239 0.0073
BHUSE4 246 110 0.165526 21.547 0.0000
BCAL1 028 -026
BCAL2 075 016
BCAL3 -033 -0346CAL4 035 -027BCAL5 012 012
SCGP 142 007 0.096910 10.117 0.0015
ARTSGP -060 -028OFFPR 000 048
BTCAL 056 008
Regression equation
R2= 0.103 F= 22.9 Sig.F=0.0000 R
2=0.026 F= 13.2 Sig.F= 0.0000
(*) Correlations above 0.062 are significant at p= 0.05, above 0.081 significant at p = 0.01.
Table 10.14 Correlations and regression analysis results for pupil jobscores using teacher
and pupil characteristics as predictors.
B. Teacher Activities
Table 10.15 shows that none of the correlations between the 19
Teacher-Activities and the two pupil jobscores PJOB1 and PJOB2 reaches the
0.05 level of significance. In a regression analysis for PJOB1, the last
remaining variable (Activity 13) was removed when the F-value had reached a
significance level of 0.25, whilst in the corresponding analysis for PJOB2,
the final variable (Activity 4) was removed at an value of 0.067. These
results show that Teachers' Activities cannot be used as predictors of
pupils' attitudes towards a computer-related job.
173
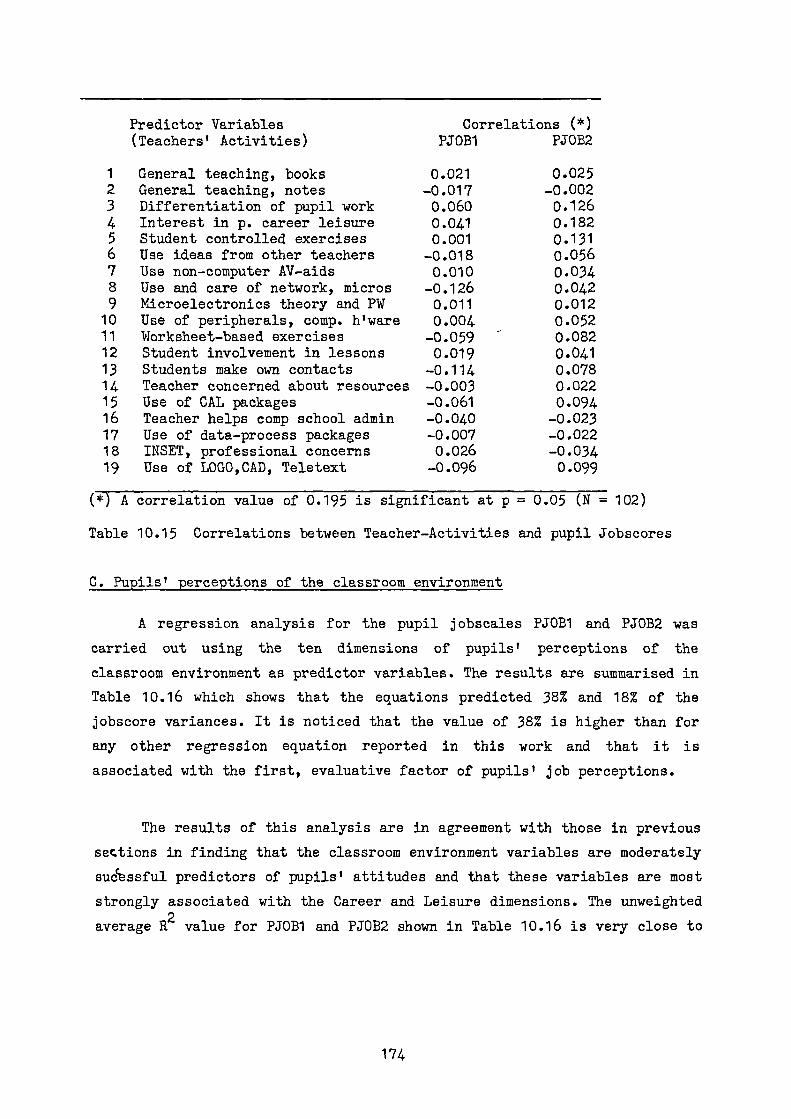
Predictor Variables(Teachers' Activities)
Correlations (*)PJOB1 PJOB2
1 General teaching, books 0.021 0.0252 General teaching, notes -0.017 -0.0023 Differentiation of pupil work 0.060 0.1264 Interest in p. career leisure 0.041 0.1825 Student controlled exercises 0.001 0.1316 Use ideas from other teachers -0.018 0.0567 Use non-computer AV-aids 0.010 0.0348 Use and care of network, micros -0.126 0.0429 Microelectronics theory and PW 0.011 0.012
10 Use of peripherals, comp. h l ware 0.004 0.05211 Worksheet-based exercises -0.059 0.08212 Student involvement in lessons 0.019 0.04113 Students make own contacts -0.114 0.07814 Teacher concerned about resources -0.003 0.02215 Use of CAL packages -0.061 0.09416 Teacher helps comp school admin -0.040 -0.02317 Use of data-process packages -0.007 -0.02218 INSET, professional concerns 0.026 -0.03419 Use of LOGO,CAD, Teletext -0.096 0.099
(*) A correlation value of 0.195 is significant at p = 0.05 (N = 102)
Table 10.15 Correlations between Teacher-Activities and pupil Jobscores
C. Pupils' perceptions of the classroom environment
A regression analysis for the pupil jobscales PJOB1 and PJOB2 was
carried out using the ten dimensions of pupils' perceptions of the
classroom environment as predictor variables. The results are summarised in
Table 10.16 which shows that the equations predicted 38% and 18% of the
jobscore variances. It is noticed that the value of 38% is higher than for
any other regression equation reported in this work and that it is
associated with the first, evaluative factor of pupils' job perceptions.
The results of this analysis are in agreement with those in previous
sections in finding that the classroom environment variables are moderately
sujassful predictors of pupils' attitudes and that these variables are most
strongly associated with the Career and Leisure dimensions. The unweighted
average R2
value for PJOB1 and PJOB2 shown in Table 10.16 is very close to
174

the 29% value shown for the prediction of scores on the CAREER scale
in Table 10.9. These results contrast with the correlation of only 0.04
between teachers' and pupils' attitudes found in a meta-analysis of 11
science studies by Druva and Anderson (1983). The high value obtained in
the current study may be attributed to the pupils' limited knowledge of
computer-based careers compared with a wider knowledge of science and the
work of scientists. In this circumstance pupils are likely to be strongly
influenced by the example given by their own Computer Studies teacher.
Whether or not this explanation is acceptable, the high correlation between
teachers' and pupils' "job" attitudes is the strongest association found
between any dimension of pupils'attitudes and another variable.
Predictor Correlations(*) Regression Equation PJOB1 Regression Equation P3082
Variables P3061 PJOB2 Beta F Sig.F Beta F Sig.F
RESOURCES 165 223
INVOLVEMENT 592 355 0.437577 17.730 0.0001
TASK-ORIENTATION 359 248
ORDER & ORGAN 525 331 0.230177 4.629 0.0339 0.202669 4.022 0.0476
INNOVATION 194 274PERSONALISATION 419 382 0.294438 8.489 0.0044
PARTICIPATION 355 231
INDEPENDENCE 116 -056
INVESTIGATION 460 380
DIFFERENTIATION 051 138
Regression equation
R2= 0.380 F= 30.3 Sig.F=0.0000 R
2=0.180 F= 10.8 Sig.F= 0.0001
Decimal point omitted
(*) N= 102 Correlations above 0.195 are significant at p= 0.05.
Table 10.16 Correlations and regression analysis results for pupil jobscores using pupils'
perceptions of the classroom environment as predictor variables.
D. Teachers' attitudes toward the Job of a Computer Studies teacher
The Pearson product-moment correlation coefficients between the
teachers' Jobscores and the pupils' Jobscores are shown in Table 10.16. All
values reach the 0.001 level of significance. The highest pupil-teacher
correlations are between "matching" Jobscores.
175
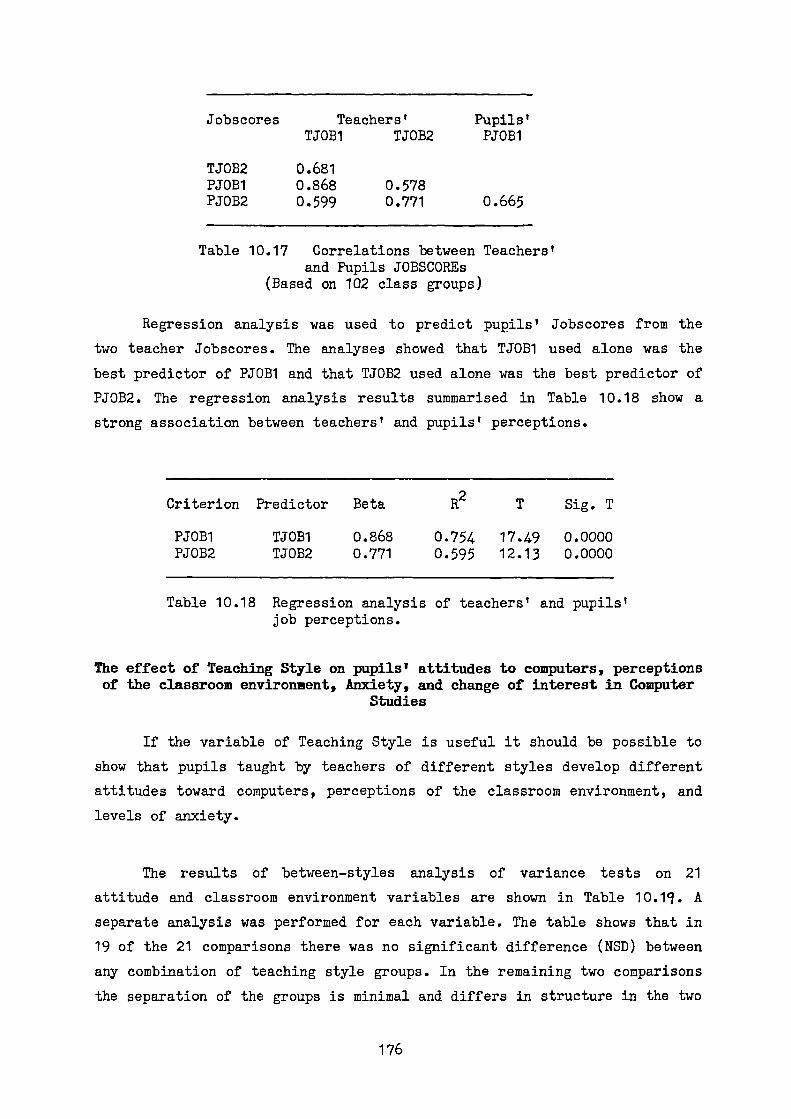
Jobscores Teachers' Pupils'TJOB1 TJOB2 PJOB1
TJOB2 0.681PJOB1 0.868 0.578PJOB2 0.599 0.771 0.665
Table 10.17 Correlations between Teachers'and Pupils JOBSCOREs
(Based on 102 class groups)
Regression analysis was used to predict pupils' Jobscores from the
two teacher Jobscores. The analyses showed that TJOB1 used alone was the
best predictor of PJOB1 and that TJOB2 used alone was the best predictor of
PJOB2. The regression analysis results summarised in Table 10.18 show a
strong association between teachers' and pupils' perceptions.
Criterion Predictor Beta R2
T Sig. T
PJOB1 TJOB1 0.868 0.754 17.49 0.0000PJOB2 TJOB2 0.771 0.595 12.13 0.0000
Table 10.18 Regression analysis of teachers' and pupils'job perceptions.
The effect of Teaching Style on pupils' attitudes to computers, perceptionsof the classroom environment, Anxiety, and change of interest in Computer
Studies
If the variable of Teaching Style is useful it should be possible to
show that pupils taught by teachers of different styles develop different
attitudes toward computers, perceptions of the classroom environment, and
levels of anxiety.
The results of between-styles analysis of variance tests on 21
attitude and classroom environment variables are shown in Table 10.15. A
separate analysis was performed for each variable. The table shows that in
19 of the 21 comparisons there was no significant difference (NSD) between
any combination of teaching style groups. In the remaining two comparisons
the separation of the groups is minimal and differs in structure in the two
176

Variable
Teaching Style Group Means
Gp.1 Gp.2 Gp.3 Gp.4 Gp.5
Test results(Oneway,
Scheffe)
RESOURCES 23.48 22.13 22.66 20.66 23.61 (2+3+1+5)>(4+2+3)
INVOLVEMENT 17.86 17.35 17.35 17.14 16.45 NSD
TASK-ORIENTATION 20.79 20.95 19.55 21.05 19.85 NSD
ORD & ORGANISATION 19.67 19.25 17.92 17.68 17.49 NSD
INNOVATION 12.58 12.42 13.36 12.14 11.31 NSD
PERSONALISATION 30.36 30.21 30.24 29.86 27.21 NSD
PARTICIPATION 31.14 29.83 30.58 29.87 28.96 NSD
INDEPENDENCE 31.96 31.59 32.53 30.21 31.34 NSD
INVESTIGATION 25.97 25.60 27.27 24.89 23.18 (4+2+1+3)>(54.44-2)
DIFFERENTIATION 23.83 24.09 27.73 23.13 22.37 NSD
SATISFACTION 22.08 22.26 23.76 23.20 23.04 NSD
EMPLOY 32.11 32.73 32.43 32.37 32.05 NSD
THREAT 28.38 28.31 29.95 28.53 28.35 NSD
FUTURE 24.39 24.03 24.20 24.97 24.10 NSD
SOCIAL 31.42 31.06 32.08 31.84 31.28 NSD
CAREER 19.64 19.83 20.28 19.85 20.52 NSD
LEISURE 19.65 19.40 19.98 20.36 19.95 NSD
SCHOOL 19.06 19.23 20.69 20.01 19.68 NSD
ANXIETY 9.209 9.137 9.506 9.155 9.231 NSD
JOBSC1 35.17 35.88 35.23 35.14 35.66 NSD
JOBSC2 41.50 41.57 41.40 41.67 42.65 NSD
Table 10.19 Results of Scheffe test carried out on means ofpupils' classroom environment, attitudes toward computers,anxiety and jobscores of groups taught by five different styles
cases. It is thought likely these two isolated and rather different
177

effects are random and can therefore be set aside. On this
assumption, it is concluded that Teaching Style has no effect on pupils'
attitudes toward computers, perceptions of the classroom environment, level
of anxiety and attitude toward a computer-based job.
The SATISFACTION scale also failed to show any association with
Teaching Style possibly because the combination of CDFs included in the
regression equation for this scale in Table 10.2 (CDF1 +ve, CDF2 -ve, and
CDF3 +ve) corresponds to none of the five Teaching Styles shown in
Table 8.13.
As described in Chapter 9, pupils were assigned to one of fourTHEN/NOW groups according to their interest in Computer Studies at the
start of the course and its subsequent change. The groups were:
Group 1: High initial level which has been maintainedGroup 2: Low initial level which has been maintainedGroup 3: High initial level changing to a lower level laterGroup 4: Low initial level changing to a higher level later
THEN-NOWGROUP(*)
Gp.1
Teaching Style Group
Gp.2 Gp.3 Gp.4 Gp.5
RowTotal
1 522 246 70 242 137 1217
2 32 11 6 19 11 79
3 292 130 37 136 115 710
4 10 4 0 10 2 26
Column Totals 856 391 113 407 265 2032
Chi2 = 13.5, d.f. = 12, Significance = 0.33
(*) THEN-NOW groups were as in the text above.
Table 10.20 Chi-square test of crosstabulation of Teaching Stylegroup against pupils' interest pattern.
178
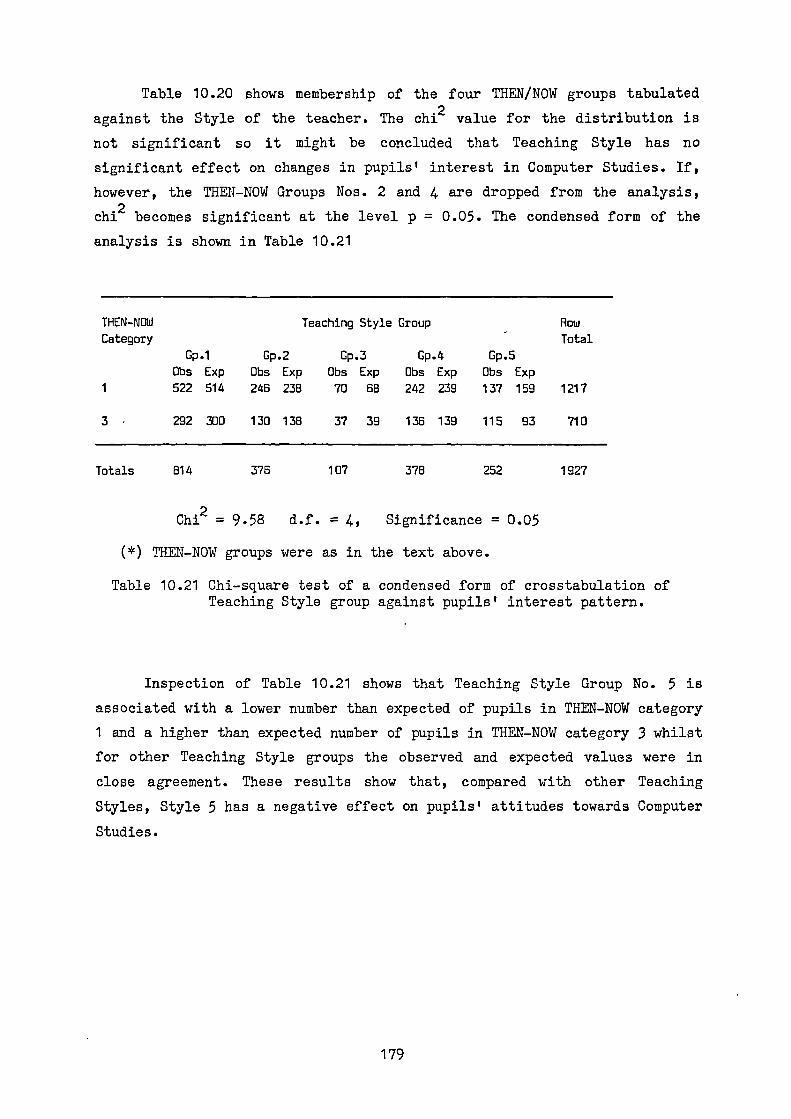
Table 10.20 shows membership of the four THEN/NOW groups tabulated
against the Style of the teacher. The chi2 value for the distribution is
not significant so it might be concluded that Teaching Style has no
significant effect on changes in pupils' interest in Computer Studies. If,
however, the THEN-NOW Groups Nos. 2 and 4 are dropped from the analysis,.
ch2i becomes significant at the level p = 0.05. The condensed form of the
analysis is shown in Table 10.21
THEN-NOW
Teaching Style Group
Row
Category
Total
Gp.1
Obs Exp
Gp.2
Obs Exp
Gp.3
Obs Exp
Gp.4
Obs Exp
Gp.5
Obs Exp
1 522 514 246 238 70 68 242 239 137 159 1217
3 292 300 130 138 37 39 136 139 115 93 710
Totals 814 376 107 378 252 1927
Chi2 = 9.58 d.f. = 4, Significance = 0.05
(*) THEN-NOW groups were as in the text above.
Table 10.21 Chi-square test of a condensed form of crosstabulation ofTeaching Style group against pupils' interest pattern.
Inspection of Table 10.21 shows that Teaching Style Group No. 5 is
associated with a lower number than expected of pupils in THEN-NOW category
1 and a higher than expected number of pupils in THEN-NOW category 3 whilst
for other Teaching Style groups the observed and expected values were in
close agreement. These results show that, compared with other Teaching
Styles, Style 5 has a negative effect on pupils' attitudes towards Computer
Studies.
179
Discussion
Seven conclusions follow from the analyses described in this chapter:
1. Pupils' attitudes toward computers as measured by the CARAQ scales
are moderately related to pupil personal characteristics of gender, homeuse
of a computer and choice of science subjects. These attitudes are not
related to the gender of the teacher. The attitude scales of CAREER and
LEISURE show the strongest associations with the pupil personal
characteristics.
2. Pupils' perceptions of the classroom environment are significantly
related to many of the pupil and teacher personal characteristics included
in the study. The percentage of the classroom environment score variance
predicted by regression based on these characteristics is, however, only
about 10%.
3. A small number of the 19 Teacher Activities are significantly
associated with pupils' attitudes toward computers. The scales of THREAT
and FUTURE show the strongest associations with Teacher Activities whilst
the scales of CAREER and LEISURE have no association. Similar results were
found for the relationships between Teacher Activities and pupils'
perceptions of the classroom environment. Only a small number of Activities
were included in the regression equations, these predicted maximum levels
of CE score variance for the scales of INNOVATION and DIFFERENTIATION but
none of the variance for the scale PARTICIPATION.
4. Pupils' perceptions of the classroom environment were found to be
moderately good predictors of their attitudes toward computers. The average
score variance predicted by the regression equations was 18% with the
scales of CAREER and LEISURE showing the highest values of 29% and 20%.
5. The scale of ANXIETY and the two JOBSCOREs showed associations
similar to those shown by the CARAQ scales. Scores on the ANXIETY scale
were significantly related to pupil personal characteristics of gender,
180
homeuse of a computer and choice of science subjects, were not
related to Teacher Activities and to only the INVOLVEMENT scale of the
classroom environment measures. The two JOBSCOREs showed the same pattern
of associations with the pupil personal characteristics and Teacher
Activities but interacted with a total of three CE scales.
6. Three canonical discriminant functions (CDFs) derived from
teachers' checklist reponses predicted a significant amount of the attitude
score variance only for the SATISFACTION scale. The CDFs interacted with
all ten CE scales but predicted substantial portions of the variance for
only the scales RESOURCES, ORDER & ORGANISATION, PERSONALISATION and
DIFFERENTIATION.
7. The global construct Teaching Style was not significantly
associated with pupils' attitudes toward computers, their perceptions of
the Computer Studies classroom environment, level of Computer Anxiety nor
perceptions of a job or career using a computer. The most negative Teaching
Style was associated with a larger than expected number of pupils whose
attitudes to Computer Studies had declined.
In terms of the model given in Chapter 3, pupils' attitudes,
perceptions of the classroom environment and teacher activity variables
interact as shown in Figure 10.1. The diagram is unable to show that
although pupils' CE perceptions and teachers' activities have approximately
the same mean effect on pupils' attitudes toward computers, the variables
in these two groups interact most strongly with different attitude
dimensions.
One of the objectives of the study was to determine the suitability
of some classroom environment scales for use in Computer Studies. In this
chapter it has been shown that two CE scales, PARTICIPATION and
INDEPENDENCE, were used in none of the regression equations predicting
pupils' attitudes from CE perceptions. The scales PERSONALISATION and
DIFFERENTIATION were each used in only one regression equation. Since all
four of these scales come from the ICEQ instrument, it appears that the
ICEQ is not particularly suitable for use in Computer Studies classrooms.
181
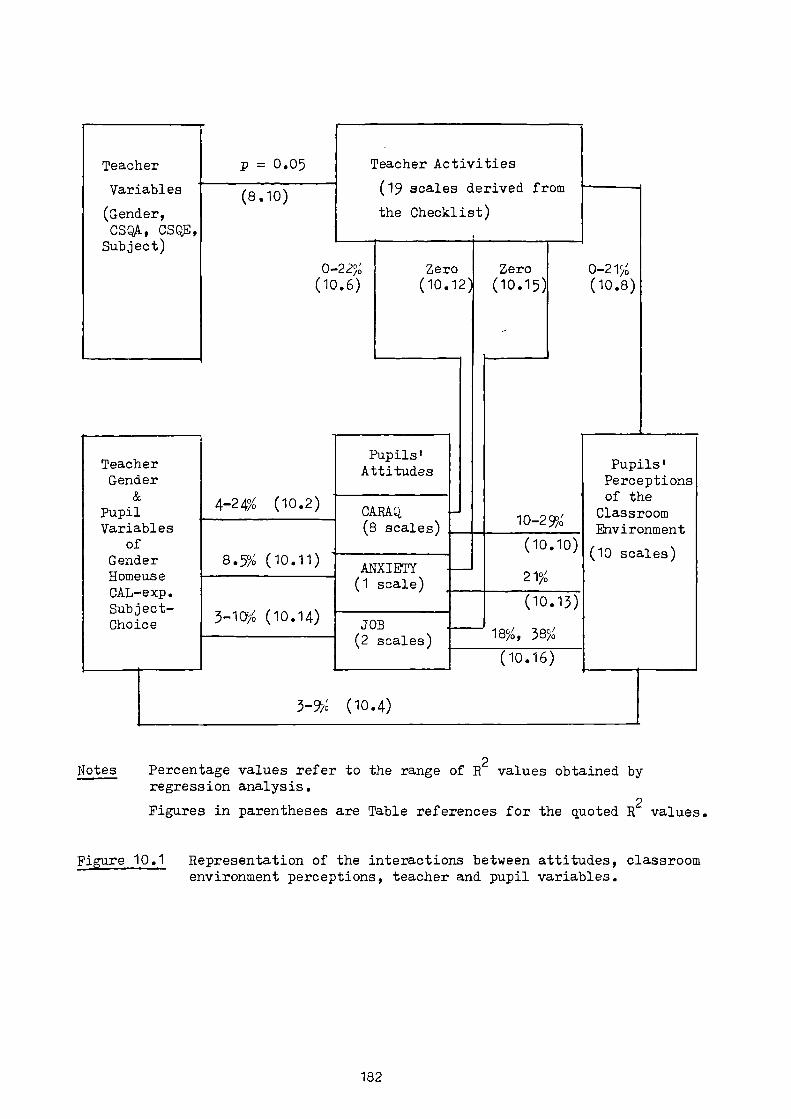
TeacherGender
PupilVariables
ofGenderHomeuseCAL-exp.Subject-Choice
4-2 4% (10.2
8.5% (10.11)
-10% (10.14)
Pupils/Attitudes
CARAQ(8 scales)
ANXIETY(1 scale)
JOB(2 scales)
Teacher
Variables
(Gender,CSQA, CSQE,
Subject)
Teacher Activities
(19 scales derived from
the Checklist)
0-22% Zero Zero 0-21%(10.6) (10.12 (10.15) (10.8)
p = 0.05
(8.10)
Pupils/Perceptionsof the
ClassroomEnvironment
(10 scales)
--- 18%, 38%
(10.16)
3-9 (10.4)
Notes Percentage values refer to the range of R2 values obtained by
regression analysis.
Figures in parentheses are Table references for the quoted R2 values.
Figure 10.1 Representation of the interactions between attitudes, classroomenvironment perceptions, teacher and pupil variables.
10-29%
182

CHAPTER 11
THE DIARY STUDY
Aims of the Diary Study
The Diary Study, a survey of Computer Studies lessons, was based on
use of the Lesson Diary Report Form (LDRF) described in Chapter 6. The aims
of the survey were:
1. To demonstrate that the Lesson Diary Report Form can be used to
collect significant and reliable data about the teaching of Computer
Studies to pupils most of whom were studying for examinations at age 16+.
2. To discover whether the format or content of Computer Studies
lessons are affected by teacher variables including teacher-training and
teaching-experience.
3. To discover whether Computer Studies lessons vary in format or
content according to the ability of the pupils.
The teacher sample
The Teacher Booklet included an invitation to interested teachers to
take part in a Diary Study of Computer Studies teaching. Two copies of the
Diary Booklet were sent to 84 teachers who responded to this invitation.
Each Diary Booklet consisted of seven LDRFs together with a cover sheet for
recording some basic information about the class and the teacher. A total
of 61 teachers (47M, 14F) returned 96 Diary Booklets. Individual teachers
recorded from 6 to 14 lessons of the total of 692 lessons. Data on the
Diary Study teacher sample are shown in Tables 11.1 to 11.5
183

Total TeachingExperience NT (%) NT (%) CSS *(%)0 - 2 years 3 5 35 5 53 - 5 years 7 1 90 13 136 -10 years 16 27 169 24 3211+ years 35 57 400 58 46
Legend: NT = Number of teachers NT. = Number of lessons* CSS Comparative data from the Checklist Study Sample of 253 teachers
Table 11.1 Teaching Experience of Diary Study teacher sample
CS-TeachingExperience N
T(%) NT (%) *CSS (%)
0 - 2 8gyears 8 13 13 83 - 5 years 30 49 334 48 516 -10 years 15 25 175 25 2611+ years 8 13 95 14 10
Legend: NT = Number of teachers NL = Number of lessons* CSS Comparative data from Checklist Study sample of 253 teachers.
Table 11.2 CS-Teaching Experience of Diary Study teacher sample
Table 11.1 shows over half the teachers taking part in the Diary
Study had 11 or more years of teaching experience. Experience of teaching
Computer Studies (Table 11.2) was more limited, half the teacher sample
having five years or less teaching experience in the subject.
IndustrialExperience NT (%) NT (%) *CSS (%)None 48 79 53Z 76 790 - 2 years 5 8 63 9 93 - 5 years 5 8 77 11 )6 -10 years 1 2 7 1 ) 1211+ years 2 3 21 3 )
Legend: Nm = Number of teachers N Number of lessons* CSS Comparative data from Checklist gtudy sample of 253 teachers.
Table 11.3 Industrial Experience of Diary Study teacher sample
184
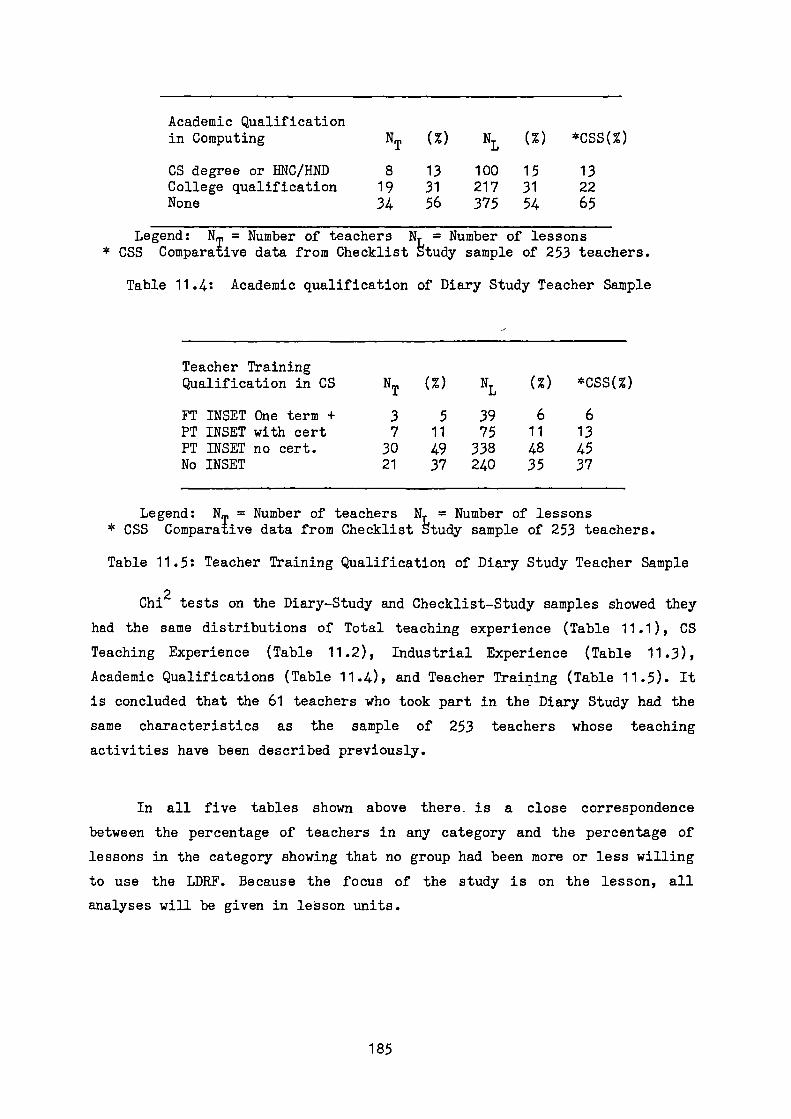
Academic Qualificationin Computing NT (%) N (%) *CSS(%)
CS degree or HNC/HND 8 13 100 15 13College qualification 19 31 217 31 22None 34 56 375 54 65
Legend: Nm = Number of teachers NT. = Number of lessons* CSS Comparative data from Checklist Study sample of 253 teachers.
Table 11.4: Academic qualification of Diary Study Teacher Sample
Teacher TrainingQualification in CS N
T(%) N
L (%) *CSS(%)
FT INSET One term + 3 5 39 6 6PT INSET with cert 7 11 75 11 13PT INSET no cert. 30 49 338 48 45No INSET 21 37 240 35 37
Legend: Nm = Number of teachers NT = Number of lessons* CSS Comparative data from Checklist Study sample of 253 teachers.
Table 11.5: Teacher Training Qualification of Diary Study Teacher Sample
.Ch
2i tests on the Diary-Study and Checklist-Study samples showed they
had the same distributions of Total teaching experience (Table 11.1), CS
Teaching Experience (Table 11.2), Industrial Experience (Table 11.3),
Academic Qualifications (Table 11.4), and Teacher Training (Table 11.5). It
is concluded that the 61 teachers who took part in the Diary Study had the
same characteristics as the sample of 253 teachers whose teaching
activities have been described previously.
In all five tables shown above there. is a close correspondence
between the percentage of teachers in any category and the percentage of
lessons in the category showing that no group had been more or less willing
to use the LDRF. Because the focus of the study is on the lesson, all
analyses will be given in lesson units.
185

The pupil sample
Table 11.6 summarises the data for the sample of 1842 pupils
according to gender, year-group and class size. The data show a 25%
increase in the number of girls in Year 4 classes as compared to Year 5
classes.
MYear 4F T M
Year 5F T M
TotalsF T
Num pupils 474 310 784 691 367 1058 1165 677 1842Num classes 39 57 96Mean p/class 12.1 8.0 20.1 12.2 6.4 18.6 12.1 7.1 19.2% girls 40 35 37Num lessons 276(40%) 416(60%) 692(100%)% lessons bymale teacher 83 77 79
Table 11.6: Descriptive statistics for pupil sample
The cover-sheet attached to each set of seven LDRFs asked teachers to
give "a broad description of the ability level of the pupils (e.g. "mostly
CSE with about 4 pupils obtaining Grade 5 only")". Responses were
classified into nine Ability Groupings. These groupings and the number of
lessons given to each are shown in Table 11.7. A chi2 test confirmed that
there was no significant difference between the ability distributions in
Years 4 and 5. The data show that over half the pupils were in Ability
Groupings 1 - 4 inclusive. This suggests some schools have a policy of
encouraging above average pupils to take Computer Studies or, perhaps, of
restricting it to the more able pupils.
186

Ability GroupingDescription
Number (%) of lessonsYear 4 Year 5 Total
N % N % N %1 Very good 0-level 0 0 16 4 16 22 All 0-level 54 20 37 9 91 133 Mostly 0-level 75 27 78 19 153 224 Equal 0-level and CSE 41 15 69 17 110 165 Mostly CSE, some 0-level 33 12 65 15 98 146 CSE 26 9 87 21 113 167 CSE with some weaker p 0 0 32 8 32 58 Non-examination, a few CSE 7 2 7 2 14 29 Full-range mixed ability 40 15 25 6 65 9
Table 11.7 Description of Ability Grouping categories used to describethe pupil sample with number and percentage of lessons taught to each.
The timing of the study
The LDRFs were completed between October 1985 and February 1986. The
number of lessons reported in each month were as shown in Table 11.8. The
collection of data extended over five months and included both fourth year
and fifth year classes. The extended collection period was helpful because
it helped the survey to sample as much of the course as possible. Because,
however, the sampling period did not include the final intensive
examination-revision lessons of Year 5, the data almost certainly
underestimate the number and percentage of lessons devoted to tests and the
completing of projects during the total course.
1985 1986October November December January February
49 450 93 47 53
Table 11.8 Timing of the Lesson Reports
The context of Computer Studies teaching
On each LDRF teachers were asked to indicate the type of room used
and the length of the lesson. The data are shown in Tables 11.9 and 11.10.
187

Room Description
Lessons Recorded
A. Purpose built & equipped 107 15.5B. Adapted, dedicated micros ready for use 392 56.6C. Not dedicated, micros have to be set up 47 6.8D. No micro facilities for pupils 146 21.1
Table 11.9: Type of room-facilities used for CS lessons
The data show that over 70% of lessons took place in a room that had
been purpose-built or specially adapted for work with microcomputers and
that over half the reported lessons lasted for exactly 70 minutes.
Duration Lessons recorded/min
35 - 65 152 2270 398 58
75 - 120 142 20
Table 11.10: Duration of CS lessons
Analysis of results by Year-Group
(A copy of the LDRF is included in the Appendix.)
Lesson-type
The LDRF listed nine Lesson-types from which the teacher was asked to
choose the one type that best described the lesson being recorded. A tenth
category "Other - Please describe" was also included on the LDRF. This was
used for less than 1% of the lessons. Teachers' descriptions of these
lessons were used to allocate them to one of the nine listed Lesson-types.
Table 11.11 shows teachers' choice of the nine lesson types arranged
by Year-group. The data show that some types of lesson are comparatively
rare. Five types of lesson shown in the Table as numbers 3, 5, 6, 8 and 9
together account for less than 20% of all lessons. Of the remaining four
types, accounting for 80% of all lessons, three show different frequencies
188
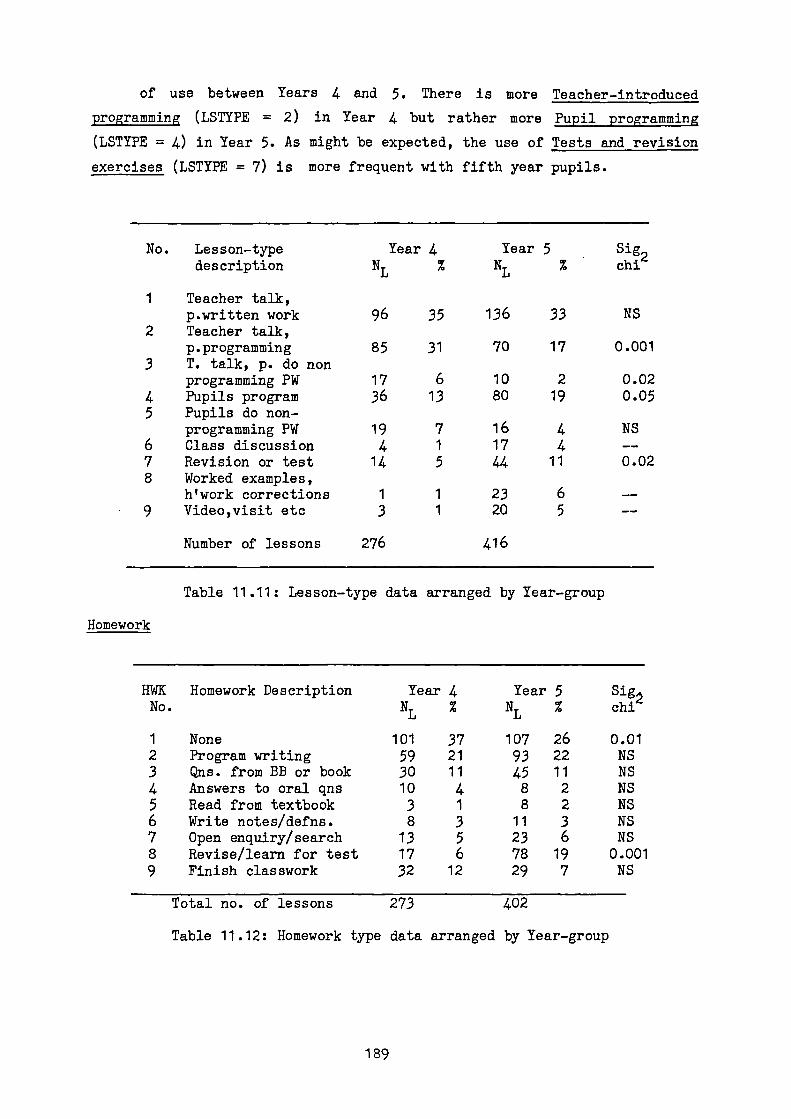
of use between Years 4 and 5. There is more Teacher-introduced
programming (LSTYPE = 2) in Year 4 but rather more Pupil programming
(LSTYPE = 4) in Year 5. As might be expected, the use of Tests and revision
exercises (LSTYPE = 7) is more frequent with fifth year pupils.
No.
1
Lesson-typedescription
Teacher talk,
NL
Year 4 Year 5NL
Sig2chi
p.written work 96 35 136 33 NS2 Teacher talk,
p.programming 85 31 70 17 0.0013 T. talk, p. do non
programming PW 17 6 10 2 0.024 Pupils program 36 13 80 19 0.055 Pupils do non-
programming PW 19 7 16 4 NS6 Class discussion 4 1 17 47 Revision or test 14 5 44 11 0.028 Worked examples,
h l work corrections 1 1 23 69 Video,visit etc 3 1 20 5
Number of lessons 276 416
Table 11.11: Lesson-type data arranged by Year-group
Homework
HWKNo.
Homework Description Year 4NL%
Year 5NL%
Signchi
1 None 101 37 107 26 0.012 Program writing 59 21 93 22 NS3 Qns. from BB or book 30 11 45 11 NS4 Answers to oral qns 10 4 8 2 NS5 Read from textbook 3 1 8 2 NS6 Write notes/defns. 8 3 11 3 NS7 Open enquiry/search 13 5 23 6 NS8 Revise/learn for test 17 6 78 19 0.0019 Finish classwork 32 12 29 7 NS
Total no. of lessons 273 402
Table 11.12: Homework type data arranged by Year-group
189

Table 11.12 shows the type of homework set to Computer Studies
classes in Years 4 and 5. Some differences between the homework exercises
used with the two year-groups are shown by the data. The category None is
more common in Year 4 whilst Revision is more common in Year 5. Teachers'
use of other types of homework activity show no significant variation
between fourth and fifth year groups.
Resources
Information about teachers' and pupils' usepf resources in Computer
Studies lessons is summarised in Table 11.13. The data show that the use of
resources other than books and charts varies only a little between Years 4
No. Resource description Year 4 Year 5 Sig2NT % NT % chi
TRO1 B-board or OHP 165 60 22' 53 NSTRO2TRO3
Charts & diagrams-Micro & large screen
4451
1619
4187
1021
0.05NS
TRO4 Other comp. h'ware 21 8 44 11 NSTRO5 Models & slides 2 1 6 1TRO6 Textbook 48 17 114 27 0.01TRO7 Software package . 32 12 39 9 NSTRO8 Microelectronics 11 4 1 0TRO9 Video or film 5 2 15 4 NSTRIO Pub.teaching mats. 13 5 29 7 NS
Total reports 392 597
PRO1 Microcomputer 150 54 194 47 NSPRO2 Teacher handout 112 41 155 37 NSPRO3 Textbook 72 26 151 36 0.02PRO4 Robot, buggy etc 0 0 8 2 --PROS Microelectronics 8 3 3 1PRO6 Ref.book Or library 13 5 50 12 0.01PRO? Software package 48 17 70 17 NS
Total reports 403 631
Table 11.13: Use of teacher resources (TR) and pupilresources (PR) arranged by Year-group
and 5. Both teachers and pupils make more use of textbooks in Year 5.
The data shown in Table 11.13 also indicate some resources are used
infrequently; these include microelectronics modules, robots, models,
videos and published materials other than books.
190
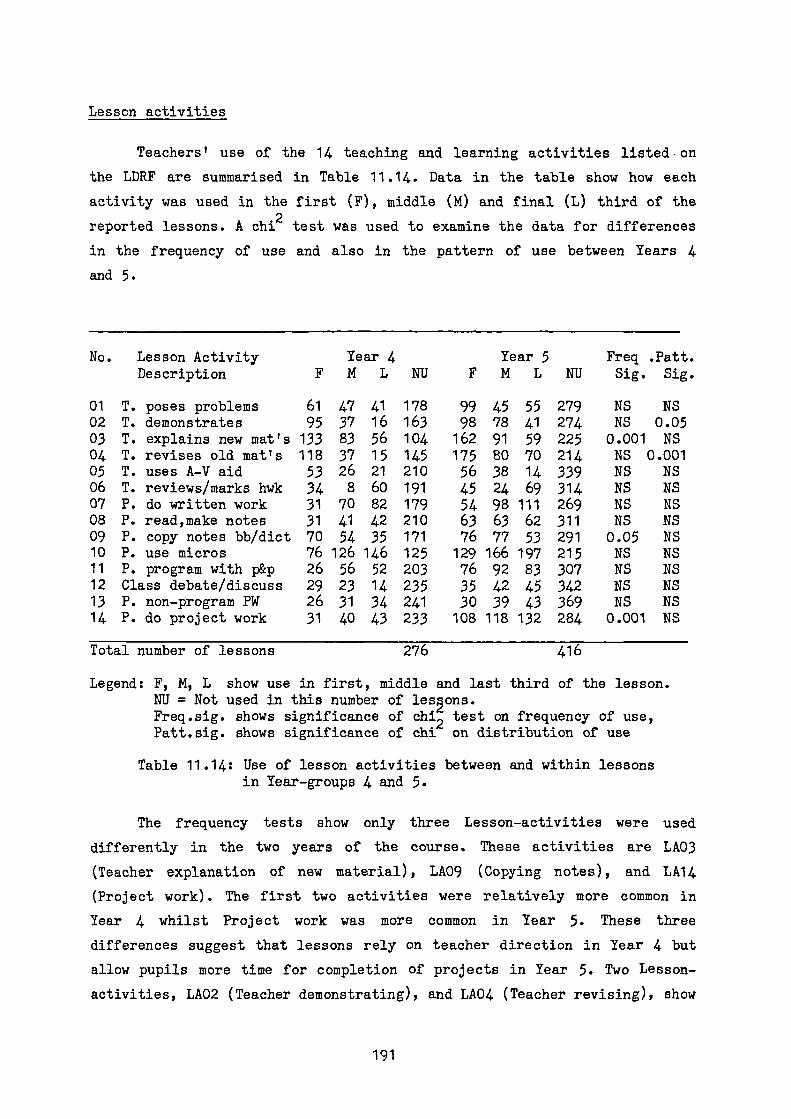
No. Lesson ActivityDescription
01 T. poses problems02 T. demonstrates03 T. explains new mat's04 T. revises old mat's05 T. uses A-V aid06 T. reviews/marks hwk07 P. do written work08 P. read,make notes09 P. copy notes bb/dict10 P. use micros11 P. program with p&p12 Class debate/discuss13 P. non-program PW14 P. do project work
Total number of lessons
Lesson activities
Teachers' use of the 14 teaching and learning activities listed on
the LDRF are summarised in Table 11.14. Data in the table show how each
activity was used in the first (F), middle (M) and final (L) third of the
reported lessons. A chi2 test was used to examine the data for differences
in the frequency of use and also in the pattern of use between Years 4
and 5.
Year 4 Year 5 Freq .Patt.F M L NU F M L NU Sig. Sig.
61 47 41 178 99 45 55 279 NS NS95 37 16 163 98 78 41 274 NS 0.05133 83 56 104 162 91 59 225 0.001 NS118 37 15 145 175 80 70 214 NS 0.00153 26 21 210 56 38 14 339 NS NS34 8 60 191 45 24 69 314 NS NS31 70 82 179 54 98 111 269 NS NS31 41 42 210 63 63 62 311 NS NS70 54 35 171 76 77 53 291 0.05 NS76 126 146 125 129 166 197 215 NS NS26 56 52 203 76 92 83 307 NS NS29 23 14 235 35 42 45 342 NS NS26 31 34 241 30 39 43 369 NS NS31 40 43 233 108 118 132 284 0.001 NS
276 416
Legend: F, M, L show use in first, middle and last third of the lesson.NU = Not used in this number of les2ons.Freq.sig. shows significance of chi 2 test on frequency of use,Patt.sig. shows significance of chi on distribution of use
Table 11.14: Use of lesson activities between and within lessonsin Year-groups 4 and 5.
The frequency tests show only three Lesson-activities were used
differently in the two years of the course. These activities are LA03
(Teacher explanation of new material), LA09 (Copying notes), and LA14
(Project work). The first two activities were relatively more common in
Year 4 whilst Project work was more common in Year 5. These three
differences suggest that lessons rely on teacher direction in Year 4 but
allow pupils more time for completion of projects in Year 5. Two Lesson-
activities, LA02 (Teacher demonstrating), and LA04 (Teacher revising), show
19 1
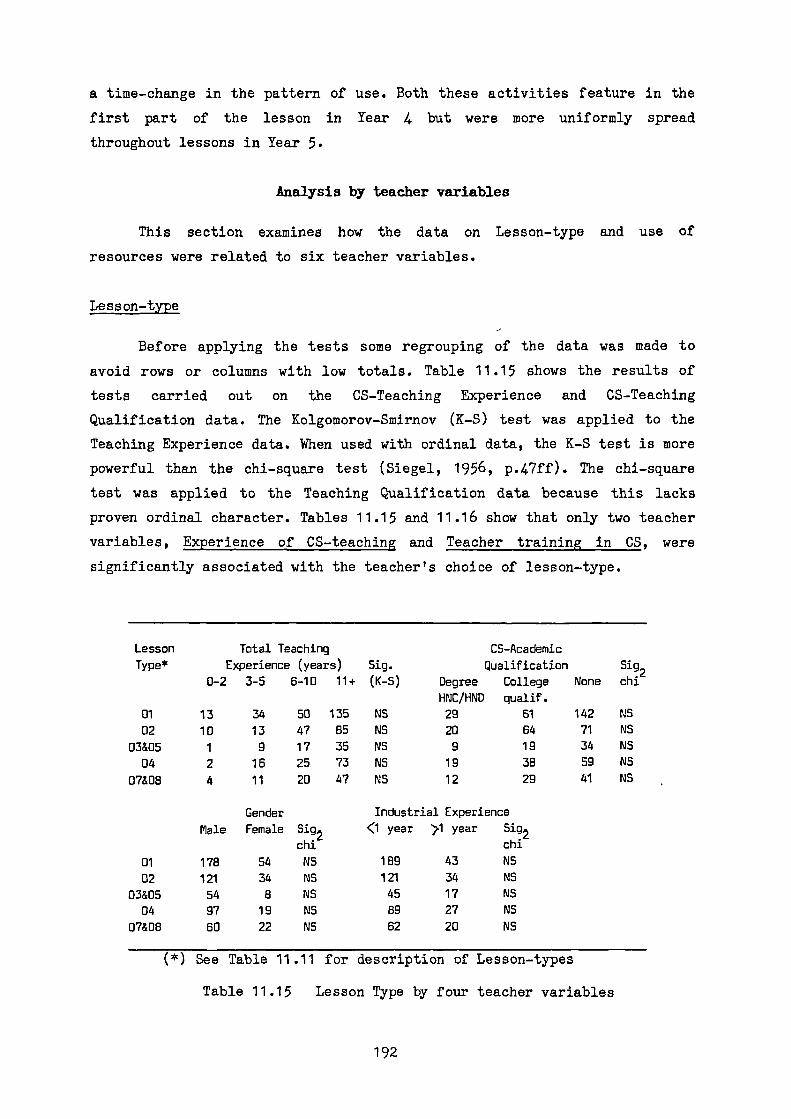
a time-change in the pattern of use. Both these activities feature in the
first part of the lesson in Year 4 but were more uniformly spread
throughout lessons in Year 5.
Analysis by teacher variables
This section examines how the data on Lesson-type and use of
resources were related to six teacher variables.
Lesson-type
Before applying the tests some regrouping of the data was made to
avoid rows or columns with low totals. Table 11.15 shows the results of
tests carried out on the CS-Teaching Experience and CS-Teaching
Qualification data. The Kolgomorov-Smirnov (K-S) test was applied to the
Teaching Experience data. When used with ordinal data, the K-S test is more
powerful than the chi-square test (Siegel, 1956, p.47ff). The chi-square
test was applied to the Teaching Qualification data because this lacks
proven ordinal character. Tables 11.15 and 11.16 show that only two teacher
variables, Experience of CS-teaching and Teacher training in CS, were
significantly associated with the teacher's choice of lesson-type.
Lesson Total Teaching CS-Academic
Type* Experience (years) Sig. Qualification5192
0-2 3-5 6-10 11+ (K-S) Degree
HNC/HND
College
qualif.
None chi
01 13 34 50 135 NS 29 61 142 NS
02 10 13 47 85 NS 20 64 71 NS
03&05 1 9 17 35 NS 9 19 34 NS
04 2 16 25 73 NS 19 38 59 NS
071108 4 11 20 47 NS 12 29 41 NS
Gender Industrial Experience
Male Female 5192chi
<1 year )4 year Sig2
chi
01 178 54 NS 189 43 NS
02 121 34 NS 121 34 NS
03&05 54 8 NS 45 17 NS
04 97 19 NS 89 27 NS
07&08 60 22 NS 62 20 NS
(*) See Table 11.11 for description of Lesson-types
Table 11.15 Lesson Type by four teacher variables
192
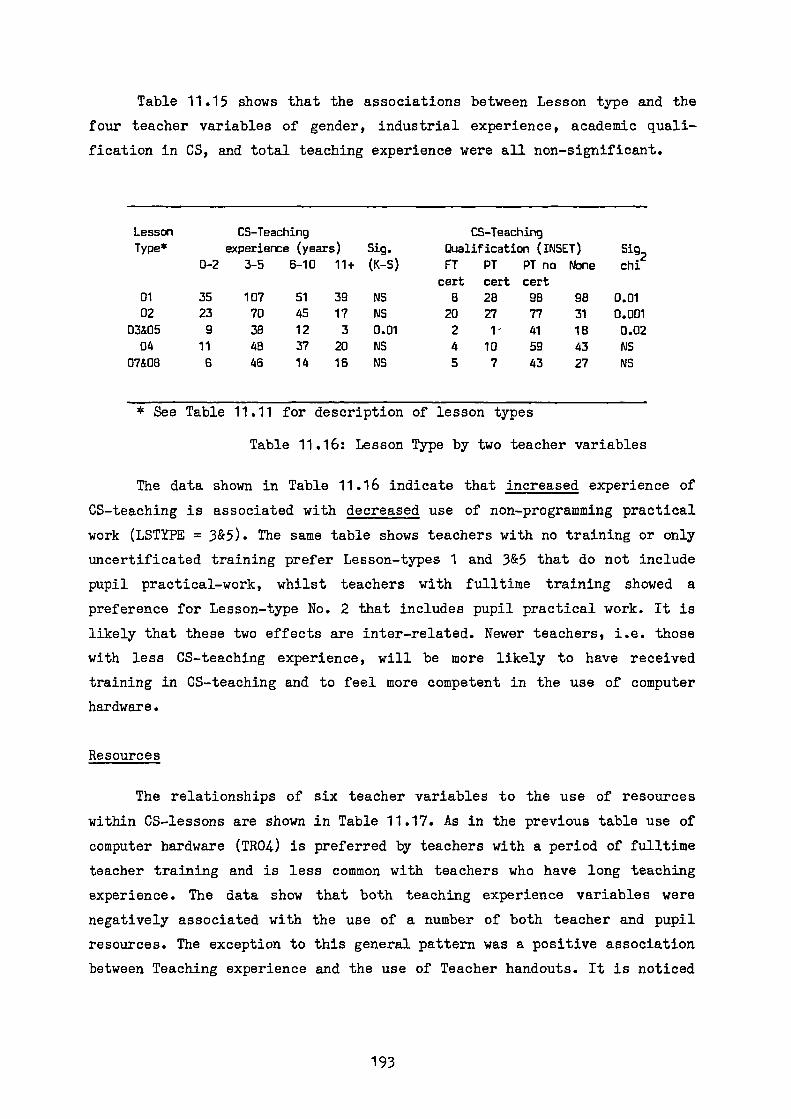
Table 11.15 shows that the associations between Lesson type and the
four teacher variables of gender, industrial experience, academic quali-
fication in CS, and total teaching experience were all non-significant.
LessonType*
CS-Teachingexperience (years) Sig.
CS-TeachingQualification (INSET)
Sig20-2 3-5 6-10 11+ (K-S) FT
certPTcert
PT nocert
None chi
01 35 107 51 39 NS 8 28 98 98 0.0102 23 70 45 17 NS 20 27 77 31 0.001
03&05 9 38 12 3 0.01 2 1- 41 18 0.0204 11 48 37 20 NS 4 10 59 43 NS
07&06 6 46 14 16 NS 5 7 43 27 NS
* See Table 11.11 for description of lesson types
Table 11.16: Lesson Type by two teacher variables
The data shown in Table 11.16 indicate that increased experience of
CS-teaching is associated with decreased use of non-programming practical
work (LSTYPE = 3&5). The same table shows teachers with no training or only
uncertificated training prefer Lesson-types 1 and 3&5 that do not include
pupil practical-work, whilst teachers with fulltime training showed a
preference for Lesson-type No. 2 that includes pupil practical work. It is
likely that these two effects are inter-related. Newer teachers, i.e. those
with less CS-teaching experience, will be more likely to have received
training in CS-teaching and to feel more competent in the use of computer
hardware.
Resources
The relationships of six teacher variables to the use of resources
within CS-lessons are shown in Table 11.17. As in the previous table use of
computer hardware (TR04) is preferred by teachers with a period of fulltime
teacher training and is less common with teachers who have long teaching
experience. The data show that both teaching experience variables were
negatively associated with the use of a number of both teacher and pupil
resources. The exception to this general pattern was a positive association
between Teaching experience and the use of Teacher handouts. It is noticed
193

that female teachers make more use of teacher resources. The validity
of this finding is supported by agreement with the data in Table 8.10
showing that female teachers had higher use of several resource-based
Teaching Activities except microelectronics.
.Resource Chi2 test of Resource-use by teacher variables
No. Description Sex CSQE CSQA IndExp CS-Exp T-Exp
TRO1 B'board or OHP NS 0.001(+) NS 0.01(+) NS NSTRO2 Charts/diagrams NS NS NS NS NS NSTRO3 Micro & screen NS NS NS NS NS NSTRO4 Comp.Hardware 0.05(F) 0.001(+) NS 0.05(+) 0.001(-) 0.001(-)TRO5 Models/slidesTRO6 Textbook 0.01(F) 0.05(+) 0.05(-) NS NS NSTRO7 Software 0.001(F) 0.05(-) NS NS 0.01(-) 0.01(-)TRO8 Microelectronics NS NS NS NSTRO9 Video/Film NS NS NS NS NS NSTRIO Pub.Materials 0.01(F) NS NS NS 0.05(-) 0.05(-)
PRO1 Microcomputer NS NS NS NS NS NSPRO2 Teacher handout 0.05(M) NS NS NS NS 0.01(+)PRO3 Textbook NS NS 0.05(-) NS NS 0.01(-)PRO4 Robot or Buggy NS --PRO5 Microelectronics NS -- -- --PRO6 Reference books NS 0.05(-) 0.05(+) NS 0.001(-) 0.001(-)PRO? Software NS 0.01(-) NS NS NS 0.05(-)
Legend: (F), (M), (+), (-) indicate increased resource use is associatedwith this direction of the teacher variableCSQE, (CSQA) CS qualification educational (academic),CS-Exp = CS teaching experience
Table 11.17: Use of teacher and pupil resources by teacher variables
Teacher Lesson-satisfaction
For each lesson, teachers were asked to rate their own level of
satisfaction with the lesson on a five-point scale. The level of Lesson—
satisfaction was analysed in terms of the resources used and the Lesson-
type.
194
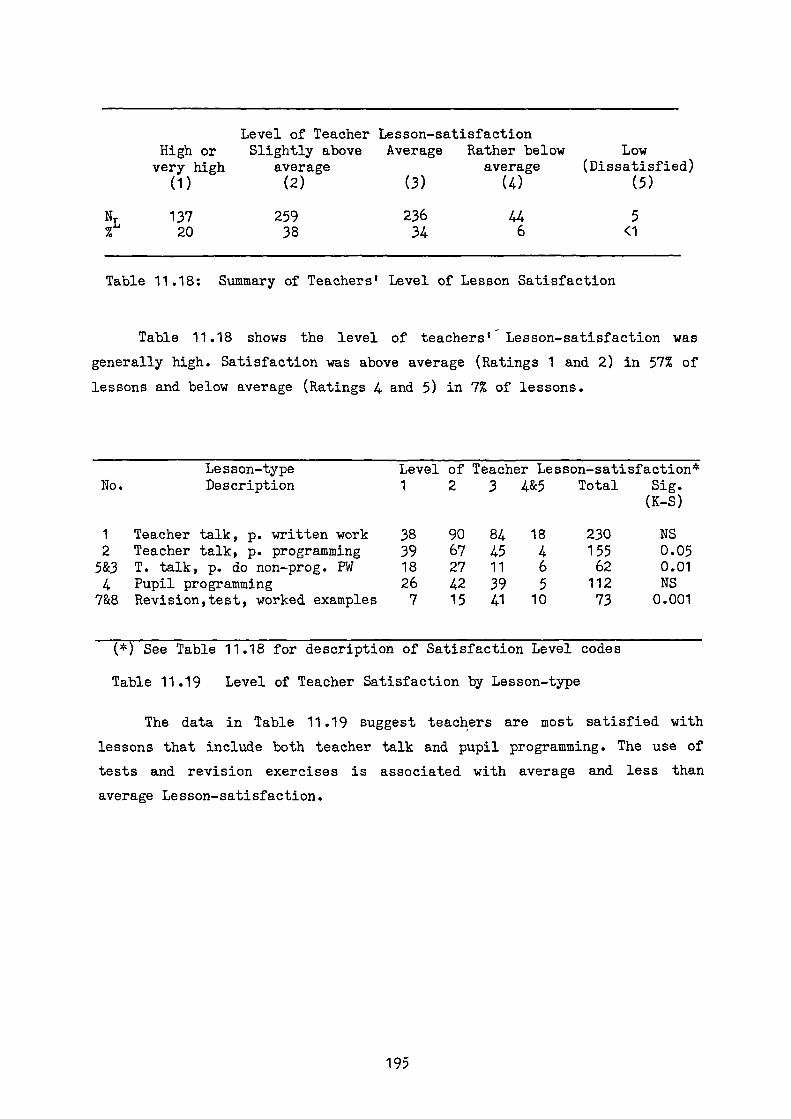
5<1
Level of Teacher Lesson-satisfactionHigh or Slightly above Average Rather below Lowvery high average average (Dissatisfied)
(1) (2) (3) (4) (5)
137 259 236 44NL
20 38 34 6
Table 11.18: Summary of Teachers' Level of Lesson Satisfaction
Table 11.18 shows the level of teachers' - Lesson-satisfaction was
generally high. Satisfaction was above average (Ratings 1 and 2) in 57% of
lessons and below average (Ratings 4 and 5) in 7% of lessons.
Lesson-type Level of Teacher Lesson-satisfaction*No. Description 1 2 3 4&5 Total Sig.
(K-S)
1 Teacher talk, p. written work 38 90 84 18 230 NS2 Teacher talk, p. programming 39 67 45 4 155 0.05
5&3 T. talk, p. do non-prog. PW 18 27 11 6 62 0.014 Pupil programming 26 42 39 5 112 NS
7&8 Revision,test, worked examples 7 15 41 10 73 0.001
(*) See Table 11.18 for description of Satisfaction Level codes
Table 11.19 Level of Teacher Satisfaction by Lesson-type
The data in Table 11.19 suggest teachers are most satisfied with
lessons that include both teacher talk and pupil programming. The use of
tests and revision exercises is associated with average and less than
average Lesson-satisfaction.
195

Level Teacher Satisfaction(*)ofPupil-resource1 2 3 05 Sig
0 1 0 1 0 1 0 1 K-S
PRO1 Microcomputer 57 80 121 138 131 105 28 21 NSPRO2 Teacher handout 90 47 145 114 153 83 27 22 NSPRO3 Textbook 104 33 180 79 139 97 36 13 . 05PRO4 Robot, Buggy, etc 135 2 253 6 236 0 49 0 NS
PRO5 Microelectronics 131 6 255 4 235 1 49 0 NSPRO6 Ref. books,library 122 15 234 25 222 14 40 9 NSPRO7 Software package 106 31 212 47 208 28 38 11 NS
Teacher-resource
Level of Teacher Satisfaction(*)
(£) 01
12
0 13
0 105
0 1SigK-S
TRO1 Blackboard, OHP 69 68 100 159 100 136 28 21 NSTRO2 Charts & diagrams 115 22 230 29 206 30 46 3 NSTRO3 Micro & large screen 93 44 201 58 206 30 43 6 .001TRW, Other comp.h'ware 120 17 235 24 216 20 45 4 NSTRO5 Models & slides 137 0 252 7 235 1 49 0 NSTRO6 Textbook 116 21 198 61 165 71 40 9 .05TRO7 Software package(s) 114 23 228 31 223 13 46 3 .01TRO8 Microelectronics 132 5 255 4 233 3 49 0 NSTRO9 Video, film 132 5 251 8 -229 7 49 0 NSTR10 Published materials 129 8 240 19 225 11 45 4 NS
(*) See Table 11.18 for description of Satisfaction Level codes(£) 0 and 1 categories indicate numbers of Non-uses (0)and Uses (1) of the activity associated with column satisfaction level
Table 11.20: Level of Teacher Lesson-satisfaction by Teacher-resource use
The data for Resource-use and Teacher Lesson-satisfaction given in
Table 11.20 show Lesson-satisfaction is higher when the teacher uses
either a micro and demonstration screen or software materials. The use of
the textbook is associated with average Lesson-satisfaction. All other uses
of teacher resources are without significant relationships to the level of
Lesson-satisfaction. The data also re-emphasise the low frequency of use of
some resources.
(*) See Table 11.18 for description of Satisfaction Level codes
Table 11.21: Level of Teacher satisfaction by Pupil-resource use
196

Teacher Lesson-satisfaction was also analysed according to the use of
pupil-controlled resources. Results in Table 11.21 show teachers associate
average and below average Lesson-satisfaction with the use of textbooks.
Although teachers expressed a higher level of Lesson-satisfaction with a
Lesson-type that included pupil-programming (see Table 11.19), pupils' use
of the microcomputer shows no significant relationship in Table 11.21. It
is also noticed that although teachers' use of software has a significant
association with Lesson-satisfaction in Table 11.20, there is no matching
level of significance for pupils' use of software.
Analysis by pupil ability
The ability of each class was judged on an 8-point scale with a
further category of "Full-range mixed ability". The data are shown in Table
11.7. Prior to the analyses reported in this section, the top two ability
ranges were combined as were the two lowest ranges. The lessons given to
the mixed ability classes, under 10% of the total, were omitted from the
analyses because it did not seem appropriate to combine them with any of
the more homogeneous groups.
Lesson type
The data for the distribution of Lesson-type by pupil ability are
shown in Table 11.22. The data show an increased emphasis on revision
activities for pupils of moderate and lower ability.
Pupil Ability Grouping Sig.No. Lesson type 1&2 3 4 5 6 7&8 K-S
01 T.talks,p.write 36 63 28 31 42 17 NS02 T.talks,p.program 29 33 30 21 21 3 NS
03&05 Non-program PW 10 17 3 7 3 11 NS04 Programming 16 25 25 21 13 6 NS
07&08 Revision/Test 4 13 13 14 21 8 0.01
Ability codes: 1=Good 0-level, 2= All 0-level, 3=Mostly 0-level,4= 0+CSE, 5=Good CSE, 6=CSE, 7=Weak CSE, 8=Non-exam.
Table 11.22: Lesson type by pupil ability
197
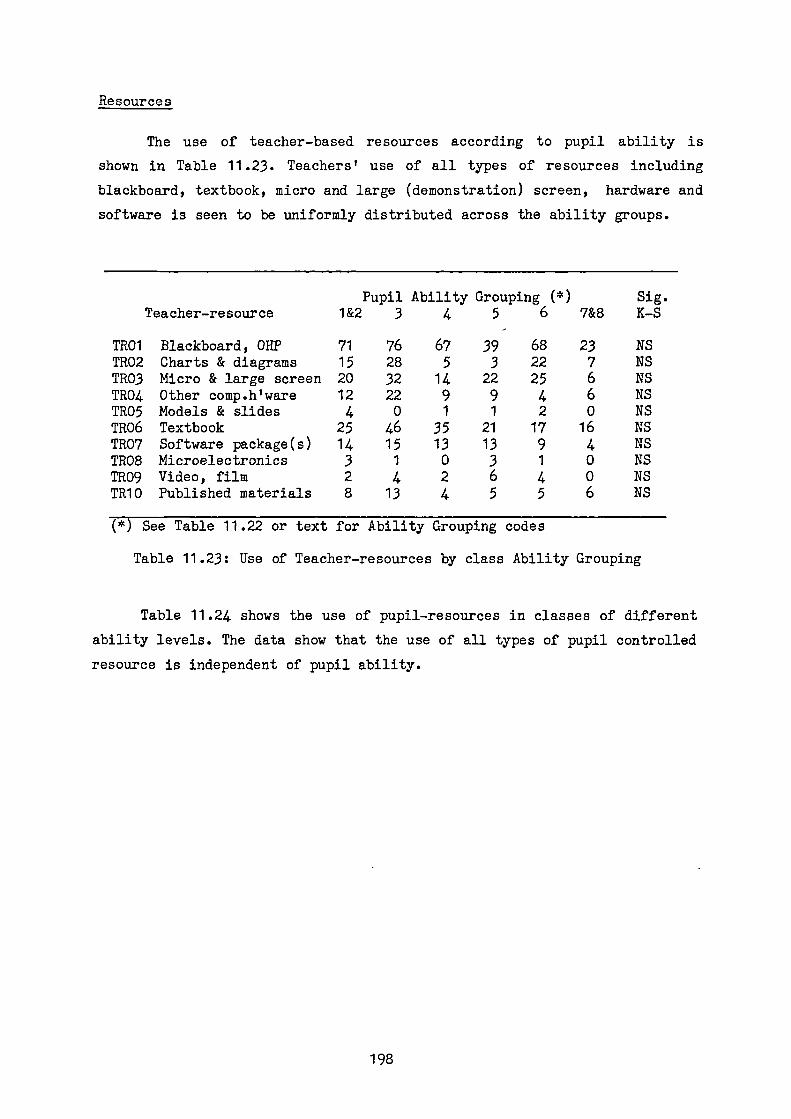
Resources
The use of teacher-based resources according to pupil ability is
shown in Table 11.23. Teachers' use of all types of resources including
blackboard, textbook, micro and large (demonstration) screen, hardware and
software is seen to be uniformly distributed across the ability groups.
Pupil Ability Grouping (*) Sig.Teacher-resource 1&2 3 4 5 6 7&8 K-S
TRO1 Blackboard, OHP 71 76 67,
39 68 23 NSTRO2 Charts & diagrams 15 28 5 3 22 7 NSTRO3 Micro & large screen 20 32 14 22 25 6 NSTRO4 Other comp.h'ware 12 22 9 9 4 6 NSTRO5 Models & slides 4 0 1 1 2 0 NSTRO6 Textbook 25 46 35 21 17 16 NSTRO7 Software package(s) 14 15 13 13 9 4 NSTRO8 Microelectronics 3 1 0 3 1 0 NSTRO9 Video, film 2 4 2 6 4 0 NSTR10 Published materials 8 13 4 5 5 6 NS
(*) See Table 11.22 or text for Ability Grouping codes
Table 11.23: Use of Teacher-resources by class Ability Grouping
Table 11.24 shows the use of pupil-resources in classes of different
ability levels. The data show that the use of all types of pupil controlled
resource is independent of pupil ability.
198

Ability Grouping (*) Sig.Pupil-resource 1&2 3 4 5 6 7&8 K-S
PRO1 Microcomputer 59 72 64 50 45 19 NSPRO2 Teacher handout 44 61 37 29 47 28 NSPRO3 Textbook 31 49 53 32 22 25 NSPRO4 Robot, Buggy, etc 4 2 0 1 0 0 NSPRO5 Microelectronics 3 0 0 3 1 0 NSPRO6 Ref. books, library 16 5 12 18 3 7 NSPRO7 Software package 25 24 20 19 12 14 NS
(*) See Table 11.22 or text for Ability Grouping codes
Table 11.24: Use of Pupil-resources by Ability Grouping
Homework
The distribution of homework type was also tested against pupil-
ability as shown in Table 11.25. The infrequently used categories of 4, 5,
and 6 (see Table 11.12) were omitted from the analysis. These three
categories together accounted for less than 10% of the responses. The K-S
tests confirm that some homework types are not uniformly distributed across
the ability range. Whilst higher ability pupils are likely to be set
written questions, pupils in the lower ability classes are more likely to
be given homework of the revising/learning kind . The data show that higher
ability pupils do not receive a higher proportion of open or enquiry type
of homework.
Pupil ability groupings(*) Sig.No .Homework Type 1&2 3 4 5 6 7&8 K-S
1 None 25 43 38 29 26 23 NS2 Programming 30 33 22 19 27 4 NS3 Written exercises 17 21 9 6 12 1 0.057 Open enquiry 3 10 6 9 4 0 NS8 Revise/learn 14 19 6 13 27 9 0.059 Finish classwork 5 13 11 14 7 1 NS
(*) See Table 11.22 or text for Ability group codes.
Table 11.25: Frequencies of Homework type by pupil ability
199
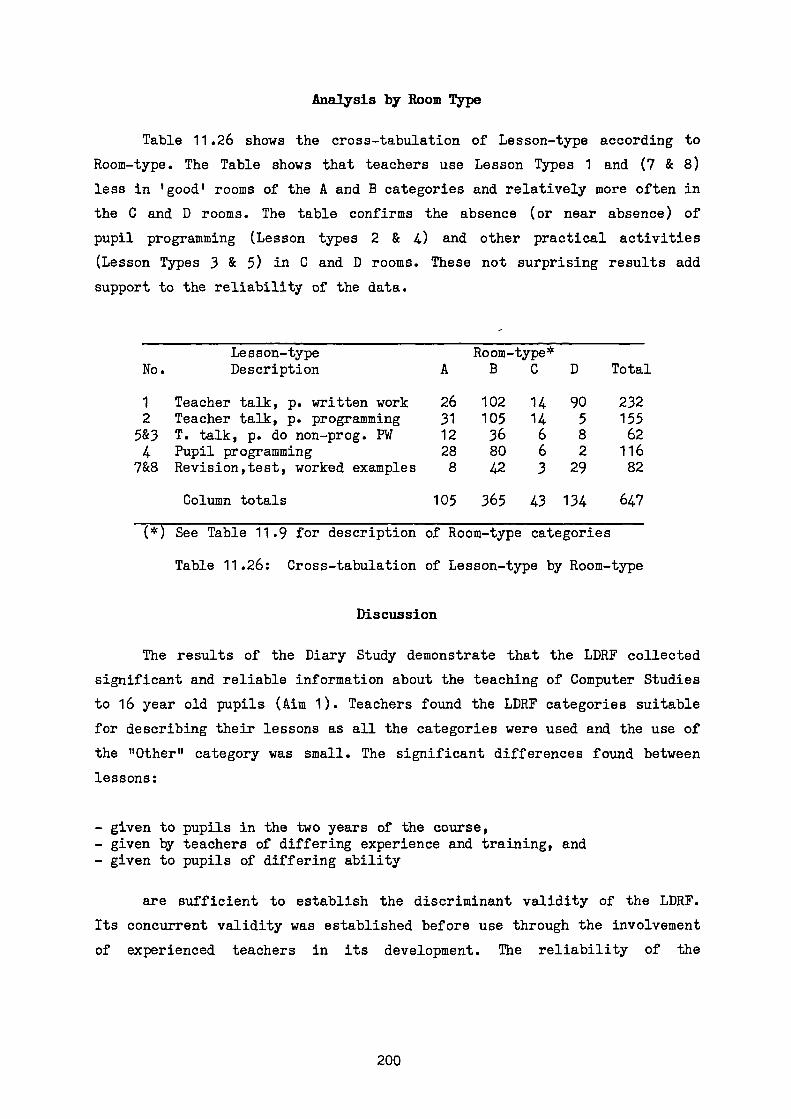
Analysis by Room Type
Table 11.26 shows the cross-tabulation of Lesson-type according to
Room-type. The Table shows that teachers use Lesson Types 1 and (7 & 8)
less in 'good' rooms of the A and B categories and relatively more often in
the C and D rooms. The table confirms the absence (or near absence) of
pupil programming (Lesson types 2 & 4) and other practical activities
(Lesson Types 3 & 5) in C and D rooms. These not surprising results add
support to the reliability of the data.
No.Lesson-typeDescription A
Room-type*B C D Total
1 Teacher talk, p. written work 26 102 14 90 2322 Teacher talk, p. programming 31 105 14 5 155
5&3 T. talk, p. do non-prog. PW 12 36 6 8 624 Pupil programming 28 80 6 2 116
7&8 Revision,test, worked examples 8 42 3 29 82
Column totals 105 365 43 134 647
(*) See Table 11.9 for description of Room-type categories
Table 11.26: Cross-tabulation of Lesson-type by Room-type
Discussion
The results of the Diary Study demonstrate that the LDRF collected
significant and reliable information about the teaching of Computer Studies
to 16 year old pupils (Aim 1). Teachers found the LDRF categories suitable
for describing their lessons as all the categories were used and the use of
the "Other" category was small. The significant differences found between
lessons:
- given to pupils in the two years of the course,- given by teachers of differing experience and training, and- given to pupils of differing ability
are sufficient to establish the discriminant validity of the LDRF.
Its concurrent validity was established before use through the involvement
of experienced teachers in its development. The reliability of the
200
instrument is confirmed by the general agreement between findings
from the sets of Lesson-type, Resource-use and Lesson-activities data. In
other circumstances additional information about the LDRF might have been
obtained from a comparison of the teachers' reports with LDRFs completed by
a classroom observer but such studies could not be undertaken because of
industrial difficulties in schools.
Although the correlations between some teacher variables and lessons
must be interpreted with some caution because of the small number of
teachers in some categories, from the data it seems likely that there are
differences between the types of lessons given by trained and untrained
teachers (Aim 2). One of the strongest findings in the analyses according
to teacher-variables was of a negative correlation between teaching
experience and the use of resources, except Teacher handouts. This shows
that more recently qualified teachers were more likely to use resources
both for themselves and their pupils. One of the most encouraging findings
of the survey allied to this was that a period of fulltime training does
produce changes in teachers' use of resources. It appears that teacher
variables of gender, industrial experience and academic qualifications are
unimportant in determining teaching patterns.
For classes of different ability, no significant differences were
found in the use of resources, only one significant difference was found on
Lesson-type and two differences in the type of homework given (Aim 3). In
lessons the less-able pupils are more likely to be engaged in written work.
For homework the higher ability pupils are likely to be given written work
whilst lower ability pupils are more likely to receive learning homework.
The survey has shown that one-third of classes receive no homework
assignment this being most evident in Year 4. When homework is set it is
most likely to be Program writing (Years 4 and 5), or Finish work startedin the lesson (Year 4) or Revise/learn (Year 5). Homework featured as asignificant correlate of student learning in two studies described in
201
a variety of worthwhileto those provided inof the different ages,
..exploit the environmentthe skills of discovery,learning." (p.42-43)
of homework as a correlate of
the recommendations of HMI have
Chapter 3 (Fraser, 1987; Paschal et al, 1984) and a recent report by
HMI (DES, 1987) said of homework
"its function must be to generatelearning experiences additionalschool...designed to take accountabilities and needs of the pupils.outside the school and to developof investigation and of independent
In Computer Studies the importance
learning has not been fully exploited and
been only partially met.
There was no consistent pattern of differences between classes of
different ability on measures of lesson-type, use of resources or homework
activities. The absence of significant relationships between pupil ability
and lesson characteristics may be due in part to the relative homogeneity
of CS classes. The data have shown most CS-pupils are of above average
ability and a high percentage of CS-classes contain 0-level pupils only.
Teachers may decide this level of uniformity makes it unnecessary to
arrange alternative activities for pupils of different abilities.
Teachers were most satisfied with lessons based on teacher
demonstration and the use of software and least satisfied with lessons
based on the use of textbooks, tests and allied activities. These results
show that teachers prefer to use lesson-types and resources that allow
joint teacher-pupil participation. The finding that Computer Studies
lessons are based on a narrow range of lesson-structures and use a limited
range of activities and resources is a major finding of the survey. It
appears that resources such as videos, robots and models, and
microelectronics modules have very low frequencies of use. Any follow-up
study should seek to discover whether teachers are unaware of these
resources, are unable to obtain them, or have decided against their use.
Computer studies syllabuses and examinations may be blamed by some
teachers for restricting opportunities to use a wider range of teaching and
202
learning activities. It is probably examination pressures that cause
teachers to emphasise the teaching of programming in Year 4 and thepreparation of a student-project and the use of revision-tests in Year 5.
The greater frequency of Revision-type homework in Year 5 is also
consistent with teaching that is focused on meeting examination
requirements.
Summary
A one sheet per lesson instrument the LDRF was used to collect data
about the teaching of Computer Studies to pupils age 14-16 years. The LDRF
collected data about the location and duration of the lesson, the style of
lesson, the use of resources, homework assignments and the time-
distribution of lesson activities. Background information was also
collected giving the composition and ability of the class and six teacher
variables.It was shown that the 61 teachers who completed the LDRFs were an
equivalent sample to the 253 teachers who completed the Activities
Checklist.
A review of the Room, Duration, Pupil and Teacher data gives a
description of the typical Computer Studies classroom. Teachers' responses
showed that 70% of CS-lessons are given in rooms specially built or adpated
for work with microcomputers and last for 70 minutes. Computer Studies
classes typically contain from 18 - 20 pupils about one-third of whom are
girls. The ability of Computer Studies pupils is above average, more than
50% of classes contain all or some pupils of 0-level standard.
It was found that four types of lesson were in common use; (1)
Teacher talk combined with pupil written exercises, (2) Teacher talk
combined with pupil programming, (3) Pupil programming, and (4) Revisionexercises and tests. Although 14 lesson activities were listed on the LDRF,
only three showed a high frequency of use. These were Teacher explaining
new material (53%), Pupils using microcomputers (50%), and Teacher revising
old material (48%). The principal resources used in Computer Studies
lessons were found to be blackboard, microcomputer, teacher handout and
textbook. The finding that teachers and pupils made only infrequent use of
203
other resources such as videos, microelectronics and models, is one
finding of the survey. The Lesson-type chosen by teachers was found to be
related to their Experience of CS-teaching and their CS-teaching
Qualification. Other teacher variables of gender, qualifications and
experience were unrelated to choice of Lesson-type but did influence the
use of some resources. Teachers expressed most personal satisfaction with
lessons and resource use that allowed teacher-pupil interaction and least
satisfaction with lessons using textbooks.
Differences were found between the types of lessons given to pupils
in the first and second years of the course. These showed a greater amount
of teacher-talk in the first year and of pupil individual work in the
second. Differences between first and second year classes in the use of
teacher-controlled and pupil-controlled resources were generally confined
to the use of textbooks and reference books. The analysis of within lesson
activities showed more teacher explanation of new material and pupil note-
making in the first year. This is an expected result that adds additional
validity to the study.
Differences between the type of homework assignments set in the two
years were found to be confined to two of the nine homework-types. The
frequency of Revision rose from about 6% in Year 4 to almost 20% in Year 5.
The frequency of No-homework fell from 37% in Year 4 to 26% in Year 5. The
discovery that over the two years of the course about one-third of lessons
had no associated homework assignment is an additional finding of the
survey.
Some effects associated with Pupil Ability were found in the data
relating to Lesson-type and Homework. The use of Teacher-resources and
Pupil-resources did not vary significantly with pupil ability.
204
CHAPTER 12
SUMMARY, DISCUSSION AND SUGGESTIONS FOR FURTHER RESEARCH
Summary
It is convenient to set out the main findings of the study in terms
of the 12 objectives listed in Chapter 5. It will be seen that all these
objectives have been achieved.
Objective 1.
To describe the characteristics of a sample of pupils engaged in ComputerStudies.
The sample of 2320 pupils included 747 (32%) girls. About half the
sample probably had access to a computer at home although this was little
used except for games and programming by boys (Table 9.3). Only a minority
of pupils had significant experience of CAL (Table 9.4). Data from the
Diary Study pupil sample showed that Computer Studies classes contain a
high percentage of pupils of above average ability.
Objective 2.
To identify scales or instruments suitable for the measurement of attitudestoward computers held by Computer Studies pupils.
The CARAQ instrument with an additional scale was confirmed as
suitable for measuring the attitudes towards computers of pupils taking
Computer Studies as an examination subject. The values of reliabilities and
mean interscale correlations obtained for the CARAQ scales were closely
similar to results obtained in the author's 1984 study (Table 9.6). The
instrument used to assess Computer Anxiety was reliable (Table 9.12) and
discriminated between sub-groups of the sample (see under Objective 3,below). Two reliable scales measuring pupils' attitudes to a Job using a
Computer were derived from a semantic differential questionnaire (Table
9.15).
205
Objective 3.
To seek relationships between pupil characteristics and attitudes tocomputers in the sample of Computer Studies pupils.
Gender, home-use of a computer for programming and educational games
and Science group membership were found to be associated with more
favourable attitudes on all CARAQ scales although the 0.05 level of
significance was not reached on the scales THREAT and FUTURE by girls'
Homeuse of a computer. CAL-experience was associated with improved scores
on the SCHOOL scale for boys and the scales EMPLOY, CAREER and SCHOOL for
girls (Table 9.7). Membership of the Arts-group was associated with more
favourable attitudes on the scales EMPLOY, SOCIAL, CAREER and LEISURE
(Table 10.1).
Boys had a significantly lower level of Computer Anxiety than girls
and in general high-levels of Homeuse of a computer for games or
programming were associated with lower Anxiety. For girls CAL experience
reduced the level of Computer Anxiety (Table 9.13).
One of the two Jobscales showed a significant gender effect (Table
9.16), in which boys gave a computer-based job a higher score on the
evaluative scale.
Objective 4.
To describe the characteristics of a sample of Computer Studies teachers
It was estimated that about 42% of eligible teachers returned the
Teacher Booklet. Of the survey sample of 253 teachers one-quarter was
female. Only 13% of the sample had a degree or near-equivalent academic
qualification in Computer Science and only about one teacher in 16 had
received full-time training in the teaching of CS (Tables 8.6 and 8.7).
Nearly 80% of the sample also taught mathematics (Table 8.5), the data
suggested that most CS teachers had previously had some years of teaching
another subject. About 20% of the sample had had some industrial experience
of using computers.
206

Objective 5.
To identify and measure variables that correspond to stable characteristicsof teachers' behaviours in Computer Studies lessons.
The 19 Activity Scales derived from the Checklist had moderate values
of alpha reliability, were statistically distinct (Table 8.10), and were
shown by factor analysis to belong to a common construct. These derived
variables were used to identify five Teaching Styles. One of these Styles
(Style 1) which was adopted by almost 40% of the teacher sample showed
fewest departures from "average" teaching, it was characterised by higher
than average use of computer software and lower than average use of
worksheets and routine exercises (Table 8.12). Styles 2 and 3 were
described as "positive" because they were distinguished by the greater use
of physical resources, two "negative" Styles were characterised by almost
total lack of use of teaching resources other than blackboard and textbook.
Male teachers preferred Style 1 whilst teachers with a qualification in
computing or teacher training in the subject were most common in Styles 1
and 2 (Table 8.15). Teachers whose other subject was mathematics seemed to
avoid the most positive Style (Style 2) and prefer the two negative Styles.
Three canonical discriminant functions (CDFs) derived from the
Activity scales may be useful measures of teacher characteristics. Each of
the teacher variables of length of teaching experience, industrial
experience, academic and training qualifications, teaching subject and
gender was associated with just one of the CDFs (Table 8.15). This shows
that each teacher variable is associated with an identifiable group of
teaching activities.
Responses to the semantic differential questionnaire showed teachers'
attitudes to their job could be expressed in terms of two components of
demand and evaluation (Table 8.18). These attitude-component scales were
found to be reliable (Table 8.20) and independent of teacher variables
(Table 8.21).
207
Objective 6.
To seek relationships between the behaviour variables of Computer Studiesteachers and pupils' attitudes toward computers.
Teacher gender was not included in any of the regression equations
predicting pupils' attitude scores (Table 10.2). Oneway analysis of
variance showed that the global construct of Teaching Style was not
associated with pupils' attitudes (Table 10.14). The Activity scale scores
were moderately good predictors of the pupils' CARAQ scores with R2
values
from the regression equations ranging up to 22%. The Activities of
Microelectronics, Student involvement, Teachers concern for resources, and
Teacher taking interest in pupils' career and leisure activities were found
to evoke more favourable attitudes (Table 10.6)
No significant correlation was found between any of the 19 teaching
Activities and pupils' level of Computer Anxiety (Table 10.12). Teacher
gender and other teacher characteristics measured by the CDFs also had no
significant correlation with pupils' Anxiety scores (Table 10.11).
Teachers' Jobscores were strongly and positively associated with
pupils' views of a computer-based job or career (Table 10.16).
Objective 7.
To identify scales or instruments to measure pupils' perceptions of theComputer Studies classsroom environment.
Nine established scales and one new scale were used to measure
pupils' perceptions of the classroom environment. The values of scale
reliabilites and interscale correlations found for students of Computer
Studies were similar to those reported for science students (Table 9.9).
Further analyses suggested four scales of the ICEQ instrument were not
wholly suitable for use in Computer Studies classrooms.
208
Objective 8.
To seek relationships between pupil characteristics and perceptions of theComputer Studies classroom environment.
A few significant relationships were found between pupil
characteristics and their perceptions of the classroom environment. When
grouped by gender, boys' scores were greater on the RESOURCES and TASK
ORIENTATION scales. Homeuse of a microcomputer produced a significant
increase on the INVOLVEMENT scale for both boys and girls as well as on the
PARTICIPATION scale for boys and on the INVESTIGATION and INNOVATION scales
for girls. Experience of CAL significantly increased pupils' perception of
the levels of PERSONALISATION and INVESTIGATION in Computer Studies lessons
and also increased boys' perceptions of the levels of PARTICIPATION and
INNOVATION. Science group membership had no significant influence on
pupils'perceptions of the Computer Studies classroom environment
(Table 9.10).
Objective 9.
To seek relationships between the behaviour variables of Computer Studiesteachers and pupils' perceptions of the Computer Studies classroomenvironment.
Although some of the multiple correlations between pupils'
perceptions of the classroom environment and the 19 Teaching Activities are
quite low, some interesting points arise (Table 10.8). The Activity Use of
non-micro AV aids increases pupils' perceptions of INNOVATION, TASK-
ORIENTATION and ORDER & ORGANISATION in Computer Studies lessons which
suggest that pupils feel they are being "well-taught”. The use of
additional hardware such as Network and wordprocessor is positively
correlated with pupils' perceptions of RESOURCES. The perception of
INNOVATION is increased by New teaching ideas, Network and wordprocessor
and the use of Worksheets. The perception of PERSONALISATION is increased
by Use of software and also by Teacher-interest in pupils. When pupils Seek
their own information about computers the increased perception of
INDEPENDENCE is accompanied by a decrease in the perceptions of TASK
ORIENTATION and INVOLVEMENT. Pupils appreciate Activities of Pupil-
209
differentiation and Pupil-directed exercises through an increased
perception of classroom DIFFERENTIATION. Oneway analysis of variance showed
that Teaching Style was not significantly associated with pupils' classroom
environment perceptions (Table 10.19).
Objective 10.
To seek relationships between pupils' perceptions of the Computer Studiesclassroom environment and their attitudes toward computers.
The 14 CE dimensions were moderately good predictors of pupils'
attitudes toward computers. The value of R2
for the eight attitude scales
was in the range 0.10 to 0.29 (Table 10.10). One or both of the classroom
environment dimensions of INVOLVEMENT and ORDER & ORGANISATION were
included in the regression equation of the eight attitude scales. The
scales of CAREER and LEISURE were most strongly related to classroom
perceptions while LEISURE was negatively correlated wuith TASK ORIENTATION.
Only the scale INVOLVEMENT had a significant correlation with Computer
Anxiety. A higher level of INVOLVEMENT was associated with a lower level of
Anxiety (Table 10.13).
Objective 11.
To determine the lesson styles, activities and resources used by teachersand 14-16 year old pupils in Computer Studies lessons.
Over half the CS lessons reported in the Diary Study lasted for 70
minutes. The majority of lessons were given in a room specially equipped
for Computer Studies. The mean class size was 19 pupils (12B, 7G). Computer
Studies classes were reported to contain a lower proportion of pupils of
average and below average ability (Table 11.17).
Over 80% of lessons used one of the three lesson structures of
Teacher talk and pupil written work, Teacher talk and pupil programming and
Pupil programming in Year 4 (Table 11.11). These structures were also themost common in Year 5 although the frequency of Revision examples and Tests
increased sharply. Quite often, after a teacher introduction in the first
third of the lesson, pupils spent the remainder of the lesson either doing
210

written exercises or programming at the keyboard. Both teachers and
pupils used a limited range of non-hardware resources (Table 11.13).
Lessons varied little in type, use of resources or homework with pupil
ability possibly because teachers thought any variation unnecessary with
relatively homogeneous classes (Tables 11.22 to 11.25). Only three types of
homework were common in each year of the course, Program writing and
Answering questions were common in both Years 4 and 5, Finish classwork was
common in Year 4 and Revise in Year 5 (Table 11.12).
Objective 12.
To determine whether lesson styles and resource use in Computer Studieslessons are related to characteristics of the teacher, pupil and classroomenvironment.
One of the most noticeable feature of Computer Studies lessons was
their uniformity. Lesson-Type varied only with teacher variables of teacher
training and teaching experience in Computer Studies (Tables 11.15, 11.16).
The use of resources followed a similar pattern, the variables of CS
Teaching Experience and CS Teacher Training Qualification showed the
strongest influence on the use of a wide range of resources (Table 11.17).
Discussion
Computer Studies in the school curriculum
The significance of the descriptions of Computer Studies teaching
activities, pupils' attitudes and the context of lessons obtained in the
survey has to be judged against the potential benefits of this subject for
pupils. In other words, "Why do schools teach Computer Studies?". Views of
Universities and of the Alvey Committee quoted in Chapter 1 agree that the
cognitive content of current courses of CS is of little or even negative
value to pupils going into Higher Education. Thus a "specialist knowledge"
or "introduction to further studies" argument cannot be used to justify the
place of Computer Studies in the school curriculum. The value of the
cognitive content of Computer Studies to students leaving school at age 16
is also doubtful. In Chapter 1 it was noted that the skills of BASIC
programming and of handling the limited range of school equipment are
judged of little value by employers. In their view the interests of
students would be better served by more attention to the basic skills of
211
literacy, numeracy and communication. Thus the "vocational skills"
argument cannot be used to justify the teaching of Computer Studies. In the
concluding section of his survey report, Wellington (1987) says:
"The requirements of employers are rarely stated in specificterms and are almost never phrased in the language ofskills....employers 1 requirements and selection criteria areusually couched in terms of attitudes, aptitudes, awareness"(Wellington, 1987, p.81)
These requirements suggest the place of Computer Studies in the
school curriculum may be justified if it
1. helps pupils to develop favourable attitudes to computers and their use,and2. helps pupils to become aware of the range of computer equipment,techniques and applications to be found in industry and commerce.
Some points from this study
Data from this and other studies suggest that pupils have little
experience of computer assisted learning. If there is also no provision
within a school for granting pupils individual access to computers to
pursue self-chosen activities, Computer Studies lessons may be equated with
pupils' total school computer experience. It is therefore important to
ensure that Computer Studies lessons do develop computer awareness and
favourable attitudes toward computers. The results of this study have
provided information about the attitudinal effects of lesson activities and
other variables.
One of the principal findings has been the strong association between
home-use of a computer and pupils' attitudes and perceptions. The existence
of a link between home-use and attitudes in the general population is well-
known and is understandable. Neverthless it is still somewhat surprising to
find that there is a strong association between home-use and attitudes in a
sample of pupils taking Computer Studies at school. All the pupils in the
sample had received between 50 and 60 weeks of Computer Studies lessons
averaging 140 minutes per week. The results show that this extensive school
study of computers did not mask the attitudinal effects of home-use.
212
For those pupils who do not have the advantage of a home computer,
open access to school computer facilities could improve attitudes and
reduce Computer Anxiety. It might also be useful in reducing a marked
gender effect which was shown on all attitude scales. Even after the period
of Computer Studies experience, girls had significantly less favourable
attitudes. In Chapter 2. it was noted that in a Swedish study, a 12 month
course in "datalara" did not remove gender differences.
The five Teaching Styles had no significant differential effect on
pupils' attitudes although it might have An expected that the positive
styles would lead to different outcomes from the negative styles. One
reason for the absence of a Teaching Style effect in this study may be
connected with another major finding of the survey which was that the
format, structure and resources employed in Computer Studies lessons vary
over a limited range. The emphasis on programming and the limited range of
concrete materials are all consistent with a course perceived in terms of
an examination based on "Project plus written paper" which could have
masked the effect of teacher style on pupil attitudes. If, as it seems
reasonable to suppose, passing the examination rather than developing
attitudes and awareness is the teachers' major aim, the pervading ethos
might be similar in all Computer Studies lessons. Thus all Teaching Styles
could have the same minimal effect on pupils.
Trends and implications
An increasing number of schools are providing courses of "computer
awareness" or "information technology" for all pupils and are reducing, or
ceasing altogether, the amount of CS taught in favour of using resources
for computer assisted learning across the curriculum (Wellington, 1987). In
Chapter 1 it was noted that the networking of a school's micro-computers,
often associated with the teaching of Computer Studies, was negatively
associated with use of CAL across the curriculum. If schools feel pressed
to increase their commitment to CAL and to the use of information
technology throughout the school, they may decide it is preferable to
distribute their computer hardware more widely. This policy would make it
more difficult to also teach Computer Studies. In The National Curriculum
5-16 (DES, 1987) Computer Studies is not one of the ten core subjects.
213

Given current criticisms of this subject and the likely pressures on
the school timetable, the writer thinks it most unlikely that Computer
Studies as an examination subject will survive if the National Curriculum
proposals are implemented. In future, pupils may be expected to acquire
their knowledge of computers and micro-electronics through the core subject
"Technology" which will be taught to all pupils from 7 to 16.
The employers questioned by Wellington wished school leavers to be
aware of computers and information technology and to have favourable
attitudes toward their use. There is no reason to suppose these aims should
be different for the teaching of "technology for all" in a new curriculum.
The content and teaching methods of the new subject should be chosen to
meet these aims.
Results from the present survey can provide helpful pointers to
designers and teachers of these new courses. The results indicate that
teacher training has an effect on classroom practices. The importance of
teacher training in the use of alternative classroom activities and the use
of resources will increase as less-specialised and more wide-ranging
courses are put into the curriculum of younger pupils.
Suggested courses should be framed in ways that requires pupils to
experience a wide range of both hardware (equipment) and software
(programs). It has been shown that one feature of the present CS courses
was their concentration on a narrow range of resources. The finding that
use of micro-electronics modules, videos, visits etc. together account for
less than 10% of all lessons is a clear indication that current courses do
not help pupils to become "aware" of computers and microelectronics
technology and their applications. The survey has shown that teacher
training can encourage teachers to employ a wide range of teaching tactics
and teaching resources which in turn lead to pupils acquiring more
favourable attitudes. Research showing the favourable effect of new science
curricula and interaction on students' attitudes was reported in Chapter 3
and similarities between science and Computer Studies research studies make
it reasonable to suppose a similar effect may be found if new syllabuses of
computer awareness technology" are introduced.
214
In the new courses pupils should not be required to prepare any long
project for assessment or other purpose. The excessive amount of class-time
required for pupils to produce this piece of work was possibly one reason
why teachers were unable to use a range of lesson structures that would
reflect their own skills, personality and interests.
The tasks or exercises for computer solution used in teaching the new
subject should be seen as relevant by the pupils. They should be the sort
of tasks that pupils might themselves tackle with their home computer. The
basis for this suggestion is the observation that home activities have
favourable associations with attitudes. These favourable associations
include a lower level of Computer Anxiety. Therefore school activities that
are similar to these activities and take place in the same environment may
also promote favourable attitudes.
The importance of the environment in which computer activities take
place is demonstrated by other evidence from the survey. More favourable
attitudes on the CARAQ scales were favoured by classroom environments the
students perceived as high in INVOLVEMENT and ORDER & ORGANISATION. As
explained earlier, it is possible to interpret these findings as students
seeking a "home" environment within the classroom.
Spaull (1987) reports an experiment in which open access to computer
equipment provided within a University Hall of residence produced a "home
environment" in which the students could gain computing experience. Just as
at home, the computers are available "in the room next door" around the
clock and there is often someone else nearby, not a teacher or member of
staff, who can be approached for help or who can be shown one's latest
achievement. Also any problem a student chooses to tackle is their own
choice, it is not part of an assignment, there is no time limit, and it can
be continued or abandoned just as the student wishes. The provison of a
"home-computer room" within a school would help to redress the imbalance
against girls and socially-disadvantaged groups of pupils who do not have
access to a computer outside school.
215
Suggestions for further research
It has been suggested that new school courses dealing with computers
should have the aims of promoting awareness and favourable attitudes.
Awareness of computers may be achieved through use of a much wider range of
computer and teaching resources than is presently used in CS lessons.
Favourable attitudes may be encouraged if school experiences of computers
set out to "mimic" home experiences. These two suggestions (provision and
use of a wider range of resources and home-like experiences) for teaching
changes could be the subject of action research.
To study the effects of materials, a small number of teachers could
first be trained in the classroom use of a wide range of computer-related
teaching resources for themselves and the pupils. These would include
videos, computer software, microelectronics modules, visits and so on. The
teachers would then be asked to teach a non-examination course of computer
awareness (or information technology awareness) for, say, one term. It
would be feasible to use the CARAQ instrument and Anxiety scale to look for
attitude changes associated with pupils' wider experiences.
The second line of research, the provison of "home environment
experiences" at school may be more significant. Perhaps a study of the
effects of the provision of a "home-computer room" within a few schools
would provide useful pointers for a larger scale study.
216
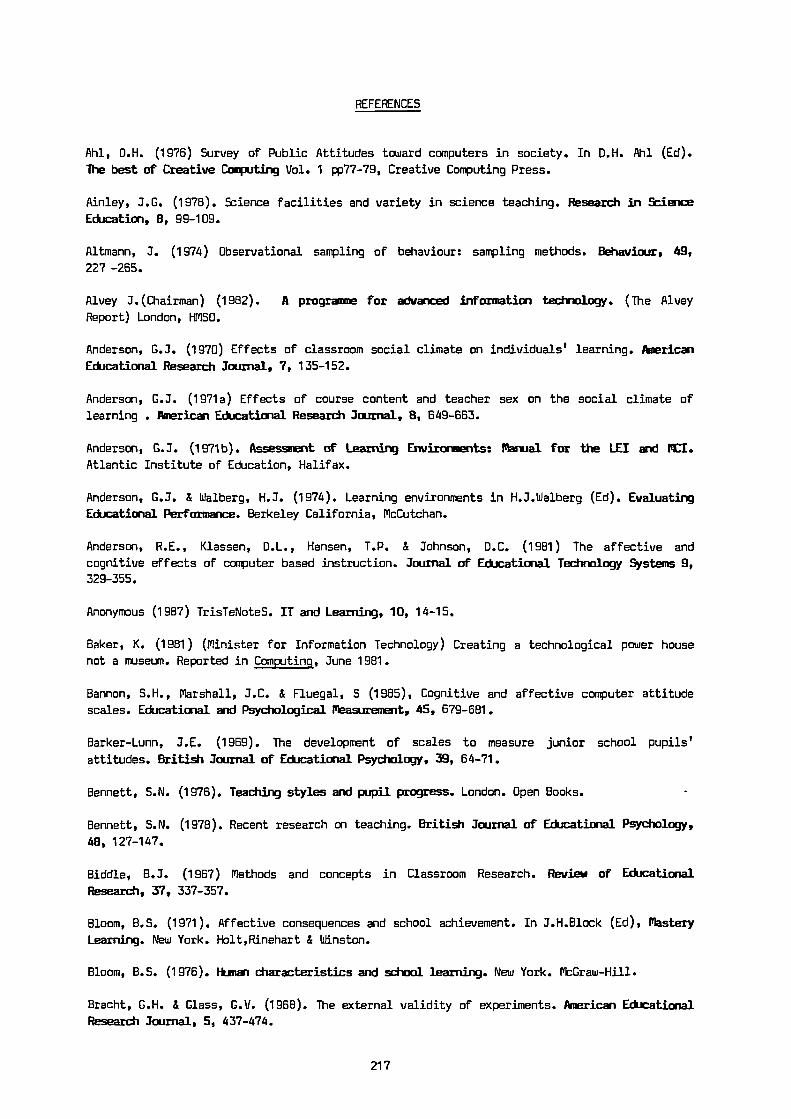
REFERENCES
Ahl, D.H. (1976) Survey of Public Attitudes toward computers in society. In D.H. Ahl (Ed).
The best of Creative Computing Vol. 1 pp77-79, Creative Computing Press.
Ainley, J.G. (1978). Science facilities and variety in science teaching. Research in Science
Education, B, 99-109.
Altmann, J. (1974) Observational sampling of behaviour: sampling methods. Behaviour, 49,
227 -265.
Alvey J.(Chairman) (1982). A programme for advanced information technology. (The Alvey
Report) London, HMSO.
Anderson, G.J. (1970) Effects of classroom social climate on individuals' learning. American
EdUcational Research Journal, 7, 135-152.
Anderson, G.J. (1971a) Effects of course content and teacher sex on the social climate of
learning . American Educational Research Journal, B, 649-663.
Anderson, G.J. (1971b). Assessment of Learning Environments: Manual for the LEI and MCI.
Atlantic Institute of Education, Halifax.
Anderson, G.J. & Walberg, H.J. (1974). Learning environments in H.J.Walberg (Ed). Evaluating
Educational Performance. Berkeley California, McCutchan.
Anderson, R.E., Klassen, D.L., Hansen, T.P. & Johnson, D.C. (1981) The affective and
cognitive effects of computer based instruction. Journal of Educational Technology Systems 9,329-355.
Anonymous (1987) TrisTeNoteS. IT and Learning, 10, 14-15.
Baker, K. (1981) (Minister for Information Technology) Creating a technological power house
not a museum. Reported in Computing, June 1981.
Bannon, S.H., Marshall, J.C. & Fluegal, S (1985), Cognitive and affective computer attitude
scales. Educational and Psychological, Measurement, 45, 679-681.
Barker-Lunn, J.E. (1969). The development of scales to measure junior school pupils'
attitudes. British Journal of Educational Psychology, 39, 64-71.
Bennett, S.N. (1976). Teaching styles and pupil progress. London. Open Books.
Bennett, S.N. (1978). Recent research on teaching. British Journal of Educational Psychology,
48, 127-147.
Biddle, B.J. (1967) Methods and concepts in Classroom Research. Review of Educational
Research, 37, 337-357.
Bloom, B.S. (1971). Affective consequences and school achievement. In J.H.Block (Ed), Mastery
Learning. New York. Holt,Rinehart & Winston.
Bloom, B.S. (1976). Human Characteristics and school learning. New York. McGraw-Hill.
Brecht, G.H. & Glass, G.V. (1968). The external validity of experiments. American Educational
Research Journal, 5, 437-474.
217

Bredderman, T. (1983). The effects of activity-based science on student outcomes. Review of
Educational Research, 83, 499-518.
Brown, S.A. & Davis, T.N. (1973) The development of an "attitude to science" scale for 12-14
year olds. Scottish Educational Studies, 5, 85,94.
Burstein, L.,Linn, R.L. & Capell, F.J. (1978) Analysing multilevel data in the presence of
heterogeneous within-class regressions. Journal of Educational Statistics, 3, 347-383.
Cameron, B.E. (1975) Some relationships between perception of teacher and motivational
dispositions in primary grade pupils. Australian Journal of Education, 19, 287-288.
Campbell, D.T. & Stanley, J.C. (1963). Experimental and quasi-experimental designs for
research. Chicago, Rand McNally.
Choppin, B & Frankel, R (1976) The three most interesting things. Studies in Educational.
Evaluation, 2, 57-61.
Christal, R.E. (1970) Implications of airforce occupational research for curriculum
development. In Smith, 6.13 & Moss, J. (Eds) Process and Techniques of Curriculum Development,
Minneapolis, University of Minnesota.
Clarke, V.A. (1986) The impact of computers on mathematics abilities and attitudes. Journal
of Computers in Mathematics and Science Teaching, 5, 32-33.
Comber, L.C. & Keeves, LP. (1973). Science education in nineteen countries. New York. Wiley.
Crisp, J.(1984). UK Market surges ahead. Financial Times, 16 April 1984.
Cronbach, L.J. (with Deken, J.E. & Webb, N.) (1976) Reearch on classrooms and schools:
Formulation of questions, design and analysis. Unpub. paper Stanford Educational Consortium,
Stanford, USA.
Dambrot, F.H., Watkins-Malek, M.A., Silling, S.M., Marshall, R.S. & Garver, J.A. (1985).
Correlates of sex differences in attitudes toward and involvement with computers. Journal of
Vocational Behaviour, 27, 71-86.
DES (Department of Education and Science) (1987). Homework. Education Observed 4, DES.
DES (Department of Education and Science) (1987). The National Curriculum 5-16. DES.
Docking, R.A. (1978) Anxiety, achievement and cognitive incongruence. Unpublished paper.
Murdoch University, Western Australia. Quoted in Fraser et al (1983).
Docking, R.A. & Thornton, J.A. (1979) Anxiety and the school experience. Paper at Annual
Conference of Australian Association for Research in Education, Melbourne. Quotedby Fraser et
al (1983).
Druva, C.A. & Anderson, R.D. (1983). Science teacher characteristics by teacher behaviour and
by student outcome: a meta-analysis of research. Journal of Research in Science Teaching,20,467-479.
Dunkerton, J. & Guy, J.J. (1981) The Science Teaching Observation Schedule: is it
Quantitative? European Journal of Science Education, 3, 313-316.
Edwards, A.L. (1957). Techniques of attitude scale construction. New York. Appleton-CenturyCrofts.
218
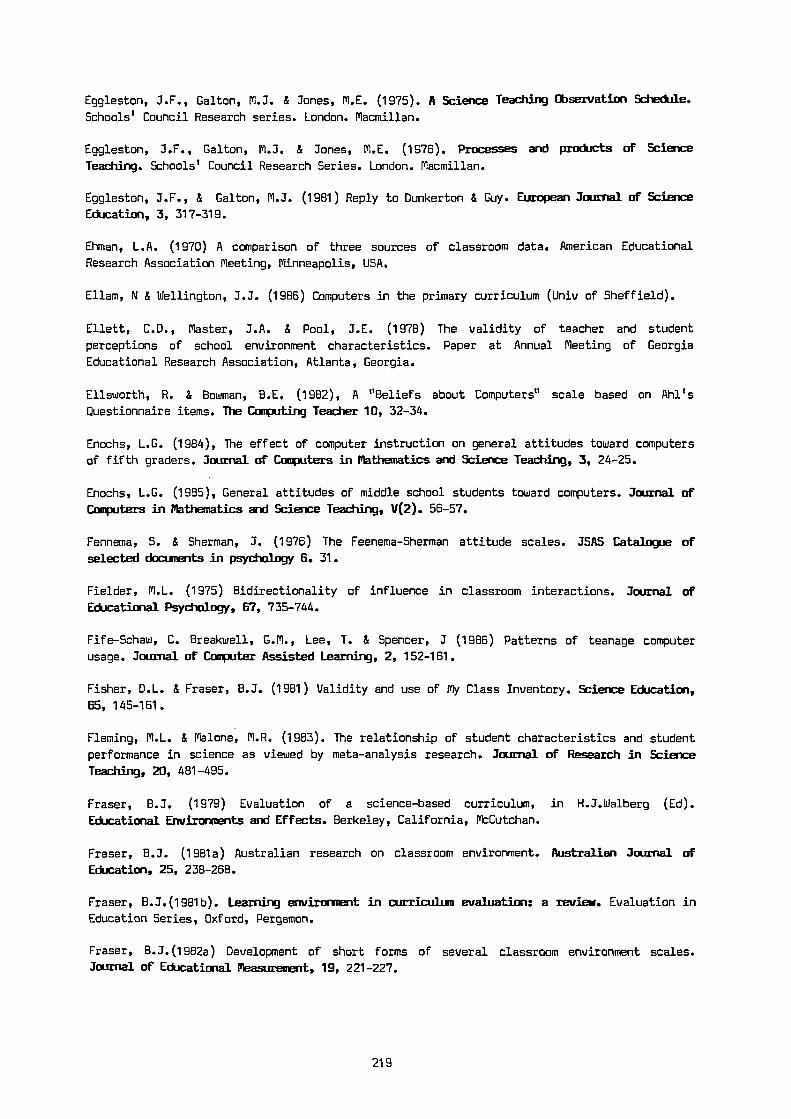
Eggleston, J.F., Galton, M.J. & Jones, M.E. (1975). A Science Teaching Observation Schedule.
Schools' Council Research series. London. Macmillan.
Eggleston, J.F., Galton, M.J. & Jones, M.E. (1976). Processes and products of Science
Teaching. Schools' Council Research Series. London. Macmillan.
Eggleston, J.F., & Galton, M.J. (1981) Reply to Dunkerton & Guy. European Journal of Science
Education, 3, 317-319.
Ehman, L.A. (1970) A comparison of three sources of classroom data. American Educational
Research Association Meeting, Minneapolis, USA.
Ellam, N & Wellington, J.J. (1986) Computers in the primary curriculum (Univ of Sheffield).
Ellett, C.D., Master, J.A. & Pool, J.E. (1978) The validity of teacher and student
perceptions of school environment characteristics. Paper at Annual Meeting of Georgia
Educational Research Association, Atlanta, Georgia.
Ellsworth, R. & Bowman, B.E. (1982), A "Beliefs about Computers" scale based on Nil's
Questionnaire items. The Computing Teacher 10, 32-34.
Enochs, L.G. (1984), The effect of computer instruction on general attitudes toward computers
of fifth graders. Journal of Computers in Mathematics and Science Teaching, 3, 24-25.
Enochs, L.G. (1985), General attitudes of middle school students toward computers. Journal of
Computers in Mathematics and Science Teaching, V(2). 56-57.
Fennema, S. & Sherman, J. (1976) The Feenema-Sherman attitude scales. 3S1S Catalogue of
selected documents in psychology 6. 31.
Fielder, M.L. (1975) Bidirectionality of influence in classroom interactions. Journal ofEducational Psychology, 67, 735-744.
Fife-Schaw, C. Breakwell, G.M., Lee, T. & Spencer, J (1986) Patterns of teanage computer
usage. Journal of Computer Assisted Learning, 2, 152-161.
Fisher, D.L. & Fraser, BO. (1981) Validity and use of my Class Inventory. Science Education,
65, 145-161.
Fleming, M.L. & Malone, M.R. (1983). The relationship of student characteristics and student
performance in science as viewed by meta-analysis research. Journal of Research in Science
Teaching, 20, 481-495.
Fraser, B.J. (1979) Evaluation of a science-based curriculum, in H.J.Walberg (Ed).
Educational Environments and Effects. Berkeley, California, McCutchan.
Fraser, B.J. (1981a) Australian research on classroom environment. Australian Journal of
Education, 25, 238-268.
Fraser, B.3.(1981b). Learning environment in curriculum evaluation: a review. Evaluation in
Education Series, Oxford, Pergamon.
Fraser, B.J.(1982a) Development of short forms of several classroom environment scales.
Journal of Educational Measurement, 19, 221-227.
219

Fraser, BO. (1982b) Differences between student and teacher perceptions of actual and
preferred classroom learning environment. Educational Evaluation and '.licy Analysis, 4,
511-519.
Fraser, B.J. (1983) Improving classrooms through evaluation of learning environments. Annual
Meeting of American Research Association, Montreal.
Fraser, B.J. (1986). Classroom environment. London, Groom Helm.
Fraser, B.J. (1987) Syntheses of educational productivity research. International Journal of
Educational Research, 11, 147-255.
Fraser, B.J.,Anderson, G.J. & Walberg, H.J. (1982). Assessment of Learning
Environments:Manual for Learning Environment Inventory (LEI) and my Class Inventory (MCI).
(Third edition). Perth, Australia, Western Australia Institute of Technology.
Fraser, B.J. & Fisher, D.L. (1982a) Predicting students' outcomes from their perceptions of
classroom psychosocial environment. American Educational Research Journal, 19, 498518.
Fraser, B.J. & Fisher, D.L. (1982b) Effects of anxiety on science-related attitudes. European
Journal of Science Education, 4, 441-450.
Fraser, B.J. & Fisher, D.L. (1983a) Development and validation of short forms of some
instruments measuring student perceptions of actual and preferred classroom learning
environment. Science Education, 67, 115-131.
Fraser, B.J. & Fisher, D.L. (1983b) Effects of classroom openness on science students'
achievements and attitudes. Research in Science and Technological Education, 1, 41-51.
Fraser, B.J., Nash, R. & Fisher, D.L. (1983) Anxiety in science classrooms: its measurement
and relationship to classroom environment. Research in Science and Technological Education,1, 201-208.
Fraser, B.J. & Walberg, H.J. (1961) Psychosocial learning environment in science classrooms.
Studies in Science Education, 8, 67-92.
Galton, M.J. (1978). British Mirrors: A collection of classroom observation systems.
Leicester, University of Leicester School of Education.
Galton, M.J. & Eggleston, J.F. (1979) Some characteristics of effective science teaching.
European Journal of Science Education, 1, 75-86.
Gardner, P.L. (1975a) Attitudes to science: a review. Studies in Science Education, 2, 1-41.
Gardner, P.L. (1975c) Attitude measurement, a critique of some recent research. Educational
Research, 17, 101-109.
Gardner, P.L. (1976) Attitudes toward physics: personal and environmental influences. Journal
of Research in Science Teaching, 13, 111-125.
Garland, G. (Ed) (1982) Microcomputers and children in the primary school Lewes, Falmer
Press.
Glass, G.V. (1977) Integrating findings: the meta-analysis of research. Review of Research inEducation, 5, 351-379.
220
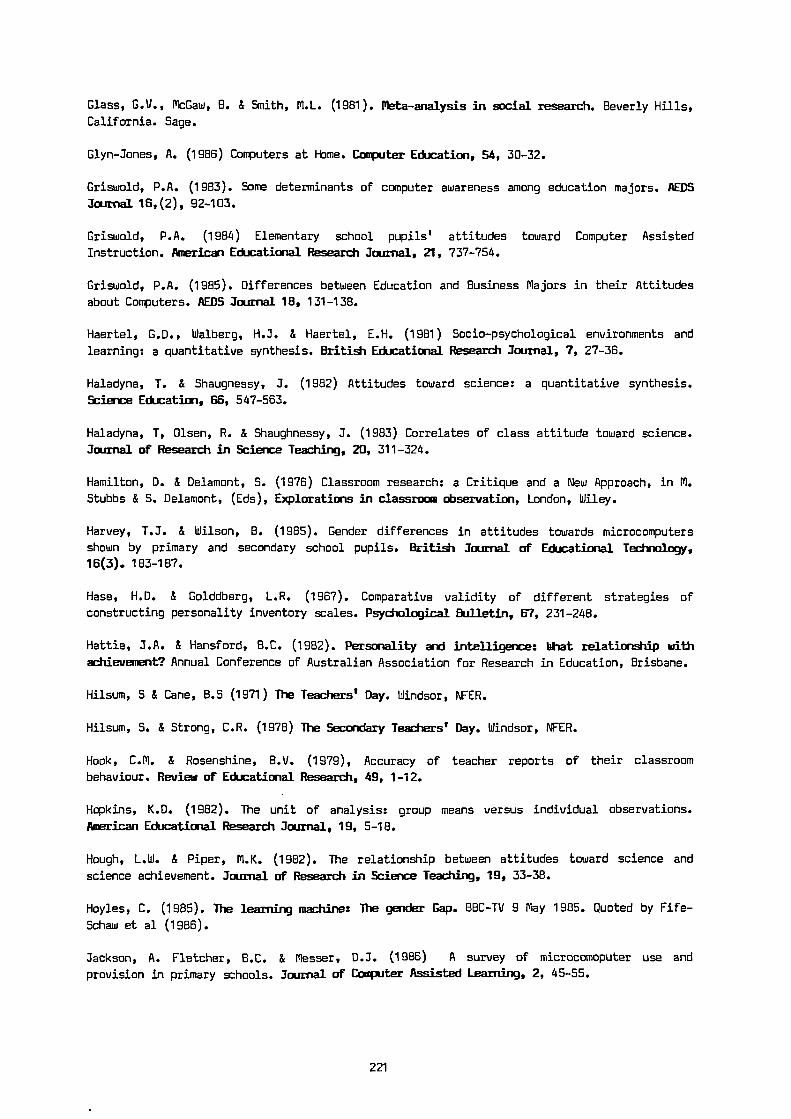
Glass, G.V., McCaw, B. & Smith, M.L. (1981). Meta-analysis in social research. Beverly Hills,California. Sage.
Glyn-Jones, A. (1986) Computers at Home. Computer EdUcation, 54, 30-32.
Griswold, P.A. (1983). Some determinants of computer awareness among education majors. REDS
Journal 16,(2), 92-103.
Griswold, P.A. (1984) Elementary school pupils' attitudes toward Computer Assisted
Instruction. American EdUcational Research Journal, 21, 737-754.
Griswold, P.A. (1985). Differences between Education and Business Majors in their Attitudes
about Computers. REDS Journal 18, 131-138.
Haertel, G.D., Walberg, H.J. & Haertel, E.H. (1981) Socio-psychological environments and
learning: a quantitative synthesis. British Educational Research Journal, 7, 27-36.
Haladyna, T. & Shaugnessy, J. (1982) Attitudes toward science: a quantitative synthesis.
Science Education, 66, 547-563.
Haladyna, T, Olsen, R. & Shaughnessy, J. (1983) Correlates of class attitude toward science.
Journal of Research in Science Teaching, 20, 311-324.
Hamilton, D. & Delamont, S. (1976) Classroom research: a Critique and a New Approach, in M.
Stubbs & S. Delamont, (Eds), Explorations in classroom Observation, London, Wiley.
Harvey, T.J. & Wilson, B. (1985). Gender differences in attitudes towards microcomputers
shown by primary and secondary school pupils. British Journal of Educational Technology,16(3). 183-187.
Hese, N.D. & Golddberg, L.R. (1967). Comparative validity of different strategies of
constructing personality inventory scales. Psychological Bulletin, 67, 231-248.
Hattie, J.A. & Hansford, B.C. (1982). Personality and intelligence: What relationship with
achievement? Annual Conference of Australian Association for Research in Education, Brisbane.
Hilsum, S & Cane, 6.5 (1971) The Teachers' Day. Windsor, NFER.
Hilsum, S. & Strong, C.R. (1978) The Secondary Teachers' Day. Windsor, NFER.
Hook, C.M. & Rosenshine, B.V. (1979), Accuracy of teacher reports of their classroom
behaviour. Review of Educational Research, 49, 1-12.
Hopkins, K.D. (1982). The unit of analysis: group means versus individual observations.
American Educational Research Journal, 19, 5-18.
Hough, L.W. & Piper, M.K. (1982). The relationship between attitudes toward science and
science achievement. Journal of Research in Science Teaching, 19, 33-38.
Hoyles, C. (1985). The learning machine: The gender Gap. BBC-TV 9 May 1985. Quoted by Fife-
Schaw et al (1986).
Jackson, A. Fletcher, B.C. & Messer, D.J. (1986) A survey of microcomoputer use and
provision in primary schools. Journal of Computer Assisted Learning, 2, 45-55.
221
Johnson, D.W., Maruyama, G., Johnson, R., Nelson, D., & Skon, L. (1981). Effects of
cooperative, competitive, and individualistic goal structures on achievement: a meta-
analysis. Psychological Bulletin, 89, 47-62.
Jordon, V.B. & Brownlee, L. (1981). Meta-analysis of the relationship between Piagetian andschool achievement tests. Annual meeting of American Educational Research Association.
Joslin, P.A. (1981) Inservice teacher education: a meta-analysis of the research.
Dissertation Abstracts International, 41, 3058A.
Kelly, A , (1981) The missing half: girls and science education. Manchester UniversityPress.
Konvalina, J., Stephens, L. & Wileman, S. (1961). Identifying factors influencing Computer
Studies aptitude and achievement. REDS Journal, Winter 1983, 106-112.
Lawrenz, F.P. (1976a) Student perceptions of the classroom learning environment in biology,
chemistry and physics courses. Journal of Research in Science Teaching, 13, 315-323.
Lawrenz, F.P. (1976b) The prediction of student attitude toward science from student
perception of the classroom learning environment. Journal of Research in Science Teaching,
13, 509-515.
Lawton, J. & Gerschner, V.T. (1982) A review of the literature on attitudes towards computers
and computerised instruction. Journal of Research and development in Education, 16(1). 50-55.
Lee, R.S. (1970), Social attitudes and the computer revolution. Public %inion Quarterly, 34.
53-59.
Lewis, J. & Adank, R. (1975) Intercorrelations among measures of intelligence, self-esteem
and anxiety in two groups of pupils exposed to two different models of instruction.
Educational and Psychological Measurement, 35, 449-501.
Lichtman, D. (1979) Survey of educator's attitudes toward computers. Creative Computing, 5,
4B-50.
Lilley, A. & Wilkinson, W.J. (1983). Personal characteristics of teachers and their oral
interactions in Further Education classrooms. Research in Science and Technological
Education, 1, 53-63.
Lindquist, E.F. (1940). Statistical analysis in educational research. New York.
Loyd, B.H. & Gressard, C. (1984a), Reliability and factorial validity of computer attitude
scales. Educational and Psychological Measurement. 44, 501-505.
Loyd, B.H. & Gressard, C. (1984b) The effects of sex, age and computer experience on computer
attitudes. REDS Journal. Winter 1984, 67-77.
McCallon, E.L. & Brown, 3.0 (1971) A semantic Differential Instrument for Measuring Attitude
Toward Mathematics. The Journal of Experimental Education, 39, 69-72.
McGarity, J.R. & Butts, D.P. (1984) The relationship among teacher management behaviour,
student engagement, and student achievement of middle and high school science students of
varying aptitude. Journal of Research in Science Teaching, 21, 55-61.
McIntyre, D. & MacLeod, G (1978) The characteristics and uses of systematic classroom
observation, in R. McAleese & D. Hamilton (Eds) Understanding classroom life, London, NFER.
222

Mallow,J.V.& Greenburg,S.L.(1982) Science anxiety: causes and remedies. Journal of College
Science Teaching, 11, 356-358.
Marjoribanks, K. (1974). (Ed). Environments for learning. NFER.
Mathews, W.M. & Wolf, A.W. (1979) The computer attitutude continuum. Proceedings of the
Association for EdUcational Data Systems Annual Conference. New York.
Medley, D.M. & Mitzel, H.E. (1963) Measuring classroom behaviour by systematic observation,
in N.L.Gage (Ed) Handbook of Research on Teaching, Chicago, Rand-McNally.
Mintzes, J.J. (1982) Overt teaching behaviours and student ratings of instructors. Journal of
Experimental Education, 48, 145-153.
Mohamedali, M.H., Messer, D.J. & Fletcher, B.C. (1987) Factors affecting micro-computer use
and programming ability of secondary school children. Journal of Computer Aqsisted Learning,
3, 224-239.
Moore, J.L. (1984). The development and use of a questionnaire measuring secondary school
pupils' attitudes to computers and rdbots. Unpublished M.Phil thesis. University ofNottingham.
Moore, J.L. (1985a) Development of a questionnaire to measure secondary school pupils'
attitudes to computers and robots. EdUcational Studies, 11, 33-40.
Moore, J.L. (1985b) An empirical study of pupils' attitudes to computers and robots. Journal
of Computer Assisted Learning, 1, 87-98.
Moore, J.L. (1987). Is using a computer at home more valuable than using a computer at
school? Computer Education, 56, 13-14.
Moos, R.H. (1974). Evaluating treatment environments. New York, Wiley.
Moos, R. H. (1979). Evaluating educational environments: procedUres, measures, findings and
policy implications. San Francisco, Jossey-Bas.
Moos, R.H. & Teickett, E.J. (1974). Classsroom environment scale manual. California,
Consulting Psychologists Press.
Morrison, P.R. (1983). A survey of attitudes toward computers. Communications of the ACM, 26.
1051-1057.
Munby, H (1980) An evaluation of instruments which measure attitudes to science. In McFadden
(Ed) World trends in science education. Halifax, Nova Scotia, 266-275.
Nagy, P (1978) Subtest formation by cluster analysis of the scientific attitude inventory.
Journal of Research in Science Teaching, 15 , 355-360.
Neill, S.R. St J., (1983) Choosing an Appropriate Observation Method for Science Lessons.
European Journal of Science EdUcation, 5, 327-331.
Newfield, J (1980) Accuracy of teacher reports: reports and observations of specific
classroom behaviours. Journal of EdUcational Research, 74, 78-82.
Nissen, J. & Riis, U (1985). Datalara pa grundskolans hogstadium: en ogonblicksbild fran tre
kommuner och sex skolor vintern 1984/5. Tema T Rapport 10, 1985. Linkoping, Sweden.
University of Linkoping.
223
Oppenheim, A.N. (1966). Questionnaire design and attitude measurement. London. Heinemann.
Osgood, C.E. (1952) The nature and measurement of meaning. Psychological Bulletin, 49, 197-
237.
Osgood, C.E., Suci, G.J. & Tannenbaum, P.H. (1957). The measurement of meaning. Urbana, Ill.
University of Illinois.
Pace, C.R. & Stern, G.G. (1950 An approach to the measurement of psychological
characteristics of college environments. Journal of Educational Psychology, 49, 269-277.
Paschal, R., Weinstein, T. & Walberg, H.J. (1984). The effects of homework on learning: a
quantitative synthesis. Journal of Educational Research, 78, 97-104.
Peck, R., Fox, R. & Blattstein, D. (1979) Teacher characteristics that influence student
evaluations. Austin, Texas. The University of Texas at Austin Centre for Teacher Education.
Power,C.N.( 1977) A critical review of science classroom interaction studies. Studies in
Science Education, 4, 1-30.
Reece, M.J. & Gable, R.K. (1982), The development and validation of a measure of general
attitudes towards computers. Educational and Psychological Measurement 42, 913-6.
Rentoul, A.J. & Fraser, B.J. (1978) Measuring perceptions of inquiry and open learning
environments. Research in Science Education, 8, 79-88.
Rentoul, A.J. & Fraser, B.J. (1979) Conceptualisation of enquiry-based or open classroom
learning environments. Journal of Curriculum Studies, 11, 233-245.
Richards, P.S., Johnson, D.W., & Johnson, R.T (1986), A scale for assessing student attitudes
toward computers. Computers in the Schools. 3, 31-38.
Rosenshine, B. (1971). Teaching behaviours and student achievement, London, NFER
Rosenshine, B. & Furst, N. (1973). The use of direct observation to study teaching, in
R.M.W.Travers (Ed.) Second handbook of research on teaching. Chicago, Rand McNally.
Schibeci, R.A. (1977) Attitudes to science: a semantic differential instrument. Research in
Science Education, 7, 149-155.
Schibeci, R.A. (1982) Measuring Student Attitudes: Semantic Differential or Likert
Instruments? Science Education, 66, 565-570.
Schibeci, R.A. (1984) Attitudes to science: an update. Studies in Science Education, 11,
26-59.
Schofield, H.R. & Start, K.B. (1978) Mathematics attitudes and achievement among student
teachers. Australian Journal of Education, 22, 77-82.
Shavelson, R. & Dempsey-Atwood (1976) Generalisability of measures of teaching behaviour.
Review of Educational Research, 46, 553-611.
Shymansky, LA., Kyle, W.C., & Alport, J.M. (1983). The effects of new science curricula on
student performance. Journal of Research in Science Teaching, 20, 387-404.
Sieber, J. E., O'Neil, H.F. & Tobias, S. (1977). Anxiety, learning and instruction. New York.
Wiley.
224
Simon, A. & Boyer, E.G (1968). Mirrors for Behaviour, Philadelphia, USA. Research for Better
Schools Inc.
Simon, A. & Boyer, E.G (1974). Mirrors for Behaviour III, Communication Materials Centre.
Slater, B.C. & Thompson, J.J. (1977) Science teachers described-a new method for the
understanding of individual differences. School Science Review, 59, 49-57.
Smeltzer, D.K. (1981) The media specialist and the computer. THE Journal, 8, 50-53.
Spaul, B. (1987). University of Hull Bulletin 97, (December 1987) 1-3.
Steele, J.M., House, E.R. & Kerins, T. (1971) An instrument for assessing instructional
climate through low-inference student judgements. American Educational Research Journal, 7,
447-466.
Steinkamp, M.W. & Maehr, M.L. (1983). Affect, ability and science achievement: a quantitative
synthesis of correlation research. Review of EdUcational Research, 53, 369-396.
Stewart, R. (1967). Managers and their jobs. London. Macmillan.
Stewart, R. (1975) The manager in his job: a behavioural view point. New Behaviour, 1, 2-20.
Stinchcombe, A.L. (1972) The social determinants of success. Science, 178, 603-604.
Sweitzer, G.L. & Anderson, R.D. (1983) A meta-analysis of research on science teacher
education practices associated with inquiry strategy. Journal of Research in Science
Teaching, 20, 453-466.
Talmage, H. & Hart, A (1977) A study of investigative teaching of mathematics and effects on
the classroom learning environment. Journal of Research in Mathematics EdUcation, 8, 345-358.
Tamir, P. (1983) Teachers' Self Report as an Alternative Strategy for the Study of Classroom
Transactions. Journal of Research in Science Teaching, 20, 815-823.
Thomas, K.C. (1978) Attitude measurement. Nottingham. University of Nottingham School of
Education.
Tisher, R.P. & Power, C.N. (1975) The effects of classroom activities and pupils perceptions
where self-paced curricula are used. Quoted by Fraser, 1986.
Trickett, E.J. & Moos, R.H. (1973) Social environment of junior high and high school
classrooms. Journal of Educational Psychology, 65, 93-102.
Turkle, S. (1984). The second self: computers and the human spirit. Granada, London.
Wagman, M. (1983). A factor analytic study of the psychological implications of the computer
for the individual and society. Behaviour Research Methods and Instrumentation, 15, 413-419.
Walberg,H.J. (1968) Teacher personality and classroom climate. Psychology in the schools, 5,
163-169.
Walberg,H.J. (1969) Predicting class learning: a generalised regression approach to the class
as a social system. American Educational Research Journal, 6, 529-542.
Walberg, H.J. (1976) The psychology of learning environments: Behavioural, structural or
perceptual? Review of Research in Education, 4, 142-178.
225

Walberg, H.J. (1981) A psychological theory of educational productivity. In F.H.Farley and N.Gordon (Eds). Psychology and Education. Berkeley, California, McCutchan.
Walberg, H.J. (1982) What makes schooling effective? Contemporary Education Review, 1, 23-34.
Walberg, H.J. (1984) Improving the productivity of America's schools. Educational Leadership,41, 19-30.
Walberg, H.J. (1986). Synthesis of research on teaching. In M.C.Wittrock (Ed). Handbook of
research on teaching. (Third edition). Washington, D.C. AERA.
Walberg, H.J. & Marjoribanks, K. (1976) Family environment and cognitive development. Review
of Educational Research, 46, 527-531.
Ward, J.H.(Jr) (1963) Hierarchial grouping to optimise an objective function. American
Statistical Association Journal, 58, 236-244.
Waxman, H.C. & Eash, M.J. (1983) Utilising students' perceptions and contexE variables to
analyse effective teaching: a process-product investigation. Journal of Educational Research,
76, 321-325
Weinstein, T., Boulanger, F.D. & Walberg, H.J. (1982) Science curriculum effects in high
school: a quantitative synthesis. Journal of Research in Science Teaching,19, 511-522.
Weiss, J. (1973) Validating and improving instruments for describing openness of school
program. Toronto, Ontario Institute for Studies in Education.
Welch, W.W. & Walberg, H.J. (1972) A national experiment in curriculum evaluation. American
Educational Research Journal, 9, 373-383.
Wellington, J.J. (1987). Skills for the future. HMSO for Manpower Services Commission.
Willett, J.B., Yamashita, J.J.M. & Anderson, R.D. (1983) A meta-analysis of instructional
systems applied to science teaching. Journal of Research in Science Teaching, 20, 405-417.
Williams, F., Coulombe, J. & Lievrou, L. (1983) Children's attitudes towards small computers.
Educational Technology and Communication Journal, 31(1). 3-7.
Willson, V.L. (1983). A meta-analysis of the relationship between science achievement and
science attitudes. Journal of Research in Science Teaching, 20, 839-850.
Willson, V.L. & Puttnam, R.R. (1982). A meta-analysis of pretest sensitisation effects in
experimental design. American Educational Research Journal, 19, 249-258.
Wise, K.C. & Okey, J.R. (1983). A meta-analysis of the effects of various science teaching
strategies on achievement. Journal of Research in Science Teaching, 20, 419-435.
Wolf, B. (1983) On the assessment of the learning environment. Studies in Educational
Evaluation, 9, 253-265.
Youngman, M.B. (1979a). Designing and analysing questionnaires. Nottingham. University of
Nottingham School of Education.
Youngman, M.B. (1979b). Analysing Teachers' Activities: Technical Report. London, Social
Science Research Council.
Youngman, M.B. (1979c). Analysing Social and Educational Research Data. London, McGraw-Hill.
226

Youngman, M.B. (1982) A System for Describing Teachers' Jobs. Educational Studies, 8, 23-30.
Youngman, M.B. (1983) Intrinsic Roles of Secondary School Teachers British Journal of
Educational Psychology, 53, 234-246.
Youngman, M.B., Oxtoby, R., Monk, J.D. & Heywood, J. (1978) Analysing Jobs. Farnborough,
Hants. Gower Press.
Zimmerman, B.J. (1970) The relationship between teacher classroom behaviour and student
anxiety levels. Psychology in the Schools, 7, 89-93.
Zuckerman, M. (1960). The development of an affect adjective checklist for the measurement of
anxiety. Journal of Consulting Psychology, 24, 457-462.
227

APPENDIX
CONTENTS
Teacher completed instruments
1. The Activities in Computer Studies Teaching Booklet 2292. The Lesson Diary Report Form 238
The Pupil scales
1. The CARAQ scales 2402. The Classroom Environment scales 242
The 19 Teacher Activity scales 245
T-test results on Teacher Activities by teacher characteristics 252
Breakdown of Activity scale scores by Importance-matrix ratings. 253
T-test results on Computer Attitudes by pupil variables. 254
T-test results on Classroom Environment scores by pupil variables. 257
Correlations between pupil attitude and perception variables. 260
Regression analysis results. 261
ITE Seminar: List of invited participants. 268
228

010
AC'0
, -, 4 H..4-' - r--1g;11o
.1a, 931
4.eO -pCO g 111 114 03 4.
$4 94 V ..4
/-1 0 Y.o g 0U3 9-1 13
04. 0gg
94113 54
0 00 0 91IX g4.
0.043O A ; ca
L.)
t a)•
o s• •41 0 44
o A -R 45_
0 0O 0.0
9-1 0
v e..
0 V
.0 0 -,-,-4'
_1.'.
4 .5d
4 4 g 0 .... 0O 0a .
is. 4 0 8 0 4 0 0.0
,-1 .0 1),1 4.4'O g 4.4.O P. 0 0 .0 0O 0 .b E 01) 0 104.4. 03 4. 9494 0 i.n 0 iiO ,-4 0
O .0 .0 0 ..-1 > gg 9-1O 4' A 1.0
9-1Ilt" a 4. 0OD
4. 0O 0
i a/ g EO 0O .0 0II 0
4 89-14.
CD .0g 4
.OM94009:3 •00 01
0CO g- g4-,$4OS 03 0 0
09-1 0 43 ts: 0 90 4094 -.4
1.4 03
HO 4'' 01-4.,
4"
g ID g 4g4-,
4'.,1k .I.,4 >!t0, Z A 0
R
c 1I
• a 4.4
10 r4 > 11.0
0 a'91-Pr-1 CD 9-1 0• ,-1 0 0- 00 ,-1E111
8 4.', 4. ri 0 0 ,-1
= 0 '41 4. 0 'CI 0 g I-1_
9-1 .0j 0 0 g 04. a 44-1 0 0g
0 to 0 Cl).1-1 1140 0 0 14 TS
+ 4
0) t'CO 0
114 CO14
CO P. O0 r9 gO 4.
15.-I
.4 0 0
A' „..9 4. 0 4. >,
04-.'-k r-400 0O 0 0it o 4. Po -0 0 CD 94 Li \
E C3O 0 til 1 g O' f, 2.0 0 0 4,
11.0 5 k 4., 8
_ 0 R. .4 0 0 91 ZO CD > .3
a 4 % i 1 g '.--1 0
"A 0 I0 b-44'O a g /4 ri 0.314 &I 17 P P =
cn L. bu
Lu cu In a-11--+• mIIMI
. =An46.a
J . a1 E>. -0 u
• O .-ErDLI 41-4 CU
EC.LJ LflF-229
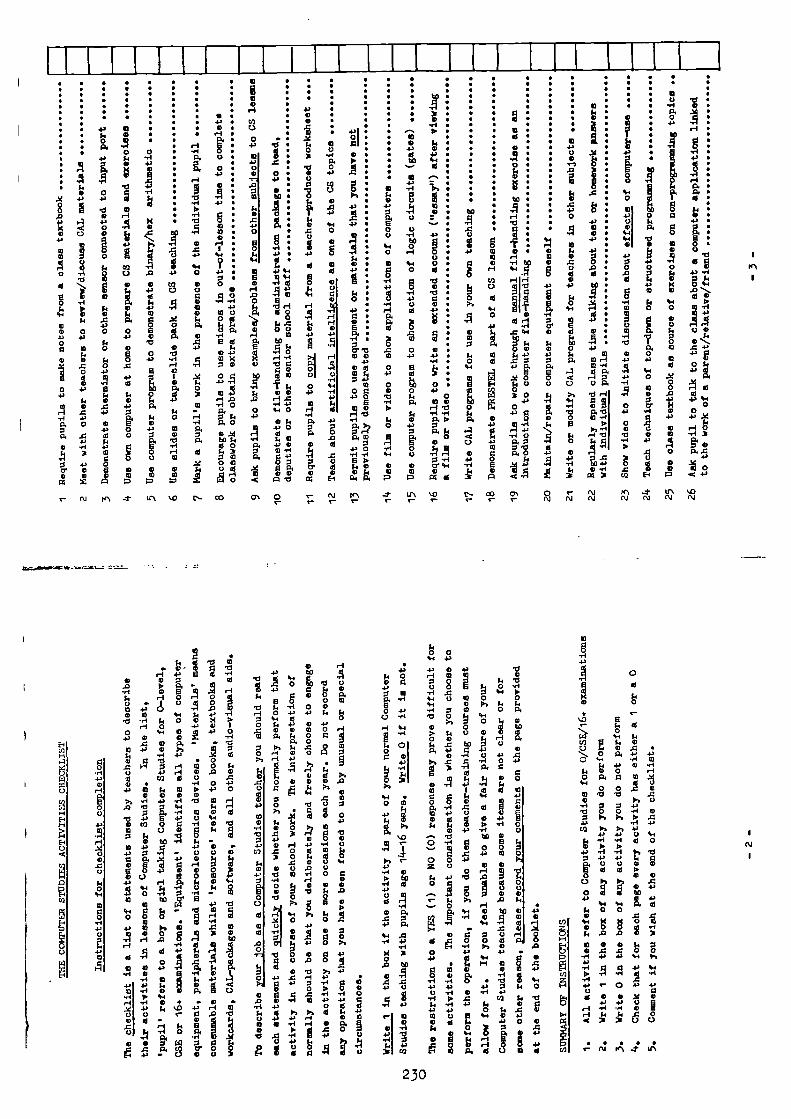
1
a
%.0N
•
NNN• N • N 14l cO Crsr. C +-
11-N a.0
44- •
4. 0
k .,0 •0 eePo lO 0
43 k 'elge
• +,g _1"4 .0
..,0 2 t'2 A4.' 1 g0
t S0
.14.
g
..,154 CO
2 0
g o o
b 4.0 0
.tt o
Si CO
.0 P• g0O 49 g
5. '0O oE 0O 4.
.0
4. e
co 4. al
..4 • tOElkSe f4'• 0
.0 4. Pt
4. 0
• 64 ko
44 0 4.O 0 Z
54 E.0
E 04.
0 00O V 0A 0
100
tea -.1"
CgC0
.-1•45 CO• 1..).--1
O 0 g4. .0O 0
4., o 0
., 4.*3 A4 g o
AOk .g44
P .0o 0
O 4, aO 0o g,-1 aI 0 +4
4 4.444O
? 14
4.. q 44aO 4O oI ,-, 4•9-2 r00 .54. 14O 0P. 0
O 14E -..-a
3g. 0 o+4 ..4E • P.F., 0O X Si4) 4.'O g 04'44 10 4 14.-4.0 .0-.4 0Pt 0p 54 -55P.O o ..4 A101-. TICO P.
1 MI ..:
sti 0 .4
r-I80
4bpr4PP 0gI
•
14oH 444
▪
0k
4. 0141
.42 04"8pU P.o •0
IA %.1" N a a% 0
3 ri4. 1.0 ..1.0 g ,t4
ID k o4. 0 g0 21 00C .0
POOP.14 go O 0.0 E ,., 0 0I-1 0 4. 4. $4 14O 4-. • oo 14 440440 4.
'I 0000 4-1c.,k001
a. 0 Sp / 8 oO .-IO U0>, 0-1 44 g14O 14
,_.,.,O C>.
E-. 4414 >a A'C
.00 o 0 0 0O L0
C 0 .00.440 +:1 0 0U >. .s1 2 2 0O 145.14 44
4-1 C+40o SITs 4 ), g 4'
4. m H 4. .4 0m ooO 44
0 4 00,01+
0g 0j 0 14
F4 4 • 0.1• 0 0 ..0 944 4' 0 +4 a0a . .1 e-1 o
•Y ,:, ,.. .0
. . ..O 4' 00 a alOc., I.. gC 4-4 44 il 14 el
.4 0 0 0co UI 4.
O 0 1 : g..4 043 t 4-, 0
4' is 0 0 441
.0 0 AO .0 10)44 .0 .-I 4.,O 4., 0 +4 e i. . .44 ,0
+I +4 0o E 0...-1 4+ 0 • g,0 0 0 4, 4,I. • 03 P.,. •S k 4,o 00O 4 .0 . . 44 . , , 4, - • •
+4 4•P.o 5
B.0C
O js40)
21 .0 .5o 44 k-g I
0O al .9
0
•
$0, i Tig 4• .4., e .,..1a a at g' :1 5 .-1.-, 0 0 %
4: A 0 .5 o Eo <n-n i.; $14-) -,-1
.,-1 si o 0 t45 nr-I 044 0
O
•
+I4+.2 g
• 10+I +5 .1
gA ,0p H 1;
00 $44. .--1 a .0 a.aco a 0
• ..-1 o 4.el k 0 • .t, 0o o m cori 4-, ..-1 ,o1 CO .--14:1 k Hp gm -,4" 0 o 0
4-, 0 n-nc o' o a - Ho ka , 31o 0.0s• oa to .,-1 14
4. .,4f.) -c! Zo -
Pe 4. 0g g )-I
o g 1c.3 E 0 10
.:p.5 4) 44
?1 p4 4 oP
...i _54 2.ti w
i t S.4
.
El
•cl 4. ti
g 4 gC n o +4O 14,0 .0 0O 0 0
o A 07.H .0 00
..4 • A .24 g +, 14
OCO -O 4 5.4., -.it g I.•
n--I4-1 a $44.'4-, k i-el m '1 g:14 El• le-ieel 0 + . o ....4., k ‘.0 4. I-1 el0O - 0 li
54 0,., a.l OP.g ::4)1+4
• P141 0 CI koA Pt 0C) rf
04. 00 )
kO 044 4.•
4. 44 04'4, 21k 0 1-1 0 oO P g 8 i 14'd
4., F., 0-elO es -.4.0 0 44 >
;1' -.4 9+4 0 0 0 0,.
O p. S. kO 4.' +4 CO OP.U -44 'V g 4e4
?.a Y 0 b cZr+ 4-4 0 130
E -r4> $4 0 0$4 .0 f21) p
1-10 SeO Pe +0' 4 a,O 0 0 44 4
+I 0 4.0
O 0
>a .0 0x -ri Pe gk..-1
g 0: 00. k 14 o 0
>1 m •,-1 4-, ”-1C I 0 b_ 10
44 • P g 54 LI 4.O 0 0 2 0a.
4-, g. .44'1 .40 'IS 0;
R.. 111$4 14 g
o0'4
44O 4. -41*+ 0
11 00 PE kP4 I 0 .,..
2g 0 0.0 44 CO 0
0+ a- 0 0 4.4; z 0 00-.4 0 0 )-1 N '14.,4 go 6. 44 .0 .0
Z g 1 8 0
4. 0O .-.4. g 0Cl/ 1
r- 14 >a A $4..... Or.,
•O Pe .R. 444 o to o 4,
44 0 0 co o.0 0 -1-1
1 g .r.41
.13 Pe . 9-•94.0 o 0 0 n-1 8 +4 4. • .0E-
10 0 0+I +4 14 V .0
U• 4H M
,W A 0O
44 4. ••4. t
,*4.0 60 1 4,6 El• g g 0
o44.4 .0 *1-1 er1 8. • •cl $ .
cii. . 444.' 4. P1400.w0 -.4 0 .04 4.
-.4 14 .0lo 4 Cl)4. ,.. 014 10 b
44
•
4.' 0 k AC O 0k 94 0 4.,
44 0 •• ..1 l.'s
el o 0 .011 a .. g 2 4.
..4 04. 0
t A g 3 14.)s. 4.,g g3, (0 Pe 0 10 • 1/1
0
0+ a-
1/40 El, I., al
4 09414Cl) 014000 14 0 .0 •.... 0 •e
▪
l 0-, 43 -I-1
$4. k- 40 ,-.1
O P.O U. .X...4 o o .5 ,gO 4.4'.0• 1,--. -0..-14-,V 8 8 ..-1 toO ?.. >a • .0
4. -.44'Cl) 4,1,, 4t, 4.0 si
t -,4 .,-1 CO • •444.4”.1 ON 21
O 4. 4. Sc 000' 0 0 45• • •O 00
U 0. .O g ?
0 44000
44 Vlo 4.'4+ Fe ca$40 00• .4 .5o44
g g o
COO C.4A.0 .0 0 ACV 01. 00 .0.0 00-r1 4. 4. 94 Ira4.''.1 1 4t.
4, ...4 -,4
4. r- 0 44 44O 00 • O. 04444 00 g,-1 .,4 .,-, 0 E"-I 0$4 $44C 31 31 6 0
• • • • •• N
230

[ 1
• ••
Co 44 •4.3 0
• 0 01 Co CoI, .
3' Coa .1-Ig Co OV gC
o k
,-, HI: Co0 00 Co1• • 4-4, 4. 60 0
.4 Co . ,-4 0 42 •g 0 Co0 54 0 m el)454'3
Co0
$4 Co j.-.j.-.I 0 4., 9 0 k , Co" 04,0
--;11.-1 4.g.' 0 03
. as Coto 44 0 g 0 00 3 2 g Co....... I 8 -2
0C44 0 4-4
.40 3 1 0 .4 I 3 2 2:0 4,H P.
.4 CO 1;
a 0 43 0 0 0 %-•> 08 CO 1-1 0 TS :gas • - H
g SiP. 0 0 ¢ 0a. H kCoCO 0 Co 0 U 0'D
0P4 g 8CO
I 1'1Co0 c• o oH c o
54 60 0 CO .0 54 4. C.) 44 C.) 4-1O . 0 44 54 0 0 1 Co0 >4 el 54 Co
0j.H
Co 2. e. g Si Co ga3
to OP, P. 2 Co '3 4.0''er1 '40° Coa a 4 4.) o 8 • 111 o, -,4 .1
4
.4
4 o IPCo
.0 H 44 0 11 k 0 .g 0 023 1.4 0 .0 § •H° g.P. Co 4-1 54 Co 04 42 0 .1 0 Co Co 0O 0 CO Co g 4. g ; 4 4-, • > 4-9 0 k Co A 42 j $24o 0 • el 5.4 0 ill
2 g54 4 0 0 A
>. 0 .r., Si V01 03i0 7 N) •t1 3 0 4-, 4.2 4 `;', 2 .*:) o
.. H cr. 4-, b Coo0 Po 3• M) k •• .0
4. k 04 Co 44 CO 0Co3 P. , 10 - la • -.VA :34cf) g Y .1
j4) CoCo 94 (0 0 ..4 .o..1 H El H0 I',a 0 -I-,
lai 3 .r..: '0Coi
04-, .0 44 0-4 ri A H 0 Co 54 0 4-1 Co Co
Co .0 P. gigCo
Si 4 4-4 Si54 Si54 P.042 1 •cI Si54 CO ..1 40 -14 4.1 "0Io .49 S t) 410
H.0 0 04 0 R Co
O r. 0 03 04 k -P ? in 0 0 0 0 54 0 94 4. 1:0 4. A$4
4.
0
0
54 0
0
40CoSi
4-,
Co0 •H
0 00Si 0 0 H I 4,
0.0
aCO 0, Co Si 0
•P 1.4 a Po SiP. 54 44 q, ail >1 P. (0 'r., 41 3 4 4.0
0 44 M 0.00 01 0-1 0 Co 0.4 '0 0 k • 44 4-1 0 Co Co 0 44 Cob Co 0 COCo Si Co 0O
41 a o 0 0 4.2 4. 4, •g '-'
A7 Co • ••1 Co 'Coli 0 "tiH003\ 0 Si-,a CoCoCo 0
4431 ya
Coo g P. 04 00 o Coo Co0 1 Co
Po 0 0 4311 t,.. SiO
1- -0 00 CO41 rq .Lsk 1 404 4 0Co! ..:
0g
42 3 8 I4 O P.
., 3g1 4-1 43 0004 CO 4., •0 CO H. p, CO
'CI Ei 0 >4 04) 0 LI 0 • +, o Co Co ., 44P.
04 g
0P. 04Si54 Sig 0 CO 54 0, H s. gb6. 4, 3 .4 Co0 4..
0 Co 0 42 Co .4 o 8 4-3 Co Co 0 3 0Co P .0b0 •R
.1 0 -0 Co A .2 o 48 3 a 0 co 0 H4 0 >, 0 0 k 0(0 +, Co Co 4) • (c) 44 • gr.
(0(0 . ..4 0 4-, 03 0 a 0 .0 M 0 A 4. 0
0
0 a) a
4.
.-04 .
0
?.1 4
0
4 i
0
g
$4 600
0 1 a0 0 Co0 Co0 0 44 0 kCO . -el g r-4 0 gO 0 0 4, 40 44 o 80 4'8 4' iv 1 1 -2 o .2 .' 4 4' Co o R 3- ` '.2, - Co. .1 E tS0 H 5 X § . r1 . el 4-3 Si 9.• 0 4. ao a . CJ 10 44 94 4., 0 3 s.. o .., . 4-, Co 41 54riCo 444:1 A 0 Co Si 0 0 g g 4 10
°Co
Co H +.4 4" l". ,11° A 3 Si >4 54 13442 44 Co 2 .1-;3g a. 0 CO !,A, 4. CO :11 0 0 H Co 4/ 0 P.
Co 5-4 rci:, -., .0Co 44 60 U.. Co0 0 0, 4, V 4. 9 4 0 410., 4 o Ha3 t.." .r4ige -H04 '144
rcl 4 ig 4" - S
A ° 0 0 H 2 4 A Co4 A 2, 3 40' Co 44; Co -4 " g 4.r7 11, k i 0° Fri Si :::1 .f..4 Co A ,....
O (0 H 0 • -0 4-4 Si > .0 I• 3 Si 'H u 4-' P.
0 0 3 •elP. A' f• Z 3 03 X -rl 'H El
O H Co 0 0::I CI, P. 43. CO 0 0 0 -P 0.0 47:, Co III, e 4. 0 P. 0 0 0 41 04 13.0--•Co el Co 0 4 a R. 2, Co
0-:d.. . 20.' *0 Co 3, 2 . .-1 - 2 g ,6 ..1 , g • C0 M b° A
S. R. 2 8,
COP. a 0 • 0 P. 0 0 0 0 0 44 GO 0 C.) Co Co
Co 8 H r 14 0 0 (0 -4 54 4) Cr 0 r-1 S-1 y o' ,... 0 A -4 44:: I 1 1
gr-I .1 ac. 4aCo
4 Co CO''''
4.Co
Co
Co
cA 3' 4 Co
Co ..4 es :;',' 4 kiiii a •r44-1 '2 40 A o A El o -2 p H
- N 0' UN \fa C.- CO ON 0 N (<1 st c0 0‘. 0 s N rt-\
•-• c-C C C C N N N N N
H Ii• Co •
b0 el••
Co Co-9
-.44-, H 0 0.
k 0 P. 0 P. 3m o .,-1 co E 0 Co
+1 0 4-2 0 Co CoO 4' 0 Pi H
-P Ha 0Co 0
14 Si ig, Co -g Hel
OSi54 0P. 0 0 42 ek 0 g rri A >,
O s., e 5., o 41 0 0 A • Si Co 431 O. • 0 CO
Co 04 Co 0 0 Co 0 Ig. 4.4
Co
Co
0 .k P. 03 H g 4-4 >3 0O Co
Co 54 -P P.Co 0 44
54 04 0 C4443 A
CPCo
N.....Co
m
fii g H HCo0 > P, 0 Co0
C44-,0Si P. 0 0 3 A 0 42 . 0
4, I H 0 0 0 Er) 4. 4.1 El 54 g 54 0 0
Si g 5. Co ,-I co Si 0 _ 431 0 0 A 2 m COed 4 4',Co :1 ''' 4" 0
O Co
0.
00
4-'
0 m .0 6
.
-P
,44
g
CoCo 0 .
.0 o
CoCo 0
X 0 0
0
Co H Pi gO P4 a o a Si .1., 0 g .4 >0 H Co ?
H A Ia 0 H '9 10 42 0 /43
Co Hi 42 HCo ,i,
... .42 S C..)
O 0 0 Co
44 Co >ato
.4C)
g-I .4 H 2 Co .x x 5 o 0Coo
4, H4
O 4-1 H 44 0 42P
6 SiP.. 0 0 0 .
H..k 4-I to
04 $4 4. 9.Y
4, 54 41a° g 721 g .2 g . .2 A .41 40' 42 ti HSIPI
Al.01 0 CO Co 1 0 0 0 .p .g o j -r1 0 0 94O tCo
•A° 4.'l Til. 1° Si 0P. 2 44E 0 Cori ta 0 .4O p 0 4/
Co 00
..i., E 0 c. , , ..4Co EP' t3 t 4 'Uri § 4̀1 491 4' 'Dg. 4 "5 'clo.
.4
0P. lie4 El
O O. o .g 0 • r.. -,4 o° E. P. ' ; P. ° 4" ...44" 'HO 41 CO A 4 A,..z .. ,..S.,., bo 0Sikg k 0
tO g 2 tti A Co f, 0 Co, 4 3. P. Co 'I' * -4 2 Si `E'.3 CO Co .-1.1 4" 'Ho, o 4'2 S.. t
44 H 4./ 440 4 a. 3, `"4 . 2, °' 1 44' .79 3 2, ?, a ''' A " . 0 CoO o Co
Co 0 k 44 0 A .0 0 0 -.4 1 434 0r: 40 ...."%4 E .4 ..„ -m 4 4 P. '1 1 ..p.,P. "10
N
.0?Si
t 4.4q 42 A elO 0 0 0 4-, 0 03 0Co H 03 Co 4
b3 CO > HI I.4RI Co 0 0.4 •P 0 1 4 4. to 3 0 04 54 11) .1,-1 4, .0 .g Co
03 0 3 Co P. m 0
„.0, 0 g s., a .o *A 54 41 0 aCo
a .1.-1 bla 0 a N-1 4-1 • 4 VP 14 > 0 Co 0 • .40 0),to>m4 tO 4J INEl 4 4 CO 44 Co P N -,, 42 0
P
Co Si bri P.,id 49 4',44 g )4 Co 4. Co 431 4:1 49 k4.4 0 042 04 10,
03i-3 0 0 H4. .-1 0 44
4 0Co0 0▪ Si
1O AI i
..4ri I
Cocd 2 ea 54
-.1 o El H 4
02 0 44 Co t 0 I 0 . 0
O.w Oa Co Co 40 4.,
.,9 00 4-1 4,Co PI 0.g
Si Co t f '41 •M a A '4" "Cok 0 SiCo V 4. o 64 .3 94 4,
O 4-4.0 4 o 44 > 1 4
0 P. 0 0 Co
0 44 d g Co ..x • 41 0O a g .0 0 143 4. v4 P.
t ,0 g. 04, 0 0 0 4-1
r .N 0 ,.41 1.1. f.5. 0 -5.'.. ; 1 H A 0 g 4 a o 54 ..% .14 0 .1..), Co .2 t
00 41
00 t .i jO
co,P. 0 0 0 0
0 0.9 14 €03 0 1 0 ..44, g t .0 ,-4 ,4 ...4
4..P4 k 0 0 0 0 o y E., p, 0 42
54 HI 0 I0 k
O .4., 4.3 0 00 -0 0° s °la i MSi; ..1 :56 Co T., 1 .21 4:7 i :..9 1 "A ...1St -,41 ° E as bo 4:3 4 i g ?,g m . "r1 0 .0 Co
O Q 10 es '0 540,. .0 .4 pi •ti.
I, ° '''' I H-r"'' 0 •• 0 Co III Cl] o o o o •-i 0 4. 0 0 0 0P. • a ,--I g -,I .1. k Co 434 a is, g 44 42 Co .ritg, 0 .1:4 4.,
P. 2 r-I Co 4 ' -9 0 P. 42' 0 .4 04 A 134 CO al 0 P. CO Ig, 0 0. o
4 br. Co o Co -4 0 M .). 0(0 0 ..4.42Co 44 0 4. P. ..r4 p,
O1 11° 2 1 S 0 :3 1 .16 0 ...., 4? 41' 4 T` 2. r) g ,.1 ri ., r-1 S 1 . u 2 .. 1 .b )1
le P. N.,,, . 4 .4J • 43 0
-.4 I 0, S. 8H
C) 1 .. 0. Co 4.1 41 Co P. Co
.1:1 i AI ji
.44 o 0 o
P 2g1 ofx a,....alcc pia M.*.Co pl51 3'4, i 4Coo A• .
•
... 0 •10 • 03 U. C4 44 94 co 0al "Hs. / *O (0
I•N -1' U.S n4C••• CO CIN 0 4' Ul 5.0 Es - c0 0, N2 '- K‘ - 1. 'AN N N Ns. N0
Nre N e- N $'l
231
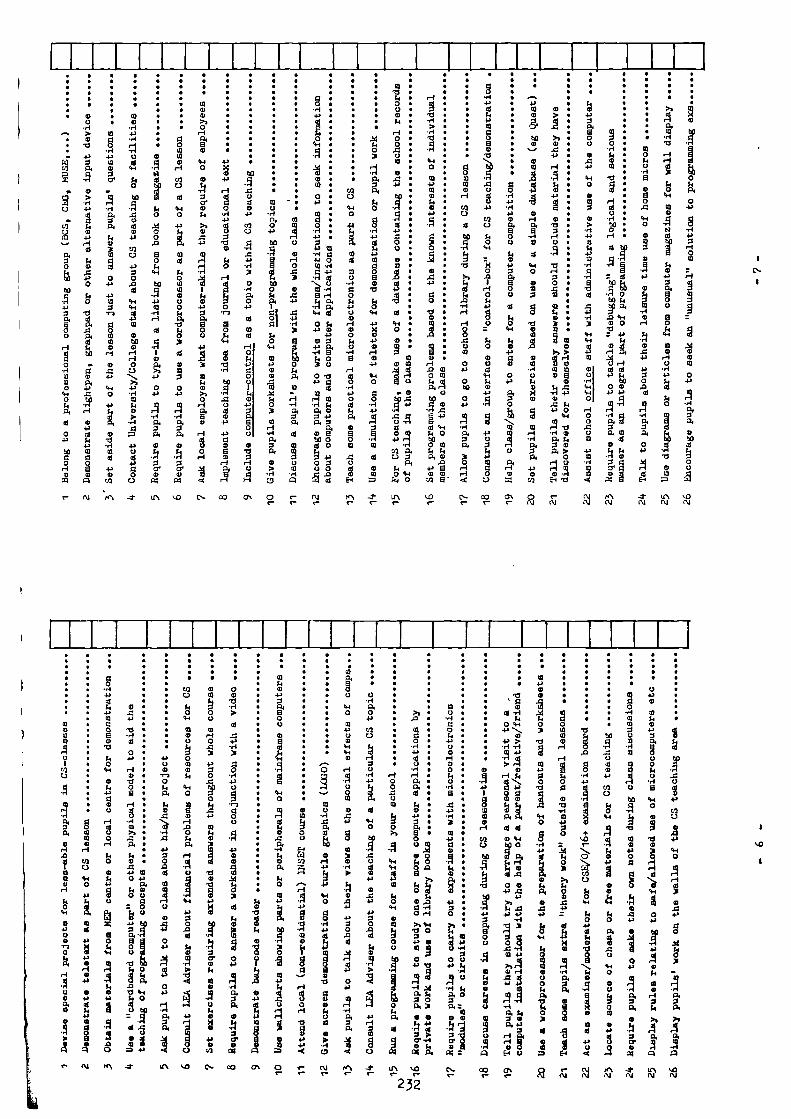
1111111[ 111 Iii•
940
5
21.4
0 8CO
8
4.00&
tom.....,00A
0
CO
al
>•
1.1
,g
0.0 4) .P04)44 4)
4)4-i "4$40 Pt00 P.$44404 0 8
4-, 8 r40 H
41 El "
4-,10
04.
90
0
aa}. 4,A
0a, iina
>, oco 0 oa .4-14. m k
A 0H 44 la
.4 44 21
• 0 • (00 o4-1 -.4H., > al 44• 0 tzl ..-I
• 21 o• 1- el
4T 44 44 00 to 4
CO 04 0 44
-5o0. p.0- 0 -
9›... .5r to
C.) 44 •-I .40 P. .0
• a 0 0CO kPt 08 0 0
4 , 44 4,....... H to
0 coa 00 4.4
g0 0 4.
tt .40
44 0 00 4-3 A
tO 0.1 g
4.0 g
,1-44-4
0 "0 •-1A0. 5.8 .g g 0
u 1... 2 0• • 60
H 14 43 43
I to H H
g-io - (0 o' .4 4 4 00 0 4-3 \la 04 >443 4-3 04 4,
0-1 .= 0 .440 9...)$4 4. k01 1-I 00 . Y. •>....
44 00 0 0
4. k 2144 44 44
R 0g
0 00 00 0 4.H 8 44 04
0 0 04 0 0
40 g
.54. 01 9
Hcd
0 0H 0 0 -riPo "0 0.0 0°.4 I-1
•rt44 r-I
0 0 04 .4 (4 •
4, 4.n
00.1.4 .4-1 a0 , .4po
7-60 al0to ,f90 g 0 .4 /01'
(4)14H 'AI 1 c`io ...1.0 441 1 , 00
21m.g
g m " -a4 4.'0
410 R
>, > HI.1 g '01
al ..kOH
-/-1 (00 0 :04)0 00 01 4. k44 m 44 tO0 44 0014 .. -49 44 4)4'co 0 o 0 A.414 Hg
4-, 4-40 4-1 0
'014 4A 0 0..g 0H .44)0 00 0. 0
-.4 9.14 ofa, 10 0A9., 0). ..:Cia: - 1
44 A 3 0 0.00 0-44 .11
Cl) 04.4 .0 04
N reN -t LIN 4) ON 0H N teN 4.0 C4- c0 04 0 4- 2 pi
C- r- r- r- H N N N N
•
to
a0
CO
0.
toto
094
4.0•0
0.to
.5
.5
c!C- Crs 0 V' CV -t
.5
43
a
501
4.4
to •
04-4 P.0 0
4.3co
coc..)
4-44-40
I-I
0Ca0 al
44 .41
to
to3 ,00
oA 4.4.,
4.4. 00 00 .0.0 al
A 03
.1-o
0 a
1
o.
1 g.4 0
0
0
1
0 0 00 0 0
ti §21
0 >44 0al.0 a•
0 H ..00 0 4,§
.0 ..-13 3
oal 4-. g0 0 0(4 0 -el
4-4 1) 4.)00 0 9
2 .,a
0 44 0H 0.0 CO0 14
.4k 0P. I
:•
g4..H
A•
• 21 1..A1 4g 3
94 4,
4., g 4)
0 44011 •
.0. 4
14 . 10 0
.4 10' o0 4,• 41
1144 0 1
1 1 4.00 0,14.... 0 •
1 g 14• O.0 o
0 CO 01
%.0 Cs• CO
co>, 0.0 -r1
0co ocg k4,I-1 0
4. 05 H
0,I o,-1 ka. 0a -rim a14 40 -4,4, ..-I0 3.0.a m0 4.04) a
Z 8 .,i2 ' 14
(13 ik
0 .0 4.10 -.4 00 H 0>01421 00*cc o0 3 o0 0 0.1... 21 44
4 g A 0-,-1 71 A ka, k 12, 00 o 00,3 a, =• • 00- t; A 10 N.
g. Irf 4404, 0
C0 P. CO z'
,43 C....r-
•
. 01• 4,
• •
^0 •'9m 1
0 -.4 M
44 41 n
04-4 0 07 •
co44 > 21 4•ri -A
I H
- 0 H
0 4.• g
1-4 44g 10'2 .›. .0 g
2 gi -00
t ,-19.9. 44 al
0 4.,
4) 4) 0
0 4.-i go
0 .14 L.44 .71
ri6N kg !0
00 la k
44 .0 P. 0
4. al
Z' ol .0 4.• .0
4... 41 4, =....
A ' 4
0 A 44 11
A ;4 g(0 4.
>,1
. I A. •/-1
fl• 2U 0,0 0
A A P.k Pt
21 •c; h 1%4 el
0 • X 2at 4.0 4 -18.il 3 1.E.. 0 = El
40 0.c-
• 044
Q 000 4410 00 4,LI.5
00 0
El404-40
al Id0 04.1
0ri
„al
Al4-,
•
14, 0
$4
0Qs 14• >•s
• ri0.ce
4.
al
U'.N N
232

0
0
0
0
0
•
8 .ss.44. 3g 31
A 10AP."0 0 4.0
I
k•434 1
1g.O 30
• 44 0O 04-n •o m o
H -.4H fao P.i •g
XII9:1ri 4.Os 0rlO 3 3
.4 3 go34,O I 1• • •• -3 k A1O Psk O gA 0 0a .ri
3 •• a)AI 1 1
• 00 0X • 4,
2 3 g A
A3 •4. •
34 Z AAU . •O 14A A, g ow
Et
A
▪
•Col
N toN -t
44 0 m
•
0 44
o 43
.2
•
m
* d 0 0
••••
4.
0
0.84
00
0
044
•30
0
0
"a.
004.
04-1 •e IN 43
1 43 0
1
•
g• 14
gl
4.
C
4
01
Al .1
41g00
0 •rt• 4444
• 0.1.00
1 04....4• 0
04 -0 -14 H A la
31 14
8• btk01 il
.-•-..1$ og .0..-i4.
41
0
V/ 144
3 40.O
.. 4.0O I of 1:,
g go 0
1 a9 0 44g g
4.
il
4.al
m oO 44 8 Po • rl A
•
gPt 4 Al
PI de k 0 .1) PsPtH 0k 014
1
•
H .3 14 .... •1 60 0 • 41t A° 4. 04
El0 0
O 2 g 0 44il 0.6 4. H 4 3 • • 1 4A g
-1-14.
0e 4.O 8 a1
4. • •0 H 41 g
m P.g 121 0
U Z$4 .3 A0 g
g 8 4 .4 43;'144 4. 14 ..4 •
CO1 tO 8A :93e 1 Ts
O C3
4. ......•0O 00
V
o 0P. 8 oa 0 •,4 8 0 . 4 '0.0 0 0• 4. o ▪ I.0 0O CP3 3 g • r4
•
k 41 0I A g .044.410
• g .0 • ? 0 0 A 42 CCI 0
41 0•O ,s0v 1 0 -*I O 4..43 .1 0 8 Z 1:: 41 .1.1 4" Ca ,-,4
01 '8 0V e >2 0 0 AI ag -0 A
V a C..)I 4. k H .5 d ▪ eri
•4
..
.g.
OH 'iH 4.0 0• gg 0 0 .0 .0 ...... d 11
.0 A .'9 H A gl A 0• 4 11 1 iO 44 He
...1,4 $ g .5.3 0,
A41 k 8• A4.•• A to 1F2, a
• o01 0 1-1
or.,,H 0•O PI
4 4.O 3 I .8 8 i 3 Po 0
•
k • P. 0O Po H g V it 0 i A R, g 41 $
▪
1. 1 4 3:
.I. 0•
F 1
b 200 -A 0O 14
444
t4 44O H
4.H • al 0 0A 4.0 A
•
g >, 8,-1
10
4.
• 14 10 F4 A00g1 00 . 4. 0 0 0 ,-4i
•
g 0O
.0fOlO 0 0 000 , 0 .44. 4. 4, k
00CO
.5 Y° 0 4,
• 1 Pg
P. 0
'4e 44A 0P. 1 g.OP 0 0 14 0 41 0 0 e
ml3./4 H
/4Po 4.O 12 4. A 0 03 ...el f4 0)1 k 04, El A
g 04.
04. *.'il
0 0 04. 41 4, 4.3 4 ri V,› .g 4,43 4. .o
O 3 A A A g g H 4.O E m II I 14A 4 1 0 A I 1.144 4 41 -14 0 4 0 00 1 14 ,-1 230 3 o A .1110 lel
0g l'sA ko 0. .11d t 4 Po A 4. 1.1k O 0 ..4
0•+1 0 0 0" 0 0
5 3'1.. 0.1O 0 o d H a,'4 HH 0
g1 H44 0 A
g g P. 44 P. •1. • P. P. P. PIe H r-1O 0 Po A 0Aa 0
4. > 0 o o P. 0 A .)4.co 0o O 0 8 i A A . 5 .h A Elo 0O 0 g 1 0e
a 0 44 Hi'H9 1-1 44 0.k a .
1 r t, .0O 0 ..11 0 0a' .1 •
•
g.3 ,.., a. .74 •• 2
• 0. b• S -Ap. m a
3 to m Q a) : V
▪•
0 o gSt
0.0 a i M
11
gi CO 1:4 •R c.1 d 34 Cl ' A CP Pi CO 2 CO C4 CP 0 A 04 2 04
O r- 1 -../. ErN ,43ual N N N N N Nl \ 0 Cs.. CCO T N tc \ -t UN \ 0 C*-- c0 0 \ 0
••••••
4°4 0
E
i• .h)
1.4.0 a8 0 4.
O 43 00
'Ho ,-1 •O O. El
A4:1e
• • A gR i
ofk 0
O 1408 4.
-14)5 014 P. 0
3
7, • 3 g i4 04,i3 4
" d
4 •P ..c. 1. •3OI
• >,•n A1 A H
0'0 4. • 0
1 1 G k...I > g43.1 g 0
s.4 Po g 1 Ci•g b
to g Po 4. 4 4 a n 40 44
043
ii ii 13
k - A ! !
‘01 1 4.
•
•43
b.0.4)
I• 1 Al
10
1AA 8
•IH oa
• PIN 4` UN s4:1 c. co 0% o N PIN -t UN )4, c0
CO
0CO
cn • N233

80
4,
• •
V V0..
a0 O.
0.1 b•
I . 14.) IA r•
1A
ite \
1‘.0 1
III4-1
.4)4)4-, 4-,0
to
t•-•
N N• 2
4
N
34.
g
...1
i to
01
iift
IAI
,..
to
i
04-I
ko
t0
17
g
t
,-
+43.g
•0
.r1 A 11 VI 4 :340...•
40
3 30 3° -... Z
6 4100484
4.h.
4.)NAu'Ei
A li
0"048. A
0A
S••.0
•.:1 8to
a4.
4V 48, g 1o•
4-1 o-o-4
Or a $61a0
tOsc'.)' ro0 .4.44,0g
4 ',:111 33
G3 t) .3 i 0A
-411
111 •
• • 4.0• 0 •
Ya 0 •
U) "0 'Li .0
.4.. g•
▪ gi
0. 0 ri A
a 40 ..-1 61O a coO a a 0
+0
o pt, co
g,-1 <41.0
O 5 0 0I-1
O ..-1 .1-, 0
,-1 r-1 I.4.
44 Clo" Ak
l 0.0 01 40
. 1-1 to 0
1 .0 d it0
O .r1 to 0N. -0
A 00 ,
Y 44 g14o
4, o toO a0 0 1 0
rl 0 0
. r1 k to
0 0 0) 0
101 .0 a., .-I'11 0 0
to a. co.p 0 a 0O to oo 4 0 .0
.0 a g
g >• o 40r-1 40
40 0 to
4, 40to 0 • 0
r-1 0 40O Oo r-1
4, EI 0 t.,o -,-4 0
A 0 40 .0
..-I al i 0
M. g
4'4 .r4 Is-.4O O. I
tO 0 .0ai P.
• •N)to • V a+0
1,-I
O 0 V.
1 to
••• to A• N
▪
LIN Cs.. CO
•2
•• •• 00 • I • 30 8 .0.0 to -r4 o0
14 iii4)
g40 toO to 0 40O e•-• at I-I
40 60 0 84O 0
g r.4 14 0.040
8 ..... 0 4.7 4.to -to 2 .0il 8.4O 0 4.9-1 o
• • gYm) I Acu 33 = 0 A .00.0 0 0O s. 14 14 14 g.kO ”1 4,
0.01)0 0 3 0. ..-1O 40 0 )to .....
.0 2 g -.0 .44 0. ap4) 10. 0 a (1)O o g . .-1 .0bo 0 1 •'.I -,-I 0 V. +. 1
•A 4-1
-0 4-. k4
..A p,
N ,..0O 1 04
a) 30, •ri
4 s.
0 )1 00.
O 1
�
40
ti4 el0O
r100 'PO -p
0 0m''V
2 ,.....11 k ,--I 1
•, -. to4 %I
O . P. 4, 0 0 0 0O 0 3 a N 4-, 40
0.0 Pf 40 4 0• g 0o n-og
▪
0 ‘1El
..., o.o ,o k I-143 00 0 1 to to 0 0
d 0 4-1 0 4.0 041 /4
§4-1 4-0 0O 40 0
g 0 3 0. 443
40 A "il 0 0 A 8to ..., +1 0 61 0 g .3to 0 .r1 •••
.00 1O 0 r• 0
O 0 4. • 40 1 i8 3 ; 0 k
40 04, 0 +0 A to 0
. 1 • A •,--,• • 5 N N.P.k A •rl 0
4)4) 0) a. 41 f 41to .0 .0 54 44 0k 44 4.1 01 • CI, 4-4 0 0O 0 k .4.1a 0 to a, to P. g.0...• 3
. 0O .4 o3 '''fa
g 1 0 o 1 0• u IIg a a o' 1 1
A 4 3I 0)08 0
0`. 0 N MN
▪
n•-0 Cs. ca
0
2 3 4
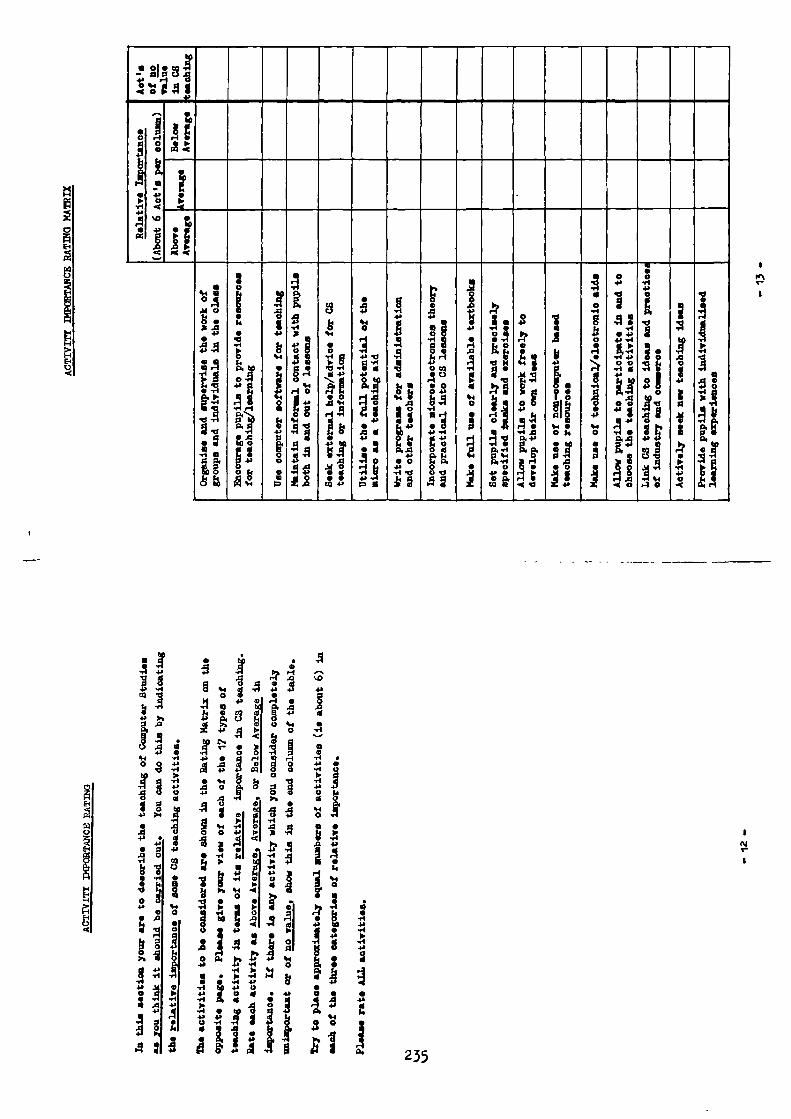
• of . pg3- mou 1V *I ' i' A I.11 0
4. n r
..-..:I
n .
• I.i. e g5.1
t k
4
$•04'
•
01•••4
4:..1-4
:0.0
i 4r.
.. .<.....•
od ...0
•••0
U1 i •
4+
V•0
444+414 •o A
MU3 •X .04.
1
Z•
N.00
.•S
1.40...I•
6
b
•0••e
g
..
S
•.04.
i
I 0I
••
g
1
ele.3 6
2
0I
14
1I
• .30
• A1 I• -1:34
'''':•1. 630.
41e l,
3I•4•I
t i4gr.,0 .o-I 0
•44 .
hill,
r4
14+ VI
• al
...,
.34is
3 ;,
.3e A.0ow•U
i °P
•A.-4
1
i
: 4k 0A kfil42 va
..1•
4.
PI:
.4Ai
Y
2110
li •
:T!
410i
1.1
4.; 4:4 i
i N.0
1 ii 11.
041 10
1
.0i
4.
I
4
.4.ci 4
0 •03,1 j
fli
IT,
151
,...3
V
! I t.
4 i
ii
3
2 i4.
:I 4
I t
r 41 .1
0 va'04 1
1.. 1S eh
•+4 XI
IIgilco4 •0 k
4'4040
0 •S• ''4a
•1It
IV.0 30
OII
a b. I.•
. IA lo
gV. 'b 4
CAg 1g 4'o bA .4
I'3•A
3 A.3..9 3CS
1 3A
1 i4.
4+• 3.9 o
.yi I; s
0.`' .R• t.
..4 RI
o44044p.0 .04 1
•A
•AiA
SIa
a. 43 :440 di°elit..0
P . 4+
3,I A'pi
e
•' 1; ..
0
1.!
•;•
04 A
V'k 1
..1. •
4+ 4+1
8 3
1.4. •
,,•:
.143..,
A• 1
11
• 1 • • 4•
-'.
I..g
g I., 1 ..1 .3 .3‘04.
.11 • 4+
•
g 1 ;.• 4 .11
3. A
..43 C...1-
I
•
A fl A i '4 4. .
0
X
44 •
/4 • 42
4 ›.•4. 0 t•
+4 .4 b3 4 i
i .-4 •
0
0 Ili 0
0, .08 4+
0
•....
4.
44
4-1
A
.§
••
•
U
•
1o 4.
xi 0 A. & g •
.444+O 44
t• 441 1 11
• .4.1 §
• 1 0 .. ,O 0di I:. di 01.' a5.. A • • •
.4 1o• &
1 g a 44 ala 10 4
1 46+ g i 1 14J1 • X N-I
•.4
V 4 A ++ii 4
A gll eel •4 k4-1
4li 1.1. 0 i 14 ° • ri 44
U4 Cj 41, S. 4.*1 / .... .: .a. g I 3 ''' *011 : • :
; • •... .3 I;4' 4• o 0.0
1 44 • ii• ,1H0.4•11_ .34. •• .0t 1 0 4+ • -4
3 8 3 2 j 3 3 • 3 141g .3..S. 1
4aO 0; .. V 3 .40 b. : 3
-.1 4 ...1.4 7: .4411 i •
41t.file a 1
.4 A ••• .di ti.
• I0 I•
3 4.• .4 ,I p, 4
g MI
4 9 i il le 1 1 I I P 1 ti.
+. A A gA 4.n 0
/
I
3 °
235

1+' 4
. 'F' 1 .1 i t g..,.. 1 ..9 0 0 . 1 •c1• +2+) au g 0
0 01O h N..-1
4, -.41$
• 0
54
4,0.. g •P g'. 0 0 11 AI 2 st rgp4 Z Z
o
0
•
1, C.- Cs- C.- ts. C.- Cs. C.- C.. Cs-
%0 a.° %.0
UN IA IA IA IA IA IA IA CA IA LA IA
4- 4. 4" 4- 4- 4- 4- 4- 4- 4. 4. 4*
K\ p4\ oclorNteNntr‘n erN lc\
NNNNNNNNNN
g 0,-. 0 .4.
,t.. A..„ 1
t--1 tc 0.,1'4.. ,1 i i 0
to o at
il OI s ... 0 .0A 4 0 H 0 4,
m 0 O. 0. b io o 0 0 o o3 Z = CC 3. A
rft
A
•0O AO 4-3 0A ..-;4.) Ao YJ. ., :.... ... .._,. ,.,15 0 P.MO o k-P .cl 0ni 0 to-.4 4., mitb 3o
S.03CI
1 0*40
0C1 ..4 ot o -.i' Ph
iHV ta
4br-I
0 W0k
o 4.
g 3 80.0 ,0 03 0 ol40.,-14. orl ti4 04, AH ca
•X g
1 )3 k gA 4-, aso oo
t A o
J
.. 0 ido 3
gO alO 0 k Ho o
o Ao•re 1 =-Po ..a .a a oo d 4.g $ 4... 4. 4 A
OV-8 1 .0-•s.gmow0 0
-.4 00 •ciAA 0 42O
O o.•.. Y .05 0
>2 ,cl-.1'01. I.A II 4.O 1-10 14. 0 4.-O o r40A 0 0•k4
A .h f:,O g1.,,com eO 0 P'O 4. 0k 1.4A at ...,P. 0 0k E.m
00 A b11 4
. ra..4k 0 qo .cX O 4'o oA r4 r-I
4.4 gg 4 to
; Ao .:4. ,-) 4.o.00 2.4
.00O 4'14 "2o gA 1.q ..1a0A 0O 4.' ao• g
.0 0 0E4 I... +2
O His 0o12.1
▪
0 0
to
•o14k• oA .0oO+2CO04.'
114O 0
.0 0O g.0••)
4.2o 0• k-rIU. 0010 Po.co .0
043
meCi0 42•A al0
,W1• •
0
0
rig
0
•
00
*4
0
•0
0
11
1 q4. •clO
i !I 1Oii 4-0
4, .1 .0 He :41 4, I 1 8.4• 0 kO 0 .... 00 • ... F., o .1.4 r. E.1-1 H o g'>. 42O 14 V00 g e 1 +4.04 A 1 .0 4.• O 4. 0 H
. El ":41
N • a 0 p Aii .14 Ir 'g '' 4r-I ..-1
g cr 0 .0• 4. 1, .-0 L. 1A •Z 14
k 4.0
Z I ,R.v ,,i, to . ,g i I 1
C 4̀ Cs. Cs- C, L's
1/4.0 %la n13 s43 %.0 n0
LA LA LA u1 uN UN us% LA LA ul
4- 4- 4- 4' 4. 4. 4- 4' 4. 4-
r en ten IA IA IA IA PA IA In te. tc‘
cv CU NNN N N N NN N
4-- e- a- 4- a- a- •- .- ,0•04 I.0.0 .04. 4. 031O 0>4.0 .9 H
b 4i 0
E • H.04.,-1
H4 "' 0O 5 H ) •
O 00 •,-I g 0 0 00O 00 43 /r E. r1* 1.t -r1 0 H .1 •t' &I 7.1 8 • A
b+1
Ug 4g-, 4 4HO - 0' ti; 4 .2 •T-O 3 I
O 0 0 4, A -a .45 t' 41 H
1,, ' P' g o .I 0o 4.4 O 0 0> f3 $ % t4 .:4 0 P EA NO Z Eg o 0 A z+,
.0.. 0 o.0 o 4,O .0 40 4.• 0
4' ao 24.)
1 O ,004.) .0 4. 04.4. 0 . >1O 0'.-)
O 4, H1. A -,1
g4., 4-, InA crS o a1.00
, 0 00VO 00 0A 0+'4. toto To 11O 0 0 gH 0 4)1 0O P H 0 A ,r4
•I 4,014.)4.O 1.10ii 1.0V 0H 4. 4.O A 4.•-2 C.- o04 • 4,
g1,7 0 0
.
H 12.1 LA0 •el• 4.
.01 1/40
H 0
81 VD
H 0 0CO HOO 000 >a N1
O 0
>1
gIA 41) ,9 0
O 4, 04' .44) PIO -I- 0..-CA cr al4.2 44 H
IA 0 H... tA .+.I0 • •
A V) IAqi N N 0
O Y -O e ._ IA
O >41.1.14O 04. A PI H,0 .0id to to o 4, 4..0 a g 5.4 o o
O -el .4
IsX g H HO 0 •
>, 0 0O
-..g lj42 0236
TSHPi
OP olSI 4,
H 410co .4 211x 0 A4, 0 0 to -.4 ?...
4, to 00 H41 0 0 7. .
A 0',c,.
0 A .E HOO P.tA Z A' •`, ,- „? PO g
• •ci
..'-400
miCs- C•-• Cs- Cs- C.. Cs-H 0O b e4.,H
O alv %0 %.0 n0 V) '.0s.0H 0 g
.00 I6o 0 .0 IA IA LA LA 01 IA 4.O H O 1. v-ia g 0o 0
A I4) 0 0 4. -I' -* 4. 4. 4.
i4 01O o 0H .4 51 4.g 4, Kt MI /A '4", IA ot'sto ..1 P 0•O 0 -.1o 0 *0 N N N N N NA 0 0+, TI 1.0 4.O 0 0 CO4, V .0 r4 4- e- .- I- s- 4-A .5 P 5 0i.....• .. 00 4,0o
•
Hk
▪
6 ..:- 0 C., *,4c) o-,-)
-r ,-, oO S.s.
3.
10 OroO
.0r
O 00 N-I0 :-.1 A' ,,
1:1 o 5,
§ ..1 • 04) 0 .0O 00_. 0 04) 4. '0O H 00. 0 .0 i g
0 0 0
A 0 g ..g 1, 0"hH o
..4X 0
+4 H4 •1 4 Z A A
I. 4,g
.."4. 1472 El

a°
A
p.1 2 toi 04.3 1 P.O i P. 1°44 .0 04' 0
.4 bA Z 0 A
44O 0 •
°.:Iteo g V
ti .h • : I
k• :0 i 281 6 A
V
0 0 4.0 0 0 .s.•
• H o io g 1 417 .1:5 'd .-I
:12"3_4° 11 Ve .8 t V,O 0• • 0 1
O 0 0 V .0 04C li44 • • 44 0 0 0 0
3 04.' /
51, LA1 ' P.
. ,..
.00,0 :6:
HOB HI 4-4 )t V el P.31 •
4, 4.4 )1 .; xo
R.A
..... • .4.• -.4 4 : sl -4 14
T k 'Ho..... . )
2 01 1 .,„ •oQ 0 •0 PI. 0... 0
PI k 1... 4 • 5 g41"4 •o 0 4.
0 HIill .1. ,..1.2 420
4 :6 4. $4 0
• g g .....
All
C.) k ..... ,0a 0
0
I !
0O 1.•e• ,-I
1 to
v•
• 04-, 13. •0
,-4O 0A 04
O 0
HI 0 0 a',.0 a aa ..-1C., 00 CO P4')O 4-4
HI 0 04-, 0 b) H
H P
4,0 .A ti).. •01 0
8 g $40
.0 0 0.0
I' 4CO
." 4-,44
44 A4O 43
H 0EA 4, 4, 4.4
P 4.3 O 4. 0O 0 -"I H0 • 01 ..
4 ..-1g
0, 0 0
gO.a. 2
A 4-, 044
Z ni'dos6 :0
4 1=n.
r, 04' ,--1
-4-4 0
O 0+' -% O'O 0
-4_1 0 -r-1 0
5. 0o-.
a 4 200 0 0
51
44
4-, • 4 .00 4'444
4 ...8 .4...,A 434.,
.13 g
0
O 4-, o4.4-I -4-4 0 co 2 a)A )0
r.P CC 14
P .O Cl.HOP,
0 4a 4 .a
a
16 2 i a.
237

POST-TASSON REPORT FORM
Date
Lesson duration (mine) Room Type (A,B,C,D)
Lesson type Tick ONE that best gives a description of this lesson
Teacher talk/demonstration, little/no PW by pupils
Teacher talk/demonstration, pupils do programming PW
Teacher talk/demonstration, pupils do non-programming PW
Pupils do programming PW Pupils do non-programming PW
Class debate/discussion Revision or pupil exercises
Other (describe)
Resources used by the teacher Circle ALL those used in this lesson
BB/OHP Charts/ Micro and Other computer Model/diagrams large screen hardware slides
Textbook Software Microelectronics Film/ Published teach-package modules/robot video ing materials
Resources used by pupils Circle ALL those used in this lesson
Micro Teacher
Textbook
Robot/
Microelectronicshandout
buggy etc modules/circuits
Ref book/ Software Otherlibrary package (describe)
Homework set this lesson Circle ONE that best describes the work set
No home- Program Written answers to Written answers towork set writing textbook/handout qns oral/bb questions
Reading from Writing notes/ Open enquiry or Revising ortextbook definitions search for info. learning
Level of lesson satisfaction Mark ONE estimate for your own, ONE for pupils
The general level of High/ Slightly Average Rather Lowyour satisfaction very above below (dies-with this lesson is: high average average atisfied)
Your estimate of High/ Slightly Average Rather Lowpupils' satisfaction very above below (dies-with this lesson is high average average atisfied)
28
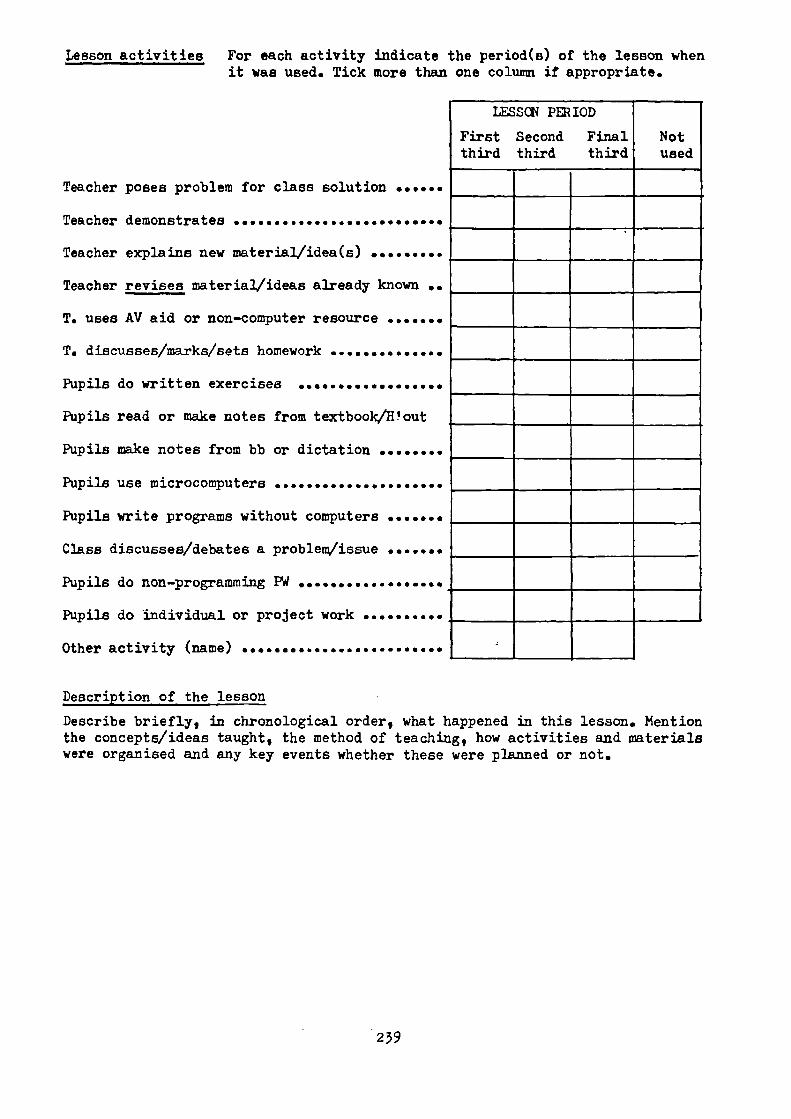
LESSON PERIOD
First Second Final Notthird third third used
Lesson activities For each activity indicate the period(s) of the lesson whenit was used. Tick more than one column if appropriate.
Teacher poses problem for class solution
Teacher demonstrates
Teacher explains new material/idea(s)
Teacher revises material/ideas already known
T. uses AV aid or non-computer resource
T. discusses/marks/sets homework
Pupils do written exercises
Pupils read or make notes from textbook/R!out
Pupils make notes from bb or dictation
Pupils use microcomputers
Pupils write programs without computers
Class discusses/debates a problem/issue
Pupils do non-programming PW
Pupils do individual or project work
Other activity (name)
Description of the lesson
Describe briefly, in chronological order, what happened in this lesson. Mentionthe concepts/ideas taught, the method of teaching, how activities and materialswere organised and any key events whether these were planned or not.
239
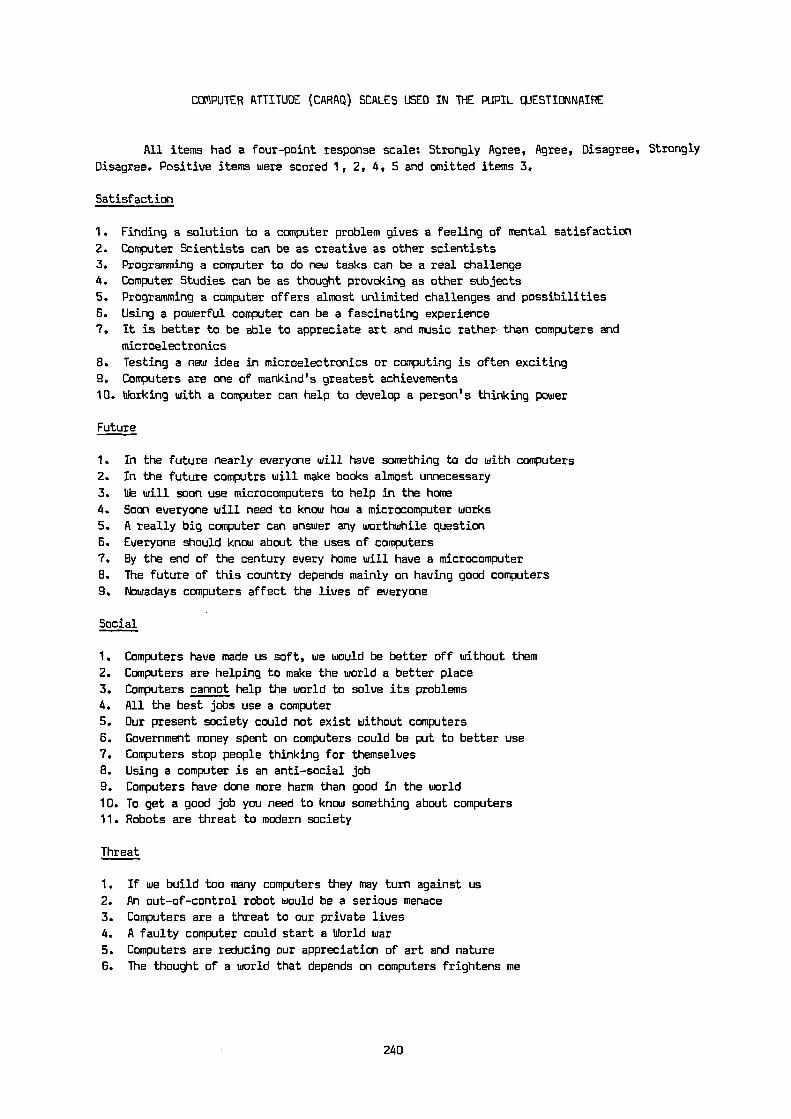
COMPUTER ATTITUDE (CARAQ) SCALES USED IN THE PUPIL QUESTIONNAIRE
All items had a four-point response scale: Strongly Agree, Agree, Disagree, Strongly
Disagree. Positive items were scored 1, 2, 4, 5 and omitted items 3.
Satisfaction
1. Finding a solution to a computer problem gives a feeling of mental satisfaction
2. Computer Scientists can be as creative as other scientists
3. Programming a computer to do new tasks can be a real challenge4. Computer Studies can be as thought provoking as other subjects
5. Programming a computer offers almost unlimited challenges and possibilities
6. Using a powerful computer can be a fascinating experience
7. It is better to be able to appreciate art and music rather- than computers and
microelectronics
8. Testing a new idea in microelectronics or computing is often exciting
9. Computers are one of mankind's greatest achievements
10. Working with a computer can help to develop a person's thinking power
Future
1. In the future nearly everyone will have something to do with computers
2. In the future computrs will make books almost unnecessary
3. We will soon use microcomputers to help in the home
4. Soon everyone will need to know how a microcomputer works
5. A really big computer can answer any worthwhile question
6. Everyone should know about the uses of computers
7. By the end of the century every home will have a microcomputer
B. The future of this country depends mainly on having good computers
9. Nowadays computers affect the lives of everyone
Social
1. Computers have made us soft, we would be better off without them
2. Computers are helping to make the world a better place
3. Computers cannot help the world to solve its problems
4. All the best jobs use a computer
5. Our present society could not exist without computers
6. Government money spent on computers could be put to better use
7. Computers stop people thinking for themselves
8. Using a computer is an anti-social job
9. Computers have done more harm than good in the world
10. To get a good job you need to know something about computers
11. Robots are threat to modern society
Threat
1. If we build too many computers they may turn against us
2. An out-of-control robot would be a serious menace
3. Computers are a threat to our private lives
4. A faulty computer could start a World war
5. Computers are reducing our appreciation of art and nature
6. The thought of a world that depends on computers frightens me
240

7. Computers should not keep information about ordinary people
8. Personal privacy is threatened by computer databanks
9. A computerised society would care less about individual people
10. We are letting microcomputers change the world too quickly
Employ
1. A clever man or woman can do any job just as well as a computer
2. We need to use more computers in our factories
3. It is wrong to use computers whilst people are unemployed
4. This country needs to use more robots and computers
5. Robots will make factory work more pleasant
6. Computers do not take away people's jobs
7. Shops and offices should make more use of computers
8. We should reject robots and find other ways of making things
9. Offices should use more people and fewer electronic machines10. Shops that use a computer are less helpful to their customers
11. Microcomputers do not cause unemployment
Career
1. I would dislike having to work all day with a computer
2. I would like to be a computer specialist when I leave school
3. I think a job in computing is one of the best available
4. I would like to work for a firm that uses computers
5. Working with a computer would be an interesting and worthwhile career
6. Using a computer would be an interesting way to earn a living
7. If possisble I shall choose a job that does not use a computer
Leisure
1. TV-programmes about computers or robots are boring
2. I would very much like to be given a book about computers
3. During the school holidays, I would like to visit a firm using computers
4. I like to read about computers and the uses of computers
5. I would like to see more TV-programmes about computers and robots
6. I do not enjoy reading about robots and the uses of robots
7. I would not give up some of my free time to visit a computer system
School
1. All children should be taught to use a microcomputer at school
2. It is not necessary for a school to have a microcomputer
3. Children should not use school-time to learn about computers
4. Every school should have a computer club
5. School lessons about computers help to train pupils for a good career
6. Schools are spending too much time and money on computers
7. Lessons about comoputers and their uses should be compulsory for all pupils
8. I think every school should have several microcomputers for the pupils to use
9. Schools should use microcomputers to help pupils to learn more easily
241

CLASSROOM ENVIRONMENT SCALES USED IN THE PUPIL QUESTIONNAIRE
Part 1: The ICEQ Scales
All ICEQ items had a five-point response scale: Almost Never, Seldom, Sometimes,
Often, Very Often. These were scored 1, 2, 3, 4, 5 respectively for "positive" items.
Personalisation
1. The teacher considers students' feelings.
2. The teacher talks with each student
3. The teacher takes a personal interest in each student
4. The teacher goes out of his/her way to help each student
5. The teacher is unfriendly to students
6. The teacher helps each student who is having trouble with the work
7. The teacher remains at the front of the class rather than moving about
8. Students are encouraged to be considerate of other people's ideas and feelings
9. The teacher tries to find out what each student wants to learn about
10. The teacher uses tests to find out where each student needs help.
Participation
1. Students discuss their work.
2. The teacher talks rather than listens
3. Most students take part in discussion
4. Students give their opinion during discussion
5. The teacher lectures without students asking or answering questions
6. Students are asked questions
7. Students sit and listen to the teacher
8. Students ideas and suggestions are used during classroom discussions
9. Students ask the teacher questions
10. There is classroom discussion
Independence
1. The teacher decides where students sit
2. Students choose their partnesr for group work
3. Students are told exactly how to do their work
4. Students are told how to behave in the classroom
5. The teacher decides when students are to be tested
6. Students are punished if they behave badly
7. The teacher decides which students should work together
8. Students are told what will happen if they break any rules
9. Students who break the rules get into trouble
10. The teacher decides how much movement and talk there should be in the classroom
242
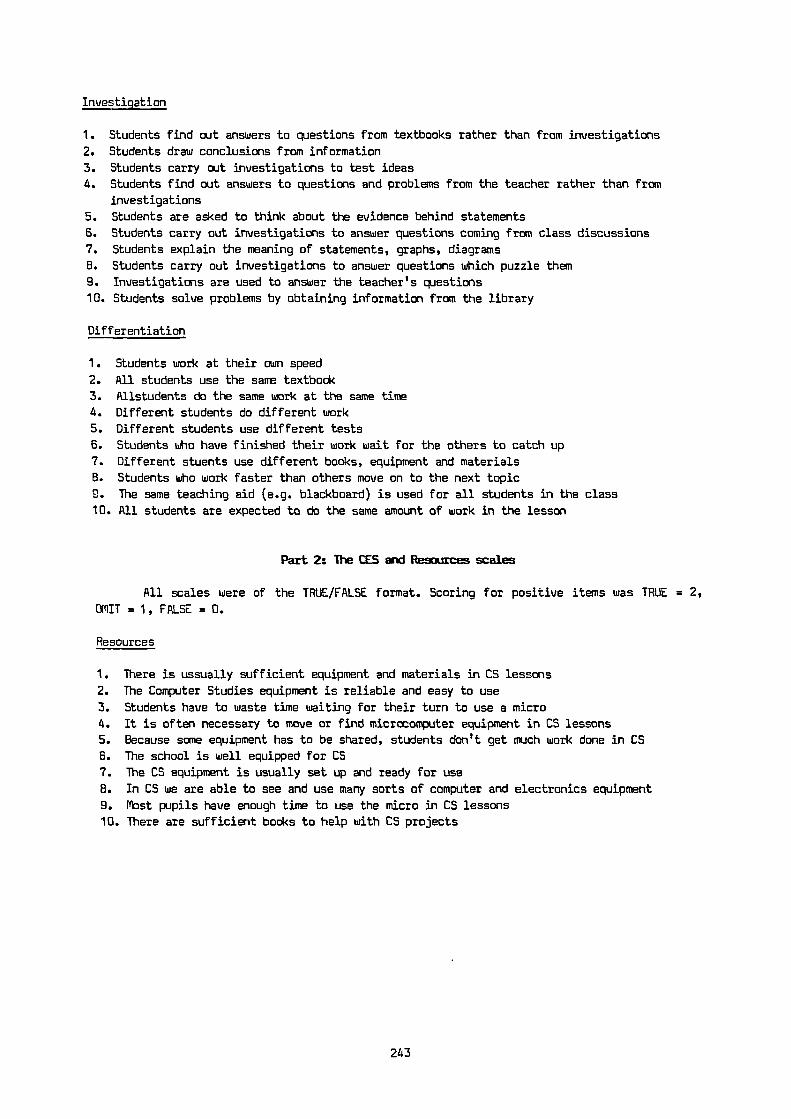
Investigation
1. Students find out answers to questions from textbooks rather than from investigations
2. Students draw conclusions from information
3. Students carry out investigations to test ideas
4. Students find out answers to questions and problems from the teacher rather than from
investigations
5. Students are asked to think about the evidence behind statements
6. Students carry out investigations to answer questions coming from class discussions
7. Students explain the meaning of statements, graphs, diagrams
B. Students carry out investigations to answer questions which puzzle them
9. Investigations are used to answer the teacher's questions
10. Students solve problems by obtaining information from the library
Differentiation
1. Students work at their own speed
2. All students use the same textbook
3. Allstudents do the same work at the same time
4. Different students do different work
5. Different students use different tests
6. Students who have finished their work wait for the others to catch up
7. Different stuents use different books, equipment and materials
B. Students who work faster than others move on to the next topic
D. The same teaching aid (e.g. blackboard) is used for all students in the class
10. All students are expected to do the same amount of work in the lesson
Part 2: The CES and Resources scales
All scales were of the TRUE/FALSE format. Scoring for positive items was TRUE = 2,
OMIT = 1, FALSE = D.
Resources
1. There is ussually sufficient equipment and materials in CS lessons
2. The Computer Studies equipment is reliable and easy to use
3. Students have to waste time waiting for their turn to use a micro
4. It is often necessary to move or find microcomputer equipment in CS lessons
5. Because some equipment has to be shared, students don't get much work done in CS
6. The school is well equipped for CS
7. The CS equipment is usually set up and ready for use
8. In CS we are able to see and use many sorts of computer and electronics equipment
9. Most pupils have enough time to use the micro in CS lessons
10. There are sufficient books to help with CS projects
243

Involvement
1. Students put a lot of effort into what they do in CS lessons
2. Students are often "clock-watching" in CS lessons
3. Most students really pay attention to what the teacher says in CS lessons
4. In CS lessons, very few students take part in class discussions or activities
5. A lot of students just "doodle" or waste time in CS lessons
6. As part of a CS lesson, students talk about their project to the rest of the class
7. A lot of students seem only half awake in Computer Studies
8. Students sometimes do extra Computer Studies work on their own
9. Students really enjoy Computer Studies lessons
Task Orientation
1. In Computer Studies, almost all the time is spent in lesson activities
2. Students are expected to stick closely to the work set in CS lessons
3. Getting the proper amount of work done is important in CS
4. Students don't do much work in CS lessons
5. In CS we usually get through the planned lesson
6. If a student misses a couple of CS lessons, it is difficult fo him or her to catch up
7. In CS lessons we often talk about things not connected with computers or electronics
B. CS lessons seem more aplace to chat or play games than they are to learn something
9. In CS the teacher sticks to classwork and doesn't get sidetracked to talk about other
things
Order & Organisation
1. Computer Studies lessons are well organised
2. Students are almost always well behaved in Computer Studies
3. CS classes are often very noisy
4. In CS lessons, the teacher hardly ever has to call the class to order
5. Computer Studies activities are usually clear so everyone knows exactly what to do
6. CS lessons hardly ever start on time7. The teacher often has to tell students to calm down in CS
8. Students don't fool around in Computer Studies lessons
9. In CS lessons, students don't shout out whilst the teacher is talking
Innovation
1. New ideas are always being tried out in CS lessons
2. What students do in CS is very different on different days
3. New and different ways of teaching are not tried very often in CS classes
4. The CS teacher likes pupils to think up unusual problems
5. In CS the students have very little say about how the lessons are spent or arranged
6. The CS teacher often suggests unusual projects for pupils
7. Students are set the same kind of homework after almost every CS lesson
244

THE TEACHER ACTIVITY SCALES
Pc tivity Descriptions
(Short descriptions of the 19 Teaching Activities derived from the 206 item checklist)
ACTO1 General teaching via textbooks, pupil programming on micros
ACTO2 General teaching via tests, making notes, class discussion
ACTO3 Differentiation of pupil work via individual exercises, materials
ACTO4 Teacher concern for pupils'career and leisure interests both during and after lessons
ACTO5 Use of pupil-centred and pupil-directed study exercises
ACTO6 Obtain and use new teaching ideas from other teachers, INSET courses, journals
ACTO7 Use of wallcharts, TV and videos, other non-computer audio-visual-aids
ACTO8 Concern for and use of microcomputer network, wordprocessors
ACTO9 Microelectronics: demonstration and pupil use, course attendance
ACT10 Use of computer hardware and other peripherals for teaching
ACT11 Use of worksheet-based exercises, routine keyboard exercises
ACT12 Pupil participation in lessons
ACT13 Pupils encouraged to find out about computers for themselves
ACT14 Teacher concern for provision of hardware resources and up-to-date information
ACT15 Teacher demonstration and pupil use of software packages
ACT16 Teacher involvement with computer-based school administration
ACT17 Use of micro for data handling, use of commercial materials
ACT18 Concern for computing as a professional study, courses for other staff
ACT19 Use of simulation materials, demonstration of LOGO, CAD, teletext
Lists of the Teaching Behaviours (Checklist items) within each Activity are given on
the following pages. The number preceding each item shows its position in the checklist.
Items marked * were deleted from the Activity before calculation of the Scale statistics.
Activity No.1
Label: General teaching via textbooks, pupil programming on micros
1 Require pupils to make notes for class textbook
138 Require pupils to make notes on applications from class textbook
45 Require pupils to read selected parts of textbook in CS lesson
*12 Teach about artificial intelligence as one of CS topics
67 Specify the length or content of pupils' projects
103 Display rules relating to safe/allowed use of microcomputers etc
55 Issue a class textbook for an extended period
*192 Issue more than one textbook during the course
*13 Permit pupils to use equipment/materials you have not previously demonstrated
*36 Allow pupils to program directly at the keyboard without first making a program listing
on paper
27 Require pupils to work at micros in groups of three or more
140 Use more than one type of micro with a class or group
169 Require pupils to program on more than one type of micro
245

Activity No. 2
Label: General teaching via tests, making notes, class discussion
6 Use slides or tape-slidepack for CS-teaching
76 Offer extreme or exaggerated view to stimulate pupils' comments
23 Show video to initiate discussion about computer use
185 Use diagrams/articles from computer magazine as part of pupil handout
16 Require pupils to write an extended account ("essay") after viewing a film or video
175 Require pupils to make their our notes about film/video
51 Require pupils to write notes or an essay as a follow-up to a class discussion or
debate
66 Ask pupils to bring computer-items from newspapers and magazines for teaching use in
CS-lessons
53 Hold class discussion of recent computer news or development in place of the lesson
planned for that day
85 Set exercises requiring extended answers throughout whole course
145 Set test requiring extended answers each term or more often
74 Talk generally about a topic whilst pupils make own notes
102 Require pupils to make own notes during class discussions
Activity NO. 3
Label: Differentiation of pupil work via individual exercises, materials
7 Mark a pupil's work in the presence of the individual pupil
71 Suggest pupils devise their own problems for programming exercises
39 Within the same class, set different programming execises to pupils with different
levels of programming experience
132 Use different sets of programming exercises for fast and slow pupils in the same class
30 Set an individual pupil extra problems/exercises to help correct a misunderstanding
revealed by test or homework
120 Set programming problems based on the known interests of individual members of the
class
59 Use pupils' questions as ideas for subsequent lessons
78 Use pupils'programming ideas as a starting point for further lesson(s) on programming
46 Plan lessons so that time is available for talk with individual pupils
171 Ask pupils' opinions of work set/done in CS lessons
191 Encourage pupils with a home micro to work ahead of other pupils
Activity No.4
Label: Teacher concern for pupils' career and leisure interests both during and after
lessons
48 Discuss careers in computing with pupils in out of lesson time
206 Point out the job-relevance of CS topics and skills
96 Discuss careers in computing during CS lesson time
91 Ask pupils to tak about their views on the social effects of computers
128 Talk to pupils about their leisure time use of home micros
continued....
246

172 See pupil after school to explain errors in test/homework
189 Talk to pupils about TV-programmes on computers outside lessons
199 Discuss own personal computer interest with pupils after lessons
68 Require pupils to choose and write their or ideas about some aspect of the social
effects of computer use
Activity No. 5
Label: Use of pupil-centred and pupil-directed study exercises
94 Require pupils to study one or more computer applications by private work and use of
library books
125 Tell pupils their essay answers should include material they have discovered for
themselves
178 Explain to class how to use information for projects
137 Require pupils to use reference books to find data for class exercises
156 Require pupils to consult more than one book to answer set exercise
148 Arrange some lessons so that half the class uses micros for programs whilst the other
pupils do non-programming work
194 Arrange the class so that some pupils write programs into notebooks whilst others use
micros for programming exercises
158 Allow pupil to work on project or individual study instead of doing class exercises
168 Seek help from another teacher about the teaching of a CS topic
Activity No.6
Label: Obtain and use new teaching ideas from other teachers, INSET courses, journals
2 Meet with other teachers to review/discuss CAL materials
146 Collaborate with other teachers to teach Information Technology
32 Help other staff to choose or obtain appropriate CAL software
61 Help/advise staff about microcomputer hardware for CAL use
183 Encourage pupils to attend outside lecture/exhibition on computing
112 Implement teaching idea from journal, or educational text
151 Implement teaching idea from another teacher or INSET course
159 Demonstrate an education program as an example of computer use
89 Attend local (non-residential) INSET course
101 Locate source of cheap or free materials for CS teaching
Activity No.?
Label: Use of wallcharts, TV and videos, other non-computer audio-visual aids
*8 Encourage pupils to use micros in out-of-lesson time to complete classwork or to Obtain
extra practice
14 Use film or video to show applications of computers
*25 Use class textbook as sourcxe of exercises on non-programming topics
*127 Require pupils to teackle "debugging" in a logical and serious manner as an
integral part of programming
*24 Teach techniques of top-down or structured programming
114 Give pupils worksheets for non-programming topics
continued....
247

54 Use wallcharts showing peripherals or parts of microcomputers
88 Use wallcharts of peripherals or parts of mainframe computers
35 Record TV-programme for use in CS-lesson
201 Preview audio-visual materials prior to use in CS lesson
129 Use diagram or article from computer magazine for wall display
152 Use newspaper/magazine article as source of lesson material
177 Read educational computing journal to look for teaching ideas
Activity No. 8
Label: Concern for and use of microcomputer network, wordprocessors
20 Maintain/repair computer equipment oneself
134 Devote part of each day (or nearly every day) to care of school network, administration
programs and/or software resources
47 Maintain library of books and magazines specifically for pupil use
*79 Devise special projects for less-able pupils in CS-classes
187 Demonstrate assembly language or machine-code programming
157 Vacate CS-area in favour of teacher wishing to use CAL
34 Demonstrate a commercial/business package/program to CS pupils
98 Use a wordprocessor for the preparation of handouts/worksheets
161 Demonstrate wordprocessor in CS-lesson
70 Allow pupils to use wordprocessor to prepare the documentation for their CS-project
110 Require pupils to use a wordprocessor as part of a CS-lesson
Activity No. 9
Label: Microelectronics: demonstration and pupil use; course attendance
3 Demonstrate thermistor or other sensor connected to input port
72 Require pupils to use sensors (eg for heat, light) as part of CS practical work
60 Demonstrate control of lamp/motor via the output port of micro
160 Require pupils to use non-keyboard input device(s) for PW
65 Demonstrate BBC-Buggy or other robot-like device
149 Require pupils to use BBC-Buggy or robot for practical work
122 Construct an interface or "control-box" for CS teaching/demonstration
181 Personally construct microelectronics equipment for CS teaching
144 Make or repair microelectronics equipment for another teacher
131 Attend an INSET course on microelectronics
Activity No. 10
Label: Use of computer hardware and other peripherals for teaching
18 Demonstrate PRESTEL as part of a CS lesson
196 Demonstrate electronic mail-box communication
87 Demonstrate bar-code reader
29 Use teletypewriter to show production/reading of paper tape
38 Use/demonstrate link to a mainframe computer
77 Ask pupil to bring their own software for use in CS lessons
188 Ask pupils to bring items of hardware for use in CS lessons
continued
248
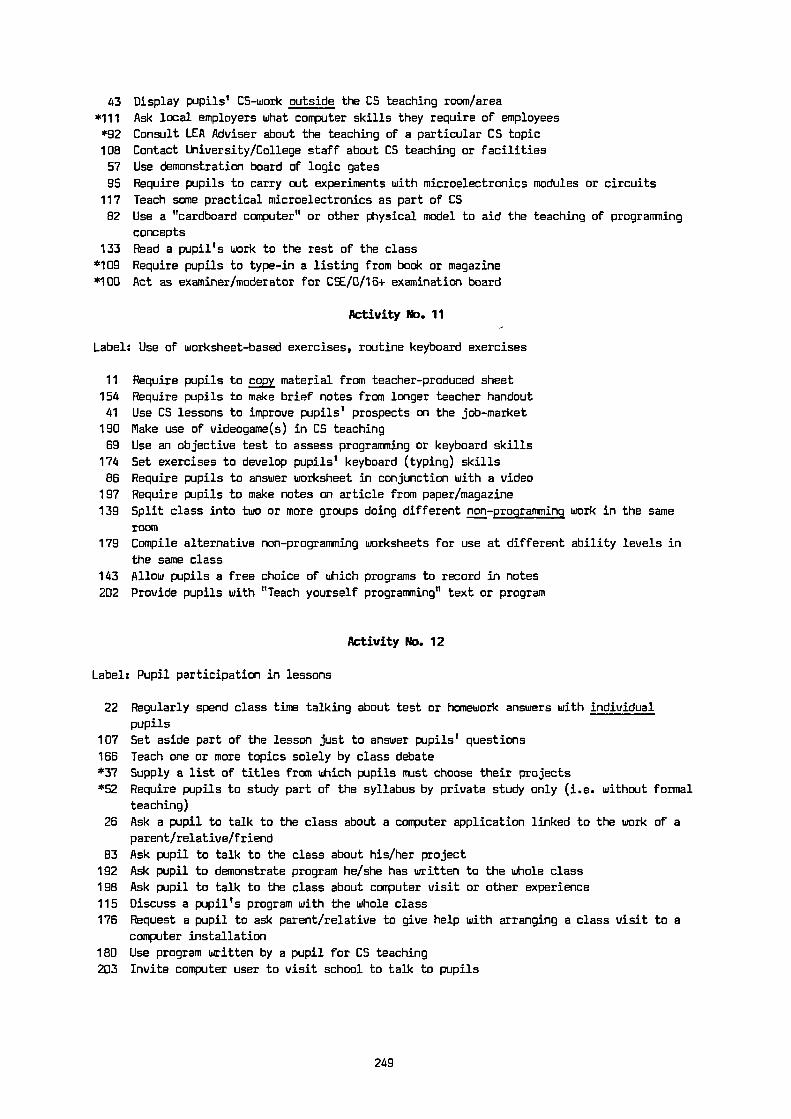
43 Display pupils' CS-work outside the CS teaching room/area
*111 Ask local employers what computer skills they require of employees
*92 Consult LEA Adviser about the teaching of a particular CS topic
108 Contact University/College staff about CS teaching or facilities
57 Use demonstration board of logic gates
95 Require pupils to carry out experiments with microelectronics modules or circuits
117 Teach some practical microelectronics as part of CS
82 Use a "cardboard computer" or other physical model to aid the teaching of programming
concepts
133 Read a pupil's work to the rest of the class
*109 Require pupils to type-in a listing from book or magazine
*100 Act as examiner/moderator for CSE/0/16+ examination board
Activity No. 11
Label: Use of worksheet-based exercises, routine keyboard exercises
11 Require pupils to copy material from teacher-produced sheet
154 Require pupils to make brief notes from longer teacher handout
41 Use CS lessons to improve pupils' prospects on the job-market
190 make use of videogame(s) in CS teaching
69 Use an objective test to assess programming or keyboard skills
174 Set exercises to develop pupils' keyboard (typing) skills
86 Require pupils to answer worksheet in conjunction with a video
197 Require pupils to make notes on article from paper/magazine
139 Split class into two or more groups doing different non-programming work in the same
room179 Compile alternative non-programming worksheets for use at different ability levels in
the same class
143 Allow pupils a free choice of which programs to record in notes
202 Provide pupils with "Teach yourself programming" text or program
Activity No. 12
Label: Pupil participation in lessons
22 Regularly spend class time talking about test or homework answers with individual
pupils
107 Set aside part of the lesson just to answer pupils' questions
166 Teach one or more topics solely by class debate
*37 Supply a list of titles from which pupils must choose their projects
*52 Require pupils to study part of the syllabus by private study only (i.e. without formal
teaching)
26 Ask a pupil to talk to the class about a computer application linked to the work of a
parent/relative/friend
83 Ask pupil to talk to the class about his/her project
192 Ask pupil to demonstrate program he/she has written to the whole class
198 Ask pupil to talk to the class about computer visit or other experience
115 Discuss a pupil's program with the whole class
176 Request a pupil to ask parent/relative to give help with arranging a class visit to a
computer installation
180 Use program written by a pupil for CS teaching
203 Invite computer user to visit school to talk to pupils
249

Activity No. 13
Label: Pupils encouraged to find out about computers for themselves
97 Tell pupils they should try to arrange a personal visit to a computer installation with
the help of a parent/relative/friend
125 Tell pupils to make a personal study of a computer application linked to the work of a
parent/relative/friend
130 Encourage pupils to seek and "unusual" solution to programming exercises
184 Allow pupils free choice of which application to study
33 Provide pupils with a guide to help them make notes from books
63 Incorporate the teaching of study skills within CS lessons
116 Encourage pupils to write to firms/institutions to seek information about computers and
computer applications
165 Call on pupil with special knowledge or interest in a topic to make a greater
contribution to class discussion
164 Arrange for class or group to produce cooperative work
204 Consult or discuss with other teachers about the teaching of problem-solvinq skills
121 Allow pupils to go to school library during a CS lesson
Activity No.14
Label: Teacher concern for provision of hardware resources and up-to-date information.
4 Use own computer at home to prepare CS materials and exercises
44 Give lessons on problem-solving in addition to lessons on programming
17 Write CAL program for use in awn teaching
21 Write or modify CAL programs for teachers in other subjects
9 Ask pupils to bring examples/problems from other subjects to CS-lessons
147 Set programming problem based on topic from other school subject
84 Consult LEA Adviser about financial problems of resources for CS
150 Make personal visit to compouter installation to obtain ideas or information for CS
teaching
31 Engage in fund-raising activities to buy additional microcomputers
99 Teach some pupils "theory work" outside normal lessons
75 Take positive action to encourage girls to choose CS
104 Display pupils' work on the walls of the CS teaching area
49 Read computing or technical magazine in the school library
136 Check programs used in computer club sessions have some educational value
Activity Pb. 15
Label: Teacher demonstration and pupil use of software packages
50 Demonstrate the use of input-output ports of the micro
113 Include computer control as a topic within CS teaching
106 Demonstrate lightpen, graphpad or other input device
142 Demonstrate a stock-control program
170 Require pupils to use a simulation of a computer application
58 Set pupils exercise based on use of a file-handling package
124 Set pupils exercise based on use of a simple database (eg Quest)163 Require pupils to collect data to make up a personal datafile
62 Require pupils to use a commercial/office software package (eg a spreadsheet)
155 Demonstrate file-handling by means of a commercial program
250
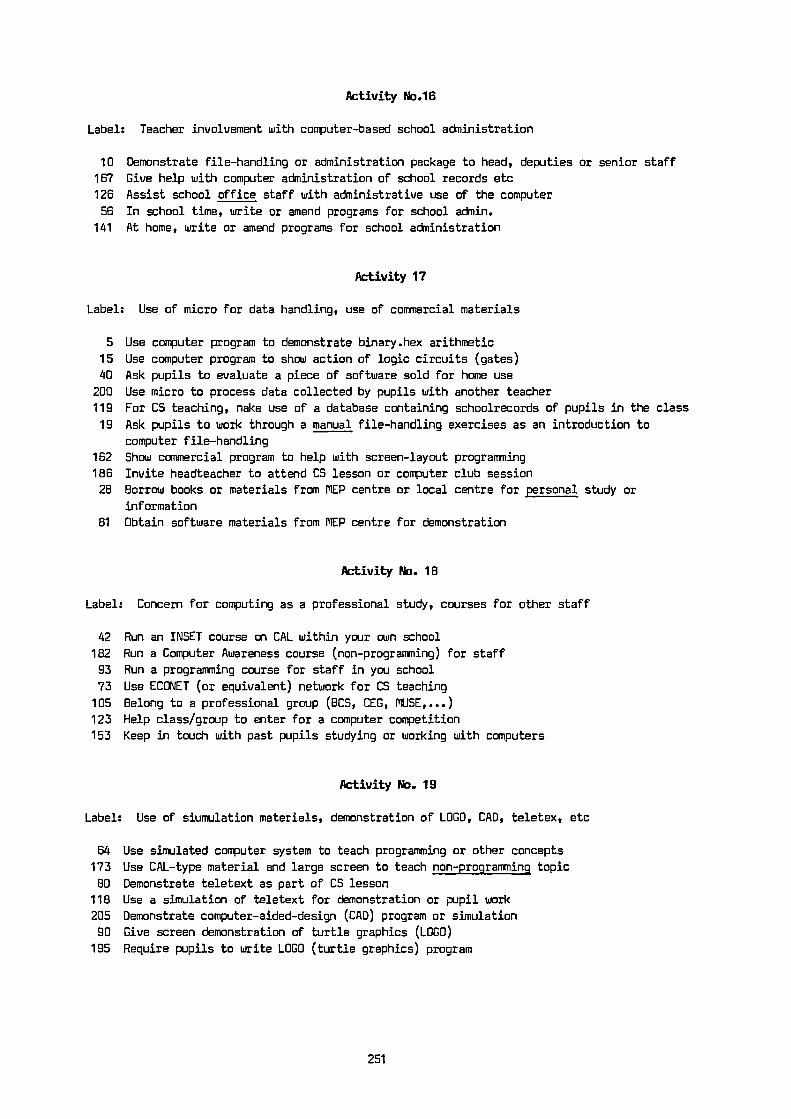
Activity No.16
Label: Teacher involvement with computer-based school administration
10 Demonstrate file-handling or administration package to head, deputies or senior staff
167 Give help with computer administration of school records etc
126 Assist school office staff with administrative use of the computer
56 In school time, write or amend programs for school admin.
141 At home, write or amend programs for school administration
Activity 17
Label: Use of micro for data handling, use of commercial materials
5 Use computer program to demonstrate binary.hex arithmetic
15 Use computer program to show action of logic circuits (gates)
40 Ask pupils to evaluate a piece of software sold for home use
200 Use micro to process data collected by pupils with another teacher
119 For CS teaching, nake use of a database containing schoolrecords of pupils in the class
19 Ask pupils to work through a manual file-handling exercises as an introduction to
computer file-handling
162 Show commercial program to help with screen-layout programming
186 Invite headteacher to attend CS lesson or computer club session
28 Borrow books or materials from MEP centre or local centre for personal study or
information
81 Obtain software materials from MEP centre for demonstration
Activity No. 18
Label: Concern for computing as a professional study, courses for other staff
42 Run an INSET course on CAL within your awn school
182 Run a Computer Awareness course (non-programming) for staff
93 Run a programming course for staff in you school
73 Use ECONET (or equivalent) network for CS teaching
105 Belong to a professional group (BCS, CEG, MUSE,...)
123 Help class/group to enter for a computer competition
153 Keep in touch with past pupils studying or working with computers
Activity No. 19
Label: Use of siumulation materials, demonstration of LOGO, CAD, teletex, etc
64 Use simulated computer system to teach programming or other concepts
173 Use CAL-type material and large screen to teach non-programming topic
80 Demonstrate teletext as part of CS lesson118 Use a simulation of teletext for demonstration or pupil work
205 Demonstrate computer-aided-design (CAD) program or simulation
90 Give screen demonstration of turtle graphics (LOGO)
195 Require pupils to write LOGO (turtle graphics) program
251
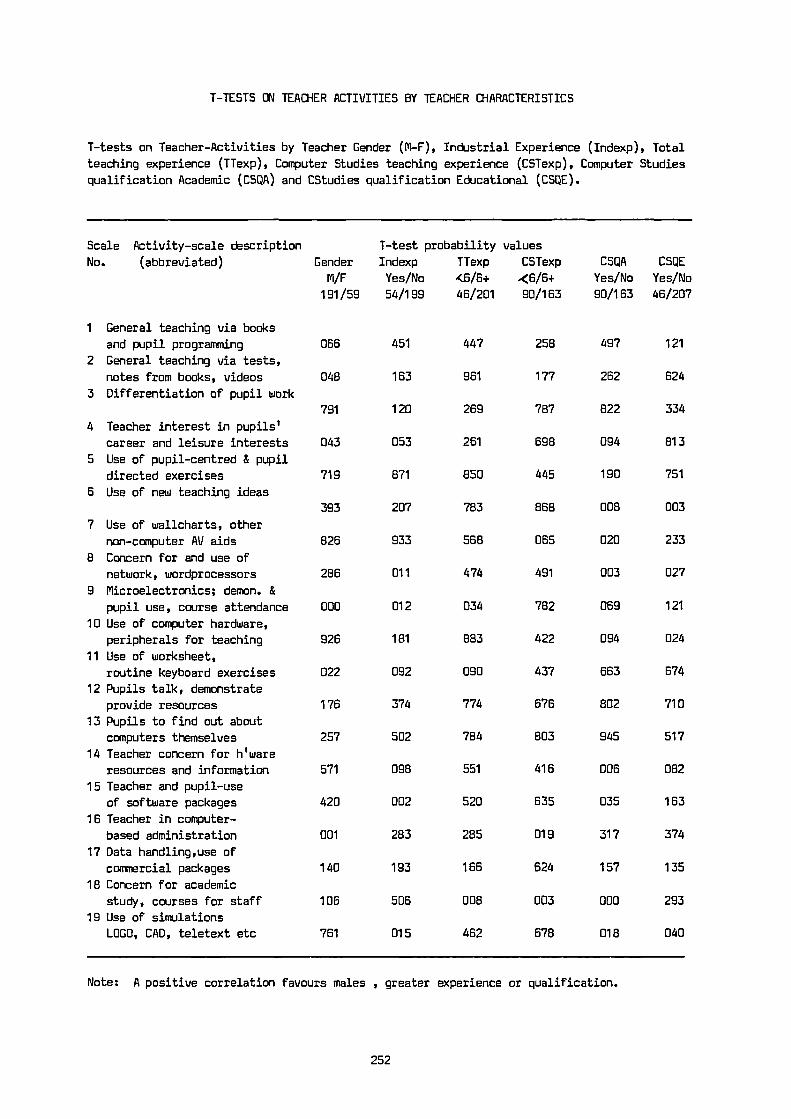
1-TESTS ON TEACHER ACTIVITIES BY TEACHER CHARACTERISTICS
1-tests on Teacher-Activities by Teacher Gender (M-F), Industrial Experience (Indexp), Total
teaching experience (TTexp), Computer Studies teaching experience (CSTexp), Computer Studies
qualification Academic (CSQA) and CStudies qualification Educational (CSQE).
Scale Activity-scale description
No. (abbreviated) Gender
M/F
T-test probability values
Indexp TTexp CSTexp
Yes/No 46/6+ 46/6+
CSQA
Yes/No
CSQE
Yes/No
191/59 54/199 46/201 90/163 90/163 46/207
1 General teaching via books
and pupil programming 066 451 447 258 497 121
2 General teaching via tests,
notes from books, videos 048 163 961 177 262 624
3 Differentiation of pupil work
791 120 269 787 822 334
4 Teacher interest in pupils'
career and leisure interests 043 053 261 698 094 813
5 Use of pupil-centred & pupil
directed exercises 719 871 850 445 190 751
6 Use of new teaching ideas393 207 783 868 008 003
7 Use of wallcharts, other
non-computer AV aids 826 933 568 065 020 233
8 Concern for and use of
network, wordprocessors 286 011 474 491 003 027
9 Microelectronics; demon. &
pupil use, course attendance 000 012 034 782 069 121
10 Use of computer hardware,
peripherals for teaching 926 181 883 422 094 024
11 Use of worksheet,
routine keyboard exercises 022 092 090 437 663 674
12 Pupils talk, demonstrate
provide resources 176 374 774 676 802 710
13 Pupils to find out about
computers themselves 257 502 764 803 945 517
14 Teacher concern for hiware
resources and information 571 098 551 416 006 082
15 Teacher and pupil-use
of software packages 420 002 520 635 035 163
16 Teacher in computer-
based administration 001 283 285 019 317 374
17 Data handling,use of
commercial packages 140 193 166 624 157 135
18 Concern for academic
study, courses for staff 106 506 008 003 000 293
19 Use of simulations
LOGO, CAD, teletext etc 761 015 462 678 018 040
Note: A positive correlation favours males , greater experience or qualification.
252

BREAKDOWN OF ACTIVITY SCORES BY IMPORTANCE MATRIX ITEM RATINGS
The value quoted is the significance of F, the ratio of the mean squares between
groups to the mean square within groups. Since N = 253 and each Matrix item had (usually)
three classes of response, the numbers of degrees of freedom were 2 and 250.
Act. Importance Rating Matrix Item Numbers
No. 01 02 03 04 05 06 07 08 09 10 11 12 13 14 15 16 17
01 247 666 256 179 981 110 465 351 000 715 250 395 419 782 035 240 496
02 441 001 155 113 527 066 096 104 278 453 328 396 725 784 059 473 798
03 599 534 707 550 104 490 060 050 513 027 003 034 020 594 522 956 004
04 243 002 151 683 161 284 098 137 038 666 144 708 410 859 574 730 549
05 068 002 230 894 426 886 204 989 492 350 004 357 050 212 241 883 125
06 188 223 034 009 031 062 376 021 060 042 546 372 177 831 225 507 089
07 159 153 017 817 520 016 381 087 611 425 359 503 241 716 532 900 798
08 294 512 264 364 737 244 130 295 001 059 321 322 656 552 118 122 080
09 244 022 459 534 571 081 035 000 013 560 047 568 000 021 476 170 476
10 885 019 788 304 413 018 004 001 010 068 096 965 048 804 862 461 152
11 732 022 086 160 784 013 096 086 490 260 487 191 010 506 410 752 575
12 536 000 509 920 247 535 184 605 000 368 230 645 426 394 262 472 159
13 787 006 311 302 272 661 177 640 106 389 005 253 016 084 614 918 004
14 534 001 823 422 188 818 053 573 018 267 010 454 059 378 536 770 039
15 424 096 001 141 763 309 732 001 007 774 414 148 056 073 527 564 130
16 869 627 320 302 190 560 000 076 260 429 552 425 508 019 853 420 964
17 874 038 119 471 680 085 014 009 072 839 344 662 142 472 290 160 189
18 319 366 371 841 017 315 067 053 061 151 430 506 262 680 923 144 173
19 110 275 001 142 846 111 507 002 069 282 343 091 128 674 434 606 193
253

RESULTS CF T-TESTS ON COMPUTER ATTITUDES BY PUPIL VARIABLES
Tests by gender
Variable Group N Mean SD T/Prob.
Satisfaction Boys 778 21.8985 6.278 -6.46Girls 357 24.4285 6.051 0.000
Employment Boys 778 31.4627 7.808 -6.86Girls 357 34.8627 7.728 0.000
Threat Boys 778 27.7121 7.397 -5.78Girls 357 30.4482 7.406 0.000
Future Boys 778 24.2185 5.686 -1.97Girls 357 24.9356 5.701 0.049
Social Boys 778 31.0566 7.184 -5.28Girls 357 33.3697 6.687 0.000
Career Boys 778 19.2044 7.011 -6.18Girls 357 21.8571 6.577 0.000
Leisure Boys 778 18.4460 6.736 -9.97Girls 357 22.5910 6.395 0.000
School Boys 778 19.3997 5.617 -2.09Girls 357 20.1849 5.982 0.037
Tests by Homeuse for Boys
Satisfaction High 625 20.9568 5.696 -7.80Low 153 20.7451 7.054 0.000
Employment High 625 30.6960 7.553 -5.42Low 153 34.5948 8.070 0.000
Threat High 625 27.0512 7.375 -5.34Low 153 30.4118 6.879 0.000
Future High 625 23.6645 5.488 -3.45LOW 153 25.7386 6.223 0.001
Social High 625 30.3152 6.944 -5.73Low 153 34.0850 7.376 0.000
Career High 625 18.0704 6.763 -10.3Low 153 23.8366 6.051 0.000
Leisure High 625 17.4480 6.293 -8.32Low 153 22.5229 6.965 0.000
School High 625 18.6496 5.079 -6.68Low 153 22.4641 6.601 0.000
Tests by House for Girls
Satisfaction High 179 23.0615 5.789 -4.38Low 178 25.7978 6.014 0.000
Employment High 179 33.5922 7.671 -3.15Low 178 36.1404 7.594 0.002
continued

Variable Group N Mean SD T/Prob.
Threat High 179 29.7542 7.992 -1.78Low 178 31.1461 6.716 0.076
Future High 179 24.6145 5.840 -1.07Low 178 25.2584 5.555 0.287
Social High 179 32.3464 6.658 -2.93Low 178 34.3969 6.575 0.004
Career High 179 20.6983 6.399 -3.39Low 178 23.0225 6.566 0.001
Leisure High 179 21.4525 6.295 -3.42Low 178 23.7360 6.307 0.001
School High 179 19.0279 5.218 -3.73Low 178 21.3483 6.471 0.000
Tests by CAL for Boys
Satisfaction High 258 21.4535 5.574 -1.47Low 520 22.1192 6.594 0.141
Employment High 258 31.0969 7.480 -0.94Low 520 31.6642 7.966 0.348
Threat High 258 27.9225 7.510 0.558Low 520 27.6077 7.346 0.580
Future High 258 24.1977 5.631 -0.07Low 520 24.2288 5.718 0.942
Social High 258 30.9109 6.785 -0.41Low 520 31.1268 7.379 0.682
Career High 258 19.0310 6.701 -0.05Low 520 19.2904 7.164 0.620
Leisure High 258 18.0891 6.678 -1.05Low 520 18.6231 6.764 0.296
School High 258 18.6589 5.086 -2.72Low 520 19.7673 5.832 0.007
Tests by CAL for Girls
Satisfaction High 107 24.0935 6.034 -0.68Low 250 24.5680 6.064 0.497
Employment High 107 32.9346 7.130 -3.24Low 250 35.6680 7.840 0.001
Threat High 107 29.5327 7.206 -1.55Low 250 30.8400 7.470 0.155
Future High 107 24.1682 5.235 -1.75Low 250 25.2640 5.868 0.082
Social High 107 32.8224 6.470 -1.03Low 250 33.6040 6.777 0.304
Career High 107 20.4206 6.289 -2.78Low 250 22.4720 6.615 0.006
Leisure High 107 21.7009 5.609 -1.85Low 250 22.9720 6.678 0.066
School High 107 19.1869 5.669 -2.13Low 250 20.6120 6.072 0.034

Scheffe Tests of Computer Attitude scales by Science Group
Variable SC-Grp Means Mean Squares OF F/Prob/Result.
Satisfaction 3 21.1088 8G 981.4882 2 25.6403
2 22.2445 (11G 38.2791 1160 0.000
1 24.4378 3 ) 2 > 1
Employment 3 30.5306 BC 2090.5815 2 35.375
2 31.7695 (tIG 59.0977 1160 0.0000
1 35.2405 3 ) 2 >1
Threat 3 27.0102 BC 1325.1183 2 24.2722
2 28.0020 WG 54.5940 1160 0.0000
1 30.7622 3)1 2>1
Future 3 24.0802 BC 111.0878 2 3.4275
2 24.6190 WG 32.4190 1160 0.0328
1 25.0730 2 ) 1
Social 3 30.3810 BC 2340.1805 2 24.0895
2 31.1303 (tIG 48.5725 1160 0.0000
1 33.8297 3)1 2,1
Career 3 18.0102 BC 1563.2327 2 33.9033
2 19.5892 (11G 46.1085 1160 0.0000
1 22.2541 3 ) 2 , 1
Leisure 3 17.3027 BC 2167.9275 2 49.4062
2 19.2425 WG 43.8797 1160 0.0000
1 22.3216 3 > 2 1
School 3 18.9694 BC 450.6655 2 13.9621
2 19.0621 (1JG 32.2778 1160 0.0000
1 20.9162 3>1 2)1
256
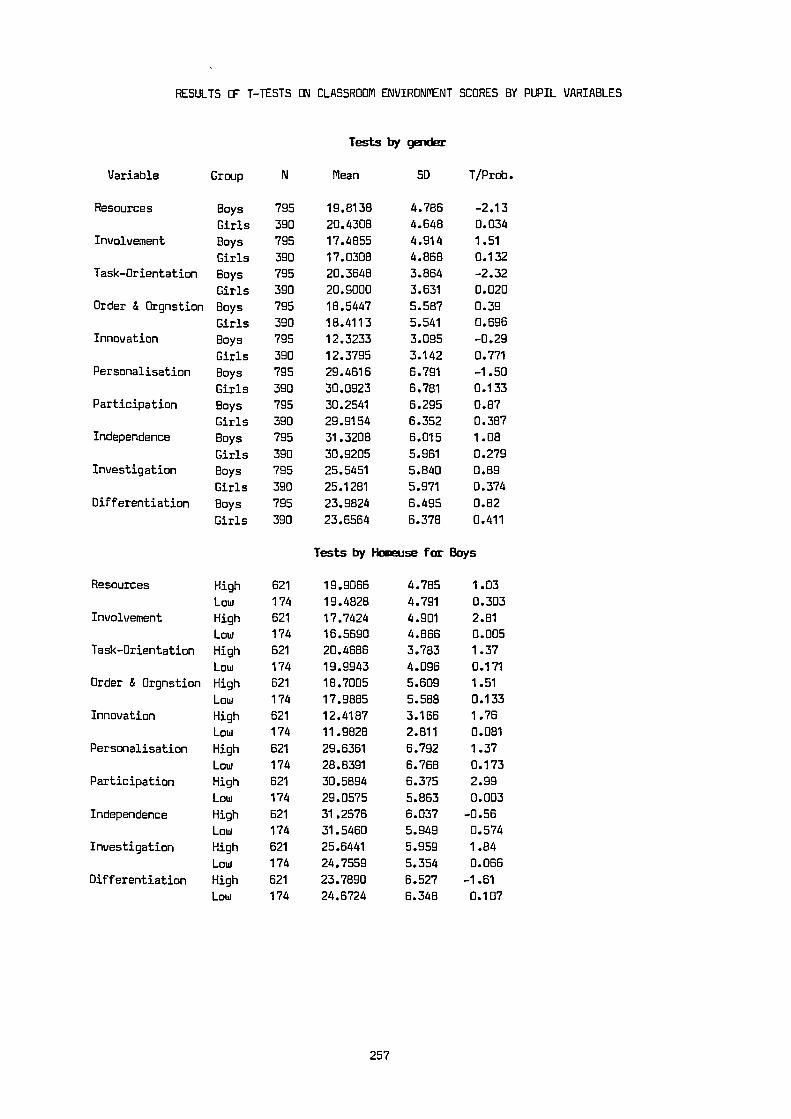
RESULTS OF T-TESTS ON CLASSROOM ENVIRONMENT SCORES BY PUPIL VARIABLES
Variable Group N
Tests
Mean T/Prob.
by gender
SD
Resources Boys 795 19.8138 4.786 -2.13
Girls 390 20.4308 4.648 0.034
Involvement Boys 795 17.4855 4.914 1.51
Girls 390 17.0308 4.868 0.132
Task-Orientation Boys 795 20.3648 3.864 -2.32
Girls 390 20.9000 3.631 0.020
Order & Orgnstion Boys 795 18.5447 5.587 0.39
Girls 390 18.4113 5.541 0.696
Innovation Boys 795 12.3233 3.095 -0.29
Girls 390 12.3795 3.142 0.771Personalisation Boys 795 29.4616 6.791 -1.50
Girls 390 30.0923 6.781 0.133
Participation Boys 795 30.2541 6.295 0.87
Girls 390 29.9154 6.352 0.387Independence Boys 795 31.3208 6.015 1.08
Girls 390 30.9205 5.961 0.279Investigation Boys 795 25.5451 5.840 0.89
Girls 390 25.1281 5.971 0.374
Differentiation Boys 795 23.9824 6.495 0.82
Girls 390 23.6564 6.378 0.411
Tests by House far Bays
Resources High 621 19.9066 4.785 1.03
Low 174 19.4828 4.791 0.303
Involvement High 621 17.7424 4.901 2.81
Low 174 16.5690 4.866 0.005
Task-Orientation High 621 20.4686 3.783 1.37
Low 174 19.9943 4.096 0.171
Order & Orgnstion High 621 18.7005 5.609 1.51
Low 174 17.9885 5.588 0.133
Innovation High 621 12.4187 3.166 1.76
Low 174 11.9828 2.811 0.081
Personalisation High 621 29.6361 6.792 1.37
Low 174 28.8391 6.768 0.173
Participation High 621 30.5894 6.375 2.99
Low 174 29.0575 5.863 0.003
Independence High 621 31.2576 6.037 -0.56
Low 174 31.5460 5.949 0.574
Investigation High 621 25.6441 5.959 1.84
Low 174 24.7559 5.354 0.066
Differentiation High 621 23.7890 6.527 -1.61
Low 174 24.6724 6.348 0.107
257
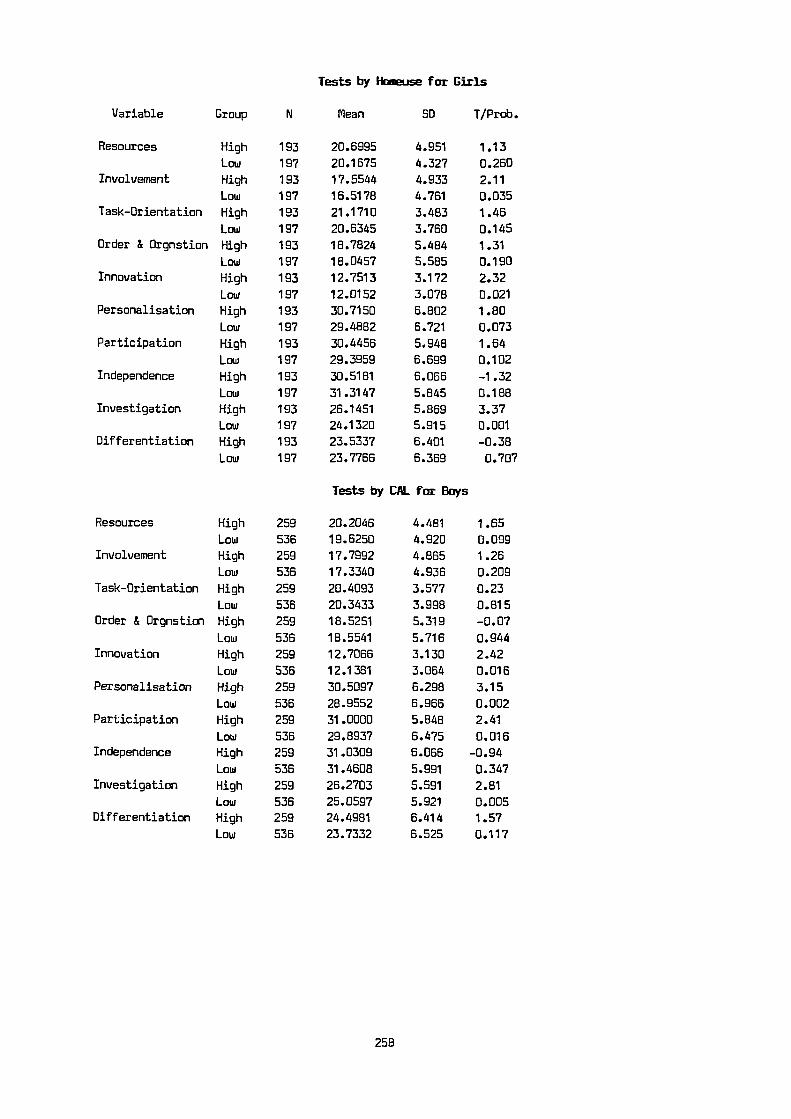
Tests by Hooeuse for Girls
Variable Group N Mean SD T/Prob.
Resources High 193 20.6995 4.951 1.13
Low 197 20.1675 4.327 0.260
Involvement High 193 17.5544 4.933 2.11
Low 197 16.5178 4.761 0.035Task-Orientation High 193 21.1710 3.483 1.46
Low 197 20.6345 3.760 0.145Order & Orgnstion High 193 18.7824 5.484 1.31
Low 197 18.0457 5.585 0.190Innovation High 193 12.7513 3.172 2.32
Low 197 12.0152 3.078 0.021Personalisation High 193 30.7150 6.802 1.80
Low 197 29.4882 6.721 0.073
Participation High 193 30.4456 5.948 1.64
Low 197 29.3959 6.699 0.102
Independence High 193 30.5181 6.066 -1.32
Low 197 31.3147 5.845 0.188Investigation High 193 26.1451 5.869 3.37
Low 197 24.1320 5.915 0.001Differentiation High 193 23.5337 6.401 -0.38
Low 197 23.7766 6.369 0.707
Tests by CAL for Boys
Resources High 259 20.2046 4.481 1.65
Low 536 19.6250 4.920 0.099Involvement High 259 17.7992 4.865 1.26
Low 536 17.3340 4.936 0.209
Task-Orientation High 259 20.4093 3.577 0.23
Low 536 20.3433 3.998 0.815
Order & Orgnstion High 259 18.5251 5.319 -0.07
Low 536 18.5541 5.716 0.944Innovation High 259 12.7066 3.130 2.42
Low 536 12.1381 3.064 0.016Personalisation High 259 30.5097 6.298 3.15
Low 536 28.9552 6.966 0.002Participation High 259 31.0000 5.848 2.41
Low 536 29.8937 6.475 0.016Independence High 259 31.0309 6.066 -0.94
Low 536 31.4608 5.991 0.347Investigation High 259 26.2703 5.591 2.81
Low 536 25.0597 5.921 0.005Differentiation High 259 24.4981 6.414 1.57
Low 536 23.7332 6.525 0.117

Tests by CAL for Girls
Variable Group N Mean SD T/Prob.
Resources High 123 20.3171 4.916 -0.32
Low 267 20.4831 4.528 0.751Involvement High 123 17.1707 4.998 0.38
Low 267 16.9603 4.816 0.705Task-Orientation High 123 21.1789 3.497 1.05
Low 267 20.7715 3.691 0.295Order & Orgnstion High 123 18.3821 5.615 -0.07
Low 267 18.4232 5.516 0.946Innovation High 123 12.7236 3.173 1.46
Low 267 12.2210 3.122 0.145Personalisation High 123 31.5854 6.646 3.00
Low 267 29.4045 6.744 0.003Participation High 123 30.8130 6.410 1.69
Low 267 29.5019 6.294 0.060Independence High 123 31.2764 5.940 0.80
Low 267 30.7566 5.975 0.424Investigation High 123 26.1789 6.104 2.34
Low 267 24.6442 5.856 0.020Differentiation High 123 23.3577 6.658 -0.61
Low 267 23.7940 6.252 0.541
Scheffe Test of Classroom Environment scales by Science Group
Variable Mean Squares OF F/Prob Result.Resources BC 33.4793 2 1.4809 N5D
WG 22.6076 1195 0.2279
Involvement BC 36.0044 2 1.5077 NSDWG 23.8804 1195 0.2218
Task-Orientation BC 19.8463 2 1.3809 NSDWG 14.3723 1195 0.2518
Order & Organ. BC 85.9312 2 2.7745 NSD
WG 30.9721 1195 0.0628
Innovation BG 6.8392 2 0.7130 NSD
WG 9.6283 1195 0.4917
Personalisation BG 16.8327 2 0.3640 NSD
WG 46.2440 1195 0.6950
Participation BG 5.4870 2 0.1372 NSD
WG 39.8492 1195 0.8714
Independence BC 65.6105 2 1.7979 NSD
WG 36.4937 1195 0.1661
Investigation BC 29.4087 2 0.8508 NSD
WG 34.5668 1195 0.4273
Differentiation BG 0.0772 2 0.0018 NSDWG 41.7182 1195 0.9982
259

CORRELATIONS BETWEEN PUPIL ATTITUDE AND CLASSROOM ENVIRONMENT VARIABLES
PERS PART INDP INVS DIFF RESS INVL TSKO OROG INNV
PERS 1000 687 179 656 304 304 665 221 434 498
PART 687 1000 285 570 122 281 693 124 279 505
INDP 179 285 1000 -011 175 188 175 -196 130 231
INVS 656 570 -011 1000 231 377 599 341 463 496
DIFF 304 122 175 231 1000 002 076 -253 -064 343
RESS 304 281 188 377 002 1000 292 153 378 274
INVL 665 693 175 599 076 292 1000 547 673 375
TSKO 221 124 -196 341 -253 153 547 1000 634 017
OROG 434 279 130 463 -064 378 673 634 1000 115
INNV 498 505 231 496 343 274 375 017 115 1000
SATF 287 249 200 329 007 205 416 327 454 122
EMPL 053 109 139 144 -083 -049 143 193 266 005
THRT 079 046 -081 238 -096 030 173 265 334 -132
FUTR 248 259 121 281 -081 050 311 171 190 -168
SOCL 209 225 094 311 -126 045 303 291 351 101
CARR 273 287 172 312 042 081 510 316 473 100
LEIS 240 230 222 269 067 157 417 172 405 119
SCHL 382 297 162 361 -052 189 436 214 352 129
SATF EMPL THRT FUTR SOCL CARR LEIS SCHL
SATF 1000 486 260 483 482 625 720 652
EMPL 486 1000 542 327 635 496 456 284
THRT 260 542 1000 -023 529 336 189 197
FUTR 483 327 -023 1000 384 485 472 625
SOCL 482 635 529 384 1000 501 401 430
CARP 625 496 336 485 501 1000 743 581
LEIS 720 456 189 472 401 743 1000 559
SCHL 652 284 197 625 430 581 559 1000
Decimal points omitted. Based on 102 Class Sets
Scales are: Personalisation, Participation, Independence, Investigation,
Differentiation, Resources, Involvement, Task-Orientation, Order & Organisation, Innovation,
Satisfaction, Employment, Threat, Future, Social, Career, Leisure, School.
260

REGRESSSION ANALYSIS RESULTS
Computer Attitude variables
Using Pupil and Teacher variables as predictors
Criterion Retained Beta F-value Sig. F Multiple RVariable Variables & R-squared
Satisfaction BHUSE1 -0.053080 2.746 0.0978 0.39032CANF1 0.062287 7.802 0.0053 0.015235CANF2 -0.049777 2.866 0.0908SCGP 0.135154 16.726 0.0000CANF3 0.069778 5.644 0.0177
BHUSE3 0.124113 14.944 0.0001
BCAL3 -0.120049 15.530 0.0001
BCAL5 0.062712 4.170 0.0414PSEX 0.091076 7.368 0.0067
BHUSE4 0.209122 36.944 0.0000
Employ BTCAL 0.060913 3.852 0.0500 0.38171
SCGP 0.127130 14.251 0.0002 0.14570
8HUSE3 0.104328 10.461 0.0013
BCAL3 -0.095092 9.410 0.0022
PSEX 0.099183 9.017 0.0027
BHUSE4 0.194735 35.603 0.0000
ARTSGP 0.083686 7.710 0.0056
Threat CANF2 -0.053136 2.991 0.0841 0.25357
SCGP 0.106921 9.680 0.0019 0.06430
BHUSE3 0.080210 5.716 0.0170
PSEX 0.086594 6.366 0.0118
6HUSE4 0.096450 8.063 0.0046
Future OFFPR 0.055434 3.186 0.0746 0.19464
SCGP 0.052980 2.823 0.0932 0.03789
BHUSE3 0.076462 5.060 0.0247
BHUSE4 0.126702 13.669 0.0002
Social SCGP 0.138872 20.079 0.0000 0.32782
BHUSE3 0.126286 14.746 0.0001 0.10747
BCAL3 -0.071064 5.615 0.0180
ARTSGP 0.055483 3.287 0.0701
BHUSE4 0.176692 28.535 0.0000
Career BHUSE1 -0.063956 4.073 0.0438 0.41948
SCGP 0.093242 7.836 0.0052 0.17596
BHUSE3 0.171095 28.167 0.0000
BCAL3 -0.091812 9.355 0.0023
BHUSE2 0.070067 4.976 0.0259
BCAL5 0.072169 5.680 0.0173
ARTSGP 0.086769 8.572 0.0035
PSEX 0.095435 8.315 0.0040
BHUSE4 0.209541 36.806 0.0000
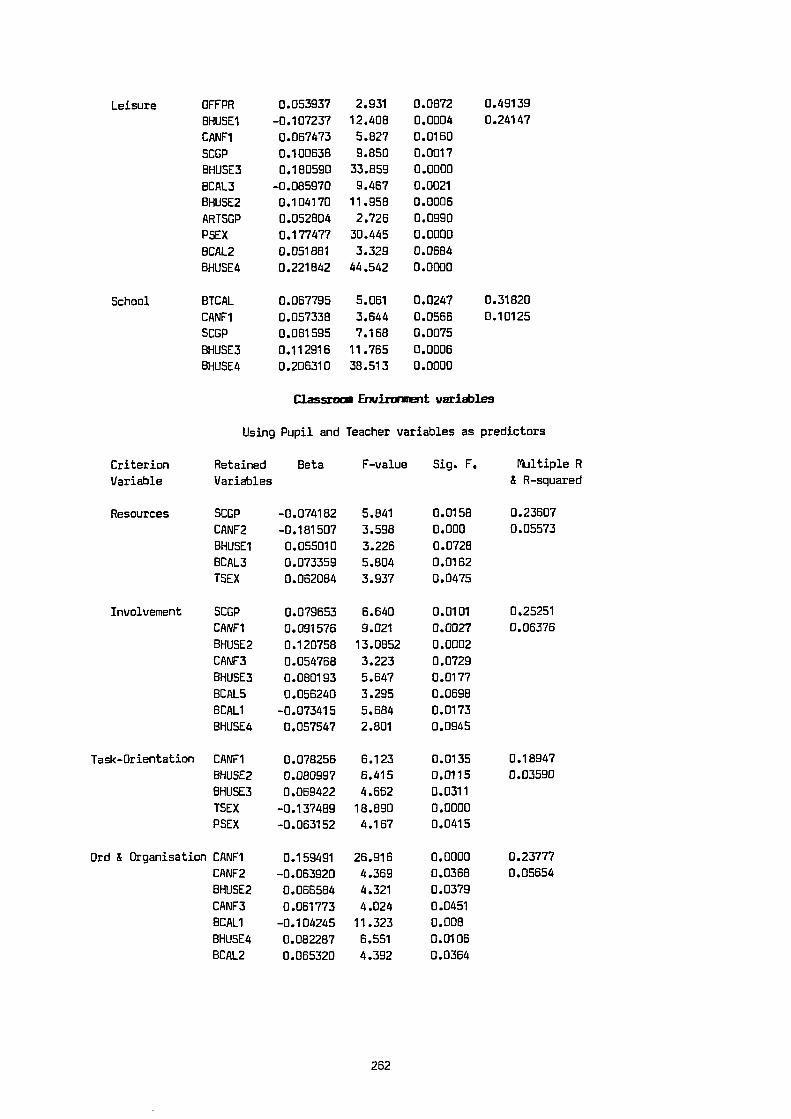
Leisure OFFPR 0.053937 2.931 0.0872 0.49139
BHUSE1 -0.107237 12.408 0.0004 0.24147
CANF1 0.067473 5.827 0.0160
SCGP 0.100638 9.850 0.0017
BHUSE3 0.180590 33.859 0.0000
BCAL3 -0.085970 9.467 0.0021
BHUSE2 0.104170 11.958 0.0006
ARTSGP 0.052804 2.726 0.0990
PSEX 0.177477 30.445 0.0000
8CAL2 0.051881 3.329 0.0684
BHUSE4 0.221842 44.542 0.0000
School BTCAL 0.067795 5.061 0.0247 0.31820
CANF1 0.057338 3.644 0.0566 0.10125
5CGP 0.061595 7.168 0.0075
BHUSE3 0.112916 11.765 0.0006
BHUSE4 0.206310 38.513 0.0000
Classroom Environment variables
Using Pupil and Teacher variables as predictors
Criterion Retained Beta F-value Sig. F. Multiple R
Variable Variables & R-squared
Resources SCGP -0.074182 5.841 0.0158 0.23607
CANF2 -0.181507 3.598 0.000 0.05573
BHUSE1 0.055010 3.226 0.0728
BCAL3 0.073359 5.804 0.0162
TSEX 0.062064 3.937 0.0475
Involvement SCGP 0.079653 6.640 0.0101 0.25251
CANF1 0.091576 9.021 0.0027 0.06376
81-IUSE2 0.120758 13.0852 0.0002
CANF3 0.054768 3.223 0.0729
BHUSE3 0.080193 5.647 0.0177
BCAL5 0.056240 3.295 0.0698
BCAL1 -0.073415 5.684 0.0173
BHUSE4 0.057547 2.801 0.0945
Task-Orientation CANF1 0.078256 6.123 0.0135 0.18947
BHUSE2 0.080997 6.415 0.0115 0.03590
BHUSE3 0.069422 4.662 0.0311
TSEX -0.137489 18.890 0.0000
PSEX -0.063152 4.167 0.0415
Ord & Organisation CANF1 0.159491 26.916 0.0000 0.23777
CANF2 -0.063920 4.369 0.0368 0.05654
8HUSE2 0.066584 4.321 0.0379
CANF3 0.061773 4.024 0.0451
BCAL1 -0.104245 11.323 0.008
BHUSE4 0.082287 6.551 0.0106
BCAL2 0.065320 4.392 0.0364

Innovation CANF1 0.079002 6.527 0.0108 0.17978
BHUSE2 0.108090 12.674 0.0004 0.03232CANF3 0.060100 3.776 0.0523
BHUSE3 0.085811 7.188 0.0075
BCAL1 0.075455 5.931 0.0150
Personalisation BTCAL 0.084263 6.769 0.0094 0.26145
CANF1 0.108090 12.674 0.0004 0.06835CANF2 0.101851 11.241 0.0008BHUSE2 0.053573 2.886 0.0879CANF3 0.068302 5.011 0.0254
BHUSE3 0.150575 22.641 0.0000
BCAL4 0.054118 2.814 0.0937
Participation CANF2 0.066177 4.453 0.0351 0.23846
BHUSE2 0.103811 10.165 0.0015 0.05686
CANF3 0.054275 3.187 0.0745BHUSE3 0.092532 7.429 0.0065TSEX 0.062077 3.933 0.0476
BCAL5 0.054886 3.231 0.0726BHUSE4 0.083660 5.987 0.0146
Independence SCGP 0.0633530 4.272 0.0390 0.25035
CANF1 0.063778 4.101 0.0431 0.06267
CANF2 0.065871 4.380 0.0366
CANF3 -0.078950 6.659 0.0100BHUSE3 -0.101045 9.187 0.0025
TSEX 0.162325 25.283 0.0000
BCAL4 0.076574 6.219 0.0128
BCAL1 -0.071455 5.376 0.0206
BHUSE4 0.061885 3.385 0.0661
Investigation BTCAL 0.062033 3.548 0.0599 0.29391
CANF1 0.124216 16.012 0.0001 0.08222
BHUSE2 0.131610 16.917 0.0000
CANF3 0.085495 8.017 0.0047
BHUSE3 0.097118 8.509 0.0036
TSEX -0.086970 7.926 0.0050
BCAL5 0.063529 3.775 0.0523
BHUSE4 0.073631 4.785 0.0289
Differentiation SCGP -0.056566 2.831 0.0928 0.24464
CANF2 0.153561 24.166 0.0000 0.05985
CANF3 0.093498 9.04 0.0021
TEX 0.168700 29.127 0.0000
BCAL5 0.054003 3.084 0.0793
PSEX 0.058811 3.022 0.0825
BHUSE4 -0.070409 5.091 0.0243
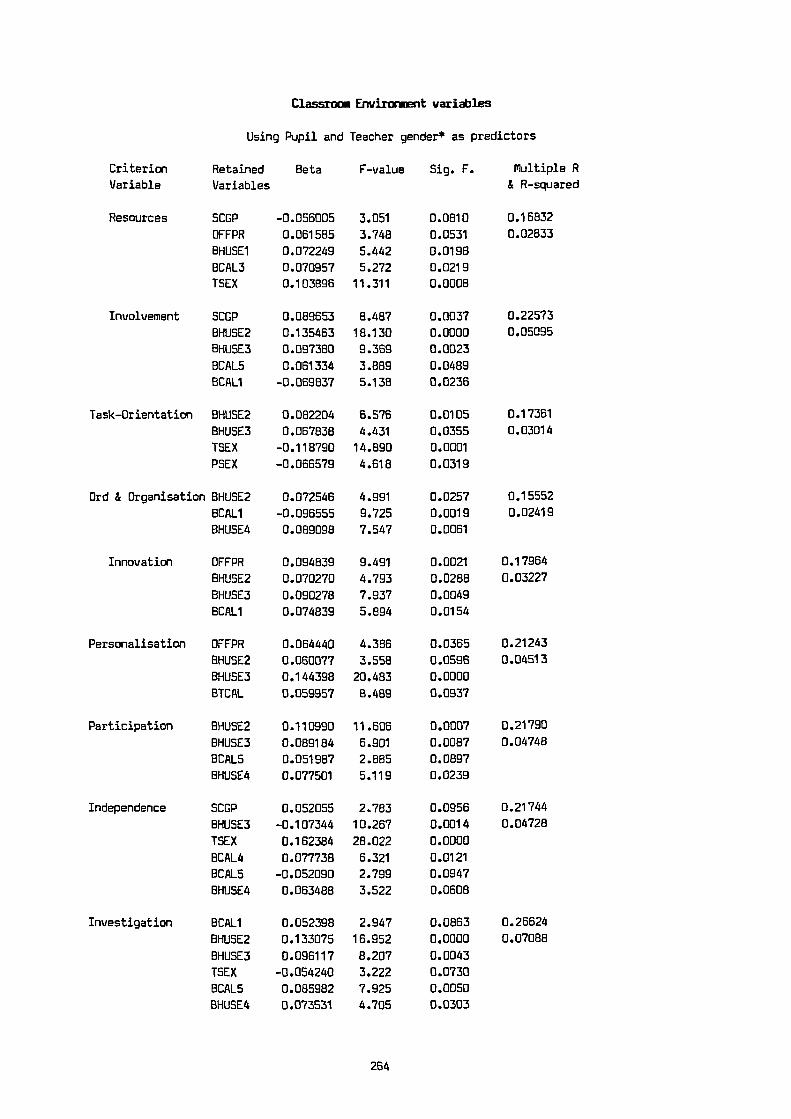
Classroom Environment variables
Using Pupil and Teacher gender* as predictors
Criterion Retained Beta F-value Sig. F. Multiple R
Variable Variables & R-squared
Resources SCGP -0.056005 3.051 0.0810 0.16832
OFFPR 0.061585 3.748 0.0531 0.02833
BHUSE1 0.072249 5.442 0.0198
BCAL3 0.070957 5.272 0.0219
TSEX 0.103896 11.311 0.0008
Involvement SCGP 0.089653 8.487 0.0037 0.22573
BHUSE2 0.135463 18.130 0.0000 0.05095
8HUSE3 0.097380 9.369 0.0023
BCAL5 0.061334 3.889 0.0489
8CAL1 -0.069837 5.138 0.0236
Task-Orientation BHUSE2 0.082204 6.576 0.0105 0.17361
BHUSE3 0.067838 4.431 0.0355 0.03014
TSEX -0.118790 14.890 0.0001
PSEX -0.066579 4.618 0.0319
Ord & Organisation BHUSE2 0.072546 4.991 0.0257 0.15552
BCAL1 -0.096555 9.725 0.0019 0.02419
BHUSE4 0.089098 7.547 0.0061
Innovation OFFPR 0.094839 9.491 0.0021 0.17964
BHUSE2 0.070270 4.793 0.0288 0.03227
BHUSE3 0.090278 7.937 0.0049
BCAL1 0.074839 5.894 0.0154
Personalisation OFFPR 0.064440 4.386 0.0365 0.21243
BHUSE2 0.060077 3.558 0.0596 0.04513
BHUSE3 0.144398 20.483 0.0000
BTCAL 0.059957 8.489 0.0937
Participation BHUSE2 0.110990 11.606 0.0007 0.21790
BHUSE3 0.089184 6.901 0.0087 0.04748
HCAL5 0.051987 2.885 0.0897
BHUSE4 0.077501 5.119 0.0239
Independence SCGP 0.052055 2.783 0.0956 0.21744
8HUSE3 -0.107344 10.267 0.0014 0.04728
TSEX 0.162384 28.022 0.0000
BCAL4 0.077738 6.321 0.0121
BCAL5 -0.052090 2.799 0.0947
BHUSE4 0.063488 3.522 0.0608
Investigation BCAL1 0.052398 2.947 0.0863 0.26624
BHUSE2 0.133075 16.952 0.0000 0.07088
BHUSE3 0.096117 8.207 0.0043
TSEX -0.054240 3.222 0.0730
BCAL5 0.085982 7.925 0.0050
BHUSE4 0.073531 4.705 0.0303

Differentiation OFFPR
0.053861
3.025
0.0828 0.15848
TSEX
0.129874 17.758
0.0000 0.02512
BHUSE4
-0.068613
4.910
0.0269
( 4 ) The three COFs were not included in these analyses.
Computer Attitude variables
Using Teacher Activities as predictors
Criterion
Variable
Retained
Variables
Beta F-value Sig. F Multiple R
& R-squared
Satisfaction ACT09 0.216235 2.252 0.0266 0.31481
ACT04 0.220608 2.063 0.0417 0.09910
ACT11 -0.220533 2.061 0.0420
Employ ACT12 0.282668 2.316 0.0227 0.39249
ACT01 -0.183674 1.863 0.0655 0.15405
ACTO3 -0.290505 2.486 0.0147
ACT17 -0.280109 2.268 0.0256
ACT14 0.234709 1.706 0.0913
Threat ACT19 -0.216494 2.200 0.0302 0.39662
ACTO9 0.393307 3.906 0.0002 0.15731
ACTO5 -0.210343 2.109 0.0375
Future ACTO5 -0.273414 2.50 0.0124 0.46533
1\CTO4 0.445369 3.967 0.0001 0.21653
ACTO2 -0.244930 2.298 0.0248
ACT14 0.215296 1.917 0.0582
Social ACTO9 0.255070 2.561 0.0119 0.27014
ACTO5 -0.167749 1.684 0.0952 0.07297
Career None
Leisure None
School AC118 0.205276 2.097 0.0385 0.20528
0.04214

Classroom Environment variables
Using Teacher Activities as predictors
Criterion Retained Beta F-value Sig. F Multiple R
Variable Variables & R-squared
Resources ACT12 -0.302778 3.214 0.0018 0.39768
ACTO8 0.327059 3.472 0.0008 0.15815
Involvement ACTO5 0.2444874 2.220 0.0287 0.29451
ACTO7 0.177183 1.724 0.0878 0.08673
ACT13 -0.211041 1.882 0.0629
Task-Orientation ACTO7 0.264380 2.591 0.0110 0.26916
ACT13 -0.181525 1.779 0.0783 0.07245
Order & Organ. ACTO7 0.261029 2.704 0.0081 0.26103
0.06814
Innovation ACT16 -0.262977 2.345 0.0211 0.43440
ACT11 0.196594 1.689 0.0944 0.18871
ACTOB 0.266938 2.326 0.0221
ACTO2 -0.255883 2.159 0.0334
ACTO6 0.261700 2.180 0.0317
Personalisation ACT19 -0.252375 2.182 0.0315 0.32358
ACTO4 0.220910 2.220 0.0287 0.10470
ACT15 0.251780 2.184 0.0314
Participation None
Independence ACT18 0.212660 2.096 0.0385 0.35298
ACT15 -0.207851 2.039 0.0442 0.10626
ACT13 0.202929 1.971 0.0515
Investigation ACT10 0.251872 2.603 0.0107 0.25187
0.06344
Differentiation ACTO1 -0.197595 2.141 0.0348 0.46128
ACTO5 0.320298 3.056 0.0029 0.21278
ACTO3 0.287219 2.659 0.0092
ACT17 -0.263861 2.569 0.0117
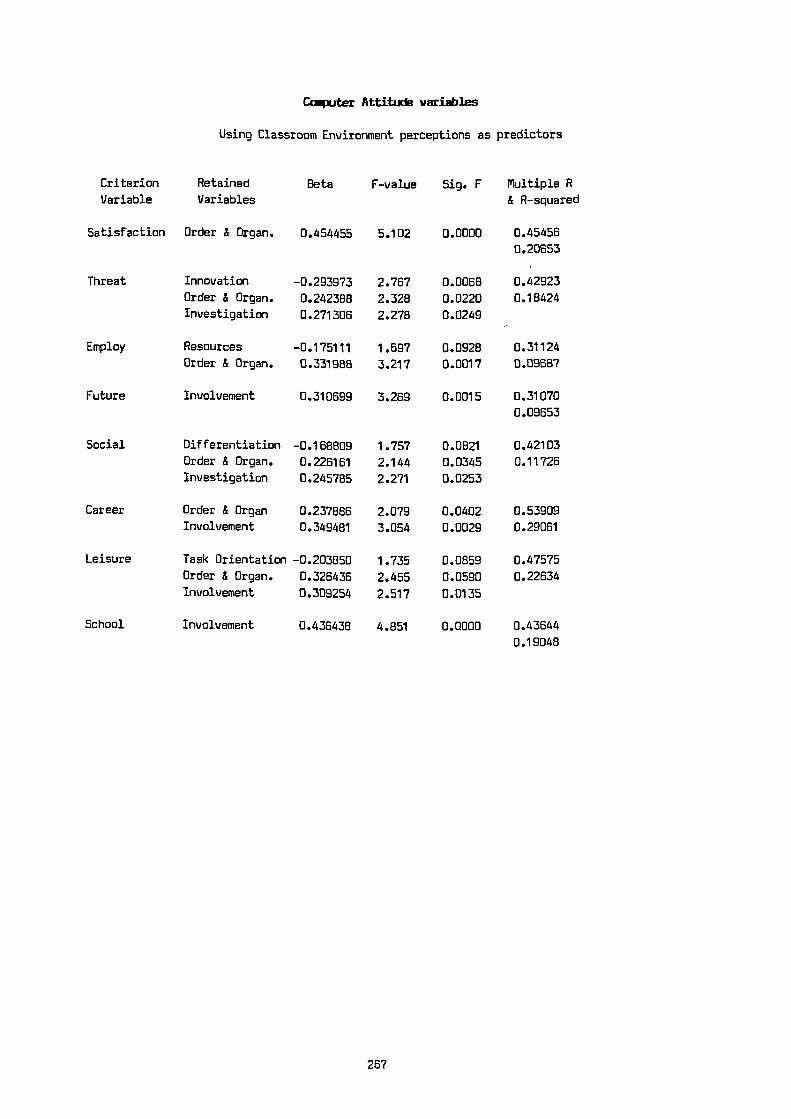
Computer Attitude variables
Using Classroom Environment perceptions as predictors
Criterion
Variable
Retained
VariablesBeta F-value Sig. F Multiple R
& R-squared
Satisfaction Order & Organ. 0.454455 5.102 0.0000 0.45456
0.20653
Threat Innovation -0.293973 2.767 0.000 0.42923
Order & Organ. 0.242388 2.328 0.0220 0.18424Investigation 0.271306 2.278 0.0249
Employ Resources -0.175111 1.697 0.0928 0.31124Order & Organ. 0.331988 3.217 0.0017 0.09687
Future Involvement 0.310699 3.269 0.0015 0.31070
0.09653
Social Differentiation -0.168809 1.757 0.0821 0.42103Order & Organ. 0.226161 2.144 0.0345 0.11726
Investigation 0.245785 2.271 0.0253
Career Order & Organ 0.237886 2.079 0.0402 0.53909Involvement 0.349481 3.054 0.0029 0.29061
Leisure Task Orientation -0.203850 1.735 0.0859 0.47575
Order & Organ. 0.326436 2.455 0.0590 0.22634Involvement 0.309254 2.517 0.0135
School Involvement 0.436438 4.851 0.0000 0.43644
0.19048

FORUM/SEMINAR ON RESEARCH STUDIES IN COMPUTER/IT EDUCATION
(Part of the Information Technology and Education Programme)
List of invited participants
Professor R Lewis
Coordinator, ITE ProgrammeUniversity of LancasterLancaster LA1 4YF
Dr Peter Barker
Moray House College of EducationEdinburgh EH8 8AQ
Dr Ian Birnbaum Hull Education CentreHull HU5 4DA
Dr John Gardner
Queen's UniversityBelfast BT7 'INN
Professor David Johnson
Chelsea CollegeLondon SW6 411R
Dr Paul McGee
Croydon LEACroydon CR9 1TP
Dr Ken Ruthven
University of CambridgeCambridge CB2 1TN
Dr John Sanger
University of East AngliaNorwich NR4 7TJ
Dr Bill Tagg AUCBEHatfield, Herts AL10 8AU
JULY 1985
268
Copyright © 2022 FDOKUMEN