An Analysis of Agricultural Systems Modelling Approaches ...
Upload
khangminh22Category
view
0download
0
Agricultural Systems 194 (2021) 103265
Available online 1 September 20210308-521X/© 2021 The Authors. Published by Elsevier Ltd. This is an open access article under the CC BY-NC-ND license(http://creativecommons.org/licenses/by-nc-nd/4.0/).
Ex-ante evaluation of interventions to upgrade pork value chains in Southern Myanmar
Jared Berends a,b, Karl M. Rich c,e, Simeon Kaitibie a,*, Michael C. Lyne a,d
a Faculty of Agribusiness and Commerce, Lincoln University, Lincoln 7647, New Zealand b The New Zealand Institute for Plant & Food Research Limited, Auckland, New Zealand c International Livestock Research Institute, West Africa Regional Office, B.P. 24265 Ouakam, Dakar, Senegal d School of Agricultural, Earth and Environmental Sciences, University of KwaZulu-Natal, South Africa e Ferguson College of Agriculture, Master of International Agriculture Program and Department of Agricultural Economics, Oklahoma State University, Stillwater, OK 74078 USA
H I G H L I G H T S G R A P H I C A L A B S T R A C T
• Pig production is an important liveli-hood activity among small-scale farmers in Myanmar, but pork value chains are weak.
• We applied systems thinking and participatory methods to develop a sys-tem dynamics model of a local pork value chain.
• Of the interventions assessed, financial services, animal health workers, and training were most beneficial to pig farmers.
• A combination of interventions managed by producer groups showed promise in sustaining financial benefits to smallholders.
• System dynamics tools provide a cost- effective way of evaluating, ex-ante, in-terventions in complex agri-food value chains.
A R T I C L E I N F O
Editor: Dr Val Snow
Keywords: Spatial group model building Poverty alleviation System dynamics Agribusiness value chain Myanmar
A B S T R A C T
CONTEXT: Myanmar has made rapid economic progress since the country began its transition to a more inte-grated market economy in the late 2000s. Although these gains are led by positive developments in the agri-cultural sector, agricultural productivity and profitability are among the lowest in Asia with high rates of poverty especially in rural areas. Small-scale farms dominate rural livelihoods in Myanmar, especially for the 87% of Myanmar’s poor who live in rural areas. Hence, these small-scale farms are critical development leverage points as they are an important source of rural incomes to both farm and non-farm households. OBJECTIVE: This study is part of a larger, five-year agricultural research and development project intended to upgrade pork and rice value chains and strengthen rural livelihoods in southern Myanmar’s Tanintharyi Region.
* Corresponding author. E-mail addresses: [email protected] (J. Berends), [email protected] (K.M. Rich), [email protected] (S. Kaitibie), Michael.
[email protected] (M.C. Lyne).
Contents lists available at ScienceDirect
Agricultural Systems
journal homepage: www.elsevier.com/locate/agsy
https://doi.org/10.1016/j.agsy.2021.103265 Received 14 March 2021; Received in revised form 22 August 2021; Accepted 23 August 2021

Agricultural Systems 194 (2021) 103265
2
We evaluated producer-focused interventions to upgrade the pork value chain using tools that consider the dynamic and complex nature of the chain. METHODS: This research used systems thinking and participatory methods to develop a system dynamics model of the pork value chain in southern Myanmar. The model integrated modules of animal production, marketing, investment, finance, and collective action. Scenario analysis with the model guided recommendations for pro- poor interventions for implementation within the five-year development project. RESULTS AND CONCLUSIONS: Simulation results indicated that a mix of technical interventions implemented by functional producer groups showed promise in delivering sustained financial benefits to the target community and outperformed the short-term gains generated by these interventions in the absence of collective action. The model also highlighted specific interventions, such as improved financial services, animal health workers, and training that enabled poorer households to benefit from pig livelihoods while reducing risks from environmental and economic shocks. Within complex agri-food systems such as the pork value chain in Tanintharyi, a multi- pronged intervention strategy is recommended to address problems faced by small-scale agribusiness value chain participants. SIGNIFICANCE: Development interventions tend to be implemented in complex environments, often with scarce data to inform decision-making. This research shows how system dynamics tools and spatial group model building processes could help overcome these inherent challenges by creating virtual laboratories where plau-sible project interventions can be tested and modified, bringing increased confidence to implementation choices.
1. Introduction
Small-scale farming dominates rural livelihoods, generating 80% of the food in Africa and Asia and supporting the livelihoods of around 2.6 billion people (FAO, 2017). Investments in small-scale farms have been shown to deliver three to four times greater poverty reduction outcomes than other sectors given their role in food security and on- and off-farm income generation (Hendriks and Lyne, 2003; IFAD, 2016). Small-scale farmers, however, face many complex production and marketing bar-riers to upgrading, including market intelligence, infrastructure and resource constraints, and an unfavorable institutional environment (Poulton et al., 2006; Trienekens, 2011).
While pro-poor value chain approaches are common within devel-opment interventions to upgrade small-scale farmers, few deal adequately with the complexities of these chains. Agri-food value chains are characterized by biophysical delays, cyclical behaviors, and dynamic interactions between nodes in the value chain (Rich et al., 2011). Traditional pro-poor value chain methodologies typically provide a “snapshot” of dynamic phenomenon, relying on static qualitative and descriptive data for decision making (Rich et al., 2011). Meanwhile, information is often clustered at the macro- or meso-level inhibiting a deeper analysis of impacts across chain actors and communities (Bolwig et al., 2010). These traditional approaches are therefore limited in their ability to quantify, ex-ante, the impacts of upgrading strategies as they do not sufficiently consider the wider consequences and trade-offs (intended or unintended) within or beyond the immediate value chain system (i.e., impact on other nodes, value chain actors, and non-farm households) (Rich et al., 2011; Stoian, et al., 2012). This inhibits their ability to target interventions to tackle “root cause” problems or focus limited project resources on catalytic nodes and processes in the value chain.
This study formed part of the five-year Tanintharyi Region Rural Income and Livelihood Development (TRRILD) project to upgrade the pork value chain and strengthen rural livelihoods in the Tanintharyi Region of Myanmar. Myanmar has made rapid economic progress since the country began its transition to a more integrated market economy. GDP has more than doubled since 2008 and economic growth rates have averaged 6.7% per annum since 2010 (World Bank, 2020). These gains are underpinned by the agricultural sector which accounts for 30% of GDP, 25% of export earnings, and 56% of employment, as well as providing food security for the rural poor (MoALI, 2018). While there is rich potential for growth in Myanmar, agricultural productivity and profitability are among the lowest in Asia (World Bank, 2016) and the poverty rate is much higher in rural areas (38.8%) than in urban centers (14.5%) (World Bank, 2017). This reflects multiple constraints including low quality inputs, limited knowledge and skills on value addition that
meets market demand, crude processing and storage facilities, and limited access to affordable credit (MoALI, 2018; World Bank, 2016). With 87% of Myanmar’s poor living in rural areas, small-scale farms are critical development leverage points as they are an important source of rural incomes to both farm and non-farm households (Boughton et al., 2018). The TRRILD project’s baseline survey showed that the region’s small-scale farmers face multiple production, storage, processing, and marketing constraints, which prevent them from meeting the quality requirements of higher value markets (Snoxell and Lyne, 2019).
Pig production is a major contributor to the livelihoods of poor smallholders in Tanintharyi Region, and pork consumption is growing rapidly - driven largely by growth in the Region’s tourism industry (Ministry of Hotels and Tourism, 2009, 2019). The pork value chain in Tanintharyi is complex and dynamic, characterized by large swings in live pig prices, changing consumer preferences, and shifts in farming practices across different sized producers. The TRRILD project’s emphasis on pro-poor interventions required tools that accommodate this complexity and allow for trade-off analysis across value chain actors while considering socio-economic and environmental impacts within target communities (Bolwig et al., 2010). Recent value chain studies show promise in the application of participatory group model building and system dynamics modelling to quantify, ex-ante, the impacts of potential upgrading strategies (Lie et al., 2018; Cooper et al., 2021). An emerging participatory modelling tool, spatial group model building (SGMB), uses participatory GIS tools and a codified process to further engage stakeholders in the model-building process (Rich et al., 2018).
This paper describes the application of system dynamics tools, including SGMB, to conduct an ex-ante impact evaluation of plausible interventions to upgrade the pork value chain in the TRRILD project’s target area. Results of the analysis helped the project’s decision-makers to identify a portfolio of interventions that could offer sustained and meaningful benefits to small-scale pig farmers. In the next section, the paper provides brief descriptions of the pork industry in Tanintharyi Region. Section 3 describes the system dynamics model that was developed to evaluate the impacts of plausible chain interventions. Section 4 presents and discusses the results of the ex-ante impact anal-ysis. The paper concludes with recommendations for pro-poor in-terventions in the pork chain and for the application of system dynamics tools in the design and implementation of value chain development projects.
2. The pork industry in Tanintharyi
The TRRILD project targeted 32 villages spread across two districts, Myeik, with a substantial trading hub of around 400,000 people, and Palaw, a rural town of 130,000 people situated a three-hour drive to the
J. Berends et al.

Agricultural Systems 194 (2021) 103265
3
north of Myeik. While information on the pork industry in Myeik and Palaw is scarce, the research’s participatory sessions with value chain actors and key stakeholders revealed the notable dynamics of the pork value chain.
Pork consumption in the townships increased by 5–10% per annum over the previous decade (Ebata et al., 2018). There was a steady shift in consumer preference for leaner pork produced from hybrid pig breeds, though local pig breeds still dominate production in the project’s target villages. Increasing demand reflected steady population growth, ur-banization, rising incomes, and - in particular - rapid expansion of the Region’s tourism industry (Huynh et al., 2007; Ministry of Hotels and Tourism, 2019). As a result, pig production has become more important in peri-urban and rural areas, augmenting the region’s traditional live-lihoods of rubber, paddy, betel leaf, and areca nut production, and lowering vulnerability to shocks. The project’s baseline survey found that pig producers in the region were living below or around the poverty line as they were earning less than a dollar a day per person, and more than 40% experienced food shortages during the year (Snoxell and Lyne, 2019). For the poorest village members, pigs are typically treated as a form of savings to alleviate temporary cashflow problems and to finance inputs for subsistence crops and non-farm enterprises. Small-scale pig farmers follow one of two different production systems; the smaller and less costly wean-to-fatten (WF) system, where one to three piglets are purchased and fattened, and the larger and more intensive farrow-to- fatten (FF) system, where one to three sows are kept, and piglets are either sold or fattened. There is also a spatial dimension to pig pro-duction. In more remote villages where households have less access to critical farm inputs and services (quality feed, animal health workers, high quality breeds, and credit), pig farmers typically follow the WF system with local pig breeds.
A system of brokers connects local pig farmers to slaughterhouses located in and around Myeik town. The negotiating power of brokers tends to be stronger in more remote areas where pig farmers have less information about prices paid by slaughterhouses. A government licensing system for pig slaughtering allows slaughterhouses to assume the role of “lead” actors within the pork chain. Licenses are auctioned annually, granting their holders the right to slaughter a specified num-ber of pigs over a period of 12 months. This system creates significant power asymmetries in the chain as pig farmers have few alternatives for their products. Slaughterhouses operate at very low standards of food safety and licensees have little incentive to invest in hygienic, food-safe slaughtering facilities owing to a government-imposed ceiling on wholesale pork prices, weak demand for premium pork cuts, the absence of government meat inspections, and the uncertainty of license renewal. As buyers, slaughterhouses confront high transaction costs buying pigs from small scale farmers and procure most of their pigs from Mawly-mine, a trading hub located a 12-h drive north of Tanintharyi.
Virtually all of the pork entering the chain sells wholesale at wet markets, but orders from restaurants and hotels for leaner pork cuts are beginning to increase. These buyers pay a small premium (5–10%) above wet market prices. However, high-end restaurants import frozen pork cuts directly from Thailand due to concerns about quality and hygiene standards on farms and in local slaughterhouses. In Yangon, the nation’s capital, several wholesalers import upwards of one ton of pre-mium pork cuts per week from Spain and Thailand, and were seeking to coordinate vertically with domestic businesses to protect their supply chains against possible import restrictions.
There is little vertical coordination between actors in the local pork chain - the governance structure sits firmly within the “informal market” category where there is a limited number of buyers and sellers and high price volatility (Bhattarai et al., 2013: Gereffi and Fernandez-Stark, 2016) - and the project’s baseline survey found no evidence of collec-tive action by farmers in the target villages (Snoxell and Lyne, 2019). Instead, individual farmers sell live pigs at spot rates negotiated with brokers. Producers generally have to weigh up low spot-rates from brokers against ongoing feed costs, an uncertain future price for their
pigs, and pressure to repay loans taken at high interest rates from informal money lenders.
The pork value chain is impacted by regular and irregular demand and supply shocks. While small and isolated disease outbreaks (e.g., blue ear) occur frequently, there are also less frequent, but significantly more threatening outbreaks - such as the Hog Cholera outbreak in 2016. Disease outbreaks result in panic selling by pig producers. Once con-sumers become aware of a disease outbreak, demand falls sharply due to concerns about purchasing diseased meat as there are no traceability or safety standards in the value chain. Weak demand, together with the oversupply of pigs, quickly depresses live pig prices. Prices remain low until consumer confidence returns after the disease outbreak has ended. Strong demand, combined with a temporary shortage of fatteners, then cause prices to spike – and more so if the local government bans the importation of live pigs from outside the region. These high prices encourage pig producers to invest in production upgrades that bring prices down sharply after a short biological lag, and even more sharply if the growth in local production coincides with the removal of import restrictions. Declining prices often force over-indebted farmers to exit the pig industry.
3. System dynamics model of the pork value chain
3.1. An overview of system dynamics modelling for ex-ante value chain impact evaluations
System Dynamics (SD) is an approach for studying the structure and behavior of complex systems. Central to this framework is the premise that the behavior of a system is primarily determined by its structure (Sterman, 2000). While often complex, systems can be modelled by including only the components and relationships which influence sys-tem behaviors. SD is interdisciplinary, grounded in the theories of nonlinear dynamics and feedback control from mathematics, physics, and engineering. Through qualitative and quantitative modelling, SD tools are now commonly used in a variety of multi-disciplinary settings to support decision-making when tackling complex and messy problems (Vennix, 1996).
Over the last decade, a body of research has demonstrated the utility of SD models to analyze agri-food value chains and conduct ex-ante analysis of policy interventions. This includes applications covering (i) the impacts of disease outbreaks and policy options on livestock systems (Naziri et al., 2015; Dizyee et al., 2017; Ouma et al., 2018); and (ii) policy and intervention options for agricultural value chains, including beef (Dahlanuddin et al., 2017), goats (Hamza et al., 2014), amaranth (Dizyee et al., 2020), and dairy (Lie et al., 2018) sectors. As shown across these studies, SD models provide a useful analytical tool and virtual “laboratory” for policy makers to test the likely impacts of different technical and policy options, allowing for more informed and targeted investments in the sector. This virtual laboratory is particularly relevant in a pro-poor approach as it allows consideration of trade-offs across chain actors and impacts on matters of concern such as employment, risk, environment, and poverty levels (Bolwig et al., 2010).
3.2. Data collection and model development
The research followed SGMB principles outlined by Rich et al. (2021), adapting group model building (GMB) and participatory facili-tation methods described by Vennix (1996) and Hovmand (2014), and scripts developed by Andersen and Richardson (1997). GMB is a participatory process in which SD models are co-constructed with stakeholders (Vennix, 1996). One of the first applications of GMB in a value chain setting was Lie et al. (2017, 2018), modelling a dairy value chain in Nicaragua. New participatory modelling tools have recently been developed to codify the process and enhance the robustness of value chain oriented GMB sessions (Rich et al., 2021). The SGMB tech-nique includes participatory GIS tools to explicitly address the spatial
J. Berends et al.

Agricultural Systems 194 (2021) 103265
4
aspects and drivers of livestock systems (Rich et al., 2018). From a practitioner point of view, the use of participatory GIS tools helps stakeholders visualize system phenomena, improving the quality and pace of information collected and facilitating greater participation in focus group sessions (Rich et al., 2021).
The model-building process outlined in Fig. 1 centered on two distinct but parallel platforms: SGMB workshops and reference group (RG) sessions. Model-building outputs originated from five SGMB workshops, which were attended by 13 value chain actors (over half female), including pig producers, brokers, slaughterhouses, and whole-salers. The RG sessions involved subject matter experts who helped refine SGMB outputs by providing an additional layer of technical analysis and information triangulation. An average of eight people attended RG sessions, with 25% female representation. A six-person model building team (MBT) comprising staff from TRRILD partner or-ganizations and the Researcher was trained to facilitate SGMB and RG sessions. Discrete roles and responsibilities were assigned to each team member and ongoing coaching was provided by an expert modeler. The agendas for the five SGMB workshop are presented in the Supplemen-tary Material A.
The first SGMB workshop took place in January 2019 and focused on prioritizing problems in the pork value chain. As the initial step, the model’s focus and boundary were agreed upon: interventions to improve the profitability of small-scale pig producers in all project villages. Participants used Layerstack, a participatory GIS tool, to map out different layers in the pork value chain with reference to spatial ele-ments on the underlying geographical map (Rich et al., 2021). The MBT used the SD terminology introduced during the workshop to prompt discussions that segued into identifying problems preventing small-scale producers from increasing their farm profits. The top three problems
noted were: (i) the unstable price of live pigs, (ii) insufficient capital for successful pig farming, and (iii) the high cost of quality pig feed.
In the second SGMB workshop, reference modes describing the na-ture and behavior of prioritized problems were created and then further explored through cause-and-consequence maps. Critical relationships between causes and consequences were identified and emerging feed-back loops discussed, documenting the polarity of relationships between variables. The MBT facilitated plenary discussions on emerging themes to determine the modules for development into causal loop diagrams (CLDs). Each of these modules represented a critical sub-system of the pork value chain; for example, pig production and farm finance. The third and fourth SGMB session concentrated on developing qualitative CLDs for each module using SD terminology of stocks, flows, and pa-rameters with key causal relationships and feedback loops assigned positive or negative polarity. Once agreement on the basic CLD structure was reached, modules were parameterized with RG members particu-larly useful in noting differences across pig production systems, geographical locations, and the impacts on pig production from changes in farming practices, such as feed quality and vaccinations. The fifth and final SGMB and RG sessions were combined and focused on verification of the quantitative SD model and its preliminary findings.
3.3. Modules in the system dynamics model of the pork value chain
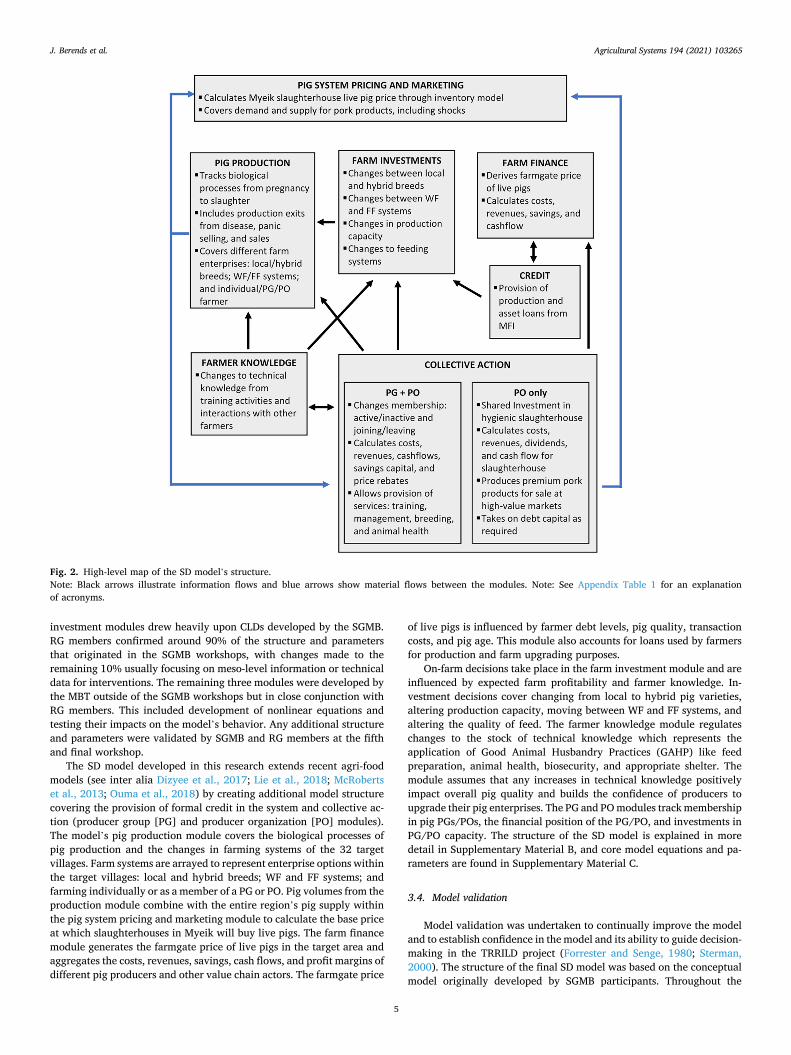
The SD model of the pork value chain comprised seven modules, each representing a crucial sub-sector of the pork value chain. Fig. 2 shows a high-level map of the model’s structure, highlighting the in-formation (black arrows) and material (blue arrows) flows between the component modules along with each module’s core functionality. Of the seven modules, the pricing and marketing, production, finance, and
Fig. 1. Overview of the model building process. Note: See Appendix Table 1 for an explanation of acronyms.
J. Berends et al.
Agricultural Systems 194 (2021) 103265
5
investment modules drew heavily upon CLDs developed by the SGMB. RG members confirmed around 90% of the structure and parameters that originated in the SGMB workshops, with changes made to the remaining 10% usually focusing on meso-level information or technical data for interventions. The remaining three modules were developed by the MBT outside of the SGMB workshops but in close conjunction with RG members. This included development of nonlinear equations and testing their impacts on the model’s behavior. Any additional structure and parameters were validated by SGMB and RG members at the fifth and final workshop.
The SD model developed in this research extends recent agri-food models (see inter alia Dizyee et al., 2017; Lie et al., 2018; McRoberts et al., 2013; Ouma et al., 2018) by creating additional model structure covering the provision of formal credit in the system and collective ac-tion (producer group [PG] and producer organization [PO] modules). The model’s pig production module covers the biological processes of pig production and the changes in farming systems of the 32 target villages. Farm systems are arrayed to represent enterprise options within the target villages: local and hybrid breeds; WF and FF systems; and farming individually or as a member of a PG or PO. Pig volumes from the production module combine with the entire region’s pig supply within the pig system pricing and marketing module to calculate the base price at which slaughterhouses in Myeik will buy live pigs. The farm finance module generates the farmgate price of live pigs in the target area and aggregates the costs, revenues, savings, cash flows, and profit margins of different pig producers and other value chain actors. The farmgate price
of live pigs is influenced by farmer debt levels, pig quality, transaction costs, and pig age. This module also accounts for loans used by farmers for production and farm upgrading purposes.
On-farm decisions take place in the farm investment module and are influenced by expected farm profitability and farmer knowledge. In-vestment decisions cover changing from local to hybrid pig varieties, altering production capacity, moving between WF and FF systems, and altering the quality of feed. The farmer knowledge module regulates changes to the stock of technical knowledge which represents the application of Good Animal Husbandry Practices (GAHP) like feed preparation, animal health, biosecurity, and appropriate shelter. The module assumes that any increases in technical knowledge positively impact overall pig quality and builds the confidence of producers to upgrade their pig enterprises. The PG and PO modules track membership in pig PGs/POs, the financial position of the PG/PO, and investments in PG/PO capacity. The structure of the SD model is explained in more detail in Supplementary Material B, and core model equations and pa-rameters are found in Supplementary Material C.
3.4. Model validation
Model validation was undertaken to continually improve the model and to establish confidence in the model and its ability to guide decision- making in the TRRILD project (Forrester and Senge, 1980; Sterman, 2000). The structure of the final SD model was based on the conceptual model originally developed by SGMB participants. Throughout the
Fig. 2. High-level map of the SD model’s structure. Note: Black arrows illustrate information flows and blue arrows show material flows between the modules. Note: See Appendix Table 1 for an explanation of acronyms.
J. Berends et al.
Agricultural Systems 194 (2021) 103265
6
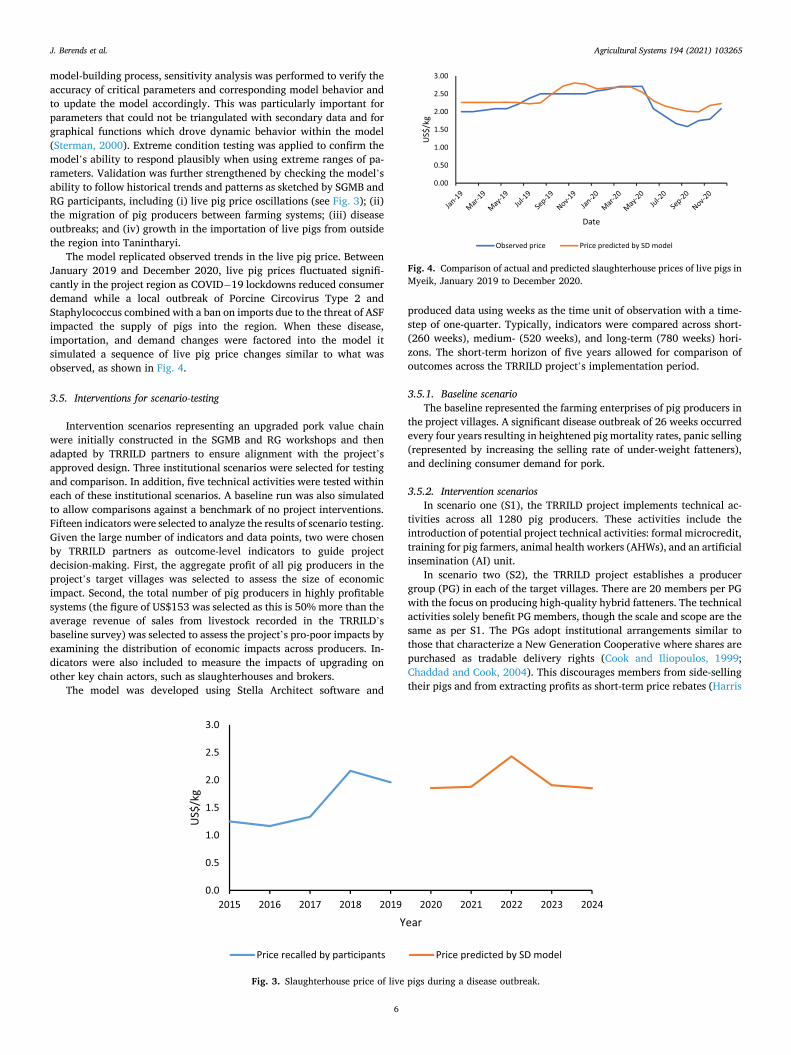
model-building process, sensitivity analysis was performed to verify the accuracy of critical parameters and corresponding model behavior and to update the model accordingly. This was particularly important for parameters that could not be triangulated with secondary data and for graphical functions which drove dynamic behavior within the model (Sterman, 2000). Extreme condition testing was applied to confirm the model’s ability to respond plausibly when using extreme ranges of pa-rameters. Validation was further strengthened by checking the model’s ability to follow historical trends and patterns as sketched by SGMB and RG participants, including (i) live pig price oscillations (see Fig. 3); (ii) the migration of pig producers between farming systems; (iii) disease outbreaks; and (iv) growth in the importation of live pigs from outside the region into Tanintharyi.
The model replicated observed trends in the live pig price. Between January 2019 and December 2020, live pig prices fluctuated signifi-cantly in the project region as COVID− 19 lockdowns reduced consumer demand while a local outbreak of Porcine Circovirus Type 2 and Staphylococcus combined with a ban on imports due to the threat of ASF impacted the supply of pigs into the region. When these disease, importation, and demand changes were factored into the model it simulated a sequence of live pig price changes similar to what was observed, as shown in Fig. 4.
3.5. Interventions for scenario-testing
Intervention scenarios representing an upgraded pork value chain were initially constructed in the SGMB and RG workshops and then adapted by TRRILD partners to ensure alignment with the project’s approved design. Three institutional scenarios were selected for testing and comparison. In addition, five technical activities were tested within each of these institutional scenarios. A baseline run was also simulated to allow comparisons against a benchmark of no project interventions. Fifteen indicators were selected to analyze the results of scenario testing. Given the large number of indicators and data points, two were chosen by TRRILD partners as outcome-level indicators to guide project decision-making. First, the aggregate profit of all pig producers in the project’s target villages was selected to assess the size of economic impact. Second, the total number of pig producers in highly profitable systems (the figure of US$153 was selected as this is 50% more than the average revenue of sales from livestock recorded in the TRRILD’s baseline survey) was selected to assess the project’s pro-poor impacts by examining the distribution of economic impacts across producers. In-dicators were also included to measure the impacts of upgrading on other key chain actors, such as slaughterhouses and brokers.
The model was developed using Stella Architect software and
produced data using weeks as the time unit of observation with a time- step of one-quarter. Typically, indicators were compared across short- (260 weeks), medium- (520 weeks), and long-term (780 weeks) hori-zons. The short-term horizon of five years allowed for comparison of outcomes across the TRRILD project’s implementation period.
3.5.1. Baseline scenario The baseline represented the farming enterprises of pig producers in
the project villages. A significant disease outbreak of 26 weeks occurred every four years resulting in heightened pig mortality rates, panic selling (represented by increasing the selling rate of under-weight fatteners), and declining consumer demand for pork.
3.5.2. Intervention scenarios In scenario one (S1), the TRRILD project implements technical ac-
tivities across all 1280 pig producers. These activities include the introduction of potential project technical activities: formal microcredit, training for pig farmers, animal health workers (AHWs), and an artificial insemination (AI) unit.
In scenario two (S2), the TRRILD project establishes a producer group (PG) in each of the target villages. There are 20 members per PG with the focus on producing high-quality hybrid fatteners. The technical activities solely benefit PG members, though the scale and scope are the same as per S1. The PGs adopt institutional arrangements similar to those that characterize a New Generation Cooperative where shares are purchased as tradable delivery rights (Cook and Iliopoulos, 1999; Chaddad and Cook, 2004). This discourages members from side-selling their pigs and from extracting profits as short-term price rebates (Harris
0.0
0.5
1.0
1.5
2.0
2.5
3.0
2015 2016 2017 2018 2019 2020 2021 2022 2023 2024
US$/
kg
Year
Price recalled by par�cipants Price predicted by SD model
Fig. 3. Slaughterhouse price of live pigs during a disease outbreak.
Fig. 4. Comparison of actual and predicted slaughterhouse prices of live pigs in Myeik, January 2019 to December 2020.
J. Berends et al.

Agricultural Systems 194 (2021) 103265
7
et al., 1996; Esnard et al., 2017) allowing PGs to retain and accumulate profits to finance long-term investments in PG capacity. The PGs continue to deliver AHW, pig training, and AI services to members, incurring operational expenses with any savings used to first cover any cashflow shortfalls. Price rebates are paid to members in proportion to patronage and only after savings and investment goals are achieved. PGs enter into a contract with a local slaughterhouse to supply high-quality fatteners for the local wholesale market and receive a 5% premium above the farmgate price of live pigs. The total demand for high-quality fatteners in the wholesale market starts at 511 kg per week and grows by 2% per annum as indicated by SGMB and RG members.
In scenario three (S3), PGs and a strategic business partner co-invest in a PO to finance a modern, hygienic slaughterhouse with the capacity to produce high-grade pork cuts that meet the quality standards required by premium buyers. Initially, the facility has sufficient capacity to slaughter 37 pigs/week, a throughput considered the minimum viable quantity for a new slaughterhouse, but capacity increases with addi-tional investments made over time in response to growth in demand and profitability. The initial facility is financed largely from equity capital (US$25,000) invested by the strategic partner. Subsequent investments are financed from the PO’s retained earnings, including retentions on payments made to PGs to grow their share of the PO’s equity capital. These shares are “stapled” to the delivery rights held by farmers in their PGs, thus retaining the tradability and proportionality features of a New Generation Cooperative that incentivize farmer investment and compliance with supply contracts (Plunkett et al., 2010). Profits not retained by the PO are distributed to its shareholders as a dividend paid every six months. The new facility supplies premium wholesalers in Yangon, with demand starting at 1000 kg/week and increasing by 6% per year – estimates provided by premium buyers in Yangon. Preparing a premium product for the Yangon market incurs additional costs for marketing, butchering, packaging, and transport but also attracts a premium over the Myeik wholesale market price. In addition, the PO slaughterhouse supplies premium pork cuts directly to restaurants in Myeik, and the high-quality Myeik wholesale market, with any remaining pork sold at the undifferentiated wholesale pork market.
3.5.3. Technical activities to upgrade the value chain In activity one (A1), an initial stock of microcredit amounting to US
$150,000 is made available to pig producers. The model uses the MFI partner’s standard amortized loan product which follows Myanmar’s microfinance regulations. This includes an interest rate of 2.46% per month and a loan term of 12 months. Microcredit is prioritized for in-vestments with the remaining loan capital used for seasonal production loans. Any capital shortfalls by producers are met by taking loans from moneylenders at an interest rate of 5% per month and a loan term of 15 months. In the model, the stock of microcredit reduces when pig pro-ducers default on loans following farm failure. A second microcredit activity (referred to as activity A1a) that increases the stock of available microcredit to US$300,000 was also included. Activity two (A2) covers technical training provided by the project to pig producers. Training builds pig farmers’ technical knowledge, leading to improvements in biosecurity and hygiene measures, the increased confidence to upgrade, and improvements in overall pig quality. Technical knowledge also grows through peer-to-peer learning. Within activity three (A3), one AHW per target village is trained and equipped. Each AHW has the ca-pacity to cover 140 pigs at a time and, as determined by RG members, this reduces the disease mortality rate by up to 60% through the pro-vision of vaccinations, advice, and basic veterinary services. In activity four (A4), an artificial insemination (AI) unit is established and subsi-dized by the TRRILD project for three years to keep its service fee below the standard hybrid boar charges of US$30 per service. Following the project’s exit, the AI unit’s service fee is determined by cost recovery and an additional 20% profit margin. In activity five (A5) all the technical activities are implemented jointly.
4. Results and discussion
4.1. Baseline results
In the baseline, the model shows that the slaughterhouse price of live pigs in Myeik and Palaw rose steadily although significant outbreaks of swine disease caused substantive price fluctuations as shown in Fig. 5. At the initial stages of a disease outbreak, live pig prices fall due to panic selling and reduced consumption owing to food-safety concerns. Prices then rebound sharply as the stock of pigs falls and consumer confidence returns, and then surpass pre-disease levels while farmers restock. These large spikes in price induce small-scale producers to invest in additional production capacity or to upgrade to higher-value, but more risky, pig enterprises. Subsequent growth in the number of fatteners entering the market caused live pig prices to drop back to pre-disease levels, resulting in over-indebted farmers dropping out of pig farming.
In the baseline run, FF farming systems were much more profitable than WF farming systems, with hybrid breeds more profitable than local breeds (Table 2). This is consistent with discussion in SGMB workshops and research by Ebata et al. (2018) which suggest that small-scale producers in Myanmar raise local pigs primarily as a livestock bank for household savings rather than as a commercial enterprise. For vil-lages without access to formal banking and with limited land, space and capital, pig farming enables members to use available resources – such as kitchen scraps, rice by-products, and household land – to maintain an asset that is easy to sell when cash is required.
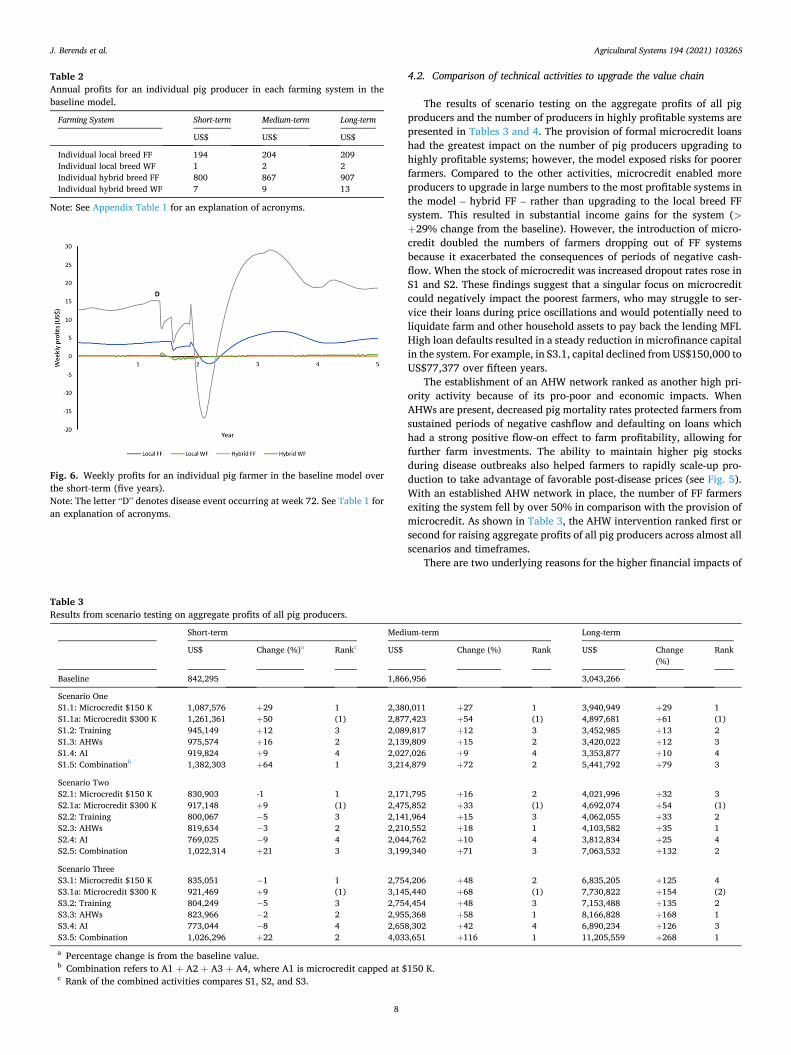
The four-fold increase in profits associated with hybrid breeds pro-vided a strong incentive for farmers to upgrade from local to hybrid breeds as well as from WF to FF systems. However, the potential prof-itability was offset by higher risks inherent within these systems. As illustrated in Fig. 6, hybrid FF farming systems are more risky as they experience more significant periods of negative cashflow owing to higher pig mortality rates, the fluctuating live pig price, and substantial asset and production loan payments to money lenders. Following a disease outbreak, cashflow remains lower but is still positive as pig farmers panic sell fatteners below optimal weight; however, cashflow then becomes negative due to ongoing loan repayments for key inputs (feed and piglets) and the need to restock farms. In the baseline, the total number of pig producers in highly profitable systems showed a small increase of 2.1% per annum. Pig farmers upgraded steadily from local breed WF to local breed FF farming system but were unable to upgrade in large numbers to the highly profitable hybrid FF system. Even though the local breed FF systems were less risky than the hybrid equivalent, just over a third of farmers dropped out and returned to the minimally profitable WF system over the model’s lifetime.
Fig. 5. Simulated slaughterhouse price of pigs in target region. Note: The letter “D” denotes disease events occurring at weeks 72, 280, 488, and 696.
J. Berends et al.
Agricultural Systems 194 (2021) 103265
8
4.2. Comparison of technical activities to upgrade the value chain
The results of scenario testing on the aggregate profits of all pig producers and the number of producers in highly profitable systems are presented in Tables 3 and 4. The provision of formal microcredit loans had the greatest impact on the number of pig producers upgrading to highly profitable systems; however, the model exposed risks for poorer farmers. Compared to the other activities, microcredit enabled more producers to upgrade in large numbers to the most profitable systems in the model – hybrid FF – rather than upgrading to the local breed FF system. This resulted in substantial income gains for the system (>+29% change from the baseline). However, the introduction of micro-credit doubled the numbers of farmers dropping out of FF systems because it exacerbated the consequences of periods of negative cash-flow. When the stock of microcredit was increased dropout rates rose in S1 and S2. These findings suggest that a singular focus on microcredit could negatively impact the poorest farmers, who may struggle to ser-vice their loans during price oscillations and would potentially need to liquidate farm and other household assets to pay back the lending MFI. High loan defaults resulted in a steady reduction in microfinance capital in the system. For example, in S3.1, capital declined from US$150,000 to US$77,377 over fifteen years.
The establishment of an AHW network ranked as another high pri-ority activity because of its pro-poor and economic impacts. When AHWs are present, decreased pig mortality rates protected farmers from sustained periods of negative cashflow and defaulting on loans which had a strong positive flow-on effect to farm profitability, allowing for further farm investments. The ability to maintain higher pig stocks during disease outbreaks also helped farmers to rapidly scale-up pro-duction to take advantage of favorable post-disease prices (see Fig. 5). With an established AHW network in place, the number of FF farmers exiting the system fell by over 50% in comparison with the provision of microcredit. As shown in Table 3, the AHW intervention ranked first or second for raising aggregate profits of all pig producers across almost all scenarios and timeframes.
There are two underlying reasons for the higher financial impacts of
Table 2 Annual profits for an individual pig producer in each farming system in the baseline model.
Farming System Short-term Medium-term Long-term
US$ US$ US$
Individual local breed FF 194 204 209 Individual local breed WF 1 2 2 Individual hybrid breed FF 800 867 907 Individual hybrid breed WF 7 9 13
Note: See Appendix Table 1 for an explanation of acronyms.
Fig. 6. Weekly profits for an individual pig farmer in the baseline model over the short-term (five years). Note: The letter “D” denotes disease event occurring at week 72. See Table 1 for an explanation of acronyms.
Table 3 Results from scenario testing on aggregate profits of all pig producers.
Short-term Medium-term Long-term
US$ Change (%)a Rankc US$ Change (%) Rank US$ Change (%)
Rank
Baseline 842,295 1,866,956 3,043,266
Scenario One S1.1: Microcredit $150 K 1,087,576 +29 1 2,380,011 +27 1 3,940,949 +29 1 S1.1a: Microcredit $300 K 1,261,361 +50 (1) 2,877,423 +54 (1) 4,897,681 +61 (1) S1.2: Training 945,149 +12 3 2,089,817 +12 3 3,452,985 +13 2 S1.3: AHWs 975,574 +16 2 2,139,809 +15 2 3,420,022 +12 3 S1.4: AI 919,824 +9 4 2,027,026 +9 4 3,353,877 +10 4 S1.5: Combinationb 1,382,303 +64 1 3,214,879 +72 2 5,441,792 +79 3
Scenario Two S2.1: Microcredit $150 K 830,903 -1 1 2,171,795 +16 2 4,021,996 +32 3 S2.1a: Microcredit $300 K 917,148 +9 (1) 2,475,852 +33 (1) 4,692,074 +54 (1) S2.2: Training 800,067 − 5 3 2,141,964 +15 3 4,062,055 +33 2 S2.3: AHWs 819,634 − 3 2 2,210,552 +18 1 4,103,582 +35 1 S2.4: AI 769,025 − 9 4 2,044,762 +10 4 3,812,834 +25 4 S2.5: Combination 1,022,314 +21 3 3,199,340 +71 3 7,063,532 +132 2
Scenario Three S3.1: Microcredit $150 K 835,051 − 1 1 2,754,206 +48 2 6,835,205 +125 4 S3.1a: Microcredit $300 K 921,469 +9 (1) 3,145,440 +68 (1) 7,730,822 +154 (2) S3.2: Training 804,249 − 5 3 2,754,454 +48 3 7,153,488 +135 2 S3.3: AHWs 823,966 − 2 2 2,955,368 +58 1 8,166,828 +168 1 S3.4: AI 773,044 − 8 4 2,658,302 +42 4 6,890,234 +126 3 S3.5: Combination 1,026,296 +22 2 4,033,651 +116 1 11,205,559 +268 1
a Percentage change is from the baseline value. b Combination refers to A1 + A2 + A3 + A4, where A1 is microcredit capped at $150 K. c Rank of the combined activities compares S1, S2, and S3.
J. Berends et al.

Agricultural Systems 194 (2021) 103265
9
AHWs in S2 and S3 compared with S1. Firstly, the structure of PGs/POs allowed them to maintain investments in AHWs after the project exits. After fifteen years, 22% of the pig population was covered by AHW services in S1.3, compared with 97% in S2.3 and 98% in S3.3. Secondly, AHWs helped offset the higher risks of producing a premium product by enabling PGs/POs to maintain livestock numbers to consistently meet orders from Yangon and Myeik, with surplus fatteners able to take advantage of post-disease price peaks.
The introduction of AHWs increased off-farm employment (i.e., employment within brokers, input shops, service providers, and slaughterhouses involved in the pork value chains) by a factor of eight compared with other activities and strengthening the supply of locally produced pigs for brokers, slaughterhouses, and consumers. This continuous supply of pigs increased local slaughterhouse profits as they had multiple supply channels to choose from, thereby reducing the price of live pigs they purchase.
The training of pig producers delivered around two-thirds of the financial and pro-poor gains of microcredit and AHW activities, and was considered a medium priority intervention. As highlighted in Tables 3 and 4, short-term training did not enable large numbers of farmers to upgrade to highly profitable systems. Rather, training helped farmers extract further profits from current enterprises through improved farm practices that lessen the impact of seasonal diseases and increase the quality of fatteners. The results suggested that training has the highest potential for negative impacts on slaughterhouses, because it equipped producers with further information on the quality of their product, reducing the gap between the overall slaughterhouse price and the farmgate price.
AI was given the lowest priority for the project owing to its comparatively low impacts and high risks. AI is a relatively new phe-nomenon in Myanmar and practiced only by the larger, internationally- backed pig farms near Yangon. In the model, AI reduced costs for the fertilization of hybrid sows from US$30 to around US$7. While this was a large cost reduction, it is only a small percentage (4%) of the overall costs of producing hybrid pigs, and therefore did not bring material gains to the system.
Combining the four activities resulted in a healthy interaction effect. As Table 3 illustrates, implementing activities in parallel delivered two to three times more aggregate profit for all pig producers than the highest single activity. This combined impact was particularly important in S2 and S3 where individual activities had a negative (between − 1% and − 9%) financial impact in the short-term but, significantly, a well- sequenced combination of technical activities produced short-term positive outcomes (i.e., S3.1 + S3.2 + S3.3 + S3.4 = +22%). As shown in Table 4, stand-alone activities also initially reduced the number of highly profitable pig producers in S2 and S3; however, combining activities reversed this trend.
The model’s results show that stand-alone activities that promoted rapid upgrading were unable to fully overcome liquidity problems faced by PG members. In contrast, a strategy of multiple activities prevented PGs from dissipating early on when member profits and PG rebates and services were low (due to biological production delays and loan re-payments) and continued to provide ongoing protection from negative cashflows and subsequent dropouts. This allowed PG members to rapidly transition from moderately profitable hybrid WF to highly profitable FF systems, activating reinforcing feedback investment loops.
4.3. Comparison of institutional scenarios
A comparison of the three institutional scenarios (with all activities jointly implemented) revealed differences in impact and trade-offs across temporal horizons and between value chain actors. Targeting individual producers in S1 had the highest short-term financial impact; however, gains plateaued after the project exited. Meanwhile, in-vestments in collective action in S2 and S3 produced accelerating financial benefits which outperformed S1 by the medium-term. By the end of the model’s horizon, establishing PGs delivered close to twice the economic benefits of working with individual farmers. The greatest change, however, came from investing in a PO that can manage value- added assets, as this grew incomes in the target villages by three times that of S1 and twice that of S2.
All three scenarios significantly increased the number of producers
Table 4 Results from scenario testing on total number of pig producers in highly profitable systems.
Short-term Medium-term Long-term
Number Change (%)a Rankc Number Change (%) Rank Number Change (%)
Rank
Baseline 379 441 464
Scenario 1 S1.1: Microcredit $150 K 420 +11 1 539 +22 1 550 +18 1 S1.1a: Microcredit $300 K 477 +26 (1) 635 +44 (1) 636 +37 (1) S1.2: Training 399 +5 2 495 +12 2 522 +12 2 S1.3: AHWs 389 +3 3 457 +3 3 507 +9 3 S1.4: AI 380 +0 4 449 +2 4 483 +4 4 S1.5: Combinationb 480 +26 1 639 +45 2 710 +53 2
Scenario 2 S2.1: Microcredit $150 K 343 − 10 2 394 − 11 2 453 − 2 2 S2.1a: Microcredit $300 K 363 − 4 (1) 435 − 2 (1) 512 +10 (1) S2.2: Training 343 − 10 1 498 − 10 1 474 +2 1 S2.3: AHWs 343 − 10 2 378 − 14 4 449 − 3 3 S2.4: AI 343 − 10 2 387 − 12 3 451 − 3 4 S2.5: Combination 397 +5 3 542 +23 3 704 +52 3
Scenario 3 S3.1: Microcredit $150 K 343 − 10 1 534 +21 4 699 +51 4 S3.1a: Microcredit $300 K 363 − 4 (1) 575 +30 (1) 853 +84 (2) S3.2: Training 343 − 10 1 550 +25 2 751 +62 2 S3.3: AHWs 343 − 10 1 556 +26 1 882 +90 1 S3.4: AI 343 − 10 1 540 +22 3 722 +55 3 S3.5: Combination 399 +5 2 684 +55 1 877 +89 1
a Percentage change is from the baseline value. b Combination refers to A1 + A2 + A3 + A4, where A1 is microcredit capped at $150 K. c Rank of the combined activities compares S1, S2, and S3.
J. Berends et al.

Agricultural Systems 194 (2021) 103265
10
engaged in highly profitable pig systems. In the short-term, S1 (480) outperformed S2 (397) and S3 (399). This is because in S1, a large portion of farmers (59%) quickly upgraded to local breed FF systems but could not transition to hybrid systems, thereby missing out on the sub-stantially larger financial gains. In S2, PGs capture value added pre-miums only for the small portion of their high-quality fatteners that supply Myeik restaurants. The price rebates from the PGs in S2 are less than those from POs in S3, slowing down further investment and tran-sitions to the FF system. As a result, S2 and S1 had a similar number of producers engaged in highly profitable systems by the end of the model’s horizon. In contrast, PO members in S3 accessed the larger Yangon market for premium pork and received higher premiums, which encouraged members to scale-up production and quickly upgrade to FF systems. By the midpoint of the model’s horizon, S3 had the highest pro- poor impact and by the end of the horizon S3 had 24% more farmers in highly profitable systems than S2 or S3.
Investments in pig producer institutions created a third pro-poor option for generating a meaningful income from pig farming: the hybrid WF system. In S2 (PGs) and S3 (POs), WF farmer annual incomes reach US$103 and US$411 respectively by the end of the model’s ho-rizon. S3 incomes were considerably larger owing to rebates afforded by investments in the slaughterhouse. This level of profits compared favorably to local breed FF farms (US$252 per annum) albeit with a significantly lower environmental cost and resource (financial, physical, and human) requirements. S3, and to a lesser extent S2, therefore, created a pathway for poorer pig producers with lower capital and risk tolerance to engage in a moderately profitable livelihood, (i.e., hybrid WF farming), and then transition to the highly profitable hybrid FF system.
Two areas of concern regarding farmer liquidity problems were identified in the model. In S1, soon after the project exits, hybrid FF farmers faced periods of negative cashflow. In S2 and S3, PG/PO members did not experience similar liquidity problems once loans were repaid, as they were able to maintain investments in biosecurity and AHWs. The second area of concern was the prolonged period of negative cashflow experienced by PG/PO members in S2 and S3 when they take on microfinance loans to upgrade farms to hybrid FF or WF systems. PG members took around 90 weeks for their enterprises to break even, with debt peaking at US$1951 for FF farmers and US$134 for WF farmers. Consequently, different financial products were included in the model to understand their impact on individual farmer cashflows. The model showed that increasing asset and production loan terms to their maximum length (24 and 18 months) and initially selling a higher portion of piglets, combined with either a balloon or deferred payment loan, enabled producers to maintain positive cashflow, albeit with overall reductions in farm profits (− 39% over three years compared with the standard amortized loan product). Finnemore et al. (2004) demonstrate the advantages of loan products with repayment schedules that better match the cashflows generated by investments in productive assets.
Each institutional scenario had a different impact on downstream actors in the pork value chain. Targeting individual producers in S1 magnified the current system leading to profit increases for brokers (60%) and slaughterhouses (25%) as well as increases in off-farm employment (133%). In S2 and S3, PGs sell directly to a slaughter-house, causing the cumulative profits for brokers to fall by 49% in the long term. S2 and S3 also resulted in a small (1.1% to 1.7%) decrease in annual slaughterhouse profits, suggesting it could prove difficult to engage with existing slaughterhouses to switch part of their system to a focus on high-quality wholesale pork, given the strong financial incen-tive to continue operating in a high volume, low-quality system. External support may be necessary to attract suitable business partners for POs. This support could include training in safe, hygienic slaugh-tering and butchering of premium cuts along with equipment grants to encourage slaughterhouses to adopt new practices. All three scenarios substantially increased off-farm employment by 105% to 143% in the
short-term. After five years, employment gains in S2 and S3 outpaced S1 as PGs and POs became debt-free and invested in farm and organiza-tional capacity that brought additional employment to the value chain. Increases in off-farm wages in S2 and S3 largely offset losses experienced by brokers and slaughterhouse owners. The results suggest that a new, hygienic slaughterhouse facility would be a sound investment for a strategic partner, delivering annualized returns of over 50%. Existing slaughterhouses could be approached to invest in new PO-owned slaughterhouses but the model showed that, even without an external investor, a PO could service a standard two-year MFI loan while main-taining positive cashflow and financing investments.
4.4. Sensitivity analysis
Sensitivity analysis (SA) was performed to test whether policy con-clusions drawn from the model remained valid when assumptions were altered over a plausible range of uncertainty (Sterman, 2000, p.883). SA was undertaken by altering both structure and parameters and then comparing intervention results and rank order to the original findings. A summary of the structural SA tests is provided in Table 5, and these revealed several findings applicable to decision making in the TRRILD
Table 5 Summary of structural sensitivity analysis tests.
Structural SA Test Changes to structure and parameters
Disease outbreaks ▪ No significant disease outbreaks occur ▪ Significant disease outbreaks along with
a live pig importation ban from outside the region
▪ Temporal changes to disease outbreaks (delayed by one, two, and three years as well as random timing) and length of disease (random length between 10 and 52 weeks)
Temporal delay to technical upgrading activities
▪ One year delay to each of the technical upgrading activities
Varying combinations of technical upgrading activities
▪ Testing the technical upgrading activities with different combinations, i. e. A1 + A3 versus A1+ A2
Alternative PG and PO arrangements
▪ PGs/POs do not collect fees or premiums from members (i.e., no collective savings)
▪ PGs/POs prioritise rebates for members over savings, resulting in 50% less collective savings
▪ PGs/POs prioritise savings over member rebates, resulting in 50% more collective savings
▪ PGs/POs do not pay rebates to members to prioritise savings and investment capacity
Changes in responsiveness of pig producers to market signals
▪ Time taken to respond to market signals was changed by ±25%
▪ Response to market signals (i.e., production and upgrading responses) was changed by ±25%
African Swine Fever (ASF) outbreak in target region
▪ ASF outbreak in target region, modelled as a four-fold increase in mortality compared with typical disease outbreak as per RG recommendations
▪ Biosecurity protocols introduced to target villages as per the VietGAHP 2016 guidelines (Nguyen et al., 2019) and FAO criteria (2010)
▪ ASF outbreak occurs twice over 15-year period
Alternative microcredit products
▪ Testing loan terms of 6 to 24 months Testing three viable loan products: (i)
amortized; (ii) balloon; and (iii) deferred payment
Changes to demand for pork products
▪ Annual increase reduced from 6% to 3% and 1%.
Note: See Appendix Table 1 for an explanation of acronyms.
J. Berends et al.

Agricultural Systems 194 (2021) 103265
11
project. First, an African Swine Fever (ASF) outbreak in the target region would decrease chain profits by almost 40%. However, if biosecurity interventions were mainstreamed across the project’s activities, pig producer profits would remain largely unharmed in the long-term. Second, medium- and long-term results strongly point to the impor-tance of institutional arrangements that encourage collective savings and rebates proportional to patronage as a mechanism to increase the financial position of PG/PO members. Third, the nature of credit prod-ucts available to small-scale farmers greatly impacted the project’s re-sults. System profits doubled moving from the worst (6 months) to best- case (24 months) scenario for loan terms. Interestingly, the shortest loan term of six months performed worse in pro-poor impact than the base-line of no microcredit. SA also showed that negative cashflows among small-scale producers could be overcome through a combination of lengthening loan terms to two years, a production-aligned balloon loan, and initially selling a higher volume of piglets (80% sold to WF farmers.)
SGMB and RG members identified fourteen exogenous parameters (Table 6) that were both uncertain and had high potential to impact the model’s results. These parameters were selected for multivariate parameter SA performed with Monte Carlo simulations (Sterman, 2000). This analysis used the Latin hypercube sampling technique with a sample of 1000 runs. Ford (2010) contends that this technique is effi-cient for testing SD models. A triangular distribution was applied to parameters where historical data were available, with the value used for scenario testing taken as the mean, and worst-case and best-case values as lower and upper bounds (Ford, 2010). In cases where there were no historical data, a uniform distribution was applied with upper and lower values representing plausible extremes of real-world parameters, or ±50% from the original value for parameters without real world equiv-alency, such as the price elasticity of demand. Bounds for SA were weighted towards a worst-case scenario given the desire to “future proof” project decisions against potential negative events and to coun-teract the tendency for participants in group model building processes to
be overly optimistic with critical model variables (Ford, 2010; Sterman, 2000).
The results of the multivariate SA support the model’s original findings on the project’s financial and pro-poor impacts and are detailed in Supplementary Material D. The multivariate SA reduced the mean baseline values for the two outcome indicators by around 10%, which was expected given the weighting towards worst-case scenarios. The SA ranking of the three institutional scenarios on the aggregate profits of all pig producers did not change. However, the weighting towards worst- case scenarios in SA brought a small delay to the impacts of PG and PO investments in transitioning producers to highly profitable systems. The results of the SA strengthened the case for prioritizing microfinance and AHW activities, which generally improved in ranking. The SA also confirmed the importance of complementary activities. In S2 and S3, the negative impacts of single activities were more substantial in SA; how-ever, the combination of activities still produced better results.
5. Conclusion
Analysis of the pork value chain examined in this study suggests that a well-sequenced combination of technical training, horizontal and vertical coordination mechanisms, disease prevention, and micro and meso-credit could deliver the best financial outcomes for its small-scale pig producers. While some farmers can successfully upgrade their en-terprises with the assistance of just one or two interventions, poorer farmers require more layered support. There is pressure for development projects to cover large target populations, and this often limits the range of technical support available to farmers. However, this research sug-gests that by directing their investments to broadly support a smaller number of committed small-scale farmers within functional producer groups, development agencies will achieve greater inclusion and better financial outcomes.
The research also indicates that the provision of affordable and appropriate credit is critical for small-scale farmers in Myanmar to up-grade their agri-food enterprises. MFIs and other financial institutions need to develop loan products with tailored repayment schedules to address smallholder liquidity problems (Finnemore et al., 2004). This includes seasonal loans to finance inputs for products that meet the quality and food safety requirements of premium markets, along with meso-sized loans to finance lumpy value-adding assets.
Testing interventions in a virtual modelling environment is a cost- effective method for development agencies to trial different upgrading strategies. Information generated by SD models can improve decision- making, leading to a better allocation of scare development resources and more accurate targeting of vulnerable or marginalized groups. This technique is particularly applicable to complex, interconnected envi-ronments like agri-food value chains, where interventions may create winners at the expense of losers, and result in unintended negative consequences that manifest long after implementation. Development partners, however, need to understand the rationale for using value chain SD models early in the project process. When applied to a project that already has an approved design, like the TRRILD project, SD modelling can guide decisions about upgrading activities that are feasible within the project’s budgetary, time, and design constraints. In contrast, embedding SD modelling from a project’s inception would allow its designers to test a range of upgrading approaches, helping to set the project’s strategic direction and design. This latter approach re-quires more flexibility on the part of donor agencies and would be more suited to agencies that apply adaptive aid management principles.
The application of SGMB and SD modelling to analyze agribusiness value chains and evaluate interventions is relatively new. Among recent applications, Rich et al. (2018) analyzed urban food value chains in New Zealand. Cooper et al. (2021) went further by analyzing and evaluating potential interventions in horticulture value chains in India. In addition, they highlighted the potential of the SD model to quantitatively evaluate financial products in agribusiness value chains. In this paper we develop
Table 6 Parameters for multivariate sensitivity analysis.
Parameter Base value
Unit Ranges of uncertainty
Death rate 0.15 Proportion Triangular (0.05, 0.3)
Panic selling rate 0.05 Proportion Triangular (0.025, 0.3)
Length of disease outbreak 26 Weeks Triangular (10, 52)
Consumer change in pork demand due to disease
− 0.3 Proportion Triangular (− 0.1, − 0.6)
Change in pork demand during Chinese New Year
0.2 Proportion Triangular (0.1,0.5)
Sensitivity of Myeik price to inventory coverage
− 0.1 n.a Uniform (− 0.05, − 0.15)
Sensitivity of Mawlymine price to inventory coverage
− 0.05 n.a Uniform (− 0.025, − 0.075)
Price elasticity of demand − 0.5 n.a Uniform (− 0.25, − 0.75)
Money lender interest rate 0.05 Percentage/ mth
Triangular (0.04, 0.075)
Time to fatten hybrid pigs 19.3 Weeks Triangular (17.4, 20)
Slaughterhouse production costs 8.82 US$/pig Uniform (6.15, 11.0)a
Premium for high-quality wholesale pork in Myeik
10 Percent Uniform (1, 15)
Premium for high-quality pork cuts in Myeik
15 Percent Uniform (5, 20)
Premium for high-quality pork cuts in Yangon
35 Percent Uniform (20, 40)
Note: See Appendix Table 1 for an explanation of acronyms. a For the PO slaughterhouse’s production costs a uniform distribution was
used with ± of 25% as the maximum and minimum variables for key input costs exogenous to the model.
J. Berends et al.

Agricultural Systems 194 (2021) 103265
12
the first SD model that evaluates both financial products and collective action among farmers as possible interventions to upgrade an inefficient agribusiness value chain. While these interventions were evaluated ex- ante, the SD model has proved remarkably accurate in predicting live pig price movements in southern Myanmar.
The SD model developed for the TRRILD project could be updated and modified to account for changing contextual conditions, and used to guide the design of future strategies to further upgrade the project’s pork value chain. The methods employed in this research could also serve as a foundation for other projects that aim to upgrade agri-food value chains.
Declaration of Competing Interest
The authors declare that they have no known competing financial
interests or personal relationships that could have appeared to influence the work reported in this paper.
Acknowledgements
This research was funded by the New Zealand Aid Programme via its Partnerships for International Development Fund, Funding Arrange-ment PF 9-558 Tanintharyi Region Rural Income and Livelihoods Development, Myanmar. We would also like to acknowledge World Vision Myanmar staff and the value chain stakeholders who participated in model building and validation.
Appendix A. Appendix
Appendix Table 1 Acronyms and abbreviations.
Acronym Definition
A1 Activity one: US$150,000 in microcredit is made available to pig producers A2 Activity two: Technical training is provided to pig producers A3 Activity three: Animal health workers trained and equipped A4 Activity four: Artificial insemination unit established for hybrid sows A5 Activity five: Combination of activities one, two, three, and four AHW Animal Health Worker AI Artificial Insemination ASF African Swine Fever CLD Causal Loop Diagram FF Farrow-to-Fatten GAHP Good Animal Husbandry Practices GIS Graphical Information Systems GMB Group Model Building MBT Model Building Team PG Producer Group PO Producer Organization RG Reference Group S1 Scenario One: Project interventions are implemented across all pig producers S2 Scenario Two: Project establishes 32 producer groups with 20 members S3 Scenario Three: Project encourages producer groups to graduate to Producer Organizations after three years SA Sensitivity Analysis SD System Dynamics SGMB Spatial Group Model Building TRRILD Tanintharyi Region Rural Income and Livelihood Development project WF Wean-to-Fatten
Appendix B. Supplementary data
Supplementary data to this article can be found online at https://doi.org/10.1016/j.agsy.2021.103265.
References
Andersen, D.F., Richardson, G.P., 1997. Scripts for group model building. Syst. Dyn. Rev. 13 (2), 107–129. https://doi.org/10.1002/(SICI)1099-1727(199722)13:2%3C107:: AID-SDR120%3E3.0.CO;2-7.
Bhattarai, S., Lyne, M.C., Martin, S.K., 2013. Assessing the performance of a supply chain for organic vegetables from a smallholder perspective. J. Agribus. Dev. Emerg. Econ. 3 (2), 101–118. https://doi.org/10.1108/JADEE-12-2012-0031.
Bolwig, S., Ponte, S., Du Toit, A., Riisgaard, L., Halberg, N., 2010. Integrating poverty and environmental concerns into value-chain analysis: a conceptual framework. Dev. Policy Rev. 28 (2), 173–194. https://doi.org/10.1111/j.1467-7679.2010.00480.x.
Boughton, D., Aung, N., Belton, B., Filipski, M., Mather, D., Payongayong, E., 2018. Myanmar’s rural economy: a case study in delayed transformation. In: Feed the Future Innovation lab for Food Security Policy, Research Paper 104. https://www.ca nr.msu.edu/resources/myanmar-s-rural-economy-a-case-study-in-delayed-trans formation.
Chaddad, F.R., Cook, M.L., 2004. Understanding new cooperative models: an ownership- control rights typology. Rev. Agric. Econ. 26 (3), 348–360. https://www.jstor.org/ stable/3700806.
Cook, M.L., Iliopoulos, C., 1999. Beginning to inform the theory of the cooperative firm: emergence of the new generation cooperative. Finnish J. Bus. Econ. 4, 525–535. http s://www.researchgate.net/publication/237207641_Beginning_to_Inform_the_Theor y_of_the_Cooperative_Firm_Emergence_of_the_New_Generation_Cooperative.
Cooper, C.S., Rich, K.M., Shankar, B., Rana, V., Ratna, N.N., Kadiyala, S., Ala, M.J., Nadagouda, S.B., 2021. Identifying ‘win-win-win’ futures from inequitable value chain trade-offs: a system dynamics approach. Agric. Syst. 190, 103096. https://doi. org/10.1016/j.agsy.2021.103096.
Dahlanuddin, B.H., Dizyee, K., Hermansyah, A.A., 2017. Assessing the sustainable development and intensification potential of beef cattle production in Sumbawa, Indonesia, using a system dynamics approach. PLoS One 12 (8), e0183365. https:// doi.org/10.1371/journal.pone.0183365.
Dizyee, K., Baker, D., Rich, K.M., 2017. A quantitative value chain analysis of policy options for the beef sector in Botswana. Agric. Syst. 156, 13–24. https://doi.org/ 10.1016/j.agsy.2017.05.007.
Dizyee, K., Baker, D., Herrero, M., Burrow, H., McMillan, L., Sila, D.N., Rich, K.M., 2020. The promotion of amaranth value chains for livelihood enhancement in East Africa: a systems modelling approach. African J. Agricult. Res. Econ. 15 (10), 81–94. https://doi.org/10.22004/ag.econ.307620.
Ebata, A., Win, K.S., Loevinsohn, M., Macgregor, H., 2018. Value chain governance and institutions behind biosecurity along pig value chains in Myanmar. In: Paper
J. Berends et al.

Agricultural Systems 194 (2021) 103265
13
Presented at the 30th International Conference of Agricultural Economists, Vancouver, July 28–August 2, p. 2018.
Esnard, R., Lyne, M., Old, K., 2017. Institutional factors affecting value added by agricultural cooperatives in Saint Lucia. J. Co-Operat. Org. Manag. 5 (2), 73–79. https://doi.org/10.1016/j.jcom.2017.10.003.
Finnemore, G.R.L., Darroch, M.A.G., Lyne, M.C., 2004. Loan products to manage liquidity stress when broad-based black empowerment enterprises invest in productive assets. Agrekon 43 (4), 396–417. https://doi.org/10.1080/ 03031853.2004.9523657.
Food and Agriculture Organization, 2010. Good Practices for Biosecurity in the Pig Sector – Issues and Options in Developing and Transition Countries. http://www.fao. org/3/i1435e/i1435e00.pdf.
Food and Agriculture Organization, 2017. State of the Food and Agriculture. Leveraging Food Systems for Inclusive Rural Transformation. Available at. http://www.fao. org/3/a-I7658e.pdf.
Ford, A., 2010. Modeling the Environment, 2nd ed. Island Press, Washington, USA. Forrester, J.W., Senge, P.M., 1980. Tests for building confidence in system dynamics
models. In: Legasto, A.A., Forrester, J.W., Lyneis, J.M. (Eds.), System Dynamics: TIMS Studies in the Management Science, 14. North-Holland, New York, pp. 209–228.
Gereffi, G., Fernandez-Stark, K., 2016. Global Value Chain Analysis: A Primer. https ://www.researchgate.net/profile/Gary_Gereffi/publication/305719326_Global_Val ue_Chain_Analysis_A_Primer_2nd_Edition/links/579b6f0708ae80bf6ea3408f/Global -Value-Chain-Analysis-A-Primer-2nd-Edition.pdf.
Hamza, K.H., Rich, K.M., Baker, A.D., Hendrickx, S., 2014. Commercializing smallholder value chains for goats in Mozambique: a systems dynamics approach. In: Systems dynamics and innovation in food networks: Proceedings of the 8th International European Forum on Systems Dynamics and Innovations in Food Networks, University of Bonn, 17–21 February 2014. International Centre for Food Chain and Network Research, Innsbruck-Igis, Austria, pp. 117–134. https://doi.org/10.18461/ pfsd.2014.1411.
Harris, A., Stefanson, B., Fulton, M., 1996. New generation cooperatives and cooperative theory. J. Cooperat. 11, 15–28.
Hendriks, S.L., Lyne, M.C., 2003. Agricultural growth multipliers for two communal areas of KwaZulu-Natal. Dev. South. Afr. 20 (3), 423–444. https://doi.org/10.1080/ 0376835032000108211.
Hovmand, P.S., 2014. Community Based Systems Dynamics. Springer. Huynh, T.T.T., Aarnink, A.J.A., Drucker, A., Verstegen, M.W.A., 2007. Pig production in
Cambodia, Laos, Philippines, and Vietnam: a review. Asian J. Agricult. Dev. 4 (1), 70–90. https://doi.org/10.22004/ag.econ.165789.
International Fund for Agricultural Development, 2016. Rural Development Report 2016 Fostering Inclusive Rural Transformation. Available at. https://www.ifad.org/do cuments/38714170/39155702/Rural+development+report+2016.pdf/347402dd-a 37f-.
Lie, H., Rich, K.M., Burkhart, S., 2017. Participatory system dynamics modelling for dairy value chain development in Nicaragua. Dev. Pract. 27 (6), 785–800. https:// doi.org/10.1073/pnas.0913714108.
Lie, H., Rich, K.M., van der Hoek, R., Dizyee, K., 2018. An empirical evaluation of policy options for inclusive dairy value chain development in Nicaragua: a system dynamics approach. Agric. Syst. 164, 193–222. https://doi.org/10.1016/j.agsy.2018.03.008.
McRoberts, K.C., Nicholson, C.F., Blake, R.W., Tucker, T.W., and Padilla, G.D. 2013. Group model building to assess rural dairy cooperative feasibility in south-Central Mexico. Int. Food Agribus. Manag. Rev., 16(3), 55-98 https://www.ifama.org/ resources/Documents/v16i3/v16i3.pdf#page=63.
Ministry of Agriculture, Livestock, and Irrigation (MoALI), 2018. Myanmar agricultural development strategy and investment plan (2018–19 – 2022-23). Available at. https
://www.lift-fund.org/sites/lift-fund.org/files/publication/MOALI_ADS_June201 8_compressed_EN.pdf.
Ministry of Hotels and Tourism, 2009. Myanmar Tourism Statistics 2008–2009. Available at. https://tourism.gov.mm/wp-content/uploads/2019/03/2008-2009. pdf.
Ministry of Hotels and Tourism, 2019. Myanmar Tourism Statistics 2018. Available at. https://tourism.gov.mm/wp-content/uploads/2019/08/Myanmar-Toursim-Statis tics-2018.pdf.
Naziri, D., Rich, K.M., Bennett, B., 2015. Would a commodity-based trade approach improve market access for Africa? A case study of the potential of beef exports from communal areas of Namibia. Dev. Policy Rev. 33 (2), 195–219. https://doi.org/ 10.1111/dpr.12098.
Nguyen, L.T., Nanseki, T., Chomei, Y., 2019. The impact of VietGAHP implementation on Vietnamese households’ pig production. Environ. Dev. Sustain. 22 (8), 7701–7725. https://doi.org/10.1007/s10668-019-00543-w.
Ouma, E., Dione, M., Birungi, R., Lule, P., Mayega, L., Dizyee, K., 2018. African swine fever control and market integration in Ugandan peri-urban smallholder pig value chains: an ex-ante impact assessment of interventions and their interaction. Prevent. Vet. Med. 151, 29–39. https://doi.org/10.1016/j.prevetmed.2017.12.010.
Plunkett, B., Chaddad, F., Cook, M., 2010. Ownership structure and incentives to invest: dual-structured irrigation cooperatives in Australia. J. Inst. Econ. 6 (2), 261–280. https://doi.org/10.1017/S1744137409990361.
Poulton, C., Kydd, J., Dorward, A., 2006. Overcoming market constraints on pro-poor agricultural growth in sub-Saharan Africa. Dev. Policy Rev. 24 (3), 243–277. https:// doi.org/10.1111/j.1467-7679.2006.00324.x.
Rich, K.M., Ross, R.B., Baker, A.D., Negassa, A., 2011. Quantifying value chain analysis in the context of livestock systems in developing countries. Food Policy 36 (2), 214–222. https://doi.org/10.1016/j.foodpol.2010.11.018.
Rich, K.M., Rich, M., Dizyee, K., 2018. Participatory systems approaches for urban and peri-urban agriculture planning: the role of system dynamics and spatial group model building. Agric. Syst. 160, 110–123. https://doi.org/10.1016/j. agsy.2016.09.022.
Rich, K.M., Berends, J., Cooper, G.S., 2021. Enriching value chains through maps: reflections and lessons from spatial group model building in Myanmar and India. Dev. Pract. https://doi.org/10.1080/09614524.2021.1907545.
Snoxell, S., Lyne, M., 2019. Constraints to commercialisation of smallholder agriculture in Tanintharyi division, Myanmar. J. Agric. Rural. Dev. Trop. Subtrop. 120 (2), 219–227. https://doi.org/10.17170/kobra-20191212867.
Sterman, J.D., 2000. Business Dynamics: Systems Thinking and Modelling for a Complex World. Irwin/McGraw-Hill, Boston, USA, Boston.
Stoian, D., Donovan, J., Fisk, J., Muldoon, M., 2012. Value chain development for rural poverty reduction: a reality check and a warning. Enterprise Development and Microfinance 23 (1), 54–60. https://doi.org/10.3362/1755-1986.2012.006.
Trienekens, J.H., 2011. Agricultural value chains in developing countries; a framework for analysis. Int. Food Agribus. Manag. Rev. 14 (2), 51–83.
Vennix, J.A.M., 1996. Group Model Building. Wiley, New York, USA. World Bank, 2016. Myanmar: Analysis of Farm Production Economics (Economic and
Sector Work Report No. 100066-MM). Available at. https://www.lift-fund.org/mya nmar-analysis-farm-production-economics.
World Bank, 2017. An Analysis of Poverty in Myanmar (English). Available at. http: //documents.worldbank.org/curated/en/829581512375610375/An-analysis-of -poverty-in-Myanmar.
World Bank, 2020. Population Growth (annual %) – Myanmar [Data set]. https://data. worldbank.org/indicator/SP.POP.GROW?locations=MM&display=graph.
J. Berends et al.
Copyright © 2022 FDOKUMEN