Agricultural Service providers in Odisha: - Cereal Systems ...
58
SOCIO-ECONOM Agricultural Service Providers in Odisha: Characterization of Mechanized Agricultural Service providers for Technology Targeting and Business Development Bidhan K. Mohapatra, Sampriti Baruah and Takashi Yamano July 2014 ICS Working paper 2014 Agricultural Service providers in Odisha: Characterisation of Mechanised Agricultural Service providers for Technology Targeting and Business Development CSISA Socio-Economics Working Paper The Cereal Systems Initiative for South Asia (CSISA) is a regional initiative to sustainably increase the productivity of cereal-based cropping systems, thus improving food security and farmers’ livelihoods in Bangladesh, India and Nepal. CSISA works with public and private partners to support the widespread adoption of resource-conserving and climate- resilient farming technologies and practices. The initiative is led by the International Maize and Wheat Improvement Center (CIMMYT), implemented jointly with the International Food Policy Research Institute (IFPRI) and the International Rice Research Institute (IRRI), and is funded by the US Agency for International Development (USAID) and the Bill & Melinda Gates Foundation.
-
Upload
khangminh22 -
Category
Documents
-
view
0 -
download
0
Transcript of Agricultural Service providers in Odisha: - Cereal Systems ...
SOCIO-ECONOM
Agricultural Service Providers in Odisha: Characterization of Mechanized Agricultural Service providers for Technology Targeting and Business Development
Bidhan K. Mohapatra, Sampriti Baruah and Takashi Yamano
July 2014
ICS Working paper
2014
Agricultural Service providers in Odisha: Characterisation of Mechanised Agricultural Service providers for Technology Targeting and Business Development
CSISA Socio-Economics Working Paper
The Cereal Systems Initiative for South Asia (CSISA) is a regional initiative to sustainably
increase the productivity of cereal-based cropping systems, thus improving food security
and farmers’ livelihoods in Bangladesh, India and Nepal. CSISA works with public and
private partners to support the widespread adoption of resource-conserving and climate-
resilient farming technologies and practices. The initiative is led by the International
Maize and Wheat Improvement Center (CIMMYT), implemented jointly with the
International Food Policy Research Institute (IFPRI) and the International Rice Research
Institute (IRRI), and is funded by the US Agency for International Development (USAID)
and the Bill & Melinda Gates Foundation.

1
Table of Contents
Executive Summary................................................................................................................................. 6
1. Introduction........................................................................................................................................ 9
2. Agriculture and Farm Mechanisation in Odisha.............................................................................. 11
3. Sampling ........................................................................................................................................... 16
4. Service Providers .............................................................................................................................. 19
5. Machines Owned and Used ............................................................................................................. 23
6. Services Provided – cost, coverage, and business strategy ............................................................ 30
7. Business Constraints and Training Needs........................................................................................ 43
8. Conclusion ......................................................................................................................................... 50
Appendix ............................................................................................................................................... 52
2
List of Tables
Table 1. Agro-ecological Indicators of CSISA Districts of Odisha .......................................................... 12
Table 2. Sample Service providers Interviewed by the Main Machine Type ........................................ 16
Table 3. Sample Districts, Blocks, Villages, and Service providers........................................................ 17
Table 4. Socio-economic Characteristics of Service Providers............................................................. 19
Table 5. Social Network of Service Providers........................................................................................ 22
Table 6. Agricultural Machines that Service providers Own................................................................. 23
Table 7. Source of Information about the Machines ............................................................................ 25
Table 8. Motivations for Purchasing the Machines .............................................................................. 26
Table 9. Top Three Brands by Machine Type........................................................................................ 27
Table 10. Debts and Potential Credit Constraints................................................................................. 28
Table 11.Machines for Own Use ........................................................................................................... 29
Table 12. Basic Indicators of Business .................................................................................................. 30
Table 13. Service providers’ Number of Years of Experience in Business ............................................ 30
Table 14. Purchasing Costs and Subsidy Received................................................................................ 32
Table 15. Percentage of Service providers Providing Paid Service through Selected Machines .......... 33
Table 16. Indicators on Paid Service ..................................................................................................... 34
Table 17. Machine Operators for Paid Service ..................................................................................... 35
Table 18.Cost on Machine Operation for Service ProvisionA................................................................ 36
Table 19.Fees for Paid Service .............................................................................................................. 37
Table 20. Cost on Machine Operation at Others Field.......................................................................... 38
Table 21. Cost on Machine Operation at Others Field.......................................................................... 39
Table 22.Business Development Strategy by SPs ................................................................................. 41
Table 23.Demand Aggregator for Business Development .................................................................... 42
Table 24. Credit/subsidy as Constraint to Mechanized Service Business ............................................. 43
Table 25. Machine operator as Constraint to Mechanized Service Business ....................................... 44
Table 26. Demand for Machine as Constraint to Mechanized Service Business .................................. 45
Table 27. Technology as Constraint to Mechanized Service Business .................................................. 46
Table 28.Assessment of Machine Utilisation and Base of Assessment ................................................ 47
Table 29.Training Taken by Service providers on Machines ................................................................. 47
Table 30.Organizer of Training and Training Quality ............................................................................ 48
Table 31.Demand for Training and Type of Training Need ................................................................... 49
3
List of Figures
Figure 1 - A Mechanisation in Odisha: Tractors, Power Tillers and Pump sets Figure 1 - B Farm Mechanisation in Odisha: Combine harvester and Self –
Propelled Transplanters Figure 1 - C Farm Mechanisation in Odisha: Power – operated Implements,
Manual Implements and Power Threshers Figure 2 Service Provider Composition by Machine Type Figure 3 Locations of Service Providers Figure 4 Primary and Secondary Occupations of Service Providers Figure 5 Income Sources and Expenditure of Service Providers Figure 6 Service Provider’s information Sources about Machines Figure 7 Service Provider’s Motivation Factors for Purchasing Machines Figure 8 Credit Accessibility of Service Providers Figure 9 Service Provider’s Business Strategy Figure 10 Who should aggregate demand Figure 11 Level of Machine Use
4
Acknowledgments
This study was conducted as part of the Cereal Systems Initiative for South Asia (CSISA) project, which is jointly funded by the Bill & Melinda Gates Foundation (BMGF) and the United States Agency for International Development (USAID).
CSISA is mandated to enhance farm productivity and increase incomes of resource-poor farm families in South Asia through the accelerated development and inclusive deployment of new varieties, sustainable management technologies, partnerships, and policies.
The views expressed in this report are those of the authors and do not necessarily reflect the views of USAID, BMGF, the International Rice Research Institute (IRRI), International Maize and Wheat Improvement Centre (CIMMYT), International Livestock Research Institute (ILRI), International Food Policy Research Institute (IFPRI), or the CSISA project.
The authors express their deepest appreciation and thanks to several people for their support in various stages of this study. The authors wish to thank the Department of Agriculture, Government of Odisha, for providing support in the form of conducting surveys and providing secondary information.

5
Acronyms
BMGF Bill & Melinda Gates Foundation
CBO Community Based Organisation
CH Combine Harvester
CIMMYT International Maize and Wheat Improvement Center CSISA Cereal Systems Initiative for South Asia
GSDP Gross State Domestic Product
IFPRI International Food Policy Research Institute
ILRI International Livestock Research Institute
INR Indian Rupees
IRRI International Rice Research Institute
KVK Krishi Vigyan Kendra
MPS Mechanised Service Provision
MTR Mechanical Transplanted Rice
NGO Non-Government Organisation
OBC Other Backward Class
OUAT Orissa University of Agriculture & Technology
PT Paddy Transplanter
Pvt. Private
SC Scheduled Caste
SD Seed Drill
SPs Service providers
ST Scheduled Tribe
USAID United States Agency for International Development

6
Executive Summary
In Eastern India, where farm mechanisation lagged behind other progressive states, state
governments have put significant efforts to popularize agricultural machines and equipment
among farmers through demonstrations and subsidies. Since 2012, the CSISA project has
joined the efforts by working in three districts of Odisha: Bhadrak, Mayurbhanj and Puri. To
scale-up the mechanization, it was recognized that agricultural service providers can play an
important role since it is not economical for small and marginal farmers to own their own
machines. However, little has been documented about agricultural service providers in
Odisha. Thus, the main aim of this report is to characterize service providers and provide
recommendations on how to assist them.
The data used in this report come from 281 service providers in the three mentioned Odisha
districts. The service providers were randomly selected from a service provider list, which was
provided by the State Government of Odisha. The list was categorized by the machines that
the service providers own and included service providers who own at least one of the
following six machines: Paddy transplanter, Thresher, Tractor, Seed Drill, Reaper and Combine
harvester. The survey was conducted in April – May, 2014.
The results indicate that the service providers are mostly male, except for 21 female service
providers. More than 80 percent of them have high school education or higher, and less than
10 percent of them belong to Scheduled Caste or Tribes. About 53 percent of the service
providers are in the age group of 25-40 years. Farming is the primary occupation for about
half of them, while service provision is the primary occupation for about 18 percent of them.
On average, service provision contributes about 30 percent of their total income, while farm
income covers about 43 percent. The service providers are active members of social groups:
they are members of cooperatives (47%), political parties (43%), village committees (43%),
and formal credit groups (38%).
Popular agricultural machines that the service providers own include tractors (45%), reapers
(30%), power tillers (29%), paddy transplanters (22%), and cultivators (20%). They obtain
information about the machines mostly from friends and neighbours, although dealers,
government agencies, agricultural universities are also important information sources.
Around 14 percent of the service providers find potential profits (cost and time saving) and
so motivated to purchase machines. More than three fourth of them have loans from
commercial banks. They rely much less on other credit sources such as microcredit
organizations, government agencies, family, and friends.
The average years of experience in service provision is about 3 years among the service
providers. Thus, the service providers are relatively new in the business. In 2013, they hired,
on average, one permanent and two part-time employees and served about 95 farmers.
Service providers with combine harvesters served farmers most, serving 188 farmers in 2013
over 45 working days. Service providers with other machines served less: tractors (107
farmers), seed drills (49 farmers), threshers (44 farmers), paddy transplanters (33 farmers),

7
and reapers (32 farmers). Fees that they charged range from Rs. 406 (USD 7) per hour of seed
drills to Rs. 1,950 (USD 33) per hour of combined harvesters.
The Odisha government provides subsidy to purchase agricultural machines. The level of
subsidy varies from 25 to 75 percent, with some upper limits, depending on the machines.
About 87 percent of the service providers who were interview for this study received
subsidy when they purchased, most recently, one of the six agricultural machines considered
in the report. All service providers who purchased paddy transplanters or combine
harvesters received subsidy. On average, the subsidy covered about 36 percent of the
purchase cost among those who received subsidy. For paddy transplanters, the average
price of the machines was about 2 Lakh (USD 3,333), and the subsidy covered about 62
percent of the cost. For combine harvesters, the subsidy covered only 25 percent of the
purchase cost, although the absolute amount of the subsidy they received was high at about
four lakh (USD 6,547) per machine. Service providers who used other machines also received
subsidy.
Service providers who used combine harvesters earn the most: the average profit per year
was found to be around 2.9 Lakh Rupees (USD 4,833), and it was about 0.9 Lakh Rupees for
service providers who used tractors. The estimated profit was about 0.6 Lakh Rupees for
those used paddy transplanters and was about 30 percent of the purchase price without
subsidy. With subsidy, however, the profit was about 77 percent of the actual net payment
for the machine. Thus, the service providers with paddy transplanters could recover about 77
percent of the initial investment, i.e., the net purchase cost after receiving subsidy, in one
year. Without the subsidy, they would needed more than three years to recover the cost. For
service providers with combine harvesters and tractors, it would take more than five years to
recover the purchase cost without subsidy but would take only four years with subsidy.
About one fourth of the service providers received formal training in the past. Close to 60
percent of the service providers with paddy transplanters received formal training. In general,
the training was provided by private companies (74%), followed by government agencies
(16%), NGOs (7%), and research organizations (3%). They are eager to take more training.
More than 80 percent of the service providers with combined harvesters, paddy transplanters,
reapers, and seed drills want to take more training, while the service providers with tractors
and threshers are less enthusiastic. This could be because tractors and threshers were
introduced in Odisha early, while combine harvesters (2009), seed drills (2008), and paddy
transplanters (2002) were introduced recently.
To find customers, the service providers talk to their neighbours (47%) and conduct
demonstrations (22%). The access to credit or subsidy, or lack of it, is not a major constraint
for the service providers. They find that hiring machine operators as a constraint. Especially,
more than 56 percent of the service providers who used combine harvesters find it as a strong
constraint. The service providers who use seed drills, threshers, and reapers also find it as a
strong or a very strong constraint. Demand for their service was not considered as a constraint
for their business. Thus, it seems that there is adequate demand for their service, and the
access to credit is not a constraint. However, hiring skilled operators of their machines
appears to be an important constraint.
8
In sum, the lack of technical skills of newly introduced machines seems to be a major
constraint among the service providers as the service providers with newly introduced
machines find the lack of machine operators as a strong constraint to expand their business
and tend to demand more training. Thus, the state governments may consider assisting
technical training of private companies, government agencies, NGOs, or research
organizations. Although service providers are promoting various technologies, most of them
have inadequate knowledge about best-bet agronomic practices associated with their
services with machines. Therefore, awareness programs through demonstrations and hand-
holding support by extension workers should be scaled-up in the future.
Odisha agriculture is at a cross road toward achieving agricultural mechanisation in coming
decades, and service providers need to play an imperative role to take the road. Assisting
service providers, therefore, should be considered as a top priority for the Odisha government
and other state governments in Eastern India.
9
Agricultural Service Providers in Odisha:
Characterisation of Mechanised Agricultural Service providers for
Technology Targeting and Business Development
1. Introduction
Agricultural mechanisation advanced significantly in India, especially in areas that
experienced high rate of agricultural growth due to Green Revolution in the 1970s and 1980s.
Farm mechanization helped farmers reduce production and transport costs and increased
returns from their agricultural investment, and it reduced drudgery of labour and helped
farmers avoid waiting for farm workers during peak agricultural periods. In addition, it
increased the demand for skilled workers who operate machines and has stimulated business
interests around machines: trading, maintaining, and providing services to farmers who do
not own machines.
Because Eastern India lagged behind in the process of farm mechanisation, significant efforts
have been placed in recent years to popularize agricultural machineries among farmers
through demonstrations and subsidies in the region. In Odisha, the Agriculture Engineering
Wing of Directorate of Agriculture is the nodal department for agriculture mechanization and
works in all the thirty districts of Odisha. It provides subsidies for farmers to buy certain types
of agriculture machineries and engages in extension work, with active cooperation of farm
machinery division of Orissa University of Agriculture & Technology (OUAT), Krishi Vigyan
Kendra (KVK), and machine suppliers. Farmers in Odisha have started showing strong interests
in mechanization mostly because of increasing labour costs.
In 2012, the CSISA project commenced its activities in three districts of Odisha directly and in
collaboration with state government agencies, Non-Government Organizations/Community
Based Organisations (CBOs), formal and informal groups (including women groups) and
individual agri-entrepreneurs. The three districts fall in three different agro-climatic zones:
Mayurbhanj in North-Central Plateau zone, Bhadrak in the North-Eastern Coastal Plain zone,
and Puri in East & Southeast Coastal Plain zone1. The CSISA project promotes technologies
that are suitable to Odisha’s agro-ecology. To scale-up the mechanization efforts, it was
recognized that agricultural service providers could play an important role. However, little has
been documented about the agricultural service providers in Odisha. It is not clear how many
of service providers are actively providing agricultural services to farmers. Who are they? Do
they make profits? Do they have interest in business expansion?
To answer such questions, this study was designed. The objectives of the study are:
1. to describe the socio-economic characteristics of service providers,
1 Odisha Agriculture Statistics 2011-12.
10
2. to examines their business: type and number of machines they own, costs and
returns to their services,
3. to identify constraints to their business expansion, and
4. to understand their training needs and business opportunities. The report is based on a survey of 281 service providers who were randomly selected from a
list of service providers, which was provided by the State Government of Odisha. The list was
categorized by the machines that the service providers own. For this report, service providers
who own at least one of the six machines (i.e., Paddy transplanter, Thresher, Tractor, Seed
Drill, and combine harvester) that the CSISA project target for service provision in Odisha were
chosen. The survey of the 281 service providers was conducted in April – May, 2014.
Because of the rising labour costs and improved access to dealers and mechanics of
agricultural machines, Odisha agriculture is on the path toward achieving agricultural
mechanisation in coming decades. However, because farmers in Odisha are mostly small and
marginal, they need to rely on service providers to use agricultural machines, and the service
providers need assistance not only purchasing machines in subsidy but also using their
machines more effectively and hire skilled operators. Technical training of the service
providers and their operators should be considered as an imperative component in the farm
mechanization policy in Odisha and other states, as the results in this report show. Other
recommendations are also discussed in the final section of this report.
The report is divided in eight sections. The next section describes agriculture and farm
mechanization in Odisha. Section 3 explains sampling methods of the survey. The results from
the survey are presented in the remaining sections. Section 4 shows the characteristics of the
281 service providers in the three target districts in Odisha. The business of the service
providers is examined in Section 5. The next section investigates business constraints and
training needs of the service providers. Finally, Section 8 summarizes the main findings from
the report and discusses recommendations to assist service providers so that they can assist
many small and marginal farmers in Odisha.
11
2. Agriculture and Farm Mechanisation in Odisha
2.1 Agriculture in Odisha
Odisha is an agrarian state. Almost 70 percent of the state population depends on agriculture,
although the agriculture sector contributes only 16 percent of the Gross State Domestic
Product (GSDP). Agriculture in Odisha is characterised by low productivity on account of
various factors, which include less-favoured soil (acidic, saline and water logged), lack of
assured irrigation, low seed replacement rate, low level of fertiliser consumption (63 kg/ha
against the national average of 140 kg/ha), and low level of mechanisation. Low crop yields
of the state, compared with yield potential, and the potential benefits from technology
transfer provide an excellent opportunity to increase productivity and production
substantially in the state. The state has about 64 lakh hectares of cultivable area out of total
geographical area of 156 lakh hectares. About 40.2 lakh hectares of cultivable area has acidic
soil and approximately 4 lakh hectares of area suffers from salinity. Nearly 3 lakh hectares of
cultivable area is under water logging. The average size of land holding in the state is 1.25 ha
per household. Small and marginal farmers constitute about 83percent of all farm households
in the state.
In Odisha, 47 percent of the total cultivated land is highland, 25 percent is lowland, and 28
percent is medium land. Only 35 percent of the total cultivated land is irrigated, and this
indicates that a majority of the farmers in the state depend on rain as a source of water for
cultivation. Even though the irrigation potential has been expanded to nearly 45.14 lakh ha,
only 69 percent of the area is actually irrigated, indicating under use of irrigation potential in
the state. Odisha receives an average normal annual rainfall of 1,498 mm, of which 80 percent
is received during the monsoon season from June to September. Even though the quantity of
rainfall seems high, its distribution is erratic and uneven during the monsoon period, thus
affecting agricultural activities in the state. Apart from the erratic and uneven rainfall
distribution, the state has a history of regular occurrence of floods, cyclones, and droughts of
various intensity affecting primarily kharif crops and in some cases even affecting rabi crops2.
The state is divided into 10 agro-climatic zones on the basis of soil structure, humidity,
elevation, topography, vegetation, rainfall and other agro-climatic factors. The average
rainfall in the state is 1452 mm, of which about 80 percent is confined to monsoon months
(June-September). The total irrigation potential is 31 lakh hectares in Kharif, the main
agricultural season, and 15.0 lakh hectares in Rabi. Rice is the main staple crop of the state.
The total paddy production in the state during 2012-13 is estimated to be 144 lakh tons.
In terms of area coverage, rice is the major crop in Odisha. Out of total area of 8267.75
thousand hectares under various crops, the area covered under some major crops like rice,
mung, vegetables3 , biri, maize, groundnut, sesamum, kulthi, ragi and mustard is 4004.54
thousand hectares, 799.68 thousand hectares, 596.93 thousand hectares, 590.56 thousand
2 Characterization of CSISA Odisha Hub Districts for Technology Development and Targeting, CSISA Report, 2013 3 Excluding area under sweet potato, potato and onion
12
hectares, 262.05 thousand hectares, 255.14 thousand hectares, 235.68 thousand hectares,
230.15 thousand hectares, 169.22 thousand hectares and 126.67 thousand hectares
respectively4.
Table 1. Agro-ecological Indicators of CSISA Districts of Odisha
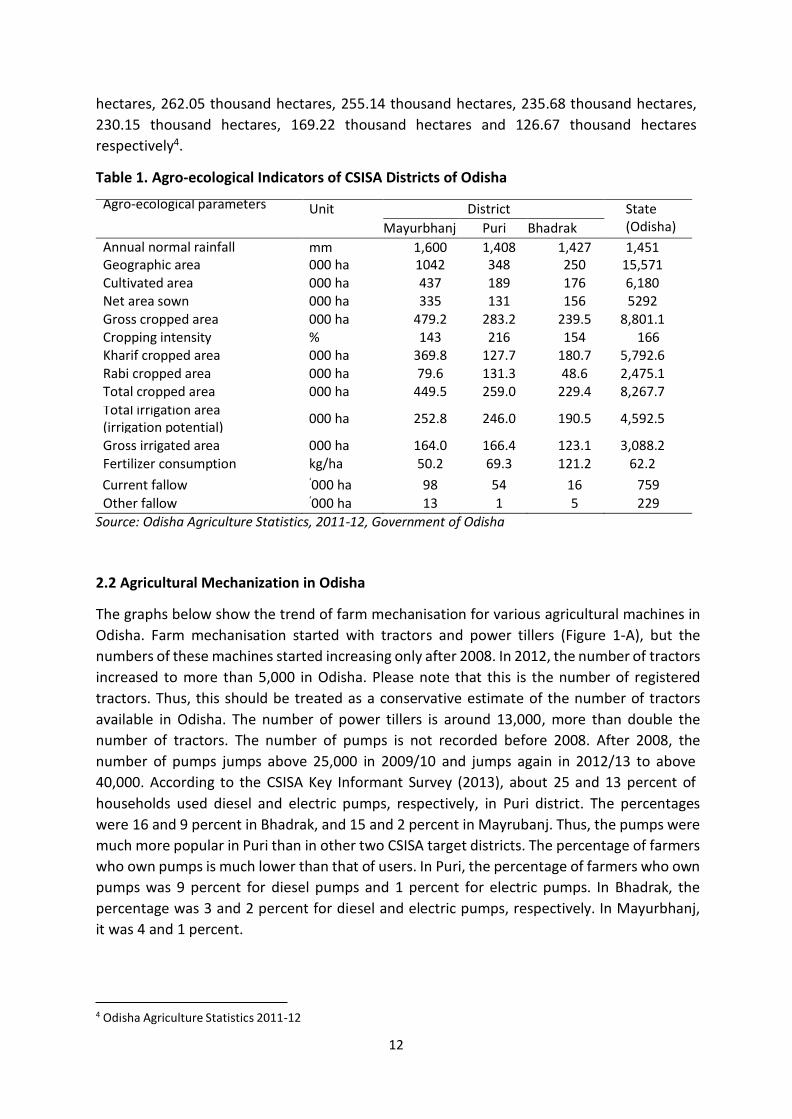
Agro-ecological parameters Unit District State (Odisha) Mayurbhanj Puri Bhadrak
Annual normal rainfall mm 1,600 1,408 1,427 1,451 Geographic area 000 ha 1042 348 250 15,571 Cultivated area 000 ha 437 189 176 6,180 Net area sown 000 ha 335 131 156 5292 Gross cropped area 000 ha 479.2 283.2 239.5 8,801.1 Cropping intensity % 143 216 154 166 Kharif cropped area 000 ha 369.8 127.7 180.7 5,792.6 Rabi cropped area 000 ha 79.6 131.3 48.6 2,475.1 Total cropped area 000 ha 449.5 259.0 229.4 8,267.7 Total irrigation area (irrigation potential)
000 ha 252.8 246.0 190.5 4,592.5
Gross irrigated area 000 ha 164.0 166.4 123.1 3,088.2
Fertilizer consumption kg/ha 50.2 69.3 121.2 62.2
Current fallow ‘000 ha 98 54 16 759
Other fallow ‘000 ha 13 1 5 229 Source: Odisha Agriculture Statistics, 2011-12, Government of Odisha
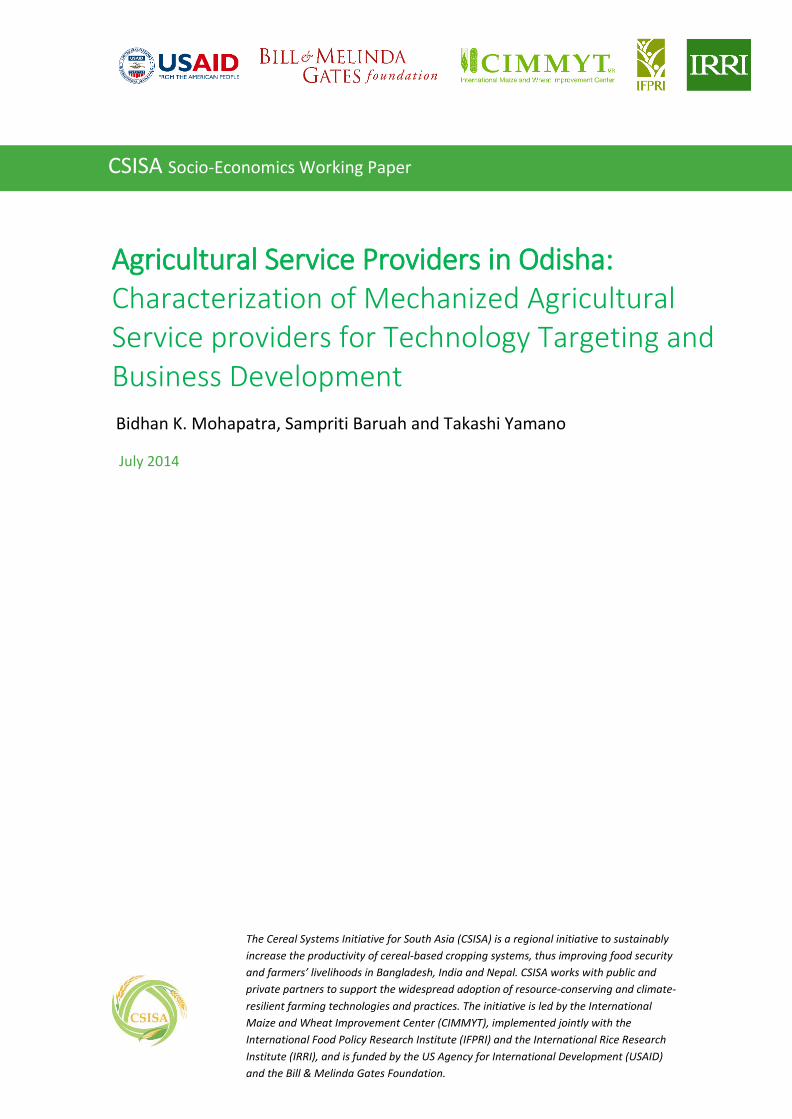
2.2 Agricultural Mechanization in Odisha
The graphs below show the trend of farm mechanisation for various agricultural machines in
Odisha. Farm mechanisation started with tractors and power tillers (Figure 1-A), but the
numbers of these machines started increasing only after 2008. In 2012, the number of tractors
increased to more than 5,000 in Odisha. Please note that this is the number of registered
tractors. Thus, this should be treated as a conservative estimate of the number of tractors
available in Odisha. The number of power tillers is around 13,000, more than double the
number of tractors. The number of pumps is not recorded before 2008. After 2008, the
number of pumps jumps above 25,000 in 2009/10 and jumps again in 2012/13 to above
40,000. According to the CSISA Key Informant Survey (2013), about 25 and 13 percent of
households used diesel and electric pumps, respectively, in Puri district. The percentages
were 16 and 9 percent in Bhadrak, and 15 and 2 percent in Mayrubanj. Thus, the pumps were
much more popular in Puri than in other two CSISA target districts. The percentage of farmers
who own pumps is much lower than that of users. In Puri, the percentage of farmers who own
pumps was 9 percent for diesel pumps and 1 percent for electric pumps. In Bhadrak, the
percentage was 3 and 2 percent for diesel and electric pumps, respectively. In Mayurbhanj,
it was 4 and 1 percent.
4 Odisha Agriculture Statistics 2011-12

13
45000 40000 35000 30000 25000 20000 15000 10000
5000 0
Trend of Farm Mechanisation in Odisha
Tractor Power tiller Pump set
Figure 1-A. Farm Mechanization in Odisha: Tractors, Power Tillers, and Pump sets
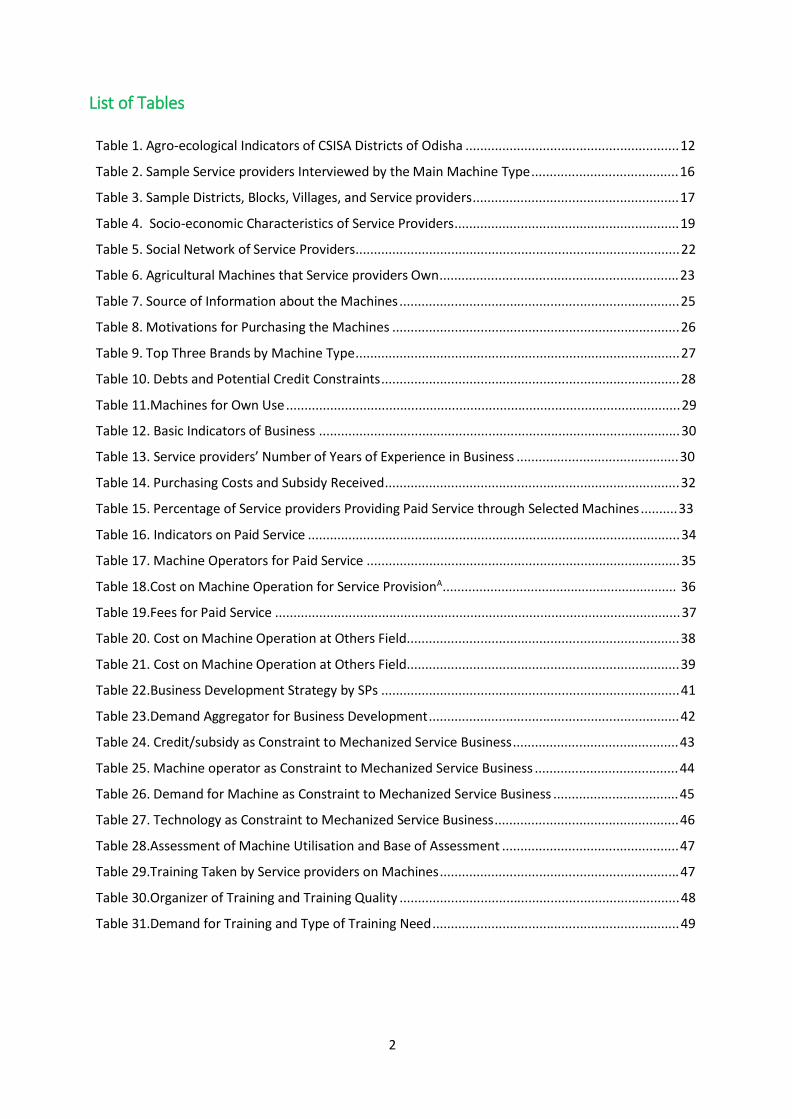
Combine harvesters and paddy transplanters are new in Odisha. The total number of self-
propelled paddy transplanter is just more than 150 in 2012/13, and the number of combine
harvesters is just above 100 (Figure 1-B). There is no doubt that these numbers will increase
significantly increase in coming years. Because of clear popularity of these machines in the
fields.
200
Trend of Farm Mechanisation in Odisha
150
100
50
0
Combine harvester Self propelled transplanter
Figure 1-B. Farm Mechanization in Odisha: Combine Harvester and Self-propelled Transplanters
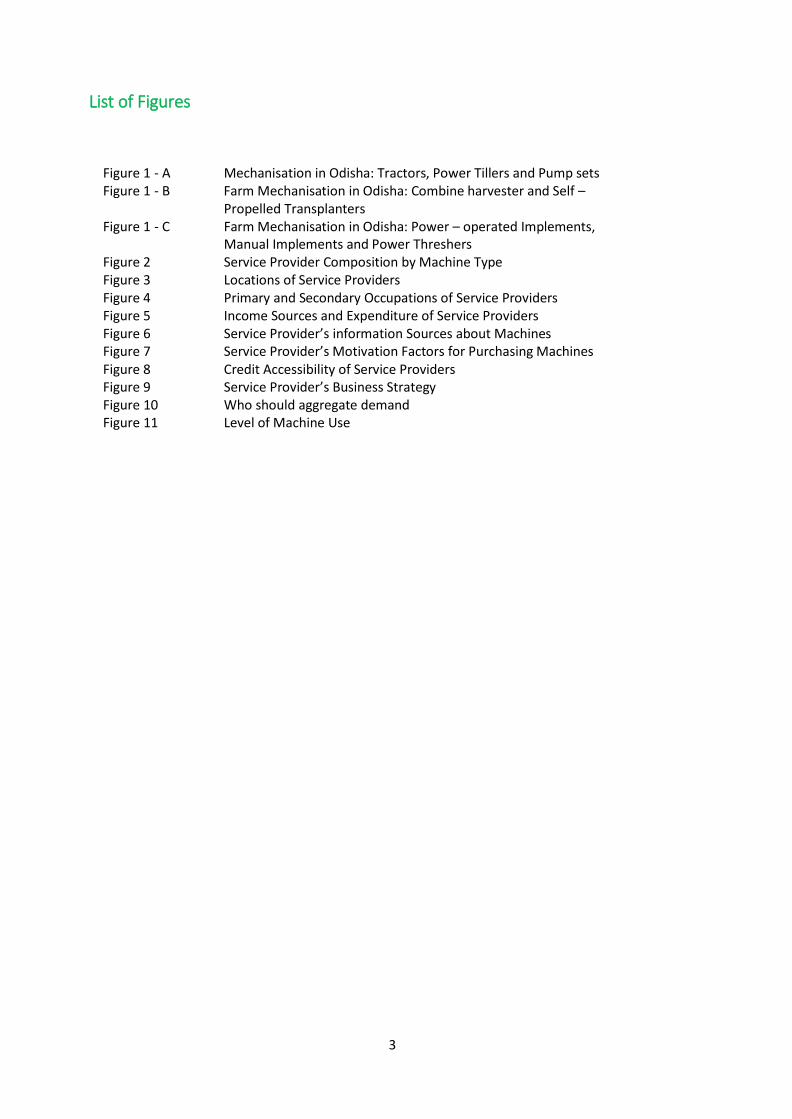
Power-thresher is another machine that has become very popular in recent years. The
number of power-thresher increased from less than 1,000 in 2008/09 to about 5,000 in
2012/13. According to the CSISA Key Informant Survey (2013), it is particularly popular in Puri

14
district. More than 54 percent of the households were considered by the key informants to
be users of Power-threshers. The ownership of the power-thresher was less than 1 percent in
Puri district, suggesting that most of the users relied on service providers.
12000
10000
8000
6000
4000
2000
0
Trend of Farm Mechanisation in Odisha 2007-08 2008-09 2009-10 2010-11 2011-12 2012-13
Power operated implement Manual implements Power thresher
Figure 1-C. Farm Mechanization in Odisha: Power-operated Implements, Manual Implements, and
Power Threshers CSISA Key Informant Survey in Odisha in 2013
In May 2013, a survey of key informants from randomly selected 120 villages of the three
CSISA targeted districts, Puri, Bhadrak, and Puri, in Odisha was conducted (CSISA, 2013). The
results of the key informant survey show that the sample villages and households in the three
districts share similar socio-economic characteristics, although they belong to different agro-
ecological zones. The average distance from the sample villages to the nearest market is about
6 km for all three districts. On average, 63 percent of population was reported to be below
Poverty Line (BPL) card holders. About 12 percent of the households were female-headed
households. On average, 46 percent of the households belonged to Scheduled Castes or
Tribes. The percentage is high in Mayurbhanj at 74 percent.
The average daily wage rate for male agricultural workers during the kharif season was about
Rs. 159. For female agricultural workers, it was about Rs. 135. Female workers were mostly
involved in transplanting rice seedlings and weeding. The survey also asked about the daily
wage rates 10 years ago and found that it was Rs. 71 for male and Rs. 55 for female workers.
Thus, in the nominal term, the wage rates doubled over the last 10 years. However, the rice
output price and other prices also increases. By using the wage-output price ratio, the survey
finds that the ratio increased by about 30 percent for male workers and about 41 percent for
female workers over the last 10 years.
The survey showed different levels of machine use across states. The machines that farmers
commonly used included diesel and electric pumps, 4-wheel tractors, pesticide sprayers, and
rice threshers. Farmers in Puri used more machines than farmers in Bhadrak and Mayurbhanj.

15
Except pesticide sprayers, few farmers owned agricultural machines. Instead, they rented
machines or relied on service providers. Rice threshers were becoming popular as they were
less labour intensive than manual threshing. In 22 percent of the sample villages, farmers
used rice threshers.
In about 43 percent of the sample villages, the key informants indicated that it was very
difficult to hire male agricultural workers during the kharif season. The percentage for hiring
female agricultural workers was about 36 percent. The percentages were higher in Puri at
63percent for male workers and 57 percent for female workers. In Bhadrak, the labour
availability was better: only in 20 percent of the sample villages in Bhadrak, farmers face
difficulties in hiring male as well as female agricultural workers.
Therefore, it is clear that farmers are relying on service providers to use machines on their
farms. The rest of the report describes how service providers in Odisha serve farmers and
identifies constraints that they face in their business.

16
3. Sampling
To randomly select service providers, a list of agricultural service providers5 was obtained
from State Government of Odisha for three CSISA districts. The list was categorized/stratified
on the basis of machines (paddy transplanter, seed drill, axial flow thresher, reaper, combine
harvester, tractor, etc.) that the service providers own. Six major machines, through which
services were provided by machine owners, were chosen for sampling. The six machines were
chosen because they are targeted in the CSISA project for service provision. The six machines
under study include paddy transplanter, thresher, tractor6, reaper, seed drill and combine
harvester.
As seen in Table 2, from each of stratified list of service providers, sixty samples were
randomly selected for each the following four machine type: paddy transplanters (60 out of
83), threshers (60 out of 109), tractors (60 out of 376), and reapers (60 out of 213). For
combine harvesters and seed drills, however, the total number of the samples in each group
was less than sixty. Thus, all listed service providers, forty-three for combine harvester and
eight for seed drills, were chosen. As a result, a total of 291 machine owners/service providers
were selected for the present study. Out of the 291, 10 service providers were not available,
reducing the number of service providers interviewed to 281 (Table 2).
Table 2. Sample Service providers Interviewed by the Main Machine Type
Major Machine for Service Provision
Total No. of Machine
Sample (service providers) selected
Number of service providers interviewed
Owners/SPs for interview
Paddy Transplanter 83 60 58
Thresher 109 60 59
Tractor 376 60 56
Reaper 213 60 59
Seed drill 8 8 8
Combine harvester 43 43 41
Total 832 291 281
5Not all farmers listed as service providers worked as service providers for other farmers. Some of them use their machines for their production only. Bur all are machine owners. 6 It was assumed and observed by the scientists and technicians that although there are many tractors available in field, many of those are not used for agriculture purposes and during agriculture pick season, on time availability of tractors is very difficult. Although the CSISA project promotes technologies that require machines that are not included in the list of six, such as laser land levelling, they were excluded because very few or no SPs provide such services in Odisha.
17
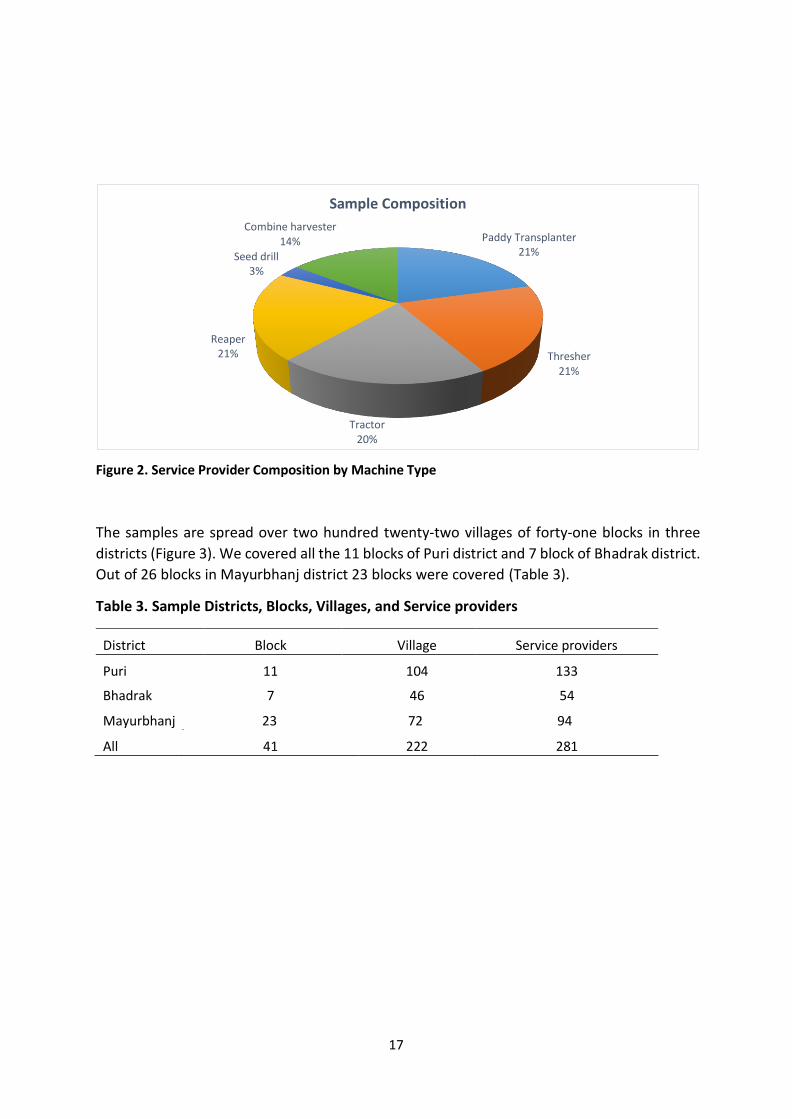
Sample Composition
Combine harvester 14%
Seed drill 3%
Reaper 21%
Paddy Transplanter
21%
Thresher 21%
Tractor 20%
Figure 2. Service Provider Composition by Machine Type
The samples are spread over two hundred twenty-two villages of forty-one blocks in three
districts (Figure 3). We covered all the 11 blocks of Puri district and 7 block of Bhadrak district.
Out of 26 blocks in Mayurbhanj district 23 blocks were covered (Table 3).
Table 3. Sample Districts, Blocks, Villages, and Service providers
District
Block
Village
Service providers
Puri
11
104
133
Bhadrak 7 46 54
Mayurbhanj 23 72 94
All 41 222 281

18
Mapping of sample service providers:
Figure 3. Locations of Service providers
A structured questionnaire was developed for computer assisted personal interview software,
called Surveybe, for data collection. The questionnaire was divided into several sections to
capture the study objectives. Six enumerators were trained for 3 days to collect data in April
2014. The questionnaire was pre-tested, and mock sessions for data collection were held
simultaneously before finalizing the questionnaire. During the interview practice and
pretesting, unclear questions were clarified and revised, and unnecessary questions were
eliminated. To make the interview process easier and short, word typing and open-ended
questions were avoided as much as possible. Instead, pre-coded answers presented in drop-
down menus were used. Care was taken to improve enumerators’ understanding of the
questions and the philosophy behind the questions.
The interviews were conducted in four weeks, from the last week of April to the third week of May 2014. Because most of the service providers were busy during the survey period, enumerators needed to make efforts to set appointments with sample service providers. At the end, interviews with 281 service providers were successfully implemented.

19
4. Service Providers
Socio-economic Characteristics
Out of the 281 sample service providers, 7.5 percent of them are female service providers.
This suggests that women have entered into mechanized service providing business in
agriculture. About 53 percent of the service providers are in the age group of 25-40 years.
Young service providers are expected to provide services for many years to come. Most of the
service providers are reasonably educated: 76 percent of the service providers are qualified
from high school to graduate (high school 33.5 percent, higher secondary 21 percent and
graduate 21.7 percent). Thus, educated people (around 23 percent graduates) are engaged in
mechanized service business in agriculture. Only one percent of the service providers have no
schooling, and 1.8 percent of them have attended adult literacy programs. The latter shows
their curiosity towards education despite their lack of formal education. Regarding caste of
the service providers, about 10 percent of the service providers are from scheduled category
(SCs and STs). Awareness among them is required to take the advantages of various schemes
for mechanized service for their socio-economic development. The majority of the service
providers, about 61 percent, belong to the general category, while the remaining 29 percent
belongs to the Other Backward Class (OBC).
Table 4. Socio-economic Characteristics of Service Providers
Indicator Description Figure (%)
Gender Male 92.5 Female 7.5
Age Group
25 years old or younger 2.5 Between 25 and 40 52.7 Between 40 and 60 38.4 60 years old or older 6.4
Education
No schooling 1.0 Primary 7.1 Upper Primary 9.3 High School 33.5 Higher Secondary 21.0 Graduate 21.7 Post Graduate 4.6 Adult literacy Program 1.8
Religion
Hindu 98.9 Muslim 1.1 Christian 0 Sikh 0 Other 0
Caste
General 60.9 SC 4.6 ST 5 OBC 28.8 No caste 0.7
20
Occupation of the SPs (%)
60 51.3 53
50 36.3
40
30 18.2
20 11 9.3 8.9
10 1.3 5.7
0.7 1.8 2.5
Primary Occupation
Secondary Occupation
Agr
icu
ltu
re
Agr
i-b
usi
ne
ss/M
ech
anis
ed
Se
rvic
e P
rovi
sio
n
No
n-a
gri-
bu
sin
ess
Pri
vate
ser
vice
Go
vern
men
t Se
rvic
e
Oth
er
Agr
i-b
usi
ne
ss/M
ech
anis
ed
Se
rvic
e P
rovi
sio
n
Agr
icu
ltu
re
No
n-a
gri-
bu
sin
ess
Go
vern
men
t Se
rvic
e
Pri
vate
ser
vice
Oth
er
Major Occupation
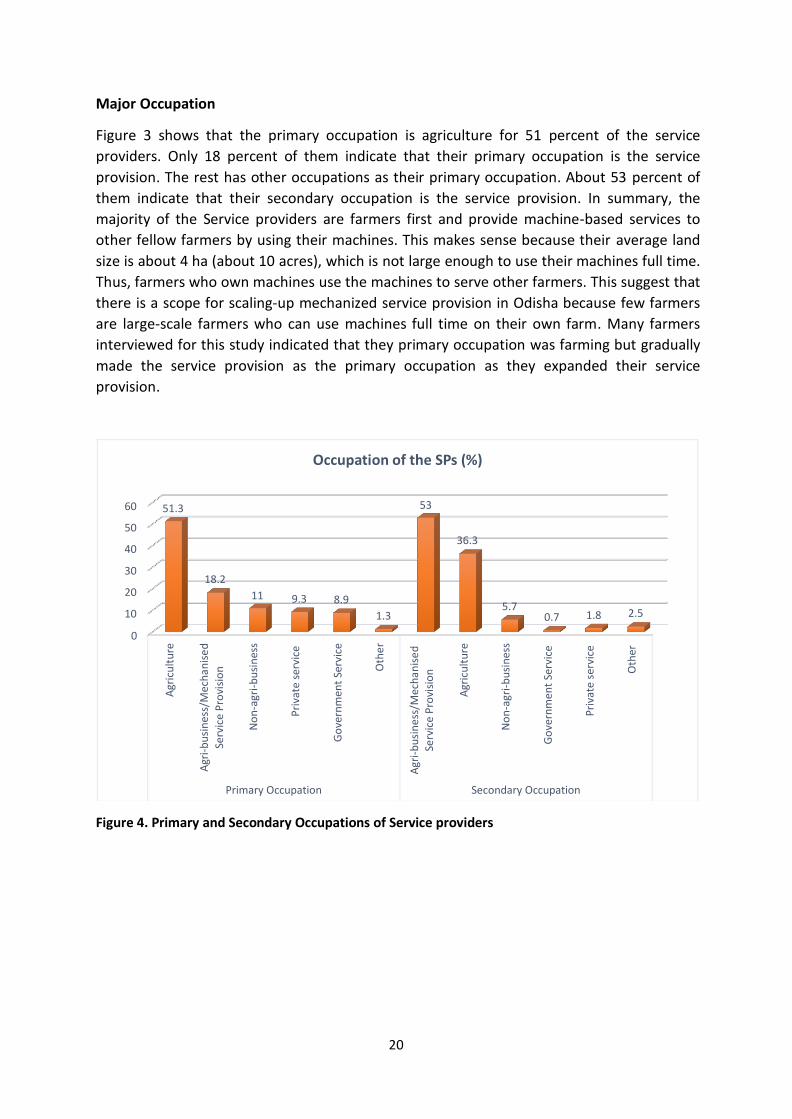
Figure 3 shows that the primary occupation is agriculture for 51 percent of the service
providers. Only 18 percent of them indicate that their primary occupation is the service
provision. The rest has other occupations as their primary occupation. About 53 percent of
them indicate that their secondary occupation is the service provision. In summary, the
majority of the Service providers are farmers first and provide machine-based services to
other fellow farmers by using their machines. This makes sense because their average land
size is about 4 ha (about 10 acres), which is not large enough to use their machines full time.
Thus, farmers who own machines use the machines to serve other farmers. This suggest that
there is a scope for scaling-up mechanized service provision in Odisha because few farmers
are large-scale farmers who can use machines full time on their own farm. Many farmers
interviewed for this study indicated that they primary occupation was farming but gradually
made the service provision as the primary occupation as they expanded their service
provision.
0
Figure 4. Primary and Secondary Occupations of Service providers

21
Agr
icu
ltu
re
Agr
i-b
usi
ne
ss/M
ech
aniz
ed
Serv
ice
Pro
visi
on
No
n-a
gri-
bu
sin
ess
Go
vern
men
t Se
rvic
e
Pri
vate
ser
vice
Oth
er
Co
nsu
mp
tio
n E
xpen
dit
ure
(F
oo
d)
Co
nsu
mp
tio
n E
xpen
dit
ure
(N
on
-Fo
od
) Savi
ngs
Inve
stm
ent
Income and Expenditure
It was found that mechanized service provision contributes about 30 percent to the income
of the SP. This indicates that the service provision provide a significant share of their income.
Still, agriculture provides the basic livelihood of the service providers: 43 percent of the total
income comes from agriculture. They are also involved in some sort of business – non-
agriculture which contributes around 12 percent. So far as expenditure is concerned,
consumption expenditure is around 3/4th of total outflow. Unlike normal consumption
practice of spending fairly more on food, service providers have shifted their consumption
practice from food to non-food. Still food consumption is around 43 percent. About 1/4th of
total outflow is saved and invested.
Income and Expenditure (%)
42.9 45 40 35 30 25 20 15 10
5 0
28.9
12.3
6.5 5.9
3.5
42.8 32.5
15.5
9.2
Income (in-flow) Expenditure (Out-flow)
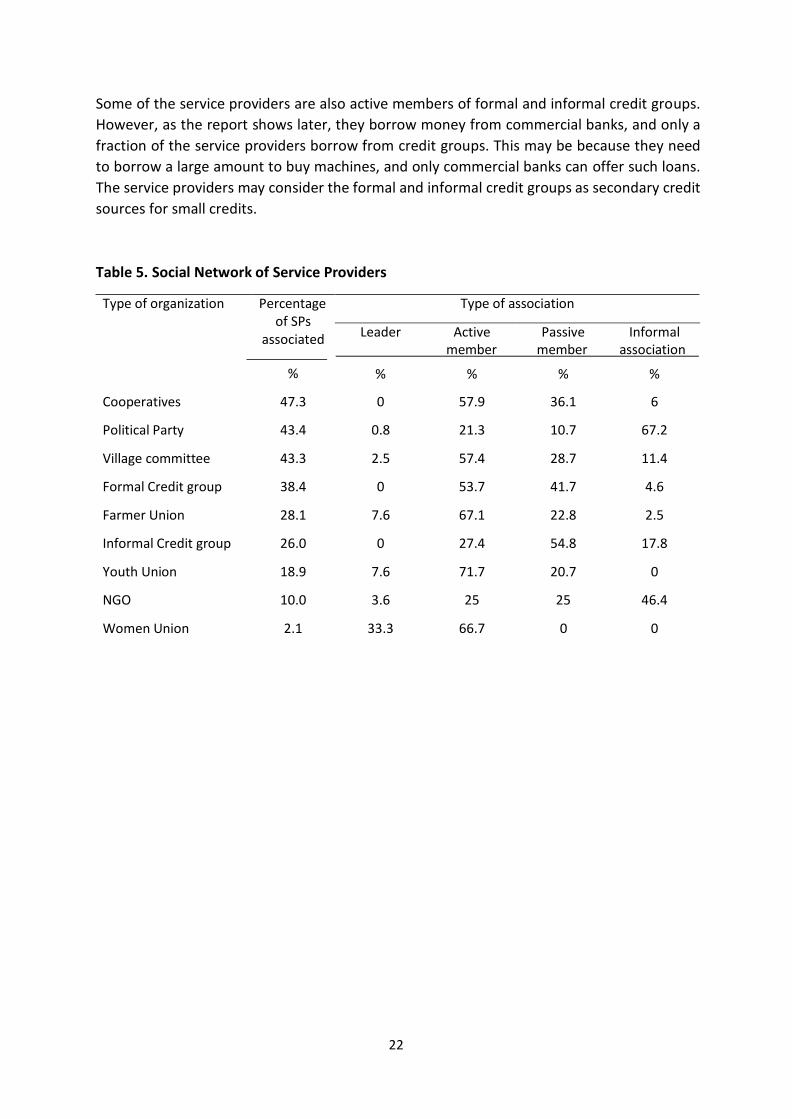
Figure 5. Income Sources and Expenditure of Service providers Social Networking: The SPs are actively engaged in social networking (Table 5). The active
social network may help them to conduct their service provision business and cope with hard
times. Percentage of service providers associated with cooperatives, political parties, village
committee, formal credit group, is high at 47.3, 43.4, 43.3, and 38.4 percent, respectively.
Understandably, many service providers who are associated with cooperatives, village
committees, and farmer unions are active members in these groups. But they have only
informal associations with political parties.
Although the over-all percentage of the service providers who are associated with Youth
Union and Women Union is low, most of those who are associated with these unions are
either leaders or active members. Thus, this indicates that young and women service
providers are leading their age and gender groups.
22
of SPs associated
member member association
% % % % %
Cooperatives 47.3 0 57.9 36.1 6
Political Party 43.4 0.8 21.3 10.7 67.2
Village committee 43.3 2.5 57.4 28.7 11.4
Formal Credit group 38.4 0 53.7 41.7 4.6
Farmer Union 28.1 7.6 67.1 22.8 2.5
Informal Credit group 26.0 0 27.4 54.8 17.8
Youth Union 18.9 7.6 71.7 20.7 0
NGO 10.0 3.6 25 25 46.4
Women Union 2.1 33.3 66.7 0 0
Some of the service providers are also active members of formal and informal credit groups.
However, as the report shows later, they borrow money from commercial banks, and only a
fraction of the service providers borrow from credit groups. This may be because they need
to borrow a large amount to buy machines, and only commercial banks can offer such loans.
The service providers may consider the formal and informal credit groups as secondary credit
sources for small credits.
Table 5. Social Network of Service Providers
Type of organization Percentage Type of association
Leader Active Passive Informal
23
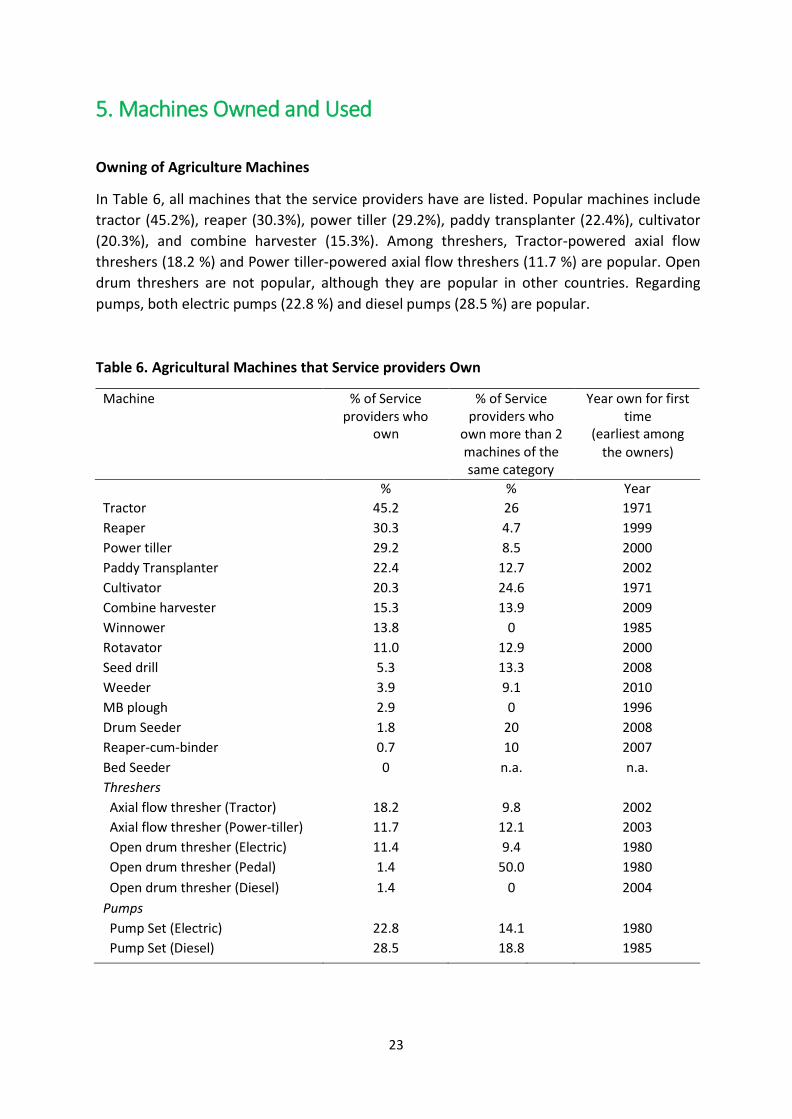
5. Machines Owned and Used
Owning of Agriculture Machines
In Table 6, all machines that the service providers have are listed. Popular machines include
tractor (45.2%), reaper (30.3%), power tiller (29.2%), paddy transplanter (22.4%), cultivator
(20.3%), and combine harvester (15.3%). Among threshers, Tractor-powered axial flow
threshers (18.2 %) and Power tiller-powered axial flow threshers (11.7 %) are popular. Open
drum threshers are not popular, although they are popular in other countries. Regarding
pumps, both electric pumps (22.8 %) and diesel pumps (28.5 %) are popular.
Table 6. Agricultural Machines that Service providers Own
Machine % of Service providers who
own
% of Service providers who
own more than 2 machines of the
Year own for first time
(earliest among the owners)
same category
% % Year
Tractor 45.2 26 1971
Reaper 30.3 4.7 1999
Power tiller 29.2 8.5 2000
Paddy Transplanter 22.4 12.7 2002
Cultivator 20.3 24.6 1971
Combine harvester 15.3 13.9 2009
Winnower 13.8 0 1985
Rotavator 11.0 12.9 2000
Seed drill 5.3 13.3 2008
Weeder 3.9 9.1 2010
MB plough 2.9 0 1996
Drum Seeder 1.8 20 2008
Reaper-cum-binder 0.7 10 2007
Bed Seeder
Threshers
Axial flow thresher (Tractor)
0
18.2
n.a.
9.8
n.a.
2002
Axial flow thresher (Power-tiller) 11.7 12.1 2003
Open drum thresher (Electric) 11.4 9.4 1980
Open drum thresher (Pedal) 1.4 50.0 1980
Open drum thresher (Diesel) 1.4 0 2004
Pumps
Pump Set (Electric)
22.8
14.1
1980
Pump Set (Diesel) 28.5 18.8 1985
24
The table also shows the earliest year that the service providers owned the machine for the
first time. According to the table, tractors and cultivators were first owned in 1971.
Winnowers were first owned in 1985. Power tillers and paddy transplanters were owned in
the early 2000s. Seed drills and drum-seeders are among the newest machines owned by the
Service providers. Among threshers, open drum threshers were owned first in the 1980s. But
axial flow threshers which were owned later in the early 2000s become more popular.
Source of Information about the Machines
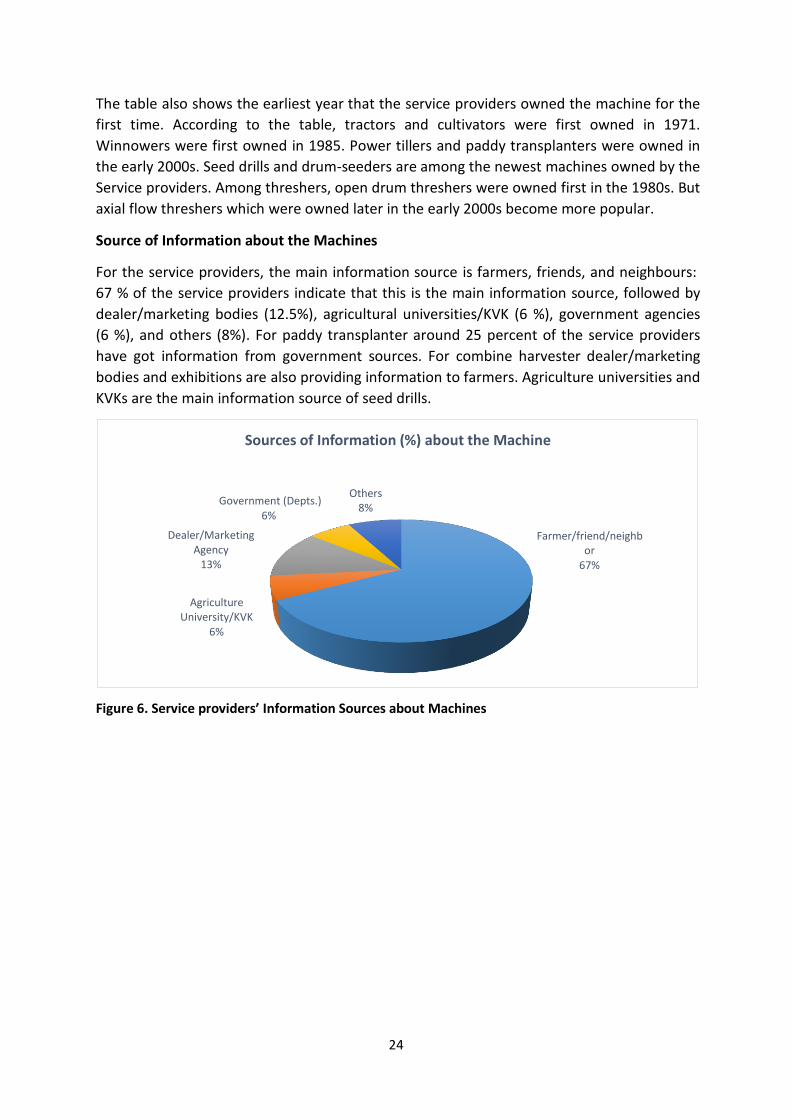
For the service providers, the main information source is farmers, friends, and neighbours:
67 % of the service providers indicate that this is the main information source, followed by
dealer/marketing bodies (12.5%), agricultural universities/KVK (6 %), government agencies
(6 %), and others (8%). For paddy transplanter around 25 percent of the service providers
have got information from government sources. For combine harvester dealer/marketing
bodies and exhibitions are also providing information to farmers. Agriculture universities and
KVKs are the main information source of seed drills.
Sources of Information (%) about the Machine
Government (Depts.) 6%
Dealer/Marketing Agency
13%
Others 8%
Farmer/friend/neighb
or 67%
Agriculture
University/KVK 6%
Figure 6. Service providers’ Information Sources about Machines
25
Table 7. Source of Information about the Machines
Machine Source of Information - you first get to know about the machine
Farmer
friends or
neighbors
Agriculture
University
Dealer
Marketing
Government Others
% % % % % Paddy Transplanter 61.9 12.7 7.94 12.7 4.76 Seed Drill 71.43 21.43 7.14 0 0 Combine Harvester 60.47 4.65 16.28 0 18.6 Thresher 65.05 2.91 9.71 10.68 11.65 Tractor 73.17 4.07 22.76 0 0 Reaper 67.44 6.98 3.49 9.3 12.79 Overall 67.13 6.25 12.5 6.25 7.87
Note: Others include Exhibition, Newspaper, Kisan Mela, and others.
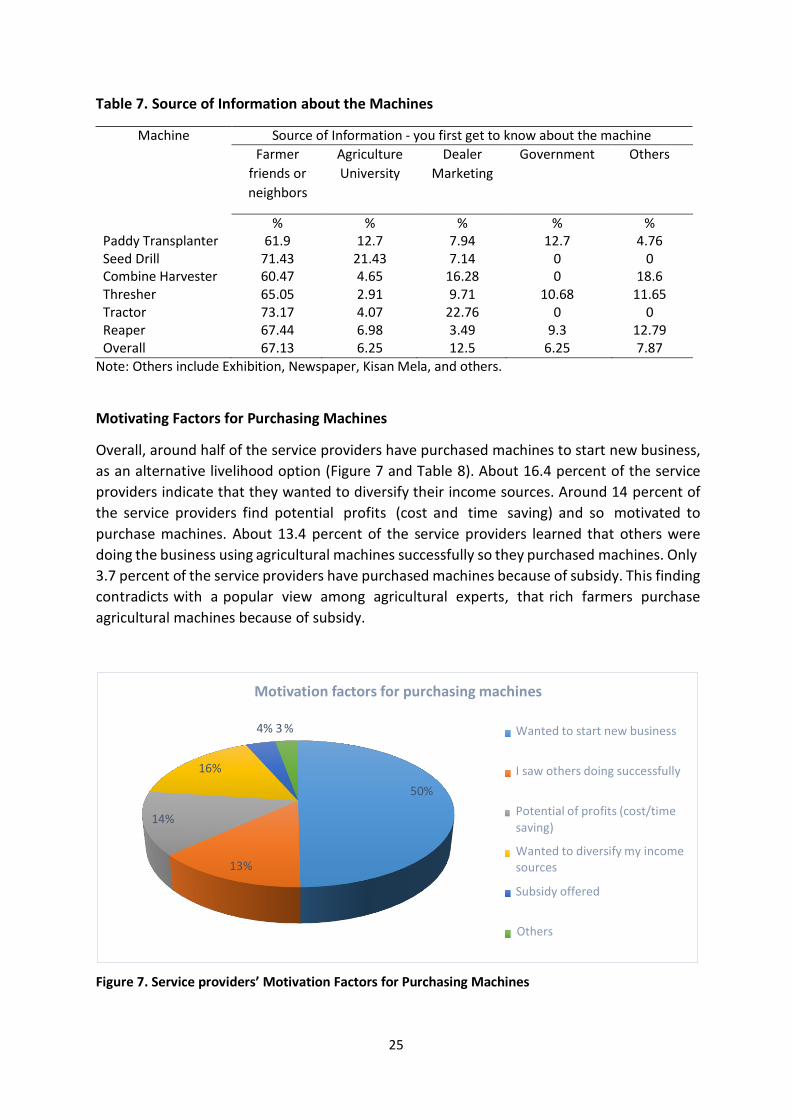
Motivating Factors for Purchasing Machines
Overall, around half of the service providers have purchased machines to start new business,
as an alternative livelihood option (Figure 7 and Table 8). About 16.4 percent of the service
providers indicate that they wanted to diversify their income sources. Around 14 percent of
the service providers find potential profits (cost and time saving) and so motivated to
purchase machines. About 13.4 percent of the service providers learned that others were
doing the business using agricultural machines successfully so they purchased machines. Only
3.7 percent of the service providers have purchased machines because of subsidy. This finding
contradicts with a popular view among agricultural experts, that rich farmers purchase
agricultural machines because of subsidy.
Motivation factors for purchasing machines
4% 3 % Wanted to start new business
14%
16%
13%
50%
I saw others doing successfully
Potential of profits (cost/time
saving)
Wanted to diversify my income sources
Subsidy offered
Others
Figure 7. Service providers’ Motivation Factors for Purchasing Machines
26
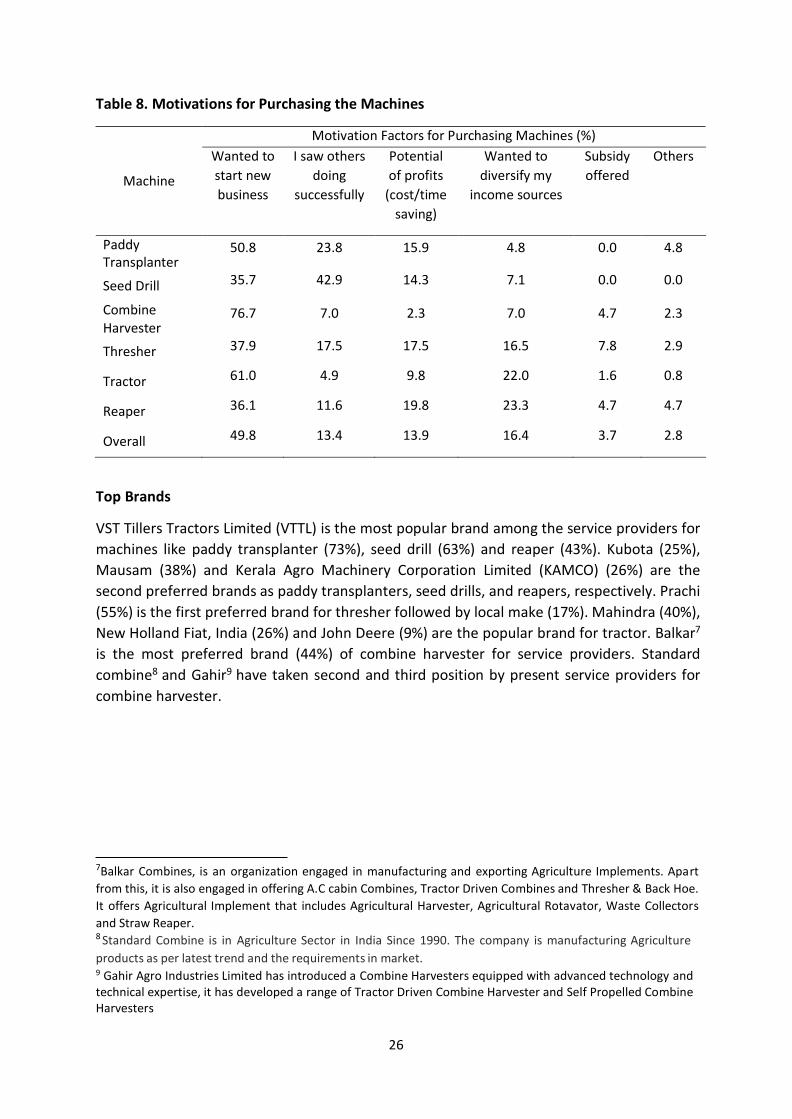
Table 8. Motivations for Purchasing the Machines
Motivation Factors for Purchasing Machines (%)
Machine
Wanted to
start new
business
I saw others
doing
successfully
Potential
of profits
(cost/time
saving)
Wanted to
diversify my
income sources
Subsidy
offered
Others
Paddy Transplanter
50.8 23.8 15.9 4.8 0.0 4.8
Seed Drill 35.7 42.9 14.3 7.1 0.0 0.0
Combine 76.7 7.0 2.3 7.0 4.7 2.3 Harvester
Thresher 37.9 17.5 17.5 16.5 7.8 2.9
Tractor 61.0 4.9 9.8 22.0 1.6 0.8
Reaper 36.1 11.6 19.8 23.3 4.7 4.7
Overall 49.8 13.4 13.9 16.4 3.7 2.8
Top Brands
VST Tillers Tractors Limited (VTTL) is the most popular brand among the service providers for
machines like paddy transplanter (73%), seed drill (63%) and reaper (43%). Kubota (25%),
Mausam (38%) and Kerala Agro Machinery Corporation Limited (KAMCO) (26%) are the
second preferred brands as paddy transplanters, seed drills, and reapers, respectively. Prachi
(55%) is the first preferred brand for thresher followed by local make (17%). Mahindra (40%),
New Holland Fiat, India (26%) and John Deere (9%) are the popular brand for tractor. Balkar7
is the most preferred brand (44%) of combine harvester for service providers. Standard
combine8 and Gahir9 have taken second and third position by present service providers for
combine harvester.
7Balkar Combines, is an organization engaged in manufacturing and exporting Agriculture Implements. Apart
from this, it is also engaged in offering A.C cabin Combines, Tractor Driven Combines and Thresher & Back Hoe.
It offers Agricultural Implement that includes Agricultural Harvester, Agricultural Rotavator, Waste Collectors
and Straw Reaper.
8 Standard Combine is in Agriculture Sector in India Since 1990. The company is manufacturing Agriculture
products as per latest trend and the requirements in market. 9 Gahir Agro Industries Limited has introduced a Combine Harvesters equipped with advanced technology and technical expertise, it has developed a range of Tractor Driven Combine Harvester and Self Propelled Combine Harvesters

27
Table 9. Top Three Brands by Machine Type
Machine First Brand Second Brand Third Brand
Paddy Transplanter Seed Drill
VTTL (73%)
VTTL (63%)
Kubota (25%)
Mausam (38%)
Others (2%)
n.a.
Combine harvester
Balkar (44%) Standard (15%) Gahir (12%)
Thresher
Tractor
Reaper
Prachi (55%)
Mahindra (40%)
VTTL (43%)
Others-local (17%)
New Holland (11%)
KAMCO (26%)
VST (10%) John
Deere (9%)
Kubota (10%)
Credit Accessibility
Access to credit is very important for service providers to start and run the business. All the
service providers have borrowed some amount from some sources. At the time of the
interview, most of the service providers (76.5%) had outstanding debts, borrowed from
bank with an average loan of Rs.319,649 (about USD 5,300). About 56.2 percent of the
service providers expect they can borrow more than the current average loan amount from
the same source. Next to bank, friend (13.9%) and family (13.2%) are the dependable
sources of credit. But the borrowing amount is not high, even less than Rs.50,000 (about
USD 833). The service providers have not preferred microcredit organization for loan. But
some service providers (10%) say they can borrow from this source in difficult situation.
Credit Accessibility by SPs (%)
76.5
80
70
56.2 60
50
40
30
20 10
10 4.6
0
12.5 14.6
33.1
13.2 13.9
29.5
5
1.4
Bank Microcredit organisation
Government Family Friend Others
SPs (%) currently in loan from this source SPs (%) can also borrow from this source
Figure 8. Credit Accessibility of Service providers
28
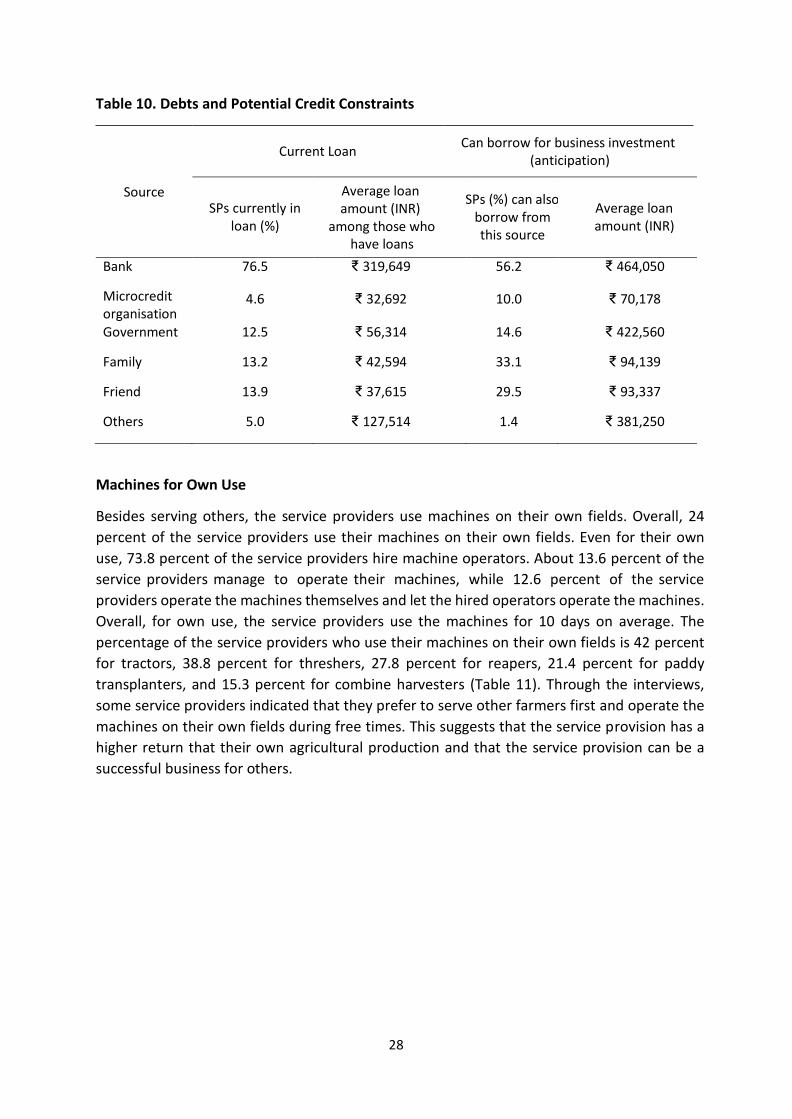
Table 10. Debts and Potential Credit Constraints
Current Loan Can borrow for business investment
(anticipation)
Source
SPs currently in loan (%)
Average loan amount (INR)
among those who have loans
SPs (%) can also borrow from this source
Average loan amount (INR)
Bank 76.5 ₹ 319,649 56.2 ₹ 464,050
Microcredit organisation
4.6
₹ 32,692
10.0
₹ 70,178
Government 12.5 ₹ 56,314 14.6 ₹ 422,560
Family 13.2 ₹ 42,594 33.1 ₹ 94,139
Friend 13.9 ₹ 37,615 29.5 ₹ 93,337
Others 5.0 ₹ 127,514 1.4 ₹ 381,250
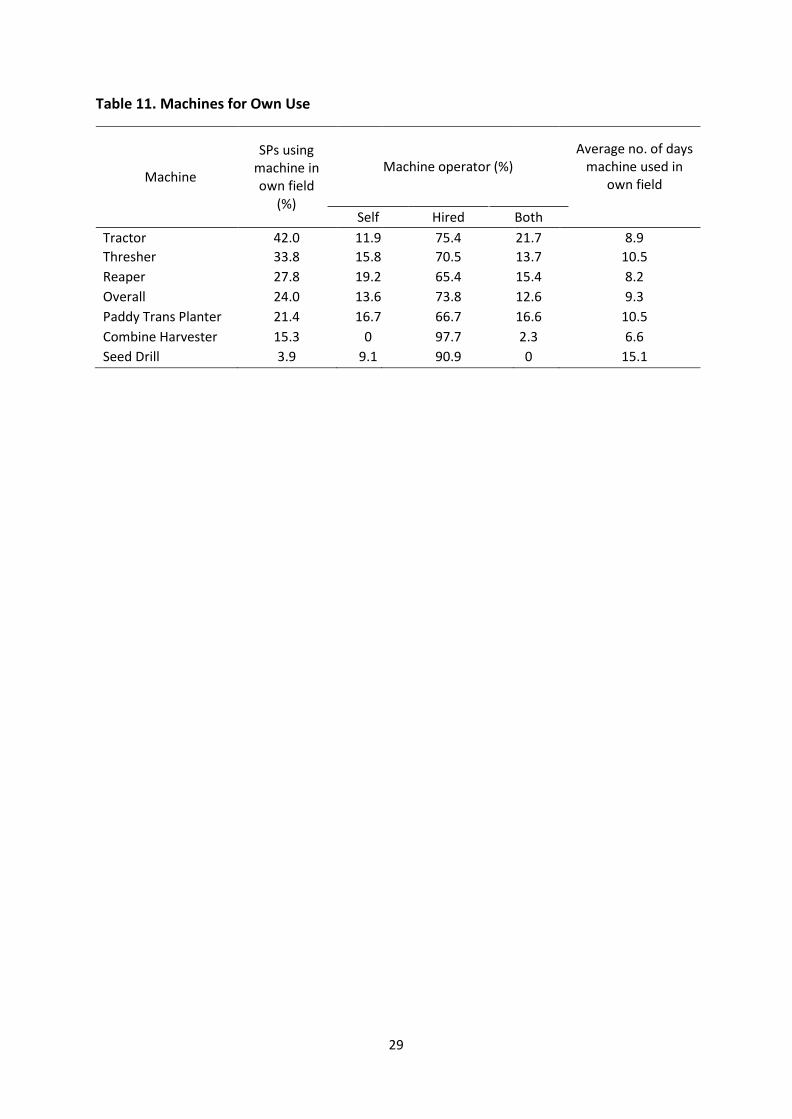
Machines for Own Use
Besides serving others, the service providers use machines on their own fields. Overall, 24
percent of the service providers use their machines on their own fields. Even for their own
use, 73.8 percent of the service providers hire machine operators. About 13.6 percent of the
service providers manage to operate their machines, while 12.6 percent of the service
providers operate the machines themselves and let the hired operators operate the machines.
Overall, for own use, the service providers use the machines for 10 days on average. The
percentage of the service providers who use their machines on their own fields is 42 percent
for tractors, 38.8 percent for threshers, 27.8 percent for reapers, 21.4 percent for paddy
transplanters, and 15.3 percent for combine harvesters (Table 11). Through the interviews,
some service providers indicated that they prefer to serve other farmers first and operate the
machines on their own fields during free times. This suggests that the service provision has a
higher return that their own agricultural production and that the service provision can be a
successful business for others.
29
Table 11. Machines for Own Use
Machine
SPs using machine in own field
Machine operator (%)
Average no. of days machine used in
own field
(%)
Self
Hired
Both
Tractor 42.0 11.9 75.4 21.7 8.9
Thresher 33.8 15.8 70.5 13.7 10.5
Reaper 27.8 19.2 65.4 15.4 8.2
Overall 24.0 13.6 73.8 12.6 9.3
Paddy Trans Planter 21.4 16.7 66.7 16.6 10.5
Combine Harvester 15.3 0 97.7 2.3 6.6
Seed Drill 3.9 9.1 90.9 0 15.1
30
6. Services Provided – cost, coverage, and business strategy
General Business Practice
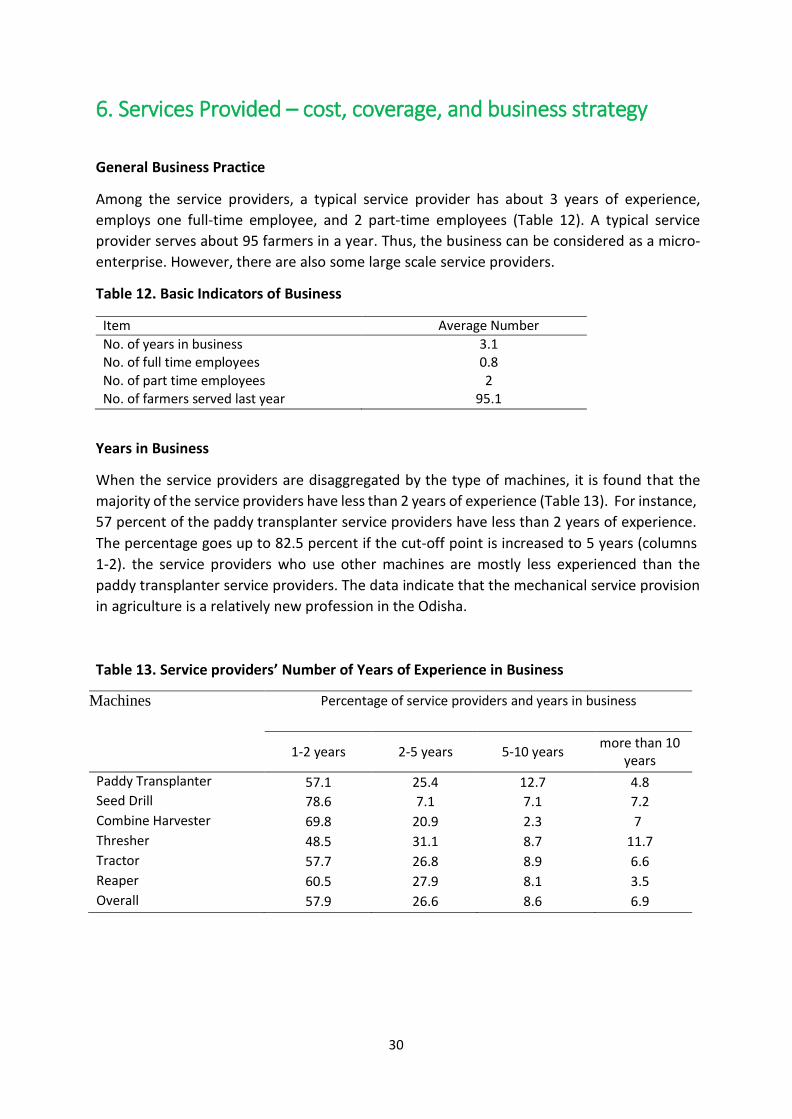
Among the service providers, a typical service provider has about 3 years of experience,
employs one full-time employee, and 2 part-time employees (Table 12). A typical service
provider serves about 95 farmers in a year. Thus, the business can be considered as a micro-
enterprise. However, there are also some large scale service providers.
Table 12. Basic Indicators of Business
Item Average Number No. of years in business 3.1 No. of full time employees 0.8 No. of part time employees 2 No. of farmers served last year 95.1
Years in Business
When the service providers are disaggregated by the type of machines, it is found that the
majority of the service providers have less than 2 years of experience (Table 13). For instance,
57 percent of the paddy transplanter service providers have less than 2 years of experience.
The percentage goes up to 82.5 percent if the cut-off point is increased to 5 years (columns
1-2). the service providers who use other machines are mostly less experienced than the
paddy transplanter service providers. The data indicate that the mechanical service provision
in agriculture is a relatively new profession in the Odisha. Table 13. Service providers’ Number of Years of Experience in Business
Machines Percentage of service providers and years in business
1-2 years
2-5 years
5-10 years more than 10
years
Paddy Transplanter 57.1 25.4 12.7 4.8
Seed Drill 78.6 7.1 7.1 7.2
Combine Harvester 69.8 20.9 2.3 7
Thresher 48.5 31.1 8.7 11.7
Tractor 57.7 26.8 8.9 6.6
Reaper 60.5 27.9 8.1 3.5
Overall 57.9 26.6 8.6 6.9
31
Purchase and Subsidy
As explained in Section 2, the Odisha government provides subsidy to farmers to buy
agricultural machines. Subsidies are specified for different machines, covering a fixed share
of the total purchase cost with an upper limit for a specific type of machines. Here is the
summary of the subsidy schedules for the six machines that are examined in this report (see
Appendix for other machines):
Paddy Transplanters (riding type): 75 % limited to Rs. 5,00,000
Paddy Transplanters (walk behind): 75 % limited to Rs. 1,50,000
Seed Drills: 75 % limited to Rs. 45,000
Combine Harvesters (Self-propelled): 50 % limited to 6 Lakh
Threshers (Axial flow threshers): 50 % limited to Rs. 70,000
Power Threshers (All types): 50 % limited to Rs. 24,000
Tractors: 50 % limited to Rs. 90,000
Reapers (paddy): 50 % limited to Rs. 80,000
In the service provider survey, questions were asked about their purchase of the machine that
they purchased most recently and the subsidy that they received on the purchase. Regarding
the six types of the machined focused in this report, the survey finds that 87 percent of the
service providers received subsidy when they purchased the latest machine (Table 14). On
average, the subsidy covers about 36 percent of the purchase cost among those who received
the subsidy. However, the coverage ranges from 20 percent for tractors to 62 percent of
paddy transplanters. Thus, the data need to be disaggregated by the type of the machines.
For paddy transplanters, the average price of the machines is about 2 Lakh (USD 3,333). All of
the service providers who purchased paddy transplanters received subsidy. The subsidy
covers about 62 percent of the cost, although the subsidy is allowed for 75 percent of the cost
limited to Rs. 5,00,000 for riding types and Rs. 1,50,000 for walk behind types. Thus, it seems
that some machines are more expensive than these limits. The average amount of the subsidy
they received is about 1.2 Lakh (USD 2,023).
All of service providers who purchased combined harvesters also received subsidy, although
the subsidy covers only 25 percent of the purchase cost. However, in terms of the absolute
amount, the amount they received is high at about four lakh (USD 6,547) per machine because
the cost of the machine is high at about 16 Lakh (about USD 27,000).
Threshes and reapers cost about one lakh or less, and more than 90 percent of the service
providers received subsidy. Seed drills are cheaper than other machines considered in this
report. The average cost is Rs. 35,857 (about USD 600). The proportion of service providers
who received subsidy is low at 43 percent, and the subsidy covers 47percent for those who
received the subsidy.
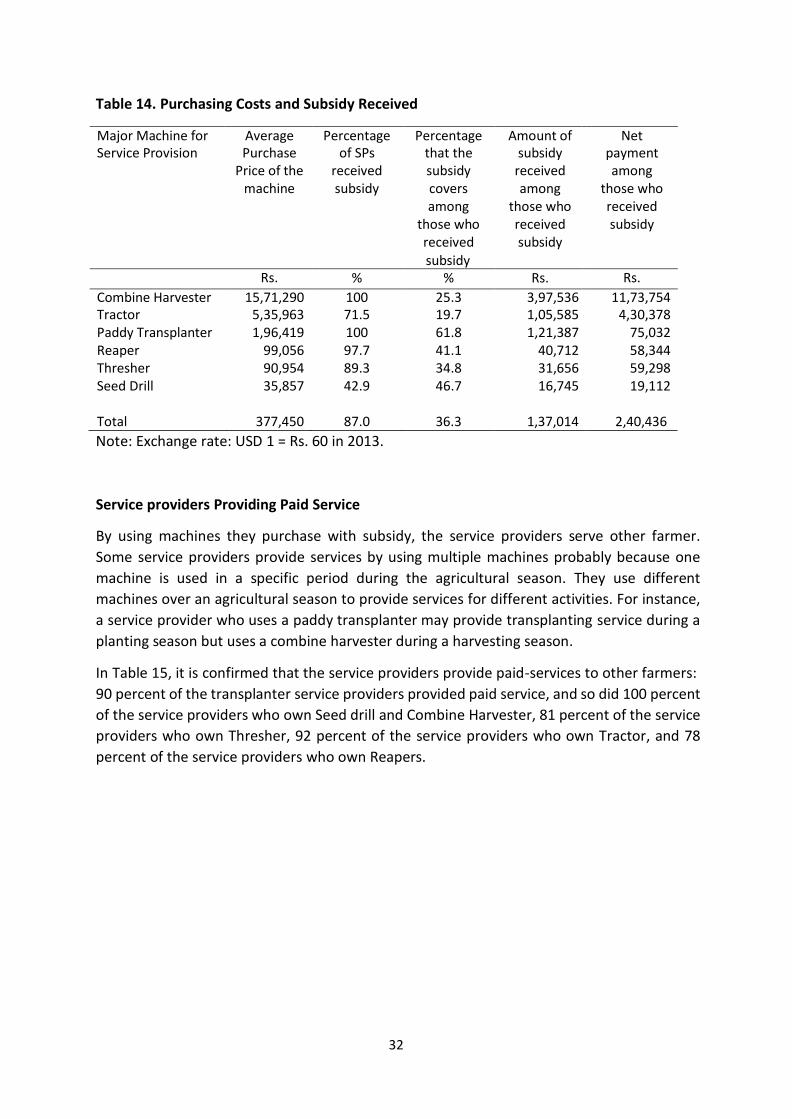
32
Table 14. Purchasing Costs and Subsidy Received
Major Machine for Average Percentage Percentage Amount of Net Service Provision Purchase
Price of the machine
of SPs received subsidy
that the subsidy covers among
those who received
subsidy received among
those who received subsidy
payment among
those who received subsidy
subsidy
Rs. % % Rs. Rs.
Combine Harvester 15,71,290 100 25.3 3,97,536 11,73,754 Tractor 5,35,963 71.5 19.7 1,05,585 4,30,378 Paddy Transplanter 1,96,419 100 61.8 1,21,387 75,032 Reaper 99,056 97.7 41.1 40,712 58,344 Thresher 90,954 89.3 34.8 31,656 59,298 Seed Drill 35,857 42.9 46.7 16,745 19,112
Total 377,450 87.0 36.3 1,37,014 2,40,436
Note: Exchange rate: USD 1 = Rs. 60 in 2013.
Service providers Providing Paid Service
By using machines they purchase with subsidy, the service providers serve other farmer.
Some service providers provide services by using multiple machines probably because one
machine is used in a specific period during the agricultural season. They use different
machines over an agricultural season to provide services for different activities. For instance,
a service provider who uses a paddy transplanter may provide transplanting service during a
planting season but uses a combine harvester during a harvesting season.
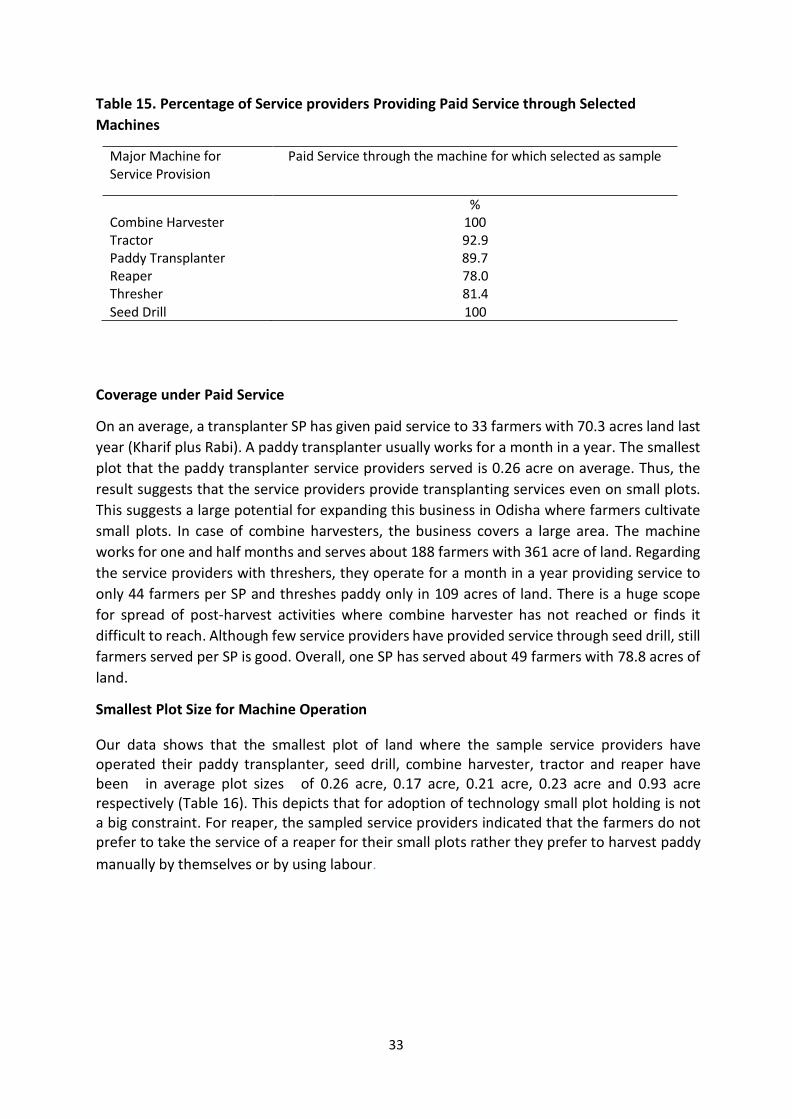
In Table 15, it is confirmed that the service providers provide paid-services to other farmers:
90 percent of the transplanter service providers provided paid service, and so did 100 percent
of the service providers who own Seed drill and Combine Harvester, 81 percent of the service
providers who own Thresher, 92 percent of the service providers who own Tractor, and 78
percent of the service providers who own Reapers.
33
Table 15. Percentage of Service providers Providing Paid Service through Selected
Machines
Major Machine for Service Provision
Paid Service through the machine for which selected as sample
% Combine Harvester 100 Tractor 92.9 Paddy Transplanter 89.7 Reaper 78.0 Thresher 81.4 Seed Drill 100
Coverage under Paid Service
On an average, a transplanter SP has given paid service to 33 farmers with 70.3 acres land last
year (Kharif plus Rabi). A paddy transplanter usually works for a month in a year. The smallest
plot that the paddy transplanter service providers served is 0.26 acre on average. Thus, the
result suggests that the service providers provide transplanting services even on small plots.
This suggests a large potential for expanding this business in Odisha where farmers cultivate
small plots. In case of combine harvesters, the business covers a large area. The machine
works for one and half months and serves about 188 farmers with 361 acre of land. Regarding
the service providers with threshers, they operate for a month in a year providing service to
only 44 farmers per SP and threshes paddy only in 109 acres of land. There is a huge scope
for spread of post-harvest activities where combine harvester has not reached or finds it
difficult to reach. Although few service providers have provided service through seed drill, still
farmers served per SP is good. Overall, one SP has served about 49 farmers with 78.8 acres of
land.
Smallest Plot Size for Machine Operation Our data shows that the smallest plot of land where the sample service providers have operated their paddy transplanter, seed drill, combine harvester, tractor and reaper have been in average plot sizes of 0.26 acre, 0.17 acre, 0.21 acre, 0.23 acre and 0.93 acre respectively (Table 16). This depicts that for adoption of technology small plot holding is not a big constraint. For reaper, the sampled service providers indicated that the farmers do not prefer to take the service of a reaper for their small plots rather they prefer to harvest paddy
manually by themselves or by using labour.

34
Mechanized Service Taken by Women Farmers
In this study we also tried to understand, how women farmers accessed mechanised service
from service providers. Although it is found that about 7.5 percent of service providers are
female10, only 2 women farmers have taken service from a service provider last year. It is
believed that the using the paddy transplanter can reduce drudgery (by escaping the manual
transplanting process), therefore it was expected that more women would be interested to
avail service of a paddy transplanter. But on the contrary it was found that, as compared to
other machines, least number of women farmers, 0.6 women farmers on average, have taken
paid service (Table 16). More women farmers have taken paid service for combine harvesters
and tractors.
Table 16. Indicators on Paid Service
10Mostly the machine is in the name of female but the service is managed by male.
Machine Days machine in operation per year
Total area treated in last
yea
No. of farmers
served in last year
No. of women farmers
served in last year
Smallest plot
served
(A) (B) (C) (D) (E)
Days Acre number number Acre
Combine Harvester 45 361.0 187.7 4.2 0.21
Tractor 45 246.4 107 2.8 0.23
Paddy Transplanter 28 70.3 32.5 0.6 0.26
Reaper 25 63.0 31.7 0.5 0.93
Thresher 31 108.6 43.9 0.9 -
Seed Drill 38 78.8 48.8 1.4 0.17
35
Machine Operators
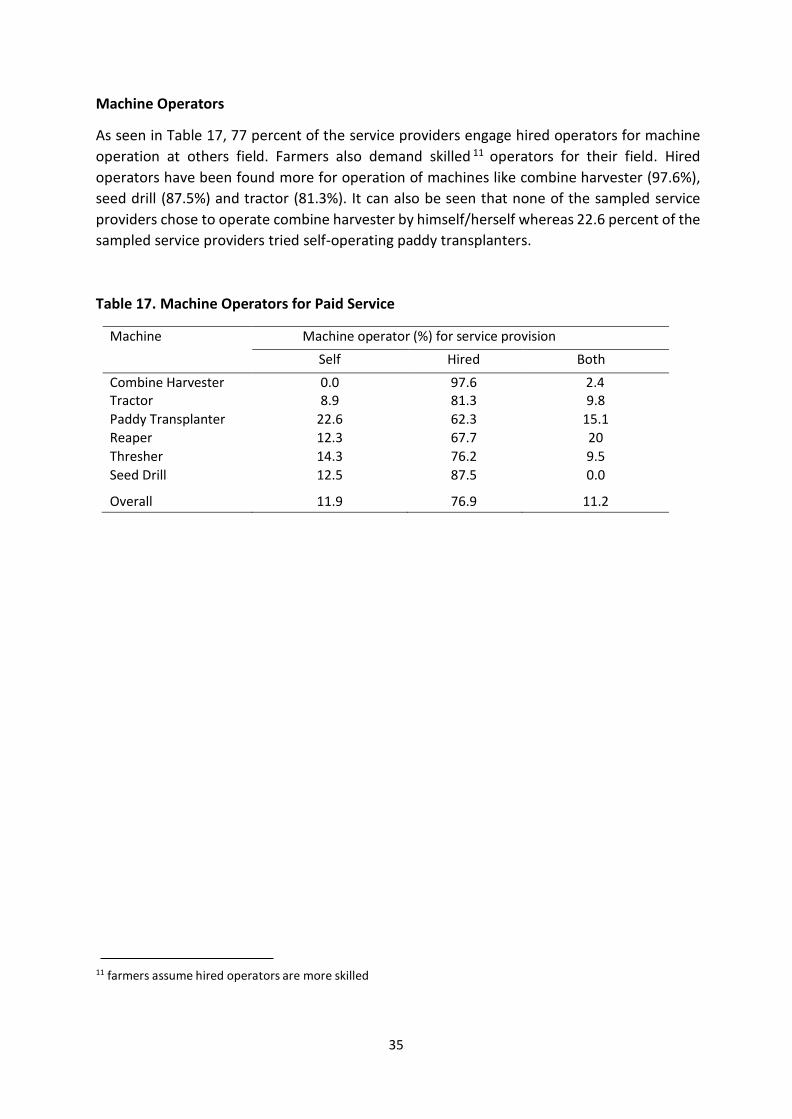
As seen in Table 17, 77 percent of the service providers engage hired operators for machine
operation at others field. Farmers also demand skilled 11 operators for their field. Hired
operators have been found more for operation of machines like combine harvester (97.6%),
seed drill (87.5%) and tractor (81.3%). It can also be seen that none of the sampled service
providers chose to operate combine harvester by himself/herself whereas 22.6 percent of the
sampled service providers tried self-operating paddy transplanters. Table 17. Machine Operators for Paid Service
Machine Machine operator (%) for service provision Self Hired Both
Combine Harvester 0.0 97.6 2.4 Tractor 8.9 81.3 9.8 Paddy Transplanter 22.6 62.3 15.1 Reaper 12.3 67.7 20 Thresher 14.3 76.2 9.5 Seed Drill 12.5 87.5 0.0
Overall
11.9
76.9
11.2
11 farmers assume hired operators are more skilled
36
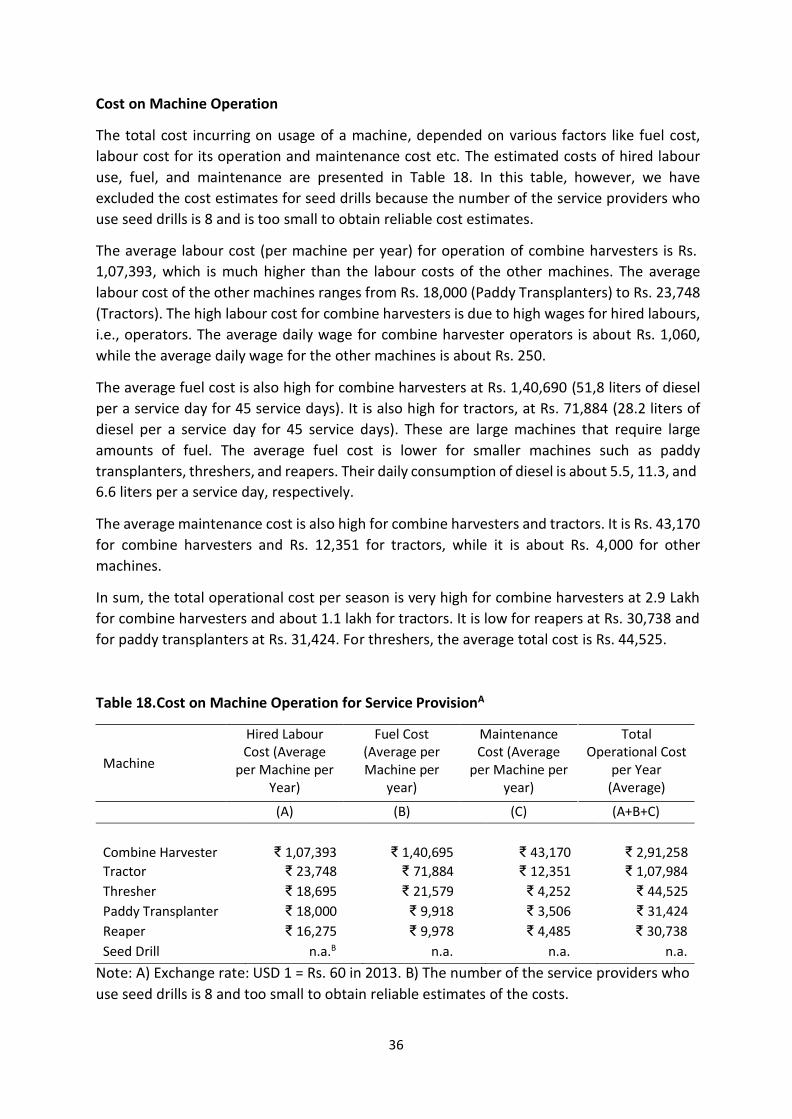
Cost on Machine Operation
The total cost incurring on usage of a machine, depended on various factors like fuel cost,
labour cost for its operation and maintenance cost etc. The estimated costs of hired labour
use, fuel, and maintenance are presented in Table 18. In this table, however, we have
excluded the cost estimates for seed drills because the number of the service providers who
use seed drills is 8 and is too small to obtain reliable cost estimates.
The average labour cost (per machine per year) for operation of combine harvesters is Rs.
1,07,393, which is much higher than the labour costs of the other machines. The average
labour cost of the other machines ranges from Rs. 18,000 (Paddy Transplanters) to Rs. 23,748
(Tractors). The high labour cost for combine harvesters is due to high wages for hired labours,
i.e., operators. The average daily wage for combine harvester operators is about Rs. 1,060,
while the average daily wage for the other machines is about Rs. 250.
The average fuel cost is also high for combine harvesters at Rs. 1,40,690 (51,8 liters of diesel
per a service day for 45 service days). It is also high for tractors, at Rs. 71,884 (28.2 liters of
diesel per a service day for 45 service days). These are large machines that require large
amounts of fuel. The average fuel cost is lower for smaller machines such as paddy
transplanters, threshers, and reapers. Their daily consumption of diesel is about 5.5, 11.3, and
6.6 liters per a service day, respectively.
The average maintenance cost is also high for combine harvesters and tractors. It is Rs. 43,170
for combine harvesters and Rs. 12,351 for tractors, while it is about Rs. 4,000 for other
machines.
In sum, the total operational cost per season is very high for combine harvesters at 2.9 Lakh
for combine harvesters and about 1.1 lakh for tractors. It is low for reapers at Rs. 30,738 and
for paddy transplanters at Rs. 31,424. For threshers, the average total cost is Rs. 44,525.
Table 18.Cost on Machine Operation for Service ProvisionA
Machine
Hired Labour Cost (Average
per Machine per Year)
Fuel Cost (Average per Machine per
year)
Maintenance Cost (Average
per Machine per year)
Total Operational Cost
per Year (Average)
(A) (B) (C) (A+B+C)
Combine Harvester
₹ 1,07,393
₹ 1,40,695
₹ 43,170
₹ 2,91,258
Tractor ₹ 23,748 ₹ 71,884 ₹ 12,351 ₹ 1,07,984
Thresher ₹ 18,695 ₹ 21,579 ₹ 4,252 ₹ 44,525
Paddy Transplanter ₹ 18,000 ₹ 9,918 ₹ 3,506 ₹ 31,424
Reaper
Seed Drill
₹ 16,275
n.a.B
₹ 9,978
n.a.
₹ 4,485
n.a.
₹ 30,738
n.a.
Note: A) Exchange rate: USD 1 = Rs. 60 in 2013. B) The number of the service providers who
use seed drills is 8 and too small to obtain reliable estimates of the costs.
37
Fees and Payment
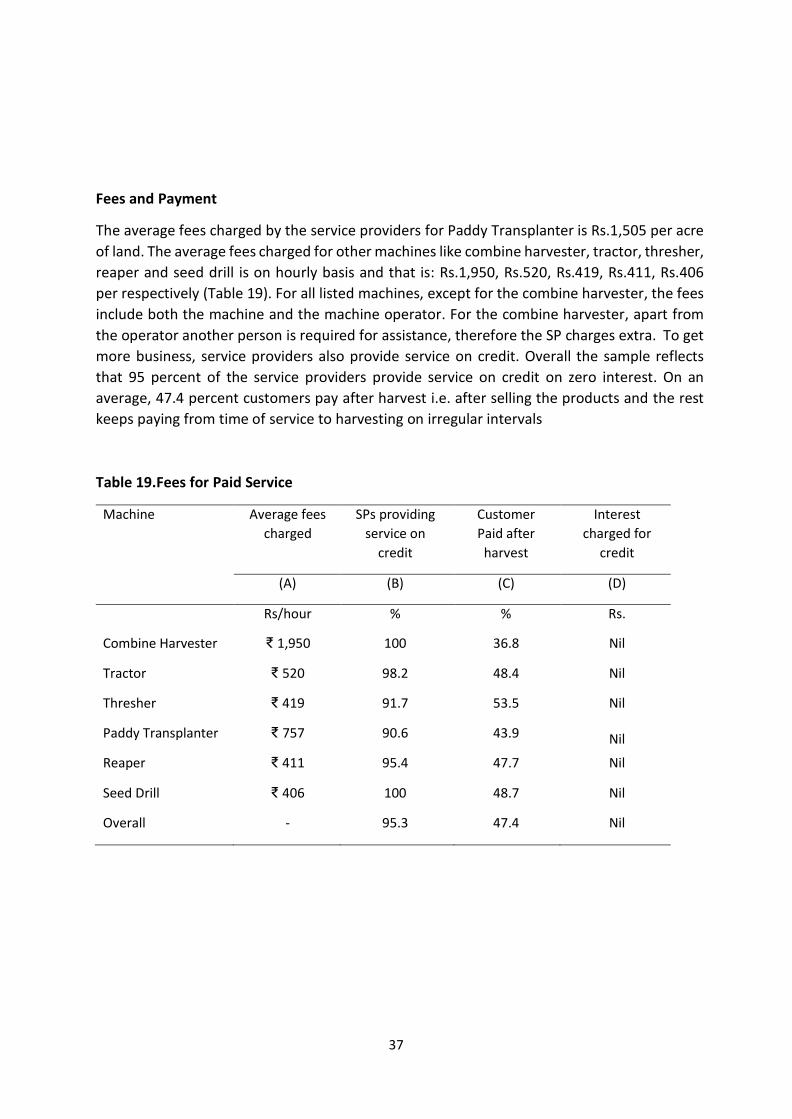
The average fees charged by the service providers for Paddy Transplanter is Rs.1,505 per acre
of land. The average fees charged for other machines like combine harvester, tractor, thresher,
reaper and seed drill is on hourly basis and that is: Rs.1,950, Rs.520, Rs.419, Rs.411, Rs.406
per respectively (Table 19). For all listed machines, except for the combine harvester, the fees
include both the machine and the machine operator. For the combine harvester, apart from
the operator another person is required for assistance, therefore the SP charges extra. To get
more business, service providers also provide service on credit. Overall the sample reflects
that 95 percent of the service providers provide service on credit on zero interest. On an
average, 47.4 percent customers pay after harvest i.e. after selling the products and the rest
keeps paying from time of service to harvesting on irregular intervals Table 19.Fees for Paid Service
Machine Average fees
charged
SPs providing
service on
credit
Customer
Paid after
harvest
Interest
charged for
credit
(A) (B) (C) (D)
Rs/hour % % Rs.
Combine Harvester ₹ 1,950 100 36.8 Nil
Tractor ₹ 520 98.2 48.4 Nil
Thresher ₹ 419 91.7 53.5 Nil
Paddy Transplanter
Reaper
₹ 757
₹ 411
90.6
95.4
43.9
47.7
Nil
Nil
Seed Drill ₹ 406 100 48.7 Nil
Overall - 95.3 47.4 Nil
38
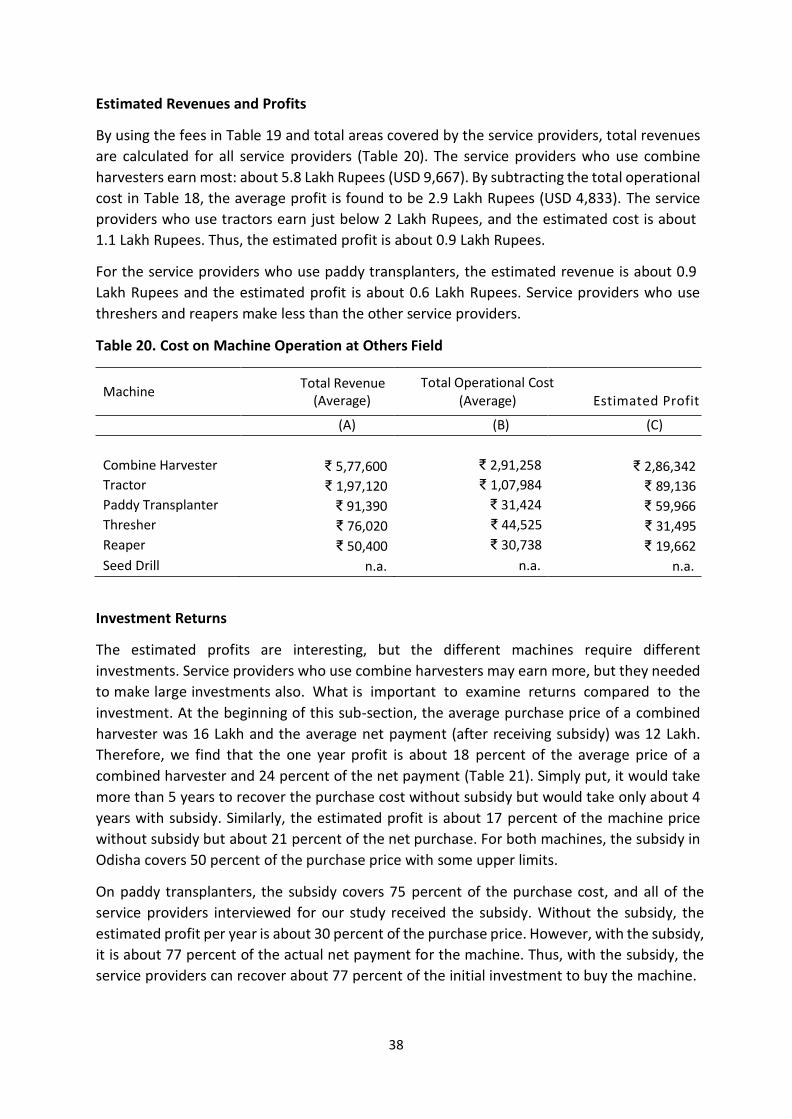
Estimated Revenues and Profits
By using the fees in Table 19 and total areas covered by the service providers, total revenues
are calculated for all service providers (Table 20). The service providers who use combine
harvesters earn most: about 5.8 Lakh Rupees (USD 9,667). By subtracting the total operational
cost in Table 18, the average profit is found to be 2.9 Lakh Rupees (USD 4,833). The service
providers who use tractors earn just below 2 Lakh Rupees, and the estimated cost is about
1.1 Lakh Rupees. Thus, the estimated profit is about 0.9 Lakh Rupees.
For the service providers who use paddy transplanters, the estimated revenue is about 0.9
Lakh Rupees and the estimated profit is about 0.6 Lakh Rupees. Service providers who use
threshers and reapers make less than the other service providers.
Table 20. Cost on Machine Operation at Others Field
Machine Total Revenue
(Average)
Total Operational Cost
(Average) Estimated Profit
(A) (B) (C)
Combine Harvester ₹ 5,77,600 ₹ 2,91,258 ₹ 2,86,342
Tractor ₹ 1,97,120 ₹ 1,07,984 ₹ 89,136
Paddy Transplanter ₹ 91,390 ₹ 31,424 ₹ 59,966
Thresher ₹ 76,020 ₹ 44,525 ₹ 31,495
Reaper ₹ 50,400 ₹ 30,738 ₹ 19,662
Seed Drill n.a. n.a. n.a.
Investment Returns
The estimated profits are interesting, but the different machines require different
investments. Service providers who use combine harvesters may earn more, but they needed
to make large investments also. What is important to examine returns compared to the
investment. At the beginning of this sub-section, the average purchase price of a combined
harvester was 16 Lakh and the average net payment (after receiving subsidy) was 12 Lakh.
Therefore, we find that the one year profit is about 18 percent of the average price of a
combined harvester and 24 percent of the net payment (Table 21). Simply put, it would take
more than 5 years to recover the purchase cost without subsidy but would take only about 4
years with subsidy. Similarly, the estimated profit is about 17 percent of the machine price
without subsidy but about 21 percent of the net purchase. For both machines, the subsidy in
Odisha covers 50 percent of the purchase price with some upper limits.
On paddy transplanters, the subsidy covers 75 percent of the purchase cost, and all of the
service providers interviewed for our study received the subsidy. Without the subsidy, the
estimated profit per year is about 30 percent of the purchase price. However, with the subsidy,
it is about 77 percent of the actual net payment for the machine. Thus, with the subsidy, the
service providers can recover about 77 percent of the initial investment to buy the machine.
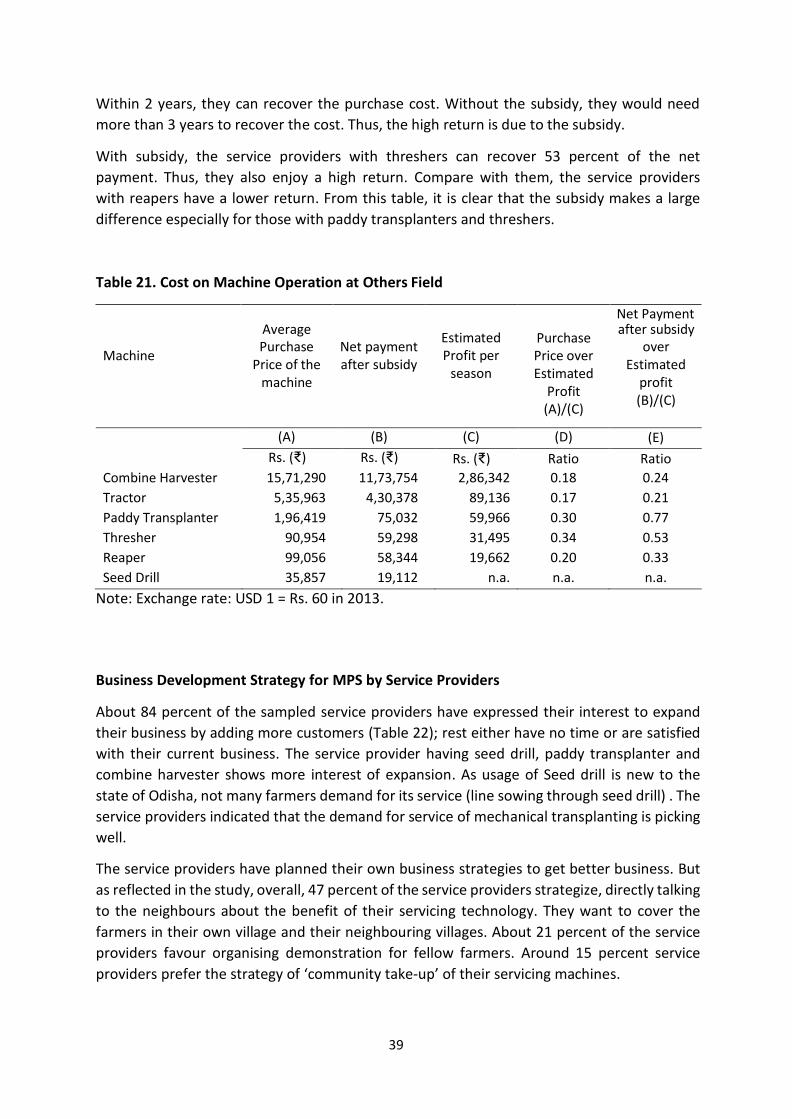
39
Within 2 years, they can recover the purchase cost. Without the subsidy, they would need
more than 3 years to recover the cost. Thus, the high return is due to the subsidy.
With subsidy, the service providers with threshers can recover 53 percent of the net
payment. Thus, they also enjoy a high return. Compare with them, the service providers
with reapers have a lower return. From this table, it is clear that the subsidy makes a large
difference especially for those with paddy transplanters and threshers.
Table 21. Cost on Machine Operation at Others Field
Net Payment
Machine
Average Purchase
Price of the machine
Net payment after subsidy
Estimated Profit per
season
Purchase Price over Estimated
Profit (A)/(C)
after subsidy over
Estimated profit (B)/(C)
(A) (B) (C) (D) (E)
Rs. (₹) Rs. (₹) Rs. (₹) Ratio Ratio
Combine Harvester 15,71,290 11,73,754 2,86,342 0.18 0.24
Tractor 5,35,963 4,30,378 89,136 0.17 0.21
Paddy Transplanter 1,96,419 75,032 59,966 0.30 0.77
Thresher 90,954 59,298 31,495 0.34 0.53
Reaper 99,056 58,344 19,662 0.20 0.33
Seed Drill 35,857 19,112 n.a. n.a. n.a.
Note: Exchange rate: USD 1 = Rs. 60 in 2013.
Business Development Strategy for MPS by Service Providers
About 84 percent of the sampled service providers have expressed their interest to expand
their business by adding more customers (Table 22); rest either have no time or are satisfied
with their current business. The service provider having seed drill, paddy transplanter and
combine harvester shows more interest of expansion. As usage of Seed drill is new to the
state of Odisha, not many farmers demand for its service (line sowing through seed drill) . The
service providers indicated that the demand for service of mechanical transplanting is picking
well.
The service providers have planned their own business strategies to get better business. But
as reflected in the study, overall, 47 percent of the service providers strategize, directly talking
to the neighbours about the benefit of their servicing technology. They want to cover the
farmers in their own village and their neighbouring villages. About 21 percent of the service
providers favour organising demonstration for fellow farmers. Around 15 percent service
providers prefer the strategy of ‘community take-up’ of their servicing machines.

40
Interestingly, for paddy transplanter, about 32 percent of the sampled Service providers
strategize to opt for ‘backward and forward linkages’. They are planning to be with the
farmers before and after the service. They will help farmers in availing inputs and advise them
for better package of practices. Also help them in marketing their product. For seed drill there
are only two strategies opted: demonstration to fellow farmers (87.5%) and talking to
neighbour farmers (12.5%) on benefit of technology.
46.9
The Most Important Method to Find Customers (%)
21.5
15.2
5.9
5.6 3.6
1.3
Talk to neighbors
about benefits of technology
Demonstration for fellow farmers
Community take up
Backward and forward linkage
Other Service on credit
Give discounted
service price for first time
adopter
Figure 9. Service Providers’ Business Strategy

41
Table 22.Business Development Strategy by SPs
Machine SPs interested to serve more farmers
Strategies for business development (%
Demonstration for fellow farmers
Talk to neighbours about benefits of technology
Community take up
Backward and forward linkage
Other
A B C D E Paddy
Transplanter 94.3 28 28 2 32 10
Seed Drill 100 87.5 12.5 0 0 0
Combine
Harvester
90.2
32.4
32.4
16.2
0
19.0
Thresher
77.4
13.9
63.1
12.3
1.5
9.2
Tractor 78.6 11.4 44.3 28.4 1.1 14.8
Reaper 84.6 23.6 63.6 10.9 0 1.9
Overall 83.5 21.5 46.9 15.2 5.9 10.5
Demand Aggregator for Business Development
The service providers were asked about how a demand aggregator could be helpful in
developing their business. The results show, overall 43 percent of the service providers are in
favour of using a demand aggregator. Within the 43 percent (who favour using an aggregator),
87 percent of them want to use them for promoting the Seed drill technology, 76 percent for
combine harvester and 41 percent for both paddy transplanter and reaper. When asked
about who could be the better demand aggregator,46 percent of the service providers
indicated about fellow farmers, 35 percent indicated about unemployed youth with good
networking skills and 15 percent indicated about (Table 23). But the service providers
servicing Seed Drill machines opined that, unemployed youth with good networking skills
could be the most successful demand aggregator.
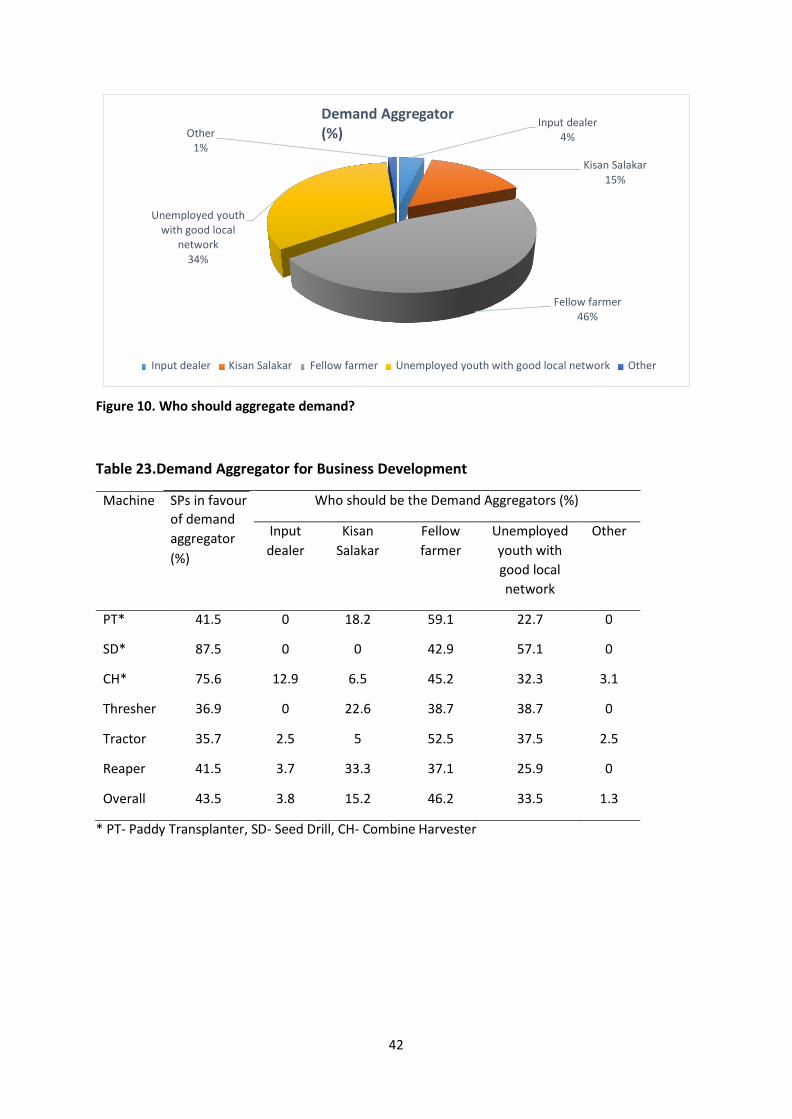
42
Machine SPs in favour
of demand
aggregator
Other 1%
Demand Aggregator (%)
Input dealer
4%
Kisan Salakar 15%
Unemployed youth
with good local network
34%
Fellow farmer 46%
Input dealer Kisan Salakar Fellow farmer Unemployed youth with good local network Other
Figure 10. Who should aggregate demand?
Table 23.Demand Aggregator for Business Development
Who should be the Demand Aggregators (%)
(%)
Input
dealer
Kisan
Salakar
Fellow
farmer
Unemployed
youth with
good local
network
Other
PT* 41.5 0 18.2 59.1 22.7 0
SD* 87.5 0 0 42.9 57.1 0
CH* 75.6 12.9 6.5 45.2 32.3 3.1
Thresher 36.9 0 22.6 38.7 38.7 0
Tractor 35.7 2.5 5 52.5 37.5 2.5
Reaper 41.5 3.7 33.3 37.1 25.9 0
Overall 43.5 3.8 15.2 46.2 33.5 1.3
* PT- Paddy Transplanter, SD- Seed Drill, CH- Combine Harvester
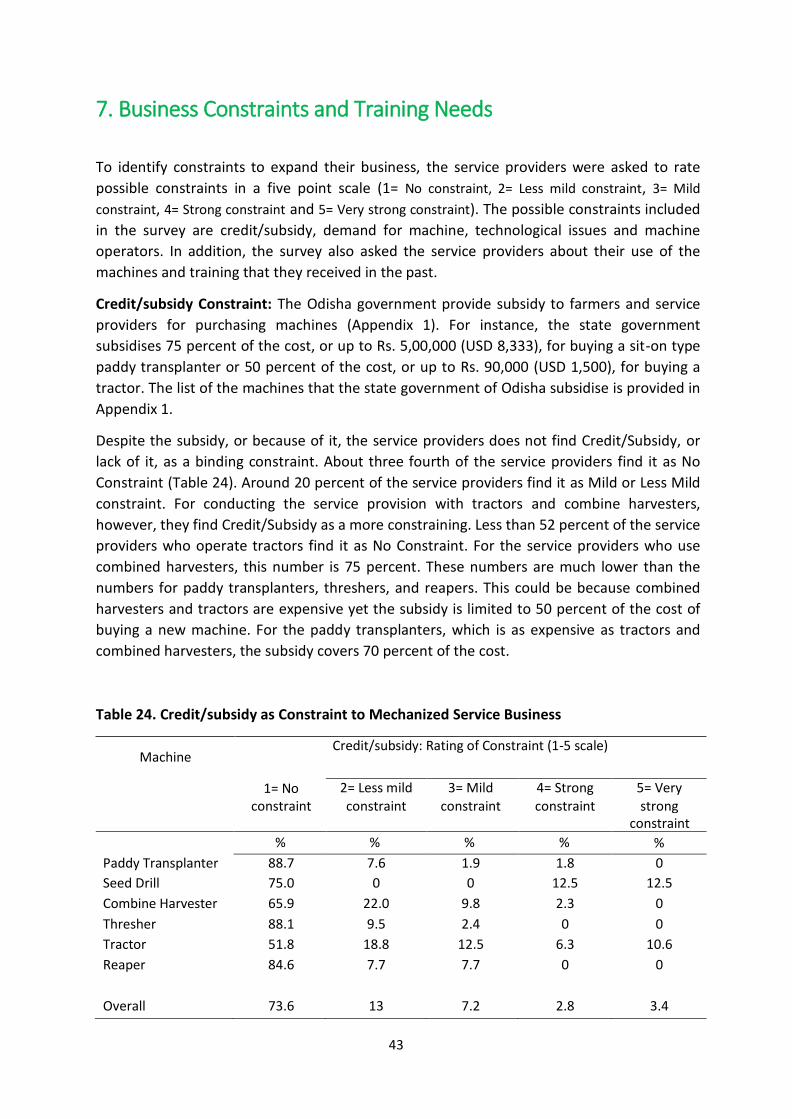
43
7. Business Constraints and Training Needs
To identify constraints to expand their business, the service providers were asked to rate
possible constraints in a five point scale (1= No constraint, 2= Less mild constraint, 3= Mild
constraint, 4= Strong constraint and 5= Very strong constraint). The possible constraints included
in the survey are credit/subsidy, demand for machine, technological issues and machine
operators. In addition, the survey also asked the service providers about their use of the
machines and training that they received in the past.
Credit/subsidy Constraint: The Odisha government provide subsidy to farmers and service
providers for purchasing machines (Appendix 1). For instance, the state government
subsidises 75 percent of the cost, or up to Rs. 5,00,000 (USD 8,333), for buying a sit-on type
paddy transplanter or 50 percent of the cost, or up to Rs. 90,000 (USD 1,500), for buying a
tractor. The list of the machines that the state government of Odisha subsidise is provided in
Appendix 1.
Despite the subsidy, or because of it, the service providers does not find Credit/Subsidy, or
lack of it, as a binding constraint. About three fourth of the service providers find it as No
Constraint (Table 24). Around 20 percent of the service providers find it as Mild or Less Mild
constraint. For conducting the service provision with tractors and combine harvesters,
however, they find Credit/Subsidy as a more constraining. Less than 52 percent of the service
providers who operate tractors find it as No Constraint. For the service providers who use
combined harvesters, this number is 75 percent. These numbers are much lower than the
numbers for paddy transplanters, threshers, and reapers. This could be because combined
harvesters and tractors are expensive yet the subsidy is limited to 50 percent of the cost of
buying a new machine. For the paddy transplanters, which is as expensive as tractors and
combined harvesters, the subsidy covers 70 percent of the cost.
Table 24. Credit/subsidy as Constraint to Mechanized Service Business
Machine Credit/subsidy: Rating of Constraint (1-5 scale)
1= No constraint
2= Less mild constraint
3= Mild constraint
4= Strong constraint
5= Very strong
constraint
% % % % %
Paddy Transplanter 88.7 7.6 1.9 1.8 0
Seed Drill 75.0 0 0 12.5 12.5
Combine Harvester 65.9 22.0 9.8 2.3 0
Thresher 88.1 9.5 2.4 0 0
Tractor 51.8 18.8 12.5 6.3 10.6
Reaper 84.6 7.7 7.7 0 0
Overall
73.6
13
7.2
2.8
3.4
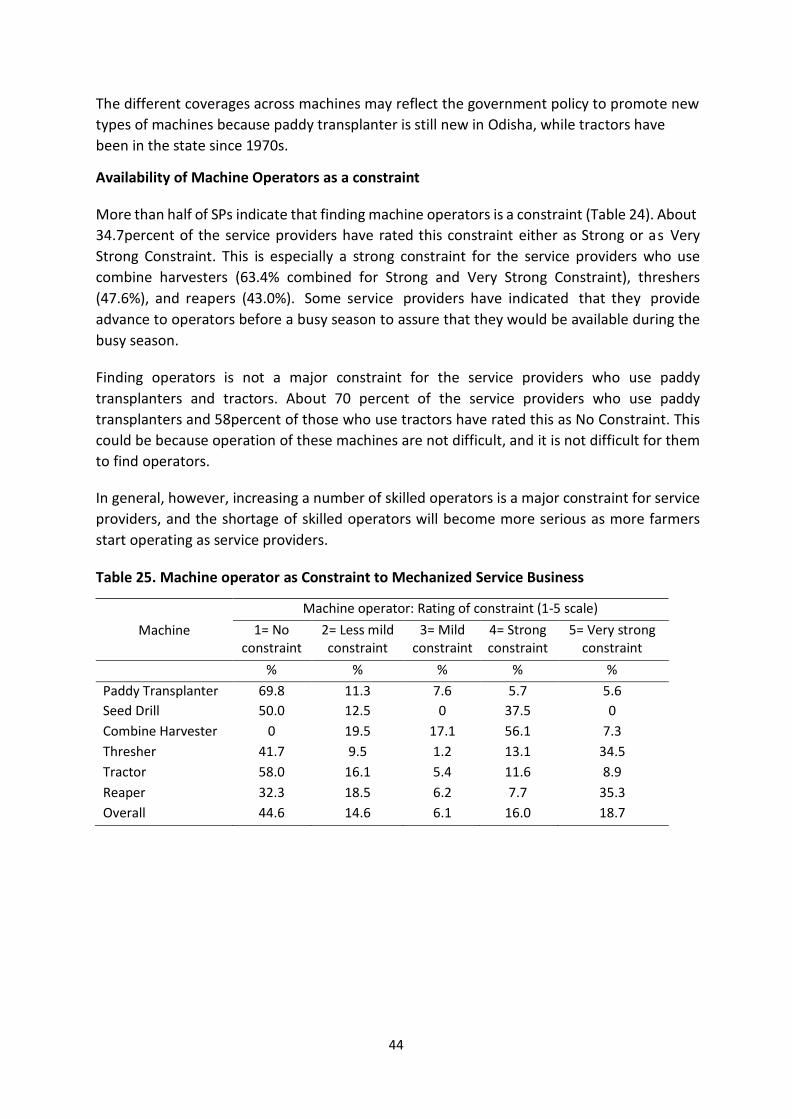
44
The different coverages across machines may reflect the government policy to promote new
types of machines because paddy transplanter is still new in Odisha, while tractors have
been in the state since 1970s.
Availability of Machine Operators as a constraint More than half of SPs indicate that finding machine operators is a constraint (Table 24). About
34.7percent of the service providers have rated this constraint either as Strong or as Very
Strong Constraint. This is especially a strong constraint for the service providers who use
combine harvesters (63.4% combined for Strong and Very Strong Constraint), threshers
(47.6%), and reapers (43.0%). Some service providers have indicated that they provide
advance to operators before a busy season to assure that they would be available during the
busy season. Finding operators is not a major constraint for the service providers who use paddy
transplanters and tractors. About 70 percent of the service providers who use paddy
transplanters and 58percent of those who use tractors have rated this as No Constraint. This
could be because operation of these machines are not difficult, and it is not difficult for them
to find operators. In general, however, increasing a number of skilled operators is a major constraint for service
providers, and the shortage of skilled operators will become more serious as more farmers
start operating as service providers. Table 25. Machine operator as Constraint to Mechanized Service Business
Machine operator: Rating of constraint (1-5 scale)
Machine 1= No constraint
2= Less mild constraint
3= Mild constraint
4= Strong constraint
5= Very strong constraint
% % % % %
Paddy Transplanter 69.8 11.3 7.6 5.7 5.6
Seed Drill 50.0 12.5 0 37.5 0
Combine Harvester 0 19.5 17.1 56.1 7.3
Thresher 41.7 9.5 1.2 13.1 34.5
Tractor 58.0 16.1 5.4 11.6 8.9
Reaper 32.3 18.5 6.2 7.7 35.3
Overall 44.6 14.6 6.1 16.0 18.7

45
Demand for machine as a constraint: Possibly because of rising labour costs or increased awareness of agricultural machines through media and extension work, the demand for service provision seems high. About half of the service providers suggest that demand is not a constraint to expand their business at all. Combined with Less Mild Constraint, the percentage increases to higher than 73 percent. The demand for Paddy Transplanters seems very high. Higher than 96 percent of the service providers with paddy transplanters indicate that Demand is Less Mild or No Constraint. Combined harvesters also have a high demand.
Table 26. Demand for Machine as Constraint to Mechanized Service Business
Demand for machine: Rating of constraint (1-5 scale)
Machine 1= No
constraint 2= Less mild constraint
3= Mild constraint
4= Strong constraint
5= Very strong constraint
% % % % %
Paddy Transplanter 60.4 35.9 1.9 0 1.8
Seed Drill 62.5 25 0 12.5 0
Combine Harvester 46.3 36.6 17.1 0 0
Thresher 48.8 15.5 21.4 11.9 2.4
Tractor 45.5 29.5 18.8 4.5 1.7
Reaper 35.4 21.5 32.3 9.2 1.6
Overall 47.1 26.5 18.7 6.1 1.6
Technology constraint: Service providers face technical problems (Table 27). In some cases,
they have difficulties in finding technicians who can maintain or repair machines or obtaining
missing parts. This is especially true for machines that are new in their locations. Seed drills
are new in some parts of Odisha. Possibly because of this, about 38 percent of the service
providers who use seed drills find Technology as Very Strong Constraint. Combine harvester
is not only new but also highly sophisticated. Thus, about half of the service providers who
use combine harvesters find Technology as either Mild or Strong Constraint. Technology is
not a major constraint for machines that are popular and wide-spread, such as tractors and
paddy transplanters. From discussion with SPs it was found that although SPs are promoting various technologies, most of them do not have much knowledge on best-bet agronomic practices associated with those technologies. So they demand massive awareness programs through demonstrations, hand-holding support by extension workers, and propagation through mass media and other effective modes should be made.

46
Table 27. Technology as Constraint to Mechanized Service Business
Technology issues: Rating of constraint (1-5 scale)
Machine 1= No 2= Less mild 3= Mild 4= Strong 5= Very strong constraint constraint constraint constraint constraint
% % % % %
Paddy Transplanter 47.1 34.0 15.1 0 3.8
Seed Drill 62.5 0 0 0 37.5
Combine Harvester 26.8 24.4 34.2 14.6 0
Thresher 34.5 40.5 13.1 7.1 4.8
Tractor 52.7 33.0 8.9 1.8 3.6
Reaper 13.9 43.1 23.1 15.4 4.5
Overall 38.0 35.0 16.0 6.6 4.4
Assessment of Machine Utilization and Base of Assessment
We have also discussed with the service providers whether they have made an assessment
on the level of their machine use and the base of that assessment. We learn from the data
that around 90percent of the service providers have made an assessment of their machine
utilisation levels. Overall, 63 percent of the sampled survive providers claim to have made
the optimum use of their machines, 30 percent reflected under-utilisation and 7percent
claimed of making over utilisation.
Level of Machine Utilisation Over 7%
Under 30%
Optimum 63%
Figure 11. Level of Machine Use

47
Table 28.Assessment of Machine Utilisation and Base of Assessment
SP has assessed the level of their
Level of machine utilized Base of assessment
Machine machine
utilization Under Optimum Over Income
getting Time giving
Capacity of the machine
% % % % % % %
PT* 77.4 26.8 63.4 9.8 29.3 39.0 31.7
SD* 75.0 16.7 83.3 0 16.7 16.7 66.6
CH* 92.7 26.3 65.8 7.9 10.5 50.0 39.5
Thresher 89.3 34.7 60.0 5.3 24.0 49.3 26.7
Tractor 93.8 22.9 66.7 10.4 10.5 47.6 41.9
Reaper 92.3 41.7 56.7 1.6 21.7 50.0 28.3
Overall 89.5 29.9 63.1 7.0 18.2 47.1 34.7
* PT- Paddy Transplanter, SD- Seed Drill, CH- Combine Harvester
Training Taken by Service providers
Service provider’s knowledge on technology and management adds to his business. Overall,
only 24.8percent Service providers have taken training on machines whereas 58.5 percent
service providers have attended training on paddy transplanter. Generally Service providers
(95.6%) have taken technical training. Only 3.4 percent have attended business management
training. Among trained service providers, 67.7 percent have given training to others on
machines. One trained SP has given training to 6-7 persons. The training spill over effect is
more for paddy transplanter (1:9) and least for seed drill (1:2).
Table 29.Training Taken by Service providers on Machines
SPs have Type of training attended SPs No. of persons
Machine
taken training
on machines
Technical
Managerial
Entrepren.
development
trained
others
trained by SPs
% % % % % (Average)
PT* 58.5 93.6 3.2 3.2 67.7 8.5
SD* 12.5 100 0 0 100 2
CH* 22 88.9 11.1 0 44.4 3.8
Thresher 20.2 94.1 5.9 0 70.6 7.4
Tractor 8.9 100 0 0 80 4.3
Reaper 33.9 100 0 0 63.6 4.4
Overall 24.8 95.6 3.37 0.54 66.7 6.3
* PT- Paddy Transplanter, SD- Seed Drill, CH- Combine Harvester
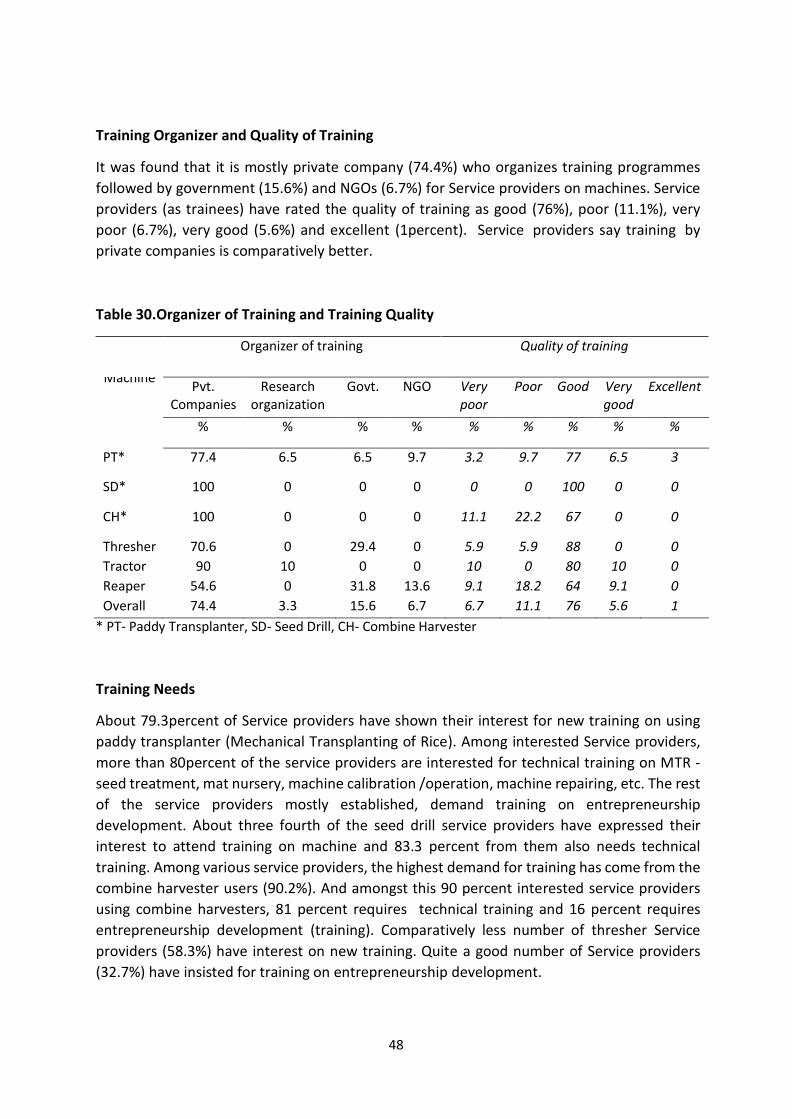
48
Training Organizer and Quality of Training
It was found that it is mostly private company (74.4%) who organizes training programmes
followed by government (15.6%) and NGOs (6.7%) for Service providers on machines. Service
providers (as trainees) have rated the quality of training as good (76%), poor (11.1%), very
poor (6.7%), very good (5.6%) and excellent (1percent). Service providers say training by
private companies is comparatively better.
Table 30.Organizer of Training and Training Quality
Organizer of training Quality of training
Machine Pvt.
Companies Research
organization Govt. NGO Very
poor Poor Good Very
good Excellent
% % % % % % % % %
PT* 77.4 6.5 6.5 9.7 3.2 9.7 77 6.5 3
SD* 100 0 0 0 0 0 100 0 0
CH* 100 0 0 0 11.1 22.2 67 0 0
Thresher 70.6 0 29.4 0 5.9 5.9 88 0 0
Tractor 90 10 0 0 10 0 80 10 0
Reaper 54.6 0 31.8 13.6 9.1 18.2 64 9.1 0
Overall 74.4 3.3 15.6 6.7 6.7 11.1 76 5.6 1
* PT- Paddy Transplanter, SD- Seed Drill, CH- Combine Harvester
Training Needs
About 79.3percent of Service providers have shown their interest for new training on using
paddy transplanter (Mechanical Transplanting of Rice). Among interested Service providers,
more than 80percent of the service providers are interested for technical training on MTR -
seed treatment, mat nursery, machine calibration /operation, machine repairing, etc. The rest
of the service providers mostly established, demand training on entrepreneurship
development. About three fourth of the seed drill service providers have expressed their
interest to attend training on machine and 83.3 percent from them also needs technical
training. Among various service providers, the highest demand for training has come from the
combine harvester users (90.2%). And amongst this 90 percent interested service providers
using combine harvesters, 81 percent requires technical training and 16 percent requires
entrepreneurship development (training). Comparatively less number of thresher Service
providers (58.3%) have interest on new training. Quite a good number of Service providers
(32.7%) have insisted for training on entrepreneurship development.
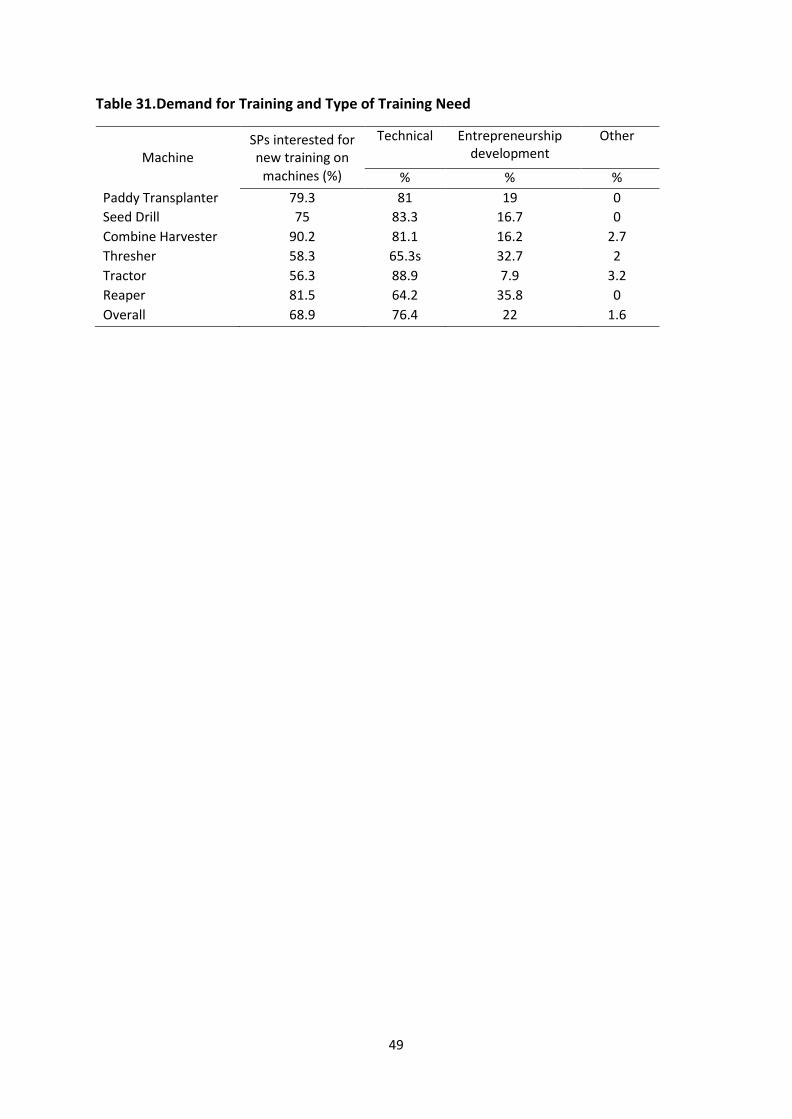
49
Table 31.Demand for Training and Type of Training Need
Machine SPs interested for new training on
Technical Entrepreneurship development
Other
machines (%) % % %
Paddy Transplanter 79.3 81 19 0
Seed Drill 75 83.3 16.7 0
Combine Harvester 90.2 81.1 16.2 2.7
Thresher 58.3 65.3s 32.7 2
Tractor 56.3 88.9 7.9 3.2
Reaper 81.5 64.2 35.8 0
Overall 68.9 76.4 22 1.6
50
8. Conclusion
The results in this report describe characteristics of service providers in Odisha. They are
mostly male and highly educated. Their primary income source is still agricultural production,
but service provision provides 30 percent of the income. This share may increase as they
expand their business in the future because most of them have just started the business less
than three years ago. They obtain information about the machines mostly from friends and
neighbours, and more than three fourth of them have loans from commercial banks.
The service providers employ workers who operate machines. However, finding skilled
operators seems to be a constraint. The lack of skilled machine operators was cited as a major
constraint for their business in the report. The service providers also stimulate local business
as they buy machines from local dealers and hire local technicians for maintenance of their
machines. The expansion of their business, therefore, may contribute to the economic
development in rural areas in Odisha.
The report finds that close of 90 percent of the service providers who were interviewed for
the report received subsidy to purchase agricultural machines used for service provision.
Because of the subsidy, the service providers can recover their initial investment quickly. In
the case of service providers with paddy transplanters, they can recover about 77 % of their
net payment, after receiving subsidy, for a paddy transplanter within one year. Service
providers who use combine harvesters can recover the net payment for the machine within
four years, instead of more than five years without subsidy. Thus, the subsidy plays an
important role in encouraging more farmers to become service providers.
Possibly due to the availability of the subsidy, the access to credit/subsidy was not found to
be a binding constraint. Instead, the lack of skilled workers was cited as a major constraint.
Therefore, it is recommended that the Odisha government provides assistance to technical
trainings which are conducted by private companies, government agencies, NGOs, or
research organizations in addition to providing subsidy to machine purchases.
Odisha agriculture is at a cross road toward achieving agricultural mechanisation in coming
decades, and service providers need to play an imperative role to take the road. Assisting
service providers through easy supply of machines, assured post sale service, provision for
their capacity building in understanding technologies and best-bet agronomic practices
associated with these, troubleshooting and maintenance knowledge, training on successful
business development models, etc., therefore, should be considered as a top priority for the
Odisha government and other state governments in Eastern India.
51
References:
Characterization of CSISA Odisha Hub Districts for Technology Development and Targeting, CSISA
India, 2013
Economic Survey 2012-13, Planning & Coordination Department, Government of Odisha
Farm Mechanisation in Odisha, Odisha Farm Machinery Research & Development Centre
Odisha Agriculture Statistics, 2012-13, Government of Odisha
Odisha Agriculture Statistics, 2011-12, Government of Odisha
Odisha Agriculture Statistics, 2011-11, Government of Odisha
Odisha Agriculture Statistics, 2009-10, Government of Odisha
Orissa Agriculture Statistics, 2008-09, Government of Orissa
Orissa Agriculture Statistics, 2007-08, Government of Orissa
Orissa Agriculture Statistics, 2006-07, Government of Orissa
State Agriculture Policy 2013, Government of Odisha
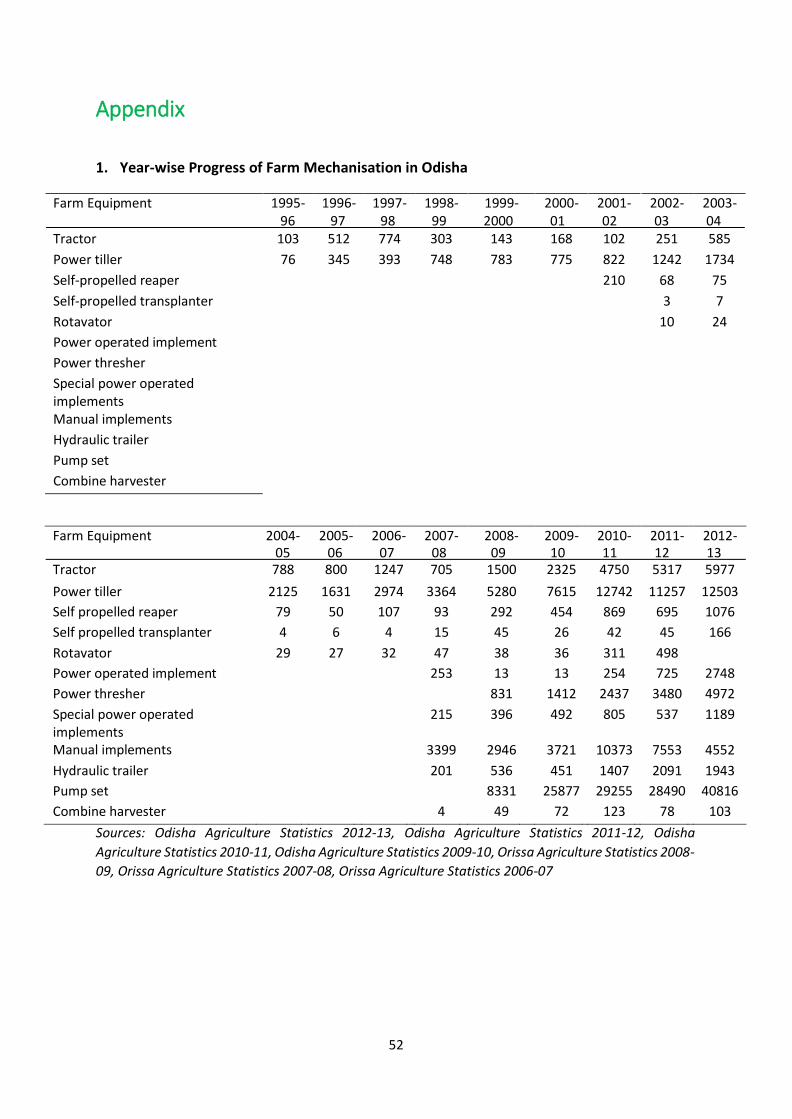
52
Appendix
1. Year-wise Progress of Farm Mechanisation in Odisha
Farm Equipment 1995- 1996- 1997- 1998- 1999- 2000- 2001- 2002- 2003- 96 97 98 99 2000 01 02 03 04
Tractor 103 512 774 303 143 168 102 251 585
Power tiller 76 345 393 748 783 775 822 1242 1734
Self-propelled reaper 210 68 75
Self-propelled transplanter 3 7
Rotavator 10 24
Power operated implement
Power thresher
Special power operated implements Manual implements
Hydraulic trailer
Pump set
Combine harvester
Farm Equipment 2004- 2005- 2006- 2007- 2008- 2009- 2010- 2011- 2012-
05 06 07 08 09 10 11 12 13 Tractor 788 800 1247 705 1500 2325 4750 5317 5977
Power tiller 2125 1631 2974 3364 5280 7615 12742 11257 12503
Self propelled reaper 79 50 107 93 292 454 869 695 1076
Self propelled transplanter 4 6 4 15 45 26 42 45 166
Rotavator 29 27 32 47 38 36 311 498
Power operated implement 253 13 13 254 725 2748
Power thresher 831 1412 2437 3480 4972
Special power operated implements Manual implements
215
3399
396
2946
492
3721
805
10373
537
7553
1189
4552
Hydraulic trailer 201 536 451 1407 2091 1943
Pump set 8331 25877 29255 28490 40816
Combine harvester 4 49 72 123 78 103
Sources: Odisha Agriculture Statistics 2012-13, Odisha Agriculture Statistics 2011-12, Odisha
Agriculture Statistics 2010-11, Odisha Agriculture Statistics 2009-10, Orissa Agriculture Statistics 2008-
09, Orissa Agriculture Statistics 2007-08, Orissa Agriculture Statistics 2006-07
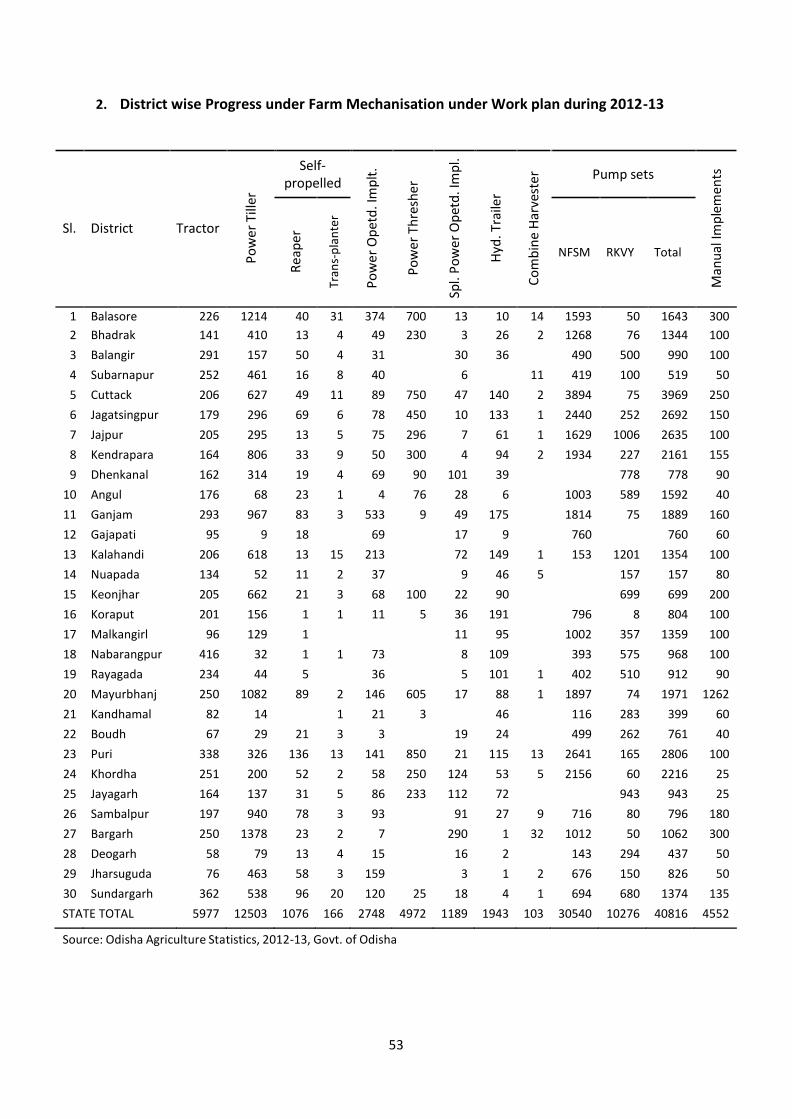
53
Po
we
r Ti
ller
Rea
per
Tran
s-p
lan
ter
Po
wer
Op
etd
. Im
plt
.
Po
we
r Th
resh
er
Spl.
Po
we
r O
pet
d. I
mp
l.
Hyd
. Tra
iler
Co
mb
ine
Har
vest
er
Man
ual
Imp
lem
ents
2. District wise Progress under Farm Mechanisation under Work plan during 2012-13
Self- propelled
Pump sets
Sl. District Tractor NFSM RKVY Total
1 Balasore 226 1214 40 31 374 700 13 10 14 1593 50 1643 300
2 Bhadrak 141 410 13 4 49 230 3 26 2 1268 76 1344 100
3 Balangir 291 157 50 4 31 30 36 490 500 990 100
4 Subarnapur 252 461 16 8 40 6 11 419 100 519 50
5 Cuttack 206 627 49 11 89 750 47 140 2 3894 75 3969 250
6 Jagatsingpur 179 296 69 6 78 450 10 133 1 2440 252 2692 150
7 Jajpur 205 295 13 5 75 296 7 61 1 1629 1006 2635 100
8 Kendrapara 164 806 33 9 50 300 4 94 2 1934 227 2161 155
9 Dhenkanal 162 314 19 4 69 90 101 39 778 778 90
10 Angul 176 68 23 1 4 76 28 6 1003 589 1592 40
11 Ganjam 293 967 83 3 533 9 49 175 1814 75 1889 160
12 Gajapati 95 9 18 69 17 9 760 760 60
13 Kalahandi 206 618 13 15 213 72 149 1 153 1201 1354 100
14 Nuapada 134 52 11 2 37 9 46 5 157 157 80
15 Keonjhar 205 662 21 3 68 100 22 90 699 699 200
16 Koraput 201 156 1 1 11 5 36 191 796 8 804 100
17 Malkangirl 96 129 1 11 95 1002 357 1359 100
18 Nabarangpur 416 32 1 1 73 8 109 393 575 968 100
19 Rayagada 234 44 5 36 5 101 1 402 510 912 90
20 Mayurbhanj 250 1082 89 2 146 605 17 88 1 1897 74 1971 1262
21 Kandhamal 82 14 1 21 3 46 116 283 399 60
22 Boudh 67 29 21 3 3 19 24 499 262 761 40
23 Puri 338 326 136 13 141 850 21 115 13 2641 165 2806 100
24 Khordha 251 200 52 2 58 250 124 53 5 2156 60 2216 25
25 Jayagarh 164 137 31 5 86 233 112 72 943 943 25
26 Sambalpur 197 940 78 3 93 91 27 9 716 80 796 180
27 Bargarh 250 1378 23 2 7 290 1 32 1012 50 1062 300
28 Deogarh 58 79 13 4 15 16 2 143 294 437 50
29 Jharsuguda 76 463 58 3 159 3 1 2 676 150 826 50
30 Sundargarh 362 538 96 20 120 25 18 4 1 694 680 1374 135
STA TE TOTAL 5977 12503 1076 166 2748 4972 1189 1943 103 30540 10276 40816 4552
Source: Odisha Agriculture Statistics, 2012-13, Govt. of Odisha

3. Pattern of Assistance under State Agriculture Policy (2013)
Sl. No.
Scheme Pattern of Assistance
1 Capital Investment Subsidy for Commercial Agri Enterprises (CAE)
Capital Investment Subsidy for Commercial Agri Enterprises (CAE)
40% of the fixed capital (excluding the cost of land) subject to a limit of Rs.50.00 lakh (50% limited to Rs.50.00 lakh for SC/ ST/ Women/ Graduate of Agriculture and allied discipline)
2 Private Lift Irrigation Projects (Jalanidhi)
i) Shallow tube well 50% of the project cost subject to a limit of Rs.20,000/-. In addition, in case of
Cluster of 10 nos or more STWs the cost of electrification on will be borne by the Government subject to a ceiling of Rs.4 lakh per cluster.
ii) Dug well 75% of the project cost subject to a limit of Rs.75000/-
iii) Deep bore well 75% of the project cost subject to a limit of Rs.50000/- (excluding cost of electrification) In addition 75% of Genset / electrification cost subject to a limit of Rs.50000/- (for energisation)
iv) River lift/ Surface lift project
75% of the project cost subject to a limit of Rs.60000/- Community-based/ R e g d . Bodies to get 90% subsidy provided the minimum coverage is 4 0 ha.
3 Farm Mechanization (Including Central Assistance if any)
I) Tractor 50% of the cost, limited to Rs.90,000/- Tractors up to 40 PTO HP
ii) Power Tiller (a) Power Tiller of 8 BHP & above.@ 50% Of t h e cost, limited t o R s . 7 5 , 0 0 0 /-.
(b) 50% of the cost, limited to Rs.40,000/- Light weight power tiller below 8 BHP for hill regions.
54
iii) Self propelled Reaper, paddy
transplanter and other similar
self propelled machines.
Self propelled –
a) Paddy Reaper- @ 50 %of the cost limited
to Rs.80,000/-
b) Paddy Reaper cum binder- @ 50 %
limited to Rs.1,50,000/-
c) Walk behind type Transplanter - @ 75%
of the cost limited to Rs.1,50,000/-
d) Riding type Transplanter - 75% of the
cost limited to Rs.5,00,000/- to be paid
in 3 instalments in 3 years in the ratio
of 2:2:1 which can be availed by
Individual/ Agro Service Centres/
PACS/ LAMPS etc.
e) Seedling raising machine for transplanting mat
preparation @ 75% of the cost limited to
Rs.2,00,000/-
(other self propelled machines will be included
in the subsidy fold with approval of SLTC)
iv) Specialized power driven
equipments
Special power driven equipment like –
a) All type Axial flow threshers (tractor & power
tiller operated) @ 50% of the cost limited to
Rs.70,000/-.
b) Rotavator / Rotary tillers 75 % of the cost
limited to Rs.80,000/- .
c) Others like ground nut digger, potato
planter, potato digger, all type of power
weeders, brush cutter, post hole digger, straw
reaper etc - 50 % of the cost limited to
Rs.60,000/-
d) Post harvest machineries like Rubber roll
Sheller, Mini oil mill, Mini Dal Processing Unit, all
type of cleaner cum graders, Power ground
nut decorticator, Maize Sheller and other
related machines-75 % of the cost limited to
Rs.2,00,000/-
(other self propelled machines will be included in
the subsidy fold with approval of SLTC)
55

v) Power driven equipment (Tractor/ power tiller operated / Conventional implements)
Power driven equipment like all type of Tractor
/ power tiller drawn implements like –
a) Disc ploughs / harrows, all type of MB
ploughs, all type of tillers, ridgers, levellers,
power tiller trailer, etc. @ 50 % of the
cost limited to Rs.25,000/-
b) All type of seed cum fertilizer drills,
Zero till cum seed drills, etc. @ 75 %
of the cost limited to Rs.45,000/-
(other self propelled machines will be included
in the subsidy fold with approval of SLTC)
vi) a) Manually operated
implements / tools b)
Animal operated
implements / tools
@ 75% of the cost, limited to Rs.6,000/-
vii. Animal driven tool carrier 50% of the cost limited to Rs.12,000/- Animal
driven specialized implements viz.
(a) Multi tool bar / carrier / tropicultor (with minimum four attachments). (b)
Pre-germinated paddy seeder.
viii) Power Threshers (All types) 50% of the cost, limited to Rs.24,000/-
ix) Diesel/ Electric/ petrol/ kerosene pump sets up to 10 BHP/ 7.5 KW
Diesel/ Electric/ petrol/ kerosene centrifugal monobloc pump sets from 1 KW up to 7.5 KW @ 50% of the cost limited to
Rs.15,000/-
x) Laser Guided Leveller 75% of the cost, limited to Rs.3.00 lakh
xi) Plant Protection Equipment
a. Manual 50% of the cost, limited to Rs.1,600/-
b. Power operated 50% of the cost, limited to Rs.4,000/-
c. Tractor mounted 50% of the cost, limited to Rs.8,000/-
d. Aero-blast sprayer 50% of the cost, limited to Rs.50,000/-
xii) Combine Harvesters
(a) Self propelled track type 50% of the cost, limited to Rs.6.00 lakh
(b) Self propelled wheel type 50% of the cost, limited to Rs.6.00 lakh
56

(c) Tractor mounted combine 50% of the cost, limited to Rs.5.00 lakh
(Subsidy will be provided for combine only
exclusive of tractor)
xiii) Miscellaneous if any Any suitable machine/ implement will b e
included w i t h a p p r o v a l of SLTC.
57