agricultural export and economic growth in asean countries
37
AGRICULTURAL EXPORT AND ECONOMIC GROWTH IN ASEAN COUNTRIES By AYE MON MON KYAW THESIS Submitted to KDI School of Public Policy and Management In Partial Fulfillment of the Requirements For the Degree of MASTER OF PUBLIC POLICY 2017
-
Upload
khangminh22 -
Category
Documents
-
view
1 -
download
0
Transcript of agricultural export and economic growth in asean countries
AGRICULTURAL EXPORT AND ECONOMIC GROWTH IN ASEAN
COUNTRIES
By
AYE MON MON KYAW
THESIS
Submitted to
KDI School of Public Policy and Management
In Partial Fulfillment of the Requirements
For the Degree of
MASTER OF PUBLIC POLICY
2017

AGRICULTURAL EXPORT AND ECONOMIC GROWTH IN ASEAN
COUNTRIES
By
AYE MON MON KYAW
THESIS
Submitted to
KDI School of Public Policy and Management
In Partial Fulfillment of the Requirements
For the Degree of
MASTER OF PUBLIC POLICY
2017
Professor Siwook LEE
AGRICULTURAL EXPORT AND ECONOMIC GROWTH IN ASEAN
COUNTRIES
By
AYE MON MON KYAW
THESIS
Submitted to
KDI School of Public Policy and Management
In Partial Fulfillment of the Requirements
For the Degree of
MASTER OF PUBLIC POLICY
Committee in charge:
Professor Siwook LEE, Supervisor
Professor Junesoo LEE
Professor Dongseok KIM
Approval as of December, 2017
ABSTRCT
AGRICULTURAL EXPORT AND ECONOMIC GROWTH IN ASEAN COUNTIRES
By
AYE MON MON KYAW
Many of developing countries in ASEAN community are still depend on the agricultural
environment. This research applied the fixed effect and random effects regression model to
examine the impact of the primary product of agricultural export on the countries economics
growth in selected developing ASEAN countries. The study period is from 1995-2014 using year
dummy variables. The outcomes of the study show the primary products of agricultural raw
materials export is statistically significant on the inverse relation on the growth of economic. But
the manufactured export (non-agricultural export) is strongly and positively effect on the
economic development. Based on main finding of this research, this study concluded that the
domestically value-added processing should be encouraged instead of exporting raw material to
the foreign market. Over-reliance on primary agriculture export (raw material) may suffer
economic development of the country. The manufactured export should expand to rapid increase
of economic development.
ACKNOWLEDGEMANT
First and foremost, I would like to express my earnest gratitude to my supervisors Professor
Siwook Lee and Professor Junesoo Lee. I really appreciate for the inspiration from their
guidelines, the encouragement and constructive comments which received during research thesis
paper writing.
I am always grateful to my beloved parents and my sister because of their unbounded help and
hind encouragement.
I appreciate to Dr. Tin Htut, Permanent Secretory of Ministry of Agriculture, Livestock and
Irrigation of Myanmar for the permission, enthusiastic encouragement and giving opportunity to
attend this school. Dr Ye Tint Htun, Head of Department of Agriculture, Sayar U Than Kyaing, ,
Sayar U Hla Myint Aung, Sayar U Tint Lwin, Sayar U Kyaw Mg Mg and Daw Htar Htar Lwin
who are raised me with their hands wherever I need them.
I am not only really indebted but also would like to express my utmost gratitude to Dr. Cho Cho
San, Professor and Head, Department of Agricultural Economics, Dr Theingi Myint, Professor
and lecturer, assistant lecturer and demonstrators from Yezin Agricultural University for their
valuable advice in data analysis, kind help, invaluable suggestions and worth guidance leading
towards the successful completion of my research work. I really appreciate for her untiring
assistance, love, kindness, moral support, and understanding to me. And I also deeply thank the
YAU family for their understanding and supporting me.
I also thank my mutual friends and their supports. Without all of you, my stay at KDI cannot be.
This chance would not have been created without the financial support from KOICA. Therefore,
I am highly thankful to the founders and faculty members of KOICA-MDI Organization.

i
Table of Contents
I. INTRODUCTION ................................................................................................................... 1
1.1 Problem Statement ............................................................................................................... 3
1.2 Research objectives and Research question ..................................................................... 5
1.3 Organization of the Paper ................................................................................................. 5
II. LITERATURE REVIEW .................................................................................................... 6
2.1 Causality of Export and Economic Growth ..................................................................... 6
2.2 Empirical Findings on Agricultural Export and Economic Growth ................................ 7
III. METHODOLOGY AND DATA ....................................................................................... 10
3.1. Model Specification ........................................................................................................... 10
3.2. Method of Data Collection ................................................................................................. 13
3.3 Meaning of Variables ..................................................................................................... 14
3.3.1 Dependent Variable ............................................................................................... 14
3.2.2 Explanatory variables ................................................................................................... 15
IV. RESULTS OF EMPIRICAL ANALYISIS AND RELATED DISCUSSION .................. 16
V. SUMMARY AND POLICY IMPLICATIONS ................................................................... 24
5.1 Summary ............................................................................................................................. 24
5.2 Policy Recommendation ............................................................................................... 25
APPENDICES ............................................................................... Error! Bookmark not defined.
REFERENCES ............................................................................................................................. 28

ii
List of Tables
Table 1. Descriptive Statistics ..................................................................................................................... 16
Table 2. Result of Unit Root Test ............................................................................................................... 17
Table 3. Regression Result of the Impact of Agriculture Export on Economic Growth ............................ 17
Table 4. Fixed Effect Regression with time dummy variable ..................................................................... 20
Table 5. Panel Regression result of Growth Equation ................................................................................ 22

1
I. INTRODUCTION
The relationship between export and economic growth is an interesting global issue in both
developed and less developed countries. Export growth is also the major engine of economic
growth. (CORBO, KRUEGER, A. O, & OSSA, 1985) said that “export growth can be the
determinant of development of economy in any nation, while some considered it to be the key
indicators t of the production and employment improvement which is reflected in the gross
domestic product (GDP) growth”. Export growth creates flow of foreign exchange, which
stimulates the nation’s capacity to produce in the long run. Generation of foreign exchange can
contribute to the importing of manufactured good, capital goods and technology. Comparative
advantages of trade produce significant better effect, such as improve in management efficiency,
advanced manufacturing system and experienced profession about production design which lead
to economic growth. Most of literature focus on the export growth as an engine of growth,
agriculture’s contribution to total export is often contribute as major role in developing countries.
Many developed countries have approved the export-led growth backed by empirical evidence
and various theoretical justifications. According to the Keynesian theory, increase in export
brings increase in earning via foreign money enhancer within short duration. Moreover, the more
money from abroad is generated, the more import of production factors like capital goods,
manufacture goods and technology can lead to economic development. Competition through the
promotion of exports can raise the level of production, technology development and efficient
capital utilization. There are also many positive externalities like collecting the information and
knowledge of better idea and new implication and positive learning from skilled person of
production experiences to more export, which leads to economic growth.

2
“Until recently, research on the relation between agricultural export and economics growth has
not been given serious attention. In the developing world, the main stream of national income is
flow from agriculture sector, which why many researchers believe that the relation between
agricultural export and economic is a worthwhile to investigate” (VERTER & BEČVAŘOVA,
V, 2014). Some controversies are focusing on issue in agriculture trade. International trade
imports and exports diversity of commodities which help plenty of choice in partner countries.
Although balanced of growth can be elevated by agricultural exports in all countries involved if
only contention linked to the global trade in unprocessed agricultural goods such as trade
restriction and distortions are faced (Anderson and Martin, 2005).
Agriculture sector is one of the major sectors of ASEAN countries’ development, nobody deny
that rural development of these countries heavily relies on this sector. Since Southeast Asia has
a different nature of topography, ASEAN rich in source of food and variety of agriculture
product. A number of commodities stand at the particular position among top global exporters
especially in export of stable commodities of livelihood such as rice, fruits, vegetables, and
coffee. Furthermore, ASEAN is also a major exporter in industry corps. Many ASEAN member
states establish certain bilateral and multilateral trade network in these products with trade
partner countries across the world. As the result, development of the agriculture sector still play
major role in ASEAN community. Vietnam stand first place in rice export in 2014, followed by
Thailand and the Philippines stand second and third respectively among the community
Myanmar is the leading country in exporting peas and bean large volume to India and the world.
According to US statistics, “over $10 billion in agricultural goods were exported from ASEAN in
2015, including over $700 million in tree nuts and $850 million in dairy products. ASEAN is the
6th largest importer of US agricultural goods, and the 3rd largest in Asia after China and Japan.

3
ASEAN is also the top global rubber and palm oil exporter, responsible for 75% and 89% of
global production respectively in 2014” (US Statistics, 2015). According to these facts,
agriculture is the major source of job opportunity for local communities in less developed
economies.
The percentage of entire employment in ASEAN, approximately 25 percent has been contributed
by agriculture, forestry and fishing sectors which has continuously decreased over the past
decades. Specifically, ratio of enrollment in farming becomes somewhat decreased due to
globalization and urbanization and labor move their occupation to the industry sector.
Agriculture sector has been facing labor scarcity problem due to the migrate working to abroad
to get higher salary. Even though lesser working in this sector, more than half of total
employment is still devoted, in some countries like Vietnam, Myanmar, Thailand and Laos.
Except Singapore, agrarian community still the key area of most of the ASEAN population.
Agriculture is the potential tool for poverty reduction. As an empirical example, accelerate
agricultural development has also to be sure means of efficient way in reduction of poverty
empirical evidence in Vietnam. Similarly, Cotsomitis and Kwok found that “an increase in
overall GDP arising from agricultural labour productivity is on average 2.9 times more effective
in raising the incomes of the poorest quintile in developing countries than an equivalent increase
in GDP coming from non-agricultural labor productivity. Comparable results hold for the
agricultural growth-poverty linkages at the country level” (Kwan & Cotsomitis, 1996).
1.1 Problem Statement
Athukorala (1991) noted that trade policy remained the center of debate on economic policy
making in developing countries. When the government tries to adapt international trade, trade

4
policy has influenced the level and composition of import allocation, income distribution of
structural production and development structure of the economy. The nature of trade regime, the
mechanism could have the critical management of resource allocation and labor-force efficiency
of nation economy.
The globalization economy opens up the new opportunities for multinational corporations.
Krueger (1984) argued that trade openness brings advantages such as export expansion. To be
more specific, the relative importance of national policies and exported oriented policy for
external market demand has been widely debated in different literature. ASEAN members signed
the ASEAN Free Trade Area (AFTA) in 1992, which reduced import quotas significantly
eliminate import tariffs. Agriculture production and output are sharply increase after trade
liberalization. Products from each country need to be more competitive to overcome the sensitive
list of unprocessed products to get agriculture development (Mahadevan, 2003).
Johnston and Mellor (1986) said that moving forward, expansion of agriculture export is the
fundamental means of increasing income and foreign earning. For many less developed countries
and developing countries, more than half of the population relies on the agriculture sector.
Agriculture is the major employment source and plays a key role in poverty reduction.
Agriculture trade remains a crucial part of overall economic activities and domestic agricultural
production employment. Although productivity increases for domestic consumption, the big
challenge is that export earnings have relied more on only a small number of exportable
commodities. Many countries suffer from the price discrimination because of heavily rely on the
income from traditional primary product agriculture.
Meanwhile, agricultural exports are failed to meet the international market because ASEAN
regional produce has been left to compare with cheap imports generated by the subsidies given to
5
producers in developed countries. In order to diversify and improve the economy, most countries
have focused on primary agricultural product exports as a means of stimulating growth.
However, the impact of agricultural raw material exports on economic development of
developing ASEAN countries remains unclear.
1.2 Research objectives and Research question
The study intends to ascertain the level of impact that agricultural raw product exports have on
the economic growth of ASEAN countries using a panel analysis which spans from 1995 to 2014
and focuses on the eight developing ASEAN countries. The study is apt because it will provide a
platform for assessing the impact of agricultural exports on the economic growth of ASEAN
member countries, which will aid decision-making and policy formulation towards developing a
synergy in stimulating the growth process of the ASEAN region.
The research question of this study is “Can agricultural export lead the economic growth of
developing countries?”
1.3 Organization of the Paper
This study is structured into five sections. Section 1 is about the introduction and background of
the study. Section 2 will review the theories and previous research concerning with the impact of
export of agricultural product on economic growth. Section 3 will explain the research
methodology and data. Section 4 will be explained the statistical interpretation of how much the
dependent variable has been effect by the explanatory variables and the discussion of results.
Section 5 will provide summary and conclusion.

6
II. LITERATURE REVIEW
2.1 Causality of Export and Economic Growth
This study will look into the impact of agricultural exports on economic growth of developing
ASEAN countries. Many scientists have recently researched the correlation of exports and
economic development from various point of view and using different analysis method. The
outcome of each research still mixed. Most of studies have strong prof positive effects of the
export growth especially agricultural products, admitting that there might also be negative
influence in a certain analysis.
Theoretically speaking that export-led growth can promote economic growth conversely
according to the growth theory. There are various theoretical and practical explanations why
these two variables are related to each other. The growth of export increases the total
productivity of output which stimulates the capital formation positively. Trade implies that a
country gets better access to stimulate the outside demand, which acts as a stimulus not only to
domestic(inside) output but also foreign market which creates the incentive to highly productive
export sector. Flow of foreign exchange can be created to raising growth of export which
provides import of other factor of production like manufactured good and technology.
Competition ensures comparative advantages and efficient management of resource allocation by
applying better production technology which leads to economic growth.
Growth of output leads to the growth of export. Some authors provide evidence work supporting
the fact that growth of export will leads economic growth to export-led-growth (ELG) hypothesis
(Arnade etal,1995) and other researcher discovered the evidence in support of growth-led-export
(GLE) hypothesis (Thornton,1996). Under growing economy, firms are facing technology
innovation thorough foreign direct investment. Export-oriented policies contribute to the output

7
growth expansion to the overseas market rather than focusing only on the domestic demand.
Another possible hypothesis shows the inverse causality runs from output growth to export
growth. Increase in domestic demand of output of non-exportable and nontraded good will
reduce the export concentration. Therefore, it is easier to identify negative relationship between
increase in productivity and the exports growth (Bhagwati 1979).
2.2 Empirical Findings on Agricultural Export and Economic Growth
Ekanayake (1999) examined the causality between overall commodities export increase and
economic development. The author made analysis the annual time series data of eight Asian
developing countries covering the period of 1960 to 1997 by using two method of co-integration
model and error-correction model. This study provided the positive relation between the higher
the export the grower economy by proofing the causality among seven of the eight countries
except Malaysia. There was significant result for long-run Granger causality between the
variables used in all countries.
In another study, Dawson (2005) analyzed the major export commodities of agriculture to in
under developing countries. The study was applied with two theoretical models in the analysis,
source-of-growth equation developed from dual economy model including both agricultural and
manufactured exports where each sector. Panel data of 62 LDC countries during the study 1974‒
1995 has been analyzed using fixed and random effects estimator. The study encourages export
lead growth theory and highlighted a balance of export promotion policies.
Empirically, Sanjuán-López and Dawson (2010) tried to access the correlation between GDP
growth and these two sectors using panel cointegration methods in 42 countries. Vigorous suppot
of evidence showed long-run causality between those variables. Thus, confirming the export-led
growth hypothesis for the 42 countries under these studies.
8
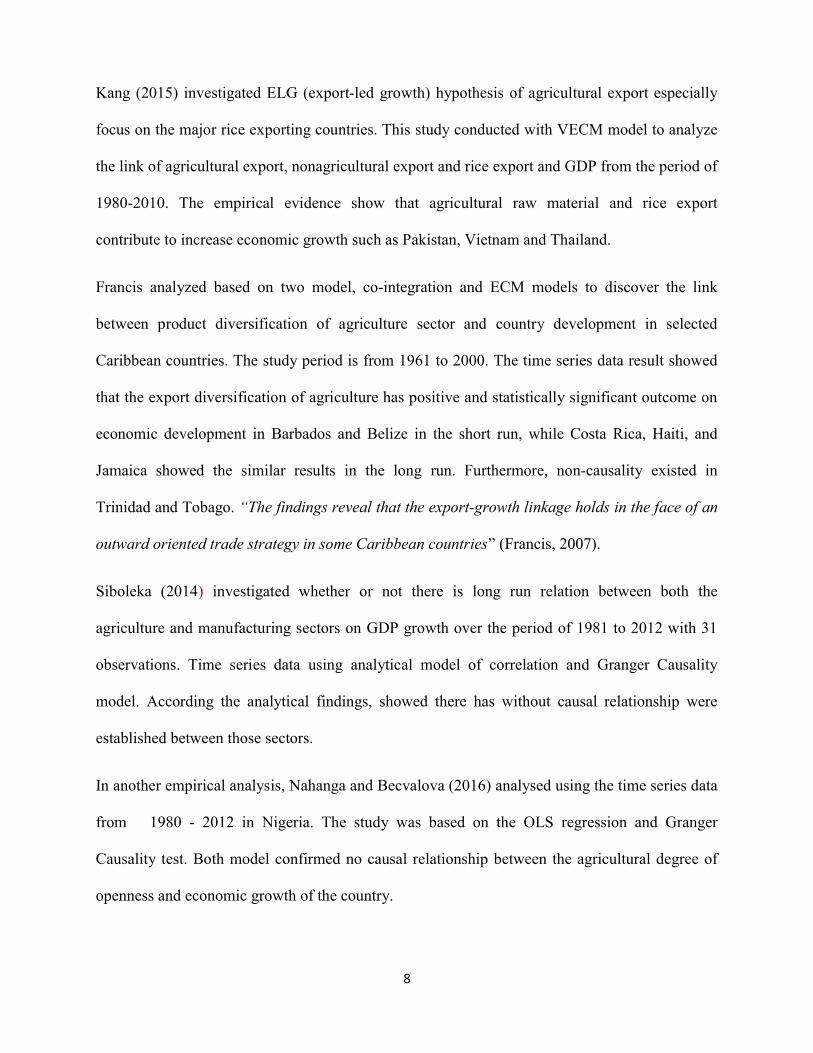
Kang (2015) investigated ELG (export-led growth) hypothesis of agricultural export especially
focus on the major rice exporting countries. This study conducted with VECM model to analyze
the link of agricultural export, nonagricultural export and rice export and GDP from the period of
1980-2010. The empirical evidence show that agricultural raw material and rice export
contribute to increase economic growth such as Pakistan, Vietnam and Thailand.
Francis analyzed based on two model, co-integration and ECM models to discover the link
between product diversification of agriculture sector and country development in selected
Caribbean countries. The study period is from 1961 to 2000. The time series data result showed
that the export diversification of agriculture has positive and statistically significant outcome on
economic development in Barbados and Belize in the short run, while Costa Rica, Haiti, and
Jamaica showed the similar results in the long run. Furthermore, non-causality existed in
Trinidad and Tobago. “The findings reveal that the export-growth linkage holds in the face of an
outward oriented trade strategy in some Caribbean countries” (Francis, 2007).
Siboleka (2014) investigated whether or not there is long run relation between both the
agriculture and manufacturing sectors on GDP growth over the period of 1981 to 2012 with 31
observations. Time series data using analytical model of correlation and Granger Causality
model. According the analytical findings, showed there has without causal relationship were
established between those sectors.
In another empirical analysis, Nahanga and Becvalova (2016) analysed using the time series data
from 1980 - 2012 in Nigeria. The study was based on the OLS regression and Granger
Causality test. Both model confirmed no causal relationship between the agricultural degree of
openness and economic growth of the country.
9
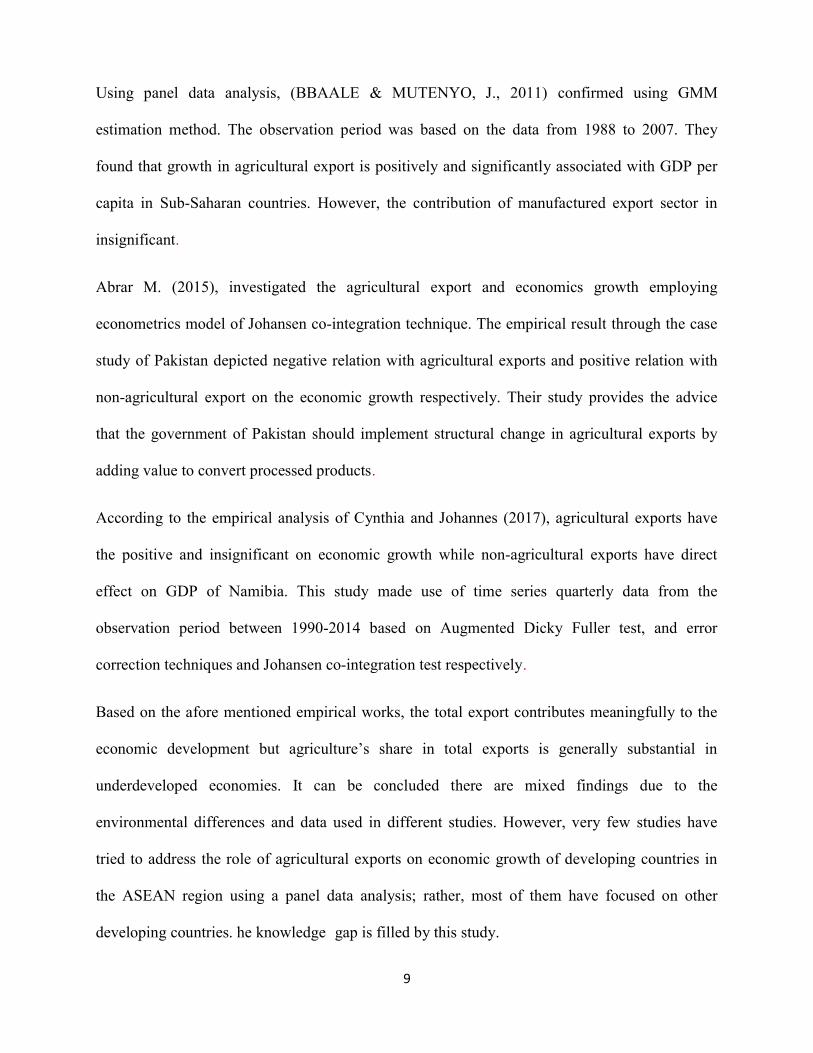
Using panel data analysis, (BBAALE & MUTENYO, J., 2011) confirmed using GMM
estimation method. The observation period was based on the data from 1988 to 2007. They
found that growth in agricultural export is positively and significantly associated with GDP per
capita in Sub-Saharan countries. However, the contribution of manufactured export sector in
insignificant.
Abrar M. (2015), investigated the agricultural export and economics growth employing
econometrics model of Johansen co-integration technique. The empirical result through the case
study of Pakistan depicted negative relation with agricultural exports and positive relation with
non-agricultural export on the economic growth respectively. Their study provides the advice
that the government of Pakistan should implement structural change in agricultural exports by
adding value to convert processed products.
According to the empirical analysis of Cynthia and Johannes (2017), agricultural exports have
the positive and insignificant on economic growth while non-agricultural exports have direct
effect on GDP of Namibia. This study made use of time series quarterly data from the
observation period between 1990-2014 based on Augmented Dicky Fuller test, and error
correction techniques and Johansen co-integration test respectively.
Based on the afore mentioned empirical works, the total export contributes meaningfully to the
economic development but agriculture’s share in total exports is generally substantial in
underdeveloped economies. It can be concluded there are mixed findings due to the
environmental differences and data used in different studies. However, very few studies have
tried to address the role of agricultural exports on economic growth of developing countries in
the ASEAN region using a panel data analysis; rather, most of them have focused on other
developing countries. he knowledge gap is filled by this study.
10
III. METHODOLOGY AND DATA
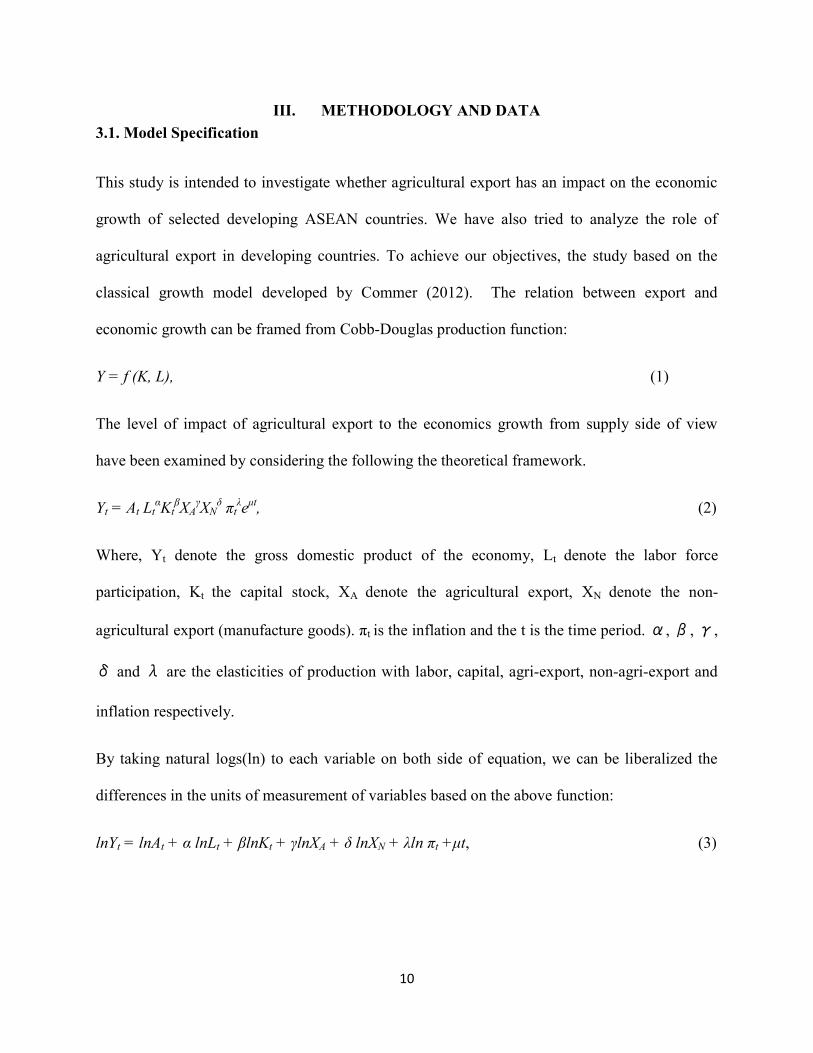
3.1. Model Specification
This study is intended to investigate whether agricultural export has an impact on the economic
growth of selected developing ASEAN countries. We have also tried to analyze the role of
agricultural export in developing countries. To achieve our objectives, the study based on the
classical growth model developed by Commer (2012). The relation between export and
economic growth can be framed from Cobb-Douglas production function:
Y = f (K, L), (1)
The level of impact of agricultural export to the economics growth from supply side of view
have been examined by considering the following the theoretical framework.
Yt = At LtαKt
βXAγXN
δ πtλeμt, (2)
Where, Yt denote the gross domestic product of the economy, Lt denote the labor force
participation, Kt the capital stock, XA denote the agricultural export, XN
denote the non-
agricultural export (manufacture goods). πt is the inflation and the t is the time period. α, β, γ,
δ and λ are the elasticities of production with labor, capital, agri-export, non-agri-export and
inflation respectively.
By taking natural logs(ln) to each variable on both side of equation, we can be liberalized the
differences in the units of measurement of variables based on the above function:
lnYt = lnAt + α lnLt + βlnKt + γlnXA + δ lnXN + λln πt +μt, (3)
11
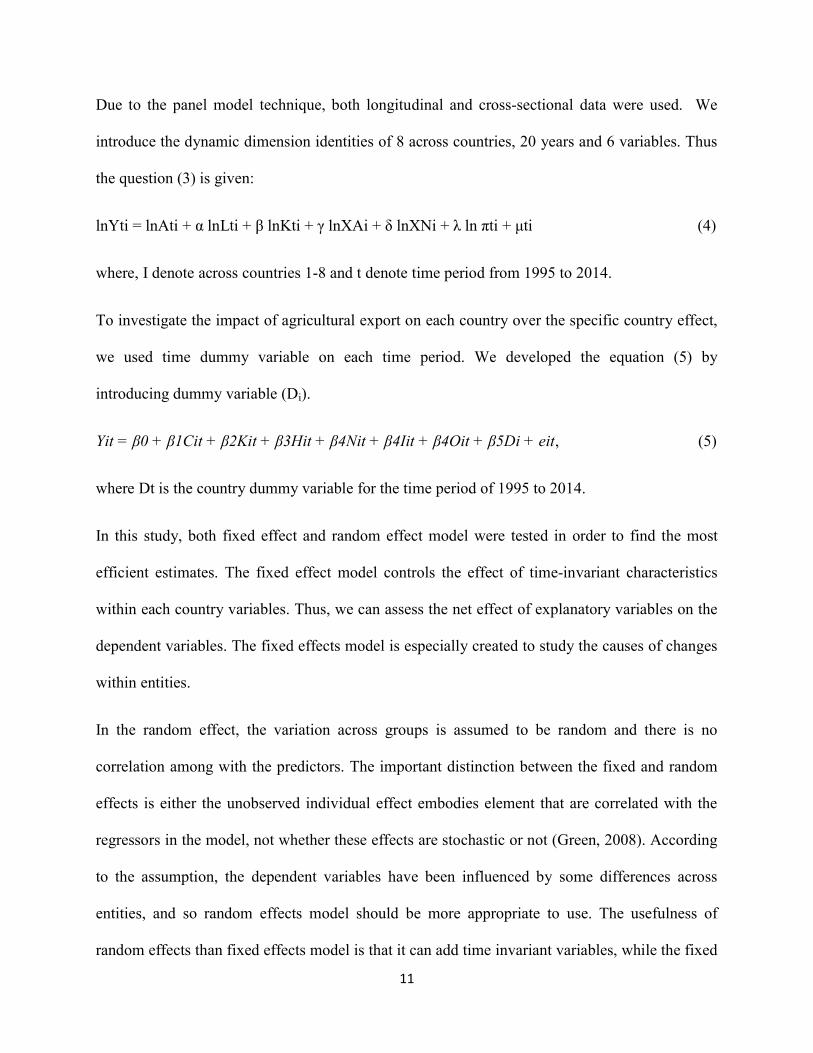
Due to the panel model technique, both longitudinal and cross-sectional data were used. We
introduce the dynamic dimension identities of 8 across countries, 20 years and 6 variables. Thus
the question (3) is given:
lnYti = lnAti + α lnLti + β lnKti + γ lnXAi + δ lnXNi + λ ln πti + μti (4)
where, I denote across countries 1-8 and t denote time period from 1995 to 2014.
To investigate the impact of agricultural export on each country over the specific country effect,
we used time dummy variable on each time period. We developed the equation (5) by
introducing dummy variable (Di).
Yit = β0 + β1Cit + β2Kit + β3Hit + β4Nit + β4Iit + β4Oit + β5Di + eit, (5)
where Dt is the country dummy variable for the time period of 1995 to 2014.
In this study, both fixed effect and random effect model were tested in order to find the most
efficient estimates. The fixed effect model controls the effect of time-invariant characteristics
within each country variables. Thus, we can assess the net effect of explanatory variables on the
dependent variables. The fixed effects model is especially created to study the causes of changes
within entities.
In the random effect, the variation across groups is assumed to be random and there is no
correlation among with the predictors. The important distinction between the fixed and random
effects is either the unobserved individual effect embodies element that are correlated with the
regressors in the model, not whether these effects are stochastic or not (Green, 2008). According
to the assumption, the dependent variables have been influenced by some differences across
entities, and so random effects model should be more appropriate to use. The usefulness of
random effects than fixed effects model is that it can add time invariant variables, while the fixed

12
effect model is absorbed by the intercept. The random effects model equation can be generated
from equation (4) :
Yit = β0 + β1Cit + β2Kit + β3Hit + β4Nit + β4Iit + β4Oit + β5Di + eit +μit (6)
To know the most appropriate way to carrying out this analysis, we used the Hausman test.
Based on the result of Hausman test, we decided the fixed effect and random effect which is
more appropriate for this analysis. The null hypothesis is no correlation between unique error (ui)
and the regressors and the alternative hypothesis are correlated with each other. If the null
hypothesis is rejected, we can conclude that the correlation is relevant and panel fixed effect is
the appropriate way to analyze the relationship of agricultural export and economic growth.
From the other point of view, if the null hypothesis fails to be rejected, the correlation is not
relevant and panel model of random effects is appropriate. The Hausman test model can be
represented as:
H = (b1 – b0)1 (Var (b1) – Var (b1) χ (b1 – b0), (7)
Moreover, we generate the Level equation from equation (4) in order to estimate the time effect
by adding time dummy.
lnrealgdpwb = α0+ α1lnagriex+ α2 lnmanuex + α3 GCFofGDP + α4 inf + α5 lnl + et (8)
lnrealgdpwb = β0+ α1lnagriex+ β2 lnmanuex + β3 GCFofGDP + β4 inf + β5 lnl + β6Dt + et (9)
Where lnrealgdpwb is natural log of the real GDP, lnagriex is the natural log of agricultural
export, lnmuex is the natural log of manufacture export, GCF of GDP is the gross capital
formation (% of GDP), inf is the inflation(CPI) and lnl is the natural logof laborforce
participation and et is the error term.
13
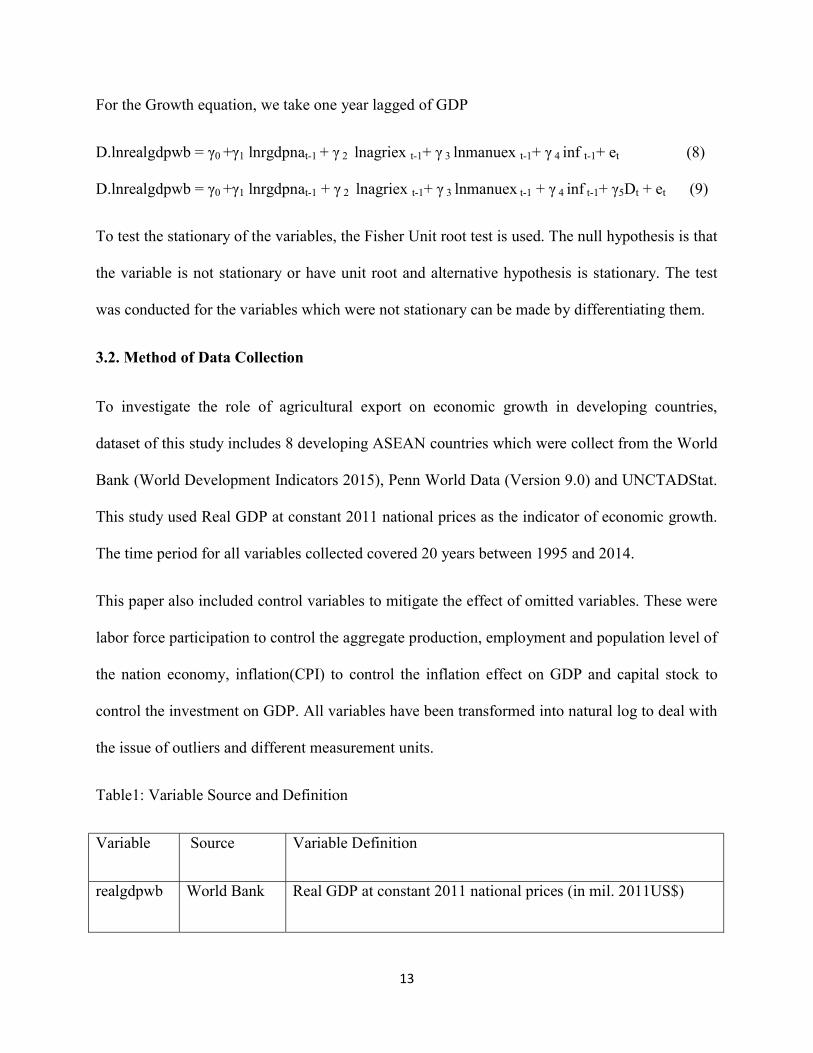
For the Growth equation, we take one year lagged of GDP
D.lnrealgdpwb = γ0 +γ1 lnrgdpnat-1 + γ 2 lnagriex t-1+ γ 3 lnmanuex t-1+ γ 4 inf t-1+ et (8)
D.lnrealgdpwb = γ0 +γ1 lnrgdpnat-1 + γ 2 lnagriex t-1+ γ 3 lnmanuex t-1 + γ 4 inf t-1+ γ5Dt + et (9)
To test the stationary of the variables, the Fisher Unit root test is used. The null hypothesis is that
the variable is not stationary or have unit root and alternative hypothesis is stationary. The test
was conducted for the variables which were not stationary can be made by differentiating them.
3.2. Method of Data Collection
To investigate the role of agricultural export on economic growth in developing countries,
dataset of this study includes 8 developing ASEAN countries which were collect from the World
Bank (World Development Indicators 2015), Penn World Data (Version 9.0) and UNCTADStat.
This study used Real GDP at constant 2011 national prices as the indicator of economic growth.
The time period for all variables collected covered 20 years between 1995 and 2014.
This paper also included control variables to mitigate the effect of omitted variables. These were
labor force participation to control the aggregate production, employment and population level of
the nation economy, inflation(CPI) to control the inflation effect on GDP and capital stock to
control the investment on GDP. All variables have been transformed into natural log to deal with
the issue of outliers and different measurement units.
Table1: Variable Source and Definition
Variable Source Variable Definition
realgdpwb World Bank Real GDP at constant 2011 national prices (in mil. 2011US$)

14
agriex UNCTADStat Agricultural exports primary products rather than value added
products. (SITC Rev.3 product group)
manuex UNCTADStat Non-agricultural exports consist of manufactured goods (SITC
Rev.3 product group)
inf World Bank Inflation, consumer prices (annual %)
l Penn World
Table (9.0)
Labor Force, Number of persons engaged (in millions)
GCFofGDP World Bank Gross fixed capital formation (% of GDP)
3.3 Meaning of Variables
3.3.1 Dependent Variable
Real Gross Domestic Product (realgdpwb)
This was the dependent variable because we are focusing on the relation between the real GDP
and agricultural export in developing ASEAN countries. It is defined as “the sum of gross value
added by all resident producers in the economy plus any product taxes and minus any subsidies
not included in the value of the products. It is calculated without making deductions for
depreciation of fabricated assets or for depletion and degradation of natural resources. These
data are based on constant US dollar”. (World Bank, 2017)
15
3.2.2 Explanatory variables
Agricultural export (agriex)
This refers to total export of raw material of agricultural products excluding oil seeds and
oleaginous fruits, crude fertilizer other than division 56 and crude materials and metalliferous
ores and metal scrap.(UNCTAD stat SITC Rev.3 product group 2 less 22,27 and 28)
Manufactured export (manuex)
This includes miscellaneous manufactured articles, manufacture goods, industrial equipment and
transport equipment and chemical and related products, by excluding pearls, precious and semi-
precious stone, non-ferrous metal. (UNCTAD stat SITC Rev. 3 product group 5,6 and 7 less 667
and 68)
Inflation (inf)
Inflation as measured by “the consumer price index reflects the annual percentage change in the
cost to the average consumer of acquiring a basket of goods and services that may be fixed or
changed at specified intervals, such as yearly. The Laspeyres formula is generally used”. (World
Bank, 2017)
Gross Fixed Capital Formation (GFC%ofGDP)
Gross fixed capital formation includes “land improvements (fences, ditches, drains, and so on);
plant, machinery, and equipment purchases; and the construction of roads, railways, and the
like, including schools, offices, hospitals, private residential dwellings, commercial and
industrial buildings. According to the 1993 SNA, net acquisitions of valuables are also
considered capital formation. Data are in current U.S. dollars”. (World Bank, 2017)
Labor Force Participation Rate (lnl)
It is the total employment of the labor, number of person engaged in million.

16
IV. RESULTS OF EMPIRICAL ANALYISIS AND RELATED DISCUSSION
Table 1. Descriptive Statistics
Panel A: Summary Statistics
lnRealGDPWB lnagriex lnmanuex GCFofGDP lnl inf
Mean 25.05 13.06 16.03 23.86 2.64 6.69 S.D. 1.5 2.65 2.22 7.76 1.85 9.43 Min 22.02 4.11 11.54 10.15 -2.08 -2.31 Max 27.57 16.6 18.93 43.64 4.75 58.39
Panel B: Correlation Matrix
lnRealGDPWB lnagriex lnmanuex GCFofGDP lnl inf lnRealGDPWB 1 lnagriex 0.736 1 lnmanuex 0.864 0.763 1 GCFofGDP 0.404 0.234 0.362 1 lnl 0.661 0.858 0.635 0.152 1 inf -0.051 0.145 -0.15 -0.272 0.279 1
From Table 1 Panel, this table show the descriptive statistics of the data series. The maximum
value of agricultural product export is 16.6 and the minimum value is 4.22. The means of
average is 13.06. The maximum value of manufacture export is 18.93 and the minimum value is
11.54. The mean of average is 16.03. According to the statistical value, we can realize that our
variables can meet the qualification to apply in the regression analysis and they do not found the
outlier.
From the aforementioned Table 1 Panel B, it is shown that inf (inflation) is negatively related to
lnRealGDPWB. lnRealGDPWB is also positively related to lnagriex, lnmanuex and GCFofGDP.
Lnagriex, lnmanuex and GCFofGDP is positively correlated with each other. Inflation is
positively correlated with agricultural export and negatively correlated with the rest of variables.

17
Table 2. Result of Unit Root Test
Variables Difference Statistics
Economic Growth First Difference -5.2199 (0.0000)***
Agricultural Export First Difference -5.1066 (0.0000)***
Non-agricultural Export First Difference -4.9493( 0.0000)***
Labor Force Participation First Difference -2.9192 (0.0018)***
Capital Stock First Difference -4.3655( 0.0000)***
Inflation(CPI) First Difference -4.5262( 0.0000)***
Source: Author's own calculation
Before estimating the model, I tested the data whether each data series in both cross section and
year are non-stationary or stationary by using the panel unit root test. The model of Levin-Lin-
Chu panel Unit root test was applied to conduct the test for unit root in order to analysis the
stationary. Table 2 presents the result of the unit root test and reveals that all variables used in
this study are stationary at first difference level. Therefore, this result strongly rejects the null
hypothesis of all panel contain unit root test.
Table 3. Regression Result of the Impact of Agriculture Export on Economic Growth
Pool OLS Fixed Effect Random Effect VARIABLES lnRealGDPWB lnRealGDPWB lnRealGDPWB lnagriex 0.016 0.049*** 0.071***
(0.050) (0.018) (0.019) lnmanuex 0.471*** 0.172*** 0.230***
(0.044) (0.026) (0.025) GCFofGDP 0.025*** 0.008*** 0.008***
(0.008) (0.002) (0.002) inf 0.006 -0.007*** -0.007***
(0.007) (0.002) (0.002) lnl 0.132** 1.268*** 0.762***
(0.062) (0.151) (0.120) Constant 16.295*** 18.144*** 18.280***
(0.560) (0.278) (0.407)
Observations 160 160 160 Number of group 8 8 R-squared 0.782 0.833 0.833 Standard errors in parentheses
18
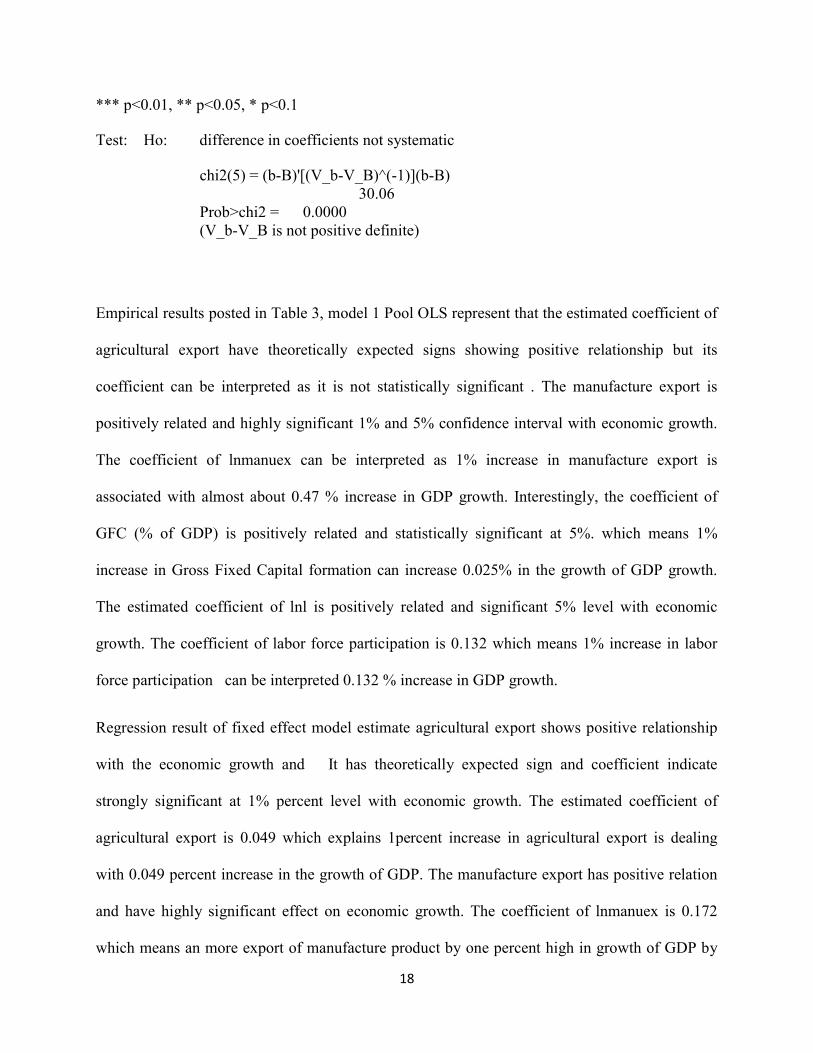
*** p<0.01, ** p<0.05, * p<0.1
Test: Ho: difference in coefficients not systematic
chi2(5) = (b-B)'[(V_b-V_B)^(-1)](b-B) 30.06
Prob>chi2 = 0.0000 (V_b-V_B is not positive definite)
Empirical results posted in Table 3, model 1 Pool OLS represent that the estimated coefficient of
agricultural export have theoretically expected signs showing positive relationship but its
coefficient can be interpreted as it is not statistically significant . The manufacture export is
positively related and highly significant 1% and 5% confidence interval with economic growth.
The coefficient of lnmanuex can be interpreted as 1% increase in manufacture export is
associated with almost about 0.47 % increase in GDP growth. Interestingly, the coefficient of
GFC (% of GDP) is positively related and statistically significant at 5%. which means 1%
increase in Gross Fixed Capital formation can increase 0.025% in the growth of GDP growth.
The estimated coefficient of lnl is positively related and significant 5% level with economic
growth. The coefficient of labor force participation is 0.132 which means 1% increase in labor
force participation can be interpreted 0.132 % increase in GDP growth.
Regression result of fixed effect model estimate agricultural export shows positive relationship
with the economic growth and It has theoretically expected sign and coefficient indicate
strongly significant at 1% percent level with economic growth. The estimated coefficient of
agricultural export is 0.049 which explains 1percent increase in agricultural export is dealing
with 0.049 percent increase in the growth of GDP. The manufacture export has positive relation
and have highly significant effect on economic growth. The coefficient of lnmanuex is 0.172
which means an more export of manufacture product by one percent high in growth of GDP by
19
0.172 percentage point. Interestingly, GFC (% of GDP) is positively related and statictically
strongly significant at 5% level. The coefficient of GFCofGDP is about 0.008 which means 1%
increase in Gross Fixed Capital formation is associated with approximately 0.008% raise in
growth of GDP. The estimate coefficient of inflation have the expected sign between dependent
variable and independent variable.The inf is negativerelation and highly significant at 1% and
5% level . The estimated coefficient of inflation is 0.007 which means inflation increase by 1
percentage ed the growth of GDP decreade by 0.007 percentage point. The estimated coefficient
of labor force participation has supposed sign and which is positive relation with economic
growth. The coefficient of labor force participation is 1.268 and strongly significant which
means 1% increase in manufacture export can be explain 1.268 % increase in GDP
Regression result of random effect model shows agricultural export exhibits direct relationship
with variable we are focusing on and its expected coefficient is highly significant at 1% and 5%
level. The estimate result of agricultural export is 0.071 which means 1% increase in agricultural
export GDP increase by 0.071 percentage point. The manufacture export is positively related and
statistically significant 1% and 5% with economic growth. The coefficient of lnmanuex is 0.230
which means 1% increase in manufacture export, economy growth by 0.230 percentage.The
estimated sign of GFC (% of GDP) is positively related with independent variable. The
coefficient of GFCofGDP is 0.008 which means in Gross Fixed Capital formation increase by
1% which help to increase 0.008% in GDP growth. The expected sign of inf is inverse relation
with development of economic. The highly significant of coefficient of inflation is 0.007 which
means 1% increase in manufacture export can decrease approximately 0.007 % in GDP growth.
The labor lnl is positively related and strongly significant at 1% and 5% with economic growth.
The coefficient of labor force participation is 0.762 which means 1% raise in export of
manufacture product is associated with approximately 0.762 % higher in GDP growth.

20
Table 4. Fixed Effect Regression with time dummy variable
Model (1) Model (2) VARIABLES lnRealGDPWB lnRealGDPWB lnagriex 0.049*** -0.040**
(0.018) (0.012) lnmanuex 0.172*** 0.168***
(0.026) (0.040) GCFofGDP 0.008*** 0.007
(0.002) (0.007) inf -0.007*** -0.005*
(0.002) (0.002) lnl 1.268*** -0.170
(0.151) (0.726) (0.177) (0.382)
Year Dummy No Yes Constant 18.144*** 22.830***
(0.278) (1.618)
Observations 160 160 Number of count1 8 8 R-squared 0.833 0.885 Robust standard errors in parentheses *** p<0.01, ** p<0.05, * p<0.1
The Regression output from Table 4 shows that agricultural export exhibits positive relationship
with economic growth and its coefficient is statistically highly significant at 1% confidence
interval. The coefficient of agricultural export is 0.049 which means 1% increase in agricultural
export can increase nearly 0.049 % in GDP growth. The manufacture export is positively
related and highly significant 1% and 5% with economic growth. The coefficient of lnmanuex is
0.172 which means manufacture export increase by one percent associated with almost 0.172%
increase in GDP growth. Interestingly, GFC (% of GDP) has positive relation. The coefficient of
GFCofGDP significant at 5 percent level which means 1% increase in Gross Fixed Capital
formation is indicated with nearly 0.008% more in GDP growth. The expected sign of inf is
negatively related with GDP and coefficient is highly significant at 1% The coefficient of
21
inflation explains 1% increase in manufacture export is associated with approximately 0.007 %
decrease in GDP growth. The lnl is positively related and statistically significant at 1% and 5%
with economic growth. The coefficient of labor force participation is 1.268 which means
increase in 1% of manufacture export brings 1.268 % increase in GDP growth.
In Table 4 model 2, we add time dummy variable to investigate year-specific effect. Considering
the year-specific effect, the result represents agricultural export become negative correlation and
significant at 5% level. The coefficient of agricultural export is 0.040 which means 1% increase
in agricultural export is associated with an approximately 0.040 decrease in GDP growth.
Moreover, the manufacture exports become positively correlated and statistically significant 1%
and 5% with economic growth. The coefficient of lnmanuex is 0.168 which means manufacture
product export is increase by 1 % which relatively high 0.168% in GDP growth. Interestingly,
GFC (% of GDP) is positively related and statistically insignificant. The inf is negatively related
and statistically significant at 10% with economic growth. The coefficient of inflation is 0.007
which means 1% increase in manufacture export is associated with approximately 0.007 %
decrease in GDP growth. The lnl is negatively related and statistically insignificant with GDP
growth.
Although the impact of agro- product exports on growth of economic with year specific was
weak, there was an overall positive relationship between agricultural raw material exports and
economic growth in this region. However, the result also means that the agricultural exports has
not contributed to the growth process in ASEAN counties.

22
Table 5. Panel Regression result of Growth Equation
Growth Equation
Model (3) Model (4) VARIABLES D.lnRealGDPWB D.lnRealGDPWB
L.lnRealGDPWB -0.956*** -0.039062**
(0.141) (0.017261) L.lnagriex -0.356*** 0.000217
(0.069) (0.004041) L.lnmanuex 0.083 0.011288**
(0.112) (0.005576) L.inf 0.001 -0.000285
(0.014) (0.000320) (0.014724)
Year Dummy No Yes Observations 152 152
Number of count1 8 8 R-squared 0.3897 0.48613
Standard errors in parentheses 0.779 0.486 *** p<0.01, ** p<0.05, * p<0.1
The result of growth equation in table 4 model (3) shows agricultural export become negatively
correlated to economic development and strongly prof at both 1% and 5% level. The coefficient
of agricultural export is 0.356 which means 1% increase in agricultural export is associated with
approximately 0.356 % decrease in GDP growth. Moreover, the manufacture exports become
negatively correlated and statistically significant at 1% and 5% with economic growth. The
coefficient of lnmanuex is 0.083 which means 1% more in manufacture product export is
associated with approximately 0.083 % decrease in GDP growth. However, inflation is
statistically insignificant on the GDP growth.
Adding time specific effect in model (4), the regression result shows agricultural export become
positively correlated and statistically insignificant with economic growth. Moreover, the

23
manufacture exports become positively correlated and statistically significant 5% with economic
growth. The coefficient of lnmanuex is 0.0113 which means 1% higher in manufacture export,
0.0113% increase in GDP growth. However, inflation is statistically insignificant on the GDP
growth.
Considering the time-specific effects, the results indicate that agricultural exports had an inverse
relationship with economic growth during the years 1997, 1998, 2001, and 2009. The rest of the
study period showed weak the impact of agricultural exports on economic growth. Although a
positive relationship exists between agricultural exports and economic growth in the years 1997,
1998, 2001, and 2009, overall, agricultural exports have not contributed to the growth process in
ASEAN member counties and are insignificant to GDP growth.
24
V. SUMMARY AND POLICY IMPLICATIONS
5.1 Summary
This research attempts to examine the impact of agricultural raw material export on the growth
of GDP especially in developing agriculture based ASEAN countries. The rational of study is
located on selected developing ASEAN countries such as, Brunei Darussalam, Cambodia,
Indonesia, Thailand, Malaysia, Philippines, Viet Nam, Myanmar using of panel data series. The
study period is from 1995-2014 applying panel fixed effect model at level and growth equation
model using year dummy variables.
The following are the primary findings. The impact of variable we want to know is agricultural
product export which shows the positive relation on level fixed effect equation and inverse
relation on growth rate fixed effect regression. This is not so amazing by the reason of the export
product of agricultural by most developing countries are based on the primary products, i.e. raw
materials than the processing products. The price of the products is failed to compete in the
world market. study area of South East Asia is closely located to major competitors China and
India, and import of agricultural goods is high in some commodities. Well processed agricultural
goods have been enormously import from the developed countries. These commodities are
higher-value products and also higher in price. The unfavorable balance of trade in agriculture
export and import product may be the prominent reason of this negative outcome.
Our study also observed that non-agricultural export’s impact on improvement of nations
economy has which has positive relation with the economic growth. This result is our
expectations on this variable. There is a larger market for manufactured product export because
they are higher value-added product and the price are substantially high in globally demand.
Manufacture export sector provide more revenue and support to the country development than

25
agriculture sector in developing ASEAN countries. Consequently, this sector strongly reveals the
economic growth.
At the last, we can be made the decision that this study does not support the hypothesis of
export-led growth by the agriculture sector in developing ASEAN countries. On the other hand,
over-reliance on primary agriculture export (raw material) may suffer economic development of
the country. Agriculture diversification and value-adding to the product will be the fundamental
issue of the problem. Importing of higher value-added product from other should be discourage
by encouraging domestically agro-processing sector.
5.2 Policy Recommendation
Above discussion highlight the following policy implication,
i. Due to the outcome of the analysis, primary product of agriculture is the negatively
related to the country’s economic development in developing ASEAN. The government should
be changed the framework and arrangement of international trade. To perform the export-
oriented policy, the proportion of primary agricultural product should be reduced and the
manufactured goods should try to increase in the total share of export.
ii. To expand the manufactured products export (non-agricultural product), the government
should encourage the farming system from raw materials to final product and the domestically
processing industry. Tax abatement and tax avoidance should provide by the government as an
inducement to investor.
iii. The primary agro-products should be export as the value-added products instead of raw
materials. For instead – exporting paddy should be converted to the milled rice or parboiled rice
26
which are high price and demand in global market. This way will help to secure the benefit from
the agriculture sector.
iv. The competitive environment in the global market, modernized production practices and
facilities should be conduct. The global standard quantity and quality of the product will get the
high revenue and enhance the economic product.
v. The ASEAN member states already exit the strong foreign market for raw materials,
there will also exist the proper market for processing agricultural products and expand the market
conditions. Foreign market demand creates the expansion of domestic productivity.
vi. The government of the ASEAN member states should also invite the FDI to invest in the
agro-processing sector. ASEAN regions are abundant in cheap labor force. Positive externalities
from the foreign direct investment brings the experiences and skilled labor to employ in sector of
production.
vii. The policy of input substitution and export promotion should be considered as the
strategy for economic development of the countries. Export expansion is the promising way of
efficient resource allocation, better production practices via improved techniques to get better
production efficiency, getting enlarge in economy scale, increase capital formation and
opportunities for job creation will lead to the economic development.
viii. To increase the output per worker, the following are some measure,
Government should provide the capacity building program to improve the skill of
each of worker.
Infrastructure facilities providing should also be considered.

27
The appropriate new technologies should be accepted to increase per worker
productivity.
Human resource management should be efficiently allocated through appropriate
strategy.
Farm gate price of agricultural products should be stable for farmer to avoid the
fluctuation of raw commodities.
The supply chain practices of crops should be well manage to reduce the
undesirable intermediate man’ price playing.
ix. Government should also prioritize the infrastructure development for domestic value-
added processing. Transportation facilities should be convenience to readily transport from one
place to another. The countries entrance and exit building like international airport, seaport
should be promoted to enhance the export volume to full fill the global demand
x. The strong points of ASEAN member states are that these countries are located closely
near the well-developed countries like India and China and not so far from Japan, Korea,
Taiwan. Thus, the qualified export commodities have the strong trade link and definitely get
the benefit from these neighboring countries. But the weak point is that our commodities must
compare the exports from those countries.
28
REFERENCES
AURANGZEB, R., 2006. Exports, productivity and economic growth in Pakistan: a time series
analysis. The Lahore Journal of Economics, 11(1), 1–18. ISSN 1811-5438.
Athukorala, P. (1991) “An Analysis of Demand and Supply Factors in Agricultural Exports from
Arnade, C. and Vasavada U. (1995), “Causality between productivity and exports in
agriculture: Evidence from Asia and Latin America”, Journal of Agricultural Economics,
Vol.46, pp.174-186
Abrar ul haq M., (2015) Agricultural Export and Economic Growth: A Case Study of Pakistan:
Public Policy and Administration Research www.iiste.org ISSN 2224-5731(Paper) ISSN
2225-0972(Online) Vol.5, No.8, 2015
BBAALE, E. and MUTENYO, J. 2011. Export composition and economic growth in Sub-
Saharan Africa: A panel analysis
Bhagwati, J. (1979), “International Factor Movements and National Advantage,” 9th V.K.
Ramawami Memorial Lecture.
CORBO, V., KRUEGER, A. O. & OSSA, F., 1985. Export-oriented development strategies: the
success of five newly industrialized countries. London: Westview Press
1Cynthia and Johannes (2017), AGRICULTURAL EXPORTS AND ECONOMIC GROWTH IN
NAMIBIA: European Journal of Basic and Applied Sciences; Vol. 4 No. 1, 2017 ISSN
2059-3058
Dawson, P.J. (2005). Agricultural exports and economic growth in less developed countries.
Agricultural Economics, 33, 145-152

29
Ekanayake, E.M. (1999). Exports and economic growth in asian developing countries: co-
integration and error correction models. Journal of Economic Development, 24(2), 43-56.
FOSU, A. K., 1990. Exports and economic growth: the African case. World Development, 18(6),
831-835. ISSN 0305-750X. DOI.
Francis, B, L. S. Osaretin and L. Troy. (2007). Agricultural export diversification and economic
growth in Caribbean countries: co-integration and error-correction models. The
International Trade Journal. Vol. XXI. No. 3, fall, 2007
HAUSMANN, R., HWANG, J. & RODRIK, D., 2007. What you export matters. Journal of
Economic Growth, 12(1), 1–25.
IJIRSHAR, V. U. 2015. The empirical analysis of agricultural exports and economic growth in
698 Nahanga Verter, Věra Bečvařova Nigeria. Journal of Development and Agricultural
Economics, 7(3): 113–122.
Krueger, A.O. (1984) “Comparative Advantage and Development Policy 20 Years Later”, in M.
Syrquin, L, Taylor and L.E. Westphal (ed.) Economic Structure and Performance,
Orlando: Academic Press, pp. 135-155
KWAN, A. C. C., COTSOMITIS, J. A. & KWOK, B. K. C, 1999. Export economic growth and
structural invariances: evidence from some Asian NICS. Applied Economics, 31 (4), 493–
498.
KANG, H. 2015. Agricultural exports and economic growth: Empirical evidence from the major
rice exporting countries. Agricultural Economics – Czech, 61(2): 81–87.
30
MALIK, N., 2010. Pakistan agricultural export performance in the light of trade liberalization
and economic reforms. World Journal of Agricultural Sciences, 6(1), 29–38. ISSN 1817-
3047
MELITZ, M., 2003. The impact of trade on intra-industry reallocations and aggregate industry
productivity. Econometrica, 71(6), 1695–1725.
Nahanga and Becvalova(2016) The Impact ofAagricultural Exports on Economic Growth in
Nigeria Acta Universitatis Agriculturae et Silviculturae Mendelianae Brunensis · January
2016
RAM, R., 1987. Exports and economic growth in developing countries: evidence from timeseries
and cross-section data. Economic Development and Cultural Change, 36(1), 51–72.
SANJUAN-LOPEZ, A. I. & DAWSON, P. J., 2010. Agricultural exports and economic growth in
developing countries: a panel co-integration approach. Journal of Agricultural Economics,
61(3), 565–583.
SANTOS-PAULINO, A. U., 2002. Trade liberalization and export performance in selected
developing countries. The Journal of Development Studies, 39(1), 140–164.
Siboleka, M., Nyambe, J. M., & Osterkamp, R. (2014) Agriculture and Manufacturing Sector
Growth in Namibia During the Period 1981 to 2012: A Granger Causality Test. British
Journal of Economics, Management and Trade, 4, 1700-1707
Thornton, J. (1996), “Cointegration, Causality and Export-led Growth in Mexico”, 1895-1992.
Economics Letters, Vol. 50, pp.413-416Developing Asian Countries”,
Weltwirtschaftliches Archiv, Vol. 127 (4), pp. 764-791.