
agr 503 analytical techniques in agriculture
143
AGR 503 ANALYTICAL TECHNIQUES IN AGRICULTURE Course Team Dr. Obasi, Sunday Nathaniel (Course Writer) - NOUN Dr. J. A. Aliyu (Course Editor) - ABU, Zaria Dr. Aliyu Musa (Course Coordinator) - NOUN Prof. Grace E. Jokthan (Programme Leader) - NOUN NATIONAL OPEN UNIVERSITY OF NIGERIA COURSE GUIDE
-
Upload
khangminh22 -
Category
Documents
-
view
5 -
download
0
Transcript of agr 503 analytical techniques in agriculture
AGR 503ANALYTICAL TECHNIQUES IN AGRICULTURE
Course Team Dr. Obasi, Sunday Nathaniel (Course Writer) -NOUNDr. J. A. Aliyu (Course Editor) - ABU, ZariaDr. Aliyu Musa (Course Coordinator) - NOUNProf. Grace E. Jokthan (Programme Leader) -NOUN
NATIONAL OPEN UNIVERSITY OF NIGERIA
COURSEGUIDE

ARG 503 COURSE GUIDE
ii
© 2019 by NOUN PressNational Open University of NigeriaPlot 91, Cadastral Zone, University VillageNnamdi Azikiwe ExpresswayJabi, Abuja
Lagos Office14/16 Ahmadu Bello WayVictoria IslandLagos
e-mail: [email protected]: www.nou.edu.ng
All rights reserved. No part of this book may be reproduced, in anyform or by any means, without permission in writing from the publisher.
Printed 2020
ISBN: 978-978-970-184-1

ARG 503 COURSE GUIDE
iii
CONTENTS PAGE
Introduction ……………………………………………………… ivWhat You Will Learn In This Course …………………………. .. ivCourse Aims …………………………………………………….. vCourse Objectives ……………………………………………….. vWorking through this Course …………………………………..... vCourse Materials ……………………………………………….... viStudy Units ………………………………………………………. viAssessment ………………………………………………………. viiTutor-Marked Assignment ………………………………………. viiFinal Examination and Grading …………………………………. viiiCourse Marking Scheme ……………………………………….... viiiFacilitators/Tutors and Tutorials ………………………………… viiiSummary ………………………………………………………… ix

ARG 503 COURSE GUIDE
iv
INTRODUCTION
All scientists of different fields generally depend on analysis as a majormeans of solving scientific problems. This is to enable them proffersolutions to numerous questions on the content of the materials withwhich they work. The methods by which these analyses are carried outare referred to as analytical techniques. The types of analyticaltechniques may vary from field to field. This variation stems primarilyfrom differences in the nature of materials with which people in eachfield works. Agricultural sciences being a key branch of applied sciencesthat makes use of the principles of physics, chemistry, biology andmathematics in the study of crops, soil and animal feed and parameters.This is because while the soil consists of matter (living and non-living)interacting together physically, chemically and biologically to provideecosystem services at all levels of consideration, crops and animals areall made up of living cells and serve as key sources of food and survivalto man. For an agricultural scientist to be able therefore to answerquestions on the constituents of soil, compositions of crops and animalsas well as animal feeds, he needs to carry out one form of analysis or theother. Methods and techniques of analysis in soil, crops and animalscience are of very vital importance to students of agricultural sciences.
Prerequisites
The background knowledge from biology, chemistry, biochemistry andgeology is required.
WHAT YOU WILL LEARN IN THIS COURSE
The course consists of modules in units and a course guide. This courseguide tells you briefly what the course is about, what course materialsyou will be using and how you can work with these materials. Inaddition, it advocates some general guidelines for the amount of timeyou are likely to spend on each unit of the course in order to complete itsuccessfully. It gives you guidance in respect of your Tutor-MarkedAssignment in the assignment file. There will be regular tutorial classesthat are related to the course. It is advisable for you to attend thesetutorial sessions. The course will prepare you for the challenges you willmeet in the field of soil pedology and classification.
ARG 503 COURSE GUIDE
v
COURSE AIMS
The aim of the course is not complex. The course aims to provide youwith an understanding of soil Survey and Land Evaluation; it also aimsto provide you with solutions to problems with soil classification in thefield.
COURSE OBJECTIVES
To achieve the aims set out, the course has a set of objectives. Each unithas specific objectives which are included at the beginning of the unit.You should read these objectives before you study the unit. You maywish to refer to them during your study to check on your progress. Youshould always look at the unit objectives after completion of each unit.By doing so, you would have followed the instructions in the unit. Beloware the comprehensive objectives of the course as a whole. By meetingthese objectives, you should have achieved the aims of the course as awhole. In addition to the aims above, this course sets to achieve someobjectives.
Thus, after going through the course, you should be able to:
Know the basic principles governing common laboratoryequipments
Know the basic principles governing basic analytical procedures Explain precision, accuracy and operational variation in analytical
techniques. Understand the use of instruments, equipments and machines Know how to carry out animal, plant and soil sampling and
sample preparation Have good idea of major analytical instruments and their
principles of operations. Such instruments include; Microscopy,Spectrophotometer, Polymerase chain reaction (PCR), GelElectrophoresis, High performance liquid Chromatography(HPLC)
Understand the use of thin layer chromatography (TLC) and GasChromatography (GC)
Explain hematology and serum biochemistry Understand the concept of cryopreservation
WORKING THROUGH THE COURSE
To complete this course, you are required to read each study units, readthe textbook and other materials which may be provided by the NationalOpen University of Nigeria. Each unit contains self-assessment exercises

ARG 503 COURSE GUIDE
vi
and at certain points in the course you would be required to submitassignment for assessment purpose. At the end of the course there is afinal examination. The course should take you a total of 17 weeks tocomplete. Below you will find listed all the components of the course,what you have to do and how should allocate your time to each unit inorder to complete the course on time and successfully the details that youspend a lot of time to read. I would advise that you avail yourself theopportunity of attending the tutorial sessions where you have theopportunity of comparing your knowledge with that of other people.
THE COURSE MATERIALS
The main components of the course are:
1. The Course Guide2. Study Units3. References/Further Reading4. Assignments5. Presentation Schedule
STUDY UNITS
The study units in this course are as follows:
Module 1 Principles Governing Basic Analytical Procedures
Unit 1 Principle of SafetyUnit 2 Principle of QualityUnit 3 Principle of Precision and AccuracyUnit 4 Calibration and Use of Blanks in Analytical Procedures
Module 2 Animal, Crop and Soil Samples Analysis
Unit 1 Animal Feed Sample AnalysisUnit 2 Plant Sampling and Sample Preparation for AnalysisUnit 3 Soil Sampling and Sample Preparation
Module 3 Use of Instruments, Equipments and Machines
Unit 1 MicroscopyUnit 2 Principles and Operation of Atomic Absorption
Spectrophotometer (AAS)Unit 3 High-performance liquid chromatography (HPLC)Unit 4 Thin Layer Chromatography (TLC)Unit 5 Gas ChromatographyUnit 6 Polymerase Chain Reaction (PCR)

ARG 503 COURSE GUIDE
vii
Unit 7 Gel ElectrophoresisUnit 8 Hematology and Serum Biochemistry
Module 4 Sample Conservation and Preservation
Unit 1 Cryopreservation

CONTENTS PAGE
Module 1 Principles Governing Basic AnalyticalProcedures…………………………………. 1
Unit 1 Principle of Safety………………………….. 1Unit 2 Principle of Quality…………………………. 7Unit 3 Principle of Precision and Accuracy………… 13Unit 4 Calibration and Use of Blanks in Analytical
Procedures…………………………………… 19
Module 2 Animal, Crop and Soil Samples Analysis.... 26
Unit 1 Animal Feed Sample Analysis……………… 26Unit 2 Plant Sampling and Sample Preparation for
Analysis……………………………………… 36Unit 3 Soil Sampling and Sample Preparation……… 45
Module 3 Use of Instruments, Equipments andMachines…………………………………….. 58
Unit 1 Microscopy…………………………………… 58Unit 2 Principles and Operation of Atomic
Absorption Spectrophotometer (AAS)………. 67Unit 3 High-performance liquid chromatography
(HPLC)………………………………………. 76Unit 4 Thin Layer Chromatography (TLC)…………. 87Unit 5 Gas Chromatography………………………… 95Unit 6 Polymerase Chain Reaction (PCR)…………... 104Unit 7 Gel Electrophoresis…………………………... 114Unit 8 Hematology and Serum biochemistry ……….. 123
Module 4 Sample Conservation and Peservation …… 127
Unit 1 Cryopreservation……………………………… 127
MAINCOURSE

AGR MODULE 1
1
MODULE 1 PRINCIPLES GOVERNINGBASICANALYTICAL PROCEDURES
Unit 1 Principle of SafetyUnit 2 Principle of QualityUnit 3 Principle of Precision and AccuracyUnit 4 Calibration and use of Blanks in Analytical Procedures
UNIT 1 PRINCIPLE OF SAFETY
CONTENTS
1.0 Introduction2.0 Objectives3.0 Main Content
3.1 Important Facts to know3.2 Safety Measures in the Laboratory
4.0 Conclusion5.0 Summary6.0 Tutor-Marked Assignment7.0 References/Further Reading
1.0 INTRODUCTIONS
Safety principles are important consideration in any soil/plant laboratorieseven though it is frequently overlocked. As the saying goes “Safety first”anyone carrying out any activity in the lab should be very safety conscious.To avoid injuries that may lead to deformation or even death, all safetyprecaution in the Laboratory must be strictly adhered to. Therefore, safetyis of interest to every employee who works in the labs as well as anyorganisations which operate laboratories. All staff, not minding his/hergrade, technical skills or employment status should be properly educated onthe subject of safety when laboratories are concerned especially atcommencement of work. From time to time, reminders of such regulationsshould be done to encourage staff familiarity with such regulations.
2.0 OBJECTIVES
By the end of this unit, you will be able to:
understand the safety precautions of a soil science laboratory

AGR 503 ANALYTICAL TECHNIQUES IN AGRICULTURE
2
adhere strictly to all safety precautions in the laboratory to avoid anycasualty.
3.0 MAIN CONTENT
3.1 Important Facts to Know
- Always double-check the name of the reagent to be used and thename of the reagent you are using. Reagent bottles should remainstoppered, except when you are actually pouring solutions out ofthem. Always replace the stopper or lid of stock solutions or stains.Be sure to put them on the container they came from. Take only asmuch as you need and never return leftover solutions to a reagentbottle. Discard leftovers in the proper container.
- Do not use your thumb as a stopper. Swirl gently or put a piece ofparaffin over the opening to mix solutions.
- Label all test tubes and other containers with contents.
- Do not pour reagents and chemicals down the sink. Dispose of theseonly in designated containers.
- Put plant remains in the designated containers. Do not discard solidsor plant materials down the sinks. They will clog up the sink. Usespecified containers for such wastes.
- Be sure to use caution when using razor blades to prepare labmaterials. Put the used blades into the designated container fromwhich you obtained them. Do not leave them loose on the desks orcounters. Never put razor blades in the wastepaper basket.
- Your instructor will review with you the location and, whereapplicable, use of the safety equipment in the laboratory including:emergency phone, first aid kit, fire extinguisher, eyewash.
3.2 Principle of Safety
Laboratory is not a place of playing or carrying out any careless activitytherefore, the principle of safety is key. Anyone entering laboratory shouldbe very careful and be conscious of what he/she has gone there to do.However, rules pertaining to safety can be extensive, different categories ofconcerns have been noted (Rashid, et al., 2007).

AGR MODULE 1
3
3.2.1 Different Categories Where Safety Is Needed
i. General attitudeii. Instrument operationiii. Accidentsiv. Chemicalsv. Furnace, Ovens and Hot platesvi. Handling gassesvii. Maintenanceviii. Eating and drinkingix. Protective Equipmentx. Waste disposals
General safety rules in different categories to ensure safety
1. General attitudei. Develop a positive attitude towards laboratory safetyii. Observe normal laboratory safety practicesiii. Maintain a safe and clean work environmentiv. Avoid working alone
2. Instrument operationi. Follow safety precautions provided by the manufacturer when
operating instrumentsii. Monitor instruments while they are in operationiii. Do not open centrifuge cover until machine has completely
stoppediv. Atomic Absorption Spectrophotometer (AAS) must be vented
to the atmosphere, ensure that the drain trap is filled withwater before igniting the burner
3. Accidentsi. Learn what to do in case of emergencies (fire, spill of
chemicals, etc.), firefighting equipment must be readilyaccessible in the event of fire.
ii. Learn emergency first aid. First aid supplies are a necessityand laboratory staff should be well trained in their use.
iii. Immediately seek medical attention if affected by chemicals,use first aid until medical aid is available.
iv. Access to eye-wash fountains and safety showers must not belocked. Fountain and showers should be regularly checked forproper operation.

AGR 503 ANALYTICAL TECHNIQUES IN AGRICULTURE
4
4. Chemicalsi. Add acid to water and not water to acid when diluting the
acid.ii. Always put labels on bottles, vessels and wash-bottles
containing reagents, solutions, samples and water.iii. Handle per caloric acid and hazardous chemicals in fume
hoods.iv. With the wet oxidation method of sample digestion, destroy
organic matter (OM) first with nitric acid.v. Read the labels on the bottles before opening them.vi. Wash hands after handling toxic/hazardous chemicals.vii. Never suck the chemicals by mouth but use automatic
pipetting devices.5. Maintenance
i. All electrical, plumbing and instrument maintenance workshould be done by qualified personnel.
ii. Fume hoods should be checked routinely .iii. As most equipment operate on low wattage, use of
Uninterrupted power supply (UPS) is necessary to providestable power and allows the completion of any batchmeasurement in the event of power outage.
6. Eating and drinkingi. Do not eat, drink or smoke in the laboratory. This is essential
both for reasons of health and to reduce contamination.ii. Do not use laboratory glassware for eating/drinking.iii. Do not store food in the laboratory.
7. Protective equipmenti. Use personal safety equipment as follow.ii. Body protection: Use laboratory coat and chemical resistant
apron.iii. Hand protection: use gloves particularly when handling
concentrated acids, bases and other hazardous chemicals.iv. Dust mask: usually needed when grinding soil.v. Eye protection: Use safety glasses with side shields. Persons
wearing contact lens should always wear safety glasses in thelaboratory. Make sure the people you work with know youare using contact lenses and it should not be worn aroundcorrosives.
vi. Full face shield: wear face shields over safety glasses inexperiments involving corrosive chemicals.
vii. Foot protection: proper foot wear should be used; sandalsshould be worn in the laboratories.

AGR MODULE 1
5
8. Waste disposali. Liquid waste should be poured carefully down the sink with
sufficient water to dilute and flush it away.ii. Dispose of chipped or broken glassware in specially marked
containers.
3.2.2 Handling Contaminations
One of the most insidious enemies in any laboratory is contamination andtherefore its sources must be identified and eliminated.
Some common sources of contaminations are as follow:
1. External dusts blown from the surrounding environment.2. Internal dusts resulting from cleaning operations .3. Cross- contaminations derived from handling many samples at the
same time (e.g. handling plant and soil samples together).4. Failure to store volatile reagents well away from the samples.5. Washing materials especially soap powder.6. Smoking in the laboratory.
4.0 CONCLUSION
Electrical cables, plugs and tubing need proper checking in order to avoidaccidents. Various types of gas cylinders needed in the laboratory, such asacetylene, nitrous oxide and liquefied petroleum gas, must be kept underwatch and properly sealed/ capped, and they must be stored in ventilatedcupboards. Hazardous chemicals should be stored in plastic bottles. Whileworking with chemicals, such as perchloric acid, a fume hood must beused. Chemicals must be labelled properly, indicating their hazardousnature. Bottles with inflammable substances need to be stored in stainless-steel containers. Each country has special rules and methods for thedisposal of hazardous waste. Cyanides, chromates, arsenic (As), selenium(Se), cobalt (Co) and molybdate are commonly used but hazardouschemicals. They should never be disposed of in the laboratory sink butcollected in a metal container for proper disposal at the specified places andin the manner described in national legislation for waste disposal.
5.0 SUMMARY
You have learnt that safety precautions in the laboratory include but notlimited to the following; Food and drink must not be allowed in lab unlessfood or drinks are provided as a part of the lab requirement for the intended
AGR 503 ANALYTICAL TECHNIQUES IN AGRICULTURE
6
analysis. Even though lab tables and counters are wiped down before eachlab set up, as a result of some laboratory exercises, chemical residues maybe present on the tables. For labs exercises involving food or drinks, labassistants and instructors will follow procedures that allow safeconsumption. Smoking is totally not acceptable in all University buildings.Shoes must be worn in lab. If you have very long hair, please tie it back inthe laboratory. Handle chemicals, reagents, and stains carefully and followall warnings. All bottles and containers are labeled as to contents andpotential hazards. If, for example, a label says avoid contact with substanceand fumes, do so. For potentially hazardous chemicals, information on thehazards, proper handling, and clean-up is provided on Material Safety DataSheets (MSDS). These are available in the lab. It is highly recommendedthat you spend the first few minutes of the lab consulting the MSDS. Readall precautions in the laboratory manual and on labels and follow directionsexactly.
6.0 TUTOR-MARKED ASSIGNMENT
1. Why is safety a very important consideration in a soil sciencelaboratory?
2. Mention 10 different categories where safety is needed in alaboratory.
3. Give at least (5) safety precautions in (5) of the categoriesmentioned above.
4. What are the sources of contaminations in the laboratory and howcan they be handled?
7.0 REFERENCES/FURTHER READING
Rashid, R., Ryan, J., & Estefan, G. (2007). Soil and Plant analysisLaboratory Manual. International Center for Agricultural ResearchIn The Dry Area National Agricultural Research Center, Islamabad,Pakistanhttp://www.fao.org/3/a-i0131e.pdf
AGR MODULE 1
7
UNIT 2 PRINCIPLE OF QUALITY
CONTENTS
1.0 Introduction2.0 Objectives3.0 Main Content
3.1 Principle of Quality3.1.1 Quality Management
3.1.1.1 Good Laboratory Practice (GLP)3.1.2 Quality Assurance3.1.3 Quality Control
4.0 Conclusion5.0 Summary6.0 Tutor-Marked Assignment7.0 References/Further Reading
1.0 INTRODUCTION
The term "quality" has a relative meaning. This is expressed by theInternational Standard Organisation (ISO) definition: The totality offeatures and characteristics of a product or service that bear on its ability tosatisfy stated or implied needs. In simpler words, one can say that a producthas good quality when it complies with the requirements specified by theclient. When projected on analytical work, quality can be definedas delivery of reliable information within an agreed span of time underagreed conditions, at agreed costs, and with necessary aftercare. The agreedconditions should include a specification as to the precision and accuracy ofthe data which is directly related to fitness of use and which may differ fordifferent applications. Yet, in many cases the reliability of data is notquestioned and the request for specifications omitted.
2.0 OBJECTIVES
By the end of this unit, you will be able to:
know the meaning of safety as concerns laboratory activities understand the meaning of quality management, quality assurance
and quality control.
AGR 503 ANALYTICAL TECHNIQUES IN AGRICULTURE
8
3.0 MAIN CONTENT
3.1 Principle of Quality
Many laboratories work according to established methods and procedureswhich are not readily changed and have inherent default specifications.Moreover, not all future uses of the data and reports can be foreseen so thatspecifications about required precision and accuracy cannot even be given.Consequently, this aspect of quality is usually left to the discretion of thelaboratory. However, all too often the embarrassing situation exists that alaboratory cannot evaluate and account for its quality simply because thenecessary documentation is lacking. In the ensuing discussions numerousactivities aimed at maintaining the production of quality are dealt with. Inprinciple, three levels of organisation of these activities can bedistinguished. From the top down these levels are:
1. Quality Management (QM)2. Quality Assurance (QA)3. Quality Control (QC)
3.1.1 Quality Management
Quality Management is the assembly and management of all activitiesaimed at the production of quality by organisations of various kinds. In thepresent case this implies the introduction and proper running of a "QualitySystem" in laboratories. A statement of objectives and policy to producequality should be made for the organisation or department concerned (bythe institute's directorate). This statement also identifies the internalorganisation and responsibilities for the effective operation of the QualitySystem. Quality Management can be considered a somewhat widerinterpretation of the concept of "Good Laboratory Practice" (GLP).Therefore, inevitably the basics of the present Guidelines largely coincidewith those of GLP. Note. An even wider concept of quality management ispresently coming into vogue: "Total Quality Management" (TQM). Thisconcept includes additional aspects such as leadership style, ethics of thework, social aspects, relation to society, etc.
3.1.1.1 Good Laboratory Practice (GLP)
Quality Management in the present context can be considered a modemversion of the hitherto much used concept "Good Laboratory Practice"(GLP) with a somewhat wider interpretation. The OECD Document definesGLP as follows: "Good Laboratory Practice (GLP) is concerned with the
AGR MODULE 1
9
organisational process and the conditions under which laboratory studiesare planned, performed, monitored, recorded, and reported."Thus, GLP prescribes a laboratory to work according to a system ofprocedures and protocols. This implies the organisation of the activities andthe conditions under which these take place are controlled, reported andfiled. GLP is a policy for all aspects of the laboratory which influence thequality of the analytical work. When properly applied, GLP should then:
- allow better laboratory management (including quality management)- improve efficiency (thus reducing costs)- minimise errors- allow quality control (including tracking of errors and their cause)- stimulate and motivate all personnel- improve safety- improve communication possibilities, both internally and externally.
The result of GLP is that the performance of a laboratory is improved andits working effectively controlled. An important aspect is also that thestandards of quality are documented and can be demonstrated to authoritiesand clients. This results in an improved reputation for the laboratory (andfor the institute as a whole). In short, the message is:
- say what you do- do what you say- do it better- be able to show what you have done
The basic rule is that all relevant plans, activities, conditions and situationsare recorded and that these records are safely filed and can be produced orretrieved when necessary. These aspects differ strongly in character andneed to be attended to individually.
As an assembly, the involved documents constitute a so-called QualityManual. This comprises then all relevant information on:
- Organisation and Personnel- Facilities- Equipment and Working materials- Analytical or testing systems- Quality control- Reporting and filing of results.

AGR 503 ANALYTICAL TECHNIQUES IN AGRICULTURE
10
Since institutions having a laboratory are of divergent natures, there is nostandard format and each has to make its own Quality Manual. The presentGuidelines contain examples of forms, protocols, procedures and artificialsituations. They need at least to be adapted and many new ones will have tobe made according to the specific needs, but all have to fulfill the basicrequirement of usefulness and verifiability.
3.1.2 Quality Assurance
Proper Quality Management implies consequent implementation of the nextlevel: Quality Assurance. The ISO definition reads: "the assembly of allplanned and systematic actions necessary to provide adequate confidencethat a product, process, or service will satisfy given qualityrequirements." The result of these actions aimed at the production ofquality, should ideally be checked by someone independent of the work: theQuality Assurance Officer. If no QA officer is available, then usually theHead of Laboratory performs this job as part of his quality managementtask. In case of special projects, customers may require special qualityassurance measures or a Quality Plan.
3.1.3 Quality Control
A major part of the quality assurance is the Quality Control defined by ISOas "the operational techniques and activities that are used to satisfy qualityrequirements. "An important part of the quality control is the QualityAssessment: the system of activities to verify if the quality control activitiesare effective, in other words: an evaluation of the products themselves.Quality control is primarily aimed at the prevention of errors. Yet, despiteall efforts, it remains inevitable that errors are made. Therefore, the controlsystem should have checks to detect them. When errors or mistakes aresuspected or discovered it is essential that the "Five Ws" are trailed.
- what error was made?- where was it made?- when was it made?- who made it?- why was it made?
Only when all these questions are answered, proper action can be taken tocorrect the error and prevent the same mistake being repeated. Thetechniques and activities involved in Quality Control can be divided intofour levels of operation:
AGR MODULE 1
11
1. First-line control: Instrument performance check.2. Second-line control: Check of calibration or standardization.3. Third-line control: Batch control (control sample, identity check).4. Fourth-line control: Overall check (external checks: reference
samples, inter-laboratory exchange programmes).
Because the first two control levels both apply to the correct functioning ofthe instruments they are often taken together and then only three levels aredistinguished. This designation is used throughout the present Guidelines:
1. First-line control: Instrument check / calibration.2. Second-line control: Batch control3. Third-line control: External check
It will be clear that producing quality in the laboratory is a major enterpriserequiring a continuous human effort and input of money. The rule-of-fist isthat 10-20% of the total costs of analysis should be spent on quality control.Therefore, for quality work at least four conditions should be fulfilled:
- means are available (adequate personnel and facilities)- efficient use of time and means (costs aspect)- expertise is available (answering questions; aftercare)- upholding and improving level of output (continuity)
In quality work, management aspects and technical aspects are inherentlycobbled together and for a clear insight and proper functioning of thelaboratory these aspects have to be broken down into their components.This is done in the ensuing chapters of this manual.
4.0 CONCLUSION
Quality control is the totality of features and characteristics of a product orservice that bear on its ability to satisfy stated or implied needs. In simplerwords, one can say that a product has good quality when it complies withthe requirements specified by the client. When projected on analyticalwork, quality can be defined as delivery of reliable information within anagreed span of time under agreed conditions, at agreed costs, and withnecessary aftercare.
AGR 503 ANALYTICAL TECHNIQUES IN AGRICULTURE
12
5.0 SUMMARY
Proper Quality Management implies consequent implementation of theQuality Assurance. A major part of the quality assurance is the QualityControl defined by ISO as the operational techniques and activities that areused to satisfy quality requirements. An important part of the qualitycontrol is the Quality Assessment: the system of activities to verify if thequality control activities are effective, in other words: an evaluation of theproducts themselves.
6.0 TUTOR-MARKED ASSIGNMENT
1. Briefly explain three levels of organisation of quality in thelaboratories.
2. Enumerate the benefits of good laboratory practice when properlyapplied.
3. What are the five Ws that are essential when errors or mistakes aresuspected in the laboratories?
4. What are the four techniques involved in Quality Control levels ofoperation?
5. Outline the four conditions that must be fulfilled for quality works inthe laboratory.
7.0 REFERENCES/FURTHER READING
http://www.fao.org/3/W7295E/w7295e07.htm#TopOfPage

AGR MODULE 1
13
UNIT 3 PRINCIPLE OF PRECISION AND ACCURACY
CONTENTS
1.0 Introduction2.0 Objectives3.0 Main Content
3.1 Precision and Accuracy3.1.1 Precision/Repeatability/Reproducibility
3.2 Errors3.2.1 Sources of Errors
3.3 Detection Limits4.0 Conclusion5.0 Summary6.0 Tutor-Marked Assignment7.0 References/Further Reading
1.0 INTRODUCTION
The issues of accuracy and precision are vital considerations for the analystand can be determining factors in any method selection. Accuracy is theability to obtain the “true” value and is dependent to a large degree on theavailability and use of reliable standards (Jones 2001). Precision, on theother hand, is a measure of the degree of variability of an obtained resultdetermined by repeated analyses of the same sample through all the stepsfrom sample preparation to the final obtained result. Hislop (1980) has anarticle on the requirements for obtaining accurate and precise analyticalresults. Hurwitz (2000) also has evaluated various analytical procedures byassigning levels of performance based on years of use in the determinationof elements and substances in a wide range of materials. Raymentet al.,(2000) looked at the percent coefficients of variation for a number ofcommonly performed soil analysis procedures, found that the pHdetermination had the lowest (<5%), that determinations for Cl, organic C,nitrate-N, DTPA Zn and Mn, and exchangeable Ca, K, and Mg ranged from10 to 20%, that exchangeable Na was between 20 and 30%, and that OlsenP and Bray P were greater than 30%. They also looked at intra-laboratoryRSDs (%), finding that the greatest precision was obtained for thedetermination of pH (RSD of 1.6%), that determinations for ammoniun-N,Bray P1, and organic carbon had RSDs of 6.2, 6.3, and 8.3%, respectively,and that nitrate-N (Cd reduction) and Olsen P had RSDs of 14.5 and 11.8%,respectively. All these evaluations would suggest that there may be aninherent variance in a particular method and/or that the methodology

AGR 503 ANALYTICAL TECHNIQUES IN AGRICULTURE
14
associated with these assay procedures should be more carefully examinedto determine the source of variance.
2.0 OBJECTIVES
By the end of this unit, you will be able to:
understand the meaning of accuracy and precision in soil analyticalprocedures
know what to do to ensure accuracy and precision in soil analyticaltechnique.
3.0 MAIN CONTENT
3.1 Precision and Accuracy
Precision is defined as the agreement without conflict or the concordance,of a series of measurements of the same quantity. The mean deviation orthe relative mean deviation is a measure of precision.Accuracy expresses the correctness of a measurement, while precisionexpresses the reproducibility of a measurement. Precision alwaysaccompanies accuracy, but a high degree of precision does not implyaccuracy. In ensuring high accuracy in analysis, accurate preparation ofreagents including their perfect standardisation is critical. The purity ofchemicals is also important. For all estimations where actual measurementof a constituent of the sample in terms of the “precipitate formation” orformation of “colored compound” or “concentration in the solvent” is a partof the steps in estimation, chemical reagents involved in such aspects mustalways be of high purity, which is known as analytical-reagent (AR) grade.
3.1.1 Precision/Repeatability/Reproducibility
Precision is a term that describes an instrument’s degree of freedom fromrandom errors. If a large number of readings are taken of the same quantityby a high precision instrument, then the spread of readings will be verysmall. Precision is often, though incorrectly, confused with accuracy. Highprecision does not imply anything about measurement accuracy. A highprecision instrument may have a low accuracy. Low accuracymeasurements from a high precision instrument are normally caused by abias in the measurements, which is removable by recalibration. The termsrepeatability and reproducibility mean approximately the same but areapplied in different contexts as given below.
AGR MODULE 1
15
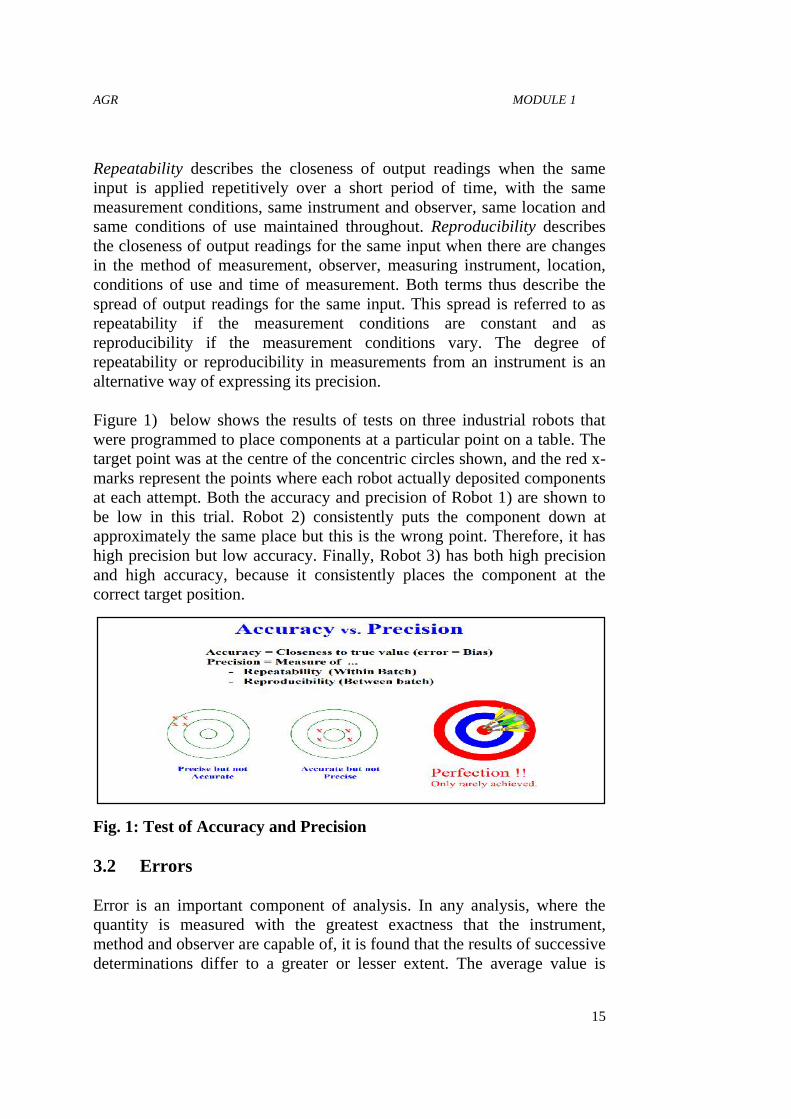
Repeatability describes the closeness of output readings when the sameinput is applied repetitively over a short period of time, with the samemeasurement conditions, same instrument and observer, same location andsame conditions of use maintained throughout. Reproducibility describesthe closeness of output readings for the same input when there are changesin the method of measurement, observer, measuring instrument, location,conditions of use and time of measurement. Both terms thus describe thespread of output readings for the same input. This spread is referred to asrepeatability if the measurement conditions are constant and asreproducibility if the measurement conditions vary. The degree ofrepeatability or reproducibility in measurements from an instrument is analternative way of expressing its precision.
Figure 1) below shows the results of tests on three industrial robots thatwere programmed to place components at a particular point on a table. Thetarget point was at the centre of the concentric circles shown, and the red x-marks represent the points where each robot actually deposited componentsat each attempt. Both the accuracy and precision of Robot 1) are shown tobe low in this trial. Robot 2) consistently puts the component down atapproximately the same place but this is the wrong point. Therefore, it hashigh precision but low accuracy. Finally, Robot 3) has both high precisionand high accuracy, because it consistently places the component at thecorrect target position.
Fig. 1: Test of Accuracy and Precision
3.2 Errors
Error is an important component of analysis. In any analysis, where thequantity is measured with the greatest exactness that the instrument,method and observer are capable of, it is found that the results of successivedeterminations differ to a greater or lesser extent. The average value is
AGR 503 ANALYTICAL TECHNIQUES IN AGRICULTURE
16
accepted as most probable. This may not always be the true value. In somecases, the difference in the successive values may be small, in some cases itmay be large; the reliability of the result depends on the magnitude of thisdifference. There could be a number of factors responsible for thisdifference, which is also referred to as error. In absolute terms, error is thedifference between the observed or measured value and the true or mostprobable value of the quantity measured. The absolute error is a measure ofthe accuracy of the measurement. Therefore, the accuracy of adetermination may be defined as the concordance between it and the true ormost probable value. The relative error is the absolute error divided by thetrue or most probable value. The error may be caused by any deviationfrom the prescribed steps to be taken in analysis. The purity of chemicals,their concentration/strength, and the accuracy of the instruments and theskill of the technician are important factors.
Part of improving chemical analysis is to be able to identify the place whereerrors can occur and be able to evaluate their magnitude. There ispossibility of making mistakes at any step of the analysis. These possiblemistakes are called error. One way to find out if you have made mistake isto repeat the whole procedure for several replicate samples or replicates.The more the replicates, the higher the level of certainty of the results.
3.2.1 Sources of Errors
Errors could be classified based on the sources as:
1. Personal error: - These are errors that emanate from the personcarrying out the analysis (the analyst). It could be due to lack ofexperience, dirty or unorganised work habit, lack of attention todetails, or personal defect that may pose hindrance to accuratejudgement (e.g. color blindness).
2. Method errors: - These are errors that emanate due to use of wrongmethod of analysis. Some methods may not be able to eliminatecertain interferences in the course of analysis, thus leading to error.
3. Instrumental errors: These are errors resulting from improperfunctioning of the instrument used for the measurement. It could bedue to improper calibration or low sensitivity of instrument.
Errors could also be classified based on the whether or not the magnitudecan be ascertained and correction made or not. Errors originating fromfixed case are referred to as determinate or1. systematic error; while those originating from arbitrary or
indeterminate processes are

AGR MODULE 1
17
2. random errors.
Measuring errorsWhen several runs of replicates are made on a sample, it is not likely thatthe results would be exactly the same. We can make use of the Arithmeticmean (average) with deviation from mean (absolute deviation, or relativedeviation).
3.3 Detection Limits
In the analysis for elements, particularly trace elements in soils, plants andfertilisers and for environmental monitoring, the need arises to measurevery low contents of analytes. Modern equipment is capable of suchestimation. However, while selecting the equipment and the testing methodfor such a purpose, it is important to have information about the lowestlimits to which analytes can be detected or determined with sufficientconfidence. Such limits are called detection limits or lower limits ofdetection. The capacity of the equipment and the method may be such thatit can detect the traces of analyte in the sample. In quantitative terms, thelowest contents of such analytes may be decided through appropriateresearch as the values of interpretable significance. The service laboratoriesare generally provided with such limits.
4.0 CONCLUSION
Accuracy is the ability to obtain the “true” value and is dependent to a largedegree on the availability and use of reliable standards. Precision, on theother hand, is a measure of the degree of variability of an obtained resultdetermined by repeated analyses of the same sample through all the stepsfrom sample preparation to the final obtained result.
5.0 SUMMARY
The absolute error is a measure of the accuracy of the measurement.Therefore, the accuracy of a determination may be defined as theconcordance between it and the true or most probable value. The relativeerror is the absolute error divided by the true or most probable value. Theerror may be caused by any deviation from the prescribed steps to be takenin analysis. The purity of chemicals, their concentration/strength, and theaccuracy of the instruments and the skill of the technician are importantfactors.

AGR 503 ANALYTICAL TECHNIQUES IN AGRICULTURE
18
6.0 TUTOR-MARKED/ASSIGNMENT
1. i. Define Precision and accuracy.ii. With the aid of diagram, should relationship between precision
and accuracy2. What is the relationship between precision, repeatability and
reproducibility?3. i. What do you understand by error in an analytical process?
ii. State four sources of error.4. Explain fully what you know about Detection Limits.
7.0 REFERENCES/FURTHER READING
Association of official Analytical Chemists, Arlington, VA.Boca Raton London New York Washington, D.C. Element Analytical
Chemistry in Medicine and Biology, DeGruyter, Berlin, Germany,747–767.
Hislop, J.S. (1980). Choice of the Analytical Method, In: P. Bratter and P.Schramel, (Eds.). Trace.
Horwitz, W. Ed. 2000. Official Methods of Analysis of the AOACInternational, (17th ed.).
Jones J.B (2001) Laboratory Guide for Conducting Soil Tests and PlantAnalysis. CBC Press.
Measures to Enhance Analytical Quality in Soil and Plant Laboratories.Commun. Soil Sci. Plant Anal., 31:1513–1530.
Rayment, G.E., R.O. Miller, & E. Sulaeman. (2000). Proficiency Testingand Other Interactive.

AGR MODULE 1
19
UNIT 4 CALIBRATION AND USE OF BLANKSINANALYTICAL PROCEDURES
CONTENTS
1.0 Introduction2.0 Objectives3.0 Main Content
3.1 Calibration and use of blanks in analytical procedures3.1.1 Calibration Graph
3.1.1.1 How to Obtain Calibration Graphs ARE:3.1.1.2 Construction and Use3.1.1.3 Independent Standards3.1.1.4 Measuring a Batch
4.0 Conclusion5.0 Summary6.0 Tutor-Marked Assignment7.0 References/Further Reading
1.0 INTRODUCTION
For any result of analytical procedure to be useful, meaningful andacceptable, quality is of utmost importance according to StandardOrganisation Procedures (SOPs). Aspects considered include calibration,use of blanks performance characteristics of the procedure, and reporting ofresults. Virtually all activities associated with these aspects are gearedtowards one purpose which includes the production of reliable data with aminimum of errors. In addition, it must be ensured that reliable data areproduced consistently. To achieve this appropriate programme of qualitycontrol (QC) must be executed or implemented. Quality control is the termused to describe the practical steps undertaken to ensure that errors in theanalytical data are within the acceptable limit, appropriate for the use towhich the data will be put. This therefore means that the errors (which areunavoidably made) have to be quantified to enable a decision whether theyare of an acceptable magnitude, and that unacceptable errors are discoveredso that corrective action can be taken. Therefore, quality control must detectboth random and systematic errors. The procedures for QC primarilymonitor the accuracy of the work by checking the bias of data with the helpof (certified) reference samples and control samples and the precision bymeans of replicate analyses of test samples as well as of reference and/orcontrol samples.

AGR 503 ANALYTICAL TECHNIQUES IN AGRICULTURE
20
2.0 OBJECTIVES
By the end of this unit, you will be able to:
understand the importance of calibrations and use of blanks inanalytical procedure
know how calibrations and blanks can be used while carrying outany laboratory analysis.
3.0 MAIN CONTENT
3.1 Calibration and Use of Blanks in Analytical Procedures
3.1.1 Calibration Graph
The construction and use of calibration graphs or curves in daily practice ofa laboratory is of high necessity. Calibration of instruments(including adjustment) is also referred to as standardisation. The confusionabout these terms is mainly in word usage and the terms calibration curveand standard curve are always used interchangeably. The term "curve"implies that the line is not straight. However, the best calibration lines arelinear (straight) and, therefore, the general term "graph" is preferred. Formany measuring techniques calibration graphs have to be constructed. Thetechnique is simple and consists of plotting the instrument response againsta series of samples with known concentrations of the analyte (standards). Inpractice, these standards are usually pure chemicals dispersed in a matrixcorresponding with that of the test samples (the "unknowns"). Byconvention, the calibration graph is always plotted with the concentrationof the standards on the x-axis and the reading of the instrument response onthe y-axis. The unknowns are determined by interpolation, not byextrapolation, so that a suitable working range for the standards must beselected. In addition, in the present discussion it is assumed that theworking range is limited to the linear range of the calibration graphs andthat the standard deviation does not change over the range. Non-lineargraphs can sometimes be linearised in a simple way, e.g. by using a logscale (in potentiometer), but usually imply statistical problems (polynomialregression) for which the reader is referred to the relevant literature. Itshould be mentioned, however, that in modem instruments which make anduse calibration graphs automatically these aspects sometimes go byunnoticed.

AGR MODULE 1
21
3.1.1.1 How to Obtain Calibration Graphs Are
1. Standards are made in a solution with the same composition asthe Extractants : The standards are made in a solution with thesame composition as the extractant used for the samples (with thesame dilution factor) so that all measurements are done in the samematrix. This technique is often practiced when analysing manybatches where the same standards are used for some time. In thisway an incorrectly prepared extractant or matrix may be detected (inblank or control sample).
2. The standards are made in the blank extract. A disadvantage ofthis technique is that for each batch the standards have to bepipetted. Therefore, this type of calibration is sometimes favoredwhen only one or few batches are analysed or when the extractant isunstable. A seeming advantage is that the blank can be forced tozero. However, an incorrect extractant would then more easily go byundetected. The disadvantage of pipetting does not apply in case ofautomatic dispensing of reagents when equal volumes of differentconcentration are added (e.g. with flow-injection).
3. Standard additions technique is less common but useful in specialcases is the so-called standard additions technique. This can bepracticed when a matrix mismatch between samples and standardsneeds to be avoided: the standards are prepared from actual samples.The general procedure is to take a number of aliquots of sample orextract, add different quantities of the analyte to eachaliquot (spiking) and dilute to the final volume. One aliquot is usedwithout the addition of the analyte (blank). Thus, a standard series isobtained.
If calibration is involved in an analytical procedure, the SOP for this shouldinclude a description of the calibration sub-procedure. If applicable,including an optimalisation procedure (usually given in the instructionmanual).
3.1.1.2 Construction and Use
In several laboratories calibration graphs for some analyses are stilladequately plotted manually and the straight line (or sometimes a curvedline) is drawn with a visual "best fit", e.g. for flame atomic emissionspectrometry, or colorimetric. However, this practice is only legitimatewhen the random errors in the measurements of the standards are small:when the scattering is appreciable the line-fitting becomes subjective and

AGR 503 ANALYTICAL TECHNIQUES IN AGRICULTURE
22
unreliable. Therefore, if a calibration graph is not made automatically by amicroprocessor of the instrument, the following more objective and alsoquantitatively more informative procedure is generally favored.The proper way of constructing the graph is essentially the performance ofa regression analysis i.e., the statistical establishment of a linearrelationship between concentration of the analyte and the instrumentresponse using at least six points. This regression analysis (of reading y onconcentration x) yields a correlation coefficient r as a measure for the fit ofthe points to a straight line (by means of Least Squares).
3.1.1.3 Independent Standards
It cannot be overemphasised that for quality control (QC), a calibrationshould always include measurement of an independentstandard or calibration verification standard at about the middle of thecalibration range. If the result of this measurement deviates so much fromthe correct or expected value (say > 5%), then inspection is indicated. Suchan independent standard can be obtained in several ways. Most usually it isprepared from pure chemicals by another person than the one who preparedthe actual standards. Obviously, it should never be derived from the samestock or source as the actual standards. If necessary, a bottle from anotherlaboratory could be borrowed. In addition, when new standards areprepared, the remainder of the old ones always have to be measured as amutual check (include this in the SOP for the preparation of standards!).
3.1.1.4 Measuring a Batch
After calibration of the instrument for the analyte, a batch of test samples ismeasured. Ideally, the response of the instrument should not change duringmeasurement (drift or shift). In practice this is usually the case for only alimited period of time or number of measurements and regular recalibrationis necessary.
The frequency of recalibration during measurement may vary widelydepending on the following:
- Technique- Instrument- Analyte- Solvent- Temperature and- Humidity

AGR MODULE 1
23
In general, emission and atomising techniques (especially while usingAtomic Absorption Spectrophotometer) are more sensitive to drift (or evensudden shift: by clogging) than colorimetric techniques. Also, thetechniques of recalibration and possible subsequent action vary widely.
3.1.2 Blanks
A blank or blank determination is an analysis of a sample without theanalyte or attribute, or an analysis without a sample, i.e. going through allsteps of the procedure with the reagents only. The latter type is the mostcommon as samples without the analyte or attribute are often not availableor do not exist. Another type of blank is the one used for calibration ofinstruments. Thus, we may have two types of blank within one analyticalmethod or system:
- a blank for the whole method or system and- a blank for analytical sub-procedures (measurements) as part of the
whole procedure or system.
For instance, in the cation exchange capacity (CEC) determination of soilswith the percolation method, two methods or system blanks are included ineach batch: two percolation tubes with cotton wool or filter pulp and sandor celite, but without sample. For the determination of the index caution(NH4 by colorimetric or Na by flame emission spectroscopy) a blank isincluded in the determination of the calibration graph. If NH4 is determinedby distillation and subsequent titration, a blank titration is carried out forcorrection of test sample readings.
The Importance of blanks1. In many analyses sample results are calculated by subtracting blank
readings from sample readings.2. Blank readings can be excellent monitors in quality control of
reagents, analytical processes, and proficiency.3. They can be used to estimate several types of method detection
limits.For blanks the same rule applies as for replicate analyses: the largerthe number, the greater the confidence in the mean. The widelyaccepted rule in routine analysis is that each batch should include atleast two blanks. For special studies where individual results arecritical, more blanks per batch may be required (up to eight). Toensure quality, control charts are made of blank readings identicallyto those of control samples. The between-batch variability of theblank is expressed by the standard deviation calculated from
AGR 503 ANALYTICAL TECHNIQUES IN AGRICULTURE
24
the control chart of the Mean of Blanks; the precision can beestimated from the Control Chart of the Range of Duplicates ofBlanks.
In many laboratories, no control charts are made for blanks. Sometimes,analysts argue that 'there is never a problem with my blank; the reading isalways close to zero'. Admittedly, some analyses are more prone to blankerrors than others. This, however, is not a valid argument for not keepingcontrol charts. They are made to monitor procedures and to alarm whenthese are out of control (shift) or tend to become out of control (drift). Thiscan happen in any procedure in any laboratory at any time.
From the foregoing discussion it will be clear that signals of blank analysesgenerally are not zero. In fact, blanks may found to be negative. This maypoint to an error in the procedure: e.g. for the zeroing of the instrument anincorrect or a contaminated solution was used or the calibration graph wasnot linear. It may also be due to the matrix of the solution (e.g. extractant),and is then often unavoidable. For convenience, some analysts practice"forcing the blank to zero" by adjusting the instrument. Some instrumentseven invite or compel analysts to do so. This is equivalent to subtracting theblank value from the values of the standards before plotting the calibrationgraph. From the standpoint of Quality Control this practice must bediscouraged. If zeroing of the instrument is necessary, the use of pure waterfor this is preferred. However, such general considerations may beoverruled by specific instrument or method instructions. This is becomingmore and more common practice with modem sophisticated hi-techinstruments. Whatever the case, a decision on how to deal with blanks mustmade for each procedure and laid down in the SOP concerned.
4.0 CONCLUSION
Calibration of instruments (including adjustment) is also referred toas standardisation. For many measuring techniques calibration graphshave to be constructed. The technique is simple and consists of plotting theinstrument response against a series of samples with known concentrationsof the analyte (standards). In practice, these standards are usually purechemicals dispersed in a matrix corresponding with that of the test samples(the "unknowns"). Also, a blank determination is an analysis of a samplewithout the analyte or attribute, or an analysis without a sample, i.e. goingthrough all steps of the procedure with the reagents only.

AGR MODULE 1
25
5.0 SUMMARY
By convention, the calibration graph is always plotted with theconcentration of the standards on the x-axis and the reading of theinstrument response on the y-axis. The unknowns are determined byinterpolation, not by extrapolation, so that a suitable working range for thestandards must be selected. In addition, in the present discussion it isassumed that the working range is limited to the linear range of thecalibration graphs and that the standard deviation does not change over therange. A blank or blank determination is an analysis of a sample withoutthe analyte or attribute, or an analysis without a sample, i.e. going throughall steps of the procedure with the reagents only.
6.0 TUTOR-MARKED ASSIGNMENT
1. Explain fully what you understand by calibration and blank inanalytical procedure.
2. State how calibration graph can be obtained.3. Briefly explain the following terms as relates to calibration graph
i. Independent standardsii. Construction and useiii. Measuring a batch.
4. What are the factors that may affect the frequency of recalibrationduring measurement?
5. State the importance of blank in analytical procedure.
7.0 REFERENCES/FURTHER READING
Rayment, G.E., Miller, R.O. & Sulaeman, E. (2000). Proficiency Testingand other Interactive Measures to Enhance Analytical Quality in Soiland Plant Laboratories. Commun. Soil Sci. Plant Anal., 31:1513–1530.
http://www.fao.org/3/W7295E/w7295e07.htm#TopOfPage

AGR 503 MODULE 2
26
MODULE 2 ANIMAL, CROP AND SOIL SAMPLESANALYSIS
Unit 1 Animal Feed Sample AnalysisUnit 2 Plant Sampling and Sample Preparation for AnalysisUnit 3 Soil Sampling and Sample Preparation
UNIT 1 ANIMAL FEED SAMPLE ANALYSIS
CONTENTS
1.0 Introduction2.0 Objectives3.0 Main Content
3.1 Animal Feed Sample Analysis4.0 Conclusion5.0 Summary6.0 Tutor-Marked Assignment7.0 References/Further Reading
1.0 INTRODUCTION
Analysis of animal feed is of very vital importance since its nutritionalcontent and value determines the health and quality of our animals, whichinvariably determines the health and nutritional quality of man whodepends on animals as major source of protein. Types of analysesconducted by laboratory are proximate analyses, macro-minerals, micro-minerals at trace level, chromatographic analyses (such as amino acids,fatty acids, etc.) and chromatographic analyses at trace level (contaminantssuch as aflatoxins, pesticides and pesticide residues, antibiotics, etc.) (DeJonge and Jackson 2005). Several standard and laboratory methods havebeen developed over the years for the detection of both nutrients andcontaminants in feed ingredients and feedstuffs.
2.0 OBJECTIVES
By the end of this unit, you will be able to:
know different methods of analysis used for animal feed sample animal feed for laboratory analysis.

AGR 503 ANALYTICAL TECHNIQUES IN AGRICULTURE
27
3.0 MAIN CONTENT
3.1 Methods of Analysis in the Feed Industry
Malomo and Ihegwuagu(2017)classified the methods into official methods(required by law and used by regulatory and complying organization),reference methods (developed by collaborating organizations for validationpurposes), screening or rapid methods (usually for large samples todetermine whether further analysis are required with more accuratemethods), routine methods (can be official, standard or modified methodsused for routine testing), automated methods (may be official or screeningmethods that adopts automated equipment), and modified methods (usuallyofficial or standard methods, which have been modified to make it simpleand applicable to wide range of samples).In the absence of standardizedanalytical methods, laboratory methods that meet certain criteria, validatedand accredited in line with international guidelines and quality assuranceprotocols, may serve as alternatives. ‘Accuracy, applicability (matrix andconcentration range), limit of detection, limit of determination, precision,repeatability and reproducibility’ are some of the criteria that laboratorymethods must meet to serve as an alternative to standard methods.
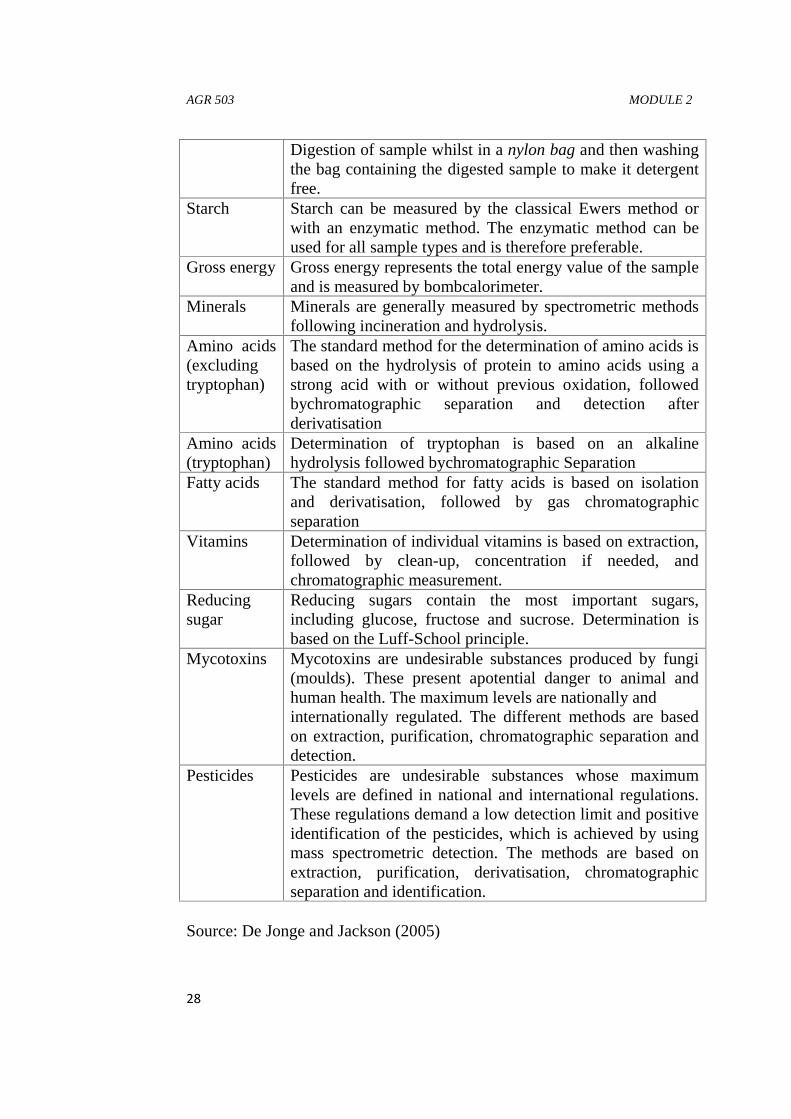
Table 1: Description of typical tests in feed analysesParameter DescriptionDry mater Part of the sample that remains after dying at 103°CCrude ash Part of the sample that remains after incineration at 550°CAshinsoluble inacid (sand)
Ash that remains after boiling in strong acid
Crudeprotein
Total nitrogen content and to calculate the protein contentby multiplying the nitrogen content by an appropriateconversion factor (usually ×6.25). Kjeldahl method(Nitrogen is converted into ammonia which is absorbed inboric acid and titrated against a standard acid); Dumasmethod (With complete combustion of sample at950°C inthe presence of oxygen, nitrogen is converted to a gaseousstate and reduced toN2, followed by measurement in athermal conductivity cell)
Crude fat Non-polar extractable fraction of the sample. The extractioncan be performed with or without prior acid hydrolysis, bothbeing complementary methods. The laboratory should offerboth options
Fibreanalysis
Digestion of feed directly in the detergent solution andfiltration using crucibles (official standard method).
AGR 503 MODULE 2
28
Digestion of sample whilst in a nylon bag and then washingthe bag containing the digested sample to make it detergentfree.
Starch Starch can be measured by the classical Ewers method orwith an enzymatic method. The enzymatic method can beused for all sample types and is therefore preferable.
Gross energy Gross energy represents the total energy value of the sampleand is measured by bombcalorimeter.
Minerals Minerals are generally measured by spectrometric methodsfollowing incineration and hydrolysis.
Amino acids(excludingtryptophan)
The standard method for the determination of amino acids isbased on the hydrolysis of protein to amino acids using astrong acid with or without previous oxidation, followedbychromatographic separation and detection afterderivatisation
Amino acids(tryptophan)
Determination of tryptophan is based on an alkalinehydrolysis followed bychromatographic Separation
Fatty acids The standard method for fatty acids is based on isolationand derivatisation, followed by gas chromatographicseparation
Vitamins Determination of individual vitamins is based on extraction,followed by clean-up, concentration if needed, andchromatographic measurement.
Reducingsugar
Reducing sugars contain the most important sugars,including glucose, fructose and sucrose. Determination isbased on the Luff-School principle.
Mycotoxins Mycotoxins are undesirable substances produced by fungi(moulds). These present apotential danger to animal andhuman health. The maximum levels are nationally andinternationally regulated. The different methods are basedon extraction, purification, chromatographic separation anddetection.
Pesticides Pesticides are undesirable substances whose maximumlevels are defined in national and international regulations.These regulations demand a low detection limit and positiveidentification of the pesticides, which is achieved by usingmass spectrometric detection. The methods are based onextraction, purification, derivatisation, chromatographicseparation and identification.
Source: De Jonge and Jackson (2005)

AGR 503 ANALYTICAL TECHNIQUES IN AGRICULTURE
29
3.1.1 Proximate Analyses
Characterization of feeds and feed ingredients for general nutritionalparameters are done using proximate analyses. The ability to conductproximate analyses is the minimum requirement for laboratories (De Jongeand Jackson 2005). Proximate analyses can be conducted in any basicnutrition laboratory while other analyses can be done in more complexlaboratories. Analytical methods for proximate composition and some otherfeed components are presented in Table 1.
3.1.2 Risk Analysis
Demands for higher standards in all aspects of feed production have beenon the increase globally. This may be in part due to the increasingawareness of the role of feeds in potential hazards associated with food ofanimal origin. Accordingly, appropriate codes have been developed byrelevant international bodies to assist national authorities to take measuresthat would mitigate most of these risks, particularly those of public healthimportance and which may constitute barriers to international trades. Riskanalysis is an objective and defensible mechanisms for risks reduction thatare associated with health and other factors. For example, Article 2.1 of theaquatic animal health code, which addresses animal health issues ininternational trades, provided basic guide and steps for import risk analysisin relation to aquatic animals and aquatic animal products (OIE, 2014).However, the principles and methods of risk analysis are the same for bothaquatic and terrestrial animals and products, including feedstuff. The fourcomponents involved with risk analysis are highlighted below:
a. Hazard identification: This is a categorization step in the riskanalysis and the risk assessment should be concluded at this stage inthe absence of any identified potential risk.
b. Risk assessment: Involves both qualitative and quantitative methodsof risk assessment, each with its relevant outputs. The steps are entryassessment; exposure assessment (both entry and exposureassessment steps involve the assessment of biological, country andcommodity factors); consequence assessment (direct and indirectconsequences); and risks estimation which integrates results of theentry, exposure and consequence assessments to produce the overallmeasures of risks associated with the hazard identified at the outset.The risk assessment should be concluded at either entry assessmentor exposure assessment step if no substantial risk is demonstrated.The whole risks pathway from identified hazard to unwantedoutcome is taken into account by the risk estimation step.

AGR 503 MODULE 2
30
c. Risk management: This involves deciding and implementingprotective measures and at the same time minimising the negativeeffects on trade. Components of risk management include riskevaluation, option evaluation, implementation, and monitoring andreview.
d. Risk communication: This requires having a risk communicationstrategy in place at the outset of each risk analysis.
3.1.3 Quality Assurance and Control in Feed Analysis
There are variations in the results of feed analyses obtained from differentlaboratories and these have been a major source of concern in the feedindustry and among relevant authorities globally (Key et al., 1997).Effortsto limit unacceptably high variations in the results of analysed samples invarious laboratories, which are sometimes difficult to attribute to genotypic,environmental or inter laboratory differences, contributed to thedevelopment of quality assurance and control for analysis (Mueller-Harvey2004). Use of quality assurance schemes, inter-laboratory evaluationprogrammes and reference materials were recommended by Petterson et al.,(1999) to reduce errors due to laboratory and methodological differences.Laboratory quality assurance scheme requires the implementation ofmanagement quality policy statement, objectives of the scheme, control ofsamples and records, equipment maintenance, methods evaluation,measurement principles, training, methods selection, intra- and inter-laboratory testing, reference standards, field and lab sampling, statisticalconsiderations, audits, corrective actions, programme revisions and update.These could be grouped properly under the four guiding principles of validanalytical measurement (VAM), which was developed in 1994 in theUnited Kingdom by the Department of Trade and Industry to contribute tovalidity of analytical data, namely (Malomo and Ihegwuagu 2017):
i. Use of properly validated methods of measurement.ii. Incorporate certified reference materials (CRMs) in quality
assurance protocols to ensure traceability measurements.iii. Independent assessment of laboratory’s performance for particular
tests through participation in national and international proficiencytesting schemes (PTS).
iv. Independent approval of quality assurance arrangements oflaboratories by accreditation or licensing to a recognised qualitystandard.

AGR 503 ANALYTICAL TECHNIQUES IN AGRICULTURE
31
3.1.4 Some Aspects of and Considerations in Feed Sampling
The accuracy and reliability of the results of any analysis in the animal feedindustry begins with the quality of sampling. An analysis can be said to beas good as its sampling because several challenges that can affect accuracyand reliability of the results are associated with sampling of the feeds andfeed materials. It is, therefore, critical to ensure sampling of animal feedingredients and feeds is done in an area and in a way that makes theprocedures easy, as well as minimise the risk of contamination and crosscontamination, makes proper performance of the laboratory analysispossible, and ensures all safety and health precautions for the sampler andthe environment.
3.1.5 Types of samples
Pierce (1994) and Malomo and Ihegwuagu (2017) identified various typesof samples depending on their purposes and uses as follows:
i. check sampleii. composite sampleiii. discrete sampleiv. duplicate samplev. official samplevi. purchasing samplevii. referee sampleviii. reference sampleix. retained samplex. standard samplexi. working sample.
3.1.6 Sampling Errors
Sampling errors may be due to the heterogeneity of the inspectedcharacteristics, the random nature of sampling, and the known andacceptable characteristics of the sampling plan (FAO, 2004). Some of themeasures to be taken to minimise sampling errors in the animal feedindustry include.
i. Sampling procedures should be based on the objectives,standards, or purposes of the analysis. Simple random sampling,stratified random sampling, and systematic sampling are examples ofcommon sampling schemes used in the feed industry.
AGR 503 MODULE 2
32
ii. Use appropriate sampling equipment that will not introducecontamination. For example, do not use lead containing materials tocollect samples meant for lead analysis. Examples of samplingequipment include grain probes (slotted grain probes, open-handledgrain probes, open-handled spiral probe); pelican grain sampler;tapered bag triers; double tube bag triers; single-tube, open-endedbag triers; bomb or zone sampler.
iii. Collect representative samples. If the samples collected are notrepresentative of the whole, the results of the analysis becomeskewed. To collect a representative sample, the sampling schememust be followed, adequate quantity of sample must be collected,and sampling equipment and procedure must be appropriate,required inspection of sample, among other things
iv. Use the right quantity of materials and avoid splashing of samplesduring collection and analysis. Several errors can be associated withthe splitting of samples, if not done carefully.
v. Use standard reference materials.vi. Repeat analysis.vii. Validate laboratory methodologies and use standard methods.viii. Use well trained and knowledgeable personnel.ix. Observe sampling precautions required for the methods of analysis.x. Use the appropriate sampling plans.
3.1.7 Sampling Plans Selection
Sampling plan is a planned procedure that enables the choice of separatesamples from a lot, for the purpose of getting the needed information, suchas a decision on compliance status of a lot. It is also a scheme that definesthe number of items to collect and the number of non-conforming itemsrequired in a sample to evaluate the compliance status of a lot. Thus,without an appropriate sampling plan, it may be practically impossible toaccurately decide the compliance status of a particular lot of a product.Codex guideline for sampling recommends seven important considerationsin selecting appropriate sampling plans incompliance with relevantstandards in the feed industry (FAO 2004):
(i) Existence (or not) of international reference document on samplingof the products under consideration;
(ii) Nature of control (individual or whole lot),(iii) Nature of the characteristic to control (qualitative or quantitative
characteristics),

AGR 503 ANALYTICAL TECHNIQUES IN AGRICULTURE
33
(iv) Choice of the quality level, limiting quality or acceptance qualitylevel, in line with principles laid down in codex manual ofprocedures and the type of risk,
(v) Nature of the lot, that is bulk or pre-packed products, size,homogeneity and distribution concerning the characteristics ofcontrol,
(vi) Composition of sample, that is those composed of single or morethan one sampling unit,
(vii) Choice of the type of sampling plan.
3.1.8 Preparation of Samples
FAO (2004) also sets the guidelines for sample preparation. A primarysample is prepared by direct collection of items or incremental samples.During the first stage of the sampling process, primary samples arecollected from lots of items or incremental samples for pre-packed or bulkfeeds, respectively. In order to facilitate laboratory analysis, sufficientquantity of the primary samples of similar size should be collected.Necessary precautions must be taken to ensure sample integrity and avoidany form of contamination throughout the entire process of sampling andanalysis. Composite sample is prepared, whenever required by the samplingplan, by carefully mixing the primary samples. This involves primarysamples collected from a lot of pre-packaged products or incrementalsamples from a bulk (not-pre-packed) lot. In composite sample preparation,combination of primary samples may lead to loss of information on sample-to-sample variation. The composite sample should, except when too large,constitute the final sample which is sent to the laboratory for analysis.
4.0 CONCLUSION
The reliability and quality of the analysis depends on the accuracy ofsampling. However, adequate care must be taken to ensure that the analytesare handled in a way that will prevent degradation and errors. Laboratoryquality assurance scheme requires the implementation of managementquality policy statement, objectives of the scheme, control of samples andrecords, equipment maintenance, methods evaluation, measurementprinciples, training, methods selection, intra- and inter-laboratory testing,reference standards, field and lab sampling, statistical considerations,audits, corrective actions, programme revisions and update to ensurequality and reliable results of laboratory feed analysis.
AGR 503 MODULE 2
34
5.0 SUMMARY
Feed sampling and analyses are essential parts of the processes whichensure that feed stuffs and the resultant food animals meet all necessarystandards. Where a feed which has been identified as not satisfying the feedsafety requirement is part of a batch, lot or consignment of feed of the sameclass or description, it shall be presumed that all of the feed in that batch,lot or consignment is so affected, unless following a detailed assessmentthere is no evidence that the rest of the batch, lot or consignment fails tosatisfy the feed safety requirement. This is an important point if you get anadverse sample result when sampling.
6.0 TUTOR-MARKED ASSIGNMENT
1. In a tabular form mention 10 feed parameters and describe brieflytheir laboratory procedures.
2. Explain the term proximate analysis in laboratories.3. What do you understand by risk analysis? State four components
involved with risk analysis.4. List 10 types of samples you studied.5. Define Sampling error as given by FAO and state 10 steps to be
taken to minimise sampling error in animal feed analysis.6. What do you understand by sampling plan? What are the
considerations while selecting a sampling pan?
7.0 REFERENCES/FURTHER READING
De Jonge L.H., & Jackson F.S. (2005). The Feed Analysis Laboratory:Establishment and Quality Control.
FAO/WHO. (2004). General Guidelines on Sampling (CAC/GL 50-2004).Rome: FAO; Geneva:WHO.
Key, P.E, Patey, A.L, Rowling, S, Wilbourn, A, Worner, F.M. (1997)International proficiency testingof analytical laboratories for foodsand feeds from 1990 to 1996: The experiences of the UnitedKingdom food analysis performance assessment scheme. Journal ofAOAC International. 80:895-899.
Malomo, G. A. & Ihegwuagu, N. E. (2017).Some Aspects of Animal FeedSampling and Analysis in Ideas and Applications Toward SamplePreparation for Food and Beverage Analysis. Livestock ResearchDivision and Natural Resources Management Division, Agricultural
AGR 503 ANALYTICAL TECHNIQUES IN AGRICULTURE
35
Research Council of Nigeria (ARCN), Abuja, Nigeriahttp://dx.doi.org/10.5772/intechopen.70856
Mueller-Harvey, I. (2004). Modern Techniques in Feed Analysis. In:Assessing Quality and Safety of Animal Feed. Rome: FAO.
OIE (2014). Aquatic Animal Health Code. (17th ed.). Paris: WorldOrganisation of Animal Health; 2014. ISBN: 978-92-9044-942-3.
Petterson, D.S, Harris, D.J, Rayner, C.J, Blakeney, A.B, & Choct, M.(1999). Methods For The Analysis of Premium Livestock Grains.Australian Journal of Agricultural Research. 50:775-787
Pierce, J.G. (1994) Sampling. In: Feed Manufacturing Technology IV.Arlington, V,A, USA: AFIA.
Setting up a feed analysis laboratory, and implementing a quality assurancesystemcompliant with ISO/IEC 17025:2005. In: Makkar HPS,editor. Animal Production and Health Guidelines No. 15. Rome:FAO.
AGR 503 MODULE 2
36
UNIT 2 PLANT SAMPLING AND SAMPLEPREPARATION FOR ANALYSIS
CONTENTS
1.0 Introduction2.0 Objectives3.0 Main Content
3.1 Plant Sampling and Sample Preparation4.0 Conclusion5.0 Summary6.0 Tutor-Marked Assignment7.0 References/Further Reading
1.0 INTRODUCTION
Plant and soil testing enable scientific assessment of the needs of the plantfor nutrient elements and of the capacity of the soil to supply them. Thenutrient elements enter the plant in ionic form from the soil solution. Iontransport to the root surface may take place through ion diffusion and bulktransport (mass flow). Sample collection is critical for plant analysis asplant nutrient composition varies with age, the portion of the plant sampled,and many other factors. Mistakes or carelessness in selecting, collecting,handling, preparing, or shipping plant tissue for analysis can result inunreliable data, which may lead to incorrect interpretations andrecommendations. Standards, against which the sample is evaluated, havebeen selected to represent the plant part and time of sampling that bestdefine the relationship between nutrient composition and plant growth.Deviation from the prescribed protocol severely limits this interpretationscapability. It is, therefore, critical to follow a standard sampling procedure.However, when plant analysis is being used to confirm a suspected nutrientdeficiency, the samples should be taken as early in the season as possible sothat the deficiency can be corrected and minimize the potential yield loss.Plants showing abnormalities usually continue to accumulate nutrients evenif growth is impaired by some limiting factor.
2.0 OBJECTIVES
By the end of this unit, you will be able to:
understand the meaning of crop sampling and sample preparation carry out crop sampling and sample preparation.
AGR 503 ANALYTICAL TECHNIQUES IN AGRICULTURE
37
3.0 MAIN CONTENT
3.1 Crop Sampling and Sample Preparation
3.1.1 Crop Sampling
Crop sampling is crucial for crop tissue analysis to enable researchers in thefield of crop science carry out sustainable research works. This will lead toadequate crop improvements, genetic enhancement and modifications aswell as improved productivity. Crop sampling has to be done with utmostcarefulness as any mistakes or carelessness in selecting, collecting,handling, preparing, or shipping plant tissue for analysis can result inunreliable data, which may lead to incorrect interpretations andrecommendations. Samples should not be taken from plants that obviouslyhave been stressed from causes other than nutrients. Do not take samplesfrom plants that are dead or insect damaged; Are mechanically orchemically injured; Have been stressed by too much or too little moisture(i.e., flooding or drought); Have been stressed by abnormally high orabnormally low temperature. Sample normal and abnormal areas when anutrient deficiency is suspected (even without visual symptoms), or there isa need to compare different areas in a field, it is recommended that similarplant parts be collected separately from both the affected plants andadjacent normal plants that are at the same stage of growth. In this way, abetter evaluation can be made between the nutritional status of healthy andabnormal plants of the same variety grown under the same conditions.
3.1.1.1 Collection and Treatment of Plant Material
Select plant material with the desired or expected composition. Realise thatthe composition of different parts of a plant (leaf, stem, flower, fruit) maydiffer considerably and that, in general, the control sample should matchthe test samples as much as possible. If the fresh material is contaminated(e.g. by soil, salts, dust) it needs to be washed with tap water or dilute (0.1M) hydrochloric acid followed by deionised water. For test samples, tominimise the change of concentration of components, this washing shouldbe done in a minimum of time, say within half a minute. For the preparationof a control sample this is less critical.The sample is dried at 70°C in a ventilated drying oven for 24 hours. Thesample is then cut and ground to pass a 1 mm sieve. Storage can be done asdescribed for soil samples. Note. During the pretreatment (drying, milling,sieving) both soil and plant material may be contaminated by the toolsused. In this way the concentration of certain elements (Cu, Fe, Al, etc.,)
AGR 503 MODULE 2
38
may be increased. Like the washing procedure, this problem is less criticalfor control samples than for test samples (unless the contamination ispresent as large particles).
Precautions during crop samplingThe following guidelines have to be followed during sampling as seriouserror may occur which may lead to grave consequences. Such precautionsare as follow:
1. Samples should not be taken from plants that obviously have beenstressed from causes other than nutrients.
2. Do not take samples from plants that are dead or insect damaged3. Are mechanically or chemically injured4. Have been stressed by too much or too little moisture (i.e., flooding
or drought);5. Have been stressed by abnormally high or abnormally low
temperature.6. Sample normal and abnormal areas when a nutrient deficiency is
suspected (even without visual symptoms), or there is a need tocompare different areas in a field, it is recommended that similarplant parts be collected separately from both the affected plants andadjacent normal plants that are at the same stage of growth.
3.1.2 Plant Tissue Sample Preparation
- After a plant sample has been collected, it should be prepared forshipment or delivery to the laboratory.
- Roots or foreign material attached to the sample should be removedand discarded. Plant tissue must then be dusted off to remove soilparticles.
- DO NOT WASH tissue since soluble nutrients will be leached out ofthe sample. If tissue is to be mailed, the sample should be air-driedabove a heating vent or in the sun for one to two days to avoid moldformation during shipment.
- Place the plant sample in a paper bag in a large paper envelope forshipment. Do not pack the sample tightly into the mailing containeror put samples in plastic or polyethylene bags as this will alsopromote mold development.
- Plant samples that are delivered to the laboratory do not need to beair-dried if they are delivered within one day after sampling.Samples to be delivered directly to the laboratory at a later date maybe kept frozen or air-dried until they are delivered.
AGR 503 ANALYTICAL TECHNIQUES IN AGRICULTURE
39
- Include Soil Sample Soil test results for pH, organic matter,phosphorus, and potassium (routine test) can be useful forcorrelating with plant analysis results to pinpoint a nutrient problem.
- A composite soil sample, consisting of five or more cores, taken to adepth of 6-7 inches, should be taken from the same area where theplant sample was collected. For row crops, avoid the fertilizer bandby sampling from the middle of the row.
- Put the sample into a soil sample bag or other waterproof containerand label the soil sample with the same field and sample number asthat assigned to the tissue sample.
- Package corresponding plant and soil samples together, but makecertain soil sample bags do not open in transit as spilled soil willcontaminate plants.
Precautions during Plant tissue sample preparation1. Roots or foreign material attached to the sample should be removed
and discarded.2. Plant tissue must then be dusted off to remove soil particles.3. DO NOT WASH tissue since soluble nutrients will be leached out of
the sample.4. If tissue is to be mailed, the sample should be air-dried above a
heating vent or in the sun for one to two days to avoid moldformation during shipment.
5. Place the plant sample in a paper bag in a large paper envelope forshipment.
6. Do not pack the sample tightly into the mailing container or putsamples in plastic or polyethylene bags as this will also promotemold development.
7. Plant samples that are delivered to the laboratory do not need to beair-dried if they are delivered within one day after sampling.
8. Samples to be delivered directly to the laboratory at a later date maybe kept frozen or air-dried until they are delivered.
9. Include Soil Sample Soil test results for pH, organic matter,phosphorus, and potassium (routine test) can be useful forcorrelating with plant analysis results to pinpoint a nutrient problem.
10. A composite soil sample, consisting of five or more cores, taken to adepth of 6-7 inches, should be taken from the same area where theplant sample was collected.
3.1.3 What to Do with Samples

AGR 503 MODULE 2
40
A “Plant Analysis Information Sheet” should be filled out for any samplessubmitted. Use a separate information sheet for each sample. Plant samples,corresponding soil samples, and accompanying information sheets can beobtained and turned in at the County Extension Office especially in theUnited States. Samples may also be sent or delivered to the laboratorydirectly. The University of Wisconsin laboratory that conducts the plantanalysis program is the Soil and Plant Analysis Laboratory at Madison.Some, but not all, private laboratories also analyse plant tissues; therefore,you should check with your laboratory on the specific services they providebefore submitting the samples.
3.1.4 What the Analysis Report Will Include
The report will show the concentration of N, P, K, Ca, Mg, S, Zn, Mn, B,Cu, Fe, Al, and Na in the plant sample. If a soil was submitted with theplant sample, soil analyses for pH, organic matter, P, K, and any specialsoil test results will also be reported. In addition, the analytical levels ofnutrients in the plant and soil will be interpreted to reflect nutrientdeficiencies, toxicities, or imbalances by the sufficiency range approach,and if calibration data are available, the nutrient ratio method. Whenwarranted, fertiliser recommendations will be made based on the analyticalresults. Most commonly grown field vegetables and fruit crops will receivethese interpretations and recommendations. For those plant materials wherecalibration data are not available, these analytical results will be providedwithout interpretation.
3.1.5 Procedure for Plant Preparation for Analysis
The following procedure is suggested:
1. For analysis of seasonal crop plants, pick a few representative plantsat random from each plot. Remove the shoot (aerial part) with thehelp of a sharp stainless-steel cutter for whole shoot analysis or thedesired part for analysis of specific plant parts.
2. If roots are to be included, uproot the whole plant carefully from wetsoil, retaining even the fine/active roots. Dip the plant roots gently inwater several times to remove adhering soil.
3. Wash with water several times.4. Wash the samples with about 0.2 percent detergent solution to
remove the waxy/greasy coating on the leaf surface.5. Wash with 0.1M HCl followed by thorough washing with plenty of
water. Give a final wash with distilled water.6. Wash with DDW if micronutrient analysis is to be carried out.

AGR 503 ANALYTICAL TECHNIQUES IN AGRICULTURE
41
7. Soak to dry with tissue paper.8. Air-dry the samples on a perfectly clean surface at room temperature
for at least 2–3 days in a dust-free atmosphere.9. Put the samples in an oven, and dry at 70 °C for 48 hours.10. Grind the samples in an electric stainless steel mill using a 0.5-mm
sieve. Clean the cup and blades of the grinding mill before eachsample.
11. Put the samples back in the oven, and dry again for constant weight.Store in well-stoppered plastic or glass bottles or in paper bags foranalysis.
3.1.6 Parts of Crops Analysed
Whole plant analysis is conducted in order to determine the total nutrientuptake (which is usually carried out on the shoot). For plant analysis to bemeaningful as a diagnostic tool, the collection of particular plant parts(tissue) at the right stage of growth for analysis is very important. Plantleaves are considered the focus of physiological activities. Theconcentrations of leaf nutrients appear to reflect changes in mineralnutrition. As an example, Table 1 shows the specific parts, as identified byvarious researchers, to be sampled from different plant species. Theirconcentrations are expected to reflect the true nutrient status of a growingplant (deficiency, sufficiency or excess).
The interpretation of plant analysis data is usually based on the totalconcentrations of nutrients in the dry matter of leaves or other suitable plantparts compared with standard values of “critical nutrient concentrations”(“critical values”). Between the nutrient concentrations of the deficiencyrange and those of adequate supply, there is the critical nutrient range. Thecritical level is that level of concentration of a nutrient in the plant that islikely to result in 90 percent of the maximum yields. The main advantage ofcritical values, once properly established, is their wide applicability for thesame crop. Their disadvantage is that they only provide “yes or no” type ofinformation and do not cover the entire range over which nutrient suppliesneed to be managed. Table 2 presents some critical values for a range ofcrops.
Table 2: General sufficiency or optimal range of nutrients in plantsNutrients Sufficiency or optimal
level

AGR 503 MODULE 2
42
Macronutrients %N 2.0–5.0P 0.2–0.5K 1.0–5.0Ca 0.1–1.0Mg 0.1–0.4S 0.1–1.3Micronutrients (μg/g)Zn 20 – 100Fe 50 – 250Mn 20 – 300Cu 5 – 20Mo 0.1 – 0.5B 10 – 100FAO, 2008
Table 3: Crop Part to be sampled, with age or growth stageCrop Part to be sampled with age or growth stageWheat Flag-leaf, before head emergence
Rice 3rd leaf from apex, at tilleringMaize Ear leaf before tasselingBarley Flag leaf at head emergencePulse Recently matured leaf at bloom initiationGroundnut Recently matured leaflets at maximum tilleringSoybean 3rd leaf from top, 2 months after plantingCotton Petiole 4th leaf from apex, at initiation of floweringSugar cane leaf from top, 3–5 months after plantingTea 3rd leaf from tip of young shootsPotato Most recent, fully developed leaf (half-grown)Tomato Leaves adjacent to inflorescence (mid-bloom)Onions Top non-white portion (1/3 to 1/2 grown)Beans Uppermost, fully developed leavesPea Leaflets from most recent, fully developed leaves, at first
bloomApple, Pear Leaves from middle of terminal shoot growth, 8–12 weeks
after full bloom, 2–4 weeks after formation of terminalbuds in bearing trees
Cherry Fully expanded leaves, mid-shoot current growth in July–August
Peach Mid-shoot leaves, fruiting or non-fruiting spurs,midsummer leaves
Strawberry Fully expanded matured leaf without petiole, at peak or

AGR 503 ANALYTICAL TECHNIQUES IN AGRICULTURE
43
harvest periodBanana Petiole of 3rd open leaf from apex, 4 months after plantingPapaya Papaya 3–5-month old leaves from new flushPineapple Middle third portion of white basal portion of 4th leaf from
apex, at 4–6-month stageFAO, 2008
4.0 CONCLUSION
You have learnt that samples should not be taken from plants that obviouslyhave been stressed from causes other than nutrients. Do not take samplesfrom plants that are dead or insect damaged; Are mechanically orchemically injured; Have been stressed by too much or too little moisture(i.e., flooding or drought); Have been stressed by abnormally high orabnormally low temperature. Sample normal and abnormal areas when anutrient deficiency is suspected.
5.0 SUMMARY
The analytical levels of nutrients in the plant and soil will be interpreted toreflect nutrient deficiencies, toxicities, or imbalances by the sufficiencyrange approach, and if calibration data are available, the nutrient ratiomethod. When warranted, fertilizer recommendations will be made basedon the analytical results. Most commonly grown field vegetables and fruitcrops will receive these interpretations and recommendations. For thoseplant materials where calibration data are not available, these analyticalresults will be provided without interpretation.
6.0 TUTOR-MARKED ASSIGNMENT
1. What is plant sampling and why is it crucial in plant analysis?2. What are the precautions to take while carrying out crop sampling?3. State 10 precautions during plant tissue sample preparation.4. Mention at least ten (10) parameters to be measured during plant
analysis.5. Discuss what to do with samples after collection.6. Outline the procedure for plant preparation for analysis.

AGR 503 MODULE 2
44
7.0 REFERENCES/FURTHER READING
FAO (2008) Guides to Laboratory Establishment for Plant NutrientAnalysis. Fertilizer and Plant nutrition Bulletin Vol. 19. Rome.
http://www.soils.wisc.edu/extension/pubs/pa_sampling.pdf

AGR 503 ANALYTICAL TECHNIQUES IN AGRICULTURE
45
UNIT 3 SOIL SAMPLING AND SAMPLE PREPARATION
CONTENTS
1.0 Introduction2.0 Objectives3.0 Main Content
3.1 Soil Sampling and Sample Preparation4.0 Conclusion5.0 Summary6.0 Tutor-Marked Assignment7.0 References/Further Reading
1.0 INTRODUCTION
Soil sampling is a method that can be used for exploration of soil resourcesthat lack obvious surface manifestations. Soils that are above or adjacent toa “hidden” system will have a unique chemistry that can be indicative ofsuch system at depth and a zone of relatively high permeability. Themethods and procedures for obtaining soil samples vary according to thepurpose of the sampling. Analysis of soil samples may be needed forengineering and agricultural purposes. This guide describes soil samplingfor agricultural purposes, i.e. for soil fertility evaluation and fertilizerrecommendations for crops. The results of even very carefully conductedsoil analyses can only be as good as the soil samples themselves. Thus, theefficiency of a soil testing service depends on the care and skill with whichsoil samples are collected. Non-representative samples constitute the largestsingle source of error in a soil fertility programme. The most importantphase of soil analysis takes place not in the laboratory but in the field wherethe soil is sampled. Soils vary from place to place. In view of this, effortsshould be made to take the samples in such a way that they are fullyrepresentative of the field. Only 1–10 g of soil is used for each chemicaldetermination and this sample needs to represent as accurately as possiblethe entire surface 0–22 cm of soil, weighing about 2 million kg/ha.
2.0 OBJECTIVES
By the end of this unit, you will be able to: know the meaning of soil sampling and sample preparation understand the meaning of crop sampling and sample preparation.

AGR 503 MODULE 2
46
know the basic procedures, techniques and equipment’s used in soiland crop sampling and sample preparations
3.0 MAIN CONTENT
3.1 Soil Sampling and Sample Preparation
3.1.1 Soil Sampling
The major objectives of soil sampling have been to determine the averagenutrient status of a field and to provide some measure of nutrient variabilityin a field. Soil sampling for precision agriculture is the trending dimensionof agricultural researches and has these same objectives with somemodifications. Instead of a field, producers are interested in areas withinfields. They also are interested in relating trends in soil fertilizer levels toother field properties that are predictable or easily measured. Knowledge offactors influencing soil nutrient levels including soil type, topography,cropping history, manure application, fertilizer application and leveling forirrigation will help the producer determine the most effective samplingapproach. The basic principles of soil sampling still apply to precisionsampling. An adequate number of samples should be collected to accuratelycharacterise nutrient levels. The samples should be collected to the properdepth for non-mobile and mobile nutrients. Samples should be handled andstored to minimise contamination and degradation.
3.1.1.1 Collection and Treatment of Soil Material
The amount of material to be collected depends on the turn-over of thesample material, the expected stability and the amount that can be handledduring preparation. Thus, amounts may range from a few kilos to a hundredkilo or more. The material is collected in plastic bags and spread out onplastic foil or in large plastic trays in the institute for air-drying (do notexpose to direct sunlight; forced drying up to 40°C is permitted). Removelarge plant residues. After drying, pass the sample through a 2 mm sieve.Clods, not passing through the sieve are carefully crushed (not ground!) bya pestle and mortar or in a mechanical breaker. Gravel, rock fragments etc.not passing through the sieve are removed and discarded. The materialpassing through the sieve is collected in a bin or vessel for mechanicalhomogenisation. If the whole sample has to be ground to a finer particlesize this can be done at this stage. If only a part has to be ground finer, thisshould be done after homogenisation. Homogenisation may be done with ashovel or any other instrument suitable for this purpose. Some laboratoriesuse a concrete mixer. Mixing should be intensive and complete. After that,
AGR 503 ANALYTICAL TECHNIQUES IN AGRICULTURE
47
the bulk sample is divided into subsamples of 0.5 to 1 kg to be used in thelaboratory. For this, riffle samplers and sample splitters may be used. Thesubsamples can be kept in glass or plastic containers. The latter have theadvantage that they are unbreakable. Both have the disadvantage is that fineparticles may be electrostatically attracted to the container walls thuscausing segregation. The rule about labelling is that it should preferably bedone on both the container and the lid. If only one label is used this shouldalways be stuck on the container and not on the lid!
3.1.2 Soil Sampling Methods
Properly collecting soil samples is the most important step in anynutrient/soil amendment management program. When considering Soilsampling methods, the following borne in mind:
i. Soil sampling should reflect tillage,ii. past fertilizer/soil amendment placement,iii. cropping patterns (and corresponding irrigation requirements),iv. soil type (including drainage and slope characteristics) and perhapsv. old field boundaries (such as old feedlots, windrows, altered stream
beds, etc.).
Trends toward reduced and/or zero tillage and technology for variable ratefertilization (VRF) have especially demanded that soil samples be takenmore comprehensively and intensively for more accurate fertilizer and soilamendment application. This section will discuss the many methods usedfor taking an accurate soil sample using various methods and under severaldifferent types of tillage situations. The most commonly used method forsoil sampling would be based on soil types. Fields are split into samplingareas that contain similar soils. Hillsides are kept separate from bottomssince the soil types will vary. Soil survey maps, if applicable, can helporganize the soil types throughout the sampling area. Samples will notnecessarily need to be collected for every soil type; however, similar soilsshould be kept together. Sampling maps can be kept to note the locations ofthe cores for subsequent sampling. The sampling area will be dependent onthe soils and topography. Generally, an area of forty acres is considered themaximum size. Smaller sampling areas may be needed if the soils are quitevariable or a production problem is apparent.
Once the sampling area is determined, a sufficient number of cores shouldbe taken to acquire a representative sample. This is generally 10 to 20cores. The depth of sample for surface soils would be 0 to 6 inches or asdeep as the primary tillage. Deeper samples to 24 or 36 inches can be taken
AGR 503 MODULE 2
48
for residual nitrate-nitrogen. These deep samples would be kept separatefrom the surface samples and noted accordingly on the bag and submittalform.
3.1.3 Sampling Techniques
Soil variability is a major concern when trying to obtain a representativesoil sample. The strategy used to sample a field can address this challenge.Information collected during a site assessment can assist in choosing anappropriate strategy for a particular field. Some of the sampling techniquesthat can be adopted include:
Random composite sampling Directed random composite sampling Benchmark sampling Landscape-directed benchmark sampling Grid sampling Transect sampling
1. Random composite samplingRandom composite sampling involves taking samples in a randompattern across a field, while avoiding unusual or problem soil areas.This strategy is most appropriate for fields less than 30 ha (80 ac),that have been uniformly cropped in the recent past and have littlenatural variation. This is the most common method of samplingpresently used in most research works in Nigeria. For randomsampling, collect cores from 15 to 20 sites and separate each core bydepth to obtain representative bulk samples for each depth.
2. Directed random samplingDirected or managed random sampling is a modified version of arandom sampling strategy. This pattern is suited to fields or areaswhere it is difficult to identify a single dominant area that wouldrepresent most of the field. The study field is therefore sub-dividedinto management zones based on unique characteristics. Forinstance, if there are noticeable differences in yield throughout afield, management zones might be comprised of below average,average and above-average yielding areas. Take 15 to 20 coresrandomly from each management zone. A single field may requireseveral bulk samples depending on the number of managementzones. This technique might also be appropriate for areas with morethan one soil type, fields with hummocky (rolling) landforms, andfields under strip-crop management.

AGR 503 ANALYTICAL TECHNIQUES IN AGRICULTURE
49
3. Benchmark samplingBenchmark sampling involves selecting a small (30 m by 30 m)representative site on a field. This site is used as a guide forfertilizing that entire field. Select probe sampling sites in a gridpattern within the benchmark area and prepare a composite samplefor each soil depth. Sampling from the same small area each yearreduces sampling variability and better reflects changes in soilnutrient level from year to year. Benchmark sampling sites should bemarked with a GPS or by other means. When first using thissampling technique, it can be difficult to select a benchmark site thatbest represents a field. Therefore, in the first year, it may benecessary to sample and analyze a number of potential benchmarksites. Initially, the costs for laboratory analysis will be higher but themost representative benchmarking site will be identified. If a singlesite does not adequately represent a field, it may be necessary tomaintain multiple benchmark areas (i.e., directed benchmarksampling, see next section).
Features that helps in selecting a benchmark site Look for features such as soil colour and landscape to identify
where different soil types occur. Select a site that has characteristics similar to most of the
field or the dominant soil type. Observe crop development patterns to assist in identifying
different soil conditions. At the beginning of the growingseason differences in crop establishment and vigor are moreapparent, making a representative location easier to identify.
Potential benchmark sites can also be selected based on yield, Aerial photos or topographic maps, this gaining popularity
particularly with increased use of GPS. GPS coordinates help to identify and locate the benchmark
site for sampling each year.4. Directed benchmark sampling
Directed benchmark sampling is a variation on the benchmarktechnique. It involves establishing multiple benchmark areas andmanagement zones, based on topography or other characteristics.This strategy can be used when major areas within fields havedistinct and well-defined features related to moisture (e.g., texture,slope). Management zones can be identified using soil surveys,detailed elevation mapping, aerial black and white photographs,yield maps or remote sensed images.

AGR 503 MODULE 2
50
Directed benchmark sampling is only warranted if distinct areas aremanaged individually. For example, a soil analysis from abenchmark site in a low area suggests that it might respond to higherrates of N compared to a benchmark site on an upland area. Evenwithout variable rate application capabilities, N application could beincreased by other means to optimize yield in low areas.
5. Grid samplingGrid sampling is the most intense and expensive sampling strategy.It uses a systematic method to reveal fertility patterns and assumesthere is no topographic reason for fertility patterns to vary within afield. For grid sampling, a field is divided into small areas or blocks.A sample location within each block (e.g., the center point) issampled 3 to 10 times. Sampling frequency may range from onesample from each 60 m × 60 m (0.5 ac) area of the field to onesample from each 2 ha (5 ac) of the field. In general, the smaller thesampling unit, the greater the accuracy.
6. Transect samplingA transect is a path along which one counts and records occurrencesof the species of study. It requires an observer to move along a fixedpath and to count occurrences along the path and, at the same time(in some procedures), obtain the distance of the object from the path.This results in an estimate of the area covered and an estimate of theway in which detectability increases from probability 0 (far from thepath) towards 1 (near the path). Using the raw count and thisprobability function, one can arrive at an estimate of the actualdensity of objects.In soil sampling especially along a slope or a toposequence, atransect is usually made from the crest of the slope to its bottom andsampling carried out along the transect line.
3.1.4 Selection of a Sampling Unit
A visual survey of the field should precede the actual sampling. Note thevariation in slope, colour, texture, management and cropping pattern bytraversing the field. Demarcate the field into uniform portions, each ofwhich must be sampled separately. Where all these conditions are similar,one field can be treated as a single sampling unit. Such a unit should notexceed 1–2 ha, and it must be an area to which a farmer is willing to giveseparate attention. The sampling unit is a compromise between expenditure,labour and time on the one hand, and precision on the other.

AGR 503 ANALYTICAL TECHNIQUES IN AGRICULTURE
51
3.1.5 General Soil Sampling Guidelines
For any soil sampling Technique: Take 15 to 20 cores for eachrepresentative bulk sample. This number of samples is based onstatistical precision.
Each core will be segmented into lengths that represent depths of 0to 15 cm, 15 to 30 cm and 30 to 60 cm.
Separate the segmented cores by depth into clean, labeled plasticpails. Thoroughly mix the content of each pail, crushing any lumpsin the process.
Avoid using metal pails to collect samples because they can alter theresults of micronutrient tests.
Take a single sub-sample (0.5 kg) for each sampling depth andsubmit for analysis.
For hilly fields with knolls, slopes, or depressions, take samplesfrom crest or top slope, mid-slope and foot slope positions to get arepresentative sample each part of the field.
Avoid sampling obvious areas of unusual variability such as: salineareas, eroded soils, old manure piles, burn piles, haystacks, corrals,fence rows, old farmsteads or any other unusual areas.
Soils within 15 m (50 ft) of field borders or shelterbelts and within50 m (150 ft) of built-up roads should be avoided or sampledseparately.
Always sample prior to manure or fertilizer applications.
3.1.6 Soil Sampling Procedure
1. Prepare a map of the area to be covered in a survey showingdifferent sampling unit boundaries.
2. Enter a plan of the number of samples and manner of compositesampling on the map, designating different fields by letters (A, B, C,etc.).
3. Traverse each area separately. Cut a slice of the plough layer atintervals of 15–20 steps or according to the area to be covered.
4. Generally, depending on the size of the field, 10–20 spots must betaken for one composite sample.
5. Scrape away surface litter to obtain a uniformly thick slice of soilfrom the surface to the plough depth from each spot.
6. Make a V-shaped cut with a spade to remove a 1–2-cm slice of soil.Collect the sample on the blade of the spade and put it in a cleanbucket.

AGR 503 MODULE 2
52
7. In this way, collect samples from all the spots marked for onesampling unit.
8. In the case of hard soil, take samples with the help of an auger fromthe plough depth and collect them in the bucket.
9. Pour the soil from the bucket onto a piece of clean paper or cloth,and mix it thoroughly. Spread the soil evenly and divide it intoquarters. Reject two opposite quarters and mix the rest of the soilagain.
10. Repeat the process until left with about 0.5 kg of the soil. Collect itand put in a clean cloth bag. Mark each bag clearly in order toidentify the sample.
11. The bag used for sampling must always be clean and free from anycontamination.
3.1.7 Methods for Sub-Sampling Soils
1. MixingThe bulk soil sample should be thoroughly homogenized by mixingwith a spatula, stirring rod, or other implement. As much of thesample as possible should be loosened and mixed together. Nosegregation of the sample by aggregate size should be apparent aftermixing. Dip into the center of the mixed sample to obtain asubsample.
2. WeighingSubsamples should be weighed into a tared vessel with a minimumprecision of +/- 1% (e.g., 5.0 +/- 0.05 g). If a separate container isused to weigh and transfer subsamples to extraction vessels, itshould be brushed out between samples to avoid cross-contamination.
3. ScoopingDip into the center of the homogenized bulk sample with a standardsoil scoop, filling it heaping full without pushing against the side ofthe soil container. Holding the scoop firmly, tap the handle threetimes with a spatula, two or three inches from the sample. Hold thespatula perpendicular to the top of the scoop and strike off the excesssoil (Peck, 1988). If weight basis results are needed, empty the scoopcontents into a tared weighing vessel and record the weight.
3.1.8 Depth of Soil Samples
Remove organic debris, rocks and trash from the surface of the soilsampling areas before the sample is collected the soil sample to ploughlayer. Select the sampling spot using any of the sampling techniques

AGR 503 ANALYTICAL TECHNIQUES IN AGRICULTURE
53
discussed earlier. Collect all the samples in a bucker. Depth of sampling isdesired according to the purpose.
1. Soil fertility (15-25 cm)2. Salinity and alkalinity (1m)3. Establishment of gardens (2m)4. Soil survey profile of (1-1.5m) depth
Keep record of the areas sampled and simple sketch map for reference.When sampling a soil, bear in mind the following:
Do not sample unusual areas, such as unevenly fertilized areas,marshy areas, old paths, old channels, old bunds, areas near trees,sites of previous compost piles, and other unrepresentative sites.
For a soft and moist soil, the tube auger or spade is consideredsatisfactory. For harder soil, a screw auger may be more convenient.
Where crops have been planted in rows, collect samples from themiddle of the rows in order to avoid the area where fertilizer hasbeen band placed.
Avoid any type of contamination at all stages. Soil samples shouldnever be stored with fertilizer materials and detergents.Contamination is likely when the soil samples are spread out to dryin the vicinity of stored fertilizers or on floor where fertilizers werestored previously.
Before putting soil samples in bags, they should be examined forcleanliness as well as for strength.
The information sheet should be filled in clearly with a copyingpencil.
3.1.9 Steps Adopted In Preparing Samples for LaboratoryAnalysis
After complete collection of soil samples from field the organic residueslike tree leaves, twigs, dung etc. and gravels, stones and other unwantedmaterial should be kept out and sample should be prepared for laboratoryanalysis by adopting following steps.
1. Drying2. Grinding3. Sieving4. Mixing5. Partitioning6. Weighing

AGR 503 MODULE 2
54
7. Labelling8. Storing
The soil samples should be air dried first and then grinding should befollowed. A wooden mortar and pestle should be used for grinding to avoidcontamination in the soil sample. After grinding soil samples should besieved with 2 mm mesh sieve and all the samples are then mixedthoroughly by spreading over cloth or paper. From this bulk soil sampleone representative soil sample should be collected following quarteringmethod of portioning. About 250 to 500 g of soil sample is sufficient whichshould be stored in dry and clean poly bags, screw cap jars or card boardboxes with proper labeling.
3.1.10 Sampling Tools and Sample Preparation
A sampling tool should be:
uncontaminated approximately uniform in cross section to the desired depth provide reproducible sampling units
Depending on the purpose and precision required, the following tools maybe needed for taking soil samples:
1. blades: trowel, spade, shovel, spoon, knife, cutlass2. tubes: open-sided and plain cylinders3. augers: wood-bit, post-hole, sheathed auger4. a clean bucket or a tray or a clean cloth – for mixing the soil and
subsampling;5. cloth bags of a specific size;6. a copying pencil for markings, and tags for tying cloth bags;7. soil sample information sheet.

AGR 503 ANALYTICAL TECHNIQUES IN AGRICULTURE
55
Figure 2. Blade, tube, and auger (left to right).
For comparison over periods of time, take soil samples at approximately thesame time of the year (e.g. before planting). When making comparisons,consider other factors like weather conditions, crops, treatments, seasonalfluctuations. Select sampling depth according to the purpose of sampling.For soil fertility evaluations in annual crops, sample at a depth of 0 to 15 or0 to 20 cm. For perennial crops (e.g. trees), take deeper samples since treeroots often grow deep into the soil.
Soil samples usually need preparation before laboratory analysis:
Air-drying. Crush large soil clods to facilitate drying. Do not dry athigh temperature. During air-drying, avoid contamination (i.e. fromdust, gases, rain, etc.). Air-drying usually takes one week.
Crushing. Crush the sample in a mortar using a rubber or porcelain-capped pestle (Figure 6). The mortar is usually made from porcelain.
Figure 3. Mortar and pestle, sieve.

AGR 503 MODULE 2
56
Pulverising. Not all samples require pulverising. The subsamplingerror is a function of the ratio between the average weight of thelargest particles and the weight of the subsample. If the subsamplebeing analyzed is small (i.e. for total nitrogen and organic carbonanalysis), the sample has to be pulverised to a fine powder (less than0.5 mm).
Sieving. Sieve the soil through a 2 mm sieve made of brass, stainlesssteel, or plastic. Use plastic sieves when micronutrients are to beanalysed.
Mixing and storage. Mix samples thoroughly, then store in cleanclosed containers (i.e. polyethylene bags or bottles). Label thecontainers.
4.0 CONCLUSION
Soil Sampling should be carried out in such a manner that can maximizetheir use as a soil fertility index based on comparison between samplingevents. Consistency, in the areas of season, location (aided by GPStechniques), crop rotation, soil type and sampling depth must be maintainedas this will help in proper soil test interpretation. Inconsistencies in any ofthese areas of soil sampling collection will lessen the interpretation value ofsoil test changes that occurred since the last soil sample was taken. Alongwith consistency, soil samples should reflect past soil andfertilizer/amendment management of a given field, taking into accounttillage, crop rotation, fertilizer/ amendment placement and also soilcharacteristics (texture, slope and drainage). Following these guidelineswill allow soil tests to be used more effectively for nutrient managementand crop diagnostics.
5.0 SUMMARY
You have learnt that the major objectives of soil sampling have been todetermine the average nutrient status of a field and to provide somemeasure of nutrient variability in a field. Through soil sampling andanalysis, soil scientists are able to relate trends in soil fertilizer levels toother field properties that are predictable or easily measured. Knowledge offactors influencing soil nutrient levels including soil type, topography,cropping history, manure application, fertilizer application and leveling forirrigation will help the producer determine the most effective samplingapproach or technique.

AGR 503 ANALYTICAL TECHNIQUES IN AGRICULTURE
57
6.0 TUTOR-MARKED ASSIGNMENT
1. What do you understand by soil sampling?2. What are factors to consider in choosing sampling method?3. Mention and discuss the sampling techniques you studied.4. Outline the guidelines for soil sampling.5. State and explain sampling tools and how they are used for sampling
soils.6. How do we carry out soil preparations before analysis?
7.0 REFERENCES/FURTHER READING
FAO (2008) Guides to Laboratory Establishment for Plant NutrientAnalysis. Fertilizer and Plant Nutrition. Bulletin Vol. 19. Rome.
Peck, T. R. (1988). Standard Soil Scoop. p.4-6. In: W. C. Dahnke (ed.)Recommended Chemical Soil Test Procedures For The NorthCentral Region. North Dakota Agric. Exp. Stn. Bull. 499.
http://www.cglrc.cgiar.org/iita/soilSampling/9._Sampling_Tools_and_Sample_Preparation.htm
https://agriinfo.in/preparation-of-soil-sample-1780/
http://agrienergy.net/docs/lab-information/soil-sampling.pdf
http://www1.agric.gov.ab.ca/$department/deptdocs.nsf/all/epw11920/$file/3-3.pdf
https://en.wikipedia.org/wiki/Transect
https://dpipwe.tas.gov.au/agriculture/land-management-and-soils/soil.../soil-sampling
https://openei.org/wiki/Definition:Soil_Sampling
https://uwlab.soils.wisc.edu/wp-content/uploads/sites/17/2015/09/sample_preparation.pdf
AGR 503 MODULE 3
58
MODULE 3 USE OF INSTRUMENTS, EQUIPMENTSAND MACHINES
Unit 1 MicroscopyUnit 2 Principles and Operation of Atomic Absorption
Spectrophotometer (AAS)Unit 3 High-Performance Liquid Chromatography (HPLC)Unit 4 Thin Layer Chromatography (TLC)Unit 5 Gas Chromatography (GC)Unit 6 Polymerase Chain Reaction (PCR)Unit 7 Gel ElectrophoresisUnit 8 Hematology and Serum Biochemistry
UNIT 1 MICROSCOPY
CONTENTS
1.0 Introduction2.0 Objectives3.0 Main Content
3.1 Microscopy4.0 Conclusion5.0 Summary6.0 Tutor-Marked Assignment7.0 References/Further Reading
1.0 INTRODUCTION
Microscopy comprises of the tools that are used to see/image themicroscopic objects and even macromolecules. There exists a wide varietyof microscopic tools for studying the bio-molecules and biologicalprocesses. Light microscopy is the simplest form of microscopy. This isbecause it includes all forms of microscopic methods that useelectromagnetic radiation to achieve magnification. With the advent ofhigh-resolution microscopes modern microbiologists have access tomicroscope that produces images with high clarity and magnification. TheLeeuwenhoek’s singlelens microscope has been transformed in to a high-resolution multi-lens combination with magnification up to two thousandtime. Electron microscopes with magnification up too many thousand timesand used to study fine structure of cells and sub-cellular components.
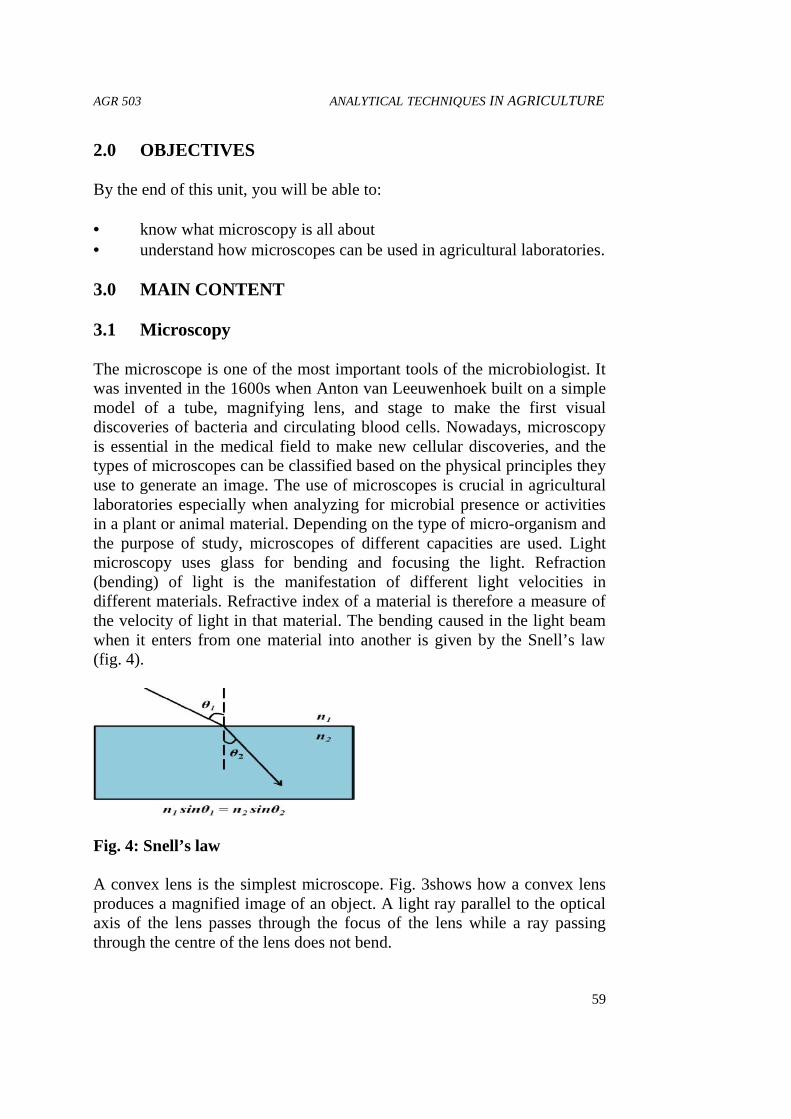
AGR 503 ANALYTICAL TECHNIQUES IN AGRICULTURE
59
2.0 OBJECTIVES
By the end of this unit, you will be able to:
know what microscopy is all about understand how microscopes can be used in agricultural laboratories.
3.0 MAIN CONTENT
3.1 Microscopy
The microscope is one of the most important tools of the microbiologist. Itwas invented in the 1600s when Anton van Leeuwenhoek built on a simplemodel of a tube, magnifying lens, and stage to make the first visualdiscoveries of bacteria and circulating blood cells. Nowadays, microscopyis essential in the medical field to make new cellular discoveries, and thetypes of microscopes can be classified based on the physical principles theyuse to generate an image. The use of microscopes is crucial in agriculturallaboratories especially when analyzing for microbial presence or activitiesin a plant or animal material. Depending on the type of micro-organism andthe purpose of study, microscopes of different capacities are used. Lightmicroscopy uses glass for bending and focusing the light. Refraction(bending) of light is the manifestation of different light velocities indifferent materials. Refractive index of a material is therefore a measure ofthe velocity of light in that material. The bending caused in the light beamwhen it enters from one material into another is given by the Snell’s law(fig. 4).
Fig. 4: Snell’s law
A convex lens is the simplest microscope. Fig. 3shows how a convex lensproduces a magnified image of an object. A light ray parallel to the opticalaxis of the lens passes through the focus of the lens while a ray passingthrough the centre of the lens does not bend.

AGR 503 MODULE 3
60
Fig. 5: Magnification of an object by a convex lens
A microscope that uses two lenses to generate the magnified image of theobject is called a compound microscope. The magnified image generated byone lens is further magnified by the second lens (Fig. 4). Magnification of acompound microscope is the product of the magnification caused by theobjective and ocular (eyepiece) lenses:
Fig. 6: Ray optical diagram of a compound microscope
3.1.1 Types of Microscope
While most people picture the compound model from lab class when theythink of microscopes, many types of microscopes are actually available.These useful devices are employed by researchers, medical technicians andstudents on a daily basis; the type they select depends on their resourcesand needs. Some microscopes provide greater resolution with lowermagnification and vice versa, and they range in cost from tens to thousandsof dollars. There are two major categories of microscopy namely; light(optical) microscopes and electron microscopes.
Microscopy categories
1. Light(optical)microscope and2. Electronmicroscope
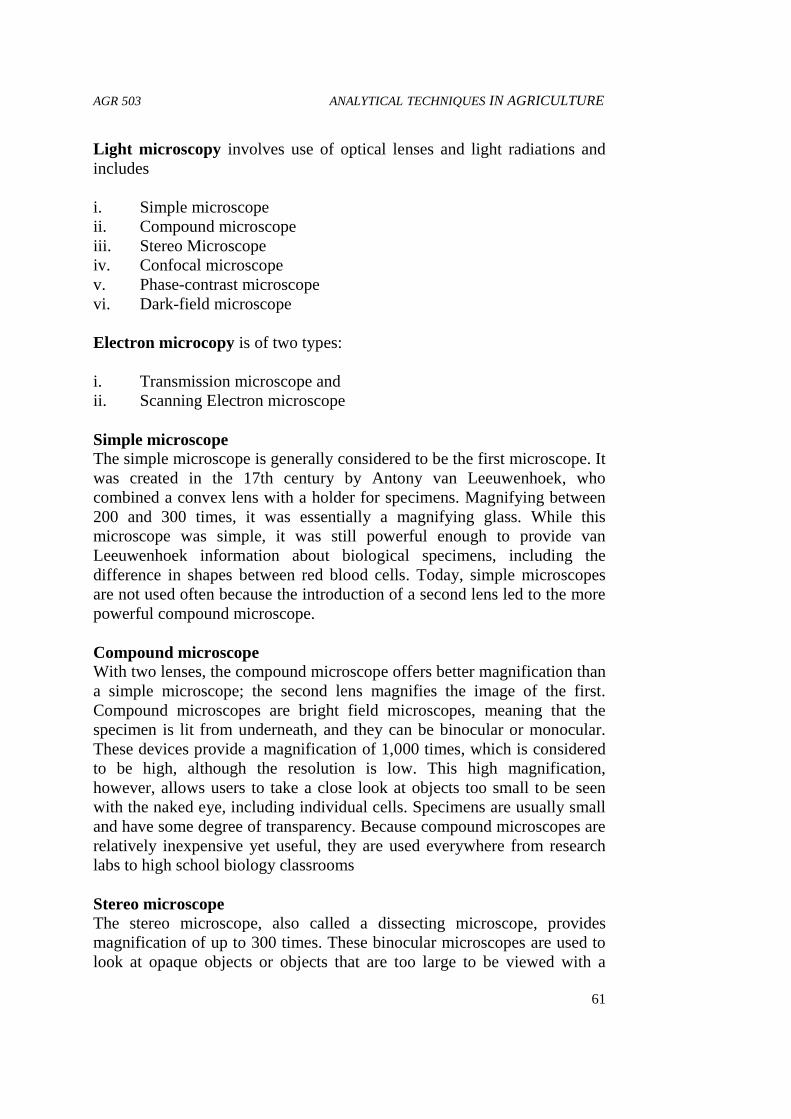
AGR 503 ANALYTICAL TECHNIQUES IN AGRICULTURE
61
Light microscopy involves use of optical lenses and light radiations andincludes
i. Simple microscopeii. Compound microscopeiii. Stereo Microscopeiv. Confocal microscopev. Phase-contrast microscopevi. Dark-field microscope
Electron microcopy is of two types:
i. Transmission microscope andii. Scanning Electron microscope
Simple microscopeThe simple microscope is generally considered to be the first microscope. Itwas created in the 17th century by Antony van Leeuwenhoek, whocombined a convex lens with a holder for specimens. Magnifying between200 and 300 times, it was essentially a magnifying glass. While thismicroscope was simple, it was still powerful enough to provide vanLeeuwenhoek information about biological specimens, including thedifference in shapes between red blood cells. Today, simple microscopesare not used often because the introduction of a second lens led to the morepowerful compound microscope.
Compound microscopeWith two lenses, the compound microscope offers better magnification thana simple microscope; the second lens magnifies the image of the first.Compound microscopes are bright field microscopes, meaning that thespecimen is lit from underneath, and they can be binocular or monocular.These devices provide a magnification of 1,000 times, which is consideredto be high, although the resolution is low. This high magnification,however, allows users to take a close look at objects too small to be seenwith the naked eye, including individual cells. Specimens are usually smalland have some degree of transparency. Because compound microscopes arerelatively inexpensive yet useful, they are used everywhere from researchlabs to high school biology classrooms
Stereo microscopeThe stereo microscope, also called a dissecting microscope, providesmagnification of up to 300 times. These binocular microscopes are used tolook at opaque objects or objects that are too large to be viewed with a
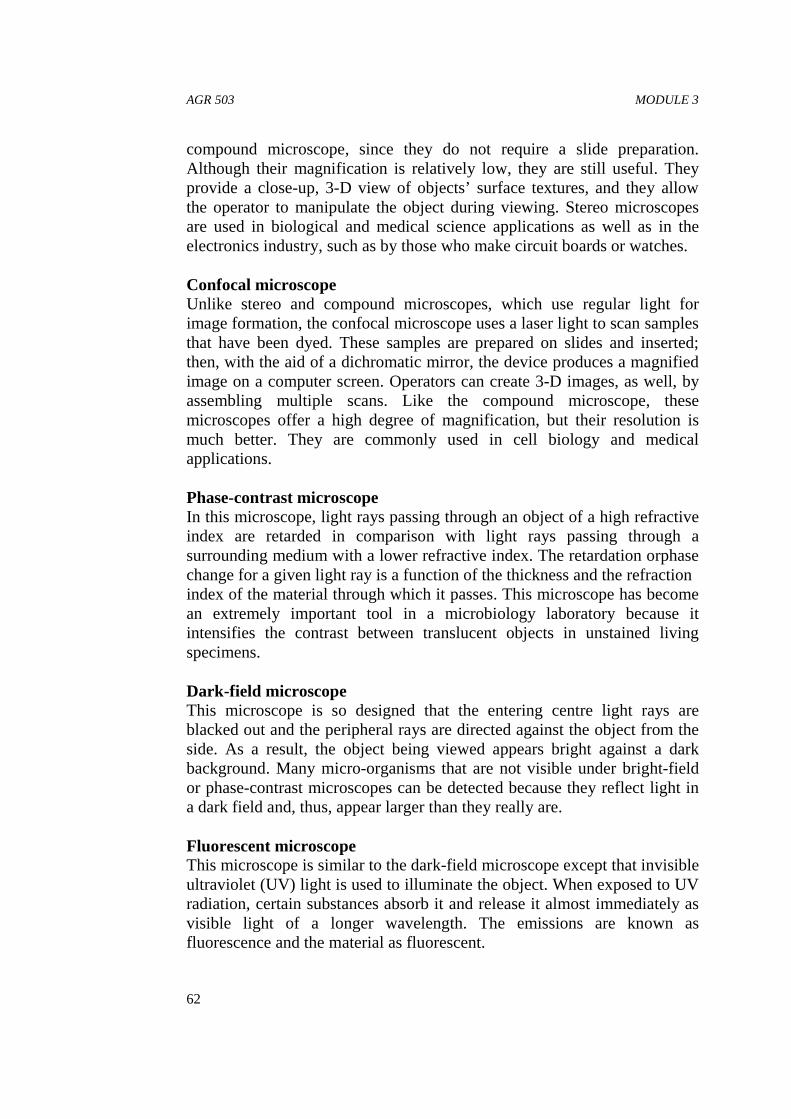
AGR 503 MODULE 3
62
compound microscope, since they do not require a slide preparation.Although their magnification is relatively low, they are still useful. Theyprovide a close-up, 3-D view of objects’ surface textures, and they allowthe operator to manipulate the object during viewing. Stereo microscopesare used in biological and medical science applications as well as in theelectronics industry, such as by those who make circuit boards or watches.
Confocal microscopeUnlike stereo and compound microscopes, which use regular light forimage formation, the confocal microscope uses a laser light to scan samplesthat have been dyed. These samples are prepared on slides and inserted;then, with the aid of a dichromatic mirror, the device produces a magnifiedimage on a computer screen. Operators can create 3-D images, as well, byassembling multiple scans. Like the compound microscope, thesemicroscopes offer a high degree of magnification, but their resolution ismuch better. They are commonly used in cell biology and medicalapplications.
Phase-contrast microscopeIn this microscope, light rays passing through an object of a high refractiveindex are retarded in comparison with light rays passing through asurrounding medium with a lower refractive index. The retardation orphasechange for a given light ray is a function of the thickness and the refractionindex of the material through which it passes. This microscope has becomean extremely important tool in a microbiology laboratory because itintensifies the contrast between translucent objects in unstained livingspecimens.
Dark-field microscopeThis microscope is so designed that the entering centre light rays areblacked out and the peripheral rays are directed against the object from theside. As a result, the object being viewed appears bright against a darkbackground. Many micro-organisms that are not visible under bright-fieldor phase-contrast microscopes can be detected because they reflect light ina dark field and, thus, appear larger than they really are.
Fluorescent microscopeThis microscope is similar to the dark-field microscope except that invisibleultraviolet (UV) light is used to illuminate the object. When exposed to UVradiation, certain substances absorb it and release it almost immediately asvisible light of a longer wavelength. The emissions are known asfluorescence and the material as fluorescent.

AGR 503 ANALYTICAL TECHNIQUES IN AGRICULTURE
63
The electron microscopeThe energy source used in the electron microscope is a beam of electrons.The beam has an exceptionally short wavelength, and increases theresolution of the image significantly over light microscopy. Whole objectsare coated in gold or palladium, which deflects the electron beam, creatingdark and light areas as 3-D images viewed on a monitor. Details like theintricate silica shells of marine diatoms and surface details of viruses can becaptured. Both transmission electron microscopes (TEM) and the newerscanning electron microscopes (SEM) fall in this specialized category ofmicroscopy.
Transmission Electron Microscope (TEM)Like the scanning electron microscope, the transmission electronmicroscope (TEM) uses electrons in creating a magnified image, andsamples are scanned in a vacuum so they must be specially prepared.Unlike the SEM, however, the TEM uses a slide preparation to obtain a 2-Dview of specimens, so it's more suited for viewing objects with some degreeof transparency. A TEM offers a high degree of both magnification andresolution, making it useful in the physical and biological sciences,metallurgy, nanotechnology and forensic analysis.
Scanning Electron Microscope (SEM)The scanning electron microscope, or SEM, uses electrons rather than lightfor image formation. Samples are scanned in vacuum or near-vacuumconditions, so they must be specially prepared by first undergoingdehydration and then being coated with a thin layer of a conducive material,such as gold. After the item is prepared and placed in the chamber, theSEM produces a 3-D, black-and-white image on a computer screen.Offering ample control over the amount of magnification, SEMs are usedby researchers in the physical, medical and biological sciences to examine arange of specimens from insects to bones.
Objectives of microscopesMicroscopes are generally equipped with three objectives: a low-powerobjective (10×); a high-power objective (40×); and an oil immersionobjective (100×). The desired objective is rotated into place. The totalmagnification obtained with the objectives is as follows:
- The 10× objective with a 10× eyepiece gives a total magnification of100.
- The 40× objective with a 10× eyepiece gives a total magnification of400.

AGR 503 MODULE 3
64
- The 100× objective with a 10× eyepiece gives a total magnificationof 1 000.
Fig. 7: Parts of optical microscope
Functions of parts of optical microscopei. Light source: project aparallel beam of light on to the sample for
illuminationii. Condenser gathers light and concentrates it into a cone of light that
illuminates the specimen with uniform intensity over the entire viewfield
iii. Sample stage: with X-Y movement: sample is placed on the stageand different part of the sample can be viewed due to the X-Ymovement capability
iv. Fine/Focusing knobs: since the distance between objective and eyepiece is fixed, focusing is achieved by moving the sample relative tothe objective lens.
v. Objectives: does the main part of magnification and resolves thefine details on the samples (mo~10–100)
vi. Eyepiece: forms a further magnified virtual image which can beobserved directly with eyes (me~10)
vii. Beam splitter and camera: allow a permanent record of the realimage from the objective be made on film (for modern researchmicroscope).
The procedure for using a microscope is:
i. Place the microscope in a position facing the source of light beingused, and adjust the mirror to reflect good light into the body tube.
ii. Place the slide containing the specimen on the stage.

AGR 503 ANALYTICAL TECHNIQUES IN AGRICULTURE
65
iii. Keeping the eye close to the eyepiece, turn the coarse adjustmentslowly to raise the body tube until the slide comes into focus.
iv. Turn the fine adjustment slowly until the focus is perfect and theobject being examined is seen clearly.
v. Focusing with the oil immersion objective should be done verycarefully. For this, first use the low-power objective to locate theportion of the specimen to be examined. Care should be taken tolocate the portion in the exact centre of the low-power field as thefield diameter is much smaller with the oil immersion objective thanwith either of the other objectives.
vi. Raise the body tube and then rotate the nose-piece until the oilimmersion objective clicks into position. Place an oil immersiondrop on the portion of the slide directly under the objective. Watchthe objective from the side and lower it carefully into the oil. Do notallow the objective to touch the slide.
vii. Then study/examine the specimen.
4.0 CONCLUSION
The main types of microscopes used in Agricultural laboratories study aresimple and Compound microscope. This microscope consists of two sets oflenses, the objective and the eyepiece. The main functions of the objectiveare to gather the light rays coming from any point of the object, to unitethem in a point on the image, and to magnify the image. The eyepiecemagnifies the image further. Most microscope manufacturers have adopted160 mm as the standard tube length.
5.0 SUMMARY
While most people picture the compound model from lab class when theythink of microscopes, many types of microscopes are actually available.These useful devices are employed by researchers, medical technicians andstudents on a daily basis; the type they select depends on their resourcesand needs. Some microscopes provide greater resolution with lowermagnification and vice versa, and they range in cost from tens to thousandsof dollars. There are two major categories of microscopy namely; light(optical) microscopes and electron microscopes.
AGR 503 MODULE 3
66
6.0 TUTOR-MARKED ASSIGNMENT
1. Briefly explain the term “microscopy” and state its use.2. Give brief historical background of the development of microscopy.3. State the two (2) major categories of microscopes and give the
different types under each.4. With the aid of a labelled diagram, show the parts of an optic
microscope.5. What are the functions of different parts of an optic microscope?6. Outline the procedure involved in using a microscope.
7.0 REFERENCES/FURTHER READING
FAO (2008) Guides to Laboratory Establishment for Plant NutrientAnalysis. Fertilizer and Plant Nutrition Bulletin Vol. 19. Rome.
https://sciencing.com/difference-glass-compound-light-microscope-8611655.html

AGR 503 ANALYTICAL TECHNIQUES IN AGRICULTURE
67
UNIT 2 PRINCIPLES AND OPERATION OF ATOMICABSORPTION SPECTROPHOTOMETER (AAS)
CONTENTS
1.0 Introduction2.0 Objectives3.0 Main Content
3.1 Atomic Absorption Spectrophotometer (AAS)4.0 Conclusion5.0 Summary6.0 Tutor-Marked Assignment7.0 References/Further Reading
1.0 INTRODUCTION
Trace element analysis is very important in many fields which encompassecological science, food analysis, forensic science, material science, soiland plant science as well as in environmental studies. In order to carry outthe analysis, many techniques varying in degree of sensitivity andconvenience have been developed. These include Atomic AbsorptionSpectrometry, Inductively Coupled Plasma-atomic emission Spectrometry,X-ray Fluorescence, Neutron Activation analysis, Mass Spectrometry andProton Induced x-ray Emission. Atomic Absorption Spectrometry will bediscussed in this unit. It is worthy to note that Atomic AbsorptionSpectrometer and Atomic Absorption Spectrophotometer are always usedinterchangeably and both are always abbreviated as AAS, a few slightdifferences have been noted; a spectrometer tells you which wavelengths oflight is absorbed and which wavelengths of light is reflected. Aspectrophotometer measures the relative intensity of the light absorbed orreflected at a particular wavelength of light. Spectrometer is a term thatapplied to instruments that operate over a very wide range of wavelengths,from gamma rays and x-rays into the far infrared, however if the instrumentis designed to measure the spectrum in absolute units rather than relativeunits, then it is typically called spectrophotometer. In this unit, we will usethe two interchangeably.
2.0 OBJECTIVES
By the end of this unit, you will be able to:
understand the principles and operations of AAS

AGR 503 MODULE 3
68
know the different components of the AAS and functions
3.0 MAIN CONTENT
3.1 Atomic Absorption Spectrophotometer (AAS)
Atomic absorption spectrometry (AAS) is an analytical technique thatmeasures the concentrations of elements. Atomic absorption is so sensitivethat it can measure down to parts per billion of a gram (μgdm–3) in asample. The technique makes use of the wavelengths of light specificallyabsorbed by an element. They correspond to the energies needed topromote electrons from one energy level to another, higher, energy level.Atomic absorption spectrometry has many uses in different areas ofchemistry.
Fig. 8: Flame atomic absorption spectroscopy instrument (Wikipedia)
3.1.1 How it Works
Atoms of different elements absorb characteristic wavelengths oflight.
Analysing a sample to see if it contains a particular element meansusing light from that element.
For example with lead, a lamp containing lead emits light fromexcited lead atoms that produce the right mix of wavelengths to beabsorbed by any lead atoms from the sample.
In AAS, the sample is atomised – ie converted into ground state freeatoms in the vapour state – and a beam of electromagnetic radiationemitted from excited lead atoms is passed through the vaporisedsample.
Some of the radiation is absorbed by the lead atoms in the sample.The greater the number of atoms there is in the vapour, the more

AGR 503 ANALYTICAL TECHNIQUES IN AGRICULTURE
69
radiation is absorbed. The amount of light absorbed is proportionalto the number of lead atoms.
A calibration curve is constructed by running several samples ofknown lead concentration under the same conditions as theunknown. The amount the standard absorbs is compared with thecalibration curve and this enables the calculation of the leadconcentration in the unknown sample.
Consequently, an atomic absorption spectrometer needs thefollowing three components: a light source; a sample cell to producegaseous atoms; and a means of measuring the specific lightabsorbed.
Fig. 9: Basic Atomic Absorption Spectrometer
Fig.10: Schematic Diagram of Atomic Absorption Spectrometer
3.1.3 Principles of Operation of AAS
The technique makes use of the atomic absorption spectrum of a sample inorder to assess the concentration of specific analytes within it. It requiresstandards with known analyte content to establish the relation between themeasured absorbance and the analyte concentration and relies therefore onthe Beer-Lambert Law.

AGR 503 MODULE 3
70
In short, the electrons of the atoms in the atomizer can be promoted tohigher orbitals (excited state) for a short period of time (nanoseconds) byabsorbing a defined quantity of energy (radiation of a given wavelength).This amount of energy, i.e., wavelength, is specific to a particular electrontransition in a particular element. In general, each wavelength correspondsto only one element, and the width of an absorption line is only of the orderof a few picometers (pm), which gives the technique its elementalselectivity. The radiation flux without a sample and with a sample in theatomizer is measured using a detector, and the ratio between the two values(the absorbance) is converted to analyte concentration or mass using theBeer-Lambert Law.
3.1.4 The Basic Components
Every absorption spectrometer must have components which fulfill thethree basic requirements. There must be:
1. Light source: A light source which emits the sharp atomic lines ofthe element to be determined is needed. The most widely known andrecognised source is the hollow cathode lamp. These lamps aredesigned to emit the atomic spectrum of a particular element, andspecific lamps are selected for use depending on the element to bedetermined.
2. Sample cell: An atomic vapor must be generated in the light beamfrom the source. This is generally accomplished by introducing thesample into a burner system or electrically heated furnace aligned inthe optical path of the spectrophotometer.
3. Means of specific light measurement: The selection of a specificsource and a particular wavelength in that source is what allows thedetermination of a selected element to be made in the presence ofothers. The wavelength of light which is isolated by themonochromator is directed onto the detector, which serves as the‘‘eye’’ of the instrument.
1. Light sourcesAn atom absorbs light at discrete wavelengths. In order to measurethis narrow light absorption with maximum sensitivity, it isnecessary to use a line source, which emits the specific wavelengthswhich can be absorbed by the atom. Narrow line sources not onlyprovide high sensitivity, but also make atomic absorption a veryspecific analytical technique with few spectral interferences. Thetwo most common line sources used in atomic absorption are the‘‘hollow cathode lamp’’ and the ‘‘electrodeless discharge lamp.’’

AGR 503 ANALYTICAL TECHNIQUES IN AGRICULTURE
71
i. The hollow cathode lampThe hollow cathode lamp is an excellent, bright line sourcefor most of the elements determinable by atomic absorption.
ii. The electrodeless discharge lampThe atomic absorption determination of these elements canoften be dramatically improved with the use of brighter, morestable sources such as the ‘‘electrodeless discharge lamp’’.
2. Optical considerationsPhotometersThe portion of an atomic absorption spectrometer’s optical systemwhich conveys the light from the source to the monochromator isreferred to as the photometer. Three types of photometers aretypically used in atomic absorption instruments: single-beam,double-beam and what might be called compensated single-beam orpseudo double-beam.
i. Single-beam photometersThe instrument represents a fully functional ‘‘single-beam’’atomic absorption spectrometer. It is called ‘‘single-beam’’because all measurements are based on the varying intensityof a single beam of light in a single optical path.
ii. Double-beam photometersAn alternate photometer configuration, known as ‘‘double-beam’’ uses additional optics to divide the light from thelamp into a ‘‘sample beam’’ (directed through the samplecell) and a ‘‘reference beam’’ (directed around the samplecell).
iii. Alternative photometer designsMany alternative system designs which provide advantagesthat are similar to those of double beam optical systems andthe light throughput characteristic of single-beam systems.
3. The atomic absorption atomiser (The Sample Cell)i. Pre-mix burner system
The sample cell, or atomiser, of the spectrometer mustproduce the ground state atoms necessary for atomicabsorption to occur. This involves the application of thermalenergy to break the bonds that hold atoms together asmolecules.

AGR 503 MODULE 3
72
ii. Impact devicesThe sample aerosol is composed of variously sized droplets asit is sprayed into the mixing chamber. Upon entering theflame, the water in these droplets is vaporised. The remainingsolid material must likewise be vaporised, and chemicalbonds must be broken to create free ground state atoms.
iii. Nebulisers, burner heads and mounting systems- Several important factors enter into the nebulizer portion of
the burner system. In order to provide efficient nebulizationfor all types of sample solution, the nebulizer should beadjustable. Stainless steel has been the most common materialused for construction of the nebuliser because of its durabilityand affordability.
- Burner heads typically are constructed of stainless steel ortitanium. All-titanium heads are preferred as they provideextreme resistance to heat and corrosion.
- A ‘‘quick change’’ atomiser mount is an important item tofacilitate convenient changeover from one device to anotherwithout the use of tools.
4. Electronicsi. Precision in atomic absorption measurements
Observed precision will improve with the period of time overwhich each sample is read. Where analyte concentrations arenot approaching detection limits, integration times of one tothree seconds will usually provide acceptable precision.When approaching instrument detection limits whererepeatability is poor, precision can be improved by using evenlonger integration times, up to 10 seconds. In most instances;however, there is little advantage to using integration timeslonger than 10 seconds.
ii. Calibration of the spectrometer- Most modern atomic absorption instruments include
microcomputer-based electronics.- The microcomputer provides atomic absorption instruments
with advanced calculation capabilities, including the ability tocalibrate and compute concentrations from absorbance dataconveniently and accurately, even for nonlinear calibrationcurves.
- In the linear region, data on as little as one standard and ablank may be sufficient for defining the relationship betweenconcentration and absorbance.

AGR 503 ANALYTICAL TECHNIQUES IN AGRICULTURE
73
- However, additional standards are usually used to verifycalibration accuracy. Where the relationship becomesnonlinear, however, more standards are required.
- The accuracy of a calibration computed for a nonlinearrelationship depends on the number of standards and theequations used for calibration.
- For the equation format which optimally fits atomicabsorption data, it has been experimentally shown thataccurate calibration can be achieved with a minimum ofthree standards plus a blank, even in cases of severecurvature.
- Figure 11 illustrates the accuracy of microcomputer-calculated results for cobalt with single standard‘‘linear’’ and three-standard ‘‘nonlinear’’ calibrations.After the instrument was calibrated using the specifiedprocedure, a series of standards were analyzed.
- Figure 11 shows plots of the actual concentrations forthose standards versus the measured values for bothcalibration procedures.
- The results obtained with ‘‘linear’’ calibration areaccurate only where the absorbance: concentrationrelationship is linear, up to about 5 mg/mL.
- The results obtained with three-standard ‘‘nonlinear’’calibration are still accurate at 30mg/mL, significantlyextending the useful working range. For versatility,current instruments allow fitting of more than threestandards to these same basic equations.
Fig. 11: Cobalt Calibration Accuracy
5. Automation of Atomic Absorption

AGR 503 MODULE 3
74
i. Automated Instruments and Sample ChangersOne of the greatest contributions to the efficiency of theanalytical laboratory is the automated atomic absorptionspectrometer. Automatic samplers were the first step infreeing the analyst from the monotonous task of manuallyintroducing each and every sample.
ii. Automated sample preparationThe introduction of commercial systems based on techniquessuch as flow injection have directly addressed the need forautomated sample preparation capabilities. Flow injectiontechniques can be used to automate relatively simpleprocedures such as dilution or reagent addition. They can alsobe used to automate complex chemical pretreatments,including analyte preconcentration and cold vapor mercuryand hydride generation procedures.
iii. The stand-alone computer and atomic absorptionStand-alone and personal computers have extended theautomation and data handling capabilities of atomicabsorption even further. These computers can interfacedirectly to instrument output ports to receive, manipulate, andstore data and print reports in user selectable formats. Also,data files stored in personal computers can be read intosupplemental software supplied with the system or third-partysoftware such as word processor, spreadsheet and databaseprograms for open-ended customization of data treatment andreporting.
4.0 CONCLUSION
You have learnt that atoms of different elements absorb characteristicwavelengths of light. Analysing a sample to see if it contains a particularelement means using light from that element. For e.g. with lead, a lampcontaining lead emits light from excited lead atoms that produce the rightmix of wavelengths to be absorbed by any lead atoms from the sample. InAAS, the sample is atomised – ie converted into ground state free atoms inthe vapour state – and a beam of electromagnetic radiation emitted fromexcited lead atoms is passed through the vaporised sample. Some of theradiation is absorbed by the lead atoms in the sample. The greater thenumber of atoms there is in the vapour, the more radiation is absorbed. Theamount of light absorbed is proportional to the number of lead atoms. Acalibration curve is constructed by running several samples of known leadconcentration under the same conditions as the unknown.
AGR 503 ANALYTICAL TECHNIQUES IN AGRICULTURE
75
5.0 SUMMARY
You have been taught that the three main requirements that the componentsof every AAS must fulfill include Light source, Sample cell and means ofspecific light measurement. A light source which emits the sharp atomiclines of the element to be determined. Sample cell ensures an atomic vapormust be generated in the light beam from the source. This is generallyaccomplished by introducing the sample into a burner system or electricallyheated furnace aligned in the optical path of the spectrophotometer. Meansof specific light measurement: The selection of a specific source and aparticular wavelength in that source is what allows the determination of aselected element to be made in the presence of others.
6.0 TUTOR-MARKED ASSIGNMENT
1. Briefly explain the AAS instrument and mention 5 other instrumentsin that category.
2. Explain how the AAS instrument works and state its principles ofoperation.
3. Mention and briefly explain the three basic components of the AAS.4. What do you understand as the Photometer? State three types of
photometers you studied.5. Write short notes on the following components of a Sample cell or
Atomic Absorption Atomiser.i. Pre-Mix Burner System.ii. Impact devices.iii. Nebulisers, burner heads and mounting systems.
6. Give a detailed explanation on how calibration of the spectrometercan be carried out.
7. What is the difference and similarity of colorimeter to AAS?
7.0 REFERENCES/FURTHER READING
Richard D. B. & Jack D. K. (1993) Concepts, Instrumentation andTechniques in Atomic Absorption Spectrophotometry. (2nd ed.). ThePerkin-Elmer Corporation.
http://faculty.sdmiramar.edu/fgarces/labmatters/instruments/aa/AAS_Theory/AASTheory.htm
https://physics.stackexchange.com/questions/150895/spectrometer-vs-spectrophotometer
AGR 503 MODULE 3
76
UNIT 3 HIGH-PERFORMANCE LIQUIDCHROMATOGRAPHY (HPLC)
CONTENTS
1.0 Introduction2.0 Objectives3.0 Main Content
3.1 High-Performance Liquid Chromatography (HPLC)4.0 Conclusion5.0 Summary6.0 Tutor-Marked Assignment7.0 References/Further Reading
1.0 INTRODUCTION
High-performance liquid chromatography (HPLC; also formerly knownas high-pressure liquid chromatography) is a technique in analyticalchemistry used to separate, identify, and quantify each component in amixture. This equipment relies on pumps to pass a pressurizedliquid solvent containing the sample mixture through a column filled with asolid adsorbent material. Each component in the sample interacts slightlydifferently with the adsorbent material, causing different flow rates for thedifferent components and leading to the separation of the components asthey flow out of the column. HPLC has been used for manufacturing (e.g.,during the production process of pharmaceutical and biological products),legal (e.g., detecting performance enhancement drugs in urine), research(e.g., separating the components of a complex biological sample, or ofsimilar synthetic chemicals from each other), and medical (e.g., detectingvitamin D levels in blood serum) purposes.
2.0 OBJECTIVES
By the end of this unit, you will be able to:
know what HPLC is all about understand how HPLC operates in agricultural and microbiological
laboratories.
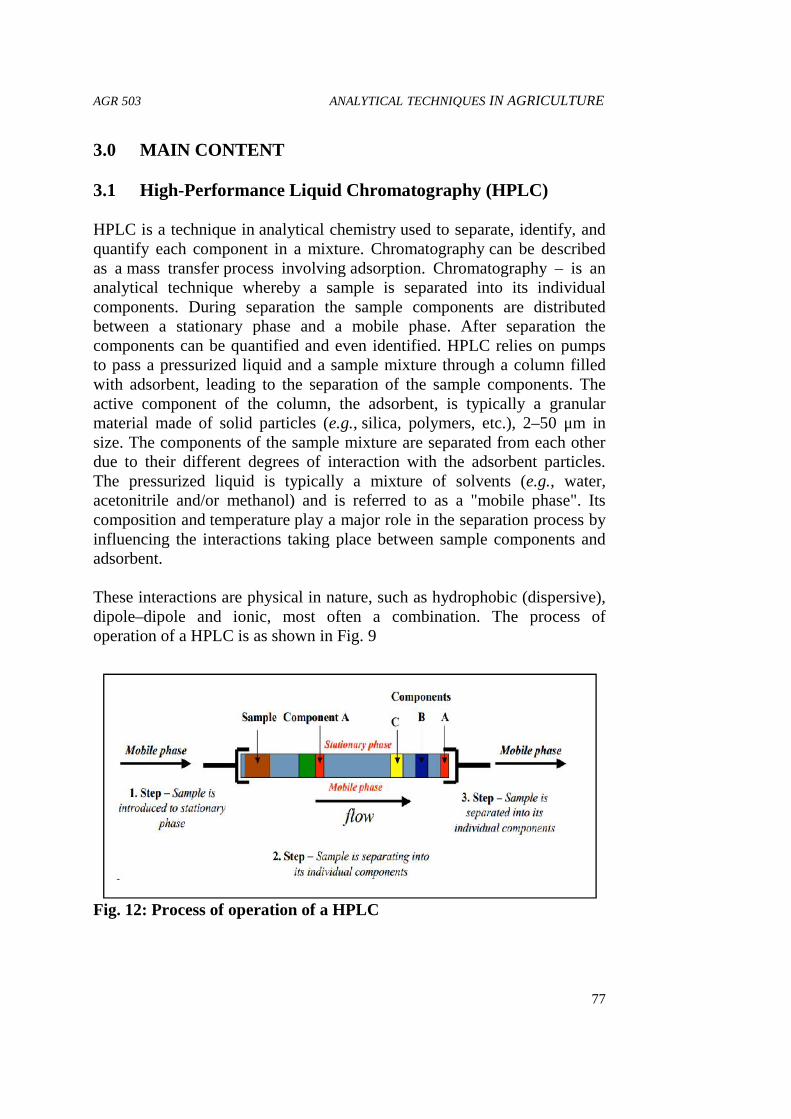
AGR 503 ANALYTICAL TECHNIQUES IN AGRICULTURE
77
3.0 MAIN CONTENT
3.1 High-Performance Liquid Chromatography (HPLC)
HPLC is a technique in analytical chemistry used to separate, identify, andquantify each component in a mixture. Chromatography can be describedas a mass transfer process involving adsorption. Chromatography – is ananalytical technique whereby a sample is separated into its individualcomponents. During separation the sample components are distributedbetween a stationary phase and a mobile phase. After separation thecomponents can be quantified and even identified. HPLC relies on pumpsto pass a pressurized liquid and a sample mixture through a column filledwith adsorbent, leading to the separation of the sample components. Theactive component of the column, the adsorbent, is typically a granularmaterial made of solid particles (e.g., silica, polymers, etc.), 2–50 μm insize. The components of the sample mixture are separated from each otherdue to their different degrees of interaction with the adsorbent particles.The pressurized liquid is typically a mixture of solvents (e.g., water,acetonitrile and/or methanol) and is referred to as a "mobile phase". Itscomposition and temperature play a major role in the separation process byinfluencing the interactions taking place between sample components andadsorbent.
These interactions are physical in nature, such as hydrophobic (dispersive),dipole–dipole and ionic, most often a combination. The process ofoperation of a HPLC is as shown in Fig. 9
Fig. 12: Process of operation of a HPLC

AGR 503 MODULE 3
78
Fig. 13: Separation modes in chromatography
3.1.1 Historical Perspective
1903 Tswett - plant pigments separated on chalk columns 1931 Lederer& Kuhn - LC of carotenoids 1938 TLC and ion exchange 1950 reverse phase LC 1954 Martin & Synge (Nobel Prize) 1959 Gel permeation 1965 instrumental LC (Waters)
The term High Performance Liquid Chromatography (HPLC) wasintroduced in the 1970’s to distinguish the modern high-performancetechnique from classical low-pressure column chromatography, developedin the 1930’s.

AGR 503 ANALYTICAL TECHNIQUES IN AGRICULTURE
79
Fig. 14: Difference between classical column chromatography andHPLC
Table 4: Difference between classical column chromatography andHPLC
Classical Column Chromatography High Performance LiquidChromatography (HPLC)
1. Its mobile phase flow is byHydrostatic pressure or use of low-pressure pump
Its mobile phase flow is by ahigh-pressure pump
2 Stationary phase made up of largeparticles
Stationary phase of small particles(3 - 10µm)
3 Made up of glass column Stainless steel column4 Long separation time Short separation time5 Poor separation Good separation
Table 5: Improvement in Separation EfficiencyYear Particle diameter (µm) Separation power
N/mClassical LC 100µm 1001965 30 10,0001971 10 30,0001975 5 60,0001978 3 100,0001990 1.5 360,000
3.1.2 HPLC is Very Applicable in Separating Substances SuchAs:
Amino acids Proteins Nucleic acids Carbohydrates Terpenoids Antibiotics Steroids Inorganic salts
3.1.3 Major HPLC Application Areas Are
1. Quality control in industry

AGR 503 MODULE 3
80
2. Determination of active compounds in drug research and thepharmaceutical industry
3. Polymer analysis4. Determination of toxic compounds in environmental analysis
environmental analysis5. Quality control in the food and cosmetics industry6. Separation and isolation of biopolymers such as enzymes and
nucleic acids7. Manufacturing: HPLC has many applications in both laboratory and
clinical science. It is a common technique used in pharmaceuticaldevelopment, as it is a dependable way to obtain and ensure productpurity.
8. Legal: This technique is also used for detection of illicit drugs inurine. The most common method of drug detection is animmunoassay. This method is much more convenient. However,convenience comes at the cost of specificity and coverage of a widerange of drugs.
9. Research: Similar assays can be performed for research purposes,detecting concentrations of potential clinical candidates like anti-fungal and asthma drugs. This technique is obviously useful inobserving multiple species in collected samples, as well, but requiresthe use of standard solutions when information about species identityis sought out.
10. Medical: Medical use of HPLC always include drug analysis, ithowever falls more closely under the category of nutrient analysis.While urine is the most common medium for analyzing drugconcentrations, blood serum is the sample collected for most medicalanalyses with HPLC. Other methods of detection of molecules thatare useful for clinical studies have been tested against HPLC,namely immunoassays.
3.1.4 The HPLC Parameters
1. Theoretical: HPLC separations have theoretical parameters andequations to describe the separation of components into signal peakswhen detected by instrumentation such as by a UV detector or amass spectrometer.
2. Internal diameter: The internal diameter (ID) of an HPLC columnis an important parameter that influences the detection sensitivityand separation selectivity in gradient elution.
3. Particle size: Most traditional HPLC is performed with thestationary phase attached to the outside of small

AGR 503 ANALYTICAL TECHNIQUES IN AGRICULTURE
81
spherical silica particles (very small beads). These particles come ina variety of sizes with five µm beads being the most common.
4. Pore size: Many stationary phases are porous to provide greatersurface area. Small pores provide greater surface area while largerpore size has better kinetics, especially for larger analytes.
5. Pump pressure: Pumps vary in pressure capacity, but theirperformance is measured on their ability to yield a consistent andreproducible volumetric flow rate. Pressure may reach as high as60 MPa (6000 lbf/in2), or about 600 atmospheres. Modern HPLCsystems have been improved to work at much higher pressures, andtherefore are able to use much smaller particle sizes in the columns(<2 μm).
6. Detectors: HPLC detectors fall into two main categories: universalor selective. Universal detectors typically measure a bulk property(e.g., refractive index) by measuring a difference of a physicalproperty between the mobile phase and mobile phase with solutewhile selective detectors measure a solute property (e.g., UV-Visabsorbance) by simply responding to the physical or chemicalproperty of the solute.
7. Autosamplers: Large numbers of samples can be automaticallyinjected onto an HPLC system, by the use of HPLC autosamplers. Inaddition, HPLC autosamplers have an injection volume andtechnique which is exactly the same for each injection, consequentlythey provide a high degree of injection volume precision.
3.1.5 Principles of HPLC (High Performance LiquidChromatography)
HPLC is distinguished from traditional ("low pressure") liquidchromatography because operational pressures are significantlyhigher (50–350 bar), while ordinary liquid chromatography typicallyrelies on the force of gravity to pass the mobile phase through thecolumn.
The schematic of a HPLC instrument typically includes a degasser,sampler, pumps, and a detector. The sampler brings the samplemixture into the mobile phase stream which carries it into thecolumn.
The pumps deliver the desired flow and composition of the mobilephase through the column.
The detector generates a signal proportional to the amount of samplecomponent emerging from the column, hence allowingfor quantitative analysis of the sample components.

AGR 503 MODULE 3
82
A digital microprocessor and user software control the HPLCinstrument and provide data analysis.
Some models of mechanical pumps in a HPLC instrument can mixmultiple solvents together in ratios changing in time, generating acomposition gradient in the mobile phase.
Various detectors are in common use, suchas UV/Vis, photodiode array (PDA) or based on mass spectrometry.
Most HPLC instruments also have a column oven that allows foradjusting the temperature at which the separation is performed.
3.1.6 Types of HPLC
1. Partition chromatographyPartition chromatography was one of the first kinds ofchromatography that chemists developed. The partition co efficientprinciple has been applied in paper chromatography, thin layerchromatography, gas phase and liquid–liquid separationapplications.
2. Normal–phase chromatographyNormal–phase chromatography was one of the first kinds of HPLCthat chemists developed. Also known as normal-phase HPLC (NP-HPLC) this method separates analytes based on their affinity for apolar stationary surface such as silica, hence it is based on analyteability to engage in polar interactions (such as hydrogen-bonding or dipole-dipole type of interactions) with the sorbentsurface. NP-HPLC uses a non-polar, non-aqueous mobile phase(e.g., Chloroform), and works effectively for separating analytesreadily soluble in non-polar solvents.
3. Displacement chromatographyThe basic principle of displacement chromatography is: A moleculewith a high affinity for the chromatography matrix (the displacer)will compete effectively for binding sites, and thus displace allmolecules with lesser affinities. There are distinct differencesbetween displacement and elution chromatography. In elution mode,substances typically emerge from a column in narrow, Gaussianpeaks. Wide separation of peaks, preferably to baseline, is desired inorder to achieve maximum purification. The speed at which anycomponent of a mixture travels down the column in elution modedepends on many factors. But for two substances to travel atdifferent speeds, and thereby be resolved, there must be substantialdifferences in some interaction between the biomolecules and thechromatography matrix.

AGR 503 ANALYTICAL TECHNIQUES IN AGRICULTURE
83
i. Reversed-phase chromatography (RPC)Reversed phase HPLC (RP-HPLC) has a non-polar stationary phaseand an aqueous, moderately polar mobile phase. One commonstationary phase is a silica which has been surface-modified withRMe2SiCl, where R is a straight chain alkyl group such as C18H37 orC8H17. With such stationary phases, retention time is longer formolecules which are less polar, while polar molecules elute morereadily (early in the analysis). An investigator can increase retentiontimes by adding more water to the mobile phase; thereby making theaffinity of the hydrophobic analyte for the hydrophobic stationaryphase stronger relative to the now more hydrophilic mobile phase.
ii. Size-exclusion chromatographySize-exclusion chromatography (SEC), also known as gelpermeation chromatography or gel filtration chromatography,separates particles on the basis of molecular size (actually by aparticle's Stokes radius). It is generally a lowresolutionchromatography and thus it is often reserved for the final,"polishing" step of the purification. It is also useful for determiningthe tertiary structure and quaternary structure of purified proteins.SEC is used primarily for the analysis of large molecules such asproteins or polymers. SEC works by trapping these smallermolecules in the pores of a particle. The larger molecules simplypass by the pores as they are too large to enter the pores. Largermolecules therefore flow through the column quicker than smallermolecules, that is, the smaller the molecule, the longer the retentiontime.
iii. Ion-exchange chromatographyThe ion-exchange chromatography (IC) operation is such thatretention is based on the attraction between solute ions and chargedsites bound to the stationary phase. Solute ions of the same charge asthe charged sites on the column are excluded from binding, whilesolute ions of the opposite charge of the charged sites of the columnare retained on the column. Solute ions that are retained on thecolumn can be eluted from the column by changing the solventconditions (e.g., increasing the ion effect of the solvent system byincreasing the salt concentration of the solution, increasing thecolumn temperature, changing the pH of the solvent, etc.).
iv. Bio-affinity chromatographyThis chromatographic process relies on the property of biologicallyactive substances to form stable, specific, and reversible complexes.The formation of these complexes involves the participation ofcommon molecular forces such as the Van der Waals interaction,electrostatic interaction, dipole-dipole interaction, hydrophobic

AGR 503 MODULE 3
84
interaction, and the hydrogen bond. An efficient, biospecific bond isformed by a simultaneous and concerted action of several of theseforces in the complementary binding sites.
v. Aqueous normal-phase chromatographyAqueous normal-phase chromatography (ANP) is a chromatographictechnique which encompasses the mobile phase region betweenreversed-phase chromatography (RP) and organic normal phasechromatography (ONP). This technique is used to achieve uniqueselectivity for hydrophilic compounds, showing normal phaseelution using reversed-phase solvents.
4.0 CONCLUSION
HPLC is a technique in analytical chemistry used to separate, identify, andquantify each component in a mixture. Chromatography can be describedas a mass transfer process involving adsorption. Chromatography – is ananalytical technique whereby a sample is separated into its individualcomponents. During separation the sample components are distributedbetween a stationary phase and a mobile phase. After separation thecomponents can be quantified and even identified. Different types of HPLCincludes; Partition, Normal phase, Displacement, Reversed phase, Size-exclusion, Ion- exchange, Bio-affinity and Aqueous normal-phasechromatography.
5.0 SUMMARY
The High Performance Liquid Chromatography (HPLC) equipment relieson pumps to pass a pressurized liquid solvent containing the samplemixture through a column filled with a solid adsorbent material. Eachcomponent in the sample interacts slightly differently with the adsorbentmaterial, causing different flow rates for the different components andleading to the separation of the components as they flow out of the column.HPLC has been used for manufacturing (e.g., during the production processof pharmaceutical and biological products), legal (e.g., detectingperformance enhancement drugs in urine), research (e.g., separating thecomponents of a complex biological sample, or of similar syntheticchemicals from each other), and medical (e.g., detecting vitamin D levels inblood serum) purposes.

AGR 503 ANALYTICAL TECHNIQUES IN AGRICULTURE
85
6.0 TUTOR-MARKED ASSIGNMENT
1. What do you understand as HPLC? Give a brief historicalbackground of its development.
2. In a tabular form give five (5) differences between Classical columnchromatography and HPLC.
3. Outline eight (8) substances that can be separated with HPLC andwhat are other areas of its application.
4. State at least five operational principles of the HPLC equipment.5. Name and briefly discuss at least five (5) different types of HPLC.6. Enumerate and briefly explain at least five (5) parameters of HPLC.
7.0 REFERENCES/FURTHER READING
Gerber, F.; Krummen, M.; Potgeter, H.; Roth, A.; Siffrin, C.; Spoendlin, C.(2004). "Practical aspects of fast reversed-phase high-performanceliquid chromatography using 3μm particle packed columns andmonolithic columns in pharmaceutical development and productionworking under current good manufacturing practice". Journal ofChromatography A. 1036 (2): 127–133.
Karger, Barry L. (1997). "HPLC: Early and Recent Perspectives". Journalof Chemical Education. 74 (1): 45. Bibcode:1997JChEd..74...45K.
Iler, R.K. (1979). The Chemistry of Silica. John Wiley & Sons. New York.
Karger, B. L.; Berry, L. V. (1971). "Rapid liquid-chromatographicseparation of steroids on columns heavily loaded with stationaryphase". Clin. Chem. 17 (8): 757–64.
Xiang, Y.; Liu Y.; Lee M.L. (2006). "Ultra high pressure liquidchromatography using elevated temperature". Journal ofChromatography A. 1104 (1–2): 198 202.
Horváth, Cs.; Preiss B.A. & Lipsky S.R. (1967). "Fast liquidchromatography. Investigation of operating parameters and theseparation of nucleotides on pellicular ion exchangers". AnalyticalChemistry. 39 (12): 1422–1428.
https://en.wikipedia.org/wiki/High-performance_liquid_chromatography

AGR 503 MODULE 3
86
Morgan, David J. (2003-11-19). "Fraction collector (post onFlickr)". Flickr. Retrieved 28 October 2015.
Henry, Richard A. (1 February 2009) "The Early Days of HPLC atDupont". Chromatography Online. Avanstar Communications Inc.
AGR 503 ANALYTICAL TECHNIQUES IN AGRICULTURE
87
UNIT 4 THIN LAYER CHROMATOGRAPHY (TLC)
CONTENTS
1.0 Introduction2.0 Objectives3.0 Main Content
3.1 Thin Layer Chromatography (TLC)3.1.1 Preparation of the Plate3.1.2 Procedure3.1.3 Separation Process and Principle
4.0 Conclusion5.0 Summary6.0 Tutor-Marked Assignment7.0 References/Further Reading
1.0 INTRODUCTION
Thin-layer chromatography (TLC) is a chromatography technique used toseparate non-volatile mixtures. Thin-layer chromatography is normallycarried out on a sheet of glass, plastic, or aluminium foil, which is coatedwith a thin layer of adsorbent material, usually silica gel, aluminiumoxide (alumina), or cellulose. This layer of adsorbent is known asthe stationary phase. After the sample has been applied on the plate,a solvent or solvent mixture (known as the mobile phase) is drawn up theplate via capillary action. Because different analytes ascend the TLC plateat different rates, separation is achieved. The mobile phase has differentproperties from the stationary phase. For example, with silica gel, a verypolar substance, non-polar mobile phases such as heptane are used. Themobile phase may be a mixture, allowing chemists to fine-tune the bulkproperties of the mobile phase. After the experiment, the spots arevisualized. Often this can be done simply by projecting ultraviolet lightonto the sheet; the sheets are treated with a phosphor, and dark spots appearon the sheet where compounds absorb the light impinging on a certain area.Chemical processes can also be used to visualize spots; anisaldehyde, forexample, forms colored adducts with many compounds, and sulfuricacid will char most organic compounds, leaving a dark spot on the sheet.
2.0 OBJECTIVES
By the end of this unit, you will be able to:
know what thin layer chromatography is

AGR 503 MODULE 3
88
know how to use the TLC in mixture separation
3.0 MAIN CONTENT
3.1 Thin Layer Chromatography (TLC)
Thin-layer chromatography (TLC) is a chromatography technique used toseparate non-volatile mixtures. Thin-layer chromatography can be used tomonitor the progress of a reaction, identify compounds present in a givenmixture, and determine the purity of a substance. Specific examples ofthese applications include: analysing ceramides and fatty acids, detectionof pesticides or insecticides in food and water, analysing the dyecomposition of fibers in forensics, as saying the radiochemicalpurity of radiopharmaceuticals, or identification of medicinal plants andtheir constituents. A number of enhancements can be made to the originalmethod to automate the different steps, to increase the resolution achievedwith TLC and to allow more accurate quantitative analysis. This method isreferred to as HPTLC, or "high-performance TLC". HPTLC typically usesthinner layers of stationary phase and smaller sample volumes, thusreducing the loss of resolution due to diffusion.
3.1.1 Preparation of the Plate
TLC plates are usually commercially available, with standard particle sizeranges to improve reproducibility. They are prepared by mixing theadsorbent, such as silica gel, with a small amount of inert binderlike calcium sulfate (gypsum) and water. This mixture is spread as a thickslurry on an unreactive carrier sheet, usually glass, thick aluminum foil, orplastic. The resultant plate is dried and activated by heating in an oven forthirty minutes at 110 °C. The thickness of the absorbent layer is typicallyaround 0.1 – 0.25 mm for analytical purposes and around 0.5 – 2.0 mm forpreparative TLC.
3.1.2 Procedure
The process is the same as paper chromatography with the advantage offaster runs, better separations, and the choice between different stationaryphases. Because of its simplicity and speed TLC is often used formonitoring chemical reactions and for the qualitative analysis of reactionproducts. Plates can be labeled before or after the chromatography processusing a pencil or other implement that will not interfere or react with theprocess.

AGR 503 ANALYTICAL TECHNIQUES IN AGRICULTURE
89
To run a thin layer chromatography plate, the following procedure iscarried out:
Using a capillary, a small spot of solution containing the sample isapplied to a plate, about 1.5 centimeters from the bottom edge.The solvent is allowed to completely evaporate off to prevent it frominterfering with sample's interactions with the mobile phase in thenext step.
A small amount of an appropriate solvent (eluent) is poured into aglass beaker or any other suitable transparent container (separationchamber) to a depth of less than 1 centimeter. A strip of filter paper(aka "wick") is put into the chamber so that its bottom touches thesolvent and the paper lies on the chamber wall and reaches almost tothe top of the container.
The container is closed with a cover glass or any other lid and is leftfor a few minutes to let the solvent vapors ascend the filter paper andsaturate the air in the chamber. (Failure to saturate the chamber willresult in poor separation and non-reproducible results).
The TLC plate is then placed in the chamber so that the spot(s) ofthe sample do not touch the surface of the eluent in the chamber, andthe lid is closed. The solvent moves up the plate by capillary action,meets the sample mixture and carries it up the plate (elutes thesample).
The plate should be removed from the chamber before the solventfront reaches the top of the stationary phase (continuation of theelution will give a misleading result) and dried.
Without delay, the solvent front, the furthest extent of solvent up theplate, is marked.
The plate is visualised. As some plates are pre-coated with aphosphor such as zinc sulfide, allowing many compounds to bevisualized by using ultraviolet light; dark spots appear where thecompounds block the UV light from striking the plate. Alternatively,plates can be sprayed or immersed in chemicals after elution.Various visualising agents react with the spots to produce visibleresults.
3.1.3 Separation Process and Principle
Different compounds in the sample mixture travel at different rates due tothe differences in their attraction to the stationary phase and because ofdifferences in solubility in the solvent. By changing the solvent, or perhapsusing a mixture, the separation of components (measured by the Rf value)can be adjusted. Also, the separation achieved with a TLC plate can be used

AGR 503 MODULE 3
90
to estimate the separation of a flash chromatography column. (A compoundelutes from a column when the amount of solvent collected is equal to1/Rf.) Chemists often use TLC to develop a protocol for separation bychromatography and use TLC to determine which fractions contain thedesired compounds.
Fig 15:Development of a TLC plate, a purple spot separates into a redand blue spot
Fig. 16: Surface of a freshly cut Plank
Surface of a freshly cut plank of Eucalyptus camaldulensis displaying thin-layer chromatography. The horizontal blue strip is from a reaction betweenthe iron band saw supports and the acidic timber
3.1.4 Analysis of TLC
As the chemicals being separated may be colorless, several methods exist tovisualise the spots:
fluorescent analytes like quinine may be detectedunder blacklight (366 nm)
Often a small amount of a fluorescent compound,usually manganese-activated zinc silicate, is added to the adsorbentthat allows the visualisation of spots under UV-C light (254 nm).The adsorbent layer will thus fluoresce light-green by itself, butspots of analyte quench this fluorescence.
Iodine vapors are a general unspecific color reagent
Specific color reagents into which the TLC plate is dipped or whichare sprayed onto the plate exist.- Potassium permanganate – oxidation

AGR 503 ANALYTICAL TECHNIQUES IN AGRICULTURE
91
- Bromine
In the case of lipids, the chromatogram may be transferred toa PVDF membrane and then subjected to further analysis, forexample mass spectrometry, a technique known as Far-Easternblotting.Once visible, the Rf value, or retardation factor, of each spot can bedetermined by dividing the distance the product traveled by thedistance the solvent front traveled using the initial spotting site asreference. These values depend on the solvent used and the type ofTLC plate and are not physical constants.
3.1.5 Application
1. Characterisation
In organic chemistry, crop and animal science laboratoriesreactions are qualitatively monitored with TLC. Spots sampled witha capillary tube are placed on the plate: a spot of starting material, aspot from the reaction mixture, and a cross-spot with both. A small(3 by 7 cm) TLC plate takes a couple of minutes to run. The analysisis qualitative, and it will show if the starting material hasdisappeared, i.e. the reaction is complete, if any product hasappeared, and how many products are generated (although this mightbe underestimated due to co-elution). Unfortunately, TLCs fromlow-temperature reactions may give misleading results, because thesample is warmed to room temperature in the capillary, which canalter the reaction—the warmed sample analysed by TLC is not thesame as what is in the low-temperature flask. One such reaction isthe DIBALH reduction of ester to aldehyde.
In one study TLC has been applied in the screening of organicreactions, for example in the fine-tuning of BINAP synthesisfrom 2-naphthol. In this method, the alcohol and catalyst solution(for instance iron(III) chloride) are placed separately on the baseline, then reacted, and then instantly analysed.
A special application of TLC is in the characterisation ofradiolabeled compounds, where it is used to determineradiochemical purity. The TLC sheet is visualised using a sheet ofphotographic film or an instrument capable ofmeasuring radioactivity. It may be visualised using other means aswell. This method is much more sensitive than the others and can beused to detect an extremely small amount of a compound, providedthat it carries a radioactive atom.

AGR 503 MODULE 3
92
iv. IsolationSince different compounds will travel a different distance in thestationary phase, chromatography can be used to isolate componentsof a mixture for further analysis. The separated compounds eachoccupying a specific area on the plate, they can be scraped off (alongwith the stationary phase particles) and dissolved into an appropriatesolvent. As an example, in the chromatography of an extract of greenplant material (for example spinach) shown in seven stages ofdevelopment, Carotene elutes quickly and is only visible until step2. Chlorophyll A and B are halfway in the final step and lutein thefirst compound staining yellow. Once the chromatography is over,the carotene can be removed from the plate, extracted into a solventand placed into a spectrophotometer to determine its spectrum. Thequantities extracted are small and a technique such as columnchromatography is preferred to separate larger amounts.
Step 1 Step 2
Step 3 Step 4
Step 5 Step 6

AGR 503 ANALYTICAL TECHNIQUES IN AGRICULTURE
93
Step 7Fig. 17v. Examining reactionsTLC is also used for the identification of the completion of any chemicalreaction. To determine this it is observed that at the beginning of a reactionthe entire spot is occupied by the starting chemicals or materials on theplate. As the reaction starts taking place the spot formed by the initialchemicals starts reducing and eventually replaces the whole spot of startingchemicals with a new product present on the plate. The formation of anentirely new spot determines the completion of a reaction.
4.0 CONCLUSION
Separation of compounds is based on the competition of the solute and themobile phase for binding sites on the stationary phase. For instance, ifnormal-phase silica gel is used as the stationary phase, it can be consideredpolar. Given two compounds that differ in polarity, the more polarcompound has a stronger interaction with the silica and is, therefore, betterable to displace the mobile phase from the available binding sites. As aconsequence, the less polar compound moves higher up the plate (resultingin a higher Rf value). If the mobile phase is changed to a more polar solventor mixture of solvents, it becomes better at binding to the polar plate andtherefore displacing solutes from it, so all compounds on the TLC plate willmove higher up the plate.
5.0 SUMMARY
Thin-layer chromatography (TLC) is a chromatography technique used toseparate non-volatile mixtures. Thin-layer chromatography is normallycarried out on a sheet of glass, plastic, or aluminum foil, which is coatedwith a thin layer of adsorbent material, usually silica gel, aluminumoxide (alumina), or cellulose. This layer of adsorbent is known asthe stationary phase. After the sample has been applied on the plate,a solvent or solvent mixture (known as the mobile phase) is drawn up theplate via capillary action.

AGR 503 MODULE 3
94
6.0 TUTOR-MARKED ASSIGNMENT
1. Explain in details the term “Thin Layer Chromatography” (TLC)2. Briefly explain preparation of plate in TLC.3. To run a thin layer chromatography plate, state the seven procedures
involved.4. In Analysis of TLC, state at least five methods of visualising the
spots.5. State and briefly explain the 3 major applications of TLC.
7.0 REFERENCES/FURTHER READING
A.I. Vogel; A.R. Tatchell; B.S. Furnis; A.J. Hannaford & P.W.G. Smith(1989).
(5th ed.). ISBN 978-0-582-46236-6.
Harry W. Lewis & Christopher J. Moody (1989). Experimental OrganicChemistry: Principles and Practice (Illustrated ed.). WileyBlackwell.pp. 159–173. ISBN 978-0-632-02017-1.
Reich, E.; Schibli A. (2007). High-performance thin-layer chromatographyfor the analysis of medicinal plants (Illustrated ed.). New York:Thieme. ISBN 978-3-13-141601-8.
TLC plates as a convenient platform for solvent-free reactions Jonathan M.Stoddard, Lien Nguyen, Hector Mata-Chavez and KellyNguyen Chem. Commun., 2007, 1240 -1241, doi:10.1039/b616311d"Applications of Thin LayerChromatography". News-Medical.net. 2018-09-18. Retrieved 2018-09-25.
https://en.wikipedia.org/wiki/Thin-layer_chromatography

AGR 503 ANALYTICAL TECHNIQUES IN AGRICULTURE
95
UNIT 5 GAS CHROMATOGRAPHY (GC)
CONTENTS
1.0 Introduction2.0 Objectives3.0 Main Content
3.1 Gas Chromatography4.0 Conclusion5.0 Summary6.0 Tutor-Marked Assignment7.0 References/Further Reading
1.0 INTRODUCTION
Gas chromatography (GC) is a common type of chromatography usedin analytical chemistry for separating and analyzing compounds that canbe vaporized without decomposition. Main uses of GC involve testing thepurity of a particular substance, and also separating the differentcomponents of a mixture (the relative amounts of such components can alsobe determined). In some situations, GC may help in identifying acompound.
2.0 OBLECTIVES
By the end of this unit, you will be able to:
know what gas chromatography is all about understand how gas chromatography functions.
3.0 MAIN CONTENT
3.1 Gas Chromatography
Gas chromatography is in principle similar to other forms ofchromatography, such as HPLC, TLC), but has some notable differences.First, the process of separating the compounds in a mixture is carried outbetween a liquid stationary phase and a gas mobile phase, whereas inothers, the stationary phase is a solid and the mobile phase is a liquid.(Hence the full name of the procedure is "Gas–liquid chromatography",referring to the mobile and stationary phases, respectively.) Second, thecolumn through which the gas phase passes is located in an oven where the

AGR 503 MODULE 3
96
temperature of the gas can be controlled, whereas other chromatography(typically) has no such temperature control. Gas chromatography is alsosometimes known as vapor-phase chromatography (VPC), or gas–liquidpartition chromatography(GLPC). These alternative names, as well astheir respective abbreviations, are frequently used in scientific literature. Ingas chromatography, the mobile phase (or "moving phase") is a carrier gas,usually an inert gas such as helium or an unreactive gas such as nitrogen.Helium remains the most commonly used carrier gas in about 90% ofinstruments although hydrogen is preferred for improvedseparations.[3] The stationary phase is a microscopic layerof liquid or polymer on an inert solid support, inside a pieceof glass or metal tubing called a column (an homage to the fractionatingcolumn used in distillation). The instrument used to perform gaschromatography is called a gas chromatograph (or "aerograph", "gasseparator").
Fig. 18: A gas chromatograph with a headspace sampler
3.1.1 GC Analysis
A gas chromatograph is a chemical analysis instrument for separatingchemicals in a complex sample. A gas chromatograph uses a flow-throughnarrow tube known as the column, through which different chemicalconstituents of a sample pass in a gas stream (carrier gas, mobile phase) atdifferent rates depending on their various chemical and physical propertiesand their interaction with a specific column filling, called the stationaryphase. As the chemicals exit the end of the column, they are detected andidentified electronically. The function of the stationary phase in the columnis to separate different components, causing each one to exit the column ata different time (retention time). Other parameters that can be used to alter

AGR 503 ANALYTICAL TECHNIQUES IN AGRICULTURE
97
the order or time of retention are the carrier gas flow rate, column lengthand the temperature.
3.1.1.1 Analytical Procedure
In a GC analysis, a known volume of gaseous or liquid analyte isinjected into the "entrance" (head) of the column, usually using amicrosyringe (or, solid phase microextraction fibers, or a gas sourceswitching system).
As the carrier gas sweeps the analyte molecules through the column,this motion is inhibited by the adsorption of theanalyte molecules either onto the column walls or onto packingmaterials in the column.
The rate at which the molecules progress along the column dependson the strength of adsorption, which in turn depends on the type ofmolecule and on the stationary phase materials.
Since each type of molecule has a different rate of progression, thevarious components of the analyte mixture are separated as theyprogress along the column and reach the end of the column atdifferent times (retention time).
A detector is used to monitor the outlet stream from the column;thus, the time at which each component reaches the outlet and theamount of that component can be determined.
Generally, substances are identified (qualitatively) by the order inwhich they emerge (elute) from the column and by the retention timeof the analyte in the column.
3.1.2 Components of GC
1. Autosamplers
The auto sampler provides the means to introduce a sample automaticallyinto the inlets. Manual insertion of the sample is possible but is no longercommon. Automatic insertion provides better reproducibility and time-optimisation. Different kinds of auto samplers exist. Auto samplers can beclassified in relation to sample capacity (auto-injectors vs. auto samplers,where auto-injectors can work a small number of samples), to robotictechnologies (XYZ robot vs. rotating robot – the most common), or toanalysis:
Liquid Static head-space by syringe technology Dynamic head-space by transfer-line technology

AGR 503 MODULE 3
98
Solid phase microextraction (SPME)
2. Inlets
Split/splitless inlet.The column inlet (or injector) provides the means to introduce a sampleinto a continuous flow of carrier gas. The inlet is a piece of hardwareattached to the column head.
Common inlet types are: S/SL (split/splitless) injector; a sample is introduced into a heated
small chamber via a syringe through a septum – the heatfacilitates volatilization of the sample and sample matrix. The carriergas then either sweeps the entirety (splitless mode) or a portion (splitmode) of the sample into the column.
On-column inlet; the sample is here introduced directly into thecolumn in its entirety without heat, or at a temperature below theboiling point of the solvent. The low temperature condenses thesample into a narrow zone. The column and inlet can then be heated,releasing the sample into the gas phase. This ensures the lowestpossible temperature for chromatography and keeps samples fromdecomposing above their boiling point.
PTV injector; Temperature-programmed sample introduction wasfirst described by Vogt in 1979. Originally Vogt developed thetechnique as a method for the introduction of large sample volumes(up to 250 µL) in capillary GC. Vogt introduced the sample into theliner at a controlled injection rate. The temperature of the liner waschosen slightly below the boiling point of the solvent. The low-boiling solvent was continuously evaporated and vented through thesplit line. By introducing the sample at a low initial liner temperaturemany of the disadvantages of the classic hot injection techniquescould be circumvented.
Gas source inlet or gas switching valve; gaseous samples incollection bottles are connected to what is most commonly a six-portswitching valve. The carrier gas flow is not interrupted while asample can be expanded into a previously evacuated sample loop.Upon switching, the contents of the sample loop are inserted into thecarrier gas stream.
P/T (Purge-and-Trap) system; An inert gas is bubbled through anaqueous sample causing insoluble volatile chemicals to be purgedfrom the matrix. The volatiles are 'trapped' on an absorbent column(known as a trap or concentrator) at ambient temperature. The trap isthen heated and the volatiles are directed into the carrier gas stream.

AGR 503 ANALYTICAL TECHNIQUES IN AGRICULTURE
99
Samples requiring preconcentration or purification can be introducedvia such a system, usually hooked up to the S/SL port.
The choice of carrier gas (mobile phase) is important. Hydrogen hasa range of flow rates that are comparable to helium in efficiency.However, helium may be more efficient and provide the bestseparation if flow rates are optimized. Helium is non-flammable andworks with a greater number of detectors and older instruments.Therefore, helium is the most common carrier gas used. However,the price of helium has gone up considerably over recent years,causing an increasing number of chromatographers to switch tohydrogen gas. Historical use, rather than rational consideration, maycontribute to the continued preferential use of helium.
3. Detectors
The most commonly used detectors are the flame ionization detector (FID)and the thermal conductivity detector (TCD). Both are sensitive to a widerange of components, and both work over a wide range of concentrations.While TCDs are essentially universal and can be used to detect anycomponent other than the carrier gas (as long as their thermal conductivitiesare different from that of the carrier gas, at detector temperature), FIDs aresensitive primarily to hydrocarbons, and are more sensitive to them thanTCD. However, a FID cannot detect water. Both detectors are also quiterobust. Since TCD is non-destructive, it can be operated in-series before aFID (destructive), thus providing complementary detection of the sameanalytes. Other detectors are sensitive only to specific types of substances,or work well only in narrower ranges of concentrations.
i. Thermal Conductivity Detector (TCD): relies on the thermalconductivity of matter passing around a tungsten -rhenium filamentwith a current traveling through it. In this set up helium or nitrogenserve as the carrier gas because of their relatively high thermalconductivity which keep the filament cool and maintain uniformresistivity and electrical efficiency of the filament. However, whenanalyte molecules elute from the column, mixed with carrier gas, thethermal conductivity decreases and this causes a detector response.
ii. Flame Ionisation Detector (FID): In this detector, electrodes areplaced adjacent to a flame fueled by hydrogen / air near the exit ofthe column, and when carbon containing compounds exit the columnthey are pyrolyzed by the flame. This detector works only fororganic / hydrocarbon containing compounds due to the ability of
AGR 503 MODULE 3
100
the carbons to form cations and electrons upon pyrolysis whichgenerates a current between the electrodes.
3.1.3 Methods
The method is the collection of conditions in which the GC operates for agiven analysis. Method development is the process of determining whatconditions are adequate and/or ideal for the analysis required.Some GCsalso include valves which can change the route of sample and carrier flow.The timing of the opening and closing of these valves can be important tomethod development. They include:
i. Carrier gas selection and flow ratesii. Stationary compound selectioniii. Inlet types and flow rates
3.1.4 Sample Size and Injection Technique
Sample injectionThe real chromatographic analysis starts with the introduction of thesample onto the column. The development of capillary gaschromatography resulted in many practical problems with theinjection technique. The technique of on-column injection, oftenused with packed columns, is usually not possible with capillarycolumns. In the injection system in the capillary gas chromatographthe amount injected should not overload the column and the width ofthe injected plug should be small compared to the spreading due tothe chromatographic process.
Column selectionThe choice of column depends on the sample and the activemeasured. The main chemical attribute regarded when choosing acolumn is the polarity of the mixture, but functional groups can playa large part in column selection. The polarity of the sample mustclosely match the polarity of the column stationary phase toincrease resolution and separation while reducing run time. Theseparation and run time also depends on the film thickness (of thestationary phase), the column diameter and the column length.
3.1.5 Data Reduction and Analysis
Qualitative analysisGenerally, chromatographic data is presented as a graph of detectorresponse (y-axis) against retention time (x-axis), which is called a
AGR 503 ANALYTICAL TECHNIQUES IN AGRICULTURE
101
chromatogram. This provides a spectrum of peaks for a samplerepresenting the analytes present in a sample eluting from thecolumn at different times. Retention time can be used to identifyanalytes if the method conditions are constant. Also, the pattern ofpeaks will be constant for a sample under constant conditions andcan identify complex mixtures of analytes. However, in mostmodern applications, the GC is connected to a mass spectrometer orsimilar detector that is capable of identifying the analytesrepresented by the peaks.
Quantitative analysisThe area under a peak is proportional to the amount of analytepresent in the chromatogram. By calculating the area of the peakusing the mathematical function of integration, the concentration ofan analyte in the original sample can be determined. Concentrationcan be calculated using a calibration curve created by finding theresponse for a series of concentrations of analyte, or by determiningthe relative response factor of an analyte. The relative responsefactor is the expected ratio of an analyte to an internalstandard (or external standard) and is calculated by finding theresponse of a known amount of analyte and a constant amount ofinternal standard (a chemical added to the sample at a constantconcentration, with a distinct retention time to the analyte).
In most modern GC-MS systems, computer software is used to draw andintegrate peaks, and match MS spectra to library spectra.
3.1.6 Applications
In general, substances that vaporize below 300 °C (and therefore are stableup to that temperature) can be measured quantitatively. The samples arealso required to be salt-free; they should not contain ions. Very minuteamounts of a substance can be measured, but it is often required that thesample must be measured in comparison to a sample containing the pure,suspected substance known as a reference standard.
Various temperature programs can be used to make the readingsmore meaningful; for example to differentiate between substancesthat behave similarly during the GC process.
Professionals working with GC analyze the content of a chemicalproduct, for example in assuring the quality of products in thechemical industry; or measuring toxic substances or pollutions insoil, air or water. GC is very accurate if used properly and can

AGR 503 MODULE 3
102
measure picomoles of a substance in a 1 ml liquid sample, or parts-per-billion concentrations in gaseous samples.
The hydrocarbons are separated using a capillary column anddetected with a FID. A complication with light gas analyses thatinclude H2 is that He, which is the most common and most sensitiveinert carrier (sensitivity is proportional to molecular mass) has analmost identical thermal conductivity to hydrogen (it is thedifference in thermal conductivity between two separate filaments ina Wheatstone Bridge type arrangement that shows when acomponent has been eluted).
Argon is often used when analyzing gas phase chemistry reactionssuch as F-T synthesis so that a single carrier gas can be used ratherthan two separate ones. The sensitivity is reduced, but this is a tradeoff for simplicity in the gas supply.
4.0 CONCLUSION
A gas chromatograph uses a flow-through narrow tube known asthe column, through which different chemical constituents of a sample passin a gas stream (carrier gas, mobile phase) at different rates depending ontheir various chemical and physical properties and their interaction with aspecific column filling, called the stationary phase. As the chemicals exitthe end of the column, they are detected and identified electronically.
5.0 SUMMARY
Gas chromatography (GC) is a common type of chromatography usedin analytical chemistry for separating and analyzing compounds that canbe vaporized without decomposition. Main uses of GC involve testing thepurity of a particular substance, and also separating the differentcomponents of a mixture (the relative amounts of such components can alsobe determined).
6.0 TUTOR-MARKED ASSIGNMENT
1. What do you understand by gas chromatography and what is thedifference between gas chromatography and HPLC and TLC
2. Discuss briefly, the principles and operations of GasChromatography
3. State the analytical procedures of gas chromatography4. Discuss briefly, the following components of GC
a. Autosamplersb. Inlets

AGR 503 ANALYTICAL TECHNIQUES IN AGRICULTURE
103
c. Detectors5. outline the three methods in Gas Chromatography analysis
7.0 REFERENCES/FURTHER READING
Carvalho, Matheus (2018). "Osmar, the open-sourcemicrosyringeautosampler". Hardware X. 3: 10–38. doi:10.1016/j.ohx.2018.01.001 – via Elsevier.
Dauenhauer, Paul (2015). "Quantitative carbon detector (QCD) forcalibration-free, high-resolution characterisation of complexmixtures". Lab Chip. 15 (2): 440–7. doi:10.1039/c4lc01180e. PMID 25387003.
Grob, Konrad (1997). "Carrier Gases for GC". Restek Advantage, RestekCorporation. Retrieved March 9, 2016.
Grob, Robert L.; & Barry, Eugene F. (2004). Modern Practice of GasChromatography (4th ed.). John Wiley & Sons. ISBN 978-0-471-22983-4.
Harris, Daniel C. (1999). "24. Gas Chromatography". Quantitativechemical Analysis (Chapter) (5th ed.). W. H. Freeman andCompany. pp. 675–712. ISBN 978-0-7167-2881-8.
Higson, S. (2004). Analytical Chemistry. Oxford UniversityPress ISBN 978-0-19-850289-0
https://en.wikipedia.org/wiki/Gas_chromatography
Pavia, L., Gary, M. Lampman, George S. Kritz, Randall G. Engel(2006). Introduction to Organic Laboratory Techniques (4th ed.).Thomson Brooks/Cole. pp. 797–817. ISBN 978-0-495-28069-9.
AGR 503 MODULE 3
104
UNIT 6 POLYMERASE CHAIN REACTION (PCR)
CONTENTS
1.0 Introduction2.0 Objectives3.0 Main Content
3.1 Polymerase Chain Reaction (PCR)4.0 Conclusion5.0 Summary6.0 Tutor-Marked Assignment7.0 References/Further Reading
1.0 INTRODUCTION
Polymerase chain reaction (PCR) is a technique used in the lab to makemillions of copies of a particular section of DNA. It was first developed inthe 1980s. Using PCR, copies of DNA sequences areexponentially amplified to generate thousands to millions of more copies ofthat particular DNA segment. PCR is now a common and oftenindispensable technique used in many laboratory research for a broadvariety of applications including biomedical research and criminalforensics. Agriculturally, researches in animal DNAs can be carried outwith the aid of PCR, which would find great use in animal breeding andgenetics.
PCR was developed by Kary Mullis in 1983 while he was an employee ofthe Certus Corporation. He was awarded the Nobel Prize in Chemistry in1993 (along with Michael Smith) for his work in developing themethod.The vast majority of PCR methods rely on thermal cycling.Thermal cycling exposes reactants to repeated cycles of heating and coolingto permit different temperature-dependent reactions—specifically, DNAmelting and enzyme-driven DNA replication. PCR employs two mainreagents – primers (which are short single strand DNA fragments knownas oligonucleotides that are a complementary sequence to the target DNAregion) and a DNA polymerase.
2.0 OBJECTIVES
By the end of this unit, you will be able to:
know the principles and operations of PCR
AGR 503 ANALYTICAL TECHNIQUES IN AGRICULTURE
105
use PCR in the laboratories to carry out analysis.
3.0 MAIN CONTENT
3.1 Polymerase Chain Reaction (PCR)
The polymerase chain reaction (PCR) was originally developed in 1983 bythe American biochemist Kary Mullis. He was awarded the Nobel Prize inChemistry in 1993 for his pioneering work. PCR is used in molecularbiology to make many copies of (amplify) small sections of DNA or a gene.Using PCR it is possible to generate thousands to millions of copies of aparticular section of DNA from a very small amount of DNA.PCR is acommon tool used in medical, biological and animal science research labs.It is used in the early stages of processing DNA for sequencing, fordetecting the presence or absence of a gene to helpidentify pathogens during infection, and when generating forensic DNAprofiles from tiny samples of DNA.
3.1.2 Application of PCR
Applications of the PCR technique include:
i. DNA cloning for sequencing, gene cloning and manipulation .ii. Gene mutagenesis: PCR can be used to create mutant genes with
mutations chosen by scientists at will. These mutations can bechosen in order to understand how proteins accomplish theirfunctions, and to change or improve protein function.
iii. Construction of DNA-based phylogenies, or functional analysisof genes.
iv. Diagnosis and monitoring of hereditary diseases.v. Amplification of ancient DNA: An exciting application of PCR is
the phylogenic analysis of DNA from ancient sources, such as thatfound in the recovered bones of Neanderthals, from frozen tissuesof mammoths, or from the brain of Egyptian mummies.
vi. Analysis of genetic fingerprints for DNA profiling (for example,in forensic science and parentage testing).
vii. Detection of pathogens in nucleic acid tests for the diagnosisof infectious diseases.

AGR 503 MODULE 3
106
Fig. 19: A typical PCR Machine
3.1.3 The principles behind PCR
PCR amplifies a specific region of a DNA strand (the DNA target).The amount of amplified product is determined by the availablesubstrates in the reaction, which become limiting as the reactionprogresses. Most PCR methods amplify DNA fragments of between0.1 and 10 kilo base pairs (kbp) in length, although some techniquesallow for amplification of fragments up to 40 kbp.
A basic PCR set-up requires several components andreagents, including:
i. a DNA template that contains the DNA target region toamplify;
ii. a DNA polymerase; an enzyme that polymerizes new DNAstrands; heat-resistant Taq polymerase is especiallycommon, as it is more likely to remain intact during the high-temperature DNA denaturation process;
iii. two DNA primers that are complementary to the 3' (threeprime) ends of each of the sense and anti-sense strands of theDNA target (DNA polymerase can only bind to and elongatefrom a double-stranded region of DNA; without primers thereis no double-stranded initiation site at which the polymerasecan bind);specific primers that are complementary to theDNA target region are selected beforehand, and are oftencustom-made in a laboratory or purchased from commercialbiochemical suppliers; deoxynucleoside triphosphates, or

AGR 503 ANALYTICAL TECHNIQUES IN AGRICULTURE
107
dNTPs (sometimes called "deoxynucleotidetriphosphates"; nucleotides containing triphosphate groups).
iv. The reaction is commonly carried out in a volume of 10–200 μL in small reaction tubes (0.2–0.5 mL volumes) ina thermal cycler. The thermal cycler heats and cools thereaction tubes to achieve the temperatures required at eachstep of the reaction.
The principles behind every PCR, whatever the sample of DNA, are thesame.
3.1.4 Five Core ‘Ingredients’ Required To Set Up a PCR Are:
the DNA template to be copied primers which are short stretches of DNA that initiate the PCR
reaction, designed to bind to either side of the section of DNA youwant to copy.
DNA nucleotide bases (also known as dNTPs). DNA bases (A, C, G and T) are the building blocks of DNA and are
needed to construct the new strand of DNA. Taq polymerase enzyme to add in the new DNA bases buffer to
ensure the right conditions for the reaction.
PCR involves a process of heating and cooling called thermal cyclingwhich is carried out by machine.
3.1.5 There are Three Main Stages of PCR
Denaturing – when the double-stranded template DNA is heated toseparate it into two single strands.During this stage the cocktail containingthe template DNA and all the other core ingredients is heated to 94-95⁰C.The high temperature causes the hydrogen bonds between the bases intwo strands of template DNA to break and the two strands to separate.
Annealing – when the temperature is lowered to enable the DNA primersto attach to the template DNA.During this stage the reaction is cooled to50-65⁰C. This enables the primers to attach to a specific location on thesingle-stranded template DNA by way of hydrogen bonding (the exacttemperature depends on the melting temperature of the primers you areusing).

AGR 503 MODULE 3
108
Extending – when the temperature is raised and the new strand of DNA ismade by the Taq polymerase enzyme. During this final step, the heat isincreased to 72⁰C to enable the new DNA to be made by a special TaqDNA polymerase enzyme which adds DNA bases.Taq DNA polymerase isan enzyme taken from the heat-loving bacteria Thermusaquaticus. Thisbacterium lives in hot springs so can tolerate temperatures above 80⁰C.Thebacteria's DNA polymerase is very stable at high temperatures, whichmeans it can withstand the temperatures needed to break the strands ofDNA apart in the denaturing stage of PCR.
These three stages are repeated 20-40 times, doubling the number of DNAcopies each time. A complete PCR reaction can be performed in a fewhours, or even less than an hour with certain high-speed machines. AfterPCR has been completed, a method called electrophoresis can be used tocheck the quantity and size of the DNA fragments produced. Fig. 20. showshow the polymerase chain reaction (PCR) produces lots of copies of DNA.
Fig. 20. Illustration showing how the polymerase chain reaction (PCR)produces lots of copies of DNA. Source: Genome Research Limited
3.1.6 Stages
As with other chemical reactions, the reaction rate and efficiency of PCRare affected by limiting factors. Thus, the entire PCR process can further bedivided into three stages based on reaction progress:
Exponential amplification: At every cycle, the amount of productis doubled (assuming 100% reaction efficiency). After 30 cycles, asingle copy of DNA can be increased up to 1 000 000 000 (one

AGR 503 ANALYTICAL TECHNIQUES IN AGRICULTURE
109
billion) copies. In a sense, then, the replication of a discrete strand ofDNA is being manipulated in a tube under controlled conditions.Thereaction is very sensitive: only minute quantities of DNA must bepresent.
Leveling off stage: The reaction slows as the DNA polymeraseloses activity and as consumption of reagents such as dNTPs andprimers causes them to become limiting.
Plateau: No more product accumulates due to exhaustion ofreagents and enzyme.
3.1.7 Advantages
PCR has a number of advantages.i. It is fairly simple to understand and to use,ii. It produces results rapidly.iii. The technique is highly sensitive with the potential to produce
millions to billions of copies of a specific product for sequencing,cloning, and analysis.
iv. PCR is a very powerful and practical research tool. The sequencingof unknown etiologies of many diseases are being figured out by thePCR.
v. The PCR technique can help identify the sequence of previouslyunknown viruses related to those already known and thus give us abetter understanding of the disease itself.
3.1.8 Limitations
i. One major limitation of PCR is that prior information about thetarget sequence is necessary in order to generate the primers that willallow its selective amplification. This means that, typically, PCRusers must know the precise sequence(s) upstream of the targetregion on each of the two single-stranded templates in order toensure that the DNA polymerase properly binds to the primer-template hybrids and subsequently generates the entire target regionduring DNA synthesis.
ii. Like all enzymes, DNA polymerases are also prone to error, whichin turn causes mutations in the PCR fragments that are generated.
iii. Another limitation of PCR is that even the smallest amount ofcontaminating DNA can be amplified, resulting in misleading orambiguous results.
AGR 503 MODULE 3
110
3.1.9 Variations of PCR
1. Allele-specific PCR: a diagnostic or cloning technique based onsingle-nucleotide variations (SNVs not to be confused with SNPs)(single-base differences in a patient).
2. Assembly PCR or Polymerase Cycling Assembly (PCA): artificialsynthesis of long DNA sequences by performing PCR on a pool oflong oligonucleotides with short overlapping segments.
3. Asymmetric PCR: preferentially amplifies one DNA strand in adouble-stranded DNA template. It is used in sequencing andhybridization probing where amplification of only one of the twocomplementary strands is required.
4. Convective PCR: a pseudo-isothermal way of performing PCR.Instead of repeatedly heating and cooling the PCR mixture, thesolution is subjected to a thermal gradient. The resulting thermalinstability driven convective flow automatically shuffles the PCRreagents from the hot and cold regions repeatedly enabling PCR
5. Dial-out PCR: a highly parallel method for retrieving accurate DNAmolecules for gene synthesis. A complex library of DNA moleculesis modified with unique flanking tags before massively parallelsequencing. Tag-directed primers then enable the retrieval ofmolecules with desired sequences by PCR.
6. Digital PCR (dPCR): used to measure the quantity of a target DNAsequence in a DNA sample. The DNA sample is highly diluted sothat after running many PCRs in parallel, some of them do notreceive a single molecule of the target DNA. The target DNAconcentration is calculated using the proportion of negativeoutcomes. Hence the name 'digital PCR'.
7. Helicase-dependent amplification: similar to traditional PCR, butuses a constant temperature rather than cycling through denaturationand annealing/extension cycles. DNA helicase, an enzyme thatunwinds DNA, is used in place of thermal denaturation.
8. Hot start PCR: a technique that reduces non-specific amplificationduring the initial set up stages of the PCR. It may be performedmanually by heating the reaction components to the denaturationtemperature (e.g., 95 °C) before adding the polymerase.
9. In silico PCR (digital PCR, virtual PCR, electronic PCR, e-PCR)refers to computational tools used to calculate theoreticalpolymerase chain reaction results using a given setof primers (probes) to amplify DNA sequences from asequenced genome or transcriptome. In silico PCR was proposed asan educational tool for molecular biology.

AGR 503 ANALYTICAL TECHNIQUES IN AGRICULTURE
111
10. Intersequence-specific PCR (ISSR): a PCR method for DNAfingerprinting that amplifies regions between simple sequencerepeats to produce a unique fingerprint of amplified fragmentlengths.

AGR 503 MODULE 3
112
4.0 CONCLUSION
Polymerase chain reaction (PCR) is a technique used in the lab to makemillions of copies of a particular section of DNA. Using PCR, copiesof DNA sequences are exponentially amplified to generate thousands tomillions of more copies of that particular DNA segment. PCR is now acommon and often indispensable technique used in many laboratoryresearches for a broad variety of applications including biomedical researchand criminal forensics. Agriculturally, researches in animal DNAs can becarried out with the aid of PCR, which would find great use in animalbreeding and genetics.
5.0 SUMMARY
The polymerase chain reaction (PCR) was originally developed in 1983 bythe American biochemist Kary Mullis. PCR is used in molecular biology tomake many copies of (amplify) small sections of DNAor a gene. UsingPCR it is possible to generate thousands to millions of copies of a particularsection of DNA from a very small amount of DNA.PCR is a common toolused in medical, biological and animal science research labs. It is used inthe early stages of processing DNA for sequencing, for detecting thepresence or absence of a gene to help identify pathogens during infection,and when generating forensic DNA profiles from tiny samples of DNA.
6.0 TUTOR-MARKED ASSIGNMENT
1. What is the main use of PCRs and where can they be found?2. Outline eight (8) applications of PCR3. Briefly explain the operating principles of PCR4. Discuss these major stages of PCR
a. Denaturingb. Annealing andc. Extending
5. State five (5) advantages and three (3) limitations of PCR6. Mention and briefly explain at least five (5) variations of PCR
7.0 REFERENCES/FURTHER READING
Bartlett, J. M. S.; Stirling, D. (2003). "A Short History of the PolymeraseChain Reaction". PCR Protocols. Methods in MolecularBiology. 226 (2nd ed.). pp. 3–6. doi:10.1385/1-59259-384-4:3. ISBN 978-1-59259-384-2. PMID 12958470.

AGR 503 ANALYTICAL TECHNIQUES IN AGRICULTURE
113
Cheng, S.; Fockler, C.; Barnes, W. M. & Higuchi, R. (1994). "EffectiveAmplification of Long Targets from Cloned Inserts and HumanGenomic DNA". Proceedings of the National Academy ofSciences. 91 (12): 5695–5699. Bibcode:1994PNAS...91.5695C. doi:10.1073/pnas.91.12.5695. PMC 44063. PMID 8202550.
https://en.wikipedia.org/wiki/Polymerase_chain_reaction
https://www.yourgenome.org/facts/what-is-pcr-polymerase-chain-reaction
Kary, B. Mullis (2012) Nobel Lecture: The Polymerase ChainReaction". "Determining Annealing Temperatures for PolymeraseChain Reaction". The American Biology Teacher. 74 (4): 256–260.2012. doi:10.1525/abt.2012.74.4.9.
Mullis, Kary B. et al. (1986) "Process for amplifying, detecting, and/or-cloning nucleic acid sequences" U.S. Patent 4,683,195
Saiki, R.; Gelfand, D.; Stoffel, S.; Scharf, S.; Higuchi, R.; Horn, G.; Mullis,K.; Erlich, H. (1988). "Primer-directed enzymatic amplification ofDNA with a thermostable DNApolymerase". Science. 239 (4839):487-491. Bibcode:1988Sci...239..487S. doi:10.1126/science.2448875. PMID 2448875.
Saiki, R.; Scharf, S.; Faloona, F.; Mullis, K.; Horn, G.; Erlich, H. &Arnheim, N. (1985). "Enzymatic amplification of beta-globingenomic sequences and restriction site analysis for diagnosis ofsickle cell anemia". Science. 230 (4732): 1350–1354. doi:10.1126/science.2999980. PMID 2999980.
AGR 503 MODULE 3
114
UNIT 7 GEL ELECTROPHORESIS
CONTENTS
1.0 Introduction2.0 Objectives3.0 Main Content
3.1 Gel Electrophoresis4.0 Conclusion5.0 Summary6.0 Tutor-Marked Assignment7.0 References/Further Reading
1.0 INTRODUCTION
Gel electrophoresis is a method normally employed in the separation andanalysis of macromolecules such as (DNA, RNA and proteins) as well astheir fragments, based on their size and charge. It is employed in clinicalchemistry and animal science laboratories to separate proteins by charge orsize (IEF agarose, essentially size independent) andin biochemistry and molecular biology to separate a mixed population ofDNA and RNA fragments by length, to estimate the size of DNA and RNAfragments or to separate proteins by charge. Nucleic acid molecules areseparated by applying an electric field to move the negatively chargedmolecules through a matrix of agarose or other substances. Shortermolecules move faster and migrate farther than longer ones because shortermolecules migrate more easily through the pores of the gel. Thisphenomenon is called sieving. Proteins are separated by charge in agarosebecause the pores of the gel are too large to sieve proteins. Gelelectrophoresis can also be used for separation of nanoparticles.
2.0 OBJECTIVES
By the end of this unit, you will be able to:
understand what gel electrophoresis is all about know the gel materials used in gel electrophoresis.

AGR 503 ANALYTICAL TECHNIQUES IN AGRICULTURE
115
3.0 MAIN CONTENT
3.1 Gel Electrophoresis
In simple terms, electrophoresis is a process which enables the sorting ofmolecules based on size. Using an electric field, molecules (such as DNA)can be made to move through a gel made of agarose or polyacrylamide.Gelelectrophoresis uses a gel as an anticonvective medium or sieving mediumduring electrophoresis, the movement of a charged particle in an electricalfield. Gels suppress the thermal convection caused by application of theelectric field, and can also act as a sieving medium, retarding the passage ofmolecules; gels can also simply serve to maintain the finished separation,so that a post electrophoresis stain can be applied. DNA Gel electrophoresisis usually performed for analytical purposes, often after amplification ofDNA via polymerase chain reaction (PCR), but may be used as apreparative technique prior to use of other methods such as massspectrometry, RFLP, PCR, cloning, DNA sequencing, or Southernblotting for further characterisation.
Fig. 21. Gel Electrophoresis Machine
3.1.1 Types of Gel
Agarose and polyacrylamide gels are most typically used. This is becauseeach type of gel is well-suited to different types and sizes of analyte. Whilepolyacrylamide gels are usually used for proteins because of thier very highresolving power for small fragments of DNA (5-500 bp), agarose gels onthe other hand have lower resolving power for DNA but have greater rangeof separation, and are therefore used for DNA fragments of usually 50-20,000 bp in size, but resolution of over 6 Mb is possible with pulsed field

AGR 503 MODULE 3
116
gel electrophoresis (PFGE). Polyacrylamide gels are run in a verticalconfiguration while agarose gels are typically run horizontally in asubmarine mode. They also differ in their casting methodology, as agarosesets thermally, while polyacrylamide forms in a chemical polymerisationreaction.
1. AgaroseAgarose gels are made from thenatural polysaccharide polymers extracted from seaweed. Agarosegels are easily cast and handled compared to other matrices, becausethe gel setting is a physical rather than chemical change. Samples arealso easily recovered. After the experiment is finished, the resultinggel can be stored in a plastic bag in a refrigerator.Agarose gels do not have a uniform pore size, but are optimal forelectrophoresis of proteins that are larger than 200 kDa.Agarose gelelectrophoresis can also be used for the separation of DNAfragments ranging from 50 base pair to several megabases (millionsof bases), the largest of which require specialized apparatus. Thedistance between DNA bands of different lengths is influenced bythe percent agarose in the gel, with higher percentages requiringlonger run times, sometimes days. Instead high percentage agarosegels should be run with a pulsed field electrophoresis (PFE), or fieldinversion electrophoresis.
2. PolyacrylamidePolyacrylamide gel electrophoresis (PAGE) is used for separatingproteins ranging in size from 5 to 2,000 kDa due to the uniform poresize provided by the polyacrylamide gel. Pore size is controlled bymodulating the concentrations of acrylamide and bis-acrylamidepowder used in creating a gel. Care must be used when creating thistype of gel, as acrylamide is a potent neurotoxin in its liquid andpowdered forms.Traditional DNA sequencing techniques such as Maxam-Gilbert or Sanger methods used polyacrylamide gels to separateDNA fragments differing by a single base-pair in length so thesequence could be read. Most modern DNA separation methods nowuse agarose gels, except for particularly small DNA fragments. It iscurrently most often used in the field of immunology and proteinanalysis, often used to separate different proteins or isoforms of thesame protein into separate bands. These can be transferred ontoa nitrocellulose or PVDF membrane to be probed with antibodiesand corresponding markers, such as in a western blot.

AGR 503 ANALYTICAL TECHNIQUES IN AGRICULTURE
117
3. Starch
Partially hydrolysed potato starch makes for another non-toxicmedium for protein electrophoresis. The gels are slightly moreopaque than acrylamide or agarose. Non-denatured proteins can beseparated according to charge and size. They are visualised usingNapthal Black or Amido Black staining. Typical starch gelconcentrations are 5% to 10%.
3.1.2 Gel Conditions
1. Denaturing Denaturing gels are run under conditions that disrupt the natural
structure of the analyte, causing it to unfold into a linear chain. Thus, the mobility of each macromolecule depends only on its linear
length and its mass-to-charge ratio. Thus, the secondary, tertiary, and quaternary levels of biomolecular
structure are disrupted, leaving only the primary structure to beanalysed.
Nucleic acids are often denatured by including urea in the buffer,while proteins are denatured using sodium dodecyl sulfate, usuallyas part of the SDS-PAGE process.
For full denaturation of proteins, it is also necessary to reduce thecovalent disulfide bonds that stabilise their tertiary and quaternarystructure, a method called reducing PAGE.
Reducing conditions are usually maintained by the addition of beta-mercaptoethanol or dithiothreitol. For general analysis of proteinsamples, reducing PAGE is the most common form of proteinelectrophoresis.
2. Native Native gels are run in non-denaturing conditions, so that the
analyte's natural structure is maintained. Unlike denaturing methods, native gel electrophoresis does not use a
charged denaturing agent. The molecules being separated (usually proteins or nucleic acids)
therefore differ not only in molecular mass and intrinsic charge, butalso the cross-sectional area, and thus experience differentelectrophoretic forces dependent on the shape of the overallstructure.
This allows the physical size of the folded or assembled complex toaffect the mobility, allowing for analysis of all four levels of thebiomolecular structure.

AGR 503 MODULE 3
118
For biological samples, detergents are used only to the extent thatthey are necessary to lyse lipid membranes in the cell.
Complexes remain—for the most part—associated and folded asthey would be in the cell.
One downside, however, is that complexes may not separate cleanlyor predictably, as it is difficult to predict how the molecule's shapeand size will affect its mobility. Addressing and solving this problemis a major aim of quantitative native PAGE.
For proteins, since they remain in the native state they may bevisualised not only by general protein staining reagents but also byspecific enzyme-linked staining.
Native gel electrophoresis is typically usedin proteomics and metallomics. However, native PAGE is also usedto scan genes (DNA) for unknown mutations as in Single-strandconformation polymorphism.
3. Buffers Buffers in gel electrophoresis are used to provide ions that carry a
current and to maintain the pH at a relatively constant value. These buffers have plenty of ions in them, which is necessary for the
passage of electricity through them. Something like distilled water or benzene contains few ions, which
is not ideal for the use in electrophoresis. There are a number of buffers used for electrophoresis. The most
common being, for nucleicacids Tris/Acetate/EDTA (TAE), Tris/Borate/EDTA (TBE).
Many other buffers have been proposed, e.g. lithium borate, which isalmost never used, based on Pubmed citations (LB), iso electrichistidine, pK matched goods buffers, etc.; in most cases thepurported rationale is lower current (less heat) matched ionmobilities, which leads to longer buffer life.
However, with its low conductivity, a much higher voltage could beused (up to 35 V/cm), which means a shorter analysis time forroutine electrophoresis.
As low as one base pair size difference could be resolved in 3%agarose gel with an extremely low conductivity medium (1 mMLithium borate).
Most SDS-PAGE protein separations are performed usinga "discontinuous" (or DISC) buffer system that significantlyenhances the sharpness of the bands within the gel.
During electrophoresis in a discontinuous gel system, an ion gradientis formed in the early stage of electrophoresis that causes all of the
AGR 503 ANALYTICAL TECHNIQUES IN AGRICULTURE
119
proteins to focus into a single sharp band in a processcalled isotachophoresis.
Separation of the proteins by size is achieved in the lower,"resolving" region of the gel. The resolving gel typically has a muchsmaller pore size, which leads to a sieving effect that nowdetermines the electrophoretic mobility of the proteins.
4. Visualisation After electrophoresis is complete, the molecules in the gel are
stained in order to make them visible and the process is calledvisualisation.
DNA may be visualised using ethidium bromide which, whenintercalated into DNA, fluoresce under ultraviolet light.
Protein may be visualised using silver stain or Coomassie BrilliantBlue dye.
Other methods may also be used to visualize the separation of themixture's components on the gel. If the molecules to be separatedcontain radioactivity, Photographs can be taken of gels, often usinga Gel Doc system.
5. Downstream processing After separation, an additional separation method may then be used,
such as isoelectric focusing or SDS-PAGE. The gel will then be physically cut, and the protein complexes
extracted from each portion separately. Each extract may then be analysed, such as by peptide mass
fingerprinting or de novo peptide sequencing after in-gel digestion.This can provide a great deal of information about the identities ofthe proteins in a complex.
3.1.6 Applications of Gel Electrophoresis
Estimation of the size of DNA molecules following restrictionenzyme digestion, e.g. in restriction mapping of cloned DNA.
Analysis of PCR products, e.g. in molecular geneticdiagnosis or genetic fingerprinting
Separation of restricted genomic DNA prior to southern transfer, orof RNA prior to Northern transfer.
Gel electrophoresis is used in forensics, molecular biology, genetic,microbiology andbiochemistry.

AGR 503 MODULE 3
120
3.1.7 History
1930s – first reports of the use of sucrose for gel electrophoresis 1955 – introduction of starch gels, mediocre separation (Smithies) 1959 – introduction of acrylamide gels; disc electrophoresis
(Ornstein and Davis); accurate control of parameters such as poresize and stability; and (Raymond and Weintraub)
1966 – first use of agar gels 1969 – introduction of denaturing agents especially SDS separation
of protein subunit (Weber and Osborn) 1970 – Laemmli separated 28 components of T4 phage using a
stacking gel and SDS 1972 – agarose gels with ethidium bromide stain 1975 – 2-dimensional gels (O’Farrell); isoelectric focusing then SDS
gel electrophoresis 1977 – sequencing gels 1983 – pulsed field gel electrophoresis enables separation of large
DNA molecules 1983 – introduction of capillary electrophoresis 2004 – introduction of a standardized time of polymerization of
acrylamide gels enables clean and predictable separation of nativeproteins (Kastenholz).
A 1959 book on electrophoresis by Milan Bier cites references from the1800s. However, Oliver Smithies made significant contributions. Bierstates: "The method of Smithies is finding wide application because of itsunique separatory power." Taken in context, Bier clearly implies thatSmithies' method is an improvement.
4.0 CONCLUSION
Gel electrophoresis is a method normally employed in the separation andanalysis of macromolecules such as (DNA, RNA and proteins) as well astheir fragments, based on their size and charge. Nucleic acid molecules areseparated by applying an electric field to move the negatively chargedmolecules through a matrix of agarose or other substances. Shortermolecules move faster and migrate farther than longer ones because shortermolecules migrate more easily through the pores of the gel. Thisphenomenon is called sieving.

AGR 503 ANALYTICAL TECHNIQUES IN AGRICULTURE
121
5.0 SUMMARY
Agarose and polyacrylamide gels are most typically used. This is becauseeach type of gel is well-suited to different types and sizes of analyte. Whilepolyacrylamide gels are usually used for proteins because of their very highresolving power for small fragments of DNA (5-500 bp), agarose gels onthe other hand have lower resolving power for DNA but have greater rangeof separation, and are therefore used for DNA fragments of usually 50-20,000 bp in size, but resolution of over 6 Mb is possible with pulsed fieldgel electrophoresis (PFGE).
6.0 TUTOR-MARKED ASSIGNMENT
1. What do you understand as Gel electrophoresis and which labs arethey found?
2. State the two major types of gel used in Gel electrophoresis andwhat is the different between them?
3. Mention at least four different gel conditions and briefly explaineach.
4. Outline the applications of gel electrophoresis.5. State the history of the development of gel electrophoresis.
7.0 REFERENCES/FURTHER READING
"Agarose gel electrophoresis (basic method)". Biological Protocols.Retrieved 23 August2011.
Berg, J.M., Tymoczko, J.L., Stryer, L. (2002). Biochemistry (5th ed.). WHFreeman. ISBN 978-0-7167-4955-4.
https://en.wikipedia.org/wiki/Gel_electrophoresis
Robyt, John F.; White, Bernard J. (1990). Biochemical Techniques Theoryand Practice. Waveland Press. ISBN 978-0-88133-556-9.
Sambrook, J, & Russel D.W. (2001). Molecular Cloning: A LaboratoryManual (3rd ed.). Cold Spring Harbor Laboratory Press. Cold SpringHarbor, NY.
Schägger, Hermann (2006). "Tricine–SDS-PAGE". Nature Protocols. 1 (1):16–22. doi:10.1038/nprot.2006.4. PMID 17406207.

AGR 503 MODULE 3
122
Smisek, D. L.; Hoagland, D. A. (1989). "Agarose gel electrophoresis ofhigh molecular weight, syntheticpolyelectrolytes". Macromolecules. 22 (5): 2270–2277. Bibcode:1989MaMol..22.2270S. doi:10.1021/ma00195a048.
Tom, Maniatis; E. F. Fritsch; Joseph, Sambrook (1982). "Chapter 5,protocol 1". Molecular Cloning - A Laboratory Manual. 1 (3rd ed.).p. 5.2–5.3. ISBN 978-0879691363.

AGR 503 ANALYTICAL TECHNIQUES IN AGRICULTURE
123
UNIT 8 HEMATOLOGY AND SERUM BIOCHEMISTRY
CONTENTS
1.0 Introduction2.0 Objectives3.0 Main Content
3.1 Hematology3.2 Serum Biochemistry
4.0 Conclusion5.0 Summary6.0 Tutor-Marked Assignment7.0 References/Further Reading
1.0 INTRODUCTION
Hematology, also spelled haematology, is the branchof medicine concerned with the study of the cause, prognosis, treatment,and prevention of diseases related to blood. It involves treating diseases thataffect the production of blood and its components, such as bloodcells, hemoglobin, blood proteins, bone marrow, platelets, bloodvessels, spleen, and the mechanism of coagulation. Such diseases mightinclude hemophilia, blood clots, other bleeding disorders andblood cancers such as leukemia, multiple myeloma, and lymphoma. Thelaboratory work that goes into the study of blood is frequently performedby a medical technologist or medical laboratory scientist. Serumbiochemistry on the other hand refers to the chemical analysis of bloodserum. A profile of tests can be combined to evaluate renal function,electrolyte metabolism, serum proteins, digestion, injury, lipids, pancreaticfunction, and the liver. Specialised chemistry testing can also be undertakento assess thyroid glands and liver function.
2.0 OBJECTIVES
By the end of this unit, you will be able to:
understand what hematology and serum biochemistry are all about know how some common blood diseases that can be determined in
the laboratory.

AGR 503 MODULE 3
124
3.0 MAIN CONTENT
3.1 Hematology
Hematology, also spelled haematology, is the branchof medicine concerned with the study of the cause, prognosis, treatment,and prevention of diseases related to blood. Physicians specialized inhematology are known as hematologists or haematologists. Their routinework mainly includes the care and treatment of patients with hematologicaldiseases, although some may also work at the hematology laboratoryviewing blood films and bone marrow slides under the microscope,interpreting various hematological test results and blood clottingtest results. In some institutions, hematologists also manage the hematologylaboratory. Physicians who work in hematology laboratories, and mostcommonly manage them, are pathologists specialised in the diagnosis ofhematological diseases, referredtoas hematopathologists or haematopathologists. Hematologists andhematopathologists generally work in conjunction to formulate a diagnosisand deliver the most appropriate therapy if needed. Hematology is a distinctsubspecialty of internal medicine, separate from but overlapping with thesubspecialty of medical oncology.
Hematologists may specialise further or have special interests, forexample, in:
treating bleeding disorders such as hemophilia and idiopathicthrombocytopenic purpura
treating hematological malignancies suchas lymphoma and leukemia (cancers)
treating hemoglobinopathies the science of blood transfusion and the work of a blood bank bone marrow and stem cell transplantation
3.2 Serum Biochemistry
Serum biochemistry on the other hand refers to the chemical analysis ofblood serum. A profile of tests can be combined to evaluate renal function,electrolyte metabolism, serum proteins, digestion, injury, lipids, pancreaticfunction, and the liver. Specialised chemistry testing can also be undertakento assess thyroid glands and liver function. In veterinary clinical pathology,serum biochemistry testing presents the challenges of species differencesand low volume samples. Automated analysers for veterinary use have beenimplemented to provide a precision to sample analysis. Two of these types

AGR 503 ANALYTICAL TECHNIQUES IN AGRICULTURE
125
of analysers are important tools used in the laboratory of the Division ofComparative Pathology. Preset biochemistry panels are available for useand custom panels can be tailored for the best use in your research project.
Available blood tests with their specificity in mammalian speciesinclude:
Renal function – blood urea nitrogen (BUN) and creatinine Electrolytes – chloride, potassium, phosphorus, calcium, magnesium Liver – alanine aminotransferase (ALT), aspartate aminotransferase
(AST), alkaline phosphatase, gamma-glutamyltransferase (GGT),total and direct bilirubin, albumin
Pancreas – amylase, lipase, glucose Serum proteins – total protein, albumin, globulin; alpha, beta and
gamma globulins via protein electrophoresis Injury – creatine kinase (CK), lactate dehydrogenase (LDH) Lipids – cholesterol, triglycerides, high-density lipoprotein (HDL),
low-density lipoprotein (LDL), very low-density lipoprotein (VLDL)
4.0 CONCLUSION
Hematology, also spelled haematology, is the branchof medicine concerned with the study of the cause, prognosis, treatment,and prevention of diseases related to blood. Serum biochemistry on theother hand refers to the chemical analysis of blood serum. A profile of testscan be combined to evaluate renal function, electrolyte metabolism, serumproteins, digestion, injury, lipids, pancreatic function, and the liver.Specialised chemistry testing can also be undertaken to assess thyroidglands and liver function.
5.0 SUMMARY
Hematology, is concerned with the study of the cause, prognosis,treatment, and prevention of diseases related to blood. Hematologists andhematopathologists generally work in conjunction to formulate a diagnosisand deliver the most appropriate therapy if needed. Hematology is a distinctsubspecialty of internal medicine, separate from but overlapping with thesubspecialty of medical oncology. Serum biochemistry refers to thechemical analysis of blood serum.

AGR 503 MODULE 3
126
6.0 TUTOR-MARKED ASSIGNMENT
1. Briefly explain the term “Hematology”.2. Briefly explain the term “Serum biochemistry”.3. State at least five areas of specialisation in hematology.4. Outline three clinical issues that can be managed by hematologists.5. Mention seven available blood related tests that have their specificity
in mammalian species.
7.0 REFERENCES/FURTHER READING
https://en.wikipedia.org/wiki/Hematology
https://www.acponline.org/about-acp/about-internal medicine/ subspecialties/ hematology
https://en.wikipedia.org/wiki/Hematology

AGR 503 MODULE 4
127
MODULE 4 SAMPLE CONSERVATION ANDPESERVATION
UNIT 1 CRYOPRESERVATION
CONTENTS
1.0 Introduction2.0 Objectives3.0 Main Content
3.1 Cryopreservation4.0 Conclusion5.0 Summary6.0 Tutor-Marked Assignment7.0 References/Further Reading
1.0 INTRODUCTION
Cryo-preservation or cryo-conservation is a process in whichespecially animal and plant material samples suchas organelles, cells, tissues, extracellular matrix, organs, seeds or anyother biological constructs susceptible to damage caused byunregulated chemical kinetics are preserved by cooling to verylow temperatures (typically −80 °C using solid carbon dioxide or−196 °C using liquid nitrogen). At low enough temperatures,any enzymatic or chemical activity which might cause damage to thebiological material in question is effectively stopped. Cryopreservationmethods seek to reach low temperatures without causing additionaldamage caused by the formation of ice crystals during freezing.Traditional cryopreservation has relied on coating the material to befrozen with a class of molecules termed cryoprotectants. New methodsare constantly being investigated due to the inherent toxicity of manycryoprotectants.By default it should be considered that cryopreservationalters or compromises the structure and function of cells unless it isproven otherwise for a particular cell population. Cryoconservation ofanimal genetic resources is the process in which animal genetic materialis collected and stored with the intention of conservation of the breed.
2.0 OBJECTIVES
By the end of this unit, you will be able to:
know what cryo-preservation is all about know different animal sample materials that can be preserved
using cryopreservation.

AGR 503 ANALYTICAL TECHNIQUES IN AGRICULTURE
128
3.0 MAIN CONTENT
3.1 Cryopreservation
Cryo-preservation is a process in which especially animal and plantmaterial samples such as organelles, cells, tissues, extracellularmatrix, organs, seeds or any other biological constructs susceptible todamage caused by unregulated chemical kinetics are preserved bycooling to very low temperatures (typically −80 °C using solid carbondioxide or −196 °C using liquid nitrogen).
3.1.1 Naturalcryopreservation
Water-bears (Tardigrada), microscopic multicellular organisms, cansurvive freezing by replacing most of their internal water withthe sugar trehalose, preventing it from crystallisation that otherwisedamages cell membranes. Mixtures of solutes can achieve similareffects. Some solutes, including salts, have the disadvantage that theymay be toxic at intense concentrations. In addition to the water-bear,wood frogs can tolerate the freezing of their blood and other tissues.Urea is accumulated in tissues in preparation for overwintering, andliver glycogen is converted in large quantities to glucose in response tointernal ice formation. Both urea and glucose act as "cryoprotectants" tolimit the amount of ice that forms and to reduce osmotic shrinkage ofcells. Frogs can survive many freeze/thaw events during winter if nomore than about 65% of the total body water freezes.
3.1.1.1 Organisms that Exhibit Natural Cryopreservation
Freeze tolerance, in which organisms survive the winter by freezingsolid and ceasing life functions, is known in a few vertebrates whichinclude;
i. Five species of frogs (Rana sylvatica, Pseudacristriseriata, Hylacrucifer, Hyla versicolor, Hylachrysoscelis), In the case of Ranasylvatica one cryopreservant is ordinary glucose, which increasesin concentration by approximately 19 mmol/l when the frogs arecooled slowly.
ii. One of salamanders (Hynobius keyserlingi),iii. One of snakes (Thamnophis sirtalis)iv. Three of turtles
(Chrysemyspicta, Terrapenecarolina, Terrapeneornata). Snapping turtles Chelydraserpentina and
v. Wall lizards Podarcismuralis also survive nominal freezing but ithas not been established to be adaptive for overwintering.

AGR 503 MODULE 4
129
3.1.2 History of Cryopreservation
One of the most important early theoreticians of cryopreservationwas James Lovelock.
In 1953, he suggested that damage to red blood cells duringfreezing was due to osmoticstress, and that increasing the saltconcentration in a dehydrating cell might damage it.
In the mid-1950s, he experimented with the cryopreservation ofrodents, determining that hamsters could be frozen with 60% ofthe water in the brain crystallised into ice with no adverse effects;other organs were shown to be susceptible to damage.
This work led other scientists to attempt the short-term freezingof rats by 1955, which were fully active four to seven days afterbeing revived.
Fowl sperm was cryopreserved in 1957 by a team of scientists inthe UK directed by Christopher Polge.
During 1963, Peter Mazur, at Oak Ridge National Laboratory inthe U.S., demonstrated that lethal intracellular freezing could beavoided if cooling was slow enough to permit sufficient water toleave the cell during progressive freezing of the extracellularfluid.
That rate differs between cells of differing size and waterpermeability: a typical cooling rate around 1 °C/minute isappropriate for many mammalian cells after treatment withcryoprotectants such as glycerol or dimethyl sulphoxide, but therate is not a universal optimum.
3.1.3 Temperature
Storage at very low temperatures is presumed to provide anindefinite longevity to cells, although the actual effective life israther difficult to prove.
Researchers experimenting with dried seeds found that there wasnoticeable variability of deterioration when samples were kept atdifferent temperatures – even ultra-cold temperatures.
Temperatures less than the glass transition point (Tg) of polyol'swater solutions, around −136 °C (137 K; −213 °F), seem to beaccepted as the range where biological activity very substantiallyslows, and −196 °C (77 K; −321 °F), the boiling point of liquidnitrogen, is the preferred temperature for storing importantspecimens.
While refrigerators, freezers and extra-cold freezers are used formany items, generally the ultra-cold of liquid nitrogen is requiredfor successful preservation of the more complex biologicalstructures to virtually stop all biological activity.

AGR 503 ANALYTICAL TECHNIQUES IN AGRICULTURE
130
3.1.4 Risks of Cryopreservation
Phenomena which can cause damage to cells during cryopreservationmainly occur during the freezing stage, and include:
i. Solution effects:As ice crystals grow in freezingwater, solutes are excluded, causing them to become concentratedin the remaining liquid water. High concentrations of somesolutes can be very damaging.
ii. Extracellular ice formation:When tissues are cooled slowly,water migrates out of cells and ice forms in the extracellularspace. Too much extracellular ice can cause mechanical damageto the cell membrane due to crushing.
iii. Dehydration: Migration of water, causing extracellular iceformation, can also cause cellular dehydration. The associatedstresses on the cell can cause damage directly.
iv. Intracellular ice formation: Whilesome organisms and tissues can tolerate some extracellular ice,any appreciable intracellular ice is almost always fatal to cells.
.Many of these effects can be reduced by cryoprotectants. Once thepreserved material has become frozen, it is relatively safe from furtherdamage. However, estimates based on the accumulation of radiation-induced DNA damage during cryonic storage have suggested amaximum storage period of 1000 years.
3.1.4.1 Main Methods to Prevent Risks
The main techniques to prevent cryopreservation damages are a well-established combination of controlled rate and slow freezing and anewer flash-freezing process known as vitrification.
3.1.5 Vitrification
Researchers Greg Fahy and William F. Rall helped to introducevitrification to reproductive cryopreservation in the mid-1980s.
As of 2000, researchers claim vitrification provides the benefitsof cryopreservation without damage due to ice crystal formation.
The situation became more complex with the development oftissue engineering as both cells and biomaterials need to remainice-free to preserve high cell viability and functions, integrity ofconstructs and structure of biomaterials.
For clinical cryopreservation, vitrification usually requires theaddition of cryoprotectants prior to cooling. The cryoprotectantsact like antifreeze: they decrease the freezing temperature. Theyalso increase the viscosity.

AGR 503 MODULE 4
131
Instead of crystallizing, the syrupy solution becomesan amorphous ice—it vitrifies. Rather than a phase change fromliquid to solid by crystallization, the amorphous state is like a"solid liquid", and the transformation is over a small temperaturerange described as the "glass transition" temperature.
Vitrification of water is promoted by rapid cooling, and can beachieved without cryoprotectants by an extremely rapid decreaseof temperature (megakelvins per second). The rate that isrequired to attain glassy state in pure water was considered to beimpossible until 2005.
3.1.5.1 Conditions Required for Vitrification
Two conditions usually required to allow vitrification are anincrease of the viscosity and a decrease of the freezingtemperature.
Many solutes do both, but larger molecules generally have alarger effect, particularly on viscosity.
Rapid cooling also promotes vitrification. For established methods of cryopreservation, the solute must
penetrate the cell membrane in order to achieve increasedviscosity and decrease freezing temperature inside the cell.
One of the difficult compromises of vitrifying cryopreservationconcerns limiting the damage produced by the cryoprotectantitself due to cryoprotectant toxicity.
3.1.6 Areas In Which Cryopreservation is Possible
i. Freezable tissues Generally, cryopreservation is easier for thin samples and
small clumps of individual cells, because these can becooled more quickly and so require lesser doses of toxiccryoprotectants.
Nevertheless, suitable combinations of cryoprotectants andregimes of cooling and rinsing during warming oftenallow the successful cryopreservation of biologicalmaterials, particularly cell suspensions or thin tissuesamples.
Examples include:Semen in semen cryopreservation
ii. Ovarian tissue in ovarian tissue cryopreservation Plant seeds or shoots may be cryopreserved
for conservation purposes.

AGR 503 ANALYTICAL TECHNIQUES IN AGRICULTURE
132
Countless cryopreserved cells, vaccines, tissue and otherbiological samples have been thawed and usedsuccessfully.
iii. Preservation of microbiology cultures Bacteria and fungi can be kept short-term (months to about
a year, depending) refrigerated, however, cell division andmetabolism is not completely arrested and thus is not anoptimal option for long-term storage (years) or to preservecultures genetically or phenotypically, as cell divisions canlead to mutations or sub-culturing can cause phenotypicchanges.
A preferred option, species-dependent, iscryopreservation. Nematode worms are the onlymulticellular eukaryotes that have been shown to survivecryopreservation.
iv. Fungi Fungi, notably zygomycetes, ascomycetes and higher
basidiomycetes, regardless of sporulation, are able to bestored in liquid nitrogen or deep-frozen.
Crypreservation is a hallmark method for fungi that do notsporulate (otherwise other preservation methods for sporescan be used at lower costs and ease), sporulate but havedelicate spores (large or freeze-dry sensitive), arepathogenic (dangerous to keep metabolically activefungus) or are to be used for genetic stocks (ideally tohave identical composition as the original deposit).
As with many other organisms, cryoprotectantslike DMSO or glycerol (e.g. filamentous fungi 10%glycerol or yeast 20% glycerol) are used.
Differences between choosing cryoprotectants are species(or class) dependent, but generally for fungi penetratingcryoprotectants like DMSO, glycerol or polyethyleneglycol are most effective (other non-penetrating onesinclude sugars mannitol, sorbitol, dextran, etc.). Freeze-thaw repetition is not recommended as it can decreaseviability.
Back-up deep-freezers or liquid nitrogen storage sites arerecommended. Multiple protocols for freezing aresummarized below (each uses screw-cap polypropylenecryotubes).
v. Bacteria Many common culturable laboratory strains are deep-
frozen to preserve genetically and phenotypically stable,long-term stocks. Sub-culturing and prolonged refrigeratedsamples may lead to loss of plasmid(s) or mutations.
AGR 503 MODULE 4
133
Common final glycerol percentages are 15, 20 and 25.From a fresh culture plate, one single colony of interest ischosen and liquid culture is made.
From the liquid culture, the medium is directly mixedwith equal amount of glycerol; the colony should bechecked for any defects like mutations.
All antibiotics should be washed from the culture beforelong-term storage. Methods vary, but mixing can be donegently by inversion or rapidly by vortex and cooling canvary by either placing the cryotube directly at −50 to−95 °C, shock-freezing in liquid nitrogen or graduallycooling and then storing at −80 °C or cooler (liquidnitrogen or liquid nitrogen vapor).
Recovery of bacteria can also vary, namely if beads arestored within the tube then the few beads can be used toplate or the frozen stock can be scraped with a loop andthen plated, however, since only little stock is needed theentire tube should never be completely thawed andrepeated freeze-thaw should be avoided. 100% recovery isnot feasible regardless of methodology.
vi. WormsThe microscopic soil-dwelling nematode roundworms Panagrolaimusdetritophagusand Plectusparvus are the only eukaryotic organisms that havebeen proven to be viable after long-term cryopreservation todate. In this case, the preservation was natural rather thanartificial, due to permafrost.
vii. Embryosviii. Ovarian tissue
ix. Semenx. Testicular tissue
xi. Moss
4.0 CONCLUSION
Cryopreservation is storage at ultra-low temperature (–196oC), usuallyin liquid nitrogen. All cellular division and metabolic processes stop atthis temperature, so plant material can be stored without alteration ormodification for an unlimited period of time in a small volume,protected from contamination and requiring very little maintenance.Cryopreservation currently offers the only safe and cost-effective optionfor the long-term conservation of genetic resources of vegetativelypropagated species.

AGR 503 ANALYTICAL TECHNIQUES IN AGRICULTURE
134
5.0 SUMMARY
Cryopreservation methods seek to reach low temperatures withoutcausing additional damage caused by the formation of ice crystalsduring freezing. Traditional cryopreservation has relied on coating thematerial to be frozen with a class of molecules termed cryoprotectants.New methods are constantly being investigated due to theinherent toxicity of many cryoprotectants.
6.0 TUTOR-MARKED ASSIGNMENT
1. Discuss exhaustively, the concept of cryopreservation orcryoconservation.
2. What is natural cryopreservation? state five organisms whichexhibit natural cryopreservation?
3. Briefly outline the history of cryopreservation.4. Explain the role of temperature in cryopreservation.5. State and briefly explain the risks of cryopreservation.6. What do you understand by vitrification andwhat are the
conditions required by vitrification?7. Mention and briefly discuss areas where cryopreservation is
possible.
7.0 REFERENCES/FURTHER READING
Pegg, David E. (January 1, 2007). "Principles ofcryopreservation". Methods in Molecular Biology. Clifton,N.J. 368: 39–57. doi:10.1007/978-1-59745-362-2_3. ISBN 978-1-58829-377-0. ISSN 1064-3745. PMID 18080461.
Sambu, Sammy (June 25, 2015). "A Bayesian approach to optimisingcryopreservation protocols". PeerJ. 3:e1039. doi:10.7717/peerj.1039. ISSN 2167-8359. PMC 4485240. PMID 26131379.
Fuller, Barry J.; Lane, Nick; Benson & Erica E., (Eds.). (2004). Life inthe Frozen State. CRC Press. p. 7. ISBN 978-0203647073.
Mazur, Peter (1970). "Cryobiology: the freezing of biologicalsystems". Science. 168(3934): 939–49. Bibcode:1970Sci...168..939M. doi:10.1126/science.168.3934.939. PMID 5462399.
"The Cryobiological Case for Cryonics" (PDF). Cryonics. Vol. 9(3)no. 92. Alcor Life Extension Foundation. March 1988. p. 27.

AGR 503 MODULE 4
135
Perry, R. Michael (October 2014). "Suspension Failures – Lessons fromthe Early Days". ALCOR: Life Extension Foundation.Retrieved August 29, 2018.
Mazur, P (1984). "Freezing of living cells: mechanisms andimplications". American Journal of Physiology. 247 (3 Pt 1):C125–42. Bibcode:1957RSPSB.147..498P. doi:10.1098/rspb.1957.0068.
Vutyavanich, T; Piromlertamorn W; Nunta S (April 2010). "Rapidfreezing versus slow programmable freezing of humanspermatozoa". Fertil. Steril. 93 (6): 1921–8. doi:10.1016/j.fertnstert.2008.04.076. PMID 19243759.
"dead link". Archived from the original on 2009-05-26.
Deller, Robert, C.; Vatish, Manu; Mitchell, Daniel A.; Gibson, MatthewI. (February 3, 2014). "Synthetic polymers enable non-vitreouscellular cryopreservation by reducing ice crystal growth duringthawing". Nature Communications. 5:3244. Bibcode:2014NatCo...5E3244D. doi:10.1038/ncomms4244. PMID 24488146.
https://en.wikipedia.org/wiki/Cryopreservationhttps://lrd.spc.int/our-work/genetic-resources/training-and-workshops-
/cryopreservation-the-future-in-conservation