Underlying Familial Factors for Aggressive Behavior in ... - MDPI

AGGRESSIVE BEHAVIOR
Volume 32, pages 279–293 (2006)
Aggressive Behavior Among Girls and Boys DuringMiddle Childhood: Predictors and Sequelae of TrajectoryGroup MembershipTracy W. Harachi1�, Charles B. Fleming1, Helene R. White2, Margaret E. Ensminger3
Robert D. Abbott4, Richard F. Catalano1, and Kevin P. Haggerty1
1Social Development Research Group, School of Social Work, University of Washington, Seattle, WA2Rutgers University, Piscataway, NJ3John Hopkins University, Baltimore, MD4Educational Psychology, University of Washington, Seattle, WA
: : : : : : : : : : : : : : : : : : : : : : : : : : : : : : : : : : : : : : : : :
Using longitudinal data spanning early elementary through middle school, aggression behavior trajectory groups were identified forboys and girls. Early elementary school predictors of trajectory group membership were examined as well as whether trajectorygroup predicted physical aggression, covert delinquency, and substance use in 9th grade. Semiparametric group modeling identifiedaggression behavior trajectory groups. We identified four aggression trajectory groups for both genders described as ‘‘notinvolved,’’ ‘‘low,’’ ‘‘moderate,’’ and ‘‘high.’’ Attention problems, family conflict, and low school commitment and attachmentwere predictors of membership in higher aggression groups for both boys and girls. Low family involvement and low parentaleducation predicted membership in higher aggression groups for boys; while depression, low-income status, and having a singleparent predicted higher aggression group membership for girls. For both boys and girls, few risk predictors distinguished betweenthe moderate and high aggression trajectories except that low school commitment and having a teen mother were significantpredictors of being in the high group for girls, and low parental education and income were significant predictors of being inthe high group for boys. Membership in the higher aggression trajectory groups predicted involvement in violent behaviors,covert delinquency, and substance use in 9th grade. Findings suggest that children who display an early trajectory of highlevels of aggressive behavior are more likely to continue involvement in later problem behaviors. Second-grade predictorssuggest commonality of risk across genders and provide evidence of modifiable targets for preventive interventions. Aggr. Behav.32:279–293. 2006. r 2006 Wiley-Liss, Inc.
: : : : : : : : : : : : : : : : : : : : : : : : : : : : : : : : : : : : : : : : :
Keywords: aggression; trajectory; childhood predictors; gender; boys; girls
INTRODUCTION
Among the most consistent findings in longitu-dinal studies of children and adolescents is evidenceof stability in levels of aggressive behavior duringearly childhood and the relationship of early aggre-ssive behavior in childhood with later delinquencyand substance use [e.g., Block et al., 1988; Brooket al., 1995; Campbell and Ewing, 1990; Ensmingeret al., 1983; Hawkins et al., 1992; Kazdin, 1995;Loeber and Coie, 2001; McCord, 1988; Robins,1966, 1978; White et al., 1993]. Much of the researchexamining stability of aggression and delinquency isbased on male samples despite the fact that conductdisorder (CD) is one of the most common psychia-tric disorders among adolescent girls [Atkins et al.,1996; Zoccolillo, 1993] and that the consequences ofantisocial behavior among adolescent girls can be
severe. Moffitt et al. [2001] found that femalesdiagnosed with CD experienced more adult depres-sion and medical problems and gave a worsesubjective rating of their health than did maleswho had been diagnosed with CD. In addition,females who displayed elevated levels of antisocialbehavior were 3.9 times more likely than their non-antisocial peers to attempt suicide compared to anodds ratio (OR) of 1.6 times for antisocial males.
Published online 21 February 2006 in Wiley InterScience (www.
interscience.wiley.com). DOI: 10.1002/ab.20125
Received 15 April 2005; Accepted 4 May 2005
Grant sponsor: National Institute on Drug Abuse; Grant number:]R01 DA08093.�Correspondence to: T.W. Harachi, Social Development Research
Group, University of Washington, 9725 3rd Avenue N.E., Suite 401,
Seattle, WA 98115. E-mail: [email protected]
r 2006 Wiley-Liss, Inc.

Antisocial females were as likely as their malecounterparts to report symptoms of alcohol depen-dence during the transition into adulthood and toexperience a number of other negative consequencessuch as the number of months disabled, having achild before age 21, and self-reported crime at age21. In the Woodlawn longitudinal study of urbanAfrican Americans, Ensminger et al. [2002] foundthat while early aggressive behavior in first gradewas not related to adolescent substance use for girls(as it was for the boys), it was associated withcocaine use at age 32. Zoccolillo and Rogers [1991]report that adolescent girls with CD were morelikely to have dropped out of school, becomepregnant before age 17, suffered a traumatic injury,or died a violent death.The available information on the amount and type
of antisocial behavior by gender is limited and ofteninconsistent due to differences in design, datasource, measurement, and analysis [Lahey et al.,1999a]. Numerous studies have found that boys aremore physically aggressive [McDermott, 1996; Tietet al., 2001] and have a higher rate of CDs [Robins,1991] than girls. Findings with regard to opposi-tional defiant disorder (ODD), often a precursor toCD [Lahey et al., 1992; Loeber et al., 2000], are lessconsistent. Rowe et al. [2002] and Lewinsohn et al.[1993], for example, found few gender differences inrates of ODD in their studies, whereas McDermott[1996] reported more ODD behaviors among 5–8-year-old boys than girls and Offord et al. [1996]found higher rates in 6–16-year-old boys than girls.Recent methodological advances have allowed the
identification of groups of individuals who havesimilar developmental trajectories of antisocialbehavior. Semiparametric group-based modeling(SGM) can be used when researchers suspect thesampled population is made up of qualitativelydifferent groups. The technique can be used even ifthe boundaries between groups are fluid and thepopulation is distributed along a multivariatecontinuum [Nagin and Tremblay, 1999]. In thelatter case, SGM is an approach for describingpopulation heterogeneity with discrete categoriesthat allow for easier interpretation of associationsbetween the behavior being modeled over time andeither predictors or consequences of that behavior.Nagin and Tremblay [1999] used SGM to identifyfour groups of boys based on teacher report ofaggression between ages 6 and 15 and Broidy et al.[2003] recently replicated Nagin and Tremblay’sSGM analyses among six cross-national samples.Cote et al. [2001] used SGM to examine girls’trajectories of disruptive behavior between kinder-
garten and sixth grade. They found that a smallproportion of girls (1.4%) could be identified whodisplayed a high level of disruptive behaviorscompared to the rest of the sample, and thatgroup membership significantly predicted numberof CD symptoms in adolescence. Girls in the highdisruptive category had more CD symptoms as wellas higher rates of CD diagnosis. Their resultssuggest that high levels of early antisocial behaviorspoint to a problematic trajectory with potentialfor later consequences. More research is neededto understand the similarities and differences inthe development of antisocial behavior for boysand girls.Further, less is known about gender differences
among developmental predictors of aggressivebehavior. A number of reviews show a wide varietyof predictors associated with aggressive behavior[e.g., Hawkins et al., 1998; Loeber and Farrington,1998; Rutter et al., 1998]. These predictors can becategorized as individual characteristics and pre-dictors in the peer, school, family, or communitydomains. Nagin and Tremblay [2001] examinedparent and child characteristics as potential pre-dictors of aggression trajectory group membershipusing the same sample and trajectory groupclassification established in their prior study. Amongparent characteristics, mother’s education, whethermother had her first child while a teenager, andwhether the natural parents were still married whenthe child was age six were predictive of boys being inone of the two higher aggression groups. Amongchild characteristics, IQ, hyperactivity, inattention,oppositional behavior, and prosocial behavior werepredictive of group membership. Most studies havenot directly examined whether girls and boys sharethe same predictors for aggression. A few studiesindicate that vulnerability to some predictorsappears to differ by gender. McFadyen-Ketchumet al. [1996] found that coercive parenting seemed tohave a greater effect on externalizing behavior forboys than girls. Moffitt et al. [2001] found that girlsand boys in the Dunedin sample shared most riskfactors for aggressive behavior, although boys weremarginally more vulnerable to family adversity,lower intelligence, under-controlled temperament,and hyperactivity. Boys in their sample also tendedto have higher rates of these critical predictors.In the Woodlawn study, Ensminger et al. [1984]found that while school bonds were equally protec-tive for substance use for males and females,family bonds were protective for females, but notmales. Storvoll and Wichstrom [2002] providesupport for a consistency in predictors related to
280 Harachi et al.
Aggr. Behav. DOI 10.1002/ab
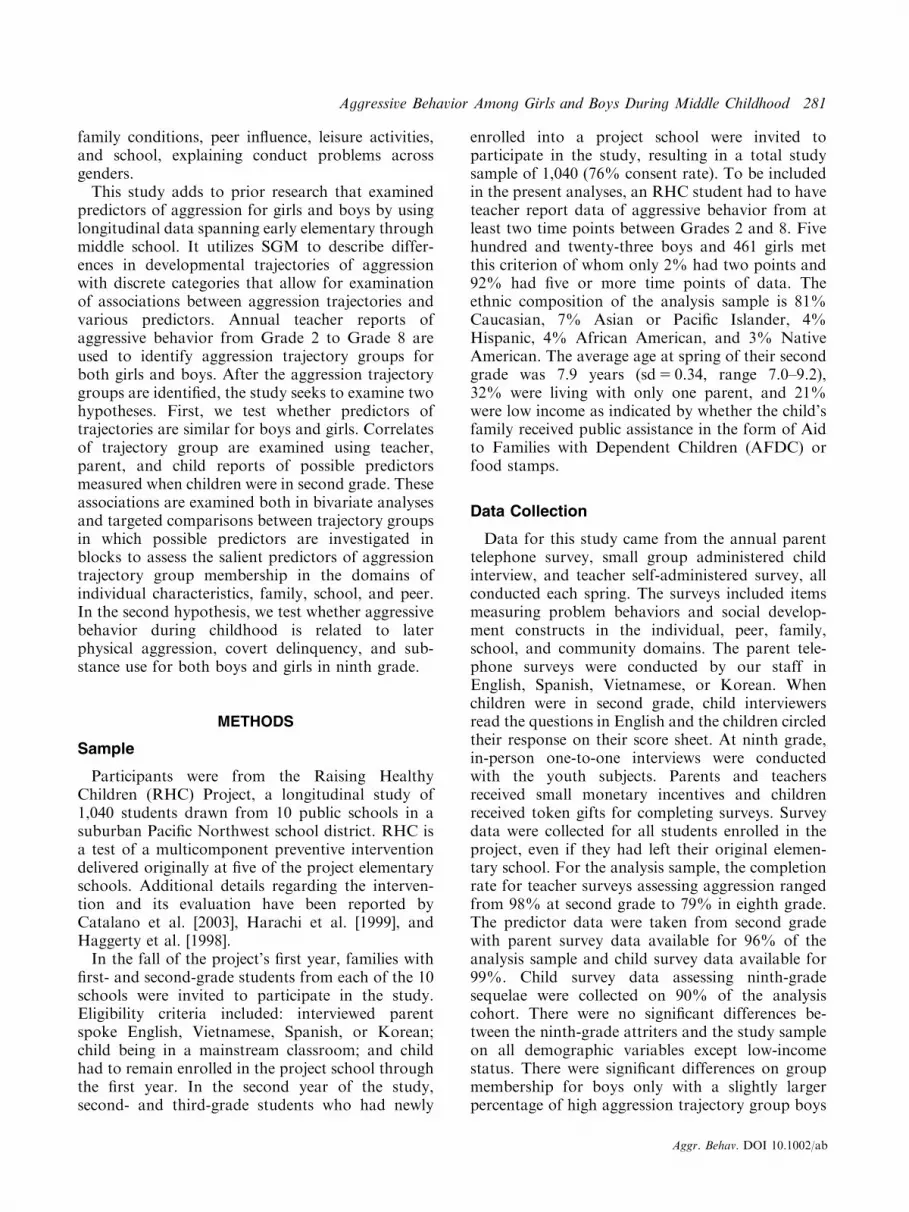
family conditions, peer influence, leisure activities,and school, explaining conduct problems acrossgenders.This study adds to prior research that examined
predictors of aggression for girls and boys by usinglongitudinal data spanning early elementary throughmiddle school. It utilizes SGM to describe differ-ences in developmental trajectories of aggressionwith discrete categories that allow for examinationof associations between aggression trajectories andvarious predictors. Annual teacher reports ofaggressive behavior from Grade 2 to Grade 8 areused to identify aggression trajectory groups forboth girls and boys. After the aggression trajectorygroups are identified, the study seeks to examine twohypotheses. First, we test whether predictors oftrajectories are similar for boys and girls. Correlatesof trajectory group are examined using teacher,parent, and child reports of possible predictorsmeasured when children were in second grade. Theseassociations are examined both in bivariate analysesand targeted comparisons between trajectory groupsin which possible predictors are investigated inblocks to assess the salient predictors of aggressiontrajectory group membership in the domains ofindividual characteristics, family, school, and peer.In the second hypothesis, we test whether aggressivebehavior during childhood is related to laterphysical aggression, covert delinquency, and sub-stance use for both boys and girls in ninth grade.
METHODS
Sample
Participants were from the Raising HealthyChildren (RHC) Project, a longitudinal study of1,040 students drawn from 10 public schools in asuburban Pacific Northwest school district. RHC isa test of a multicomponent preventive interventiondelivered originally at five of the project elementaryschools. Additional details regarding the interven-tion and its evaluation have been reported byCatalano et al. [2003], Harachi et al. [1999], andHaggerty et al. [1998].In the fall of the project’s first year, families with
first- and second-grade students from each of the 10schools were invited to participate in the study.Eligibility criteria included: interviewed parentspoke English, Vietnamese, Spanish, or Korean;child being in a mainstream classroom; and childhad to remain enrolled in the project school throughthe first year. In the second year of the study,second- and third-grade students who had newly
enrolled into a project school were invited toparticipate in the study, resulting in a total studysample of 1,040 (76% consent rate). To be includedin the present analyses, an RHC student had to haveteacher report data of aggressive behavior from atleast two time points between Grades 2 and 8. Fivehundred and twenty-three boys and 461 girls metthis criterion of whom only 2% had two points and92% had five or more time points of data. Theethnic composition of the analysis sample is 81%Caucasian, 7% Asian or Pacific Islander, 4%Hispanic, 4% African American, and 3% NativeAmerican. The average age at spring of their secondgrade was 7.9 years (sd5 0.34, range 7.0–9.2),32% were living with only one parent, and 21%were low income as indicated by whether the child’sfamily received public assistance in the form of Aidto Families with Dependent Children (AFDC) orfood stamps.
Data Collection
Data for this study came from the annual parenttelephone survey, small group administered childinterview, and teacher self-administered survey, allconducted each spring. The surveys included itemsmeasuring problem behaviors and social develop-ment constructs in the individual, peer, family,school, and community domains. The parent tele-phone surveys were conducted by our staff inEnglish, Spanish, Vietnamese, or Korean. Whenchildren were in second grade, child interviewersread the questions in English and the children circledtheir response on their score sheet. At ninth grade,in-person one-to-one interviews were conductedwith the youth subjects. Parents and teachersreceived small monetary incentives and childrenreceived token gifts for completing surveys. Surveydata were collected for all students enrolled in theproject, even if they had left their original elemen-tary school. For the analysis sample, the completionrate for teacher surveys assessing aggression rangedfrom 98% at second grade to 79% in eighth grade.The predictor data were taken from second gradewith parent survey data available for 96% of theanalysis sample and child survey data available for99%. Child survey data assessing ninth-gradesequelae were collected on 90% of the analysiscohort. There were no significant differences be-tween the ninth-grade attriters and the study sampleon all demographic variables except low-incomestatus. There were significant differences on groupmembership for boys only with a slightly largerpercentage of high aggression trajectory group boys
281Aggressive Behavior Among Girls and Boys During Middle Childhood
Aggr. Behav. DOI 10.1002/ab

(17.8% or N5 11 vs. 5.9%, 5.5% and 10.6% for theother three groups) missing at ninth grade.
Measures
Aggressive behavior. A four-item scale con-sisted of two items from the Teacher Observation ofClassroom Adaptation-Revised (TOCA-R)[Werthamer-Larsson et al., 1990] and two from theChild Behavior Checklist [Achenbach, 1991]. Tea-chers were asked to report how often a student‘‘Fights,’’ ‘‘Is cruel or mean to others,’’ ‘‘Threatenspeople,’’ and ‘‘Yells at others.’’ These items map onto physical and overt dimensions of aggression. Theresponse options were ‘‘Rarely or Never True,’’‘‘Sometimes True,’’ and ‘‘Often True’’ and werecoded 0, 1, and 2, respectively. A mean scale scorewas created (range 0–2) and Cronbach alphas rangedfrom 0.83 to 0.87 for boys and 0.78 to 0.85 for girlsfrom Grades 2 to 8. As an indication of constructvalidity, the correlation between this measure andteacher report of social competency was �0.64 atsecond grade and �0.52 at eighth grade.
Independent variables. Measures from par-ent, teacher, and child reports at second grade wereused as potential predictors of trajectory groupmembership. Child reports were limited by theyoung age of children that necessitated a shortsurvey with simple Yes/No response options for allitems. Standardized scores across gender werecomputed for all ordinal measures.Demographics. Measures of socioeconomic status
at second grade included parent education (the meanof each parent’s education) based on a seven-pointordinal scale and low-income status (whether thechild’s family received public assistance in the formof AFDC or food stamps). Two characteristics offamily structure were also included: first, whetherthe child had a teenage mother (defined by whetherthe child’s mother was under the age of 20 when thechild was born) and, second, whether the child livedin a single-parent household.Individual Predictors. Three child characteristics
during second grade were included. Child depressionwas measured by seven child survey items takenfrom the Seattle Personality Questionnaire [Green-berg and Kusche, 1990] (e.g., ‘‘Do you feel upsetabout things a lot?’’; a5 0.70). Content validity wasestablished by examining the content area of theseven items, which correspond to similar items onother standard child depression self-report measuressuch as the Child Depression Inventory [Kovacs,1992] and the Reynolds Child Depression Scale[Reynolds, 1989]. Construct validity was also
established by a 0.54 correlation between thismeasure and self-reported anxiety. Shy/withdrawnbehavior was measured by six teacher report itemsadopted from the TOCA-R (e.g., ‘‘Likes to bealone’’; a5 0.82). Attention problems were measuredby five items, also adopted from the TOCA-R (e.g.,‘‘Mind wanders’’; a5 0.87).Family predictors. A measure at second grade of
child involvement in prosocial activities with thefamily was based on five child survey items (e.g.,‘‘Do you talk to your mom or dad about what youdid in school?’’; a5 0.54). Child attachment toparents was based on a 6-item scale (e.g., ‘‘Howoften does your child share her thoughts and feelingswith her mother?’’; a5 0.60). Both constructs aretheorized as key components of a socializationprocess that can lead to prosocial or antisocialoutcomes and these two items have been shown tobe predictive of antisocial behavior [Catalano et al.,1999; Fleming et al., 2002]. Family conflict wasmeasured by eight parent survey items (e.g., ‘‘Wefight a lot in our family’’; a5 0.65) adopted from theFamily Environmental Scale [Moos, 1974]. An indexof family stress was based on how many of thefollowing four events were experienced by the familyin the prior year: death in the family, seriousaccident or illness, loss of job or major reductionin household income, or marital status change.In examining construct validity, the index of familystress was moderately related to parent depressionscores (r5 0.33).School and peer predictors. Child’s attachment to
school was based on four items (e.g., ‘‘Do you lookforward to going to school?’’; a5 0.37). The lowinternal consistency reflects the limitations of thedichotomous response options and homogeneity ofchildren’s attachment at second grade. Two teacherreport items, ‘‘Student tries hard in school’’ and‘‘Student wants to do well in school’’ were used tomeasure commitment to school (correlation betweenitems5 0.79). Both scales were reported in Catalanoet al. [2004] and have shown to have predictivevalidity with positive youth outcomes and problembehaviors. Academic achievement was measured byteacher ratings of child academic performance inreading, language arts, and math (a5 0.92).
Ninth-grade antisocial behaviors. Three pro-blem areas were assessed by the annual child in-person interview. Substance use was the averagefrequency of smoking, drinking, drinking to excess,and marijuana use in the past year (a5 0.86).Violent behavior was the average frequency offighting and hitting someone to hurt them (correla-tion between items5 0.54). Covert delinquency
282 Harachi et al.
Aggr. Behav. DOI 10.1002/ab

assessed frequency of shoplifting, stealing fromanother person, and breaking into buildings orhomes (a5 0.72).
Analyses
To determine the appropriateness of pooling theexperimental and control students in these analyses,tests were performed comparing students in theexperimental and control conditions with respect tothe relationships between predictor variables andaggression trajectory group membership and be-tween aggression trajectory group and ninth-gradeoutcomes. For each predictor variable and for bothboys and girls, multinomial regression models wererun that included experimental condition, thepredictor variable, and the interaction betweenthe two as predictors of group membership. Outof the 34 models examined (17 for both boys andgirls), the interaction term was significant at thePo0.05 level in three cases, but in none of thesecases did the overall direction of the associationbetween the predictor variable and aggressiontrajectory grouping differ for the experimental andcontrol conditions. Similarly, multinomial regres-sion models were also examined to test the interac-tion of experimental condition and groupmembership on ninth-grade outcomes. In one ofthe six models examined (three outcomes for bothboys and girls), the interaction term was significant,but again the associations differed by degree ratherthan direction across experimental groups. On thebasis of these analyses, the current study presentsresults of analyses that include students who were atschools that received the experimental interventionas well as students at control schools.The study analyses occurred in three phases. First,
an SGM strategy [Jones et al., 2001; Nagin, 1999;Nagin and Land, 1993; Nagin and Tremblay, 1999]was used to identify trajectories of students withingender based on teacher-reported aggressive beha-vior between Grades 2 and 8. SGM can model datawith non-normal distributions which are commonfor measures of problem behaviors. Here we usemodels based on an assumption of a censorednormal distribution that is suited for scales if asubstantial number of cases are at the zero point.SGM takes advantage of the time-ordered nature ofthe data and is able to include participants who donot have data at all time points, although werequired cases to have a minimum of two timepoints for these analyses. We selected the optimalmodel based on the Bayesian Information Criterion(BIC) [Kass and Raftery, 1995; Raftery, 1995];
theory and findings of prior research [Muthen,2003] were also considered. Based on the results ofthe mixture model, individual cases were assigned tothe trajectory group that best conformed to theirobserved behavior according to the maximumposterior probability of group membership. Groupmembership was then used as a variable in furtheranalyses.Second, we examined second-grade predictors of
aggression trajectory group membership. ANOVAand contingency tables were used to examine theoverall relationship between predictor variables andgroup membership. This is consistent with a riskfactor perspective that attempts to establish overallassociations as the first step toward identifyingpromising longitudinal predictors [Mrazek andHaggerty, 1994]. We also conducted logistic regres-sion models to assess salient predictors of targetedgroup comparisons operationalized as binary out-comes. For these models, demographic variableswere entered as a first block and then groups ofpredictor variables were entered separately bydomain. These models identify the unique associa-tions of predictors in the individual, family, andschool domains with aggression trajectorygroupings, controlling for demographic variables.For these logistic regression models, continuousmeasures of potential predictor variables weredichotomized (scores above the sample mean werecoded as ‘‘1,’’ scores below the mean coded as ‘‘0’’)for more easily interpretable results. Modelswith non-dichotomized independent measuresshowed a pattern of results consistent with modelswith dichotomized measures. Lastly, multinomialmodels containing all variables across domainwere examined.Because there were missing data on parent,
teacher, and child surveys at second grade, listwisedeletion for the logistic regression models wouldresult in losing up to 7% of cases. Following therecommendations of Graham et al. [2002] andSchafer and Graham [2002], an expectation-max-imization algorithm [Little and Rubin, 1987] andmultiple imputation were used to handle missingdata. Using SAS/STATs software, version 8.2.[SAS Institute 2002], 10 data files with completedata were imputed with the PROC MI procedure,logistic regression models were run for each data set,and PROC MIANALYZE was used to average theresults and compute standard errors adjusted forbetween and within variation.The third phase of our analyses examined the
relationships between trajectory group and ninth-grade drug use, violent behavior, and covert
283Aggressive Behavior Among Girls and Boys During Middle Childhood
Aggr. Behav. DOI 10.1002/ab
delinquency. One-way ANOVAs examined therelationship between trajectory group and ninth-grade behaviors.
RESULTS
Phase 1 Semiparametric Group Modeling ofAggression Trajectories
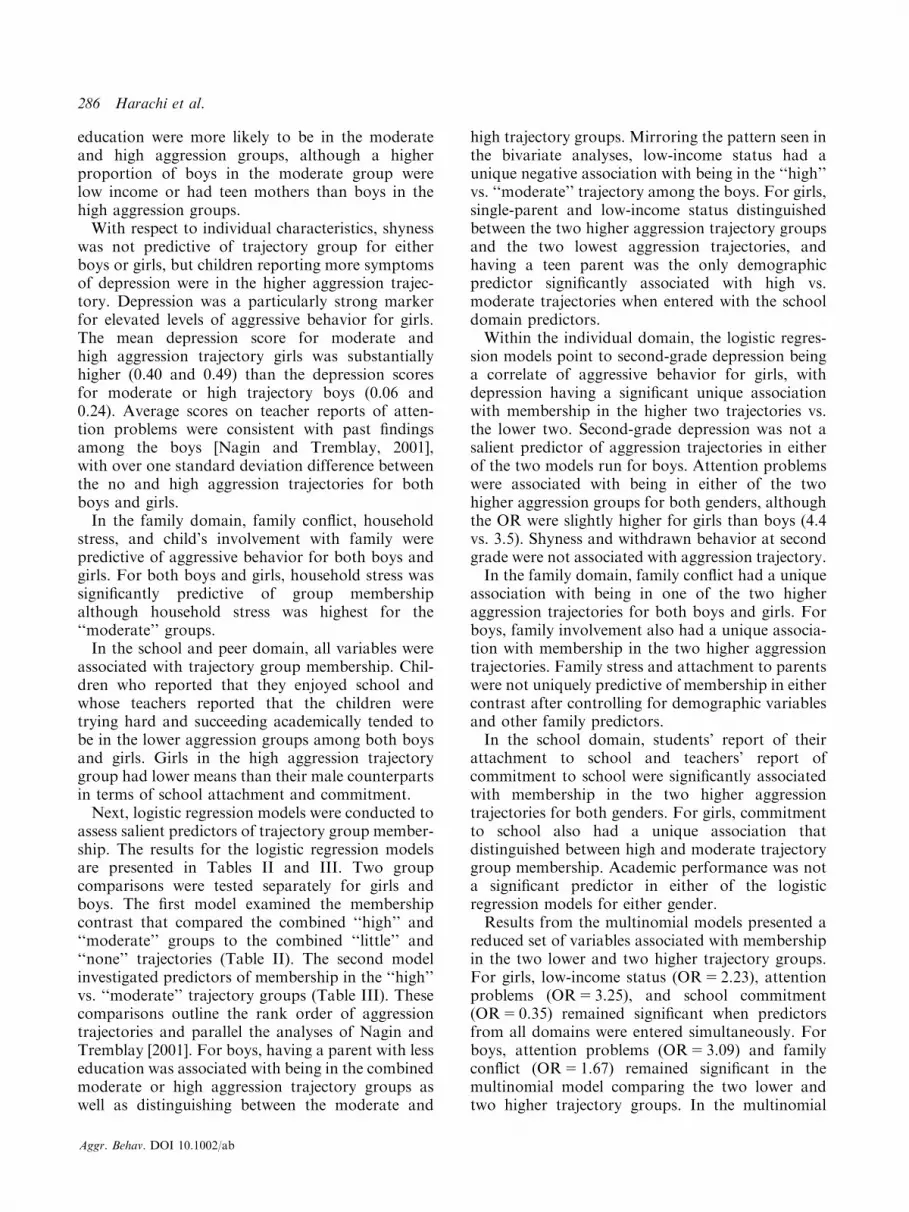
We examined one–to six-group SGM models forboth boys and girls, with each group’s trajectorydescribed by a second-order polynomial functioncontaining an intercept, linear slope, and quadraticterm. For boys, the four-group model had the bestfit, as indicated by the lowest absolute value for theBIC statistic. The trajectories for the four groups,with plots of both predicted and actual groupmeans, are shown in Figure 1. We labeled the fourgroups as ‘‘none,’’ ‘‘little,’’ ‘‘moderate,’’ and ‘‘high.’’Based on the BIC criteria alone, a three-groupmodel fit the data best for girls. However, thedifference in BICs between the three- and four-group models was small (3.83). The primarydifference between the three- and four-group modelswas due to the aggregation of the low and moderategroups found in the four-group model. Therefore,we chose to use the four-group model based on pastfindings by Cote et al. [2001]. In addition, bychoosing the four-group model for girls, analysesof predictors and later outcomes would parallelthose for boys, and there were sufficient girls in eachof the four groups for subsequent analyses. Sixty-two boys (11.9%) and 48 girls (10.4%) were in thehigh aggression trajectory group, 141 boys (27%)and 62 girls (13.4%) in the moderate, 218 boys(41.7%) and 147 girls (31.9%) in the low, and 102boys (19.5%) and 204 girls (44.3%) in the noaggression trajectory group (Fig. 2).
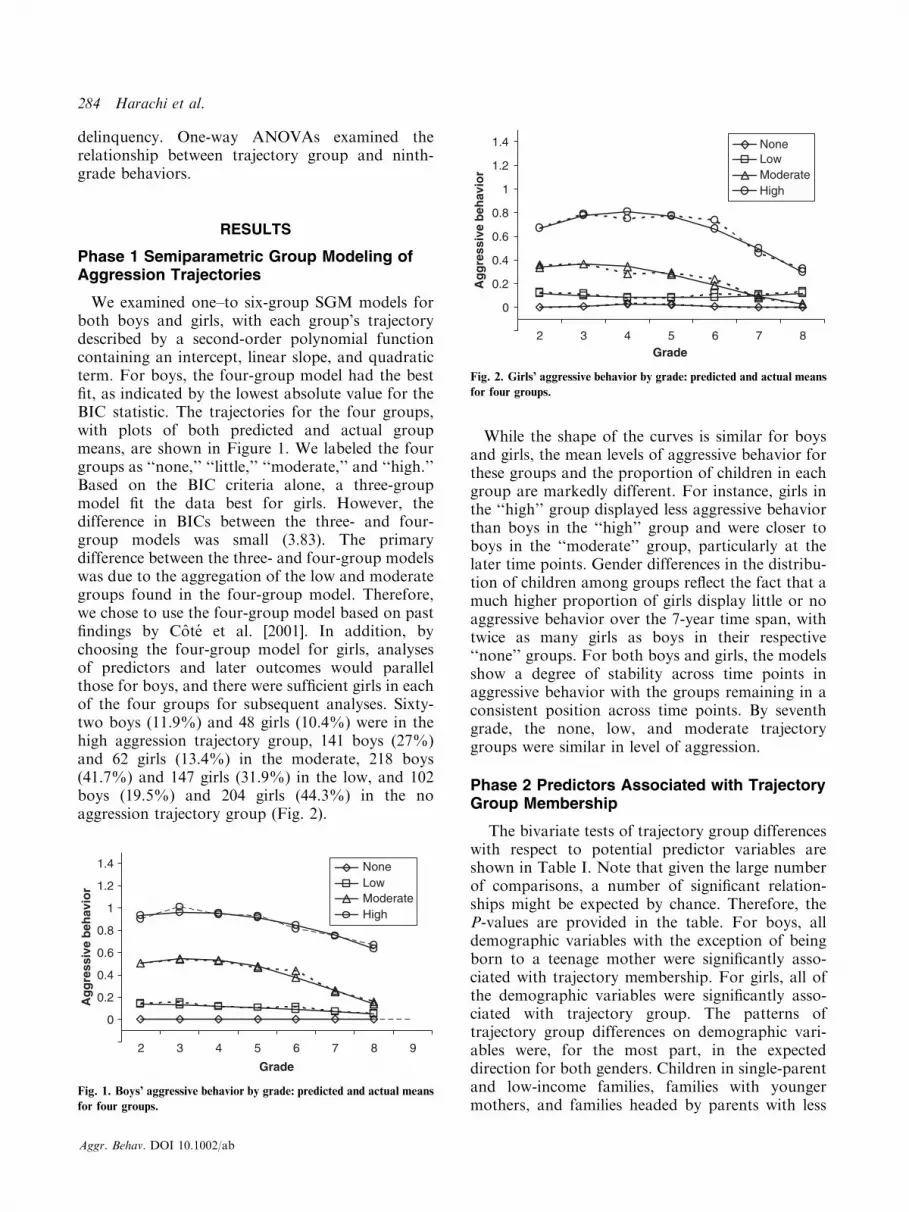
While the shape of the curves is similar for boysand girls, the mean levels of aggressive behavior forthese groups and the proportion of children in eachgroup are markedly different. For instance, girls inthe ‘‘high’’ group displayed less aggressive behaviorthan boys in the ‘‘high’’ group and were closer toboys in the ‘‘moderate’’ group, particularly at thelater time points. Gender differences in the distribu-tion of children among groups reflect the fact that amuch higher proportion of girls display little or noaggressive behavior over the 7-year time span, withtwice as many girls as boys in their respective‘‘none’’ groups. For both boys and girls, the modelsshow a degree of stability across time points inaggressive behavior with the groups remaining in aconsistent position across time points. By seventhgrade, the none, low, and moderate trajectorygroups were similar in level of aggression.
Phase 2 Predictors Associated with TrajectoryGroup Membership
The bivariate tests of trajectory group differenceswith respect to potential predictor variables areshown in Table I. Note that given the large numberof comparisons, a number of significant relation-ships might be expected by chance. Therefore, theP-values are provided in the table. For boys, alldemographic variables with the exception of beingborn to a teenage mother were significantly asso-ciated with trajectory membership. For girls, all ofthe demographic variables were significantly asso-ciated with trajectory group. The patterns oftrajectory group differences on demographic vari-ables were, for the most part, in the expecteddirection for both genders. Children in single-parentand low-income families, families with youngermothers, and families headed by parents with less
0
0.2
0.4
0.6
0.8
1
1.2
1.4
2 3 4 5 6 7 8 9
Grade
Ag
gre
ssiv
e b
ehav
ior
NoneLowModerateHigh
Fig. 1. Boys’ aggressive behavior by grade: predicted and actual means
for four groups.
0
0.2
0.4
0.6
0.8
1
1.2
1.4
2 3 4 5 6 7 8Grade
Ag
gre
ssiv
e b
ehav
ior
NoneLowModerateHigh
Fig. 2. Girls’ aggressive behavior by grade: predicted and actual means
for four groups.
284 Harachi et al.
Aggr. Behav. DOI 10.1002/ab

TABLE I. Association Between Predictor Variables Measured at Second Grade and Trajectory Group Membership for Boys
(n5 523) and Girls (n5 461)
None Little Moderate High(n5 102) (n5 218) (n5 141) (n5 62)
(n5 204) (n5 147) (n5 62) (n5 48)
Boys/Girls (%) (%) (%) (%) X2 P
Demographic variables
Single-parent family
Boys 18.8a,b,c 31.6a 37.0b 43.1c 12.99 o0.01
Girls 21.9a,b,c 31.9a,d 43.3b 55.6c,d 24.30 o0.001
Low income
Boys 12.9a 18.0b 31.1a,b 20.7 13.58 o0.01
Girls 12.8a,b,c 21.5a,d 33.3b 44.4c,d 27.83 o0.001
Teen mother
Boys 7.9a 9.3b 17.4a,b 11.3 7.03 0.07
Girls 11.4a 13.1b 11.7c 29.2a,b,c 10.70 0.01
None
m (sd)
Little
m (sd)
Moderate
m (sd)
High
m (sd) F P
Parent education
Boys 0.26a (1.15) 0.03b (0.99) �0.04 (0.99)c �0.57a,b,c (0.82) 9.21 0.001
Girls 0.21a (0.96) �0.07 (0.92) 0.04 (0.93) �0.35a (1.00) 5.47 0.001
Individual domain
Depression
Boys �0.27a (0.88) 0.02 (0.93) 0.05 (0.96) 0.23a (1.02) 4.11 0.007
Girls �0.31a,b,c (0.95) 0.10a (1.01) 0.40b (1.17) 0.49c (1.08) 13.54 0.000
Shy/withdrawn
Boys 0.02 (0.94) 0.02 (1.01) 0.06 (1.03) 0.24 (1.01) 0.84 0.472
Girls �0.05 (1.03) �0.15 (0.94) �0.09 (0.95) 0.22 (1.13) 1.62 0.184
Attention problems
Boys �0.368a,b,c (0.83) 0.10a,d,e (0.98) 0.53b,d (0.85) 0.83c,e (0.95) 29.18 0.001
Girls �0.65a,b,c (0.78) �0.14a,d,e (0.88) 0.42b,d (0.92) 0.39
c,e (1.03) 35.44 0.001
Family domain
Family conflict
Boys �0.04 (0.97) �0.01 (0.99) 0.19 (1.08) 0.38 (0.97) 3.27 0.021
Girls �0.23 (0.89) �0.04 (0.97) 0.05 (1.18) 0.23 (1.08) 3.52 0.015
Household stress
Boys �0.23a (0.94) �0.09 (0.89) 0.16a (1.04) 0.05 (1.09) 3.46 0.016
Girls �0.07a (0.94) �0.01 (0.99) 0.41a (1.24) 0.18 (1.14) 3.87 0.009
Attachment of child to parents
Boys 0.16 (0.90) �0.08 (1.06) �0.22 (1.02) �0.09 (1.03) 2.61 0.051
Girls 0.17 (0.86) 0.02 (1.05) �0.09 (1.10) 0.01 (1.03) 1.36 0.255
Involvement with family
Boys 0.21a (0.92) �0.01 (0.98) �0.17a (1.04) �0.23 (1.04) 3.77 0.011
Girls 0.21a (0.94) �0.01 (0.93) �0.13 (1.13) �0.27a (1.10) 4.22 0.006
School & peer domain
Attachment to school
Boys 0.22a (0.73) �0.08 (1.04) �0.25a (1.17) �0.19 (1.00) 4.47 0.004
Girls 0.31a (0.79) 0.05 (0.93)b �0.04 (1.12) �0.45a,b (1.22) 9.28 0.001
Commitment to school
Boys 0.39a,b,c (0.80) �0.11a,d,e (0.95) �0.44b,d (0.98) �0.59c,e (1.15) 19.44 0.001
Girls 0.58a,b,c (0.72) 0.07a,d (1.02) �0.30b (1.06) �0.61c,d (0.75) 33.10 0.001
Academic performance
Boys 0.23a,b (0.92) 0.03 (1.02) �0.18a (0.98) �0.29b (0.98) 5.20 0.002
Girls 0.24a (0.96) �0.06 (1.00) �0.08 (1.04) �0.39a (0.98) 6.49 0.001
Note: m5mean, sd5 standard deviation; standardized scores (mean5 0, SD5 1) were computed for all continuous measures. Across trajectorygroups within gender, means with the same superscript are significantly different from one another (Po.05). Across gender within trajectorygroups, means in bold are significantly different from one another (Po0.05).
285Aggressive Behavior Among Girls and Boys During Middle Childhood
Aggr. Behav. DOI 10.1002/ab
education were more likely to be in the moderateand high aggression groups, although a higherproportion of boys in the moderate group werelow income or had teen mothers than boys in thehigh aggression groups.With respect to individual characteristics, shyness
was not predictive of trajectory group for eitherboys or girls, but children reporting more symptomsof depression were in the higher aggression trajec-tory. Depression was a particularly strong markerfor elevated levels of aggressive behavior for girls.The mean depression score for moderate andhigh aggression trajectory girls was substantiallyhigher (0.40 and 0.49) than the depression scoresfor moderate or high trajectory boys (0.06 and0.24). Average scores on teacher reports of atten-tion problems were consistent with past findingsamong the boys [Nagin and Tremblay, 2001],with over one standard deviation difference betweenthe no and high aggression trajectories for bothboys and girls.In the family domain, family conflict, household
stress, and child’s involvement with family werepredictive of aggressive behavior for both boys andgirls. For both boys and girls, household stress wassignificantly predictive of group membershipalthough household stress was highest for the‘‘moderate’’ groups.In the school and peer domain, all variables were
associated with trajectory group membership. Chil-dren who reported that they enjoyed school andwhose teachers reported that the children weretrying hard and succeeding academically tended tobe in the lower aggression groups among both boysand girls. Girls in the high aggression trajectorygroup had lower means than their male counterpartsin terms of school attachment and commitment.Next, logistic regression models were conducted to
assess salient predictors of trajectory group member-ship. The results for the logistic regression modelsare presented in Tables II and III. Two groupcomparisons were tested separately for girls andboys. The first model examined the membershipcontrast that compared the combined ‘‘high’’ and‘‘moderate’’ groups to the combined ‘‘little’’ and‘‘none’’ trajectories (Table II). The second modelinvestigated predictors of membership in the ‘‘high’’vs. ‘‘moderate’’ trajectory groups (Table III). Thesecomparisons outline the rank order of aggressiontrajectories and parallel the analyses of Nagin andTremblay [2001]. For boys, having a parent with lesseducation was associated with being in the combinedmoderate or high aggression trajectory groups aswell as distinguishing between the moderate and
high trajectory groups. Mirroring the pattern seen inthe bivariate analyses, low-income status had aunique negative association with being in the ‘‘high’’vs. ‘‘moderate’’ trajectory among the boys. For girls,single-parent and low-income status distinguishedbetween the two higher aggression trajectory groupsand the two lowest aggression trajectories, andhaving a teen parent was the only demographicpredictor significantly associated with high vs.moderate trajectories when entered with the schooldomain predictors.Within the individual domain, the logistic regres-
sion models point to second-grade depression beinga correlate of aggressive behavior for girls, withdepression having a significant unique associationwith membership in the higher two trajectories vs.the lower two. Second-grade depression was not asalient predictor of aggression trajectories in eitherof the two models run for boys. Attention problemswere associated with being in either of the twohigher aggression groups for both genders, althoughthe OR were slightly higher for girls than boys (4.4vs. 3.5). Shyness and withdrawn behavior at secondgrade were not associated with aggression trajectory.In the family domain, family conflict had a unique
association with being in one of the two higheraggression trajectories for both boys and girls. Forboys, family involvement also had a unique associa-tion with membership in the two higher aggressiontrajectories. Family stress and attachment to parentswere not uniquely predictive of membership in eithercontrast after controlling for demographic variablesand other family predictors.In the school domain, students’ report of their
attachment to school and teachers’ report ofcommitment to school were significantly associatedwith membership in the two higher aggressiontrajectories for both genders. For girls, commitmentto school also had a unique association thatdistinguished between high and moderate trajectorygroup membership. Academic performance was nota significant predictor in either of the logisticregression models for either gender.Results from the multinomial models presented a
reduced set of variables associated with membershipin the two lower and two higher trajectory groups.For girls, low-income status (OR5 2.23), attentionproblems (OR5 3.25), and school commitment(OR5 0.35) remained significant when predictorsfrom all domains were entered simultaneously. Forboys, attention problems (OR5 3.09) and familyconflict (OR5 1.67) remained significant in themultinomial model comparing the two lower andtwo higher trajectory groups. In the multinomial
286 Harachi et al.
Aggr. Behav. DOI 10.1002/ab

models contrasting high and moderate trajectorygroup membership, the two variables from theindividual model results remained significant forgirls. Having a teen mother (OR5 4.11) and poor
school commitment (OR5 0.23) distinguished thetwo groups among the girls. In the multinomialmodel for boys, only low parental education(OR5 0.27) remained significant.
TABLE II. Odds Ratio and 95% Confidence Intervals for Logistic Regression Models Predicting Membership Contrasting Two
Higher Aggression vs. Two Lower Aggression Trajectory Groups
Demographic
variables only
Demographic with
individual domain variables
Demographic with family
domain variables
Demographic with
school domain variables
Odds ratio 95% CI Odds ratio 95% CI Odds ratio 95% CI Odds ratio 95% CI
Demographic
Teen mom
Boys 1.51 (0.86–2.65) 1.77 (0.99–3.15) 1.55 (0.87–2.75) 1.41 (0.78–2.53)
Girls 1.38 (0.74–2.58) 1.45 (0.77–2.73) 1.53 (0.79–2.96) 1.50 (0.78–2.89)
High parent education
Boys 0.68� (0.47–0.98) 0.70 (0.48–1.02) 0.74 (0.51–1.09) 0.76 (0.52–1.12)
Girls 0.81 (0.51–1.27) 0.79 (0.50–1.25) 0.95 (0.58–1.54) 1.00 (0.62–1.62)
Single parent
Boys 1.40 (0.92–2.13) 1.19 (0.76–1.85) 1.38 (0.90–2.13) 1.47 (0.95–2.28)
Girls 1.89� (1.14–3.14) 1.73� (1.02–2.94) 1.69 (0.98–2.92) 1.36 (0.79–2.37)
Low income
Boys 1.53 (0.95–2.46) 1.47 (0.90–2.42) 1.42 (0.87–2.33) 1.40 (0.85–2.30)
Girls 2.17�� (1.26–3.74) 2.20� (1.25–3.86) 2.08� (1.15–2.75) 2.04� (1.14–3.64)
Individual domain
Depressed
Boys 1.39 (0.95–2.05)
Girls 2.01�� (1.25–3.25)
Shy/withdrawn
Boys 0.86 (0.58–1.28)
Girls 0.76 (0.45–1.29)
Attention problems
Boys 3.49�� (2.34–5.20)
Girls 4.40�� (2.67–7.27)
Family domain
High family conflict
Boys 1.60� (1.09–2.35)
Girls 1.68� (1.03–2.73)
High family stress
Boys 1.38 (0.94–2.02)
Girls 1.02 (0.62–1.65)
High attachment to parents
Boys 0.87 (0.59–1.27)
Girls 0.89 (0.55–1.43)
High involvement
Boys 0.63� (0.44–0.92)
Girls 0.80 (0.50–1.26)
School domain
High attachment to school
Boys 0.67� (0.46–0.98)
Girls 0.52� (0.31–0.87)
High commitment to school
Boys 0.52�� (0.34–0.78)
Girls 0.23�� (0.14–0.40)
High academic
Boys 0.94 (0.63–1.40)
Girls 1.15 (0.67–1.95)
Note: Continuous measures of predictor variables were dichotomized (scores above the sample mean were coded as ‘‘1,’’ scores below the meancoded as ‘‘0’’) to make more easily interpretable results; *5Po0.05 and **5Po0.01.
287Aggressive Behavior Among Girls and Boys During Middle Childhood
Aggr. Behav. DOI 10.1002/ab

Phase 3 Trajectory Group MembershipPredicting Ninth-Grade Antisocial Behaviors
Self-reports of antisocial behavior in ninth gradewere significantly associated with group membership
for both genders (see Table IV). For boys, the
relationships between trajectory membership and
problem behaviors was unequivocal, with boys
in the higher aggression trajectories reporting
TABLE III. Odds Ratio and 95% Confidence Intervals of Logistic Regression Models Predicting Membership in High Aggression
vs. Moderate Aggression Trajectory Groups (Boys n5 203; Girls n5 110)
Demographic
variables only
Demographic with
individual domain variables
Demographic with
family domain variables
Demographic with
school domain variables
Odds ratio 95% CI Odds ratio 95% CI Odds ratio 95% CI Odds ratio 95% CI
Demographic
Teen mom
Boys 0.52 (0.20–1.36) 0.56 (0.21–1.52) 0.51 (0.20–1.34) 0.51 (0.19–1.35)
Girls 2.67 (0.92–7.70) 3.14 (0.98–9.99) 3.57� (1.04–12.24) 2.32 (0.76–7.06)
High parent education
Boys 0.34�� (0.17–0.67) 0.31�� (0.16–0.63) 0.33�� (0.16–0.67) 0.32 (0.16–0.65)
Girls 0.51 (0.23–1.14) 0.46 (0.20–1.09) 0.52 (0.22–1.24) 0.50 (0.22–1.17)
Single parent
Boys 1.98 (0.98–4.03) 1.94 (0.93–4.04) 2.06 (0.98–4.30) 1.99 (0.95–4.16)
Girls 1.69 (0.69–4.12) 1.57 (0.61–4.01) 1.40 (0.54–3.64) 1.83 (0.73–4.56)
Low income
Boys 0.38� (0.17–0.85) 0.43� (0.19–0.97) 0.39� (0.17–0.86) 0.37 (0.16–0.84)
Girls 1.29 (0.52–3.24) 1.39 (0.53–3.65) 1.55 (0.54–4.47) 1.29 (0.51–3.28)
Individual domain
Depressed
Boys 1.41 (0.74–2.69)
Girls 1.26 (0.54–2.94)
Shy/withdrawn
Boys 1.65 (0.86–3.17)
Girls 1.85 (0.75–4.56)
Attention problems
Boys 1.45 (0.68–3.07)
Girls 0.76 (0.30–1.89)
Family domain
High family conflict
Boys 1.69 (0.86–3.34)
Girls 2.19 (0.88–5.48)
High family stress
Boys 0.73 (0.37–1.42)
Girls 0.54 (0.22–1.32)
High attachment to parents
Boys 1.31 (0.69–2.49)
Girls 1.24 (0.50–3.08)
School domain
High involvement
Boys 1.04 (0.54–1.98)
Girls 1.04 (0.45–2.40)
High attachment to school
Boys 1.03 (0.54–1.94)
Girls 0.46 (0.19–1.12)
High commitment to school
Boys 1.24 (0.58–2.62)
Girls 0.26� (0.08–0.83)
High academic
Boys 0.94 (0.47–1.86)
Girls 1.33 (0.48–3.68)
Note: Continuous measures of predictor variables were dichotomized (scores above the sample mean were coded as ‘‘1,’’ scores below the meancoded as ‘‘0’’) to make for more easily interpretable results; *5Po0.05 and **5Po0.01.
288 Harachi et al.
Aggr. Behav. DOI 10.1002/ab
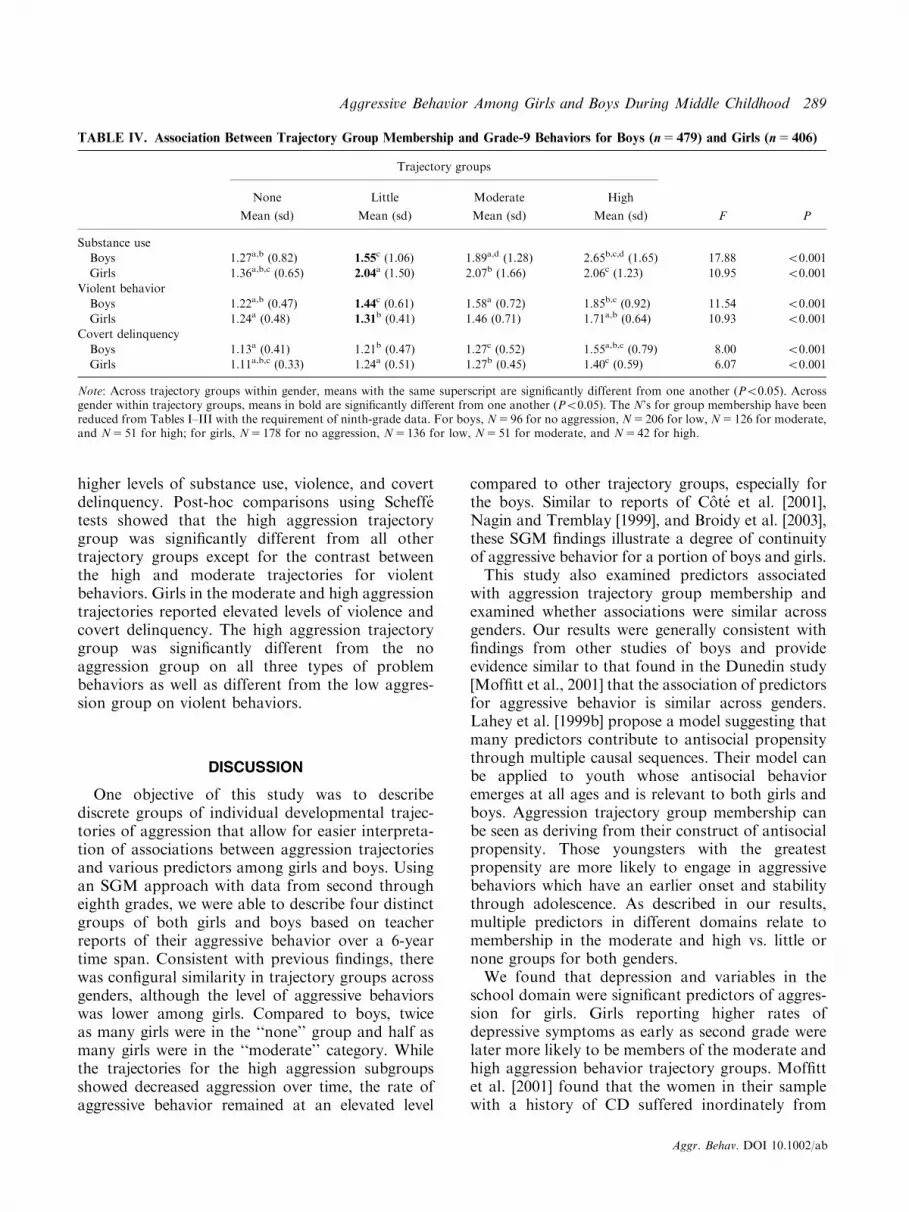
higher levels of substance use, violence, and covertdelinquency. Post-hoc comparisons using Scheffetests showed that the high aggression trajectorygroup was significantly different from all othertrajectory groups except for the contrast betweenthe high and moderate trajectories for violentbehaviors. Girls in the moderate and high aggressiontrajectories reported elevated levels of violence andcovert delinquency. The high aggression trajectorygroup was significantly different from the noaggression group on all three types of problembehaviors as well as different from the low aggres-sion group on violent behaviors.
DISCUSSION
One objective of this study was to describediscrete groups of individual developmental trajec-tories of aggression that allow for easier interpreta-tion of associations between aggression trajectoriesand various predictors among girls and boys. Usingan SGM approach with data from second througheighth grades, we were able to describe four distinctgroups of both girls and boys based on teacherreports of their aggressive behavior over a 6-yeartime span. Consistent with previous findings, therewas configural similarity in trajectory groups acrossgenders, although the level of aggressive behaviorswas lower among girls. Compared to boys, twiceas many girls were in the ‘‘none’’ group and half asmany girls were in the ‘‘moderate’’ category. Whilethe trajectories for the high aggression subgroupsshowed decreased aggression over time, the rate ofaggressive behavior remained at an elevated level
compared to other trajectory groups, especially forthe boys. Similar to reports of Cote et al. [2001],Nagin and Tremblay [1999], and Broidy et al. [2003],these SGM findings illustrate a degree of continuityof aggressive behavior for a portion of boys and girls.This study also examined predictors associated
with aggression trajectory group membership andexamined whether associations were similar acrossgenders. Our results were generally consistent withfindings from other studies of boys and provideevidence similar to that found in the Dunedin study[Moffitt et al., 2001] that the association of predictorsfor aggressive behavior is similar across genders.Lahey et al. [1999b] propose a model suggesting thatmany predictors contribute to antisocial propensitythrough multiple causal sequences. Their model canbe applied to youth whose antisocial behavioremerges at all ages and is relevant to both girls andboys. Aggression trajectory group membership canbe seen as deriving from their construct of antisocialpropensity. Those youngsters with the greatestpropensity are more likely to engage in aggressivebehaviors which have an earlier onset and stabilitythrough adolescence. As described in our results,multiple predictors in different domains relate tomembership in the moderate and high vs. little ornone groups for both genders.We found that depression and variables in the
school domain were significant predictors of aggres-sion for girls. Girls reporting higher rates ofdepressive symptoms as early as second grade werelater more likely to be members of the moderate andhigh aggression behavior trajectory groups. Moffittet al. [2001] found that the women in their samplewith a history of CD suffered inordinately from
TABLE IV. Association Between Trajectory Group Membership and Grade-9 Behaviors for Boys (n5 479) and Girls (n5 406)
Trajectory groups
None Little Moderate High
Mean (sd) Mean (sd) Mean (sd) Mean (sd) F P
Substance use
Boys 1.27a,b (0.82) 1.55c (1.06) 1.89a,d (1.28) 2.65b,c,d (1.65) 17.88 o0.001
Girls 1.36a,b,c (0.65) 2.04a (1.50) 2.07b (1.66) 2.06c (1.23) 10.95 o0.001
Violent behavior
Boys 1.22a,b (0.47) 1.44c (0.61) 1.58a (0.72) 1.85b,c (0.92) 11.54 o0.001
Girls 1.24a (0.48) 1.31b (0.41) 1.46 (0.71) 1.71a,b (0.64) 10.93 o0.001
Covert delinquency
Boys 1.13a (0.41) 1.21b (0.47) 1.27c (0.52) 1.55a,b,c (0.79) 8.00 o0.001
Girls 1.11a,b,c (0.33) 1.24a (0.51) 1.27b (0.45) 1.40c (0.59) 6.07 o0.001
Note: Across trajectory groups within gender, means with the same superscript are significantly different from one another (Po0.05). Acrossgender within trajectory groups, means in bold are significantly different from one another (Po0.05). The N’s for group membership have beenreduced from Tables I–III with the requirement of ninth-grade data. For boys, N5 96 for no aggression, N5 206 for low, N5 126 for moderate,and N5 51 for high; for girls, N5 178 for no aggression, N5 136 for low, N5 51 for moderate, and N5 42 for high.
289Aggressive Behavior Among Girls and Boys During Middle Childhood
Aggr. Behav. DOI 10.1002/ab
depression. However, their results suggest thatdepression did not precede conduct problems butemerged subsequently. Their data rely on teachers’and parents’ reports of internalizing problems at theyounger age, while our data use child self-report ofdepression. It is unclear if their finding thatdepression did not precede CD was an artifact ofteachers and parents reporting rather than use ofchild self-report. Another important finding fromthe current study was the association of school-related constructs with membership in the moderateand high aggression groups among girls. Whileattachment and commitment to school were nega-tively associated with aggressive behavior for bothgenders, the high aggression girls reported lowermeans on both scale scores suggesting a greaterdegree of disenfranchisement in the school settings.Jellinek and Snyder [1998] suggested that feelings ofsadness among school-aged children may reflect notonly a reaction to external disappointments but alsomay be a response to a sense of disappointment withthemselves. A school-age child’s self-image is pre-dicated in part on praise and positive interactionsderived from socialization at school. The highaggression subgroup of girls identified by theseresults may be beginning a self-sustaining cycle ofrejection and negative sense of self and may be atsubsequent risk for a number of clinically mean-ingful difficulties. Moffitt et al. [2001] suggested thatantisocial girls are more likely to develop relation-ships with antisocial peers that contribute to thepersistence of antisocial behavior into adulthood.The early indicators of school disenfranchisementfound in this study may contribute to greaterantisocial peer involvement in adolescence.Several variables distinguished between the two
combined higher trajectories and the combinedlower trajectories of aggressive behavior. Thelogistic regression results showed both similaritiesand differences across genders. Among the boys,those with more attention problems, family conflict,less family involvement, lower school commitmentand attachment, and lower parent education tendedto be in the two higher aggression groups. Thesefindings replicate those of Moffitt et al. [2001] whofound that family adversity, hyperactivity, andcompromised intelligence were related to boys’antisocial behavior. Our results further affirm thiswith attention problems and family conflict remain-ing significant when all domains were enteredsimultaneously. While our study did not assessintelligence, lower school commitment and attach-ment may in part be a by-product of reduced skilland capacity. In contrast to findings by Nagin and
Tremblay [2001], having a teen mother did notsignificantly predict membership in the high aggres-sion groups. Among the girls, those with moreattention problems, depression, family conflict,lower commitment and attachment to school, lowerincome, and single-parent status were more likely tobe in the two higher aggression groups. Whenentered together, more attention problems, lowercommitment to school, and lower income remainedsignificant in distinguishing the higher groups. Thus,attention problems, family conflict, and low schoolcommitment and attachment were common predic-tors for boys and girls; while low family involvementand lower parental education were unique predictorsof being in the two high trajectory groups for boys;and depression, low income, and single-parent statuswere predictors for girls.For the predictions of membership in the moderate
vs. high aggression trajectory groups, only parentaleducation and family income were significant forboys and low school commitment and having a teenmother were significant predictors for girls. Many ofthe known predictors of aggression were not able todistinguish between the most aggressive individualsand those moderately aggressive which may be afunction of the smaller sizes of these groups. The lackof discrimination between the high and moderategroups may also suggest that events occurring aftersecond grade, including changes in family situation,school, and peer group are more predictive ofdesistance. Subsequent investigations should examinetime-varying predictors that occur throughout middlechildhood and early adolescence. The identificationof these predictors could be particularly informativein developing interventions effective in enhancingdesistance and offsetting a trajectory which may leadto adverse adult outcomes.Our results support previous research from Cote
and others [Cote et al., 2001; Loeber and Farring-ton, 2000] that demonstrates a stability of problembehaviors from elementary school into adolescencefor both genders. Group membership in the highaggression trajectory was associated with higherrates of later substance use, violent behaviors, andcovert delinquency. Approximately 10–12% of thegirls and boys in the sample appear to be on atrajectory of high aggression leading to othernegative consequences as they transition into highschool and late adolescence. Elliott [1994] andMoffitt [1993] found that the continuity of offendingamong serious and chronic offenders begins early inlife and extends into adolescence and adulthood.Continued examination is necessary to determinewhether membership in the high aggression trajec-
290 Harachi et al.
Aggr. Behav. DOI 10.1002/ab

tory group reflects membership in the life coursepersistent category defined within Moffitt’s [1993]typology as individuals who onset aggression inchildhood and display a persistent, stable patternof aggression as they grow into adulthood [Whiteet al., 2001].The findings of our study suggest that there are
distinct groups of boys and girls who displayaggressive behavior throughout elementary andmiddle school. While some have argued that girlstend to display more covert aggressive behaviors,over 10% of the girls were rated consistently byteachers over a 7-year period as exhibiting higherrates of these behaviors in comparison to their peers.Further, the trajectories of the high aggressiongroup for both boys and girls have some degree ofstability, with membership in the high grouppredicting greater involvement in problem behaviorsin ninth grade. Particularly notable was the fact thatfor girls, despite the decreasing level of aggression inall four groups and lower mean levels of aggressionthan the boys’ trajectory groups, the initial highaggression behavior group continued involvement inviolent behavior and covert delinquency in ninthgrade. Arguments have been made that the diag-nostic criteria for CD should be relaxed for girls[Zoccolillo, 1993], while others report that the datado not support relaxation [Moffitt et al., 2001]. Ourdata suggest that the relevance may not be therelative comparison of boys and girls, but withingender comparison. Trajectory group membership,on the other hand, did not predict substance useamong the girls as the low, moderate, and highaggression groups did not differ from each other intheir levels of substance use in the ninth grade. Thisfinding is consistent with reviews of predictors ofsubstance use. For example, Hawkins et al. [1992]reported that early aggressive behavior predictedlater substance use for boys but not girls [see alsoWhite and Hansell, 1996]. It is notable that girls inour sample reported higher mean scores on drug useamong the no, little, and moderate aggressiongroups in contrast to their male counterparts thoughthere were only significant differences between boysand girls in the little aggression group. WhileSloboda and David [1997] note a convergence ofprevalence rates for drug use among boys and girlsages 12–17 during the 1990s, it will be useful toinvestigate whether this pattern persists in the 21stcentury and to investigate whether the high aggres-sion group continues to suffer multiple negativeconsequences throughout adolescence.Loeber and Hay [1997] point to critical periods of
development for diminishing aggressive behavior,
including the transition from preschool to theelementary school years. Our findings support theneed to recognize that interventions during earliercritical periods may have proportionally greatertreatment effects. For example, treatments for CDare less effective than treatments for oppositionaldefiance disorder [Loeber et al., 1991]. Yet, ques-tions have been raised about the ability to diagnoseODD and CD, especially among girls [Zoccolilloet al., 1996], and the low positive predictive power ofODD leading to CD among boys [Hinshaw andAnderson, 1996; Loeber et al., 1993; O’Connor,2002]. Our findings suggest that assessments ofvarious predictors and aggressive behaviors atsecond grade can provide information for both girlsand boys likely to be in the moderate and highaggression trajectory groups. Given the stability,particularly of the high aggression trajectory groupsthrough to ninth grade, it appears prudent toprovide intervention alternatives in early elementaryschool. Interventions which target aggressive beha-viors, increase school commitment and attachment,and address attention problems and family conflictin early elementary school may effectively changethe trajectories of these children.While the study overall maintained a high
completion rate, one must note a possible limitationof the study regarding attrition at ninth grade.Students in low-income status families and boys inthe high aggression trajectory group were morelikely to be missing data at ninth grade. Based onexisting literature regarding poverty as a risk factorfor delinquency and drug use [Robins and Ratcliff,1979], it seems likely that the relationships foundamong trajectory group membership and ninth-grade problem behaviors may be of an even largermagnitude had those students been included in thelater analyses. Similarly, having lost a slightlygreater percentage of high aggressive boys (17.8%or 11 boys) may have also attenuated these findings.
ACKNOWLEDGMENTS
The authors thank Dr. Todd I. Herrenkohl for hisreview of an earlier draft of this manuscript. Anearlier version of this paper was presented at theSociety for Prevention Research annual meeting,June 12–14, 2003 in Washington, DC.
REFERENCES
Achenbach TM. 1991. ‘‘Manual for the Teacher’s Report Form and
1991 Profile.’’ Burlington: University of Vermont Department of
Psychiatry.
291Aggressive Behavior Among Girls and Boys During Middle Childhood
Aggr. Behav. DOI 10.1002/ab

Atkins MS, McKay MM, Talbott E, Arvanitis P. 1996. DSM-IV
diagnosis of conduct disorder and oppositional defiant disorder:
Implications and guidelines for school mental health teams. Sch
Psychol Rev 25:274–283.
Block J, Block JH, Keyes S. 1988. Longitudinally foretelling drug
usage in adolescence: Early childhood personality and environ-
mental precursors. Child Dev 59:336–355.
Broidy LM, Nagin DS, Tremblay RE, Bates JE, Brame B,
Dodge KA, Fergusson D, Horwood JL, Loeber R, Laird R,
Lynam DR, Moffitt TE, Pettit GS, Vitaro F. 2003. Develop-
mental trajectories of childhood disruptive behaviors and
adolescent delinquency: A six-site, cross-national study. Dev
Psychol 39:222–245.
Brook JS, Whiteman M, Cohen P, Shapiro J, Balka E. 1995.
Longitudinally predicting late adolescent and young adult drug
use: Childhood and adolescent precursors. J Am Acad Child
Adoles Psychiatry 34:1230–1238.
Campbell SB, Ewing LJ. 1990. Follow-up of hard-to-manage
preschoolers: Adjustment at age 9 and predictors of continuing
symptoms. J Child Psychol Psychiatry 31:871–889.
Catalano RF, Oxford ML, Harachi TW, Abbott RD, Haggerty KP.
1999. A test of the social development model to predict problem
behaviour during the elementary school period. Crim Behav
Ment Health 9:39–56.
Catalano RF, Mazza JJ, Harachi TW, Abbott RD, Haggerty KP,
Fleming CB. 2003. Raising healthy children through enhancing
social development in elementary school: Results after 1.5 years.
J Sch Psychol 41:143–164.
Catalano RF, Haggerty KP, Oesterle S, Fleming CB, Hawkins JD.
2004. The importance of bonding to school for healthy
development: Findings from the Social Development Research
Group. J Sch Health 74:252–261.
Cote S, Zoccolillo M, Tremblay RE, Nagin D, Vitaro F. 2001.
Predicting girls’ conduct disorder in adolescence from childhood
trajectories of disruptive behaviors. J Am Acad Child Adoles
Psychiatry 40:678–684.
Elliott DS. 1994. ‘‘Youth Violence: An Overview.’’ Boulder, CO:
Center for the Study of Prevention of Violence.
Ensminger ME, Kellam SG, Rubin BR. 1983. School and family
origins of delinquency: Comparisons by sex. In Van Dusen KT,
Mednick SA (eds): ‘‘Prospective Studies of Crime and Delin-
quency.’’ Boston: Kluwer-Nijhoff, pp 73–97.
Ensminger ME, Brown CH, Kellam SG. 1984. Social control as an
explanation of sex differences in substance use among adoles-
cents. NIDA Research Monograph: Problems of drug depen-
dence, 1983. Proceedings of the 45th Annual Scientific Meeting of
the College on Problems of Drug Dependence, Inc. 49:296–304.
Ensminger ME, Juon HS, Fothergill KE. 2002. Childhood and
adolescent antecedents of substance use in adulthood. Addiction
97:833–844.
Fleming CB, Catalano RF, Oxford ML, Harachi TW. 2002. A test of
generalizability of the social development model across gender
and income groups with longitudinal data from the elementary
school developmental period. J Quant Criminol 18:423–439.
Graham JW, Cumsille PE, Elek-Fisk E. 2002. Methods for handling
missing data. In Schinka JA, Velicer WF, Weiner IB (eds):
‘‘Handbook of Psychology, Research Methods in Psychology,’’
Vol. 2. New York: John Wiley & Sons, pp 87–114.
Greenberg MT, Kusche CA. 1990. ‘‘Manual for Seattle Personality
Scale for Children (Revised).’’ Seattle, WA: University of
Washington.
Haggerty KP, Catalano RF, Harachi TW, Abbott RD. 1998.
Description de l’implementation d’un programme de prevention
des problemes de comportement a l’adolescence. (Preventing
adolescent problem behaviors: A comprehensive intervention
description). Criminologie 31:25–47.
Harachi TW, Abbott RD, Catalano RF, Haggerty KP, Fleming CB.
1999. Opening the black box: Using process evaluation measures
to assess implementation and theory building. Am J Community
Psychol 27:711–731.
Hawkins JD, Catalano RF, Miller JY. 1992. Risk and protective
factors for alcohol and other drug problems in adolescence and
early adulthood: Implications for substance-abuse prevention.
Psychol Bull 112:64–105.
Hawkins JD, Herrenkohl T, Farrington DP, Brewer D, Catalano
RF, Harachi TW. 1998. A review of predictors of youth violence.
In Loeber R, Farrington DP (eds): ‘‘Serious and Violent Juvenile
Offenders: Risk Factors and Successful Interventions.’’ Thou-
sand Oaks, CA: Sage Publications, pp 106–146.
Hinshaw SP, Anderson CA. 1996. Conduct and oppositional defiant
disorders. In Mash EJ, Barkley RA (eds): ‘‘Child Psychopathol-
ogy.’’ New York: Guilford Press, pp 113–149.
Jellinek MS, Snyder JB. 1998. Depression and suicide in children and
adolescents. Pediatr Rev 19:255–264.
Jones B, Nagin D, Roeder K. 2001. A SAS procedure based on
mixture models for estimating developmental trajectories. Sociol
Meth Res 29:374–393.
Kass RE, Raftery AE. 1995. Bayes factor. J Am Stat Assoc 90:
773–795.
Kazdin AE. 1995. ‘‘Conduct Disorders in Childhood and Adoles-
cence.’’ Thousand Oaks, CA: Sage Publications.
Kovacs M. 1992. ‘‘Children’s Depression Inventory.’’ North
Tonawanda, NY: Mental Health Systems, Inc.
Lahey BB, Loeber R, Quay HC, Frick PJ, Grimm J. 1992.
Oppositional defiant and conduct disorders: issues to be
resolved for DSM-IV. J Am Acad Child Adoles Psychiatry 31:
539–546.
Lahey BB, Miller TL, Gordon RA, Riley AW. 1999a. Develop-
mental epidemiology of the disruptive behavior disorders.
In Quay HC, Hogan AE (eds): ‘‘Handbook of Disruptive
Behavior Disorders.’’ Dordrecht, Netherlands: Kluwer Academic
Publishers, pp 23–48.
Lahey BB, Waldman ID, McBurnett K. 1999b. The development of
antisocial behavior: An integrative causal model. J Child Psychol
Psychiatry 40:669–682.
Lewinsohn PM, Hops H, Roberts RE, Seeley JR, Andrews JA. 1993.
Adolescent psychopathology: I. Prevalence and incidence of
depression and other DSM-III–R disorders in high school
students. J Abnorm Psychol 102:133–144.
Little RJA, Rubin DB. 1987. ‘‘Statistical Analysis with Missing
Data.’’ New York: John Wiley and Sons.
Loeber R, Coie J. 2001. Continuities and discontinuities of develop-
ment, with particular emphasis on emotional and cognitive
components of disruptive behaviour. In Hill J, Maughan B (eds):
‘‘Conduct Disorders in Childhood and Adolescence.’’ New York:
Cambridge University Press, pp 379–407.
Loeber R, Farrington DP. (eds): 1998. ‘‘Serious and Violent Juvenile
Offenders: Risk Factors and Successful Interventions.’’ Thou-
sand Oaks, CA: Sage Publications.
Loeber R, Farrington DP. (eds): 2000. ‘‘Child Delinquents:
Development, Intervention and Service Needs.’’ Thousand Oaks,
CA: Sage Publications.
Loeber R, Hay D. 1997. Key issues in the development of aggression
and violence from childhood to early adulthood. Annu Rev
Psychol 48:371–410.
Loeber R, Lahey BB, Thomas C. 1991. Diagnostic conundrum of
oppositional defiant disorder and conduct disorder. J Abnorm
Psychol 100:379–390.
292 Harachi et al.
Aggr. Behav. DOI 10.1002/ab
Loeber R, Keenan K, Lahey BB, Green SM, Thomas C. 1993.
Evidence for developmentally based diagnoses of oppositional
defiant disorder and conduct disorder. J Abnorm Child Psychol
21:377–410.
Loeber R, Burke JD, Lahey BB, Winters A, Zera M. 2000.
Oppositional defiant and conduct disorder: A review of the past
10 years, Part I. J Am Acad Child Adoles Psychiatry 39:
1468–1484.
McCord J. 1988. Identifying developmental paradigms leading to
alcoholism. J Stud Alcohol 49:357–362.
McDermott PA. 1996. A nationwide study of developmental and
gender prevalence for psychopathology in childhood and
adolescence. J Abnorm Child Psychol 24:53–66.
McFadyen-Ketchum SA, Bates JE, Dodge KA, Pettit GS. 1996.
Patterns of change in early childhood aggressive-disruptive
behavior: Gender differences in predictions from early coercive
and affectionate mother–child interactions. Child Dev 67:
2417–2433.
Moffitt TE. 1993. Adolescence-limited and life-course-persistent anti-
social behavior: A developmental taxonomy. Psychol Rev 100:
674–701.
Moffitt TE, Caspi A, Rutter M, Silva PA. 2001. ‘‘Sex Differences
in Antisocial Behaviour: Conduct Disorder, Delinquency, and
Violence in the Dunedin Longitudinal Study.’’ New York:
Cambridge University Press.
Moos RH. 1974. ‘‘Family Environment Scale.’’ Palo Alto, CA:
Consulting Psychology Press.
Mrazek PJ, Haggerty RJ. (eds): Committee on Prevention of Mental
Disorders, Institute of Medicine. 1994. ‘‘Reducing Risks for
Mental Disorders: Frontiers for Prevention Intervention Re-
search.’’ Washington, DC: National Academy Press.
Muthen B. 2003. Statistical and substantive checking in growth
mixture modeling: Comment on Bauer and Curran (2003).
Psychol Methods 8:369–377.
Nagin D, Land K. 1993. Age, criminal careers, and population
heterogeneity: Specification and estimation of a nonparametric,
mixed position model. Criminology 31:327–362.
Nagin D, Tremblay RE. 1999. Trajectories of boys’ physical aggression,
opposition, and hyperactivity on the path to physically violent and
nonviolent juvenile delinquency. Child Dev 70:1181–1196.
Nagin D, Tremblay RE. 2001. Parental and early childhood
predictors of persistent physical aggression in boys from
kindergarten to high school. Arch Gen Psychiatry 58:389–394.
Nagin DS. 1999. Analyzing developmental trajectories: A semipara-
metric, group-based approach. Psychol Methods 4:139–157.
O’Connor D. 2002. ‘‘Aggression and Antisocial Behavior in Children
and Adolescents.’’ New York: The Guilford Press.
Offord DR, Boyle MH, Racine Y, Szatmari P, Fleming JE, Sanford
M, Lipman EL. 1996. Integrating assessment data from multiple
informants. J Am Acad Child Adoles Psychiatry 35:1078–1085.
Raftery AE. 1995. Bayesian model selection in social research. Sociol
Methodol 25:111–163.
Reynolds WM. 1989. ‘‘Reynolds Child Depression Scale.’’ Odessa,
FL: Psychological Assessment Resources, Inc.
Robins LN. 1966. ‘‘Deviant Children Grown Up: A Sociological and
Psychiatric Study of Sociopathic Personality.’’ Baltimore: Wil-
liams and Wilkins.
Robins LN. 1978. Sturdy childhood predictors of adult anti-social
behavior: Replications from longitudinal studies. Psychol Med 8:
611–622.
Robins LN. 1991. Conduct disorder. J Child Psychol Psychiatry 32:
193–212.
Robins LN, Ratcliff KS. 1979. Continuation of antisocial behavior
into adulthood. Int J Ment Health 7:96–116.
Rowe R, Maughan B, Pickles A, Costello EJ, Angold A, Simonoff E,
Bulik CM, Silberg JL. 2002. The relationship between DSM-IV
oppositional defiant disorder and conduct disorder: findings from
the Great Smoky Mountains Study. J Child Psychol Psychiatry
43:365–373.
Rutter M, Giller H, Hagell A. 1998. ‘‘Antisocial Behavior by Young
People.’’ Cambridge: Cambridge University Press.
SAS Institute. 2002. SAS/STAT Software, Version 8.2. The MI
Procedure. Accessed January 18, 2005 at http://www.sas.com/
rnd/app/papers/miv802.pdf
Schafer JL, Graham JW. 2002. Missing data: Our view of the state of
the art. Psychol Meth 7:147–177.
Sloboda Z, David SL. 1997. ‘‘Preventing Drug Use Among Children
and Adolescents: A Research-Based Guide.’’ Rockville, MD:
National Institute on Drug Abuse.
Storvoll EE, Wichstrom L. 2002. Do the risk factors associated
with conduct problems in adolescents vary according to gender?
J Adoles 25:182–202.
Tiet QQ, Wasserman GA, Loeber R, McReynolds LS, Miller LS.
2001. Developmental and sex differences in types of conduct
problems. J Child Fam Stud 10:181–197.
Werthamer-Larsson L, Kellam SG, Ovesen-McGregor KE. 1990.
Teacher interview: Teacher Observation of Classroom Adapta-
tion—Revised (TOCA-R). In Kellam SG (ed): ‘‘John Hopkins
Prevention Center Training Manual.’’ Baltimore, MD: Johns
Hopkins University.
White HR, Hansell S. 1996. The moderating effects of gender and
hostility on the alcohol-aggression relationship. J Res Crime
Delinq 33:450–470.
White HR, Brick J, Hansell S. 1993. A longitudinal investigation of
alcohol use and aggression in adolescence. J Stud Alcohol 11:
62–77.
White HR, Bates ME, Buyske S. 2001. Adolescence-limited versus
persistent delinquency: Extending Moffitt’s hypothesis into
adulthood. J Abnorm Psychol 110:600–609.
Zoccolillo M. 1993. Gender and the development of conduct
disorder. Dev Psychopathol 5:65–78.
Zoccolillo M, Rogers K. 1991. Characteristics and outcome of
hospitalized adolescent girls with conduct disorder. J Am Acad
Child Adoles Psychiatry 30:973–981.
Zoccolillo M, Tremblay R, Vitaro F. 1996. DSM-III-R and
DSM-III criteria for conduct disorder in preadolescent girls:
Specific but insensitive. J Am Acad Child Adoles Psychiatry 35:
461–470.
293Aggressive Behavior Among Girls and Boys During Middle Childhood
Aggr. Behav. DOI 10.1002/ab


Copyright © 2022 FDOKUMEN