
Agenda and Meeting Notice - SANDAG
234
Board Members Jack Dale, Chair Councilmember, Santee Jim Janney, First Vice Chair Mayor, Imperial Beach Don Higginson, Second Vice Chair Mayor, Poway Matt Hall Mayor, Carlsbad Cheryl Cox Mayor, Chula Vista Michael Woiwode Councilmember, Coronado Terry Sinnott Mayor, Del Mar Mark Lewis Mayor, El Cajon Lisa Shaffer Deputy Mayor, Encinitas Sam Abed Mayor, Escondido Art Madrid Mayor, La Mesa Mary Teresa Sessom Mayor, Lemon Grove Ron Morrison Mayor, National City Jack Feller Councilmember, Oceanside Todd Gloria Interim Mayor, San Diego Vacant San Diego Chris Orlando Councilmember, San Marcos Lesa Heebner Councilmember, Solana Beach Judy Ritter Mayor, Vista Greg Cox Chairman, County of San Diego Bill Horn Supervisor, County of San Diego Advisory Members Hon. John Renison Supervisor, District 1 Imperial County Malcolm Dougherty, Director California Department of Transportation Harry Mathis, Chairman Metropolitan Transit System Mark Packard, Vice Chairman North County Transit District CAPT Darius Banaji, CEC, USN, CO, Naval Facilities Engineering Command Southwest U.S. Department of Defense Ann Moore, Chair San Diego Unified Port District Tom Wornham, Chairman San Diego County Water Authority Allen Lawson, Chairman Southern California Tribal Chairmen’s Association Remedios Gómez-Arnau Consul General of Mexico Gary L. Gallegos Executive Director, SANDAG BOARD OF DIRECTORS AGENDA Friday, September 27, 2013 9 a.m. to 12 noon SANDAG Board Room 401 B Street, 7th Floor San Diego AGENDA HIGHLIGHTS • TransNet ENVIRONMENTAL MITIGATION PROGRAM: FY 2014 MANAGEMENT AND MONITORING ALLOCATIONS AND COMPETITIVE LAND ACQUISITION GRANT CALL FOR PROJECTS • PROPOSED REGIONAL BIKE EARLY ACTION PROGRAM • FINAL MITIGATED NEGATIVE DECLARATION FOR DOWNTOWN BUS RAPID TRANSIT STATIONS PLEASE TURN OFF CELL PHONES DURING THE MEETING YOU CAN LISTEN TO THE BOARD OF DIRECTORS MEETING BY VISITING OUR WEBSITE AT WWW.SANDAG.ORG MESSAGE FROM THE CLERK In compliance with Government Code §54952.3, the Clerk hereby announces that the compensation for legislative body members attending the following simultaneous or serial meetings is: Executive Committee (EC) $100, Board of Directors (BOD) $150, and Regional Transportation Commission (RTC) $100. Compensation rates for the EC and BOD are set pursuant to the SANDAG Bylaws and the compensation rate for the RTC is set pursuant to state law. MISSION STATEMENT The 18 cities and county government are SANDAG serving as the forum for regional decision-making. SANDAG builds consensus, makes strategic plans, obtains and allocates resources, plans, engineers, and builds public transit, and provides information on a broad range of topics pertinent to the region's quality of life. San Diego Association of Governments ⋅ 401 B Street, Suite 800, San Diego, CA 92101-4231 (619) 699-1900 ⋅ Fax (619) 699-1905 ⋅ www.sandag.org
-
Upload
khangminh22 -
Category
Documents
-
view
2 -
download
0
Transcript of Agenda and Meeting Notice - SANDAG
Board Members
Jack Dale, Chair Councilmember, Santee
Jim Janney, First Vice Chair Mayor, Imperial Beach
Don Higginson, Second Vice Chair Mayor, Poway
Matt Hall Mayor, Carlsbad
Cheryl Cox Mayor, Chula Vista
Michael Woiwode Councilmember, Coronado
Terry Sinnott Mayor, Del Mar
Mark Lewis Mayor, El Cajon
Lisa Shaffer Deputy Mayor, Encinitas
Sam Abed Mayor, Escondido
Art Madrid Mayor, La Mesa
Mary Teresa Sessom Mayor, Lemon Grove
Ron Morrison Mayor, National City
Jack Feller Councilmember, Oceanside
Todd Gloria Interim Mayor, San Diego
Vacant San Diego
Chris Orlando Councilmember, San Marcos
Lesa Heebner Councilmember, Solana Beach
Judy Ritter Mayor, Vista
Greg Cox Chairman, County of San Diego
Bill Horn Supervisor, County of San Diego
Advisory Members
Hon. John Renison Supervisor, District 1 Imperial County
Malcolm Dougherty, Director California Department of Transportation
Harry Mathis, Chairman Metropolitan Transit System
Mark Packard, Vice Chairman North County Transit District
CAPT Darius Banaji, CEC, USN, CO, Naval Facilities Engineering Command Southwest U.S. Department of Defense
Ann Moore, Chair San Diego Unified Port District
Tom Wornham, Chairman San Diego County Water Authority
Allen Lawson, Chairman Southern California Tribal Chairmen’s Association
Remedios Gómez-Arnau Consul General of Mexico
Gary L. Gallegos Executive Director, SANDAG
BOARD OF DIRECTORS AGENDA
Friday, September 27, 2013
9 a.m. to 12 noon SANDAG Board Room 401 B Street, 7th Floor
San Diego
AGENDA HIGHLIGHTS
• TransNet ENVIRONMENTAL MITIGATION PROGRAM: FY 2014 MANAGEMENT AND MONITORING ALLOCATIONS AND COMPETITIVE LAND ACQUISITION GRANT CALL FOR PROJECTS
• PROPOSED REGIONAL BIKE EARLY ACTION PROGRAM
• FINAL MITIGATED NEGATIVE DECLARATION FOR DOWNTOWN BUS RAPID TRANSIT STATIONS
PLEASE TURN OFF CELL PHONES DURING THE MEETING
YOU CAN LISTEN TO THE BOARD OF DIRECTORS MEETING BY VISITING OUR WEBSITE AT WWW.SANDAG.ORG
MESSAGE FROM THE CLERK
In compliance with Government Code §54952.3, the Clerk hereby announces that the compensation
for legislative body members attending the following simultaneous or serial meetings is: Executive
Committee (EC) $100, Board of Directors (BOD) $150, and Regional Transportation Commission (RTC)
$100. Compensation rates for the EC and BOD are set pursuant to the SANDAG Bylaws and the
compensation rate for the RTC is set pursuant to state law.
MISSION STATEMENT The 18 cities and county government are SANDAG serving as the forum for regional decision-making.
SANDAG builds consensus, makes strategic plans, obtains and allocates resources, plans, engineers,
and builds public transit, and provides information on a broad range of topics pertinent to the
region's quality of life.
San Diego Association of Governments ⋅ 401 B Street, Suite 800, San Diego, CA 92101-4231
(619) 699-1900 ⋅ Fax (619) 699-1905 ⋅ www.sandag.org
2 Rev. 092013
Welcome to SANDAG. Members of the public may speak to the Board of Directors on any item at the time the Board is considering the item. Please complete a Speaker’s Slip, which is located in the rear of the room, and then present the slip to the Clerk of the Board seated at the front table. Members of the public may address the Board on any issue under the agenda item entitled Public Comments/Communications/Member Comments. Public speakers are limited to three minutes or less per person. The Board of Directors may take action on any item appearing on the agenda. Public comments regarding the agenda can be sent to SANDAG via [email protected]. Please include the agenda item, your name, and your organization. Email comments should be received no later than 12 noon, two working days prior to the Board of Directors meeting. Any handouts, presentations, or other materials from the public intended for distribution at the Board of Directors meeting should be received by the Clerk of the Board no later than 12 noon, two working days prior to the meeting. In order to keep the public informed in an efficient manner and facilitate public participation, SANDAG also provides access to all agenda and meeting materials online at www.sandag.org/meetings. Additionally, interested persons can sign up for e-notifications via our e-distribution list at either the SANDAG website or by sending an email request to [email protected]. SANDAG operates its programs without regard to race, color, and national origin in compliance with Title VI of the Civil Rights Act. SANDAG has developed procedures for investigating and tracking Title VI complaints and the procedures for filing a complaint are available to the public upon request. Questions concerning SANDAG nondiscrimination obligations or complaint procedures should be directed to SANDAG General Counsel, John Kirk, at (619) 699-1997 or [email protected]. Any person who believes himself or herself or any specific class of persons to be subjected to discrimination prohibited by Title VI also may file a written complaint with the Federal Transit Administration. In compliance with the Americans with Disabilities Act (ADA), SANDAG will accommodate persons who require assistance in order to participate in SANDAG meetings. If such assistance is required, please contact SANDAG at (619) 699-1900 at least 72 hours in advance of the meeting. To request this document or related reports in an alternative format, please call (619) 699-1900, (619) 699-1904 (TTY), or fax (619) 699-1905. SANDAG agenda materials can be made available in alternative languages. To make a request call (619) 699-1900 at least 72 hours in advance of the meeting.
Los materiales de la agenda de SANDAG están disponibles en otros idiomas. Para hacer una solicitud, llame al (619) 699-1900 al menos 72 horas antes de la reunión.
如有需要, 我们可以把SANDAG议程材料翻译成其他語言.
请在会议前至少 72 小时打电话 (619) 699-1900 提出请求.
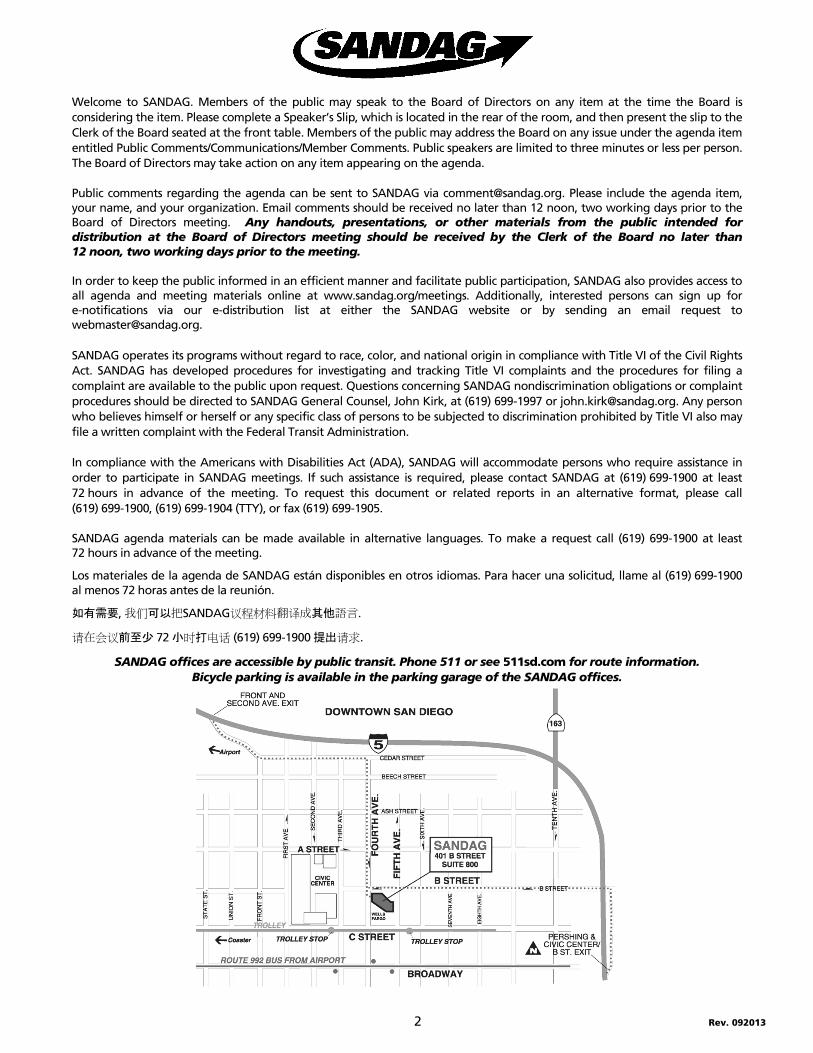
SANDAG offices are accessible by public transit. Phone 511 or see 511sd.com for route information. Bicycle parking is available in the parking garage of the SANDAG offices.
BOARD OF DIRECTORS Friday, September 27, 2013
ITEM # RECOMMENDATION
+1. APPROVAL OF MEETING MINUTES APPROVE
+1A. JULY 12, 2013, BOARD POLICY MEETING MINUTES +1B. JULY 26, 2013, BOARD BUSINESS MEETING MINUTES
2. PUBLIC COMMENTS/COMMUNICATIONS/MEMBER COMMENTS
Public comments under this agenda item will be limited to five public speakers. Members of the public shall have the opportunity to address the Board on any issue within the jurisdiction of SANDAG that is not on this agenda. Other public comments will be heard during the items under the heading “Reports.” Anyone desiring to speak shall reserve time by completing a “Request to Speak” form and giving it to the Clerk of the Board prior to speaking. Public speakers should notify the Clerk of the Board if they have a handout for distribution to Board members. Public speakers are limited to three minutes or less per person. Board members also may provide information and announcements under this agenda item.
+3. ACTIONS FROM POLICY ADVISORY COMMITTEES (Kim Kawada) APPROVE
This item summarizes the actions taken by the Borders Committee on July 26, the Transportation and Regional Planning Committees on September 6, the Executive Committee on September 13, and the Transportation Committee on September 20, 2013.
CONSENT (4 through 9)
+4. PROPOSED FY 2014 PROGRAM BUDGET AMENDMENT: ORANGE AND GREEN LINE FIBER OPTIC CABLE PROJECT (Chip Finch)*
APPROVE
The Transportation Committee recommends that the Board of Directors authorize the Executive Director to enter into a Memorandum of Understanding with Metropolitan Transit System to accept $1,317,617 for the Orange and Green Line Fiber Optic Cable Project (CIP 1144400) and approve the proposed amendment to the FY 2014 Program Budget.
+5. OVERVIEW OF DEVELOPMENTS IN THE FINANCIAL MARKETS AND QUARTERLY INVESTMENT REPORT AND ANNUAL INTEREST RATE SWAP EVALUATION FOR THE PERIOD ENDING JUNE 30, 2013 (Lisa Kondrat-Dauphin, André Douzdjian, and Marney Cox)*
INFORMATION
This quarterly report provides various finance-related items to the Board of Directors: (1) a quarterly report of investments, including all money under the direction or care of SANDAG; (2) an annual report and evaluation of all outstanding interest rate swaps; and (3) information about the latest developments in the financial markets, the economy, and sales tax revenues.
2
+6. QUARTERLY PROGRESS REPORT ON TRANSPORTATION PROJECTS - APRIL THROUGH JUNE 2013 (Michelle Merino)*
INFORMATION
This quarterly report summarizes the current status of major transit, highway, arterial, traffic management, and Transportation Demand Management projects in the SANDAG five-year Regional Transportation Improvement Program for the period April to June 2013.
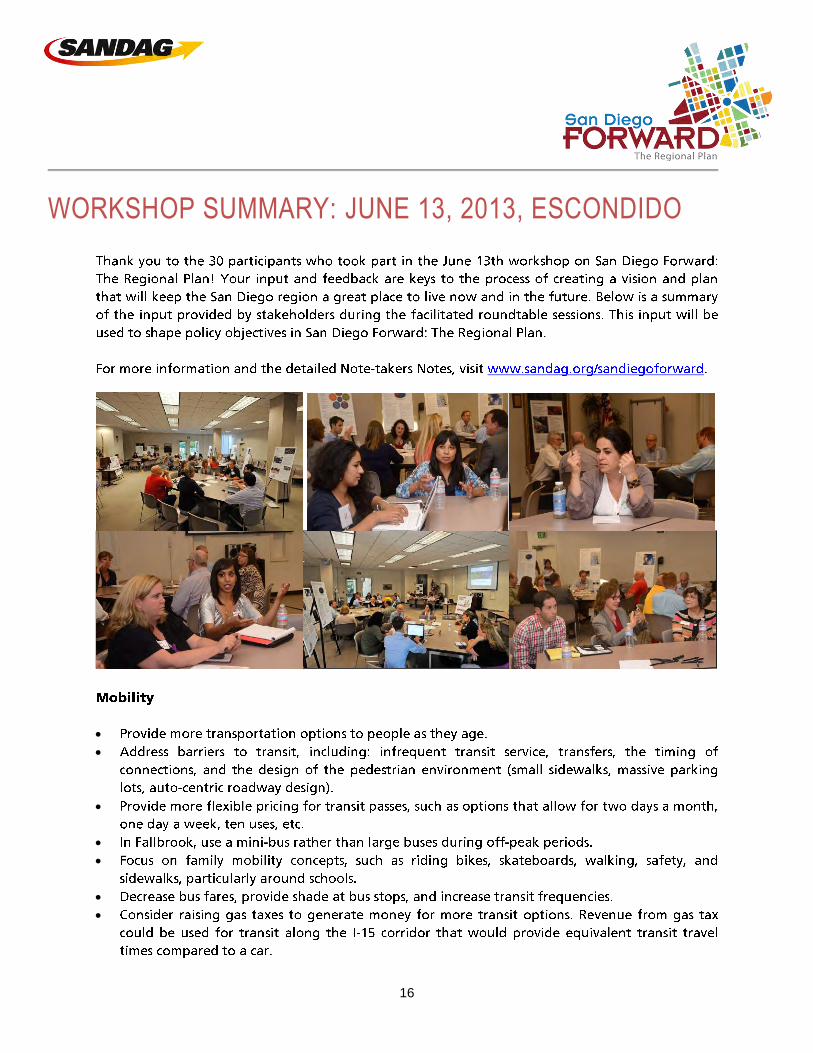
+7. SAN DIEGO FORWARD: THE REGIONAL PLAN: INPUT RECEIVED FROM SPRING AND SUMMER SERIES OF REGIONAL PLAN PUBLIC WORKSHOPS (Phil Trom)*
INFORMATION
SANDAG held a series of public workshops around the region from May through July on topics related to San Diego Forward: The Regional Plan. This report summarizes the input received from the workshops and lays out next steps in the planning process, including a workshop in mid-October on scenario planning efforts.
+8. REPORT SUMMARIZING DELEGATED ACTIONS TAKEN BY THE EXECUTIVE DIRECTOR (André Douzdjian)*
INFORMATION
In accordance with various SANDAG Board Policies, this report summarizes certain delegated actions taken by the Executive Director since the last Board of Directors meeting.
+9. REPORT ON MEETINGS AND EVENTS ATTENDED ON BEHALF OF SANDAG (Kim Kawada)
INFORMATION
Board members will provide brief reports orally or in writing on external meetings and events attended on behalf of SANDAG since the last Board of Directors meeting.
CHAIR’S REPORT (10 through 11)
+10. PERFORMANCE EVALUATION OF EXECUTIVE DIRECTOR* APPROVE
The Executive Committee recommends that the Board of Directors approve: (1) the Executive Director’s Performance Evaluation for the period July 2012 to June 2013, determining his performance satisfactory; and (2) a bonus award to the Executive Director based on accomplishment of the performance objectives during the past year. The Board of Directors also is asked to discuss the Executive Director’s proposed performance objectives for the period July 2013 to June 2014, and either approve the objectives or provide further direction on possible amendments.
+11. APPOINTMENT OF NOMINATING COMMITTEE FOR SANDAG BOARD OFFICERS*
INFORMATION
In accordance with the SANDAG Bylaws, the Chair will appoint up to a six-person nominating committee for Board officers, made up of Board members from each of the four subregions and a member from the City of San Diego and the County of San Diego. The nominating committee will submit its slate of nominees, in writing, for mailing to Board members in or around November.
3
REPORTS (12 through 15)
+12. APPROVAL OF PROPOSED SOLICITATIONS AND CONTRACT AWARDS (First Vice Chair Jim Janney; Laura Coté)*
+A. APPROVAL OF PROFESSIONAL SERVICES SOLICITATION
The Board of Directors is asked to authorize the Executive Director to conduct a solicitation for transit planning services as detailed herein.
+B. APPROVAL OF CONSTRUCTION AND PROFESSIONAL SERVICES AWARDS
The Board of Directors is asked to authorize the Executive Director to execute a construction award and multiple awards for public outreach/ involvement and customer communications services as detailed in the report.
APPROVE
+13. TransNet ENVIRONMENTAL MITIGATION PROGRAM: FY 2014 MANAGEMENT AND MONITORING ALLOCATIONS AND COMPETITIVE LAND ACQUISITION GRANT CALL FOR PROJECTS (Lemon Grove Mayor Mary Sessom, Regional Planning Committee Chair; Keith Greer, SANDAG)*
APPROVE
The Regional Planning and Transportation Committees recommend that the Board of Directors approve: (1) funding allocations totaling $4 million toward implementation of regional land management and biological monitoring activities; and (2) release of the Call for Projects for a competitive land acquisition grant program using economic benefit funding, pursuant to an executed Memorandum of Agreement with state and federal agencies on the implementation of the TransNet Environmental Mitigation Program.
+14. PROPOSED REGIONAL BIKE EARLY ACTION PROGRAM (San Diego Council President Todd Gloria, Transportation Committee Chair; Chris Kluth)*
APPROVE
The Transportation Committee recommends that the Board of Directors approve the Regional Bike Plan Early Action Program with Scenario 1 as the preferred implementation option.
+15. FINAL MITIGATED NEGATIVE DECLARATION FOR DOWNTOWN BUS RAPID TRANSIT STATIONS (San Diego Council President Todd Gloria, Transportation Committee Chair; Jennifer Williamson)*
ADOPT
The Board of Directors is asked to: (1) adopt the Final Mitigated Negative Declaration for the Downtown Bus Rapid Transit Stations; (2) adopt the Mitigation Monitoring and Reporting Program; and (3) authorize staff to move forward into final design and construction of the stations.
16. CONTINUED PUBLIC COMMENTS
If the five speaker limit for public comments was exceeded at the beginning of this agenda, other public comments will be taken at this time. Subjects of previous agenda items may not again be addressed under public comment.

4
17. UPCOMING MEETINGS INFORMATION
The next Board Policy meeting is scheduled for Friday, October 11, 2013, at 10 a.m. The next Board Business meeting is scheduled for Friday, October 25, 2013, at 9 a.m.
18. ADJOURNMENT
+ next to an agenda item indicates an attachment * next to an agenda item indicates a San Diego County Regional Transportation Commission item
BOARD OF DIRECTORS AGENDA ITEM NO. 13-09-1A SEPTEMBER 27, 2013 ACTION REQUESTED – APPROVE
BOARD OF DIRECTORS DISCUSSION AND ACTIONS
JULY 12, 2013
Chairman Jack Dale (Santee) called the meeting of the SANDAG Board of Directors to order at 10:03 a.m. The attendance sheet for the meeting is attached.
1. PUBLIC COMMENTS/COMMUNICATIONS/MEMBER COMMENTS Laurie Berman, Caltrans District 11 Director, announced the kickoff of the Steer Clear 2013 Campaign, which is scheduled to occur at 7 p.m., Saturday, July 27, through 4 a.m., Monday, July 29, 2013. Southbound Interstate 15 (I-15) will be closed from Ted Williams Parkway to Rancho Peñasquitos Boulevard to allow Caltrans to complete drainage work on the interstate. Detour signs will be posted, and the I-15 express lanes will be open to all traffic without tolls. Then from 3 p.m., August 18 through 5 a.m., August 19, there will be a full closure of I-805 from State Route 54 (SR 54) to I-905. Caltrans crews will be demolishing the Palomar Street overcrossing to allow for the construction of a new direct access ramp. SANDAG will waive tolls during this time on the South Bay Expressway (SR 125 South) to facilitate traffic flow. Supervisor Greg Cox (Chairman, County of San Diego) announced the recent passing of Gordy Shields, an active bicycling advocate, a founding member of the San Diego County Bicycle Coalition, and a member of the SANDAG Bicycle-Pedestrian Working Group and Bayshore Bikeway Working Group. Council President Todd Gloria (City of San Diego) announced that the City of San Diego has approved a bike sharing program, which will be implemented over the next few months. Dorothy Laznby, a member of the public, spoke regarding transit issues in the region. Mike Bullock, Sierra Club, provided a short presentation and spoke regarding climate change issues.
REPORTS (2)
2. SAN DIEGO FORWARD: THE REGIONAL PLAN: DRAFT POLICY OBJECTIVES (DISCUSSION/ POSSIBLE ACTION)
On May 10, 2013, the Board of Directors approved a vision and corresponding goals for San Diego Forward: The Regional Plan. This key step laid the policy foundation for the plan and identifies the “big picture” of what is to be achieved. The next step in the process is to develop policy objectives to provide a mechanism to achieve the plan’s goals. Feedback from the Regional Planning and Transportation Committees and from the public was used by staff to develop the draft policy objectives.
2
Mayor Mary Sessom (Lemon Grove), Regional Planning Committee Chair, introduced the item. Charles “Muggs” Stoll, Director of Land Use and Transportation Planning, and Phil Trom, Senior Regional Planner, presented the item and requested that the Board of Directors discuss the draft policy objectives for the Regional Plan for possible action. Bill Tippets, representing The Nature Conservancy and Endangered Habitats League, spoke in support of this item and offered additional recommendations related to preservation of natural resources. Mike Bullock, Sierra Club, provided a short presentation and spoke regarding climate change issues. Jack Shu, Cleveland National Forest Foundation, spoke in opposition to this item. Masada Disenhouse, San Diego 350.org, spoke in opposition to this item. Nicole Burgess, Bike San Diego, spoke in support of this item. Action: This item was presented for discussion. 3. CONTINUED PUBLIC COMMENTS There were no continued comments. Chairman Dale adjourned the meeting to closed session at 11:24 a.m. 4. CLOSED SESSION: CONFERENCE WITH LEGAL COUNSEL - SIGNIFICANT EXPOSURE TO
LITIGATION PURSUANT TO GOVERNMENT CODE SECTION 54956.9 (d)(2) - ONE POTENTIAL CASE
The Board of Directors was briefed on a written claim filed by South Bay Expressway, LLC alleging a breach of contract claim related to release of escrow funds associated with the purchase of the SR 125 franchise. Chairman Dale reconvened the meeting into open session at 11:40 a.m. Julie Wiley, Special Counsel, reported the following out of closed session: The Board of Directors met in closed session and voted to reject the claim filed by South Bay Expressway, LLC. 5. UPCOMING MEETINGS The next Board Business meeting is scheduled for Friday, July 26, 2013, at 9 a.m. 6. ADJOURNMENT Chairman Dale adjourned the meeting at 11:41 a.m.
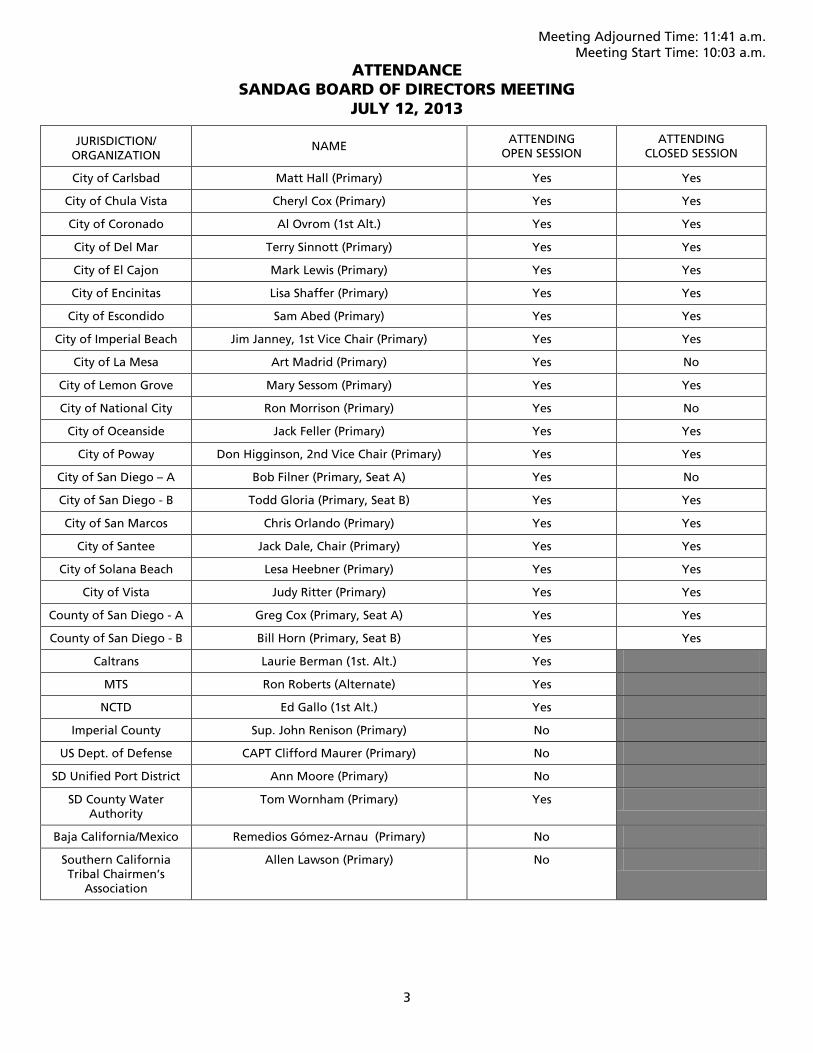
Meeting Adjourned Time: 11:41 a.m. Meeting Start Time: 10:03 a.m.
3
ATTENDANCE SANDAG BOARD OF DIRECTORS MEETING
JULY 12, 2013
JURISDICTION/ ORGANIZATION
NAME ATTENDING
OPEN SESSION ATTENDING
CLOSED SESSION
City of Carlsbad Matt Hall (Primary) Yes Yes
City of Chula Vista Cheryl Cox (Primary) Yes Yes
City of Coronado Al Ovrom (1st Alt.) Yes Yes
City of Del Mar Terry Sinnott (Primary) Yes Yes
City of El Cajon Mark Lewis (Primary) Yes Yes
City of Encinitas Lisa Shaffer (Primary) Yes Yes
City of Escondido Sam Abed (Primary) Yes Yes
City of Imperial Beach Jim Janney, 1st Vice Chair (Primary) Yes Yes
City of La Mesa Art Madrid (Primary) Yes No
City of Lemon Grove Mary Sessom (Primary) Yes Yes
City of National City Ron Morrison (Primary) Yes No
City of Oceanside Jack Feller (Primary) Yes Yes
City of Poway Don Higginson, 2nd Vice Chair (Primary) Yes Yes
City of San Diego – A Bob Filner (Primary, Seat A) Yes No
City of San Diego - B Todd Gloria (Primary, Seat B) Yes Yes
City of San Marcos Chris Orlando (Primary) Yes Yes
City of Santee Jack Dale, Chair (Primary) Yes Yes
City of Solana Beach Lesa Heebner (Primary) Yes Yes
City of Vista Judy Ritter (Primary) Yes Yes
County of San Diego - A Greg Cox (Primary, Seat A) Yes Yes
County of San Diego - B Bill Horn (Primary, Seat B) Yes Yes
Caltrans Laurie Berman (1st. Alt.) Yes
MTS Ron Roberts (Alternate) Yes
NCTD Ed Gallo (1st Alt.) Yes
Imperial County Sup. John Renison (Primary) No
US Dept. of Defense CAPT Clifford Maurer (Primary) No
SD Unified Port District Ann Moore (Primary) No
SD County Water Authority
Tom Wornham (Primary) Yes
Baja California/Mexico Remedios Gómez-Arnau (Primary) No
Southern California Tribal Chairmen’s
Association
Allen Lawson (Primary) No
BOARD OF DIRECTORS AGENDA ITEM NO. 13-09-1B SEPTEMBER 27, 2013 ACTION REQUESTED – APPROVE
BOARD OF DIRECTORS DISCUSSION AND ACTIONS
JULY 26, 2013
Chairman Jack Dale (Santee) called the meeting of the SANDAG Board of Directors to order at 9:00 a.m. The attendance sheet for the meeting is attached.
1. APPROVAL OF MEETING MINUTES
Action: Upon a motion by Supervisor Bill Horn (County of San Diego), and a second by Mayor Art Madrid (La Mesa), the Board of Directors approved the minutes from the June 14, 2013, Board Policy meeting. Yes – 15 (weighted vote, 100%). No – 0 (weighted vote, 0%). Abstain – 0 (weighted vote, 0%). Absent – Del Mar, Lemon Grove, National City, and Vista. Action: Upon a motion by Mayor Madrid, and a second by Second Vice Chair Don Higginson (Poway), the Board of Directors approved the minutes from the June 28, 2013, Board Business meeting. Yes – 15 (weighted vote, 100%). No – 0 (weighted vote, 0%). Abstain – 0 (weighted vote, 0%). Absent – Del Mar, Lemon Grove, National City, and Vista. 2. PUBLIC COMMENTS/COMMUNICATIONS/MEMBER COMMENTS Mike Bullock, Sierra Club, spoke in support of the critical mass bike rides. Mr. Bullock also spoke regarding the need to support climate stabilization. Jack Shu, Cleveland National Forest Foundation, spoke in opposition to the 2050 Regional Transportation Plan and also spoke regarding the need to address climate change. Nicole Burgess, member of the public, spoke in support of transit and safe routes for bike infrastructure. Robert Petty, member of the public, spoke about his concerns related to the inability of disabled individuals and seniors to properly view and use the ticket vending machines at trolley platforms. Mr. Petty offered suggestions to address his concerns. Mayor Bob Filner (City of San Diego) said that at its July 31 meeting, the San Diego City Council will discuss the City’s proposed climate action plan. Mayor Filner also said the City of San Diego is committed to a new bike infrastructure, and will host CicloSDias on Sunday, August 11, 2013.
2
3. ACTIONS FROM POLICY ADVISORY COMMITTEES (APPROVE) This item summarized the actions taken by the Borders Committee on June 28, the Executive Committee on July 12, and the Transportation, Regional Planning, and Public Safety Committees on July 19, 2013. Action: Upon a motion by Councilmember Lesa Heebner (Solana Beach), and a second by Mayor Mary Sessom (Lemon Grove), the Board of Directors approved Item No. 3. Yes – 17 (weighted vote, 100%). No – 0 (weighted vote, 0%). Abstain – 0 (weighted vote, 0%). Absent – Del Mar, San Diego B, and Vista.
CONSENT (4 THROUGH 8)
4. TRANSPORTATION DEVELOPMENT ACT TRIENNIAL PERFORMANCE AUDIT (APPROVE) As required by state law, the Transportation Development Act (TDA) triennial performance audits of Metropolitan Transit System (MTS), North County Transit District (NCTD), and SANDAG have been completed. The Transportation Committee recommended that the Board of Directors authorize the Executive Director to: (1) transmit the SANDAG performance audit report to Caltrans; (2) certify in writing to Caltrans that the performance audits of MTS and NCTD have been completed; (3) implement the performance audit recommendations pertaining to SANDAG TDA activities; and (4) transmit the MTS and NCTD audit recommendations to the transit operators for their implementation. 5. CALIFORNIA ENVIRONMENTAL QUALITY ACT (CEQA) EXEMPTION FOR MAINTENANCE OF
THE EAST H STREET DETENTION BASIN (APPROVE)
The East H Street Detention Basin is one of several stormwater detention basins designed to control and treat runoff from the South Bay Expressway (State Route 125 South). Maintenance activities to remove sediment are necessary to restore the basin to its original capacity and allow the maintenance responsibility to transition to the City of Chula Vista. Staff recommended the Board of Directors approve the CEQA exemption for maintenance of the East H Street Detention Basin in the City of Chula Vista. 6. iCOMMUTE EVENTS: RIDESHARE MONTH AND WALK, RIDE, AND ROLL TO SCHOOL DAY
(APPROVE) Each year during October the SANDAG iCommute program coordinates various events as a way to promote and highlight travel choices other than driving alone. The Board of Directors was asked to adopt Resolution No. 2014-01, proclaiming October 7-11, 2013, as Rideshare Week and October 2013 as Rideshare Month, and Resolution No. 2014-02, proclaiming October 9, 2013, as Walk, Ride, and Roll to School Day. The Board of Directors also was asked to encourage member agencies to approve similar proclamations.
3
7. REPORT SUMMARIZING DELEGATED ACTIONS TAKEN BY EXECUTIVE DIRECTOR (INFORMATION)
In accordance with various SANDAG Board Policies, this report summarized certain delegated actions taken by the Executive Director since the last Board of Directors meeting. 8. REPORT ON MEETINGS AND EVENTS ATTENDED ON BEHALF OF SANDAG (INFORMATION) Board members provided brief reports orally or in writing on external meetings and events attended on behalf of SANDAG since the last Board of Directors meeting. Action: Upon a motion by County Board of Supervisors Chairman Greg Cox (County of San Diego), and a second by Mayor Ron Morrison (National City), the Board of Directors approved Consent Items 4 through 8. Yes – 16. No – 0. Abstain – San Diego A. Absent – Del Mar, San Diego B, and Vista.
REPORTS (9 through 12) 9. APPROVAL OF PROFESSIONAL SERVICES AWARD (APPROVE) First Vice Chair Jim Janney (Imperial Beach) introduced the item and explained the solicitation for this particular item was conducted before the Board of Directors took action last month to approve any solicitations valued at $5 million or more. First Vice Chair Janney added that the Board of Directors is seeing the final phase today, the award of the contract. Laura Coté, Director of Administration, presented the item. Action: Upon a motion by Supervisor Horn, and a second by First Vice Chair Janney, the Board of Directors authorized the Executive Director to execute a contract with Alliant Insurance Services, Inc. for insurance broker services. Yes – 17 (weighted vote, 100%). No – 0 (weighted vote, 0%). Abstain – 0 (weighted vote, 0%). Absent – Del Mar and Vista. 10. MID-COAST CORRIDOR TRANSIT PROJECT: WAIVER OF CERTAIN SECTIONS OF BOARD
POLICY NO. 024 AND APPROVAL OF ALTERNATIVE REQUIREMENTS FOR THE MID-COAST PROCUREMENT (APPROVE)
Jim Linthicum, Director of Mobility Management and Project Implementation, provided information about various financial and experience requirements applicable to bidders on SANDAG construction contracts related to the Mid-Coast procurement and proposed waivers of sections of Board Policy No. 024: Procurement and Contracting – Construction. Action: Upon a motion by Council President Todd Gloria (City of San Diego), and a second by Councilmember Heebner, the Board of Directors: (1) approved the waiver of sections of Board Policy No. 024; and (2) approved the revised financial requirements for the Mid-Coast procurement. Yes – 17 (weighted vote, 100%). No – 0 (weighted vote, 0%). Abstain – 0 (weighted vote, 0%). Absent – Del Mar and Vista.
4
11. SUBSEQUENT MITIGATED NEGATIVE DECLARATION FOR THE SAN MARCOS TO VISTA SEGMENT OF THE INLAND RAIL TRAIL BIKEWAY PROJECT (APPROVE)
Emilio Rodriguez, Senior Engineer, provided the report on the environmental phase of the proposed seven-mile segment of the Inland Rail Trail bikeway within the cities of San Marcos and Vista and the county unincorporated area. Action: Upon a motion by Supervisor Horn, and a second by Councilmember Jack Feller (Oceanside), the Board of Directors: (1) adopted the Final Mitigated Negative Declaration (MND) for the Oceanside-Escondido Bikeway Project adopted by the City of San Marcos in 1999; (2) adopted the Final Subsequent MND for the San Marcos to Vista Segment of the Inland Rail Trail; and (3) adopted the Mitigation Monitoring and Reporting Program for the San Marcos to Vista segment of the Inland Rail Trail. Yes – 17 (weighted vote, 100%). No – 0 (weighted vote, 0%). Abstain – 0 (weighted vote, 0%). Absent – Del Mar and Vista. 12. CERTIFICATION OF SOUTH BAY BUS RAPID TRANSIT PROJECT FINAL ENVIRONMENTAL IMPACT
REPORT (EIR) (APPROVE) Council President Gloria, Transportation Committee Chair, introduced the item. Jennifer Williamson, Senior Regional Planner, gave the presentation and described how the South Bay Bus Rapid Transit (BRT) Project would provide service between the Otay Mesa Border Crossing and downtown San Diego via Eastern Chula Vista. Ms. Williamson also summarized the environmental process and outreach efforts for the project. Chairman Dale stated that the following member of the public submitted a comment slip in favor of the item, but did not wish to speak: Sean Kilkenny. Chairman Dale also stated that the following members of the public submitted comment slips in opposition of the item, but did not wish to speak: Eva Curavic, Marcia Liss, Lee Ann Jones, and Fermin Garcia. Mike Bullock, Sierra Club, spoke in favor of BRT in general but in opposition to the South Bay BRT Project. Pat Crisafulli, Lomas Verdes Homeowners Association, spoke in opposition to the South Bay BRT Project, including the proposed bridge. Jack Shu, Cleveland National Forest Foundation, spoke in opposition to the South Bay BRT Project. Leonard Fabian, member of the public, spoke in favor of the South Bay BRT Project but in opposition of the Treviana and Monét portion of the proposed route. He asked the Board of Directors to approve alternative 2 for the project. Erik Ruehr, member of the public, spoke in favor of the South Bay BRT Project and asked the Board of Directors to approve alternative 1A or 1B.
5
Jerry Rindone, Chula Vista Chamber of Commerce, spoke in favor of the South Bay BRT Project and asked the Board of Directors to approve alternative 1A. Jo Anne Springer, member of the public, spoke in opposition to the South Bay BRT Project, including the proposed bridge. Alex Napoles, Treviana Homeowners Association, spoke in opposition to the South Bay BRT Project, including the proposed bridge. Anne MacMillan Eichman, Little Italy Residents Association, spoke in opposition to the proposed South Bay BRT Project, including the proposed bridge. Lorraine Leighton, member of the public, spoke in favor of South Bay BRT Project alternative 1A. Francisco Gomez, member of the public, spoke in opposition to the South Bay BRT Project, including the proposed bridge. Stephan Haase, Baldwin and Sons, spoke in favor of the South Bay BRT Project and asked the Board of Directors to certify the EIR and approve alternative 1A or 1B. Leonardo Garcia, member of the public, spoke in favor of the South Bay BRT Project, but in opposition to alternative 1A and 1B. Mr. Garcia asked the Board of Directors to approve alternative 2. Alejandra Mier y Teran, Otay Mesa Chamber of Commerce, spoke in favor of the South Bay BRT Project. Edgar Camerino, San Diego Highway Development Association, spoke in favor of the South Bay BRT Project. Jacqueline Reynoso, National City Chamber of Commerce, spoke in favor of the South Bay BRT Project and urged the Board of Directors to certify the EIR. Cindy Gompper-Graves, South County Economic Development Council, spoke in favor of the South Bay BRT Project. Jim Sandoval, City of Chula Vista, spoke in favor of the South Bay BRT Project and asked the Board of Directors to certify the EIR and move forward with the project. Elyse Lowe, Move San Diego, spoke in favor of the South Bay BRT Project and asked the Board of Directors to approve alternative 1A or 1B. Irma Elshafei, member of the public, submitted a comment slip to speak in opposition to this item, and was called to speak but was not present. Eduardo Sanchez, member of the public, submitted a comment slip to speak in favor of this item, and was called to speak but was not present.
6
Action: Upon a motion by Mayor Cheryl Cox (Chula Vista), and a second by Council President Gloria, the Board of Directors approved Resolution No. 2014-04 (1) certifying the Final EIR prepared for the South Bay BRT Project; and (2) adopting the Project Findings, Statement of Overriding Considerations, and Mitigation Monitoring and Reporting Program. The Board of Directors also selected alternative 1B for the proposed project to carry forward into final design and construction. Yes – 12 (weighted vote, 72%). No – 5 (weighted vote, 28%). Abstain – 0 (weighted vote, 0%). Absent – Del Mar and Vista. 13. CONTINUED PUBLIC COMMENTS There were no continued comments. 14. UPCOMING MEETINGS The Board Policy and Board Business meetings in August are cancelled. The next Board Policy meeting is scheduled for Friday, September 13, 2013, at 9 a.m. The next Board Business meeting is scheduled for Friday, September 27, 2013, at 9 a.m. 15. ADJOURNMENT Chairman Dale adjourned the meeting at 11:14 a.m.
Meeting Adjourned Time: 11:14 a.m. Meeting Start Time: 9:00 a.m.
7
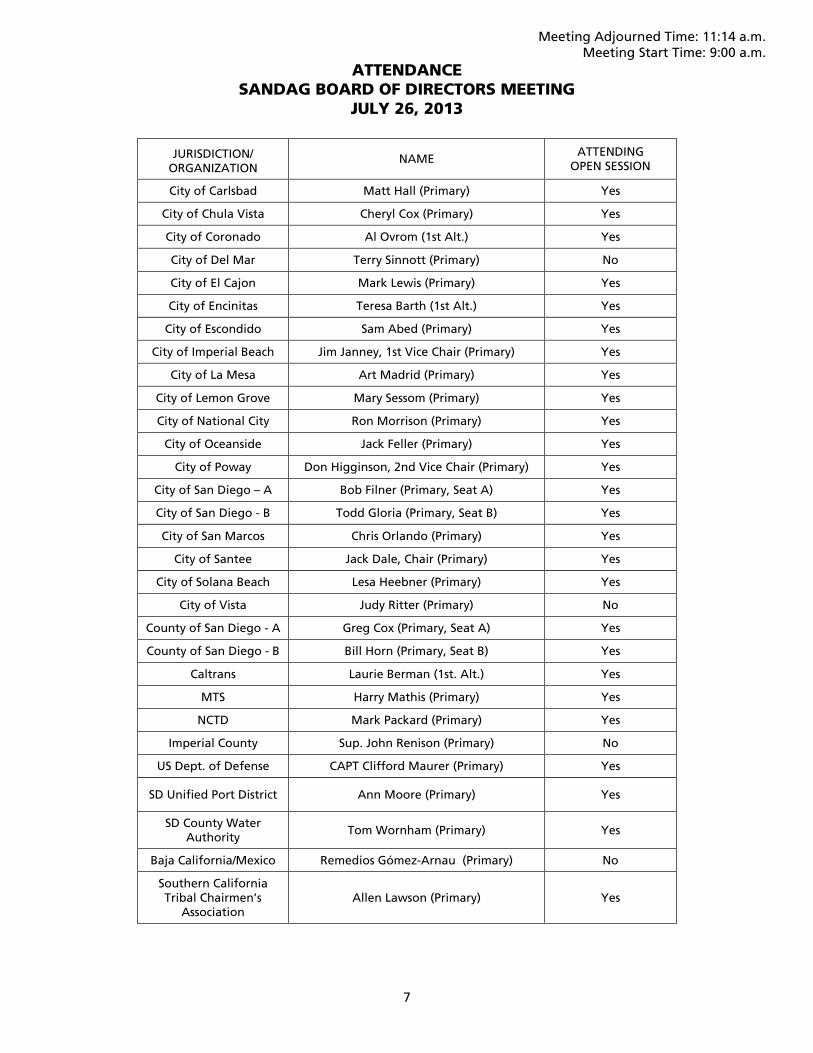
ATTENDANCE SANDAG BOARD OF DIRECTORS MEETING
JULY 26, 2013
JURISDICTION/
ORGANIZATION NAME
ATTENDING OPEN SESSION
City of Carlsbad Matt Hall (Primary) Yes
City of Chula Vista Cheryl Cox (Primary) Yes
City of Coronado Al Ovrom (1st Alt.) Yes
City of Del Mar Terry Sinnott (Primary) No
City of El Cajon Mark Lewis (Primary) Yes
City of Encinitas Teresa Barth (1st Alt.) Yes
City of Escondido Sam Abed (Primary) Yes
City of Imperial Beach Jim Janney, 1st Vice Chair (Primary) Yes
City of La Mesa Art Madrid (Primary) Yes
City of Lemon Grove Mary Sessom (Primary) Yes
City of National City Ron Morrison (Primary) Yes
City of Oceanside Jack Feller (Primary) Yes
City of Poway Don Higginson, 2nd Vice Chair (Primary) Yes
City of San Diego – A Bob Filner (Primary, Seat A) Yes
City of San Diego - B Todd Gloria (Primary, Seat B) Yes
City of San Marcos Chris Orlando (Primary) Yes
City of Santee Jack Dale, Chair (Primary) Yes
City of Solana Beach Lesa Heebner (Primary) Yes
City of Vista Judy Ritter (Primary) No
County of San Diego - A Greg Cox (Primary, Seat A) Yes
County of San Diego - B Bill Horn (Primary, Seat B) Yes
Caltrans Laurie Berman (1st. Alt.) Yes
MTS Harry Mathis (Primary) Yes
NCTD Mark Packard (Primary) Yes
Imperial County Sup. John Renison (Primary) No
US Dept. of Defense CAPT Clifford Maurer (Primary) Yes
SD Unified Port District Ann Moore (Primary) Yes
SD County Water Authority
Tom Wornham (Primary) Yes
Baja California/Mexico Remedios Gómez-Arnau (Primary) No
Southern California Tribal Chairmen’s
Association Allen Lawson (Primary) Yes
BOARD OF DIRECTORS AGENDA ITEM NO. 13-09-3 SEPTEMBER 27, 2013 ACTION REQUESTED – APPROVE
ACTIONS FROM POLICY ADVISORY COMMITTEES
The following actions were taken by the Policy Advisory Committees since the last Board of Directors meeting.
BORDERS COMMITTEE MEETING (July 26, 2013)
The Borders Committee did not take any actions at this meeting.
TRANSPORTATION COMMITTEE MEETING (September 6, 2013)
The Transportation Committee took the following actions or recommended the following approvals:
• Approved the amended charter and membership for the Active Transportation Working Group.
• Recommended that the Board of Directors authorize the Executive Director to enter into a Memorandum of Understanding with Metropolitan Transit System to accept $1,317,617 for the Orange and Green Line Fiber Optic Cable Project (CIP 1144400) and approve the proposed amendment to the FY 2014 Program Budget.
• Approved Amendment No. 8 - Administrative Modification to the 2012 Regional Transportation Improvement Program.
• Recommended that the Board of Directors approve: (1) funding allocations totaling $4 million toward implementation of regional land management and biological monitoring activities, and (2) release of the Call for Projects for a competitive land acquisition grant program using economic benefit funding, pursuant to an executed Memorandum of Agreement with state and federal agencies on the implementation of the TransNet Environmental Mitigation Program.
REGIONAL PLANNING COMMITTEE MEETING (September 6, 2013)
The Regional Planning Committee took the following actions or recommended the following approvals:
• Recommended that the Board of Directors approve: (1) funding allocations totaling $4 million toward implementation of regional land management and biological monitoring activities, and (2) release of the Call for Projects for a competitive land acquisition grant program using economic benefit funding, pursuant to an executed Memorandum of Agreement with state and federal agencies on the implementation of the TransNet Environmental Mitigation Program.
2
EXECUTIVE COMMITTEE MEETING (September 13, 2013)
The Executive Committee took the following actions or recommended the following approvals:
• Approved a support position on Assembly Bill 401 (Daly), which would provide statewide authority for the use of design build on transportation projects.
• Approved the draft agenda for the September 27, 2013, Board of Directors meeting, as amended.
• Approved the draft agenda for the October 11, 2013, Board of Directors Policy meeting, as amended.
TRANSPORTATION COMMITTEE MEETING (September 20, 2013)
The Transportation Committee is scheduled to take the following actions or recommend the following approvals:
• Authorize the Executive Director to execute an agreement with the United States Fish and Wildlife Service to provide dedicated staffing in order to expedite the delivery of TransNet projects.
• Recommend that the Board of Directors approve the Regional Bike Plan Early Action Program with Scenario 1 as the preferred implementation option.
PUBLIC SAFETY COMMITTEE MEETING (September 20, 2013)
The Public Safety Committee meeting was canceled.
GARY L. GALLEGOS Executive Director
BOARD OF DIRECTORS AGENDA ITEM NO. 13-09-4
SEPTEMBER 27, 2013 ACTION REQUESTED – APPROVE
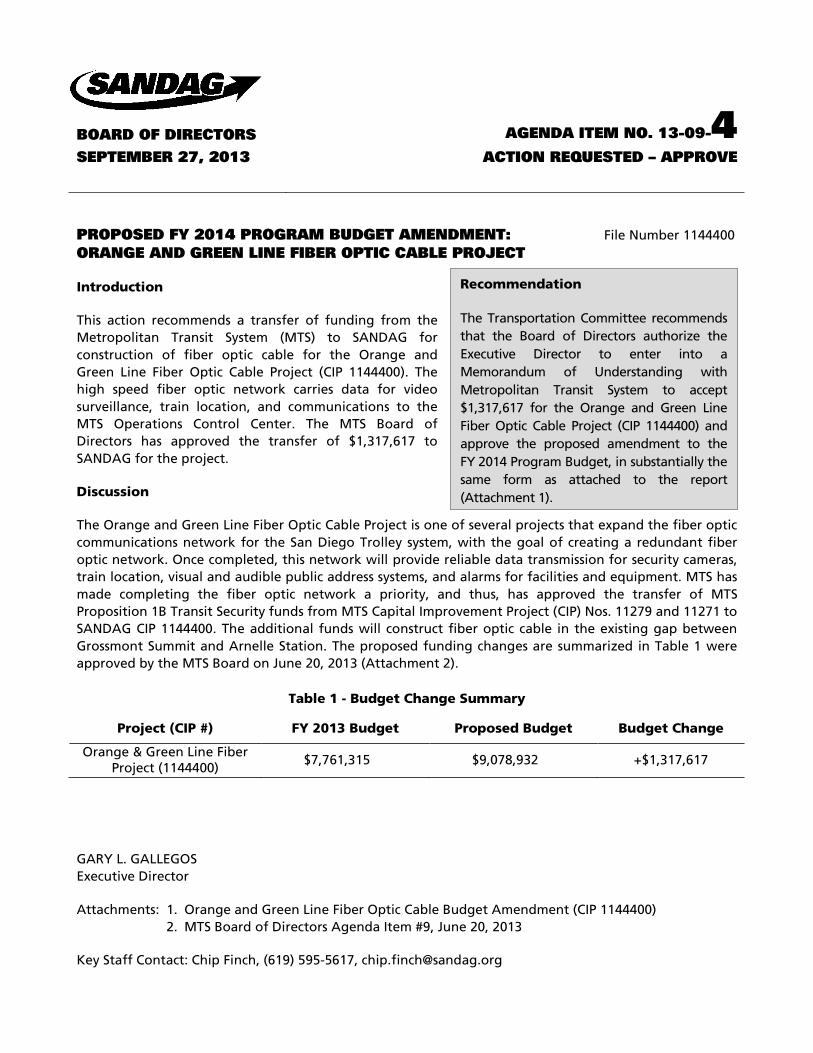
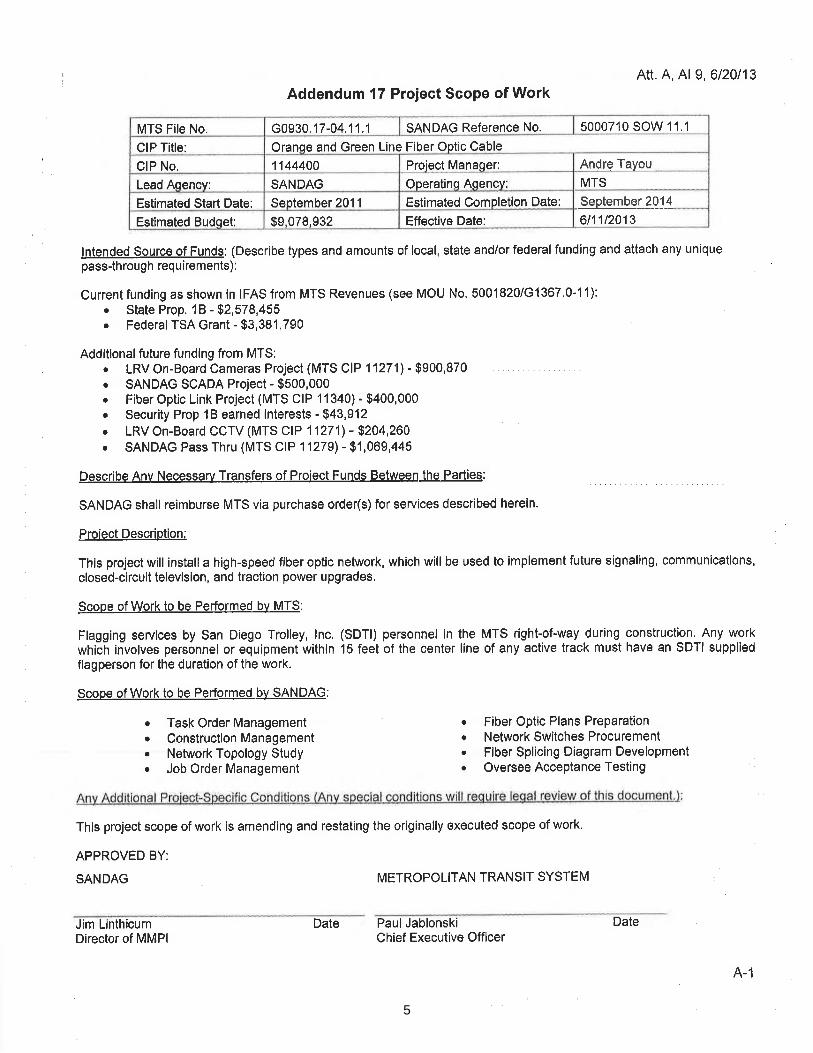
PROPOSED FY 2014 PROGRAM BUDGET AMENDMENT: File Number 1144400 ORANGE AND GREEN LINE FIBER OPTIC CABLE PROJECT
Introduction
This action recommends a transfer of funding from the Metropolitan Transit System (MTS) to SANDAG for construction of fiber optic cable for the Orange and Green Line Fiber Optic Cable Project (CIP 1144400). The high speed fiber optic network carries data for video surveillance, train location, and communications to the MTS Operations Control Center. The MTS Board of Directors has approved the transfer of $1,317,617 to SANDAG for the project.
Discussion
The Orange and Green Line Fiber Optic Cable Project is one of several projects that expand the fiber optic communications network for the San Diego Trolley system, with the goal of creating a redundant fiber optic network. Once completed, this network will provide reliable data transmission for security cameras, train location, visual and audible public address systems, and alarms for facilities and equipment. MTS has made completing the fiber optic network a priority, and thus, has approved the transfer of MTS Proposition 1B Transit Security funds from MTS Capital Improvement Project (CIP) Nos. 11279 and 11271 to SANDAG CIP 1144400. The additional funds will construct fiber optic cable in the existing gap between Grossmont Summit and Arnelle Station. The proposed funding changes are summarized in Table 1 were approved by the MTS Board on June 20, 2013 (Attachment 2).
Table 1 - Budget Change Summary
Project (CIP #) FY 2013 Budget Proposed Budget Budget Change
Orange & Green Line Fiber Project (1144400)
$7,761,315 $9,078,932 +$1,317,617
GARY L. GALLEGOS Executive Director
Attachments: 1. Orange and Green Line Fiber Optic Cable Budget Amendment (CIP 1144400) 2. MTS Board of Directors Agenda Item #9, June 20, 2013
Key Staff Contact: Chip Finch, (619) 595-5617, [email protected]
Recommendation
The Transportation Committee recommends that the Board of Directors authorize the Executive Director to enter into a Memorandum of Understanding with Metropolitan Transit System to accept $1,317,617 for the Orange and Green Line Fiber Optic Cable Project (CIP 1144400) and approve the proposed amendment to the FY 2014 Program Budget, in substantially the same form as attached to the report (Attachment 1).
Project Number: Project Manager:
Project Name: Phone Number:
MILESTONE
EXPENDITURE PLAN ($000)
TASKPRIOR YEARS FY 15 FY 16 FY 17 FY 18
FUTURE YEARS
Administration $300 $425 $425 $20 $0 $0 $0 $0 $745 $745
Miscellaneous Equipment 0 0 0 0 0 0 0 0 $0 0
Engineering & Design 498 137 137 0 0 0 0 0 $635 635
Construction Management 247 219 219 0 0 0 0 0 $466 466
Professional Services 0 89 89 0 0 0 0 0 $89 89
Construction 4,979 847 2,165 0 0 0 0 0 $5,826 7,144
Environmental 0 0 0 0 0 0 0 0 $0 0
Project Contingency 0 0 0 0 0 0 0 0 $0 0
Communications 0 0 0 0 0 0 0 0 $0 0
Legal Services 0 0 0 0 0 0 0 0 $0 0Total $6,024 $1,717 $3,035 $20 $0 $0 $0 $0 $7,761 $9,079
FUNDING PLAN ($000)
FUNDING SOURCEPRIOR YEARS FY 14 FY 15 FY 16 FY 17 FY 18
FUTURE YEARS
FEDERAL:
FTA Section 5307 $0 $400 $400 $0 $0 $0 $0 $0 $400 $400
LOCAL:
MTS 6,024 1,237 2,535 20 0 0 0 0 7,261 8,579
TDA 0 100 100 0 0 0 0 0 100 100
TOTAL: $6,024 $1,737 $3,035 $20 $0 $0 $0 $0 $7,761 $9,079
Close-Out Jul-14
FY 14 TOTAL
TOTAL
Design and construction are complete for phases 1, 2, and 3. Design is complete for phases 4 and 5. Construction will commence on phases 4 and 5 in FY 2014.
Environmental Document N/A
Ready to Advertise Dec-11
Issue Notice to Proceed Mar-12
Open for Service Mar-13
This project will install a high-speed fiber-optic network, which will be used to implement future signaling, communications, closed-circuit television, and traction power upgrades. This project will be built in five phases. Phase 1 will cover Qualcomm to Mission Valley Center, Phase 2 will cover Mission Valley Center to Old Town, Phase 3 will cover 12th and Imperial station to Baltimore Junction, Phase 4 will Cover Baltimore Junction to Santee, and Phase 5 will cover Santa Fe Depot to Old Town
Not ApplicablePROJECT JUSTIFICATION
This project is essential to SANDAG's Intelligent Transportation System (ITS) projects, including the regional automated fare collection project. It also paves the way for regional, multi-agency efforts in infrastructure and data-sharing.
PROGRESS TO DATE MAJOR MILESTONES
1144400 Andre TayouOrange and Green Line Fiber Optic Cable
(619) 699-7340
PROJECT DESCRIPTION SITE LOCATION
Attachment 1
2
1 255 lmperlal Avenue, Suite 1000San Diego, CA 92101-7490(61 9) 231 -1 466 . FAX (61 9) 234-3407
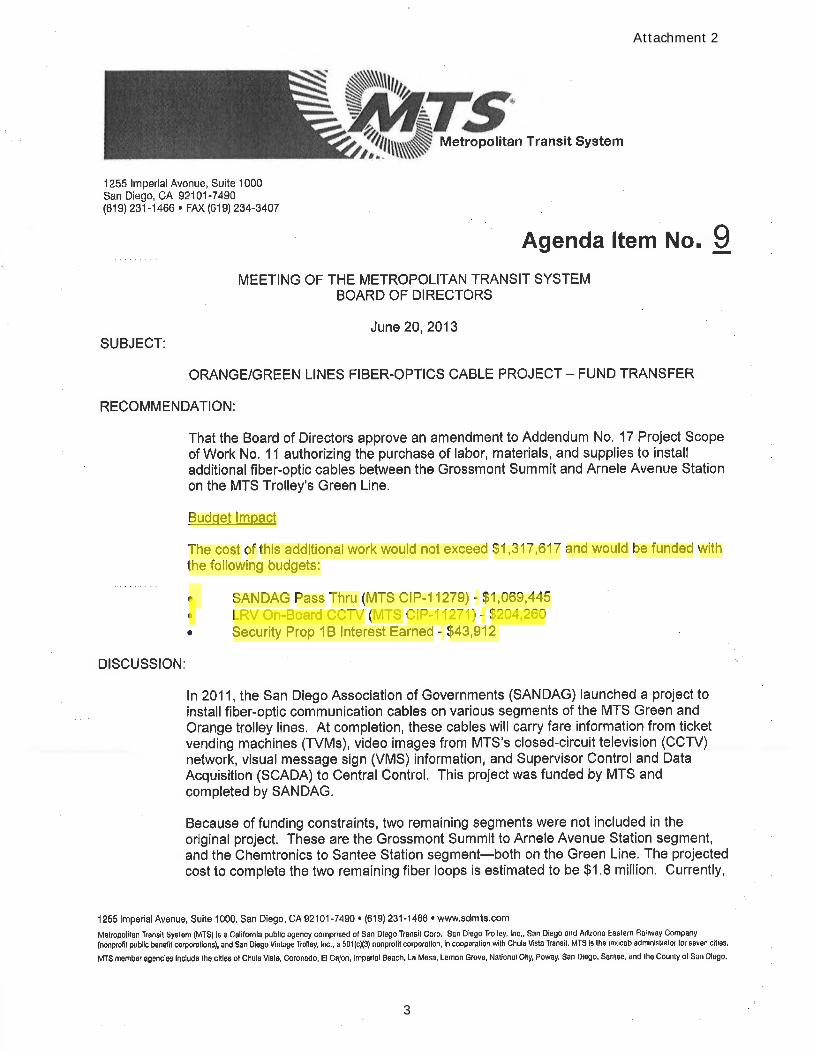
MEETING OF THE METROPOLITAN TRANSIT SYSTEMBOARD OF DIRECTORS
June 20, 2013SUBJECT:
ORANGE/GREEN LINES FIBER.OPTICS CABLE PROJECT - FUND TRANSFER
RECOMMENDATION:
That the Board of Directors approve an amendment to Addendum No. 17 Project Scopeof Work No, 1l authorizing the purchase of labor, materials, and supplies to installadditionalfiber-optic cables between the Grossmont Summit and Arnele Avenue Stationon the MTS Trolley's Green Line.
Budoet lmpact
The cost of this additionalwork would not exceed $1,317,617 and would be funded withthe following budgets:
o SANDAG Pass Thru (MTS CIP-11279) - $1,069,445¡ LRV On-Board CCTV (MTS CIP-11271) - $204,260
Security Prop 1B lnterest Earned - $43,912
DISCUSSION;
ln 201 1, the San Diego Association of Governments (SANDAG) launched a project toinstallfiber-optic communication cables on various segments of the MTS Green andOrange trolley lines. At completion, these cables will carry fare information from ticketvending machines (TVMs), video images from MTS's closed-circuit television (CCTV)network, visual message sign (VMS) information, and Supervisor Control and DataAcquisition (SCADA) to Central Control. This project was funded by MTS andcompleted by SANDAG.
Because of funding constraints, two remaining segments were not included in theoriginal project. These are the Grossmont Summit to Arnele Avenue Station segment,and the Chemtronics to Santee Station segment-both on the Green Line. The projectedcost to complete the two remaíning fiber loops is estimated to be $'1,8 miflion. Currently,
1255 lmpêr¡al Avenue, Suile 1000, San Diego, CA 92101-7499 r (619) 231-1466 . www,sdmts.oom
Metropolitan Transit System
Agenda ltem No. 9
3
Attachment 2
cfi
Highlight
cfi
Highlight
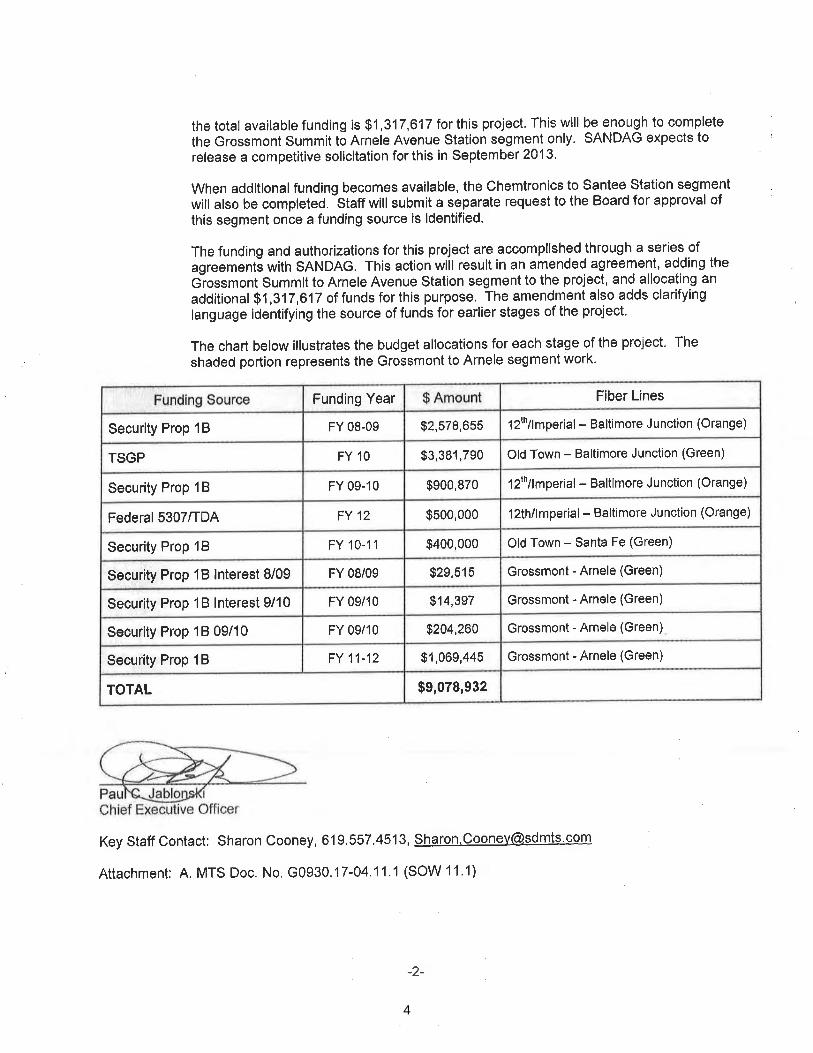
the total available funding is $1,317,617 lor this project. This will be enough to complete
the Grossmont Summit to Arnele Avenue Station segment only. SANDAG expects to
release a competitive solicitation for this in Septembe¡ 2013.
When additionalfunding becomes available, the Chemtronics to Santee Station segment
will also be completeO. -Staff
will suþmit a separate request to the Board for approval of
this segment once a funding source is identified'
The funding and authorizations for this project are accomplished through a series of
agreementé with SANDAG, This action wiil result in an amended agreement, adding the
G-rossmont Summit to Arnele Avenue Station segment to the project, and allocating an
additional $1,317 ,617 of funds for this purpose. The amendment also adds clarifying
language identifying the source of funds for earlier stages of the project.
The chart below illustrates the budget allocations for each stage of the project. The
shaded portion represents the Grossmont to Arnele segment work'
Security Prop 1B
Funding Source
TSGP
Security Prop 1B
Federal 5307/TDA
Security Prop 1B
Security Prop 1B lnterest 8/09
Security Prop 1B lnterest 9/10
Funding Year
Security Prop 1B 09/10
FY 08-09
Security Prop 1B
FY 10
TOTAL
FY 09-10
$ Amount
$2,578,655
FY 12
FY 10-11
$3,381,790
FY 08/09
$900,870
FY 09/10
12thllmperial - Baltimore Junction (orange)
Key Statf Contact: Sharon Cooney, 619.557.4513, [email protected]
Attachment: A, MTS Doc, No, G0930.17'04,11.1 (SOW 11.1)
$500,000
FY 09/10
Old Town - Baltimore Junction (Green)
$400,000
FY 11-12
12thllmperial - Baltimore Junction (Orange)
Fiber Línes
$29,515
l2thllmperial - Baltimore Ju nction (Orange)
$14,3e7
Old Town - Santa Fe (Green)
$204,260
Grossmont - Arnele (Green)
$1,069,445
$9,078,932
Grossmont - Arnele (Green)
Grossmont - Arnele (Green)
Grossmont - Arnele (Green)
-2-
4
mmo
Rectangle
MTS File No.
CIP Title:
GIP No.
Lead Aoencv:
lntended Source of Funds: (Describe types and amounts of local, state and/or federal funding and attach any uniquepass-through requirements):
Current funding as shown in IFAS from MTS Revenues (see MOU No. 5001820/G1367.0-11):o State Prop, 1B - $2,578,455. Federal TSA Grant - $3,381,790
Additional future funding from MTS:. LRV On-Board Cameras Project (MTS CIP 11271) - $900,870o SANDAG SCADA Project - $500,000. Fiber Optic Link Project (MTS CIP 11340) - $400,000¡ Security Prop 1B earned interests ' $43,912. LRV On-Board CCTV (MTS CIP 11271) - fi204,260¡ SANDAG Pass Thru (MTS CIP 11279') - $1,069,445
Describe Any Necessarv llensfers of Proiect Funds Between the Pertleq:
SANDAG shall reímburse MTS via purchase orde(s) for services described herein.
Proiect Descriotion:
This project will install a high-speed fiber optic network, which will be used to implement future signaling, communications,
closed-circuit television, and traction power upgrades,
Scope of Work to be Performed b:l MTS:
Flagging services by San Diego Trolley, lnc. (SDTI) personnel in the MTS right-of-way during construction. Any workwhióñ involves persónnel or equipment within 15 feet of the center line of any active track must have an SDTI supplied
flagperson for the duration of the work.
Scope of Work to be Pedormed by SANDAG;
Estimated Start Date:
Estimated Budqet:
Addendum 17 Project Scope of Work
G0930, 17-04,11,1
Oranqe and Green Line Fiber Optic Cable
1144400
SANDAG
Seotember 201 1
$9,078,932
SANDAG Reference No.
Proiect Manager:
Operatinq Aqencv;
Estimated Gomoletion Date:
Etfective Date:
5000710 sow '11.'1
Att. A, Al9,6120113
Andre layouMTS
September 201!-
6t11t2013
a
a
a
a
Task Order Managemenl r Fiber Optic Plans Preparation
Construction Managemen[ o Network SWitChes ProcurementNetwork Topology study ' Fiber Splicing Diagram Development
Job Order Managemenf o Oversee Acceptance Testing
This project scope of work is amending and restating the originally executed scope of work.
APPROVED BY:
SANDAG METROPOLITAN TRANSIT SYSTEM
Jim Linthicum DateDirector of MMPI
PaulJablonskiChief Executive Officer
Date
A-1
5
mmo
Rectangle
BOARD OF DIRECTORS AGENDA ITEM NO. 13-09-5
SEPTEMBER 27, 2013 ACTION REQUESTED – INFORMATION
OVERVIEW OF DEVELOPMENTS IN THE FINANCIAL File Number 8000180 MARKETS AND QUARTERLY INVESTMENT REPORT AND ANNUAL INTEREST RATE SWAP EVALUATION FOR THE PERIOD ENDING JUNE 30, 2013
Introduction
Staff provides quarterly briefings intended to keep the Board of Directors informed about the latest developments in the financial markets, the economy, sales tax revenues, the strategies being explored and implemented to minimize possible impacts to the TransNet Program, and a quarterly report on investments as required per Board Policy No. 003: Investment Policy.
In addition, Board Policy No. 032: San Diego County Regional Transportation Commission Interest Rate Swap Policy, requires that a written description of the swaps and an evaluation of the risks associated with outstanding interest rate swaps be presented to the Board on an annual basis.
Discussion
Market Review and Update
Overview
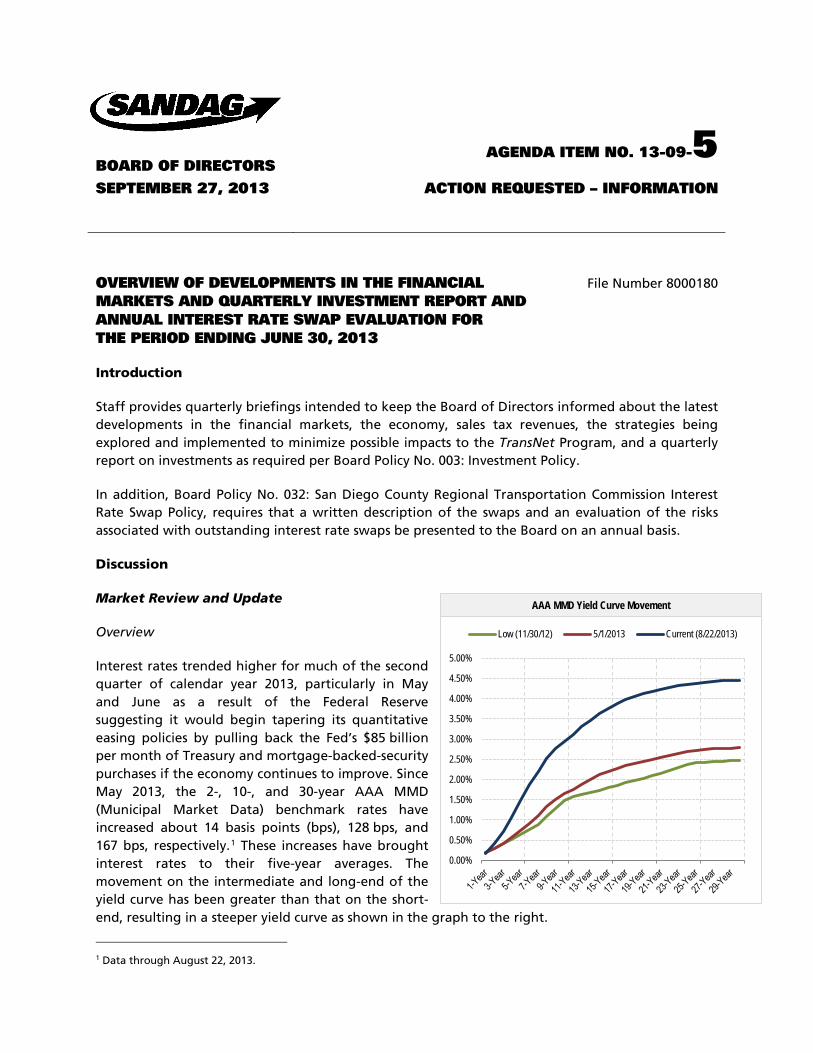
Interest rates trended higher for much of the second quarter of calendar year 2013, particularly in May and June as a result of the Federal Reserve suggesting it would begin tapering its quantitative easing policies by pulling back the Fed’s $85 billion per month of Treasury and mortgage-backed-security purchases if the economy continues to improve. Since May 2013, the 2-, 10-, and 30-year AAA MMD (Municipal Market Data) benchmark rates have increased about 14 basis points (bps), 128 bps, and 167 bps, respectively.1 These increases have brought interest rates to their five-year averages. The movement on the intermediate and long-end of the yield curve has been greater than that on the short-end, resulting in a steeper yield curve as shown in the graph to the right.
1 Data through August 22, 2013.
AAA MMD Yield Curve Movement
0.00%
0.50%
1.00%
1.50%
2.00%
2.50%
3.00%
3.50%
4.00%
4.50%
5.00%
Low (11/30/12) 5/1/2013 Current (8/22/2013)
2
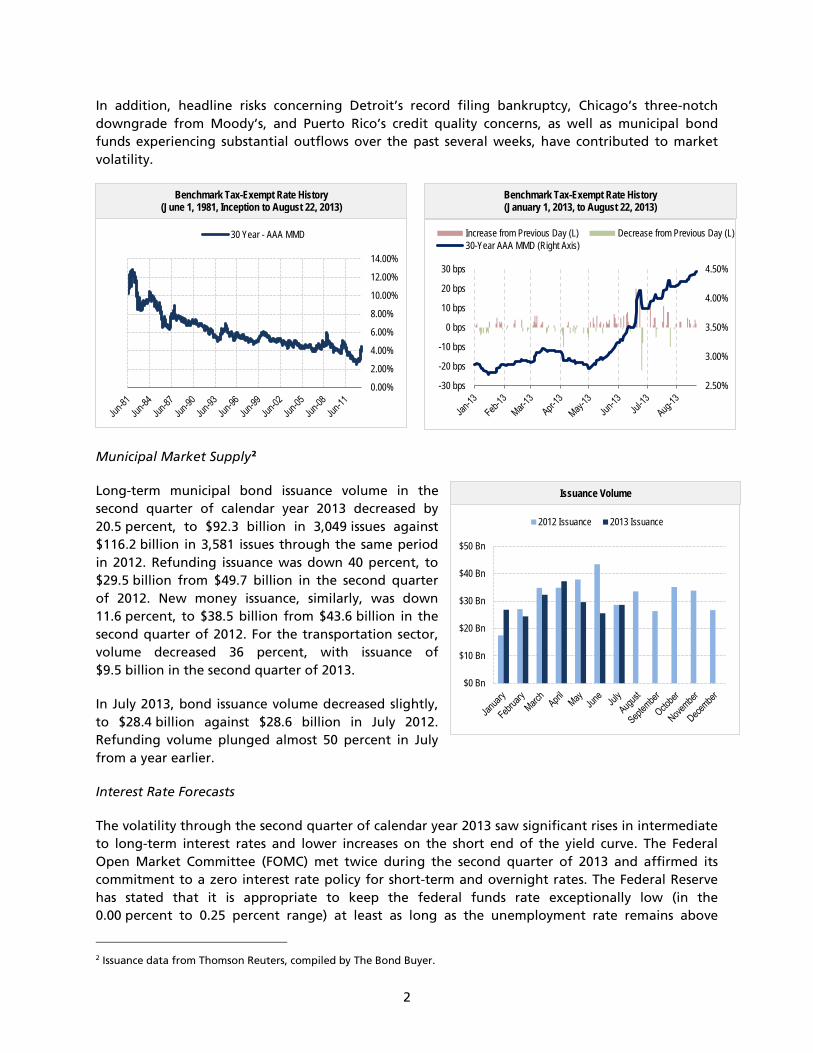
In addition, headline risks concerning Detroit’s record filing bankruptcy, Chicago’s three-notch downgrade from Moody’s, and Puerto Rico’s credit quality concerns, as well as municipal bond funds experiencing substantial outflows over the past several weeks, have contributed to market volatility.
Municipal Market Supply2
Long-term municipal bond issuance volume in the second quarter of calendar year 2013 decreased by 20.5 percent, to $92.3 billion in 3,049 issues against $116.2 billion in 3,581 issues through the same period in 2012. Refunding issuance was down 40 percent, to $29.5 billion from $49.7 billion in the second quarter of 2012. New money issuance, similarly, was down 11.6 percent, to $38.5 billion from $43.6 billion in the second quarter of 2012. For the transportation sector, volume decreased 36 percent, with issuance of $9.5 billion in the second quarter of 2013.
In July 2013, bond issuance volume decreased slightly, to $28.4 billion against $28.6 billion in July 2012. Refunding volume plunged almost 50 percent in July from a year earlier.
Interest Rate Forecasts
The volatility through the second quarter of calendar year 2013 saw significant rises in intermediate to long-term interest rates and lower increases on the short end of the yield curve. The Federal Open Market Committee (FOMC) met twice during the second quarter of 2013 and affirmed its commitment to a zero interest rate policy for short-term and overnight rates. The Federal Reserve has stated that it is appropriate to keep the federal funds rate exceptionally low (in the 0.00 percent to 0.25 percent range) at least as long as the unemployment rate remains above
2 Issuance data from Thomson Reuters, compiled by The Bond Buyer.
0.00%
2.00%
4.00%
6.00%
8.00%
10.00%
12.00%
14.00%
30 Year - AAA MMD
Issuance Volume
Benchmark Tax-Exempt Rate History (June 1, 1981, Inception to August 22, 2013)
Benchmark Tax-Exempt Rate History (January 1, 2013, to August 22, 2013)
$0 Bn
$10 Bn
$20 Bn
$30 Bn
$40 Bn
$50 Bn
2012 Issuance 2013 Issuance
-30 bps
-20 bps
-10 bps
0 bps
10 bps
20 bps
30 bps
2.50%
3.00%
3.50%
4.00%
4.50%
Increase from Previous Day (L) Decrease from Previous Day (L)30-Year AAA MMD (Right Axis)
3
6.5 percent and inflation remains no more than half a percentage point above the FOMC’s 2 percent longer-run goal. These low short-term rates are expected to persist into 2015.
On the longer end of the curve, the tax-exempt and U.S. Treasury markets weakened significantly due to the prospect of the Fed slowing its $85 billion per month of Treasury and mortgage-backed-security purchases. If the economy stays on track, asset purchases could begin to wind down starting this fall and be discontinued by mid-2014. Despite all the prospective changes, officials at the Fed have tried to calm investors by emphasizing that bond purchases will not halt until the economy strengthens.
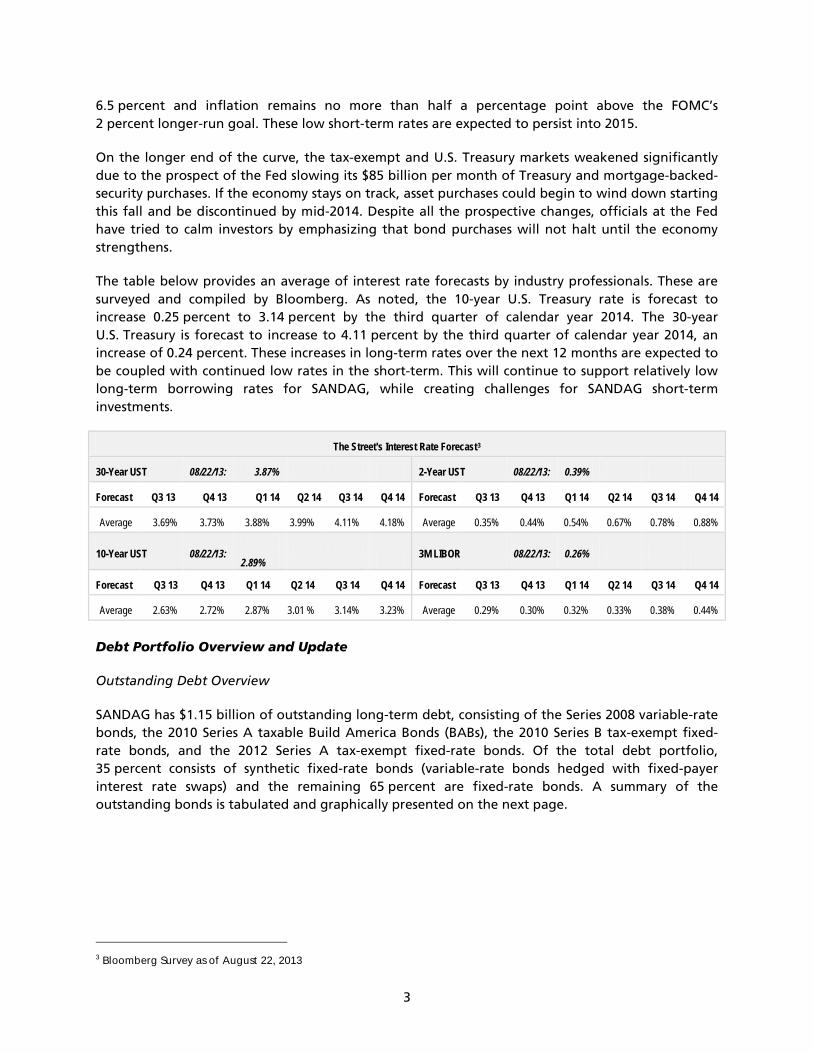
The table below provides an average of interest rate forecasts by industry professionals. These are surveyed and compiled by Bloomberg. As noted, the 10-year U.S. Treasury rate is forecast to increase 0.25 percent to 3.14 percent by the third quarter of calendar year 2014. The 30-year U.S. Treasury is forecast to increase to 4.11 percent by the third quarter of calendar year 2014, an increase of 0.24 percent. These increases in long-term rates over the next 12 months are expected to be coupled with continued low rates in the short-term. This will continue to support relatively low long-term borrowing rates for SANDAG, while creating challenges for SANDAG short-term investments.
The Street's Interest Rate Forecast3
30-Year UST 08/22/13: 3.87% 2-Year UST 08/22/13: 0.39% Forecast Q3 13 Q4 13 Q1 14 Q2 14 Q3 14 Q4 14 Forecast Q3 13 Q4 13 Q1 14 Q2 14 Q3 14 Q4 14
Average 3.69% 3.73% 3.88% 3.99% 4.11% 4.18% Average 0.35% 0.44% 0.54% 0.67% 0.78% 0.88%
10-Year UST 08/22/13: 2.89%
3M LIBOR 08/22/13: 0.26% Forecast Q3 13 Q4 13 Q1 14 Q2 14 Q3 14 Q4 14 Forecast Q3 13 Q4 13 Q1 14 Q2 14 Q3 14 Q4 14
Average 2.63% 2.72% 2.87% 3.01 % 3.14% 3.23% Average 0.29% 0.30% 0.32% 0.33% 0.38% 0.44%
Debt Portfolio Overview and Update
Outstanding Debt Overview
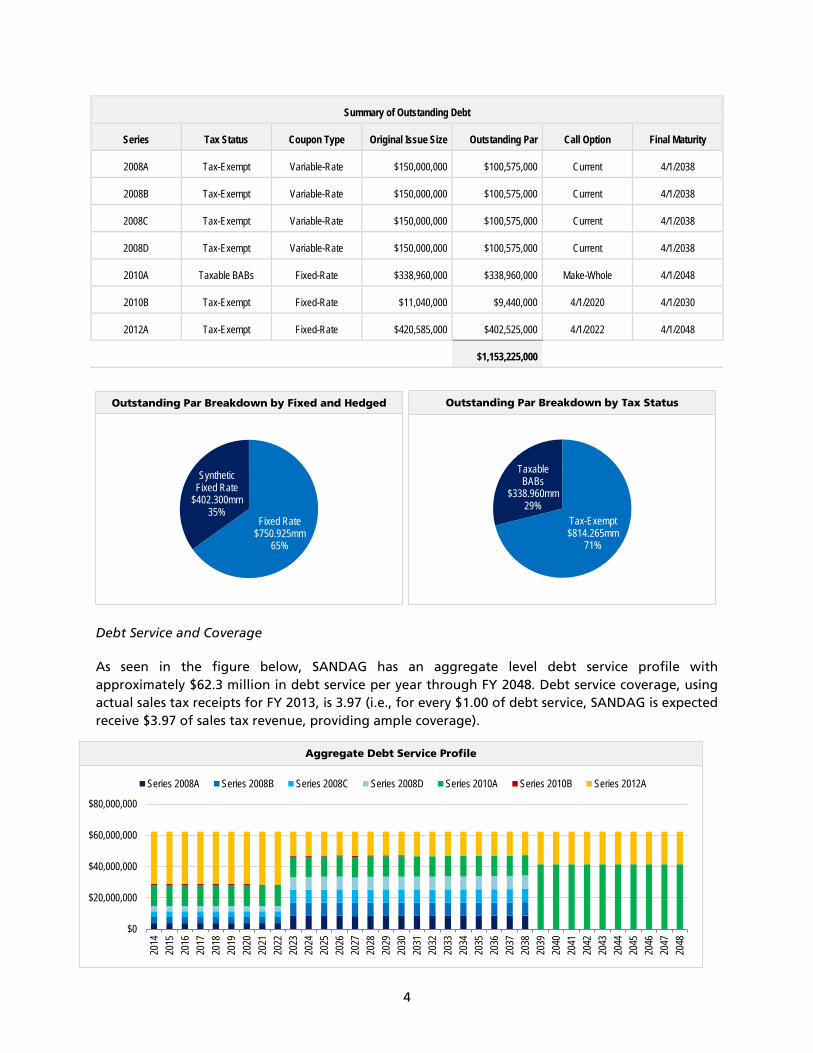
SANDAG has $1.15 billion of outstanding long-term debt, consisting of the Series 2008 variable-rate bonds, the 2010 Series A taxable Build America Bonds (BABs), the 2010 Series B tax-exempt fixed-rate bonds, and the 2012 Series A tax-exempt fixed-rate bonds. Of the total debt portfolio, 35 percent consists of synthetic fixed-rate bonds (variable-rate bonds hedged with fixed-payer interest rate swaps) and the remaining 65 percent are fixed-rate bonds. A summary of the outstanding bonds is tabulated and graphically presented on the next page.
3 Bloomberg Survey as of August 22, 2013
4
Summary of Outstanding Debt
Series Tax Status Coupon Type Original Issue Size Outstanding Par Call Option Final Maturity
2008A Tax-Exempt Variable-Rate $150,000,000 $100,575,000 Current 4/1/2038
2008B Tax-Exempt Variable-Rate $150,000,000 $100,575,000 Current 4/1/2038
2008C Tax-Exempt Variable-Rate $150,000,000 $100,575,000 Current 4/1/2038
2008D Tax-Exempt Variable-Rate $150,000,000 $100,575,000 Current 4/1/2038
2010A Taxable BABs Fixed-Rate $338,960,000 $338,960,000 Make-Whole 4/1/2048
2010B Tax-Exempt Fixed-Rate $11,040,000 $9,440,000 4/1/2020 4/1/2030
2012A Tax-Exempt Fixed-Rate $420,585,000 $402,525,000 4/1/2022 4/1/2048
$1,153,225,000
Debt Service and Coverage
As seen in the figure below, SANDAG has an aggregate level debt service profile with approximately $62.3 million in debt service per year through FY 2048. Debt service coverage, using actual sales tax receipts for FY 2013, is 3.97 (i.e., for every $1.00 of debt service, SANDAG is expected receive $3.97 of sales tax revenue, providing ample coverage).
Outstanding Par Breakdown by Fixed and Hedged
Tax-Exempt $814.265mm
71%
Taxable BABs
$338.960mm 29%
Outstanding Par Breakdown by Tax Status
Aggregate Debt Service Profile
Fixed Rate $750.925mm
65%
Synthetic Fixed Rate
$402.300mm 35%
$0
$20,000,000
$40,000,000
$60,000,000
$80,000,000
2014
2015
2016
2017
2018
2019
2020
2021
2022
2023
2024
2025
2026
2027
2028
2029
2030
2031
2032
2033
2034
2035
2036
2037
2038
2039
2040
2041
2042
2043
2044
2045
2046
2047
2048
Series 2008A Series 2008B Series 2008C Series 2008D Series 2010A Series 2010B Series 2012A
5
Recent Variable-Rate Demand Bond Performance
SANDAG has $402.3 million of outstanding variable-rate demand bonds (VRDBs) (Series 2008 A, B, C, and D), as shown below. These VRDBs are backed by Standby Bond Purchase Agreements (SBPAs) from certain financial institutions. The interest rate on these bonds resets weekly through a remarketing process. SANDAG VRDBs have been trading well, with their interest rate resets at or below the Securities Industry and Financial Markets Association (SIFMA) Index (the benchmark short-term municipal index) resets. On average, SANDAG VRDBs have reset at a rate of 0.12 percent to 0.13 percent since September 29, 2011.
SANDAG Series 2008ABCD VRDB Resets Since September 29, 2011
Series SBPA Provider Remarketing Agent Reset Average SIFMA Average Spread to SIFMA
2008A JP Morgan Chase Bank NA Barclays Capital Inc. 0.13% 0.14% -1 bps
2008B JP Morgan Chase Bank NA Goldman Sachs & Company 0.13% 0.14% -1 bps
2008C Mizuho Corporate Bank J.P. Morgan Securities LLC 0.13% 0.14% -1 bps
2008D State Street/CALSTRS E.J. De La Rosa & Company 0.12% 0.14% -2 bps
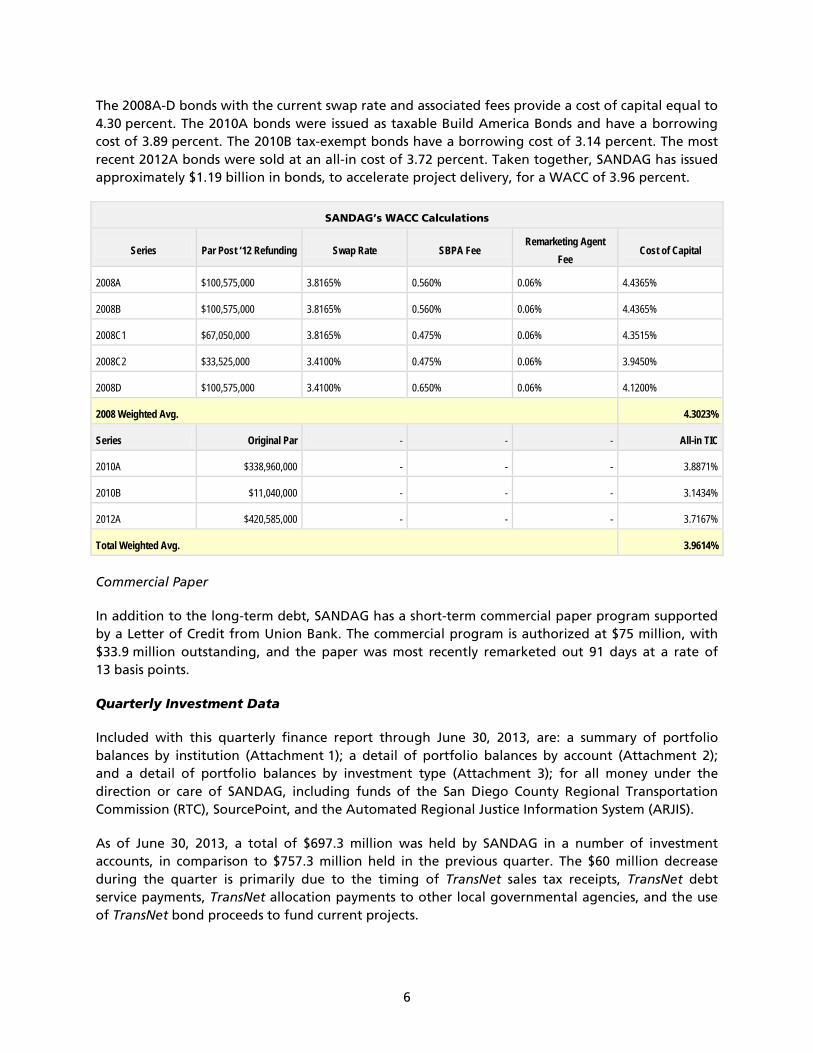
Cost of Capital
SANDAG has a very attractive weighted average cost of capital (WACC) of 3.96 percent. This cost can vary based upon swap performance and the cost of liquidity to support the variable-rate debt.
Bond Buyer Revenue Bond Index and SANDAG’s WACC
3.00%
3.50%
4.00%
4.50%
5.00%
5.50%
6.00%
6.50%
7.00%30-Year Fixed Rate Bond Buyer Revenue Bond Index SANDAG's Current Weighted Average Cost of Capital
Series 2008
Series 2010
Series 2012
6
The 2008A-D bonds with the current swap rate and associated fees provide a cost of capital equal to 4.30 percent. The 2010A bonds were issued as taxable Build America Bonds and have a borrowing cost of 3.89 percent. The 2010B tax-exempt bonds have a borrowing cost of 3.14 percent. The most recent 2012A bonds were sold at an all-in cost of 3.72 percent. Taken together, SANDAG has issued approximately $1.19 billion in bonds, to accelerate project delivery, for a WACC of 3.96 percent.
SANDAG’s WACC Calculations
Series Par Post ‘12 Refunding Swap Rate SBPA Fee Remarketing Agent
Fee Cost of Capital
2008A $100,575,000 3.8165% 0.560% 0.06% 4.4365%
2008B $100,575,000 3.8165% 0.560% 0.06% 4.4365%
2008C1 $67,050,000 3.8165% 0.475% 0.06% 4.3515%
2008C2 $33,525,000 3.4100% 0.475% 0.06% 3.9450%
2008D $100,575,000 3.4100% 0.650% 0.06% 4.1200%
2008 Weighted Avg. 4.3023%
Series Original Par - - - All-in TIC
2010A $338,960,000 - - - 3.8871%
2010B $11,040,000 - - - 3.1434%
2012A $420,585,000 - - - 3.7167%
Total Weighted Avg. 3.9614%
Commercial Paper
In addition to the long-term debt, SANDAG has a short-term commercial paper program supported by a Letter of Credit from Union Bank. The commercial program is authorized at $75 million, with $33.9 million outstanding, and the paper was most recently remarketed out 91 days at a rate of 13 basis points.
Quarterly Investment Data
Included with this quarterly finance report through June 30, 2013, are: a summary of portfolio balances by institution (Attachment 1); a detail of portfolio balances by account (Attachment 2); and a detail of portfolio balances by investment type (Attachment 3); for all money under the direction or care of SANDAG, including funds of the San Diego County Regional Transportation Commission (RTC), SourcePoint, and the Automated Regional Justice Information System (ARJIS).
As of June 30, 2013, a total of $697.3 million was held by SANDAG in a number of investment accounts, in comparison to $757.3 million held in the previous quarter. The $60 million decrease during the quarter is primarily due to the timing of TransNet sales tax receipts, TransNet debt service payments, TransNet allocation payments to other local governmental agencies, and the use of TransNet bond proceeds to fund current projects.
7
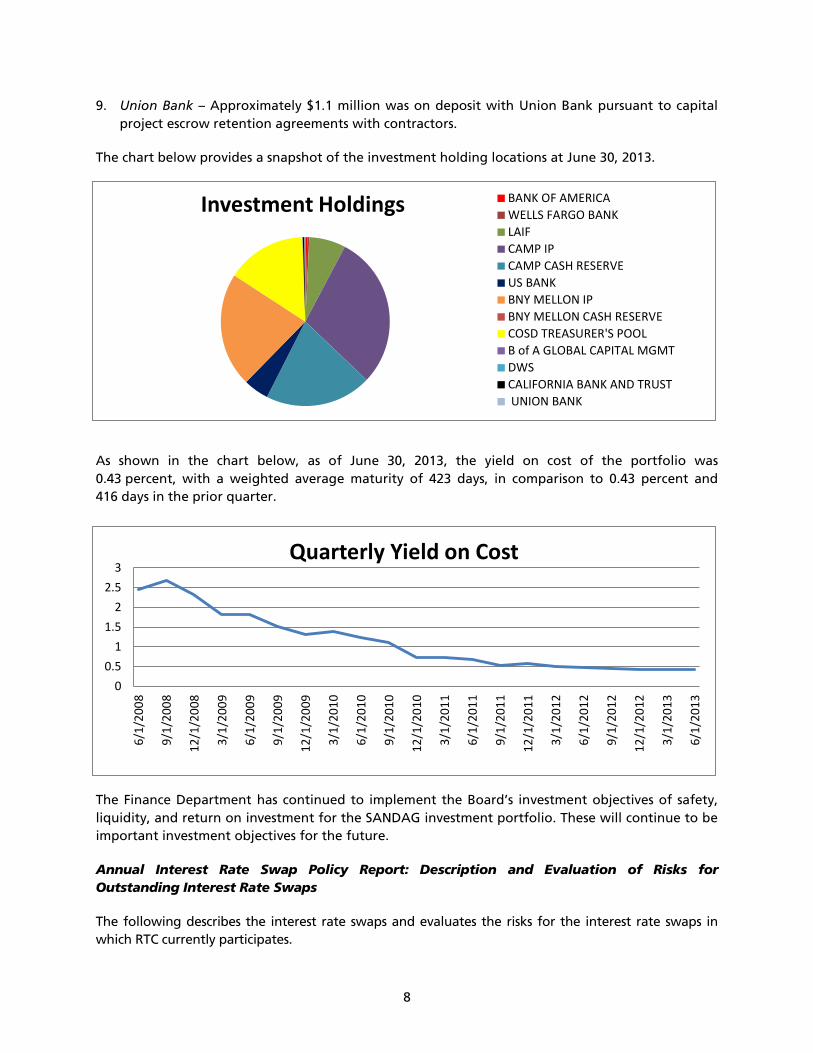
Approximately $2.7 million was held in eight Bank of America accounts and $2.7 million in two Wells Fargo accounts at the end of the quarter. Funds in these accounts are used for operating purposes. Approximately $691.9 million was invested in nine institutions, as follows:
1. State of California Local Agency Investment Fund (LAIF) – State law allows local agencies (RTC and SANDAG) to invest up to $50 million per agency in LAIF. These funds hold excess operating funds for RTC and SANDAG. A total of approximately $48.7 million was invested in LAIF, of which RTC held approximately $47.8 million of sales tax funds, and SANDAG held $954,811. These funds are highly liquid, and funds may be accessed easily for immediate operating needs.
2. California Asset Management Program (CAMP) – These are funds administered by one of the two SANDAG financial advisors, PFM Asset Management LLC. The Cash Reserve Portfolio, totaling $204.8 million, is used for the investment of the 2008, 2010, and 2012 TransNet bond proceeds and TransNet sales tax funds not yet paid for TransNet approved projects. In addition, CAMP uses the Individual Portfolio, totaling $142 million, for the investment of the 2008, 2010, and 2012 TransNet bond proceeds needed for payment in the short-term, and excess operating funds for Interstate 15 FasTrak®, State Route 125 (SR 125), ARJIS, and TransNet sales tax funds not yet paid to other local governmental agencies.
3. US Bank – These funds, totaling approximately $33.8 million, were held by US Bank, Trustee for bond debt service payments and payment of interest on the short-term Commercial Paper Program, as part of the TransNet Program, and for the toll revenues of the SR 125 franchise. Of this balance, $31.8 million of the investments held by US Bank is invested in North County Transit District auction rate securities purchased with commercial paper.
4. The Bank of New York Mellon – These are funds administered by one of the two SANDAG financial advisors, Cutwater Asset Management. The Individual Portfolio, totaling $152.2 million, and the Cash Reserve Portfolio, totaling $264,502, are used for the investment of excess TransNet sales tax revenue not yet paid for TransNet-approved projects.
5. San Diego County Treasurer’s Pooled Money Fund – These funds, totaling $106.4 million, were held by the San Diego’s County Treasurer’s Pooled Money Fund. The funds consist of the SourcePoint Cash Reserve Fund for the City of Santee, ARJIS, SANDAG Service Authority for Freeway Emergencies, TransNet sales tax revenues, and TransNet 2012 bond proceeds.
6. BofA Funds – These funds are invested in treasury reserves capital shares funds managed by BofA Global Capital Management, a division of Bank of America Corporation. These also are highly liquid and may be used for immediate cash needs. There was a total of $277,295 for Coronado Bridge Toll Funds held in trust by SANDAG that was invested in this mutual fund.
7. DWS Money Market Series Institutional Funds – This institution holds the funds received by SANDAG from the California Department of Boating and Waterways. There was a total of $268,551 in this mutual fund.
8. California Bank and Trust – There was approximately $2.3 million on deposit with California Bank and Trust pursuant to capital project escrow retention agreements with various contractors.
8
00.5
11.5
22.5
3
6/1/
2008
9/1/
2008
12/1
/200
8
3/1/
2009
6/1/
2009
9/1/
2009
12/1
/200
9
3/1/
2010
6/1/
2010
9/1/
2010
12/1
/201
0
3/1/
2011
6/1/
2011
9/1/
2011
12/1
/201
1
3/1/
2012
6/1/
2012
9/1/
2012
12/1
/201
2
3/1/
2013
6/1/
2013
Quarterly Yield on Cost
Investment Holdings BANK OF AMERICAWELLS FARGO BANKLAIFCAMP IPCAMP CASH RESERVEUS BANKBNY MELLON IPBNY MELLON CASH RESERVECOSD TREASURER'S POOLB of A GLOBAL CAPITAL MGMTDWSCALIFORNIA BANK AND TRUST UNION BANK
9. Union Bank – Approximately $1.1 million was on deposit with Union Bank pursuant to capital project escrow retention agreements with contractors.
The chart below provides a snapshot of the investment holding locations at June 30, 2013.
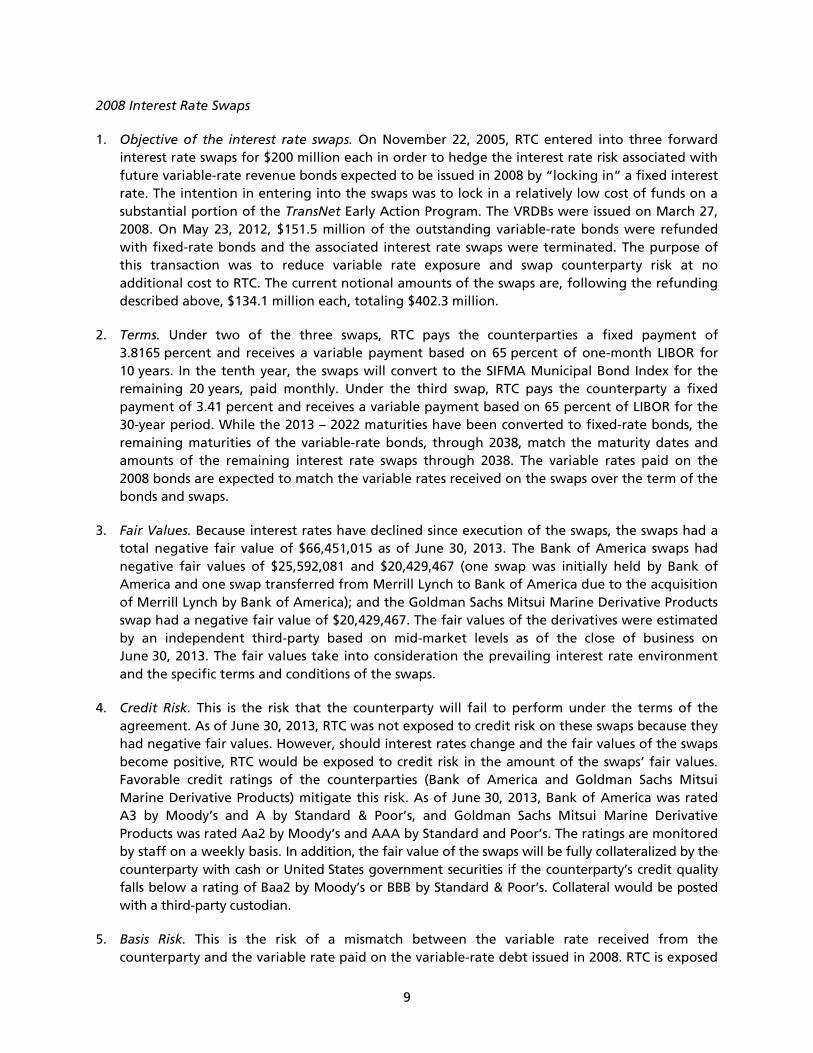
As shown in the chart below, as of June 30, 2013, the yield on cost of the portfolio was 0.43 percent, with a weighted average maturity of 423 days, in comparison to 0.43 percent and 416 days in the prior quarter.
The Finance Department has continued to implement the Board’s investment objectives of safety, liquidity, and return on investment for the SANDAG investment portfolio. These will continue to be important investment objectives for the future.
Annual Interest Rate Swap Policy Report: Description and Evaluation of Risks for Outstanding Interest Rate Swaps
The following describes the interest rate swaps and evaluates the risks for the interest rate swaps in which RTC currently participates.
9
2008 Interest Rate Swaps
1. Objective of the interest rate swaps. On November 22, 2005, RTC entered into three forward interest rate swaps for $200 million each in order to hedge the interest rate risk associated with future variable-rate revenue bonds expected to be issued in 2008 by “locking in” a fixed interest rate. The intention in entering into the swaps was to lock in a relatively low cost of funds on a substantial portion of the TransNet Early Action Program. The VRDBs were issued on March 27, 2008. On May 23, 2012, $151.5 million of the outstanding variable-rate bonds were refunded with fixed-rate bonds and the associated interest rate swaps were terminated. The purpose of this transaction was to reduce variable rate exposure and swap counterparty risk at no additional cost to RTC. The current notional amounts of the swaps are, following the refunding described above, $134.1 million each, totaling $402.3 million.
2. Terms. Under two of the three swaps, RTC pays the counterparties a fixed payment of 3.8165 percent and receives a variable payment based on 65 percent of one-month LIBOR for 10 years. In the tenth year, the swaps will convert to the SIFMA Municipal Bond Index for the remaining 20 years, paid monthly. Under the third swap, RTC pays the counterparty a fixed payment of 3.41 percent and receives a variable payment based on 65 percent of LIBOR for the 30-year period. While the 2013 – 2022 maturities have been converted to fixed-rate bonds, the remaining maturities of the variable-rate bonds, through 2038, match the maturity dates and amounts of the remaining interest rate swaps through 2038. The variable rates paid on the 2008 bonds are expected to match the variable rates received on the swaps over the term of the bonds and swaps.
3. Fair Values. Because interest rates have declined since execution of the swaps, the swaps had a total negative fair value of $66,451,015 as of June 30, 2013. The Bank of America swaps had negative fair values of $25,592,081 and $20,429,467 (one swap was initially held by Bank of America and one swap transferred from Merrill Lynch to Bank of America due to the acquisition of Merrill Lynch by Bank of America); and the Goldman Sachs Mitsui Marine Derivative Products swap had a negative fair value of $20,429,467. The fair values of the derivatives were estimated by an independent third-party based on mid-market levels as of the close of business on June 30, 2013. The fair values take into consideration the prevailing interest rate environment and the specific terms and conditions of the swaps.
4. Credit Risk. This is the risk that the counterparty will fail to perform under the terms of the agreement. As of June 30, 2013, RTC was not exposed to credit risk on these swaps because they had negative fair values. However, should interest rates change and the fair values of the swaps become positive, RTC would be exposed to credit risk in the amount of the swaps’ fair values. Favorable credit ratings of the counterparties (Bank of America and Goldman Sachs Mitsui Marine Derivative Products) mitigate this risk. As of June 30, 2013, Bank of America was rated A3 by Moody’s and A by Standard & Poor’s, and Goldman Sachs Mitsui Marine Derivative Products was rated Aa2 by Moody’s and AAA by Standard and Poor’s. The ratings are monitored by staff on a weekly basis. In addition, the fair value of the swaps will be fully collateralized by the counterparty with cash or United States government securities if the counterparty’s credit quality falls below a rating of Baa2 by Moody’s or BBB by Standard & Poor’s. Collateral would be posted with a third-party custodian.
5. Basis Risk. This is the risk of a mismatch between the variable rate received from the counterparty and the variable rate paid on the variable-rate debt issued in 2008. RTC is exposed
10
to basis risk should the floating rate that it receives on a swap be less than the actual variable rate RTC pays on the bonds. Depending on the magnitude and duration of any basis risk shortfall, the effective fixed rate on the debt will vary. Based on historical experience, the expectation is that the payments received under the agreements will approximate the expected bond payments over the 30-year term of the swaps. Due to the favorable market conditions during FY 2013, RTC was not exposed to basis risk since the variable rate received from the counterparty, which is 65 percent of LIBOR, was more than the variable rate RTC paid on the bonds. This savings for FY 2013 was $18,722 as compared to a negative of $1,029,325 in FY 2012.
6. Termination Risk and Termination Payments. This is the risk that the transaction is terminated in a market dictating a termination payment by RTC. RTC can terminate the swap at the fair value by providing notice to the counterparty, while the counterparty may only terminate the swap upon certain termination events under the terms of the agreement. RTC or the counterparties may terminate the swap if the other party fails to perform under the terms of the contracts, such as the failure to make swap payments. If the swap is terminated, the VRDBs would no longer be hedged. Given the negative fair value of June 30, 2013, RTC was not in a favorable termination position relative to the market. RTC effectively reduced the ongoing termination risk by refunding $151.5 million in VRDBs and terminating the same amount of the outstanding interest rate swaps in June 2012 under favorable market conditions with low fixed rates. Refunding additional maturities and terminating more of the interest rate swaps would have led to a net increase in debt service under a fixed-rate structure, which was contrary to RTC’s programmatic objectives. Consequently, the reduced amount of VRDBs and interest rate swaps was left in place.
7. Reset Rates Paid and Received by RTC. The weekly variable interest rates paid on the 2008 TransNet bonds by RTC to the bondholders for the period July 1, 2012, through June 30, 2013, ranged from 0.05 percent to 0.24 percent for Barclays Bank; 0.04 percent to 0.28 percent for Goldman, Sachs & Co.; 0.05 percent to 0.23 percent for J.P. Morgan Securities, Inc.; and 0.05 percent to 0.24 percent for EJ De La Rosa.
Fixed rates paid by RTC to the swap provider counterparties were 3.41 percent to Bank of America for one of the swaps, 3.8165 percent to Bank of America for another one of the swaps, and 3.8165 percent to Goldman Sachs Mitsui Marine Derivative Products. Sixty-five percent (65 percent) of LIBOR received by RTC from the swap provider counterparties ranged from 0.12596 percent to 0.15971 percent during the same time period.
8. Actual Debt Service Requirements versus the Projected Debt Service on the Swap Transaction. For the fiscal year ending June 30, 2013, Bank of America actual debt service was $4,558,287 versus projected debt service of $4,572,810 for one of the swaps, and was $5,118,069 versus projected debt service of $5,117,926 for the other Bank of America swap; and Goldman Sachs Mitsui Marine Derivative Products actual debt service was $5,113,585 versus projected debt service of $5,117,926 for its swap. In total, actual debt service was $14,789,941 versus projected debt service of $14,808,663, which resulted in a savings of variable rate payments received from the swap counterparties as compared to the variable rate payments made on the bonds in the amount of $18,722 for FY 2013. Over the life of the swaps from the issuance of the bonds through June 30, 2013, the cumulative excess of variable rate payments made on the bonds as compared to the variable rate payments received from the swap counterparties is $4,430,239. This means that the net variable rates RTC is paying on the 2008 TransNet bonds is more than
11
the variable rate RTC is receiving, and these rates were originally intended to offset and net to zero. Regardless, the debt program remains cost-effective in comparison to issuing fixed-rate bonds in March 2008.
The total net cost of the program includes liquidity facilities with JP Morgan (Series A and B), Mizuho Corporate Bank, Ltd (Series C), and State Street Bank and Trust Company and California State Teachers’ Retirement Fund (Series D). The SBPA cost for the Series A and B bonds is 56 basis points, the Series C bonds is 47.5 basis points, and the SBPA cost for the Series D bonds is 65 basis points.
2018 Basis Rate Swaps Overlay to the 2008 Interest Rate Swaps
1. Objective of the Basis Rate Swaps. On March 19, 2009, RTC entered into a SIFMA versus LIBOR floating-to-floating or “basis” swap. The combination of the Basis Swaps and the existing 2008 Interest Rate Swaps effectively amended the existing swaps without having to change the existing floating-to-fixed interest rate swaps. This overlay allowed RTC to bid out the new transaction to a group of potential counterparties without changing the existing 2008 Interest Rate Swaps. RTC was able to enter into a new transaction with Barclays Bank PLC to overlay the terms under two of the 2008 Interest Rate Swaps, with an expected benefit to RTC of a substantial reduction in the cost of debt after 2018.
2. Terms. The initial notional amounts of the swaps are $156.6 million each. Under two of the 2008 Interest Rate Swaps, RTC pays the counterparties a fixed payment of 3.8165 percent and receives 65 percent of LIBOR (through April 2018), and thereafter receives the SIFMA index. The 2018 Basis Rate Swaps overlay these two 2008 Interest Rate Swaps with a payment of the SIFMA index and a receipt of 107.4 percent of LIBOR for the last 20 years of the swap (April 2018 to April 2038).
3. Fair Values. The swaps had a total combined positive fair value of $18,307,130 as of June 30, 2013. The fair values of the derivatives were estimated by an independent third-party based on mid-market levels as of the close of business on June 30, 2013. The fair values take into consideration the prevailing interest rate environment and the specific terms and conditions of the swaps.
4. Credit Risk. This is the risk that the counterparty will fail to perform under the terms of the agreements. As of June 30, 2013, RTC was exposed to credit risk on these swaps in the amount of $18,307,130, which is the fair value of the derivatives. However, should interest rates change and the fair value of the swaps become negative, RTC would not be exposed to any credit risk. The favorable credit rating of the counterparty mitigates this risk. As of June 30, 2013, the swap counterparty, Barclays Bank PLC, was rated A2 by Moody’s and A+ by Standard & Poor’s.
5. Basis Risk. This is the risk of a mismatch between the variable rate received from the counterparty and the variable rate paid on the variable-rate debt issued in 2008. RTC is exposed to basis risk should the floating rate that it receives on a swap be less than the actual variable rate RTC pays on the bonds. Depending on the magnitude and duration of any basis risk shortfall, the effective fixed rate on the debt will vary. Based on current and historical experience, staff expects the overlay of the SIFMA to LIBOR Basis Rate Swaps to significantly reduce the costs of financing after 2018, assuming a return to normal, or even near to normal trading relationships.
12
6. Termination Risk and Termination Payments. This is the risk that the transaction is terminated in a market dictating a termination payment by RTC. RTC can terminate a swap at the fair market value by providing notice to the counterparty, while the counterparty only may terminate the swap upon certain termination events under the terms of the agreement. Given the positive fair value at June 30, 2013, RTC was in a favorable termination position relative to the market.
SANDAG Board Policy No. 032: The San Diego County Regional Transportation Commission Interest Rate Swap Policy requires a contingency plan to either replace the swaps or fund the termination payments, if any, in the event one or more outstanding swaps are terminated. Should a swap be terminated, the excellent credit rating of SANDAG would allow it to assign the swap to another counterparty. Alternatively, if a swap is terminated and it has a negative fair value, RTC could use TransNet sales tax receipts to fund the termination payment.
Certifications
The Director of Finance reports that this investment portfolio, together with the authorized short-term Commercial Paper program, will provide the necessary liquidity to meet the expenditure requirements of SANDAG, RTC, ARJIS, and SourcePoint for the next six months. This portfolio is in compliance with state law and Board Policy No. 003: Investment Policy.
The Director of Finance reports that there has not been any material event involving outstanding swap agreements, nor has there been any default by a swap counterparty or counterparty termination.
The Local Economy and Sales Tax Revenues
Three important trends have emerged locally that have led to positive gains in the economy, providing a solid foundation for a continuation in the growth of taxable sales. First is the growth in new jobs. According to the California Employment Development Department, for the second year in a row, the rate of local job growth is outpacing the nation; through July 2013 the San Diego region has added more than 19,000 new jobs. Second, the pace of job growth combined with slow labor force growth has pushed the unemployment rate down to 7.8 percent from 9.5 percent recorded in July 2012. Third, the average price of a house, according to the Case-Shiller Home Price Index, has risen nearly 20 percent over the past year, driven by a growing demand on a depleted inventory of units for sale. Despite some concerns early in the year over the possible impacts of sequestration, the local economy, for the most part, seems to have shrugged it off. All three of these trends are improving the financial condition of households in the region, which if the trends continue, would to lead to similar to slightly higher rates of growth in taxable retail sales during the coming year as experienced during the previous year. During FY 2013, TransNet sales tax revenue increased 4.34 percent compared to FY 2012.
Although the local economy seems to be moving progressively forward and most economists are expecting the second half of this year to be better than the first half, with the growth in gross domestic product (GDP) averaging 2.5 percent from 1.5 percent during the first half of the year, there are some broader concerns that could affect this trend. One is the actions of the Federal Reserve and its decision on whether to begin to taper the Quantitative Easing (QE) Program, designed to keep mid- to long-term interest rates low. Most public discussions concerning reducing the QE Program have unexpectedly sent shock waves into the financial markets, increasing uncertainty and sending interest rates higher. Some economists have expressed concern that the
13
spike in interest rates could dampen the turnaround currently underway in the housing market. This reaction has forced the Fed to re-think its plan to taper QE. The civil conflict in Syria has now become an international problem due to the use of chemical weapons, sending the price of commodities such as oil up sharply. (As a rule of thumb, for every $10 rise in the price per barrel of oil, GDP growth slows by 0.5 percent.)
In addition to these emerging concerns, the national and local economies have not yet fully recovered from the effects of the Great Recession. Most economists believe it will require additional time to repair the damage caused by the Great Recession; for example, the consensus expects 2014 to look more like the second half of 2013, with growth in GDP staying at or above 2.5 percent. Even with this expected improvement, the unemployment rate is projected to stay above pre-recession levels through 2015. The transition to more normal rates of economic growth will produce needed jobs and eventually bring down the unemployment rate. If the trends to a more robust economy continue, it will mean that SANDAG will face a different market when it receives construction bids for future projects. Material costs will likely rise and the number of bidders per project may be reduced. Both trends would likely push the cost of projects up.
Through the first quarter of FY 2014, sales tax revenue received from the State Board of Equalization was approximately 6.1 percent higher than revenue received during the same period last year. The positive growth in sales tax receipts is consistent with the SANDAG expectation that revenue increases will occur as the economy begins to experience increased job growth, which has occurred nationwide and locally over the past two-plus fiscal years. However, each year since the end of the recession, the rate of growth in sales tax revenue has been less than the previous year. This trend of smaller growth rates indicates that the economy may not be out of the woods yet, and likely faces challenges during the next couple of years. The SANDAG forecast of sales tax revenue growth of 5.0 percent for FY 2014 reflects this expected longer recovery period.
GARY L. GALLEGOS Executive Director
Attachments: 1. SANDAG Summary of Portfolio Balances (by Institution) as of June 30, 2013 2. SANDAG Detail of Portfolio Balances (by Account) as of June 30, 2013 3. SANDAG Detail of Portfolio Balances (by Investment Type) as of June 30, 2013 Key Staff Contacts: André Douzdjian, (619) 699-6931, [email protected]
Marney Cox, (619) 699-1960, [email protected] Lisa Kondrat-Dauphin (619) 699-1942, [email protected]
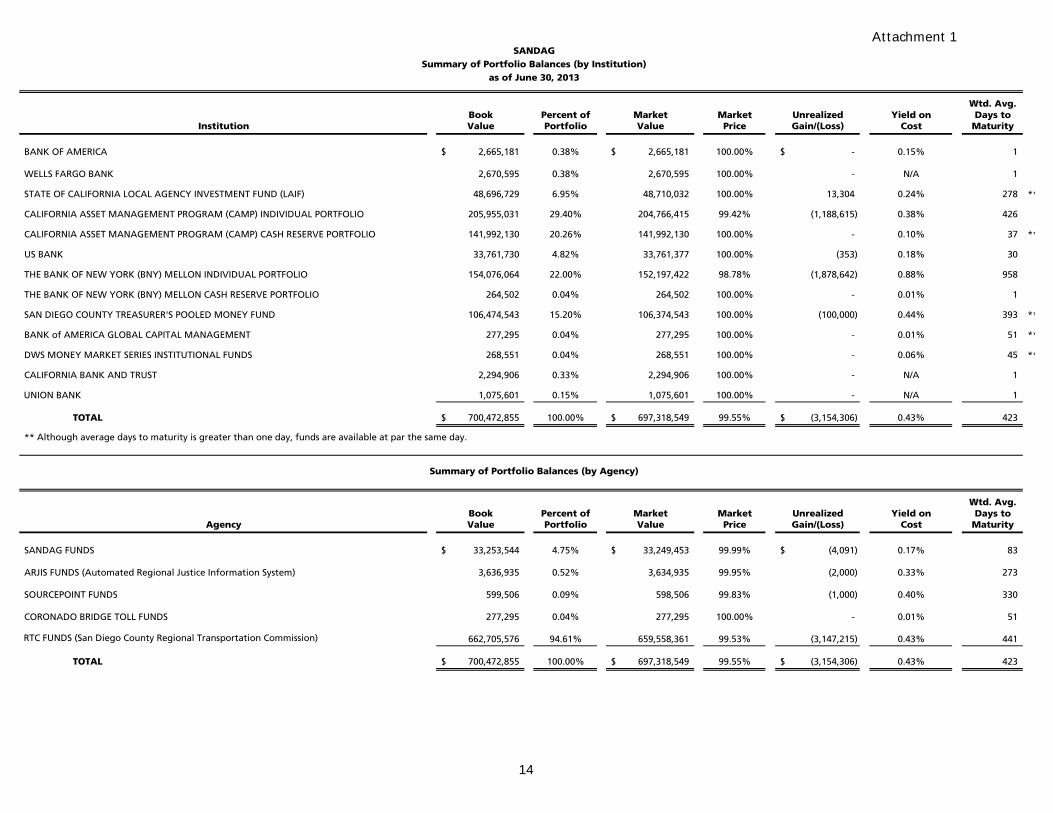
SANDAGSummary of Portfolio Balances (by Institution)
as of June 30, 2013
Wtd. Avg.Book Percent of Market Market Unrealized Yield on Days to
Institution Value Portfolio Value Price Gain/(Loss) Cost Maturity
BANK OF AMERICA 2,665,181$ 0.38% 2,665,181$ 100.00% -$ 0.15% 1
WELLS FARGO BANK 2,670,595 0.38% 2,670,595 100.00% - N/A 1
STATE OF CALIFORNIA LOCAL AGENCY INVESTMENT FUND (LAIF) 48,696,729 6.95% 48,710,032 100.00% 13,304 0.24% 278 **
CALIFORNIA ASSET MANAGEMENT PROGRAM (CAMP) INDIVIDUAL PORTFOLIO 205,955,031 29.40% 204,766,415 99.42% (1,188,615) 0.38% 426
CALIFORNIA ASSET MANAGEMENT PROGRAM (CAMP) CASH RESERVE PORTFOLIO 141,992,130 20.26% 141,992,130 100.00% - 0.10% 37 **
US BANK 33,761,730 4.82% 33,761,377 100.00% (353) 0.18% 30
THE BANK OF NEW YORK (BNY) MELLON INDIVIDUAL PORTFOLIO 154,076,064 22.00% 152,197,422 98.78% (1,878,642) 0.88% 958
THE BANK OF NEW YORK (BNY) MELLON CASH RESERVE PORTFOLIO 264,502 0.04% 264,502 100.00% - 0.01% 1
SAN DIEGO COUNTY TREASURER'S POOLED MONEY FUND 106,474,543 15.20% 106,374,543 100.00% (100,000) 0.44% 393 **
BANK of AMERICA GLOBAL CAPITAL MANAGEMENT 277,295 0.04% 277,295 100.00% - 0.01% 51 **
DWS MONEY MARKET SERIES INSTITUTIONAL FUNDS 268,551 0.04% 268,551 100.00% - 0.06% 45 **
CALIFORNIA BANK AND TRUST 2,294,906 0.33% 2,294,906 100.00% - N/A 1
UNION BANK 1,075,601 0.15% 1,075,601 100.00% - N/A 1
TOTAL 700,472,855$ 100.00% 697,318,549$ 99.55% (3,154,306)$ 0.43% 423
** Although average days to maturity is greater than one day, funds are available at par the same day.
Summary of Portfolio Balances (by Agency)
Wtd. Avg.Book Percent of Market Market Unrealized Yield on Days to
Agency Value Portfolio Value Price Gain/(Loss) Cost Maturity
SANDAG FUNDS 33,253,544$ 4.75% 33,249,453$ 99.99% (4,091)$ 0.17% 83
ARJIS FUNDS (Automated Regional Justice Information System) 3,636,935 0.52% 3,634,935 99.95% (2,000) 0.33% 273
SOURCEPOINT FUNDS 599,506 0.09% 598,506 99.83% (1,000) 0.40% 330
CORONADO BRIDGE TOLL FUNDS 277,295 0.04% 277,295 100.00% - 0.01% 51
RTC FUNDS (San Diego County Regional Transportation Commission) 662,705,576 94.61% 659,558,361 99.53% (3,147,215) 0.43% 441
TOTAL 700,472,855$ 100.00% 697,318,549$ 99.55% (3,154,306)$ 0.43% 423
Attachment 1
14
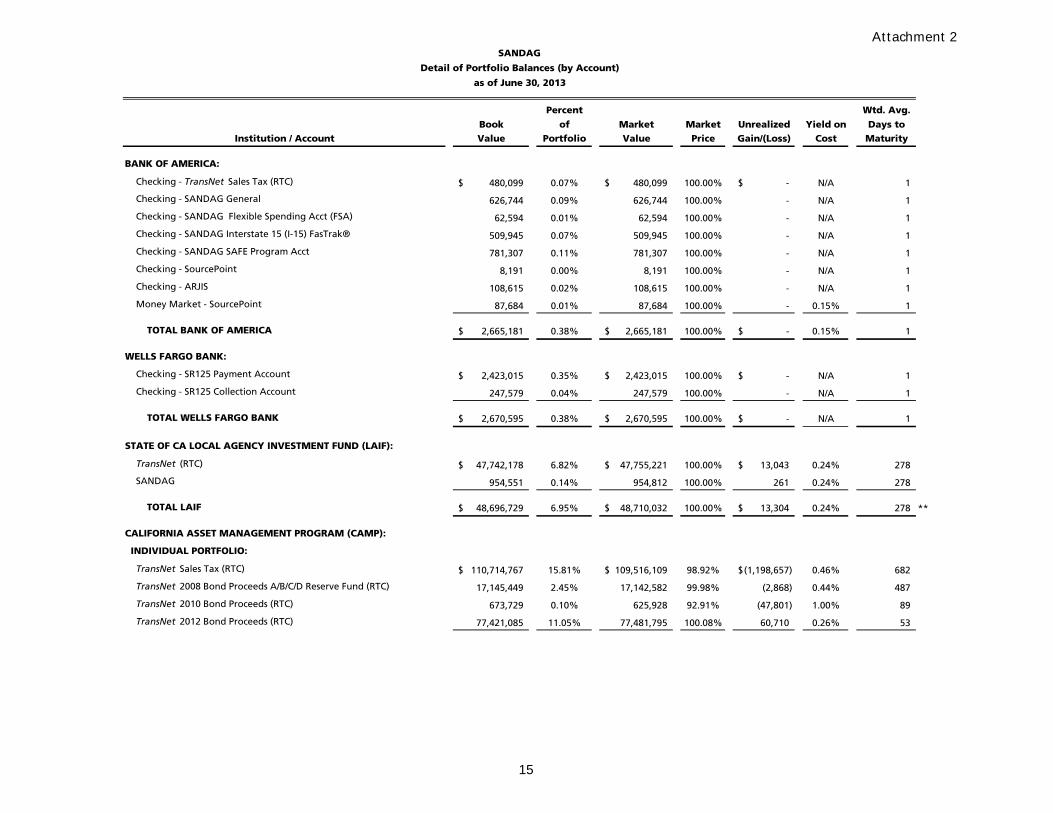
Percent Wtd. Avg.
Book of Market Market Unrealized Yield on Days toInstitution / Account Value Portfolio Value Price Gain/(Loss) Cost Maturity
BANK OF AMERICA:
Checking - TransNet Sales Tax (RTC) 480,099$ 0.07% 480,099$ 100.00% -$ N/A 1
Checking - SANDAG General 626,744 0.09% 626,744 100.00% - N/A 1
Checking - SANDAG Flexible Spending Acct (FSA) 62,594 0.01% 62,594 100.00% - N/A 1
Checking - SANDAG Interstate 15 (I-15) FasTrak® 509,945 0.07% 509,945 100.00% - N/A 1
Checking - SANDAG SAFE Program Acct 781,307 0.11% 781,307 100.00% - N/A 1
Checking - SourcePoint 8,191 0.00% 8,191 100.00% - N/A 1
Checking - ARJIS 108,615 0.02% 108,615 100.00% - N/A 1
Money Market - SourcePoint 87,684 0.01% 87,684 100.00% - 0.15% 1
TOTAL BANK OF AMERICA 2,665,181$ 0.38% 2,665,181$ 100.00% -$ 0.15% 1
WELLS FARGO BANK:
Checking - SR125 Payment Account 2,423,015$ 0.35% 2,423,015$ 100.00% -$ N/A 1
Checking - SR125 Collection Account 247,579 0.04% 247,579 100.00% - N/A 1
TOTAL WELLS FARGO BANK 2,670,595$ 0.38% 2,670,595$ 100.00% -$ N/A 1
STATE OF CA LOCAL AGENCY INVESTMENT FUND (LAIF):
TransNet (RTC) 47,742,178$ 6.82% 47,755,221$ 100.00% 13,043$ 0.24% 278
SANDAG 954,551 0.14% 954,812 100.00% 261 0.24% 278
TOTAL LAIF 48,696,729$ 6.95% 48,710,032$ 100.00% 13,304$ 0.24% 278 **
CALIFORNIA ASSET MANAGEMENT PROGRAM (CAMP):
INDIVIDUAL PORTFOLIO:
TransNet Sales Tax (RTC) 110,714,767$ 15.81% 109,516,109$ 98.92% (1,198,657)$ 0.46% 682
TransNet 2008 Bond Proceeds A/B/C/D Reserve Fund (RTC) 17,145,449 2.45% 17,142,582 99.98% (2,868) 0.44% 487
TransNet 2010 Bond Proceeds (RTC) 673,729 0.10% 625,928 92.91% (47,801) 1.00% 89
TransNet 2012 Bond Proceeds (RTC) 77,421,085 11.05% 77,481,795 100.08% 60,710 0.26% 53
SANDAG
Detail of Portfolio Balances (by Account)
as of June 30, 2013
15
Attachment 2
Percent Wtd. Avg.
Book of Market Market Unrealized Yield on Days toInstitution / Account Value Portfolio Value Price Gain/(Loss) Cost Maturity
SANDAG
Detail of Portfolio Balances (by Account)
as of June 30, 2013
TOTAL INDIVIDUAL PORTFOLIO 205,955,031$ 29.40% 204,766,415$ 99.42% (1,188,615)$ 0.38% 426
CASH RESERVE PORTFOLIO:
I-15 FasTrak® 618,797$ 0.09% 618,797$ 100.00% -$ 0.10% 37
ARJIS 1,106,145 0.16% 1,106,145 100.00% - 0.10% 37
California Coastal Commission 1,151,204 0.16% 1,151,204 100.00% - 0.10% 37
SANDAG SR -125 1,844,383 0.26% 1,844,383 100.00% - 0.10% 37
SANDAG Toll Road Project Maint 15,406,798 2.20% 15,406,798 100.00% - 0.10% 37
2008 Bond Series A/B/C/D Reserve Fund (RTC) 57,407 0.01% 57,407 100.00% - 0.18% 37
2008 Bond Series A - Principal (RTC) 67 0.00% 67 100.00% - 0.10% 37
2008 Bond Series B - Principal (RTC) 67 0.00% 67 100.00% - 0.10% 37
2008 Bond Series C - Principal (RTC) 67 0.00% 67 100.00% - 0.10% 37
2008 Bond Series D - Principal (RTC) 67 0.00% 67 100.00% - 0.10% 37
2010 Bond Series B - Project (RTC) 231,506 0.03% 231,506 100.00% - 0.10% 37
2010 Bond Series A - San Marcos Fund (RTC) 16,921,502 2.42% 16,921,502 100.00% - 0.10% 37
2010 Bond Series B - Principal (RTC) 147,582 0.02% 147,582 100.00% - 0.10% 37
2010 Bond Series B - Interest (RTC) 95,670 0.01% 95,670 100.00% - 0.10% 37
2010 Bond Series A - Interest (RTC) 5,010,650 0.72% 5,010,650 100.00% - 0.10% 37
2012 Bond Series A - Project (RTC) 76,581,207 10.93% 76,581,207 100.00% - 0.10% 37
2012 Bond Series A - Interest (RTC) 4,764,196 0.68% 4,764,196 100.00% - 0.10% 37
2012 Bond Series A - Principal (RTC) 3,624,975 0.52% 3,624,975 100.00% - 0.10% 37
2010 Bond Series A - Solana Beach Fund (RTC) 5,467,100 0.78% 5,467,100 100.00% - 0.10% 37
2008 Sales Tax Account - TransNet Extension (RTC) 7,752,072 1.11% 7,752,072 100.00% - 0.10% 37
Wetland Mitigation TransNet Sales Tax (RTC) 290,623 0.04% 290,623 100.00% - 0.10% 37
Sage Hill Endowment (RTC) 920,045 0.13% 920,045 100.00% - 0.10% 37
TOTAL CASH RESERVE PORTFOLIO 141,992,130$ 20.26% 141,992,130$ 100.00% -$ 0.10% 37 **
TOTAL CAMP 347,947,160$ 49.66% 346,758,545$ 99.66% (1,188,615)$ 0.27% 267
16
Percent Wtd. Avg.
Book of Market Market Unrealized Yield on Days toInstitution / Account Value Portfolio Value Price Gain/(Loss) Cost Maturity
SANDAG
Detail of Portfolio Balances (by Account)
as of June 30, 2013
US BANK:
MCCarthy Building Cos/SANDAG Escrow Fund 8,319$ 0.00% 8,319$ 100.00% -$ 0.01% 1
MCCarthy Building Cos/SANDAG Escrow Fund 50,038 0.01% 49,685 99.29% (353) 0.50% 1
SANDAG - Toll Road Project Revenue Fund 69,000 0.01% 69,000 100.00% - 0.05% 1
SANDAG - Toll Road Project Capital Expenditure Reserve 354,338 0.05% 354,338 100.00% - 0.05% 1
SANDAG - Toll Road Project Expense Fund - TIFIA Note Expense Acct 10,004 0.00% 10,004 100.00% - 0.05% 1
SANDAG - Toll Road Project Senior Obligation Debt Service - Interest 300 0.00% 300 100.00% - 0.05% 1
SANDAG - Toll Road Project Senior Obligation Debt Service - Principal 9 0.00% 9 100.00% - 0.00% 1
SANDAG - Toll Road Project Major Maintenance Reserve 15 0.00% 15 100.00% - 0.07% 1
SANDAG - Toll Road Proj First Subord Obl TransNet Payment 138 0.00% 138 100.00% - 0.05% 1
SANDAG - Toll Road Project SANDAG Distribution 1 0.00% 1 100.00% - 0.00% 1
2008 Bond Series A/B/C/D Main Interest (RTC) 1,251,538 0.18% 1,251,538 100.00% - 0.04% 1
Commercial Paper Series B - NCTD Interest (RTC) 239,018 0.03% 239,018 100.00% - 0.04% 1
NCTD Certificates of Participation 31,775,000 4.54% 31,775,000 100.00% - 0.19% 32
2010 Bonds Series A - Project Fund - San Marcos 470 0.00% 470 100.00% - 0.04% 1
2010 Bonds Series A - Project Fund - Solana Beach 119 0.00% 119 100.00% - 0.04% 1
2010 Bonds Series A & B Project Fund 0 0.00% 0 100.00% - 0.00% 1
2012 Bonds Series A - Project Fund 2 0.00% 2 100.00% - 0.00% 1
Sales Tax Revenue CP Notes Series B Interest (RTC) 2,921 0.00% 2,921 100.00% - 0.00% 1
Sales Tax Revenue CP Notes Series B Principal (RTC) 499 0.00% 499 100.00% - 0.00% 1
TOTAL US BANK 33,761,730$ 4.82% 33,761,377$ 100.00% (353)$ 0.18% 30
THE BANK OF NEW YORK MELLON:
INDIVIDUAL PORTFOLIO:
TransNet Extension (RTC) 154,076,064$ 22.00% 152,197,422$ 98.78% (1,878,642)$ 0.88% 958
TOTAL INDIVIDUAL PORTFOLIO 154,076,064$ 22.00% 152,197,422$ 98.78% (1,878,642)$ 0.88% 958
17
Percent Wtd. Avg.
Book of Market Market Unrealized Yield on Days toInstitution / Account Value Portfolio Value Price Gain/(Loss) Cost Maturity
SANDAG
Detail of Portfolio Balances (by Account)
as of June 30, 2013
CASH RESERVE:
TransNet Extension (RTC) 264,502$ 0.04% 264,502$ 100.00% -$ 0.01% 1
TOTAL CASH RESERVE 264,502$ 0.04% 264,502$ 100.00% -$ 0.01% 1
TOTAL THE BANK OF NEW YORK MELLON 154,340,566$ 22.03% 152,461,924$ 98.78% (1,878,642)$ 0.88% 957
SAN DIEGO COUNTY TREASURER'S POOLED MONEY FUND:
SourcePoint Cash Reserve Fund 503,630$ 0.07% 502,630$ 100.00% (1,000)$ 0.44% 393
TransNet Extension (RTC) 48,903,271 6.98% 48,857,271 100.00% (46,000) 0.44% 393
ARJIS 2,422,175 0.35% 2,420,175 100.00% (2,000) 0.44% 393
TransNet 2012 Bond Proceeds (RTC) 50,150,061 7.16% 50,103,061 100.00% (47,000) 0.44% 393
SANDAG SAFE Program 4,495,405 0.64% 4,491,405 100.00% (4,000) 0.44% 393
TOTAL SAN DIEGO COUNTY TREASURER'S POOLED MONEY FUND 106,474,543$ 15.20% 106,374,543$ 100.00% (100,000)$ 0.44% 393 **
BofA FUNDS (BANK OF AMERICA CORPORATION):
TREASURY RESERVES CAPITAL SHARES FUND:
Coronado Bridge Toll Funds 277,295$ 0.04% 277,295$ 100.00% -$ 0.01% 51
TOTAL BOFA FUNDS (BANK OF AMERICA CORPORATION) 277,295$ 0.04% 277,295$ 100.00% -$ 0.01% 51 **
DWS MONEY MARKET SERIES INSTITUTIONAL FUNDS:
California Boating & Waterways 268,551$ 0.04% 268,551$ 100.00% -$ 0.06% 45 **
TOTAL DWS MONEY MARKET SERIES INSTITUTIONAL FUNDS 268,551$ 0.04% 268,551$ 100.00% -$ 0.06% 45
CALIFORNIA BANK AND TRUST
Capital Project Retention Accounts 2,294,906$ 0.33% 2,294,906$ 100.00% -$ N/A 1
TOTAL CALIFORNIA BANK AND TRUST 2,294,906$ 0.33% 2,294,906$ 100.00% -$ N/A 1
18
Percent Wtd. Avg.
Book of Market Market Unrealized Yield on Days toInstitution / Account Value Portfolio Value Price Gain/(Loss) Cost Maturity
SANDAG
Detail of Portfolio Balances (by Account)
as of June 30, 2013
UNION BANK
Capital Project Retention Accounts 1,075,601$ 0.15% 1,075,601$ 100.00% -$ N/A 1
TOTAL UNION BANK 1,075,601$ 0.15% 1,075,601$ 100.00% -$ N/A 1
TOTAL 700,472,855$ 100.00% 697,318,549$ 99.55% (3,154,306)$ 0.43% 423
Legend:
Automated Regional Justice Information System (ARJIS)
Commercial Paper (CP)
State of California Local Agency Investment Fund (LAIF)
North County Transit District (NCTD)
San Diego County Regional Transportation Commission (RTC)
** Although average days to maturity is greater than one day, funds are available at par the same day.
19
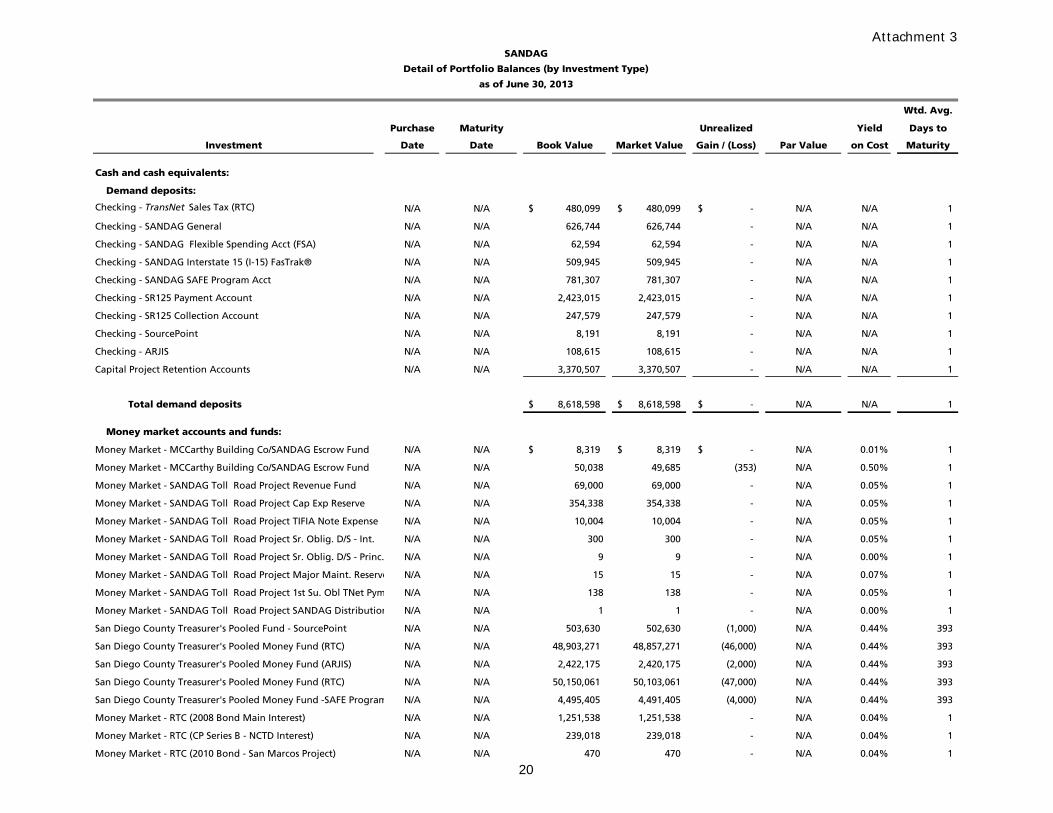
Wtd. Avg.
Purchase Maturity Unrealized Yield Days to
Investment Date Date Book Value Market Value Gain / (Loss) Par Value on Cost Maturity
Cash and cash equivalents:
Demand deposits:
Checking - TransNet Sales Tax (RTC) N/A N/A 480,099$ 480,099$ -$ N/A N/A 1
Checking - SANDAG General N/A N/A 626,744 626,744 - N/A N/A 1
Checking - SANDAG Flexible Spending Acct (FSA) N/A N/A 62,594 62,594 - N/A N/A 1
Checking - SANDAG Interstate 15 (I-15) FasTrak® N/A N/A 509,945 509,945 - N/A N/A 1
Checking - SANDAG SAFE Program Acct N/A N/A 781,307 781,307 - N/A N/A 1
Checking - SR125 Payment Account N/A N/A 2,423,015 2,423,015 - N/A N/A 1
Checking - SR125 Collection Account N/A N/A 247,579 247,579 - N/A N/A 1
Checking - SourcePoint N/A N/A 8,191 8,191 - N/A N/A 1
Checking - ARJIS N/A N/A 108,615 108,615 - N/A N/A 1
Capital Project Retention Accounts N/A N/A 3,370,507 3,370,507 - N/A N/A 1
Total demand deposits 8,618,598$ 8,618,598$ -$ N/A N/A 1
Money market accounts and funds:
Money Market - MCCarthy Building Co/SANDAG Escrow Fund N/A N/A 8,319$ 8,319$ -$ N/A 0.01% 1
Money Market - MCCarthy Building Co/SANDAG Escrow Fund N/A N/A 50,038 49,685 (353) N/A 0.50% 1
Money Market - SANDAG Toll Road Project Revenue Fund N/A N/A 69,000 69,000 - N/A 0.05% 1
Money Market - SANDAG Toll Road Project Cap Exp Reserve N/A N/A 354,338 354,338 - N/A 0.05% 1
Money Market - SANDAG Toll Road Project TIFIA Note Expense N/A N/A 10,004 10,004 - N/A 0.05% 1
Money Market - SANDAG Toll Road Project Sr. Oblig. D/S - Int. N/A N/A 300 300 - N/A 0.05% 1
Money Market - SANDAG Toll Road Project Sr. Oblig. D/S - Princ. N/A N/A 9 9 - N/A 0.00% 1
Money Market - SANDAG Toll Road Project Major Maint. Reserve N/A N/A 15 15 - N/A 0.07% 1
Money Market - SANDAG Toll Road Project 1st Su. Obl TNet Pym N/A N/A 138 138 - N/A 0.05% 1
Money Market - SANDAG Toll Road Project SANDAG Distribution N/A N/A 1 1 - N/A 0.00% 1
San Diego County Treasurer's Pooled Fund - SourcePoint N/A N/A 503,630 502,630 (1,000) N/A 0.44% 393
San Diego County Treasurer's Pooled Money Fund (RTC) N/A N/A 48,903,271 48,857,271 (46,000) N/A 0.44% 393
San Diego County Treasurer's Pooled Money Fund (ARJIS) N/A N/A 2,422,175 2,420,175 (2,000) N/A 0.44% 393
San Diego County Treasurer's Pooled Money Fund (RTC) N/A N/A 50,150,061 50,103,061 (47,000) N/A 0.44% 393
San Diego County Treasurer's Pooled Money Fund -SAFE Program N/A N/A 4,495,405 4,491,405 (4,000) N/A 0.44% 393
Money Market - RTC (2008 Bond Main Interest) N/A N/A 1,251,538 1,251,538 - N/A 0.04% 1
Money Market - RTC (CP Series B - NCTD Interest) N/A N/A 239,018 239,018 - N/A 0.04% 1
Money Market - RTC (2010 Bond - San Marcos Project) N/A N/A 470 470 - N/A 0.04% 1
SANDAG
Detail of Portfolio Balances (by Investment Type)
as of June 30, 2013
Attachment 3
20
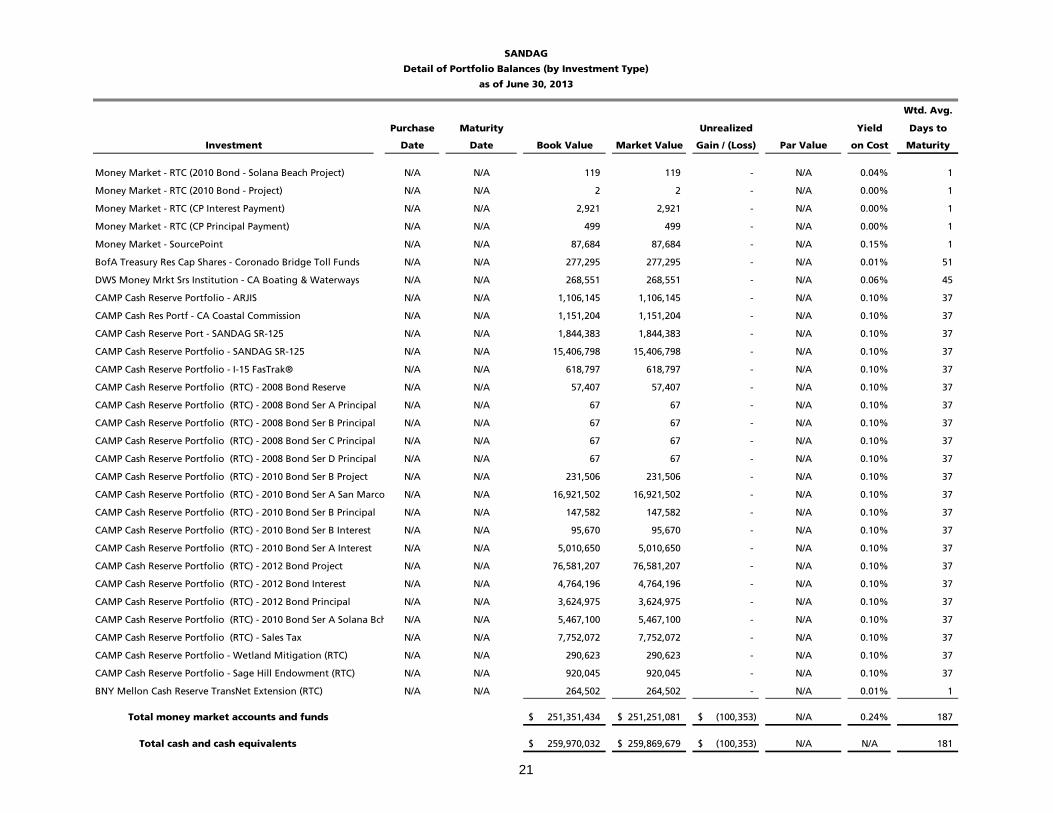
Wtd. Avg.
Purchase Maturity Unrealized Yield Days to
Investment Date Date Book Value Market Value Gain / (Loss) Par Value on Cost Maturity
SANDAG
Detail of Portfolio Balances (by Investment Type)
as of June 30, 2013
Money Market - RTC (2010 Bond - Solana Beach Project) N/A N/A 119 119 - N/A 0.04% 1
Money Market - RTC (2010 Bond - Project) N/A N/A 2 2 - N/A 0.00% 1
Money Market - RTC (CP Interest Payment) N/A N/A 2,921 2,921 - N/A 0.00% 1
Money Market - RTC (CP Principal Payment) N/A N/A 499 499 - N/A 0.00% 1
Money Market - SourcePoint N/A N/A 87,684 87,684 - N/A 0.15% 1
BofA Treasury Res Cap Shares - Coronado Bridge Toll Funds N/A N/A 277,295 277,295 - N/A 0.01% 51
DWS Money Mrkt Srs Institution - CA Boating & Waterways N/A N/A 268,551 268,551 - N/A 0.06% 45
CAMP Cash Reserve Portfolio - ARJIS N/A N/A 1,106,145 1,106,145 - N/A 0.10% 37
CAMP Cash Res Portf - CA Coastal Commission N/A N/A 1,151,204 1,151,204 - N/A 0.10% 37
CAMP Cash Reserve Port - SANDAG SR-125 N/A N/A 1,844,383 1,844,383 - N/A 0.10% 37
CAMP Cash Reserve Portfolio - SANDAG SR-125 N/A N/A 15,406,798 15,406,798 - N/A 0.10% 37
CAMP Cash Reserve Portfolio - I-15 FasTrak® N/A N/A 618,797 618,797 - N/A 0.10% 37
CAMP Cash Reserve Portfolio (RTC) - 2008 Bond Reserve N/A N/A 57,407 57,407 - N/A 0.10% 37
CAMP Cash Reserve Portfolio (RTC) - 2008 Bond Ser A Principal N/A N/A 67 67 - N/A 0.10% 37
CAMP Cash Reserve Portfolio (RTC) - 2008 Bond Ser B Principal N/A N/A 67 67 - N/A 0.10% 37
CAMP Cash Reserve Portfolio (RTC) - 2008 Bond Ser C Principal N/A N/A 67 67 - N/A 0.10% 37
CAMP Cash Reserve Portfolio (RTC) - 2008 Bond Ser D Principal N/A N/A 67 67 - N/A 0.10% 37
CAMP Cash Reserve Portfolio (RTC) - 2010 Bond Ser B Project N/A N/A 231,506 231,506 - N/A 0.10% 37
CAMP Cash Reserve Portfolio (RTC) - 2010 Bond Ser A San Marco N/A N/A 16,921,502 16,921,502 - N/A 0.10% 37
CAMP Cash Reserve Portfolio (RTC) - 2010 Bond Ser B Principal N/A N/A 147,582 147,582 - N/A 0.10% 37
CAMP Cash Reserve Portfolio (RTC) - 2010 Bond Ser B Interest N/A N/A 95,670 95,670 - N/A 0.10% 37
CAMP Cash Reserve Portfolio (RTC) - 2010 Bond Ser A Interest N/A N/A 5,010,650 5,010,650 - N/A 0.10% 37
CAMP Cash Reserve Portfolio (RTC) - 2012 Bond Project N/A N/A 76,581,207 76,581,207 - N/A 0.10% 37
CAMP Cash Reserve Portfolio (RTC) - 2012 Bond Interest N/A N/A 4,764,196 4,764,196 - N/A 0.10% 37
CAMP Cash Reserve Portfolio (RTC) - 2012 Bond Principal N/A N/A 3,624,975 3,624,975 - N/A 0.10% 37
CAMP Cash Reserve Portfolio (RTC) - 2010 Bond Ser A Solana Bch N/A N/A 5,467,100 5,467,100 - N/A 0.10% 37
CAMP Cash Reserve Portfolio (RTC) - Sales Tax N/A N/A 7,752,072 7,752,072 - N/A 0.10% 37
CAMP Cash Reserve Portfolio - Wetland Mitigation (RTC) N/A N/A 290,623 290,623 - N/A 0.10% 37
CAMP Cash Reserve Portfolio - Sage Hill Endowment (RTC) N/A N/A 920,045 920,045 - N/A 0.10% 37
BNY Mellon Cash Reserve TransNet Extension (RTC) N/A N/A 264,502 264,502 - N/A 0.01% 1
Total money market accounts and funds 251,351,434$ 251,251,081$ (100,353)$ N/A 0.24% 187
Total cash and cash equivalents 259,970,032$ 259,869,679$ (100,353)$ N/A N/A 181
21
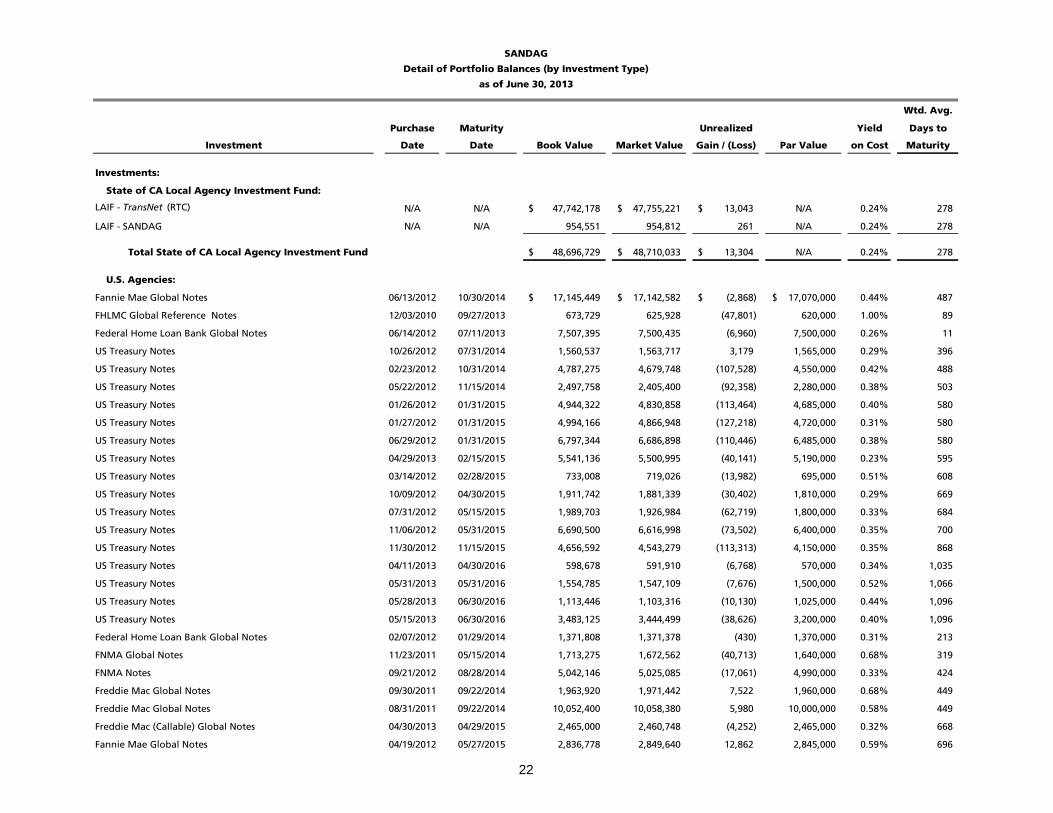
Wtd. Avg.
Purchase Maturity Unrealized Yield Days to
Investment Date Date Book Value Market Value Gain / (Loss) Par Value on Cost Maturity
SANDAG
Detail of Portfolio Balances (by Investment Type)
as of June 30, 2013
Investments:
State of CA Local Agency Investment Fund:
LAIF - TransNet (RTC) N/A N/A 47,742,178$ 47,755,221$ 13,043$ N/A 0.24% 278
LAIF - SANDAG N/A N/A 954,551 954,812 261 N/A 0.24% 278
Total State of CA Local Agency Investment Fund 48,696,729$ 48,710,033$ 13,304$ N/A 0.24% 278
U.S. Agencies:
Fannie Mae Global Notes 06/13/2012 10/30/2014 17,145,449$ 17,142,582$ (2,868)$ 17,070,000$ 0.44% 487
FHLMC Global Reference Notes 12/03/2010 09/27/2013 673,729 625,928 (47,801) 620,000 1.00% 89
Federal Home Loan Bank Global Notes 06/14/2012 07/11/2013 7,507,395 7,500,435 (6,960) 7,500,000 0.26% 11
US Treasury Notes 10/26/2012 07/31/2014 1,560,537 1,563,717 3,179 1,565,000 0.29% 396
US Treasury Notes 02/23/2012 10/31/2014 4,787,275 4,679,748 (107,528) 4,550,000 0.42% 488
US Treasury Notes 05/22/2012 11/15/2014 2,497,758 2,405,400 (92,358) 2,280,000 0.38% 503
US Treasury Notes 01/26/2012 01/31/2015 4,944,322 4,830,858 (113,464) 4,685,000 0.40% 580
US Treasury Notes 01/27/2012 01/31/2015 4,994,166 4,866,948 (127,218) 4,720,000 0.31% 580
US Treasury Notes 06/29/2012 01/31/2015 6,797,344 6,686,898 (110,446) 6,485,000 0.38% 580
US Treasury Notes 04/29/2013 02/15/2015 5,541,136 5,500,995 (40,141) 5,190,000 0.23% 595
US Treasury Notes 03/14/2012 02/28/2015 733,008 719,026 (13,982) 695,000 0.51% 608
US Treasury Notes 10/09/2012 04/30/2015 1,911,742 1,881,339 (30,402) 1,810,000 0.29% 669
US Treasury Notes 07/31/2012 05/15/2015 1,989,703 1,926,984 (62,719) 1,800,000 0.33% 684
US Treasury Notes 11/06/2012 05/31/2015 6,690,500 6,616,998 (73,502) 6,400,000 0.35% 700
US Treasury Notes 11/30/2012 11/15/2015 4,656,592 4,543,279 (113,313) 4,150,000 0.35% 868
US Treasury Notes 04/11/2013 04/30/2016 598,678 591,910 (6,768) 570,000 0.34% 1,035
US Treasury Notes 05/31/2013 05/31/2016 1,554,785 1,547,109 (7,676) 1,500,000 0.52% 1,066
US Treasury Notes 05/28/2013 06/30/2016 1,113,446 1,103,316 (10,130) 1,025,000 0.44% 1,096
US Treasury Notes 05/15/2013 06/30/2016 3,483,125 3,444,499 (38,626) 3,200,000 0.40% 1,096
Federal Home Loan Bank Global Notes 02/07/2012 01/29/2014 1,371,808 1,371,378 (430) 1,370,000 0.31% 213
FNMA Global Notes 11/23/2011 05/15/2014 1,713,275 1,672,562 (40,713) 1,640,000 0.68% 319
FNMA Notes 09/21/2012 08/28/2014 5,042,146 5,025,085 (17,061) 4,990,000 0.33% 424
Freddie Mac Global Notes 09/30/2011 09/22/2014 1,963,920 1,971,442 7,522 1,960,000 0.68% 449
Freddie Mac Global Notes 08/31/2011 09/22/2014 10,052,400 10,058,380 5,980 10,000,000 0.58% 449
Freddie Mac (Callable) Global Notes 04/30/2013 04/29/2015 2,465,000 2,460,748 (4,252) 2,465,000 0.32% 668
Fannie Mae Global Notes 04/19/2012 05/27/2015 2,836,778 2,849,640 12,862 2,845,000 0.59% 696
22
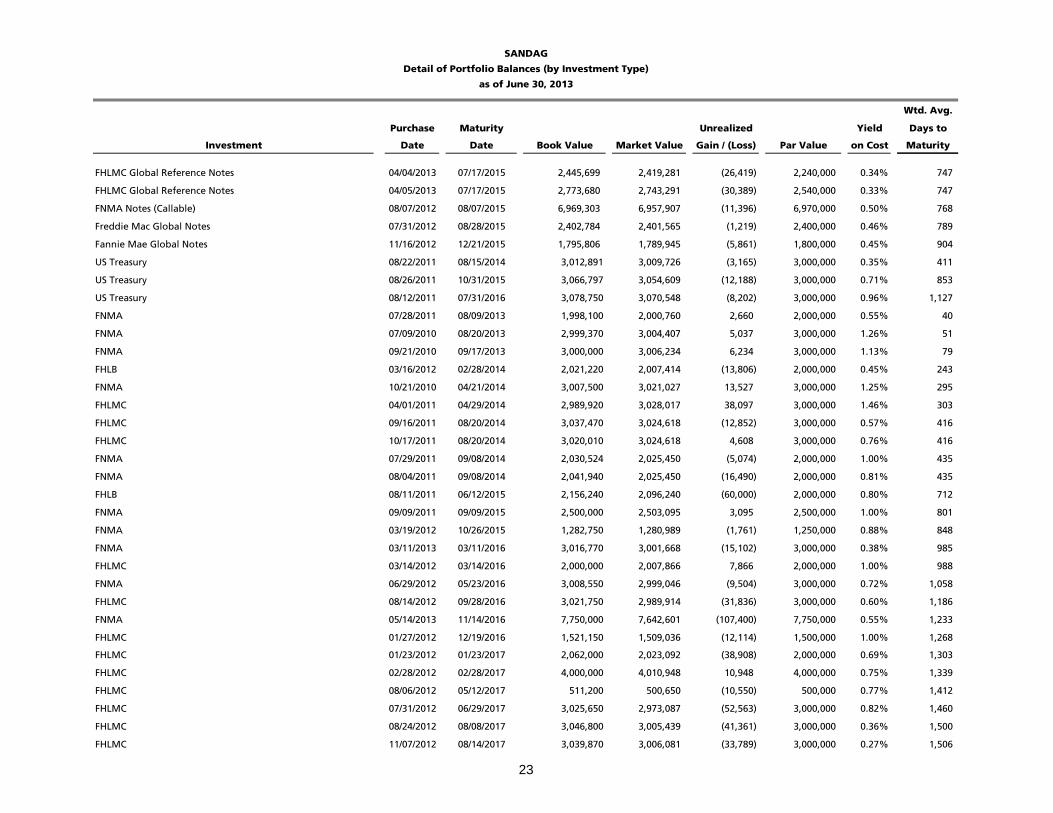
Wtd. Avg.
Purchase Maturity Unrealized Yield Days to
Investment Date Date Book Value Market Value Gain / (Loss) Par Value on Cost Maturity
SANDAG
Detail of Portfolio Balances (by Investment Type)
as of June 30, 2013
FHLMC Global Reference Notes 04/04/2013 07/17/2015 2,445,699 2,419,281 (26,419) 2,240,000 0.34% 747
FHLMC Global Reference Notes 04/05/2013 07/17/2015 2,773,680 2,743,291 (30,389) 2,540,000 0.33% 747
FNMA Notes (Callable) 08/07/2012 08/07/2015 6,969,303 6,957,907 (11,396) 6,970,000 0.50% 768
Freddie Mac Global Notes 07/31/2012 08/28/2015 2,402,784 2,401,565 (1,219) 2,400,000 0.46% 789
Fannie Mae Global Notes 11/16/2012 12/21/2015 1,795,806 1,789,945 (5,861) 1,800,000 0.45% 904
US Treasury 08/22/2011 08/15/2014 3,012,891 3,009,726 (3,165) 3,000,000 0.35% 411
US Treasury 08/26/2011 10/31/2015 3,066,797 3,054,609 (12,188) 3,000,000 0.71% 853
US Treasury 08/12/2011 07/31/2016 3,078,750 3,070,548 (8,202) 3,000,000 0.96% 1,127
FNMA 07/28/2011 08/09/2013 1,998,100 2,000,760 2,660 2,000,000 0.55% 40
FNMA 07/09/2010 08/20/2013 2,999,370 3,004,407 5,037 3,000,000 1.26% 51
FNMA 09/21/2010 09/17/2013 3,000,000 3,006,234 6,234 3,000,000 1.13% 79
FHLB 03/16/2012 02/28/2014 2,021,220 2,007,414 (13,806) 2,000,000 0.45% 243
FNMA 10/21/2010 04/21/2014 3,007,500 3,021,027 13,527 3,000,000 1.25% 295
FHLMC 04/01/2011 04/29/2014 2,989,920 3,028,017 38,097 3,000,000 1.46% 303
FHLMC 09/16/2011 08/20/2014 3,037,470 3,024,618 (12,852) 3,000,000 0.57% 416
FHLMC 10/17/2011 08/20/2014 3,020,010 3,024,618 4,608 3,000,000 0.76% 416
FNMA 07/29/2011 09/08/2014 2,030,524 2,025,450 (5,074) 2,000,000 1.00% 435
FNMA 08/04/2011 09/08/2014 2,041,940 2,025,450 (16,490) 2,000,000 0.81% 435
FHLB 08/11/2011 06/12/2015 2,156,240 2,096,240 (60,000) 2,000,000 0.80% 712
FNMA 09/09/2011 09/09/2015 2,500,000 2,503,095 3,095 2,500,000 1.00% 801
FNMA 03/19/2012 10/26/2015 1,282,750 1,280,989 (1,761) 1,250,000 0.88% 848
FNMA 03/11/2013 03/11/2016 3,016,770 3,001,668 (15,102) 3,000,000 0.38% 985
FHLMC 03/14/2012 03/14/2016 2,000,000 2,007,866 7,866 2,000,000 1.00% 988
FNMA 06/29/2012 05/23/2016 3,008,550 2,999,046 (9,504) 3,000,000 0.72% 1,058
FHLMC 08/14/2012 09/28/2016 3,021,750 2,989,914 (31,836) 3,000,000 0.60% 1,186
FNMA 05/14/2013 11/14/2016 7,750,000 7,642,601 (107,400) 7,750,000 0.55% 1,233
FHLMC 01/27/2012 12/19/2016 1,521,150 1,509,036 (12,114) 1,500,000 1.00% 1,268
FHLMC 01/23/2012 01/23/2017 2,062,000 2,023,092 (38,908) 2,000,000 0.69% 1,303
FHLMC 02/28/2012 02/28/2017 4,000,000 4,010,948 10,948 4,000,000 0.75% 1,339
FHLMC 08/06/2012 05/12/2017 511,200 500,650 (10,550) 500,000 0.77% 1,412
FHLMC 07/31/2012 06/29/2017 3,025,650 2,973,087 (52,563) 3,000,000 0.82% 1,460
FHLMC 08/24/2012 08/08/2017 3,046,800 3,005,439 (41,361) 3,000,000 0.36% 1,500
FHLMC 11/07/2012 08/14/2017 3,039,870 3,006,081 (33,789) 3,000,000 0.27% 1,506
23
Wtd. Avg.
Purchase Maturity Unrealized Yield Days to
Investment Date Date Book Value Market Value Gain / (Loss) Par Value on Cost Maturity
SANDAG
Detail of Portfolio Balances (by Investment Type)
as of June 30, 2013
FHLMC 12/31/2012 08/14/2017 3,032,250 3,006,081 (26,169) 3,000,000 0.26% 1,506
FHLMC 01/11/2013 08/14/2017 3,536,295 3,507,095 (29,201) 3,500,000 0.24% 1,506
FNMA 11/30/2012 09/20/2017 3,508,400 3,420,795 (87,605) 3,500,000 0.70% 1,543
FNMA 12/05/2012 09/20/2017 1,002,750 977,370 (25,380) 1,000,000 0.65% 1,543
FNMA 02/26/2013 09/20/2017 4,004,000 3,909,480 (94,520) 4,000,000 0.82% 1,543
FHLMC 01/30/2013 01/12/2018 4,931,800 4,841,040 (90,760) 5,000,000 1.03% 1,657
Farmer Mac 01/25/2013 01/24/2018 2,499,375 2,431,523 (67,853) 2,500,000 0.94% 1,669
FHLMC 02/26/2013 02/07/2018 2,470,712 2,436,516 (34,196) 2,455,000 0.67% 1,683
FNMA 02/22/2013 02/08/2018 1,989,480 1,941,770 (47,710) 2,000,000 0.98% 1,684
FHLB 03/18/2013 03/09/2018 254,980 248,795 (6,185) 250,000 0.96% 1,713
FNMA 05/29/2013 03/13/2018 3,033,720 2,981,379 (52,341) 3,000,000 0.87% 1,717
FNMA 06/14/2013 04/03/2018 2,968,800 2,942,979 (25,821) 3,000,000 1.35% 1,738
Total U.S. Agencies 231,493,074$ 229,396,645$ (2,096,429)$ 226,740,000$ 0.58% 810
Corporate Medium Term Notes:
General Electric Capital Corp Global Notes 03/19/2013 09/15/2014 2,583,779$ 2,551,349$ (32,429)$ 2,435,000$ 0.62% 442
Walt Disney Co Global Notes 11/30/2012 12/01/2015 382,132 383,233 1,101 385,000 0.70% 884
Berkshire Hathaway Finc Corp Note 02/11/2013 02/11/2016 549,951 547,398 (2,553) 550,000 0.80% 956
Caterpillar Financial SE Notes 02/28/2013 02/26/2016 649,194 644,002 (5,192) 650,000 0.74% 971
PepsiCo Inc Global Notes 02/28/2013 02/26/2016 709,752 704,553 (5,199) 710,000 0.71% 971
JPMorgan Chase & Co Global Notes 02/26/2013 02/26/2016 1,997,580 1,970,636 (26,944) 2,000,000 1.17% 971
Apple Inc Global Notes 05/03/2013 05/03/2016 998,190 989,261 (8,929) 1,000,000 0.51% 1038
IBM Corp Global Notes (Ex-Callable) 05/07/2013 05/06/2016 2,742,245 2,711,209 (31,037) 2,750,000 0.55% 1041
Toyota Motor Credit Corp 05/17/2013 05/17/2016 1,099,549 1,094,271 (5,278) 1,100,000 0.81% 1052
Pfizer Inc Global Notes 06/06/2013 01/15/2017 2,695,680 2,669,949 (25,731) 2,700,000 0.95% 1295
CME Group Inc 08/05/2011 08/01/2013 2,176,100 2,007,654 (168,446) 2,000,000 0.92% 32
Bank of New York 08/26/2010 08/27/2013 1,113,140 1,007,105 (106,035) 1,000,000 1.27% 58
Berkshire Hathaway Fin Corp 10/04/2010 10/15/2013 1,101,590 1,011,817 (89,773) 1,000,000 1.20% 107
Berkshire Hathaway Fin Corp 01/04/2012 10/15/2013 154,712 146,713 (7,999) 145,000 0.83% 107
New York Life Global 09/08/2010 12/13/2013 1,623,296 1,609,882 (13,414) 1,600,000 1.39% 166
Wal-Mart 12/17/2010 02/03/2014 3,109,437 3,046,314 (63,123) 3,000,000 1.80% 218
Met Life Inc. 03/16/2012 04/04/2014 2,513,315 2,515,628 2,313 2,500,000 0.92% 278
Google Inc. 05/23/2011 05/19/2014 2,999,130 3,021,834 22,704 3,000,000 1.26% 323
24
Wtd. Avg.
Purchase Maturity Unrealized Yield Days to
Investment Date Date Book Value Market Value Gain / (Loss) Par Value on Cost Maturity
SANDAG
Detail of Portfolio Balances (by Investment Type)
as of June 30, 2013
GE Capital 10/16/2012 01/09/2015 1,029,240 1,019,574 (9,666) 1,000,000 0.82% 558
Berkshire Hathaway Fin Corp 01/26/2012 01/15/2015 4,474,400 4,257,276 (217,124) 4,000,000 0.80% 564
IBM Corp 02/07/2012 02/06/2015 3,002,220 2,997,231 (4,989) 3,000,000 0.53% 586
New York Life Global 03/21/2012 05/04/2015 1,324,665 1,307,602 (17,063) 1,255,000 1.18% 673
GE Capital 12/23/2011 06/29/2015 1,053,750 1,043,291 (10,459) 1,000,000 1.91% 729
Wal-Mart 01/19/2012 07/08/2015 1,049,330 1,032,199 (17,131) 1,000,000 0.81% 738
US Bancorp 10/29/2010 07/27/2015 3,082,440 3,090,102 7,662 3,000,000 1.84% 757
GE Capital 12/23/2011 09/21/2015 1,472,581 1,452,660 (19,921) 1,360,000 2.07% 813
Procter & Gamble 09/20/2011 11/15/2015 2,055,280 2,051,148 (4,132) 2,000,000 1.12% 868
Google Inc. 10/16/2012 05/19/2016 1,053,370 1,033,284 (20,086) 1,000,000 0.62% 1,054
Procter & Gamble 12/23/2011 08/15/2016 1,145,143 1,145,857 714 1,132,000 1.19% 1,141
Procter & Gamble 12/23/2011 08/15/2016 734,429 734,887 458 726,000 1.19% 1,141
Mississippi Power Co 12/18/2012 10/15/2016 2,104,080 2,073,838 (30,242) 2,000,000 0.96% 1,203
PepsiCo Inc 02/19/2013 08/13/2017 3,004,200 2,934,768 (69,432) 3,000,000 1.22% 1,505
Philip Morris Int'l 12/18/2012 08/21/2017 999,720 971,625 (28,095) 1,000,000 1.13% 1,513
Wal-Mart 05/31/2013 02/15/2018 720,498 702,628 (17,870) 600,000 1.38% 1,691
Wal-Mart 04/16/2013 04/11/2018 500,215 485,055 (15,160) 500,000 1.12% 1,746
Total Corporate Medium Notes 58,004,331$ 56,965,832$ (1,038,499)$ 56,098,000$ 1.08% 748
Commercial Paper:
Rabobank USA Fin Corp Comm Paper 02/22/2013 07/11/2013 9,990,733$ 9,999,610$ 8,877$ 10,000,000$ 0.24% 11
Nordea North America Inc Comm Paper 02/22/2013 07/23/2013 9,990,143 9,999,210 9,067 10,000,000 0.24% 23
General Elec Cap Corp Comm Paper 02/22/2013 08/21/2013 9,988,000 9,998,950 10,950 10,000,000 0.24% 52
BNP Paribas Finance Inc Comm Paper 03/25/2013 08/22/2013 9,987,500 9,996,950 9,450 10,000,000 0.30% 53
UBS Finance Delaware LLC Comm Paper 03/25/2013 08/22/2013 9,988,750 9,997,460 8,710 10,000,000 0.27% 53
HSBC USA Inc Comm Paper 03/25/2013 10/07/2013 9,985,300 9,994,770 9,470 10,000,000 0.27% 99
Toyota Motor Credit Corp Comm Paper 02/22/2013 10/21/2013 9,983,264 9,994,410 11,146 10,000,000 0.25% 113
Total Commercial Paper 69,913,690$ 69,981,360$ 67,670$ 70,000,000$ 0.26% 58
Municipal Bonds/Notes:
CA ST Dept of Water Rev Bonds 09/27/2012 12/01/2015 620,000$ 620,000$ -$ 620,000$ 0.65% 884
Total Municipal Bonds/Notes 620,000$ 620,000$ -$ 620,000$ 0.65% 884
25
Wtd. Avg.
Purchase Maturity Unrealized Yield Days to
Investment Date Date Book Value Market Value Gain / (Loss) Par Value on Cost Maturity
SANDAG
Detail of Portfolio Balances (by Investment Type)
as of June 30, 2013
Certificates of Participation:
North County Transit District Certificates of Participation 04/24/2013 07/30/2013 31,775,000$ 31,775,000$ -$ 31,775,000$ 0.19% 32
Total Certificates of Participation 31,775,000$ 31,775,000$ -$ 31,775,000$ 0.19% 32
Total investments 440,502,823$ 437,448,870$ (3,053,953)$ N/A 0.53% 566
Total Portfolio: 700,472,855$ 697,318,549$ (3,154,306)$ N/A 0.43% 423
Legend:
Automated Regional Justice Information System (ARJIS)
Commercial Paper (CP)
State of California Local Agency Investment Fund (LAIF)
North County Transit District (NCTD)
San Diego County Regional Transportation Commission (RTC)
26
BOARD OF DIRECTORS AGENDA ITEM NO. 13-09-6
SEPTEMBER 27, 2013 ACTION REQUESTED – INFORMATION
QUARTERLY PROGRESS REPORT ON TRANSPORTATION File Number 1500000 PROJECTS – APRIL THROUGH JUNE 2013
Introduction
This quarterly report summarizes the current status of major transit, highway, traffic management, and Transportation Demand Management (TDM) projects in the SANDAG five-year Regional Transportation Improvement Program. The TransNet one-half cent local sales tax and other local, state, and federal revenue sources fund the projects. The projects contained in this report have been previously prioritized and are included in the 2050 Regional Transportation Plan. All projects shown in bold have changed from the previous quarter; this report will highlight some of those changes. This item is presented to the Board of Directors for information.
Discussion
TransNet Program
Attachment 1 – TransNet Program – indicates sales tax revenue available for allocation was approximately $61.2 million in the fourth quarter of FY 2013. Revenue for the fourth quarter of the fiscal year was 4.2 percent lower compared to the third quarter of FY 2013 ($63.9 million); however, it was approximately 3.7 percent higher than the fourth quarter of last fiscal year ($59 million).
Transit Projects
Attachment 2 – Transit Projects – provides cost and schedule information on the major transit and rail projects in the San Diego region. The accompanying map (Attachment 3 – Major Transit Projects) locates these projects.
Blue Line Station Improvements: In July 2013, a groundbreaking ceremony was held for the Blue Line Station Improvements Project (Project No. 13). The stations along the Blue Line between the 12th and Imperial Station and San Ysidro will be completely remodeled to make loading and unloading of passengers more efficient, with platforms that accommodate state-of-the-art low-floor trolley cars, next-arrival signs, new shelters, and equipment such as new track and switches. All stations are scheduled to be open to the public by fall 2014.
Mid-City Rapid Bus: The Mid-City Rapid Bus Project (Project No. 14) held a groundbreaking ceremony in July 2013. This project will include new stations for the line, which will be located at major activity centers and transfer points, and will look different than normal bus stops. The stations will include shelters, real-time bus arrival signs, landscaping, and street lighting. Buses on the route will have low floors for easier boarding, and will run from 5 a.m. to 1 a.m. the following day, seven days per week. During weekday peak hours, the buses will arrive at stations every
2
10 minutes; during weekday off-peak hours and weekends, the buses will run every 15 minutes. This project is scheduled to be completed and open to users by summer of 2014.
Active Transportation Projects
Attachment 4 – Active Transportation Projects (includes projects related to bicycle, pedestrian, and access to transit infrastructure) – provides cost and schedule information on the active transportation projects in the San Diego region. The accompanying map (Attachment 5 – Major Active Transportation Projects) locates these projects.
Coastal Rail Trail – Oceanside: The schedule for the Coastal Rail Trail – Oceanside Project (Project No. 32) has been updated. Now scheduled to open to users by December 2013, this segment of the Coastal Rail Trail in Oceanside is a Class I bicycle trail that parallels Meyers Street between Oceanside Boulevard and Wisconsin Avenue, along North County Transit District property. Construction will improve the existing open lot with pavement, landscaping, lighting, and drainage. The Coastal Rail Trail is part of a connected, 44-mile bike trail between the City of Oceanside and the City of San Diego.
Inland Rail Trail: On July 26, 2013, the SANDAG Board of Directors approved the Final Subsequent Mitigated Negative Declaration for the San Marcos to Vista Segment of the Inland Rail Trail Project (Project No. 33). The project received approval under the National Environmental Policy Act on August 5, 2013. The current project is a seven-mile, Class I bikeway passing through San Marcos, Vista, and the County of San Diego. Within the City of Oceanside, approximately 0.1 miles of the Inland Rail Trail is located within the City of Oceanside along Melrose Drive. The project extends from the intersection of North Melrose Drive and West Bobier Drive to the intersection of West Mission Road and North Pacific Street. The final design phase for this project is anticipated to be completed by June 2014.
Express/High Occupancy Vehicle Lanes and Direct Access Ramps Projects
Attachment 6 – Express/High Occupancy Vehicle (HOV) lanes and Direct Access Ramps (DARs) Projects – provides cost and schedule information on the major highway projects in the San Diego region. The accompanying map (Attachment 7 – Express/HOV lanes and DARs Projects) locates these projects.
Interstate 805 (I-805) Managed Lanes – South: The I-805 Managed Lanes – South Project (Project No. 47) is currently scheduled to be open to traffic by December 2014. This project will design and construct two HOV lanes in the median of I-805, including a DAR at Palomar Street. To accommodate the construction of a DAR, transit station and Park & Ride, the East Palomar Street Bridge over I-805 in Chula Vista needed to be removed. Demolition of the bridge occurred during August. To accommodate the demolition, Caltrans closed I-805 to all traffic in both directions overnight for approximately 14 hours between 3 p.m. on Sunday, August 18, and 5 a.m. on Monday, August 19.
During the closure, northbound and southbound traffic was detoured to parallel routes – State Route 125 (SR 125) in the east and Interstate 5 (I-5) in the west. Due to the closure’s potential for significant regional traffic congestion on both sides of the U.S. and Mexico border, an extensive bilingual outreach campaign was launched to encourage motorists to avoid the freeway during the
3
closure. The project name for this effort was “DARmageddon,” with the slogan “Steer Clear” in order to encourage the public to avoid the I-805 and educate motorists about the facility and its function as a DAR. The entire effort was deemed a success, with traffic congestion from the closure significantly minimized and the freeway opened on time for the morning commute.
I-805 HOV Lanes and Carroll Canyon Road Extension: The ‘open to traffic’ update has been revised for the I-805 HOV Lanes and Carroll Canyon Road Extension Project (Project No. 49) to December 2013 due to some unforeseen issues with the retaining walls along Carroll Canyon Road. The project will extend the HOV lanes from I-5 to I-805 at Carroll Canyon Road and extend Carroll Canyon Road to connect with Sorrento Valley Boulevard. The project also adds additional on-ramps from Carroll Canyon Road and a direct-access ramp for HOVs.
Highway Projects
Attachment 8 – Highway Projects – provides cost and schedule information on the major highway projects in the San Diego region. The accompanying map (Attachment 9 – Major Highway) locates these projects.
I-5/Interstate 8 (I-8) Interchange Connector Widening: The construction contract for the I-5/I-8 Interchange Connector Widening Project (Project No. 51) is scheduled to be awarded in October 2013. This project will construct auxiliary lanes northbound on I-5 and widen the connector between I-5 northbound and I-8 westbound. This TransNet-funded project will improve operation at the interchange and is anticipated to be completed and open to users by spring 2015.
State Route 76 (SR 76)/Interstate 15 (I-15) East Widening Interchange Improvement: On August 23, 2013, the SR 76/I-15 East Widening Interchange Improvement Project (Project No. 55) opened to traffic ahead of schedule. Improvements include a widened bridge and two new loop on-ramps to I-15.
SR 76 East Widening: The SR 76 East Widening Project (Project No. 56) is currently scheduled to be advertised by November 2013. It is one of the high-priority “lockbox” transportation projects in the region's TransNet Early Action Program. The project as a whole is on schedule and expected to be opened to motorists by the end of 2015.
Traffic and Demand Management and Intelligent Transportation System
Attachment 10 – Traffic Management and Intelligent Transportation System Projects (ITS) – provides cost and schedule information on the major traffic management and ITS projects in the San Diego region.
Regional Arterial Detection Plan: SANDAG initiated the Regional Arterial Detection Plan Project (Project No. 62) in March 2013. The project was initiated in an effort to improve the region’s ability to better understand the performance of regional arterials. This project will provide the region with automated, continuous, real-time monitoring of arterial data useful in assessing and improving regional signal timing plans and regular system performance. Phase 1 of this project is scheduled to be advertised by December 2013 and completed in fall 2014.
4
I-15 FasTrak®: During the fourth quarter of FY 2013, the I-15 Express Lanes facility recorded approximately 750,000 FasTrak trips, which is a 2.7 percent increase from the previous quarter (730,000). Approximately $1.61 million in toll revenues were generated, which is an increase of 6.8 percent from last quarter ($1.51 million). Revenues from FasTrak are used to cover operational costs first, with the remaining funds supporting transit service and other improvements along the I-15 corridor.
iCommute Program: iCommute is the TDM Program of SANDAG. The iCommute Program provides convenient transportation choices that reduce auto dependency, vehicle energy consumption, and polluting emissions, while saving commuters time and money by providing free ride-matching services, a vanpool program, transit solutions, bicycle encouragement programs, the Guaranteed Ride Home Program, SchoolPool, and support for teleworking. During the fourth quarter, iCommute programs contributed to reducing approximately 30 million pounds of carbon dioxide and saved an estimated 1.5 million gallons of fuel by reducing approximately 35 million vehicle miles traveled.
SANDAG Regional Vanpool Program: The number of vanpools is on the rise again, increasing from 725 vans last quarter to 738 vans (approximately 2 percent increase). Approximately 5,700 passengers participated in the regional program.
National Bike Month: During National Bike Month in May, iCommute supported bike to work events throughout the month. On May 1, 2013, a ceremonial ride from the SANDAG offices to the County Administration Building was led by the San Diego County Bicycle Coalition and included local elected officials, bicycle advocacy groups, and cycling fans. Bike to Work Day, which occurred on May 17, 2013, had the highest participation levels the region has seen since inception of the event. More than 8,400 cyclists participated (a 16 percent increase over 2012), and 94 pit stops were set up throughout the region.
511 Services: During the fourth quarter of FY 2013, 511 received approximately 160,000 calls. The most requested option continues to be “Traffic Conditions,” which accounted for approximately 27 percent of total calls this quarter. The 511 service continues to be utilized as a one-stop resource that consolidates the San Diego region’s transportation information into easily accessible phone and website systems.
Views for the 511 web portal page decreased slightly to an average of 631 per day; 511 traffic page views averaged 552 views per day. The transit page continues to be the most heavily visited 511-related page, amounting to 53 percent of total visits for the quarter.
Freeway Service Patrol
Attachment 11 – Freeway Service Patrol (FSP) Assists Map – summarizes the number of assists by the Freeway Service Patrol.
The FSP trucks patrol approximately 242 miles of San Diego freeways, as shown on Attachment 11. The FSP trucks operate during weekday peak periods from 5:30 to 9:30 a.m. and from 3 to 7 p.m., excluding holidays. A pilot expansion, which began in 2012, increased FSP operations beyond peak periods to help stranded motorists during midday from 10 a.m. to 2 p.m. along I-5, I-8, I-15, and I-805. In addition, weekend FSP service is now available in most of the region from 10 a.m. to 6 p.m.
5
The pilot expansion will continue as long as funds are available. Findings from the pilot will enable SANDAG to further fine-tune the program to improve efficiency. In the fourth quarter of FY 2013, this program has assisted approximately 17,000 motorists, which includes approximately 2,000 motorists during weekend beats in the San Diego region.
GARY L. GALLEGOS Executive Director
Attachments: 1. TransNet Extension Quarterly Report 2. Transit Projects 3. Major Transit Projects (map) 4. Active Transportation Projects 5. Major Active Transportation Projects (map) 6. Express/HOV lanes and DARs Projects 7. Major Express/HOV Lanes and DARs Projects (map) 8. Highway Projects 9. Major Highway Projects (map) 10. Traffic Management and Intelligent Transportation System Projects 11. Freeway Service Patrol Assists (map)
Key Staff Contact: Michelle Merino, (619) 595-5608, [email protected]
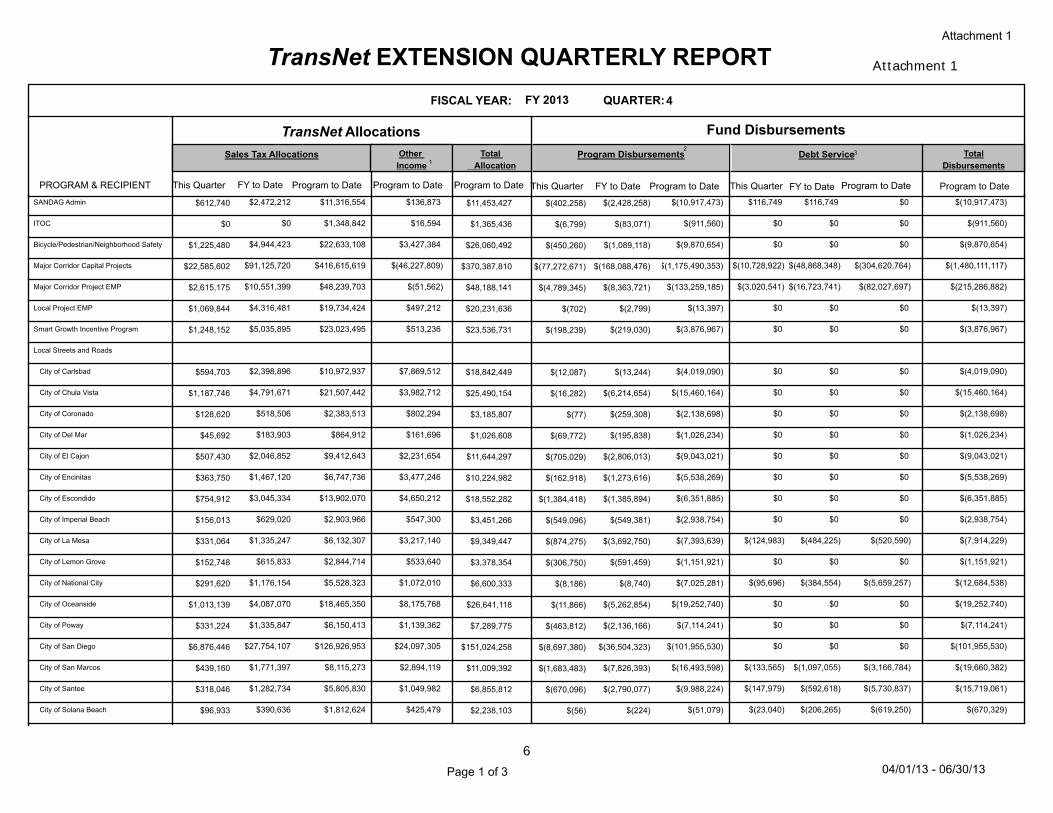
Attachment 1
6
mmo
Rectangle
mmo
Rectangle
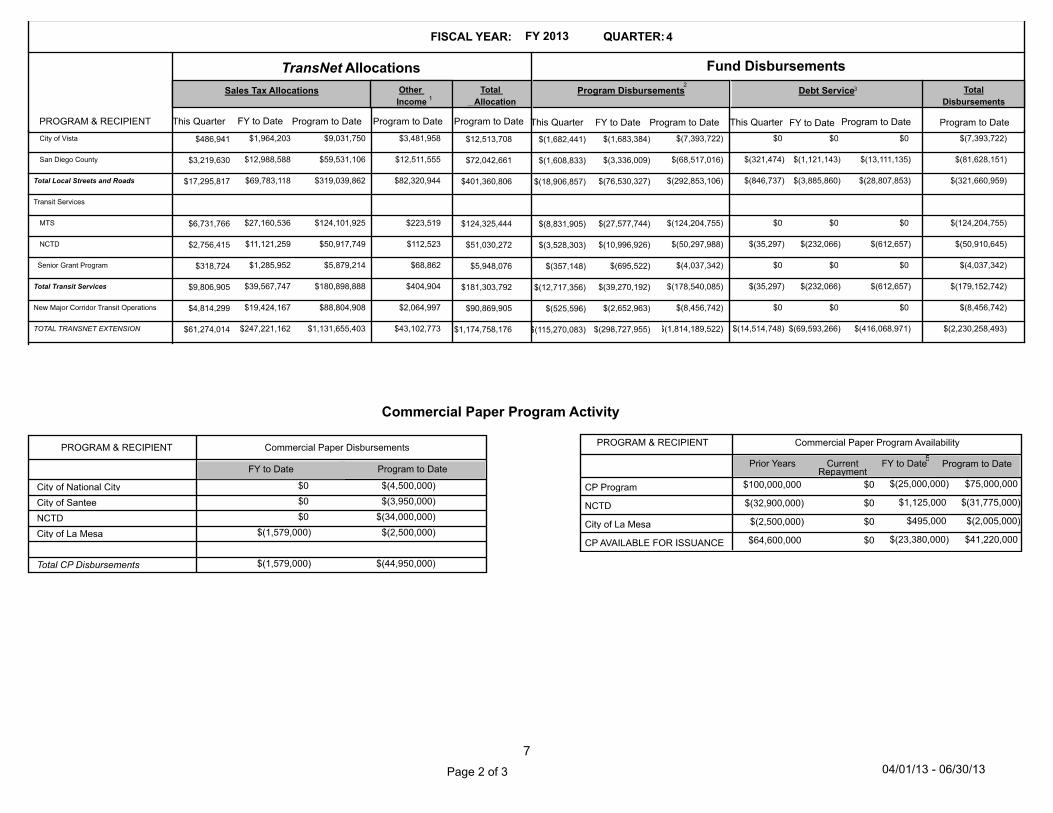
7
mmo
Rectangle
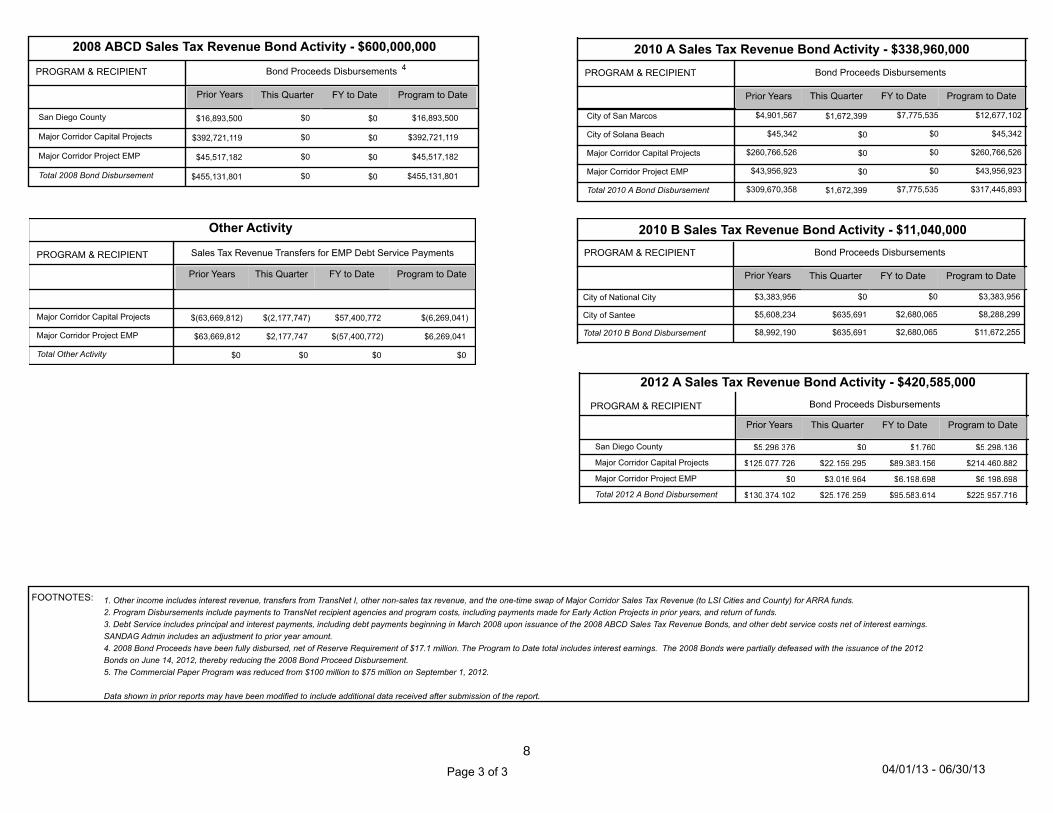
8
mmo
Rectangle
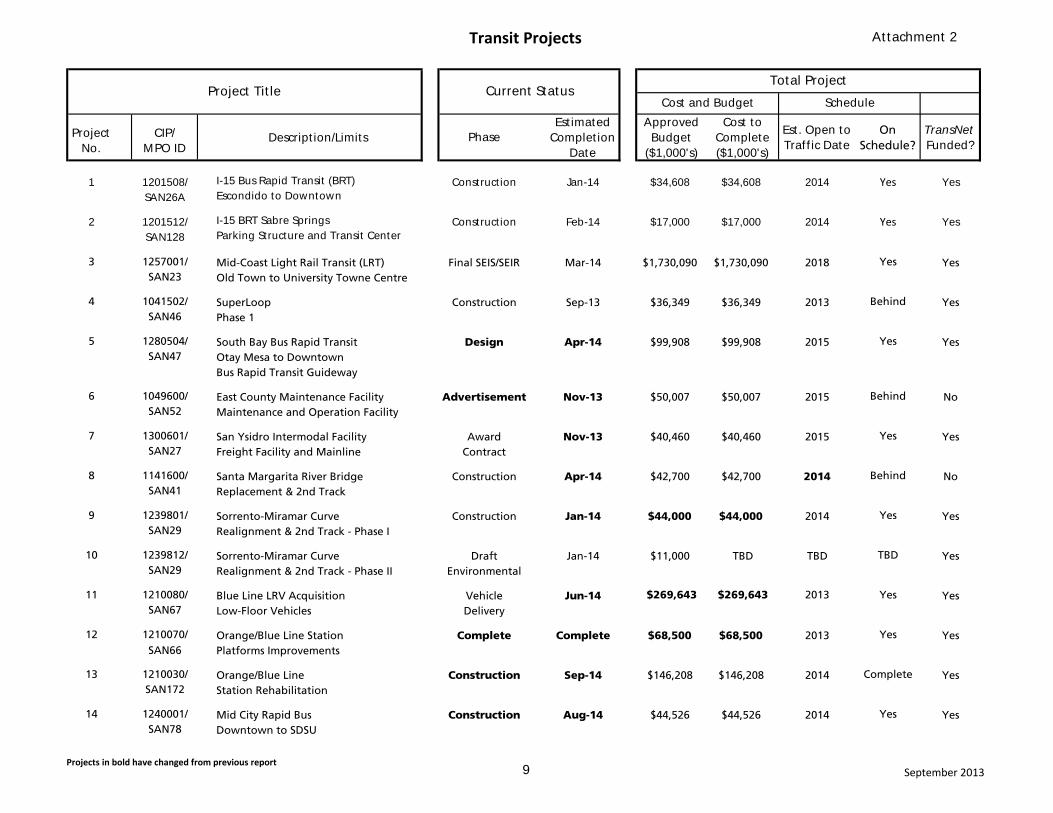
Transit Projects
Projects in bold have changed from previous reportSeptember 2013
Project No.
CIP/ MPO ID
Description/Limits PhaseEstimated
Completion Date
Approved Budget
($1,000's)
Cost to Complete ($1,000's)
Est. Open to Traffic Date
On Schedule?
TransNet Funded?
1 1201508/ I-15 Bus Rapid Transit (BRT) Construction Jan-14 $34,608 $34,608 2014 Yes YesSAN26A Escondido to Downtown
2 1201512/ I-15 BRT Sabre Springs Construction Feb-14 $17,000 $17,000 2014 Yes YesSAN128 Parking Structure and Transit Center
3 1257001/ Mid-Coast Light Rail Transit (LRT) Final SEIS/SEIR Mar-14 $1,730,090 $1,730,090 2018 Yes YesSAN23 Old Town to University Towne Centre
4 1041502/ SuperLoop Construction Sep-13 $36,349 $36,349 2013 Behind YesSAN46 Phase 1
5 1280504/ South Bay Bus Rapid Transit Design Apr-14 $99,908 $99,908 2015 Yes YesSAN47 Otay Mesa to Downtown
Bus Rapid Transit Guideway
6 1049600/ East County Maintenance Facility Advertisement Nov-13 $50,007 $50,007 2015 Behind NoSAN52 Maintenance and Operation Facility
7 1300601/ San Ysidro Intermodal Facility Award Nov-13 $40,460 $40,460 2015 Yes YesSAN27 Freight Facility and Mainline Contract
8 1141600/ Santa Margarita River Bridge Construction Apr-14 $42,700 $42,700 2014 Behind NoSAN41 Replacement & 2nd Track
9 1239801/ Sorrento-Miramar Curve Construction Jan-14 $44,000 $44,000 2014 Yes YesSAN29 Realignment & 2nd Track - Phase I
10 1239812/ Sorrento-Miramar Curve Draft Jan-14 $11,000 TBD TBD TBD YesSAN29 Realignment & 2nd Track - Phase II Environmental
11 1210080/ Blue Line LRV Acquisition Vehicle Jun-14 $269,643 $269,643 2013 Yes YesSAN67 Low-Floor Vehicles Delivery
12 1210070/ Orange/Blue Line Station Complete Complete $68,500 $68,500 2013 Yes YesSAN66 Platforms Improvements
13 1210030/ Orange/Blue Line Construction Sep-14 $146,208 $146,208 2014 Complete YesSAN172 Station Rehabilitation
14 1240001/ Mid City Rapid Bus Construction Aug-14 $44,526 $44,526 2014 Yes YesSAN78 Downtown to SDSU
ScheduleProject Title Current Status
Total Project
Cost and Budget
Attachment 2
9
Transit Projects
Projects in bold have changed from previous reportSeptember 2013
Project No.
CIP/ MPO ID
Description/Limits PhaseEstimated
Completion Date
Approved Budget
($1,000's)
Cost to Complete ($1,000's)
Est. Open to Traffic Date
On Schedule?
TransNet Funded?
ScheduleProject Title Current Status
Total Project
Cost and Budget
North Coast Corridor15 1144200/ San Onofre to Pulgas Award Sep-13 $37,696 $37,696 2015 Yes No
SAN115 Double Tracking (Phase 1) Contract
North Coast Corridor16 1239803/ Oceanside Station Award Jan-15 $19,568 $19,568 2016 Behind Yes
SAN116 Stub Tracks and Crossover Contract
North Coast Corridor17 1239805/ Poinsettia Station/Carlsbad Design Oct-13 $13,000 $13,000 2016 Yes Yes
SAN117 Run-Through Track
North Coast Corridor18 1239806/ San Elijo Lagoon Design Aug-14 $76,700 $76,700 2016 Yes Yes
SAN73 Double Tracking
North Coast Corridor19 1239807/ Sorrento Valley Advertisement Nov-13 $33,700 $33,700 2015 Yes Yes
SAN119 Double Tracking
North Coast Corridor20 1239808/ Tecolote – Washington St. Construction Oct-13 $10,950 $10,950 2013 Yes Yes
SAN120 Crossovers
North Coast Corridor21 1239809/ Eastbrook to Shell Draft Sep-13 $6,920 $74,600 TBD TBD Yes
SAN64 Double Tracking Environmental
North Coast Corridor22 1239810/ Carlsbad Village Draft Oct-13 $5,980 $28,000 TBD TBD Yes
SAN130 Double Tracking Environmental
North Coast Corridor23 1239813/ San Dieguito Draft Sep-13 $9,470 TBD TBD TBD Yes
SAN30 Double Tracking Environmental
North Coast Corridor24 1239811/ Elvira to Morena Draft Jan-14 $78,720 $78,720 2018 Yes Yes
SAN132 Double Tracking Environmental
10
Transit Projects
Projects in bold have changed from previous reportSeptember 2013
Project No.
CIP/ MPO ID
Description/Limits PhaseEstimated
Completion Date
Approved Budget
($1,000's)
Cost to Complete ($1,000's)
Est. Open to Traffic Date
On Schedule?
TransNet Funded?
ScheduleProject Title Current Status
Total Project
Cost and Budget
North Coast Corridor25 1239816/ Batiquitos Lagoon Draft Jan-15 $3,000 TBD TBD TBD Yes
SAN183 Double Track Environmental
North Coast Corridor26 1239815/ San Diego River Bridge Draft Feb-14 $9,382 TBD TBD TBD Yes
SAN182 Rail Improvements Environmental
Approved Budget
Cost to Complete
Total for Transit Projects $2,888,477 $2,945,325
11
2
6
7
3
4
9
8
15
20
24
19
18
17
16 21
23
25
22
13
1426
5
1
1
1
County of San Diego
1.
2.
3.
4.
5.
6.
7.
8.
9.
13.
14.
15.
16.
17.
18.
19.
20.
21.
22.
23.
24.
25.
26.
I-15 Bus Rapid Transit (BRT) –Escondido to Downtown
I-15 BRT Sabre Springs Parking Structureand Transit Center
Mid-Coast LRT Old Town–UTC
SuperLoop
South Bay BRT
East County Bus Maintenance Facility
San Ysidro Intermodal Freight Facility
Santa Margarita River Bridge
Sorrento–Miramar Curve Realignmentand Double Track
Orange/Blue Line Station Rehabilitations
Mid City Rapid Bus
Camp Pendleton/San Onofre Double Track
Oceanside Station Stub Tracks & Crossover
Poinsettia Station/Carlsbad Run-Through Track
San Elijo Lagoon Double Track
Sorrento Valley Double Track
Tecolote–Washington St/SD Crossovers
Eastbrook to Shell Double Track
Carlsbad Village Double Track
San Dieguito Double Track
Elvira to Morena Double Track
Batiquitos Lagoon Double Track
San Diego River Bridge Rail Improvements
TRANSIT PROJECTS
Project number refers toProject ID in Attachment 2
Project Under Construction
Project Under Development
Bus Rapid Transit Center (BRTC) Under Development
Bus Rapid Transit Center (BRTC) Under Construction
April – June 2013
Major Transit Projects
2170 9/13
Attachment 3
12
Active Transportation Projects
Projects in bold have changed from previous reportSeptember 2013
Project No.
CIP/ MPO ID
Description/Limits PhaseEstimated
Completion Date
Approved Budget
($1,000's)
Cost to Complete ($1,000's)
Est. Open to Traffic Date
On Schedule?
TransNet Funded?
30 1223016/ Coastal Rail Trail Environmental Jun-14 $400 $20,636 2016 Yes NoSAN155 South of SR 52 to Mission Bay
Along Rose Creek
31 1223017/ Coastal Rail Trail Environmental Dec-14 $234 $6,885 2016 Yes NoSAN156 Encinitas – Chesterfield to G
32 1223024/ Costal Rail Trail Construction Dec-13 $2,048 $2,048 2013 Yes YesSAN152 Oceanside – Ocean Blvd to Wisconsin Ave
33 1223023/ Inland Rail Trail Design Jun-14 $3,947 $5,647 TBD TBD NoSAN153 Phases IIA, IIB, IIIA and IIIB
Melrose Drive to N. Pacific Street
34 1143700/ Bayshore Bikeway Design Jul-14 $5,350 $5,350 2015 Yes NoSAN144 Segments 4 & 5
35 1129900/ Bayshore Bikeway Environmental Jun-14 $451 $2,600 2015 Yes NoSAN154 Segment 8B
Main St. to Palomar
36 1144500/ Sweetwater Bikeway Advertisement Jan-14 $1,946 $1,946 2014 Yes YesSAN161 Plaza Bonita Segment
37 1223020/ Bicycle Facilities Draft Apr-14 $1,014 TBD TBD TBD YesSAN158 La Mesa to North Park Environmental
38 1223022/ Bicycle Facilites Draft Jan-14 $864 TBD TBD TBD YesSAN160 Old Town to San Diego Environmental
Approved Budget
Cost to Complete
Total for Active Transportation Projects $16,254 $45,112
Project Title Current StatusTotal Project
Cost and Budget Schedule
Attachment 4
13
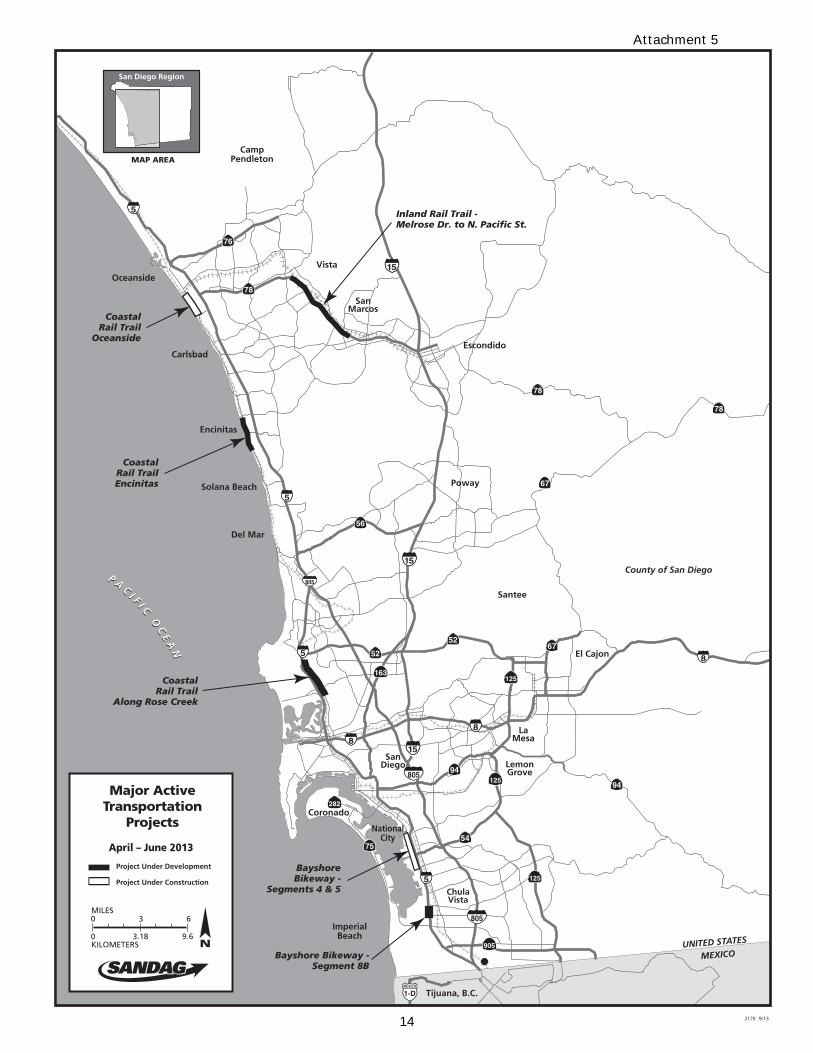
County of San Diego
Project Under Construction
Project Under Development
April – June 2013
Major ActiveTransportation
Projects
2170 9/13
CoastalRail Trail
Along Rose Creek
CoastalRail TrailEncinitas
CoastalRail Trail
Oceanside
Inland Rail Trail -Melrose Dr. to N. Pacific St.
Bayshore Bikeway -Segment 8B
BayshoreBikeway -
Segments 4 & 5
Attachment 5
14
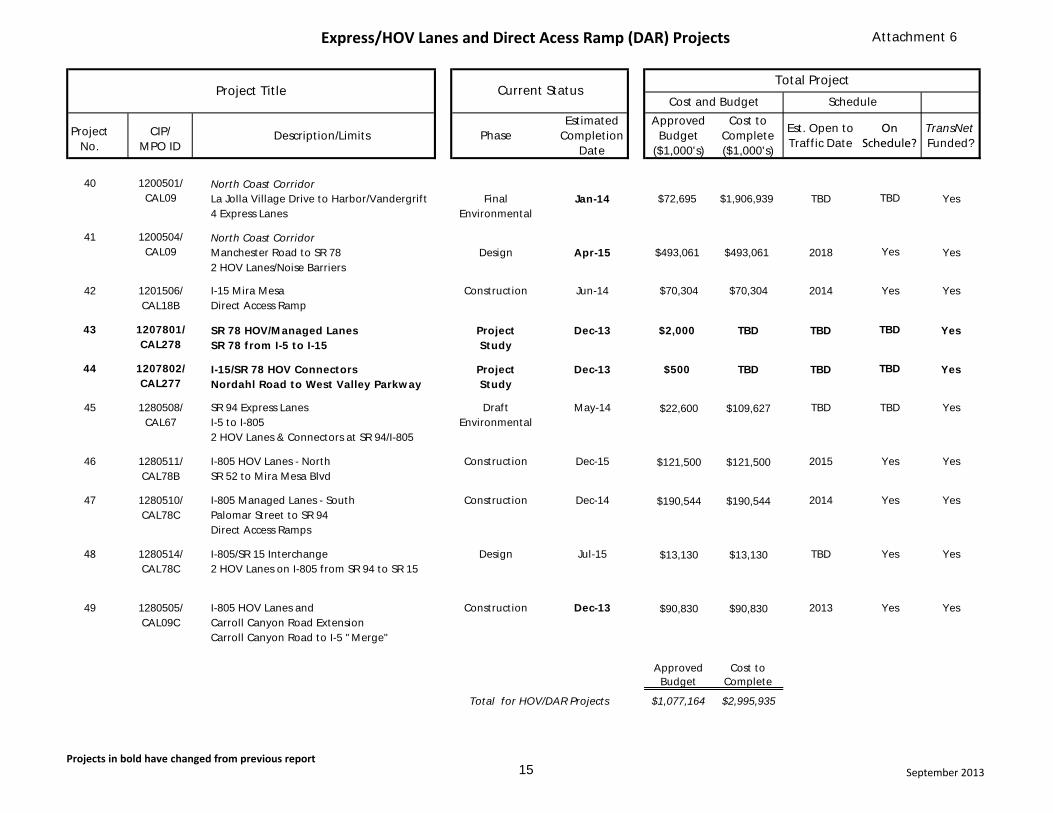
Express/HOV Lanes and Direct Acess Ramp (DAR) Projects
Projects in bold have changed from previous reportSeptember 2013
Project No.
CIP/ MPO ID
Description/Limits PhaseEstimated
Completion Date
Approved Budget
($1,000's)
Cost to Complete ($1,000's)
Est. Open to Traffic Date
On Schedule?
TransNet Funded?
40 1200501/ North Coast CorridorCAL09 La Jolla Village Drive to Harbor/Vandergrift Final Jan-14 $72,695 $1,906,939 TBD TBD Yes
4 Express Lanes Environmental
41 1200504/ North Coast CorridorCAL09 Manchester Road to SR 78 Design Apr-15 $493,061 $493,061 2018 Yes Yes
2 HOV Lanes/Noise Barriers
42 1201506/ I-15 Mira Mesa Construction Jun-14 $70,304 $70,304 2014 Yes YesCAL18B Direct Access Ramp
43 1207801/ SR 78 HOV/Managed Lanes Project Dec-13 $2,000 TBD TBD TBD YesCAL278 SR 78 from I-5 to I-15 Study
44 1207802/ I-15/SR 78 HOV Connectors Project Dec-13 $500 TBD TBD TBD YesCAL277 Nordahl Road to West Valley Parkway Study
45 1280508/ SR 94 Express Lanes Draft May-14 $22,600 $109,627 TBD TBD YesCAL67 I-5 to I-805 Environmental
2 HOV Lanes & Connectors at SR 94/I-805
46 1280511/ I-805 HOV Lanes - North Construction Dec-15 $121,500 $121,500 2015 Yes YesCAL78B SR 52 to Mira Mesa Blvd
47 1280510/ I-805 Managed Lanes - South Construction Dec-14 $190,544 $190,544 2014 Yes YesCAL78C Palomar Street to SR 94
Direct Access Ramps
48 1280514/ I-805/SR 15 Interchange Design Jul-15 $13,130 $13,130 TBD Yes YesCAL78C 2 HOV Lanes on I-805 from SR 94 to SR 15
49 1280505/ I-805 HOV Lanes and Construction Dec-13 $90,830 $90,830 2013 Yes YesCAL09C Carroll Canyon Road Extension
Carroll Canyon Road to I-5 "Merge"
Approved Budget
Cost to Complete
$1,077,164 $2,995,935Total for HOV/DAR Projects
ScheduleProject Title Current Status
Total Project
Cost and Budget
Attachment 6
15
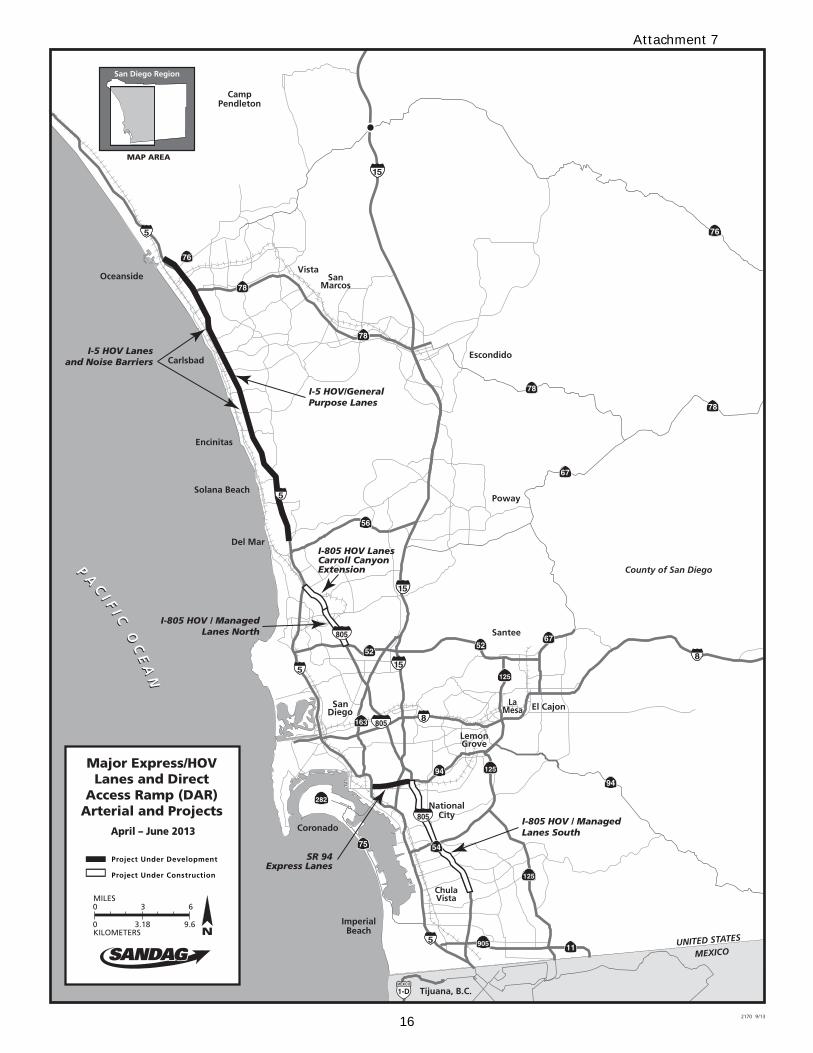
I-5 HOV Lanesand Noise Barriers
I-805 HOV / ManagedLanes North
I-5 HOV/General Purpose Lanes
I-805 HOV LanesCarroll CanyonExtension
I-805 HOV / ManagedLanes South
SR 94Express Lanes
County of San Diego
Project Under Construction
Project Under Development
April – June 2013
Major Express/HOV Lanes and Direct
Access Ramp (DAR) Arterial and Projects
2170 9/13
Attachment 7
16
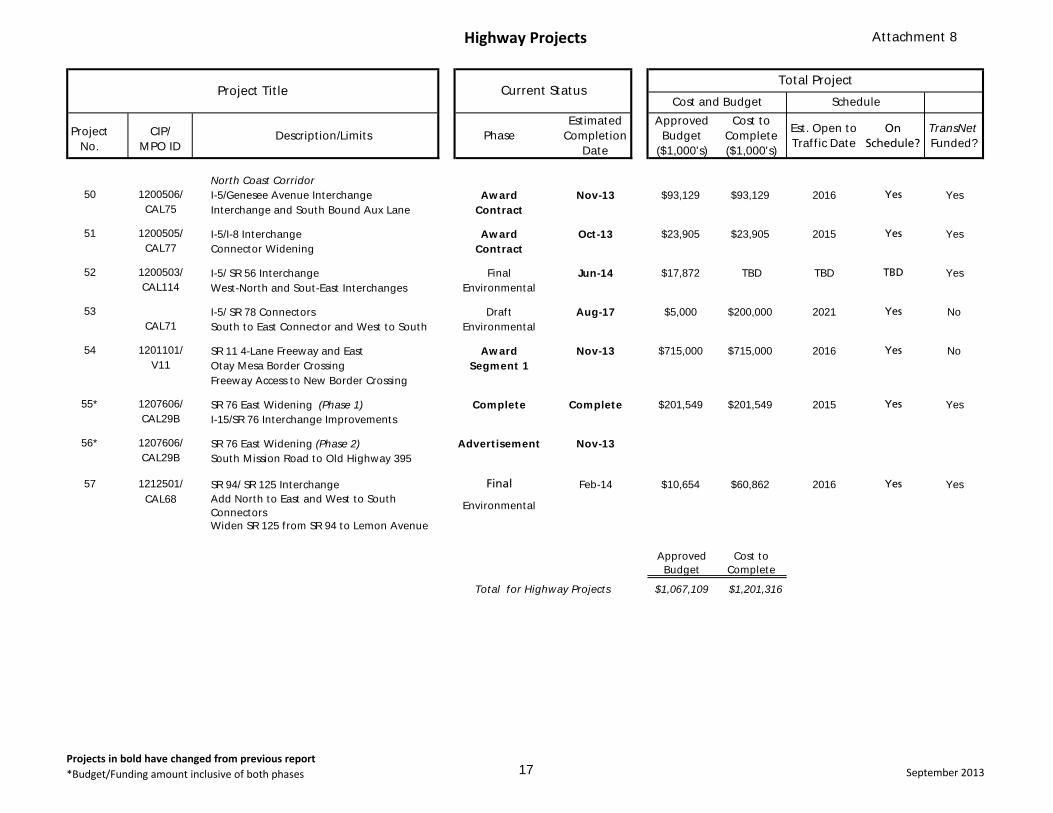
Highway Projects
Projects in bold have changed from previous report*Budget/Funding amount inclusive of both phases September 2013
Project No.
CIP/ MPO ID
Description/Limits PhaseEstimated
Completion Date
Approved Budget
($1,000's)
Cost to Complete ($1,000's)
Est. Open to Traffic Date
On Schedule?
TransNet Funded?
North Coast Corridor50 1200506/ I-5/Genesee Avenue Interchange Award Nov-13 $93,129 $93,129 2016 Yes Yes
CAL75 Interchange and South Bound Aux Lane Contract
51 1200505/ I-5/I-8 Interchange Award Oct-13 $23,905 $23,905 2015 Yes YesCAL77 Connector Widening Contract
52 1200503/ I-5/ SR 56 Interchange Final Jun-14 $17,872 TBD TBD TBD YesCAL114 West-North and Sout-East Interchanges Environmental
53 I-5/ SR 78 Connectors Draft Aug-17 $5,000 $200,000 2021 Yes NoCAL71 South to East Connector and West to South Environmental
54 1201101/ SR 11 4-Lane Freeway and East Award Nov-13 $715,000 $715,000 2016 Yes NoV11 Otay Mesa Border Crossing Segment 1
Freeway Access to New Border Crossing
55* 1207606/ SR 76 East Widening (Phase 1) Complete Complete $201,549 $201,549 2015 Yes YesCAL29B I-15/SR 76 Interchange Improvements
56* 1207606/ SR 76 East Widening (Phase 2) Advertisement Nov-13CAL29B South Mission Road to Old Highway 395
57 1212501/ SR 94/ SR 125 Interchange Final Feb-14 $10,654 $60,862 2016 Yes YesCAL68 Add North to East and West to South
ConnectorsEnvironmental
Widen SR 125 from SR 94 to Lemon Avenue
Approved Budget
Cost to Complete
$1,067,109 $1,201,316
Project Title
Total for Highway Projects
Current StatusCost and Budget
Total Project
Schedule
Attachment 8
17
SR 11New Freeway
I-5 / SR 78Connectors
New ConnectorsI-5 / SR 56
I-5 Widening atGenesee project
SR 76 Highway Widening East
SR 76 / I-15 Interchange (Completed)
SR 94 / SR 125Interchange Connectors
I-5 / I-8ConnectorWidening
County of San Diego
Project Under Construction
Project Under Development
Major Highway Projects
April – June 2013
2170 9/13
Attachment 9
18
Traffic and Demand Management (TDM) and Intelligent Transportation System (ITS) Projects
Projects in bold have changed from previous report*Budget/Funding amount inclusive of both phases September 2013
Project No.
CIP/ MPO ID
Description/Limits PhaseEstimated
Completion Date
Approved Budget
($1,000's)
Cost to Complete ($1,000's)
Est. Open to Traffic Date
On Schedule?
TransNet Funded?
60* Centralized Train Control - Phase 2 Complete Complete $12,130 $12,130 2014 Yes
Centralized Train Control - Phase 3 Implementation Dec-13
Centralized Train Control - Phase 4 Design Dec-14
61 1144601/ I-15 Integrated Corridor Management Test Dec-14 $10,040 $10,040 2014 YesSAN94 ICM Initiative 1 Implementation
62 1144800 Regional Arterial Detection Plan Advertisement Dec-13 $1,200 $1,200 2014 YesPhase 1
Approved Budget
Cost to Complete
$23,370 $23,370
*Budget/Funding amount is inclusive of all phases
Total for ITS Projects
Project Title Current StatusTotal Project
Cost and Budget Schedule
Attachment 10
19
March 2004
P A C I F I C O C E A N
P A C I F I C O C E A N
San Diego Region
MAP AREA
Freeway Service Patrol Assists
21
15
7
6 14
58
4
3
1311
12
109
®
April – June 2013
76
1-D
905 115
12554
805
805
5
5
5
282
16394
67
52
52
15
56
78
78
78
76
6 7
8
8
15
125
125
75
94
15
CampPendleton
County of San Diego
Oceanside
Encinitas
Del Mar
Solana Beach
Poway
SanDiego
Coronado
ImperialBeach
LemonGrove
LaMesa
Santee
ElCajon
Escondido
Vista
ChulaVista
Tijuana, B.C.
UNITED STATES
MEXICO
NationalCity
Assists by Patrol Beat
1,469
763
790
1,063
771
1,543
1,123
2,004
207
1,157
1,958
833
207
1
2
7
6
5
8
4
3
13
11
12
14
65615
10
9
2,457
2170 9/13
Attachment 11
20
BOARD OF DIRECTORS AGENDA ITEM NO. 13-09-7
SEPTEMBER 27, 2013 ACTION REQUESTED – INFORMATION
SAN DIEGO FORWARD: THE REGIONAL PLAN: File Number 3102000 INPUT RECEIVED FROM SPRING AND SUMMER SERIES OF REGIONAL PLAN PUBLIC WORKSHOPS
Introduction
Last winter, the Public Involvement Plan for San Diego Forward: The Regional Plan set forth goals and strategies to provide sustained engagement with the public during the development of the Regional Plan. Between May and August, a series of nine daytime and evening public workshops were conducted to solicit public input on various policy areas that will feed into the Regional Plan. This report provides a summary of the workshop results to the Board of Directors for information.
Background
In October 2012, SANDAG held a kick-off workshop to gather ideas about the initial concepts of the Regional Plan. The workshop was structured in an interactive manner, with a focus on engaging in facilitated discussions, listening to the thoughts and perspectives of workshop attendees, and minimizing staff presentations. This interactive workshop structure served as a model for the most recent series of workshops. Also in 2012 and 2013, staff started engaging the various SANDAG working groups and other stakeholders on the development of the Regional Plan. Concurrent with these efforts, SANDAG initiated contracts with 11 Community Based Organizations (CBOs) throughout the region to collect feedback from various “hard to reach” communities over the next 2 years. One of the key themes that arose in all of this engagement was a desire for SANDAG to use an interactive and highly inclusive process throughout the development of the Regional Plan.
Discussion
Similar to the format of the October 2012 kick-off workshop, the emphasis of the spring and summer workshop series was on listening. More than 650 people participated in the workshops, with many discussions held in Spanish and one group discussion held in Arabic. Workshop topics were based on Regional Plan elements drawn from the recently approved vision and goals for San Diego Forward: The Regional Plan.
In an effort to engage with a variety of stakeholders, workshops were advertised in both English and Spanish and held in both the daytime and in the evening throughout the region. The six evening workshops were conducted in the various subregions (listed below) to generate broad participation and enable discussion on all of the policy areas. The daytime workshops, held at Caltrans District 11 Headquarters in Old Town, focused on exploring more specific themes, which
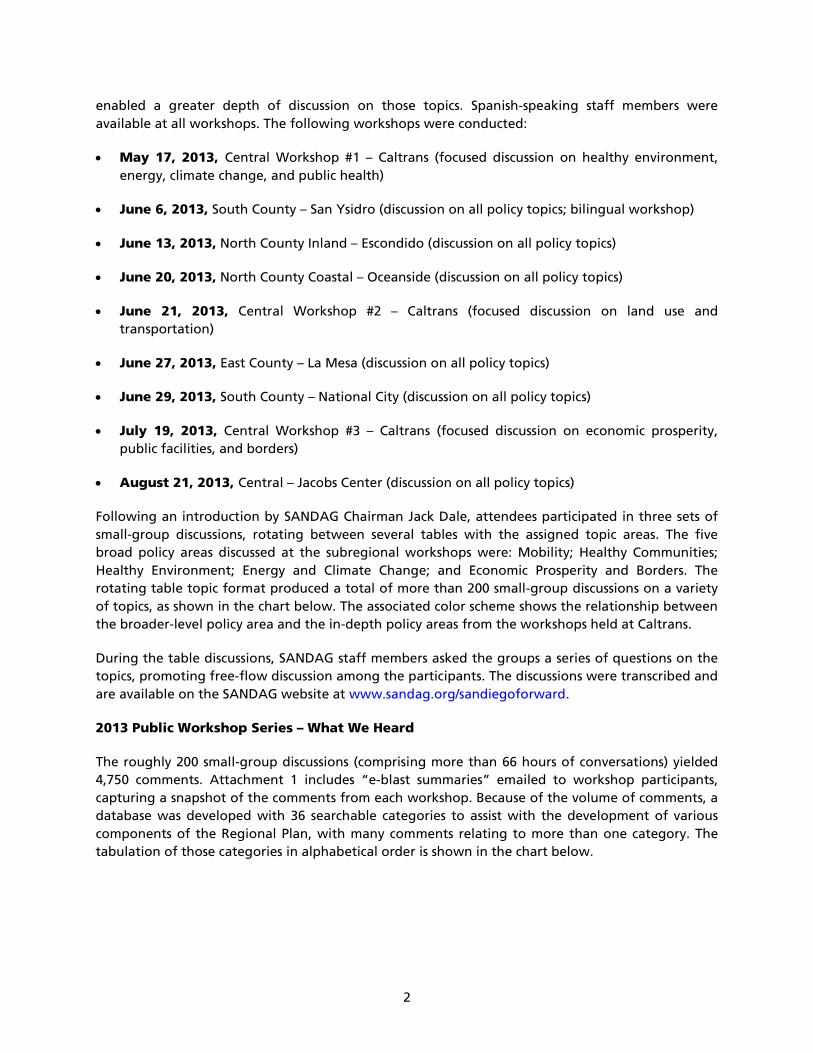
2
enabled a greater depth of discussion on those topics. Spanish-speaking staff members were available at all workshops. The following workshops were conducted:
• May 17, 2013, Central Workshop #1 – Caltrans (focused discussion on healthy environment, energy, climate change, and public health)
• June 6, 2013, South County – San Ysidro (discussion on all policy topics; bilingual workshop)
• June 13, 2013, North County Inland – Escondido (discussion on all policy topics)
• June 20, 2013, North County Coastal – Oceanside (discussion on all policy topics)
• June 21, 2013, Central Workshop #2 – Caltrans (focused discussion on land use and transportation)
• June 27, 2013, East County – La Mesa (discussion on all policy topics)
• June 29, 2013, South County – National City (discussion on all policy topics)
• July 19, 2013, Central Workshop #3 – Caltrans (focused discussion on economic prosperity, public facilities, and borders)
• August 21, 2013, Central – Jacobs Center (discussion on all policy topics)
Following an introduction by SANDAG Chairman Jack Dale, attendees participated in three sets of small-group discussions, rotating between several tables with the assigned topic areas. The five broad policy areas discussed at the subregional workshops were: Mobility; Healthy Communities; Healthy Environment; Energy and Climate Change; and Economic Prosperity and Borders. The rotating table topic format produced a total of more than 200 small-group discussions on a variety of topics, as shown in the chart below. The associated color scheme shows the relationship between the broader-level policy area and the in-depth policy areas from the workshops held at Caltrans.
During the table discussions, SANDAG staff members asked the groups a series of questions on the topics, promoting free-flow discussion among the participants. The discussions were transcribed and are available on the SANDAG website at www.sandag.org/sandiegoforward.
2013 Public Workshop Series – What We Heard
The roughly 200 small-group discussions (comprising more than 66 hours of conversations) yielded 4,750 comments. Attachment 1 includes “e-blast summaries” emailed to workshop participants, capturing a snapshot of the comments from each workshop. Because of the volume of comments, a database was developed with 36 searchable categories to assist with the development of various components of the Regional Plan, with many comments relating to more than one category. The tabulation of those categories in alphabetical order is shown in the chart below.
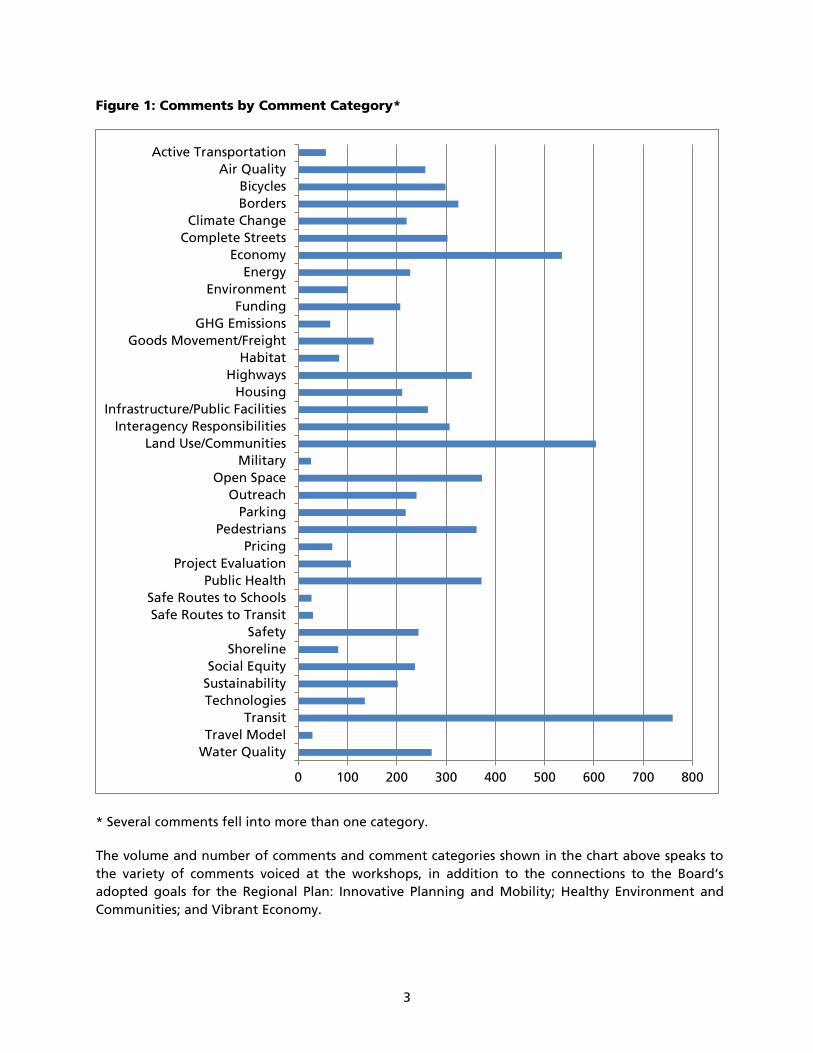
3
Figure 1: Comments by Comment Category*
* Several comments fell into more than one category.
The volume and number of comments and comment categories shown in the chart above speaks to the variety of comments voiced at the workshops, in addition to the connections to the Board’s adopted goals for the Regional Plan: Innovative Planning and Mobility; Healthy Environment and Communities; and Vibrant Economy.
0 100 200 300 400 500 600 700 800
Water QualityTravel Model
TransitTechnologiesSustainabilitySocial Equity
ShorelineSafety
Safe Routes to TransitSafe Routes to Schools
Public HealthProject Evaluation
PricingPedestrians
ParkingOutreach
Open SpaceMilitary
Land Use/CommunitiesInteragency Responsibilities
Infrastructure/Public FacilitiesHousing
HighwaysHabitat
Goods Movement/FreightGHG Emissions
FundingEnvironment
EnergyEconomy
Complete StreetsClimate Change
BordersBicycles
Air QualityActive Transportation
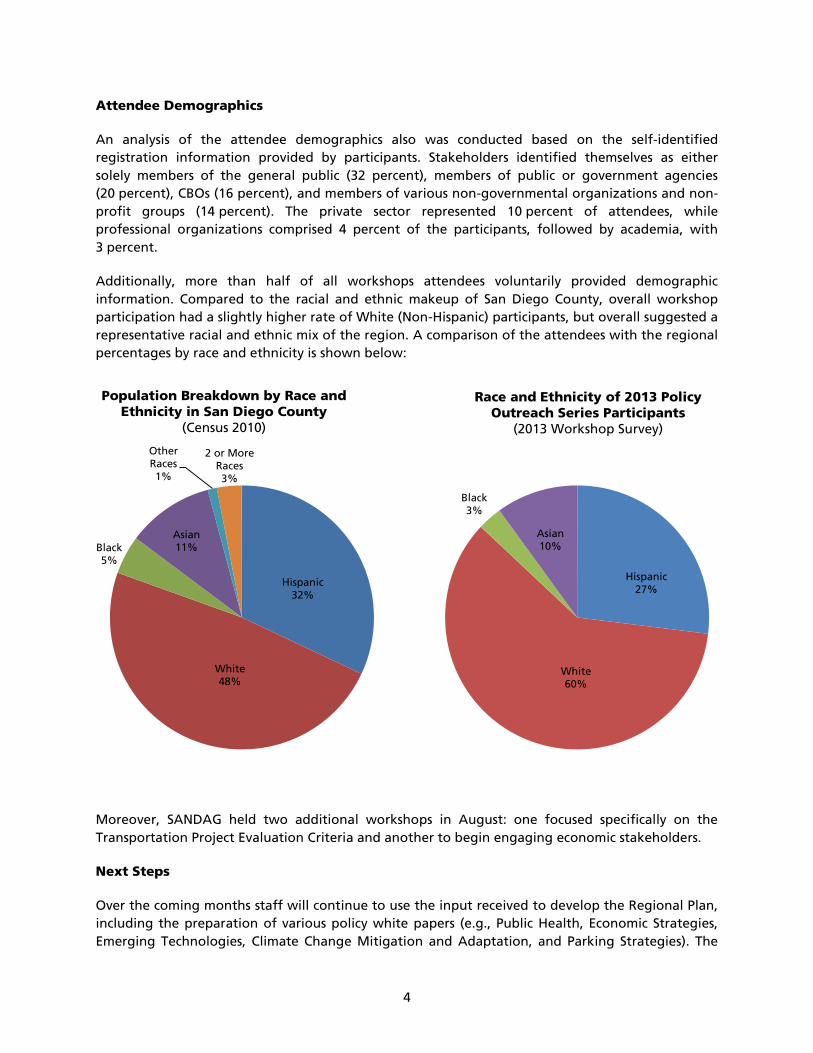
4
Attendee Demographics
An analysis of the attendee demographics also was conducted based on the self-identified registration information provided by participants. Stakeholders identified themselves as either solely members of the general public (32 percent), members of public or government agencies (20 percent), CBOs (16 percent), and members of various non-governmental organizations and non-profit groups (14 percent). The private sector represented 10 percent of attendees, while professional organizations comprised 4 percent of the participants, followed by academia, with 3 percent.
Additionally, more than half of all workshops attendees voluntarily provided demographic information. Compared to the racial and ethnic makeup of San Diego County, overall workshop participation had a slightly higher rate of White (Non-Hispanic) participants, but overall suggested a representative racial and ethnic mix of the region. A comparison of the attendees with the regional percentages by race and ethnicity is shown below:
Moreover, SANDAG held two additional workshops in August: one focused specifically on the Transportation Project Evaluation Criteria and another to begin engaging economic stakeholders.
Next Steps
Over the coming months staff will continue to use the input received to develop the Regional Plan, including the preparation of various policy white papers (e.g., Public Health, Economic Strategies, Emerging Technologies, Climate Change Mitigation and Adaptation, and Parking Strategies). The
Hispanic 32%
White 48%
Black 5%
Asian 11%
Other Races 1%
2 or More Races 3%
Hispanic 27%
White 60%
Black 3%
Asian 10%
Population Breakdown by Race and Ethnicity in San Diego County
(Census 2010)
Race and Ethnicity of 2013 Policy Outreach Series Participants
(2013 Workshop Survey)
5
comments received from the workshops also will be included in the analysis of related planning efforts that will be folded into the Regional Plan, including the Active Transportation Implementation Strategy, Habitat Management Strategic Plan, Regional Transit Oriented Development Strategy, Land Use and Transportation Scenarios, and Complete Streets Policy.
GARY L. GALLEGOS Executive Director
Attachment: 1. E-Blast Summaries from each Workshop
Key Staff Contact: Phil Trom, (619) 699-7330, [email protected]
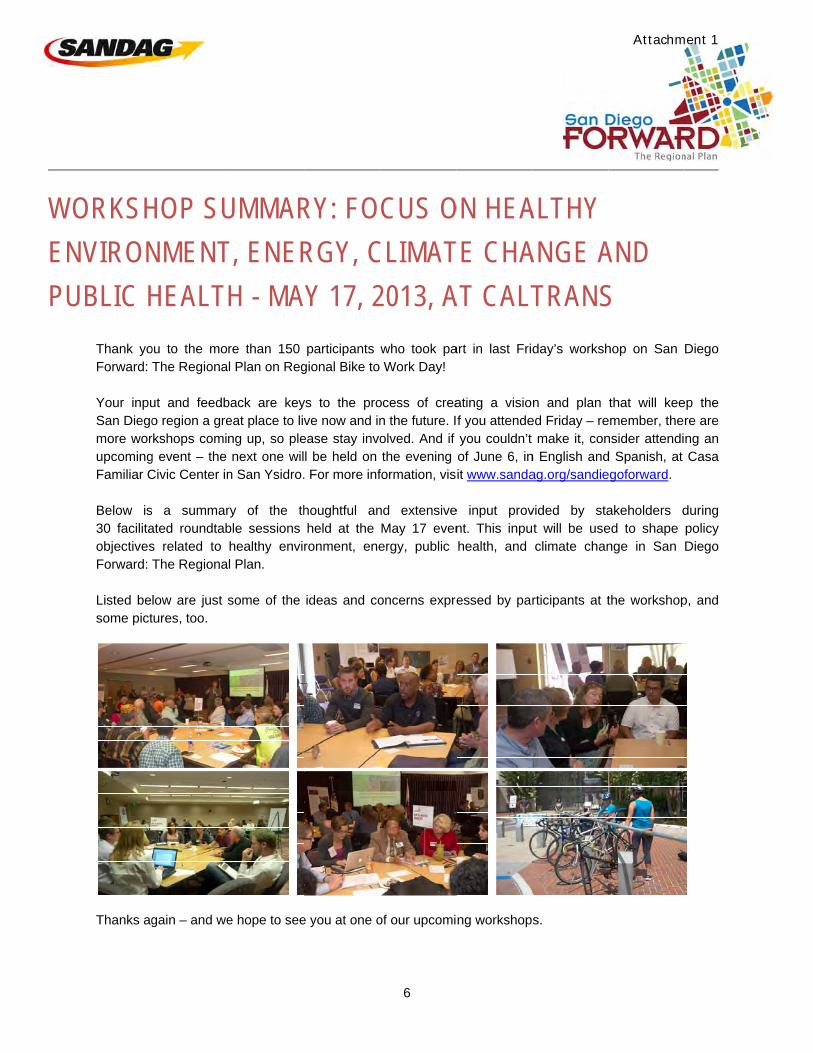
WOENPU
ORKSHNVIRONUBLIC H
Thank yoForward: Your inpuSan Diegomore worupcomingFamiliar C Below is30 facilitaobjectivesForward: Listed besome pict
Thanks ag
HOP SUNMENTHEALTou to the moThe Regiona
ut and feedbo region a grerkshops comig event – the Civic Center in
a summarated roundtabs related to The Regiona
low are just stures, too.
gain – and we
UMMART, ENERH - MAre than 150 l Plan on Reg
back are keyeat place to livng up, so plenext one wil
n San Ysidro.
ry of the thble sessions healthy envil Plan.
some of the
e hope to see
RY: FORGY, CY 17, 2participants
gional Bike to
ys to the prove now and in
ease stay invol be held on . For more inf
houghtful anheld at the ronment, ene
ideas and co
e you at one o
CUS OCLIMAT2013, A
who took paWork Day!
ocess of crean the future. Iolved. And if the evening
formation, vis
nd extensiveMay 17 evenergy, public
oncerns expre
of our upcomi
ON HEATE CHAAT CALT
art in last Frid
ating a visiof you attendeyou couldn’t of June 6, init www.sanda
e input provnt. This inpuhealth, and
essed by par
ng workshop
ALTHY ANGE ATRANSday’s worksh
n and plan ed Friday – re
make it, conn English andag.org/sandie
vided by stat will be useclimate chan
rticipants at t
s.
AND S hop on San
that will keeemember, thensider attendid Spanish, at egoforward.
akeholders ded to shape nge in San
the workshop
Diego
ep the re are ng an Casa
during policy Diego
p, and
Attachment 1
6
4
Climate Change • Place greenhouse gas (GHG) reductions at the center of the identified Regional Plan goals and
objectives. • Provide strong regional policy guidance on GHG emissions reductions. • Address Environmental Justice (EJ)/Public Health issues associated with climate change and the
measures to reduce GHGs. • Explain the full set of options that the SANDAG Board has in expending TransNet funds (e.g.,
what percent/amount of funding and category/function/program can’t be modified but every 10 years, what requires 2/3 vote to modify, and portion of the allocation is discretionary).
• Comprehensively add both climate adaptation and mitigation (without silos) and promote the synthesis between the two plans (the Regional Transportation Plan and the Regional Comprehensive Plan).
• Prepare for the impacts of climate change on both the natural and built environments. Key concerns include increases in wildfires and heat waves, sea-level rise, water supply and demand, public health impacts, agriculture and food-security, and disproportionate impacts on low-income, minority, and senior populations.
• Pursue regional coordination on climate change and adaptation efforts. We need scalable solutions – from the parcel to the regional to the state level.
• Promote best practices that provide co-benefits, such as xeriscaping, graywater re-use, tree planting, and other low-impact development solutions.
• Prioritize transportation investments based on their benefits to the environment. • SANDAG should provide a forum for regional collaboration, incentives for adaptation and mitigation,
guidance on design standards, and other resources to address climate change. • Build transportation infrastructure that can withstand the adverse effects of climate change, like sea
level rise. • Incorporate greenhouse gas (GHG) reduction and climate change efforts into the regional plan
(including goals, policy measures, and funding opportunities). • Plant more vegetation/trees now as a low-cost mitigation measure that will ultimately absorb more
GHGs in the future and enhance communities. • Empower the community to address climate-related behaviors at an individual and neighborhood
level. Start with educating the children. Air & Water Quality • Address respiratory problems with better public transportation, more carpooling and vanpooling, and
communities where people can bike and walk more. • Bring air quality issues down to the micro level, for example, by bringing small hand-held air quality
monitoring devices to community members. • More urban forestry/vegetation can help reduce air and water pollution, and improve economic
conditions in local communities. • Work within the environment: create more attractive spaces using native species – these don’t require
a lot of water and fertilizer. • Create a regionally driven policy for reclaimed water. • Look at all impacts related to water quality, not just the impacts related to new development projects. • Address both health and social equity issues related to air and water quality – need to focus on
impacted communities, those that suffer the most. Habitat & Shoreline
7
mmo
Rectangle
5
• San Diego has been successful in preserving habitat. Focus on restoring and providing access to
these areas. • Incentivize higher density development around transit. That would allow people to get around easier
and also preserve open space. • Make access to open spaces more equitable. • Wetlands protection needs to be done on a larger scale; wetlands protect shorelines and act as
carbon sinks. • Wetland rehabilitation efforts that remove concrete linings of channels and restore the riparian habitat
are important, and we should also incorporate bike lanes so that people can enjoy it. • Make policy changes that incorporate permeability and other green infrastructure codes that help
mitigate urban run-off. • Create open spaces and trails for residents in developed areas. • Create policies that require upland development projects to include a sand mitigation component as
this material can no longer flow naturally from inland to the coast. • Balance preservation and recreation – providing access while protecting habitat. • Develop bicycle trails along the San Diego River to mix the green corridor into open space – like the
San Antonio River Walk. Healthy Communities • The ability to walk and bike within communities and to school is important. • Consider rethinking the methodology of how trips are calculated within a complete streets framework,
using something other than Level of Service (LOS) and moving toward a multi-modal analysis. • Look at the inequities and health disparities between neighborhoods and focus the investments in
areas of need. • Look at areas with concentrations of obesity and diabetes and examine current transportation
infrastructure to find the gaps. Shift transportation modes toward active transportation. • Make public health a line item within the policy making process, and not an afterthought – focus on
how to bridge disparities. • Consider the needs of all populations including the aging population. • Create bike facilities for commuting AND recreation. • Marry functionality and safety in neighborhood design to encourage more walkable communities
which can lead to greater social interaction. • Need walkability connections to grocery stores, creating access to healthy foods. • Leverage existing resources with the Human Health and Services Agency (HHSA) and other
organizations. • Provide more diverse bike options. Class 1 lanes are not very common in California, but for women in
particular, they could help lower stress levels for biking. • Social equity is important to address with public health because many communities have suffered
from years of disinvestments, and have higher rates of chronic diseases, including diabetes. • Healthy communities and public facilities should address the needs of the homeless. • Healthy communities should have a robust urban forestry program, and a lot of green space. This can
impact food, safety, and health. • Where one lives should not determine the quality and length of life. • Promote policies that motivate healthier food options to move into low-income neighborhoods, and
provide incentives to those companies which promote healthy eating. Clean Energy, Clean Fuels & Innovation
8
mmo
Rectangle
6
• Place a high value on issues that will be important for the younger generations. • Plan and build facilities for safely riding bikes to and from school. • Alternative energy sources:
o Energy efficiency and roof-top energy needs to be a priority in making communities more self-sufficient.
o Need to fit the communities that we already have with photovoltaics, and deemphasize fitting the back country with large energy plants.
• Transit centers could have conference rooms attached so people can rent a room and hold meetings at a place that is accessible by transit.
• The net energy use by communities should be evaluated. • Encourage roof-top photovoltaic: public buildings, industrial and residential. • The only practical way to get people to use the good stuff is to highly tax the bad stuff. This is
politically unpopular, but economically popular. • Presentations to high school students nearing driving age should be made regarding affordable
energy-efficient cars. • Car2Go is good program because buying a zero-emission vehicle is out of reach to many families • There are programs that help seniors with the bills and they talk to them about other ways to save
money. Many seniors have inquired about ways they can be more environmentally friendly • Border crossing wait-times should be improved to reduce emissions and health impacts. • Provide opportunities for and promote mobility options that produce low emissions or no emissions at
all (bicycling and walking). • Create community garden opportunities to reduce emissions related to the transportation of fruits and
vegetables. • Focus on renewable energy (e.g. wind, solar, geothermal) and increasing low carbon fuel standards. • Focus on distributed (on-site) generation of green energy. Solar, wind, biofuel require less
infrastructure and protect open space/habitat areas; industrialized solar/wind energy is destructive and requires transmission lines.
• Build more infrastructure to support electric cars. • Develop apps or ways people can determine how much water and energy they are consuming to help
them conserve and use these resources more efficiently. • Focus on green jobs related to transportation, buildings, etc.; support entrepreneurs. • Reduce energy use by buying local food and creating food hubs.
9
mmo
Rectangle
WOJUCA
ThpaTh YocreSafutwoyoueveJuww BeinprousouseTh In nohawo
ORKSHUNE 6, 2ASA FA
ank you to trt in the Junee Regional P
our input andeating a visan Diego regioure. If you a
orkshops comu couldn’t maent – the nene 13 in Es
ww.sandag.or
elow is a sumput provided undtable sesme pictures ed to shape pe Regional P
addition to tetakers’ noteve also adde
orkshop to the
HOP SU2013 / 6
AMILIAR
ENGL
the almost 1e 6th worksholan!
feedback arsion and pon a great pla
attended – reming up, so plake it, considxt one will bscondido. Forg/sandiegofo
mmary of the by stakehold
sions held aare included
policy objectivlan.
this summes has been ped notetakerse website.
UMMAR6 DE JR, SAN
ISH
00 participanop on San Die
re keys to thlan that wiace to live no
emember, theease stay inver attending e held on th
or more infororward.
thoughtful aders during 3
at the June 6d, too. This ves in San Die
ary, a compposted on thes’ notes from
RY / REUNIO D YSIDR
nts who tookego Forward:
e process ofll keep the
ow and in theere are morevolved. And ifan upcominge evening ofrmation, visit
and extensive30 facilitated6 event, andinput will beego Forward:
plete set ofe website. We
m the May 17
ESUMEDE 201RO
k :
f e e e f g f t
e d d e :
¡Gracien el tEl Plan Su apode creSan Dfuturo.más tparticippróximjunio inform A contreflexiomesasincluyeserá uen Ade
f e 7
Ademátomarointernedel 17
EN DEL3
as a los casitaller del juevn Regional!
orte y retroaliear una visiónDiego como u. Si usted asitalleres parapar, conside
mo taller se len la ciudad
mación, visite w
tinuación se ones que loss redondas faen algunas futilizada paraelante San D
ás, un resumon en el tallet. También de mayo a la
TALLE
ESPAÑO
i 100 participves 6 de junio
imentación son y un plan quun gran lugarstió al taller,
a seguir invoere asistir a levará a cabd de Escondwww.sandag.
encuentra uns participante
acilitadas en efotos, tambiéna dar forma aiego: El Plan
men completer se ha puhemos agreg
a página de in
ER:
OL
pantes que too en Adelante
on claves parue mantendrár para vivir ale recordamo
olucrado. Y un próximo
bo en la tarddido. Para o.org/sandiego
n resumen dees expresaroel taller del 6 n. Esta retro
a los objetivoRegional.
o con las noblicado en lagado las notnternet.
omaron parte e San Diego:
ra el proceso á la región de hora y en el
os que habrá si no pudo
o evento. El de del 13 de obtener más oforward.
e las ideas y on en las 30 de junio y se
oalimentación s de política
otas que se a página de tas del taller
10
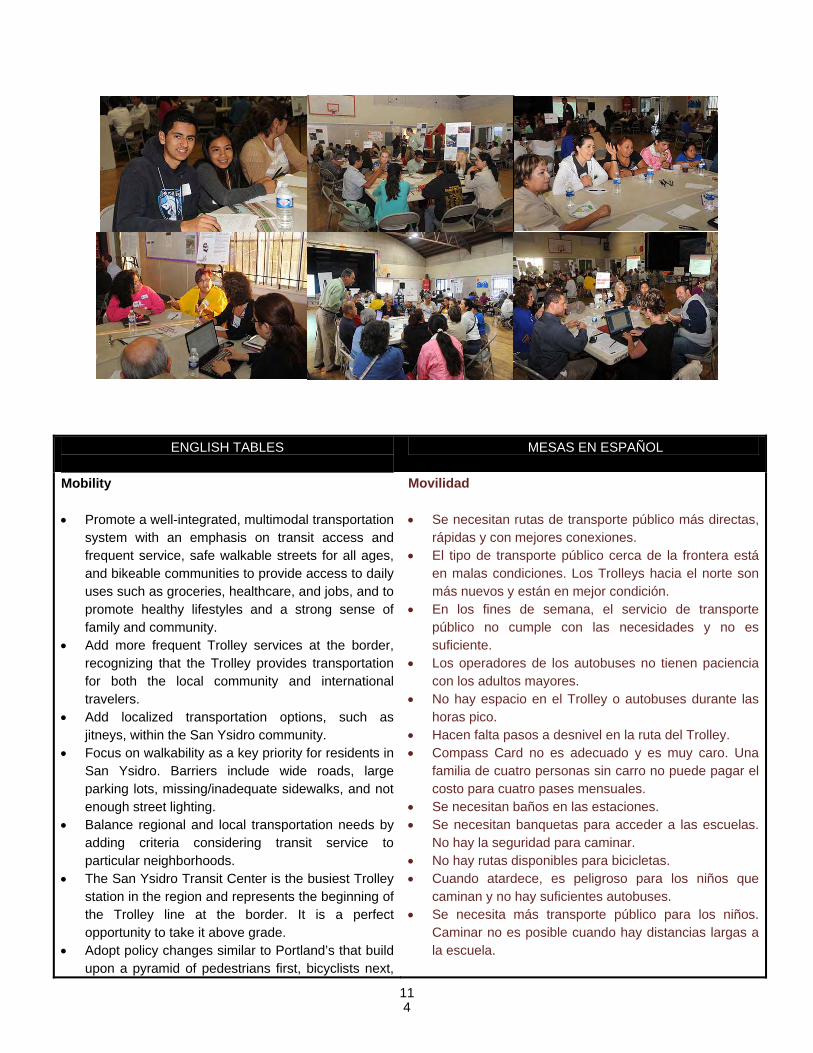
4
ENGLISH TABLES
MESAS EN ESPAÑOL
Mobility • Promote a well-integrated, multimodal transportation
system with an emphasis on transit access and frequent service, safe walkable streets for all ages, and bikeable communities to provide access to daily uses such as groceries, healthcare, and jobs, and to promote healthy lifestyles and a strong sense of family and community.
• Add more frequent Trolley services at the border, recognizing that the Trolley provides transportation for both the local community and international travelers.
• Add localized transportation options, such as jitneys, within the San Ysidro community.
• Focus on walkability as a key priority for residents in San Ysidro. Barriers include wide roads, large parking lots, missing/inadequate sidewalks, and not enough street lighting.
• Balance regional and local transportation needs by adding criteria considering transit service to particular neighborhoods.
• The San Ysidro Transit Center is the busiest Trolley station in the region and represents the beginning of the Trolley line at the border. It is a perfect opportunity to take it above grade.
• Adopt policy changes similar to Portland’s that build upon a pyramid of pedestrians first, bicyclists next,
Movilidad • Se necesitan rutas de transporte público más directas,
rápidas y con mejores conexiones. • El tipo de transporte público cerca de la frontera está
en malas condiciones. Los Trolleys hacia el norte son más nuevos y están en mejor condición.
• En los fines de semana, el servicio de transporte público no cumple con las necesidades y no es suficiente.
• Los operadores de los autobuses no tienen paciencia con los adultos mayores.
• No hay espacio en el Trolley o autobuses durante las horas pico.
• Hacen falta pasos a desnivel en la ruta del Trolley. • Compass Card no es adecuado y es muy caro. Una
familia de cuatro personas sin carro no puede pagar el costo para cuatro pases mensuales.
• Se necesitan baños en las estaciones. • Se necesitan banquetas para acceder a las escuelas.
No hay la seguridad para caminar. • No hay rutas disponibles para bicicletas. • Cuando atardece, es peligroso para los niños que
caminan y no hay suficientes autobuses. • Se necesita más transporte público para los niños.
Caminar no es posible cuando hay distancias largas a la escuela.
11
mmo
Rectangle
5
transit, commercial vehicles, taxis, then single vehicles last.
• Focus on infrastructure for pedestrians and bicyclists to improve safety, especially safe routes to schools.
• Explore better greenhouse gas (GHG) emission reduction alternatives.
• Use urban growth boundaries to maximize infill opportunities.
• Provide more security on the bus/trolley. Healthy Communities • Provide more access to organic products and
healthy foods. • Invest in more public transit and bike paths. • Create a more attractive pedestrian environment –
wider sidewalks; places to sit; shaded areas, trees. • To improve air quality, create more green areas,
plant more trees, and provide a natural buffer between homes and freeways.
• Add security to the Trolley and remove trash from the Trolley cars.
• Address idling from cars at the border crossing. • Reduce high levels of toxins in the soil to promote
gardening. • Invest in special paint that attracts carbon to the
walls. • Improve crosswalks; design streets and
communities for people, not cars; promote more ways to connect.
• Address safety concerns of children when there aren’t enough sidewalks near schools – they have to go through paths in canyons – no lighting, sometimes encounter dangerous wildlife.
• Provide more open spaces such as small pocket parks that can be within the neighborhood for families to stop by; place to socialize.
• Provide access to The Tijuana River Valley – beautiful but no trails.
• Close down a street for a street fair or farmers market and promote a community garden.
• Provide incentives/shared bike program for people who use their bikes at the border.
• Build a Class 1 Bicycle path from the international border to the Bayshore Bikeway.
Comunidades Saludables • Atraer mercados que ofrezcan comidas y productos
orgánicos. • Mejorar la promoción del uso del transporte público a
la comunidad. • Mejores calles; arreglar los hoyos que existen en las
calles; construir más banquetas para la seguridad del peatón y la juventud.
• Deben de haber rutas seguras a la escuela para los alumnos.
• Crear mejor acceso para el peatón al transporte público.
• Se necesitan mercados que sean más económicos, saludables y sustentables.
• Combatir y eliminar el uso de drogas dentro de la comunidad.
• Contaminación – el smog ha causado el incremento de casos de asma; se debe reducir el uso de carros para reducir la contaminación.
• El tiempo que se toma para cruzar la frontera es demasiado. La demora causa una “tortura” y causa un estrés muy grande.
• Necesitamos educación para el ciclista, el conductor, y para la comunidad para mejorar la seguridad de todos.
• Se debe ampliar los carriles para ciclistas sobre la calle para mejorar la seguridad.
• Necesitamos sembradillos locales – se debe usar lotes vacíos para la educación y para mejorar la comunidad.
• No hay hospital en San Ysidro. • Necesitamos mejores parques y que estén bien
cuidados y seguros y que cuenten con baños. Crear un programa como “Park and Ride” en la comunidad y aumentar el acceso a “van pools”.
Healthy Environment
Medio Ambiente Saludable
12
mmo
Rectangle
6
• Manage water runoff more effectively since the water eventually goes out to our beaches.
• There is a new global climate law in Mexico, so work together to achieve certain greenhouse (GHG) emission goals.
• Address air pollution and the negative health impacts caused by idling cars at the border.
• Promote more connections to the Tijuana Estuary so that people can appreciate the natural resources and become more active in that area.
• Address beach closures in Imperial Beach due to high levels of contamination and sewage.
• Encourage more public areas to be non-smoking. • Climate change and sea level rise is a concern.
Everything is interconnected and sea level rise will make crops harder to grow.
• Work with the Environmental Health Coalition, Wildcoast, and Ocean Force to look at salinity of the oceans, tide levels, and effects on ecosystems.
• Reinstate the bike incentive for crossing the border. • Reduce crime. Crime is an aspect of healthy
environment, because it restricts people from going out on walks or letting their children outside when it is not safe, and this limits activity levels and community participation.
• Increase children’s education programs focused on the outdoors.
• Se necesitan más árboles. • Hay que conservar el agua y usarla en forma más
restringida. • Hacen falta más baños en los parques. • La contaminación del aire en San Ysidro es cuatro
veces peor que en otras comunidades de San Diego. • La línea azul del Trolley paga por el sistema; es la
línea que funciona mejor. • Sería bueno tener un tren como el COASTER que
fuera hasta la frontera. • San Ysidro debe ser un centro de transporte; mucha
gente se va hasta Los Ángeles. • Hacen falta campañas de educación para que la gente
entiende como sus acciones impactan al medio ambiente. Se necesita una campaña dirigida a las empresas también.
• No hay confianza en el agua potable. • El agua es caro; no se puede usar la de la canilla. • Debe haber usos distintos de agua (agua de riego
versus potable). • Necesitamos más arborización de las calles. • Promover en las escuelas la protección de la playa.
Energy and Climate Change
• Increase awareness and understanding of how climate change relates to the average person.
• Tailor the message to different population segments, taking factors such as language and culture into consideration.
• Provide more green space, which can help address pollution and climate change.
• Expand Car2Go car-sharing throughout the region. • Demonstrate the benefits of making individual
changes to reduce GHG emissions. • Invest more in sustainable energy. • Increase gas prices to encourage alternative forms
of transportation. • Synchronize stoplights to reduce idling, traffic, and
pollution. • Proactively and naturally reduce fuel for wildfires, for
example, by using goats. • Change building codes to allow gray water to drain
directly into gardens/landscaping.
Energía y Cambio Climático • En la frontera, hay más contaminación que se siente
más por la cercanía a la garita. • Revisar las emisiones de vehículos que cruzan la
frontera. • Educar más a los niños acerca del cambio climático. • Publicar los horarios de la escuela y qué relación
tienen con los niveles de emisiones. • Simplificar la información para que gente entienda. • Agilizar el cruce fronterizo para los peatones. • Implementar paneles solares y sistemas eólicos. • Difundir la información de planes y programas de
desarrollo en lenguaje coloquial. • Sembrar más áreas verdes y jardines para respirar aire
más puro. • Aprovechar la energía solar. • Mejorar la eficiencia de los vehículos y reducir las
emisiones. • Caminar y andar en bicicleta como medio de
transporte.
13
mmo
Rectangle
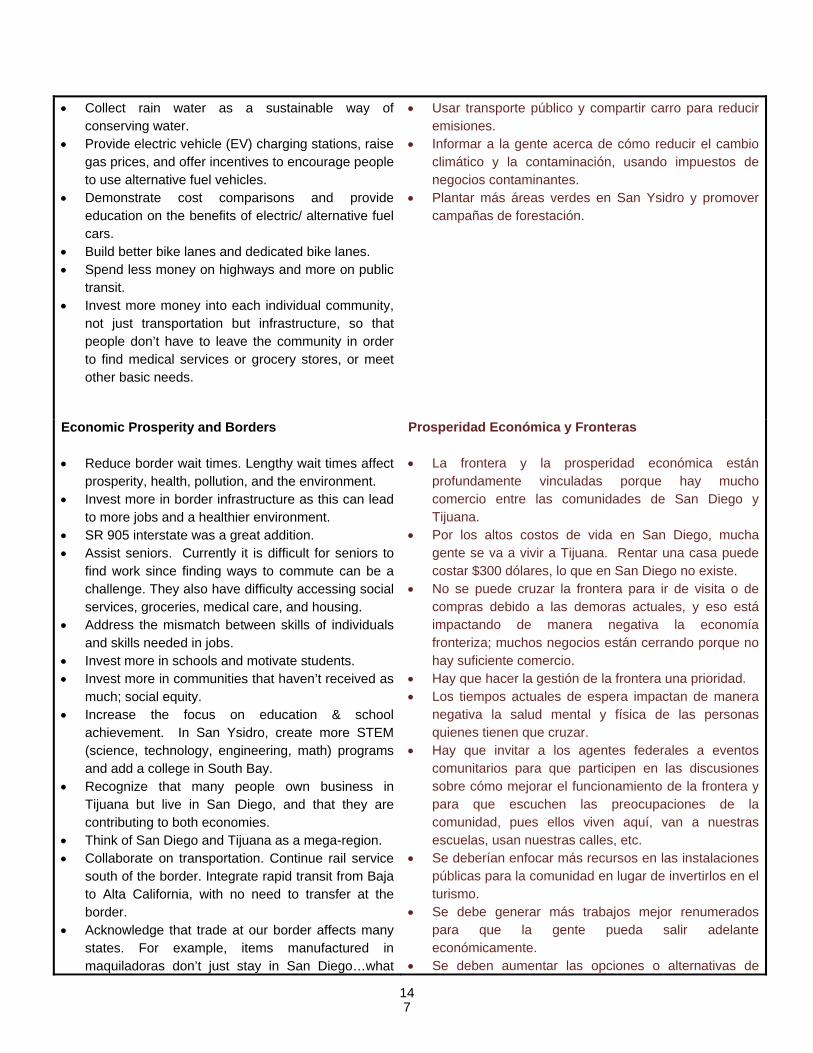
7
• Collect rain water as a sustainable way of conserving water.
• Provide electric vehicle (EV) charging stations, raise gas prices, and offer incentives to encourage people to use alternative fuel vehicles.
• Demonstrate cost comparisons and provide education on the benefits of electric/ alternative fuel cars.
• Build better bike lanes and dedicated bike lanes. • Spend less money on highways and more on public
transit. • Invest more money into each individual community,
not just transportation but infrastructure, so that people don’t have to leave the community in order to find medical services or grocery stores, or meet other basic needs.
• Usar transporte público y compartir carro para reducir emisiones.
• Informar a la gente acerca de cómo reducir el cambio climático y la contaminación, usando impuestos de negocios contaminantes.
• Plantar más áreas verdes en San Ysidro y promover campañas de forestación.
Economic Prosperity and Borders • Reduce border wait times. Lengthy wait times affect
prosperity, health, pollution, and the environment. • Invest more in border infrastructure as this can lead
to more jobs and a healthier environment. • SR 905 interstate was a great addition. • Assist seniors. Currently it is difficult for seniors to
find work since finding ways to commute can be a challenge. They also have difficulty accessing social services, groceries, medical care, and housing.
• Address the mismatch between skills of individuals and skills needed in jobs.
• Invest more in schools and motivate students. • Invest more in communities that haven’t received as
much; social equity. • Increase the focus on education & school
achievement. In San Ysidro, create more STEM (science, technology, engineering, math) programs and add a college in South Bay.
• Recognize that many people own business in Tijuana but live in San Diego, and that they are contributing to both economies.
• Think of San Diego and Tijuana as a mega-region. • Collaborate on transportation. Continue rail service
south of the border. Integrate rapid transit from Baja to Alta California, with no need to transfer at the border.
• Acknowledge that trade at our border affects many states. For example, items manufactured in maquiladoras don’t just stay in San Diego…what
Prosperidad Económica y Fronteras
• La frontera y la prosperidad económica están profundamente vinculadas porque hay mucho comercio entre las comunidades de San Diego y Tijuana.
• Por los altos costos de vida en San Diego, mucha gente se va a vivir a Tijuana. Rentar una casa puede costar $300 dólares, lo que en San Diego no existe.
• No se puede cruzar la frontera para ir de visita o de compras debido a las demoras actuales, y eso está impactando de manera negativa la economía fronteriza; muchos negocios están cerrando porque no hay suficiente comercio.
• Hay que hacer la gestión de la frontera una prioridad. • Los tiempos actuales de espera impactan de manera
negativa la salud mental y física de las personas quienes tienen que cruzar.
• Hay que invitar a los agentes federales a eventos comunitarios para que participen en las discusiones sobre cómo mejorar el funcionamiento de la frontera y para que escuchen las preocupaciones de la comunidad, pues ellos viven aquí, van a nuestras escuelas, usan nuestras calles, etc.
• Se deberían enfocar más recursos en las instalaciones públicas para la comunidad en lugar de invertirlos en el turismo.
• Se debe generar más trabajos mejor renumerados para que la gente pueda salir adelante económicamente.
• Se deben aumentar las opciones o alternativas de
14
mmo
Rectangle
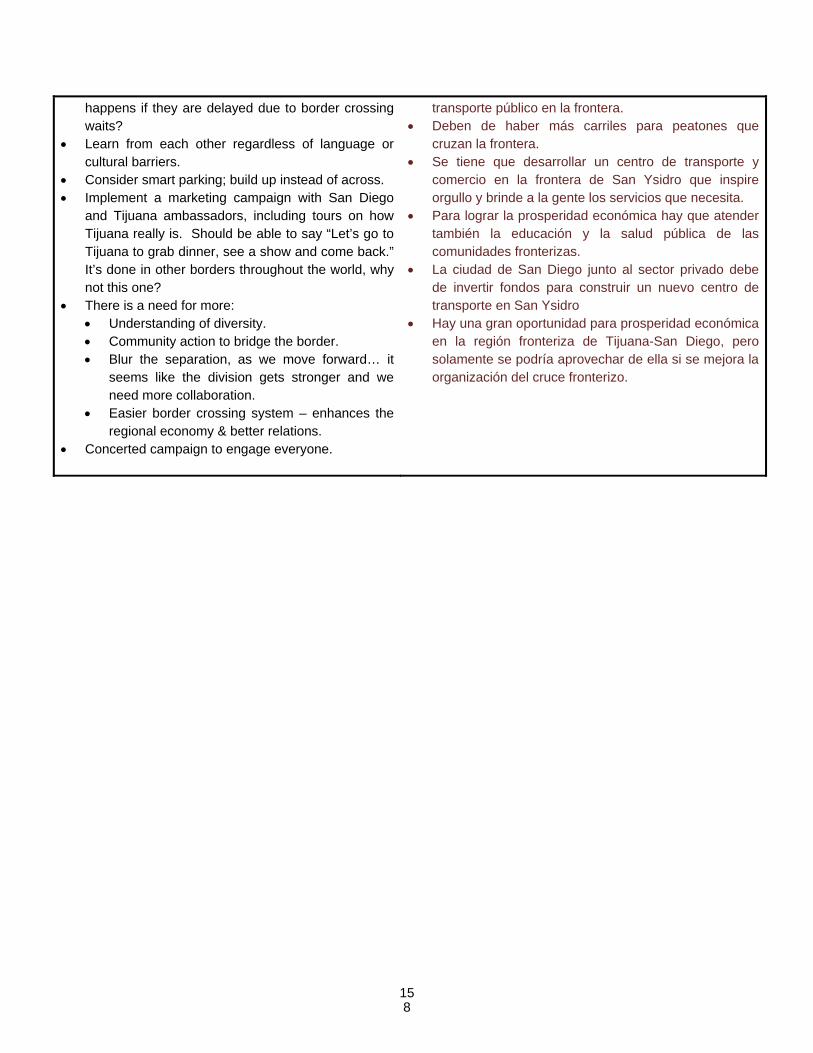
8
happens if they are delayed due to border crossing waits?
• Learn from each other regardless of language or cultural barriers.
• Consider smart parking; build up instead of across. • Implement a marketing campaign with San Diego
and Tijuana ambassadors, including tours on how Tijuana really is. Should be able to say “Let’s go to Tijuana to grab dinner, see a show and come back.” It’s done in other borders throughout the world, why not this one?
• There is a need for more: • Understanding of diversity. • Community action to bridge the border. • Blur the separation, as we move forward… it
seems like the division gets stronger and we need more collaboration.
• Easier border crossing system – enhances the regional economy & better relations.
• Concerted campaign to engage everyone.
transporte público en la frontera. • Deben de haber más carriles para peatones que
cruzan la frontera. • Se tiene que desarrollar un centro de transporte y
comercio en la frontera de San Ysidro que inspire orgullo y brinde a la gente los servicios que necesita.
• Para lograr la prosperidad económica hay que atender también la educación y la salud pública de las comunidades fronterizas.
• La ciudad de San Diego junto al sector privado debe de invertir fondos para construir un nuevo centro de transporte en San Ysidro
• Hay una gran oportunidad para prosperidad económica en la región fronteriza de Tijuana-San Diego, pero solamente se podría aprovechar de ella si se mejora la organización del cruce fronterizo.
15
mmo
Rectangle
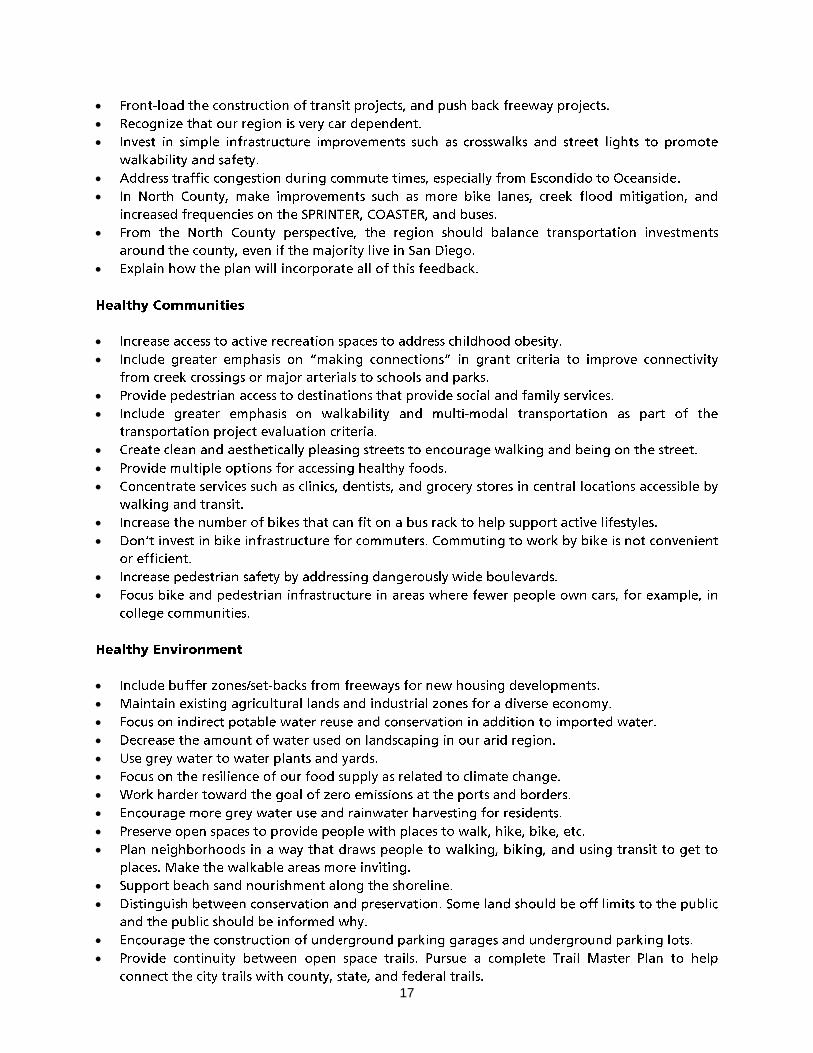
17
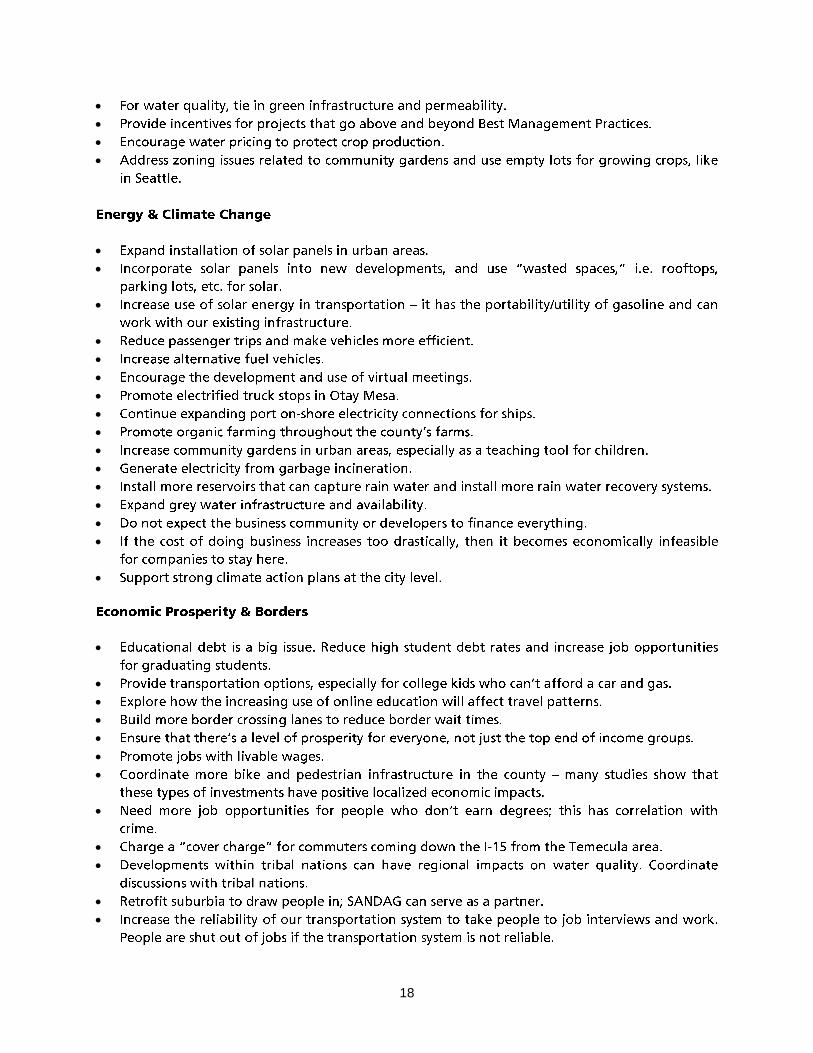
18
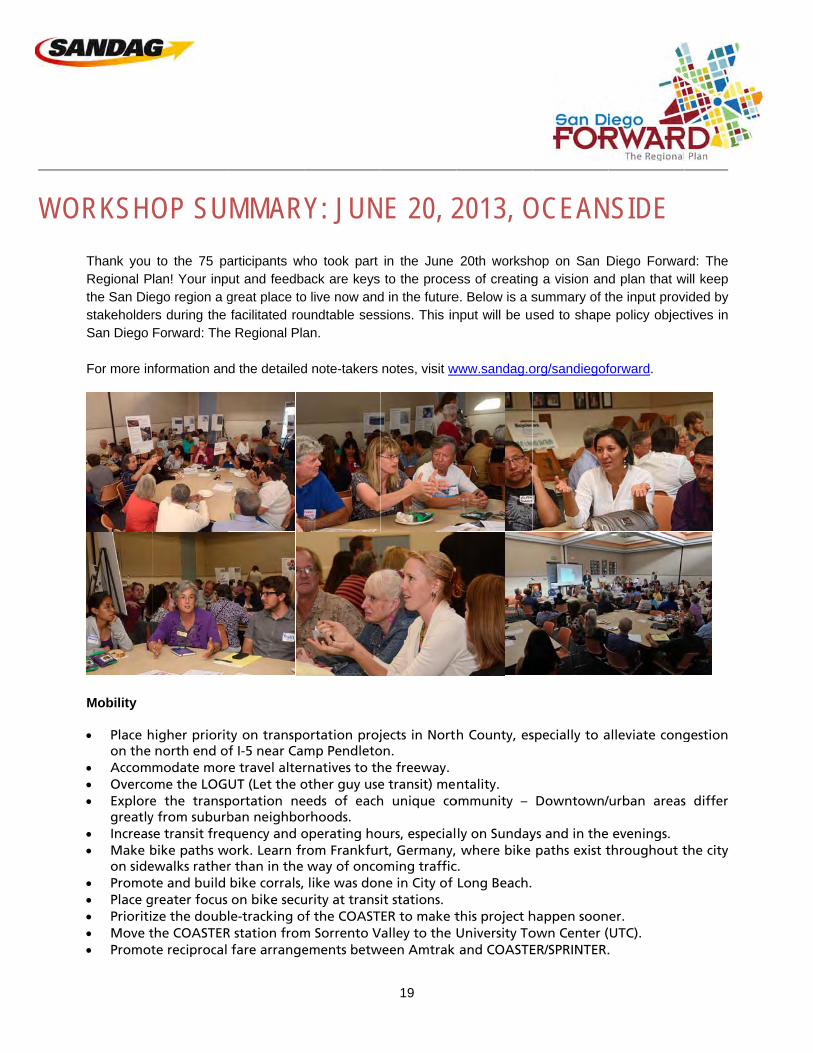
WO
ORKSHOThank you Regional Pthe San DiestakeholderSan Diego For more in
Mobility • Place h
on the • Accom• Overco• Explore
greatly• Increas• Make b
on side• Promot• Place g• Prioriti• Move t• Promot
OP SUto the 75 pa
lan! Your inpego region a grs during the Forward: The
nformation an
higher priorit north end omodate mor
ome the LOGe the transpy from suburbse transit freqbike paths wewalks ratherte and build
greater focus ze the doubthe COASTERte reciprocal
MMARYarticipants whut and feedbgreat place tofacilitated ro
e Regional Pla
d the detailed
ty on transpof I-5 near Cae travel alterUT (Let the o
portation neban neighboquency and o
work. Learn frr than in the bike corrals, on bike secule-tracking o
R station from fare arrange
Y: JUNho took part ack are keys
o live now andundtable sessan.
d note-takers
ortation projmp Pendletornatives to thother guy useeeds of eachorhoods. operating horom Frankfur way of onco like was don
urity at transof the COASTm Sorrento Vements betw
NE 20, 2in the June to the proce
d in the futuresions. This in
notes, visit w
jects in Norton. he freeway. e transit) meh unique co
ours, especialrt, Germany,oming trafficne in City of it stations. ER to make t
Valley to the Uween Amtrak
2013, O20th worksh
ess of creatinge. Below is a snput will be u
www.sandag.o
h County, es
ntality. ommunity –
ly on Sunday where bike
c. Long Beach.
this project hUniversity To and COASTE
OCEANhop on San Dg a vision ansummary of tsed to shape
org/sandiegof
specially to a
Downtown/
ys and in the paths exist t
happen soonown Center (ER/SPRINTER.
SIDE Diego Forwad plan that whe input prov
e policy objec
forward.
alleviate cong
/urban areas
evenings. throughout t
er. (UTC). .
rd: The will keep vided by ctives in
gestion
s differ
the city
19
• Improve connectivity across the COASTER rail tracks, particularly in Encinitas for individuals trying to get to school.
• Add transportation connections and safe places to park bicycles at SPRINTER stops. • Apply I-15 principles (e.g. FasTrak, premium express buses, vanpools, etc.) to I-5. • Extend car-sharing to North County. • Support electric bicycles. • Use technology to its full extent in terms of transportation planning. • Unbundle parking. • Consider physically impaired veterans who have special parking and transportation needs and the
aging population since many Baby Boomers will be incapable of driving in the future. • Put a price on carbon emissions to promote market incentives for sustainable travel behaviors. Healthy Communities • Offer active transportation options and convenient multi-modal travel choices for all age groups
that reduce greenhouse gas emissions. • Widen and improve sidewalks to promote walking, bicycling, wheel-chair access, and stroller
accessibility, and to provide safety and connectivity within the community. • Provide affordable access to basic necessities such as food, water, and housing. • Employ local residents, regardless of age, income level, or ethnicity. • Accommodate and prioritize the needs of the homeless, the aging population, and those with
mental illnesses. • Provide multi-modal and complete streets, increased access to transit for seniors, more senior-
friendly buses, and safe housing options for the elderly. • Promote farmers markets. • Promote a Walk to Work Day. • Do more to limit smoking in public areas. • Encourage new sustainable farming concepts such as the “key-hole garden” – a drought tolerant
circular raised bed with a compost pile in center which distributes nutrients to surrounding areas. • Develop and embody characteristics of resilient communities.
Healthy Environment • Encourage replacing non-native plants that are used in landscaping by native plants to help
conserve water. • Provide more incentives, such as competitions, to encourage reductions of energy and water use. • Build more community gardens in the North County Coastal area. • Create better habitat protection links with watersheds. • Improve water quality of oceans – can’t swim in the water because of sewage system breakdowns
in North County related to old water pipeline infrastructure. Modernize sewage infrastructure. • Acknowledge that population growth will affect everything; think proactively about ecological
and economic issues. • Recognize and address the barriers to achieving our goals, which include: 1) public mind-set, 2)
political mind-set and division of jurisdictional lines, and 3) honest assessment of costs. • Ensure steady supply of water. • Consider requiring each city to have a certain percentage of open space. • Focus on climate stabilization; if we don’t do that, we will lose everything, including habitat. • Do more than the bare minimum with regard to climate change and environmental issues. • Build better and more sustainably – everything should be sustainable. • Understand the trade-offs between desalinization to increase water supply and impacts to the
environment and marine life. • Focus on the quality of drinking water as a #1 priority.
20
Energy & Climate Change • Use existing and proven technologies, such as solar power. • Expand installation of solar panels in urban areas. • Shade parking lots with solar panels. • Promote electric-powered vehicles. • Implement a carbon fee to help solve the GHG emissions problem. • Promote free markets to handle GHG reductions. • Strengthen legislation for reducing GHG emissions and keep agencies accountable. • Promote more public education in schools about climate change at all levels. • Provide more options for public transportation. • Create reliable technology for bus stop times on computers and cell phones. • Work with employers to incentivize ride share and shuttle programs. • Create tools for disaster planning. • Create safer and complete streets (cars, biking, walking). • Maximize “low technologies” such as active transportation (bikeways, walking). • Support programs that allow individuals to produce biofuels. • Include regional water issues in the new plan (desalination is very energy intensive). • Raise personal awareness about energy and water footprint through visual tools. • Make transportation maps and data more accessible. • Look for strategies to reduce growth. Population growth is directly correlated with energy use. The
easiest way to reduce our energy demand is to reduce growth. Economic Prosperity & Borders
• Focus on the kinds of businesses you want to attract, such as business clusters with green tech. • Reduce regulations. The free market will come up with ideas to protect the environment and deal
with growth. Regulation is stifling businesses from creating innovative ideas and causing businesses to leave California.
• Encourage job creation closer to people living in Oceanside to improve commutes. • Increase public transportation between Escondido and Temecula. • Move people more efficiently across our international border crossings. It takes less time to travel
on a plane from Mexico to the United States than to cross the border at San Ysidro. • Encourage cooperation and cross-border economic development. • Improve utilization of all border crossing lanes, including the SENTRI and Ready Lanes. • Address the conflicts between security and ease of crossing at the international border. • Protect our borders because there are many types of potential threats. • Consider a train that travels across the U.S./Mexico border. This could help with the time it takes to
process individuals through customs. • Decrease water rates to promote and preserve agriculture in the region. • Improve wages for lower paying jobs. • Provide education as a means for acquiring higher paying jobs. • Encourage apprentice programs and job training programs.
Español Comunidades Saludables
• Necesitamos acceso a comida saludable y económica, incluyendo verduras frescas. • Queremos una ciudad limpia; que no tiren basura en la calle y que controlen los animales e
insectos. • Necesitamos calles bien pavimentadas sin baches y hoyos y con banquetas. • Banquetas son importantes para la gente con discapacidad. • Es un riesgo para los niños caminar a la orilla de la calle sin banquetas.
21
• Necesitamos centros comunitarios para que los jóvenes tengan acceso a actividades educativas. • Es importante alocar los recursos de manera equitativa. • Deberían plantar árboles en las calles y en los parques. • Necesitamos más alumbrado/iluminación. • SANDAG debe de invitar a más jóvenes para escuchar sus puntos de vista también.
Energía y Cambio Climático • Debemos disminuir el uso de la energía para frenar el cambio climático. • Los calentadores solares son buenos para ahorrar energía al largo plazo. • Los paneles solares son ahora más accesibles que antes, pero hay que educar a la gente sobre los
beneficios de instalar los paneles solares. • Hay una falta de infraestructura para cargar vehículos eléctricos. • Si uno no gana suficiente dinero, no puede comprar una casa, y si uno renta su casa, no se puede
instalar paneles solares, o hacer otras renovaciones que ayudan ahorrar energía. • Deben de haber programas de asistencia que eduquen a la gente sobre cuales tecnologías
alternativas se pueden implementar. • Deben de haber programas de incentivar a la gente tomar medidas de disminuir el uso de la
energía, y también utilizar tecnologías alternativas. • Se necesita reforestar por el bien del medio ambiente y también para el beneficio de la gente y las
comunidades. • Se debe plantar árboles, y también mantenerlos. • Tenemos que estar preparados para los efectos causados por el cambio climático. • El cambio climático está conectado al transporte y la salud pública. • Toma demasiado tiempo usar el transporte público, y el servicio debe ser más frecuente y deben de
haber más rutas. • Las paradas de autobús y del Trolley deben de contar con tejados ya que hay muchas que no los
tienen. Prosperidad Económica y Fronteras
• Queremos mejores sueldos, más trabajos, más oportunidades de educación, y también programas
de entrenamiento. • Empresas privadas deben de ofrecer programas de entrenamiento laboral. • Necesitamos inversiones económicas en nuestras comunidades. • La movilidad impacta a la economía; hay comunidades en que no es fácil trasladarse a ciertos
destinos. • Demora de 2 a 4 horas para cruzar la frontera, tanto en coche como a pie. • Mucha gente, especialmente los de la tercera edad, cruzan a Tijuana para obtener servicios y
bienes más económicos, y debe de ser más fácil cruzar. • Los carros que esperan en la línea fronteriza causan mucha contaminación del aire. • El smog que está saliendo de los carros en la frontera causa un impacto negativo. • Las largas esperas en la frontera impactan negativamente a la economía porque personas quiénes
quisieran cruzar la frontera para fines comerciales o para hacer compras no lo hace por las demoras.
• Sería una buena idea tener un carril dedicado a las bicicletas, pero tendrían que controlar el tráfico para que la gente no lo abuse.
• Sería buena idea empezar un programa de compartir bicicletas en la frontera.
22
WORKSHOP SUMMARY: FOCUS ON LAND USE AND
TRANSPORTATION - JUNE 21, 2013, CALTRANS
Focus on intra-regional mobility which can bring money to outlying areas which can foster regional economic vitality.
Consider a child bike-share program with helmets as a part of a larger bike-share program.
Create reliability for developers to invest around transit stations.
Consider moving air freight travel out of Lindbergh, separating passenger from freight and moving freight to Carlsbad or Brown Field.
Any type of bike-share program needs to include infrastructure to support safer routes to ride.
Expand traveler information to ease of use of the systems (e.g., “Next Bus” signs)
Develop a “transit ambassador” program for seniors.
Make transit competitive with driving in terms of travel time.
23
Apply a complete streets model for main boulevards accommodating multiple modes of travel.
Provide transit service that reaches hard-to-access job centers (e.g. North County).
Design transit so that it accounts for different areas (e.g. higher density areas merit light rail projects).
Improve walk/bike/other connections between bus and rail and to/from destinations.
Direct growth through transportation investments.
Encourage growth along Smart Growth transportation corridors.
Consider public health in decision-making.
Consider including punitive measures to effect change, rather than just incentivizing change; the 18 cities and Port District should be required to follow the Regional Plan goals and principles.
Include transportation options for all demographics (e.g. youth without licenses trying to get to beach as well as aging population of baby boomers).
Promote telecommuting and encourage businesses to offer telecommuting to their employees 1-2 days per week.
Consider sidewalk access and improvements.
Look at impacts of freight movement versus other modes – do the needs of trucks conflict with the needs of bikes, for example.
Make transit convenient, cost-effective, and reliable so that transit is competitive with driving.
Integrate parking with purposeful economic returns.
Balance demand management strategies (congestion pricing) with alternative transportation modes (public transit, active transportation, etc.).
Make car-sharing a more attractive option for transit users.
Develop park-once strategies where people are encouraged to ‘park once’ during a day/trip.
Use metered parking in a manner that creates turnover of spaces in high demand (for shopping or dining purposes, for example) and allows longer term metered parking (for work/employment) further away.
Use emerging technologies to connect the public with available parking (available parking spots/vacant lots, variably priced metered parking, etc.).
Survey communities to better understand their specific needs, in order to create more tailored solutions rather than a one-size-fits-all.
Consider shared parking strategies that balance the peak AM/PM use and off-peak uses.
Allocate the parking revenues to contribute to not only to the enhancement of the transit experience, but the walkability of the street.
On the private side, we need to give carpools priority parking. Cities should require it.
Companies should be incentivized to reduce employee parking and to subsidize transit passes.
Give more priority to protecting our urban open space, recreation, and habitat areas.
Expand the higher density core to include Chula Vista and the border area.
Include the area south of the border for affordable housing opportunities.
Explore the impacts of each scenario on the economy, health, environment, and quality of life.
Explore smart growth scenarios that help with transportation choices, transportation costs, and health benefits.
Consider second units close to the transit oriented development areas.
Look at the redevelopment of the region’s commercial areas and development of shopping malls near transit hubs.
Address jobs/housing fit and try to do a better job of matching income levels with housing choices to address the range of types of income levels in a job place (i.e., high-paying jobs versus service workers working in high-tech buildings). SANDAG’s modeling process should look at the implications of jobs/housing fit.
Modify scenarios to acknowledge and better integrate the major employment clusters.
Conduct a market feasibility analysis on all of the scenarios.
24
Map topographic land constraints; many slopes are uninhabitable for human development. River valleys and steep slopes are not suitable for human development.
Create a scenario with urban growth boundaries.
Address sea level rise in the scenarios.
Consider placing just as much emphasis on creating more walkable and bikeable communities than is placed on transit oriented (TOD) communities so we do not have to invest in so much public transit.
The TOD scenario is more reflective of where job centers are throughout the region.
Consider housing costs and affordability in scenarios.
Consider quality of life issues and transit access to parks, healthcare, education, family resource centers, clinics, childcare, and other community resources/social service facilities.
Adapt to current trends such as telecommuting, co-work spaces, etc. which are becoming more popular and more sustainable.
Focus on Safe Routes to Transit as a key goal.
SANDAG is doing an admirable job at trying to connect with communities but needs to do a better job in reaching out.
SANDAG’s efforts to reach-out and invite participation from groups that traditionally are not engaged in the process are appreciated and beneficial.
Broaden the active transportation goal to include skateboarding, scooters, etc.
Implement separated bicycle infrastructure facilities on major corridors.
Plan according to younger generations that want to live in communities where they can walk and bike.
Improve systems for carrying bicycles on transit vehicles.
Engage schools as a method of encouraging kids to walk and bike to school. .
Consider expanding wayfinding signage to direct users to transit stops which would encourage people to bike.
Develop infrastructure like bike stations to encourage more people to bike to transit.
Separation between bicyclists and vehicles is critical since a fear of safety is a barrier.
Incorporate the complete streets concept into SANDAG’s planning.
Offer incentives to encourage more biking; encourage employers to provide more shower and locker room facilities to employees.
Encourage bicycle education.
Emphasize utilitarian trips and not just commuter trips.
Having an Active Transportation discussion puts health first and foremost including individual and environmental health.
The ability to track the bus is important when people are going somewhere.
Self-driving vehicles can help reduce accidents.
When considering emerging technologies, include sustainability, mobility/accessibility, and safety.
The idea of crowd sourcing would be easy to focus on and easy to do. Provide the cloud to interested individuals and go beyond what is traditionally done.
Expand Car2Go system geographically so that there is coverage across the whole county.
Expand the availability of plug-in charging.
Use technology for information such as real-time traffic information. This would help people decide what mode of transit to take and what route.
Provide a greenhouse gas calculator application to help change peoples’ behavior
Apply emerging technology to infrastructure improvements that reduce reliance on vehicles.
Consider security and loss of privacy.
Keep up with technology – signal detection, loops, etc.
Technology can help with lowering costs.
25
Autonomous vehicles are an easy solution to reckless drivers; they would allow more cars on the road without building more lanes, and the idea holds promise.
The shared economy (Car2Go, etc.) is growing. Consider this in the planning process.
Provide better traveler information.
Consider equity as an issue since there are barriers to entry for technology, and not everyone can afford a smart phone, car, or Google glasses.
Consider sustainability and return on investment. Can you sustain what you are building?
Incorporate public health into the evaluation criteria and prioritization of transportation projects.
Balance return on investment and use of transportation facilities.
Provide a complete analysis of the costs and benefits of the projects, on other forms of transportation, and compare between all modes of transportation.
Encourage smart growth, neighborhood shuttles.
Add reduced GHG emissions to the criteria.
Place greater value on community involvement and input in the evaluation of these projects. Make sure the community’s voice is heard.
Focus priority on moving the most people at the least cost and increasing transit frequency.
Consider density as a factor in determining transit project priorities.
Think about health costs, too.
Keep equity in mind… neighborhoods that don’t have many transportation options should be focused on first.
Think about students, where they need to get to, and how they get to school, and how they make their connections.
26
28
29
30
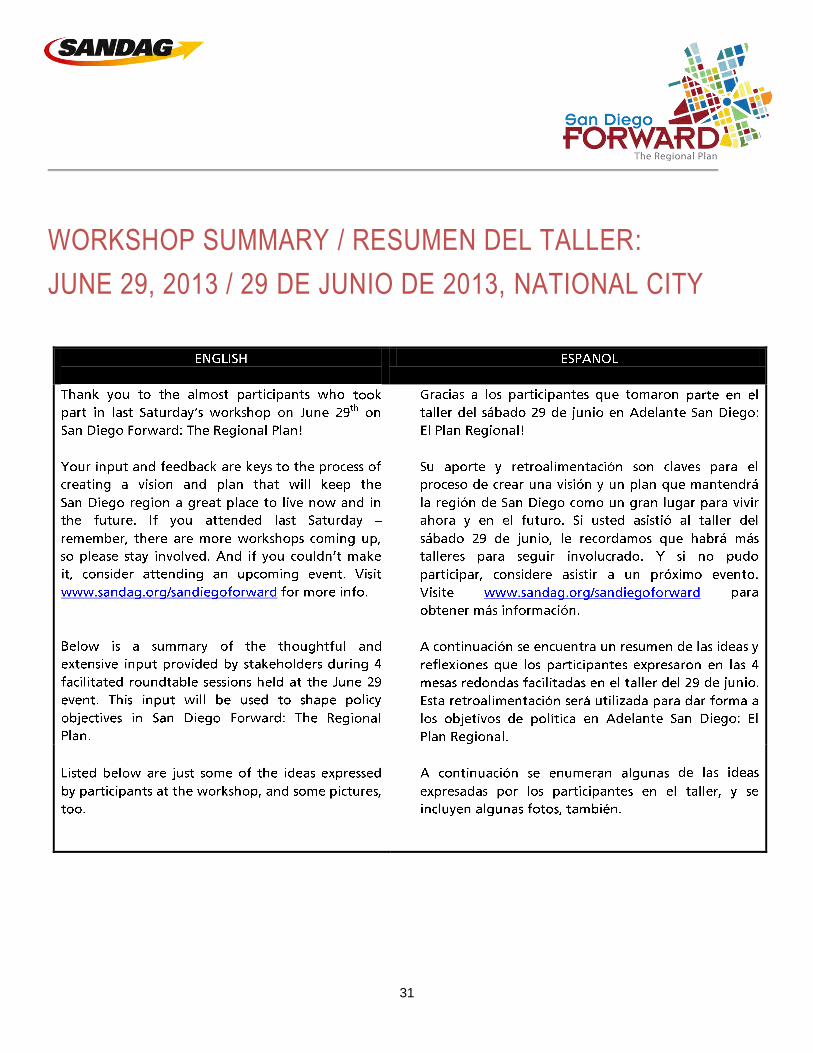
WORKSHOP SUMMARY / RESUMEN DEL TALLER:
JUNE 29, 2013 / 29 DE JUNIO DE 2013, NATIONAL CITY
31
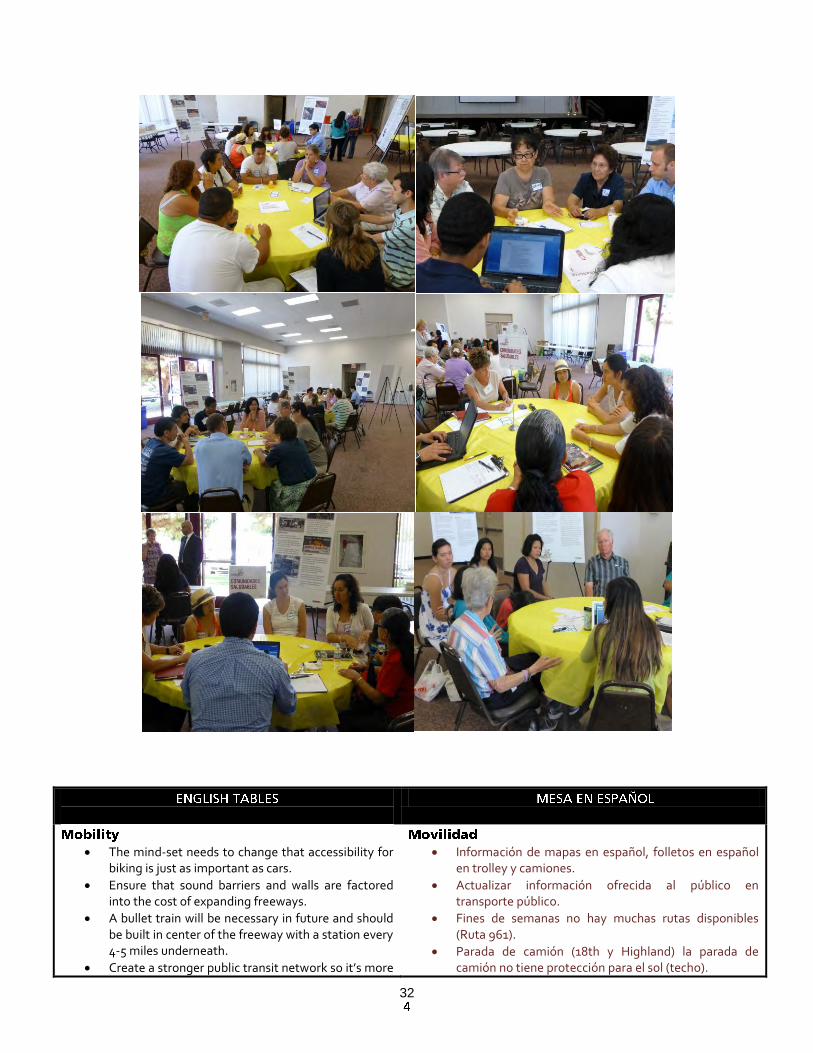
The mind-set needs to change that accessibility for biking is just as important as cars.
Ensure that sound barriers and walls are factored into the cost of expanding freeways.
A bullet train will be necessary in future and should be built in center of the freeway with a station every 4-5 miles underneath.
Create a stronger public transit network so it’s more
Información de mapas en español, folletos en español en trolley y camiones.
Actualizar información ofrecida al público en transporte público.
Fines de semanas no hay muchas rutas disponibles (Ruta 961).
Parada de camión (18th y Highland) la parada de camión no tiene protección para el sol (techo).
32
mmo
Rectangle
connected, timely, and frequent.
Expand bus service in South County.
South County lacks access to healthy foods.
Encourage Famers Markets in National City.
People will just take their car if they have to walk far to get to a bus.
Improve transit to the Airport.
We need better transportation to key destinations throughout the county.
Transit networks need to be expanded in communities with higher dependency, such as low-income and senior residency areas.
Operate transit into the evening so that people can attend night events.
SANDAG needs to use demographic trends to increase bus routes and tailor increased service to communities that are most dependent on transit.
Focus on transit projects rather than automobile infrastructure.
No hay conexiones de North Park a National City.
Miércoles y jueves en el parque Kimball venir para hacer encuestas para preguntarle a la gente su opinión.
National City esta desconectado de San Diego y sus comunidades alrededores.
No hay rutas a la playa por transporte público.
Necesitan acceso a lugares de interés regional como Balboa Park y sus museos. Un transporte especial los fines de semana, por ejemplo.
All streets should have safe bike lanes and sidewalks, especially along routes to schools to promote walking and biking to schools.
Implement more engaging and participatory outreach to promote Safe Route to schools – there is an opportunity for SANDAG to have a presence in schools and educate children.
Improve water quality in schools– currently children are discouraged from drinking water, as it tastes like drinking from corroded pipelines.
Convert all buses to run on compressed natural gas.
Implement policies to invest in and install existing technology that helps reduce energy uses.
A healthy community means friendly people and an inclusive community where people feel safe.
Kids should be able to walk to school, but parents and kids are concerned with safety.
Schools should design loading/unloading zones to support a safe environment for pedestrians.
There should be more bike lanes and better signage for bikes and pedestrians.
Wider sidewalks would help calm traffic and make streets safer.
We need more housing in National City, the right kind where people can walk to their daily needs.
It is important to focus on children and seniors who are more dependent and at risk.
Our community suffers from high obesity and diabetes, and high asthma rates.
SANDAG should focus their funding on infrastructure to mitigate air pollution, especially around freeways.
Vivir en ambiente limpio, libre de toxinas, libre tránsito, áreas verdes.
Áreas verdes para los niños (no existen parques).
Enfrente Iglesia existe terreno que se pudiera acondicionar para área verde, atrás de la escuela en el centro comunitario existe solo un pequeño centro.
Seguridad de tráfico para los niños (escuela en la calle 18 – intersección de Highland y 18th) semáforo atrás de la escuela. Los carros no se detienen, reforzar respeto al peatón además que el semáforo peatonal no dura mucho. La alcantarilla bloquea el cruce peatonal.
Gas para mina está localizado a pie de calle en la gasolinera y es peligroso por accidentes de choque o conductores en estado de ebriedad.
Iluminación en la misma zona. Así como falta de iluminación en Old-Town National City.
Determinar límites de velocidad por la misma zona para la seguridad de los niños que van a la escuela.
El programa ‘Bus Caminante al Escuela’ está empezando a ser impulsado por las escuelas.
16th y D St. Necesita arreglos incluyendo la banqueta para los peatones. Siempre hay accidentes en esta zona.
Impulsar jardín comunitario, no existen tiendas cerca de la gente para conseguir comida sana como fruta y verduras.
No es seguro usar bicicletas por las avenidas pero si por las calles vecinales.
Los carriles de bicicletas no son respetados porque la gente estaciona sus carros en los carriles de bicicleta.
Los talleres y fábricas contaminan todos los aspectos de la comunidad.
33
mmo
Rectangle
Create a border crossing efficient process for the
people and goods that regularly move to and from our region.
Strengthen relationship with the military.
Improve public transit so that people can get to jobs.
Attracting more businesses, and not fast food or taco shops.
Encourage home-ownership and regulate the up-keep of rental properties.
Make it easier/faster to cross the border.
Provide more secure bike parking and storage to prevent bicycle theft.
National City has the highest taxes in the county, but is the most impoverished.
National City isn’t seen as a business environment. It’s somewhere you live, but you have to go other places to work.
There should be more educational opportunities in National City, such as trade Schools.
Improve the cleanliness and aesthetics of the city to attract more employers/businesses. The way things look can drive people away.
Increase street sweeping frequencies and remove dumped trash.
Improve the responsiveness and oversight of local and regional government.
South County is lacking tourism.
National City needs to be more welcoming and create destinations and events to attract business and activity. People don’t want to visit a dirty city that makes them feel unsafe and uncomfortable.
Más acceso a mercados, gimnasios, lugares comunes.
Civic Center y Wilson interseccion. No quieren un negocio más sino un negocio que ayude a la comunidad como un supermercado.
Fuentes de empleo cerca de la comunidad.
Área de bicicletas en el trolley. (seccion especial para gente con bicicletas).
Reducir costos de trolley (pase mensual).
34
mmo
Rectangle
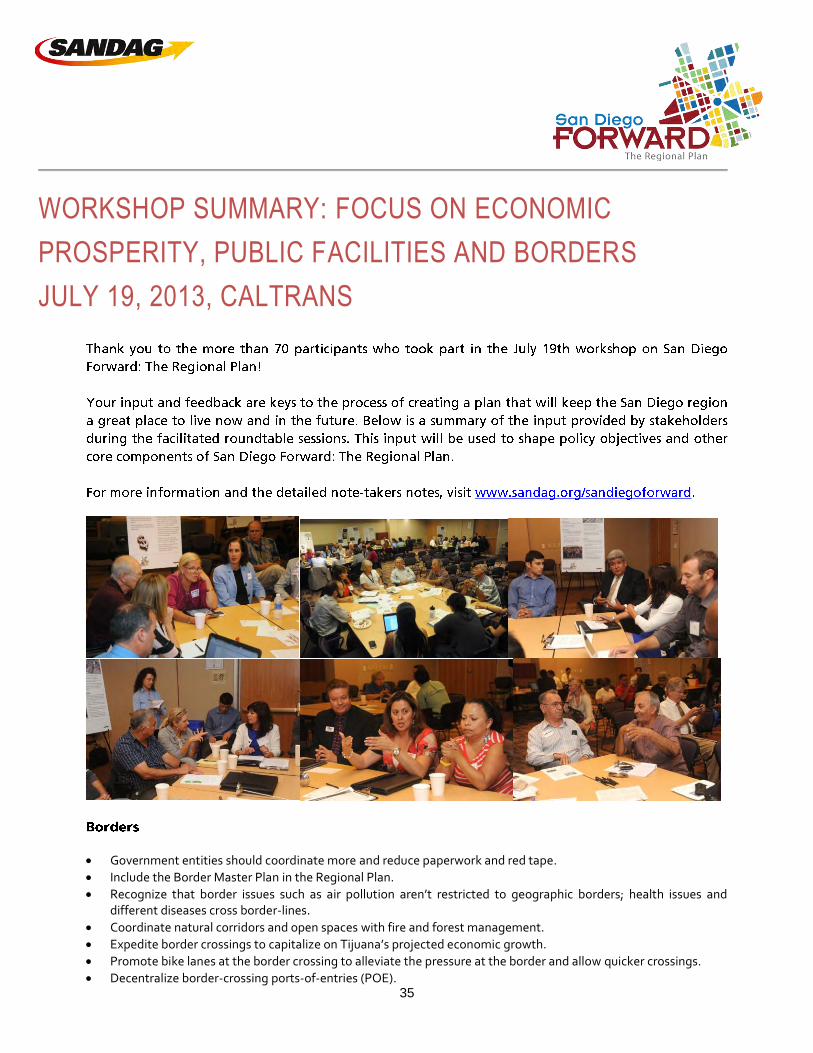
WORKSHOP SUMMARY: FOCUS ON ECONOMIC
PROSPERITY, PUBLIC FACILITIES AND BORDERS
JULY 19, 2013, CALTRANS
Government entities should coordinate more and reduce paperwork and red tape.
Include the Border Master Plan in the Regional Plan.
Recognize that border issues such as air pollution aren’t restricted to geographic borders; health issues and different diseases cross border-lines.
Coordinate natural corridors and open spaces with fire and forest management.
Expedite border crossings to capitalize on Tijuana’s projected economic growth.
Promote bike lanes at the border crossing to alleviate the pressure at the border and allow quicker crossings.
Decentralize border-crossing ports-of-entries (POE). 35
Promote better movement of goods across the border, not just passengers.
Recognize that the tribes have more to offer than just casinos; tourism prospects are good for them and for the county. Tourists will go to the casinos, but most likely will use other facilities in the region as well.
Acknowledge Temecula as an important economic partner for goods movement along I-15.
Minimize travel time between San Diego and Imperial Valley so that San Diego can capitalize on the renewable energy effort that is occurring in Imperial County.
Increase weekend service for public transportation, especially to and from Orange and Riverside Counties.
Increase connections between employment locations and affordable housing.
Increase the safety of public transit by encouraging more people to take transit; crime is a deterrent for many potential transit riders.
SANDAG should coordinate with other agencies and community based organizations to better provide and promote public facilities, serving as the “glue” that brings people, organizations, and cities together.
Use SANDAG data and information as planning tools.
Facilitate conversations about funding so cities don’t have to “re-create the wheel” and spend a lot of time searching for funding sources.
Prioritize funding for maintaining public facilities first versus fixing broken infrastructure later.
Take social equity into consideration when planning new facilities. Consider a holistic approach to planning that links public facilities to the needs of communities.
Integrate parking with purposeful economic returns.
Perform regular maintenance on roads and construct sidewalks to make communities more walkable.
Provide planning at the “complete streets” level by constructing and regularly maintaining streets and pedestrian sidewalks, parks, public restrooms, trash cans, and community centers in urban areas.
Provide safe routes to school.
Collaborate with local agencies to promote green infrastructure that can improve air quality, water quality, and ultimately quality of life.
Encourage the maintenance and delivery of water facilities.
Promote collaboration on all levels to discuss water retention from storm water in an effort to reuse water.
Consider the use of water desalination in the region.
Fund maintenance improvements for the piping network in San Diego.
Provide regional coordination to prohibit housing development in fire-prone areas.
Make roads more truck accessible.
Provide education for a variety of skill sets in the region.
Support and encourage “high tolerance communities”— diverse, college-bound communities with no ethnic barriers.
Find ways to tap into the highly-educated immigrant and refugee population to support our economy.
Subsidize bus passes for students to get between jobs, home, and school.
Support local food and our local economy.
Connect farmers and agriculture with the public through Farmers Markets. Encourage cities to support local farmers.
Promote more collaboration with other organizations, such as non-profits in the county and the city; this collaboration should outweigh competition and personalities.
Focus on a cost-effective, consistent water supply for the region in the future, especially for farmers and businesses.
Promote the development of multiple economic hubs to allow people to live close to work.
Support the development of job centers in South Bay to improve social equity. It will take people off the freeway by providing jobs close to where people live.
36
Enhance opportunities for disadvantaged populations.
Align the cost of housing with levels of income for more people to afford to live here.
Support bike parking in the business districts. Include more urban furniture, forestry, traffic calming, etc. to bring people to these areas and increase economic prosperity.
Provide safe routes to school for the local neighborhood communities to encourage economic prosperity.
Facilitate small businesses by creating collaborative workspaces and facilities (e.g. business incubators).
Support trucking and transportation needs in the region. If we can’t get goods and people around, the economy won’t be prosperous.
Plan for moving goods in all contexts, including the border, the port, and by air.
Transit oriented development should be paired with job development to help prepare for a growing population.
Balance regional growth geographically.
Consider moderate densities of 3-4 stories.
Support infrastructure that improves connections for bicyclists and pedestrians to access transit services.
Fill up empty storefronts to support economic development.
Economic Prosperity
Prosperity first starts within the family, then the community, each company, organization, and city.
Recognize that small local economies drive larger economies.
Provide more affordable housing for new family arrivals as the refugee and immigrant population continues to increase.
Encourage more affordable housing throughout the San Diego region.
Consider implementing rent control in the San Diego region.
Use empty lots throughout San Diego for farming and agriculture.
Address transportation barriers that keep immigrants away from workforce development programs. For example, provide more gas cards as incentives, and teach people how to use the transit system to get to these programs.
Public Facilities
Better allocate the structure and planning for parks. For example, while dog parks and open space portions are large, the actual playground portions for children are small.
Provide more benches and seating in public spaces and parks, and at beaches, for people to enjoy the public realm in El Cajon and downtown San Diego.
Develop partnerships, such as those in New York City, where indoor and outdoor public spaces such as atriums are privately owned, but the public has free access to these areas.
Support more de-centralized public composting for waste management.
Provide more recycling bins in public spaces and along sidewalks.
Develop improved signage to make it easy for people to place recyclables into appropriate bins.
Borders
If there were more affordable medical and dental services in the San Diego region, then people wouldn’t go across the border as frequently.
Agriculture and industrial projects should be built along the border to provide jobs for both sides.
Address traffic at the border.
Improve border crossing times to improve the economies of both regions.
Provide better coordination of schedules for people traveling to and from San Diego to Los Angeles on public transit.
37
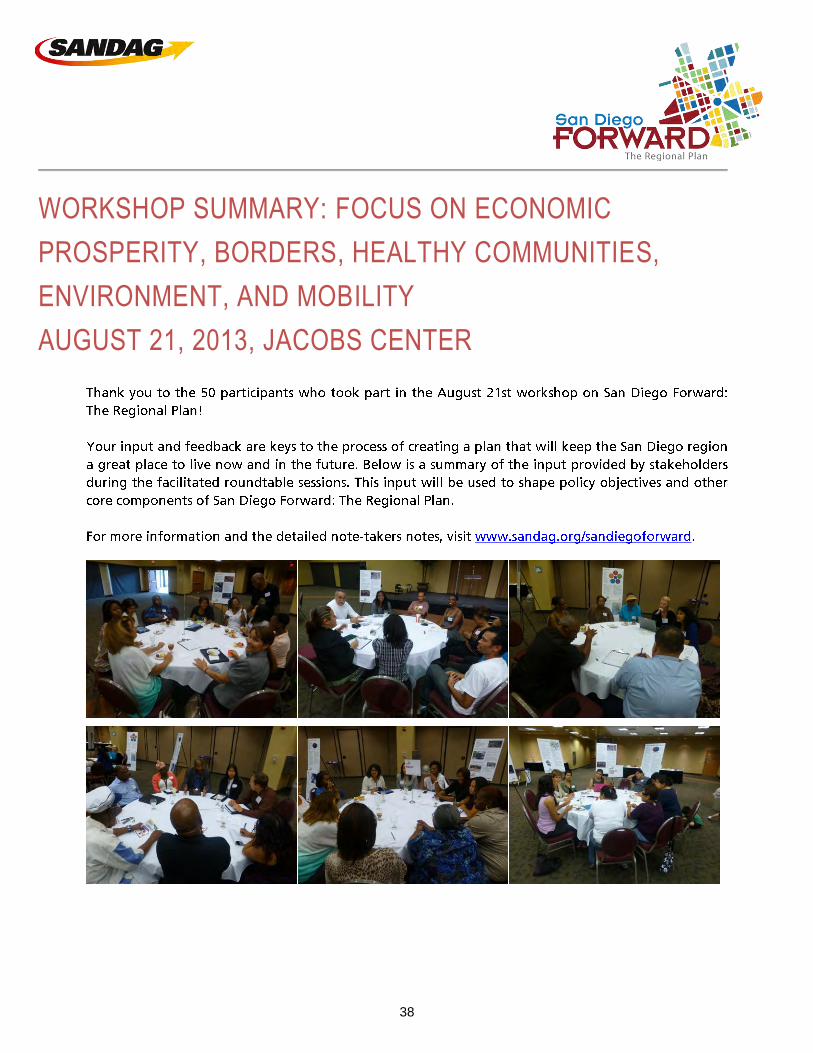
WORKSHOP SUMMARY: FOCUS ON ECONOMIC
PROSPERITY, BORDERS, HEALTHY COMMUNITIES,
ENVIRONMENT, AND MOBILITY
AUGUST 21, 2013, JACOBS CENTER
38

Expedite border crossings to reduce the economic barrier of wait time and to capitalize on Tijuana’s projected economic growth.
Encourage more business development and promote bi-national tourism.
Increase connections between employment locations and affordable housing.
Find ways to increase the percentage of community members (particularly African Americans) who work on capital projects in the San Diego region.
Increase the safety of public transit by encouraging more people to take transit; crime is a deterrent for many potential transit riders.
Improve the educational system and encourage schools to focus more on supporting training, apprenticeships, personal budget techniques, and innovation.
Encourage more mixed-income housing throughout the San Diego region.
Promote collaboration between businesses, community groups, government agencies in the region to build more relationships and social capital.
Improve Southeast San Diego’s transportation access to job centers such as Golden Triangle, Sorrento Valley.
Invest in local infrastructure and environment, such as our creeks.
Re-evaluate environmental, health, land-use requirements, and other hurdles in order to encourage more private investment in our neglected communities.
Encourage more government, business, and community investment in our youth.
Government entities should coordinate more and reduce paperwork and red tape.
Mandate public officials on both sides of the border that go to border region meetings to report the findings/results of meeting to community in an open fashion.
SANDAG should coordinate with other agencies and community based organizations to better provide and promote public facilities, serving as the “glue” that brings people, organizations, and cities together.
We need more SENTRI (Secure Electronic Network for Travelers Rapid Inspection) card access and easier travel.
Reduce/minimize barriers to crossing such as security and passport requirements.
Improve relationship with people on the other side of the border through arts and culture exchanges.
Explore the idea of hosting a Bi-national Olympics in order to foster economic, cultural exchange as the San Diego-Tijuana region.
Invest and bring in more rapid transit for the border region.
Borders exist within the San Diego region (particularly the I-8 that creates a North-South border) and to bridge these borders SANDAG should promote community visitation.
Increase funding for street-lighting to promote active transportation.
Reduce cost of public transit to increase ridership and reduce pollution.
Increase the number of bus routes because buses are more flexible and cheap.
Reduce the cost of student compass cards.
Improve bike lanes on major streets for better safety.
Prioritize transportation projects that support existing communities.
Refocus land use on creating and supporting job centers instead of suburban housing projects in North County.
Encourage more community involvement in transportation projects and decisions.
39
Create more destinations to walk to within neighborhoods.
Create program for reflective bicycle jackets to improve the safety of bike riders and make biking more appealing.
Consider the quality of life instead of the cost when prioritizing transportation decisions.
Increase awareness and promotion of public transportation.
SANDAG needs to commit to creating a mass-transit culture.
Promote mixed-use, walkable communities.
Invest in infrastructure such as sidewalks, plant more trees.
Incentivize healthy grocery stores to create businesses in low-income communities.
Fund community development/training to educate residents on getting involved with the public process.
Promote and encourage programs that promote well-being, health.
Incentivize communities to garden.
Reward businesses and governments that promote sustainability.
Promote active transportation because of community health improvements.
Promote community engagement to bond families, neighbors together.
Increase awareness of mobility with marketing strategies.
Create more community gathering spaces.
Increase funding of running/biking trails.
Encourage and educate the younger generation to become more involved and invested in their communities.
SANDAG needs to serve as the information broker for the public.
Reduce gentrification at trolley stops.
Use reclaimed water for landscaping.
Promote the use of solar energy to help create local green jobs.
Educate youth about climate change, pollution.
Educate community members about the individual behaviors that contribute to climate change and how they can change those behaviors.
Make more walkable and bikeable communities to reduce pollution.
Increase funding for composting programs to reduce waste and to help local gardens.
Partner with development community to incentivize brownfield development.
Address the burden of costly mitigation measures in brownfield development.
Inform community members of who to contact when it comes to environmental concerns.
Balance transportation decisions with their environmental impact.
Promote car sharing programs like “Car2Go”.
Promote farmers markets.
40
BOARD OF DIRECTORS AGENDA ITEM NO. 13-09-8
SEPTEMBER 27, 2013 ACTION REQUESTED – INFORMATION
REPORT SUMMARIZING DELEGATED ACTIONS File Number 8000100 TAKEN BY THE EXECUTIVE DIRECTOR
Introduction
Various Board Policies require the Executive Director to report certain actions to the Board of Directors on a monthly basis or upon taking specified actions.
Discussion
Board Policy No. 003
Board Policy No. 003: Investment Policy, states a monthly report of all investment transactions shall be submitted to the Board of Directors. Attachment 1 contains the reportable investment transactions for June and July 2013.
Board Policy No. 008
Section 6.1 of Board Policy No. 008: Legal Matters, authorizes the Office of General Counsel or outside counsel hired by the Office of General Counsel to file documents or make court appearances on behalf of SANDAG.
• Consistent with previous Board direction, on behalf of SANDAG, outside counsel filed a Notice of Election to Intervene in the matter of San Diego Association of Governments ex rel. Leonid Dubizhansky v. HMS Construction Co., Inc., et. al. (Case No. 37-2012-00103107-CU-MC-CTL) on August 30, 2013.
• Consistent with previous Board direction, on behalf of SANDAG, outside counsel filed a revised final offer in the amount of $805,600 on September 16, 2013, in the eminent domain matter of SANDAG v. Ramon Vanta et. al. (Case No. 37-2012-00101950-CU-EI-CTL).
Board Policy No. 017
Board Policy No. 017: Delegation of Authority, requires the Executive Director to report to the Board certain actions taken at the next regular meeting.
Section 4.1 of the policy authorizes the Executive Director to enter into agreements not currently incorporated in the budget and make other modifications to the budget in an amount up to $100,000 per transaction, so long as the overall budget remains in balance. Attachment 3 contains the reportable actions for July and August 2013.
2
Board Policy No. 035
Board Policy No. 035: Competitive Grant Program Procedures, authorizes the Executive Director to approve request by grantees for project schedule extensions of up to six months. The policy requires the Executive Director to report to the Board actions taken at the next regular meeting. There are four delegated actions to report to the Board:
Job Access and Reverse Commute Program:
• The Work Commute Options Program Operating Project (International Rescue Committee) was granted a six-month schedule extension (Contract No. 5001706). The contract budget will remain the same, at $78,036.
Environmental Mitigation Program:
• The Brachypodium Removal Project (Conservation Biology Institute) was granted a six-month schedule extension (Contract No. 5001965). The contract budget will remain the same, at $233,975.
• The San Pasqual Valley Weed Management Project (City of San Diego) was granted a six-month schedule extension (Contract No. 5001588). The contract budget will remain the same, at $184,623.
• The Crest Canyon Invasive Removal Project (Rocks Biological Consulting) was granted a six-month schedule extension (Contract No. 5001591). The contract budget will remain the same, at $74,481.
GARY L. GALLEGOS Executive Director
Attachments: 1. Monthly Activity for Investment Securities Transactions for June and July 2013 2. Budget Transfers and Amendments for July and August 2013
Key Staff Contact: André Douzdjian, (619) 699-6931, [email protected]
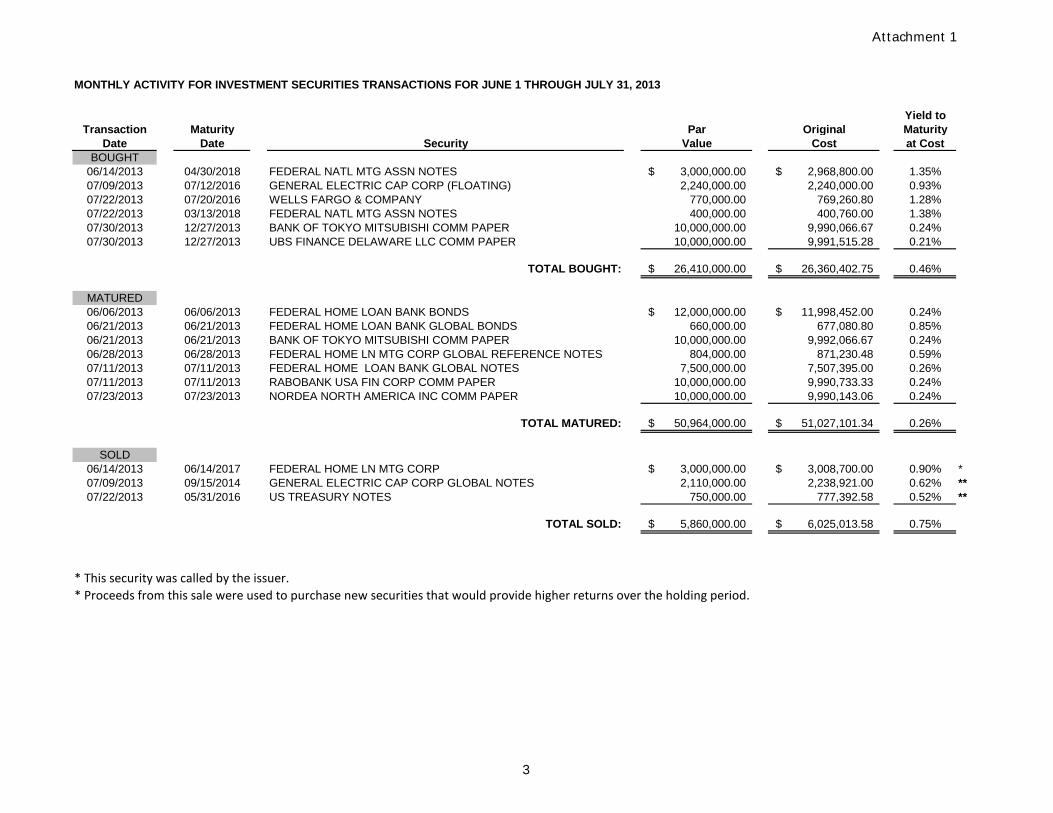
MONTHLY ACTIVITY FOR INVESTMENT SECURITIES TRANSACTIONS FOR JUNE 1 THROUGH JULY 31, 2013
Yield toTransaction Maturity Par Original Maturity
Date Date Security Value Cost at CostBOUGHT
06/14/2013 04/30/2018 FEDERAL NATL MTG ASSN NOTES 3,000,000.00$ 2,968,800.00$ 1.35%07/09/2013 07/12/2016 GENERAL ELECTRIC CAP CORP (FLOATING) 2,240,000.00 2,240,000.00 0.93%07/22/2013 07/20/2016 WELLS FARGO & COMPANY 770,000.00 769,260.80 1.28%07/22/2013 03/13/2018 FEDERAL NATL MTG ASSN NOTES 400,000.00 400,760.00 1.38%07/30/2013 12/27/2013 BANK OF TOKYO MITSUBISHI COMM PAPER 10,000,000.00 9,990,066.67 0.24%07/30/2013 12/27/2013 UBS FINANCE DELAWARE LLC COMM PAPER 10,000,000.00 9,991,515.28 0.21%
TOTAL BOUGHT: 26,410,000.00$ 26,360,402.75$ 0.46%
MATURED06/06/2013 06/06/2013 FEDERAL HOME LOAN BANK BONDS 12,000,000.00$ 11,998,452.00$ 0.24%06/21/2013 06/21/2013 FEDERAL HOME LOAN BANK GLOBAL BONDS 660,000.00 677,080.80 0.85%06/21/2013 06/21/2013 BANK OF TOKYO MITSUBISHI COMM PAPER 10,000,000.00 9,992,066.67 0.24%06/28/2013 06/28/2013 FEDERAL HOME LN MTG CORP GLOBAL REFERENCE NOTES 804,000.00 871,230.48 0.59%07/11/2013 07/11/2013 FEDERAL HOME LOAN BANK GLOBAL NOTES 7,500,000.00 7,507,395.00 0.26%07/11/2013 07/11/2013 RABOBANK USA FIN CORP COMM PAPER 10,000,000.00 9,990,733.33 0.24%07/23/2013 07/23/2013 NORDEA NORTH AMERICA INC COMM PAPER 10,000,000.00 9,990,143.06 0.24%
TOTAL MATURED: 50,964,000.00$ 51,027,101.34$ 0.26%
SOLD 06/14/2013 06/14/2017 FEDERAL HOME LN MTG CORP 3,000,000.00$ 3,008,700.00$ 0.90% *07/09/2013 09/15/2014 GENERAL ELECTRIC CAP CORP GLOBAL NOTES 2,110,000.00 2,238,921.00 0.62% **07/22/2013 05/31/2016 US TREASURY NOTES 750,000.00 777,392.58 0.52% **
TOTAL SOLD: 5,860,000.00$ 6,025,013.58$ 0.75%
* This security was called by the issuer.* Proceeds from this sale were used to purchase new securities that would provide higher returns over the holding period.
Attachment 1
3
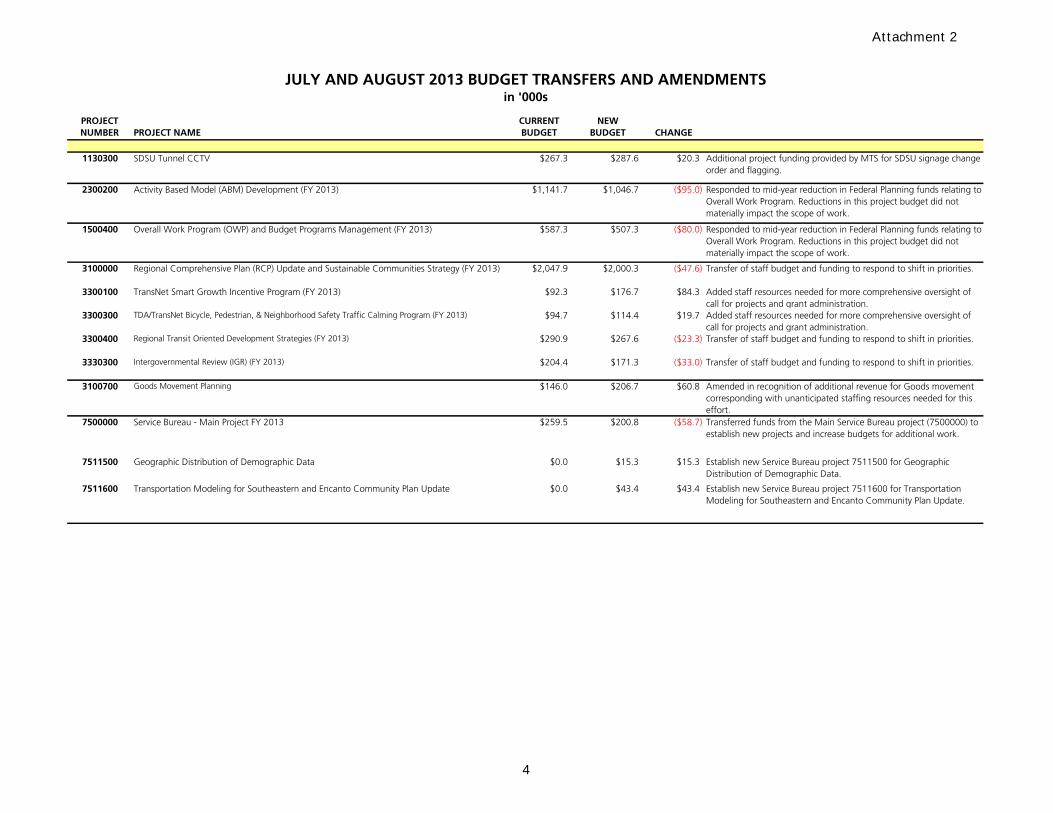
PROJECT NUMBER PROJECT NAME
CURRENTBUDGET
NEW BUDGET CHANGE
1130300 SDSU Tunnel CCTV $267.3 $287.6 $20.3 Additional project funding provided by MTS for SDSU signage change order and flagging.
2300200 Activity Based Model (ABM) Development (FY 2013) $1,141.7 $1,046.7 ($95.0) Responded to mid-year reduction in Federal Planning funds relating to Overall Work Program. Reductions in this project budget did not materially impact the scope of work.
1500400 Overall Work Program (OWP) and Budget Programs Management (FY 2013) $587.3 $507.3 ($80.0) Responded to mid-year reduction in Federal Planning funds relating to Overall Work Program. Reductions in this project budget did not materially impact the scope of work.
3100000 Regional Comprehensive Plan (RCP) Update and Sustainable Communities Strategy (FY 2013) $2,047.9 $2,000.3 ($47.6) Transfer of staff budget and funding to respond to shift in priorities.
3300100 TransNet Smart Growth Incentive Program (FY 2013) $92.3 $176.7 $84.3 Added staff resources needed for more comprehensive oversight of call for projects and grant administration.
3300300 TDA/TransNet Bicycle, Pedestrian, & Neighborhood Safety Traffic Calming Program (FY 2013) $94.7 $114.4 $19.7 Added staff resources needed for more comprehensive oversight of call for projects and grant administration.
3300400 Regional Transit Oriented Development Strategies (FY 2013) $290.9 $267.6 ($23.3) Transfer of staff budget and funding to respond to shift in priorities.
3330300 Intergovernmental Review (IGR) (FY 2013) $204.4 $171.3 ($33.0) Transfer of staff budget and funding to respond to shift in priorities.
3100700 Goods Movement Planning $146.0 $206.7 $60.8 Amended in recognition of additional revenue for Goods movement corresponding with unanticipated staffing resources needed for this effort.
7500000 Service Bureau - Main Project FY 2013 $259.5 $200.8 ($58.7) Transferred funds from the Main Service Bureau project (7500000) to establish new projects and increase budgets for additional work.
7511500 Geographic Distribution of Demographic Data $0.0 $15.3 $15.3 Establish new Service Bureau project 7511500 for Geographic Distribution of Demographic Data.
7511600 Transportation Modeling for Southeastern and Encanto Community Plan Update $0.0 $43.4 $43.4 Establish new Service Bureau project 7511600 for Transportation Modeling for Southeastern and Encanto Community Plan Update.
in '000sJULY AND AUGUST 2013 BUDGET TRANSFERS AND AMENDMENTS
Attachment 2
4
BOARD OF DIRECTORS AGENDA ITEM NO. 13-09-9
SEPTEMBER 27, 2013 ACTION REQUESTED – INFORMATION
REPORT ON MEETINGS AND EVENTS File Number 8000100 ATTENDED ON BEHALF OF SANDAG
Since the last Board of Directors meeting, Board members participated in the following meetings and events on behalf of SANDAG. Key topics of discussion also are summarized.
July 17, 2013: Los Angeles-San Diego-San Luis Obispo Rail Corridor Agency Board of Directors Meeting Los Angeles, CA
• As the SANDAG alternate representative to the Los Angeles-San Diego-San Luis Obispo Rail Corridor Agency (LOSSAN) Board of Directors, Solana Beach Councilmember Lesa Heebner attended the LOSSAN Board of Directors meeting. The LOSSAN Board discussed and approved the LOSSAN Joint Powers Agreement and Bylaws.
July 25, 2013: Facilitating Access to Coordinated Transportation Board of Directors Meeting Encinitas, CA
• As the SANDAG representative and 2013 Vice Chair of the Facilitating Access to Coordinated Transportation (FACT) Board of Directors, Third District County Supervisor Dave Roberts attended the FACT Board of Directors meeting. The FACT Board voted unanimously to authorize the FACT Executive Director to submit a proposal in response to the City of Oceanside’s request for proposals to provide senior shuttle transportation. The Board was updated by the Executive Director and the Executive Committee on why FACT did not pursue the San Diego County Office of Education opportunity due to pricing concerns. The Board unanimously approved a revised Federal Transit Administration Section 5310 capital grants application process, following extensive Board input. The Board unanimously voted to cancel its normal August monthly meeting. The Executive Director provided a service update to the Board on the progress made during the first year of operation for RideFACT.
August 7, 2013: Tijuana 20 Visit to Mexico Baja California, Mexico
• SANDAG Chairman Jack Dale and Regional Planning Committee Chair Mary Sessom attended the San Diego Regional Chamber of Commerce’s Tijuana 20 Visit to Mexico. Chairman Dale and Regional Planning Committee Chair Sessom participated on behalf of SANDAG in a press conference and met with various elected officials from Mexico regarding binational issues.
2
August 23, 2013: LOSSAN Board of Directors Meeting San Diego, CA
• First Vice Chair Jim Janney, SANDAG representative, and Councilmember Lesa Heebner, SANDAG alternate to the LOSSAN Board of Directors, attended the LOSSAN Board of Directors meeting. The LOSSAN Board discussed the progress to date on efforts toward the daily management of the Pacific Surfliner service and voted to negotiate with Orange County Transportation Authority (OCTA) to accept the role as the LOSSAN Managing Agency.
August 30, 2013: OCTA and SANDAG Joint Meeting San Juan Capistrano, CA
• Chairman Dale, First Vice Chair Janney, and Second Vice Chair Don Higginson attended a joint meeting with members of the OCTA Board of Directors to discuss critical regional planning, policy, and legislative issues, and to discuss various transportation-related projects that affect both regions.
September 10, 2013: Mexican Independence Ceremony San Diego, CA
• Chairman Dale and Regional Planning Committee Chair Sessom attended as SANDAG representatives the annual Mexican Independence Ceremony. The event was hosted by Consul General Remedios Gomez-Arnau, Mexico’s representative on the SANDAG Board of Directors.
September 12, 2013: FACT Board of Directors Meeting Encinitas, CA
• Supervisor Roberts attended the FACT Board of Directors meeting. The Board received a positive report on the RideFACT service, which noted that more than 10,000 trips have been completed to date. The City of Oceanside is scheduled to vote on a FACT proposal to provide senior shuttle transportation. The FACT Board agreed to not amend its bylaws at this time to allow absences from the Board. FACT Board members Vista Councilmember John Aguilera, Norine Sigafoose, and Supervisor Roberts were appointed to the 2014 Nominating Committee. The Board is reaching a monthly funding cap on service providers, and it was agreed that this should be placed on a future agenda for discussion.
September 19, 2013: Women’s Transportation Seminar (WTS) Awards Ceremony San Diego, CA
• Chairman Dale attended the WTS Annual Awards Ceremony as the SANDAG representative. Chairman Dale, along with key staff members, accepted awards for the following agency projects: the 2013 Innovative Transportation Solutions Award for the SuperLoop Project; and the Green Line Extension, Downtown, and Orange Line Low-Floor Stations Project – Innovative Transportation Solutions - Transit/Streets/Highways. Additionally, Elaine Richardson, SANDAG Manager of Small Business Development, was presented the Rosa Parks Diversity Award.

3
September 20, 2013: CAPT. Clifford Maurer Change of Command Ceremony San Diego, CA
• Chairman Dale represented SANDAG at the Change of Command Ceremony for Captain Clifford Maurer, United States Navy (USN) and outgoing United States Department of Defense representative to the SANDAG Board of Directors, to express our appreciation for his service to SANDAG and to welcome new Board representative Captain Darius Banaji, USN.
GARY L. GALLEGOS Executive Director
BOARD OF DIRECTORS AGENDA ITEM NO. 13-09-10
SEPTEMBER 27, 2013 ACTION REQUESTED – APPROVE
PERFORMANCE EVALUATION OF EXECUTIVE DIRECTOR File Number 8000100
Introduction
Pursuant to the employment agreement with the Executive Director, the Board of Directors shall annually review his performance. If the Executive Director’s performance is determined to be satisfactory, the Board of Directors must adjust his base salary in accordance with the employment agreement provisions.
At its July 12, 2013, meeting, the Executive Committee reviewed and recommended approval of the Executive Director’s performance evaluation for the period July 2012 to June 2013 (Attachment 1), and recommended that the Executive Director’s performance during the past year be determined satisfactory.
The employment agreement also provides that the Board of Directors use established performance criteria (objectives), as amended from time to time, in the annual review. The Executive Committee reviewed the Executive Director’s draft performance objectives for the coming year (Attachment 2), and the Board is asked either to approve the objectives or provide further direction on possible amendments.
Discussion
The Executive Committee typically reviews the Executive Director’s annual performance evaluation and his performance objectives for the coming year during a regular Committee meeting. The Board of Directors also considers the annual evaluation and approves the performance objectives during a regular meeting. If the Board determines the Executive Director’s performance to be satisfactory, the employment agreement provides that the Board shall adjust his salary on July 1 of each year. Board approval would increase the Executive Director’s salary by $10,000 to $280,000 consistent with the employment agreement.
Attachment 3 includes a copy of the Executive Director employment agreement (effective January 23, 2004) and the amendment to the agreement (effective January 22, 2010), which extended the term of the agreement through November 2015.
Recommendation
The Executive Committee recommends that the Board of Directors approve: (1) the Executive Director’s Performance Evaluation for the period July 2012 to June 2013, determining his performance satisfactory (Attachment 1); and (2) a bonus award to the Executive Director based on accomplishment of the performance objectives during the past year. The Board of Directors also is asked to discuss the Executive Director’s proposed performance objectives for the period July 2013 to June 2014 (Attachment 2), and either approve the objectives or provide further direction on possible amendments.
2
The SANDAG Pay-for-Performance Program relies on the ability to reward employees for outstanding performance. With the FY 2014 Program Budget, the Board of Directors approved a merit/bonus pool, which is available to all staff based on accomplishment of their prior year performance objectives. In July, the Executive Committee recommended a 7 percent bonus award to the Executive Director based on accomplishment of the performance objectives during the past year.
Attachment 4 lists the salaries of chief executives of comparable metropolitan planning organizations, regional transportation planning agencies, transit agencies, and other regional agencies.
JACK DALE Chairman, SANDAG Board of Directors
Attachments: 1. Executive Director Annual Performance Evaluation (July 2012 to June 2013) 2. Executive Director Annual Performance Objectives (July 2013 to June 2014) 3. Executive Director Employment Agreement 4. Comparison of Regional Agency Executive Salaries
Key Staff Contact: Kim Kawada, (619) 699-6994, [email protected]
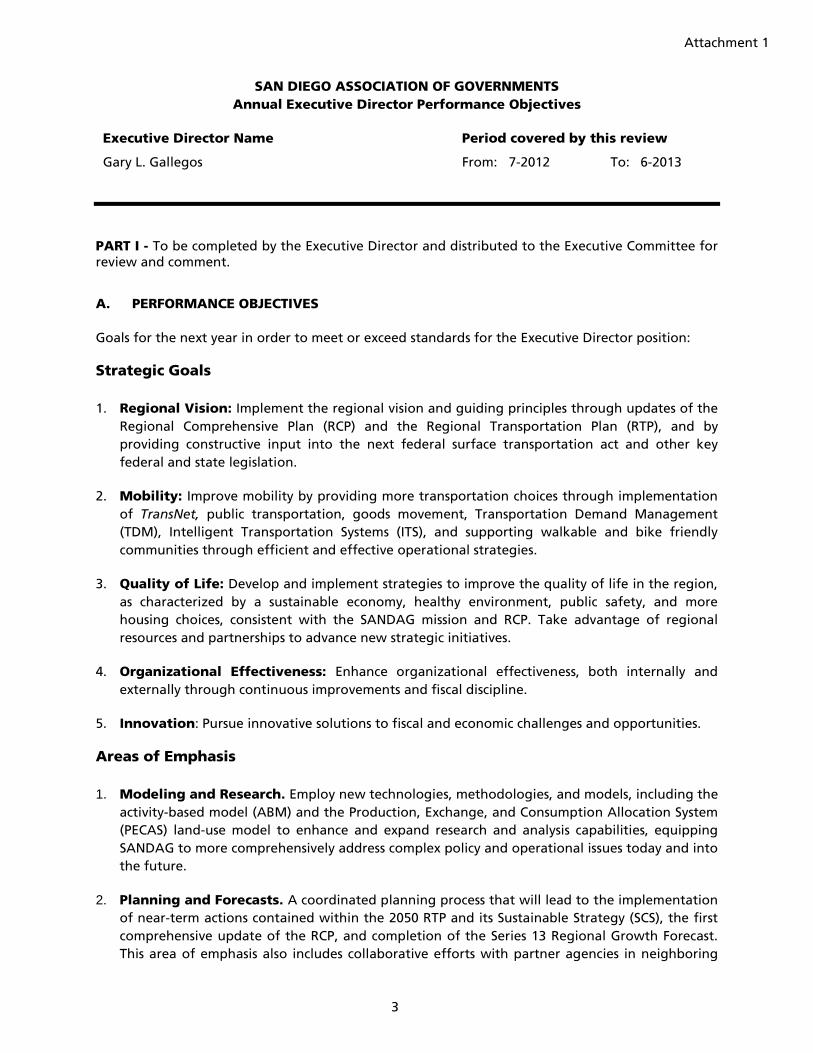
3
SAN DIEGO ASSOCIATION OF GOVERNMENTS Annual Executive Director Performance Objectives
PART I - To be completed by the Executive Director and distributed to the Executive Committee for review and comment.
A. PERFORMANCE OBJECTIVES
Goals for the next year in order to meet or exceed standards for the Executive Director position:
Strategic Goals 1. Regional Vision: Implement the regional vision and guiding principles through updates of the
Regional Comprehensive Plan (RCP) and the Regional Transportation Plan (RTP), and by providing constructive input into the next federal surface transportation act and other key federal and state legislation.
2. Mobility: Improve mobility by providing more transportation choices through implementation of TransNet, public transportation, goods movement, Transportation Demand Management (TDM), Intelligent Transportation Systems (ITS), and supporting walkable and bike friendly communities through efficient and effective operational strategies.
3. Quality of Life: Develop and implement strategies to improve the quality of life in the region, as characterized by a sustainable economy, healthy environment, public safety, and more housing choices, consistent with the SANDAG mission and RCP. Take advantage of regional resources and partnerships to advance new strategic initiatives.
4. Organizational Effectiveness: Enhance organizational effectiveness, both internally and externally through continuous improvements and fiscal discipline.
5. Innovation: Pursue innovative solutions to fiscal and economic challenges and opportunities.
Areas of Emphasis 1. Modeling and Research. Employ new technologies, methodologies, and models, including the
activity-based model (ABM) and the Production, Exchange, and Consumption Allocation System (PECAS) land-use model to enhance and expand research and analysis capabilities, equipping SANDAG to more comprehensively address complex policy and operational issues today and into the future.
2. Planning and Forecasts. A coordinated planning process that will lead to the implementation of near-term actions contained within the 2050 RTP and its Sustainable Strategy (SCS), the first comprehensive update of the RCP, and completion of the Series 13 Regional Growth Forecast. This area of emphasis also includes collaborative efforts with partner agencies in neighboring
Executive Director Name Period covered by this review
Gary L. Gallegos From: 7-2012 To: 6-2013
Attachment 1
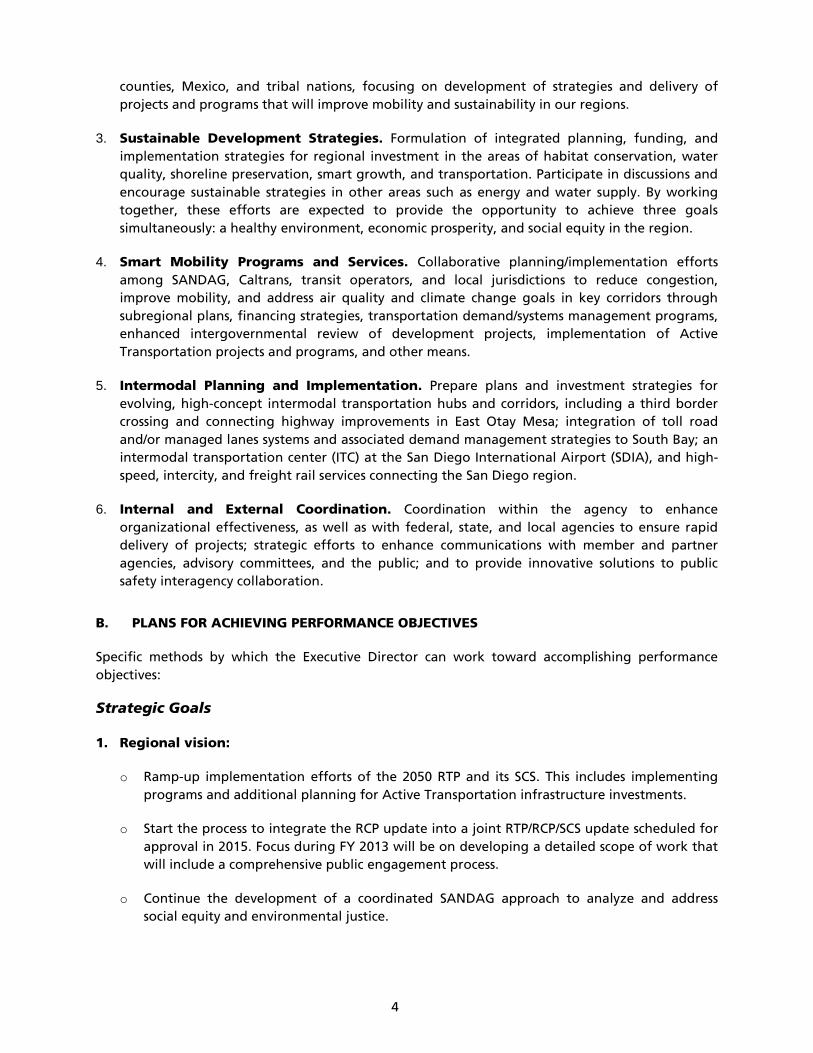
4
counties, Mexico, and tribal nations, focusing on development of strategies and delivery of projects and programs that will improve mobility and sustainability in our regions.
3. Sustainable Development Strategies. Formulation of integrated planning, funding, and implementation strategies for regional investment in the areas of habitat conservation, water quality, shoreline preservation, smart growth, and transportation. Participate in discussions and encourage sustainable strategies in other areas such as energy and water supply. By working together, these efforts are expected to provide the opportunity to achieve three goals simultaneously: a healthy environment, economic prosperity, and social equity in the region.
4. Smart Mobility Programs and Services. Collaborative planning/implementation efforts among SANDAG, Caltrans, transit operators, and local jurisdictions to reduce congestion, improve mobility, and address air quality and climate change goals in key corridors through subregional plans, financing strategies, transportation demand/systems management programs, enhanced intergovernmental review of development projects, implementation of Active Transportation projects and programs, and other means.
5. Intermodal Planning and Implementation. Prepare plans and investment strategies for evolving, high-concept intermodal transportation hubs and corridors, including a third border crossing and connecting highway improvements in East Otay Mesa; integration of toll road and/or managed lanes systems and associated demand management strategies to South Bay; an intermodal transportation center (ITC) at the San Diego International Airport (SDIA), and high-speed, intercity, and freight rail services connecting the San Diego region.
6. Internal and External Coordination. Coordination within the agency to enhance organizational effectiveness, as well as with federal, state, and local agencies to ensure rapid delivery of projects; strategic efforts to enhance communications with member and partner agencies, advisory committees, and the public; and to provide innovative solutions to public safety interagency collaboration.
B. PLANS FOR ACHIEVING PERFORMANCE OBJECTIVES
Specific methods by which the Executive Director can work toward accomplishing performance objectives:
Strategic Goals
1. Regional vision:
o Ramp-up implementation efforts of the 2050 RTP and its SCS. This includes implementing programs and additional planning for Active Transportation infrastructure investments.
o Start the process to integrate the RCP update into a joint RTP/RCP/SCS update scheduled for approval in 2015. Focus during FY 2013 will be on developing a detailed scope of work that will include a comprehensive public engagement process.
o Continue the development of a coordinated SANDAG approach to analyze and address social equity and environmental justice.
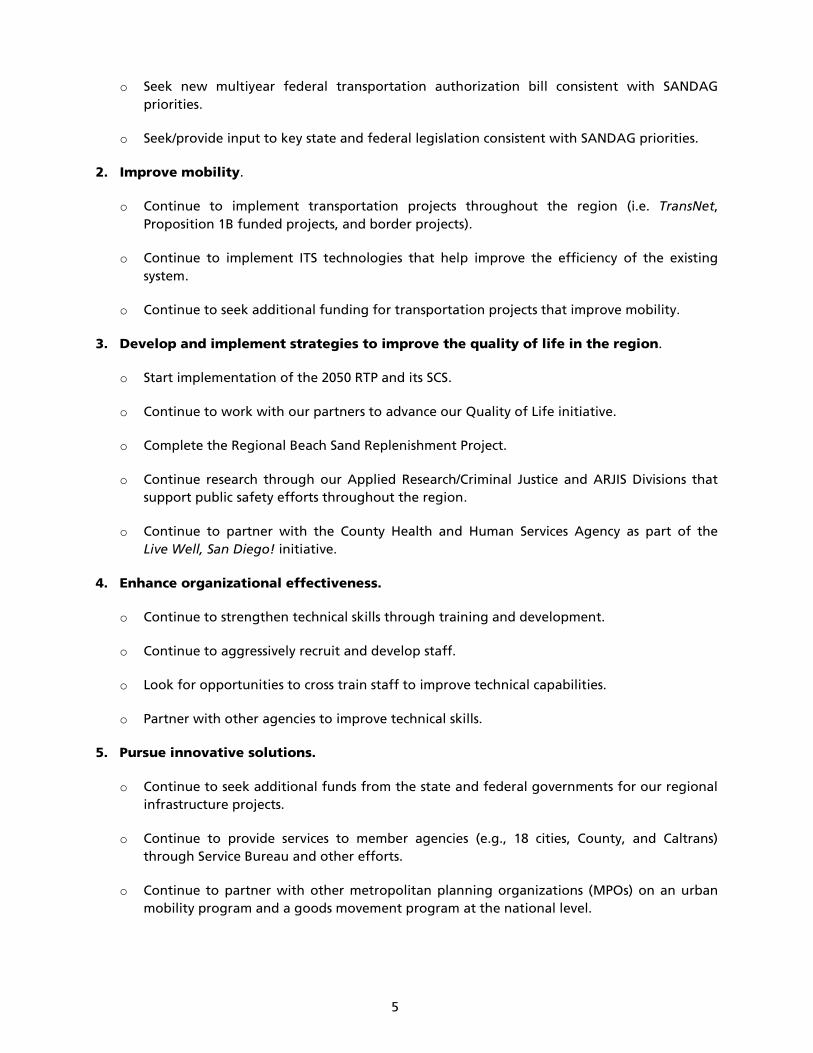
5
o Seek new multiyear federal transportation authorization bill consistent with SANDAG priorities.
o Seek/provide input to key state and federal legislation consistent with SANDAG priorities.
2. Improve mobility.
o Continue to implement transportation projects throughout the region (i.e. TransNet, Proposition 1B funded projects, and border projects).
o Continue to implement ITS technologies that help improve the efficiency of the existing system.
o Continue to seek additional funding for transportation projects that improve mobility.
3. Develop and implement strategies to improve the quality of life in the region.
o Start implementation of the 2050 RTP and its SCS.
o Continue to work with our partners to advance our Quality of Life initiative.
o Complete the Regional Beach Sand Replenishment Project.
o Continue research through our Applied Research/Criminal Justice and ARJIS Divisions that support public safety efforts throughout the region.
o Continue to partner with the County Health and Human Services Agency as part of the Live Well, San Diego! initiative.
4. Enhance organizational effectiveness.
o Continue to strengthen technical skills through training and development.
o Continue to aggressively recruit and develop staff.
o Look for opportunities to cross train staff to improve technical capabilities.
o Partner with other agencies to improve technical skills.
5. Pursue innovative solutions.
o Continue to seek additional funds from the state and federal governments for our regional infrastructure projects.
o Continue to provide services to member agencies (e.g., 18 cities, County, and Caltrans) through Service Bureau and other efforts.
o Continue to partner with other metropolitan planning organizations (MPOs) on an urban mobility program and a goods movement program at the national level.
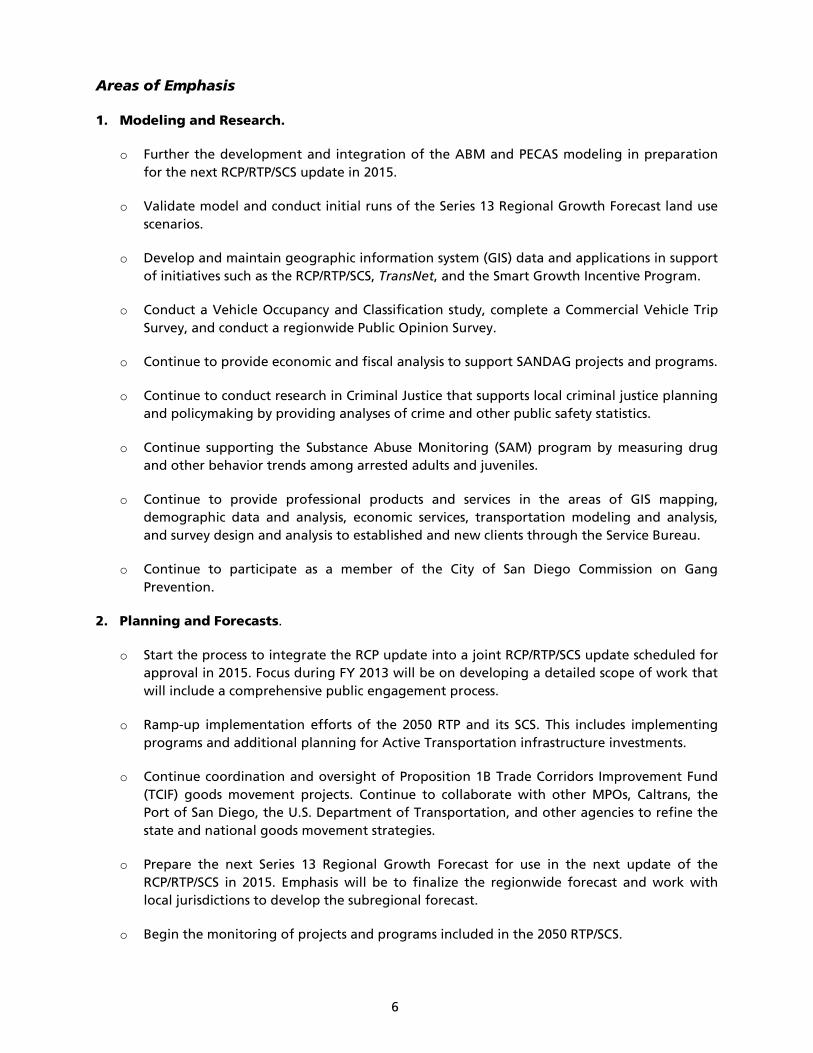
6
Areas of Emphasis
1. Modeling and Research.
o Further the development and integration of the ABM and PECAS modeling in preparation for the next RCP/RTP/SCS update in 2015.
o Validate model and conduct initial runs of the Series 13 Regional Growth Forecast land use scenarios.
o Develop and maintain geographic information system (GIS) data and applications in support of initiatives such as the RCP/RTP/SCS, TransNet, and the Smart Growth Incentive Program.
o Conduct a Vehicle Occupancy and Classification study, complete a Commercial Vehicle Trip Survey, and conduct a regionwide Public Opinion Survey.
o Continue to provide economic and fiscal analysis to support SANDAG projects and programs.
o Continue to conduct research in Criminal Justice that supports local criminal justice planning and policymaking by providing analyses of crime and other public safety statistics.
o Continue supporting the Substance Abuse Monitoring (SAM) program by measuring drug and other behavior trends among arrested adults and juveniles.
o Continue to provide professional products and services in the areas of GIS mapping, demographic data and analysis, economic services, transportation modeling and analysis, and survey design and analysis to established and new clients through the Service Bureau.
o Continue to participate as a member of the City of San Diego Commission on Gang Prevention.
2. Planning and Forecasts.
o Start the process to integrate the RCP update into a joint RCP/RTP/SCS update scheduled for approval in 2015. Focus during FY 2013 will be on developing a detailed scope of work that will include a comprehensive public engagement process.
o Ramp-up implementation efforts of the 2050 RTP and its SCS. This includes implementing programs and additional planning for Active Transportation infrastructure investments.
o Continue coordination and oversight of Proposition 1B Trade Corridors Improvement Fund (TCIF) goods movement projects. Continue to collaborate with other MPOs, Caltrans, the Port of San Diego, the U.S. Department of Transportation, and other agencies to refine the state and national goods movement strategies.
o Prepare the next Series 13 Regional Growth Forecast for use in the next update of the RCP/RTP/SCS in 2015. Emphasis will be to finalize the regionwide forecast and work with local jurisdictions to develop the subregional forecast.
o Begin the monitoring of projects and programs included in the 2050 RTP/SCS.
7
o Start advanced planning studies for the new transit projects in the 2050 RTP/SCS.
o Continue to coordinate interregional planning with Imperial, Orange, and Riverside Counties.
o Continue binational planning and coordination with Mexico.
o Continue the government-to-government framework for engaging the 17 federally recognized sovereign Tribal Nations in our regional planning efforts.
3. Sustainable Development Strategies.
o Continue development of the Quality of Life initiative to meet regional needs for habitat conservation, shoreline preservation activities, water quality improvements, and transit service enhancements. Develop a strategy to identify funding priorities and implement a public education/outreach strategy before the anticipated 2016 deadline to present a funding measure to the voters of the San Diego region.
o Continue to implement the TransNet Environmental Mitigation Program. Develop concurrence on a package of mitigation opportunities for the North Coast Corridor (including improvements to Interstate 5, the Los Angeles-San Diego-San Luis Obispo (LOSSAN) Rail Corridor, and community and environmental enhancements), based on the formal wetland mitigation land banks secured in FY 2012.
o Complete construction of the Regional Beach Sand Replenishment Project.
o Continue implementing measures identified in the Regional Energy Strategy and Climate Action Strategy. Emphasis in FY 2013 will be to implement actions identified in the 2050 RTP/SCS and to continue providing energy and climate planning assistance to local governments.
o Continue the partnership with San Diego Gas & Electric (SDG&E) to make energy efficiency outreach, planning, and technical assistance available to local governments under the Energy Roadmap Program. This next year we plan to complete Energy Roadmaps for up to nine member agencies.
o Continue to coordinate and collaborate with the San Diego County Water Authority on water quality/supply issues of common concern.
4. Smart Mobility Programs and Services.
o Continue implementing the TransNet Smart Growth Incentive Program by monitoring and providing oversight of the projects funded in the program.
o Continue implementation of Active Transportation planning and programs. Emphasis in FY 2013 will be to focus on implementation of regional bikeway projects and supporting programs.
o Continue to partner with the County of San Diego as part of the Live Well, San Diego! initiative.
8
o Continue operating the Freeway Service Patrol to help reduce congestion by providing motorist assistance services.
o Continue management and operation of the I-15 FasTrak® Value Pricing Program.
o Continue to provide 511 advanced traveler information services.
o Continue administration of the Compass Card as a common fare product for regional transit customers.
o Continue administration of the Regional TDM Program (includes Regional Vanpool Program, iCommute Program, SchoolPool matching system, employer outreach efforts, bicycle lockers, and Guaranteed Ride Home Program, among others).
o Develop an Active Transportation early action program, which defines specific projects and programs for implementation and establishes a proposed funding strategy.
o Continue monitoring the performance of our regional transportation system through the State of the Commute Report.
o Continue implementation of specialized transportation programs, including the federal Jobs Access and Reverse Commute (JARC) and New Freedom programs and the TransNet Senior Mini-Grant Program. Emphasis in FY 2013 will be to increase monitoring efforts, ensuring grantees are meeting all federal obligations, including new requirements from the updated Title VI circular, as well as requirements of the TransNet Extension Ordinance.
o Start advanced planning for new transit projects included in the 2050 RTP/SCS.
o Continue to participate in the update of the California-Baja California Master Plan.
o Maintain and operate the State Route 125 (SR 125) facility, collecting tolls and project revenue to pay for operations, maintenance, and the debt incurred in the acquisition of the Development Franchise Agreement and providing regular reports on SR 125 performance.
5. Intermodal Planning and Implementation.
o Continue the advanced planning for the ITC at SDIA. Emphasis in FY 2013 will be to continue the assessment of the Interstate 5 connector ramp proposal and participate on the advisory committee for the San Diego International Airport Master Plan effort being led by the San Diego County Regional Airport Authority.
o Continue to coordinate planning and project development along the LOSSAN Rail Corridor.
o Continue to participate in the planning, environmental, and preliminary engineering along the Los Angeles to San Diego via Inland Empire high-speed train section with the California High-Speed Rail Authority (CHSRA), Federal Railroad Administration (FRA), and fellow corridor planning agencies.
o Continue development of the new border crossing at Otay Mesa East and the connecting State Route 11. Coordinate activities at the local, state, and federal levels of governments on both sides of the border.
9
o Conduct an assessment of the current and future tolling needs of SANDAG and evaluate the existing tolling systems’ capabilities to meet these needs.
6. Internal and External Coordination.
o Continue to monitor and track project scope, schedule, and costs for all current regional transportation projects.
o Continue implementation of the TransNet Early Action Program (EAP) projects and keep the TransNet Plan of Finance up-to-date to ensure projects stay on track and funds are efficiently utilized.
o Continue to work with Independent Taxpayer Oversight Committee (ITOC) on management and independent oversight of the TransNet Program.
o Continue to market and support major work efforts, including ongoing construction projects.
o Manage federal and state legislative activities in accordance with the SANDAG Legislative Program; emphasis for this year includes pursuing SANDAG priorities for the next federal surface transportation authorization.
o Continue to be proactive with local news media (i.e., meet with staff writers and go before editorial boards on a regular basis), including Spanish media.
o Continue to promote SANDAG throughout the region.
o Continue outreach effort to keep all locally elected officials up-to-date on SANDAG activities.
o Continue to partner with chambers of commerce, economic development corporations (EDCs), and other collaboratives/organizations throughout the region on issues of common interest.
THE ABOVE PERFORMANCE OBJECTIVES HAVE BEEN REVIEWED AND AGREED UPON.
__________________________________________________________ _________________ Signature of Executive Director Date
__________________________________________________________ _________________ Signature of Chair Date
10
PART II - Accomplishments made towards achieving the agreed upon performance objectives.
Strategic Goals
1. Regional vision.
Developed an Active Transportation Implementation Strategy Framework that incorporates the Regional Bike Plan and Safe Routes to School and Safe Routes to Transit components. The team is currently developing an “Early Action Program” for regional bike projects, updating project cost estimates and establishing a priority list of projects that can be developed in the short-term.
Completed Phase II of the ITS Strategic Plan, which provides a list of potential projects and programs that meet the strategic goals of the ITS Strategic Plan and are part of the 2050 RTP/SCS.
Identified Limited English Proficiency (LEP) communities and developed an outreach plan that complies with federal Title VI laws.
Continued to meet with the San Diego legislative delegation on a regular basis to provide input on key issues and to advance the SANDAG Legislative Program. Also testified at various legislative hearings on transportation and other issues that impact the San Diego region.
Participated at the state and federal level in advocating SANDAG priorities during the development of a new federal surface transportation bill. Congress passed a two-year authorization known as MAP-21 (Moving Ahead for Progress in the 21st Century Act), which was signed into law by President Obama in July 2012.
Played a key role in helping to bring all the various transportation agencies throughout the state to work with Caltrans and the Acting Secretary of the Business, Transportation and Housing Agency on state implementing principles for MAP-21.
Successful in getting California Senate Bill 1549 (Vargas, 2012) passed and signed into law. This new state law provides SANDAG with new project delivery tools for public transit projects in the San Diego region, including design sequencing and construction manager/general contractor (CM/GC) delivery methods. CM/GC is being proposed to advance the Mid-Coast Corridor Transit Project.
Developed a work plan and schedule for integrating the update of the RCP and RTP/SCS into a consolidated regional planning effort. This work includes an extensive public outreach effort, which started with establishing a new brand identity – San Diego Forward: The Regional Plan.
Pursuant to Assembly Bill 1572 (Fletcher), which became law on September 13, 2012, SANDAG became the successor for the San Diego Service Authority for Freeway Emergencies (SD SAFE) effective January 1, 2013. SD SAFE responsibilities were transitioned into SANDAG within the required timeline.
The Governor signed into law SB 1225 (Padilla), which authorizes the Los Angeles-San Diego-San Luis Obispo Rail Corridor Agency (LOSSAN) to enter into an interagency transfer agreement with Caltrans to assume responsibility for administering state-funded intercity passenger rail service in the coastal corridor from San Diego to San Luis Obispo. Currently working with LOSSAN on the transfer agreement.
11
2. Improve mobility.
The Board adopted the 2012 Regional Transportation Improvement Program, a five-year program of major transportation projects for the San Diego region totaling $12.6 billion.
Updated the TransNet Plan of Finance; the 2012 Plan of Finance maintains the course to deliver the EAP, keeping the TransNet capital improvement projects in the FY 2013 SANDAG Program Budget on their current schedules.
Completed the Eastbound State Route 78 (SR 78) Auxiliary Lanes project, which will ease traffic flow along one of the region’s most congested stretches of freeway.
In partnership with Caltrans, the Interstate 5 North Coast Corridor (NCC) Draft Environmental Impact Report/Environmental Impact Statement (EIR/EIS) was completed. The NCC Project is a comprehensive program of improvements that meet the long-term transportation needs of a corridor that extends 27 miles from La Jolla Village Drive in San Diego to Harbor Drive in Oceanside. As part of the NCC Project, the EIR/EIS affirms the Express Lanes Only option as the Locally Preferred Alternative.
In partnership with Caltrans, the EIR/EIS for the State Route 11 (SR 11) Freeway and East Otay Mesa Border Crossing project was completed.
The design and right-of-way acquisition was completed for the San Ysidro Intermodal Facility, and the project is now under construction.
The SR 76 Widening project between Melrose Drive and Mission Road was completed and open to traffic. This is one of the TransNet “lockbox” high priority projects.
Construction of the Encinitas Pedestrian Crossing project was completed. The project consisted of the construction of a rail bridge, a paved walkway, a new crosswalk, and a traffic signal at Highway 101 and Santa Fe Drive.
Started construction of the I-15 Sabre Springs Transit Center and Parking Structure. This project is intended to meet future demand associated with a high-frequency, bus rapid transit system (BRT) along the I-15 corridor.
Improved the Rancho Bernardo and Del Lago transit stations with additional bus bays, electronic signs showing the arrival time for the next bus, and security cameras. These revamped stations reopened in March 2013 and will be used by the new BRT service scheduled for launch in 2014.
The Nordahl Road/SR 78 Interchange project was competed, providing congestion relief and improved access to the new Palomar Medical Center.
Started construction on the Sorrento to Miramar double tracking project along the LOSSAN rail corridor.
Started construction on a project to double track 4.2 miles of track and replace a bridge along the LOSSAN rail corridor between San Onofre and Las Pulgas in Camp Pendleton.
Started construction of the I-805 South High-Occupancy Vehicle (HOV) Lane project, from SR 94 to East Palomar Street in Chula Vista.
Completed construction of SR 905, connecting the border crossing at Otay Mesa to the rest of the transportation system. This important project provides a direction connection to San Diego’s only commercial crossing with Mexico.
Design was completed on the I-5/Genesee Avenue Interchange project, which will convert the existing five-lane Genesee Avenue overpass into 10 lanes and serve one of the largest employment centers in the region.
12
Completed the Draft EIR for the South Bay BRT Project, which will provide new BRT service from Otay Mesa to Downtown San Diego.
Completed design and started construction of the Mid-City Rapid Bus project from Downtown San Diego to San Diego State University.
The 511 system continued to provide commuters with 24/7 automated traveler information. During FY 2013, 511 received more than 1 million calls and more than 275,000 web visits, provided for taxi transfers, and continued support of traveler information to public access channels.
Completed the Draft Supplemental EIR/Subsequent EIS for the Mid-Coast Corridor Transit Project and received approval from the Federal Transit Administration (FTA) to circulate the draft document for public review. This completed another milestone for this high priority TransNet transit project.
Continue to operate and manage the SR 125 Toll Road. Consistent with the approved toll reduction and marketing plan, new lowered toll rates went into effect on June 30, 2012, with specific trip rate reductions of up to 40 percent. Through the third quarter of FY 2013, performance is on track to meet or exceed the goals established by the Board: traffic has exceeded 8.5 million trips, and the toll road has earned more than $16 million in toll revenues. The revenue performance has enabled SANDAG to meet its requirements for covering operating costs, funding project reserves, and scheduled debt service payments.
Continued to administer an aggressive Regional TDM program known as iCommute, which includes 737 vanpools and more than 5,700 vanpool participants. Through May 2013, participation levels resulted in a reduction of about 103 million pounds of smog-forming emissions, saved more than 5.2 million gallons in fuel consumption, and reduced more than 121 million in vehicle miles traveled. More than 30,000 individuals are registered with iCommute, and the program also manages 834 bicycle lockers located on 65 sites throughout the region with about 500 bike locker users
3. Develop and implement strategies to improve the quality of life for the region.
Conducted a public opinion survey to gauge public opinion on regional issues, including questions about quality of life in the region and regional priority areas. The survey helped inform the Board in the development of the vision and goals for San Diego Forward: The Regional Plan.
The Board adopted the vision and goals for San Diego Forward: The Regional Plan utilizing feedback gathered from both the regional survey as well as a series of public outreach efforts through public workshops, meetings of our network of community-based organizations,) and discussion among the SANDAG Policy Advisory Committees and working groups.
Completed the Regional Beach Sand Project, replenishing and widening beaches from Oceanside to Imperial Beach by adding 1.5 million cubic yards of clean, high-quality sand to eroded shorelines.
Continued to help local jurisdictions develop Energy Roadmaps; so far 12 have been completed, and three are currently under way (two remaining roadmaps will start soon). SANDAG is working with five jurisdictions on implementation of the roadmap recommendations.
13
Continued to partner with the County of San Diego Health and Human Services Agency (HHSA) on the Live Well, San Diego! initiative. As part of this effort, developed enhanced planning tools, drafted a framework for incorporating health into regional planning, supported planning for health and active transportation at the local level, and promoted active transportation and regional bikeway development.
4. Enhance organizational effectiveness.
Continued to aggressively recruit and develop staff. During FY 2013 SANDAG recruited 22 employees to fill regular positions and 64 to fill various contingent staff positions (limited-term, intern, temporary, toll operator personnel). Of the FY 2013 recruitments, 90 percent were external (open to all interested, qualified, applicants), and 10 percent were open only to current employees. During the year 13 employees were promoted using a competitive recruitment process (either internal or external recruitment). At the beginning of June 2013, 53 percent of the agency’s employees were female, and 46 percent were from minority groups.
Continued to enhance employee skills through training and development in areas such as leadership, supervisor/manager effectiveness, customer service, project management, written communication, public speaking and presentation skills, and various role-specific technical skills.
Continued to promote and encourage employees to stay active in professional organizations, such as the Women’s Transportation Seminar (WTS), American Society of Civil Engineers (ASCE), San Diego Highway Development Association, American Planning Association (APA), and Urban Land Institute (ULI), among others.
Continued strengthening our capacity and partnerships in the area of goods movement. I was appointed by the U.S. Secretary of the Transportation to serve on the Marine Transportation System National Advisory Council and currently serve as the Vice-Chair of the Council.
Continued to strengthen partnerships with the other major MPOs in California – Southern California Association of Governments (SCAG), Metropolitan Transportation Commission (MTC), and Sacramento Area Council of Governments (SACOG). Our Planning, Modeling, and Legal teams continue to work together on sharing information, standardizing assumptions, conducting joint evaluations, and developing common scenarios for regional planning issues. This partnership has been recognized statewide and the California Transportation Commission (CTC), Legislature, and Governor’s Office have been seeking more input from the groups.
5. Pursue innovative solutions.
Secured $79.7 million in Proposition 1B TCIF program funding for the SR 11 project to fund the construction of Phase 1 from SR 905 to Enrico Fermi Drive.
Secured $56.8 million of Proposition 1B Corridor Mobility Improvement Account funds for the construction of the I-805 South HOV Lanes project, from SR 94 to East Palomar Street in Chula Vista.
Secured $30 million of State Transportation Improvement Program (STIP) and Proposition 1B Intercity Rail funds to double track 4.2 miles of track and replace a bridge along the LOSSAN rail corridor between San Onofre and Las Pulgas in Camp Pendleton.
14
Continued work on the I-805 HOV Lanes – North project. This project was approved by the CTC as one of the ten projects permitted by the statewide design-build legislation. Utilizing the design-build delivery method will allow this project to be completed at least 14 months earlier than using the traditional design-bid-build process.
Initiated the Integrated Corridor Management (ICM) system along I-15 corridor. The overall vision of the ICM project is to improve mobility and reduce congestion by developing an integrated transportation management system that enhances multi-agency and multimodal coordination. The I-15 ICM project was selected as one of two pilot sites in the nation to develop, implement, and operate an ICM system and will be the first-of-its-kind decision support system developed in the nation.
Completed the Regional Arterial Detection Plan, which was initiated in an effort to improve the region’s ability to better understand the performance of regional arterials. This project will provide the region with automated, continuous, real-time monitoring of arterial data useful in assessing and improving regional signal timing plans and regular arterial system performance.
Submitted applications for three FY 2013 TIGER Discretionary Grants: Pacific Surfliner Coastal Rail Bridges, Interstate 15 Bus Rapid Transit Stations/Lanes Project, and State Routes 905/125/11 Connectors.
Continued to provide services to member agencies, private firms, and other organizations through the Service Bureau. We are currently working on approximately 70 projects generating an estimated $380,000 in revenues.
Areas of Emphasis
1. Modeling and Research.
Completed development of the state-of-art ABM and the PECAS model, both of which will be used in the update of San Diego Forward: The Regional Plan.
Developed the draft 2050 Regional Growth Forecast (Series 13 Growth Forecast); the subregional forecast is currently under development. Collaborated with local jurisdictions on a comprehensive update using an online tool to collect/update parcel level land use and development data for use in preparing the Series 13 subregional forecast.
Continued collaboration with SanGIS to maintain and enhance the regional GIS data warehouse. Implemented Web-based tools for reviewing and editing GIS data. Examples of regional collaboration projects include the development of regional parks, schools, conserved lands, and the zoning layers comment tool.
Updated GIS vegetation mapping for 500,000 acres of land included or proposed for inclusion into the regional habitat preserve system. A current and accurate map of vegetation is a key tool for land management decisions such as the allocation of funding for restoration or to address the effects of wildfires.
Updated our GIS and build visualizations, including maps and charts, and animations for our plans and programs. The visualizations help demonstrate ABM and PECAS outputs.
Completed the Commercial Vehicle Model Survey for the ABM.
Conducted a Regionwide Public Opinion Survey which assisted in informing the Board of quality of life issues and regional priorities.
15
Continued to support the SAM program by going into the local jails to conduct interviews with adult and juvenile arrestees. These interviews allow us to measure drug and other behavior trends among arrested adults and juveniles.
The SANDAG Service Bureau continued to provide professional products and services throughout the San Diego region. We are currently working on approximately 70 projects generating an estimated $380,000 in revenues.
Continued to partner with numerous law enforcement partners to help evaluate regional strategies to combat gang-related crime.
Continued to serve as a member of the City of San Diego Commission on Gang Prevention.
2. Planning and Forecasts.
Continued the legal defense of the 2050 RTP/SCS litigation.
Developed a work plan and schedule for integrating the update of the RCP and RTP/SCS into a consolidated regional planning effort. This work includes an extensive public outreach effort, which started with establishing a new brand identity – San Diego Forward: The Regional Plan.
Continued to collaborate with other MPOs, Caltrans, Port of San Diego, and the U.S. Department of Transportation on goods movement policies and strategies. These policies/ strategies are now being promoted for inclusion in the next federal transportation authorization. My continued service on the U.S. Secretary of Transportation’s Marine Transportation System National Advisory Council provides us with an opportunity to advocate for the San Diego region’s interests.
Initiated the advance planning studies for new transit projects included in the 2050 RTP/SCS. These include four new light rail transit lines and two tunnel projects.
Throughout the year continued to meet at the policy level with transportation agencies in neighboring regions, including SCAG, Imperial County Transportation Commission, Orange County Transportation Authority, and Riverside County Transportation Commission, on transportation-related issues (e.g., 2050 RTP/SCS, SR 241 Toll Road, goods movement, and border-related projects).
Continued working on an investment grade traffic and revenue study for the planned Otay Mesa Port of Entry (POE). This study is critical in helping both sides of the U.S.-Mexico border understand the overall revenue potential and bonding capacity for this new border crossing. Given the need to improve border infrastructure and the potential to utilize tolls to fund infrastructure improvements on both sides of the border, this effort continues to attract international attention.
Continued to partner with the other major MPOs throughout the nation, Caltrans, and U.S. Department of Transportation regarding transportation issues. Goods movement, land ports of entry, and our trading relationship with Mexico continue to be discussed at the national level.
Played a key role in helping to bring the City of San Diego, Metropolitan Transit System, and Caltrans together to speak with one voice to ensure that pedestrian and transit needs are included and that local impacts are addressed at San Ysidro POE. We also partnered with Caltrans to develop a funding strategy that will ensure that a plan for pedestrians and transit at Virginia Avenue are included in the next phase of POE improvements.
All 17 Tribal Nations continue to participate at SANDAG, as their input and participation are very important to all SANDAG activities and plans.
16
Received nearly $750,000 in statewide planning grants to conduct a number of regional studies, including an Interstate 8 Corridor Study, San Diego Regional Vanpool and Carpool Analysis, North University Towne Centre/Sorrento Valley Transit Study, and Border Health Equity Study.
3. Sustainable Development Strategies.
Based on the results of a public opinion survey, in March 2012 the Board of Directors amended the TransNet Extension Ordinance to delay the Quality of Life measure from 2012 to 2016. During the past year we began work on San Diego Forward: The Regional Plan, which will help guide and inform the Quality of Life effort.
Completed the Chula Vista Light Rail Corridor Improvement Project Study, which scoped out the grade separations that are needed at E, H, and Palomar Streets in Chula Vista.
Developed a work plan and schedule for San Diego Forward: The Regional Plan. This work includes an extensive public outreach effort and public involvement plan. The regional plan vision and goals have been approved by the Board of Directors.
Continued to implement the TransNet Environmental Mitigation Program (EMP). To date, 24 properties totaling more than 3,329 acres have been acquired. This includes mitigation for upland impacts for all TransNet EAP projects, including completion of mitigation and permitting for the SR 76 project, and mitigation for 319 acres for local streets and roads projects. Also secured the rights to restore five parcels for coastal wetland mitigation and obtained resource agency approval of a draft Resource Enhancement and Mitigation Program for the North Coast Corridor (I-5, SR 78, and the LOSSAN rail corridor).
Completed a call for projects and the Board awarded TransNet EMP land management grants for 15 projects totaling $2 million. These projects will fund habitat restoration and invasive control, species-specific management category, and habitat maintenance, access control/management and volunteer coordination projects throughout the region.
Continued development of a draft Management Strategic Plan for conserved lands in western San Diego County. This plan identifies common challenges from local to regional levels, prioritizes resource needs, and outlines a funding allocation strategy to maximize return.
Completed the Regional Beach Sand Project, replenishing and widening beaches from Oceanside to Imperial Beach by adding 1.5 million cubic yards of clean, high-quality sand to eroded shorelines.
Continued to implement the Regional Energy Strategy and the Climate Action Strategy. Obtained approval from the California Public Utilities Commission (CPUC) for a two-year extension of the SANDAG Energy Roadmap Program, a partnership with SDG&E. This extension also provided an additional budget of $1,262,660 to continue the program from January 1, 2013, through December 31, 2014. So far 12 Energy Roadmaps have been completed, and three are currently under way (two remaining roadmaps will start soon). SANDAG is working with five jurisdictions on implementation of the roadmap recommendations.
Continued to collaborate with the California Center for Sustainable Energy on enhancing the clean transportation components of the SANDAG Energy Roadmap program and supporting early actions of building retrofits, infrastructure for alternative fuel, and regional planning for the Electric Vehicle project.
17
Continued to coordinate and collaborate with the San Diego County Water Authority. The Series 13 Growth Forecast requires both coordination and collaboration to ensure that there is enough water to support the region’s long-range needs. The Authority utilizes the growth forecast to plan for future water needs.
Obtained a grant from the California Energy Commission to develop a regionally-accepted Electric Vehicle Readiness plan through input of the San Diego Regional Vehicle Infrastructure Working Group. Partnering with the California Center for Sustainable Energy, a list of regional barriers has been developed and work has begun to address these barriers.
4. Smart Mobility Programs and Services.
Continued to implement the TransNet Smart Growth Incentive Program. Completed a call for projects in FY 2013, and the Board awarded grant funds totaling $8.5 million for six capital projects and totaling $2.1 million for seven planning projects.
As part of the Live Well, San Diego! initiative with the County HHSA, developed enhanced planning tools, drafted a framework for incorporating health into regional planning, supported planning for health and active transportation at the local level, and promoted active transportation and regional bikeway development.
Initiated work on the regional complete streets policy, health benefits and impacts analyses, refined a regional health and wellness policy, and started prioritizing items for implementation from the Safe Routes to School Strategic Plan.
Initiated development of a funding/financing plan for the implementation of regional bikeway projects and supporting programs from the Board-approved Regional Bike Plan. Procured a group of on-call consultants that are at the ready to assist in the planning and design of these projects. Also established an active transportation data collection and reporting program.
As part of the Active Transportation Grant Program, continued to oversee the completion of projects throughout the region. Released a call for projects, and the Board awarded grant funds for 25 projects totaling $8.8 million.
Began an update of existing projects identified in the San Diego River Conservancy’s Gap Analysis and a prioritization of those projects as part of the San Diego River Trail.
Started a Border Health Equity Transportation Study. The project will assess the health impacts and benefits of providing active transportation facilities and access to public transit to and from the San Ysidro border crossing.
Continued to provide traveler information through the 511 system. During FY 2013, 511 received more than 1 million calls and more than 275,000 web visits, provided for taxi transfers, and continued support of traveler information to public access channels.
Continued to conduct TDM studies, develop plans and pilot projects that make progress towards the demand management goals contained in the 2050 RTP/SCS. These include a Regional Telework Demonstration Project Study, analyzing opportunities to expand our Regional Vanpool, Carpool, and Guaranteed Ride Home Programs, development of a new web-based resource on integrating TDM into the planning and development process for local jurisdictions, and planning for the development of a commuter loyalty program.
Developed a North Coast Corridor TDM Plan that will provide geographically-focused and context-specific TDM solutions to help manage congestion during construction of the I-5 Express Lanes and double tracking of the LOSSAN rail corridor.
18
Adopted a full update to the Coordinated Plan and completed a competitive process for specialized transportation, awarding $1.7 million to 11 JARC projects, and $1.1 million to 10 New Freedom projects, and $2.85 million to 16 TransNet Senior Mini-Grant projects. Implemented a new monitoring checklist and quarterly system of reporting on specialized transportation grants to Transportation Committee.
Started advance planning for the four new light rail lines included in the 2050 RTP/SCS.
Continued to participate in the update of the California-Baja California Border Master Plan. Most of the work for the update is being done through the SANDAG Service Bureau.
A fleet of full time tow trucks and roving pick-up trucks continue to patrol about 242 miles of the San Diego Freeway System, providing motorist service and assistance to stranded or disabled vehicles during peak commute hours. On an annual basis they assist about 50,000 motorists. This Freeway Service Patrol continues to help reduce congestion and has proven to be a cost-effective system management strategy.
Continued management and operation of the I-15 FasTrak Value Pricing Program. This continues to be an effective traffic management tool and is helping to fund public transit service in the I-15 corridor. Carpool trips in the I-15 Express Lanes grew by more than 20 percent, reaching 10.7 million trips, and FasTrak usage grew approximately 13 percent to nearly 3 million trips. During FY 2013 the program generated approximately $5.7 million in toll revenues, which covers operating costs, funds a maintenance reserve, and provides $1 million in funding to MTS for I-15 express bus operations.
Continued administration of the Compass Card as a common fare product for regional transit customers. With the Compass Card well established and the development of the fare card system complete, we are in the process of transferring the operating responsibility to the transit operators.
Continued to administer an aggressive Regional TDM program known as iCommute, which includes 737 vanpools and more than 5,700 vanpool participants. Through May 2013, participation levels resulted in a reduction of about 103 million pounds of smog-forming emissions, saved more than 5.2 million gallons in fuel consumption, and reduced more than 121 million in vehicle miles traveled. More than 30,000 individuals are registered with iCommute, and the program also manages 834 bicycle lockers located on 65 sites throughout the region with about 500 bike locker users
Completed an update of the State of the Commute Report.
Partnered with 211 San Diego and Facilitating Access to Coordinated Transportation (FACT) to secure a $2.05 million from the FTA Veterans Transportation and Community Living Initiative grant program for San Diego County’s One Call/One Click Partnership Project, which will improve veterans’ access to transportation.
5. Intermodal Planning and Implementation.
Continued with the advanced planning for the ITC at SDIA. Initial planning work identified I-5 direct connector ramp alternatives that will eliminate the need for a rail grade separation at Washington Street and Sassafras Street.
Continued work on the San Ysidro Intermodal Transportation Center. Completed a market analysis, opportunity and constraints analysis, and developed two intermodal transportation center alternatives. We also held two public workshops and two inter-agency working group meetings.
19
Continued to coordinate planning and project development on the LOSSAN rail corridor in San Diego County. We also worked on joint advocacy activities with the Capital Corridor, San Joaquin Corridor, and the Coast Rail Coordination Council in both Sacramento and Washington DC.
Continued to work with the California High-Speed Rail Authority (CHSRA) on planning, environmental, and conceptual design work for the Los Angeles to San Diego portion of the high-speed rail system. Continue to attend CHSRA Board meetings to advocate for the San Diego portion of the system.
Continued development of a new border crossing at Otay Mesa East. Jointly developing an investment grade traffic & revenue study with Mexico to identify the potential revenues that could be leveraged to fund improvements associated with the new border crossing. Also partnered with Caltrans to complete environmental work, design, and right-of-way acquisition for the first phase of SR 11. Successful in securing $75 million from the Proposition 1B infrastructure bond; this will allow construction of the first phase to start early next year.
Made significant progress on TCIF (Trade Corridor Improvement Fund) projects.
Continued to stay active and participate in the West Coast Coalition Corridor. The Coalition continues to advocate for goods movement and freight improvements along the West Coast.
6. Internal and External Coordination.
Developed an agencywide Public Participation Plan that establishes a process for communicating with and obtaining input from the public concerning agency programs, projects, and program funding. The plan was developed in accordance with the Federal Highway Administration (FHWA) for metropolitan transportation planning (23 CFR 450.136) requirements, addresses Title VI of the Civil Rights Act and related nondiscrimination requirements, and reflects the principles of social equity and environmental justice.
Continued outreach to the press, key stakeholders, and the general public on TransNet projects, educating on individual programs as well as the comprehensive effort being made under the TransNet Program to create a multimodal transportation system that offers choices to the region’s travelers.
Continued outreach through monthly rEgion newsletter and Board of Directors actions, ensured meetings were broadcast on the SANDAG website, and utilized social media (Facebook & Twitter) to extend our public outreach efforts.
Implemented the reduced tolls and a marketing program for the South Bay Expressway (SR 125 toll road) to encourage more usage of the toll road by both existing and new customers.
Continued to work closely with news media to highlight SANDAG projects and activities throughout the region (i.e., press events for all major projects, interviews, and meetings with editorial boards).
Continued to work closely with Spanish media to highlight SANDAG projects and activities throughout the region. All interviews conducted in Spanish.
Held press events and ceremonies to highlight groundbreakings and completion of major construction projects throughout the region.
20
Continued to meet with the San Diego legislative delegation on a regular basis to provide input on key issues and to advance the SANDAG legislative program. Also testified at various legislative hearings on transportation and other issues that impact the San Diego region.
SANDAG is responsible for programming STIP, Regional Surface Transportation Program, Congestion Mitigation & Air Quality, TransNet and other funds for transportation improvement projects and programs. In this capacity we track project scope, schedule, and costs on an ongoing basis to ensure that budgets and schedules are being met, and that we are complying with all state and federal requirements. Throughout the year we worked with project sponsors to ensure that state and federal deadlines are met so that funds are not lost to the region. To date no funds have been lost as we aggressively manage all the various fund types.
Continued to participate with both the California Association of Councils of Governments (CALCOG) at the state level and the National Association of Regional Councils (NARC) at the national level. Held leadership positions in both organizations and helped develop a reform agenda for CALCOG and influenced NARC’s goals at the national level.
Stayed active on Chamber and EDC boards throughout the region. Continued to serve on the Board of Directors of the San Diego Regional Chamber of Commerce. Also participated in the “One Region, One Voice” trip to Washington, DC.
Continued to meet with officials from the local, state, and federal levels in Mexico on the new border crossing at Otay Mesa East and the rehabilitation of the San Ysidro POE.
Continued to meet and partner with the Tribal Nations. SCTCA representatives continue to be active and participate on the SANDAG Policy Advisory Committees and the Board of Directors. The Tribal Transportation Working Group continued to meet quarterly to discuss key issues.
Continued outreach to locally elected officials, including traveling throughout the San Diego region to meet one-on-one with both existing and newly elected officials.
PART III - COMMENTS
Pursuant to the employment agreement with the Executive Director, the Board of Directors shall annually review the performance of the Executive Director. If the Executive Director’s performance is determined to be satisfactory, the Board of Directors shall adjust his base salary in accordance with the employment agreement provisions. The Chair has reviewed the Executive Director’s performance evaluation for the period July 2012 to June 2013, and recommends that his performance during the past year be determined satisfactory.
THE EXECUTIVE DIRECTOR HAS MET THE PERFORMANCE OBJECTIVES.
__________________________________________________________ _________________ Signature of Chair Date
21
SAN DIEGO ASSOCIATION OF GOVERNMENTS Annual Executive Director Performance Objectives
PART I - To be completed by the Executive Director and distributed to the Executive Committee for review and comment.
A. PERFORMANCE OBJECTIVES
Goals for the next year in order to meet or exceed standards for the Executive Director position:
Strategic Goals 1. Regional Vision: Implement the regional vision and guiding principles through updates of the
Regional Comprehensive Plan (RCP) and the Regional Transportation Plan (RTP), and by providing constructive input into the next federal surface transportation act and other key federal and state legislation.
2. Mobility: Improve mobility by providing more transportation choices through implementation of TransNet, public transportation, goods movement, Transportation Demand Management (TDM), Intelligent Transportation Systems (ITS), and supporting walkable and bike-friendly communities through efficient and effective operational strategies.
3. Quality of Life: Develop and implement strategies to improve the quality of life in the region as characterized by a sustainable economy, healthy environment, public safety, and more housing choices, consistent with the RCP and the SANDAG mission. Take advantage of regional resources and partnerships to advance new strategic initiatives.
4. Organizational Effectiveness: Enhance organizational effectiveness both internally and externally through continuous improvements and fiscal discipline.
5. Innovation: Pursue innovative solutions to fiscal and economic challenges and opportunities.
Areas of Emphasis 1. Modeling, Research, Estimates, and Forecasts. Employ new technologies, methodologies,
and models, including the Activity-Based (ABM) transportation model and the Production, Exchange, and Consumption Allocation System (PECAS) land-use model to enhance and expand research and analysis capabilities, equipping SANDAG to effectively meet the needs of internal and external customers through comprehensive assessment of complex policy and operational issues, today, and into the future.
Executive Director Name Period covered by this review
Gary L. Gallegos From: 7-2013 To: 6-2014
Attachment 2
22
2. Sustainable Development: Planning and Strategies. Formulation of integrated planning, funding, and implementation strategies for investment with key partner agencies and stakeholders that result in the advancement of the region’s sustainability goals and policies. Includes a coordinated planning process that will lead to the implementation of the San Diego Forward: The Regional Plan, which will combine the next update of the 2050 RTP and its Sustainable Communities Strategy (SCS) with the first comprehensive update to the RCP. Other key focus areas are smart growth, integrated multimodal transportation planning, habitat conservation, shoreline preservation, and water quality. Participate in discussions and encourage sustainable strategies in other areas such as energy and water supply.
3. Sustainable Mobility Programs and Services. Collaborative advanced planning and implementation efforts between SANDAG, Caltrans, transit operators, and other partner agencies to reduce congestion, deliver mobility programs and projects, improve reliability, enhance customer service, and address air quality and climate change goals. Emphasis on transportation demand, systems management, transit/social services, Active Transportation, and other projects and programs that are sustainable from financial, environmental, and community health perspectives.
4. Intermodal Planning and Implementation. Prepare plans and investment strategies for evolving high-level concepts for intermodal transportation hubs and corridors, including border crossings; highway/rail improvements; regional integration of toll road and managed lanes systems; an Intermodal Transit Center (ITC) at the San Diego International Airport; and high-speed, intercity, and freight rail services, which will support the San Diego region’s connectivity to the global economy.
5. Internal and External Coordination. Coordination within the agency to enhance organizational effectiveness as well as with federal, state, and local agencies to ensure rapid delivery of projects; strategic efforts to increase communications with member and partner agencies, committees, and the public.
B. PLANS FOR ACHIEVING PERFORMANCE OBJECTIVES
Specific methods by which the Executive Director can work toward accomplishing performance objectives.
Strategic Goals
1. Regional vision.
o Continue development of San Diego Forward: The Regional Plan.
o Work within the region and with state partners to develop principles for the next federal surface transportation bill.
o Continue implementation of the 2050 RTP and its SCS.
o Continue to provide input on key state and federal legislation consistent with SANDAG priorities.
23
2. Mobility.
o Continue to implement transportation projects throughout the region (i.e. TransNet, state infrastructure bond projects, border projects).
o Continue to implement ITS technologies that help improve the efficiency of the existing system.
o Continue to seek funding for transportation projects that improve mobility.
3. Quality of Life.
o Continue implementation of the 2050 RTP and its SCS.
o Continue research through our Applied Research/Criminal Justice and ARJIS Divisions that support public safety efforts throughout the region.
o Continue to partner with the County Health and Human Services Agency as part of the Live Well, San Diego! initiative.
o Continue to partner with San Diego Gas & Electric (SDG&E) on energy issues and with the San Diego County Water Authority on regional growth and water-related issues.
4. Organizational Effectiveness.
o Continue to strengthen technical skills through training and development.
o Continue to aggressively recruit and develop staff.
o Look for opportunities to cross train staff to improve technical capabilities.
o Partner with other agencies to improve technical skills.
5. Innovation.
o Continue to seek funding from the state and federal governments for regional infrastructure projects.
o Continue to provide services to member agencies (e.g., 18 cities, County, and Caltrans) through Service Bureau and other efforts.
o Continue to partner with other metropolitan planning organizations (MPOs) on an urban mobility program and a goods movement program at both the state and national levels.
o Improve the SANDAG Web Page and continue to utilize social media to provide information to the public.
24
Areas of Emphasis
1. Modeling, Research, Estimates, and Forecasts.
o Utilize the ABM and PECAS land-use model in development of San Diego Forward: The Regional Plan.
o Complete a Commercial Vehicle Model and develop a Dynamic Traffic Assignment Model to enhance our ABM Model. Given both our maritime and land ports of entry, the ability to better model commercial vehicles is becoming increasingly important.
o Continue to enhance our geographic information systems (GIS) capabilities and visualization tools.
o Conduct a 2014 Transit Public Opinion Survey, an Onboard Transit Passenger Survey, and start preparation for the 2015 Household Travel Survey – all of which are essential for calibrating the SANDAG models.
o Update the San Diego Regional Economic Prosperity Strategy data and analysis for use in San Diego Forward: The Regional Plan.
o Complete the Series 13 Regional Growth Forecast.
o Continue the Substance Abuse Monitoring (SAM) program by continuing to measure drug use and other behavior trends by interviewing adults and juveniles who have been booked into our jails and detention facilities.
o Continue to provide quality research and evaluation support to our local law enforcement and public safety agencies.
o Continue to provide professional products and services in the areas of GIS mapping, demographic data and analysis, economic services, transportation modeling and analysis, and survey design and analysis to established and new clients through the Service Bureau.
o Continue to participate as a member of the City of San Diego Commission on Gang Prevention.
o Continue to provide economic and fiscal analysis to support SANDAG projects and programs.
2. Sustainable Development: Planning and Strategies.
o Continue the development of San Diego Forward: The Regional Plan, which integrates the update of the RCP and RTP.
o Continue to implement the actions and commitments included in the 2050 RTP/SCS.
o Continue the legal defense of the 2050 RTP/SCS.
o Continue to implement the planning and other related provisions of MAP-21 (Moving Ahead for Progress in the 21st Century Act), including the freight aspects and continue to implement the Trade Corridor Improvement Fund (TCIF) projects.
25
o Update freight forecasts along major corridors and at regional goods movement facilities.
o Reevaluate the regional priorities for the Quality of Life Funding Strategy and determine how this effort will be integrated into the development of the San Diego Forward: The Regional Plan.
o Continue to implement the TransNet Environmental Mitigation Program (EMP).
o Complete a technical update of the Regional Energy Strategy (RES) that will feed into San Diego Forward: The Regional Plan.
o Continue to coordinate interregional planning with Imperial, Orange, and Riverside Counties.
o Continue to coordinate and collaborate with the San Diego County Water Authority on water quality/supply issues of common concern.
o Continue binational planning and coordination with Mexico.
o Continue the government-to-government framework for engaging the 17 federally recognized sovereign Tribal Nations of the San Diego region in our regional planning efforts.
3. Sustainable Mobility Programs and Services.
o Complete the development and begin implementation of a Regional Bike Plan early action program.
o Continue work on the Border Health Equity Transportation Study, including public outreach to reach consensus on the framework and goals for the health impact assessment report.
o Continue to provide advanced traveler information services through 511. Explore new business models to help improve the long-term sustainability of the program.
o Continue administration of the Regional TDM Program (includes Regional Vanpool Program, iCommute Program, SchoolPool matching system, employer outreach efforts, bicycle lockers, and Guaranteed Ride Home Program, among others).
o Continue operating the Freeway Service Patrol to help reduce congestion by providing motorist assistance services.
o Continue management and operation of the I-15 FasTrak® Value Pricing Program.
o Establish a connected vehicle concept of operations, including high-level requirements and deployment plan for the San Diego region.
o Continue implementation of specialized transportation programs, including federal Job Access and Reverse Commute (JARC) and New Freedom programs and the TransNet Senior Mini-Grant program.
o Continue with advanced planning for the four new light rail transit lines identified in the 2050 RTP/SCS.
26
o Continue monitoring the performance of our regional transportation system through the State of the Commute report.
o Continue to maintain and operate the State Route 125 (SR 125) facility, collecting tolls and project revenue to pay for operations, maintenance, and the debt incurred in the acquisition of the Development Franchise Agreement and providing regular reports on SR 125 performance.
4. Intermodal Planning and Implementation.
o Continue to partner with the San Diego County Regional Airport Authority on the advanced planning for the ITC at San Diego International Airport.
o Continue advance planning for the San Ysidro Intermodal Transportation Center, including evaluation of ITC alternatives, developing cost estimates and a phasing plan for the preferred ITC alternative, and preparing a project study report.
o Continue to participate in the Los Angeles to San Diego to San Luis Obispo (LOSSAN) rail corridor planning. Work with LOSSAN partners and the state on the interagency transfer agreement to transfer operations of intercity rail service to the new LOSSAN joint powers authority (JPA).
o Continue to coordinate planning and project development along the LOSSAN rail corridor in the San Diego region.
o Continue to partner with the California High-Speed Rail Authority on the advanced environmental planning for the San Diego to Los Angeles portion of the high-speed train system.
o Continue to advance the planning and implementation of a new border crossing at Otay Mesa East and begin construction of the first phase of SR 11.
o Start planning for the integration of operations of Managed Lanes and tolled facilities throughout the San Diego region. Conduct an assessment of existing systems and develop requirements for a central solution for all SANDAG tolling facilities.
5. Internal and External Coordination.
o Continue monitoring and tracking of project scope, schedule, and costs for all current regional transportation projects.
o Continue implementation of the TransNet Early Action Program (EAP) projects and keep the TransNet Plan of Finance up-to-date to ensure projects stay on track and funds are efficiently utilized.
o Continue to work with Independent Taxpayer Oversight Committee (ITOC) on management and independent oversight of TransNet Program.
o Continue to market and support major work efforts, including ongoing construction projects.
27
o Manage federal and state legislative activities in accordance with the SANDAG Legislative Program.
o Continue to be proactive with local news media (i.e., meet with staff writers and go before editorial boards on a regular basis), including Spanish media.
o Continue to promote SANDAG throughout the region.
o Continue outreach effort to keep all locally elected officials up-to-date on SANDAG activities.
o Continue to partner with chambers of commerce, economic development corporations (EDCs), and other collaboratives/organizations throughout the region on issues of common interest.
THE ABOVE PERFORMANCE OBJECTIVES HAVE BEEN REVIEWED AND AGREED UPON.
__________________________________________________________ _________________ Signature of Executive Director Date
__________________________________________________________ _________________ Signature of Chair Date
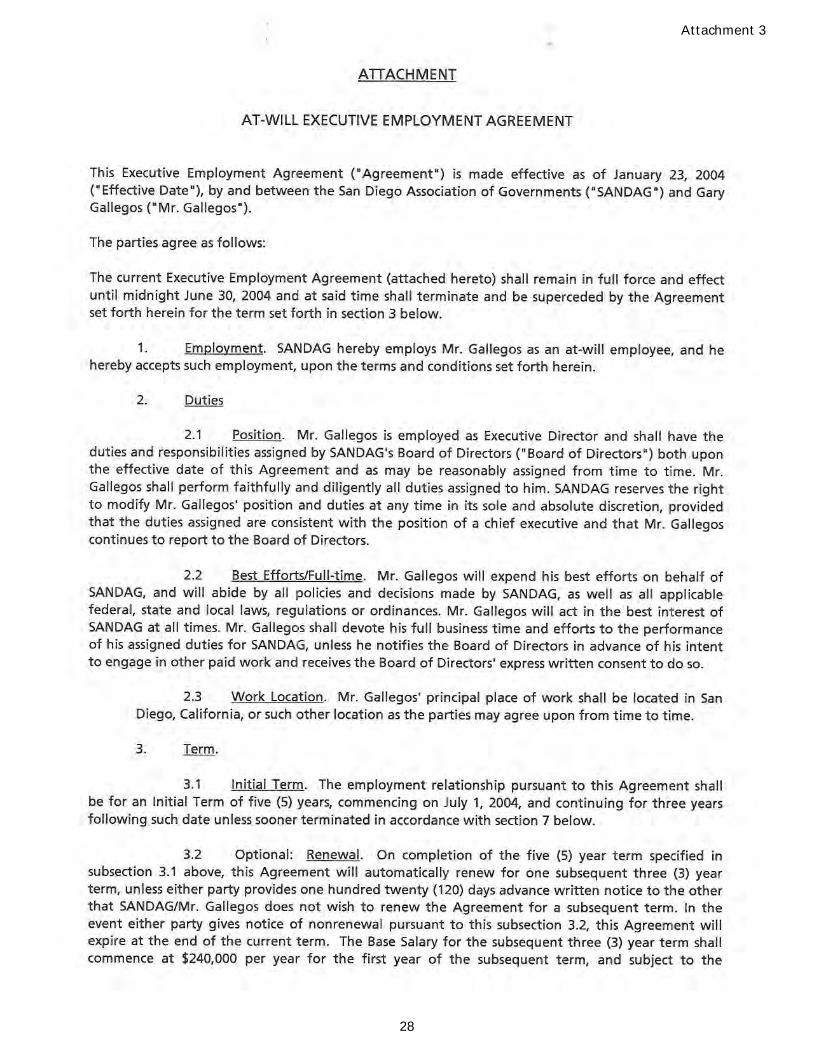
28
Attachment 3
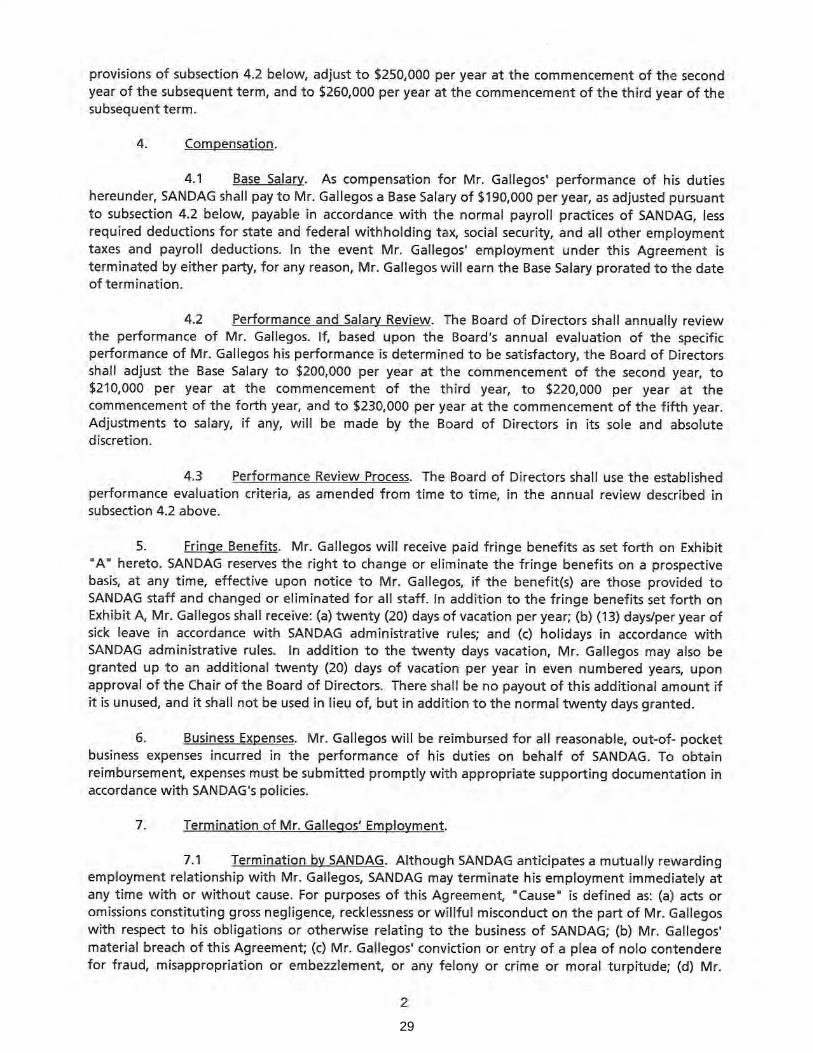
29
mmo
Rectangle
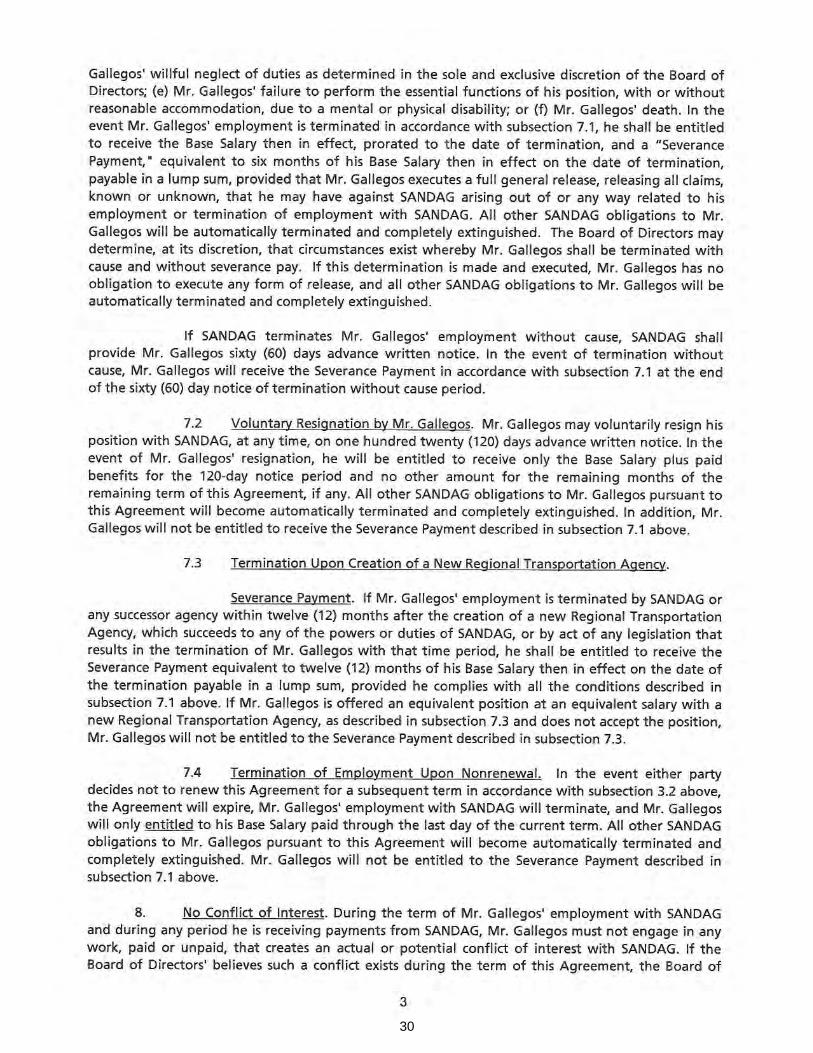
30
mmo
Rectangle
31
mmo
Rectangle
32
mmo
Rectangle
33
mmo
Rectangle
34
mmo
Rectangle
mmo
Rectangle
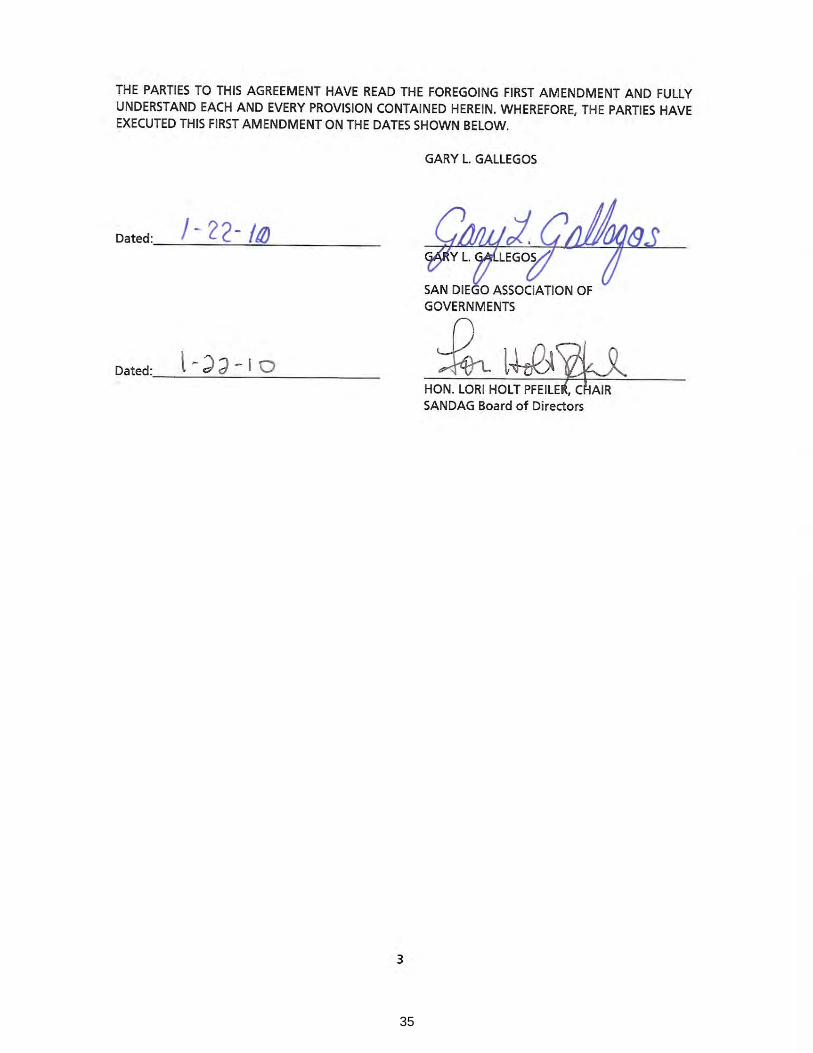
35
mmo
Rectangle
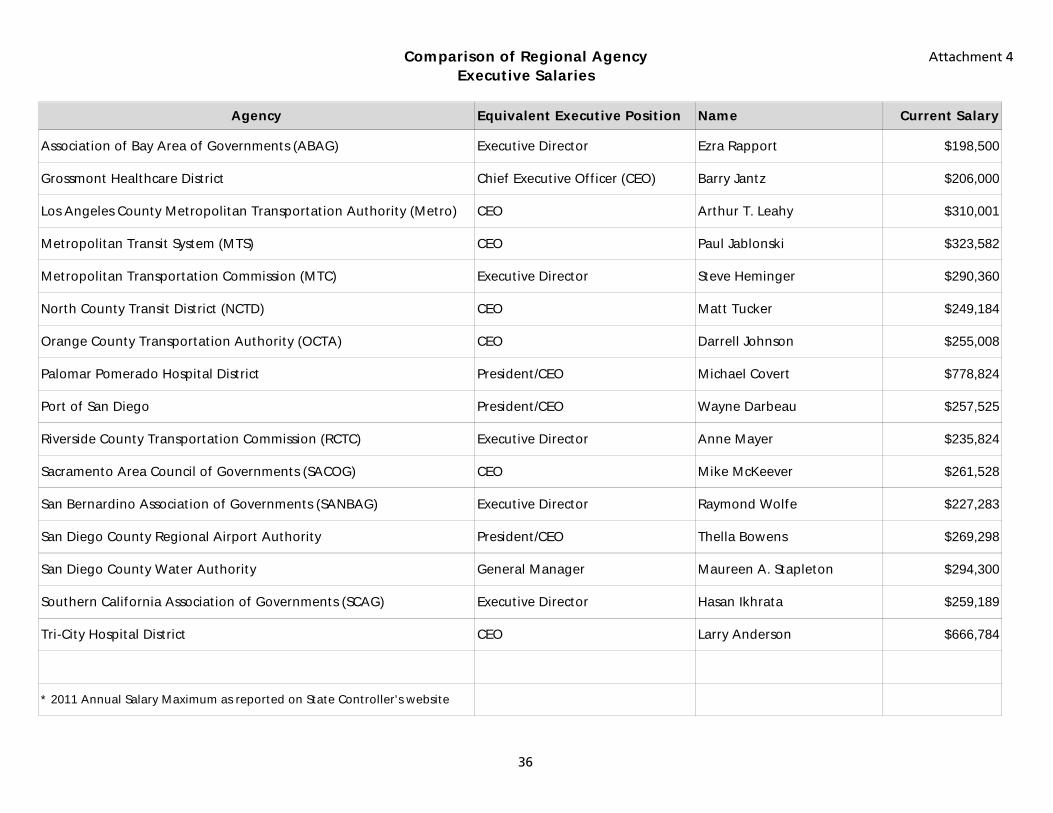
Comparison of Regional AgencyExecutive Salaries
Attachment 4
36
Agency Equivalent Executive Position Name Current Salary
Association of Bay Area of Governments (ABAG) Executive Director Ezra Rapport $198,500
Grossmont Healthcare District Chief Executive Officer (CEO) Barry Jantz $206,000
Los Angeles County Metropolitan Transportation Authority (Metro) CEO Arthur T. Leahy $310,001
Metropolitan Transit System (MTS) CEO Paul Jablonski $323,582
Metropolitan Transportation Commission (MTC) Executive Director Steve Heminger $290,360
North County Transit District (NCTD) CEO Matt Tucker $249,184
Orange County Transportation Authority (OCTA) CEO Darrell Johnson $255,008
Palomar Pomerado Hospital District President/CEO Michael Covert $778,824
Port of San Diego President/CEO Wayne Darbeau $257,525
Riverside County Transportation Commission (RCTC) Executive Director Anne Mayer $235,824
Sacramento Area Council of Governments (SACOG) CEO Mike McKeever $261,528
San Bernardino Association of Governments (SANBAG) Executive Director Raymond Wolfe $227,283
San Diego County Regional Airport Authority President/CEO Thella Bowens $269,298
San Diego County Water Authority General Manager Maureen A. Stapleton $294,300
Southern California Association of Governments (SCAG) Executive Director Hasan Ikhrata $259,189
Tri-City Hospital District CEO Larry Anderson $666,784
* 2011 Annual Salary Maximum as reported on State Controller's website
BOARD OF DIRECTORS AGENDA ITEM NO. 13-09-11
SEPTEMBER 27, 2013 ACTION REQUESTED – INFORMATION
APPOINTMENT OF NOMINATING COMMITTEE File Number 8000100 FOR SANDAG BOARD OFFICERS
Introduction
Article V, Section 3 of the SANDAG Bylaws sets forth the annual nomination and election process for SANDAG Board Officers. The process calls for an application form for the Chair, First Vice Chair, and Second Vice Chair positions to be made available on the SANDAG website in or around July, and for applications to be submitted within 30 days. The following applications for 2014 Board Officer positions were received:
• Chair – Santee Councilmember Jack Dale
• First Vice Chair – Imperial Beach Mayor Jim Janney
• Second Vice Chair – Poway Mayor Don Higginson
In accordance with the Bylaws, each September the SANDAG Chair appoints up to a six-person Nominating Committee that includes representatives from the six subregions. The Nominating Committee is responsible for reviewing the applicants for the Board Officer positions and recommending a slate of nominees to the Board of Directors in or around November. In accordance with the Bylaws, Chairman Jack Dale has appointed the following Nominating Committee:
• National City Mayor Ron Morrison (South County), Nominating Committee Chair
• San Diego Interim Mayor Todd Gloria
• San Diego County Supervisor Bill Horn
• Lemon Grove Mayor Mary Sessom (East County)
• Vista Mayor Judy Ritter (North County Inland)
• Carlsbad Mayor Matt Hall (North County Coastal)
GARY L. GALLEGOS Executive Director
Key Staff Contact: Kim Kawada, (619) 699-6994, [email protected]
Recommendation
The Board of Directors is asked to authorize the Executive Director to conduct a solicitation for transit planning services as detailed herein.
BOARD OF DIRECTORS AGENDA ITEM NO. 13-09-12A SEPTEMBER 27, 2013 ACTION REQUESTED – APPROVE
APPROVAL OF PROFESSIONAL SERVICES SOLICITATION
Introduction
Pursuant to Board direction on June 14, 2013, professional services solicitations valued at $5 million or more require Board of Directors approval.
Solicitation Information
SANDAG staff proposes to solicit services from qualified firms with expertise in a wide variety of transit planning services in order to support various planning and capital improvement efforts included in the FY 2014 Program Budget (see table on following page).
As required by SANDAG Board Policy No. 016: Procurement of Services and federal provisions, an independent cost estimate was prepared by SANDAG resulting in an estimated amount of $9.4 million over a five-year period. Factors that were considered in developing the estimate include historical use of outside transit planning consultants and staff’s knowledge of future SANDAG projects and work program efforts.
The timing and amount of work that will be needed from consulting firms will depend on the anticipated SANDAG planning and construction projects in coming years; therefore, the amount of each contract awarded based on the proposed solicitation would be determined based on the project(s) assigned. Staff anticipates the award of up to five on-call contracts.
The type of work under each of the resulting contracts also would vary depending on the type of project it relates to. The scopes of services that are expected as a result of this procurement are listed below. Proposers would be selected based on their experience and expertise in the following areas as well as their proposed rate.
• Transit Service Evaluation
• Operational Planning, Service Planning Studies, and Short-Range Planning
• Senior and Disabled Transit/Paratransit and Coordination Studies
• Title VI Analysis
• Rural and Tribal Transportation Studies
• Transit Planning Support Services
• Transit and Land Economics
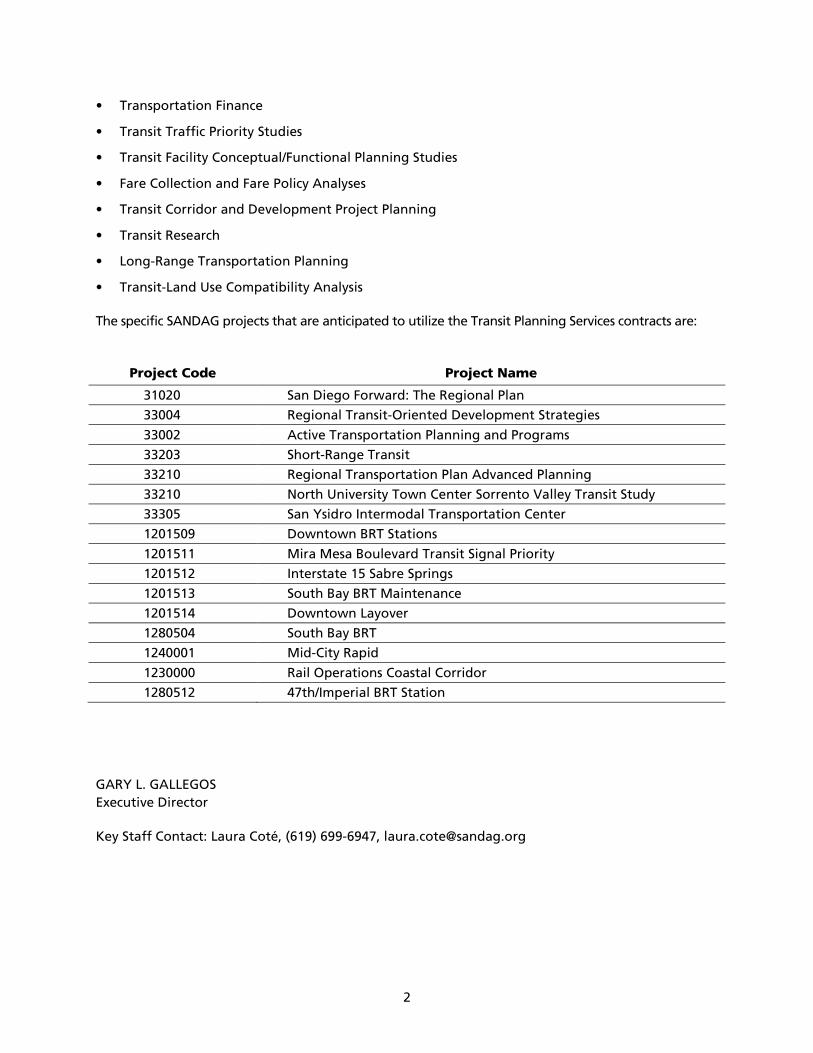
2
• Transportation Finance
• Transit Traffic Priority Studies
• Transit Facility Conceptual/Functional Planning Studies
• Fare Collection and Fare Policy Analyses
• Transit Corridor and Development Project Planning
• Transit Research
• Long-Range Transportation Planning
• Transit-Land Use Compatibility Analysis
The specific SANDAG projects that are anticipated to utilize the Transit Planning Services contracts are:
Project Code
Project Name
31020 San Diego Forward: The Regional Plan
33004 Regional Transit-Oriented Development Strategies
33002 Active Transportation Planning and Programs
33203 Short-Range Transit
33210 Regional Transportation Plan Advanced Planning
33210 North University Town Center Sorrento Valley Transit Study
33305 San Ysidro Intermodal Transportation Center
1201509 Downtown BRT Stations
1201511 Mira Mesa Boulevard Transit Signal Priority
1201512 Interstate 15 Sabre Springs
1201513 South Bay BRT Maintenance
1201514 Downtown Layover
1280504 South Bay BRT
1240001 Mid-City Rapid
1230000 Rail Operations Coastal Corridor
1280512 47th/Imperial BRT Station
GARY L. GALLEGOS Executive Director
Key Staff Contact: Laura Coté, (619) 699-6947, [email protected]
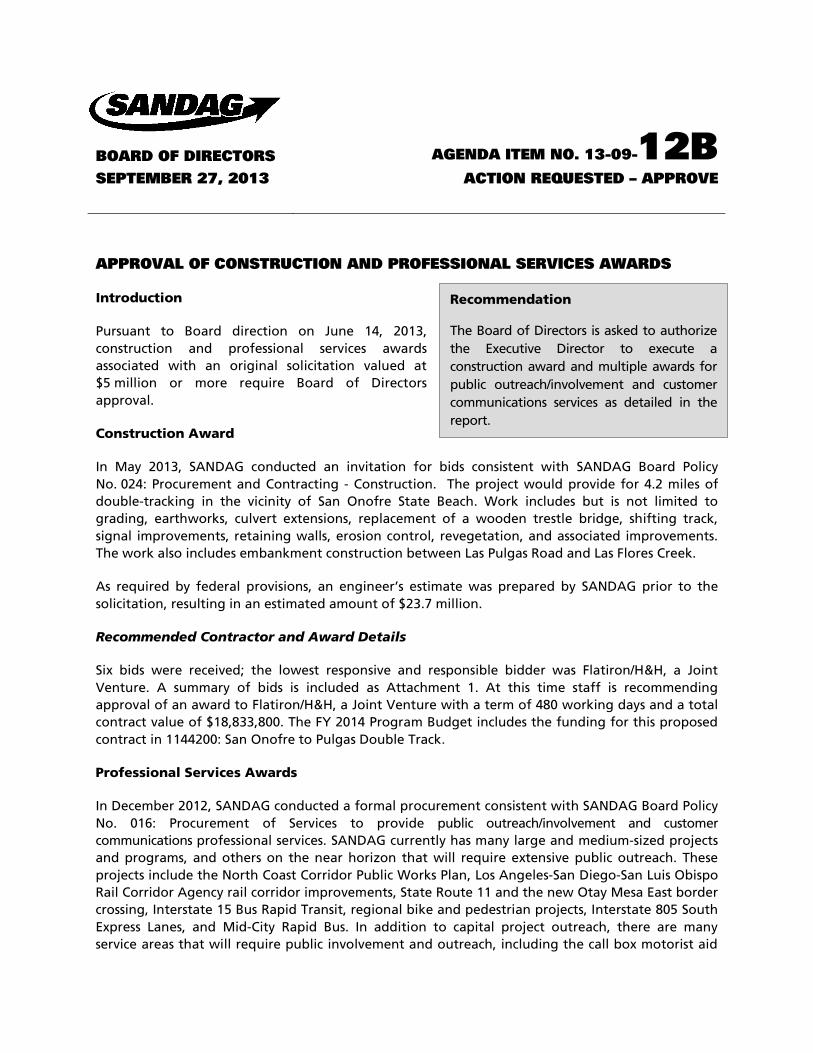
Recommendation
The Board of Directors is asked to authorize the Executive Director to execute a construction award and multiple awards for public outreach/involvement and customer communications services as detailed in the report.
BOARD OF DIRECTORS AGENDA ITEM NO. 13-09-12B
SEPTEMBER 27, 2013 ACTION REQUESTED – APPROVE
APPROVAL OF CONSTRUCTION AND PROFESSIONAL SERVICES AWARDS
Introduction
Pursuant to Board direction on June 14, 2013, construction and professional services awards associated with an original solicitation valued at $5 million or more require Board of Directors approval.
Construction Award
In May 2013, SANDAG conducted an invitation for bids consistent with SANDAG Board Policy No. 024: Procurement and Contracting - Construction. The project would provide for 4.2 miles of double-tracking in the vicinity of San Onofre State Beach. Work includes but is not limited to grading, earthworks, culvert extensions, replacement of a wooden trestle bridge, shifting track, signal improvements, retaining walls, erosion control, revegetation, and associated improvements. The work also includes embankment construction between Las Pulgas Road and Las Flores Creek.
As required by federal provisions, an engineer’s estimate was prepared by SANDAG prior to the solicitation, resulting in an estimated amount of $23.7 million.
Recommended Contractor and Award Details
Six bids were received; the lowest responsive and responsible bidder was Flatiron/H&H, a Joint Venture. A summary of bids is included as Attachment 1. At this time staff is recommending approval of an award to Flatiron/H&H, a Joint Venture with a term of 480 working days and a total contract value of $18,833,800. The FY 2014 Program Budget includes the funding for this proposed contract in 1144200: San Onofre to Pulgas Double Track.
Professional Services Awards
In December 2012, SANDAG conducted a formal procurement consistent with SANDAG Board Policy No. 016: Procurement of Services to provide public outreach/involvement and customer communications professional services. SANDAG currently has many large and medium-sized projects and programs, and others on the near horizon that will require extensive public outreach. These projects include the North Coast Corridor Public Works Plan, Los Angeles-San Diego-San Luis Obispo Rail Corridor Agency rail corridor improvements, State Route 11 and the new Otay Mesa East border crossing, Interstate 15 Bus Rapid Transit, regional bike and pedestrian projects, Interstate 805 South Express Lanes, and Mid-City Rapid Bus. In addition to capital project outreach, there are many service areas that will require public involvement and outreach, including the call box motorist aid
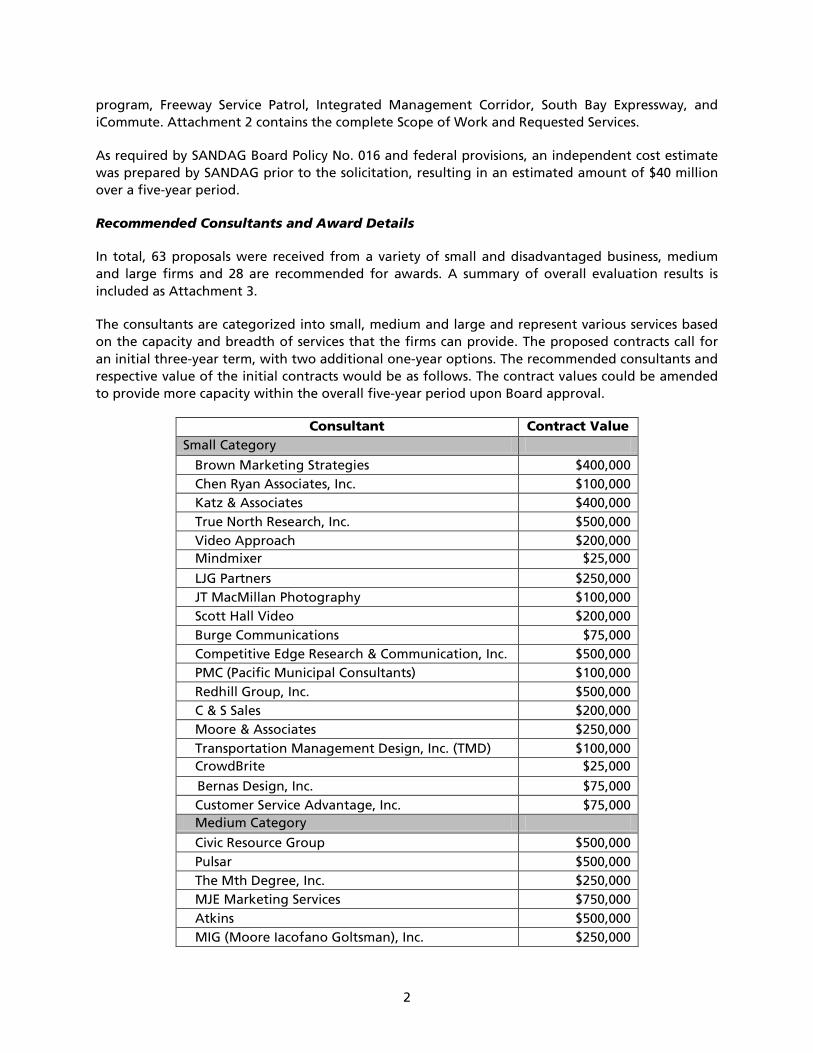
2
program, Freeway Service Patrol, Integrated Management Corridor, South Bay Expressway, and iCommute. Attachment 2 contains the complete Scope of Work and Requested Services.
As required by SANDAG Board Policy No. 016 and federal provisions, an independent cost estimate was prepared by SANDAG prior to the solicitation, resulting in an estimated amount of $40 million over a five-year period.
Recommended Consultants and Award Details
In total, 63 proposals were received from a variety of small and disadvantaged business, medium and large firms and 28 are recommended for awards. A summary of overall evaluation results is included as Attachment 3.
The consultants are categorized into small, medium and large and represent various services based on the capacity and breadth of services that the firms can provide. The proposed contracts call for an initial three-year term, with two additional one-year options. The recommended consultants and respective value of the initial contracts would be as follows. The contract values could be amended to provide more capacity within the overall five-year period upon Board approval.
Consultant Contract Value Small Category
Brown Marketing Strategies $400,000 Chen Ryan Associates, Inc. $100,000 Katz & Associates $400,000 True North Research, Inc. $500,000 Video Approach $200,000 Mindmixer $25,000
LJG Partners $250,000 JT MacMillan Photography $100,000 Scott Hall Video $200,000 Burge Communications $75,000 Competitive Edge Research & Communication, Inc. $500,000 PMC (Pacific Municipal Consultants) $100,000 Redhill Group, Inc. $500,000 C & S Sales $200,000 Moore & Associates $250,000 Transportation Management Design, Inc. (TMD) $100,000 CrowdBrite $25,000
Bernas Design, Inc. $75,000 Customer Service Advantage, Inc. $75,000 Medium Category
Civic Resource Group $500,000 Pulsar $500,000 The Mth Degree, Inc. $250,000 MJE Marketing Services $750,000 Atkins $500,000 MIG (Moore Iacofano Goltsman), Inc. $250,000
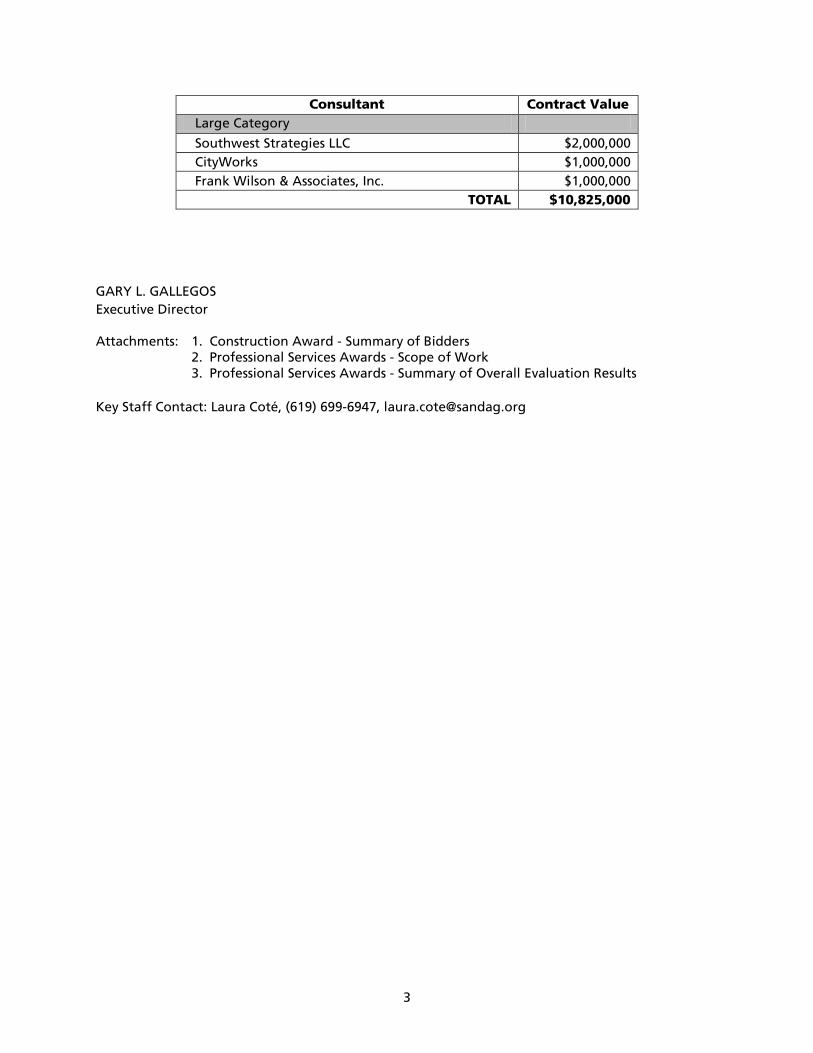
3
Consultant Contract Value Large Category
Southwest Strategies LLC $2,000,000 CityWorks $1,000,000 Frank Wilson & Associates, Inc. $1,000,000
TOTAL $10,825,000
GARY L. GALLEGOS Executive Director
Attachments: 1. Construction Award - Summary of Bidders 2. Professional Services Awards - Scope of Work 3. Professional Services Awards - Summary of Overall Evaluation Results
Key Staff Contact: Laura Coté, (619) 699-6947, [email protected]
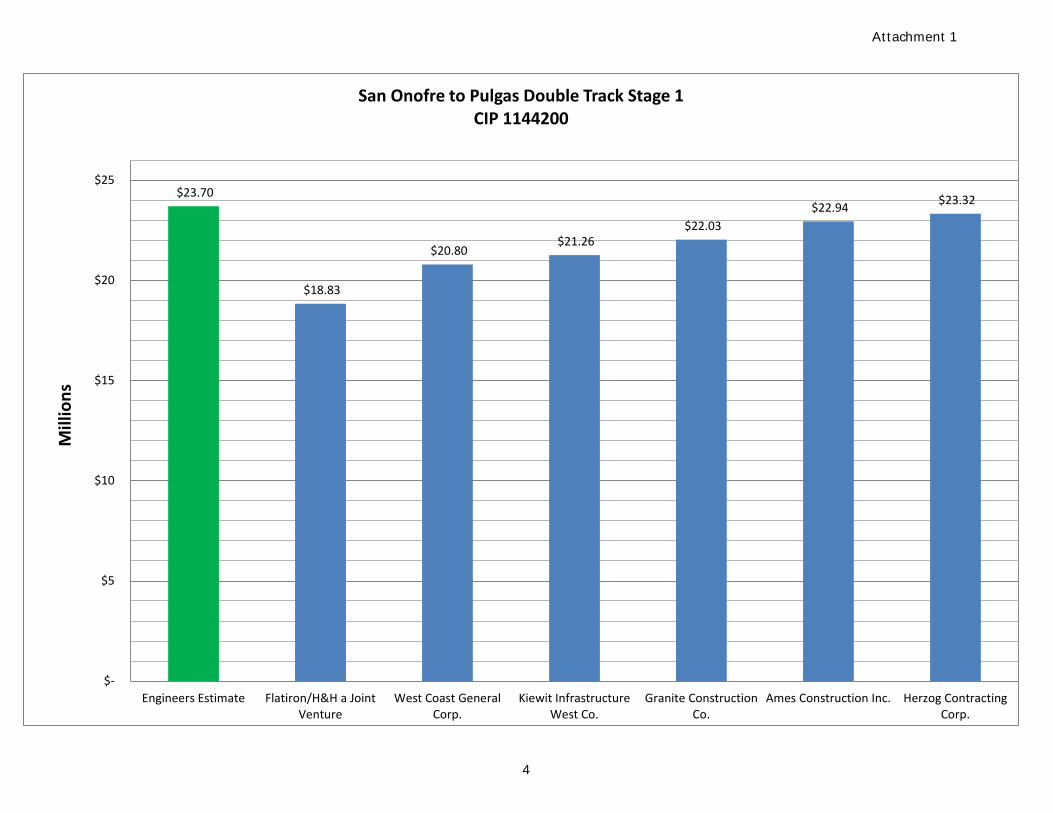
$23.70
$18.83
$20.80 $21.26
$22.03 $22.94 $23.32
$-
$5
$10
$15
$20
$25
Engineers Estimate Flatiron/H&H a JointVenture
West Coast GeneralCorp.
Kiewit InfrastructureWest Co.
Granite ConstructionCo.
Ames Construction Inc. Herzog ContractingCorp.
Mill
ions
San Onofre to Pulgas Double Track Stage 1 CIP 1144200
Attachment 1
4
Attachment 2
5
SCOPE OF WORK
SANDAG is seeking Statements of Qualifications (SOQ) from qualified firms for professional services to develop and implement a variety of marketing, communications, and public outreach efforts. SANDAG intends to award contracts to small, medium, and large firms to provide specific communications services. These efforts will support a number of SANDAG projects as needed including, but not limited to, capital highway, rail and transit projects in design, environmental, and/or construction, including the TransNet program; bike projects, planning programs including the regional plan; Active Transportation and Transportation Demand Management programs; consumer-facing marketing programs including Compass Card, FasTrak, I-15 Express Lanes, iCommute and the South Bay Expressway, and other SANDAG programs and projects.
All of the below listed services shall be provided by the successful Consultants on an On-Call, As-Needed basis as requested by SANDAG during the term of the Agreement.
SCOPE OF REQUESTED SERVICES
1. PROJECT ADMINISTRATION
The consultant shall communicate and coordinate work and progress on project(s) with the SANDAG project/task manager. Depending on the project, the consultant shall establish a tracking and reporting system that provides the basis against which the project status and progress will be measured and reported. The tracking system shall include, but not be limited to, a status report and a project and deliverables schedule. The report/invoice format shall be agreed upon with the SANDAG project manager. However, invoices must be written in English and charged in U.S. dollars. In addition, sound strategies for measuring and delivering return on investments must be demonstrated and established. All deliverables shall be submitted in electronic file for editing and review. Final products shall be submitted in electronic format such as Microsoft Word or Adobe PDF. 2. DEVELOP STRATEGIC AND CREATIVE MARKETING COMMUNICATIONS PLANS
The consultant will work in coordination with SANDAG staff to write and develop strategic and creative marketing communications plans for SANDAG programs and projects including, but not limited to, TransNet capital projects such as freeway/highway corridors, Express Lanes projects, South Bay Expressway, border projects and regional bicycle facilities; branding and promotional efforts for Transportation Demand Management programs (such as iCommute Bike to Work Day, Rideshare Week, Diamond Awards, and SchoolPool); as well as Active Transportation programs, 511 and FasTrak; and transit programs and services such as Dump the Pump and new Bus Rapid Transit Services. These plans could include:
• market analysis; • market or customer research (quantitative and/or qualitative); • development strategies for stakeholder/interested parties lists (including community-based
organizations); • communications audits;

6
• best practices research; • marketing communications strategies and campaigns; • promotional strategies and tactics; • product/service positioning strategies; • social media tactics; • online marketing strategies and content; • sponsorship development; • advertising and media buying/placement; • sales support communications; • branding and identity development; • graphic design strategies and implementation for collateral materials; • special and promotional event planning; • printing and direct mail strategies and services; • social equity and environmental justice marketing strategies; • partnership and collaboration strategies; • bi-national coordination and outreach; • implementation timelines; and • strategies for measuring the return on investment
3. IMPLEMENT MARKETING/COMMUNICATIONS PLANS
The consultant will coordinate with SANDAG staff to implement adopted marketing communications plans to support projects or programs. Activities may include the implementation of strategies outlined above in Section 2.
4. DEVELOP AND IMPLEMENT PUBLIC OUTREACH AND INVOLVEMENT PROGRAMS
Consultant will work in coordination with SANDAG staff to develop and implement public outreach and involvement programs to support one or more projects including, but not limited to, capital highway, rail, transit and bicycle projects in design, environmental, right of way acquisition, and/or construction, including the TransNet program; planning programs including the regional plan; Active Transportation and Transportation Demand Management programs; SANDAG Public Participation Plan; and other initiatives. Creative ideas are desired to increase public participation and achieve SANDAG social equity and environmental justice goals. It is anticipated that the consultant may assist in the development of Public Involvement Plans, outreach strategies and strategic message development. Public information collateral items such as newsletters, fact sheets, meeting notices and invitations, PowerPoint presentations, presentation boards, display ads, social media and Web content, video presentations, and media materials also may be needed. SANDAG may require assistance with drafting the content and graphic design of collateral items. However, SANDAG shall approve draft and final layouts, graphic/visual presentations, and proofs for offset printing, electronic distribution or Web postings. The format for graphic presentation of materials may include computer animations, charts, tables, aerial photo images, maps, videos (including time lapse), montages, and/or renderings. SANDAG may require assistance with these activities. These materials shall be prepared with software and file formats that can be used by SANDAG.
7
The consultant will provide strategic counsel and coordination for these public outreach and involvement efforts and could be asked to provide any or all of the following:
• Strategic communications planning and implementation, including the development of project-specific public information plans that define a strategic, creative, and equitable approach to public outreach and engagement; project identity development and messaging; participation in project team meetings; and maintenance of a Record of Public Involvement to document and summarize all public participation throughout the program;
• Public information program elements including design and/or content for Web-based media, social media, e-newsletter or notices, stakeholder database development and maintenance, and support for SANDAG media relations efforts;
• Planning and coordination of public meetings or events to inform the public about project elements and gain input from a diverse range of stakeholders. Consultant may be asked to develop supporting collateral materials, coordinate meeting logistics, coordinate with facilitator or provide facilitation of meeting(s), capture any required demographic information, and develop a final report that summarizes the results of the outreach and the feedback generated;
• Public outreach activities including coordinating public information presentations to targeted stakeholder groups; coordinating presentation materials, as needed, developing presentations, and documenting public input;
• Development of project collateral materials including, but not limited to, project fact sheets, newsletters, brochures, presentation boards, FAQs, maps, videos, and visual simulations;
• Construction outreach tactics including project-specific public information staffing, signage, telephone hotlines, Web site updates, media support, collateral materials, and public presentations; and
• As needed public outreach services including, but not limited to, translation services, procurement of court reporting services, special event management and coordination, and crisis communications planning.
5. PROVIDE GRAPHIC DESIGN, PRINTING, WEBSITE DESIGN, SIGNAGE/EXHIBIT DESIGN
AND/OR FABRICATION, VISUAL SIMULATIONS, VIDEO PRODUCTIONS, PHOTOGRAPHIC SERVICES, NEW MEDIA, AND/OR OTHER PRODUCTION SERVICES
The consultant will work in coordination with SANDAG to develop one or more of the following:
• Graphic design and production of advertising, marketing, and other collateral materials to support SANDAG projects and programs. These materials may include brochures, newsletters, graphics, fact sheets, print and/or online advertisements, promotional items, and other collateral.
• Signage including the design, fabrication, and installation of construction project and highway signage, custom exhibit/trade show exhibits, and/or procurement of promotional items such as mugs, pens, and other promotional items, as necessary.
• Video production to develop both cost-effective videos, as well as high-end, multi-media presentations for use on a variety of platforms including the Web and PowerPoint presentations. The ability to produce animated PowerPoint presentations is also desired. These efforts will require production, editing, casting, scriptwriting, digital animation, and other expertise.
• Digital video/computer simulations to depict transportation and/or smart growth projects, GIS based maps, and other simulations to support project outreach and marketing efforts.
• Photographic services in support of targeted marketing campaigns and public outreach campaigns.
8
• New media efforts for various projects such as social media, blogs, and other Web- or electronic-based outreach.
Other areas of expertise may include direct mail strategies and electronic marketing; printing of marketing and other collateral materials as well as signage, banners, and the like, use of Web-based public engagement tools; photography, experience with Web site and/or application development; HTML programming; and multiple language translations of copy for publication. 6. PROVIDE SPECIAL EVENT PLANNING AND SUPPORT
The consultant will assist with planning, organizing, or coordinating one or more events including, but not limited to: groundbreaking and grand opening ceremonies; public meetings or workshops; community events; contests, and other special events. The consultant will be responsible for activities including, but not limited to, researching, recommending, and securing location(s), coordinating meeting logistics to include room set up, materials preparation, providing staffing assistance at event, and assisting with other event activities including securing sponsorship development, site coordination, and vendor participation. 7. COPYWRITING/EDITING SERVICES The consultant will provide copywriting /editing services to support SANDAG projects and programs. Professional writing style and skills in editing written material to correct errors in grammar, spelling, syntax, and usage are required. Consultant should be familiar with SANDAG style and is expected to produce copy that is clear, concise, and has been edited for consistency with the SANDAG Style Guide. The consultant may be asked to develop original content, update existing content, or edit content developed by SANDAG staff for a variety of purposes, which may include: reports, white papers, brochures; newsletters; fact sheets; Web site content; e-mail; direct mail; formal letters; invitations; advertisements; radio promotions; PowerPoint presentations; speaking points; press releases; social media missives; program scripts and run of show, among other purposes. The consultant should be able to adapt writing styles to fit a variety of audiences, keeping tone and familiarity/formality consistent within current SANDAG projects and programs. 8. SOCIAL MEDIA SERVICES The consultant will provide social media strategies including game mechanics (when relevant) and content to help SANDAG to reach out and to build relationships with stakeholders, partner agencies, other government agencies, regulators, program partners, media members, and the general public. Social media activities will help SANDAG to develop and maintain relationships, promote awareness, create brand awareness, build trust, deliver key messages, and gain stakeholder insights. Social media strategies may be deployed to support planning projects, capital design or construction projects, and consumer programs and events such as iCommute, 511, FasTrak, and Bike to Work Day. Social media activities may be developed for platforms including, but not limited to, Facebook, Twitter, Pinterest, YouTube, Flickr, and location services such as Foursquare, Facebook Places, Google Latitude, and gamification services such as Badgeville, Bunchball and blogs. Game mechanics, with elements such as challenges, leader boards, badges, points, rewards, incentives can be used to invigorate SANDAG’s consumer programs; connect with end-users and reward them for their loyalty, as well as provide a means to quantify outcomes. Activities will be integrated with existing agency Web sites including SANDAG.org, KeepSanDiegoMoving.com, and iCommute, as well as partner agency sites.
9
9. PROVIDE MEDIA BUYING, SPONSORSHIP, AND/OR ADVERTISING SERVICES
The consultant will provide media recommendations and buying services for print, broadcast, online and outdoor services to name a few for SANDAG projects and initiatives. The consultant also may be contracted to provide advertising, sponsorship, and/or account management services to secure sponsorship and advertisers to offset costs for SANDAG programs such as the Regional Bike Map, Rideshare Week/Month, SchoolPool, Compass Card, Bike to Work Day, Diamond Awards, and other events or programs. SANDAG would require expertise in advertising sales, sponsorship, and account management services to develop and execute sponsorship and/or media partnership programs, and identify and contact potential sponsors or partners on behalf of SANDAG, possibly on an annual basis. 10. PROVIDE SURVEY, FOCUS GROUP, AND OTHER SURVEY RESEARCH SERVICES
The consultant will assist with developing and conducting quantitative and/or qualitative research including public opinion polling, phone, in-person, and online surveys, focus groups, stakeholder interviews, writing summary reports, and other research services. Expertise will be required in survey development, implementation, and focus group facilitation. 11. PROVIDE FACILITATION SERVICES AND FACILITATOR TRAINING The consultant will provide professional facilitation services to SANDAG, as needed, to support public meetings, small group sessions, and working group meetings for planning and capital programs. The consultant will also provide training to equip and guide SANDAG staff members in the role of facilitator on an as needed basis. Training should include structured, formal (but flexible) techniques for guiding and directing the work of people in workshops and meetings. The training should include following good meeting practices: timekeeping, following an agreed-upon agenda, and keeping a clear record of topics discussed. In addition, the consultant should train staff on a variety of listening skills including: ability to paraphrase; stack a conversation; draw people out; consensus-building; balance participation; and make space for more reticent group members. The consultant also will be expected to report to the Communications Department and the SANDAG Board or its committees as necessary regarding assigned matters. This could include preparation of PowerPoint presentations and Board reports, attendance at closed and open sessions, and preparation meetings with SANDAG staff. 12. MEDIA AND PRESENTATION TRAINING The consultant will provide professional training services to prepare SANDAG management and project staff to effectively conduct media interviews and presentations. The consultant will train staff members to present in a variety of settings and formats including, but not limited to: internal and external speeches, large and small group presentations, delivery of PowerPoint presentations, delivery of live or taped broadcasts, print or phone media interviews, radio and television interviews, one-on-one media interactions, and press conferences.
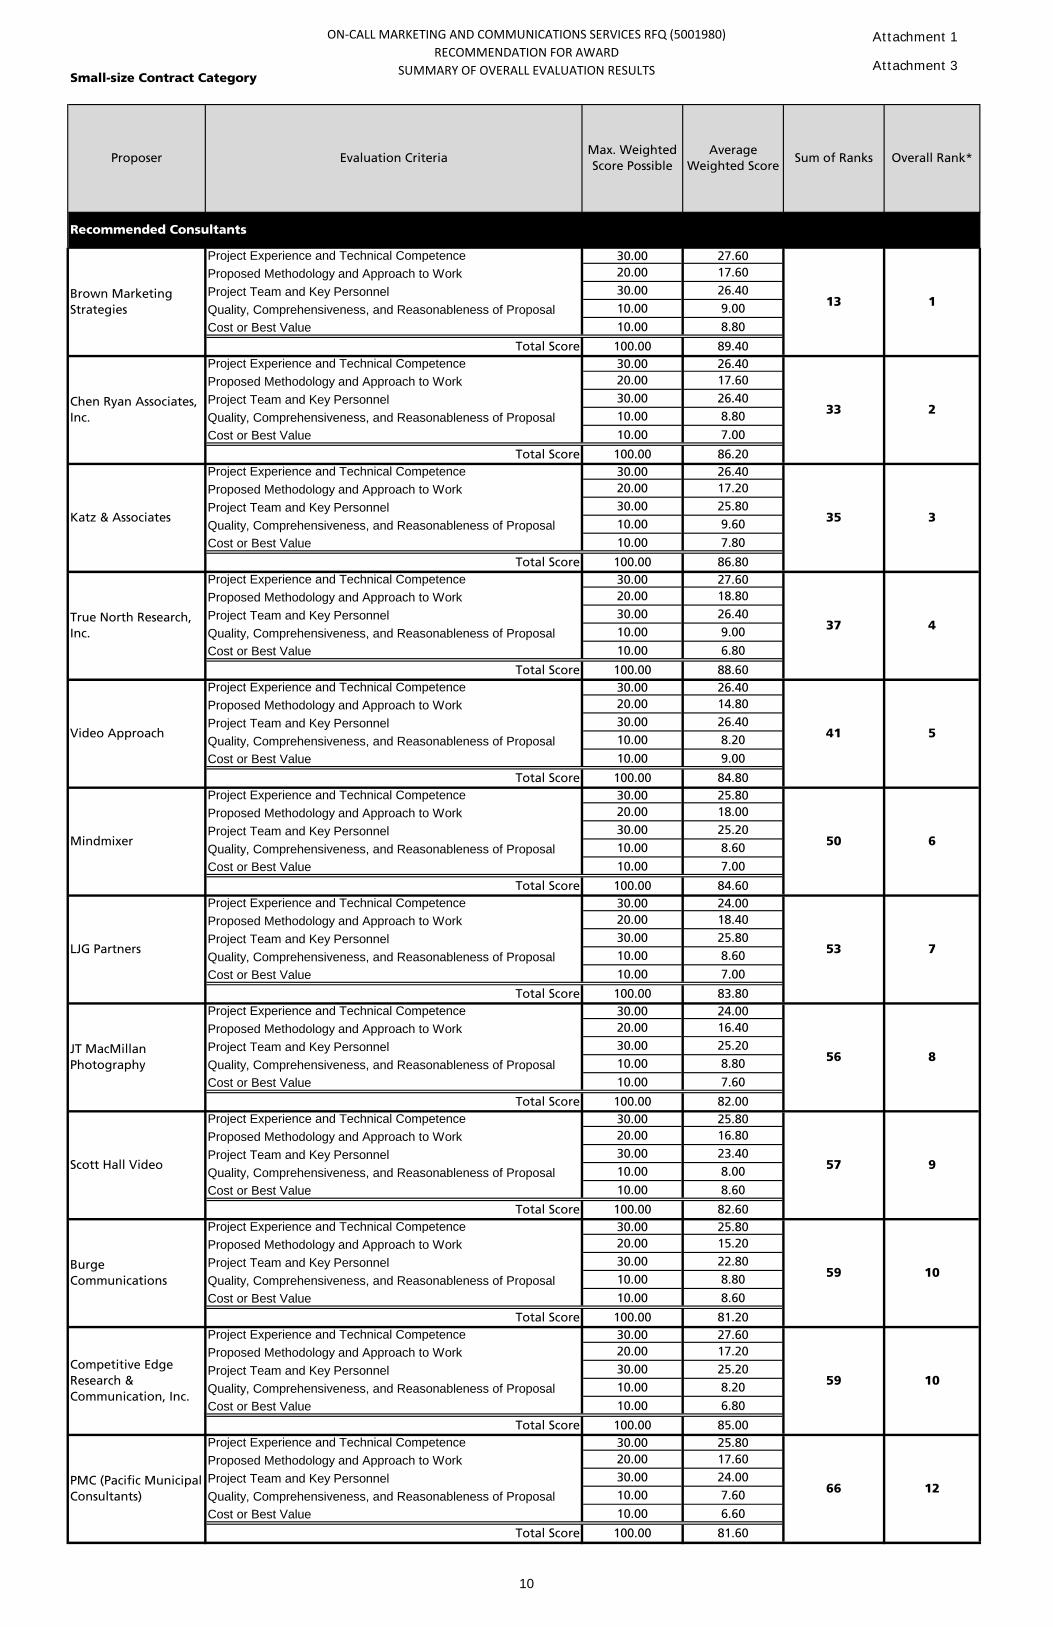
ON-CALL MARKETING AND COMMUNICATIONS SERVICES RFQ (5001980)RECOMMENDATION FOR AWARD
SUMMARY OF OVERALL EVALUATION RESULTSSmall-size Contract Category
Project Experience and Technical Competence 30.00 27.60Proposed Methodology and Approach to Work 20.00 17.60
Project Team and Key Personnel 30.00 26.40
Quality, Comprehensiveness, and Reasonableness of Proposal 10.00 9.00
Cost or Best Value 10.00 8.80
Total Score 100.00 89.40Project Experience and Technical Competence 30.00 26.40Proposed Methodology and Approach to Work 20.00 17.60
Project Team and Key Personnel 30.00 26.40
Quality, Comprehensiveness, and Reasonableness of Proposal 10.00 8.80
Cost or Best Value 10.00 7.00
Total Score 100.00 86.20Project Experience and Technical Competence 30.00 26.40Proposed Methodology and Approach to Work 20.00 17.20
Project Team and Key Personnel 30.00 25.80
Quality, Comprehensiveness, and Reasonableness of Proposal 10.00 9.60
Cost or Best Value 10.00 7.80
Total Score 100.00 86.80Project Experience and Technical Competence 30.00 27.60Proposed Methodology and Approach to Work 20.00 18.80
Project Team and Key Personnel 30.00 26.40
Quality, Comprehensiveness, and Reasonableness of Proposal 10.00 9.00
Cost or Best Value 10.00 6.80
Total Score 100.00 88.60Project Experience and Technical Competence 30.00 26.40Proposed Methodology and Approach to Work 20.00 14.80
Project Team and Key Personnel 30.00 26.40
Quality, Comprehensiveness, and Reasonableness of Proposal 10.00 8.20
Cost or Best Value 10.00 9.00
Total Score 100.00 84.80Project Experience and Technical Competence 30.00 25.80Proposed Methodology and Approach to Work 20.00 18.00
Project Team and Key Personnel 30.00 25.20
Quality, Comprehensiveness, and Reasonableness of Proposal 10.00 8.60
Cost or Best Value 10.00 7.00
Total Score 100.00 84.60Project Experience and Technical Competence 30.00 24.00Proposed Methodology and Approach to Work 20.00 18.40
Project Team and Key Personnel 30.00 25.80
Quality, Comprehensiveness, and Reasonableness of Proposal 10.00 8.60
Cost or Best Value 10.00 7.00
Total Score 100.00 83.80Project Experience and Technical Competence 30.00 24.00Proposed Methodology and Approach to Work 20.00 16.40
Project Team and Key Personnel 30.00 25.20
Quality, Comprehensiveness, and Reasonableness of Proposal 10.00 8.80
Cost or Best Value 10.00 7.60
Total Score 100.00 82.00Project Experience and Technical Competence 30.00 25.80Proposed Methodology and Approach to Work 20.00 16.80
Project Team and Key Personnel 30.00 23.40
Quality, Comprehensiveness, and Reasonableness of Proposal 10.00 8.00
Cost or Best Value 10.00 8.60
Total Score 100.00 82.60Project Experience and Technical Competence 30.00 25.80Proposed Methodology and Approach to Work 20.00 15.20
Project Team and Key Personnel 30.00 22.80
Quality, Comprehensiveness, and Reasonableness of Proposal 10.00 8.80
Cost or Best Value 10.00 8.60
Total Score 100.00 81.20Project Experience and Technical Competence 30.00 27.60Proposed Methodology and Approach to Work 20.00 17.20
Project Team and Key Personnel 30.00 25.20
Quality, Comprehensiveness, and Reasonableness of Proposal 10.00 8.20
Cost or Best Value 10.00 6.80
Total Score 100.00 85.00Project Experience and Technical Competence 30.00 25.80Proposed Methodology and Approach to Work 20.00 17.60
Project Team and Key Personnel 30.00 24.00
Quality, Comprehensiveness, and Reasonableness of Proposal 10.00 7.60
Cost or Best Value 10.00 6.60
Total Score 100.00 81.60
Recommended Consultants
Brown Marketing Strategies
JT MacMillan Photography
56
13
33
Average Weighted Score
35
Overall Rank*Proposer Evaluation CriteriaMax. Weighted Score Possible
Sum of Ranks
57 9
Competitive Edge Research & Communication, Inc.
1
Burge Communications
59 10
53 7LJG Partners
2
True North Research, Inc.
37 4
Chen Ryan Associates, Inc.
Katz & Associates 3
8
Scott Hall Video
Mindmixer 50 6
59 10
66 12PMC (Pacific Municipal Consultants)
41 5Video Approach
Attachment 1
10
Attachment 3
mmo
Rectangle
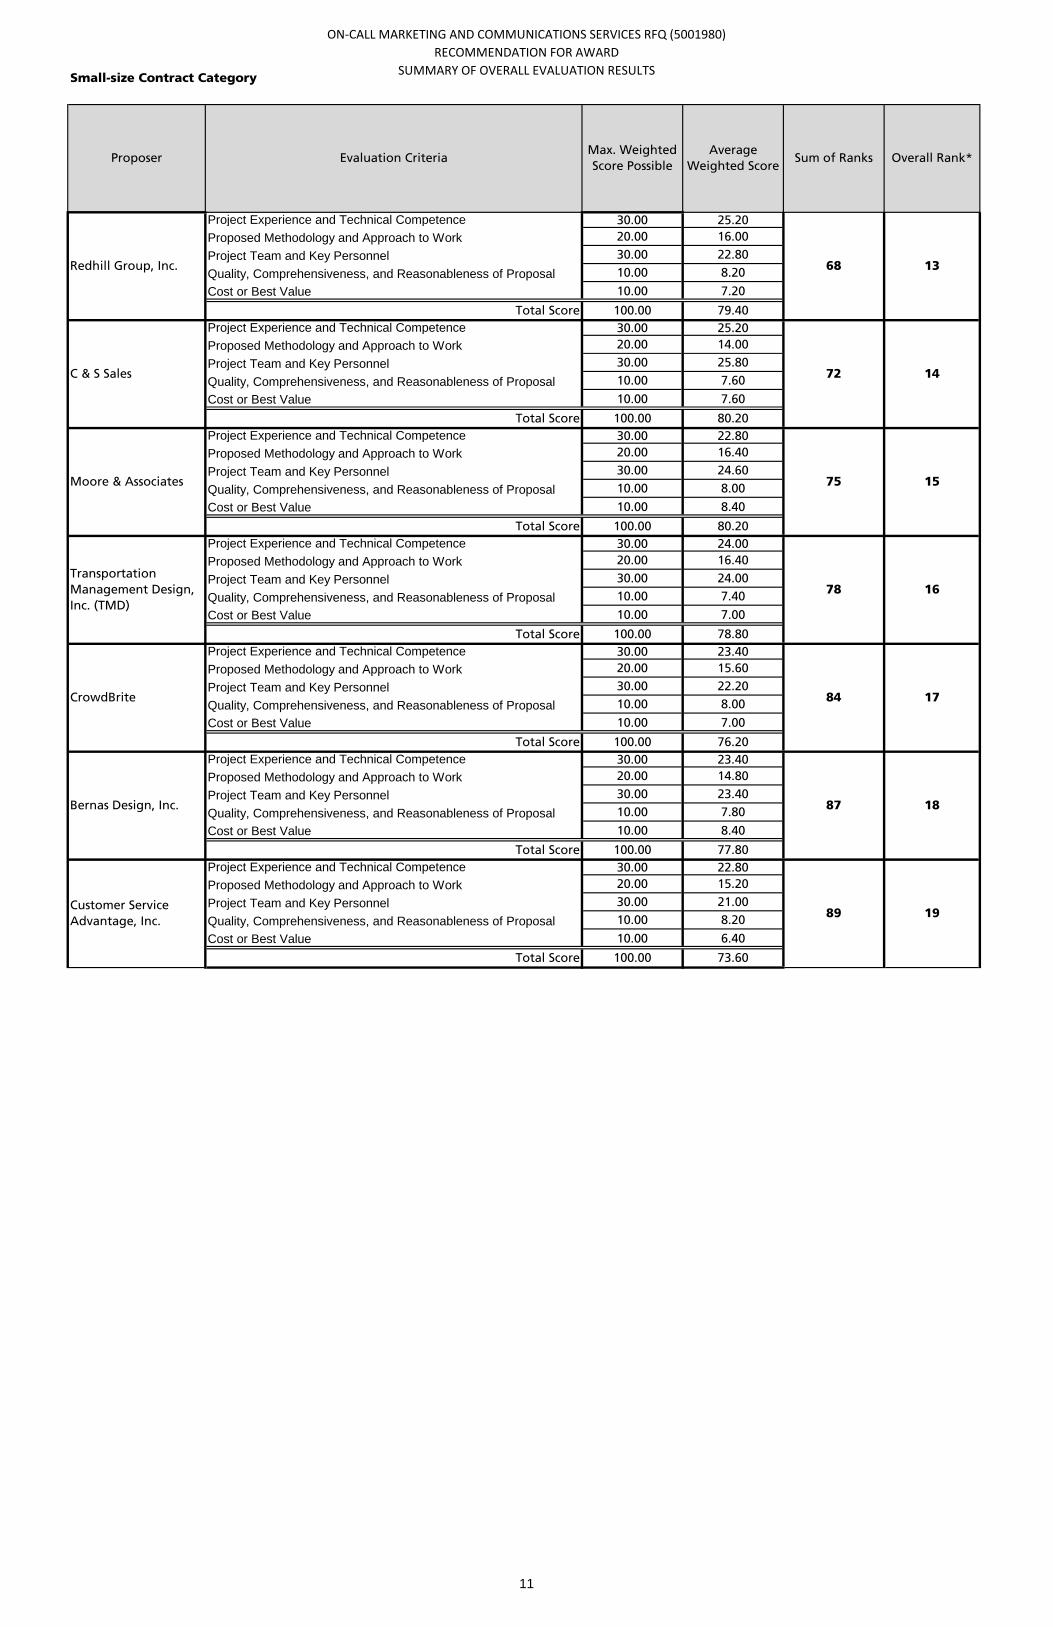
ON-CALL MARKETING AND COMMUNICATIONS SERVICES RFQ (5001980)RECOMMENDATION FOR AWARD
SUMMARY OF OVERALL EVALUATION RESULTSSmall-size Contract Category
Average Weighted Score
Overall Rank*Proposer Evaluation CriteriaMax. Weighted Score Possible
Sum of Ranks
Project Experience and Technical Competence 30.00 25.20Proposed Methodology and Approach to Work 20.00 16.00
Project Team and Key Personnel 30.00 22.80
Quality, Comprehensiveness, and Reasonableness of Proposal 10.00 8.20
Cost or Best Value 10.00 7.20
Total Score 100.00 79.40Project Experience and Technical Competence 30.00 25.20Proposed Methodology and Approach to Work 20.00 14.00
Project Team and Key Personnel 30.00 25.80
Quality, Comprehensiveness, and Reasonableness of Proposal 10.00 7.60
Cost or Best Value 10.00 7.60
Total Score 100.00 80.20Project Experience and Technical Competence 30.00 22.80Proposed Methodology and Approach to Work 20.00 16.40
Project Team and Key Personnel 30.00 24.60
Quality, Comprehensiveness, and Reasonableness of Proposal 10.00 8.00
Cost or Best Value 10.00 8.40
Total Score 100.00 80.20Project Experience and Technical Competence 30.00 24.00Proposed Methodology and Approach to Work 20.00 16.40
Project Team and Key Personnel 30.00 24.00
Quality, Comprehensiveness, and Reasonableness of Proposal 10.00 7.40
Cost or Best Value 10.00 7.00
Total Score 100.00 78.80Project Experience and Technical Competence 30.00 23.40Proposed Methodology and Approach to Work 20.00 15.60
Project Team and Key Personnel 30.00 22.20
Quality, Comprehensiveness, and Reasonableness of Proposal 10.00 8.00
Cost or Best Value 10.00 7.00
Total Score 100.00 76.20Project Experience and Technical Competence 30.00 23.40Proposed Methodology and Approach to Work 20.00 14.80
Project Team and Key Personnel 30.00 23.40
Quality, Comprehensiveness, and Reasonableness of Proposal 10.00 7.80
Cost or Best Value 10.00 8.40
Total Score 100.00 77.80Project Experience and Technical Competence 30.00 22.80Proposed Methodology and Approach to Work 20.00 15.20
Project Team and Key Personnel 30.00 21.00
Quality, Comprehensiveness, and Reasonableness of Proposal 10.00 8.20
Cost or Best Value 10.00 6.40
Total Score 100.00 73.60
89
Moore & Associates 75 15
Customer Service Advantage, Inc.
87Bernas Design, Inc.
16
13
C & S Sales
78
68
Transportation Management Design, Inc. (TMD)
18
Redhill Group, Inc.
84 17
19
72 14
CrowdBrite
11
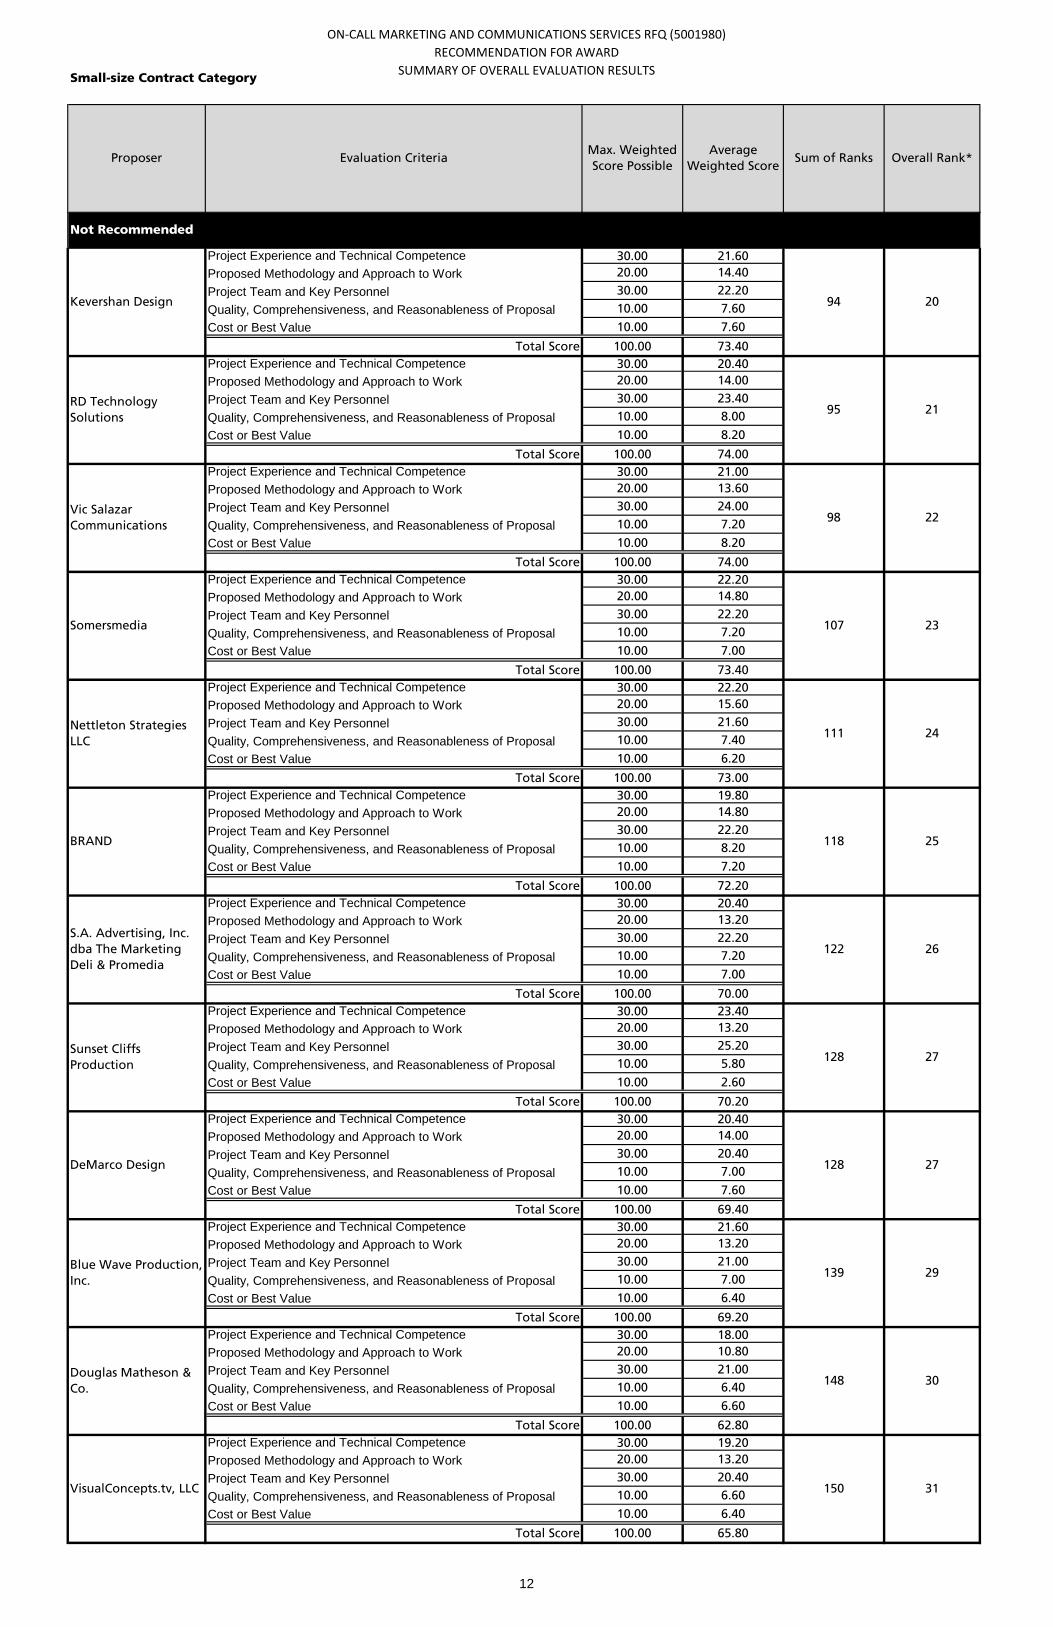
ON-CALL MARKETING AND COMMUNICATIONS SERVICES RFQ (5001980)RECOMMENDATION FOR AWARD
SUMMARY OF OVERALL EVALUATION RESULTSSmall-size Contract Category
Average Weighted Score
Overall Rank*Proposer Evaluation CriteriaMax. Weighted Score Possible
Sum of Ranks
Project Experience and Technical Competence 30.00 21.60Proposed Methodology and Approach to Work 20.00 14.40
Project Team and Key Personnel 30.00 22.20
Quality, Comprehensiveness, and Reasonableness of Proposal 10.00 7.60
Cost or Best Value 10.00 7.60
Total Score 100.00 73.40Project Experience and Technical Competence 30.00 20.40Proposed Methodology and Approach to Work 20.00 14.00
Project Team and Key Personnel 30.00 23.40
Quality, Comprehensiveness, and Reasonableness of Proposal 10.00 8.00
Cost or Best Value 10.00 8.20
Total Score 100.00 74.00Project Experience and Technical Competence 30.00 21.00Proposed Methodology and Approach to Work 20.00 13.60
Project Team and Key Personnel 30.00 24.00
Quality, Comprehensiveness, and Reasonableness of Proposal 10.00 7.20
Cost or Best Value 10.00 8.20
Total Score 100.00 74.00Project Experience and Technical Competence 30.00 22.20Proposed Methodology and Approach to Work 20.00 14.80
Project Team and Key Personnel 30.00 22.20
Quality, Comprehensiveness, and Reasonableness of Proposal 10.00 7.20
Cost or Best Value 10.00 7.00
Total Score 100.00 73.40Project Experience and Technical Competence 30.00 22.20Proposed Methodology and Approach to Work 20.00 15.60
Project Team and Key Personnel 30.00 21.60
Quality, Comprehensiveness, and Reasonableness of Proposal 10.00 7.40
Cost or Best Value 10.00 6.20
Total Score 100.00 73.00Project Experience and Technical Competence 30.00 19.80Proposed Methodology and Approach to Work 20.00 14.80
Project Team and Key Personnel 30.00 22.20
Quality, Comprehensiveness, and Reasonableness of Proposal 10.00 8.20
Cost or Best Value 10.00 7.20
Total Score 100.00 72.20Project Experience and Technical Competence 30.00 20.40Proposed Methodology and Approach to Work 20.00 13.20
Project Team and Key Personnel 30.00 22.20
Quality, Comprehensiveness, and Reasonableness of Proposal 10.00 7.20
Cost or Best Value 10.00 7.00
Total Score 100.00 70.00Project Experience and Technical Competence 30.00 23.40Proposed Methodology and Approach to Work 20.00 13.20
Project Team and Key Personnel 30.00 25.20
Quality, Comprehensiveness, and Reasonableness of Proposal 10.00 5.80
Cost or Best Value 10.00 2.60
Total Score 100.00 70.20Project Experience and Technical Competence 30.00 20.40Proposed Methodology and Approach to Work 20.00 14.00
Project Team and Key Personnel 30.00 20.40
Quality, Comprehensiveness, and Reasonableness of Proposal 10.00 7.00
Cost or Best Value 10.00 7.60
Total Score 100.00 69.40Project Experience and Technical Competence 30.00 21.60Proposed Methodology and Approach to Work 20.00 13.20
Project Team and Key Personnel 30.00 21.00
Quality, Comprehensiveness, and Reasonableness of Proposal 10.00 7.00
Cost or Best Value 10.00 6.40
Total Score 100.00 69.20Project Experience and Technical Competence 30.00 18.00Proposed Methodology and Approach to Work 20.00 10.80
Project Team and Key Personnel 30.00 21.00
Quality, Comprehensiveness, and Reasonableness of Proposal 10.00 6.40
Cost or Best Value 10.00 6.60
Total Score 100.00 62.80Project Experience and Technical Competence 30.00 19.20Proposed Methodology and Approach to Work 20.00 13.20
Project Team and Key Personnel 30.00 20.40
Quality, Comprehensiveness, and Reasonableness of Proposal 10.00 6.60
Cost or Best Value 10.00 6.40
Total Score 100.00 65.80
Not Recommended
118
98
30
95 21
29
111 24
Douglas Matheson & Co.
148
Blue Wave Production, Inc.
139
Nettleton Strategies LLC
94 20Kevershan Design
VisualConcepts.tv, LLC 150 31
22Vic Salazar Communications
S.A. Advertising, Inc. dba The Marketing Deli & Promedia
DeMarco Design
RD Technology Solutions
Sunset Cliffs Production
128 27
128 27
Somersmedia 107 23
25
122 26
BRAND
12
ON-CALL MARKETING AND COMMUNICATIONS SERVICES RFQ (5001980)RECOMMENDATION FOR AWARD
SUMMARY OF OVERALL EVALUATION RESULTSSmall-size Contract Category
Average Weighted Score
Overall Rank*Proposer Evaluation CriteriaMax. Weighted Score Possible
Sum of Ranks
Project Experience and Technical Competence 30.00 19.80Proposed Methodology and Approach to Work 20.00 13.60
Project Team and Key Personnel 30.00 21.00
Quality, Comprehensiveness, and Reasonableness of Proposal 10.00 6.80
Cost or Best Value 10.00 5.40
Total Score 100.00 66.60Project Experience and Technical Competence 30.00 20.40Proposed Methodology and Approach to Work 20.00 11.20
Project Team and Key Personnel 30.00 19.80
Quality, Comprehensiveness, and Reasonableness of Proposal 10.00 6.00
Cost or Best Value 10.00 8.00
Total Score 100.00 65.40Project Experience and Technical Competence 30.00 19.20Proposed Methodology and Approach to Work 20.00 10.40
Project Team and Key Personnel 30.00 20.40
Quality, Comprehensiveness, and Reasonableness of Proposal 10.00 5.60
Cost or Best Value 10.00 5.40
Total Score 100.00 61.00Project Experience and Technical Competence 30.00 19.20Proposed Methodology and Approach to Work 20.00 11.20
Project Team and Key Personnel 30.00 17.40
Quality, Comprehensiveness, and Reasonableness of Proposal 10.00 5.00
Cost or Best Value 10.00 7.00
Total Score 100.00 59.80Project Experience and Technical Competence 30.00 19.80Proposed Methodology and Approach to Work 20.00 11.20
Project Team and Key Personnel 30.00 18.60
Quality, Comprehensiveness, and Reasonableness of Proposal 10.00 6.60
Cost or Best Value 10.00 6.60
Total Score 100.00 62.80Project Experience and Technical Competence 30.00 18.60Proposed Methodology and Approach to Work 20.00 12.40
Project Team and Key Personnel 30.00 19.20
Quality, Comprehensiveness, and Reasonableness of Proposal 10.00 6.00
Cost or Best Value 10.00 6.20
Total Score 100.00 62.40Project Experience and Technical Competence 30.00 15.00Proposed Methodology and Approach to Work 20.00 12.40
Project Team and Key Personnel 30.00 18.00
Quality, Comprehensiveness, and Reasonableness of Proposal 10.00 6.40
Cost or Best Value 10.00 6.80
Total Score 100.00 58.60Project Experience and Technical Competence 30.00 18.00Proposed Methodology and Approach to Work 20.00 9.60
Project Team and Key Personnel 30.00 19.80
Quality, Comprehensiveness, and Reasonableness of Proposal 10.00 5.80
Cost or Best Value 10.00 7.00
Total Score 100.00 60.20Project Experience and Technical Competence 30.00 13.20Proposed Methodology and Approach to Work 20.00 11.60
Project Team and Key Personnel 30.00 16.20
Quality, Comprehensiveness, and Reasonableness of Proposal 10.00 6.20
Cost or Best Value 10.00 3.80
Total Score 100.00 51.00Project Experience and Technical Competence 30.00 16.20Proposed Methodology and Approach to Work 20.00 8.00
Project Team and Key Personnel 30.00 16.80
Quality, Comprehensiveness, and Reasonableness of Proposal 10.00 4.60
Cost or Best Value 10.00 6.00
Total Score 100.00 51.60Project Experience and Technical Competence 30.00 8.40Proposed Methodology and Approach to Work 20.00 5.20
Project Team and Key Personnel 30.00 13.20
Quality, Comprehensiveness, and Reasonableness of Proposal 10.00 2.80
Cost or Best Value 10.00 5.80
Total Score 100.00 35.40
40
159 36
The Strategic Communications & MARCOM Group
39173
TRG & Associates
SpanishLations 156 34
Phantastic Design 152 32
Szabo Designs 153 33
FX Signs 202 42
Idiom 158 35
LogosZ, Inc. 161 37
Popcorn Press & Media 191 40
TMAC Communications
168 38
Imagine Media Group, LLC
191
13

ON-CALL MARKETING AND COMMUNICATIONS SERVICES RFQ (5001980)RECOMMENDATION FOR AWARD
SUMMARY OF OVERALL EVALUATION RESULTSSmall-size Contract Category
Average Weighted Score
Overall Rank*Proposer Evaluation CriteriaMax. Weighted Score Possible
Sum of Ranks
Project Experience and Technical Competence 30.00 12.60Proposed Methodology and Approach to Work 20.00 7.20
Project Team and Key Personnel 30.00 13.20
Quality, Comprehensiveness, and Reasonableness of Proposal 10.00 4.20
Cost or Best Value 10.00 6.20
Total Score 100.00 43.40
Streamline Web Systems. Inc.
208
*Final Proposer Overall Rank is determined using the Sum of Ranks instead of the Total Weighted Score. Each evaluator's total scores are sorted into individual Proposal ranks. Their individual ranks are then added together for a Sum of Ranks. The Sum of Ranks are ordered into Overall Ranks, with the lowest number indicating which Proposal scored the highest across the evaluators. This measure is more objective, mitigating for and normalizing the evaluators' scoring differentials.
43
14
ON-CALL MARKETING AND COMMUNICATIONS SERVICES RFQ (5001980)RECOMMENDATION FOR AWARD
SUMMARY OF OVERALL EVALUATION RESULTSMedium-size Contract Category
Project Experience and Technical Competence 30.00 27.60Proposed Methodology and Approach to Work 20.00 18.40
Project Team and Key Personnel 30.00 27.60
Cost or Best Value 10.00 8.60
Interview Questions 10.00 8.80
Total Score 100.00 91.00Project Experience and Technical Competence 30.00 26.40Proposed Methodology and Approach to Work 20.00 16.00
Project Team and Key Personnel 30.00 26.40
Cost or Best Value 10.00 6.20
Interview Questions 10.00 8.60
Total Score 100.00 83.60Project Experience and Technical Competence 30.00 24.00Proposed Methodology and Approach to Work 20.00 17.20
Project Team and Key Personnel 30.00 25.20
Cost or Best Value 10.00 6.40
Interview Questions 10.00 8.80
Total Score 100.00 81.60Project Experience and Technical Competence 30.00 24.60Proposed Methodology and Approach to Work 20.00 16.00
Project Team and Key Personnel 30.00 23.70
Cost or Best Value 10.00 7.60
Interview Questions 10.00 7.80
Total Score 100.00 79.70Project Experience and Technical Competence 30.00 23.40Proposed Methodology and Approach to Work 20.00 15.20
Project Team and Key Personnel 30.00 22.80
Cost or Best Value 10.00 6.60
Interview Questions 10.00 7.40
Total Score 100.00 75.40Project Experience and Technical Competence 30.00 23.40Proposed Methodology and Approach to Work 20.00 14.40
Project Team and Key Personnel 30.00 22.20
Cost or Best Value 10.00 6.20
Interview Questions 10.00 7.60
Total Score 100.00 73.80
Project Experience and Technical Competence 30.00 20.40Proposed Methodology and Approach to Work 20.00 14.80
Project Team and Key Personnel 30.00 22.80
Cost or Best Value 10.00 6.00
Interview Questions 10.00 7.00
Total Score 100.00 71.00Project Experience and Technical Competence 30.00 21.60Proposed Methodology and Approach to Work 20.00 14.40
Project Team and Key Personnel 30.00 19.20
Cost or Best Value 10.00 8.00
Interview Questions 10.00 7.20
Total Score 100.00 70.40
Recommended Consultants
Not Recommended
35 8
Atkins
6
28 5
MIG (Moore Iacofano Goltsman), Inc.
MJE Marketing Services
29
33
Simon Wong Engineering
5 1
18 3
Civic Resource Group
*Final Proposer Overall Rank is determined using the Sum of Ranks instead of the Total Weighted Score. Each evaluator's total scores are sorted into individual Proposal ranks. Their individual ranks are then added together for a Sum of Ranks. The Sum of Ranks are ordered into Overall Ranks, with the lowest number indicating which Proposal scored the highest across the evaluators. This measure is more objective, mitigating for and normalizing the evaluators' scoring differentials.
Pulsar 12
Mth Degree, Inc.
2
19 4
7Nuffer Smith Tucker
Sum of Ranks Overall Rank*Average
Weighted ScoreProposer Evaluation Criteria
Max. Weighted Score Possible
15
ON-CALL MARKETING AND COMMUNICATIONS SERVICES RFQ (5001980)RECOMMENDATION FOR AWARD
SUMMARY OF OVERALL EVALUATION RESULTSLarge-size Contract Category
Project Experience and Technical Competence 30.00 27.00Proposed Methodology and Approach to Work 20.00 17.00
Project Team and Key Personnel 30.00 23.40
Cost or Best Value 10.00 7.70
Interview Questions 10.00 8.60
Total Score 100.00 83.70Project Experience and Technical Competence 30.00 24.00Proposed Methodology and Approach to Work 20.00 16.80
Project Team and Key Personnel 30.00 24.30
Cost or Best Value 10.00 8.40
Interview Questions 10.00 8.00
Total Score 100.00 81.50Project Experience and Technical Competence 30.00 23.10Proposed Methodology and Approach to Work 20.00 15.60
Project Team and Key Personnel 30.00 24.00
Cost or Best Value 10.00 8.20
Interview Questions 10.00 8.00
Total Score 100.00 78.90
Project Experience and Technical Competence 30.00 19.20Proposed Methodology and Approach to Work 20.00 14.60
Project Team and Key Personnel 30.00 21.90
Cost or Best Value 10.00 7.20
Interview Questions 10.00 7.70
Total Score 100.00 70.60Project Experience and Technical Competence 30.00 18.90Proposed Methodology and Approach to Work 20.00 12.80
Project Team and Key Personnel 30.00 18.60
Cost or Best Value 10.00 4.30
Interview Questions 10.00 6.60
Total Score 100.00 61.20
Recommended Consultants
Not Recommended
Proposer Evaluation CriteriaMax. Weighted Score Possible
CityWorks
Sum of Ranks Overall Rank*Average
Weighted Score
20 4
Southwest Strategies LLC
AdEase
Frank Wilson & Associates, Inc.
6 1
13 3
10 2
*Final Proposer Overall Rank is determined using the Sum of Ranks instead of the Total Weighted Score. Each evaluator's total scores are sorted into individual Proposal ranks. Their individual ranks are then added together for a Sum of Ranks. The Sum of Ranks are ordered into Overall Ranks, with the lowest number indicating which Proposal scored the highest across the evaluators. This measure is more objective, mitigating for and normalizing the evaluators' scoring differentials.
25 5EFM
16
BOARD OF DIRECTORS AGENDA ITEM NO. 13-09-13
SEPTEMBER 27, 2013 ACTION REQUESTED – APPROVE
TransNet ENVIRONMENTAL MITIGATION PROGRAM: File Number 1200201 FY 2014 MANAGEMENT AND MONITORING ALLOCATIONS AND COMPETITIVE LAND ACQUISITION GRANT CALL FOR PROJECTS
Introduction
The TransNet Extension Ordinance and Expenditure Plan, approved by the voters in November 2004, includes the Environmental Mitigation Program (EMP), which provides funding to mitigate habitat impacts from regional and local transportation projects, and provides funding for regional land management and biological monitoring. The EMP is a unique component of the TransNet Extension Ordinance in that it goes beyond traditional mitigation for transportation projects by including a funding allocation for habitat acquisition, management, and monitoring activities to help implement the regional habitat conservation plans. This funding allocation is tied to mitigation requirements and the environmental clearance approval process for projects outlined in the Regional Transportation Plan.
Each year the Board of Directors allocates $4 million toward implementation of regional land management and biological monitoring pursuant to a Memorandum of Agreement (MOA) with state and federal agencies on the implementation of the EMP. On April 26, 2013, the Board of Directors amended the MOA to include the release of funding for land acquisition using economic benefit funding and directed SANDAG staff to develop a competitive grant program for future consideration.
The purpose of this report is to present recommendations for the allocation of FY 2014 funding for management and monitoring, and the Call for Projects for a competitive land acquisition program. On September 6, 2013, the Regional Planning and Transportation Committees recommended Board approval of these actions. At its September 11, 2013, meeting, the TransNet Independent Taxpayer Oversight Committee (ITOC) reviewed and indicated support for the proposed actions. ITOC also recommended that site visits be performed as part of the grant evaluation process; SANDAG staff agrees and will incorporate this ITOC recommendation into the grant application and evaluation process.
Recommendation
The Regional Planning and Transportation Committees recommend that the Board of Directors approve: (1) funding allocations totaling $4 million toward implementation of regional land management and biological monitoring activities; and (2) release of the Call for Projects for a competitive land acquisition grant program using economic benefit funding, pursuant to an executed Memorandum of Agreement with state and federal agencies on the implementation of the TransNet Environmental Mitigation Program.
2
Discussion
On February 22, 2008, the Board of Directors entered into an MOA with state and federal resource agencies on the implementation of the EMP. A provision of the MOA allocates $4 million annually for ten years to implement regional habitat management and monitoring efforts to help maintain the region’s biological integrity, thus avoiding the future listing of endangered species. Allocation of the $4 million is done on an annual basis by the Board of Directors pursuant to a five-year program funding strategy (originally approved on December 15, 2006, and last updated by the Board of Directors on January 28, 2011).
On April 26, 2013, the Board of Directors approved the execution of an amended MOA to include a set of 11 policy points that clarified the definition, use, and process for release of funding related to the “economic benefit” provision of the TransNet Extension Ordinance. Under the amended MOA, regional and local transportation projects that have received all of the required local, state, and federal permits for construction are eligible to release economic benefit funding pursuant to a pro-rata share formula included in the MOA. This milestone in the construction process of transportation infrastructure was identified to correspond with the last environmental clearance milestone that sets the final required mitigation obligations. After this time, no additional mitigation obligations can be added. To date, 11 projects totaling approximately $20 million in economic benefit funds have received all of the required permits.
FY 2014 Annual Allocation for Management and Monitoring
Funding totaling $4 million is being recommended for regional land management and biological monitoring, as shown in Attachment 1. The recommendations were developed by the Environmental Mitigation Program Working Group (EMPWG) (an advisory working group to the Regional Planning Committee) and unanimously recommended for approval at its July 9, 2013, meeting. The allocation of the $4 million is consistent with the funding needs necessary to continue the implementation of the five-year funding strategy in FY 2014; no new tasks are recommended at this time.
Land Acquisition Call for Projects
In addition to the $4 million of regional management and monitoring funding, the Board of Directors approved the execution of an amendment to the 2008 MOA, which would allow for the release of $20 million of economic benefit funding in FY 2014. The funds can be used for land acquisition, land management, and/or regional biological monitoring. After review of the regional funding needs for land management and biological monitoring, the EMPWG unanimously recommended that the $20 million of economic benefit funding be directed towards land acquisition for FY 2014.
As a means to distribute the $20 million of economic benefit funds, the Board of Directors directed SANDAG staff to develop a Call for Projects for land acquisition using economic benefit funds. Pursuant to the amended MOA, an ad hoc committee composed of representatives from Caltrans, U.S. Fish and Wildlife Service, California Department of Fish and Wildlife, U.S. Geological Survey, and SANDAG would evaluate all proposals resulting from a competitive grant program for land acquisitions and provide its recommendation to the Board of Directors. On June 5, 2013, SANDAG staff met with these agencies to discuss the development of a Call for Projects. Experts in real estate
3
acquisition and appraisal from the California Wildlife Conservation Board and Caltrans Right-of-Way division also were in attendance to provide insight into the state’s land acquisition process.
The competitive grant process would follow the existing SANDAG process used for the TransNet Environmental Mitigation Program Land Management grants. If approved by the Board of Directors, a Call for Projects would be issued in November (see Attachment 2 for draft Grant Program Overview and Instructions as well as proposed timeline). Applicants would be required to fill out an application form (Attachment 2A), which would be assessed for eligibility and ranked using eligibility and evaluation criteria (Attachment 2B) by an evaluation committee made up of the five agencies identified in the MOA. The top-ranked projects totaling up to $20 million would be appraised by SANDAG to determine the fair-market value of the property. The top-ranked projects with a combined appraised value of up to $20 million would be brought to the Regional Planning and Transportation Committees for a recommendation to the Board of Directors. The Board of Directors would consider approval to award funding to the top projects in September 2014 (FY 2015), along with a budget amendment.
Next Steps
If approved by the Board of Directors, the next steps would be to implement the proposed management and monitoring activities for FY 2014, and issue the Call for Projects in or around November 2013 for the competitive land acquisition grant program.
GARY L. GALLEGOS Executive Director
Attachments: 1. Recommended FY 2014 Funding Allocation for Habitat Conservation Fund (CIP 1200300) 2. San Diego Association of Governments Environmental Mitigation Program FY 2014 Land Management Grants - Program Overview and Instructions 2A. Grant Application Form 2B. Economic Benefit Land Acquisition Eligibility and Evaluation Criteria Key Staff Contact: Keith Greer, (619) 699-7390, [email protected]
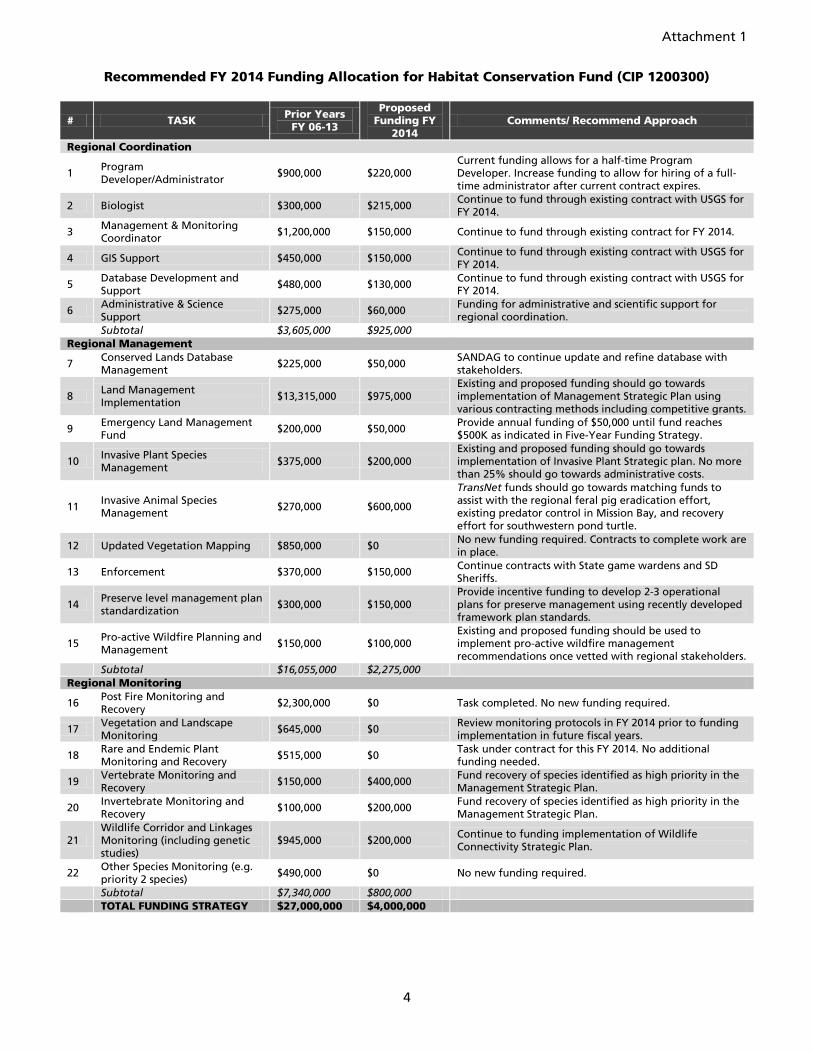
Attachment 1
4
Recommended FY 2014 Funding Allocation for Habitat Conservation Fund (CIP 1200300)
# TASK Prior Years FY 06-13
Proposed Funding FY
2014 Comments/ Recommend Approach
Regional Coordination
1 Program Developer/Administrator
$900,000 $220,000 Current funding allows for a half-time Program Developer. Increase funding to allow for hiring of a full-time administrator after current contract expires.
2 Biologist $300,000 $215,000 Continue to fund through existing contract with USGS for FY 2014.
3 Management & Monitoring Coordinator
$1,200,000 $150,000 Continue to fund through existing contract for FY 2014.
4 GIS Support $450,000 $150,000 Continue to fund through existing contract with USGS for FY 2014.
5 Database Development and Support
$480,000 $130,000 Continue to fund through existing contract with USGS for FY 2014.
6 Administrative & Science Support
$275,000 $60,000 Funding for administrative and scientific support for regional coordination.
Subtotal $3,605,000 $925,000
Regional Management
7 Conserved Lands Database Management
$225,000 $50,000 SANDAG to continue update and refine database with stakeholders.
8 Land Management Implementation
$13,315,000 $975,000 Existing and proposed funding should go towards implementation of Management Strategic Plan using various contracting methods including competitive grants.
9 Emergency Land Management Fund
$200,000 $50,000 Provide annual funding of $50,000 until fund reaches $500K as indicated in Five-Year Funding Strategy.
10 Invasive Plant Species Management
$375,000 $200,000 Existing and proposed funding should go towards implementation of Invasive Plant Strategic plan. No more than 25% should go towards administrative costs.
11 Invasive Animal Species Management
$270,000 $600,000
TransNet funds should go towards matching funds to assist with the regional feral pig eradication effort, existing predator control in Mission Bay, and recovery effort for southwestern pond turtle.
12 Updated Vegetation Mapping $850,000 $0 No new funding required. Contracts to complete work are in place.
13 Enforcement $370,000 $150,000 Continue contracts with State game wardens and SD Sheriffs.
14 Preserve level management plan standardization
$300,000 $150,000 Provide incentive funding to develop 2-3 operational plans for preserve management using recently developed framework plan standards.
15 Pro-active Wildfire Planning and Management
$150,000 $100,000 Existing and proposed funding should be used to implement pro-active wildfire management recommendations once vetted with regional stakeholders.
Subtotal $16,055,000 $2,275,000
Regional Monitoring
16 Post Fire Monitoring and Recovery
$2,300,000 $0 Task completed. No new funding required.
17 Vegetation and Landscape Monitoring
$645,000 $0 Review monitoring protocols in FY 2014 prior to funding implementation in future fiscal years.
18 Rare and Endemic Plant Monitoring and Recovery
$515,000 $0 Task under contract for this FY 2014. No additional funding needed.
19 Vertebrate Monitoring and Recovery
$150,000 $400,000 Fund recovery of species identified as high priority in the Management Strategic Plan.
20 Invertebrate Monitoring and Recovery
$100,000 $200,000 Fund recovery of species identified as high priority in the Management Strategic Plan.
21 Wildlife Corridor and Linkages Monitoring (including genetic studies)
$945,000 $200,000 Continue to funding implementation of Wildlife Connectivity Strategic Plan.
22 Other Species Monitoring (e.g. priority 2 species)
$490,000 $0 No new funding required.
Subtotal $7,340,000 $800,000
TOTAL FUNDING STRATEGY $27,000,000 $4,000,000
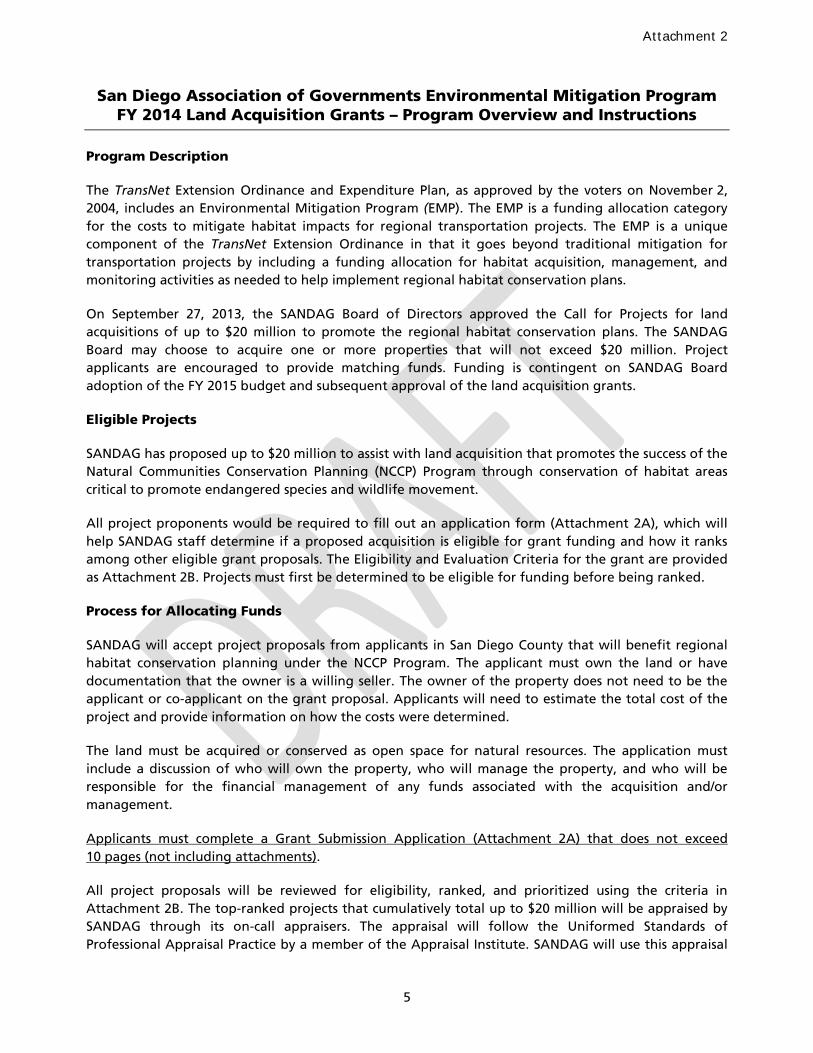
Attachment 2
5
San Diego Association of Governments Environmental Mitigation Program FY 2014 Land Acquisition Grants – Program Overview and Instructions
Program Description
The TransNet Extension Ordinance and Expenditure Plan, as approved by the voters on November 2, 2004, includes an Environmental Mitigation Program (EMP). The EMP is a funding allocation category for the costs to mitigate habitat impacts for regional transportation projects. The EMP is a unique component of the TransNet Extension Ordinance in that it goes beyond traditional mitigation for transportation projects by including a funding allocation for habitat acquisition, management, and monitoring activities as needed to help implement regional habitat conservation plans.
On September 27, 2013, the SANDAG Board of Directors approved the Call for Projects for land acquisitions of up to $20 million to promote the regional habitat conservation plans. The SANDAG Board may choose to acquire one or more properties that will not exceed $20 million. Project applicants are encouraged to provide matching funds. Funding is contingent on SANDAG Board adoption of the FY 2015 budget and subsequent approval of the land acquisition grants.
Eligible Projects
SANDAG has proposed up to $20 million to assist with land acquisition that promotes the success of the Natural Communities Conservation Planning (NCCP) Program through conservation of habitat areas critical to promote endangered species and wildlife movement.
All project proponents would be required to fill out an application form (Attachment 2A), which will help SANDAG staff determine if a proposed acquisition is eligible for grant funding and how it ranks among other eligible grant proposals. The Eligibility and Evaluation Criteria for the grant are provided as Attachment 2B. Projects must first be determined to be eligible for funding before being ranked.
Process for Allocating Funds
SANDAG will accept project proposals from applicants in San Diego County that will benefit regional habitat conservation planning under the NCCP Program. The applicant must own the land or have documentation that the owner is a willing seller. The owner of the property does not need to be the applicant or co-applicant on the grant proposal. Applicants will need to estimate the total cost of the project and provide information on how the costs were determined.
The land must be acquired or conserved as open space for natural resources. The application must include a discussion of who will own the property, who will manage the property, and who will be responsible for the financial management of any funds associated with the acquisition and/or management.
Applicants must complete a Grant Submission Application (Attachment 2A) that does not exceed 10 pages (not including attachments).
All project proposals will be reviewed for eligibility, ranked, and prioritized using the criteria in Attachment 2B. The top-ranked projects that cumulatively total up to $20 million will be appraised by SANDAG through its on-call appraisers. The appraisal will follow the Uniformed Standards of Professional Appraisal Practice by a member of the Appraisal Institute. SANDAG will use this appraisal
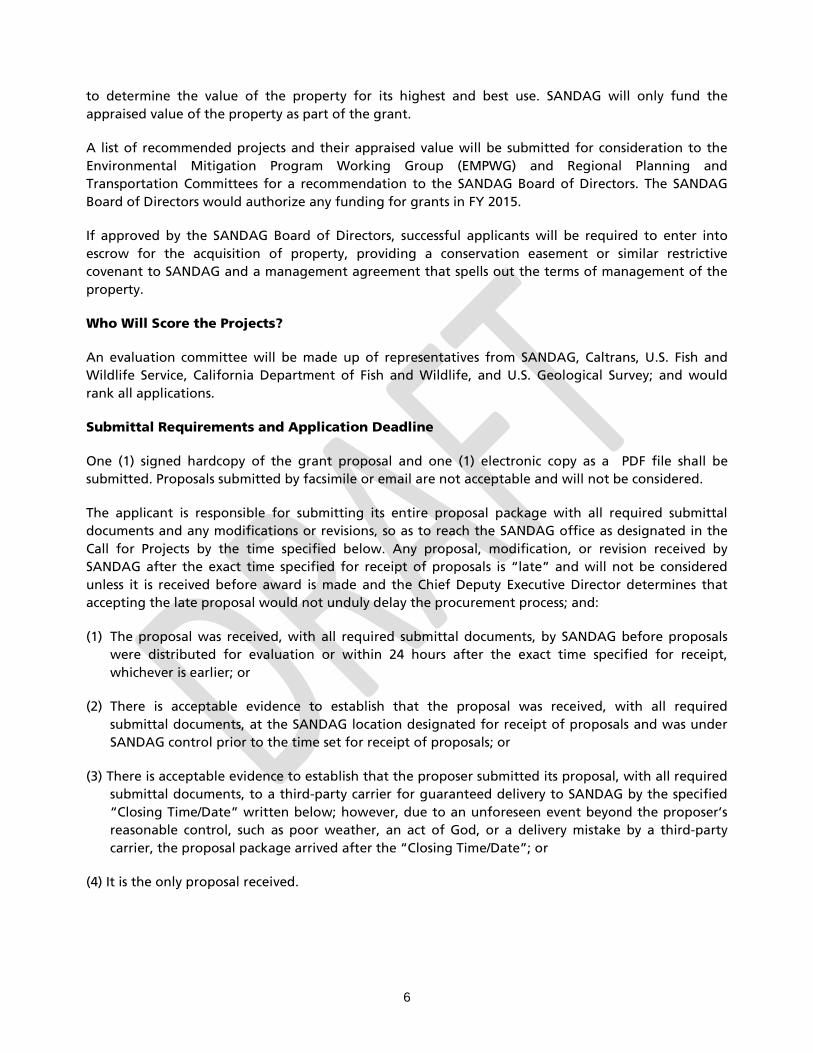
6
to determine the value of the property for its highest and best use. SANDAG will only fund the appraised value of the property as part of the grant.
A list of recommended projects and their appraised value will be submitted for consideration to the Environmental Mitigation Program Working Group (EMPWG) and Regional Planning and Transportation Committees for a recommendation to the SANDAG Board of Directors. The SANDAG Board of Directors would authorize any funding for grants in FY 2015.
If approved by the SANDAG Board of Directors, successful applicants will be required to enter into escrow for the acquisition of property, providing a conservation easement or similar restrictive covenant to SANDAG and a management agreement that spells out the terms of management of the property.
Who Will Score the Projects?
An evaluation committee will be made up of representatives from SANDAG, Caltrans, U.S. Fish and Wildlife Service, California Department of Fish and Wildlife, and U.S. Geological Survey; and would rank all applications.
Submittal Requirements and Application Deadline
One (1) signed hardcopy of the grant proposal and one (1) electronic copy as a PDF file shall be submitted. Proposals submitted by facsimile or email are not acceptable and will not be considered.
The applicant is responsible for submitting its entire proposal package with all required submittal documents and any modifications or revisions, so as to reach the SANDAG office as designated in the Call for Projects by the time specified below. Any proposal, modification, or revision received by SANDAG after the exact time specified for receipt of proposals is “late” and will not be considered unless it is received before award is made and the Chief Deputy Executive Director determines that accepting the late proposal would not unduly delay the procurement process; and:
(1) The proposal was received, with all required submittal documents, by SANDAG before proposals were distributed for evaluation or within 24 hours after the exact time specified for receipt, whichever is earlier; or
(2) There is acceptable evidence to establish that the proposal was received, with all required submittal documents, at the SANDAG location designated for receipt of proposals and was under SANDAG control prior to the time set for receipt of proposals; or
(3) There is acceptable evidence to establish that the proposer submitted its proposal, with all required submittal documents, to a third-party carrier for guaranteed delivery to SANDAG by the specified “Closing Time/Date” written below; however, due to an unforeseen event beyond the proposer’s reasonable control, such as poor weather, an act of God, or a delivery mistake by a third-party carrier, the proposal package arrived after the “Closing Time/Date”; or
(4) It is the only proposal received.
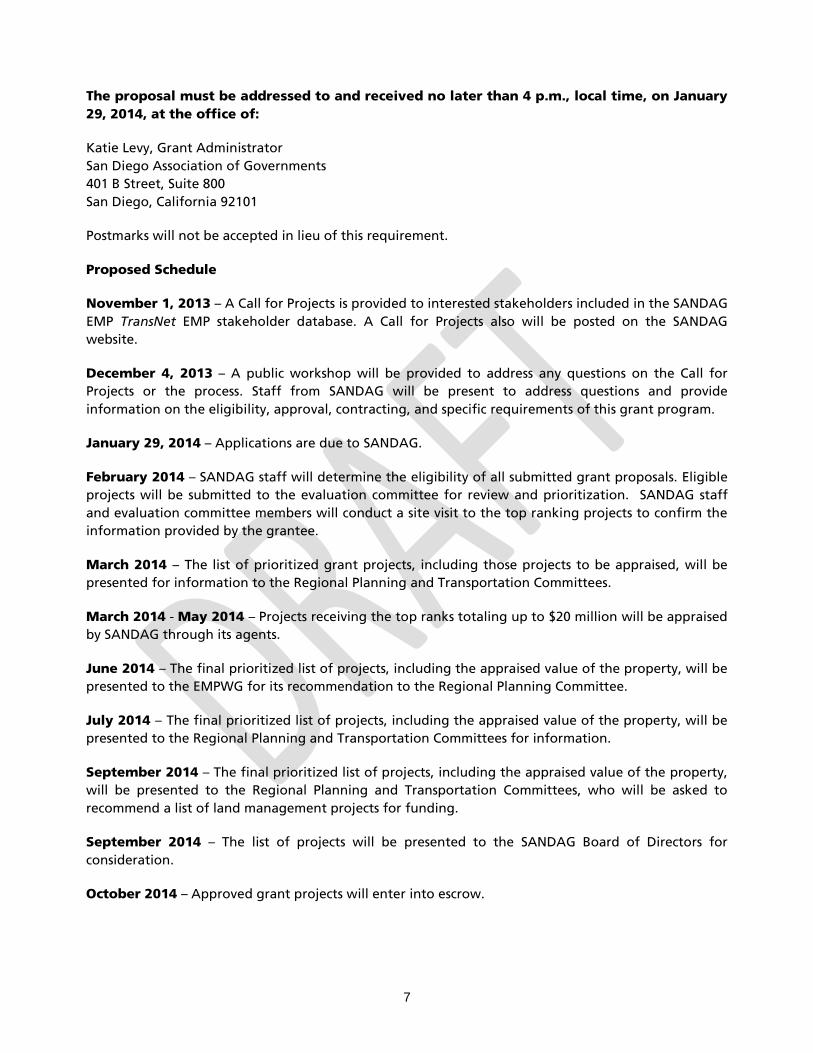
7
The proposal must be addressed to and received no later than 4 p.m., local time, on January 29, 2014, at the office of:
Katie Levy, Grant Administrator San Diego Association of Governments 401 B Street, Suite 800 San Diego, California 92101
Postmarks will not be accepted in lieu of this requirement.
Proposed Schedule
November 1, 2013 – A Call for Projects is provided to interested stakeholders included in the SANDAG EMP TransNet EMP stakeholder database. A Call for Projects also will be posted on the SANDAG website.
December 4, 2013 – A public workshop will be provided to address any questions on the Call for Projects or the process. Staff from SANDAG will be present to address questions and provide information on the eligibility, approval, contracting, and specific requirements of this grant program.
January 29, 2014 – Applications are due to SANDAG.
February 2014 – SANDAG staff will determine the eligibility of all submitted grant proposals. Eligible projects will be submitted to the evaluation committee for review and prioritization. SANDAG staff and evaluation committee members will conduct a site visit to the top ranking projects to confirm the information provided by the grantee.
March 2014 – The list of prioritized grant projects, including those projects to be appraised, will be presented for information to the Regional Planning and Transportation Committees.
March 2014 - May 2014 – Projects receiving the top ranks totaling up to $20 million will be appraised by SANDAG through its agents.
June 2014 – The final prioritized list of projects, including the appraised value of the property, will be presented to the EMPWG for its recommendation to the Regional Planning Committee.
July 2014 – The final prioritized list of projects, including the appraised value of the property, will be presented to the Regional Planning and Transportation Committees for information.
September 2014 – The final prioritized list of projects, including the appraised value of the property, will be presented to the Regional Planning and Transportation Committees, who will be asked to recommend a list of land management projects for funding.
September 2014 – The list of projects will be presented to the SANDAG Board of Directors for consideration.
October 2014 – Approved grant projects will enter into escrow.
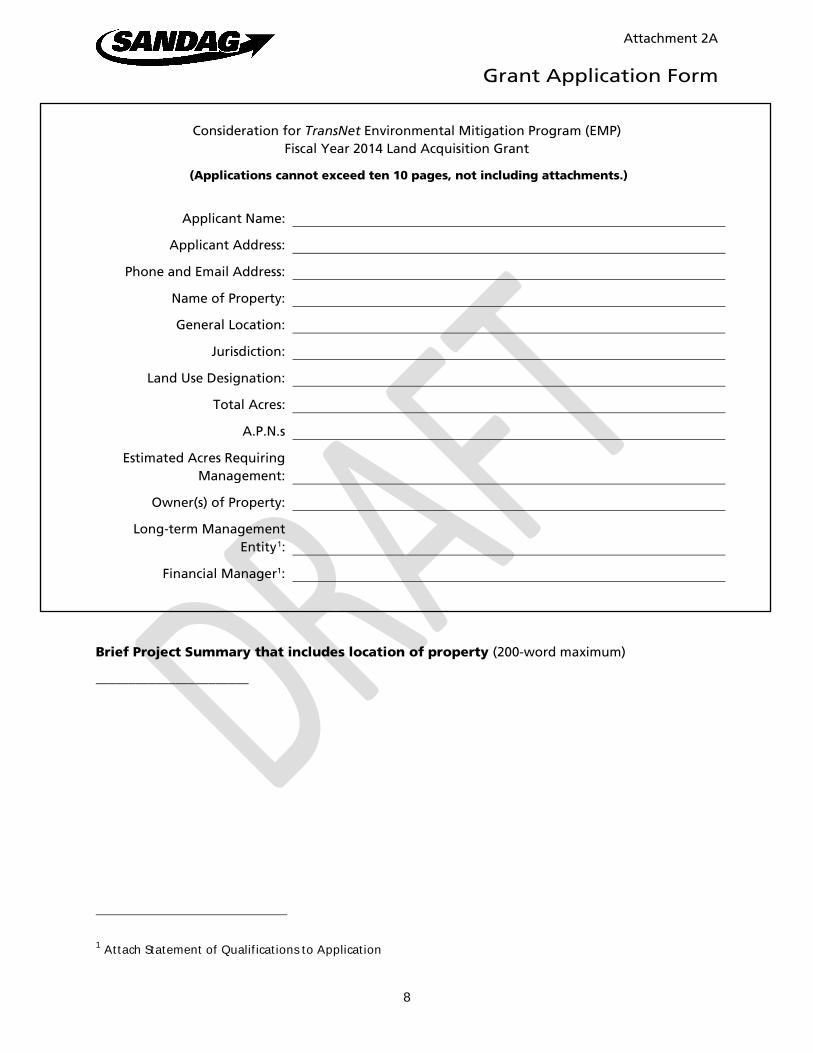
Attachment 2A
Grant Application Form
8
Consideration for TransNet Environmental Mitigation Program (EMP)
Fiscal Year 2014 Land Acquisition Grant
(Applications cannot exceed ten 10 pages, not including attachments.)
Applicant Name:
Applicant Address:
Phone and Email Address:
Name of Property:
General Location:
Jurisdiction:
Land Use Designation:
Total Acres:
A.P.N.s
Estimated Acres Requiring Management:
Owner(s) of Property:
Long-term Management Entity1:
Financial Manager1:
Brief Project Summary that includes location of property (200-word maximum)
_______________________
1 Attach Statement of Qualifications to Application
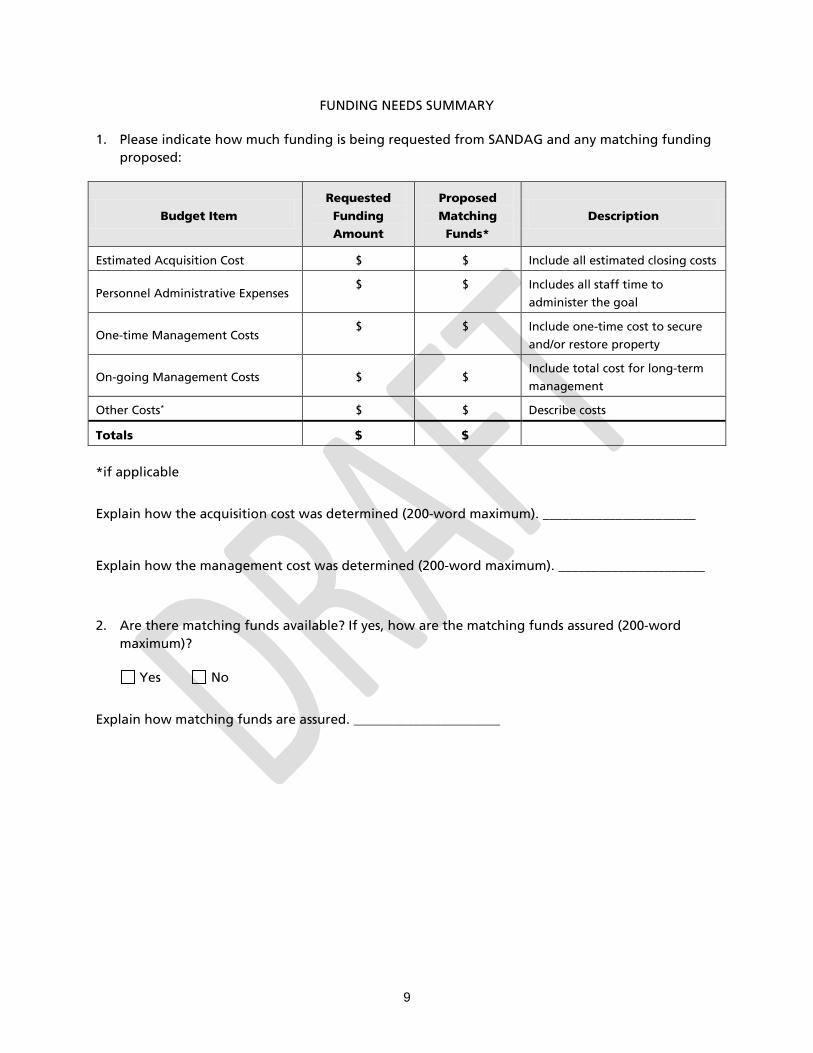
9
FUNDING NEEDS SUMMARY
1. Please indicate how much funding is being requested from SANDAG and any matching funding proposed:
Budget Item
Requested
Funding Amount
Proposed
Matching Funds*
Description
Estimated Acquisition Cost $ $ Include all estimated closing costs
Personnel Administrative Expenses $ $ Includes all staff time to
administer the goal
One-time Management Costs $ $ Include one-time cost to secure
and/or restore property
On-going Management Costs $ $ Include total cost for long-term
management
Other Costs* $ $ Describe costs
Totals $ $
*if applicable
Explain how the acquisition cost was determined (200-word maximum). _______________________
Explain how the management cost was determined (200-word maximum). ______________________
2. Are there matching funds available? If yes, how are the matching funds assured (200-word maximum)?
Yes No
Explain how matching funds are assured. ______________________
10
PROJECT SUMMARY
(Maps and/or graphics can be referenced and pasted at the end of this Word document or attached as a separate digital file.)
The summary will include the location of the acquisition property(ies), the proposed strategy for acquisition, identification of matching funds, discussion of both short-term and long-term land management, and the method to assure financial accountability of management funds.
A. Project Purpose
Address the following in the proposal.
1. Describe how the property will contribute to the success of the San Diego regional Natural Community Conservation Planning by acquiring and restoring unique habitat areas, key populations of endangered species, lands adjacent to existing conserved habitat lands, and/or promoting wildlife linkages. Describe the location of the property in relation to the regional open space plans (e.g., Multiple Species Conservation Plan South, Multiple Habitat Conservation Plan, Multiple Species Plan North, etc.) and existing or proposed conserved lands. PROVIDE A MAP as an attachment.
2. Describe the designation of the property in the local jurisdiction’s long-range land use and transportation plans, and discuss any conflicts. If the use of the site as habitat conservation/open space is not consistent, a letter from the City Council or its designee will be required indicating that the jurisdiction does not object to the site being purchased for habitat conservation/open space. PROVIDE LETTER as an attachment.
3. Describe how the property will provide benefit for federal and/or state-listed species and/or unlisted sensitive species. Identify all known federal or state-listed endangered species, species that are candidate for listing, or unlisted sensitive species (e.g., County of San Diego’s Sensitive Plant List, California Department of Fish and Wildlife list of species of special concern), and the source of the information. Discuss to the extent known, if there are any core populations of listed or sensitive species on or near the property. PROVIDE A MAP of species on property if available.
4. Describe the property’s benefit to ecosystem functions and services. Describe the existing biotic and abiotic condition of the property in relation to its disturbance and need for management. Discuss the level of required management need to (1) restore and (2) maintain the abiotic, biotic, and ecological processes of the property when considered in context of the surrounding landscape. Biotic factors include the structure and composition of plant and animal communities. Abiotic factors include soil, hydrology, natural topography, and salinity gradients. Ecological processes include succession, trophic energy flows, and disturbance regimes.
5. Include a discussion of how the acquisition of the property would contribute to overall open space connectivity throughout the region and how this acquisition could fill a void in the matrix of protected open space lands.
11
6. Describe how the acquisition of the property removes or minimizes threats on the species identified in number 2, above. Examples of threats/stressors include fragmentation; edge effects; loss of habitat from proposed development, conversion to agriculture, or lack of or inappropriate management.
7. Describe the likelihood that the land targeted for acquisition will be converted from natural habitat in the near term. Explain why.
8. Describe how the land proposed for acquisition will increase the likelihood that species and their habitats will be able to respond/adapt to climate changes (e.g., temperature and precipitation) or remove potential impediments to response to climate change.
9. Describe who would own the title of the property and who would manage the property. Describe the qualification of the land manager. Describe how the management cost, both one-time and on-going, have been determined. Discuss the proposed funding strategy for long-term management, including who would fund management and where funds would be held. Describe the experience of the financial manager (proposed entity to hold any endowments for management and/or monitoring) and assurances of long-term funding.
10. Describe the approach for the development of a long-term management plan for the property.
11. Describe any special considerations of the proposed acquisition. Special considerations may include but are not limited to: percentage of matching funds; cost per acre for acquisition and/or management; significantly facilitates broader management goals beyond the targeted parcel boundaries; ancillary benefits (e.g., supports water quality, flood control, or wildfire management needs); completes or significantly benefits a local or regional acquisition strategy/opportunity.
NOTICE REGARDING PREVAILING WAGES
SANDAG EMP Land Acquisition Grants are funded with TransNet revenues consistent with the Transnet Extension Ordinance adopted by the voters in November 2004 (SANDAG Ordinance 04-01). While SANDAG does not require grantees to pay prevailing wages, recent California appellate court opinions (Reliable Tree Experts v. Baker, 200 Cal. App. 4th 785 [2011]; Reclamation Dist. No. 684 v. Department of Industrial Relations, 125 Cal. App. 4th 1000 [2005]) and Department of Industrial Relations advisory opinions strongly suggest that many potential aspects of EMP Land Acquisition Grant projects, especially those involving habitat restoration and maintenance or environmental remediation, will be subject to prevailing wage law. Grant applicants are encouraged to review the provisions of Labor Code §§ 1720 and 1771, and California Code of Regulations, title 8, § 16000. These outline activities constituting public works for purposes of prevailing wage law. Grant applicants are further encouraged to seek advice from an attorney to determine the applicability of the aforementioned statutory provisions and regulation to their proposed grant-funded projects. If awarded an EMP Land Acquisition Grant, the grant agreement between SANDAG and the grantee requires grantee’s compliance with all federal, state, and local laws and ordinances applicable to the agreement.
12
REQUIRED STATEMENTS FROM GRANTEE
Yes No The owner of the property is a willing seller and a letter of interest, purchase agreement, or similar commitment from the owner has been attached to this application.
Yes No The site is consistent with the local jurisdiction’s land use plan as habitat conservation/open space, or the local jurisdiction does not object to the site being acquired for habitat conservation/open space and a letter from the jurisdiction has been included with this application.
Yes No A preliminary title report to the property(ies) has been included with the application.
Yes No If the property is selected for consideration to be acquired, the grantee understands that SANDAG will conduct through its proxies an appraisal consistent with the Uniformed Standards of Professional Appraisal Practice by a member of the Appraisal Institute. SANDAG will use this appraisal to determine the value of the property for its highest and best use. The grantee understands that SANDAG, at the sole discretion of the SANDAG Board of Directors, only will offer the appraised value of the property.
Yes No The grantee agrees to use the escrow account and instructions acceptable by SANDAG.
Yes No The grantee understands that upon review of the title report, hazardous waste assessments of the property, or any other real property document, SANDAG may choose to not pursue acquisition of the property at its sole discretion.
Yes No The grantee agrees to provide to record a conservation easement, deed restriction, or similar restrictive convent that will run with the title of the property and be binding on the grantee, heirs, successors, lessees, representatives, and other occupiers of the property.
Yes No The grantee understands that SANDAG would need to accept the identified land manager and the financial manager for management funds as part of the acquisition grant.
Yes No The grantee agrees to enter into a Management Agreement with SANDAG for the perpetual stewardship and biological management of the property.
Yes No The grantee agrees to complete a resource management plan within one year of the acquisition of the property for review by the state and federal wildlife agencies.
Yes No The grantee agrees to comply with SANDAG Board Policy No. 035 “Competitive Grant Program Procedures,” which outlines “use-it-or-lose-it” project milestone and completion deadlines. SANDAG Board Policy No. 035 is included in the
13
standardized agreement, and also is on the SANDAG website at the following link: http://www.sandag.org/organization/about/pubs/policy_035.pdf
Yes No The proposed grantee understands that a resolution including the requirements of SANDAG Board Policy No. 035, Section 4.1, must be submitted to SANDAG at least two weeks prior to the recommendation by the Regional Planning Committee of the list of grant projects to be considered eligible. SANDAG will provide applicants with advance notice of the Regional Planning Committee’s anticipated meeting date.
Yes No The grantee understands that only the SANDAG Board of Directors can authorize any funding and costs borne by the grantee prior to SANDAG Board of Director approval is at the risk of the grantee and may not be reimbursed.
Yes No The grantee understands that this grant is an opportunistic purchase by SANDAG and the SANDAG Board of Directors may at its sole discretion choose to fund all, part, or none of the proposal.
I have the authorization to submit this grant on behalf of my organization.
Grantee Name/Title (print or type)
mm/dd/yy Grantee Signature Date
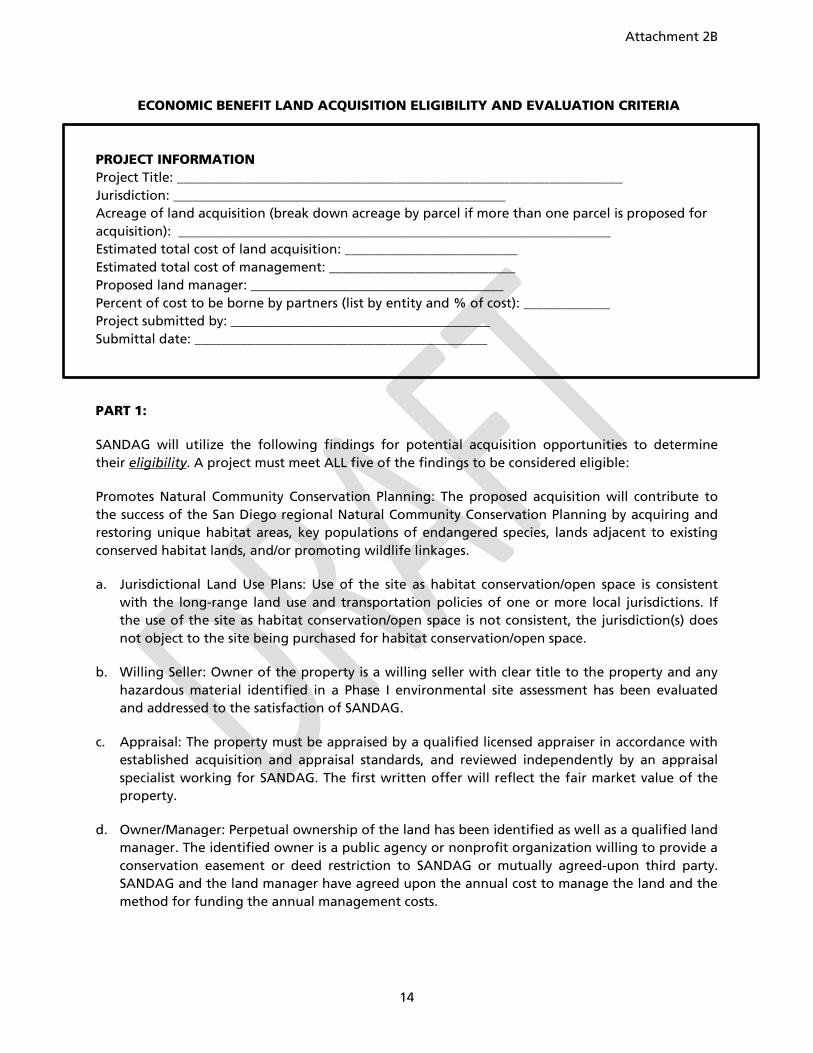
Attachment 2B
14
ECONOMIC BENEFIT LAND ACQUISITION ELIGIBILITY AND EVALUATION CRITERIA PROJECT INFORMATION Project Title: ___________________________________________________________________ Jurisdiction: __________________________________________________ Acreage of land acquisition (break down acreage by parcel if more than one parcel is proposed for acquisition): _________________________________________________________________ Estimated total cost of land acquisition: __________________________ Estimated total cost of management: ____________________________ Proposed land manager: ______________________________________ Percent of cost to be borne by partners (list by entity and % of cost): _____________ Project submitted by: _______________________________________ Submittal date: ____________________________________________ PART 1:
SANDAG will utilize the following findings for potential acquisition opportunities to determine their eligibility. A project must meet ALL five of the findings to be considered eligible:
Promotes Natural Community Conservation Planning: The proposed acquisition will contribute to the success of the San Diego regional Natural Community Conservation Planning by acquiring and restoring unique habitat areas, key populations of endangered species, lands adjacent to existing conserved habitat lands, and/or promoting wildlife linkages.
a. Jurisdictional Land Use Plans: Use of the site as habitat conservation/open space is consistent with the long-range land use and transportation policies of one or more local jurisdictions. If the use of the site as habitat conservation/open space is not consistent, the jurisdiction(s) does not object to the site being purchased for habitat conservation/open space.
b. Willing Seller: Owner of the property is a willing seller with clear title to the property and any hazardous material identified in a Phase I environmental site assessment has been evaluated and addressed to the satisfaction of SANDAG.
c. Appraisal: The property must be appraised by a qualified licensed appraiser in accordance with established acquisition and appraisal standards, and reviewed independently by an appraisal specialist working for SANDAG. The first written offer will reflect the fair market value of the property.
d. Owner/Manager: Perpetual ownership of the land has been identified as well as a qualified land manager. The identified owner is a public agency or nonprofit organization willing to provide a conservation easement or deed restriction to SANDAG or mutually agreed-upon third party. SANDAG and the land manager have agreed upon the annual cost to manage the land and the method for funding the annual management costs.
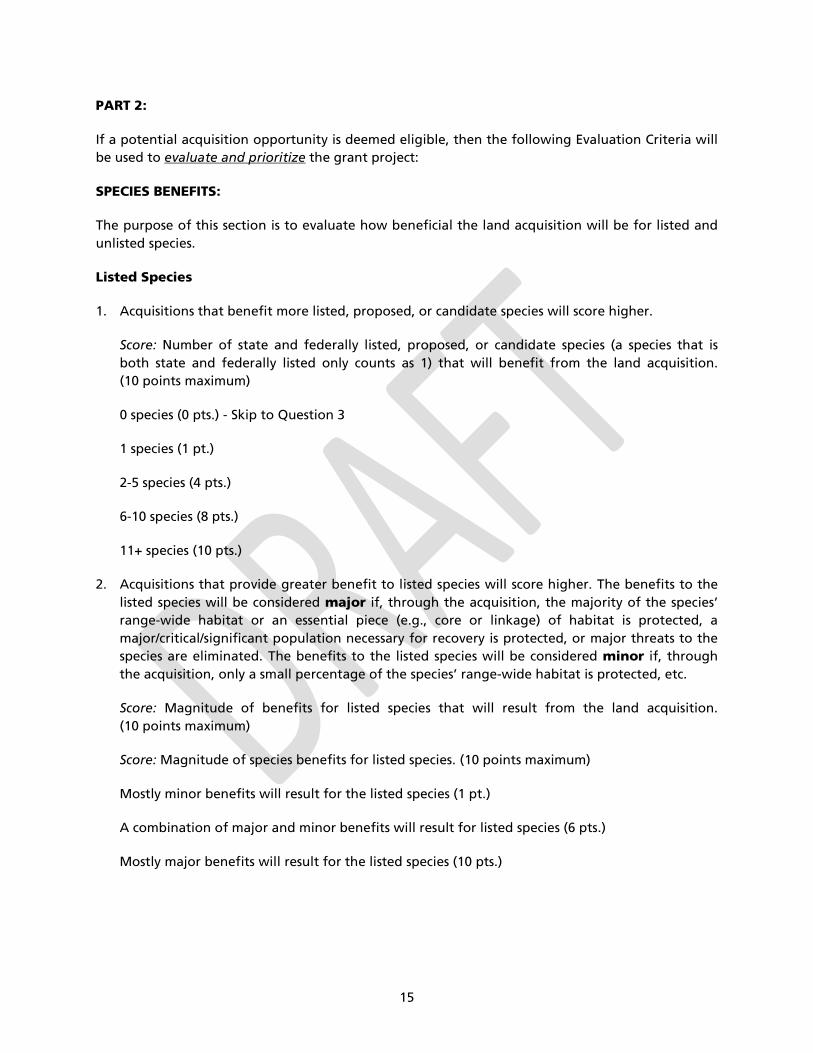
15
PART 2:
If a potential acquisition opportunity is deemed eligible, then the following Evaluation Criteria will be used to evaluate and prioritize the grant project:
SPECIES BENEFITS:
The purpose of this section is to evaluate how beneficial the land acquisition will be for listed and unlisted species.
Listed Species
1. Acquisitions that benefit more listed, proposed, or candidate species will score higher.
Score: Number of state and federally listed, proposed, or candidate species (a species that is both state and federally listed only counts as 1) that will benefit from the land acquisition. (10 points maximum)
0 species (0 pts.) - Skip to Question 3
1 species (1 pt.)
2-5 species (4 pts.)
6-10 species (8 pts.)
11+ species (10 pts.)
2. Acquisitions that provide greater benefit to listed species will score higher. The benefits to the listed species will be considered major if, through the acquisition, the majority of the species’ range-wide habitat or an essential piece (e.g., core or linkage) of habitat is protected, a major/critical/significant population necessary for recovery is protected, or major threats to the species are eliminated. The benefits to the listed species will be considered minor if, through the acquisition, only a small percentage of the species’ range-wide habitat is protected, etc.
Score: Magnitude of benefits for listed species that will result from the land acquisition. (10 points maximum)
Score: Magnitude of species benefits for listed species. (10 points maximum)
Mostly minor benefits will result for the listed species (1 pt.)
A combination of major and minor benefits will result for listed species (6 pts.)
Mostly major benefits will result for the listed species (10 pts.)
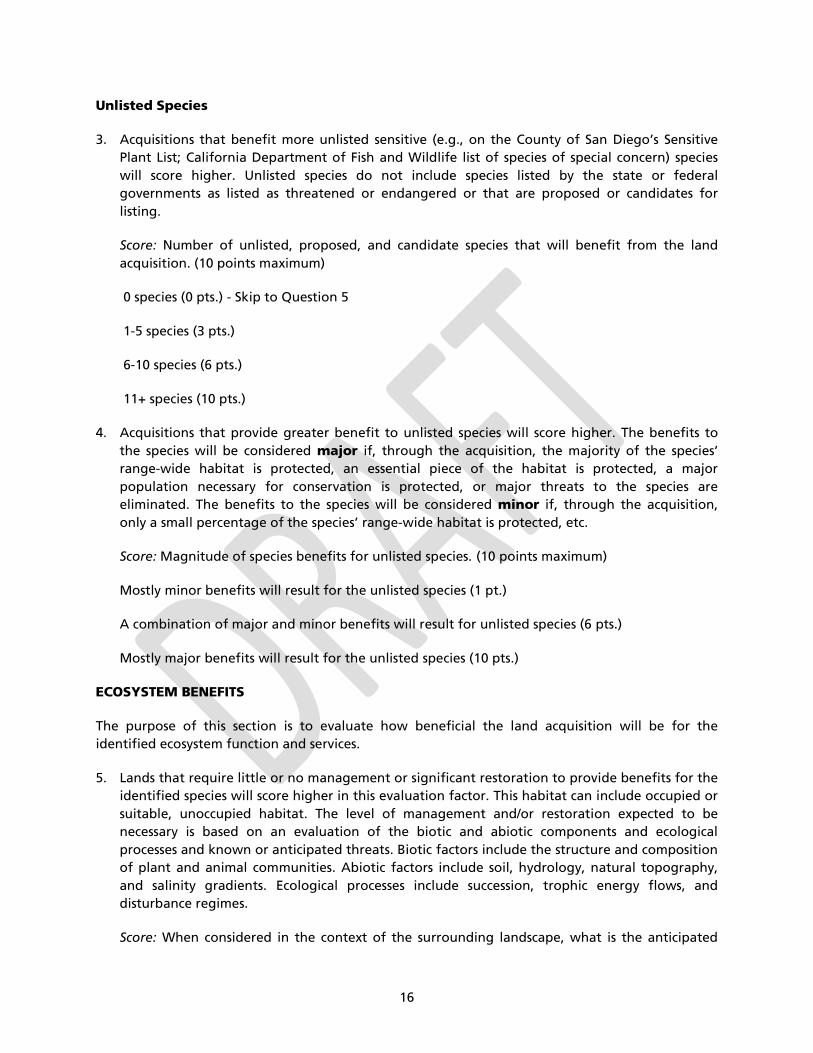
16
Unlisted Species
3. Acquisitions that benefit more unlisted sensitive (e.g., on the County of San Diego’s Sensitive Plant List; California Department of Fish and Wildlife list of species of special concern) species will score higher. Unlisted species do not include species listed by the state or federal governments as listed as threatened or endangered or that are proposed or candidates for listing.
Score: Number of unlisted, proposed, and candidate species that will benefit from the land acquisition. (10 points maximum)
0 species (0 pts.) - Skip to Question 5
1-5 species (3 pts.)
6-10 species (6 pts.)
11+ species (10 pts.)
4. Acquisitions that provide greater benefit to unlisted species will score higher. The benefits to the species will be considered major if, through the acquisition, the majority of the species’ range-wide habitat is protected, an essential piece of the habitat is protected, a major population necessary for conservation is protected, or major threats to the species are eliminated. The benefits to the species will be considered minor if, through the acquisition, only a small percentage of the species’ range-wide habitat is protected, etc.
Score: Magnitude of species benefits for unlisted species. (10 points maximum)
Mostly minor benefits will result for the unlisted species (1 pt.)
A combination of major and minor benefits will result for unlisted species (6 pts.)
Mostly major benefits will result for the unlisted species (10 pts.)
ECOSYSTEM BENEFITS
The purpose of this section is to evaluate how beneficial the land acquisition will be for the identified ecosystem function and services.
5. Lands that require little or no management or significant restoration to provide benefits for the identified species will score higher in this evaluation factor. This habitat can include occupied or suitable, unoccupied habitat. The level of management and/or restoration expected to be necessary is based on an evaluation of the biotic and abiotic components and ecological processes and known or anticipated threats. Biotic factors include the structure and composition of plant and animal communities. Abiotic factors include soil, hydrology, natural topography, and salinity gradients. Ecological processes include succession, trophic energy flows, and disturbance regimes.
Score: When considered in the context of the surrounding landscape, what is the anticipated
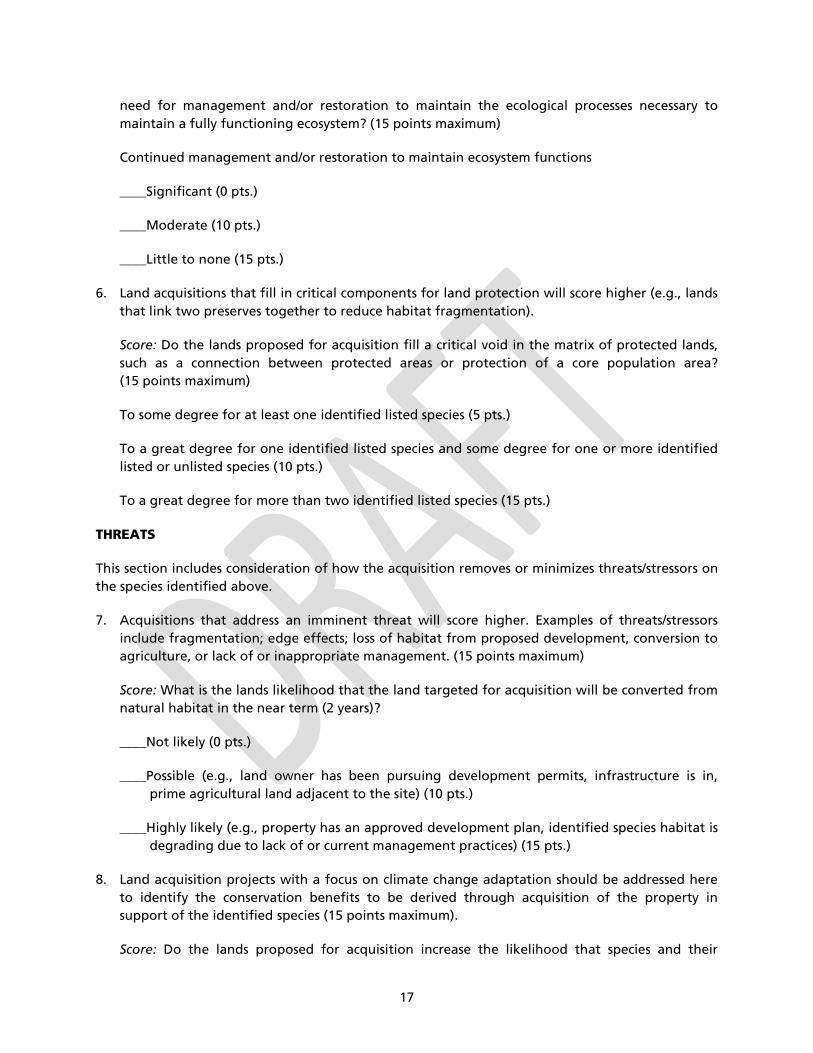
17
need for management and/or restoration to maintain the ecological processes necessary to maintain a fully functioning ecosystem? (15 points maximum)
Continued management and/or restoration to maintain ecosystem functions
____Significant (0 pts.)
____Moderate (10 pts.)
____Little to none (15 pts.)
6. Land acquisitions that fill in critical components for land protection will score higher (e.g., lands that link two preserves together to reduce habitat fragmentation).
Score: Do the lands proposed for acquisition fill a critical void in the matrix of protected lands, such as a connection between protected areas or protection of a core population area? (15 points maximum)
To some degree for at least one identified listed species (5 pts.)
To a great degree for one identified listed species and some degree for one or more identified listed or unlisted species (10 pts.)
To a great degree for more than two identified listed species (15 pts.)
THREATS
This section includes consideration of how the acquisition removes or minimizes threats/stressors on the species identified above.
7. Acquisitions that address an imminent threat will score higher. Examples of threats/stressors include fragmentation; edge effects; loss of habitat from proposed development, conversion to agriculture, or lack of or inappropriate management. (15 points maximum)
Score: What is the lands likelihood that the land targeted for acquisition will be converted from natural habitat in the near term (2 years)?
____Not likely (0 pts.)
____Possible (e.g., land owner has been pursuing development permits, infrastructure is in, prime agricultural land adjacent to the site) (10 pts.)
____Highly likely (e.g., property has an approved development plan, identified species habitat is degrading due to lack of or current management practices) (15 pts.)
8. Land acquisition projects with a focus on climate change adaptation should be addressed here to identify the conservation benefits to be derived through acquisition of the property in support of the identified species (15 points maximum).
Score: Do the lands proposed for acquisition increase the likelihood that species and their
18
habitats will be able to respond/adapt to climate changes (e.g., temperature and precipitation) or remove potential impediments to those responses?
____Not likely (0 pts.)
____Possible (8 pts.)
____Highly likely (15 pts.)
SPECIAL CONSIDERATIONS (15 points maximum).
This section documents special considerations that are not addressed in the above point scoring sections. Special considerations may include but are not limited to: percentage of matching funds; cost per acre for acquisition and/or management; significantly facilitates broader management goals beyond the targeted parcel boundaries; ancillary benefits (e.g., supports water quality, flood control, or wildfire management needs); completes or significantly benefits a local or regional acquisition strategy/opportunity; etc.
Acquisition Project
Evaluation Criteria Point Range
Maximum
Score Possible
Total Score
SPECIES BENEFIT
Listed Species
Number of Listed Species 0-10 10
Magnitude of Benefit 1-10 10
Unlisted Species
Number of Unlisted Species 0-10 10
Magnitude of Benefit 1-10 10
ECOSYSTEM BENEFIT
Landscape Context 0-15 15
Missing Linkage or Gap in Protection 5-15 15
THREATS
Land Under Imminent Threat 0-15 15
Necessary for Climate Change Adaptation 0-15 15
SPECIAL CONSIDERATIONS 0-5 15
Total 115
Total points score _______ (Maximum available = 115)
Recommendation
The Transportation Committee recommends that the Board of Directors approve the Regional Bike Plan Early Action Program with Scenario 1 as the preferred implementation option.
BOARD OF DIRECTORS AGENDA ITEM NO. 13-09-14
SEPTEMBER 27, 2013 ACTION REQUESTED – APPROVE
PROPOSED REGIONAL BIKE PLAN File Number 3300200 EARLY ACTION PROGRAM
Introduction
Riding to 2050: San Diego Regional Bicycle Plan (Bike Plan) was approved by the Board of Directors on May 28, 2010. The Bike Plan was developed to support implementation of the Regional Comprehensive Plan and the 2050 Regional Transportation Plan (RTP), both of which call for more transportation options and a balanced regional transportation system that supports smart growth and a more sustainable region.
On October 28, 2011, the Board of Directors made a major commitment to Active Transportation with the adoption of the 2050 RTP and its Sustainable Communities Strategy (SCS). The final action by the Board calls for beginning work on an Early Action Program (EAP) for the projects included in the Board-approved Bike Plan within six months of the 2050 RTP/SCS adoption as well as planning for a broader Active Transportation Program, including Safe Routes to School and Safe Routes to Transit, within two years of the 2050 RTP/SCS adoption. The Transportation Committee accepted the goals for the Bike Plan EAP framework on April 6, 2012. This action also included funding to initiate preliminary engineering and detailed cost estimates for the Bike EAP network.
The EAP and proposed implementation scenarios were presented to the Transportation Committee as an information item on July 19, 2013, and for action on September 20, 2013. Information about the July 19 Transportation Committee discussion is included in this report. Staff will provide a verbal summary of the September 20 discussion at the September 27, 2013, Board meeting.
Discussion
Transportation Committee Follow-Up
At its July 19, 2013, meeting, the Transportation Committee asked for a summary of the history of the Active Transportation Grant Program, which has provided competitive planning and capital grants to local jurisdictions since the 1970s. The Transportation Committee also noted the importance of having constituents and advocacy groups understand the impact the EAP would have on the Active Transportation Grant Program. Finally, the Transportation Committee asked that one of the scenarios that would eliminate the Active Transportation Grant Program (Scenario 4) be removed for further consideration. This report will address the issues raised by the Transportation Committee and present a
2
review of the three remaining Bike Plan EAP funding options, a summary of the funding assumptions, and description of the overall programmatic approach for implementation of the Bike EAP network.
Active Transportation Grant Summary
Table 1 shows a historical summary of the Active Transportation Grant Program grant funding allocations from FY 2005 to FY 2012. During this period, the process for funding allocations has included a defined set of evaluation criteria approved by the Transportation Committee and applied to the projects submitted through a competitive call for projects. During this time, funding also was allocated to both local and regional bikeway projects. The EAP would potentially reduce the historical amount of grant funding allocated to local projects (that are not part of the regional network) from an average of $1.8 million per year to $1 million per year.
Table 1 - Active Transportation Grant Program Historical Funding Summary
Fiscal Year Total Funding
Available (in $ millions)
Local Plans and Projects
(in $ millions)
Regional Bikeway Projects
(in $ millions)
Percentage of Funding for
Regional Projects
2005 4.2 1.7 2.5 59% 2006 3.7 2.0 1.7 45% 2007 3.7 1.5 2.2 60% 2008 4.2 1.0 3.2 77% 20091 7.3 -- 6.8 93% 2010 7.8 3.2 4.6 59% 20112 -- -- -- -- 2012 15.6 5.1 10.5 67%
Notes:
1 No FY 2009 call for local plans and projects. All allocated funding went to regional projects: Inland Rail Trail, Bayshore Bikeway, and Lake Hodges Bridge. Balance of funding went into reserves and was applied to the FY 2010 Call for Projects.
2 No FY 2011 call for local plans and projects. In April 2011, $7.6 million was allocated to initial Regional Bike Plan implementation. Balance of funding was put toward combined FY 2011 and FY 2012 Call for Projects.
Active Transportation Advocacy Support
Staff has met with the Active Transportation-related advocacy groups in the region to explain the EAP and ensure that they understand that moving forward with the EAP could reduce the historical amount of funding available for local projects in the competitive Active Transportation Grant Program to $1 million per year. Some examples of the types of projects that have been funded through the Active Transportation Grant Program include local bicycle and pedestrian projects, bicycle and pedestrian master plans, education and awareness initiatives, and bike racks. It should be noted that stand-alone bicycle and pedestrian projects are eligible for funding within the TransNet Local Streets and Roads Program. The San Diego County Bicycle Coalition, WalkSanDiego, Move San Diego, and BikeSD are in support of advancing the Bike Plan EAP.
3
EAP Framework Goals
The accepted framework goals used to develop the Bike Plan EAP and funding strategy are as follows:
• Overall goal is to implement the Regional Bicycle Network High Priority Projects within 10 years
• Execute Regional Bicycle Programs to support the Regional Bicycle Network as outlined in the Bike Plan
• Continue to fund local bicycle and pedestrian plans, programs, and projects through a competitive grant program
In accordance with the framework goals, the projects proposed for the Regional Bike Plan EAP listed in Attachment 1 were prioritized using the criteria as shown in Attachment 2.
Preliminary Engineering and Cost Estimates
The Regional Bike Plan cost estimates were developed by SANDAG engineering and planning staff with the assistance of two engineering consulting teams. The summary project costs shown in Attachment 1 are the estimated costs to complete the projects. Project costs include planning, environmental approval, preliminary engineering, design, right-of-way acquisition, review and permitting, construction, construction management, a project contingency, and administrative costs, including communications and legal. Similar to the way Transportation Demand Management measures are a part of regional major corridor projects, the estimated construction costs for regional bikeway projects also include programmatic elements, such as targeted marketing efforts and community-based travel planning that will support the capital investments for construction of the Regional Bicycle Network in order to maximize usage and safety.
Implementation Options
One of the EAP framework goals is to continue funding the local grant program. This goal is an influential factor in determining the funding capacity of the Bike EAP and was used to develop the proposed scenarios. Four preliminary financial scenarios were initially evaluated, and based on Transportation Committee feedback, one was eliminated, leaving the three scenarios shown in Table 2. No changes were made to Scenarios 1 to 3 from what was initially presented to the Transportation Committee in July. In each scenario, assumptions for the investment levels for the Bike EAP and the grant program varied. The analysis shows that positive fund balances and adequate debt service coverage are maintained for the program during a 20-year analysis period, from 2014 to 2033.
Table 2 - Bike EAP Financial Analysis (Year of Expenditure – Dollars)
Scenario 1 Scenario 2 Scenario 3 EAP Amount $200M $170M $210M Annual Grant Amount $1M $2M $1M Grant Starting Year 2014 2014 2024 Does it maintain positive fund balance and adequate debt service coverage through the 20-year analysis period (2014-2033)?
Yes Yes Yes
4
The analysis shows the impacts of having varying investment levels for the Bike EAP ($170 million to $210 million), different annual grant amounts ($1 million or $2 million), and different annual grant program starting years (2014 vs. 2024).
Attachment 1 shows the proposed project priority list, with the $200 million Scenario 1 funding cut-off shown for illustration purposes. The other scenario funding cut-offs and corresponding project lists can be found by using the rolling total cost column in Attachment 1. Attachment 3 is a map showing all of the proposed projects that are listed in Attachment 1.
The scenarios illustrate how increasing the size of the annual grant program from $1 million (Scenario 1) to $2 million (Scenario 2) would reduce the size of the Bike EAP by approximately $30 million. Deferring the start of a grant program from 2014 (Scenario 1) to 2024 (Scenario 3) adds approximately $10 million to the potential size of the EAP, from about $200 million to $210 million. All three scenarios are similar in terms of the adequately covering the debt payments that would be required.
It is proposed to initially use the existing SANDAG commercial paper program as the means for financing the projects as the overall EAP ramps up. This strategy allows for borrowing only what is needed on an ongoing basis until the program is fully up and running. The potential to transfer the financing to long-term bonds could then be evaluated each time a new bond issuance is contemplated for the overall TransNet Program during the regular updates of the TransNet Program Plan of Finance (POF).
Preferred Implementation Scenario
Staff believes Scenario 1 (shown in Table 2) would provide the best balance among the EAP framework goals to advance the implementation of the Regional Bike Network and maintain funding for local projects through the Active Transportation Grant Program. The $200 million proposed as part of Scenario 1 would enable the region to leverage and compete for non-local funding sources.
Revenue Assumptions and Other Funding Opportunities
The assumptions for the revenues include the 2 percent TransNet Bicycle, Pedestrian, and Neighborhood Safety Program, and the Transportation Development Act Non-motorized Program.
The Bike EAP is modeled after the Board’s current TransNet EAP, which has advanced TransNet Major Corridor projects around the region. The EAP concept has enabled the construction of a number of major transportation projects, and has allowed others to move forward to construction readiness, which helps position the region well if additional funds become available. To maximize funding opportunities from other sources, the Bike EAP implementation would be timed to have different projects in every stage of development. All projects would be moving toward the construction phase on a rolling timeline, so at any given time there would be projects that are close to being “shovel ready” for construction. Partnerships and coordination with other regional and local projects are other opportunities that would be actively pursued by the project development team.
Potential funding opportunities could include the Transportation Alternatives Program that was included in the federal surface transportation authorization, Moving Ahead for Progress in the 21st Century, and for which specific state legislation is pending to determine the project selection and distribution processes. This program, in part, replaces the long-standing Transportation Enhancements
5
federal funding program under which the region has historically been successful in competing for past regional bicycle projects.
Other opportunities could include future state and federal funds, including infrastructure bond measures and grant funds from environmental conservancies. In the event that the region is successful in securing additional funds, they would be incorporated into the annual TransNet POF update to identify potential additional opportunities to defer debt financing or advance additional bike projects. Changes to assumptions in project costs and schedules, and to revenues, would be included in the annual TransNet POF update reviewed by the Board each year.
Other Issues
Supporting Programs
With the implementation of the projects as part of the proposed Bike Plan EAP, it is proposed to integrate and coordinate other supporting programs within the individual project budgets, with the goal of increasing the number of people riding bikes for transportation. For example, targeted marketing efforts and community-based travel planning could be employed in a particular corridor to encourage greater usage of a new bike facility.
Data Collection, Evaluation, and Modeling
Proper planning for active transportation requires up-to-date and accurate data and model information on bicyclists, pedestrians, and the facilities they use. Development of the Regional Bike Plan EAP would be coordinated closely with ongoing data collection, evaluation, and monitoring efforts. Funding for this program was approved as part of the initial implementation efforts so that baseline data could be collected, and a bicycle/pedestrian model could be developed in time for incorporation into the Activity-Based Model that will be used to develop San Diego Forward: The Regional Plan. The Activity-Based Model under development relies on data to improve analyses of bicycle/pedestrian usage. Funding for this program is allowing SANDAG to collect pertinent data, establish evaluation criteria, and develop a framework to monitor the impact of investments in active transportation.
Next Steps
Pending approval by the Board of Directors on the Regional Bike Plan EAP, Capital Improvement Program budget amendments would be prepared for work that is anticipated for FY 2014 and FY 2015. These proposed budget amendments would be brought back to the Transportation Committee and Board of Directors for their future consideration.
GARY L. GALLEGOS Executive Director
Attachments: 1. Regional Bike Plan EAP – Proposed Project Priority 2. Regional Bike Plan EAP – Prioritization for Proposed Phasing 3. Regional Bike Plan EAP – Map Key Staff Contact: Chris Kluth, (619) 699-1952, [email protected]
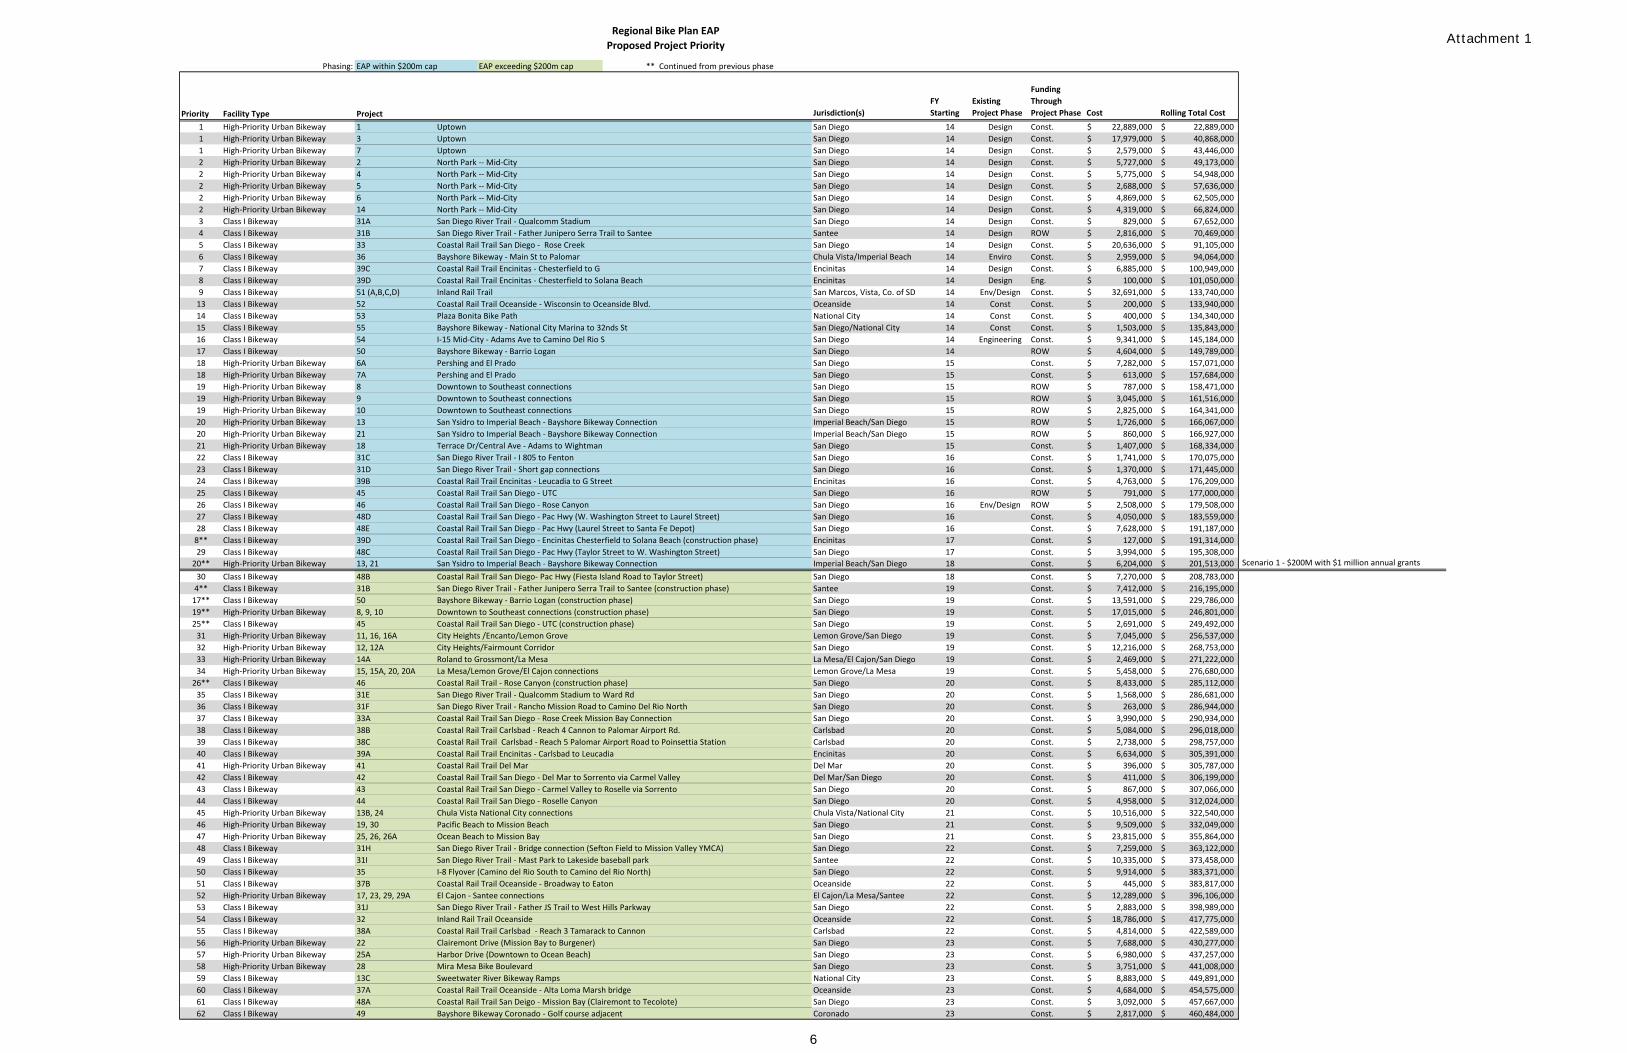
Regional Bike Plan EAPProposed Project Priority
Phasing: EAP within $200m cap EAP exceeding $200m cap ** Continued from previous phase
Priority Facility Type Project Jurisdiction(s)FY Starting
Existing Project Phase
Funding Through Project Phase Cost Rolling Total Cost
1 High-Priority Urban Bikeway 1 Uptown San Diego 14 Design Const. 22,889,000$ 22,889,000$ 1 High-Priority Urban Bikeway 3 Uptown San Diego 14 Design Const. 17,979,000$ 40,868,000$ 1 High-Priority Urban Bikeway 7 Uptown San Diego 14 Design Const. 2,579,000$ 43,446,000$ 2 High-Priority Urban Bikeway 2 North Park -- Mid-City San Diego 14 Design Const. 5,727,000$ 49,173,000$ 2 High-Priority Urban Bikeway 4 North Park -- Mid-City San Diego 14 Design Const. 5,775,000$ 54,948,000$ 2 High-Priority Urban Bikeway 5 North Park -- Mid-City San Diego 14 Design Const. 2,688,000$ 57,636,000$ 2 High-Priority Urban Bikeway 6 North Park -- Mid-City San Diego 14 Design Const. 4,869,000$ 62,505,000$ 2 High-Priority Urban Bikeway 14 North Park -- Mid-City San Diego 14 Design Const. 4,319,000$ 66,824,000$ 3 Class I Bikeway 31A San Diego River Trail - Qualcomm Stadium San Diego 14 Design Const. 829,000$ 67,652,000$ 4 Class I Bikeway 31B San Diego River Trail - Father Junipero Serra Trail to Santee Santee 14 Design ROW 2,816,000$ 70,469,000$ 5 Class I Bikeway 33 Coastal Rail Trail San Diego - Rose Creek San Diego 14 Design Const. 20,636,000$ 91,105,000$ 6 Class I Bikeway 36 Bayshore Bikeway - Main St to Palomar Chula Vista/Imperial Beach 14 Enviro Const. 2,959,000$ 94,064,000$ 7 Class I Bikeway 39C Coastal Rail Trail Encinitas - Chesterfield to G Encinitas 14 Design Const. 6,885,000$ 100,949,000$ 8 Class I Bikeway 39D Coastal Rail Trail Encinitas - Chesterfield to Solana Beach Encinitas 14 Design Eng. 100,000$ 101,050,000$ 9 Class I Bikeway 51 (A,B,C,D) Inland Rail Trail San Marcos, Vista, Co. of SD 14 Env/Design Const. 32,691,000$ 133,740,000$
13 Class I Bikeway 52 Coastal Rail Trail Oceanside - Wisconsin to Oceanside Blvd. Oceanside 14 Const Const. 200,000$ 133,940,000$ 14 Class I Bikeway 53 Plaza Bonita Bike Path National City 14 Const Const. 400,000$ 134,340,000$ 15 Class I Bikeway 55 Bayshore Bikeway - National City Marina to 32nds St San Diego/National City 14 Const Const. 1,503,000$ 135,843,000$ 16 Class I Bikeway 54 I-15 Mid-City - Adams Ave to Camino Del Rio S San Diego 14 Engineering Const. 9,341,000$ 145,184,000$ 17 Class I Bikeway 50 Bayshore Bikeway - Barrio Logan San Diego 14 ROW 4,604,000$ 149,789,000$ 18 High-Priority Urban Bikeway 6A Pershing and El Prado San Diego 15 Const. 7,282,000$ 157,071,000$ 18 High-Priority Urban Bikeway 7A Pershing and El Prado San Diego 15 Const. 613,000$ 157,684,000$ 19 High-Priority Urban Bikeway 8 Downtown to Southeast connections San Diego 15 ROW 787,000$ 158,471,000$ 19 High-Priority Urban Bikeway 9 Downtown to Southeast connections San Diego 15 ROW 3,045,000$ 161,516,000$ 19 High-Priority Urban Bikeway 10 Downtown to Southeast connections San Diego 15 ROW 2,825,000$ 164,341,000$ 20 High-Priority Urban Bikeway 13 San Ysidro to Imperial Beach - Bayshore Bikeway Connection Imperial Beach/San Diego 15 ROW 1,726,000$ 166,067,000$ 20 High-Priority Urban Bikeway 21 San Ysidro to Imperial Beach - Bayshore Bikeway Connection Imperial Beach/San Diego 15 ROW 860,000$ 166,927,000$ 21 High-Priority Urban Bikeway 18 Terrace Dr/Central Ave - Adams to Wightman San Diego 15 Const. 1,407,000$ 168,334,000$ 22 Class I Bikeway 31C San Diego River Trail - I 805 to Fenton San Diego 16 Const. 1,741,000$ 170,075,000$ 23 Class I Bikeway 31D San Diego River Trail - Short gap connections San Diego 16 Const. 1,370,000$ 171,445,000$ 24 Class I Bikeway 39B Coastal Rail Trail Encinitas - Leucadia to G Street Encinitas 16 Const. 4,763,000$ 176,209,000$ 25 Class I Bikeway 45 Coastal Rail Trail San Diego - UTC San Diego 16 ROW 791,000$ 177,000,000$ 26 Class I Bikeway 46 Coastal Rail Trail San Diego - Rose Canyon San Diego 16 Env/Design ROW 2,508,000$ 179,508,000$ 27 Class I Bikeway 48D Coastal Rail Trail San Diego - Pac Hwy (W. Washington Street to Laurel Street) San Diego 16 Const. 4,050,000$ 183,559,000$ 28 Class I Bikeway 48E Coastal Rail Trail San Diego - Pac Hwy (Laurel Street to Santa Fe Depot) San Diego 16 Const. 7,628,000$ 191,187,000$
8** Class I Bikeway 39D Coastal Rail Trail San Diego - Encinitas Chesterfield to Solana Beach (construction phase) Encinitas 17 Const. 127,000$ 191,314,000$ 29 Class I Bikeway 48C Coastal Rail Trail San Diego - Pac Hwy (Taylor Street to W. Washington Street) San Diego 17 Const. 3,994,000$ 195,308,000$
20** High-Priority Urban Bikeway 13, 21 San Ysidro to Imperial Beach - Bayshore Bikeway Connection Imperial Beach/San Diego 18 Const. 6,204,000$ 201,513,000$ Scenario 1 - $200M with $1 million annual grants 30 Class I Bikeway 48B Coastal Rail Trail San Diego- Pac Hwy (Fiesta Island Road to Taylor Street) San Diego 18 Const. 7,270,000$ 208,783,000$
4** Class I Bikeway 31B San Diego River Trail - Father Junipero Serra Trail to Santee (construction phase) Santee 19 Const. 7,412,000$ 216,195,000$ 17** Class I Bikeway 50 Bayshore Bikeway - Barrio Logan (construction phase) San Diego 19 Const. 13,591,000$ 229,786,000$ 19** High-Priority Urban Bikeway 8, 9, 10 Downtown to Southeast connections (construction phase) San Diego 19 Const. 17,015,000$ 246,801,000$ 25** Class I Bikeway 45 Coastal Rail Trail San Diego - UTC (construction phase) San Diego 19 Const. 2,691,000$ 249,492,000$
31 High-Priority Urban Bikeway 11, 16, 16A City Heights /Encanto/Lemon Grove Lemon Grove/San Diego 19 Const. 7,045,000$ 256,537,000$ 32 High-Priority Urban Bikeway 12, 12A City Heights/Fairmount Corridor San Diego 19 Const. 12,216,000$ 268,753,000$ 33 High-Priority Urban Bikeway 14A Roland to Grossmont/La Mesa La Mesa/El Cajon/San Diego 19 Const. 2,469,000$ 271,222,000$ 34 High-Priority Urban Bikeway 15, 15A, 20, 20A La Mesa/Lemon Grove/El Cajon connections Lemon Grove/La Mesa 19 Const. 5,458,000$ 276,680,000$
26** Class I Bikeway 46 Coastal Rail Trail - Rose Canyon (construction phase) San Diego 20 Const. 8,433,000$ 285,112,000$ 35 Class I Bikeway 31E San Diego River Trail - Qualcomm Stadium to Ward Rd San Diego 20 Const. 1,568,000$ 286,681,000$ 36 Class I Bikeway 31F San Diego River Trail - Rancho Mission Road to Camino Del Rio North San Diego 20 Const. 263,000$ 286,944,000$ 37 Class I Bikeway 33A Coastal Rail Trail San Diego - Rose Creek Mission Bay Connection San Diego 20 Const. 3,990,000$ 290,934,000$ 38 Class I Bikeway 38B Coastal Rail Trail Carlsbad - Reach 4 Cannon to Palomar Airport Rd. Carlsbad 20 Const. 5,084,000$ 296,018,000$ 39 Class I Bikeway 38C Coastal Rail Trail Carlsbad - Reach 5 Palomar Airport Road to Poinsettia Station Carlsbad 20 Const. 2,738,000$ 298,757,000$ 40 Class I Bikeway 39A Coastal Rail Trail Encinitas - Carlsbad to Leucadia Encinitas 20 Const. 6,634,000$ 305,391,000$ 41 High-Priority Urban Bikeway 41 Coastal Rail Trail Del Mar Del Mar 20 Const. 396,000$ 305,787,000$ 42 Class I Bikeway 42 Coastal Rail Trail San Diego - Del Mar to Sorrento via Carmel Valley Del Mar/San Diego 20 Const. 411,000$ 306,199,000$ 43 Class I Bikeway 43 Coastal Rail Trail San Diego - Carmel Valley to Roselle via Sorrento San Diego 20 Const. 867,000$ 307,066,000$ 44 Class I Bikeway 44 Coastal Rail Trail San Diego - Roselle Canyon San Diego 20 Const. 4,958,000$ 312,024,000$ 45 High-Priority Urban Bikeway 13B, 24 Chula Vista National City connections Chula Vista/National City 21 Const. 10,516,000$ 322,540,000$ 46 High-Priority Urban Bikeway 19, 30 Pacific Beach to Mission Beach San Diego 21 Const. 9,509,000$ 332,049,000$ 47 High-Priority Urban Bikeway 25, 26, 26A Ocean Beach to Mission Bay San Diego 21 Const. 23,815,000$ 355,864,000$ 48 Class I Bikeway 31H San Diego River Trail - Bridge connection (Sefton Field to Mission Valley YMCA) San Diego 22 Const. 7,259,000$ 363,122,000$ 49 Class I Bikeway 31I San Diego River Trail - Mast Park to Lakeside baseball park Santee 22 Const. 10,335,000$ 373,458,000$ 50 Class I Bikeway 35 I-8 Flyover (Camino del Rio South to Camino del Rio North) San Diego 22 Const. 9,914,000$ 383,371,000$ 51 Class I Bikeway 37B Coastal Rail Trail Oceanside - Broadway to Eaton Oceanside 22 Const. 445,000$ 383,817,000$ 52 High-Priority Urban Bikeway 17, 23, 29, 29A El Cajon - Santee connections El Cajon/La Mesa/Santee 22 Const. 12,289,000$ 396,106,000$ 53 Class I Bikeway 31J San Diego River Trail - Father JS Trail to West Hills Parkway San Diego 22 Const. 2,883,000$ 398,989,000$ 54 Class I Bikeway 32 Inland Rail Trail Oceanside Oceanside 22 Const. 18,786,000$ 417,775,000$ 55 Class I Bikeway 38A Coastal Rail Trail Carlsbad - Reach 3 Tamarack to Cannon Carlsbad 22 Const. 4,814,000$ 422,589,000$ 56 High-Priority Urban Bikeway 22 Clairemont Drive (Mission Bay to Burgener) San Diego 23 Const. 7,688,000$ 430,277,000$ 57 High-Priority Urban Bikeway 25A Harbor Drive (Downtown to Ocean Beach) San Diego 23 Const. 6,980,000$ 437,257,000$ 58 High-Priority Urban Bikeway 28 Mira Mesa Bike Boulevard San Diego 23 Const. 3,751,000$ 441,008,000$ 59 Class I Bikeway 13C Sweetwater River Bikeway Ramps National City 23 Const. 8,883,000$ 449,891,000$ 60 Class I Bikeway 37A Coastal Rail Trail Oceanside - Alta Loma Marsh bridge Oceanside 23 Const. 4,684,000$ 454,575,000$ 61 Class I Bikeway 48A Coastal Rail Trail San Deigo - Mission Bay (Clairemont to Tecolote) San Diego 23 Const. 3,092,000$ 457,667,000$ 62 Class I Bikeway 49 Bayshore Bikeway Coronado - Golf course adjacent Coronado 23 Const. 2,817,000$ 460,484,000$
Attachment 1
6
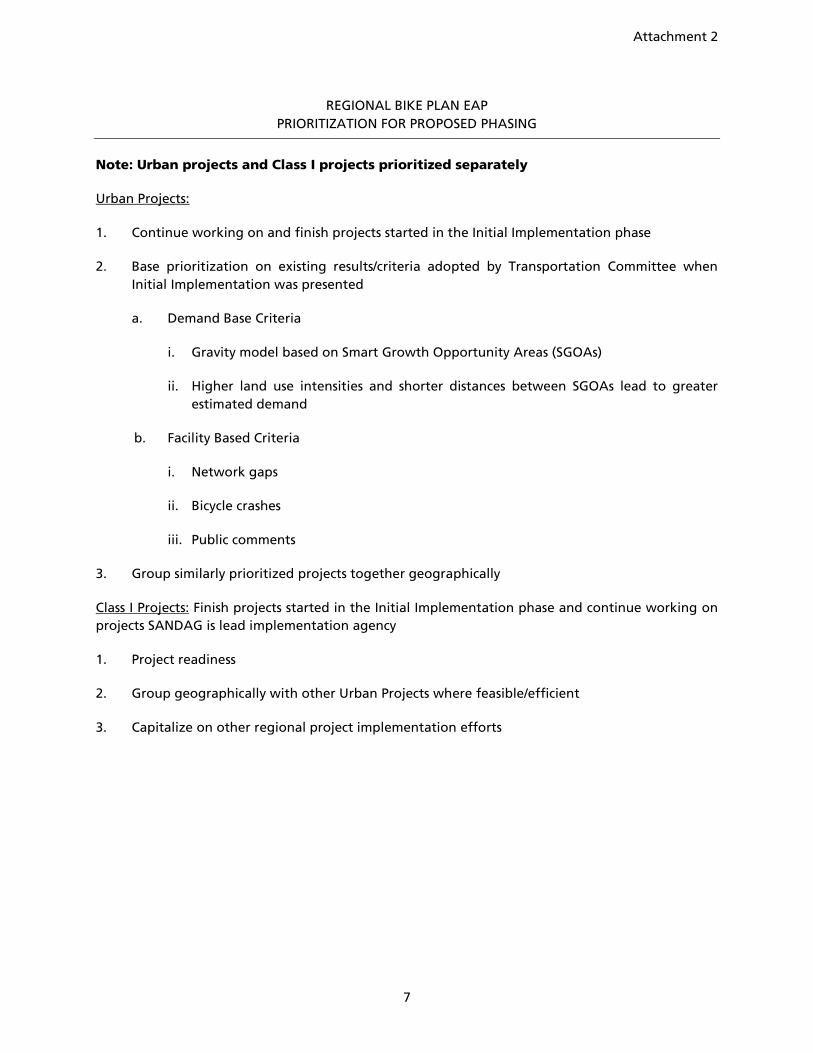
Attachment 2
7
REGIONAL BIKE PLAN EAP PRIORITIZATION FOR PROPOSED PHASING
Note: Urban projects and Class I projects prioritized separately
Urban Projects:
1. Continue working on and finish projects started in the Initial Implementation phase
2. Base prioritization on existing results/criteria adopted by Transportation Committee when Initial Implementation was presented
a. Demand Base Criteria
i. Gravity model based on Smart Growth Opportunity Areas (SGOAs)
ii. Higher land use intensities and shorter distances between SGOAs lead to greater estimated demand
b. Facility Based Criteria
i. Network gaps
ii. Bicycle crashes
iii. Public comments
3. Group similarly prioritized projects together geographically
Class I Projects: Finish projects started in the Initial Implementation phase and continue working on projects SANDAG is lead implementation agency
1. Project readiness
2. Group geographically with other Urban Projects where feasible/efficient
3. Capitalize on other regional project implementation efforts

!"̂$
?j
AÀ
!"_$
Aù
!"̂$
!"̂$
!"a$
%&s(
?Þ
A§
?z
!"̂$
%&s(
?h
A©
%&s(
!"a$
AÛ
A×
A×
?t
A×
A×
SANDIEGO
CARLSBAD
CHULAVISTA
CORONADO
DELMAR
ELCAJON
ENCINITAS
ESCONDIDO
IMPERIALBEACH
LAMESA
LEMONGROVE
NATIONALCITY
OCEANSIDE
POWAY
SANDIEGO
SANMARCOS
SANTEE
SOLANABEACH
VISTA
31F
05
37B
13
10
17
31E
52
2931C
53
51
07
29A
15A26A
06
03
37A
36
33A
43
31A
25A
38B
26
41
22
07A
49
54
38C
15
45
48B
39B
18
23
38A
44
39D
39A
42
20A
48A
13B
48C
12A
06A01
39C
1109
1225
31B
33
3019
21
16
28
50
16A
24
31J
02
55
14
31I
14A
46
04
32
31D
20
13C
31H35
0848E
48D
Pacific Ocean
MEXICO
DRAFT
Date: 7/9/2013Active Transportation Program
Projects 48B, 31B, 50, 8, 9, and10 funded through ROW.
Regional Bicycle PlanEarly Action Program
Projects within $200M Capacity
Urban Route
Class I Route
Projects above $200M Capacity
Urban Route
Class I Route
Regional Bike Network
Future
Existing
Project Done by Others
Major Roads and Highways I
Attachment 3
8
Recommendation
The Board of Directors is asked to: (1) adopt the Final Mitigated Negative Declaration for the Downtown Bus Rapid Transit Stations (Attachment 1); and (2) adopt the Mitigation Monitoring and Reporting Program (Attachment 3).
BOARD OF DIRECTORS AGENDA ITEM NO. 13-09-15
SEPTEMBER 27, 2013 ACTION REQUESTED – ADOPT
FINAL MITIGATED NEGATIVE DECLARATION FOR File Number 1201509 DOWNTOWN SAN DIEGO BUS RAPID TRANSIT STATIONS
Introduction
In accordance with the California Environmental Quality Act (CEQA), SANDAG has prepared a Mitigated Negative Declaration (MND) for Bus Rapid Transit (BRT) station improvements in downtown San Diego (Attachment 1). The proposed stations are intended to provide enhanced pedestrian access to three new BRT or Rapid lines, previously approved by the Board of Directors, which are planned to begin operations in 2014 and 2015. Staff estimates that the station improvements, if approved by the Board of Directors, would be completed by April 2015.
Discussion
Downtown BRT Operations Background
As part of the TransNet Early Action Program, new transit services will begin operating in the San Diego region in 2014: the Interstate 15 Corridor BRT, and the Mid-City Rapid Bus, followed in 2015 by the South Bay BRT. Each of these BRT/Rapid lines was previously approved by the Board of Directors. Each line will operate along Broadway given its central proximity to downtown employment, retail, residential, and entertainment destinations; and they will tie into the Santa Fe Depot station, where transfers can be made to Amtrak, COASTER, existing San Diego Trolley lines, and the future Mid-Coast Corridor extension. The BRT/Rapid lines will terminate in the west end of downtown, as called for in the 2050 Regional Transportation Plan and City of San Diego Downtown Community Plan.
Proposed Bus Rapid Transit Stations
The proposed BRT stations would be located near key downtown activity centers and various Trolley/local bus transfer points along Broadway. The BRT stations are proposed at the following locations (Attachment 2):
• Smart Corner (Broadway between Eleventh Avenue and Park Boulevard)
• Eleventh Avenue at B Street
2
• Park Boulevard at Broadway
• Broadway between Fourth Avenue and Fifth Avenue
• Broadway between Front Street and Union Street (westbound); Broadway between Front Street and First Avenue (eastbound)
• India Street and Kettner Boulevard just north of Broadway, adjacent to One America Plaza and the Santa Fe Depot
From a customer experience standpoint, a key aim of the BRT services is to create a “Trolley-like” service in terms of travel speed, service frequency, span of service, and customer amenities. The branding of BRT vehicles and stations is an important element of the customer experience by creating a distinct identity that passengers can easily recognize.
The final design for the stations would include:
• New shelters and pylons branded consistent with BRT service
• Real-time digital displays announcing next vehicle arrival times
• Security features, including two cameras for complete coverage in and around the stations
• Lean rails (rather than benches) to discourage loitering
• Lighting in the shelter and on the pylons
• Overall pavement and drainage upgrades, replacing street trees with larger trees of the same species, new or replaced paving, drainage improvements, and Americans with Disabilities Act-compliant curb upgrades
Final Mitigated Negative Declaration
The Final MND consists of: (1) the Draft MND, including revisions; (2) all appendices to the Draft MND; (3) comments received on the Draft MND, and (4) responses to comments. The Draft MND was released for a 30-day public comment period between June 10, 2013, and July 9, 2013. A public meeting was held at SANDAG during the public comment period to receive comments and answer any questions about the project.
Thirty-six comments were received on the Draft MND. SANDAG received comments from two state agencies, two organizations, and thirty-two individuals. Written responses to the comments are provided in Appendix E of the Final MND (Attachment 1).
The majority of the comments are related to bus operations in Downtown San Diego that will occur as a result of the approved BRT lines. The operation of these buses will occur with or without the proposed station improvements. The potential environmental impacts of the approved BRT operations were identified in CEQA-compliant documents previously certified and adopted by SANDAG. Therefore, the MND does not include analysis of bus operations, nor is such analysis required for this project by CEQA.
3
The Final MND incorporates the minor revisions made to the Draft MND as a result of other comments received during the public review period as well as other minor clarifications and revisions. All changes to the Draft MND are shown in strikeout underline format in the Final MND. The Final MND concludes there would be no significant environmental impacts associated with construction or operation of the proposed BRT stations. None of the comments received or other changes to the Draft MND change the overall conclusion of the Draft MND.
Additionally, staff has prepared a Mitigation Monitoring and Reporting Program (MMRP) in compliance with Public Resources Code 21081.6 and CEQA Guidelines 15097 to ensure compliance with the mitigation measure identified in the MND during project construction (Attachment 3). The MMRP includes one measure, which would require archaeological monitoring during any trenching, excavation, or grading within the Gaslamp Quarter Historic District and adjacent to Santa Fe Depot. This measure would ensure that significant effects would not occur to any resources that may be present.
Next Steps
Pending the adoption of the MND today by the Board of Directors, construction of the BRT stations is anticipated to begin in summer 2014 and take approximately one year to complete. The BRT/Rapid services scheduled for implementation prior to the completion of the BRT stations would operate utilizing existing local bus stops during an interim period.
GARY L. GALLEGOS Executive Director
Attachments: 1. Final Mitigated Negative Declaration (available via separate download) 2. Downtown San Diego BRT Station Map 3. Mitigation Monitoring and Reporting Program
Key Staff Contact: Jennifer Williamson, (619) 699-1959, [email protected]
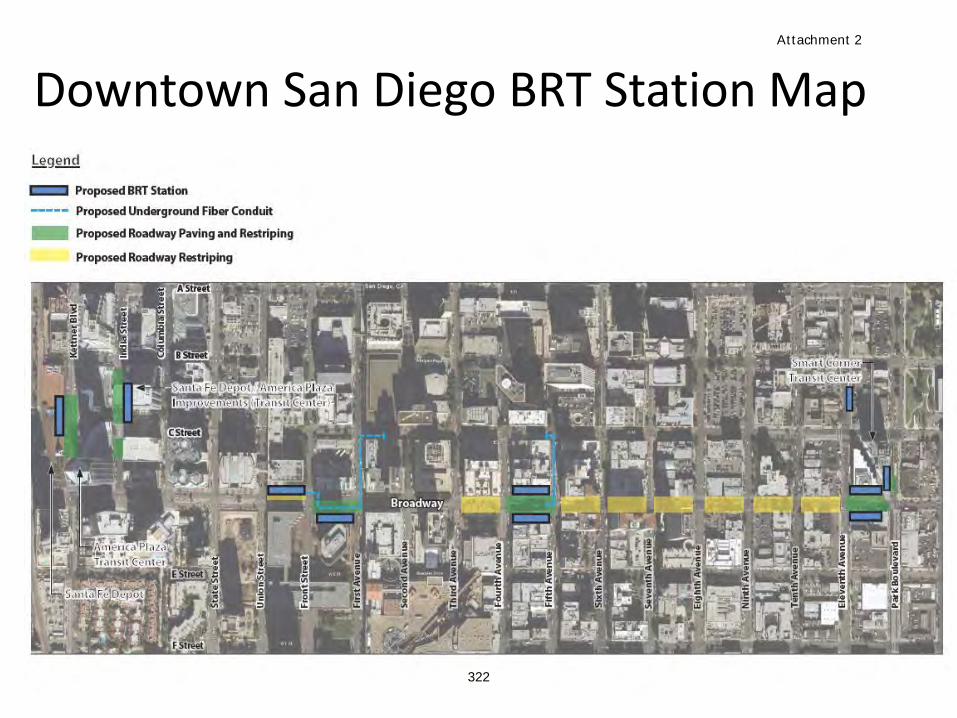
Downtown San Diego BRT Station Map
1 1
Attachment 2
322
Mitigation Monitoring and Reporting Program for the Downtown San Diego Bus Rapid Transit Stations
1. Purpose and Intended Use of the Mitigation Monitoring and Reporting Program
The California Environmental Quality Act (CEQA; California Public Resources Code §21081.6) requires public agencies to adopt a monitoring and reporting program for the revisions which it has required in the project and the measures it has imposed to mitigate or avoid significant environmental effects. In order to ensure implementation of the mitigation measure identified in the Mitigated Negative Declaration (MND), SANDAG shall adopt a Mitigation Monitoring and Reporting Program (MMRP). This MMRP has been prepared in accordance with the proposed Downtown San Diego Bus Rapid Transit (BRT) Stations Project, the environmental effects of which have been evaluated in an MND prepared in compliance with CEQA and the CEQA Guidelines.
This MMRP identifies the mitigation measure that shall be implemented by SANDAG as the responsible party and the timing of implementation. SANDAG may delegate the reporting or monitoring responsibilities identified below to another entity that accepts the delegation (such as a construction contractor). However, until the mitigation measure included in the MMRP has been completed, SANDAG remains responsible for ensuring that implementation occurs in accordance with the adopted program (CEQA Guidelines §15097[a]).
Downtown San Diego Bus Rapid Transit Stations Page 1 of 2 Mitigation Monitoring and Reporting Program September 2013
Attachment 3
232323
mmo
Rectangle
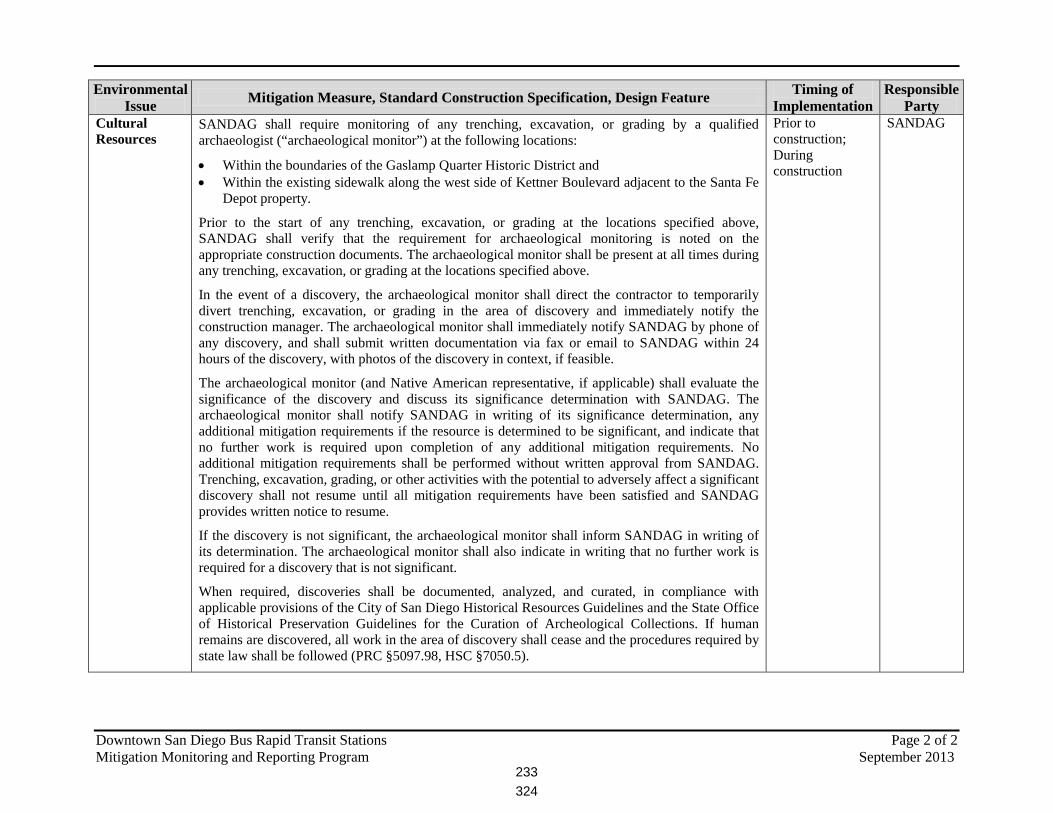
Environmental Issue Mitigation Measure, Standard Construction Specification, Design Feature Timing of
Implementation Responsible
Party Cultural Resources
SANDAG shall require monitoring of any trenching, excavation, or grading by a qualified archaeologist (“archaeological monitor”) at the following locations:
• Within the boundaries of the Gaslamp Quarter Historic District and • Within the existing sidewalk along the west side of Kettner Boulevard adjacent to the Santa Fe
Depot property.
Prior to the start of any trenching, excavation, or grading at the locations specified above, SANDAG shall verify that the requirement for archaeological monitoring is noted on the appropriate construction documents. The archaeological monitor shall be present at all times during any trenching, excavation, or grading at the locations specified above.
In the event of a discovery, the archaeological monitor shall direct the contractor to temporarily divert trenching, excavation, or grading in the area of discovery and immediately notify the construction manager. The archaeological monitor shall immediately notify SANDAG by phone of any discovery, and shall submit written documentation via fax or email to SANDAG within 24 hours of the discovery, with photos of the discovery in context, if feasible.
The archaeological monitor (and Native American representative, if applicable) shall evaluate the significance of the discovery and discuss its significance determination with SANDAG. The archaeological monitor shall notify SANDAG in writing of its significance determination, any additional mitigation requirements if the resource is determined to be significant, and indicate that no further work is required upon completion of any additional mitigation requirements. No additional mitigation requirements shall be performed without written approval from SANDAG. Trenching, excavation, grading, or other activities with the potential to adversely affect a significant discovery shall not resume until all mitigation requirements have been satisfied and SANDAG provides written notice to resume.
If the discovery is not significant, the archaeological monitor shall inform SANDAG in writing of its determination. The archaeological monitor shall also indicate in writing that no further work is required for a discovery that is not significant.
When required, discoveries shall be documented, analyzed, and curated, in compliance with applicable provisions of the City of San Diego Historical Resources Guidelines and the State Office of Historical Preservation Guidelines for the Curation of Archeological Collections. If human remains are discovered, all work in the area of discovery shall cease and the procedures required by state law shall be followed (PRC §5097.98, HSC §7050.5).
Prior to construction; During construction
SANDAG
Downtown San Diego Bus Rapid Transit Stations Page 2 of 2 Mitigation Monitoring and Reporting Program September 2013
233324
mmo
Rectangle
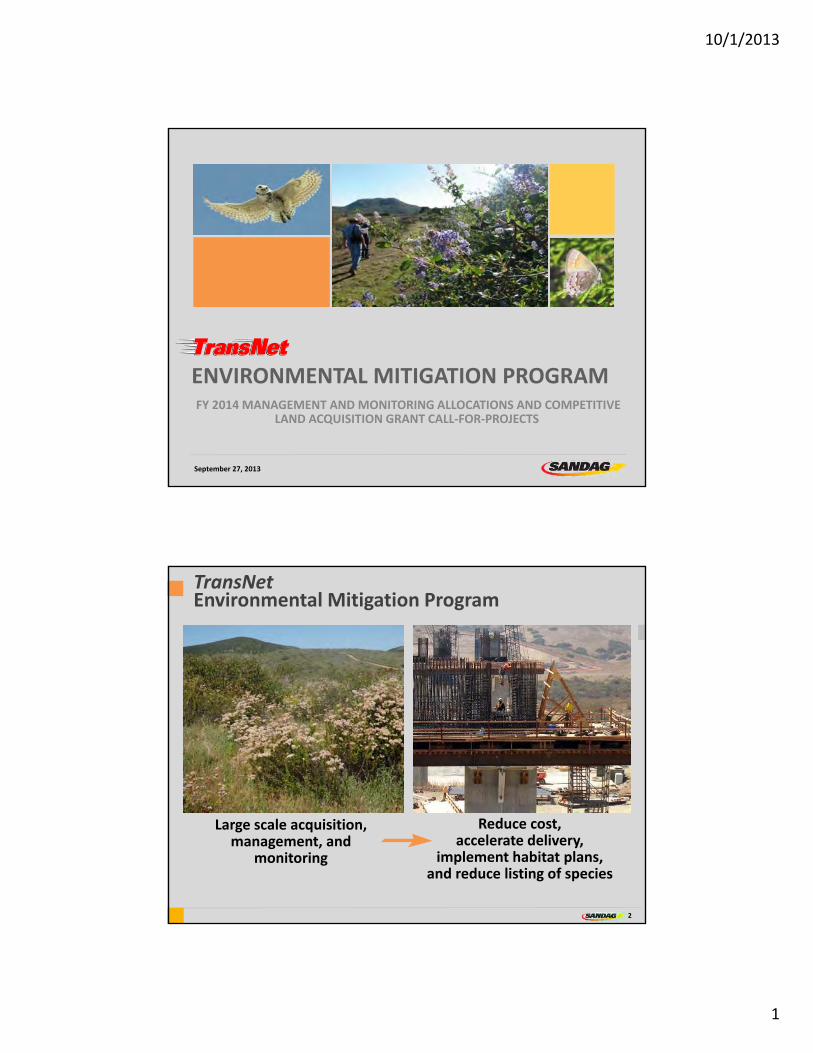
10/1/2013
1
ENVIRONMENTAL MITIGATION PROGRAM FY 2014 MANAGEMENT AND MONITORING ALLOCATIONS AND COMPETITIVE
LAND ACQUISITION GRANT CALL‐FOR‐PROJECTS
September 27, 2013
2
Large scale acquisition, management, and
monitoring
Reduce cost,accelerate delivery,
implement habitat plans,and reduce listing of species
TransNetEnvironmental Mitigation Program
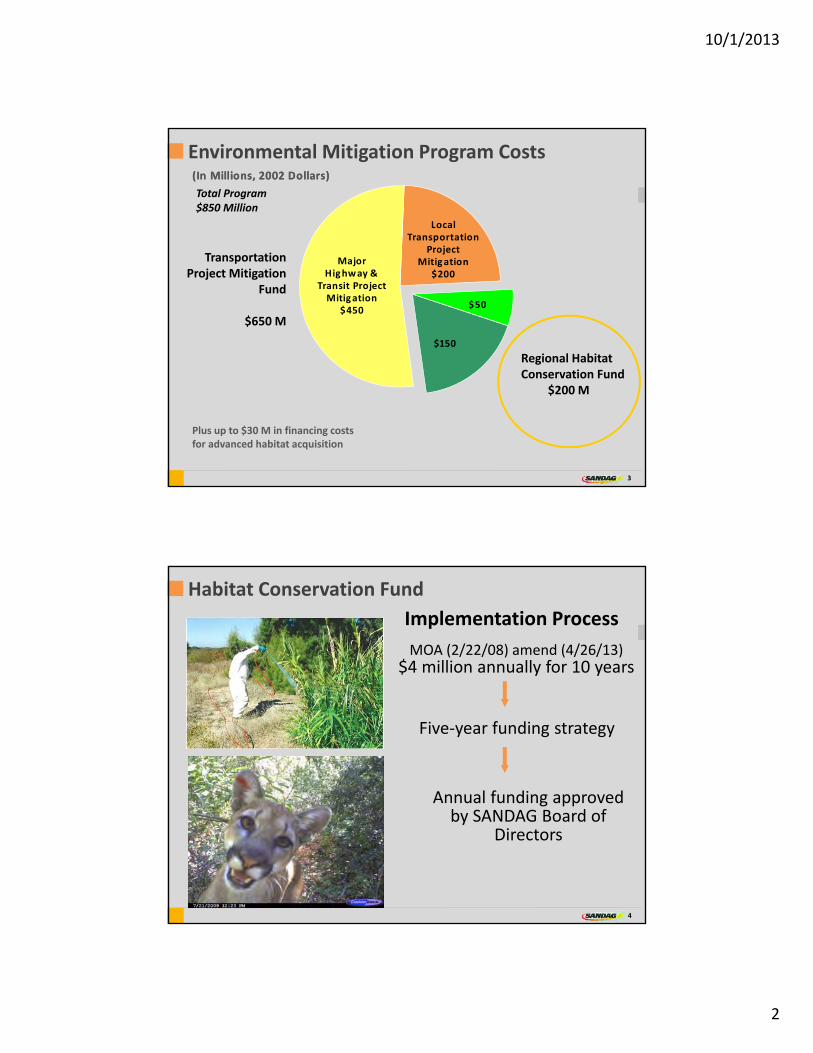
10/1/2013
2
Environmental Mitigation Program Costs
Total Program$850 Million
Plus up to $30 M in financing costsfor advanced habitat acquisition
((InIn MMillilliioonnss,, 22000022 DDoollllaarrss))
MajorHighway &
Transit ProjectMitigation
$450
$150
$50
LocalTransportation
ProjectMitigation
$200
Transportation Project Mitigation
Fund
$650 M
Regional Habitat Conservation Fund
$200 M
3
Habitat Conservation Fund
MOA (2/22/08) amend (4/26/13) $4 million annually for 10 years
Five‐year funding strategy
Annual funding approved by SANDAG Board of
Directors
Implementation Process
4
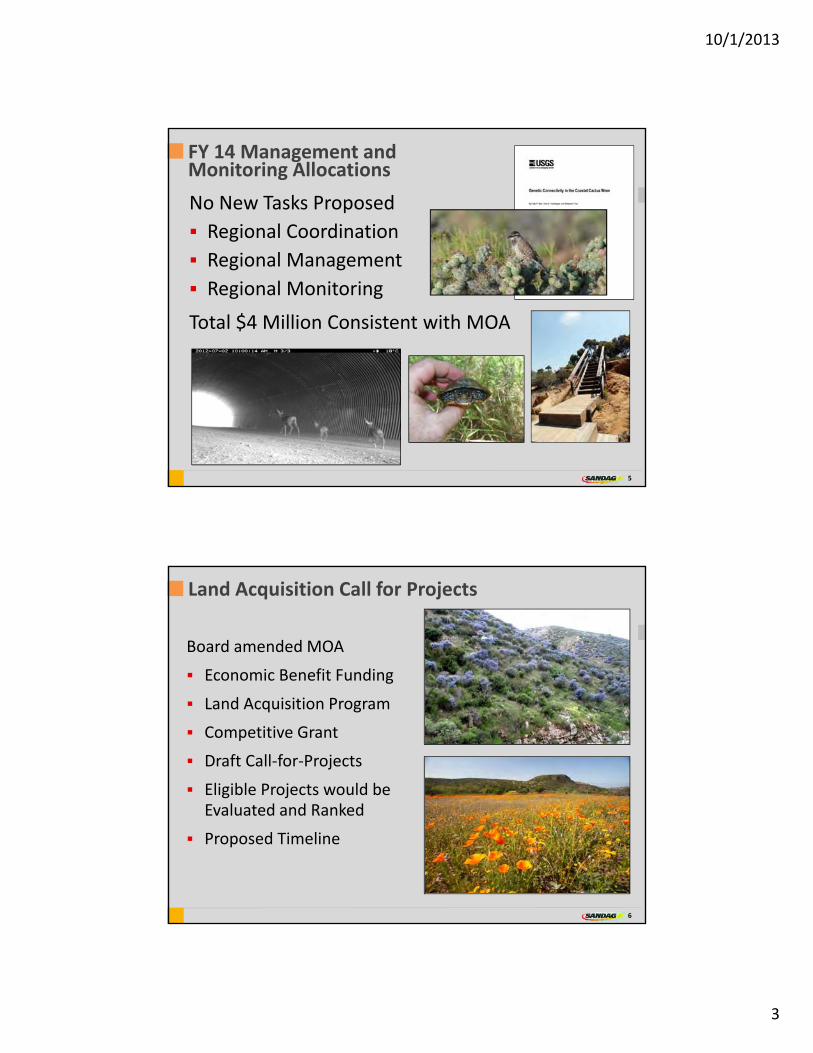
10/1/2013
3
FY 14 Management and Monitoring Allocations
No New Tasks Proposed
Regional Coordination
Regional Management
Regional Monitoring
Total $4 Million Consistent with MOA
5
Land Acquisition Call for Projects
Board amended MOA
Economic Benefit Funding
Land Acquisition Program
Competitive Grant
Draft Call‐for‐Projects
Eligible Projects would be Evaluated and Ranked
Proposed Timeline
6
10/1/2013
4
Next Steps
If approved, staff would implement the management and monitoring activitiesfor FY 14 and issue the Call‐for‐Projectsby Nov 1, 2013
7
Recommendation
The Regional Planning and Transportation Committees are recommending that the Board of Directors approve: (1) funding allocations totaling $4 million toward
implementation of regional land management and biological monitoring activities, and
(2) release of the Call for Projects for a competitive land acquisition grant program using economic benefit funding, pursuant to an executed Memorandum of Agreement with state and federal agencies on the implementation of the TransNet Environmental Mitigation Program.
8
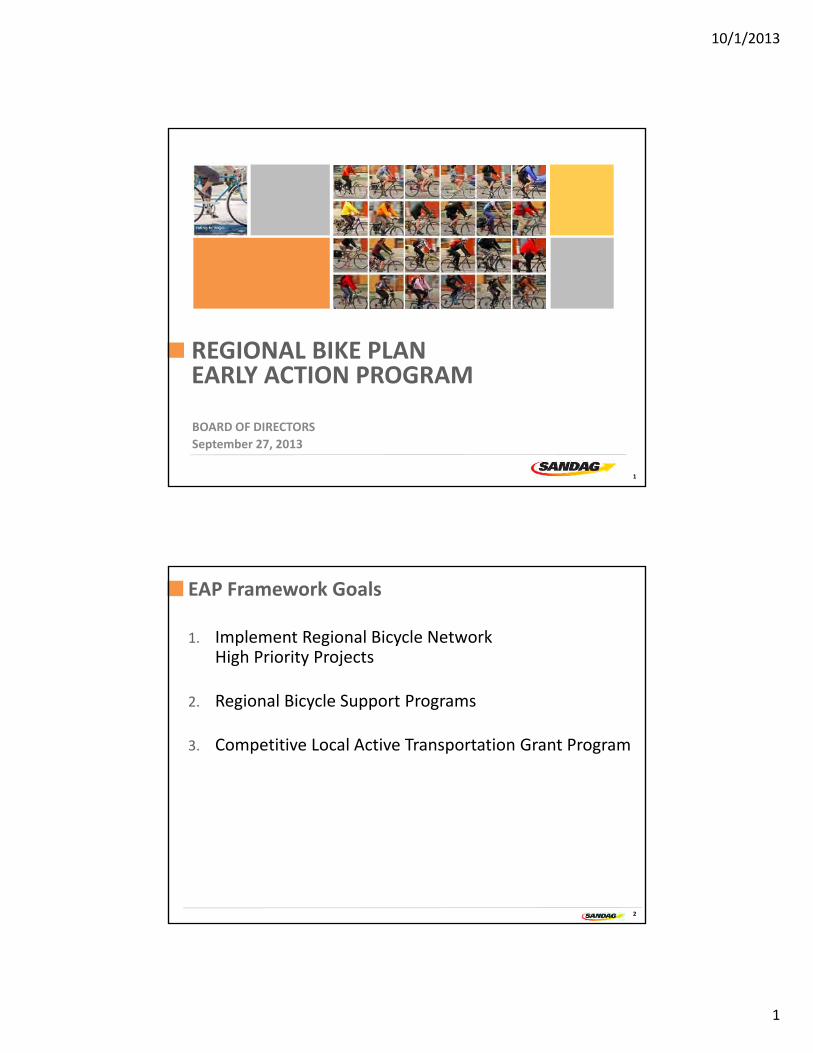
10/1/2013
1
REGIONAL BIKE PLANEARLY ACTION PROGRAM
BOARD OF DIRECTORS
September 27, 2013
1
EAP Framework Goals
1. Implement Regional Bicycle NetworkHigh Priority Projects
2. Regional Bicycle Support Programs
3. Competitive Local Active Transportation Grant Program
2
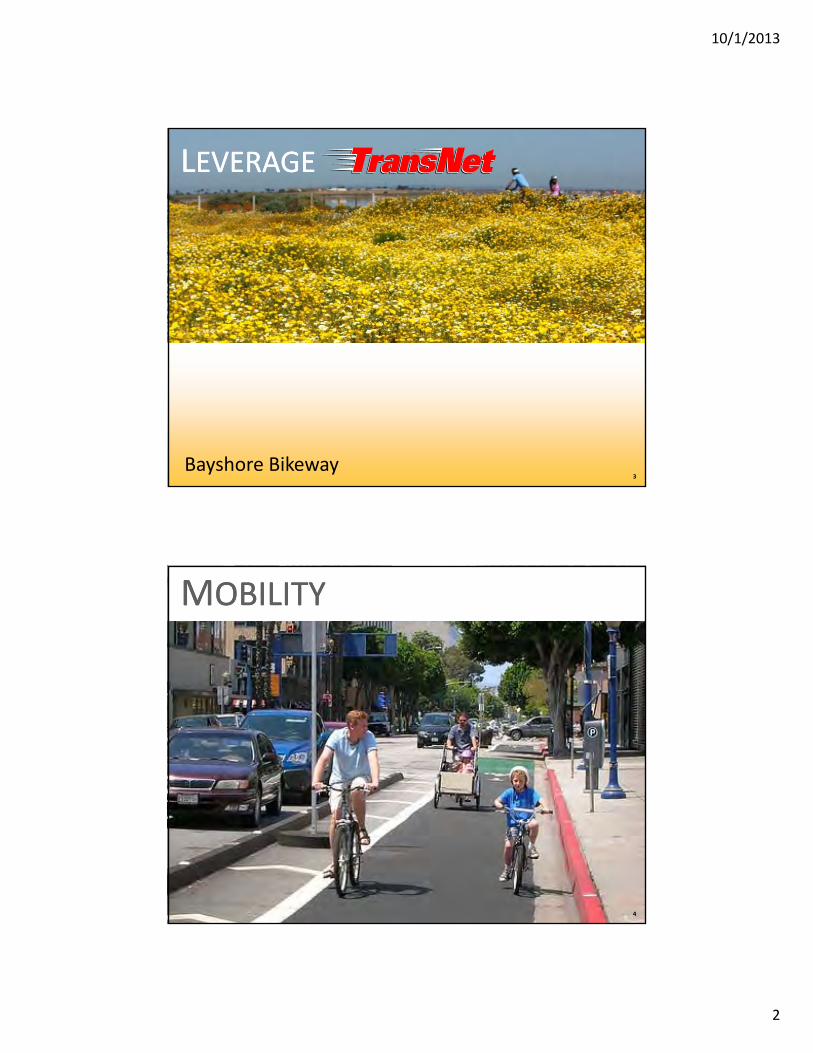
10/1/2013
2
EAP Benefits
Leverage TransNet
LEVERAGELEVERAGE
Bayshore Bikeway3
EAP BenefitsMOBILITYMOBILITY
4
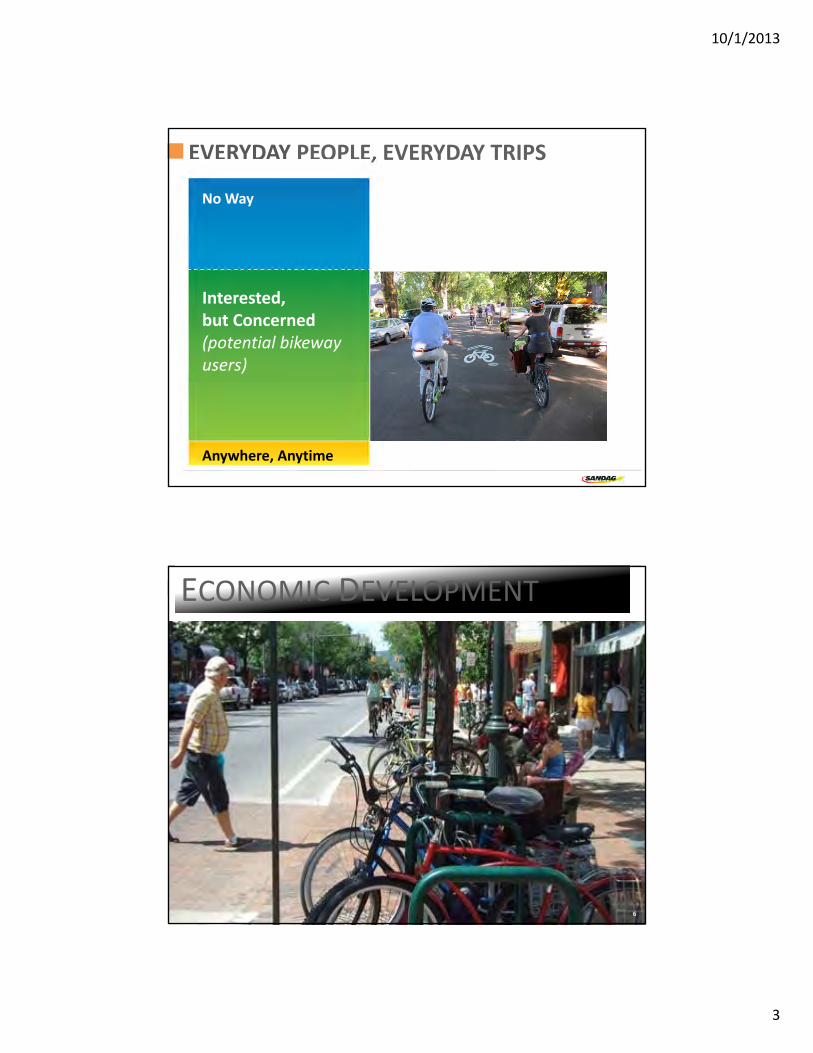
10/1/2013
3
EVERYDAY PEOPLE, EVERYDAY TRIPS
No Way
Interested, but Concerned(potential bikeway users)
Anywhere, Anytime
ECONOMIC DEVELOPMENTECONOMIC DEVELOPMENT
6
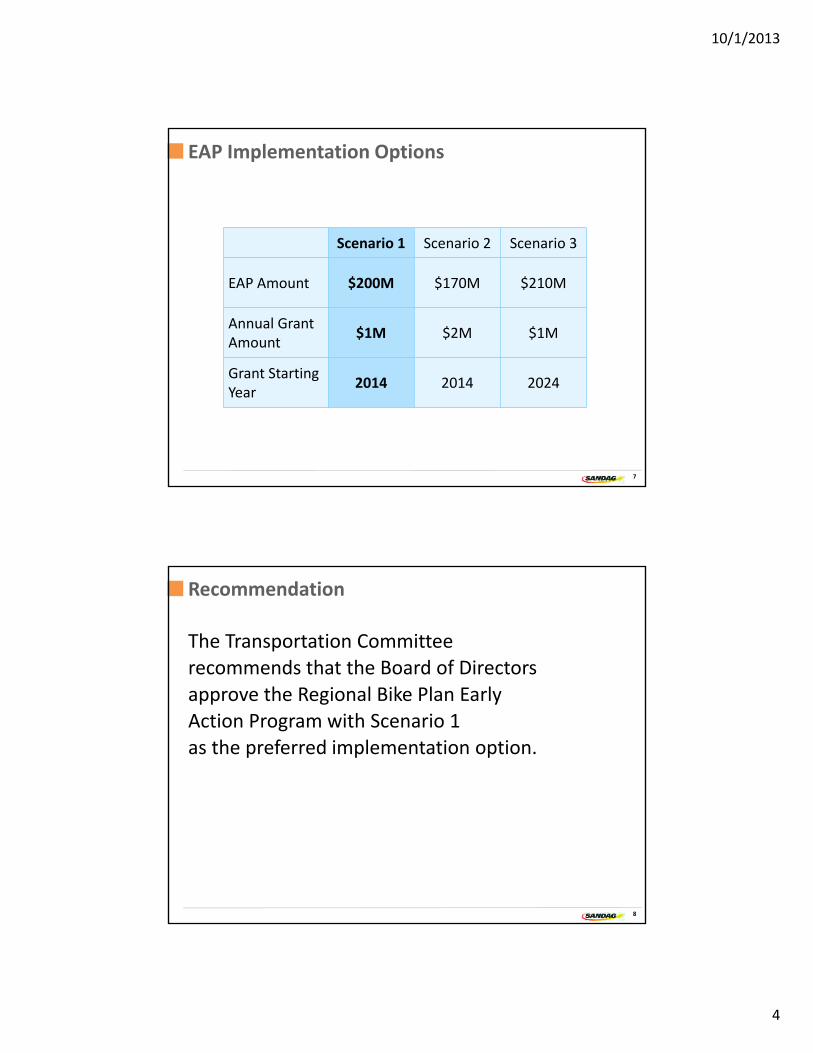
10/1/2013
4
EAP Implementation Options
Scenario 1 Scenario 2 Scenario 3
EAP Amount $200M $170M $210M
Annual Grant Amount
$1M $2M $1M
Grant Starting Year
2014 2014 2024
7
Recommendation
The Transportation Committee recommends that the Board of Directors
approve the Regional Bike Plan Early Action Program with Scenario 1as the preferred implementation option.
8
10/1/2013
1
Active TransportationActive Transportation advocates for healthy communities and healthy children.
Creates one to think about how they too can save money, stay fit, release stress, and enjoy the beautiful sunshine.
Transform San Diego into a First Class Bike Friendly City.
Initiate the value of safe facility improvements for cyclists and pedestrians.
Value our youth and the environments we create for them.
Encourage others to protects our planet and become more sustainable.
Bicycling Means Business
SafetyEconomics
Health
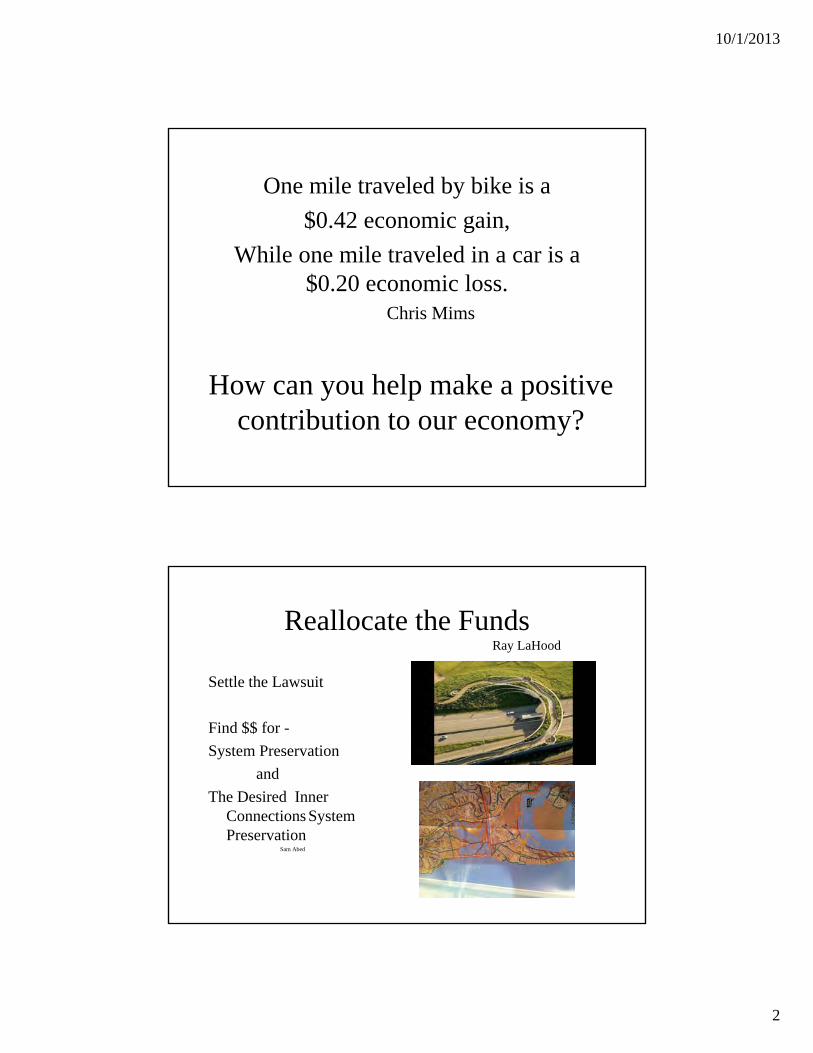
10/1/2013
2
How can you help make a positive contribution to our economy?
One mile traveled by bike is a $0.42 economic gain,
While one mile traveled in a car is a $0.20 economic loss.
Chris Mims
Reallocate the FundsRay LaHood
Settle the Lawsuit
Find $$ for -System Preservation
and The Desired Inner
Connections System Preservation
Sam Abed
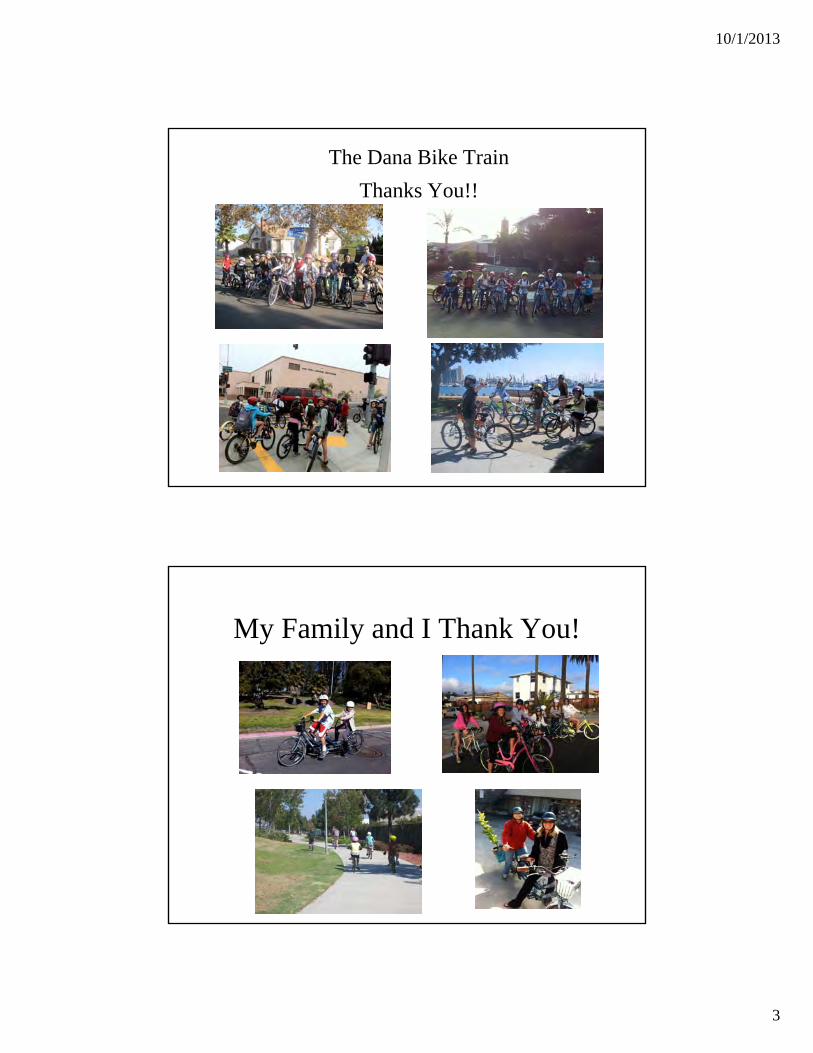
10/1/2013
3
The Dana Bike TrainThanks You!!
My Family and I Thank You!
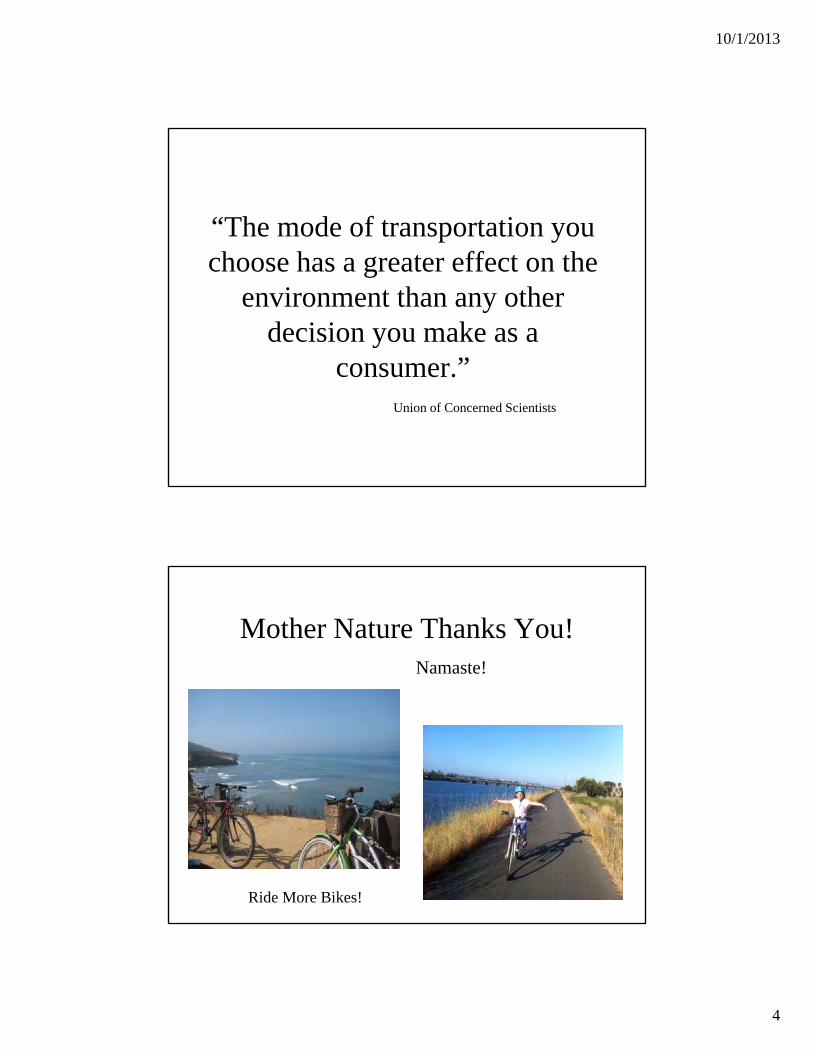
10/1/2013
4
“The mode of transportation you choose has a greater effect on the
environment than any other decision you make as a
consumer.”Union of Concerned Scientists
Mother Nature Thanks You!Namaste!
Ride More Bikes!
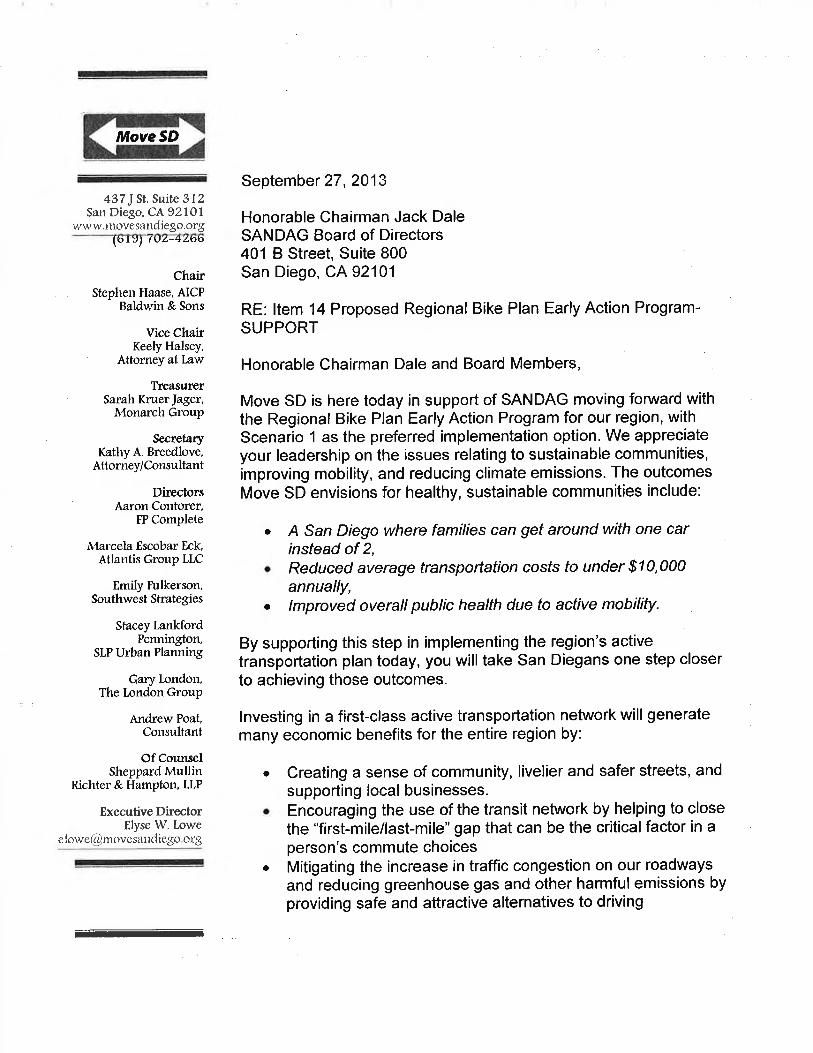
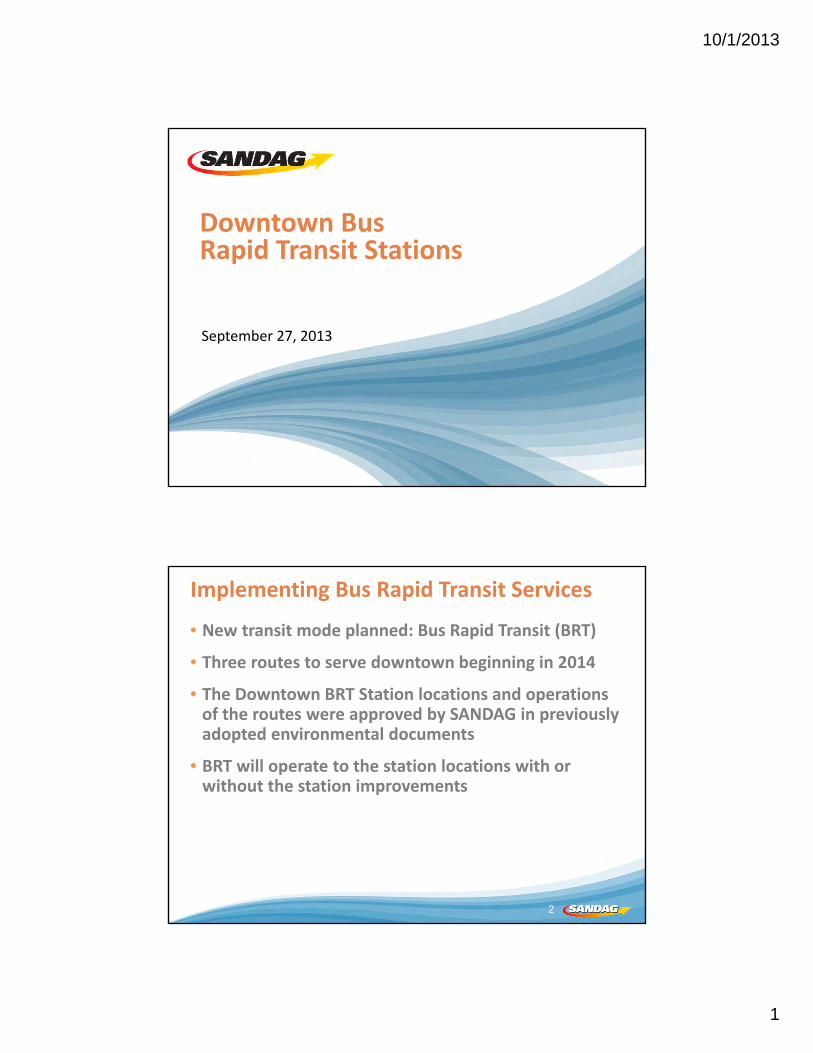
10/1/2013
1
Downtown Bus Rapid Transit Stations
September 27, 2013
Implementing Bus Rapid Transit Services
• New transit mode planned: Bus Rapid Transit (BRT)
• Three routes to serve downtown beginning in 2014
• The Downtown BRT Station locations and operations of the routes were approved by SANDAG in previously adopted environmental documents
• BRT will operate to the station locations with or without the station improvements
2
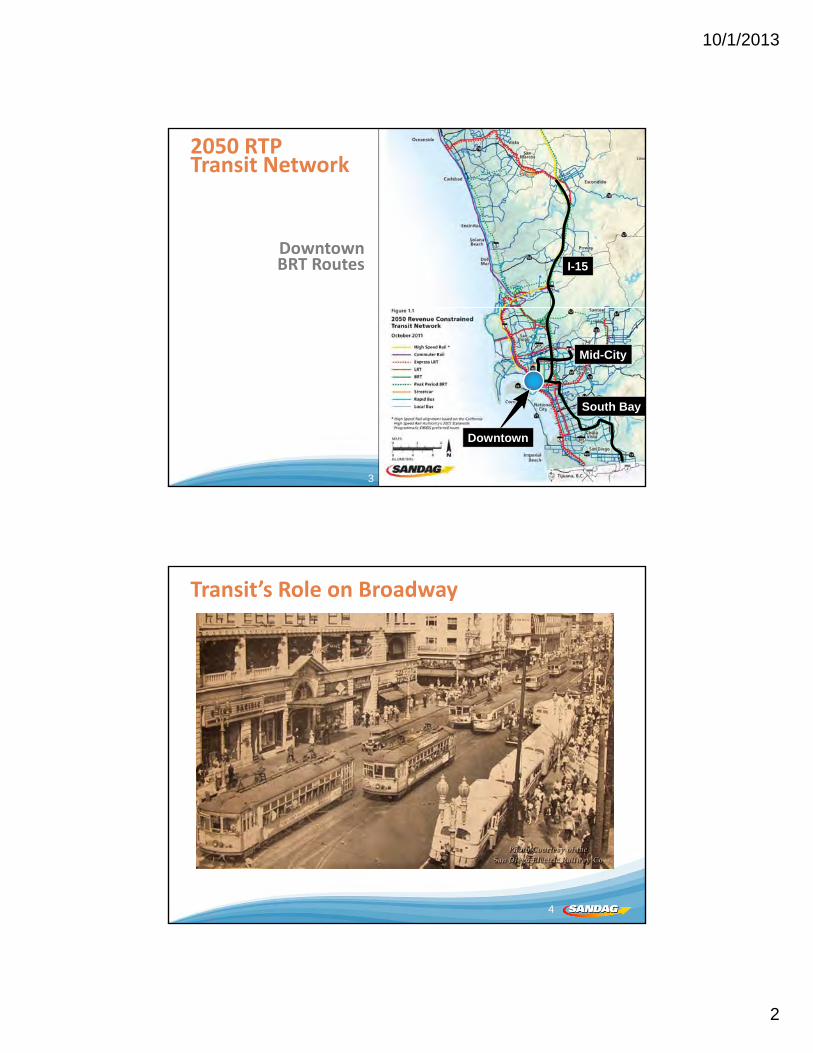
10/1/2013
2
2050 RTP Transit Network
Downtown BRT Routes I-15
Mid-City
South Bay
33
Downtown
Transit’s Role on Broadway
4
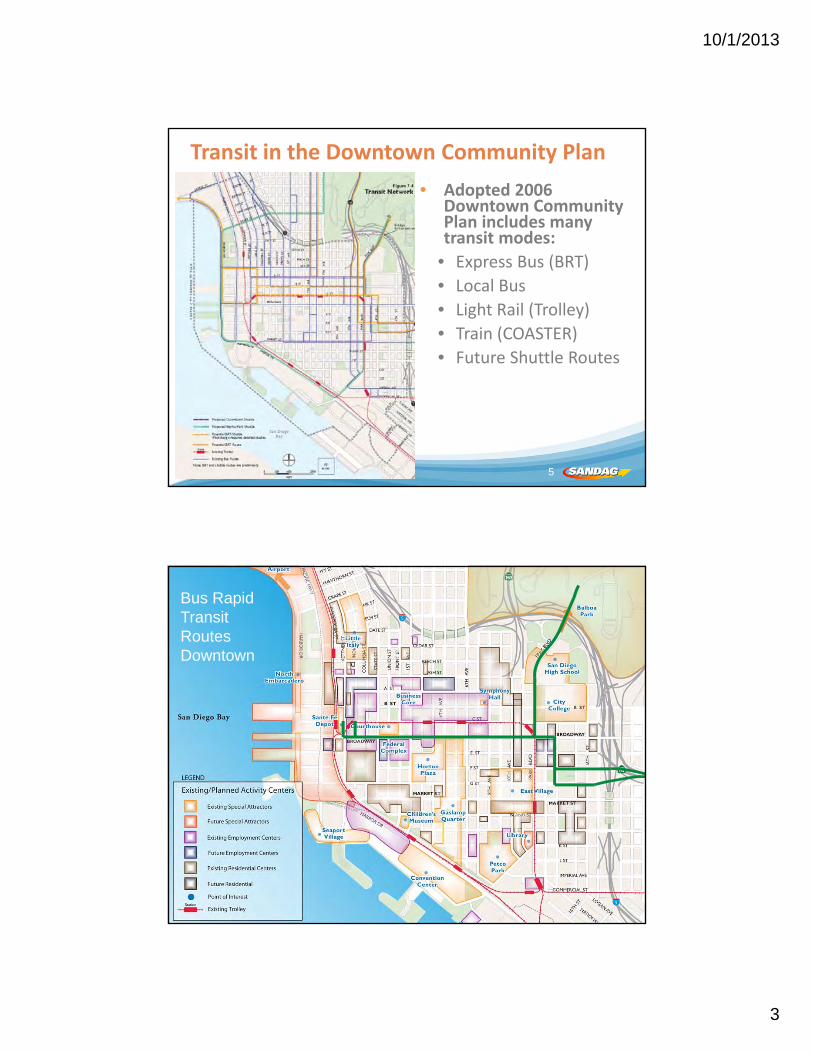
10/1/2013
3
Transit in the Downtown Community Plan
• Adopted 2006 Downtown Community Plan includes many transit modes:
• Express Bus (BRT)
• Local Bus
• Light Rail (Trolley)
• Train (COASTER)
• Future Shuttle Routes
5
Bus Rapid Transit RoutesDowntown
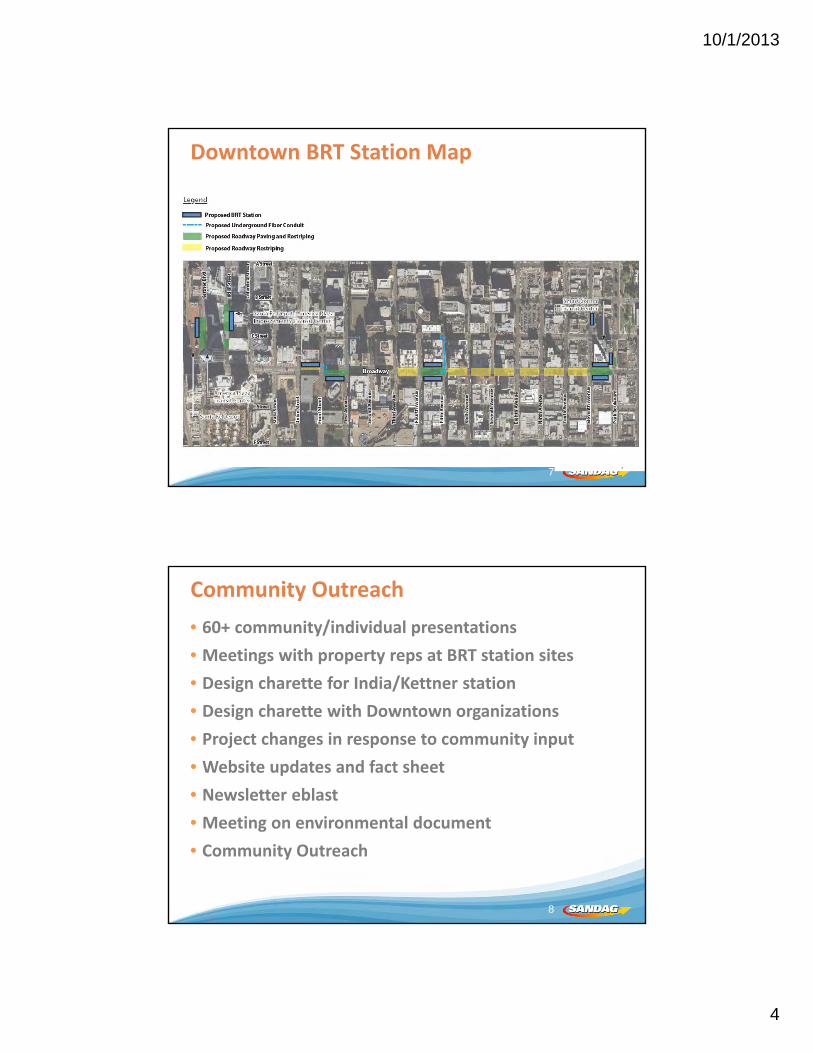
10/1/2013
4
Downtown BRT Station Map
7 7
Community Outreach
• 60+ community/individual presentations
• Meetings with property reps at BRT station sites
• Design charette for India/Kettner station• Design charette with Downtown organizations• Project changes in response to community input
• Website updates and fact sheet
• Newsletter eblast• Meeting on environmental document
• Community Outreach
8
10/1/2013
5
Design Features of a BRT Station Block
• Transit station pylons and stations as gateways
• High quality materials for new/refurbished street furniture
• Widen sidewalks, reduce clutter,improve pedestrian circulation
• Fiber for next‐bus signs and real‐time transit infoin pylons
• Premium lighting at pedestrian scale
• Consistent paving patterns and materialsfor Broadway
• Striping of crosswalks
9
Station Design FeaturesAmenities Layout
10
10/1/2013
6
Smart Corner Simulation
AfterBefore
Fifth Avenue (Gaslamp) Simulation
12
Before After
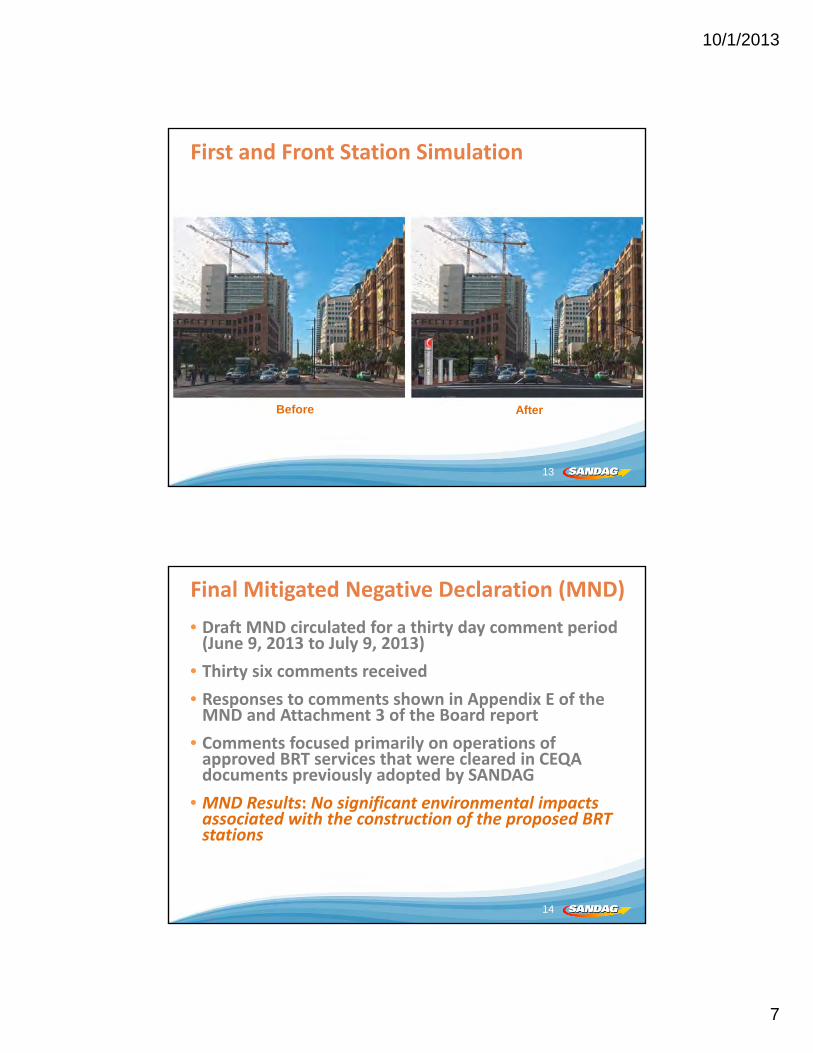
10/1/2013
7
First and Front Station Simulation
13
Before After
Final Mitigated Negative Declaration (MND)
• Draft MND circulated for a thirty day comment period (June 9, 2013 to July 9, 2013)
• Thirty six comments received
• Responses to comments shown in Appendix E of the MND and Attachment 3 of the Board report
• Comments focused primarily on operations of approved BRT services that were cleared in CEQA documents previously adopted by SANDAG
• MND Results: No significant environmental impacts associated with the construction of the proposed BRT stations
14
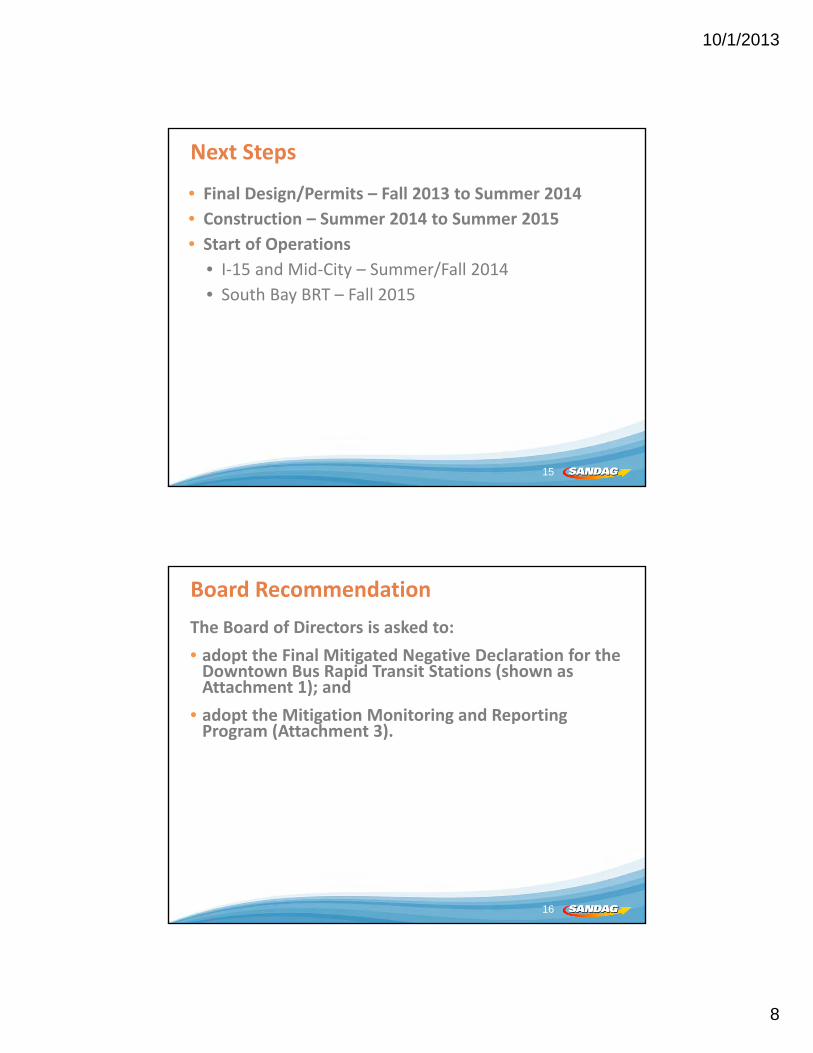
10/1/2013
8
Next Steps
• Final Design/Permits – Fall 2013 to Summer 2014
• Construction – Summer 2014 to Summer 2015
• Start of Operations
• I‐15 and Mid‐City – Summer/Fall 2014
• South Bay BRT – Fall 2015
15
Board Recommendation
The Board of Directors is asked to:
• adopt the Final Mitigated Negative Declaration for the Downtown Bus Rapid Transit Stations (shown as Attachment 1); and
• adopt the Mitigation Monitoring and Reporting Program (Attachment 3).
16
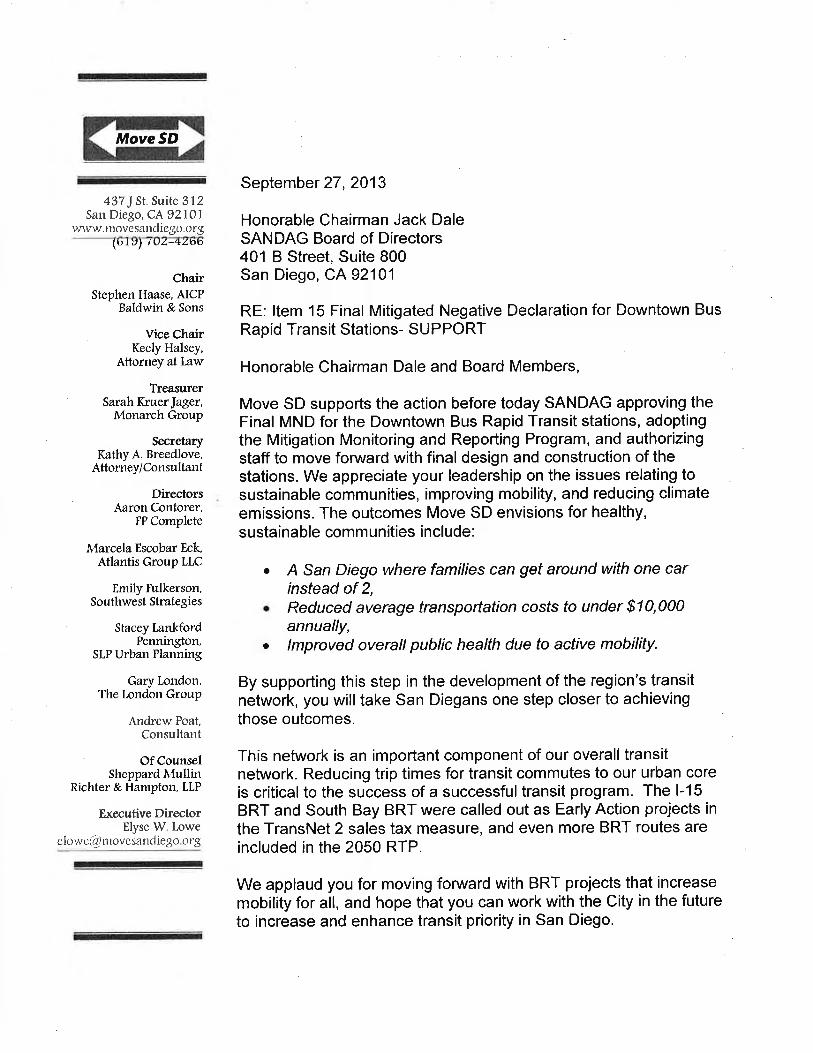
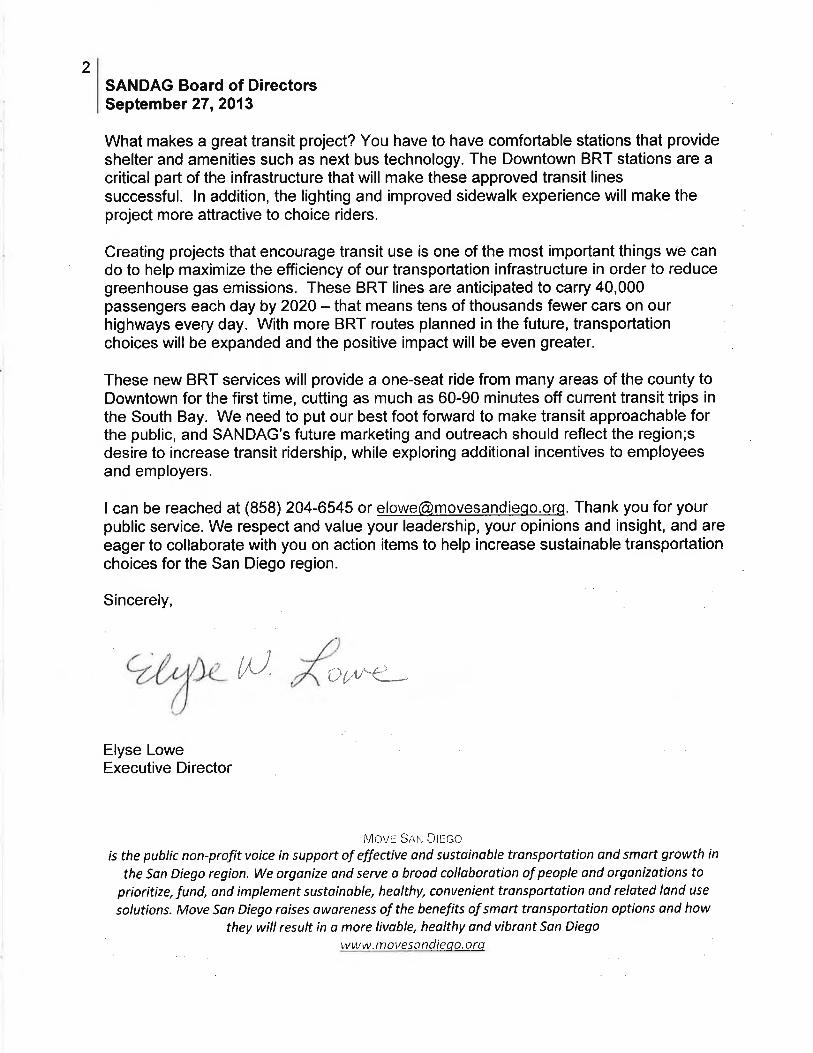
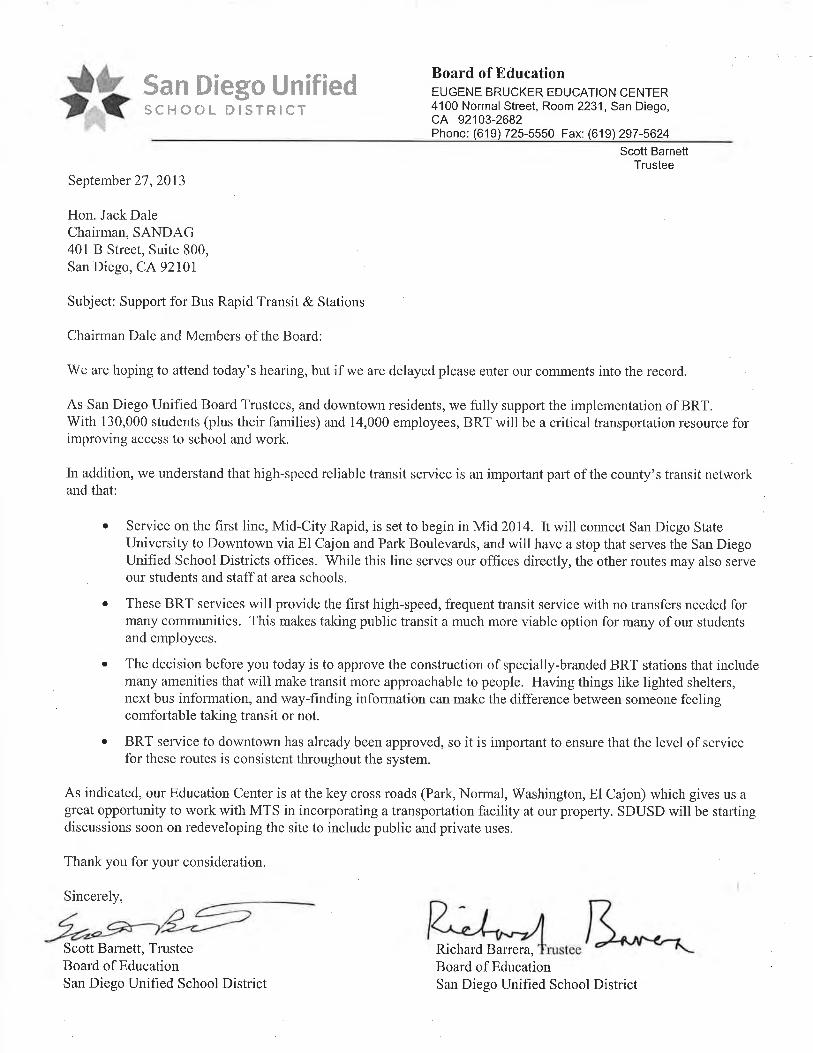
10/1/2013
1
BRTs Across the Country?Distortion of Truth
Cleveland National Forest FoundationPresentation to SANDAG Board - September 27, 2013
Item 15 - Neg. Dec. Downtown BRT StationsJack Shu, President
Last week SANDAG sent out an email announcement regarding this item and
within it had a section implying that BRT transit systems are being favored “across
the country”
Let’s look at what really is the transit system in some of the regions
SANDAG mentions in its examples of current BRT projects .
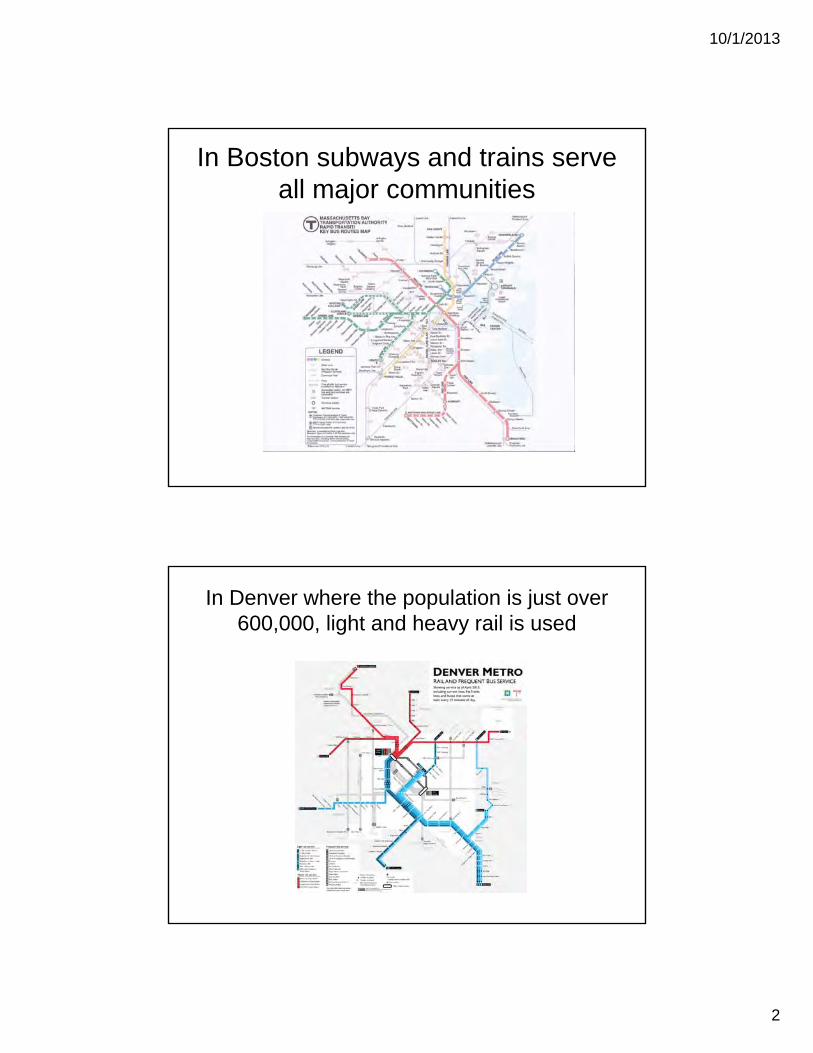
10/1/2013
2
In Boston subways and trains serve all major communities
In Denver where the population is just over 600,000, light and heavy rail is used
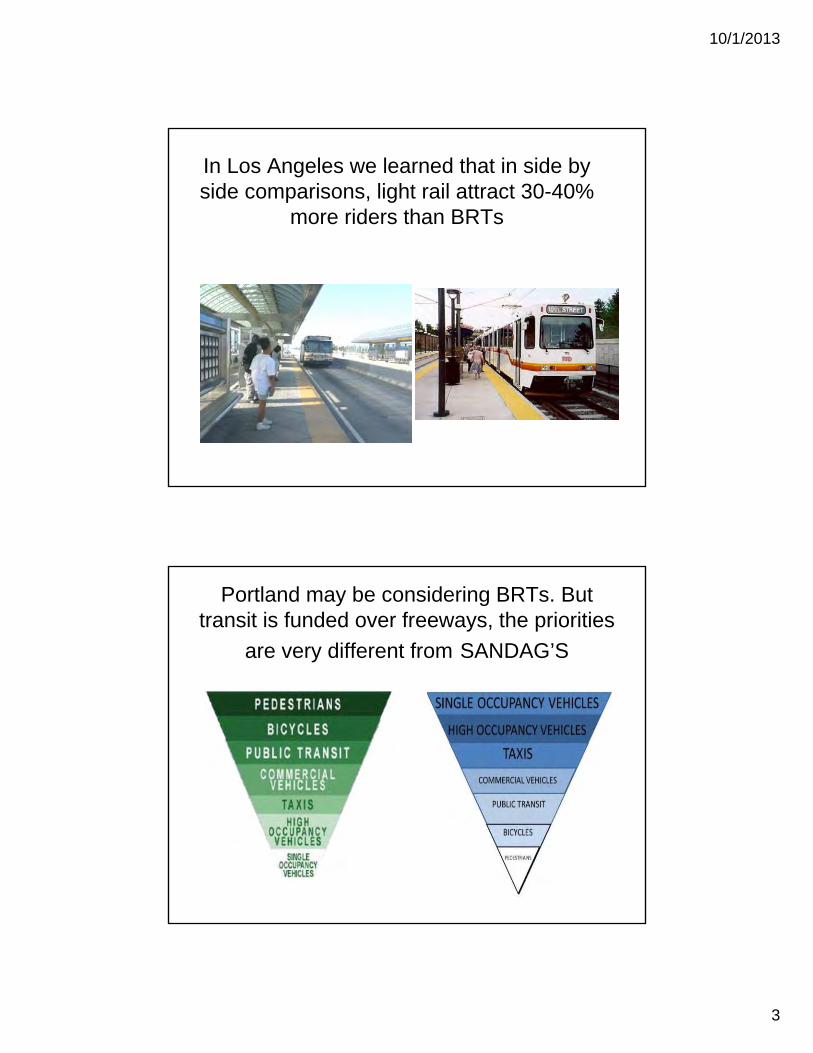
10/1/2013
3
In Los Angeles we learned that in side by side comparisons, light rail attract 30-40%
more riders than BRTs
Portland may be considering BRTs. But transit is funded over freeways, the priorities
are very different from SANDAG’S
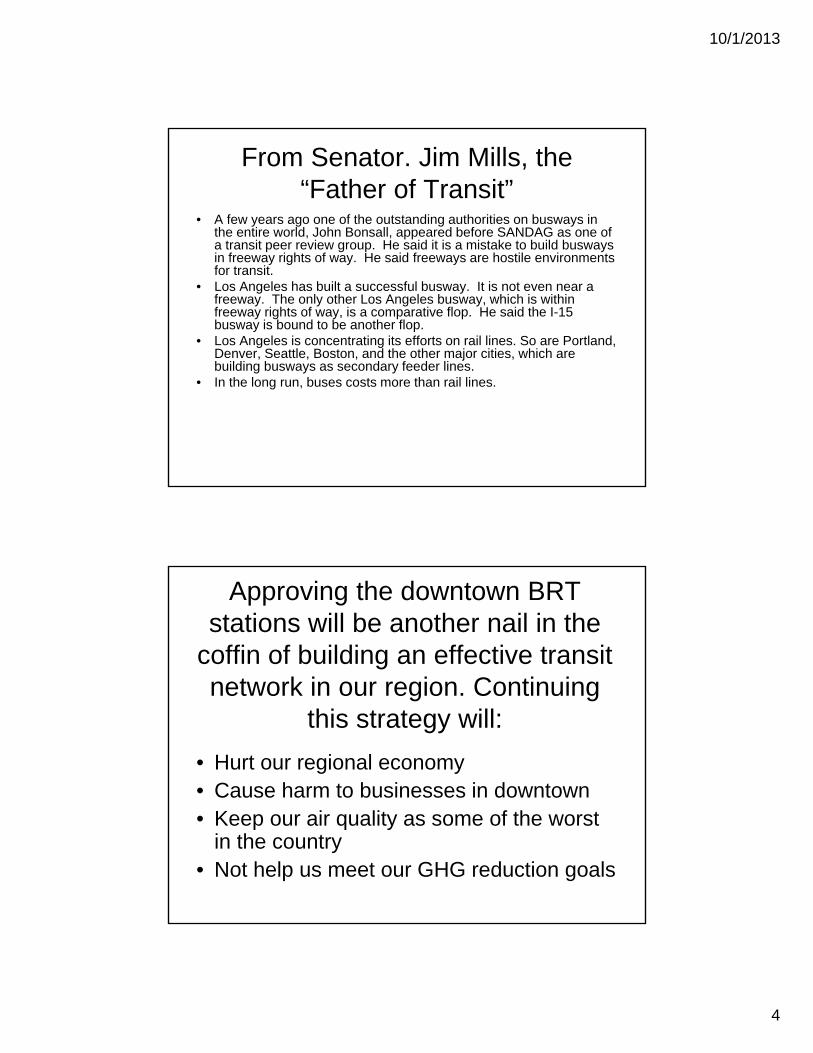
10/1/2013
4
From Senator. Jim Mills, the“Father of Transit”
• A few years ago one of the outstanding authorities on busways in the entire world, John Bonsall, appeared before SANDAG as one of a transit peer review group. He said it is a mistake to build busways in freeway rights of way. He said freeways are hostile environments for transit.
• Los Angeles has built a successful busway. It is not even near a freeway. The only other Los Angeles busway, which is within freeway rights of way, is a comparative flop. He said the I-15 busway is bound to be another flop.
• Los Angeles is concentrating its efforts on rail lines. So are Portland, Denver, Seattle, Boston, and the other major cities, which are building busways as secondary feeder lines.
• In the long run, buses costs more than rail lines.
Approving the downtown BRT stations will be another nail in the
coffin of building an effective transit network in our region. Continuing
this strategy will:• Hurt our regional economy• Cause harm to businesses in downtown• Keep our air quality as some of the worst
in the country • Not help us meet our GHG reduction goals