Age Based and Partial Preventive Replacement Policies subject to Shocks
8
Online Access: www.absronline.org/journals *Corresponding author: Behrouz Khorshidvand, Industrial Management Department, Kar Higher education Institute, Qazvin, Iran. E-Mail: [email protected] 813 Management and Administrative Sciences Review Volume 4, Issue 5 Pages: 813-820 September 2015 e-ISSN: 2308-1368 p-ISSN: 2310-872X Age Based and Partial Preventive Replacement Policies subject to Shocks Ashkan Ayough 1 *, Behrouz Khorshidvand 2 , and Akbar Alem Tabriz 3 1. Productivity Management Department, Iran center for management studies (ICMS), Tehran, Iran 2. Industrial Management Department, Kar Higher education Institute, Qazvin, Iran 3. Industrial Management Department, Faculty of management and accounting, Shahid Beheshti University, Tehran, Iran In this article, two systems subject to shocks occurring based on a non-homogeneous Poisson process (NHPP) and failure rate are analyzed. The first system is consisted of a single unit that partial preventive replacements (PPR) of lower indenture level components can be done. The second system is consisted of single unit with age based replacement policy (ABR). In PPR system, occurrence of a defeat causes system stopping and consequently system will be received minimal repairs and following the occurrence of a shock the system has received inspection. Also this system is replaced after time T preventively. In ABR system a defeat leads to unit stopping and accordingly the unit has received minimal repairs and after a shock has received inspection. This system is replaced at time T or at times less than T preventively, due to failure of unit. The systems will be replaced with new and the same types, so analysis done based on average cost rate. Two examples are studied and optimal replacement age which minimizes expected cost is obtained and according to results and comparison of models, some analyses are provided. Keywords: Non-homogeneous Poisson process (NHPP), Partial preventive replacement (PPR), Age based replacement (ABR), Minimal repairs, Shock process, Inspection, Log linear process (LLP). INTRODUCTION Replacement policy is an important issue that has been widely applied to the actual production settings. In general, there are two major policies, maintenance policy and replacement policy.
-
Upload
absronline -
Category
Documents
-
view
0 -
download
0
Transcript of Age Based and Partial Preventive Replacement Policies subject to Shocks

Online Access: www.absronline.org/journals
*Corresponding author: Behrouz Khorshidvand, Industrial Management Department, Kar Higher education Institute, Qazvin, Iran. E-Mail: [email protected]
813
Management and Administrative Sciences Review
Volume 4, Issue 5
Pages: 813-820
September 2015
e-ISSN: 2308-1368
p-ISSN: 2310-872X
Age Based and Partial Preventive Replacement Policies subject to
Shocks
Ashkan Ayough1*, Behrouz Khorshidvand2, and Akbar Alem Tabriz3
1. Productivity Management Department, Iran center for management studies (ICMS), Tehran, Iran 2. Industrial Management Department, Kar Higher education Institute, Qazvin, Iran 3. Industrial Management Department, Faculty of management and accounting, Shahid Beheshti University, Tehran, Iran
In this article, two systems subject to shocks occurring based on a non-homogeneous Poisson
process (NHPP) and failure rate are analyzed. The first system is consisted of a single unit
that partial preventive replacements (PPR) of lower indenture level components can be
done. The second system is consisted of single unit with age based replacement policy
(ABR). In PPR system, occurrence of a defeat causes system stopping and consequently
system will be received minimal repairs and following the occurrence of a shock the system
has received inspection. Also this system is replaced after time T preventively. In ABR
system a defeat leads to unit stopping and accordingly the unit has received minimal repairs
and after a shock has received inspection. This system is replaced at time T or at times less
than T preventively, due to failure of unit. The systems will be replaced with new and the
same types, so analysis done based on average cost rate. Two examples are studied and
optimal replacement age which minimizes expected cost is obtained and according to results
and comparison of models, some analyses are provided.
Keywords: Non-homogeneous Poisson process (NHPP), Partial preventive replacement (PPR), Age based replacement (ABR), Minimal repairs, Shock process, Inspection, Log linear process (LLP).
INTRODUCTION
Replacement policy is an important issue that has
been widely applied to the actual production
settings. In general, there are two major policies,
maintenance policy and replacement policy.
Manag. Adm. Sci. Rev. e-ISSN: 2308-1368, p-ISSN: 2310-872X Volume: 4, Issue: 5, Pages: 813-820
814
Maintenance policy implies that an optimal
maintenance time is based on mean down time or
average working time. Replacement policy implies
that an optimal replacement time interval exists
after the long-time running of the system. Thus this
means that in the real production, we should find
out the optimal change time to make the loss of the
system minimum (Meng, 2012). Age based policy
is quite common and easy-to-implement in
practice. Under a basic age based replacement an
operating system is replaced at particular age or at
failure, whichever occurs first (Barlow, 1960). In
partial preventive replacement (PPR) models
policy will assume that, in our equipment, PPR of
lower indenture level components can be done, at
certain operating times Ti restoring the entire
equipment to its initial failure rate. However, it is
also common that after a certain number of PPRs,
these will be more expensive than a complete
preventive equipment replacement (PR) (Marquez,
2007). In the literature, developments on
replacement models based on the shock have
provided satisfactory results for the maintenance
operation. But in these researches, shock is not
considered as an independent parameter of failure.
In this article, both shock process and failure rate
are unavoidable and play an important role in
determining the optimum replacement age. The
main contribution of this article is developing
shock process and failure rate with ABR and PPR
models. These models are applied to industrial
equipment, due to the structure of their
components (e.g. cutting tools, hydraulic
structures, compressor blades and electronic
boards). This article constructed as follows:
literature are briefly reviewed in section 2. Model
description such as shock process and maintenance
models is given in the section 3. Assumptions and
notations are explained in the section 4. Numerical
examples for proofing models optimization and
analyses are given in the section 5. Finally
conclusions are drawn in the section 6.
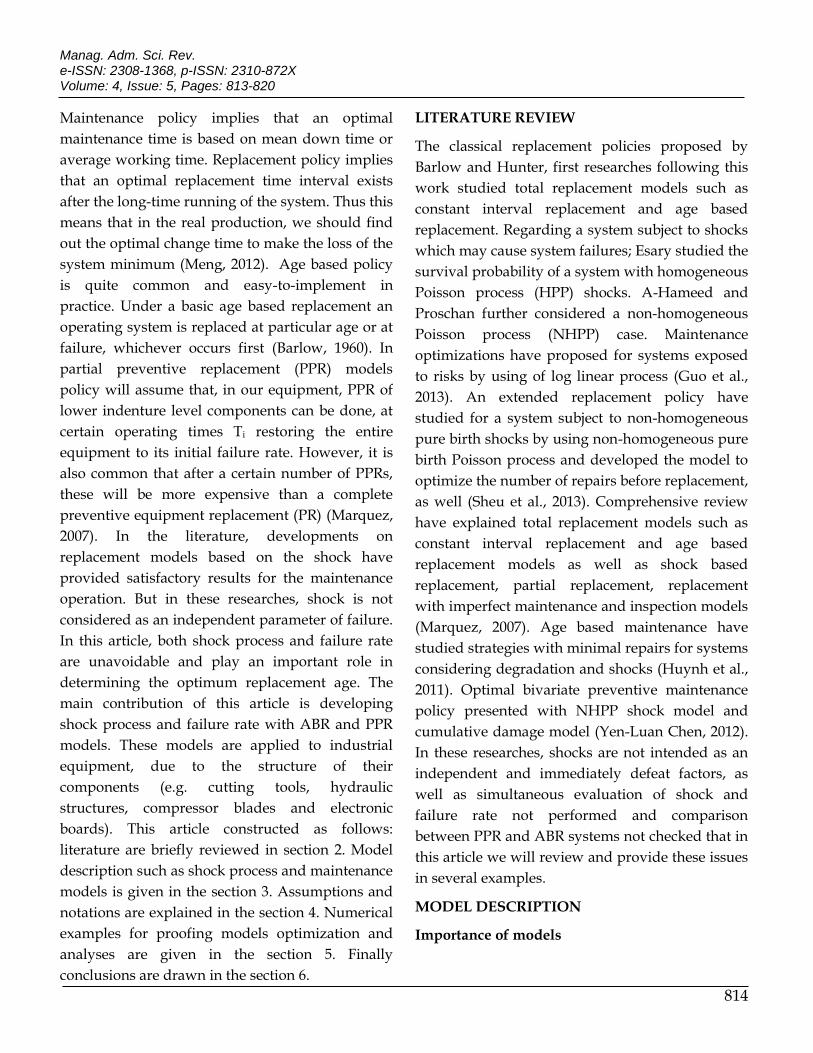
LITERATURE REVIEW
The classical replacement policies proposed by
Barlow and Hunter, first researches following this
work studied total replacement models such as
constant interval replacement and age based
replacement. Regarding a system subject to shocks
which may cause system failures; Esary studied the
survival probability of a system with homogeneous
Poisson process (HPP) shocks. A-Hameed and
Proschan further considered a non-homogeneous
Poisson process (NHPP) case. Maintenance
optimizations have proposed for systems exposed
to risks by using of log linear process (Guo et al.,
2013). An extended replacement policy have
studied for a system subject to non-homogeneous
pure birth shocks by using non-homogeneous pure
birth Poisson process and developed the model to
optimize the number of repairs before replacement,
as well (Sheu et al., 2013). Comprehensive review
have explained total replacement models such as
constant interval replacement and age based
replacement models as well as shock based
replacement, partial replacement, replacement
with imperfect maintenance and inspection models
(Marquez, 2007). Age based maintenance have
studied strategies with minimal repairs for systems
considering degradation and shocks (Huynh et al.,
2011). Optimal bivariate preventive maintenance
policy presented with NHPP shock model and
cumulative damage model (Yen-Luan Chen, 2012).
In these researches, shocks are not intended as an
independent and immediately defeat factors, as
well as simultaneous evaluation of shock and
failure rate not performed and comparison
between PPR and ABR systems not checked that in
this article we will review and provide these issues
in several examples.
MODEL DESCRIPTION
Importance of models

Manag. Adm. Sci. Rev. e-ISSN: 2308-1368, p-ISSN: 2310-872X Volume: 4, Issue: 5, Pages: 813-820
815
The systems that are subject to external shocks by
occurring any of these shocks can be failure and
then the inspection to prevent larger and more
costly downtime should be done. Given that the
shocks have cumulative damage property and
occur randomly, thus the inspection with lower
cost can be done. Also the systems can be defeat
because of their failure rates that this event is
function of systems life cumulative distribution, in
other words it can be called an internal factor.
Shock process
In this article, a cumulative shock model is
considered to explain the shock process. The
probabilities for the shock damages to occur in
different time intervals are assumed to be
independent. The log linear process (LLP) is very
flexible and has been widely used to describe the
occurrence of random events (Guo, 2013).
N (T) is the number of events by time T. A
stochastic process is a non-homogeneous Poisson
process for some small value h if:
(i) N(0) = 0
(ii) Non − overlaping increments are independent
(iii) P(N(T + h) − N(T) = 1) = Λk
(T)h + o(h)
(iv) P(N(T + h) − N(T) > 1) = o(h)
For all T and where in little o notation limh→0
o(h)
h= 0
Thus, we consider stochastic shocks occur in a non-
homogeneous Poisson process (NHPP).
To simulate this process by using of LLP, intensity
function is
Λ(T) = η𝑒𝑐𝑇; 𝐾 ∈ (0, ∞), 𝑐 ∈ (−∞, ∞) (1)
Let N (T) demonstrate the number of shocks until
time T, then the expected number of shocks until
time T, denoted by D (T) is given by
D(T) = E[N(T)] = ∫ η𝑒𝑐𝑇𝑇
0
𝑑𝑠
= {
𝜂
𝑐(𝑒𝑐𝑇 − 1)
𝜂𝑇
∀𝑐 ≠ 0∀𝑐 = 0
(2)
Also, the probability distribution of N (T) is
𝑃(𝑁(𝑇) = 𝑛)(𝐷(𝑇))𝑛𝑒−𝐷(𝑇)
𝑛!
(3)
Age based replacement (ABR) policy
In this case, the preventive replacement is done
after equipment reaches a certain operating time-
age T. In case of equipment failure a corrective
replacement (CR) is done and the next preventive
replacement (PR) is scheduled after T units of time.
We again want to calculate the best T which
minimizes total expected cost per unit time
(Marquez, 2007)
Figure1. State of ABR policy over time
Partial preventive replacement (PPR) policy
In this policy we assume that, the total preventive
replacement of the equipment (PR) is done after
(k–1) partial preventive replacements (PPR). For
equipment subject to (i–1) PPRs with (i<k), the next
PPR will be done after Ti units of operating time
since the last PPR (or PR in case i=1). In case of
failure, a minimal repair will be carried out; this
will take the equipment back to operation but
without restoring its failure rate (Marquez, 2007)

Manag. Adm. Sci. Rev. e-ISSN: 2308-1368, p-ISSN: 2310-872X Volume: 4, Issue: 5, Pages: 813-820
816
Figure2. State of PPR policy over time
MODEL ASSUMPTIONS AND NOTATIONS
Assumptions
1 When T=0, the systems begin to work and
under external shocks constantly
2 If the systems work until time T properly,
replace preventively
3 For ABR system if the unit breaks before time
T, replaces correctively
4 If in time interval [0, T] unit suffers external
shocks, inspection done
5
Preventive and corrective replacement,
minimal repairs and inspection time are
negligible
Function Notations
R (T) The survival or reliability function and
means that probability of operation until
T
F (T) The failures function and mean that
probability of failure until T
f(x) The Probability density function of failure
D (T) The expected number of shocks until time
T
β (T) The expected number of failures until
time T
λ (x) Failure rate function
µ (T) For ABR system, the expected length of
the failure cycle.
V (T) The expected time of system operation
until time T
K (T) The expected cost of system until time T
C (T) Total expected cost per unit time
Cost Notations
CR The preventive replacement cost rate
CF The corrective replacement cost rate
CPPR The partial preventive replacement cost rate
CPR The total preventive replacement cost rate
CM The minimal repairs cost rate
CI The inspection cost rate
For PPR system, long term average cost rate is
C(T) =K(T)
V(T)
(4)
By considering partial preventive policy, the
expected cost of system until time T is
K(T) = CPPR [k − 1] + CPR + CI [D(T)]+ CM[β(T)]
𝐾(𝑇)= 𝐶𝑃𝑃𝑅 [𝑘 − 1] + 𝐶𝑃𝑅
+ [𝐶𝐼 (∑ ∫ 𝜂𝑒𝑐𝑠𝑑𝑠𝑇𝑖
0
𝑘
𝑖=0)]
+ [𝐶𝑀 (∑ ∫ 𝜆(𝑥)𝑑𝑥𝑇𝑖
0
𝑘
𝑖=0)]
(5)
Also, in this case the system works until k time to
carry out the PPR, thus the expected time of system
operation is

Manag. Adm. Sci. Rev. e-ISSN: 2308-1368, p-ISSN: 2310-872X Volume: 4, Issue: 5, Pages: 813-820
817
𝑉(𝑇) = ∑ 𝑇𝑖
𝑘
𝑖=1
(6)
Finally, taking into account equations (4), (5) and
(6) average cost rate is
𝐶(𝑇)
= (𝐶𝑃𝑃𝑅 [𝑘 − 1] + 𝐶𝑃𝑅
+ [𝐶𝐼 (∑ ∫ 𝜂𝑒𝑐𝑠𝑑𝑠𝑇𝑖
0
𝑘
𝑖=0)]
+ [𝐶𝑀 (∑ ∫ 𝜆(𝑥)𝑑𝑥𝑇𝑖
0
𝑘
𝑖=0)]) / ∑ 𝑇𝑖
𝑘
𝑖=1
(7)
And for ABR system, we have
𝐶(𝑇) =𝐾(𝑇)
𝑉(𝑇)
In this system, the expected cost until time T is
𝐾(𝑇) = [𝐶𝑅(𝑅(𝑇))] + [𝐶𝐹(𝐹(𝑇))] + [𝐶𝐼(𝐷(𝑇))]
+ [𝐶𝑀(𝛽(𝑇))]
𝐾(𝑇) = [𝐶𝑅 (∫ 𝑓(𝑥)𝑑𝑥∞
𝑇
)]
+ [𝐶𝐹 (∫ 𝑓(𝑥)𝑑𝑥𝑇
0
)]
+ [𝐶𝐼 (∫ 𝜂𝑒𝑐𝑠𝑑𝑠𝑇
0
)]
+ [𝐶𝑀 (∫ 𝜆(𝑥)𝑑𝑥𝑇
0
)]
(8)
Also, the length of failure cycle can be estimated
calculating the expected value of the failure
distribution now truncated in T as follows
(Marquez, 2007)
µ(T) =∫ xf(x)dx
T
0
F(T)
(9)
Thus, expected time of system operation until time
T is
𝑉(𝑇) = [𝑇(𝑅(𝑇))] + [µ(𝑇)(𝐹(𝑇))]
𝑉(𝑇)
= [𝑇 (∫ 𝑓(𝑥)𝑑𝑥∞
𝑇
)]
+ [∫ 𝑥𝑓(𝑥)𝑑𝑥
𝑇
0
𝐹(𝑇)(∫ 𝑓(𝑥)𝑑𝑥
𝑇
0
)]
(10)
Finally, taking into account equations (4), (8) and
(10) average cost rate is
C(T)
=[CR(∫ f(x)dx
∞
T)] + [CF (∫ f(x)dx
T
0)] + [CI (∫ ηecsds
T
0)] + [CM (∫ λ(x)dx
T
0)]
[T(∫ f(x)dx∞
T)] + [
∫ xf(x)dxT
0
F(T)(∫ f(x)dx
T
0)]
(11)
NUMERICAL EXAMPLES
PPR system
In this system, it is estimated that cumulative
function followed the Weibull distribution. In this
distribution λ is scale parameter and β is shape
parameter. If β>1 there is an aging process, if β=1
there is a constant process and if β<1 there is a
mortality process. We consider λ=0.5 and β=2. Also
we have CPR=80, CPPR=65, CM=35, CI=18 by
using of an approximate calculation of cost records
and shock parameters are η=0.6 and c=0.05. Also
numbers of partial preventive replacements (k-1)
with respect to structure are 1 and 3 respectively.
Weibull probability density function of failure is
𝑓(𝑥, 𝜆, 𝛽) =𝛽
𝜆(
𝑥
𝜆)
𝛽−1
𝑒−(𝑥𝜆
)𝛽
(12)
By using MATLAB we have
Table1. Total expected Cost per unit time
C( k , T)
T
k=2 k=4
0.1 749.827 712.327

Manag. Adm. Sci. Rev. e-ISSN: 2308-1368, p-ISSN: 2310-872X Volume: 4, Issue: 5, Pages: 813-820
818
0.2 401.354 382.604
0.3 294.548 282.048
0.4 248.159 238.784
0.5 225.936 218.436
0.6 215.797 209.547
0.7 212.563 207.206
0.8 213.644 208.956
0.9 217.602 213.436
1.0 223.575 219.825
Figure3. Total expected Cost per unit time
Shows the optimal point in the figures.
In PPR system, when β=2 (aging) and k=2, the
optimal partial preventive replacement time is 0.7
and cost rate is 212.563 and when k=4, the optimal
partial cycle is 0.7 but cost rete at this time is
207.206. With the increasing number of PPRs, the
cost rate has decline trend. In addition, by
increasing the number of PPRs, total cost rate
decreases.
ABR system
And now, we studied without lower indenture
level components, Similar to previous system, a
shock causes system will be received inspection
and a defeat causes system will be stopped and
received minimal repairs. In addition system
replaces with a same type at time T preventively or
at times less than T due to failure.
In this system, it is estimated the cumulative
function followed the Weibull distribution. In this
distribution λ is scale parameter and β is shape
parameter. We consider λ=0.5 and β=2 and we
have CR=80, CF=88, CM=35, CI=18 similarly to
previous system and shock parameters are η=0.6
and c=0.05.
By using MATLAB we have
Table2. Total expected Cost per unit
T C (T) T C (T)
0.1 839.018 0.6 354.710
0.2 468.605 0.7 386.677
0.3 367.308 0.8 429.456
0.4 336.172 0.9 481.494
0.5 336.157 1.0 541.737
0
100
200
300
400
500
600
700
800
1 2 3 4 5 6 7 8 9 10
C(K
,T)
C(2,T)
C(4,T)

Manag. Adm. Sci. Rev. e-ISSN: 2308-1368, p-ISSN: 2310-872X Volume: 4, Issue: 5, Pages: 813-820
819
Figure4. Total expected Cost per unit time
In ABR system, optimal replacement cycle is 0.5
and at this time system cost rate is 336.157.
Comparison of models
Now, we compare PPR system with k=2 and ABR
system. In PPR system replacement time is more
than ABR with lower cost. As a result, if the system
is replaceable for lower indenture level
components have longer life than ABR system.
Also the cost rate in PPR system is lower than ABR
system.
Figure 5. Comparison of PPR (K=2) and ABR systems
CONCLUSIONS
In this paper, two optimal replacement policies
(PPR and ABR) by considering shock process are
presented and studied. We have shown optimal
replacement time through numerical examples.
Also, analyses are provided by considering
replacement policy type. The models in this article
will assist in replacement policies decision making
by considering internal defeats and external shocks
and will help managers to achieve the lowest cost
by considering reliability rate. In fact, by using
data mining documentation for maintenance of a
system and fitted to suit the cumulative function
and its parameters and estimate of maintenance
costs, through the use of proposed models the best
time to get a replacement system. Besides, these
models can use for warranty period time
determining when a system is new or after an
overhaul maintenance. Future research can
formulate models with the addition parameters
such as degradation or corrosion and also expand
models application by considering other
cumulative distributions and structure of
components.
REFERENCES
Adolfo Crespo Marquez (2007), the maintenance
management framework, Springer series in
reliability engineering ISSN 1614-7839,
London.
A.Pak, R.Pascual, A.K.S Jardine (2007),
Maintenance and replacement policies for
protective devices with imperfect repairs,
MARCON, University of Tennessee, May 9-
11.
Barlow, R. E., & Hunter, L. C. (1960), Optimum
preventive maintenance policies, Operations
research, 8, 90-100.
Chiming Guo, Wenbin Wang, Bo Guo, Rui Peng
(2013), Maintenance optimization for
systems with dependent competing risks
using a copula function, Maintenance and
reliability, 15(1), 9-17.
Chin-Chih Chang (2014), Preventive replacement
policy and imperfect maintenance model
with random working times, International
0
100
200
300
400
500
600
700
800
900
1 2 3 4 5 6 7 8 9 10
C(T
)
0
100
200
300
400
500
600
700
800
900
1 2 3 4 5 6 7 8 9 10
COST
Time
PPR
ABR

Manag. Adm. Sci. Rev. e-ISSN: 2308-1368, p-ISSN: 2310-872X Volume: 4, Issue: 5, Pages: 813-820
820
conference on education reform and modern
management, January.
David D. Hanagal, Rupali A. Kanade (2011),
Optimal replacement policies based on
number of downtimes for cold standby
system when the lifetime and the repair time
are dependent, Journal of reliability and
statistical studies, 4(1), 41-52.
Guan Jun Wang, Yuan Lin Zhang (2007), an
optimal replacement for a two-component
series system assuming geometric process
repair, Computers and mathematics with
Applications, 54(2), 192-202.
Guan Jun Wang, Yuan Lin Zhang (2007), a
geometric repair model for a series repairable
system with k dissimilar components,
applied mathematical modeling 31(9), 1997-
2007.
Yusuf and U.A.Ali (2012), Structural dependence
replacement model for parallel system of two
units, Nigerian journal of basic and applied
science, 20(4), 324-326.
K.T. Huynh, I.T. Castro, A. Barros, C. Berenguer
(2011), Modeling age-based maintenance
strategies with minimal repairs for systems
subject to competing failure modes due to
degradation and shocks, European journal of
operational research, 218(1), 140-151.
K.Yao, D.A. Ralescu (2013), Age replacement
policy in uncertain environment, Iranian
journal of fuzzy systems, 10(2), 29-39.
Ling Wang, Jian Chu, Weijie Mao (2008), a
condition based order-replacement for a
single-unit system, applied mathematical
modeling, 32(11), 2274-2289.
Ming Xu, Tao Chen, Xianhui Yang (2012), optimal
replacement policy for safety related multi
component multi state systems, Rel. Eng. &
System Safety, 99, 87-95.
M. sreedhar, B. Venkata Ramudu, R. Bhuvana
Vijaya (2013), An α-series process repair
model for a deteriorating cold standby
repairable system with priority in repair and
use, International journal of current
engineering and technology, 3(3), 957-961.
M. Yasin Ulukus, Jeffrey P. Kharoufeh, Lisa M.
Maillart (2012), optimal replacement policies
under environment driven degradation,
Probability in the engineering and
informational sciences, 26(3), 405-424.
Shey-Huei Sheu, Yen-Luan Chen, Chin-Chih
Chang, Zhe George Zhang (2013), extended
optimal replacement policy for systems
subject to non-homogeneous pure birth
shocks, Computers & industrial engineering,
64(2), 573-579.
Shey-Huei Sheu, Yen-Luan Chen, Chin-Chih
Chang, Zhe George Zhang (2013), Optimal
number of repairs before replacement for a
system subject to shocks of a non-
homogeneous pure birth process, IEEE
transactions on reliability, 62(1), 73-81.
Sophie Mercier, Hai Ha PHAM (2012), a
preventive maintenance policy for a
continuously monitored system with
correlated wear indicators, 222(2), 1057-
1076.
Xu-Feng Zhao, Mingchih Chen, Toshio Nakagawa
(2010), three kinds or replacement models
combined with additive and independent
damages, the ninth international symposium
on operation research and its applications,
Chengdu-Jiuzhaigou, China, 19-23.
Yanmei Jiang, Xianyum Meng (2012), the optimal
policy of shock model with limited repaired
time based on the α-process, Journal of
information & computational science, 9(14),
3987-3994.
Yen-Luan Chen (2012), a bivariate optimal
imperfect preventive maintenance policy for
a used system with two-type shocks,
Computer & industrial engineering, 63(4),
1227-1234.
Yu-Hung Chien (2009), a number-dependent
replacement policy for a system with
continuous preventive maintenance and
random lead times, applied mathematics
modeling 33(3), 1708-1718.
Yu-Hung Chien, Jih-An Chen (2011), optimal
maintenance policy for a system suffered
damage in discrete time process, Procedia-
social and behavioral sciences, 25, 159-169.