Age-associated changes in the content and fatty acid composition of brain glycerophospholipids
13
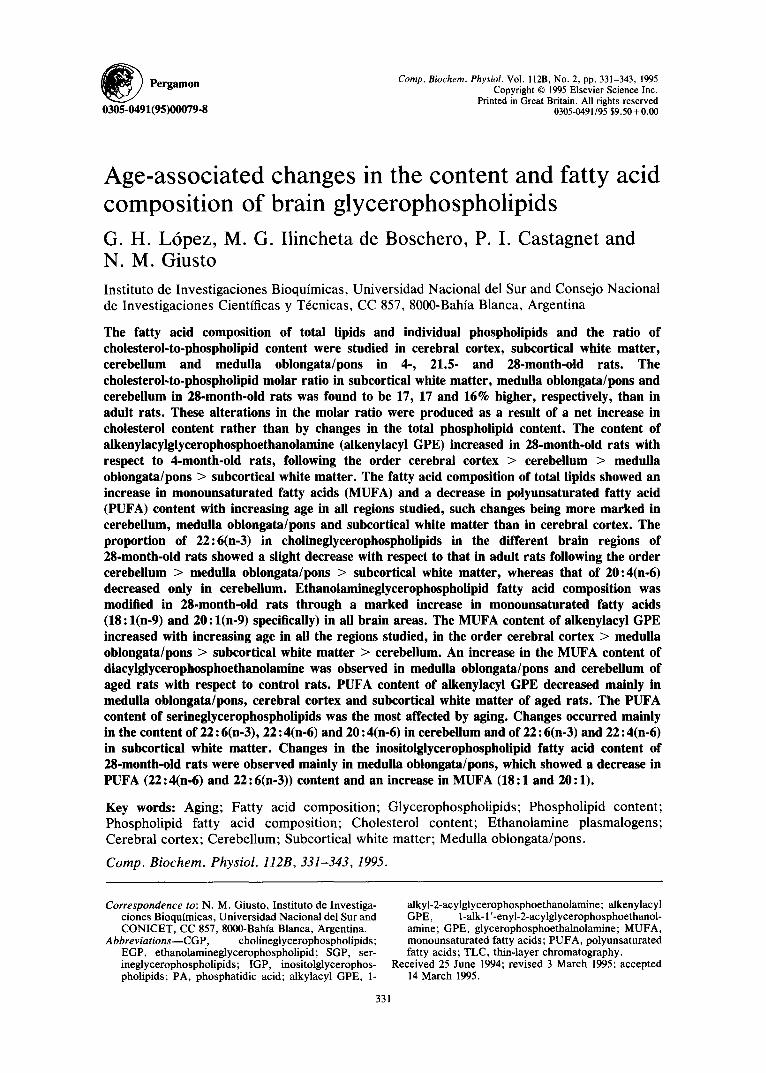
~ Pergamon 0305-0491(95)00079-8 Comp. Biochem. Physiol. Vol. 112B,No. 2, pp. 331-343, 1995 Copyright © 1995Elsevier Science Inc. Printed in Great Britain. All rights reserved 0305-0491/95 $9.50+ 0.00 Age-associated changes in the content and fatty acid composition of brain glycerophospholipids G. H. L6pez, M. G. Ilincheta de Boschero, P. I. Castagnet and N. M. Giusto Instituto de Investigaciones Bioqufmicas, Universidad Nacional del Sur and Consejo Nacional de Investigaciones Cientfficas y T6cnicas, CC 857, 8000-Bahia Blanca, Argentina The fatty acid composition of total lipids and individual phospholipids and the ratio of cholesterol-to-phospholipid content were studied in cerebral cortex, subcortical white matter, cerebellum and medulla oblongata/pons in 4-, 21.5- and 28-month-old rats. The cholesterol-to-phospholipid molar ratio in subcortical white matter, medulla oblongata/pons and cerebellum in 28-month-old rats was found to be 17, 17 and 16% higher, respectively, than in adult rats. These alterations in the molar ratio were produced as a result of a net increase in cholesterol content rather than by changes in the total phospholipid content. The content of alkenylacylglycerophosphoethanolamine (alkenylacyl GPE) increased in 28-month-old rats with respect to 4-month-old rats, following the order cerebral cortex > cerebellum > medulla oblongata/pons > subcortical white matter. The fatty acid composition of total lipids showed an increase in monounsaturated fatty acids (MUFA) and a decrease in polyunsaturated fatty acid (PUFA) content with increasing age in all regions studied, such changes being more marked in cerebellum, medulla oblongata/pons and subcortical white matter than in cerebral cortex. The proportion of 22:6(n-3) in cholinegiycerophospholipids in the different brain regions of 28-month-old rats showed a slight decrease with respect to that in adult rats following the order cerebellum > medulla oblongata/pons > subcortical white matter, whereas that of 20:4(n-6) decreased only in cerebellum. Ethanolaminegiycerophospholipid fatty acid composition was modified in 28-month-old rats through a marked increase in monounsaturated fatty acids (18: l(n-9) and 20: l(n-9) specifically) in all brain areas. The MUFA content of alkenylacyl GPE increased with increasing age in all the regions studied, in the order cerebral cortex > medulla oblongata/pons > subcortical white matter > cerebellum. An increase in the MUFA content of diacylgiycerophosphoethanolamine was observed in medulla oblongata/pons and cerebellum of aged rats with respect to control rats. PUFA content of alkenylacyl GPE decreased mainly in medulla oblongata/pons, cerebral cortex and subcortical white matter of aged rats. The PUFA content of serineglycerophospholipids was the most affected by aging. Changes occurred mainly in the content of 22: 6(n-3), 22: 4(n-6) and 20: 4(n-6) in cerebellum and of 22: 6(n-3) and 22: 4(n-6) in subcortical white matter. Changes in the inositolglycerophospholipid fatty acid content of 28-month-old rats were observed mainly in medulla oblongata/pons, which showed a decrease in PUFA (22: 4(n-6) and 22: 6(n-3)) content and an increase in MUFA (18:1 and 20:1). Key words: Aging; Fatty acid composition; Glycerophospholipids; Phospholipid content; Phospholipid fatty acid composition; Cholesterol content; Ethanolamine plasmalogens; Cerebral cortex; Cerebellum; Subcortical white matter; Medulla oblongata/pons. Comp. Biochem. Physiol. 112B, 331-343, 1995. Correspondence to: N. M. Giusto, Instituto de Investiga- ciones Bioqufmicas, Universidad Nacional del Sur and CONICET, CC 857, 8000-Bahfa Blanca, Argentina. Abbreviations--CGP, cholineglycerophospholipids; EGP, ethanolamineglycerophospholipid; SGP, ser- ineglycerophospholipids; IGP, inositolglycerophos- pholipids; PA, phosphatidic acid; alkylacyl GPE, 1- alkyl-2-acylglycerophosphoethanolamine; alkenylacyl GPE, l-alk-1'-enyl-2-acylglycerophosphoethanol- amine; GPE, glycerophosphoethalnolamine; MUFA, monounsaturated fatty acids; PUFA, polyunsaturated fatty acids; TLC, thin-layer chromatography. Received 25 June 1994; revised 3 March 1995; accepted 14 March 1995. 331
-
Upload
independent -
Category
Documents
-
view
0 -
download
0
Transcript of Age-associated changes in the content and fatty acid composition of brain glycerophospholipids
~ Pergamon
0305-0491(95)00079-8
Comp. Biochem. Physiol. Vol. 112B, No. 2, pp. 331-343, 1995 Copyright © 1995 Elsevier Science Inc.
Printed in Great Britain. All rights reserved 0305-0491/95 $9.50 + 0.00
Age-associated changes in the content and fatty acid composition of brain glycerophospholipids G. H. L6pez, M. G. Ilincheta de Boschero, P. I. Castagnet and N. M. Giusto
Instituto de Investigaciones Bioqufmicas, Universidad Nacional del Sur and Consejo Nacional de Investigaciones Cientfficas y T6cnicas, CC 857, 8000-Bahia Blanca, Argentina
The fatty acid composition of total lipids and individual phospholipids and the ratio of cholesterol-to-phospholipid content were studied in cerebral cortex, subcortical white matter, cerebellum and medulla oblongata/pons in 4-, 21.5- and 28-month-old rats. The cholesterol-to-phospholipid molar ratio in subcortical white matter, medulla oblongata/pons and cerebellum in 28-month-old rats was found to be 17, 17 and 16% higher, respectively, than in adult rats. These alterations in the molar ratio were produced as a result of a net increase in cholesterol content rather than by changes in the total phospholipid content. The content of alkenylacylglycerophosphoethanolamine (alkenylacyl GPE) increased in 28-month-old rats with respect to 4-month-old rats, following the order cerebral cortex > cerebellum > medulla oblongata/pons > subcortical white matter. The fatty acid composition of total lipids showed an increase in monounsaturated fatty acids (MUFA) and a decrease in polyunsaturated fatty acid (PUFA) content with increasing age in all regions studied, such changes being more marked in cerebellum, medulla oblongata/pons and subcortical white matter than in cerebral cortex. The proportion of 22:6(n-3) in cholinegiycerophospholipids in the different brain regions of 28-month-old rats showed a slight decrease with respect to that in adult rats following the order cerebellum > medulla oblongata/pons > subcortical white matter, whereas that of 20:4(n-6) decreased only in cerebellum. Ethanolaminegiycerophospholipid fatty acid composition was modified in 28-month-old rats through a marked increase in monounsaturated fatty acids (18: l(n-9) and 20: l(n-9) specifically) in all brain areas. The MUFA content of alkenylacyl GPE increased with increasing age in all the regions studied, in the order cerebral cortex > medulla oblongata/pons > subcortical white matter > cerebellum. An increase in the MUFA content of diacylgiycerophosphoethanolamine was observed in medulla oblongata/pons and cerebellum of aged rats with respect to control rats. PUFA content of alkenylacyl GPE decreased mainly in medulla oblongata/pons, cerebral cortex and subcortical white matter of aged rats. The PUFA content of serineglycerophospholipids was the most affected by aging. Changes occurred mainly in the content of 22: 6(n-3), 22: 4(n-6) and 20: 4(n-6) in cerebellum and of 22: 6(n-3) and 22: 4(n-6) in subcortical white matter. Changes in the inositolglycerophospholipid fatty acid content of 28-month-old rats were observed mainly in medulla oblongata/pons, which showed a decrease in PUFA (22: 4(n-6) and 22: 6(n-3)) content and an increase in MUFA (18:1 and 20:1).
Key words: Aging; Fatty acid composition; Glycerophospholipids; Phospholipid content; Phospholipid fatty acid composition; Cholesterol content; Ethanolamine plasmalogens; Cerebral cortex; Cerebellum; Subcortical white matter; Medulla oblongata/pons.
Comp. Biochem. Physiol. 112B, 331-343, 1995.
Correspondence to: N. M. Giusto, Instituto de Investiga- ciones Bioqufmicas, Universidad Nacional del Sur and CONICET, CC 857, 8000-Bahfa Blanca, Argentina.
Abbreviations--CGP, cholineglycerophospholipids; EGP, ethanolamineglycerophospholipid; SGP, ser- ineglycerophospholipids; IGP, inositolglycerophos- pholipids; PA, phosphatidic acid; alkylacyl GPE, 1-
alkyl-2-acylglycerophosphoethanolamine; alkenylacyl GPE, l-alk- 1 '-enyl-2-acylglycerophosphoethanol- amine; GPE, glycerophosphoethalnolamine; MUFA, monounsaturated fatty acids; PUFA, polyunsaturated fatty acids; TLC, thin-layer chromatography.
Received 25 June 1994; revised 3 March 1995; accepted 14 March 1995.
331
332 G.H. L6pez et al.
Introduction
Brain aging is a complex process character- ized by morphological and neurochemical modifications involving numerous biochemi- cal alterations in neural components. Phos- pholipids are structurally and functionally im- portant constituents of the membrane, and numerous studies have been carried out to ex- amine their role in aging (Rouser and Yama- mato, 1968; Horrocks et al., 1981 ; Schroeder, 1984). Phospholipids regulate not only mem- brane structure and permeability but also the activities of membrane-bound enzymes (Lynch, 1980; Stubbs and Smith, 1984). Changes in the composition and metabolism of brain lipids have been proposed to contrib- ute to the deterioration of central nervous sys- tem function with increasing age (Horrocks et al., 1981; S6derberg et al., 1990). However, analyses of age-related changes in the lipid composition and metabolism of the normal aging process in experimental animals are not fully conclusive, plagued as they are with in- consistencies owing to differences in the strains of animals used, they age of animals considered to be "old" and a host of other uncontrolled variables.
Though in studies of this type it is difficult to determine causes and effects, valuable in- sight is to be gained from a closer examination of the compositional and metabolic changes occurring in individual phospholipids during the normal aging process.
In previous studies, we demonstrated alter- ations in the composition and " in vi tro" metabolism of retinal docosahexaenoic- containing lipids in aged rats (Rotstein et al., 1987). We also reported modifications in the sphingomyelin content and composition in dif- ferent brain areas of aged rat (Giusto et al., 1992). In addition, polyunsaturated acyl groups of glycerophospholipids have been shown to decrease in the brain (Horrocks et al., 1981; Samorajski and Persson, 1985). The present study was undertaken to examine to- tal and individual glycerophospholipid fatty acid composition and the cholesterol-to- phospholipid ratio in cerebral cortex, subcor- tical white matter, cerebellum and medulla ob- longata/pons at 4, 21.5 and 28 months of age. In addition, individual phospholipid and plas- malogen content was studied.
Materials and Methods Materials
Wistar-strain rats were kept under constant environmental conditions and were fed a stan- dard pellet diet. The cerebral cortex, subcorti-
cal white matter, cerebellum and medulla ob- longata/pons were obtained from a group of 4-, 21.5- and 28-month-old rats.
Rats were killed by decapitation, and all brain areas were immediately removed (within 2-4 min of decapitation). The dissections were performed at 0-4°C.
Lipid extract ion and analyt ical me thods
Lipids were extracted and washed ac- cording to Folch et al. (1957). Aliquots were taken from the washed extract for total choles- terol determination (Ott et al., 1982; Sale et al., 1984) and for total lipid alkaline metha- nolysis. Alkaline methanolysis was carried out in this case to avoid methanolysis of fatty acids from sphingomyelin and plasmalogens. A sample of the extracts was dried under a stream of nitrogen, mixed with 1 ml KOH 1 N in methanol and left overnight under nitro- gen at room temperature. Methyl esters were extracted with hexane and purified by thin- layer chromatography (TLC) with a solvent mixture of hexane : diethylether (90 : I0, v/v). Spots were visualized with 2'7'-dichloro- fluorescein, scraped off from the plates and extracted from the silica by the procedure of Arvidson (1968). Lipids were identified by spotting the corresponding phospholipid stan- dards on the plate.
To determine the fatty acid composition and the content of individual glycerophospholipids (cholineglycerophospholipids [CGP], ethanol- amineglycerophospholipids [EGP], serine- glycerophospholipids [SGP], inositolglycero- phospholipids [IGP], and phosphatidic acid [PAD, two similar two-dimensional TLC sepa- rations were carried out (Rouser et al., 1970). The plates to be used for determining fatty acid composition were sprayed with 2'7'- dichlorofluorescein, and the spots were lo- cated under ultraviolet light. Lipids were scraped from the plates and fatty acid methyl esters were prepared with BF3 in methanol as described by Morrison and Smith (1964). The plates to be used for determining individual glycerophospholipid content were exposed to iodine vapors to locate lipid spots and quanti- tated by phosphorus analysis (Rouser et al., 1970).
To determine the content and the acyl group composition of diacylglycerophosphoethanol- amine (GPE) plus alkylacyl GPE and alk-l'- enylacyl-GPE, the EGP were isolated by two- dimensional TLC as described above and were recovered from the Silica gel G by the extraction method of Arvidson (1968), dried under N2 and briefly exposed to HCI to re- lease the aldehydes from 1-alk-l'-enyl ether bonds of alkenylacyl GPE. The method is a

Age-associated changes of brain glycerophospholipids 333
modification of a procedure used to release the fatty acids from lipids (Aveldafio and Hor- rocks, 1983). Instead of heating the samples at 100°C, they were agitated for 1 min at room temperature in a vortex mixer with a solution of concentrated HCI (1 N) in dry acetonitrile. Chloroform and 1 N NaHCO3 (1 : 1, v/v) were added and the contents thoroughly mixed. After a brief centrifugation, the aqueous phase was discarded and the organic phase was washed once with water. The organic solvent was evaporated under nitrogen and the lipids immediately subjected to TLC (solvent of the second dimension of Rouser et al., 1970). To determine the fatty acid composition or the phospholipid content of the spots, they were located as described above. Hydrolysis of es- ter bonds was only - 2 % under the present conditions (Rotstein and Alvedafio, 1987).
All gas chromatography analyses were car- ried out as follows. Two glass columns (2 m x 2 mm ID) packed with 15% OV-275 on 80-120 chromosorb WAW (Supelco, Bellefonte, PA, U.S.A.) were connected to two-flame ioniza- tion detectors operating in the dual-differential mode. A linear (5°C/min) temperature pro- gram, starting at 160 and ending at 220°C, was used. The injector and detector temperatures were 220 and 230°C, respectively.
Protein content was determined by the method of Lowry et al. (1951), and lipid phos- phorus was measured using the method of Rouser et al. (1970).
Statistical analysis
Statistical analysis was performed using Bonferoni t statistic, with the values repre- senting the mean _ SD of the total number of samples indicated in each legend. In ratios, the SD was calculated according to the ad-hoc statistical treatment of Johnson and Kotz (1969): SD = x l / x 2 • [(SD1)2/nl • (xl)2] + [(SD2)2/n2. (x2)2].
Results Cholesterol content
The total cholesterol-to-phospholipid molar ratio was studied in different brain regions of adult (4-month-old) and aged (28-month-old) rats (Fig. 1). In adult rats, this ratio was higher in subcortical white matter and medulla oblon- gata/pons than in cerebral cortex and cerebel- lum, and it increased with aging in subcortical white matter, medulla oblongata/pons and cerebellum by 17, 17 and 16%, respectively. These alterations in the molar ratio were pro- duced as a result of a net increase in choles- terol content rather than by changes in the to- tal phospholipid content. The content of total
._.1 13_
0
E
o
~9
0 c-
1.2
0.8
0.4
m
O
E Fig. 1. Cholesterol-to-phospholipid molar ratio in differ- ent regions of the central nervous system of adult and aged rats. Results are presented in moles of cholesterol per moles of phospholipid. Each bar represents the mean --_ S.D. from four to five samples from adult ([3) and aged (m) rats. Each sample was prepared from two rats. Data of aged rats are compared with those of adult rats using
the Student's t-test; *P < 0.001.
and individual phospholipids--except sphin- gomyelin, as has previously been demon- strated (Giusto et al., 1992)--did not undergo any significant changes in aged rats compared with adult rats, as shown in Tables 1 and 2. It is interesting to note that the PA content in adult rats is higher in the myelin-rich brain regions (subcortical white matter and medulla oblongata/pons) as compared with cerebral cortex and cerebellum. Previously, Sun et al. (1988) reported this observation in the myelin fraction.
The content of the two main subclasses of brain ethanolamineglycerophospholipids, dia- cylglycerophospholipids and plasmalogens (alkenylacyl GPE), was also examined. Tables 1 and 2 show that at 28 months of age the content of alkenylacyl GPE in cerebral cortex, cerebellum, medulla oblongata/pons and sub- cortical white matter increased 48, 21, 7 and 9% over control values, respectively. The mo- lar ratio of alkenylacyl GPE to diacyl GPE plus alkylacyl GPE in cerebral cortex of adult rats was very different to that obtained in the other brain regions studied: 0.61 in cerebral cortex as compared with 1.06, 0.91 and 0.92 in subcortical white matter, cerebellum and medulla oblongata/pons, respectively. The ra- tio in cerebral cortex of 28-month-old rats was somewhat higher than in 4-month-old rats, the value attained being 0.86. The respective val- ues for subcortical white matter, cerebellum and medulla oblongata/pons in 28-month-old rats were 1.06, 0.96 and 1.11.
Fatty acid composit ion o f total lipids
The acyl group composition of total lipids in cerebral cortex and subcortical white matter,
334 G . H . L6pez et al.
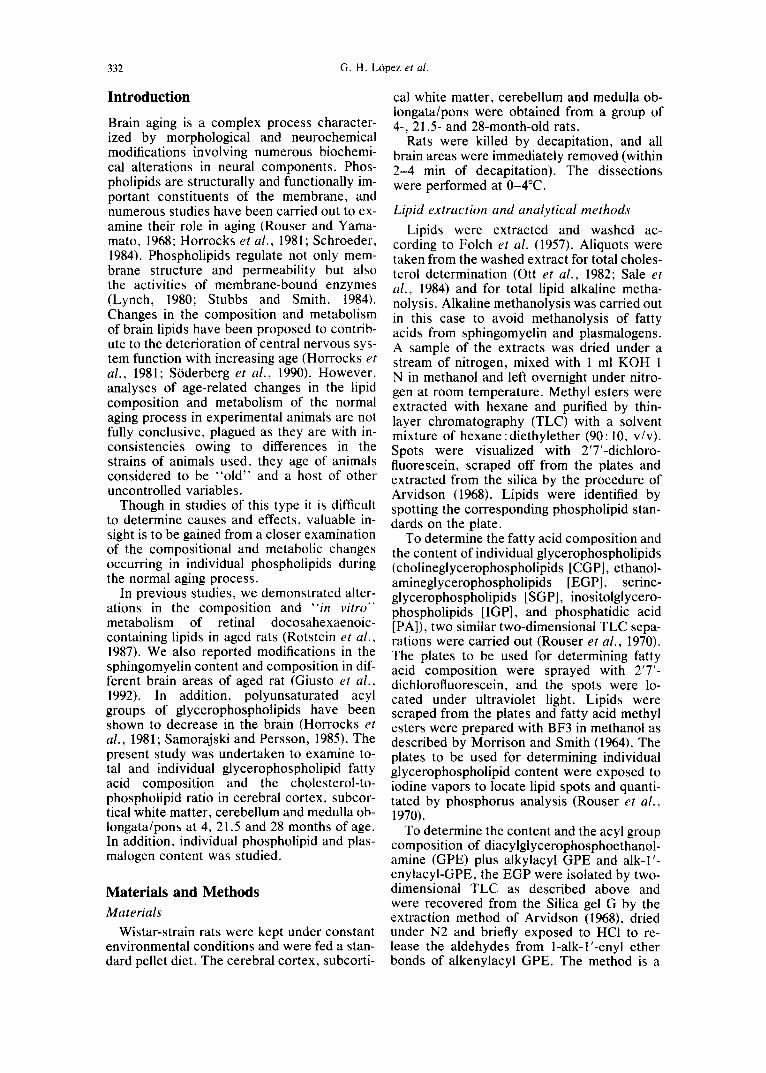
Table 1. Total phospholipid and individual glycerophospholipid contents of cerebral cortex and subcortical white matter from adult and aged rats
Cerebral Cortex Subcortical White Matter
4 21.5 28 4 2i15 28 (months of agel (months of age)
~zmol/100mg Prot PA 0.64 ± 0.17 1.0 ± 0.3 1.3 + 0.2 2.0 ± 0.2 2.2 ± 0.5 1.9 ÷ 0.07 SGP 6.1 ± 0.8 6.5 ± 1.2 7.3 + 0.3 7.6 ± 0.4 8.2 ± 0.9 9.9 ± 1.4 IGP 1.5 ± 0.4 1.3 ± 0.01 2.0 ± 0.5 2.0 ± 0.4 1.7 ± 0.2 1.5 ± 0.2 CGP 17.0 ± 1.1 18.9 ± 3.7 22.8 ± 5.1 18.4 ± 0.6 21.0 _+ 3.4 19.6 -+ 0.5 EGP 16.8 ± 1.0 16.5 ± 3.(1 21.2 ÷ 3.3 21.7 ± 1.8 25.3 ± 4.1 24.0 _+ 1.0 Alkenylacyl-GPE 6.4 ± 0.4 6.4 + 0.4 9.8 ± 0.7* 11.5 ± 0.2 11.4 ± 0.9 12.3 ± 0.1 ++ Diacyl-GPE + 10.5 _+ 0.3 10.1 _+ 0.4 11.4 + (1.7 10.2 ± 0.2 12.8 ± 0.6 ~+ 11.7 ± 0.2 ++ Alkylacyl-GPE TPL 44.1 _+ 4.2 47.7 _+ 9.8 57.9 + 10.2 54.5 ± 2.3 61.7 ± 9.1 60.1 ± 2.8 PlsEtn/ 0.61 + 0.15 0.63 ± 0.15 0.86 ± 0.14 1.08 + 0.14 0.92 ± 0.10 1.06 ± 0.03 Diacyl-GPE
The amounts of total phospholipids, glycerophospholipids, alkenylacyl GPE and diacyl GPE + alkylacyl GPE (ixmol/ 100mg Prot) are presented as mean ± SD from five to six samples analyzed separately from adult (4 month) and aged rats (21.5 and 28 months). Each sample corresponding to 21.5- or 28-month-old rats consisted of two or three cerebral cortex and subcortical white matter, respectively. Data are compared with controls using Bonferoni t statistic. +, P < 0.01; ++, P < 0.005.
obtained by alkaline methanolysis, is shown in Table 3. A slight increase in 18: l(n-9) and 20:l(n-91 was observed in cerebral cortex in 21.5-month-old rats with respect to adult rats. This increase was higher at 28 months of age. The amount of polyunsaturated fatty acids (PUFA) such as 22:4(n-61 and 22:6(n-31 was slightly lower in aged rats than in adult rats. A similar pattern of changes was observed in the fatty acid composition of total lipids from the subcortical white matter of aged rats with respect to adult rats, these changes being more marked in 28-month-old rats than in 21- month-old rats. It is interesting to note that subcortical white matter was more affected than cerebral cortex, particularly in the last
aging period studied by us (21.5-28 months of age). In addition, the content of total PUFA in this region of aged rats diminished by 14% with respect to adult rats, 22:6(n-3) being the most affected (a 30% decrease). A significant increase in the 18"2-to-20"4 molar ratio was observed in aged rats (0.117 _+ 0.017) with re- spect to adult rats (0.089 _ 0.0091, whereas in the case of 18:0-to-18: I a decrease was ob- served (0.825 _+ 0.029) in aged rats compared with 0.929 _+ 0.052 in adult rats). The lower degree of unsaturation in cerebral cortex and subcortical white matter is reflected in the lower unsaturation index, which decreased more markedly in subcortical white matter than in cerebral cortex (Table 3).
Table 2. Total phospholipid and individual glycerophospholipid contents of cerebellum and medulla oblongata/pons from adult and aged rats
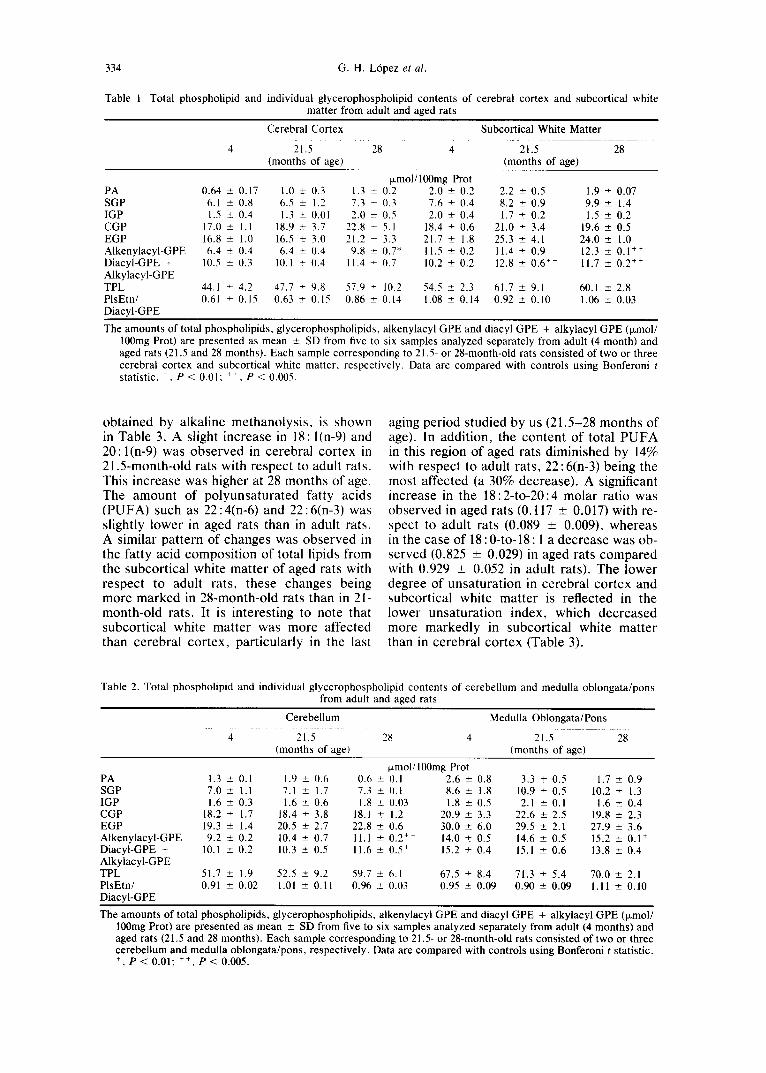
Cerebellum Medulla Oblongata/Pons
4 21.5 28 4 21.5 28 (months of agel (months of age)
p~mol/100mg Prot PA 1.3 ± 0.1 1.9 ± 0.6 0.6 ± 0.1 2.6 ± 0.8 3.3 ± 0.5 1.7 ± 0.9 SGP 7.0 ± 1.1 7.1 ± 1.7 7.3 ± 0.1 8.6 ± 1.8 10.9 ± 0.5 10.2 ± 1.3 IGP 1.6 ± 0.3 1.6 ± 0.6 1.8 ± 0.03 1.8 ± 0.5 2.1 ± 0.1 1.6 ± 0.4 CGP 18.2 ± 1.7 18.4 ± 3.8 18.1 ± 1.2 20.9 ± 3.3 22.6 ± 2.5 19.8 ± 2.3 EGP 19.3 ± 1.4 20.5 ± 2.7 22.8 ± 0.6 30.0 ± 6.0 29.5 ± 2.1 27.9 ± 3.6 Alkenylacyl-GPE 9.2 ± 0.2 10.4 ± 0.7 11.1 ± 0.2 ++ 14.0 ± 0.5 14.6 ± 0.5 15.2 ± 0.1 + Diacyl-GPE + 10.1 ± 0.2 10.3 ± 0.5 11.6 ± 0.5 + 15.2 ± 0.4 15.1 ± 0.6 13.8 ± 0.4 Alkylacyl-GPE TPL 51.7 ± 1.9 52.5 _+ 9.2 59.7 _+ 6.1 67.5 ± 8.4 71.3 ± 5.4 70.0 ± 2.1 PlsEtn/ 0.91 ± 0.02 1.01 ± 0.11 0.96 ± 0.03 0.95 ± 0.09 0.90 ± 0.09 1.11 ± 0.10 Diacyl-GPE
The amounts of total phospholipids, glycerophospholipids, alkenylacyl GPE and diacyl GPE + alkylacyl GPE (ixmol/ 100mg Prot) are presented as mean +_ SD from five to six samples analyzed separately from adult (4 months) and aged rats (21.5 and 28 months). Each sample corresponding to 21.5- or 28-month-old rats consisted of two or three cerebellum and medulla oblongata/pons, respectively. Data are compared with controls using Bonferoni t statistic. ÷, P < 0.01; ++, P < 0.005.
Age-associated changes of brain glycerophospholipids 335
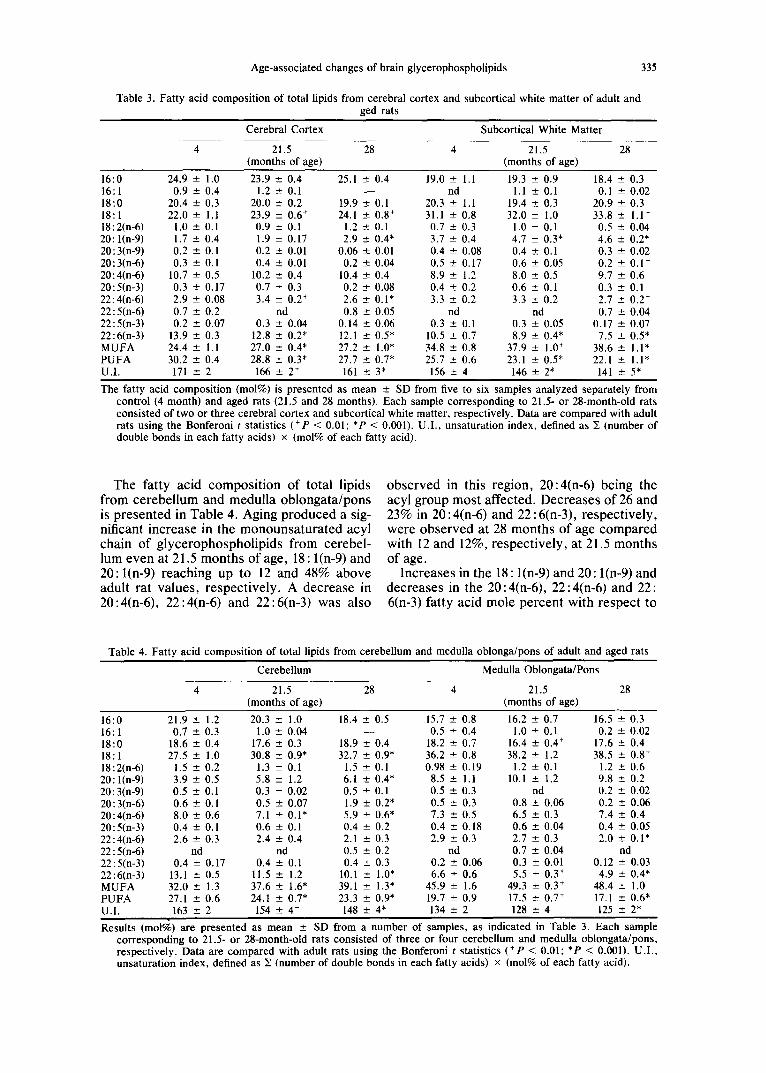
Table 3. Fatty acid composition of total lipids from cerebral cortex and subcortical white matter of adult and ged rats
Cerebral Cortex Subcortical White Matter
4 21.5 28 4 21.5 28 (months of age) (months of age)
16:0 24.9 ± 1.0 23.9 ± 0.4 25.1 ± 0.4 19.0 ± 1.1 19.3 ± 0.9 18.4 ± 0.3 16:1 0.9 ± 0.4 1.2 ± 0.1 - - nd 1.1 ± 0.1 0.1 -+ 0.02 18:0 20.4 ± 0.3 20.0 ± 0.2 19.9 ± 0.1 20.3 ± 1.1 19.4 ± 0.3 20.9 ± 0.3 18:1 22.0 ± 1.1 23.9 ___ 0.6 + 24.1 ± 0.8 + 31.1 ± 0.8 32.0 ± 1.0 33.8 ± 1.1 + 18:2(n-6) 1.0 ± 0.1 0.9 ± 0.1 1.2 ± 0.1 0.7 ± 0.3 1.0 ± 0.1 0.5 ± 0.04 20: l(n-9) 1.7 ± 0.4 1.9 ± 0.17 2.9 ± 0.4* 3.7 ± 0.4 4.7 ± 0.3* 4.6 ± 0.2* 20:3(n-9) 0.2 ± 0.1 0.2 ± 0.01 0.06 ± 0.01 0.4 ± 0.08 0.4 ± 0.1 0.3 ± 0.02 20:3(n-6) 0.3 ± 0.1 0.4 ± 0.01 0.2 ± 0.04 0.5 ± 0.17 0.6 ± 0,05 0.2 ± 0.1 + 20:4(n-6) 10.7 ± 0.5 10.2 ± 0.4 10.4 ± 0.4 8.9 ± 1.2 8.0 ± 0.5 9.7 ± 0.6 20:5(n-3) 0.3 ± 0.17 0.7 ± 0.3 0.2 ± 0.08 0.4 ± 0.2 0.6 ± 0.1 0.3 ± 0.1 22:4(n-6) 2.9 ± 0.08 3.4 ± 0.2 + 2.6 ± 0.1" 3.3 ± 0.2 3.3 ± 0.2 2.7 ± 0.2 + 22:5(n-6) 0.7 ± 0.2 nd 0.8 _+ 0.05 nd nd 0.7 ± 0.04 22:5(n-3) 0.2 ± 0.07 0.3 ± 0.04 0.14 ± 0.06 0.3 ± 0.1 0.3 ± 0.05 0.17 ± 0.07 22:6(n-3) 13.9 ± 0.3 12.8 ± 0.2* 12.1 ± 0.5* 10.5 _+ 0.7 8.9 ± 0.4* 7.5 --- 0.5* MUFA 24.4 ± 1.1 27.0 ± 0.4* 27.2 ± 1.0" 34.8 ± 0.8 37.9 ± 1.0 + 38.6 ± 1.1" PUFA 30.2 ± 0.4 28.8 ± 0.3* 27.7 ± 0.7* 25.7 ± 0.6 23.1 ± 0.5* 22.1 ± 1.1" U.I. 171 ± 2 166 ± 2 + 161 ± 3* 156 _+ 4 146 ± 2* 141 ± 5*
The fatty acid composition (mol%) is presented as mean ± SD from five to six samples analyzed separately from control (4 month) and aged rats (21.5 and 28 months). Each sample corresponding to 21.5- or 28-month-old rats consisted of two or three cerebral cortex and subcortical white matter, respectively. Data are compared with adult rats using the Bonferoni t statistics (+P < 0.01; *P < 0.001). U.I. , unsaturation index, defined as X (number of double bonds in each fatty acids) × (mol% of each fatty acid).
The fatty acid composition of total lipids from cerebellum and medulla oblongata/pons is presented in Table 4. Aging produced a sig- nificant increase in the monounsaturated acyl chain of glycerophospholipids from cerebel- lum even at 21.5 months of age, 18: l(n-9) and 20: l(n-9) reaching up to 12 and 48% above adult rat values, respectively. A decrease in 20 : 4(n-6), 22 : 4(n-6) and 22 : 6(n-3) was also
observed in this region, 20: 4(n-6) being the acyl group most affected. Decreases of 26 and 23% in 20:4(n-6) and 22:6(n-3), respectively, were observed at 28 months of age compared with 12 and 12%, respectively, at 21.5 months of age.
Increases in the 18: l(n-9) and 20: l(n-9) and decreases in the 20:4(n-6), 22:4(n-6) and 22: 6(n-3) fatty acid mole percent with respect to
Table 4. Fatty acid composition of total lipids from cerebellum and medulla oblonga/pons of adult and aged rats
Cerebellum Medulla Oblongata/Pons
4 21.5 28 4 21.5 28 (months of age) (months of age)
16:0 21.9 - 1.2 20.3 ± 1.0 18.4 ± 0.5 15.7 ± 0.8 16.2 ± 0.7 16.5 ± 0.3 16:1 0.7 ± 0.3 1.0 ± 0.04 - - 0.5 -~ 0.4 1.0 ± 0.1 0.2 ± 0.02 18:0 18.6 --- 0.4 17.6 ± 0.3 18.9 ± 0.4 18.2 ± 0.7 16.4 ± 0.4 + 17.6 ± 0.4 18:1 27.5 - 1.0 30.8 ± 0.9* 32.7 ± 0.9* 36.2 ± 0.8 38.2 ± 1.2 38.5 ± 0.8 + 18:2(n-6) 1.5 ± 0.2 1.3 ± 0.1 1.5 _+ 0.1 0.98 -+ 0.19 1.2 ± 0.1 1.2 ± 0.6 20:1(n-9) 3.9 ± 0.5 5.8 ± 1.2 6.1 ± 0.4* 8.5 ± 1.1 10.1 ± 1.2 9.8 ± 0.2 20:3(n-9) 0.5 ± 0.1 0.3 ± 0.02 0.5 ± 0.1 0.5 ± 0.3 nd 0.2 ± 0.02 20:3(n-6) 0.6 ± 0.1 0.5 ± 0.07 1.9 ± 0.2* 0.5 ± 0.3 0.8 ± 0.06 0.2 ± 0.06 20:4(n-6) 8.0 ± 0.6 7.1 ± 0.1" 5.9 ± 0.6* 7.3 ± 0.5 6.5 ± 0.3 7.4 ± 0.4 20:5(n-3) 0.4 ± 0.1 0.6 ± 0.1 0.4 ± 0.2 0.4 ± 0.18 0.6 ± 0.04 0.4 ± 0.05 22:4(n-6) 2.6 ± 0.3 2.4 ± 0.4 2.1 ± 0.3 2.9 ± 0.3 2.7 _+ 0.3 2.0 ± 0.1" 22:5(n-6) nd nd 0.5 ± 0.2 nd 0.7 ± 0.04 nd 22:5(n-3) 0.4 ± 0.17 0.4 ± 0.1 0.4 ± 0.3 0.2 ± 0.06 0.3 ± 0.01 0.12 -+ 0.03 22:6(n-3) 13.1 ± 0.5 11.5 ± 1.2 10.1 ± 1.0" 6.6 ± 0.6 5.5 ± 0.3 + 4.9 +- 0.4* MUFA 32.0 ± 1.3 37.6 ± 1.6" 39.1 ± 1.3" 45.9 ± 1.6 49.3 ± 0.3 + 48.4 -+ 1.0 PUFA 27.1 ± 0.6 24.1 ± 0.7* 23.3 ± 0.9* 19.7 ± 0.9 17.5 ± 0.7 + 17.1 ± 0.6* U.I. 163 ± 2 154 ± 4 + 148 ± 4* 134 ± 2 128 ± 4 125 ± 2*
Results (mol%) are presented as mean ± SD from a number of samples, as indicated in Table 3. Each sample corresponding to 21.5- or 28-month-old rats consisted of three or four cerebellum and medulla oblongata/pons, respectively. Data are compared with adult rats using the Bonferoni t statistics (+P < 0.01; *P < 0.001). U.I . , unsaturation index, defined as X (number of double bonds in each fatty acids) × (mol% of each fatty acid).

336 G .H. L6pez et al.
adult rat values were also observed in medulla oblongata/pons at 21 and at 28 months of age (Table 4). The most dramatic changes in this region took place in arachidonic and docosa- hexaenoic acid, which decreased 39 and 35% with respect to adult rats, respectively. At 28 months of age the unsaturation index in cere- bellum and medulla oblongata/pons decreased 10 and 8%, respectively, compared with adult rats.
Fatty acid composition of individual glycero- phospholipids
It is known that phospholipids differ sub- stantially in their fatty acid composition and that this latter characteristic depends on the particular area of location in the brain. The sum of saturated fatty acids in CGP from adult rats represents more than half of the total fatty acid content: 60, 56, 53 and 51 mol% in cere- bral cortex, cerebellum, subcortical white matter and medulla oblongata/pons, respec- tively (Fig. 2). Monounsaturated fatty acids (MUFA) in CGP account for more than one third of the total fatty acid content. Their abundance in the regions under study follows the order medulla oblongata/pons > subcorti- cal white matter > cerebral cortex > cerebel- lum. Total PUFA, such as 20 : 4, 22 : 4, 22 : 5 and 22:6, were found to constitute 10% of
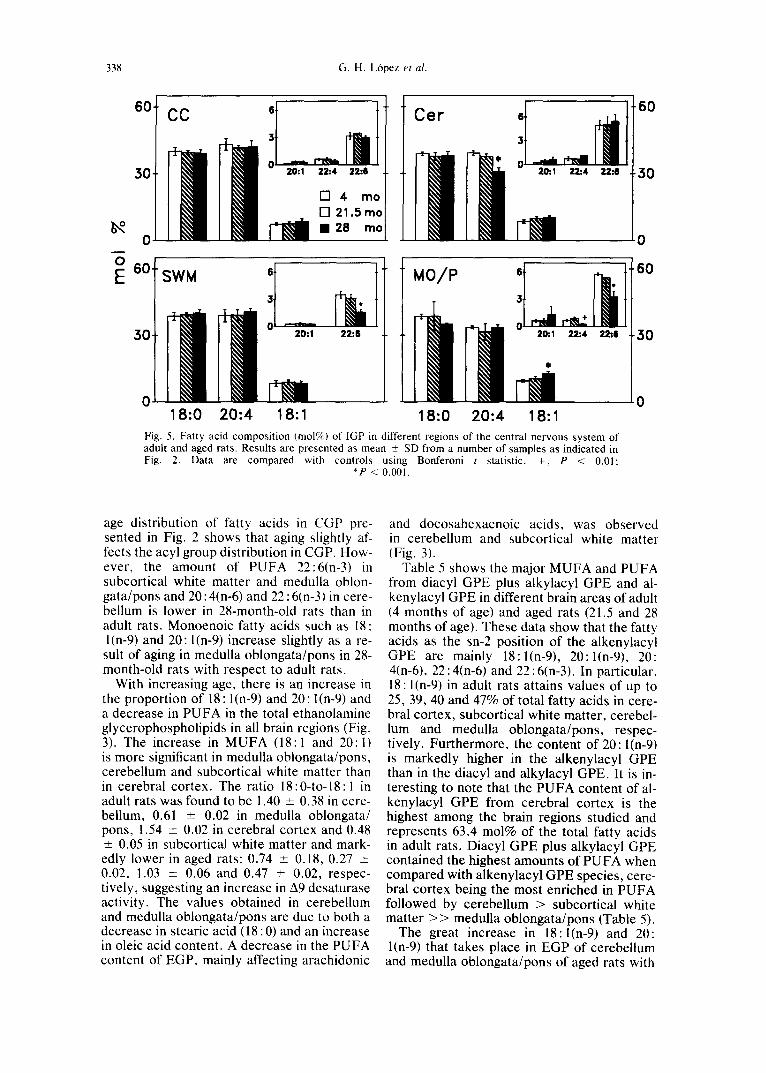
CGP in the cerebellum and cerebral cortex of adult rats but only - 6 mol% in the subcortical white matter and medulla oblongata/pons (Fig. 2). The content of polyunsaturated acyl chains was very different in the other phos- pholipids of adult rats, showing values of 36, 26, 26 and 17 mol% in the EGP of cerebral cortex, cerebellum, subcortical white matter and medulla oblongata/pons, respectively. This phospholipid shows the highest MUFA content, 18: l(n-9) and 20: l(n-9) representing 50, 36, 27 and 18% in medulla oblongata/pons, subcortical white matter, cerebellum and cere- bral cortex, respectively (Fig. 3). A large proportion of polyunsaturated acyl chains es- terified into SGP can also be seen in adult rats, where they represent 35, 26, 24 and 13% in cerebral cortex, cerebellum, subcortical white matter and medulla oblongata/pons, respec- tively (Fig. 4). IGP fatty acid composition is very characteristic and PUFA, essentially 20: 4(n-6), represent -42% of the total acyl chains in all brain areas (Fig. 5). In adult rats no dif- ferences were observed in the SFA, MUFA or PUFA content in IGP in the different brain areas (Fig. 5).
The acyl group composition of individual phospholipids in different brain areas of adult and aged rats (4, 21.5 and 28 months of age) was analyzed (Figs. 2-5). The mole percent
0 16:0 18:1 18:0 16:0 18:1 18:0
Fig. 2. Fatty acid composit ion (tool%) of CGP in different regions of the central nervous system of adult and aged rats. Results are presented as mean ± SD from four to five samples from control and aged rats analyzed separately. Each sample of cerebral cortex (CC) and subcortical white matter (SWM) was prepared from two rats. Data are compared with controls using Bonferoni t statistic. + ,
P < 0.01; *P < 0.001.
I cc :I cer
3 0
0 0
60
3O
0
Age-associated changes of brain glycerophospholipids 337
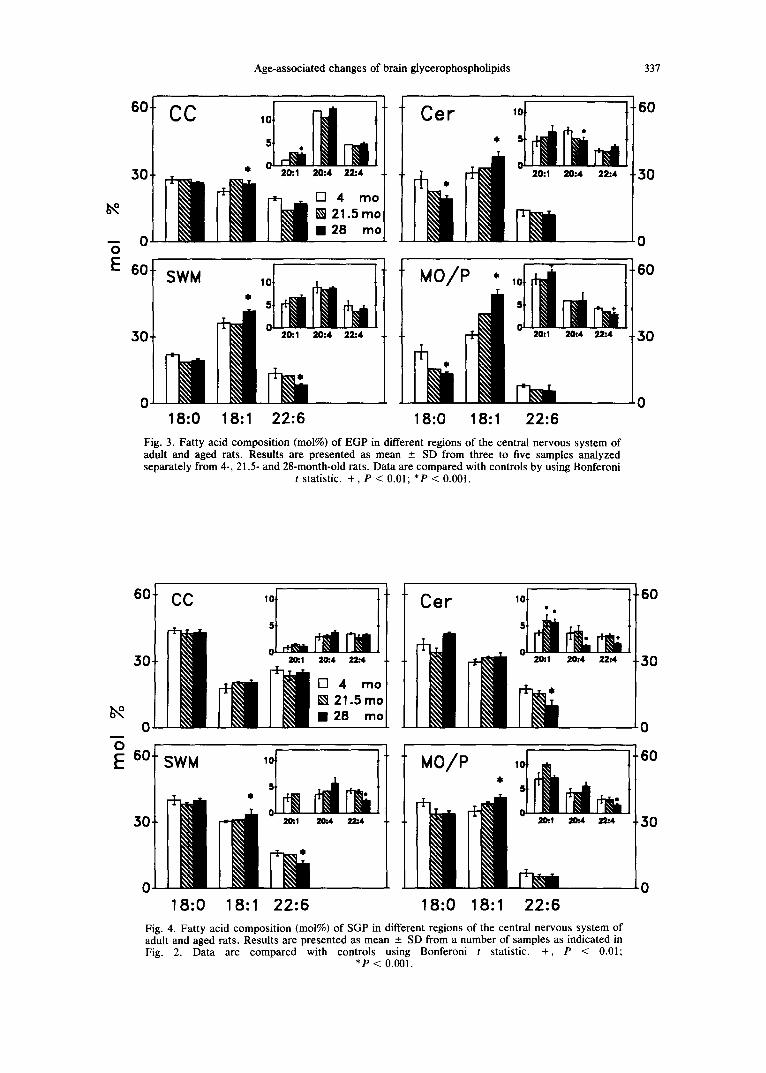
, ° N I @ ~ , o , ~ ° ~ . . . . ,o
~ II k~il I k~ll I N B [] 21.smo - o ~ • 28 mo Jo
F: ~o÷ swM ,or 1~ T Mo/P • ,oi--~ II "°
18:0 18:1 22:6 18:0 18:1 22:6 Fig. 3. Fatty acid composition (mol%) of EGP in different regions of the central nervous system of adult and aged rats. Results are presented as mean -+ SD from three to five samples analyzed separately from 4-, 21.5- and 28-month-old rats. Data are compared with controls by using Bonferoni
t statistic. + , P < 0.01; *P < 0.001.
.0~ c c ,of Car ,o I • ~0
I[I// ~'~ • 28 mo O- 0
,oj • 5 •
0 0 18:0 18:1 22:6 18:0 18:1 22:6
Fig. 4. Fatty acid composition (mol%) of SGP in different regions of the central nervous system of adult and aged rats. Results are presented as mean - SD from a number of samples as indicated in Fig. 2. Data are compared with controls using Bonferoni t statistic. +, P < 0.01;
• P < 0.001.
338 G . H . L6pez et al.
.) )lt e :I /I1 i l E 1 I D 4 mo I / 1 ~ I ~ [] 21.5mo/
0 ~ l ~ l ~ l ~ ~ ~ 0
"=~ 60 II . . .~_ ') [+~; I I S W M , " I - - - - I I , , I S l II MO/P , s ~ ~ . . + .60
3 0 ~ o : 2=:( ~:6 .30
0 0 18:0 20:4 18:1 18:0 20:4 18:1
Fig. 5. Fatty acid composi t ion (mol%) of IGP in different regions of the central nervous sys tem of adult and aged rats. Resul ts are presented as mean +_ SD from a number of samples as indicated in Fig. 2. Data are compared with controls using Bonferoni t statistic. + , P < 0.01;
*P < 0.001.
age distribution of fatty acids in CGP pre- sented in Fig. 2 shows that aging slightly af- fects the acyl group distribution in CGP. How- ever, the amount of PUFA 22:6(n-3) in subcortical white matter and medulla oblon- gata/pons and 20 : 4(n-6) and 22 : 6(n-3) in cere- bellum is lower in 28-month-old rats than in adult rats. Monoenoic fatty acids such as 18: l(n-9) and 20: l(n-9) increase slightly as a re- sult of aging in medulla oblongata/pons in 28- month-old rats with respect to adult rats.
With increasing age, there is an increase in the proportion of 18: l(n-9) and 20: l(n-9) and a decrease in PUFA in the total ethanolamine glycerophospholipids in all brain regions (Fig. 3). The increase in MUFA (18:1 and 20:1) is more significant in medulla oblongata/pons, cerebellum and subcortical white matter than in cerebral cortex. The ratio 18:0-to-18:1 in adult rats was found to be 1.40 _+ 0.38 in cere- bellum, 0.61 -+ 0.02 in medulla oblongata/ pons, 1.54 _+ 0.02 in cerebral cortex and 0.48 + 0.05 in subcortical white matter and mark- edly lower in aged rats: 0.74 _+ 0.18, 0.27 + 0.02, 1.03 _+ 0.06 and 0.47 _+ 0.02, respec- tively, suggesting an increase in A9 desaturase activity. The values obtained in cerebellum and medulla oblongata/pons are due to both a decrease in stearic acid (18 : 0) and an increase in oleic acid content. A decrease in the PUFA content of EGP, mainly affecting arachidonic
and docosahexaenoic acids, was observed in cerebellum and subcortical white matter (Fig. 3).
Table 5 shows the major MUFA and PUFA from diacyl GPE plus alkylacyl GPE and al- kenylacyl GPE in different brain areas of adult (4 months of age) and aged rats (21.5 and 28 months of age). These data show that the fatty acids as the sn-2 position of the alkenylacyl GPE are mainly 18:1(n-9), 20:I(n-9), 20: 4(n-6), 22 : 4(n-6) and 22 : 6(n-3). In particular, 18: l(n-9) in adult rats attains values of up to 25, 39, 40 and 47% of total fatty acids in cere- bral cortex, subcortical white matter, cerebel- lum and medulla oblongata/pons, respec- tively. Furthermore, the content of 20: l(n-9) is markedly higher in the alkenylacyl GPE than in the diacyl and alkylacyi GPE. It is in- teresting to note that the PUFA content of al- kenylacyl GPE from cerebral cortex is the highest among the brain regions studied and represents 63.4 moi% of the total fatty acids in adult rats. Diacyl GPE plus alkylacyl GPE contained the highest amounts of PUFA when compared with alkenylacyl GPE species, cere- bral cortex being the most enriched in PUFA followed by cerebellum > subcortical white matter > > medulla oblongata/pons (Table 5).
The great increase in 18:1(n-9) and 20: l(n-9) that takes place in EGP of cerebellum and medulla oblongata/pons of aged rats with

Age-associated changes of brain glycerophospholipids
Table 5. Fatty acid composition of EGP from different brain areas of adult and aged rats
339
Acyl groups from diacyl GPE and Alkylacyl GPE Acyl groups from Alkenylacyl GPE
4 21.5 28 4 21.5 28 (months of age) (months of age)
18:1 16.0 __. 2.6 17.9 --- 0.4 17.1 - 1.8 24.5 ± 3.8 25.1 -4- 6.7 31.2 ± 1.3 20:l(n-9 nd nd nd 5.6 ± 1.1 6.6 ± 2.6 7.5 ± 1.2
CC 20:4(n-6) 14.0 ± 1.0 12.6 ± 0.5 15.1 ± 2.2 19.5 ± 1.7 15.0 ± 0.5 + 16.8 ± 1.0 22:4(n-6) 5.3 ± 0.8 4.5 --- 0.0 4.4 ± 0.1 13.6 ± 0.4 9.2 ± 1.4 + 11.5 ± 0.7 + 22:6(n-3) 21.9 ± 3.2 19.4 ± 0.2 22.8 ± 0.9 30.3 ± 5.3 24.7 ± 1.8 28.4 ± 0.6
18:1 20.2 ± 1.2 24.0 ± 0.4 21.8 ± 0.8 39.0 ± 2.8 41.3 ± 2.5 43.3 ± 1.2 20: l(n-9) nd nd nd 11.9 ± 0.9 11.6 ± 1.0 13.1 ± 1.4
SWM 20:4(n-6) 12.3 ± 0.6 11.1 ± 0.2 13.0 --- 0.5 12.8 ± 1.0 10.3 ± 1.0 11.5 ± 0.6 22:4(n-6) 4.8 ± 0.8 3.3 ± 0.1 4.4 ± 0.3 10.5 ± 0.8 7.9 ± 0.5 + 9.2 ± 0.1 22:6(n-3) 21.2 ± 1.6 17.9 ± 0.3 19.3 ± 3.9 22.1 ± 2.3 19.9 ± 3.3 19.3 ± 2.0
18:1 21.7 ± 3.2 24.2 ± 1.4 26.0 - 1.1 + 40.4 _+ 3.5 41.7 ± 0.9 40.6 ± 2.0 20:1(n-9) 2.7 ± 0.9 3.6 ± 0.3 4.9 ± 0.7 + 10.1 ± 2.3 14.3 ± 0.2 12.3 ± 0.9
CER 20:4(n-6) 8.2 ± 0.0 8.0 .4- 0.3 + 5.8 ± 0.5 + 10.1 ± 1.3 7.9 ± 0.1 8.4 ± 1.2 22:4(n-6) 4.0 ± 1.9 3.3 ± 1.7 5.5 ± 0.6 6.3 ± 0.1 4.2 ± 0.1 8.2 ± 0.3 + 22:6(n-3) 24.0 ± 3.1 21.2 ± 0.9 19.3 ± 0.8 25.0 ± 5.5 19.6 ± 0.1 21.1 ± 0.5
18:1 29.3 ± 2.9 31.0 ± 4.3 40.5 ± 4.6 + 46.8 ± 2.6 47.8 ± 1.8 51.3 ± 1.9 20:1(n-9) 5.3 ± 0.7 5.7 ± 2.2 10.9 ± 4.7 17.5 ± 3.6 19.9 ± 2.1 19.9 ± 0.5
MO/P 20:4(n-6) 9.3 - 1.3 8.5 ± 0.6 6.5 ± 4.1 8.9 ± 1.5 6.6 ± 2.0 6.8 ± 0.1 22:4(n-6) 4.5 ± 0.7 4.3 ± 0.6 4.9 _+ 0.7 8.4 _+ 1.5 5.5 7.0 ± 1.9 22:6(n-3) 17.6 ± 1.7 13.7 ± 2.3 8.1 ± 2.0 + 12.1 _ 0.7 11.8 ± 0.8 5.6 ± 1.9 +
The data correspond to the major MUFA and PUFA from diacyl GPE plus alkylacyl GPE and alkenylacyl GPE. The other fatty acids not presented in the table (e.g., saturated fatty acids) were taken into account when calculating the mol% composition of the fatty acids presented. The acyl group composition (mol%) is presented as mean ± SD from three to five samples analyzed separately from adult (4 month) and aged rats (21.5 and 28 months). Each sample corresponding to adults and 28-month-old rats consisted of four or five cerebral cortex and subcortical white matter, respectively, Data are compared with controls using the Bonferoni t statistic. +P < 0.01; *P < 0.001).
respect to adult rats corresponds mainly to the increase in 18:1 and 20:1 esterified to diacyl GPE plus alkenylacyl GPE, although MUFA content also increased in alkenylacyl GPE species in these two regions. The increase in 18:1 and 20:1 observed in cerebral cortex and subcortical white matter in EGP was found to correspond mainly to these fatty acids esteri- fled to alkenylacyl GPE (Table 5). MUFA also significantly increased in alkenylacyl GPE of medulla oblongata/pons in aged rats and in subcortical white matter and cerebellum, al- though these latter changes were not signifi- cant. There was a decrease in PUFA content (20 : 4(n-6), 22 : 4(n-6) and 22 : 6(n-3)) in alkeny- lacyl GPE of aged rats (28 months of age) with respect to adult rats (4 months of age), this decrease being more marked in medulla oblon- gata/pons followed by subcortical white mat- ter, cerebellum and cerebral cortex.
The results showing the fatty acid composi- tion of SGP in the different brain areas are presented in Fig. 4. As can be seen, there is an increase in the proportion of MUFA and a decrease in the polyunsaturated acyl moiety in aged rats with respect to values for adult rats. Both of these age-induced effects are present in all brain areas. However, the most remarkable changes are the decrease in 20:
4(n-6), 22:4(n-6) and 22:6(n-3) in cerebellum and the decrease in 22:4(n-6) and 22:6(n-3) in subcortical white matter in aged rats with respect to adult rats and the increase in 18: 1 (n-9) in medulla oblongata/pons and subcorti- cal white matter in aged rats with respect to adult rats. It is interesting to note that minor changes in the fatty acid composition of SGP from aged rats with respect to adult rats were observed in cerebral cortex.
Brain IGP has a very characteristic compo- sition, the acyl groups being comprised mainly of arachidonic acid in the sn-2 position and stearic acid in the sn-1 position. A decrease in the proportion of 20 : 4(n-6) in IGP from cere- bellum was observed in 21.5-month-old rats (Fig. 5). This change was potentiated at 28 months of age. No changes were observed in the proportion of arachidonic acid in IGP from medulla oblongata/pons and subcortical white matter, but there were changes in docosahex- aenoic acid in these two regions (a decrease of -50% in both).
In summary, data on the cerebral cortex re- veal that aging only has a slight effect on phos- pholipid fatty acid composition. The acyl group composition of EGP is only modified at 28 months of age (a statistically significant decrease in 22:6(n-3) and an increase in 18:
340 G.H. L6pez et al.
l(n-9) and 20: l(n-9)), and the fatty acid com- position of CGP, SGP and IGP from cerebral cortex was not affected at all. The changes observed in EGP were mainly found to corre- spond to MUFA content of the alkenylacyl GPE species.
CGP was the least affected phospholipid in the different brain regions studied, showing only a slight decrease in the proportion of 22: 6(n-3) in subcortical white matter, medulla ob- longata/pons and cerebellum. The acyl groups of EGP and SGP were the most affected by aging: EGP showed a large increase in the pro- portion of 18: l(n-9) and 20: l(n-9) and a de- crease in 22:6(n-3), the most affected regions being subcortical white matter, medulla oblon- gata/pons and cerebellum. SGP showed simi- lar changes, although not so marked with re- spect to the increase in MUFA content. However, the most remarkable change was the decrease of PUFA content in 28-month- old rats with respect to 4-month-old rats.
Discussion
The aim of the present work was to under- take a thorough study of the effects of normal aging on the acyl group composition of phos- pholipids in different brain regions. Although studies have been carried out on the lipid com- position and metabolism of brain tissue during normal aging in many species (Horrocks et al . , 1981; Gaiti et al . , 1986), there is no com- plete analysis of the comparative changes in different classes of phospholipids. Aging is of- ten associated with a progressive increase in cholesterol content and an increased choles- terol-to-phospholipid molar ratio throughout the whole brain (Sun and Samorajski, 1972; Horrocks et al . , 1975, 1981; Calderini et al. , 1985). This is in agreement with our findings in the subcortical white matter, cerebellum and medulla oblongata/pons of aged rats, although we observed no significant change in cerebral cortex. The increase in the molar ratio was produced as a result of a net increase in cho- lesterol content rather than by changes in total phospholipid content. Our results show that total phospholipid content remains unchanged in aged rats with respect to adult rats, which is also in agreement with results from previous studies (Sun and Samorajski, 1972; Miyamoto et al . , 1990). However, an increased content of alkenylacyl GPE was observed in all brain regions studied in 28-month-old rats compared with 4-month-old rats, following the order cerebral cortex > cerebellum > medulla oblongata/pons > subcortical white matter. In addition, an increased alkenylacyl-GPE-to- diacyl-GPE molar ratio was observed in cere-
bral cortex and medulla oblongata/pons of rats of 28 months of age compared with rats of 4 months of age, demonstrating that the content of ether-linked lipids increased with respect to diacyl-linked lipids in EGP from aged rats. It has been reported that there is a significant increase in the molar ratio between alkenylacyl GPE and diacyl GPE in purified myelin membranes obtained from the corpus callosum of the eldest of several groups of rhe- sus monkeys with respect to the younger groups (Sun and Samorajski, 1973). In model membranes, ether-linked lipids have been shown to decrease ion permeability, surface potential and lower the phase temperature of membrane bilayers when compared with their diacyl counterparts (Snyder, 1991).
We previously reported an increase in sphingomyelin content in different brain re- gions of aged rats, the cerebellum being the most affected followed by medulla oblongata/ pons, subcortical white matter and cerebral cortex. Sphingomyelin is thought to have a high affinity for cholesterol (Demel et al . , 1977; Van Dijck, 1979; Slotte and Bierman, 1988) and, when inserted into biological mem- branes, generally increases membrane viscos- ity (Barenholz and Gatt, 1982). The increased cholesterol and sphingomyelin content is in agreement with studies reporting a decrease in fluidity with increasing age (Wood and Schroeder, 1988; Miyamoto et al . , 1990).
It is known that brain biological functions are closely linked to membrane composition and that alterations in membrane lipid compo- nents dramatically influence the membrane status. Many membrane-bound enzymes and transport systems are affected by alterations in the properties of the lipid bilayer (Lynch, 1980; Stubbs and Smith, 1984). There is a ten- dency to generalize with respect to some as- pects of the aging effect on membrane lipids, such as the unsaturation decrease in the acyl substitutes of phospholipids or the increase in the cholesterol content, as being frequently associated with decreases in membrane fluid- ity. However, such generalizations are not substantiated, and no firm conclusions can be drawn because the differences observed in the membrane fluidity of bulk lipids are not con- sistent (Wood and Schroeder, 1988).
Our results show that the aging process in- duces an increase in the cholesterol-to- phospholipid molar ratio, the content of total phospholipids remaining unchanged, and an increase in the content of alkenylacyl GPE and that the fatty acid composition of total lipids and individual glycerophospholipids is also affected. Moreover, the characteristics of these age-induced effects differ in accordance
Age-associated changes of brain glycerophospholipids 341
with the phospholipids involved and the cere- bral regions studied. As a general observation, we found that the proportion of polyunsatu- rated acyl chains esterified to phospholipids was for the most part diminished in CGP, EGP and IGP, whereas the proprotion of mono- unsaturated acyl chains of phospholipids increased considerably in EGP. A large de- crease in polyenes and an increase in mono- enes takes place in SGP in aged rats compared with adult rats. Morever, changes in MUFA are evident at 21.5 months of age, whereas the decrease in PUFA was observed at 28 months of age.
There is evidence indicating that the fatty acid composition of the retina and brain lip- ids is considerably modified in aging ro- dents (Horrocks et al., 1981; Samorajski and Persson, 1985; Rotstein et al., 1987) and hu- mans (Srderberg et al., 1990). According to our results, the fatty acid composition of CGP in aged rats exhibits minimal changes with re- spect to the other glycerophospholipids. The relatively modest changes in CGP may be ex- plained by the absence of substantial amounts of PUFA in CGP even in normal brain tissue. In EGP, the amounts of MUFA 18 : l(n-9) and 20: l(n-9) markedly increased in medulla ob- longata/pons followed by subcortical white matter and cerebellum, whereas the PUFA 20: 4(n-6), 22 : 4(n-6) and 22 : 6(n-3) decreased with age in all regions analyzed, especially in subcortical white matter. The acyl group com- position of EGP in myelin from three age groups of mice, rhesus monkeys and humans were studied by Samorajski and Rolsten (1973) and Sun and Samorajski (1973), who found the older age groups of all three species had a higher proportion of monoenes and a lower proportion of polyenes.
Concerning the fatty acid composition of EGP, the acyl group composition of diacyl GPE and the alkenylacyl GPE underwent a change in the different brain areas of aged rats with respect to control rats. In the acyl groups of diacyl GPE from cerebellum and medulla oblongata/pons, we observed a large increase in the proportion of 18: l(n-9) plus 20: l(n-9) ranging from 24.4 and 34.6% at 4 months of age to 30.9 and 51.4% at 28 months of age, respectively. MUFA from cerebral cortex and subcortical white matter of diacyl GPE, how- ever, remained unchanged in aged rats with respect to adult rats. The changes exhibited by monounsaturated acyl groups of alkenyl- acyl GPE in 28-month-old rats with respect to adult rats were similar to those in diacyl GPE, the magnitude of the changes following the or- der cerebral cortex > medulla oblongata/pons > subcortical white matter > cerebellum. The
PUFA content decreased with age in alkenyl- acyl GPE in all brain regions studied, whereas the diacyl counterparts showed such decrease only in medulla oblongata/pons and cerebel- lum. For both sub-classes of EGP, the de- crease in PUFA was greatest in medulla ob- longata/pons. Thus, the age-related changes in the acyl group composition of alkenylacyl GPE and diacyl GPE could reflect changes in metabolic activities and turnover. It has been reported that alkenylacyl GPE and diacyl GPE turnover is somewhat slower at 24 months than at 5 months of age in mouse brain (Hor- rocks, 1973). In summary, the selective in- crease in total 18:1 and 20: I corresponds mainly to the acyl groups esterified to EGP and, to a lesser extent, to SGP, and the de- crease in 22:6(n-3) occurs mainly in SGP > EGP > > IGP, all such changes being particu- larly evident in subcortical white matter, cere- bellum and medulla oblongata/pons.
Our results indicate that marked differences exist in the lipid and acyl group composition of different brain areas, reflecting the type of cells present. White matter largely consists of myelin membranes and oligodendrocyte cell bodies, whereas gray matter contains astrocytes and neuronal cell bodies. The phos- pholipids from gray matter contain many more PUFA, especially in EGP and SGP, than those from white matter, which show a fatty acid composition typical of myelin. Furthermore, a comparison of areas rich in myelin (subcorti- cal white matter and medulla oblongata/pons) with other areas in the central nervous system show that myelin glycerophospholipids are markedly more enriched in 18 : 1 and 20 : 1 and deficient in polyenes than the corresponding glycerophospholipids from cerebral cortex and cerebellum. These findings are in agree- ment with previous observations (Sun and Horrocks, 1970; Sun and Samorajski, 1972, 1973; Horrocks, 1973).
Our results also show that changes in bio- chemical properties may be associated with age-related changes in the fatty acid composi- tion of myelin-rich areas and neuron-enriched areas. It has been demonstrated that the addi- tion of double bonds to the nonpolar acyl groups of phospholipid molecules may result in expansion of the surface area of the mem- brane (Sun and Samorajski, 1973). We ob- served that aging produced an increase in the proportion of monounsaturated acyl groups, a decrease in the proportion of polyunsaturated acyl groups, an increase in the cholesterol- to-phospholipid molar ratio, an increase in al- kenylacyl GPE content and greater changes in myelin-rich regions. It has been reported that myelin plays an important role in changes ob-
342 G . H . Lopez et al.
served in brain lipid composition of aged rats (Sun and Samorajski, 1972, 1973). Therefore, it appears that the aging process gives risk to a total reduction in the number of double bonds in membrane lipids, which is likely to affect the permeability of molecules being transported across the membranes. In addi- tion, a decrease in the unsaturation index ob- served in total lipids in all brain regions ana- lyzed in our aged rats with respect to adult rats is in agreement with this statement.
There are several possible reasons for the disappearance of PUFA and the increase in MUFA in the brain during aging. One is that A6 and A5 desaturase activity--involved in the synthesis of PUFA--decreases , whereas that of A9 desaturase--involved in the synthe- sis of MUFA--increases. Alternatively, there could be a deficiency in PUFA uptake (or of their precursors) in aged brain, thus decreas- ing the supply of appropriate substrates. If a depletion of linoleic (18: 2(n-6)) and linolenic (18:3(n-3)) acids in the brain occurred, this would explain the diminution of the longer PUFA, most of which are synthesized from these essential fatty acids. A third possible ex- planation for the altered fatty acid composi- tion may be a change in the cellular makeup of the brain during aging, possibly involving a reduction in the number of dendrites (which are rich in PUFA). Moreover, lipid peroxida- tion, reported to be enhanced during the aging process (Sun and Sun, 1978; Sohal, 1989), could also account for the decrease in brain PUFA.
In addition, it has been reported that phos- pholipids containing highly unsaturated fatty acyl chains (e.g., 20:4(n-6) and 22:6(n-3)) are unlikely to associate with cholesterol and may thus create an extremely fluid membrane do- main (Van Blitterswijk et al . , 1987). The dis- proportionate level of cholesterol in the cell can be explained by the differing composition of phospholipids in plasma membranes and endomembranes and their different ordering susceptibility (affinity) toward cholesterol (Van Blitterswijk et al . , 1987). The increased cholesterol, sphingomyelin and alkenylacyl GPE and decreased polyene content we found during aging could be responsible for the for- mation of extremely viscous membrane do- mains. This latter observation, together with the fact that a significant cholesterol increase as a result of aging is found in all brain regions enriched in myelin, could also explain the dif- ferences found in studies on membrane flu- idity.
Acknowledgements--This work was supported by the Consejo Nacional de Investigaciones Cientfficas y Tecno-
16gicas (CONICET), Argentina. Dr. N. M. Giusto is a career member and P. I. Castagnet a research fellow of the CONICET. G. H. L6pez is a research fellow of the Comisi6n de Investigaciones Cientificas de la Provincia de Buenos Aires. We thank Dr. N. Winzer (Mathematics Department, Universidad Nacional del Sur) for her help with statistics.
References
Arvidson G. (1968) Structural and metabolic heterogene- ity of rat liver glycerophospholipids. Eur. J. Biochem. 4, 478-486.
Aveldafio M. I. and Horrocks L. A. (1983) Quantitative release of fatty acids from lipids by a simple hydrolysis procedure. J. Lipid Res. 24, 1101-1105.
Barenholz Y. and Gatt S. (1982) In Phospholipids (Edited by Hawthorne J. N. and Ansell G. B.), pp. 129-177. Elsevier/North-Holland, New York.
Calderini G., Aporti F., Bellini F., Bonetti A., Rubini R., Teolato S., Xu C., Zanotti A. and Toffano (1985) Phospholipids as pharmacological tools in the aging brain. In Phospholipids in the Nervous System (Edited by Horrocks et al.), pp. 11-19, Raven Press, New York.
Demel R. A., Jansen J. W. C., Van Dijck P. W. M. and Van Deenen L. L. M. (1977) The preferential interac- tion of cholesterol with different classes of phospholip- ids. Biochim. biophys. Acta 465, 1-10.
Folch J., Lees M. and Stanley G. H. S. (1957) A simple method for the isolation and purification of total lipids from animal tissues. J. biol. Chem. 226, 497-509.
Gaiti A., Gatti C. Puliti M. and Brunetti M. (1986) Phos- pholipid metabolism in aging brain. In Phospholipid Re- search and the Nervous System: Biochemical and Mo- lecular Pharmacology (Edited by Horrocks L. A., Freysz L. and Toffano G.). Vol. 4, pp. 225-231. Livi- ana Press, Padova.
Giusto N. M., Roque M. and llincheta de Boschero M. (1992) Effects of aging in the content, composition and metabolism of sphingomyelin in the central nervous system. Lipids 27, 835-839.
Horrocks L. A. (1973) Composition and metabolism of myelin phosphoglycerides during maturation and aging. Prog. Brain Res. 40, 383-395.
Horrocks L. A., Sun G. Y. and D'Amato R. (1975) Changes in brain lipids during ageing. In Neurobiology ~fAging (Edited by Ordy J. M. and Brizee K. R.), pp. 359-367. Plenum Publishing Corporation, New York.
Horrocks L. A., Van Rollins M. and Yates A. J. (1981) Lipid changes in the ageing brain. In The Molecu- lar Basis o f Neuropathology (Edited by Thompson R. S. H. and Davidson A. N.), pp. 601-630. Edward Arnold Publishers Ltd., London.
Johnson N. L, and Kotz S. (1969) In Distributions in Sta- tistics, p. 29. Houghton-Mifflin, Boston.
Lowry O. H., Rosebrough N. J., Farr A. C. and Randall R. J. (1951) Protein measurement with the Folin phenol reagent. J. biol. Chem. 193, 265-275.
Lynch R. D. (1980) Utilization of polyunsaturated fatty acids by human diploid cells aging in vitro. Lipids 15, 412-420.
Miyamoto A., Araiso T., Koyama T. and Oshika H. (1990) Membrane viscosity correlates with alfal- adrenergic signal transduction of the aged rat cerebral cortex. J. Neurochern. 55, 70-75.
Morrison W. and Smith L. (1964) Preparation of fatty acid methyl esters and dimethylacetals from lipids with bo- ron fluoride-methanol. J. Lipid Res. 5, 600-608.
Ott P., Binggeli Y. and Brodbeck U. R. S. (1982) A rapid and sensitive assay for determination of cholesterol in
Age-associated changes of brain glycerophospholipids 343
membrane lipid extracts. Biochim. biophys. Acta 685, 211-213.
Rouser G. and Yamamoto A. (1968) Curvilinear regres- sion course of human brain lipid composition changes with age. Lipids 3, 284-287.
Rouser G., Fleischer S. and Yamamoto A. (1970) Two dimensional thin layer chromatographic separation of phospholipids by phosphorus analysis of spots. Lipids 5, 494-496.
Rotstein N. and Avelda6o M. (1987) Labelling of lipids of retina subcellular fractions by [l-14C]eicosatetraenoate (20: 4(n-6) docosapentaenoate (22: 5(n-3)) and docosa- hexaenoate (22:6(n-3)). Biochim. biophys. Acta 921, 221-234.
Rotstein N., Ilincheta de Boschero M., Giusto N. and Aveldafio M. (1987) Effects of aging on the composition and metabolism of docosahexaenoate-containing lipids of retina. Lipids 22, 253-260.
Sale F. O., Marchesini S., Fishman P. H. and Berra B. (1984) A sensitive enzymatic assay for determination of cholesterol in lipid extracts. Analyt. Biochem. 142, 347-350.
Samorajski T. and Rolsten C. (1973) Neurobiological as- pects of maturation and aging. In Progress in Brain Research (Edited by Ford D. H.), Vol. 40, pp. 253-265. Elsevier, New York.
Samorajski T. and Persson K. (1985) Neurochemistry of Ageing. In Principles and Practice Geriatric Medicine (Edited by Pathy, M. S. J.), pp. 565-585. John Wiley & Sons Ltd., New York.
Schroeder F. (1984) Role of membrane lipids asymmetry in aging. Neurobiol. Aging 5, 323-333.
Slotte J. P. and Bierman E. L. (1988) Depletion of plasma- membrane sphingomyelin rapidly alters the distribution of cholesterol between plasma membranes and intracel- lular cholesterol pools in cultured fibroblasts. Biochem. J. 250, 653-658.
Snyder F. (1991) In Biochemistry ofLipids, Lipoproteins and Membranes (Edited by Vance D. E. and Vance J.), pp. 241-267. Elsevier Science Publishers, The Nether- lands.
Srderberg M., Edlund C., Kristensson K. and Dallner G. (1990) Lipid compositions of different regions of
the human brain during ageing. J. Neurochem. 54, 415- 423.
Sohai, R. S. (1989) Oxidative stress hypothesis of aging. In Advances in Myochemistry (Edited by Benzi G.), pp. 21-34. John Libbey Eurotext Ltd.
Stubbs C. D. and Smith A. D. (1984) The modification of mammalian membrane polyunsaturated fatty acid com- position in relation to membrane fluidity and function. Biochim. biophys. Acta 779, 89-137.
Sun A. Y. and Sun G. Y. (1978) Effects of dietary vitamin E and other antioxidants on aging process in rat brain. Adv. exp. Med. Biol. 97, 285-290.
Sun G. Y. and Horrocks L. A. (1970) The acyl and alk-1- enyl groups of the major phosphoglycerides from ox brain myelin and mouse brain microsomal, mitochon- drial and myelin fractions. Lipids 5, 1006-1012.
Sun G. Y. and Samorajski T. (1972) Age changes in the lipid composition of whole homogenates and isolated myelin fractions of mouse brain. J. Gerontol. 27, 10-17.
Sun G. Y. and Samorajski T. (1973) Age differences in the acyl group composition of phosphoglycerides in myelin isolated from the brain of rhesus monkey. Biochim. bio- phys. Acta 316, 19-27.
Sun G. Y., Huang H-M., KeUeher J. A., Stubbs E. B. Jr. and Sun A. Y. (1988) Marker enzymes, phospholipids and acyl group composition of a somal plasma mem- brane fraction isolated from rat cerebral cortex; a com- parison with microsomes and synaptic plasma mem- branes. Neurochem. Int. 12, 69-77.
Van Blitterswijk W. J., vander Meer B. W. and Hilkman H. (1987) Quantitative contribution of cholesterol and the individual classes of phospholipid and their degree of fatty acyl (un)saturation to membrane fluidity mea- sured by fluorescence polarization. Biochemistry 26, 1746-1756.
Van Dijck P. W. M. (1979) Negatively charged phospho- lipids and their position in the cholesterol affinity se- quence. Biochim. biophys. Acta 555, 89-101.
Wood W. G. and Schroeder F. (1988) Membrane structure in aged humans and animals. In Central Nervous Sys- tem Disorders of Aging: Clinical Intervention and Re- search (Edited by Strong R.), pp. 199-209. Raven Press, New York.
CBP-B IIZ-2-G