
Affinity Paths and information diffusion in social networks
10
This article appeared in a journal published by Elsevier. The attached copy is furnished to the author for internal non-commercial research and education use, including for instruction at the authors institution and sharing with colleagues. Other uses, including reproduction and distribution, or selling or licensing copies, or posting to personal, institutional or third party websites are prohibited. In most cases authors are permitted to post their version of the article (e.g. in Word or Tex form) to their personal website or institutional repository. Authors requiring further information regarding Elsevier’s archiving and manuscript policies are encouraged to visit: http://www.elsevier.com/copyright
Transcript of Affinity Paths and information diffusion in social networks

This article appeared in a journal published by Elsevier. The attachedcopy is furnished to the author for internal non-commercial researchand education use, including for instruction at the authors institution
and sharing with colleagues.
Other uses, including reproduction and distribution, or selling orlicensing copies, or posting to personal, institutional or third party
websites are prohibited.
In most cases authors are permitted to post their version of thearticle (e.g. in Word or Tex form) to their personal website orinstitutional repository. Authors requiring further information
regarding Elsevier’s archiving and manuscript policies areencouraged to visit:
http://www.elsevier.com/copyright

Author's personal copy
Social Networks 33 (2011) 134–142
Contents lists available at ScienceDirect
Social Networks
journa l homepage: www.e lsev ier .com/ locate /socnet
Affinity Paths and information diffusion in social networks
José Luis Iribarrena,∗, Esteban Moroa,b,1
a Instituto de Ingenieríıa del Conocimiento, Universidad Autónoma de Madrid, 28049 Madrid, Spainb Instituto de Ciencias Matematicas CSIC-UAM-UC3M-UCM, Departamento de Matemáticas & GISC, Universidad Carlos III de Madrid, 28911 Leganés, Madrid, Spain
a r t i c l e i n f o
Keywords:Viral marketingDiffusion modelsSocial networksComplex systems
a b s t r a c t
Widespread interest in the diffusion of information through social networks has produced a large numberof Social Dynamics models. A majority of them use theoretical hypothesis to explain their diffusionmechanisms while the few empirically based ones average out their measures over many messages ofdifferent contents. Our empirical research tracking the step-by-step email propagation of an invariableviral marketing message delves into the content impact and has discovered new and striking features.The topology and dynamics of the propagation cascades display patterns not inherited from the emailnetworks carrying the message. Their disconnected, low transitivity, tree-like cascades present positivecorrelation between their nodes probability to forward the message and the average number of neighborsthey target and show increased participants’ involvement as the propagation paths length grows. Suchpatterns not described before, nor replicated by any of the existing models of information diffusion,can be explained if participants make their pass-along decisions based uniquely on local knowledge oftheir network neighbors affinity with the message content. We prove the plausibility of such mechanismthrough a stylized, agent-based model that replicates the Affinity Paths observed in real informationdiffusion cascades.
© 2010 Elsevier B.V. All rights reserved.
1. Introduction and background
The discovery of quantitative laws in the collective propertiesof large numbers of people, for example the birth and death ratesor crime frequencies, was one of the factors pushing the devel-opment of statistics and led scientists and philosophers to callfor some quantitative understanding on how such precise regu-larities stem from the apparently erratic behavior of individuals.Hobbes, Laplace, Comte, Stuart Mill and many others shared, to adifferent extent, this line of thought (Ball, 2004). The question toinvestigate was how the interactions between social agents cre-ate order in their behavior from an initially disordered state. Thebasic premise was that agents’ repeated interactions should makepeople more similar since the information exchanges involved ledto higher degrees of homogeneity in values, thoughts or prefer-ences. The dynamic nature of the information diffusion, the poorunderstanding of the human behavior causes and the fact that theagents interactions take place in the thick of complex social net-
∗ Corresponding author at: Instituto de Ingenieríıa del Conocimiento, UniversidadAutónoma de Madrid, Francisco Tomas y Valiente, 11, EPS Edificio B - Planta 5a,28049 Madrid, Spain. Tel.: +34 91 497 2323.
E-mail address: [email protected] (J.L. Iribarren).1 E.M. acknowledges partial support from MEC (Spain) through grants FIS2004-
01001, MOSAICO, and a Ramón y Cajal contract and Comunidad de Madrid throughgrants UC3M-FI-05-077 and SIMUMAT-CM.
works, made the Social Dynamics problem largely untractable fora long time.
The appearance of new social phenomena related to the Internet(Social Media, Collaborative Filtering, Social Tagging, etc.) whoseinteractions can be captured in large databases and the tendencyof social scientists to move towards the formulation of simplifiedmodels and their quantitative analysis, have ushered in an era of sci-entific research in the field of Social Dynamics (Lazer et al., 2009).Several key questions have been posed: what favors the homog-enization process? What hinders it? What are the fundamentalinteraction mechanisms fostering the adoption of innovations, thespreading of rumors, the evolution towards a dominant opinion orthe emergence of trends and fashions?
Initially, the difficulty in obtaining micro-level data on the dif-fusion of information between individuals, the absence of suitablemathematical algorithms to rigorously analyze the phenomena andthe calculation complexity involved in simulations with large realnetworks limited theoretical advancements to the construction ofpopulation average diffusion models based on master or differentialequations. Those models were in general borrowed from mathe-matical epidemiology (Hethcote, 2000) since it was assumed thatinformation would propagate just like diseases do. However infor-mation diffusion research has deeply evolved since step-by-steptracking of interactions through electronic media made detaileddiffusion data plentiful (although not necessarily accessible or easyto gather).
0378-8733/$ – see front matter © 2010 Elsevier B.V. All rights reserved.doi:10.1016/j.socnet.2010.11.003

Author's personal copy
J.L. Iribarren, E. Moro / Social Networks 33 (2011) 134–142 135
The development of the science of complex systems andadvancements in the computerized treatment of Social NetworkAnalysis methods have spurred the emergence of a “new” scienceof networks (Watts, 2004) which provides more robust tools for thescientific treatment of Social Dynamics processes. As a result scien-tists realized that information spreading mechanisms vary with thetype of information which spawned a rush to develop the appro-priate model for each. According to their algorithmic approachthose models can be categorized as population-average or network-based. The population-average models assume fully mixed orhomogeneous substrate networks and describe the agents’ socialdynamic behavior at the aggregate level through differential ormaster equations. Examples of those are the seminal “two-stepinfluence model” of information diffusion by Katz and Lazarsfeld(1955), the rumor diffusion model of Daley and Kendall (1965), theinnovations adoption model of Bass (1969), its stochastic versionby Niu (2002), the minority spreading opinion formation model ofGalam (2002), the innovation diffusion model with influentials andimitators of Van den Bulte and Joshi (2007) or the percolation-basedproduct lifecycle model of Frenken et al. (2008). On the other hand,network-based models include the influence of the underlyingsocial network topology by way of agent-based stochastic algo-rithms. Some examples of them are the classic innovation adoption“threshold model” of Granovetter (1978), the model of diffusion oftechnological innovations with upgrading costs of Guardiola et al.(2002), the fads and fashion formation model of Bettencourt (2002),models on the impact of the structural characteristics of a net-work on innovations diffusion (Jackson and Yariv, 2005; Liu et al.,2005), the stochastic model for opinion formation of Sznajd-Weron(2005) or the network variant of the Daley–Kendall rumor modelby Nekovee et al. (2007).
However, this profusion of theoretical models was mainly jus-tified by plausibility arguments and Social Dynamics models basedon empirical data are still scarce. A few examples are the refer-ral networks study of Vilpponen et al. (2006) which found thatthe structure of electronic communication networks is differentfrom that of the traditional interpersonal communication ones,the chain-letter diffusion research of Liben-Nowell and Kleinberg(2008) whose strikingly long and narrow spreading chains wereattributed to a new mechanism involving asynchronous responsetimes of the forwarders or the study on information diffusionthrough blogs of Gomez-Rodriguez et al. (2010) which found a coreperiphery structure in the blogosphere news diffusion network.Nevertheless, all these studies could only trace the propagation ofmessages with varying content and are unable to discriminate thepropagation of individual content items. As a result, none of themcould study the impact of the information content on the diffu-sion processes. While the lack of insight into the content impactwould be expected of past century information diffusion research,its absence in more recent literature can only be explained becausepropagation data at the individual level, being usually proprietarybecause of its economic value or usage restrictions, is kept undertight wraps and results very hard to obtain.
Our research addresses such shortcoming. Unlike the workscited that study information propagation through the aggregateeffect of propagating messages of varying content, ours trackedthe precise paths of a viral marketing campaign fixed and invari-able message as it spread through an email social network. Themessage content remained identical through the propagation. Thisallowed us to scrutinize the individuals’ reactions to a particu-lar message instead of just averaged out behavior over diverseinformation items. By discriminating all factors impacting the par-ticipants’ spreading patterns from the message content we wereable to detect the effects produced by the latter. We found thatthe message diffusion cascades evolve through a branching processthat presents some characteristic and unique patterns unexamined
until now although some literature (Leskovec et al., 2007; Wattsand Peretti, 2007) has shown an inkling of them. We noticed asteady increase in the spreaders’ activity parameters as the messagegets deeper in the propagation cascades. This surprising patterncannot be observed in empirical experiments collecting propaga-tion data of varying content messages. It can be explained if thecascades growth stems from a mechanism based on the affinitybetween the message content and the preferences of those receiv-ing it and not on the receiving node neighbors’ status or on theunderlying social network structure used in many of the currentmodels. We test and validate that hypothesis through a stylizedagent-based propagation model. The rest of the article is organizedas follows: first we describe the data obtained from our empiricalresearch on real viral marketing campaigns and the control parame-ters of their messages propagation. Second, we present our findingson the structure and growth patterns of the information cascades.Third we introduce the message affinity propagation model andcompare its predictions with the empirical results. The article endswith our conclusions.
2. Word-of-mouth diffusion research
We tracked and measured the “word-of-mouth” diffusion ofviral marketing campaigns ran in eleven European markets whichoffered incentives to current subscribers of an IT company onlinenewsletter to promote new subscriptions through recommenda-tion emails to friends and colleagues. The campaigns were entirelyweb based: banner ads, emails, search engines and the companyhomepage drove participants into the campaign site. In it, partic-ipants accessed a referral form to register themselves and enterthe addresses of those to whom they recommended subscribingthe newsletter. The submission of this form triggered a person-alized, but otherwise identical, recommendation message with alink to the campaign registration form. The link customized URLwas appended with codes allowing to uniquely trace clicks onit to sender and addressee of the corresponding email. The formchecked email addresses for syntax correctness and to prevent selfrecommendations. Cookies in the participants’ email client pre-vented sending multiple recommendations to the same address2
and improved the user experience by pre-filling the sender’s pro-file in subsequent sessions. Additionally, the campaign web serverregistered a time stamp for each of the process steps (subscription,recommendations, referral link clicks) and removed from recordsreferrals to undeliverable email addresses.
The incentive offered to recommenders was the possibility ofwinning laptop computers in a lottery to be held at the end of thecampaign period. Aside from the obvious goal of increasing par-ticipation, the incentive mission was twofold: firstly, discourageindiscriminate referrals to prevent spamming-like behavior and,secondly, ensure legal cover for the tracking of sender–receiverdata. To accomplish such requirement, participation in the lotterywas limited to the so-called successful referrals defined as the rec-ommendation emails whose recipients clicked on the coded URLincluded on them. Thus, the more referral emails sent to recipi-ents opening them and visiting the campaign site, the higher thesender’s winning odds. More importantly, both sender and receiverof any successful referral drawn in the lottery were entitled toreceive the lottery prize. Terms and conditions, accessible fromall web site pages and referral emails, specified that participationin the lottery implied the sender’s and receiver’s approval of thecampaign registration of their email transaction details as this wasnecessary to ensure that both parties could receive the prize if their
2 However, participants with cookies disabled could send multiple referrals to thesame person. Thus 183 referrals (0.76% of total) were discarded.

Author's personal copy
136 J.L. Iribarren, E. Moro / Social Networks 33 (2011) 134–142
Table 1Campaigns propagation data set: count of Total Nodes (N), Seed Nodes (Ns), Viral Nodes (Nv), Passive Nodes (Np), total directed links (Arcs), and Total of Independent Cascades(Casc . ) measured on the campaigns propagation network. smax is the largest cascade size by its number of nodes. Quantities in All markets may not add up to the sum oftheir column because network partition removes inter-country links. The number of Seed Nodes (Ns) may not coincide with that of cascades due to cascades merging withone another during the propagation or because, sometimes, a Seed Node can not be identified (for example in the case of recommendation reciprocity between two nodes).Results in some countries are aggregated in homogeneous markets for statistical significance. Nordic includes DK, FI, NO and SE.
Market N Ns Nv Np Arcs Casc. smax
France 11,758 3,247 524 7,987 8,593 3,248 139DE + AT 7,943 1,760 567 5,616 6,239 1,750 146Spain 5,260 855 505 3,900 4,454 843 122Nordic 2,509 530 176 1,803 2,004 524 34UK + NL 2,111 521 107 1,483 1,618 518 25Italy 1,602 323 108 1,171 1,324 319 41
All markets 31,183 7,225 2,002 21,956 24,207 7,188 146
referral email was the winning one. Subscription to the newslet-ter was not required to participate in the prize draw. Campaignsran in each country local language but were identical otherwise:identical message, incentive, eligibility rules, lottery mechanism,campaign duration, web user interface and tracking processes. Thishomogeneity of data ensured that behavioral differences betweencountries were not caused by the campaigns execution but dueto the market specifics. It also validates the analysis of countryaggregated results.
2.1. Campaigns propagation data set
Spurred by the campaign sponsor web site and exogenous onlineadvertising, a total of 7225 individuals initiated message diffusioncascades which grew through viral pass-along driven by 2002 sec-ondary spreaders. Thus, the viral offering touched another 21,956passive nodes who did not forward it further. All in all, 31,183individuals of whom 9227 were spreaders, received the viral mes-sage. Thus 77% of the individuals received the message through theendogenous viral propagation mechanism. The Cascades Networkresulting of the message diffusion constitutes a directed graph with7188 independent cascades whose nodes represent participantslinked by 24,207 directed arcs representing the recommendationemails. We call Seed Nodes (Ns) the individuals who spontaneouslyinitiate recommendation cascades from the campaign site with-out having received a recommendation message from others andViral Nodes (Nv) those who forward a previously received mes-sage. Table 1 presents the summary data set of the campaignsmessage propagation.3 Unsuccessful emails, disconnected nodes,nodes with invalid or undeliverable email addresses, loops andmultiple referrals between same nodes were discarded. In com-pliance with the sponsor rigorous policy, all personal informationwas codified and masked to guarantee the participants’ privacyprotection.
2.2. Cascades Network structural metrics
Here we examine differences and similarities between the Cas-cades Network topology and that of the reported email networksthrough which they propagate. Table 2 shows the Cascades Net-work structural parameters measured without considering linksdirection. The cumulative distribution function (c.d.f.) of the undi-rected network total degree k is a power-law P(k) ∼ k−2.8 whosesignificant probability of very connected nodes evidences higherheterogeneity than the exponential degree distributions found insome email networks (Guimerá et al., 2003; Newman et al., 2002).However, their heterogeneity is less marked than that of the emailnetwork studied by Ebel et al. (2002) whose power-law degree dis-
3 The time dynamics of the message diffusion is covered on a separate paper.
tribution (p.d.f.) of exponent �k = 1.81 is fatter tailed. Additionally,email networks present positive correlations between the nodesdegree at either end of an edge, a property called degree assorta-tivity and measured, according to Newman (2002), by the Pearsoncorrelation coefficient. For example, the degree correlation coeffi-cient in the email network of Guimerá et al. (2003) is �k = +0.188,indication of a correlated network. The equivalent for theCascades Network �k = −0.001 shows total uncorrelation. Besides, innetworks with skewed node degree distributions and degree cor-relations, such as the email networks, the average connectivity ofthe network k is typically lower than that of the nearest neigh-bors of a node knn. For example in the Guimerá et al. (2003) emailnetwork, the ratio knn/k is approximately 2. Such phenomenonis responsible for the first neighbors of a node having in aver-age more contacts than such node or, quoting Feld (1991), for thefact that “your friends always have more friends than you do.”Interestingly, this feature is more marked in the Cascades Net-work whose knn to k ratio ranges from 2.24 in UK + NL to 4.24 inSpain.
Another difference between the Cascades Network and the emailnetworks through which they propagate lies in their transitivity, aproperty typical of acquaintance networks whereby two individ-uals with a common friend are more likely than average to knoweach other. The Clustering Coefficient C, defined as the fraction ofall triangles found in the network relative to the total number oftriads4 measures the transitivity. Table 2 shows that our CascadesNetworks with a Clustering Coefficient C = 4.8 × 10⁻³ for the graphof All markets are highly intransitive yet ten times more tran-sitive than an equivalent random network of the same size andconnectivity. In any case, a very low value compared to the range C[0.15–0.60] found in social or email networks (Newman and Park,2003). Probabilistic considerations show the logic of such feature:since the Cascades Network percolates its underlying email networkonly partially, the dyadic closure that builds clustering in the for-mer must be just a fraction of the one in the latter. As a result ourcampaigns viral diffusion cascades, like the one in Fig. 1, are almostpure trees.
The last distinctive property of email networks, the Small Worldor low average shortest path length (Boccaletti et al., 2006),although seemingly present since � = 2.67 (Table 2) and lower thanthat of email networks �email∼3.5 (Eckmann et al., 2004; Guimeráet al., 2003) is not comparable with those due to the nature of theCascades Network that, split in many disconnected components,limits paths calculation to reachable pairs of nodes which neces-sarily yields lower values. The distribution of those cascades size(s), like the total degree, is a very skewed power-law whose c.d.f.exponent is �s = 1.35. With largest cascade size smax = 146 nodes,mean size s = 4.33, and �s = 5.27, the cascade in Fig. 1 is 25 times
4 A triad is a group of three nodes connected by two links.

Author's personal copy
J.L. Iribarren, E. Moro / Social Networks 33 (2011) 134–142 137
Table 2Cascades Network structural metrics: k (total degree) is the average of in- or out-links of a node, �k its standard deviation, knn the mean of the nearest neighbors averagetotal degree, C the Clustering Coefficient, Crand = k/N the corresponding value for an equivalent random network, � the average shortest path length between reachable nodes(links considered undirected) and gmax the maximum number of steps in directed propagation paths.
Market k �k knn C Crand � gmax
France 1.46 1.594 3.99 0.0000 0.00012 2.164 8DE + AT 1.57 2.027 5.59 0.0049 0.00020 2.671 7Spain 1.69 2.383 7.17 0.0054 0.00032 3.287 9Nordic 1.60 1.575 4.07 0.0077 0.00064 2.243 5UK + NL 1.53 1.364 3.43 0.0112 0.00073 2.026 5Italy 1.65 1.918 5.22 0.0234 0.00103 2.229 6
All markets 1.55 1.868 4.97 0.0048 0.00005 2.671 9
Fig. 1. Tree-like propagation cascades: the viral messages diffusion graph of ourcampaigns consists of disconnected cascades as this one observed in Spain. Its 7generations and 122 nodes stem from the node labeled Seed and grow throughsecondary propagation driven by Viral Nodes A, B and C which constitute 50% ofgeneration 1. Nodes color-coded by their out-degree. The nodes at the end of eachpath are inactive (out-degree is zero) and do not intervene in the analysis of Section3.1 which refers to nodes with non-zero in- and out-degree (the Viral Nodes). Noticethe tree-like structure devoid of closed paths or triangles (C = 0). The average totaldegree of this tree is k = 1.984 and its largest undirected path (diameter) d = 13.
more likely to appear in our campaigns than in percolation througha random network.5
In consequence, the viral Cascades Network topology lacks allthe four key features of email networks (fat tailed node degree dis-tribution, nodes degree correlations, high clustering and the SmallWorld property) and can not be formally characterized as a socialnetwork. This is quite logical since the viral propagation cascadesof diffusion processes far from saturation, such as ours, overlayjust sections of the underlying email network and, as a result, canonly unveil a small portion of it. Paraphrasing Liben-Nowell andKleinberg (2008) in their study of chain-letters propagation, it isas if “the progress of the viral messages had a type of stroboscopiceffect serving to briefly light up the structure of the global emailnetwork.” Unfortunately, not having any details on the topologyof the email network substrate, we can not judge the extent of itsinfluence on the Cascades Network topology.
2.3. Cascades Network dynamic parameters
While the structure of the undirected cascades is weakly relatedto that of the email network substrate, the flow of messages in theCascades Network is not (except for the substrate network settingthe boundary conditions) and fully depends on the recommenda-
5 The tail of the cascade size distribution in large random networks near the tran-sition to the giant component goes as nc
s ∼s−5/2 (Albert and Barabási, 2002) and theprobability of a cascade of size 122 is ∼6.1 × 10⁻⁶.
tion mechanism. To study it we will consider the distribution ofrecommendation emails sent by spreaders of the viral messagewhich offers a better picture of the cascades dynamics than thetotal node degree k considered so far because 70% of the networknodes are inactive. This new variable, equivalent to the out-degreeof the network nodes, is measured separately for Seed Nodes andViral Nodes and designated as rs and rv respectively. While mostViral Nodes sent just a few recommendations a significant fractiondisplayed a very intense activity: thus for the ensemble of All mar-kets in our dataset, the mean of the number of recommendationssent by Viral Nodes, the so-called Fanout Coefficient, was rv = 2.96(see Table 3), its standard deviation �v = 7.47 and the highest num-ber of recommendations sent by a single individual rv(max) = 72. Itsdistribution can be fitted to a fat tailed power-law of the form:
PL˛ˇ(rv) = H˛ˇ
ˇ + r˛v
(1)
whose parameters for the All markets network take the valuesH˛ˇ = 11.6, ˛ = 2.83 and ˇ = 10.96 using Maximum Likelihood Esti-mation.
We can visualize the cascades of a viral propagation pro-cess growing through successive layers, or generations, as nodesreached in one generation resend the message to nodes in thenext generation. The latter nodes constitute the offspring of theearlier ones in an evolution of the propagation trees whose node-level dynamics is well described by the Galton–Watson Branchingmodel6 (Harris, 2002). Two parameters fully describe this growthprocess at the population level: the aforementioned Fanout Coeffi-cient rv and the message Transmissibility � defined as the fractionof the touched nodes that become secondary spreaders. The Trans-missibility results from data in Table 1 as:
� = Nv
N − Ns(2)
and both parameters combine to yield the Basic Reproductive Num-ber R0 or average number of secondary recommendations producedby reached nodes as:
R0 = �rv (3)
This number is widely used in mathematical epidemiology(Hethcote, 2000) to determine the moment when a disease out-break becomes a self-sustaining epidemic. Thus, if R0 ≥ 1 thespreading process reaches the Tipping-point7 an elusive goal thatnone of our campaigns attained. Table 3 presents the propagationdynamic parameters and cascades average size s of our campaigns
6 A markovian model of a population where each individual in generation g pro-duces in generation g + 1 a random number of individuals extracted from the sameprobability distribution.
7 Defined by analogy to phase transitions in Physics as the process inflection pointwhere propagation speed accelerates drastically and becomes unstopped so that themessage propagation reaches a very large fraction of the audience.
Author's personal copy
138 J.L. Iribarren, E. Moro / Social Networks 33 (2011) 134–142
Table 3Cascades growth dynamic parameters: Transmissibility (�), Fanout Coefficients of Seed (rs) and Viral (rv) nodes, standard error of the Viral Nodes Fanout coefficient (rvSEM),Basic Reproductive Number for secondary spreaders (R0) and average cascade size (s) by market as measured in the campaigns. In the last two columns s∗ is the averageCascade size predicted by the Galton–Watson Branching model Eq. (4) and %Dev. the deviation of that prediction from the actual measurements.
Market � rs rv rvSEM R0 s s∗ %Dev.
France 0.062 2.21 2.50 0.1023 0.154 3.62 3.61 −0.22DE + AT 0.092 2.48 3.06 0.1155 0.281 4.54 4.45 −2.04Spain 0.115 3.16 3.45 0.1909 0.400 6.24 6.23 −0.20Nordic 0.089 2.82 2.91 0.1836 0.259 4.79 4.81 +0.31UK + NL 0.067 2.49 2.87 0.2398 0.236 4.08 4.09 +0.15Italy 0.084 2.87 2.80 0.2301 0.236 5.02 4.76 −5.20
All markets 0.083 2.51 2.96 0.065 0.246 4.34 4.33 −0.30
and their predicted value s∗ for the infinite propagation limit givenby the Galton–Watson Branching model as
s∗ = 1 + rs
1 − R0, R0 ≤ 1 (4)
where rs is the average number of messages sent by Seed Nodesand R0 the viral propagation Basic Reproductive Number. The lastcolumn in Table 3 shows the remarkable accuracy of the cascadesaverage size predicted by the Galton–Watson Branching modelversus the empirical values.
3. Patterns of the information cascades growth
Despite the Galton–Watson model statistically accuratedescription of the distribution of cascades at a global level, adetailed study of the Cascades Network growth, reveals patternsindicating that viral messages spreading dynamics is quite peculiar.Firstly, we present a node level analysis showing the correlationin the spreading activity of a node with that of its active offspringdown the message propagation tree. Secondly, we conduct ageneration level analysis on the probability of the nodes becomingactive as a function of their ordinal position in the message diffu-sion path which shows that their messages diffusion propensityincreases with their distance to the Seed Node. Both findingslead to a striking prediction corroborated by the measurementson our viral campaigns: the viral messages diffusion dynamicparameters at the population level are correlated, a fact that hasnot been observed in other Social Dynamics processes such asinnovations adoption, rumors spreading or opinions propagation.Note that both findings are incompatible with the assumptionsin the Galton–Watson model in which the branching mechanismis homogeneous both at the social network level and within thecascades.
3.1. Correlated spreading of active nodes
The first distinctive pattern of the viral messages Cascades Net-work growth is the marked positive correlation of the spreadingactivity between Viral Nodes and their active offspring. In undi-rected networks, the nodes total degree correlation is given by theconditional probability P(k|k′) of a node of degree k pointing to anode of degree k′. This function is very noisy in finite networks andis usually replaced by the average degree of the nearest neighbors ofk-degree nodes knn(k) =
∑k′ k′P(k|k′) (Boccaletti et al., 2006). When
knn(k) is an increasing function of the degree k the nodes tend toconnect to others of similar connectivity and such network, calledassortative, displays positive node total-degree correlations.
However the active nodes network is directed and instead oneshould study its out-degree correlation defined as the tendencyof nodes to connect with others that have similar out-degrees to
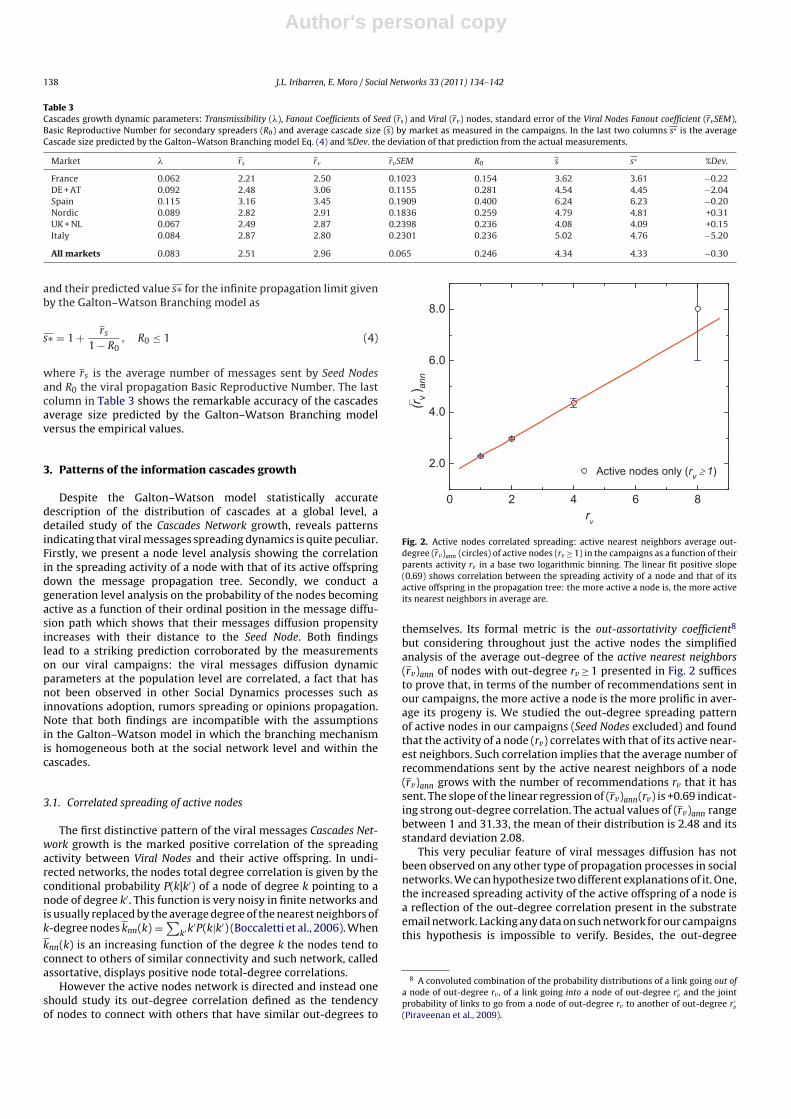
Fig. 2. Active nodes correlated spreading: active nearest neighbors average out-degree (rv)ann (circles) of active nodes (rv ≥ 1) in the campaigns as a function of theirparents activity rv in a base two logarithmic binning. The linear fit positive slope(0.69) shows correlation between the spreading activity of a node and that of itsactive offspring in the propagation tree: the more active a node is, the more activeits nearest neighbors in average are.
themselves. Its formal metric is the out-assortativity coefficient8
but considering throughout just the active nodes the simplifiedanalysis of the average out-degree of the active nearest neighbors(rv)ann of nodes with out-degree rv ≥ 1 presented in Fig. 2 sufficesto prove that, in terms of the number of recommendations sent inour campaigns, the more active a node is the more prolific in aver-age its progeny is. We studied the out-degree spreading patternof active nodes in our campaigns (Seed Nodes excluded) and foundthat the activity of a node (rv) correlates with that of its active near-est neighbors. Such correlation implies that the average number ofrecommendations sent by the active nearest neighbors of a node(rv)ann grows with the number of recommendations rv that it hassent. The slope of the linear regression of (rv)ann(rv) is +0.69 indicat-ing strong out-degree correlation. The actual values of (rv)ann rangebetween 1 and 31.33, the mean of their distribution is 2.48 and itsstandard deviation 2.08.
This very peculiar feature of viral messages diffusion has notbeen observed on any other type of propagation processes in socialnetworks. We can hypothesize two different explanations of it. One,the increased spreading activity of the active offspring of a node isa reflection of the out-degree correlation present in the substrateemail network. Lacking any data on such network for our campaignsthis hypothesis is impossible to verify. Besides, the out-degree
8 A convoluted combination of the probability distributions of a link going out ofa node of out-degree rv , of a link going into a node of out-degree r ′
v and the jointprobability of links to go from a node of out-degree rv to another of out-degree r ′
v(Piraveenan et al., 2009).

Author's personal copy
J.L. Iribarren, E. Moro / Social Networks 33 (2011) 134–142 139
Table 4Distribution of nodes by generation: distribution of the nodes touched by the viral message diffusion in the graph of All markets by ordinal number g of the position intheir diffusion path (generation). Ng is the number of nodes in generation g and Pg the probability of a node belonging to generation g ≥ 1. (Nv)g is the number of Viral Nodesby generation, �g the probability of nodes in generation g becoming spreaders and (rv)g the average number of recommendations sent by nodes in generation g and Rg theReproductive Number by generation with SEM its standard error.
g Ng Pg (Nv)g �g (rv)g Rg SEM
1 18,032 0.7527 1,398 0.0775 2.891 0.224 0.00562 4,042 0.1687 393 0.0972 3.239 0.315 0.01203 1,273 0.0531 139 0.1092 2.784 0.304 0.02284 387 0.0162 40 0.1034 3.150 0.326 0.06215 126 0.0053 20 0.1587 3.550 0.564 0.18046 71 0.0030 8 0.1127 2.125 0.239 0.06127 17 0.0007 3 0.1765 2.000 0.353 0.17658 6 0.0003 1 0.1667 4.000 0.667 0.09 4 0.0002 0 0.0 0.0 0.0 N/A
positive correlation in the substrate email network merely indi-cates that its nodes tend to link to others of similar out-degreebut does not by any means indicate that the number of recom-mendations made by active participants, hence the interest inparticipating in the campaign, should be a growing function ofthe number of recommendations made by their parent in the cas-cade. The other possible explanation, which we adopt, is that theintrinsic mechanism whereby participants in viral marketing cam-paigns forward the messages involves the sender selecting targetsamong those of her contacts perceived to be the most receptiveto the content of the message being passed-along. The iterationof these target filtering decisions through several generations ofsenders would lead, in a process akin to targeted search, to focus-ing the message on groups of individuals genuinely interested on it.Those, in turn, would also be in average more active spreaders thantheir ancestors. The fact that this mechanism has not been observedin other types of information diffusion, such as referral networks(Vilpponen et al., 2006), e-commerce recommendations (Leskovecet al., 2007) or email chain-letters (Liben-Nowell and Kleinberg,2008) may indicate either that the phenomenon is specific of viralmarketing messages or that those authors’ analysis did not isolatethe content factor.
3.2. Diffusion acceleration with path length
The second characteristic of viral spreading dynamics appearswhen measuring the probability of the nodes becoming activespreaders as a function of their position in the propagation tree.Thus, the Transmissibility by generation �g in our campaigns growsin correlation with the ordinal g representing the individuals’ loca-tion in the message propagation path. As shown in Table 4 forthe All markets data, �g increases steadily with the generation(�(g|�g) = 0.908) with parallel growth of the Reproductive Numberby generation:
Rg = �g(rv)g = Ng+1
Ng(5)
where Ng is the total number of individuals reached at generationg. Besides, there is a growth trend for (rv)g , the Fanout by gener-ation which is visible in our campaigns (Table 4) whose Fanoutratio through generations (rv)g+1/(rv)g positively correlates withthe generation number (� = 0.4). Those properties of messages dif-fusion were detected, but not studied, by Watts and Peretti (2007)or Leskovec et al. (2007) as shown in Fig. 3 along with our cam-paigns measurements. As before, we posit that such pattern is dueto “preferential forwarding,” defined as the spreaders’ propensityof passing a message preferentially to neighbors they presume tohave more interest, or affinity, for it. Such mechanism results inan increase of the recipients propensity to pass the message along.As a consequence, the message follows network paths such thatthe Transmissibility by generation �g increases as the propagation
Fig. 3. Diffusion acceleration with path length: Reproductive Number by genera-tion Rg in viral messages propagation. Solid circles with error bars correspond toour IT newsletter campaign. Other data sets (no error bars available): Oxygen Net-work advocacy portal collecting contributions for hurricane Katrina relief (squares);Tide Coldwater campaign for an energy-efficient washing detergent (empty circles);StopTheNRA, an appeal for gun control launched by the father of a Columbine shoot-ings victim (upward triangles) per Watts and Peretti (2007); referrals in e-commerce(downward triangles) per Leskovec et al. (2007).
progresses. We denominate Affinity Paths to the chains of individ-uals with similar or increasing affinity for the message. They implysome knowledge by message spreaders of their immediate neigh-bors interests, a local awareness with global impact that leads toa different class of propagation than that of other Social Dynam-ics processes. Its consciously driven spreading mechanism causesmessages to progress through paths presenting the homophily9
properties typical of social networks (McPherson et al., 2001). Thisphenomenon has been observed in the web where, according toSingla and Richardson (2008) “there is correlation between pref-erences and behavior of an individual and those of others in itsimmediate circle”.
3.3. Dynamic parameters correlation
As a result of the previous two properties, the parameters �and rv are correlated. Let us consider the relationship between the
9 The tendency of individuals to associate and bond with similar others.

Author's personal copy
140 J.L. Iribarren, E. Moro / Social Networks 33 (2011) 134–142
Fig. 4. Dynamic parameters correlation: correlation between the population leveldynamic parameters Transmissibility (�) and Fanout Coefficient (rv) of our viral cam-paigns in different markets. Dotted line is the linear fit to rv = 1 + a� with a = 22.48and R2 = 0.843. Solid line is the exponential fit to rv = 1 + b(1 − e−c�) with b = 3.82,c = 8.44 and R2 = 0.818. Markets position towards the rightmost side of this “responseline” indicates a higher affinity of the audience with the campaign message. Numberof spreading (active) nodes shown under market name.
Fanout Coefficient and the generation parameters in Table 4:
rv =∑
g=2Ng∑g=1�gNg
= 1 − Pg(1)∑g=1�gPg
(6)
where Pg(1) = N1/∑
g=1Ng = Nsrs/(N − Ns) is the probability of anindividual to have received the message from a Seed Node. Since∑
g=1�gPg = � one obtains the important expression �rv = 1 − Pg(1)which means that for � and rv to increase simultaneously one mustreduce the probability Pg(1) of finding nodes in the first generationor, equivalently, grow longer cascades. Thus, a growing �g yieldslonger paths and causes a parallel growth of rv. Our campaigns showthat the average shortest path length (�) of the diffusion cascadesand the dynamic parameters are strongly correlated: �(�|rv) = 0.88and �(�|�) = 0.89. An increase of the Transmissibility � grows thepaths length and the average number of recommendations maderv as well. Plotting the dynamic parameters for various markets(Fig. 4) their correlation was found to be very strong with a Pear-son’s coefficient �(�|rv) = 0.92. The values of � and rv by countryfrom Table 3 fit to the decreasing exponential.10
rv = 1 + b(1 − e−c�) (7)
which for � � 1, and through a MacLaurin series expansion ofe−c�, turns into rv = 1 + a� (a = bc). One can consider the slope aof this “response line” as the message “fitness” with respect to eachmarket. The exponential decrease for large � in Eq. (7) is due tothe substrate network nodes clustering which limits propagationthrough saturation and finite size effects.
In principle this correlation between Fanout Coefficient andTransmissibility should invalidate the Galton–Watson model usedin Section 2.3, because that model assumes that those parametersare uncorrelated. However, this is not the case since most of theparticipants in the campaign appear at very low generation num-bers and thus the phenomena observed here is only a significantcorrection affecting a small fraction of participants.
10 Y intercept set to 1 since rv → 1 as � → 0 because fit is on active nodes.
4. The Message Affinity Model (MAM)
The correlation between the messages propagation dynamicparameters � and rv and the independence of the nodes spread-ing activity from the substrate email network they run upon areintriguing properties of the viral marketing diffusion processes.Watts and Dodds (2007) built a model proving that informationpropagation can happen independently of the underlying socialnetwork structure and concluded that “large cascades of influenceare driven not by the influentials but by a critical mass of easilyinfluenced individuals.” However, their model does not explain thedynamic parameters correlation nor the increase with the genera-tion of the nodes propensity of becoming spreaders. We posit thatboth features are due to the fact that the decisions of forwarding aviral message and of the number of neighbors to send it to, typicallymade in a single act by each forwarding individual, are correlatedand that such correlation emerges as a function only of their affinitywith the content of the message being spread.
The agent-based Message Affinity Model (MAM) incorporatesthat mechanism by assigning to the substrate network nodes apropensity value representing their affinity with the message beingforwarded. Furthermore, the model propagation rules combine avariant of the states transition steps of the SIR epidemic model onnetworks (Pastor-Satorras and Vespignani, 2001) with the stochas-tic evolution of a pseudo-markovian11 Galton–Watson Branchingmodel. At any step, the network nodes are in one of the followingthree states:
- Susceptible (S): Node has not received the message.- Informed (I): Node is propagating the message.- Refractory (R): Node does not spread the message anymore.
Unlike the SIR model, MAM does not use a global probability forthe nodes states transitions. Instead, they stem from the aggregatedecisions that result from the interplay between the nodes pass-along propensity and the message “fitness” to diffuse. Drawn froma continuous probability density function p(a), the Affinity an ∈ [0,1] of a node represents its propensity to engage in spreading themessage. The message fitness to trigger the node activations is rep-resented by their Affinity Threshold AT ∈ [0, 1], the lowest an valuefor which such message can push the node into the Informed state:low threshold messages are capable of activating more nodes andare, as a result, forwarded more often than high threshold ones.The process starts by turning a random fraction of the substratenetwork nodes into the Informed state while leaving all others Sus-ceptible. From that point onwards the following rules govern thestochastic propagation:
(i) Susceptible nodes touched by the message become Informed iftheir Affinity is higher than the message threshold (an > AT) andRefractory otherwise while, if touched, Informed or Refractorynodes stay unchanged.
(ii) An Informed node n forwards a number of messages (rv)n =(an − AT ) × r, with r drawn from a PL distribution. The neigh-bors receiving those messages are:(a) those with highest an with probability (an − AT);(b) chosen randomly with probability 1 − (an − AT).
(iii) Informed nodes become Refractory immediately after spreadingthe message and the process ends when no Informed nodes areleft.
11 The Galton–Watson Branching model used in Section 2.3 explains well thegrowth of the cascades at the average level but fails to predict the activity cor-relations that appear in the evolution through generations. This is because theGalton–Watson model stochastic process is markovian while, in reality, one node’sactivity depends on that of its parent as per our findings in Section 3.1.
Author's personal copy
J.L. Iribarren, E. Moro / Social Networks 33 (2011) 134–142 141
Fig. 5. Cascades Network average cascade size. Expected average size of viral cas-cades for different values of the Reproductive Number R0 in simulations on theemail (boxes) and Config. (circles) networks with uniform Affinity distribution ofmean an = 0.13 and an = 0.17 respectively. The Affinity Threshold AT used in thesimulations ranges from 0.6 to 0.97 to show the asymptotic growth for R0 ∼ 1. Solidlines are not a fit but the predictions of Eq. (4). Inset: curves collapse when plotting(s − 1)/rs against R0 showing the viral propagation patterns independence of thesubstrate network topology.
The quantity an − AT embodies the interplay between the partic-ipants interests and the message content. The choice in Rule (ii) ofthe neighbors that will receive the message represents the evalua-tion Informed nodes make, based on their local knowledge, of theirneighbors’ affinity. It implies that local knowledge grows with theAffinity: nodes of high an are more likely to choose targets with thehighest propensity to pass the message while those with low an
will mostly choose their targets randomly. AT may vary by individ-ual but, without loss of generality, we take it constant including allvariations in p(a).
4.1. MAM simulation results
Here we present the result of Monte Carlo simulations of viralmessages propagation ran with the MAM model and show thatthey replicate the patterns observed in real processes. The sim-ulations ran on two substrate networks with the same degreedistribution but different structure: the real email network of aSpanish university (Guimerá et al., 2003) and a synthetic config-uration model network built with the Molloy and Reed method(Callaway et al., 2001). They differ in their Clustering Coefficient(Cemail = 0.22 vs . Cconf = 0.014) and in the fact that the email net-work node degrees are correlated while the configuration networkones are not. Their nodes Affinity, with correlation between nearestneighbors, was drawn from a uniform distribution. The CascadesNetwork resulting from the propagation of messages with AffinityThreshold between 0.6 and 0.97 were averaged over 15K cascadeswith 500 different allocations of the substrate nodes Affinity.
The simulations generate graphs with a large number of discon-nected components that, like those in the real campaigns, featuredistributions of Eq. (1) type for both their Viral Nodes activity P(rv)and cascades size P(s). The exponents �k and �s of their power-laws are in the range 1–3 depending on the values of the modelparameters nodes Affinity (an) and message Affinity Threshold (AT)used. Besides, the average cluster size of the graphs obtained inthe simulations follows closely the branching model predictions asshown in Fig. 5. It plots the average size s of the propagation net-work components obtained with different values of the messageAffinity Threshold versus their Reproductive Number R0 for each.
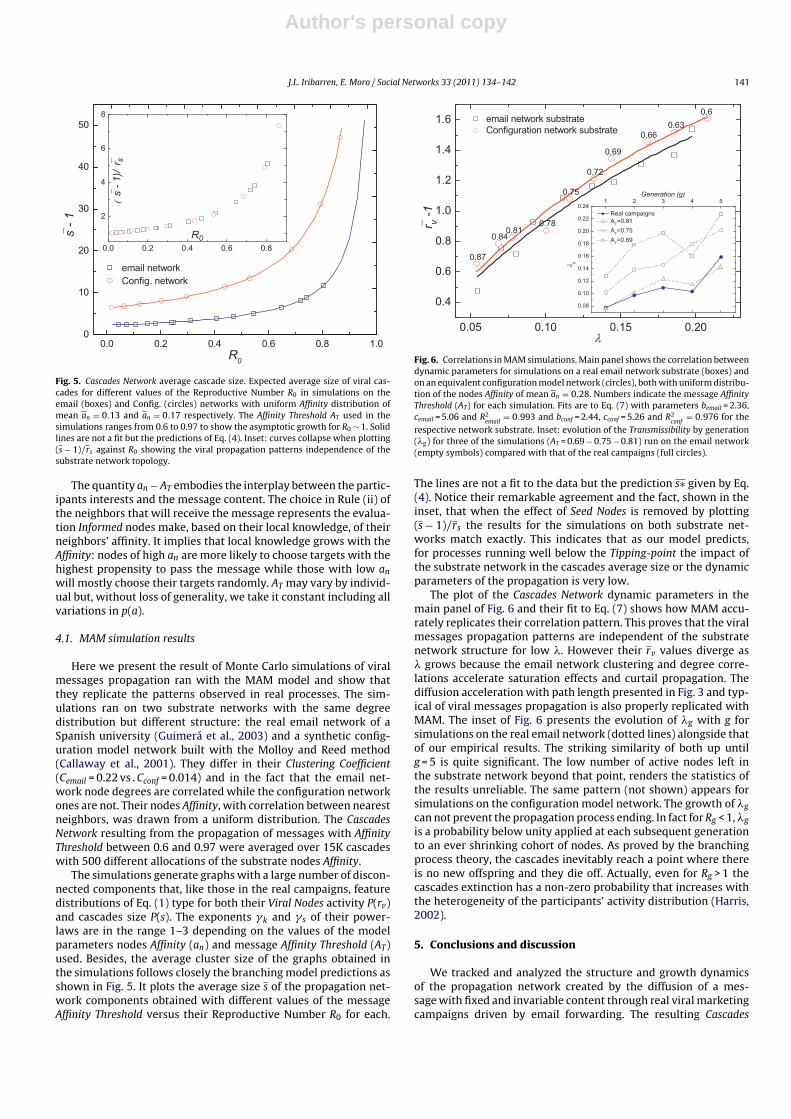
Fig. 6. Correlations in MAM simulations. Main panel shows the correlation betweendynamic parameters for simulations on a real email network substrate (boxes) andon an equivalent configuration model network (circles), both with uniform distribu-tion of the nodes Affinity of mean an = 0.28. Numbers indicate the message AffinityThreshold (AT) for each simulation. Fits are to Eq. (7) with parameters bemail = 2.36,cemail = 5.06 and R2
email= 0.993 and bconf = 2.44, cconf = 5.26 and R2
conf= 0.976 for the
respective network substrate. Inset: evolution of the Transmissibility by generation(�g) for three of the simulations (AT = 0.69 − 0.75 − 0.81) run on the email network(empty symbols) compared with that of the real campaigns (full circles).
The lines are not a fit to the data but the prediction s∗ given by Eq.(4). Notice their remarkable agreement and the fact, shown in theinset, that when the effect of Seed Nodes is removed by plotting(s − 1)/rs the results for the simulations on both substrate net-works match exactly. This indicates that as our model predicts,for processes running well below the Tipping-point the impact ofthe substrate network in the cascades average size or the dynamicparameters of the propagation is very low.
The plot of the Cascades Network dynamic parameters in themain panel of Fig. 6 and their fit to Eq. (7) shows how MAM accu-rately replicates their correlation pattern. This proves that the viralmessages propagation patterns are independent of the substratenetwork structure for low �. However their rv values diverge as� grows because the email network clustering and degree corre-lations accelerate saturation effects and curtail propagation. Thediffusion acceleration with path length presented in Fig. 3 and typ-ical of viral messages propagation is also properly replicated withMAM. The inset of Fig. 6 presents the evolution of �g with g forsimulations on the real email network (dotted lines) alongside thatof our empirical results. The striking similarity of both up untilg = 5 is quite significant. The low number of active nodes left inthe substrate network beyond that point, renders the statistics ofthe results unreliable. The same pattern (not shown) appears forsimulations on the configuration model network. The growth of �g
can not prevent the propagation process ending. In fact for Rg < 1, �g
is a probability below unity applied at each subsequent generationto an ever shrinking cohort of nodes. As proved by the branchingprocess theory, the cascades inevitably reach a point where thereis no new offspring and they die off. Actually, even for Rg > 1 thecascades extinction has a non-zero probability that increases withthe heterogeneity of the participants’ activity distribution (Harris,2002).
5. Conclusions and discussion
We tracked and analyzed the structure and growth dynamicsof the propagation network created by the diffusion of a mes-sage with fixed and invariable content through real viral marketingcampaigns driven by email forwarding. The resulting Cascades

Author's personal copy
142 J.L. Iribarren, E. Moro / Social Networks 33 (2011) 134–142
Network, formed by almost pure trees of very low clustering, showstwo striking dynamical patterns not observed so far in other SocialDynamics processes like rumor spreading, innovations adoption oremail chain-letters. First, there is positive correlation between thespreading nodes activity level as measured by their out-degree andthat of their active offspring and, second, the propensity of nodesreached by the message to becoming spreaders, the Transmissibil-ity �, grows with those nodes depth in the propagation path. Thesenovel properties can only be detected by scrutinizing the propa-gation of messages of fixed and identical content. The scarcity ofsuch type of data may explain why they have remained unobserveduntil now. The discovered patterns have two remarkable conse-quences. On the one hand, the dynamic parameters Transmissibilityand Fanout Coefficient for a given message across different marketsare correlated. On the other, the topology of the email networkunderlying the propagation has limited influence on the CascadesNetwork although its features are compatible with the structure ofthe substrate email network that conditions their formation.
Our explanation of all those peculiarities stems from the mecha-nism driving the messages propagation which involves the affinityof the campaign participants with the content of the message. Par-ticipants would make a simultaneous and conscious decision ofspreading it or not and to whom which leads to a positive correla-tion between the probability of becoming a spreader after receivingthe message and the average number of messages forwarded. Thisdecision would result from a single intrinsic property of the nodesin the substrate network, their affinity with the message beingpassed-along. Besides, the dynamic parameters by generation �g
and (rg) tend to grow with g since the choice of targets to forwardthe message to is based on the participants’ awareness of theirneighbors’ affinity with it. Such mechanism steers the messagethrough paths of increased affinity termed Affinity Paths.
This hypothesis is tested through an agent-based model (MAM)that replicates the patterns discovered and validates the proposedAffinity-driven information diffusion mechanism. It combines astochastic branching process with propagation rules that createcascades of touched nodes by taking the substrate network nodesmessage awareness through a sequence of Susceptible, Informedand Refractory states. The MAM uses just two control parameters:the Affinity distribution p(a) of the substrate network nodes toassign them an affinity value between 0 (message is not sent) and1 (message will certainly be forwarded) and the Affinity ThresholdAT representing the message fitness to be passed-around. As themodel runs through a substrate network list of edges, the inter-play between AT and the nodes Affinity generates cascades withall the experimentally observed features while providing a glimpseinto the substrate network topology. The empirical analysis and thetheoretical model validate our conclusion that the mechanism driv-ing viral marketing messages propagation results from the affinitybetween the campaign participants’ preferences and the messagescontent. In fact, the viral cascades features depend more on theindividuals’ reaction to the message than on the substrate networktopology. However, we could not verify this conclusion empiri-cally since the structure of our campaigns substrate network beingunknown, a comparison between the Cascades Network and thesubstrate email network was impossible. Also, MAM does not repli-cate the merging of cascades that occurs near the Tipping-point asit assumes that Seed Nodes are planted in a boundless network andfar apart of each other to avoid propagation clashing. Finally, MAMonly runs on substrate networks that are undirected and with asingle connected component.
References
Albert, R., Barabási, A.-L., 2002. Statistical mechanics of complex networks. Reviewsof Modern Physics 74, 47–97.
Ball, P., 2004. Critical Mass: How One Thing Leads to Another. Farrar, Strauss andGiroux, London, UK.
Bass, F.M., 1969. A new product growth model for consumer durables. ManagementScience 15, 121–227.
Bettencourt, L.M.A., 2002. From boom to bust and back again: the complex dynamicsof trends and fashions. Cond-mat/0212267.
Boccaletti, S., Latora, V., Moreno, Y., Chavez, M., Hwang, D.-U., 2006. Com-plex networks: structure and dynamics. Physics Reports 424, 175–308.
Callaway, D.S., Hopcroft, J.E., Kleinberg, J.M., Newman, M.E.J., Strogatz, S.H.,2001. Are randomly grown graphs really random? Physical Review E 64,041902.
Daley, D.J., Kendall, D.G., 1965. Stochastic rumours. IMA Journal of Applied Mathe-matics 1 (1), 42–55.
Ebel, H., Mielsch, L.-I., Bornholdt, S., 2002. Scale-free topology of e-mail networks.Physical Review E 66, 035103(R).
Eckmann, J.-P., Moses, E., Sergi, D., 2004. Entropy of dialogues creates coherent struc-tures in e-mail traffic. Proceedings of the National Academy of Sciences of theUnited States of America 101, 14333–14337.
Feld, S., 1991. Why your friends have more friends than you do. American Journalof Sociology 96, 1464–1467.
Frenken, K., Silverberg, G., Valente, M., 2008. A percolation model of the productlifecycle. In: Tech. Rep. United Nations University—UNU-MERIT.
Galam, S., 2002. Modelling rumors: the no plane pentagon french hoax case. PhysicaA 320, 571–580.
Gomez-Rodriguez, M., Leskovec, J., Krause, A., 2010. Inferring networks of diffu-sion and influence. In: Proceedings of the 16th ACM SIGKDD Conference onKnowledge Discovery and Data Mining (KDD).
Granovetter, M., 1978. Threshold models of collective behavior. American Journal ofSociology 83 (6), 1420–1443.
Guardiola, X., Díaz-Guilera, A., Pérez, C., Arenas, A., Llas, M., 2002. Modelling diffusionof innovations in a social network. Physical Review E 66, 026121.
Guimerá, R., Danon, L., Díaz-Guilera, A., Giralt, F., Arenas, A., 2003. Self-similar com-munity structure in a network of human interactions. Physical Review E 68,065103(R).
Harris, T.E., 2002. The Theory of Branching Processes. Springer-Verlag, Berlin.Hethcote, H.W., 2000. The mathematics of infectious diseases. SIAM Review 42 (4),
599–653.Jackson, M., Yariv, L., 2005. Diffusion on social networks. Économie Publique 16,
3–16.Katz, E., Lazarsfeld, P.F., 1955. Personal Influence: The Part Played by People in the
Flow of Mass Communications. Free Press, Glencoe, IL.Lazer, D., Pentland, A., Adamic, L., Aral, S., Barabási, A.-L., Brewer, D., Christakis,
N., Contractor, N., Fowle, J., Gutmann, M., Jebara, T., King, G., Macy, M., Roy,D., Alstyne, M.V., 2009. Computational social science. Science 323 (5915), 721–723.
Leskovec, J., Adamic, L., Huberman, B., 2007. The dynamics of viral marketing. ACMTransactions on the Web 1, 1.
Liben-Nowell, D., Kleinberg, J., 2008. Tracing information flow on a global scale usinginternet chain-letter data. Proceedings of the National Academy of Sciences ofthe United States of America 105 (12), 4633–4638.
Liu, B.S.-C., Madhavan, R., Sudharshan, D., 2005. Diffunet: the impact of networkstructure on diffusion of innovation. European Journal of Innovation Manage-ment 8 (2), 240–262.
McPherson, M., Smith-Lovin, L., Cook, J.M., 2001. Birds of a feather: homophily insocial networks. Annual Review of Sociology 27, 415–444.
Nekovee, M., Moreno, Y., Bianconi, G., Marsili, M., 2007. Theory of rumour spreadingin complex social networks. Physica A 374, 457–470.
Newman, M.E.J., 2002. Assortative mixing in networks. Physical Review Letters 89,208701.
Newman, M.E.J., Forrest, S., Balthrop, J., 2002. Email networks and the spread ofcomputer viruses. Physical Review E 69, 026113.
Newman, M.E.J., Park, J., 2003. Why social networks are different from other typesof networks. Physical Review E 68, 036122.
Niu, S.-C., 2002. A stochastic formulation of the bass model of new-product diffusion.Review of Marketing Science Working Papers 1 (4), 1.
Pastor-Satorras, R., Vespignani, A., 2001. Epidemic dynamics and endemic states incomplex networks. Physical Review E 63 (6), 066117, May.
Piraveenan, M., Prokopenko, M., Zomaya, A., 2009. Assortative mixing in directedbiological networks. IEEE Transactions on Computational Biology and Bioinfor-matics.
Singla, P., Richardson, M., 2008. Yes, there is a correlation—from social networks topersonal behavior on the web. In: Proceeding of WWW’2008.
Sznajd-Weron, K., 2005. Sznajd model and its applications. Acta Physica Polonica B36 (8).
Van den Bulte, C., Joshi, Y.V., 2007. New product diffusion with influentials andimitators. Marketing Science 26 (3), 400–421.
Vilpponen, A., Winter, S., Sundqvist, S., 2006. Electronic word-of-mouth in onlineenvironments: exploring referral network structure and adoption behavior.Journal of Interactive Advertising 6 (2).
Watts, D.J., 2004. The new science of networks. Annual Review of Sociology 30,243–270.
Watts, D.J., Dodds, P.S., 2007. Influentials, networks and public opinion formation.Journal of Consumer Research 34, 441–458.
Watts, D.J., Peretti, J., 2007. Viral marketing for the real world. Harvard BusinessReview, F0705A.