Affective State Influences Perception by Affecting Decision Parameters Underlying Bias and...
19
Affective State Influences Perception by Affecting Decision Parameters Underlying Bias and Sensitivity Spencer K. Lynn, Dept. Psychology, Northeastern University Xuan Zhang, and Dept. Psychology, Boston College Lisa Feldman Barrett Dept. Psychology, Northeastern University, and Dept. Psychiatry/Martinos Center for Biomedical Imaging, Harvard Medical School, Massachusetts General Hospital Abstract Studies of the effect of affect on perception often show consistent directional effects of a person’s affective state on perception. Unpleasant emotions have been associated with a “locally focused” style of stimulus evaluation, and positive emotions with a “globally focused” style. Typically, however, studies of affect and perception have not been conducted under the conditions of perceptual uncertainty and behavioral risk inherent to perceptual judgments outside the laboratory. We investigated the influence of perceivers’ experience affect (valence and arousal) on the utility of social threat perception by combining signal detection theory and behavioral economics. We created three perceptual decision environments that systematically differed with respect to factors that underlie uncertainty and risk: the base rate of threat, the costs of incorrect identification threat, and the perceptual similarity of threats and non-threats. We found that no single affective state yielded the best performance on the threat perception task across the three environments. Unpleasant valence promoted calibration of response bias to base rate and costs, high arousal promoted calibration of perceptual sensitivity to perceptual similarity, and low arousal was associated with an optimal adjustment of bias to sensitivity. However, the strength of these associations was conditional upon the difficulty of attaining optimal bias and high sensitivity, such that the effect of the perceiver’s affective state on perception differed with the cause and/or level of uncertainty and risk. Keywords threat perception; valence; arousal; signal detection theory; utility The perception of facial actions as threatening is not a simple act of decoding facial movements – it is influenced by both the internal state of the perceiver (e.g., accessible conceptual knowledge; Lindquist, Barrett, Bliss-Moreau, & Russell, 2006; Gendron, Lindquist, Barsalou, & Barrett, In press) and perceptual environment (e.g., background scene; Barrett & Kensinger, 2010) (for a review, see Barrett, Mesquita, & Gendron, 2011; Gendron, Mesquita, & Barrett, In press,). Here, we sought to evaluate how the perceiver’s affective state might serve as an internal context that influences social threat perception within different external, perceptual environments. Address correspondence to Spencer Lynn, Psychology NI-125, Northeastern University, 360 Huntington Avenue, Boston, MA 02115; [email protected]. NIH Public Access Author Manuscript Emotion. Author manuscript; available in PMC 2013 August 01. Published in final edited form as: Emotion. 2012 August ; 12(4): 726–736. doi:10.1037/a0026765. $watermark-text $watermark-text $watermark-text
Transcript of Affective State Influences Perception by Affecting Decision Parameters Underlying Bias and...

Affective State Influences Perception by Affecting DecisionParameters Underlying Bias and Sensitivity
Spencer K. Lynn,Dept. Psychology, Northeastern University
Xuan Zhang, andDept. Psychology, Boston College
Lisa Feldman BarrettDept. Psychology, Northeastern University, and Dept. Psychiatry/Martinos Center for BiomedicalImaging, Harvard Medical School, Massachusetts General Hospital
AbstractStudies of the effect of affect on perception often show consistent directional effects of a person’saffective state on perception. Unpleasant emotions have been associated with a “locally focused”style of stimulus evaluation, and positive emotions with a “globally focused” style. Typically,however, studies of affect and perception have not been conducted under the conditions ofperceptual uncertainty and behavioral risk inherent to perceptual judgments outside the laboratory.We investigated the influence of perceivers’ experience affect (valence and arousal) on the utilityof social threat perception by combining signal detection theory and behavioral economics. Wecreated three perceptual decision environments that systematically differed with respect to factorsthat underlie uncertainty and risk: the base rate of threat, the costs of incorrect identification threat,and the perceptual similarity of threats and non-threats. We found that no single affective stateyielded the best performance on the threat perception task across the three environments.Unpleasant valence promoted calibration of response bias to base rate and costs, high arousalpromoted calibration of perceptual sensitivity to perceptual similarity, and low arousal wasassociated with an optimal adjustment of bias to sensitivity. However, the strength of theseassociations was conditional upon the difficulty of attaining optimal bias and high sensitivity, suchthat the effect of the perceiver’s affective state on perception differed with the cause and/or levelof uncertainty and risk.
Keywordsthreat perception; valence; arousal; signal detection theory; utility
The perception of facial actions as threatening is not a simple act of decoding facialmovements – it is influenced by both the internal state of the perceiver (e.g., accessibleconceptual knowledge; Lindquist, Barrett, Bliss-Moreau, & Russell, 2006; Gendron,Lindquist, Barsalou, & Barrett, In press) and perceptual environment (e.g., backgroundscene; Barrett & Kensinger, 2010) (for a review, see Barrett, Mesquita, & Gendron, 2011;Gendron, Mesquita, & Barrett, In press,). Here, we sought to evaluate how the perceiver’saffective state might serve as an internal context that influences social threat perceptionwithin different external, perceptual environments.
Address correspondence to Spencer Lynn, Psychology NI-125, Northeastern University, 360 Huntington Avenue, Boston, MA 02115;[email protected].
NIH Public AccessAuthor ManuscriptEmotion. Author manuscript; available in PMC 2013 August 01.
Published in final edited form as:Emotion. 2012 August ; 12(4): 726–736. doi:10.1037/a0026765.
$waterm
ark-text$w
atermark-text
$waterm
ark-text

Prior research demonstrates widespread influence of perceivers’ affective state onperception. For example, affect influences changes in sensitivity to different spatialfrequencies (Phelps, Ling, & Carrasco, 2006; Bocanegra & Zeelenberg, 2009), field of view(Schmitz, De Rosa, & Anderson, 2009), estimates of height (Stefanucci & Proffitt, 2006)and steepness (Stefanucci, Proffitt, Clore, & Parekh, 2008), estimates of temperature andweight (Avramova, Stapel, & Lerouge, 2010), conscious awareness of affective stimuli(Anderson, Siegel, & Barrett, 2011), and attribution of affect to neutral (Anderson, Siegel,White, & Barrett, In press) or ambiguous (Bouhuys, Bloem, & Groothuis, 1995) stimuli.
The influence of affect on perception have been characterized in several ways. Someresearch has shown that the perceiver’s affective state can bias perception of affect-ladenstimuli in a direction congruent with that affective state (e.g., Bower, 1991; Bouhuys, et al.,1995). For example, participants induced to feel depressed (vs. elated) rated ambiguousfacial expressions as more sad than did other participants (Bouhuys, et al., 1995). Otherresearch argues that a person’s affective state can influence the style of processing,sometimes characterized as effort, depth, or global vs. local focus (reviewed by Schwarz &Clore, 2007). For example, people induced to feel happy expended less effort to evaluatestimuli (reviewed by Schwarz, 1990), showed greater reliance on heuristics whencategorizing stimuli (Park & Banaji, 2000), showed less ability to adjust their behaviorfollowing errors (van Steenbergen, Band, & Hommel, 2010), and showed greater influenceof perceptual context (Avramova, et al., 2010). Finally, other research argues that affect maybe associated with perceivers’ propensity to switch processing style, rather than dictating thedirection of the association itself (Huntsinger, Clore, & Bar-Anan, 2010). For example,when Huntsinger, et al., 2010 people induced to be in a positive state and primed to belocally focused stayed locally focused, while people induced to be in a negative state andprimed to be locally focused adopted a globally focused style. Huntsinger et al. (2010)attribute the commonly reported link between negative state and local focus to a propensityfor people to employ a global focus style, so that induction of negative state, typically causesa switch to a local focus style.
One limitation of prior studies is that they have tended not to investigate the interaction ofaffective state with the uncertainty (e.g., perceivers cannot always be sure of what they areseeing) and risk (e.g., being incorrect can be costly) inherent to perception outside of thelaboratory. Current theories imply that perceivers’ affect should exert its influence onperception regardless of uncertainty or risk. For example, if one hypothesizes that negativevalence will influence perception of scowling faces in a mood-congruent or locally-focuseddirection, current theories offer no expectation that the relationship should be differentamong environments that differ on: (1) the ease of distinguishing threats from non-threats(uncertainty), (2) the relative encounter rate with threats or costs of incorrect perception(risk), or (3) the difficulty of optimizing one’s perceptual decisions under different levels ofuncertainty and risk. However, uncertainty and risk clearly influence perception, asdocumented in the psychophysics literature (e.g., Commons, Nevin, & Davison, 1991). It isconceivable that affect could influence how perceivers respond to risk and uncertaintyseparately from how affect influences the better understood characteristics, such as moodcongruency and processing style. An understanding of how affect influences perception willbe incomplete until interactions of affect with uncertainty and risk are delineated.
Here, we take the perspective that perception is a decision, albeit a decision that perceiversare typically unaware of making. As a decision, perception is characterized by uncertaintyand risk. For example, sometimes scowling people look threatening when in fact they arenot (they may be concentrating, or angry about something else) and sometimes people don’tclearly show their feelings (they might appear unthreatening when they in fact are).Furthermore, failing to correctly note when something is a threat can have different costs
Lynn et al. Page 2
Emotion. Author manuscript; available in PMC 2013 August 01.
$waterm
ark-text$w
atermark-text
$waterm
ark-text

than seeing threat where it does not exist. For example, failing to respond appropriatelywhen someone is angry at you may accrue different personal or social costs than doesmisattributing anger where it does not exist. Likewise, correctly identifying threat can havedifferent benefits than correctly rejecting threat in favor of an alternative conclusion.
To capture the decision-like characteristics of perception, and examine how a perceiver’saffect might interact with them, we used signal detection theory (SDT) within a behavioraleconomic framework (Lynn, 2005, 2006, 2010). SDT characterizes a perceiver’s response touncertainty and risk by quantifying the perceiver’s ability to discriminate signals of one kind(targets, e.g., facial and body actions indicating threat) from another (foils, e.g., non-threatening actions), called sensitivity; and the perceiver’s tendency to categorize any signalas target vs. foil, called bias. A tendency to categorize signals as targets, or liberal bias,incurs many correct detections of true threats, but also many false alarm reactions to non-threatening circumstances as if they were threats. A tendency to identify signals as foils, orconservative bias, incurs many correct rejections of non-threats, but also many misseddetections of true threats.
In SDT, any given perceptual environment can be characterized by three signal parameters:(1) how frequently the perceiver encounters targets (e.g., threatening people), called baserate; (2) the payoffs associated with the four possible decision outcomes, i.e., costs of amissed detection of threat in another person or of a false alarm (incorrectly perceivingsomeone as threatening), and benefits of correctly detecting threat in another person or ofcorrectly deciding that a person is not threatening; and, (3) the perceptual similarity of targetand foil, e.g., the physical similarity of facial expressions indicative of threat (target), vs.non-threat (foil). A perceiver’s bias is largely influenced by base rates and payoffs (e.g., raretargets or costly false alarms each promote conservative bias), while his or her sensitivity isinfluenced by the perceptual similarity between targets and foils (e.g., people are moresensitive when targets and foils are less similar to one another) (Green & Swets, 1966;Macmillan & Creelman, 1991).
Within this parameterized SDT framework, overall performance is measured by utility, thenet benefit accrued over a series of decisions. Utility is the outcome of a series of correctdetections and correct rejections (which accrue benefits) minus the outcome of a series offalse alarms and missed detections (which accrue costs). A perceiver’s sensitivity and biasboth influence the utility of his or her perception. Sensitivity affects utility by its influenceon absolute number of errors committed. Higher sensitivity results in fewer false alarms andmissed detections. Bias affects utility by influencing the number of false alarm and misseddetection errors relative to each other. The amount and direction of bias that is optimal in agiven environment is a function of the environmental base rate and payoff values, but also ofthe perceiver’s level of sensitivity (Supplemental Figure S3 describes the relationship of biasto sensitivity).
The current studyWe examined the association between perceivers’ feelings and their ability to judge socialthreat under three different perceptual environments. We created a threat perception task inwhich participants categorized faces depicting scowls of varying intensities as either “morethreatening” or “less threatening.” We used affective images and music to induce variationin participants’ hedonic valence (feeling of pleasantness—unpleasantness) and arousal(feelings of low—high activation). We used different values of the three signal parameters(base rate, payoffs, and similarity) to create three environments with different levels ofperceptual uncertainty and behavioral risk. A low base rate of threat created a conservativelybiased environment, emphasizing risk of misidentification due to frequency of occurrence. A
Lynn et al. Page 3
Emotion. Author manuscript; available in PMC 2013 August 01.
$waterm
ark-text$w
atermark-text
$waterm
ark-text

high cost of missed detections of threat created a liberally biased environment, emphasizingrisk of misidentification due to differential costs of mistakes. A high perceptual similarity ofthreatening vs. non-threatening signals created an environment emphasizing risk ofmisidentification due to perceptual uncertainty. On each trial, participants viewed a scowlingface (of variable scowl intensity from trial-to-trial) and judged the face as “more” or “less”threatening. They earned points for each correct judgment and lost points for each incorrectjudgment. Participants were instructed to earn as many points as they could (i.e., optimizetheir perceptual judgments of the faces). As measures of performance, we analyzed pointsearned, response bias, perceptual sensitivity, and a novel index of signal detection optimalitythat measures perceivers’ bias and sensitivity relative to an optimality criterion calculatedfrom the values of the three signal parameters (see Supplemental Material).
We hypothesized that the affective state associated with highest utility would differ acrossthe three environments. We predicted that the regression relationship between affective state(subjective ratings of valence and arousal) and utility (points earned) would differ acrossperceptual environments for two reasons. First, the different levels or causes of uncertaintyand risk implemented in our task may play to the strengths of different affective states, ascharacterized in the prior literature. For example, achieving optimal sensitivity underconditions of high similarity might be promoted by the increased influence of discriminativecontext on perception afforded by positive valence (Avramova, et al., 2010), whileoptimizing bias to account for changing base rates or payoffs might be impaired by the lackattention to details associated with positive valence (Stroessner, Hamilton, & Mackie, 1992).Thus, the strength and direction of relationships of affective state with overall performancecould differ among the three conditions. Second, valence and arousal often have not beenexamined as separate influences on perception in prior studies. Although in the literature theinfluence of affect on perception is discussed in terms of valence, in practice, subjectiveaffect has often been measured as endorsement of a categorical emotion, e.g., “happy”(positive valence, across a possibly wide range of arousal) vs. “sad” (negative valence,typically at low arousal) (Forgas, 1995). Without separate analysis of valence and arousal,effects attributed to positive vs. negative valence might also be due to high vs. low arousal.This possible confound leaves room for doubt as to the dominance of a particular state(combination of valence and arousal) across all three task conditions.
High utility results from both high sensitivity and optimal bias, and our design permitted usto examine the influence of affect on these components of utility separately. We predictedthat valence would be associated with bias, such that people feeling more unpleasant wouldexhibit a more optimal amount of bias than would people feeling pleasant. We reasoned thatunpleasant valence should cause more optimal bias due to “local focus” processingcharacteristics, such as improved attention to category details (e.g., base rate [Stroessner, etal., 1992]) and improved behavioral adjustment in response to errors (van Steenbergen, etal., 2010). Based on prior studies of the influence of arousal on signal detection (reviewedby Matthews & Davies, 2001), we hypothesized that arousal would be associated withsensitivity, such that people feeling more activated would exhibit better sensitivity. Becauseour measure of bias optimality–distance to a line of optimal response–is novel, we made noa priori predictions about how arousal might influence it.
MethodParticipants
Participants were two hundred and fifteen people, largely undergraduate Psychology majors(118 females and 97 males; mean age = 20.2 ± 2.51 [SD] years). Participants gave informedconsent according an IRB-approved protocol and were compensated with $15 or 1.5research participation credits.
Lynn et al. Page 4
Emotion. Author manuscript; available in PMC 2013 August 01.
$waterm
ark-text$w
atermark-text
$waterm
ark-text

Affective State InductionsParticipants were assigned to receive pleasant, unpleasant, or neutral affective stateinductions with the goal of creating continuous variation in valence and arousal within thesample, for use in regression analyses. Affective state induction comprised watching a 4.5minute computer presentation of affective images (International Affective Picture System;Lang, Bradley, & Cuthbert, 2005) accompanied by affect-congruent music (SupplementalTable S1). Before and after affective state induction, participants rated their current level ofarousal (sleepy–excited) and valence (unpleasant–pleasant) on separate 9-point scales. SeeSupplemental Material for data on efficacy of the inductions.
Participants were told that the aim of the study was to investigate the influence of“concentration” (i.e., the threat perception task) on how people feel (i.e., their response tothe affective state inductions). This was the reverse of the study’s actual aim, and soparticipants were unaware that the purpose of experiencing the images and music was toinduce an affective state with the intent of investigating its influence on their perception.
Threat Perception TaskFramework—We modeled threat perception by adapting a utility-based signal detectionframework developed for studies of animal learning (Lynn, 2006, 2010), which we call theSignal Utility Estimator (SUE) model. The framework uses the SDT utility function (Green& Swets, 1966: Equation 1.14; Supplemental Material) to predict optimal decision criterionplacement given values of the three signal parameters (base rate, payoff, and similarity).
The perceptual similarity parameter was implemented as two classes of stimuli, “morethreatening” (targets) and “less threatening” (foils), which varied over a range of scowlingface intensity (Figure 1). Each stimulus class was defined by a Gaussian distribution withparticular mean and standard deviation, e.g., the 40%-scowling morph as the mean foil andthe 60%-scowling morph as the mean target, with standard deviation = 10% for bothdistributions. The presence of variance meant that the exact same stimulus would be shownwith some likelihood as a target exemplar on some trials, and with some alternativelikelihood as a foil exemplar on other trials, the likelihoods being specified by thedistribution of the respective Gaussian functions over the range of scowl intensities. Thebase rate parameter controlled the proportion of trials drawn from the target vs. foildistributions. There was thus a correct answer for every trial. However, due to overlap of thedistributions over the stimulus range, participants experienced considerable uncertainty as towhat the correct answer was (because the same physical stimulus could be a target on onetrial and a foil on another trial). The payoff parameter was implemented as points earned orlost at each trial based on whether the trial resulted in a correct detection, false alarm,missed detection, or correct rejection. A task comprised 178 trials on which participantsdecided if a stimulus was from the “more threatening” or “less threatening” stimulus class.
We created four sets of parameter values—four perceptual environment conditions. Theconditions differed from each other in the value of one of the three signal parameters (Table1). In the Baseline Condition, we set base rate of threat to 0.50 (50% of trials were drawnfrom the target stimulus class). Correct detection of targets (faces drawn from the “morethreatening” distribution) and correct rejection of foils (faces drawn from the “lessthreatening” distribution) each earned +10 points. False alarms to foils lost 7 points andmissed detection of targets lost 3 points. The 40%-scowling morph was the mean foil andthe 60%-scowling morph was the mean target, with standard deviation = 10% for bothdistributions. All else being equal, the slightly higher false alarm vs. missed detection costcreated a mildly conservatively biased perceptual environment.
Lynn et al. Page 5
Emotion. Author manuscript; available in PMC 2013 August 01.
$waterm
ark-text$w
atermark-text
$waterm
ark-text
In the Low Base Rate Condition, we set the base rate of threat to 0.25 (25% of trials weredrawn from the target stimulus class). All other parameters were as in the BaselineCondition. The payoff values and low base rate combined to create a moderatelyconservatively biased perceptual environment (Figure 1). In the Costly-miss PayoffCondition we set the cost of a false alarm to −1 point and the cost of a missed detection to−15 points. All other parameters were as in the Baseline Condition. These payoff valuescreated a liberally biased perceptual environment (Figure 1). In the High SimilarityCondition we adjusted the perceptual uncertainty by setting the mean %-scowl of the “lessthreatening” (foil) distribution to the 50%-scowling morph. All other parameters were as inthe Baseline Condition. The high perceptual uncertainty amplified the mild bias establishedby the payoff values to create a conservatively biased perceptual environment (Figure 1).
Stimuli—A stimulus set consisted of 11 faces ranging from a neutral, relaxed face to ascowling face in 10% increments (Figure 1). Faces were created by digitally blending(MorphMan 4, Stoik Imaging) the neutral and scowling end-point faces. Posed, scowlingfaces were used because they elicit “automatic” threat-related physiological and behavioralresponses in a perceiver (Roelofs, Hagenaars, & Stins, 2010). Faces were converted fromcolor to grey scale, placed against a black background, and rescaled to 500 × 625 pixels at96 dpi resolution. Six such sets were created, comprising 3 female and 3 male photographicmodels, all college-aged Caucasians from the MacBrain1 and IASLab2 face sets. Facestimuli were shown for 67 ms then backward-masked with the neutral face of differentmodel. We selected a 67 ms stimulus exposure to attenuate on-line deliberative processingwhile maintaining a supra-liminal visual experience (Szczepanowski & Pessoa, 2007). Themask remained on-screen until the participant’s behavioral response.
ProcedureDuring recruitment, we asked participants to refrain from eating for at least two hours priorto the experiment. During the study orientation, we informed participants that they couldexchange earned points for rewards—small bags of snacks (M&M® candies, potato chips,cocoa-covered almonds, or graham crackers)—at a rate of 700 points per approximately 30g serving. Prior to the threat perception tasks, participants sampled each food item andinformed the experimenter of the item for which they anticipated exchanging their points.Each kind of snack was present in sealed jars on a table in front of the participant for theduration of the study.
During the experiment, participants sat in a comfortable armchair in a sound attenuating,dimly lit room. All visual stimuli were shown on a 40-inch LCD video monitor (SamsungLNT4065F, 1080p resolution) 1.5 m from the armchair. Faces subtended ca. 7.2 horizontaldegrees by 9.5 vertical degrees.
Participants were assigned to one of three affective state inductions (pleasant, unpleasant, orneutral) and one of three test conditions (low base rate, costly-miss payoff, or highsimilarity), in a fully crossed design. Over the course of participating in a larger experiment,participants (1) experienced an affective state induction in their assigned valence condition,(2) performed a “practice” threat perception decision task in the baseline condition, (3)experienced a second “booster” affective state induction in their assigned valence condition,
1Development of the MacBrain Face Stimulus Set was overseen by Nim Tottenham and supported by the John D. and Catherine T.MacArthur Foundation Research Network on Early Experience and Brain Development. Please contact Nim Tottenham [email protected] for more information concerning the stimulus set.2Development of the Interdisciplinary Affective Science Laboratory (IASLab) Face Set was supported by the National Institutes ofHealth Director’s Pioneer Award (DP1OD003312) to Lisa Feldman Barrett. More information is available on-line at www.affective-science.org.
Lynn et al. Page 6
Emotion. Author manuscript; available in PMC 2013 August 01.
$waterm
ark-text$w
atermark-text
$waterm
ark-text

(4) performed the threat perception task in their assigned test condition, and (5) experienceda neutral affect induction (so that they left the laboratory in a more or less neutral affectivestate). Participants then exchanged total accumulated points for the snack(s) of theirchoosing, and were debriefed and dismissed.
At the beginning of the each threat perception task, on-screen instructions informedparticipants of the base rate and payoffs, and showed two exemplars from the centers of thetarget and foil distributions. We directed participants to learn how to best categorize thefaces as “more threatening” or “less threatening” by attending to the points earned and lost,and to earn as many points as possible. Participants categorized the face stimuli by usingtheir index fingers to press one of two keys on the computer keyboard, labeled “(+)” for“more threatening” and “(−)” for “less threatening”. Position of the appropriate responselabels on the “1!” and “+=“ keys was randomized for each participant. On-screen feedbackwas given immediately after each perceptual decision with the text “Yes, that was right.” or“No, that was wrong.”, the points earned or lost for that trial, and total points accrued overthe entire study thus far.
Data AnalysisFor each trial, a computer logged the decision outcome (correct detection, correct rejection,false alarm, missed detection), response time, and points earned. Responses occurring inunder 300 ms from face image on-set were excluded from analysis due to the highprobability of their containing motor errors. From the remaining trials we calculatedsensitivity (d′) and bias (c) (Macmillan & Creelman, 1991) and total points earned.
Additionally, for each condition, we used the SUE model to determine the optimal bias forany given sensitivity value, which we call the Line of Optimal Response (LOR, seeSupplemental Material). The LOR traces the amount of bias that maximizes utility at anygiven sensitivity level for particular environmental base rate and payoff values. Wedetermined each participant’s distance-to-LOR, which we call dO, (distance-sub-Optimal) asshortest Euclidean distance from a point defined as (d′, c) to the LOR. Shorter distance-to-LOR reflects a more optimal bias: At a given level of sensitivity, perceivers whose biasplaces them closer to LOR accrue more utility (where utility can be indexed as, e.g., pointsearned over a series of decisions). Because dO expresses a perceiver’s bias relative to thebias that is optimal in a given environment, it permits a measurement of whether a perceiveris too biased vs. not biased enough in a given environment, taking into account theperceiver’s sensitivity.
We used multiple regression to examine how a perceiver’s affective state (measured asvalence and arousal ratings reported immediately after the “booster” affect induction)influenced threat perception during the subsequent test condition (low base rate, costly-misspayoff, or high similarity). Valence and arousal ratings were grand mean centered for eachtest condition. We dummy-coded the three test conditions to simultaneously compare theinfluence of affective state among the conditions in a single regression. The four dependentvariables, utility (points earned), bias (c), distance-to-LOR (dO), and sensitivity (d′), wereanalyzed separately. The influence of affective state on distance-to-LOR was examinedcontrolling for sensitivity. Significant interaction of multiple regression predictor variables(centered valence and arousal ratings) were further examined with simple slopes analysis(Aiken, West, & Reno, 1991).
ResultsWe predicted that the relationship of affective state with utility would differ across the threeenvironmental test conditions and that this difference would be accompanied associations
Lynn et al. Page 7
Emotion. Author manuscript; available in PMC 2013 August 01.
$waterm
ark-text$w
atermark-text
$waterm
ark-text

between valence and bias, and arousal and sensitivity. These predictions were supported,but, unexpectedly, appeared conditional upon the apparent “difficulty” of adapting ones biasand sensitivity to a given environment.
Maximizing UtilityLow Base Rate Condition—The low base rate condition presented a low frequency oftargets relative to the other conditions. In this condition, a perceiver’s valence and arousalhad separate, additive effects on the utility of threat perception (Figure 2A, Table 2).Perceivers experiencing a pleasant affective state earned significantly fewer points over thecourse of the task than did perceivers experiencing an unpleasant state (p<0.022). Unrelatedto effects of valence, participants experiencing low arousal affective state earnedsignificantly fewer points than did those in a high arousal state (p<0.003). When the baserate of threat was low, it was most effective to feel unpleasant, high arousal.
Costly-miss Payoff Condition—The costly-miss payoff condition presented misseddetections as much more costly than false alarms (relative to the other conditions, in whichfalse alarms were somewhat more costly than missed detections; Table 1). In this condition,valence and arousal interacted to influence the utility of threat perception (Figure 2B, Table2). Points earned differed little for perceivers experiencing an unpleasant affective state.However, among perceivers experiencing pleasant affect, those who also experienced lowarousal earned fewer points than those experiencing high arousal (interaction, p<0.020).Simple slopes analysis found that a pleasant, high arousal affective state was associated withmore points earned than were all other affective states. Perceivers reporting pleasant valence(i.e., 1 SD above the mean valence of participants in the costly-miss payoff condition)showed a significant positive association between arousal and points earned (B=54.9, beta =0.4, t=2.3, p<0.026). The association between valence and points at either 1 SD below orabove mean arousal did not reach significance (B=−29.6, beta=−0.2, t=−1.3, p<0.195 andB=46.0, beta=0.3, t=1.7, p<0.085, respectively). When missing a threat was costly, it wasmost effective to feel pleasant, high arousal.
High Similarity Condition—The high similarity condition presented targets and foils thatwere more perceptually similar to each other compared to the other test conditions. In thiscondition, affect appeared to influence the utility of threat perception in several ways, albeitat marginal significance (Figure 2C, Table 2). Points earned was relatively high for bothunpleasant, low arousal perceivers and pleasant, high arousal perceivers (interaction,p<0.064). Simple slopes analysis revealed a significant association between valence andpoints at 1 SD above mean arousal (B=36.7, beta=0.5, t=2.4, p<0.018). There was nosignificant association between valence and points earned at 1 SD below mean arousal (B=−12.4, beta=−0.2, t=−1.0, p<0.332) but weak associations between points earned and arousalat 1 SD below and above mean valence (B=−30.3, beta=−0.3, t=−1.7, p<0.097 and B=39.6,beta=0.4, t=1.9, p<0.065, respectively). Under high perceptual uncertainty between threatand non-threat, it was effective to feel either pleasant, high arousal or unpleasant, lowarousal.
Summary—The relationships of valence and arousal with utility found to be significant inone environmental condition were not present in the other conditions. This inconsistencymeans that the relationship between how people felt and how they judged potential threatsdiffered depending on the base rate of threats, the cost of missing a threat vs. false alarming,and the perceptual similarity between threat and foil. We found that the strength anddirection of relationships between affective state and perception were conditional upon thelevel and/or causes of risk and uncertainty of the decision-making processes that comprise“perception.” Therefore, to understand why a particular combination of valence and arousal
Lynn et al. Page 8
Emotion. Author manuscript; available in PMC 2013 August 01.
$waterm
ark-text$w
atermark-text
$waterm
ark-text
resulted in high utility in a given environment we must examine the relationships ofaffective state to the perceptual processes that underlie utility: sensitivity and bias.
Calibrating bias to base rate and payoffAs predicted, we found a significant relationship between bias and valence. In the low baserate condition, unpleasant valence was associated with more conservative-going bias (one-tailed p<0.031; Figure 2D, Table 2). When threats were infrequent, pleasant-feelingperceivers were insufficiently conservative, resulting in less optimal bias (distance-to-LOR;p<0.024, Figure 2G, Table 2). However, associations between valence and either measure ofbias were not significant in the other conditions (Table 2).
We attributed the inconsistency of these relationships among conditions to differences in thedifficulty of calibrating bias to base rate and payoffs. Participants in the low base ratecondition achieved lower optimality of bias (higher distance-to-LOR, dO) than didparticipants in the costly-miss payoff condition (Table 3, Supplemental Figure S2). Theinfluence of valence on bias was, thus, only observed in the condition in which anadjustment of bias to either base rate or payoff was necessitated by the environment, andwas also relatively difficult to accomplish: namely, the low base rate condition (the highsimilarity condition did not require an adjustment of bias to changes in base rate or payoff).Sampling artifacts did not explain the inconsistent influence of affective state across theconditions: The mean and variance of valence and arousal among participants in the lowbase rate and costly-miss payoff conditions did not differ, nor did the variance of bias (Table3).
Calibrating bias to sensitivityThe LOR defines an inverse relationship between optimal bias and sensitivity. Thisrelationship suggests that, in a perceiver, declining sensitivity (here, implemented as thetransition from the baseline condition to the high similarity condition) necessitates anincrease in bias (here, more conservative-going in the high similarity condition than in thebaseline condition). We found that in the high similarity condition, optimality of bias(distance-to-LOR) was significantly associated with arousal. Perceivers reporting lowarousal attained shorter distance-to-LOR than others (p<0.014; Figure 2I, Table 2) and moreconservative bias (p<0.022; Figure 2F, Table 2). Associations between arousal and eithermeasure of bias were not significant in the low base rate condition, but were possiblyrepresented in the costly-miss payoff condition as a trend-level interaction on distance-to-LOR (p<0.100; Figure 2H, Table 2). In the costly-miss payoff condition low arousal wasassociated with more optimal bias for participants feeling unpleasant.
We attributed the inconsistency of these relationships among conditions to differences in thedifficulty of calibrating bias to sensitivity. Participants in the costly-miss payoff and highsimilarity conditions exhibited significantly lower sensitivity than those in the low base ratecondition (Table 3, Supplemental Figure S2). The influence of arousal on bias optimalitywas, thus, only observed in conditions which necessitated calibration of bias to challengedsensitivity: namely, the high similarity and costly-miss payoff conditions.
Achieving High SensitivityAs predicted, we found a significant relationship between sensitivity and arousal. In the lowbase rate condition, high sensitivity was associated with high arousal (one-tailed p<0.046;Figure 2J, Table 2). When threats were infrequent, high arousal perceivers were better ableto discriminate threats from non-threats. However, the association between arousal andsensitivity was not significant in the other conditions (Table 2). Instead, in the costly-miss
Lynn et al. Page 9
Emotion. Author manuscript; available in PMC 2013 August 01.
$waterm
ark-text$w
atermark-text
$waterm
ark-text
payoff condition, we found evidence for a possible interaction of arousal and valence onsensitivity (p<0.076; Figure 2K, Table 2)).
We attributed the inconsistency of this relationship among conditions to differences in thedifficulty of achieving high sensitivity. As mentioned above, participants in the low baserate condition exhibited higher sensitivity than did participants in the costly-miss payoff andhigh similarity conditions (Table 3, Supplemental Figure S2). The breakdown of a clearassociation between high arousal and high sensitivity, and possible emergence of aninteraction with valence was, thus, observed in conditions in which high sensitivity wasdifficult to achieve, namely, the costly-miss payoff and high similarity conditions.
DiscussionWe examined the influence of a perceiver’s affective state on perceptual decision-making inthe domain of social threat discrimination. By combining signal detection theory withbehavioral economics, we were able to measure the utility, bias, and sensitivity of threatperception over a series of decisions. We found that the exigencies of the environmentinfluenced the details of how perceivers’ experience of valence and arousal affectedperception. Inconsistencies in the strength and direction of affect—perception relationshipscomplicate conclusions of prior studies that have shown consistent directional associationsbetween affective state and perception. Our findings indicate that the influence of affectivestate on perception is conditional upon (i) the level and/or cause of uncertainty and risk, asinstantiated by the values of the three signal parameters, and (ii) the “difficulty” ofcalibrating one’s perception to that uncertainty and risk.
Specifically, we found that experiencing unpleasant valence promoted calibration of bias tothose environmental parameters that directly influence bias—the base rate of threat and thebenefits and costs accrued for correct vs. incorrect perceptual decisions. However, thisassociation was apparent only in the condition in which the overall bias exhibited byparticipants at the end of the task was relatively suboptimal. We found that experiencing lowarousal promoted calibration of one’s bias to one’s sensitivity (distinct from calibrating biasto base rate or payoff). However, this association was apparent only in conditionsnecessitating calibration of bias to declining sensitivity. We found that experiencing higharousal promoted high sensitivity. However, this association was characterized by mildinteraction with valence in conditions in which high sensitivity was difficult to achieve. Inthese conditions, the experience of arousal failed to influence sensitivity among participantswho felt unpleasant.
The direction of the valence-by-arousal association with sensitivity suggests that theinfluence of arousal can be enabled or attenuated by the local- vs. global-focus processingstyle that prior studies have associated with unpleasant and pleasant valence, respectively. Inthe costly-miss payoff and high similarity conditions, participants experienced difficultyachieving high sensitivity (Supplemental Figure S2). Participants in these conditionsexperiencing unpleasant valence and high arousal failed to show the effect of high arousalon their sensitivity (Figures 2K & L). In prior literature, experiencing unpleasant emotionalstates (e.g., sadness) has been associated with a processing style particularly sensitive to“local” details of a perceptual environment or target stimulus class, at the expense of more“global” task features (reviewed by Schwarz & Clore, 2007). In particular, Avramova, et al.(2010) demonstrated that people in an unpleasant state can be insensitive to thediscriminative perceptual context in which stimuli are evaluated, such as when stimuli are beevaluated relative to one another or in the presence of distractors. We speculate that highsensitivity—the discrimination of targets as a stimulus class distinct from foils—requiresrepresenting what targets look like in the “context” of what foils look like, and that when
Lynn et al. Page 10
Emotion. Author manuscript; available in PMC 2013 August 01.
$waterm
ark-text$w
atermark-text
$waterm
ark-text
high sensitivity is difficult to achieve, unpleasant valence becomes a perceptual impairment.We propose that local focus interferes with the sensitivity-promoting effects of high arousal.
We found no consistent evidence of mood-congruent effects. When judging scowling faces,unpleasant valence might be expected to lead to consistently liberal bias. For example,Baumann & DeSteno (2010) have hypothesized that negative valence may be associatedwith over-estimation of the base rate of threat (see also Mayer & Gaschke, 1988). Ourmodeling indicates that base rate over-estimation should manifest as suboptimally liberalbias (i.e., large and liberal-going distance-to-LOR). We found instead that unpleasantvalence was associated with most more optimal bias (i.e., short distance-to-LOR) in bothliberally and conservatively biased perceptual environments.
We anticipated that sensitivity would be equal in the low base rate and costly-miss payoffconditions because those conditions used identical similarity parameter values. Nonetheless,participants in the costly-miss payoff condition did not attain sensitivity equal to that ofparticipants in the low base rate condition. The finding suggests a lack of independence inhow payoffs and similarity are “estimated” by the brain. As rewards and punishments,payoffs must figure prominently in informing the brain about both the base rate andsimilarity of targets to foils. Having to learn new values for costs and benefits (from baselineto the costly-miss payoff condition) may to have interfered with perceivers’ abilitydistinguish target from foil. Parameters may not be independently represented in the brain,in spite of their theoretical independence (see, e.g., Bohil & Maddox [2001] for adiscussion).
Participants in the low similarity condition were largely unable to adapt their bias to theirlow sensitivity. The LOR indicates that, in environments in which some amount of bias isoptimal, the low utility associated with reduced sensitivity can be somewhat mitigated byadopting a more extreme bias (Supplemental Figure S3). In between-subjects manipulationsof similarity, we have found this relationship to hold (Lynn & Barrett, unpublished data).The failure of that relationship in the current within-subjects manipulation of similarity(from baseline to the high similarity condition) suggests that perceivers have difficultyadapting an established relationship between bias and sensitivity to a decrease in sensitivity.
Though human perceivers do adapt their behavior to changes in the three signal parametersin directions predicted by considerations of utility (e.g. Green & Swets, 1966, p 88; See,Warm, Dember, & Howe, 1997), the degree of optimization achieved can be quite variable(reviewed by Dusoir, 1975; Bohil & Maddox, 2001). In this context, our studies can beviewed as an examination of individual differences in perceiver affective state thatcontribute to variability in the degree of optimality perceivers achieve. We have proposedthat how a person feels (valence and arousal) influences how he or she adapts perceptualdecision-making to the environmental conditions in which the decisions are being made.This suggests that perceivers could optimize their threat perception by either strategicallymanaging how they feel or perhaps by paying particular attention to parameters with whichtheir current affective state may interfere.
Our studies implemented a limited number of environmental conditions. We manipulatedthe three parameters in a single direction only. Therefore, the generalizability of theassociations of valence with bias and of arousal with distance-to-LOR and sensitivity, and ofthe influence of optimization “difficulty,” remains to be determined. For example, we havedescribed two conditions in which the ability of perceivers to make effective (i.e., highutility) perceptual decisions unexpectedly appeared jeopardized: increasing the cost ofmissed detections (which impaired sensitivity) and decreasing similarity (which impairedoptimal bias adjustment). However, this study does not indicate whether these impairments
Lynn et al. Page 11
Emotion. Author manuscript; available in PMC 2013 August 01.
$waterm
ark-text$w
atermark-text
$waterm
ark-text

would also be found for decreasing the cost of missed detections and increasing similarity,respectively. We also found that how a person feels can have conflicting effects onperception depending on the environment, and these conflicts are another potentially fruitfularea for further study. For example, high arousal was associated with high sensitivity, yetlow arousal was associated with better adjustment of bias to sensitivity when sensitivity waspoor. Sensitivity appears to have a stronger influence on utility than does bias in our data(Figure 2), suggesting that, in general, high arousal will serve perceivers better than low.Nonetheless, the interaction of arousal and valence on utility of perception in the highsimilarity condition (Figure 2C) indicates that this generalization may not be true in allenvironments.
Placing signal detection issues in the context of behavioral economics has benefits over theuse of accuracy, or sensitivity and bias, alone. Utility permits determination of how muchbias is optimal. For example, on its own, our finding that, in the low base rate condition,perceivers feeling pleasant valence exhibited less biased behavior than those feelingunpleasant valence means only that pleasant valence was associated with a tendency to labelmoderately scowling faces as “more threatening” while unpleasant affect tended to reservethat response for more intensely scowling faces. Bias alone says nothing about whichbehavioral pattern led to better decision-making. That information is only given by pointsearned over the series of decisions or a measure of bias optimality, such as distance-to-LOR.
Supplementary MaterialRefer to Web version on PubMed Central for supplementary material.
AcknowledgmentsWe thank Hui-Wen Yu for stimulus preparation, and Hui-Wen Yu, Erica Boothby, & Chris Dewey for datacollection and management. Preparation of this manuscript was supported by the National Institutes of HealthDirector’s Pioneer Award (DP1OD003312) and by the U.S. Army Research Institute for the Behavioral and SocialSciences (contract W91WAW-08-C-0018) to Lisa Feldman Barrett. The views, opinions, and/or findings containedin this article are solely those of the authors and should not be construed as an official Department of the Army orDOD position, policy, or decision. Thanks also go to Michael Mendes and the Emerald Nut Company for donatingcocoa-covered almonds that were used as incentives in these experiments. This manuscript was improved bycomments from and conversations with Eric Anderson, Erica Boothby, Kristen Lindquist, Karen Quigley, and ErikaSiegel.
ReferencesAiken, L.; West, S.; Reno, R. Multiple regression: Testing and interpreting interactions. Thousand
Oaks: Sage Publications, Inc; 1991.
Anderson E, Siegel E, White D, Barrett LF. Out of sight but not out of mind: Affective realism innormal visual consciousness. Emotion. (In press).
Anderson E, Siegel EH, Barrett LF. What you feel influences what you see: The role of affectivefeelings in resolving binocular rivalry. Journal of Experimental Social Psychology. 2011; 47:856–860. [PubMed: 21789027]
Avramova YR, Stapel DA, Lerouge D. Mood and context-dependence: Positive mood increases andnegative mood decreases the effects of context on perception. Journal of Personality and SocialPsychology. 2010; 99:203–214. [PubMed: 20658839]
Barrett LF, Kensinger EA. Context is routinely encoded during emotion perception. PsychologicalScience. 2010; 21:595–599. [PubMed: 20424107]
Barrett LF, Mesquita B, Gendron M. Context in emotion perception. Current Directions inPsychological Science. 2011; 20:286–290.
Baumann J, DeSteno D. Emotion guided threat detection: Expecting guns where there are none.Journal of Personality and Social Psychology. 2010; 99:595–610. [PubMed: 20731499]
Lynn et al. Page 12
Emotion. Author manuscript; available in PMC 2013 August 01.
$waterm
ark-text$w
atermark-text
$waterm
ark-text

Bocanegra BR, Zeelenberg R. Emotion improves and impairs early vision. Psychological Science.2009; 20:707–713. [PubMed: 19422624]
Bohil C, Maddox W. Category discriminability, base-rate, and payoff effects in perceptualcategorization. Attention, Perception, & Psychophysics. 2001; 63:361–376.
Bouhuys AL, Bloem GM, Groothuis TGG. Induction of depressed and elated mood by musicinfluences the perception of facial emotional expressions in healthy subjects. Journal of AffectiveDisorders. 1995; 33:215–226. [PubMed: 7790675]
Bower, GH. Mood congruity of social judgments. In: Forgas, JP., editor. Emotion and socialjudgments. Oxford: Pergamon Press; 1991. p. 31-53.
Commons, ML.; Nevin, JA.; Davison, MC., editors. Signal detection: Mechanisms, models, andapplications. Hillsdale, NJ: Lawrence Earlbaum Associates; 1991.
Dusoir A. Treatments of bias in detection and recognition models: A review. Perception &Psychophysics. 1975; 17:167–178.
Forgas JP. Mood and judgment: The affect infusion model (AIM). Psychological Bulletin. 1995;117:39–66. [PubMed: 7870863]
Gendron M, Lindquist K, Barsalou L, Barrett LF. Emotion words shape emotion percepts. Emotion.(In press).
Gendron, M.; Mesquita, B.; Barrett, LF. Emotion perception. In: Reisberg, D., editor. Oxfordhandbook of cognitive psychology. New York: Oxford University Press; (In press)
Green, DM.; Swets, JA. Signal detection theory and psychophysics. New York: Wiley; 1966.
Huntsinger JR, Clore GL, Bar-Anan Y. Mood and global-local focus: Priming a local focus reversesthe link between mood and global-local processing. Emotion. 2010; 10:722–726. [PubMed:21038956]
Lang, PJ.; Bradley, MM.; Cuthbert, BN. Technical report A-6. Gainesville, FL: University of Florida;2005. International affective picture system (IAPS): Affective ratings of pictures and instructionmanual.
Lindquist KA, Barrett LF, Bliss-Moreau E, Russell JA. Language and the perception of emotion.Emotion. 2006; 6:125–138. [PubMed: 16637756]
Lynn SK. Learning to avoid aposematic prey. Animal Behaviour. 2005; 70:1221–1226.
Lynn SK. Cognition and evolution: Learning and the evolution of sex traits. Current Biology. 2006;16:R421–R423. [PubMed: 16753557]
Lynn, SK. Decision-making and learning: The peak shift behavioral response. In: Breed, M.; Moore,J., editors. Encyclopedia of animal behavior. Vol. 1. Oxford: Academic Press; 2010. p. 470-475.
Macmillan, NA.; Creelman, CD. Detection theory: A user’s guide. New York: Cambridge UniversityPress; 1991.
Matthews G, Davies DR. Individual differences in energetic arousal and sustained attention: A dual-task study. Personality and Individual Differences. 2001; 31:575–589.
Mayer JD, Gaschke YN. The experience and meta-experience of mood. Journal of Personality andSocial Psychology. 1988; 55:102–111. [PubMed: 3418484]
Park J, Banaji MR. Mood and heuristics: The influence of happy and sad states on sensitivity and biasin stereotyping. Journal of Personality and Social Psychology. 2000; 78:1005–1023. [PubMed:10870905]
Phelps EA, Ling S, Carrasco M. Emotion facilitates perception and potentiates the perceptual benefitsof attention. Psychological Science. 2006; 17:292–299. [PubMed: 16623685]
Roelofs K, Hagenaars MA, Stins J. Facing freeze: Social threat induces bodily freeze in humans.Psychological Science. 2010; 21:1575–1581. [PubMed: 20876881]
Schmitz TW, De Rosa E, Anderson AK. Opposing influences of affective state valence on visualcortical encoding. Journal of Neuroscience. 2009; 29:7199–7207. [PubMed: 19494142]
Schwarz, N. Feelings as information: Informational and motivational functions of affective states. In:Higgins, ET.; Sorrentino, RM., editors. The handbook of motivation and cognition. Vol. 2. NewYork: Guilford Press; 1990. p. 527-561.
Lynn et al. Page 13
Emotion. Author manuscript; available in PMC 2013 August 01.
$waterm
ark-text$w
atermark-text
$waterm
ark-text

Schwarz, N.; Clore, GL. Feelings and phenomenal experiences. In: Kruglanski, A.; Higgins, ET.,editors. Social psychology: Handbook of basic principles. 2. New York: Guilford Press; 2007. p.385-407.
See JE, Warm JS, Dember WN, Howe SR. Vigilance and signal detection theory: An empiricalevaluation of five measures of response bias. Human Factors: The Journal of the Human Factorsand Ergonomics Society. 1997; 39:14–29.
Stefanucci JK, Proffitt DR. The roles of altitude and fear in the perception of height. Journal of Vision.2006; 6:723.
Stefanucci JK, Proffitt DR, Clore GL, Parekh N. Skating down a steeper slope: Fear influences theperception of geographical slant. Perception. 2008; 37:321–323. [PubMed: 18414594]
Stroessner SJ, Hamilton DL, Mackie DM. Affect and stereotyping: The effect of induced mood ondistinctiveness-based illusory correlations. Journal of Personality and Social Psychology. 1992;62:564–576. [PubMed: 1583585]
Szczepanowski R, Pessoa L. Fear perception: Can objective and subjective awareness measures bedissociated? Journal of Vision. 2007; 7:1–17.
van Steenbergen H, Band GP, Hommel B. In the mood for adaptation: How affect regulates conflict-driven control. Psychological Science. 2010; 21:1629–1634. [PubMed: 20943936]
Lynn et al. Page 14
Emotion. Author manuscript; available in PMC 2013 August 01.
$waterm
ark-text$w
atermark-text
$waterm
ark-text
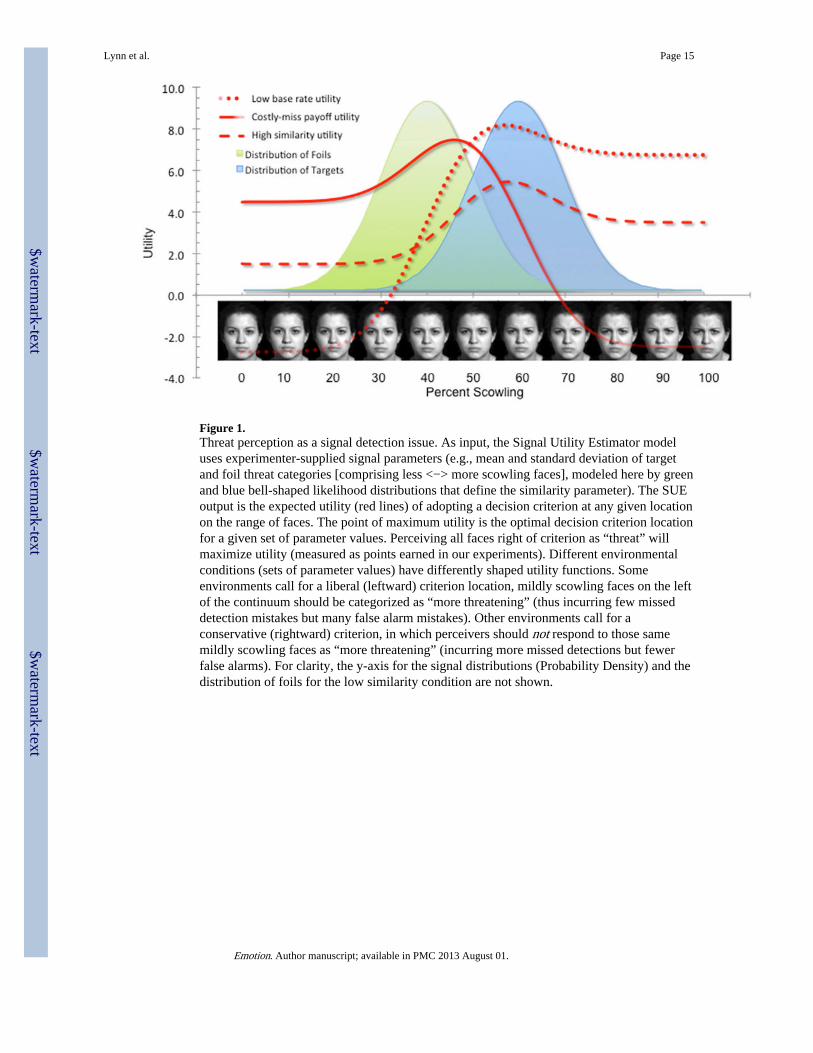
Figure 1.Threat perception as a signal detection issue. As input, the Signal Utility Estimator modeluses experimenter-supplied signal parameters (e.g., mean and standard deviation of targetand foil threat categories [comprising less <−> more scowling faces], modeled here by greenand blue bell-shaped likelihood distributions that define the similarity parameter). The SUEoutput is the expected utility (red lines) of adopting a decision criterion at any given locationon the range of faces. The point of maximum utility is the optimal decision criterion locationfor a given set of parameter values. Perceiving all faces right of criterion as “threat” willmaximize utility (measured as points earned in our experiments). Different environmentalconditions (sets of parameter values) have differently shaped utility functions. Someenvironments call for a liberal (leftward) criterion location, mildly scowling faces on the leftof the continuum should be categorized as “more threatening” (thus incurring few misseddetection mistakes but many false alarm mistakes). Other environments call for aconservative (rightward) criterion, in which perceivers should not respond to those samemildly scowling faces as “more threatening” (incurring more missed detections but fewerfalse alarms). For clarity, the y-axis for the signal distributions (Probability Density) and thedistribution of foils for the low similarity condition are not shown.
Lynn et al. Page 15
Emotion. Author manuscript; available in PMC 2013 August 01.
$waterm
ark-text$w
atermark-text
$waterm
ark-text

Figure 2.Simple slopes resulting from multiple regression of valence and arousal on four dependentvariables (utility [points earned], sensitivity [d′], bias [c], and distance-to-LOR [dO]) in eachof three conditions (low base rate, costly-miss payoff, and high similarity). Valence andarousal ratings were grand mean centered for each condition prior to regression. The simpleslopes for mean, mean + 1 SD, and mean − 1 SD of arousal (moderate, high and low arousal,respectively) are plotted against mean, mean + 1 SD, and mean − 1 SD valence (neutral,pleasant, and unpleasant valence, respectively).
Lynn et al. Page 16
Emotion. Author manuscript; available in PMC 2013 August 01.
$waterm
ark-text$w
atermark-text
$waterm
ark-text

$waterm
ark-text$w
atermark-text
$waterm
ark-text
Lynn et al. Page 17
Tabl
e 1
Sign
al p
aram
eter
val
ues
defi
ning
fou
r pe
rcep
tual
env
iron
men
t con
ditio
ns. T
he lo
w b
ase
rate
con
ditio
n im
plem
ente
d a
low
er b
ase
rate
of
occu
rren
ce o
f“m
ore
thre
aten
ing”
fac
es th
an o
ther
con
ditio
ns. T
he c
ostly
-mis
s pa
yoff
con
ditio
n im
plem
ente
d gr
eate
r lo
ss o
f po
ints
for
mis
sed
dete
ctio
ns a
nd le
ss lo
ss o
fpo
ints
for
fal
se a
larm
s ot
her
cond
ition
s. T
he h
igh
sim
ilari
ty c
ondi
tion
impl
emen
ted
mor
e si
mila
r m
eans
of
the
“mor
e” a
nd “
less
” th
reat
enin
g si
gnal
dist
ribu
tions
than
oth
er c
ondi
tions
. Pay
offs
are
in u
nits
of
poin
ts. S
imila
rity
mea
n an
d SD
are
in u
nits
of
perc
ent-
scow
ling.
Con
diti
on n
ame
Bas
e ra
teP
ayof
fsSi
mila
rity
Cor
rect
det
ecti
onC
orre
ct r
ejec
tion
Fal
se a
larm
Mis
sed
dete
ctio
n
Tar
gets
Foi
ls
Mea
nSD
Mea
nSD
Bas
elin
e0.
5010
10−
7−
360
%10
%40
%10
%
Low
bas
e ra
te0.
2510
10−
7−
360
%10
%40
%10
%
Cos
tly-m
iss
payo
ff0.
5010
10−
1−
1560
%10
%40
%10
%
Hig
h si
mila
rity
0.50
1010
−7
−3
60%
10%
50%
10%
Emotion. Author manuscript; available in PMC 2013 August 01.

$waterm
ark-text$w
atermark-text
$waterm
ark-text
Lynn et al. Page 18
Tabl
e 2
Res
ults
of
a si
ngle
(si
mul
tane
ous)
mul
tiple
reg
ress
ion
test
of
the
effe
ct o
f pe
rcei
vers
’ va
lenc
e an
d ar
ousa
l on
perc
eptio
n of
sco
wlin
g fa
ces
acro
ss th
ree
perc
eptu
al e
nvir
onm
ent c
ondi
tions
. Dis
tanc
e-to
-LO
R w
as c
ontr
olle
d fo
r se
nsiti
vity
. P-v
alue
s fo
r th
e in
flue
nce
of v
alen
ce o
n bi
as a
nd f
or a
rous
al o
nse
nsiti
vity
are
one
-tai
led,
bas
ed o
n di
rect
iona
l a p
rior
i pre
dict
ions
. All
othe
r p-
valu
es, i
nclu
ding
inte
ract
ions
, are
two-
taile
d.
Uti
lity
(poi
nts)
Bia
s (c
)D
ista
nce-
to-L
OR
(d O
)Se
nsit
ivit
y (d′)
Bβ
tp
Bβ
tp
Bβ
tp
Bβ
tp
Low
bas
e ra
te (
n=75
)
Inte
rcep
t90
0.89
0.66
29.7
4<
0.00
10.
450.
489.
63<
0.00
11.
200.
9423
.26
<0.
001
0.87
0.64
16.4
9<
0.00
1
Val
ence
−36
.39
−0.
05−
2.32
0.02
2−
0.05
−0.
10−
1.88
0.03
10.
040.
062.
270.
024
−0.
02−
0.03
−0.
740.
458
Aro
usal
46.0
70.
073.
030.
003
0.01
0.03
0.55
0.58
5−
0.02
−0.
03−
0.92
0.36
10.
050.
071.
690.
041
Inte
ract
ion
−0.
120.
00−
0.02
0.98
60.
000.
010.
100.
923
0.00
0.00
0.02
0.98
60.
00−
0.01
−0.
230.
816
Cos
tly-m
iss
payo
ff (
n=67
)
Inte
rcep
t75
7.75
0.53
23.1
9<
0.00
1−
0.52
−0.
53−
10.4
3<
0.00
10.
820.
6116
.99
<0.
001
0.72
0.50
12.5
7<
0.00
1
Val
ence
8.18
0.01
0.49
0.62
70.
000.
00−
0.04
0.48
3−
0.01
−0.
01−
0.39
0.69
80.
020.
020.
610.
545
Aro
usal
17.5
60.
021.
070.
287
0.02
0.05
0.88
0.37
80.
010.
010.
470.
642
0.03
0.04
1.03
0.10
3
Inte
ract
ion
−18
.80
−0.
05−
2.35
0.02
00.
020.
081.
570.
119
0.02
0.05
1.65
0.10
0−
0.03
−0.
07−
1.78
0.07
6
Hig
h si
mila
rity
(n=
73)
Inte
rcep
t62
4.95
0.46
19.2
8<
0.00
1−
0.10
−0.
11−
1.99
0.04
80.
790.
6119
.60
<0.
001
0.40
0.29
7.15
<0.
001
Val
ence
12.1
80.
020.
900.
368
0.02
0.06
1.10
0.13
6−
0.02
−0.
05−
1.61
0.10
90.
020.
041.
020.
311
Aro
usal
4.67
0.01
0.24
0.80
7−
0.07
−0.
12−
2.31
0.02
20.
050.
072.
470.
014
0.02
0.03
0.60
0.22
5
Inte
ract
ion
−14
.17
−0.
05−
1.86
0.06
40.
010.
020.
420.
676
0.00
0.00
0.13
0.90
1−
0.02
−0.
06−
1.38
0.17
0
Sens
itivi
ty (
cont
rolle
d fo
r in
Dis
tanc
e-to
-L
OR
reg
ress
ion)
−0.
461
−0.
496
−10
.309
<0.
001
Emotion. Author manuscript; available in PMC 2013 August 01.

$waterm
ark-text$w
atermark-text
$waterm
ark-text
Lynn et al. Page 19
Table 3
Comparison of mean and variance of valence, arousal, points earned, bias, distance-to-LOR, and sensitivityamong the three perceptual environment test conditions. For each variable, results of the omnibus test acrossthe three conditions are followed by results of paired comparisons. Conditions: Base rate denotes the low baserate condition, Payoff denotes the costly-miss payoff condition, and Similarity denotes the high similaritycondition.
Variable Equality of Mean (ANOVA) Equality of Variance (Levene’s Test)
F p F p
Valence 0.5 0.629 3.6 0.029
Base rate vs. Payoff 0.973 0.9 0.935
Base rate vs. Similarity 0.409 5.4 0.022
Payoff vs. Similarity 0.403 4.9 0.028
Arousal 2.6 0.072 1.7 0.178
Base rate vs. Payoff 0.603 0.001 0.928
Base rate vs. Similarity 0.027 2.6 0.107
Payoff vs. Similarity 0.102 2.8 0.097
Utility 24.2 <0.001 8.6 <0.001
Base rate vs. Payoff <0.001 1.0 0.309
Base rate vs. Similarity <0.001 16.8 <0.001
Payoff vs. Similarity 0.003 9.6 0.002
Bias 103.9 <0.001 0.191 0.900
Base rate vs. Payoff <0.001 0.2 0.723
Base rate vs. Similarity <0.001 0.09 0.767
Payoff vs. Similarity <0.001 0.3 0.555
Distance-to-LORa 39.1 <0.001 0.8 0.469
Base rate vs. Payoff <0.001 0.2 0.619
Base rate vs. Similarity <0.001 0.6 0.454
Payoff vs. Similarity 0.028 1.3 0.259
Sensitivity 23.3 <0.001 10.8 <0.001
Base rate vs. Payoff 0.015 0.09 0.771
Base rate vs. Similarity <0.001 19.9 <0.001
Payoff vs. Similarity <0.001 17.3 <0.001
aMean distance-to-LOR was compared with ANCOVA using sensitivity as a covariate. Residuals from the correlation between distance-to-LOR
and sensitivity were submitted to Levene’s test.
Emotion. Author manuscript; available in PMC 2013 August 01.