Trial Indication(s) Protocol Number Protocol Title Clinical Trial Phase
JOURNAL 0[ GEOCHEMICAL EXPLORATION
ELSEVIER Journal of Geochemical Exploration 58 (1997) 269-281
Regional patterns of heavy metals I Co, Cr, Cu, Fe, Ni, Pb, V and Zn) and sulphur in terrestrial moss samples as indication of
airborne pollution in a 188,000 km 2 area in northern Finland, Norway and Russia
Matti *yriis a,*, Heikki Niskavaara a, Igor Bogatyrev b, Viktor Chekushin c Vladimir Pavlov c, Patrice de Caritat d, Jo H, Halleraker d, Tot Erik Finne d',
Galina Kashulina d,e, Clemens Reimann e ~' Geological Surcey of Finland. P.O. Box 77, FIN-96101 Rovaniemi, Finland
6 Kola Geologic,al h~jbrmation l~lboratot3" Centre, Fersman st. 26. 184200 ApaliO', Russia c Central Kola Expedition, Fersman st. 20. 184200 Apatity, Russia
d Geological Surt'ey (?fNorway, P.O. Box 3006. Lade. N-7002 Trondheim. Norway Kola Science Centre, Institute of North Industrial Ecolog3 Problems. Fersman St. 14. 184200 ApatiU, Russia
Received 1 October 1996: accepted I November 1996
Abstract
The geological surveys of Finland and Norway and the Central Kola Expedition in Russia are carrying out a geochemical mapping project in a 188,000 km 2 area north of the Arctic Circle. Several sample media (terrestrial moss, organic topsoil (0-3 cm), topsoil (0-5 cm), complete podzol profiles) were collected throughout the area during the summer of 1995 at an average density of one sample station per 300 km 2.
Colour surface maps of the major airborne pollutants (Ni, Cu, Co and S) from the Russian nickel mining and smelting industry in this area, as recorded by ICP-MS and ICP-AES analysis of terrestrial mosses, clearly show the industrial sites and the areal extent of the pollution. The contrast between background and polluted sites is very large for Ni, Cu and Co, but not for S. Pollution follows the main wind and topographical directions in the area, and gradients towards the west are rather steep.
Maps for some additional elements (Fe, Cr, Pb, V, Zn) show the influence of other sources than just airborne pollution on the composition of the mosses. Zn is an example of an element whose local variation is so high that no reliable regional maps can be constructed using the moss technique. A hitherto unknown, large V anomaly was detected in the surroundings of Murmansk.
K~ vu'ords: Terrestrial moss: Pollution- Hear 5, metal: Regional mapping: Kola peninsula: Regional distribution pattern
1. I n t r o d u c t i o n
Corresponding author. Fax: +358 205-5014: E-mail: Carpet - forming terrestrial mosses ( H y l o c o m i u m
[email protected] s p l e n d e n s and P l e u r o z i u m s c h r e b e r i ) are widely used
0375-6742/97/$17.00 © 1997 Elsevier Science B.V. All rights reserved. PII S0375-6742(96)00077 5
270 M. A'yriis et al. / Journal of Geochemical Exploration 58 (1997) 269-281
to determine and monitor airborne heavy-metal pol- lution. The technique as such was developed in the late 1960's (Riihling and Tyler, 1968; Tyler, 1970) to survey the atmospheric heavy-metal pollution of large areas. A monitoring programme using moss analysis started in Scandinavia in 1985 and is now
carried out at five-year intervals (1990, 1995) (RiJhling, 1994). The 1995 survey will cover most of northern Europe, and the results reported here will become part of this. Other studies using the moss technique include those of Niskavaara and Lehmus- pelto (1992) and M~ikinen (1994a,b).
.%
" /" ( s~O V'-*)
/~" ,; . , I \
\ i
/ Ival°C~.~
0 50 100 km
[urmansk
\ \ ? (
~r.• \ I k
-'t ?. /
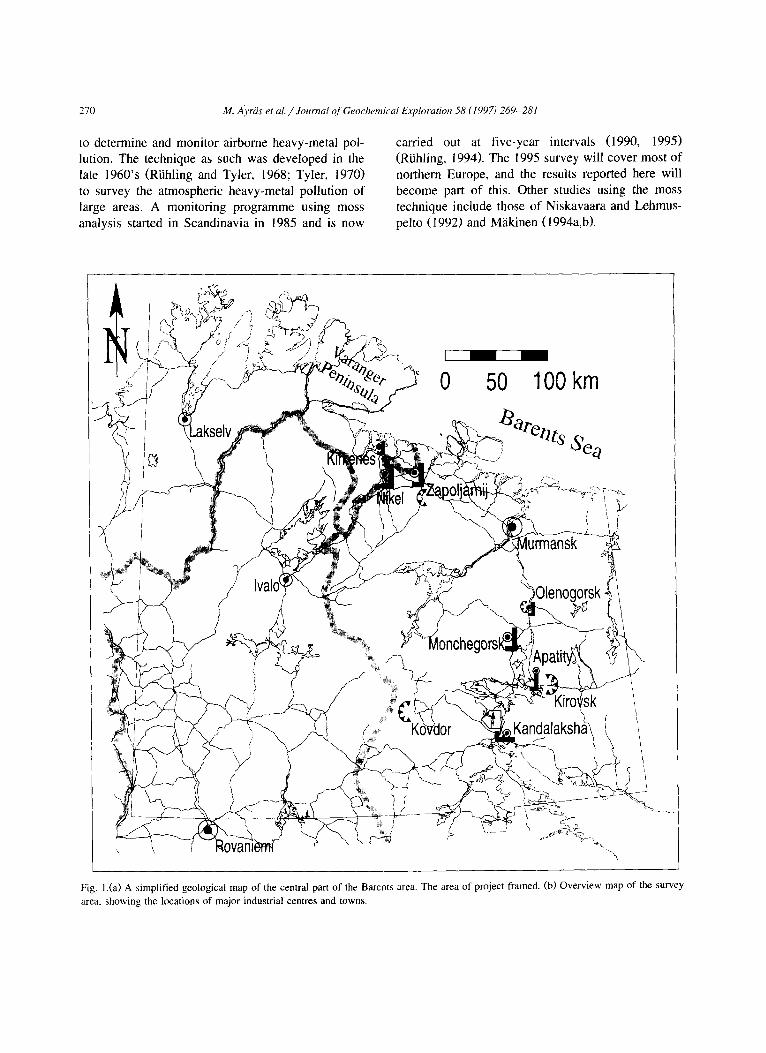
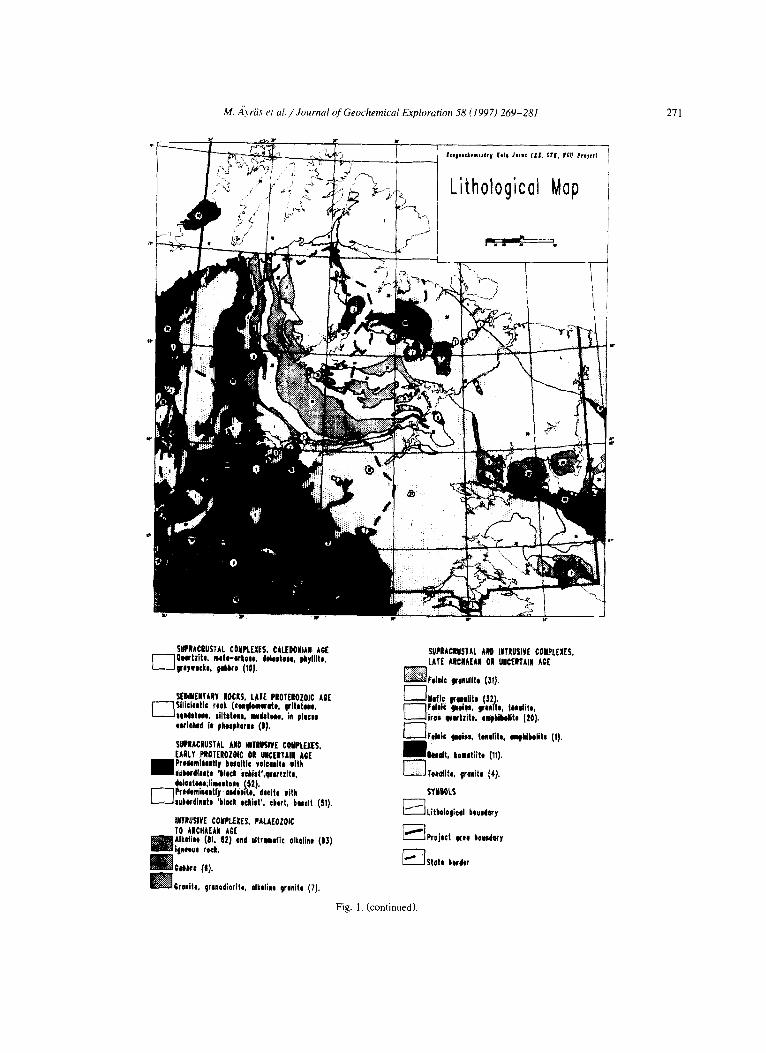
Fig. 1.(a) A simplified geological map of the central part of the Barents area. The area of project framed. (b) Overview map of the survey
area. showing the locations of major industrial centres and towns.
M. A'vr~is etal./Journal of Geochemical Exploration 58 (1997) 269-281 271
$i~RACRUSTAL COMPLEXES, CALEDONIAN AGE ~] ONrtzYto mote-erkooo deleoteno pkylllto groyoocko gabbro (lOJ.
SEDIMENTARY ROCKS LATE PROTE~Z01C AGE ~-~- ~Siliclooti¢ rock (cen|knNfeto sritoteoo
Joodatwo ointllooo mdotMo in plocoo onrlei~ad in phoopkoruo ( l )
$UPRAGIIUSTAI AND INTJlUSIV[ COMPLEXES EARLY PROTEROZOIC OR UNCERTAIN AGE
dolootono,llmootont (52) j - - ~tdomiHatly oudoofLo docile with
|oubordineto block ochigt chore bnoall ($1)
INTRUSIVE COilPLE)CES, PALAEOZOIC TO AIICHAEAN AGE
I AIklli|e (111. 82) god ultromefic alkoline (83) igneeue rgck,
E G r o n i t e , 9renodJorito, olkolino 9ronito (7).
SUPRACRUSIAL AMD INTRUSIVE COMPLEXES. LATE ARCNAEAN OR UNCERTAIN ACE
~ ' e l i i c grenullte (311.
~ l o f l c FNIIlito (.12), ~ F e l o i c gleieo, foil[It, tooolite, t . liroII quartzite, mlhibelito (20).
~ r e l o i c ~. i , , , tonalit, m0pkibe,ilo (I)
i 0 a a l t kometilt, (11), ~ Teod|te, grosltw (4).
SYMBOLS
I'~'-'---] L i t k ol4) |ic el boundary
J~---~Projoct woe boimdory
~--~Stato herder
Fig. 1. (continued).
272 M. ii,'vriis et al. / Journal ~/ Geochemical L ~ploration 58 (1997) 269-281
The geological surveys of Finland (GTK) and Norway (NGU) and the Central Kola Expedition (CKE) in Russia are carrying out a major geochemi- cal mapping project (see World Wide Web site ht tp: / /www.ngu.no/Kola) in a 188,000 km 2 area north of the Arctic Circle, comprising the entire area between 24 ° and 35.5°E to the north of the Barents Sea (Fig. 1). The project started in 1992, mapping a 12,000 km 2 subarea around the nickel smelter at Nikel (Chekushin et al., 1993; Reimann et al., 1995b, 1996a; Ayr~is et al., 1996: Niskavaara et al., 1996), continued in 1994 studying eight small catchments throughout the survey area (Reimann et al., 1995a, 1996b; ,~yr~is et al., 1995; Caritat et al., 1996a,b), and field work ended in the summer and autumn of 1995 when terrestrial moss, topsoil 0-5 cm, humus 0-3 cm and complete podzol profiles (5 horizons) were sampled throughout the survey area at an aver- age density of one sample station per 300 km 2.
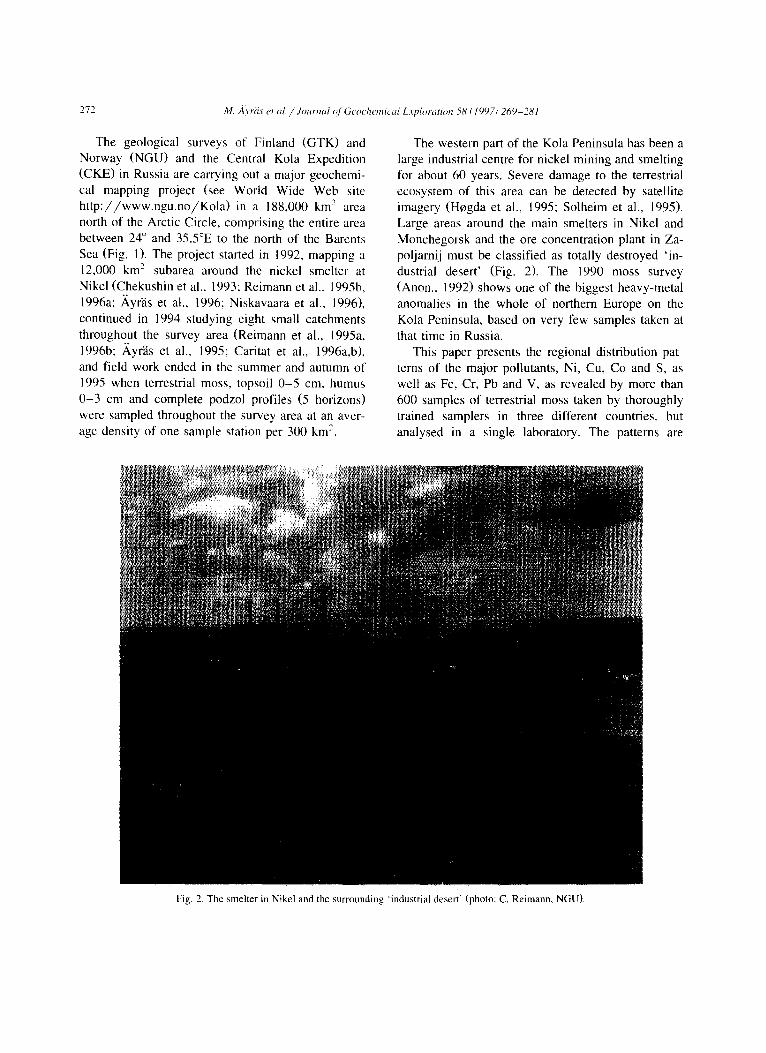
The western part of the Kola Peninsula has been a large industrial centre for nickel mining and smelting for about 60 years. Severe damage to the terrestrial ecosystem of this area can be detected by satellite imagery (H0gda et al., 1995; Solheim et al., 1995). Large areas around the main smelters in Nikel and Monchegorsk and the ore concentration plant in Za- poljarnij must be classified as totally destroyed 'in- dustrial desert' (Fig. 2). The 1990 moss survey (Anon., 1992) shows one of the biggest heavy-metal anomalies in the whole of northern Europe on the Kola Peninsula, based on very few samples taken at that time in Russia.
This paper presents the regional distribution pat- terns of the major pollutants, Ni, Cu, Co and S, as well as Fe, Cr, Pb and V, as revealed by more than 600 samples of terrestrial moss taken by thoroughly trained samplers in three different countries, but analysed in a single laboratory. The patterns are
Fig. 2. The smelter in Nikel and the surrounding 'industrial desert' (photo: C. Reimann, NGU).
M. A'yriis et al. / Journal of Geochemical Exploration 58 (1997) 269-281 273
d~sc:ussed, sources of element input identified and the levels recorded here are compared with those found in earlier studies in northern Europe.
2. M a t e r i a l a n d m e t h o d s
2.1. Sampling
through a 1-mm titanium sieve. Details on the sam- ple preparation techniques are given in Niskavaara (1995).
All moss samples were digested in a microwave oven in concentrated HNO 3 prior to analysis using the I C P - M S and I C P - A E S techniques (Niskavaara, 1995). A duplicate analysis was performed for every 10th sample and international reference samples were
No statistical grid was used for selecting the sample sites. All sample locations were pre-planned making the best use of existing knowledge (earlier moss studies, geology, vegetation maps, soil maps, regional geochemical maps). The average sample density is one sample per 300 km 2, but it was considerably increased (to about one per 100 km 2) in areas where a steep gradient in the deposition of heavy metals could be expected, and decreased (to about one per 600 km 2) in remote background areas. The main sample medium was the moss species Hvlocomium splendens, which is easily recognizable in the field and grows in annual shoots. Only shoots from the last three years were collected. Samples were clean picked in the field. Pleurozium schreberi was collected where no Hylocomium splendens could be found. Both species were sometimes collected to be able to directly compare the results. In the most polluted areas around Monchegorsk, Nikei and Za- poljamij, no mosses could be collected as they are very vulnerable to heavy-metal poisoning, this being one of the shortcomings of the moss technique. At every. 15th location, a duplicate moss sample was taken for quality control purposes. All samples were collected in pre-numbered, plastic-lined paper sam- pie bags which were checked for contamination be- fore use. More details on sampling are given in A)r'as and Reimann (1995).
2.2. Analysis
All the moss samples from Finland and Russia were sent to the GTK laboratory in Rovaniemi for sample preparation. They were dried there at room temperature to avoid losses of mercury in their origi- nal bags. The Norwegian moss samples were dried at 40"C in the NGU laboratory in Trondheim before being sent to Rovaniemi. The samples were milled in a centrifugal mill with titanium blades, to pass
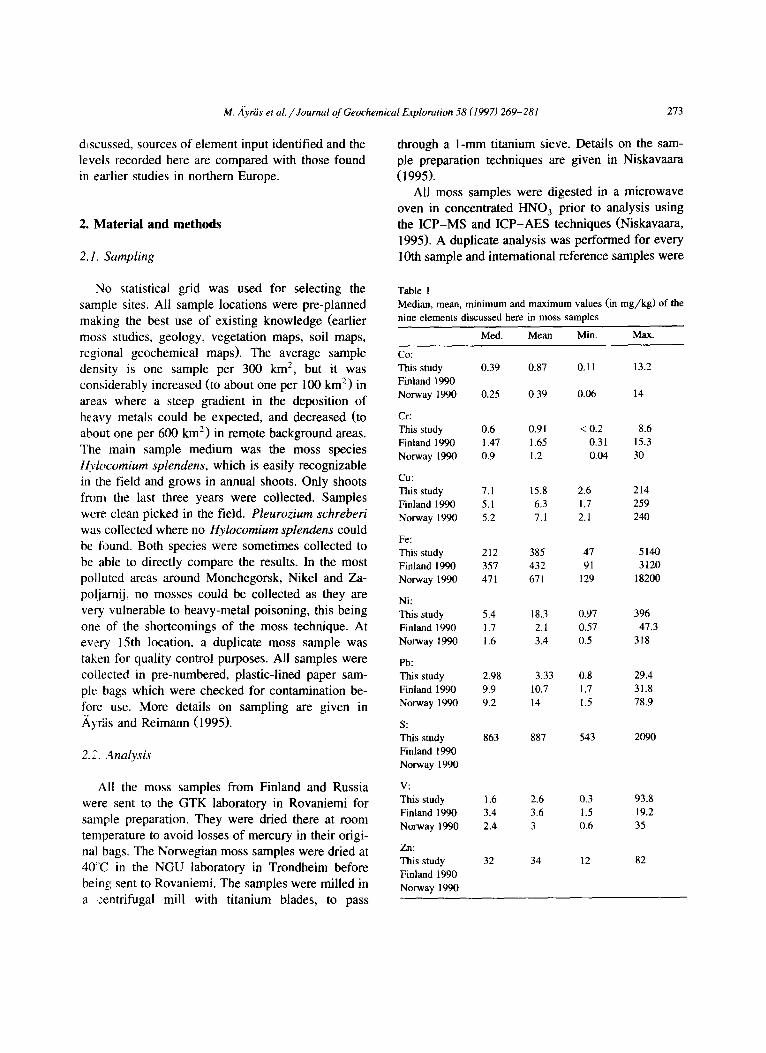
Table 1 Median, mean, minimum and maximum values (in mg/kg) of the nine elements discussed here in moss samples
Med. Mean Min. Max.
Co: This study 0.39 0.87 0,11 13.2 Finland 1990 Norway 1990 0.25 0.39 0.06 14
Cr: This study 0.6 0.91 < 0.2 8.6 Finland 1990 1.47 1.65 0.31 15.3 Norway 1990 0.9 1.2 0.04 30
Cu: This study 7.1 15.8 2.6 214 Finland 1990 5.1 6.3 1.7 259 Norway 1990 5.2 7.1 2.1 240
Fe: This study 212 385 47 5140 Finland 1990 357 432 91 3120 Norway 1990 471 671 129 18200
Ni: This study 5.4 18.3 0.97 396 Finland 1990 1.7 2.1 0.57 47.3 Norway 1990 1.6 3.4 0.5 318
Pb: This study 2.98 3.33 0.8 29.4 Finland 1990 9.9 10.7 1.7 31.8 Norway 1990 9.2 14 1.5 78.9
S: This study 863 887 543 2090 Finland 1990 Norway 1990
V: This study 1.6 2.6 0.3 93.8 Finland 1990 3.4 3.6 1.5 19.2 Norway 1990 2.4 3 0.6 35
Zn: This study 32 34 12 82 Finland 1990 Norway 1990
274 M. ,4vriis et al. / Journal o/' Geochemical Exploration 58 (1997) 269 281
99.9-[ - - ~ +- ~ 7 7 - : ~ :
--i!- 9 0 t : ::
50: ! ' 25 . . . . .
E E 8 10- 8
2- : :
+ ,
0.1 ' , i . . . . . , i , +, 0.1 1 10 100
C 0 mg/kg Cr
99.9-
98-
90-
75-
50-
25-
10.
2.
0.1 0.1
!! !!! !ii 8 g- o~
, , r , , i i i i ~ , i
1 10 100 mg/kg C u
99.9- - , . . . . - ~ : - , ~ - ~ ,
= , . . . . . .
90 • : : : '
50- ;
25- 10-
2- : :
0.1- 1 10 100 1000
mg/kg
8" 75- c :
50-
u_ 25- ~ 10-
~-e
99.9-] : + ~ 99.9-
98 _ _ [ i . , i ; - : - - ~ 9 8 -
÷ ,
0.1 'b , i 10 iC, O
~ 75-
¢ i+ • : ' ~ - : i • -:-: u _ 25- . . . . . [ . . . . -: ~ 10-
: : ' : 2"
, , il i , ; i 0.1 1000 10O00 0.1
rng/kg Ni
9 9 . 9 - + ,
= , , . + ,
50 -
u_ 25
10-
2-
+ , ~ ,
, i t , i i ~ i i l i t , i 0 . 1
lo ioo IOOO 0.~ mg/kg P b
. . . . + ; i
: , : '~ : ( f i i
.. • ,. .... ~. ~ : . :
- : - - ? -T t - _ . . . . .
I =
. . . . [
i 10 100 mg/kg
98-
90-
75-
50-
,t- 25- E o = 10-
99.9 . . . . . . . . . . . . . . ~ - i
. . . . . . . i _ i~. _+_i_ S"
S
2-
0.1 100
• i
+
, , - - , ,
100 0 10000 mg/kg
99.9 . . . . . , . . . . . . . . . . , , ~.+
90- ~ 75- ~ -
~- 2s- Y- 2s- =E lO- ~ lO
2" 2 , +~
0.1 ~* , , , , t . . . . . . 0.1 -, 0.1 1 10 100 10
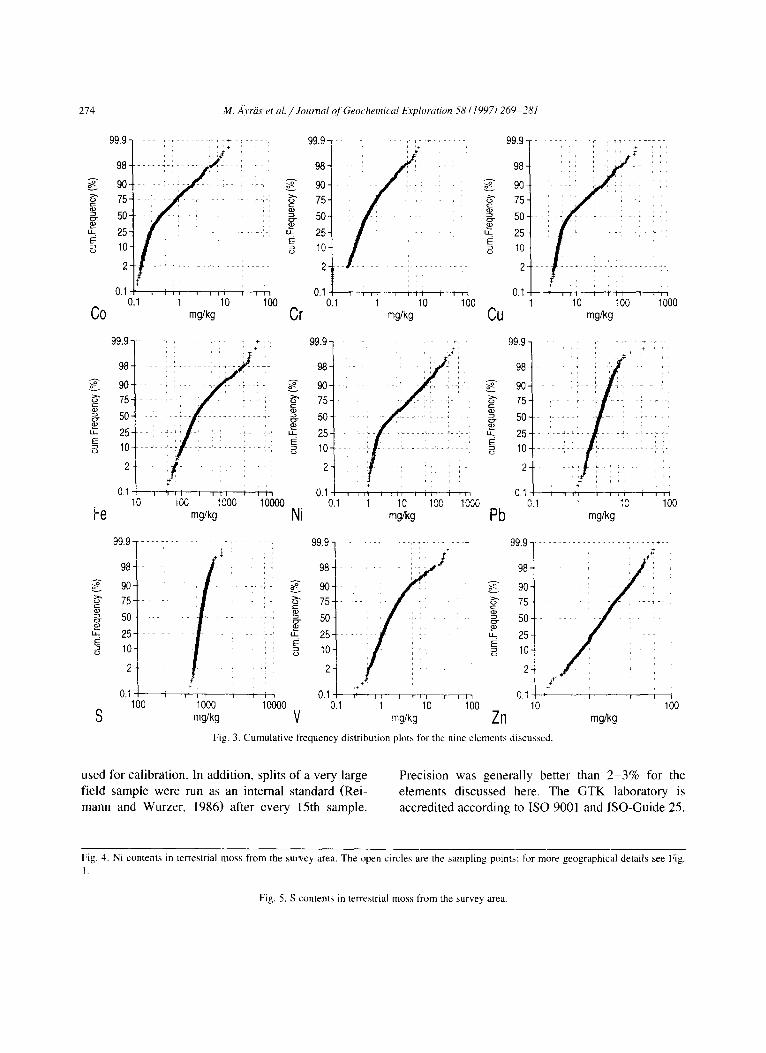
V mg/kg Zn Fig. 3. Cumulative frequency distribution plots for the nine elements discussed.
99.9 . . . . . ~ . . . . . . + * 4-
9 8 . . . . : / "
7 5 . . . . . . . : - - / . . . . , - -
50- ~ ] - '
, i i
100 mg/kg
u s e d fo r ca l ib ra t ion . In add i t i on , sp l i t s o f a v e r y large
f i e ld s a m p l e w e r e run as an in te rna l s t a n d a r d ( R e i -
m a n n a n d W u r z e r , 1986) a f t e r e v e r y 15th s a m p l e .
P r e c i s i o n w a s g e n e r a l l y be t t e r t han 2 - 3 % fo r the
e l e m e n t s d i s c u s s e d here . T h e G T K l a b o r a t o r y is
a c c r e d i t e d a c c o r d i n g to I S O 9001 and 1 S O - G u i d e 25.
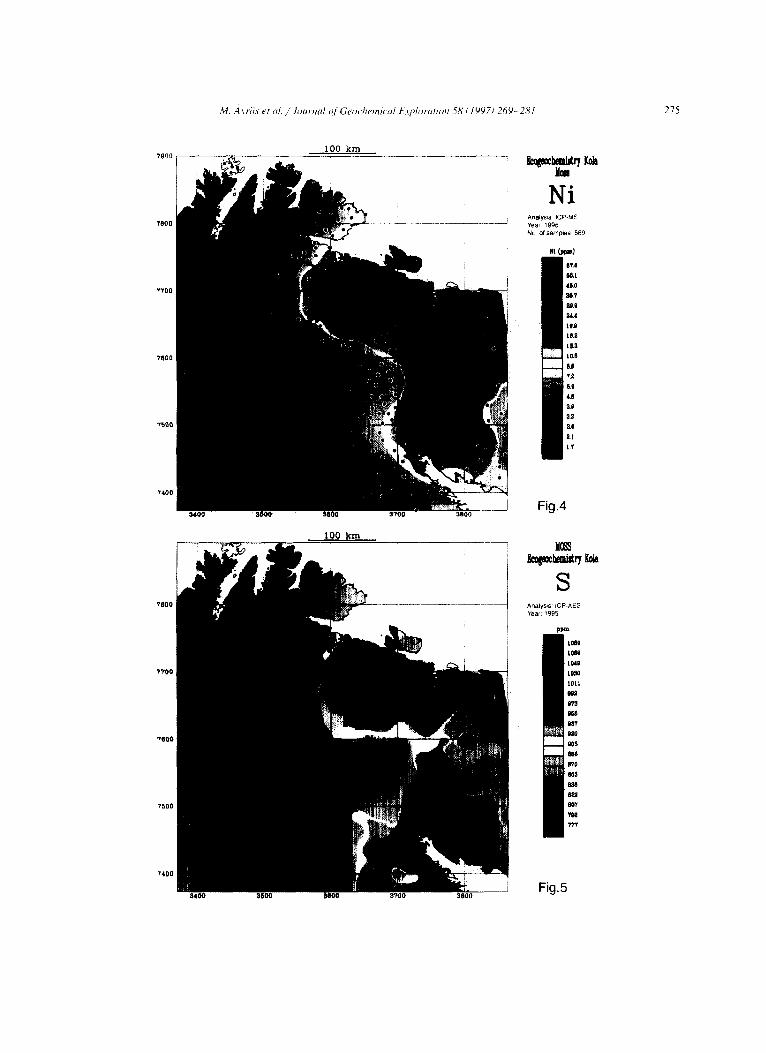
Fig. 4. Ni contents in terrestrial moss from the survey area. The open circles are the sampling points; for more geographical details see Fig. 1.
Fig. 5. S contents in terrestrial moss from the survey area•
M. ,41vriis et al. /" JourJml ~/' Geochemical ILq~loration 58 (1997) 269-281 275
?gO0
7800
~700
7600
7590
?400
~O00
7700
~690
7500
?400
I 0 0 k m
100 km
Ni Anatysis K~P-MS Year 1995 No of samples 589
6~8 t ~ t
450
19.0 I0.S t$3
10.6 6.d
IL0
U
U S.0 IL!
[,T
Fig.4
S AnalyS~s ICP-AES Year 1995
P ~
t0110
t ~
lo t [
~ ?
e?o
?"Pt
Fig.5
276 M. Avr~is et al../ Jom'lla/ <,/' (,e~>ch~'micM" Lq~loration 58 (1997) 269-281
7800
??O0
7600
756Q
, 1010 km
Cr Ana~ys*s ICP-MS Year t995
ppm
7400
7B~O
?~00
7800
?500
1 O0 krn
Fig.6
V Ana~ys~$ ICP-MS Year 1995
Fig.7
M. .41vriis et al. / Journal ~f Geochemical E.~ploration 58 (1997) 269 281 277
2.3. Data analysis
Statistical graphics were produced using the DAS program (Dutter et al., 1992). Colour surface maps were produced using GTK's ALKEMIA program (Bj~irklund and Gustavsson, 1987: Ahlsved et al.. 1 ~91 ; Salminen and Tarvainen, 1995).
3. Results
]'able I summarises the mean, median, standard dev ation and range of the elements discussed here and compares these with the 1990 results of the EJropean moss atlas (Anon., 1992; Rtihling, 1994). CDF plots for all the elements discussed are also presented (Fig. 3) to facilitate the detailed investiga- tion of the data distributions. In general, the spread of values for all elements is very large due to the great difference between polluted areas and the back- ground. For Co, Cr, Cu, Fe and Ni, two populations, pollution and background, are directly visible in the CDF plots. Compared to the 1990 results (Anon., 1992), the levels reported here for Cr, Fe and Pb in 1!~95 are lower, Cd are the same, and Nk Cu and V are higher.
3.1. Regional distribution patterns
3. I. I. Nickel, coppel; cobalt Nickel, copper and cobalt are the three major
heavy metals emitted from the nickel industry in Rusda. The three distribution maps show very simi- lar patterns, with the highest values in the immediate surroundings of the smelters in Monchegorsk and Nikel, and the ore roasting plant in Zapoljarnij. Only the Ni map is shown here as Fig. 4 (compare Fig. 1 f~r more geographical details).
The anomalies originating in Monchegorsk show a very clear north-south elongation, coinciding with the. main topographical features and the main wind direction (north-south) in the area. Elevated contents ot tlnese metals in terrestrial moss can be detected
over the whole width of the Kola Peninsula in a N-S direction. Towards the west, background levels are reached at about the Russian/Finnish border. Levels observed at the border for Ni, Cu and Co are lower than the maximum values observed in Russia by factors of about 80, 50 and 30, respectively.
Near Nikel and Zapoljarnij, the general pattern looks more circular because the two sources are about 20 km apart in an east-west direction; topog- raphy and wind direction should give a north-south elongation here, too. Values for all three metals decrease rapidly westwards, reaching the regional background level at Varangerfjord. Of these three heavy metals, nickel seems to travel farthest west.
3.1.2. Sulphur The two smelters in Monchegorsk and Nikel and
the ore concentrating plant in Zapoljarnij accounted in 1994 for 98,000 t, 130,000 t and 70,000 t of SO 2 emissions (Murmansk Regional Committee for Ecol- ogy and Natural Resources, see Reimann et al., 1996a). There are several additional sources of SOo emissions in the survey area, including large oil- and coal-fired power plants.
Sulphur is a very interesting element as it is a crucial nutrient which plants consume in large amounts and which makes an essential contribution to the structure of enzymes and protoplasm (Kubin, 1990). The damage excess sulphur from anthro- pogenic emissions can do to nature reached world- wide attention in the acid rain debate.
The S distribution map (Fig. 5) shows the highest levels at and around the smelter in Nikel. Monchegorsk shows considerably lower levels and only a very small area with really high values (above 1200 mg/kg). In general, the data distribution ob- served for S comes very close to a normal distribu- tion (Fig. 3), showing the widespread abundance of sulphur in nature. In addition, the distribution is very narrow, showing the limited opportunity mosses have for uptake of S. Some single sources, liar instance close to Apatity and Murmansk, are revealed by the map. Slightly enhanced S values are, on the whole,
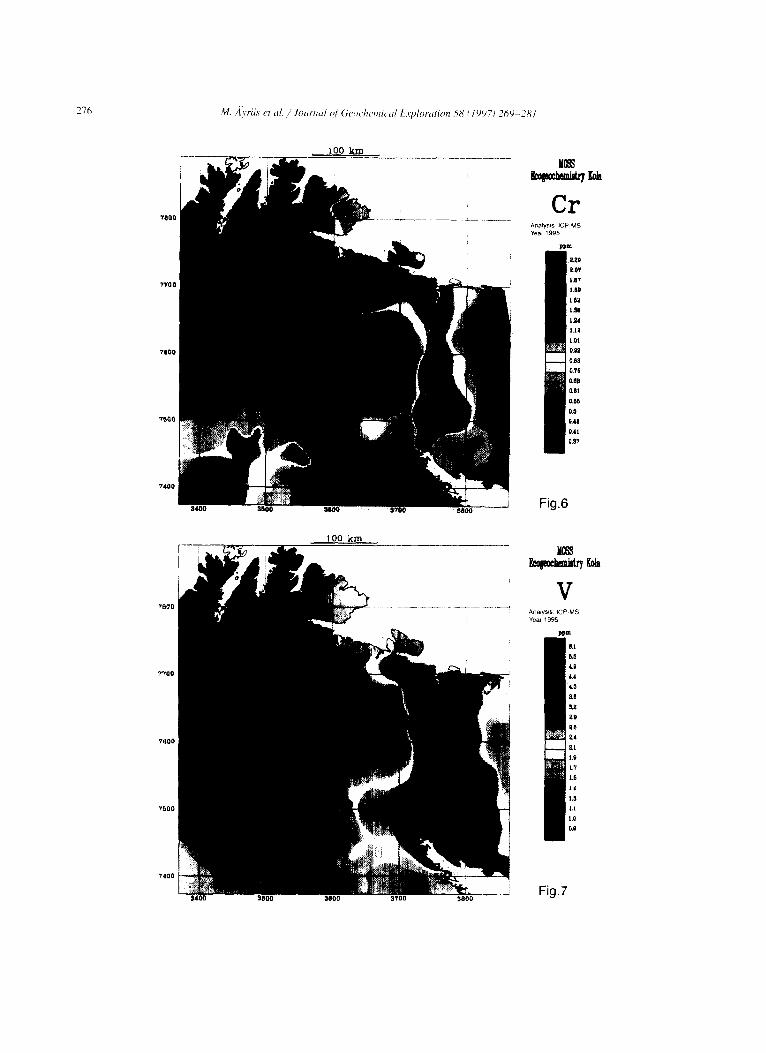
Fig. 6. Cr contents in terrestrial moss from the survey area.
Fig. 7. V contents in terrestrial moss from the survey area.
2 7 8 M. A'vr~i,s el al. / Journal qf Gevchemic'al Kq~h.'atifm 58 (1997) 269-281
7800
7v00
7Q00
7600
7400
7900
7800
7700
?600
VSO0
7400
3400
1 0 0 k m
100 km
3600 ~800 3700 3800
Pb Anaiysls tCP-MS Year 1995
E8
Eli
t.l i ,E?
&4 4J~
&0 &8
&4 &,l
&!
U
U
&8 &li
8.4
Fig.8
Zn Analysis ICP-MS Year 1995
ppm
Fig.9
M. /(vriis et al. / Journal of Geochemical Exploration 58 (1997) 269-281 279
seen in the eastern part of the survey area. The contrast between the centres of emissions and the background is very small compared with elements like Co, Ni and Cu. There may be several reasons for this behaviour of the mosses: (1) being a nutrient, S has such high natural levels in the moss that no major additional uptake is possible, or (2) SO 2, as a mainly gaseous emission, is transported high into the atmosphere and spread over much larger areas than the heavy metals, limiting the amount of S offered for uptake in the immediate surroundings of the industrial plants, or (3) sulphur is mostly deposited as sulphuric acid (acid rain) to which the uptake mechanisms of the moss do not respond favourably.
3.1.3. Chromium, iron and L'anadium
The main source for elements like Cr, Fe and V in terrestrial moss is local industry, especially iron and steel mills and combustion of coal (Anon., 1992). High concentrations of Cr and V in mosses were also found in areas underlain by ultramafic voicanics (Niskavaara and Lehmuspelto, 1992). In unvegetated are, as, soil dust can contribute significantly to the concentration of Cr, Fe and V in moss (Steinnes, 1995). One would thus expect rather complicated patterns in the regional distribution maps.
Fig. 6 shows the regional distribution of Cr. High levels occur in the surroundings of Nikel, Zapoljarnij and Kirkenes (iron ore mine and mill) along the Norwegian-Russian border. Some very high values occur in the surroundings of Monchegorsk and an- other emission centre can be clearly detected at Apatity. From Monchegorsk/Apatity, elevated lev- els. can be followed through to Murmansk. The Tomio steel industry in Finland is clearly marked. The Lapland greenstone belt is strongly reflected in this map (compare Niskavaara and Lehmuspelto, 1992). A number of high Cr levels are found on the Varanger Peninsula in Norway, which again must be attributed to geology, here partly enhanced by inputs from dust because extensive areas lack vegetation owing to a combination of the harsh coastal climate and reindeer overgrazing.
The Fe map (not shown here) is very similar to the Cr map. Some higher Fe levels occur in the surroundings of Monchegorsk and northwards. Ap- atity is easily detectable as a separate emission cen- tre. High Fe levels can be traced from Apatity to Kandalaksa and along the road to Kovdor.
Fig. 7 shows the regional distribution of V. Nikel, Zapoljarnij and Kirkenes are not clearly marked by high levels of V in moss. The highest levels actually occur in the surroundings of Murmansk and all along Murmanskfjord towards the Barents Sea. We at- tribute this feature to the combustion of heavy oil. Elevated levels can be traced from Murmansk along the main road towards the Norwegian border. Other sources of elevated V levels include Apatity (power plant) and probably the open-cast mine at Kirovsk (lithology--dust), but not Monchegorsk. The road to Kovdor is also clearly visible on the map. Indeed, large parts of the Russian portion of the area studied show elevated V levels.
3.1.4. Lead and zinc
Lead and zinc are minor ingredients of the emis- sion spectrum from the Russian nickel industry (Rei- mann et al., 1995a,b, 1996a,b). Additional sources could be local mines, industry and, of course, traffic.
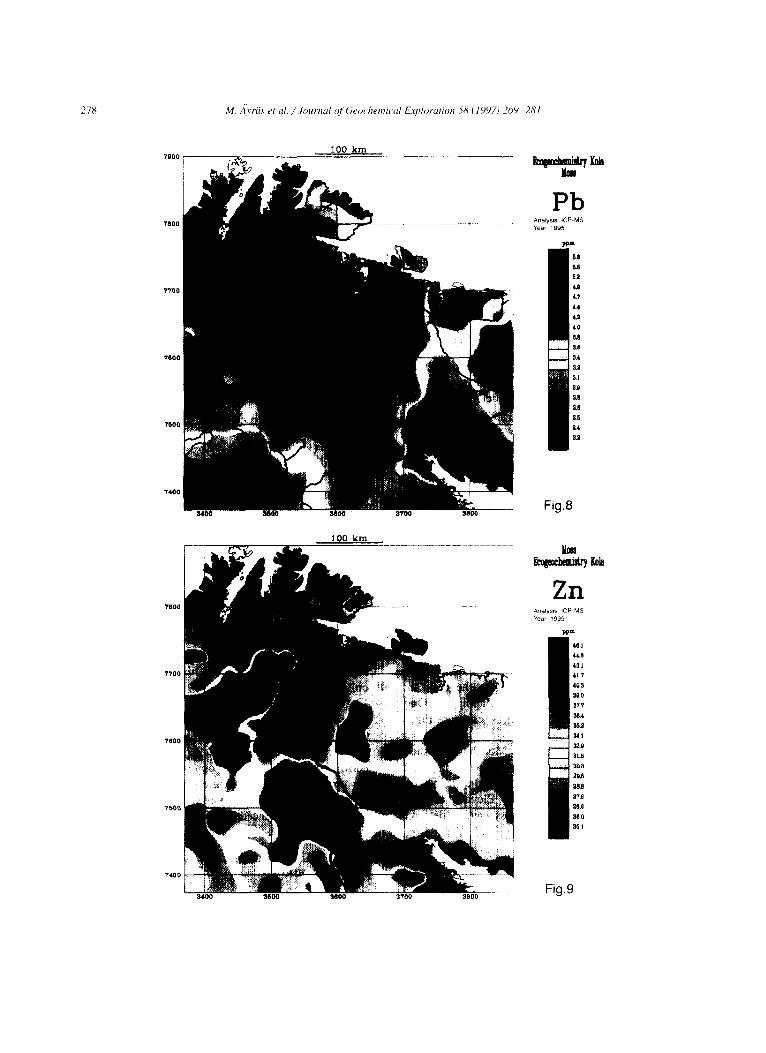
The lead map (Fig. 8) shows maximum contents close to Murmansk (local traffic and /or industry) and Kandalaksa. Elevated levels can also be ob- served in the surroundings of Nikel, Monchegorsk and Apatity--all being industrial and local traffic centres--as well as in the southwesternmost part of the Finnish area. Whether the pattern in Finland is due to long-range transport of air pollutants from central Europe, increased traffic density in these more densely inhabited areas of Finland, or simply geology can be discussed at length; we favour local traffic and /or lithology (there exists a relatively good correlation between Fe, Cr and Pb in this area) as the major source(s).
Elevated Pb levels along large parts of the Norwe- gian coast must be attributed to the patchy vegetation cover and increased dust inputs. The influence of
Fig. 8. Pb contents in terrestrial moss from the survey area. The main towns and major roads are marked.
Fig. 9. Zn contents in terrestrial moss from the survey area.
280 M. /[ivriJs et al. / Journal of Geochemical Exploration 58 (1997) 269 281
traffic can again be clearly detected along the Nor- wegian/Finnish border (the main E6 road being clearly depicted). It can be concluded that industry is not the major source for the observed Pb patterns in the moss samples from this area, but rather traffic and natural sources.
Zinc (Fig. 9) is an example of an element for which the moss technique does not function. The CDF diagram shows a perfectly normal distribution here, which is an indication that large regional pro- cesses do not influence the Zn uptake in mosses. The map is extremely 'noisy' and lacks clear patterns-- local variability is about as high as regional variabil- ity. Another medium than moss would have to be used to map the regional distribution patterns of atmospheric Zn deposition for this area.
4. Conclusions
The maps presented here show that the major pollutants from the Russian nickel mining and smelt- ing industry reach background levels close to the border between Russia and Finland and Norway. The anomalies near industrial plants are very pronounced, follow the main wind directions and show a very steep gradient towards the west.
Some elements clearly show the influence of other sources than just airborne pollution, the best example being Cr where local geology in Finland is clearly visible in the distribution patterns. This must be kept in mind when interpreting the results of regional moss surveys. Zn is an example of an element that shows such high local variations that the moss tech- nique cannot be used to map the regional atmo- spheric deposition. For the majority of elements discussed here, however, the moss technique is very well suited for mapping and monitoring atmospheric pollution in this area. The major vanadium anomaly around Murmansk has not been recognised before.
Acknowledgements
The authors want to thank the other participants of the Kola project team for valuable discussions and help with the field work. We also thank the labora- tory personnel at NGU for help in drying the sam-
pies and the GTK laboratory staff for their excellent and fast preparation and analysis of the samples. We also wish to thank Mrs. Riitta Pohjola for drawing the maps and doing other data-base-related work. We also wish to thank Professor Eiliv Steinnes for inter- esting discussions. The Norwegian and Russian par- ticipation in the project was financed by the Norwe- gian Ministry of the Environment with special pro- ject funds from the Norwegian Ministry of Foreign Affairs.
References
Ahlsved, C., Lampion, E. and Tarvainen, T., 1991. ALKEMIA--a VAX minicomputer database and program package for geo- chemical exploration. J. Geochem. Explor., 41: 23-28.
Anon., 1992. Atmospheric heavy metal deposition in northern Europe 1990. Nord 1992:12 (Nordic Council of Ministers publication series), 41 pp.
Ayr~is, M. and Reimann, C., 1995. Joint ecogeochemical mapping and monitoring in the scale of 1:1 million in the west Mur- mansk region and contiguous areas of Finland and Norway-- Field Handbook. Nor. Geol. Unders, Rep., 95.111, 33 pp.
)~yr~is, M., Caritat, P. de, Chekushin, V.A., Niskavaara, H. and Reimann, C., 1995. Ecogeochemical investigation, Kola Peninsula: sulphur and heavy metal content in snow. Water, Air Soil Pollut., 85: 749-754.
~,yriis, M., Pavlov, V. and Reimann, C., 1996. Comparison of sulphur and heavy metal contents and their regional distribu- tion in humus and moss samples from the vicinity of Nikel and Zapoljarnij, Kola Peninsula, Russia. Water, Air Soil Pol- lut. (in press).
Bjrrklund, A. and Gustavsson, N., 1987. Visualization of geo- chemical data on maps: new options. J. Geochem. Explor., 29: 89-103.
Caritat, P. de, Reimann, C., ,~yr~is, M., Niskavaara, H., Chekushin, V.A. and Pavlov, V.A., 1996a. Stream water geochemistry from selected catchments on the Kola Peninsula (NW Russia) and neighbouring areas of Finland and Norway, l. Element levels and sources. Aquat. Geochem. (in press).
Caritat, P. de, Reimann, C., Ayr~is, M., Niskavaara, H., Chekushin, V.A. and Pavlov, V.A,, 1996b. Stream water geochemistry from selected catchments on the Kola Peninsula (NW Russia) and neighbouring areas of Finland and Norway, 2. Time series. Aquat. Geochem. (in press).
Chekushin, V,A., Bogatyrev, I., Finne, T.E., Misund, A., Niskavaara, H., Pavlov, V.A., Volden, T. and ,~,yr'~, M., 1993. Report on joint ecogeochemical mapping and monitor- ing in the scale of 1:1 million in the west Murmansk region and the contiguous areas of Finland and Norway. Nor. Geol. Unders. Rep., 93.152, 29 pp., 9 tables, 54 figures and 14 appendices.
Dutter, R., Leimer, T., Reimann, C. and Wurzer, F., 1992. Gratis-
M. Avriis et al. / Journal q[" Geochemical L~ploration 58 (1997) 269-281 281
the und geostatistische Analyse am PC. Beitr~ige zur Umwelt- statistik. Schriftenr. Tech. Univ. Wien, 29: 78-88.
H,tgda, K.A., TCmmervik, H., Solheim, I. and Marhaug, 13. 1995. Use of multitemporal Landsat image data for mapping the effects from air pollution in the Kirkenes-Pechenga area in the period 1973-1994. Norut report, Tromso, document no. IT2039/1-95.66 pp.
Kubin, E., 1990. A survey of element concentrations in the epiphytic Lichen Hypogymia physodes in Finland in 1985-86. In: P. Kauppi, P. Antilla and K. Kentt~imies (Editors), Acidifi- cation in Finland. Springer-Verlag. Berlin, pp. 421-446.
M,ikinen. A., 1994a. Biomonitoring of atmospheric deposition in tile Kola Peninsula (Russia) and Finnish Lapland, based on the chemical analysis of mosses. Finnish Ministry of the Environ- ment Rep. 4 /94 , 83 pp.
M,ikinen, A., 1994b. Biomonitoring of atmospheric deposition in Finland, Estonia and the Kola Peninsula. based on the chemi- cal analysis of mosses. Publ. Dept. Bot. Univ. Helsinki, 19, 28
PP. Niskavaara, H., 1995. A comprehensive scheme of analysis tbr
soils, sediments, humus and plant samples using inductively coupled plasma atomic emission spectrometry. Geological Survey of Finland, Current Research 1993-1994, Geol. Surv. Finl. Spec. Pap., 20: 167-176.
Niskavaara, H. and Lehmuspelto, P., 1992. The use of mosses in geochemical and environmental studies in Finnish Lapland-- comparison of results from 1982 and 1990. In: E. Tikkanen. M. Varmola and T. Katermaa (Editors), Symposium on the State of the Environment and Environmental Monitoring in ]Northern Fennoscandia and the Kola Peninsula. Arctic Center Rovaniemi Publications, 4. pp. 73-77.
Niskavaara. H., Reimann, C. and Chekushin, V., 1996. Distribu tion and pathways of heavy metals and sulphur in the vicinity o:f the copper-nickel smelters in Nikel and Zapoljarnij, Kola Peninsula, Russia, as revealed by different sample media. Appl. Geochem., 11: 25-34.
Reimann, C. and Wurzer, F., 1986. Monitoring accuracy and precision--improvements by introducing robust and resistant statistics. Mikrochim. Acta, II(1-6): 31-42.
Reimann, C., Caritat, P. de. )i, yrhs, M., Chekushin, V.A.. Haller- aker, J.H., Jaeger, 0.. Niskavaara, H.. Pavlov, V. and Volden,
T., 1995a. Heavy metals and sulphur content in snowpack and rainwater samples from eight catchments north of the Arctic Circle in Finland, Norway and Russia. ln: R.D. Wilken, U. F~rstner and A. Kn~chel (Editors), Heavy Metals in the Environment, Hamburg, SepL 1995. CEP Consultants, Edin- burgh, pp. 160-163.
Reimann, C,, Niskavaara, H., Caritat, P. de, AyrS.s, M., Chekushin, V.A. and Finne, T.E., 1995b. Snowpack sampling used to fingerprint environmental contamination in the surroundings of the nickel smelter at Nikel, Kota Peninsula. In: R.D. Wilken. U. F~rsmer and A. KniSchel (Editors), Heavy Metals in the Environment, Hamburg, Sept. 1995. CEP Consultants, Edinburgh, pp. 84-87.
Reimann, C., Niskavaara, H., Finne, T.E., ,~yrfis, M. and Chekushin, V.. 1996a. Regional variation of snowpack chem- istry from the surrounding of Nikel and Zapoljarnj, Russia, northern Finland and Norway. Sci. Total Environ., 182(1-3): 147-158.
Reimann, C., Caritat, P. de. Halleraker, J.H., Volden, T., )kyrS.s, M., Niskavaara, H., Chekushin, V.A. and Pavlov, V.A., 1996b. Rainwater composition in eight arctic catchments in northern Europe (Finland. Norway and Russia). Atmos. Environ. (sub- mitted).
Ri3hling, A. (Editor), 1994. Atmospheric Heavy Metal Deposition in Europe--Estimations Based on Moss Analysis. Nord 1994:9. 53 pp.
R~hling, A. and Tyler, G., 1968. An ecological approach to the lead problem. Bot. Notiser, 121: 321-342.
Salminen, R. and Tarvainen, T., 1995. Geochemical mapping and databases in Finland. J. Geochem. Explor.. 55: 321-327.
Solheim. l.. Yc~mmervik, H. and HCgda, K.A., 1995. A time study of the vegetation in Monchegorsk. Russia. NORUT report, Troms¢, document no. 1T2039/2-95, 42 pp.
Steinnes, E.. 1995. A critical evaluation of the use of naturally growing moss to monitor the deposition of atmospheric met- als. Sci. Total Environ., 160/161: 243-249.
Tyler, G., 1970. Moss analysis--a method for surveying heavy metal deposition. In: H.M. Englund and W.T. Berry (Editors), Proc. Sec. Int. Clean Air Congress. Academic Press, New York, pp. XX-XX.
Copyright © 2022 FDOKUMEN