aees-8-3-6.pdf - Science and Education Publishing
13
Applied Ecology and Environmental Sciences, 2020, Vol. 8, No. 3, 106-118 Available online at http://pubs.sciepub.com/aees/8/3/6 Published by Science and Education Publishing DOI:10.12691/aees-8-3-6 Observed Trends and Spatial Distribution in Daily Precipitation Indices of Extremes over the Narayani River Basin, Central Nepal Dipendra Lamichhane 1 , Binod Dawadi 1,2,* , Ram Hari Acharya 1 , Saroj Pudasainee 1 , Ishwar Kumar Shrestha 3 1 Central Department of Hydrology and Meteorology, Tribhuvan University, Kathmandu, Nepal 2 Kathmandu Center for Research and Education, Chinese Academy of Sciences Tribhuvan University, Kathmandu, Nepal 3 Department of Statistics, Amrit Campus, Tribhuvan University, Kathmandu, Nepal *Corresponding author: [email protected] Received March 04, 2020; Revised April 14, 2020; Accepted April 25, 2020 Abstract Climate change is the biggest environmental challenge that plays out through changing intensity, duration, and frequency of extreme events. To fulfill the research gap in understanding and quantifying the recent changes in precipitation extremes over the Narayani river basin of central Nepal, the long term daily precipitation data from 1980 to 2018 were run in ClimPACT2 an R software package to calculate ET-SCI extreme precipitation indices. In this study physically relevant 14indices obtained from 23 stations were examined for their spatial and temporal variation. Before the calculation of indices different scientific tools and programs were used to check the data quality and homogeneity. The results suggest that the variations of extreme indices throughout the study area are quite different from that of seasonal and annual patterns to some extent. The monsoonal precipitation was mostly concentrated in the central part of the basin within the Middle Mountain region (Lumle and its surroundings). Especially the lowlands (Terai and Siwaliks) and including some parts of middle mountains the precipitation intensity-based indices like as, percentile indices (R95p) and absolute indices (RX1day, RX3day, RX5day) were in the increasing trends, but the frequency of precipitation like threshold indices (R1mm, R10mm, R20mm) along with the duration of precipitation seemed to be decreasing. This implies that the lowlands regions bringing about rainfall related hazards like floods and soil degradation with inundation and may cause possible impact on agriculture and livelihood due to intense rainfall and prolongation of dry spells with the weakeing of rainfall duration (days/year). However, the light to moderate precipitation and associated days over the high altitude and that could be the possible cause of landslides. This study also highlights the suggestion that there may be a possible impact on agriculture facilities, food security, and water scarcity in the eastern part of the basin due to the significant decreasing trend of annual total wet days precipitation (PRCPTOT). Keywords: climate change, Narayani river basin, ClimPACT2, ET-SCI precipitation indices Cite This Article: Dipendra Lamichhane, Binod Dawadi, Ram Hari Acharya, Saroj Pudasainee, and Ishwar Kumar Shrestha, “Observed Trends and Spatial Distribution in Daily Precipitation Indices of Extremes over the Narayani River Basin, Central Nepal.” Applied Ecology and Environmental Sciences, vol. 8, no. 3 (2020): 106-118. doi: 10.12691/aees-8-3-6. 1. Introduction Climate change is the biggest environmental challenge attracting global attention and takes the planet into ‘uncharted territory’ with the announcement of 2016 as the warmest year ever [1]. As a result, heat waves, cold waves, droughts, and floods which used to be occasional events are becoming more regular than in the past [2]. A changing climate leads to change in the frequency, intensity, spatial extent, duration and timing of weather and climate events and produces the unexpected climatic [3]. Increases in extreme climate events such as heat waves, heavy rain, drought, and associated wildfires have significant impacts on human health, livelihoods, assets, and ecosystems [4] and therefore, the more extreme events, the more likely it is to cause societal or environmental damage [5]. The responses of precipitation extremes (heavy precipitation events) to climate change have been the subject of extensive study because of the potential impacts on human society and ecosystems [3]. The study [6,7] highlights the importance of advancing the understanding of the character of precipitation based on recent warming. The authors pointed out the increasing precipitation extremes like heavy precipitation being somehow associated with recent warming. Especially the heavy precipitation event depends on the available atmospheric moisture and is governed by the Clausius-Clapeyron equation.
-
Upload
khangminh22 -
Category
Documents
-
view
1 -
download
0
Transcript of aees-8-3-6.pdf - Science and Education Publishing
Applied Ecology and Environmental Sciences, 2020, Vol. 8, No. 3, 106-118 Available online at http://pubs.sciepub.com/aees/8/3/6 Published by Science and Education Publishing DOI:10.12691/aees-8-3-6
Observed Trends and Spatial Distribution in Daily Precipitation Indices of Extremes over
the Narayani River Basin, Central Nepal
Dipendra Lamichhane1, Binod Dawadi1,2,*, Ram Hari Acharya1, Saroj Pudasainee1, Ishwar Kumar Shrestha3
1Central Department of Hydrology and Meteorology, Tribhuvan University, Kathmandu, Nepal 2Kathmandu Center for Research and Education, Chinese Academy of Sciences Tribhuvan University, Kathmandu, Nepal
3Department of Statistics, Amrit Campus, Tribhuvan University, Kathmandu, Nepal *Corresponding author: [email protected]
Received March 04, 2020; Revised April 14, 2020; Accepted April 25, 2020
Abstract Climate change is the biggest environmental challenge that plays out through changing intensity, duration, and frequency of extreme events. To fulfill the research gap in understanding and quantifying the recent changes in precipitation extremes over the Narayani river basin of central Nepal, the long term daily precipitation data from 1980 to 2018 were run in ClimPACT2 an R software package to calculate ET-SCI extreme precipitation indices. In this study physically relevant 14indices obtained from 23 stations were examined for their spatial and temporal variation. Before the calculation of indices different scientific tools and programs were used to check the data quality and homogeneity. The results suggest that the variations of extreme indices throughout the study area are quite different from that of seasonal and annual patterns to some extent. The monsoonal precipitation was mostly concentrated in the central part of the basin within the Middle Mountain region (Lumle and its surroundings). Especially the lowlands (Terai and Siwaliks) and including some parts of middle mountains the precipitation intensity-based indices like as, percentile indices (R95p) and absolute indices (RX1day, RX3day, RX5day) were in the increasing trends, but the frequency of precipitation like threshold indices (R1mm, R10mm, R20mm) along with the duration of precipitation seemed to be decreasing. This implies that the lowlands regions bringing about rainfall related hazards like floods and soil degradation with inundation and may cause possible impact on agriculture and livelihood due to intense rainfall and prolongation of dry spells with the weakeing of rainfall duration (days/year). However, the light to moderate precipitation and associated days over the high altitude and that could be the possible cause of landslides. This study also highlights the suggestion that there may be a possible impact on agriculture facilities, food security, and water scarcity in the eastern part of the basin due to the significant decreasing trend of annual total wet days precipitation (PRCPTOT).
Keywords: climate change, Narayani river basin, ClimPACT2, ET-SCI precipitation indices
Cite This Article: Dipendra Lamichhane, Binod Dawadi, Ram Hari Acharya, Saroj Pudasainee, and Ishwar Kumar Shrestha, “Observed Trends and Spatial Distribution in Daily Precipitation Indices of Extremes over the Narayani River Basin, Central Nepal.” Applied Ecology and Environmental Sciences, vol. 8, no. 3 (2020): 106-118. doi: 10.12691/aees-8-3-6.
1. Introduction
Climate change is the biggest environmental challenge attracting global attention and takes the planet into ‘uncharted territory’ with the announcement of 2016 as the warmest year ever [1]. As a result, heat waves, cold waves, droughts, and floods which used to be occasional events are becoming more regular than in the past [2]. A changing climate leads to change in the frequency, intensity, spatial extent, duration and timing of weather and climate events and produces the unexpected climatic [3]. Increases in extreme climate events such as heat waves, heavy rain, drought, and associated wildfires
have significant impacts on human health, livelihoods, assets, and ecosystems [4] and therefore, the more extreme events, the more likely it is to cause societal or environmental damage [5].
The responses of precipitation extremes (heavy precipitation events) to climate change have been the subject of extensive study because of the potential impacts on human society and ecosystems [3]. The study [6,7] highlights the importance of advancing the understanding of the character of precipitation based on recent warming. The authors pointed out the increasing precipitation extremes like heavy precipitation being somehow associated with recent warming. Especially the heavy precipitation event depends on the available atmospheric moisture and is governed by the Clausius-Clapeyron equation.
107 Applied Ecology and Environmental Sciences
In the meantime, several research papers, and reports published results on the analysis of precipitation extremes on global or continental or local scales to evaluate the changes in precipitation characteristics. Reference [8] brought the most up-to-date and comprehensive global picture of the observed trends in extreme in precipitation along with temperature based on the high-quality station data supplied by numerous scientists worldwide and found a widespread and significant increase in heavy precipitation indices. The findings were accepted by the Special Report on Extreme Events of Intergovernmental Panel on Climate Change (IPCC) [3] and also valid with the findings of Fifth Assessment Report fifth [4], which highlighted the general increasing trends of extreme precipitation events in most parts of the earth. Reference [9] also found that on a global scale the intensity, frequency, and duration of extreme precipitation is increasing on average. The Fifth assessment report of the Intergovernmental Panel on Climate Change [4] also stated that extended intervals of monsoon failures and dry spells have struck India and Southeastern Asia, in the last few years leading to prolonged and intense droughts, which are a recurring feature of Holocene paleoclimate, also, the frequency of heavy precipitation events are increasing while light rain events are decreasing. Tree ring based precipitation studies also showed the frequency of drought event is increasing in the recent decades in the western Himalaya [10] as well as the northern and southern slope of central the Himalayan region [11,12,13].
The comprehensive statistical analysis of precipitation observations during the South Asia summer monsoon season showed the significant increases in the frequency of dry spells (low rainfall) and intensity of wet spells (heavy rainfall) and decreases in the intensity of dry spells in South Asia [14]. In similar studies from the Hindu Kush Himalayan (HKH) showed heterogeneity in the amount of precipitation throughout the region, however regional average annual intense precipitation amount and consecutive wet-days, regional average of RX1DAY, RX3DAY, and RX5DAY is increasing [15]. However, trends of consecutive dry-days were mostly opposite to those of consecutive wet-days.
Nepal, situated in the central Himalayan with steep to pography is more susceptible to the developments of heavy rainfall and drought events however as compared to the rest of South Asia studies on the observed precipitation extremes over Nepal are rare and sporadic. Before the last decade the Disaster Risk Reduction (DDR) strategy and policies were given very low priority in Nepal. Nepal’s first disaster report [16] shows that climate-related disasters accounted for almost one-fourth of the deaths and three-fourth of economic losses. Furthermore, Reference [17] also reported that Nepal is more vulnerable country due to extreme precipitation related hydro-meteorological disaster such as; flash floods and landslides. The research reports [18,19] highlights the rising drought events as a consequence of changes in precipitation characteristics across the southern Himalaya (Nepal) and which could be the potential cause of the recent failure of the agriculture system in some parts of the country. For instance, the characteristics of the precipitation and its distribution throughout the country are unique. The annual precipitation distribution over
Nepal possesseda similar pattern to the monsoonal distribution and delineated all the precipitation pocket zones (Lumle, Gumthang, and Num) as well as the low precipitation zones on the leeward side of high mountains (Mustang, Manang, Dolpa,and Everest) [20]. On average all the seasonal and annual precipitation trends of Nepal were insignificantly decreasing with the highest decreasing trend in the post-monsoon season than other seasons [21,22]. Except for the Terai region of Nepal, the annual precipitation decreased at other physiographic zones with the highest negative trend in the High Mountain region. Reference [23] used 26 stations to calculate the extreme precipitation across Nepal for the period of 1971-2006 and found that the increasing trend in the extreme precipitation events at most of the stations. Similarly, by the analysis of precipitation datasets from 210 stations for the period 1970-2012 across Nepal found the decreasing trend in the annual precipitation, wet days and high-intensity-related precipitation extremes (R95, RX1day), together with an increasing trend in the consecutive dry days over the central and eastern middle mountains [20]. The study [24] analyzed the precipitation events and found that the number of extreme events per station is neither significantly increasing nor decreasing between 1971 and 2010 across Nepal. The analysis of spatio-temporal variability of extreme precipitation in Nepal by [25] found that peak annual precipitation between elevation 2,000 and 3,500 m above sea level (masl), but 1-day extreme precipitation peaks were found at the lower elevation in the southern foothills with its highest intensity in a central region of the country. The research output of [26] on the northern and southern slopes of the central Himalayas from 1975 to 2009 found that, the increased trend of all the indices except the maximum 1-day precipitation and simple daily precipitation intensity indices on the southern slopes. A recent study in the Roshi river basin found the increasing trend of consecutive dry days but heavy rainfall days (RX5day) and precipitation intensity on wet days were in a decreasing trend. The stream flow pattern was severely affected by these changes in extreme precipitation events [27]. Over the whole Koshi river basin, an increase in total annual rainfall and rainfall intensity was determined with no clear long-term linear trend while analyzing the recent 36 years of records [28]. Furthermore, the number of consecutive dry days increased at almost all the stations of the Koshi basin. The recent two decades of study in the same river basin [29] found a solo increasing trend of consecutive dry days but, the intensity indices of extreme precipitation was declined across Eastern Nepal. A similar type of study in the West Rapti river basin shows that the number of consecutive dry days and consecutive wet days were in the upward trend in at most of the stations and the extremely wet days, the annual total precipitation and maximum1-day precipitation trends were declined [30]. While in the Kali-Gandaki river basin except for the total annual precipitation index all the indices were in increasing trend till 2007 [31].
Based on the above-mentioned research findings, there has not been a recent and specific assessment of observed changes in climate extremes over the Narayani River basin of central Nepal, where meteorological observing systems are among the best in Nepal. The study [32] analyzed the

Applied Ecology and Environmental Sciences 108
spatial and temporal trend of precipitation and leaves a gap in understanding and quantifying the recent precipitation extremes over the basin. Therefore, the present study will evaluate the details of precipitation extremes changing in terms of spatial and trend features including intensity, frequency, and duration by the nature of occurrence from the basin and fulfill the regional gap in the climatic extremes focusing on precipitation.
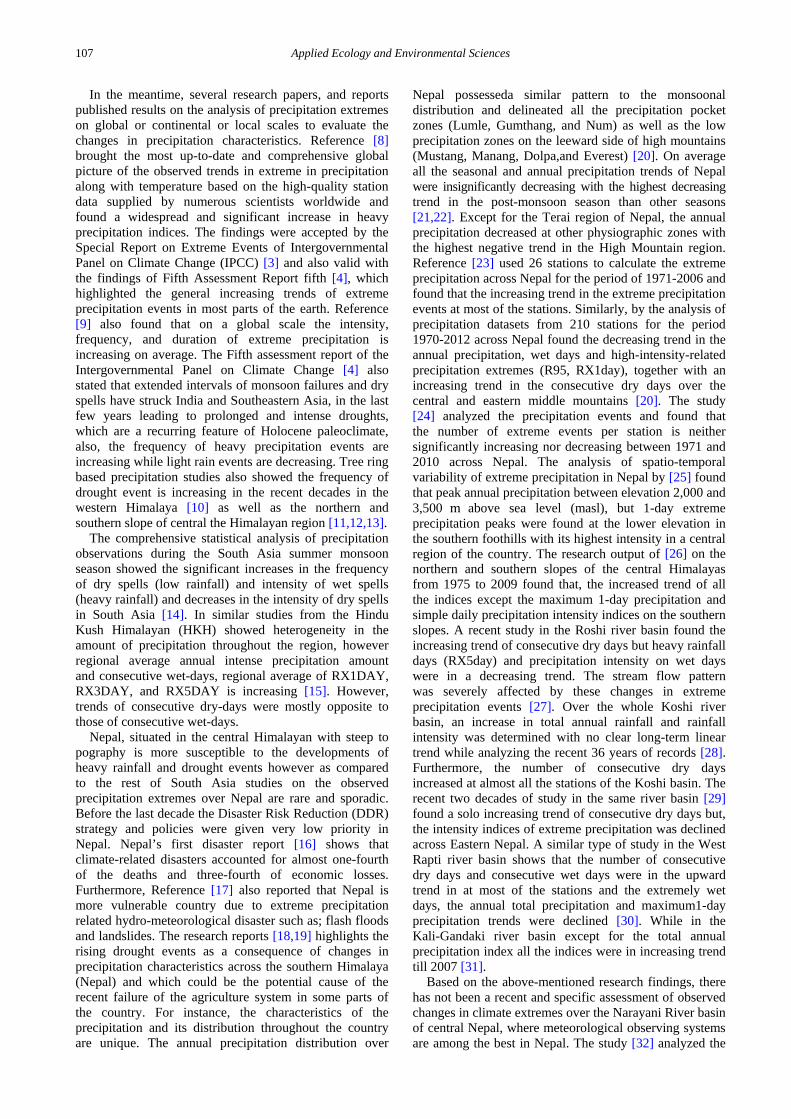
2. Study Area
The Narayani river basin is a transboundary river basin, also known as the Gandaki river basin. It covers the three countries China in the northern part, Nepal in the middle part and India in the southern part, having the total drainage area of 46300km2, among which 72% lies in Nepal alone, remaining 18 % and 10 % lies in India and China respectively (Figure 1). The basin has a high topographic variation with elevation ranging from 60 masl in the south to higher than 8000 masl in the north where it passes through the high Himalayas, which contain the Dhaulagiri (8167 masl) and Annapurna (8091 masl) peaks. Narayani River includes seven tributaries namely, Kali Gandaki, Budhi Gandaki, Trishuli, Marsyandi, Daraudi, Seti, and Madi. It contains 1710 glaciers with an area of 2285km2 [33].
According to Nepal Electricity Authority [34] the Narayani river system contributes about 50% of the total hydropower production of the country. Furthermore, it has a high potential for investment in hydropower development as well as irrigation in the downstream regions. The basin is also characterized by high poverty levels and low socio-economic indicators. Avalanches, landslides, glacial lake outburst floods (GLOFs) and other floods triggered
by heavy rainfall, and drought are the major climatic issues in the upstream area (>2,500masl) due to the abrupt rise of topography, extremely rugged terrain, steep slopes, and deeply cut valleys. The Siwalik zone of the basin has dry and unconsolidated soil materials that are highly prone to erosion and landslides, while the Terai area is characterized by vast flood plains with deciduous forest and agriculture and subject in many places to annual inundation. A study carried out by the International Centre for Integrated Mountain Development (ICIMOD), Nepal [35] also highlights the recent climate change and its toll on agriculture, water resources, tourism and biodiversity in many parts of the basin.
The climate in the basin varies from humid tropical in the low altitude of the southern part to polar tundra in the higher altitude northern belt [36]. The basin experienced four seasons, namely, winter (December-February), pre-monsoon (March-May), monsoon (June-September), and post-monsoon (October-November). Winter is a cold season with the precipitation over the basin is received by the western disturbances. Pre-monsoon is characterized by hot, dry and westerly windy weather with mostly localized precipitation in a narrow band. The monsoon is characterized by moist southeasterly monsoonal winds coming from the Bay of Bengal and occasionally from the Arabian Sea. Post-monsoon is a well-known dry season with the driest month, November. The spatial distribution of precipitation in the basin is highly heterogeneous (Figure 2). For instance, the annual precipitation varies from less than 270mm for the driest regions (Mustang, Manangand Dolpa, located at the leeward-side north of the Annapurna) to above 5401mm in and around the Lumle region. Precipitation patterns in the basin are directly associated with the summer monsoon, with about 78% of the annual precipitation falling between June and September.
Figure 1. Location of the meteorological stations used in the study
109 Applied Ecology and Environmental Sciences
3. Materials and Methods The observed daily precipitation dataset of 74
meteorological stations for the period of 1980-2018 was collected from the Department Of Hydrology and Meteorology (DHM), Nepal. Within this study period the stations that feature data gaps for more than (a) three days in a month; (b) two weeks within a year, (c) three consecutive years or (d) six years in total were omitted from the analysis. All the selected stations within the study area are presented in Figure 1. Prior to the
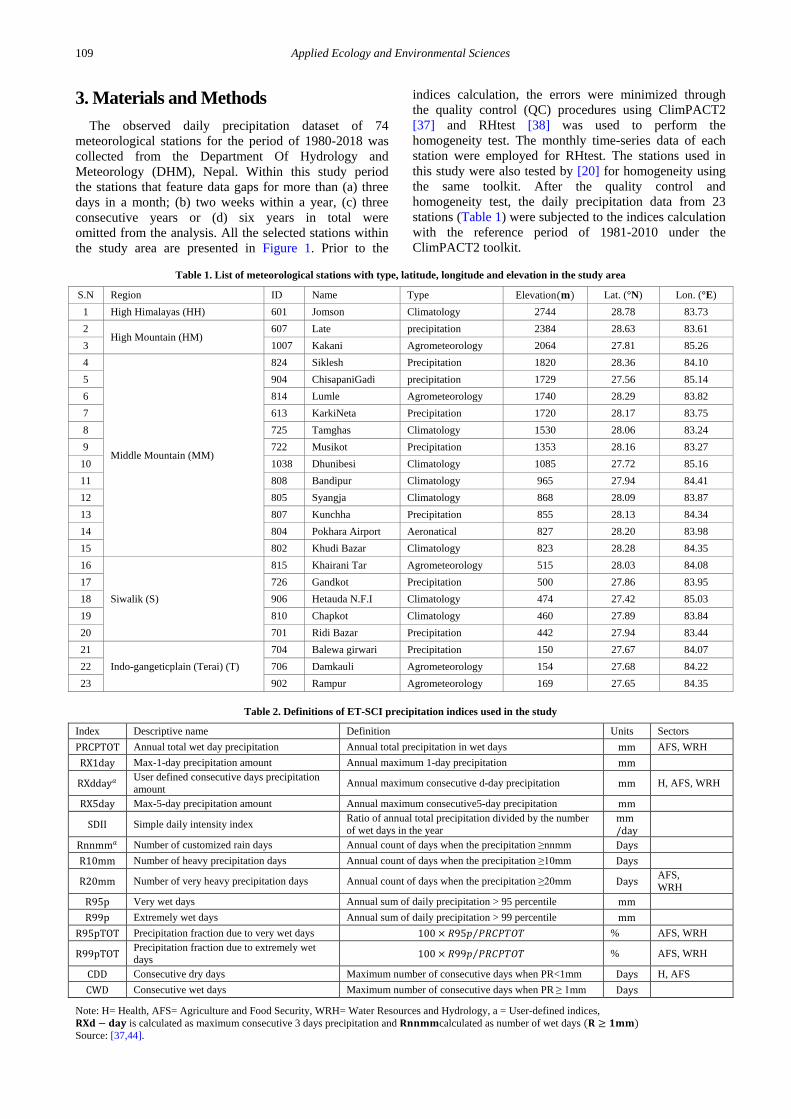
indices calculation, the errors were minimized through the quality control (QC) procedures using ClimPACT2 [37] and RHtest [38] was used to perform the homogeneity test. The monthly time-series data of each station were employed for RHtest. The stations used in this study were also tested by [20] for homogeneity using the same toolkit. After the quality control and homogeneity test, the daily precipitation data from 23 stations (Table 1) were subjected to the indices calculation with the reference period of 1981-2010 under the ClimPACT2 toolkit.
Table 1. List of meteorological stations with type, latitude, longitude and elevation in the study area
S.N Region ID Name Type Elevation(𝐦𝐦) Lat. (°N) Lon. (°E) 1 High Himalayas (HH) 601 Jomson Climatology 2744 28.78 83.73 2
High Mountain (HM) 607 Late precipitation 2384 28.63 83.61
3 1007 Kakani Agrometeorology 2064 27.81 85.26 4
Middle Mountain (MM)
824 Siklesh Precipitation 1820 28.36 84.10 5 904 ChisapaniGadi precipitation 1729 27.56 85.14 6 814 Lumle Agrometeorology 1740 28.29 83.82 7 613 KarkiNeta Precipitation 1720 28.17 83.75 8 725 Tamghas Climatology 1530 28.06 83.24 9 722 Musikot Precipitation 1353 28.16 83.27 10 1038 Dhunibesi Climatology 1085 27.72 85.16 11 808 Bandipur Climatology 965 27.94 84.41 12 805 Syangja Climatology 868 28.09 83.87 13 807 Kunchha Precipitation 855 28.13 84.34 14 804 Pokhara Airport Aeronatical 827 28.20 83.98 15 802 Khudi Bazar Climatology 823 28.28 84.35 16
Siwalik (S)
815 Khairani Tar Agrometeorology 515 28.03 84.08 17 726 Gandkot Precipitation 500 27.86 83.95 18 906 Hetauda N.F.I Climatology 474 27.42 85.03 19 810 Chapkot Climatology 460 27.89 83.84 20 701 Ridi Bazar Precipitation 442 27.94 83.44 21
Indo-gangeticplain (Terai) (T) 704 Balewa girwari Precipitation 150 27.67 84.07
22 706 Damkauli Agrometeorology 154 27.68 84.22 23 902 Rampur Agrometeorology 169 27.65 84.35
Table 2. Definitions of ET-SCI precipitation indices used in the study
Index Descriptive name Definition Units Sectors PRCPTOT Annual total wet day precipitation Annual total precipitation in wet days mm AFS, WRH RX1day Max-1-day precipitation amount Annual maximum 1-day precipitation mm
RXdday𝑎𝑎 User defined consecutive days precipitation amount Annual maximum consecutive d-day precipitation mm H, AFS, WRH
RX5day Max-5-day precipitation amount Annual maximum consecutive5-day precipitation mm
SDII Simple daily intensity index Ratio of annual total precipitation divided by the number of wet days in the year
mm/day
Rnnmm𝑎𝑎 Number of customized rain days Annual count of days when the precipitation ≥nnmm Days R10mm Number of heavy precipitation days Annual count of days when the precipitation ≥10mm Days
R20mm Number of very heavy precipitation days Annual count of days when the precipitation ≥20mm Days AFS, WRH
R95p Very wet days Annual sum of daily precipitation > 95 percentile mm R99p Extremely wet days Annual sum of daily precipitation > 99 percentile mm
R95pTOT Precipitation fraction due to very wet days 100 × 𝑅𝑅95𝑝𝑝 𝑃𝑃𝑅𝑅𝑃𝑃𝑃𝑃𝑃𝑃𝑃𝑃𝑃𝑃⁄ % AFS, WRH
R99pTOT Precipitation fraction due to extremely wet days 100 × 𝑅𝑅99𝑝𝑝 𝑃𝑃𝑅𝑅𝑃𝑃𝑃𝑃𝑃𝑃𝑃𝑃𝑃𝑃⁄ % AFS, WRH
CDD Consecutive dry days Maximum number of consecutive days when PR<1mm Days H, AFS CWD Consecutive wet days Maximum number of consecutive days when PR ≥ 1mm Days
Note: H= Health, AFS= Agriculture and Food Security, WRH= Water Resources and Hydrology, a = User-defined indices, 𝐑𝐑𝐑𝐑𝐑𝐑 − 𝐑𝐑𝐝𝐝𝐝𝐝 is calculated as maximum consecutive 3 days precipitation and 𝐑𝐑𝐑𝐑𝐑𝐑𝐦𝐦𝐦𝐦calculated as number of wet days (𝐑𝐑 ≥ 𝟏𝟏𝐦𝐦𝐦𝐦) Source: [37,44].
Applied Ecology and Environmental Sciences 110
ClimPACT2 gives both core and non-core Expert Team on Sector-Specific Climate Indices (ET-SCI). For our analysis 14, ET-SCI precipitation indices were selectedas presented in Table 2. The non-parametric Mann-Kendall trend test [39,40] was used to assess the significance of the trend in the time series and Sen’s slope estimate [41]was used to determine the true slope. The Excel template is generally known as MAKESENS [42] was used for Mann-Kendall test and Sen’s slope estimation. The trends were considered at 5% level of significance. For the spatial analysis of seasonal and extreme precipitation indices over the basin, we use the most frequently used interpolation method known as the ordinary kriging method in ArcGIS platform [43] to interpolate the values in un-sampled location.
For better understanding all the indices (Table 2) were grouped under five broad categories:
i. Percentile-based indices (R95p, R95p TOT, R99p, R99p TOT)
ii. Absolute indices (RX1day, RX3day, RX5day) iii. Threshold indices (R10mm, R20mm, R1mm) iv. Duration indices (CDD, CWD) v. Other indices (PRCPTOT, SDII).
4. Result and Discussion
4.1. Spatial and Trends Feature of Mean Seasonal Precipitation
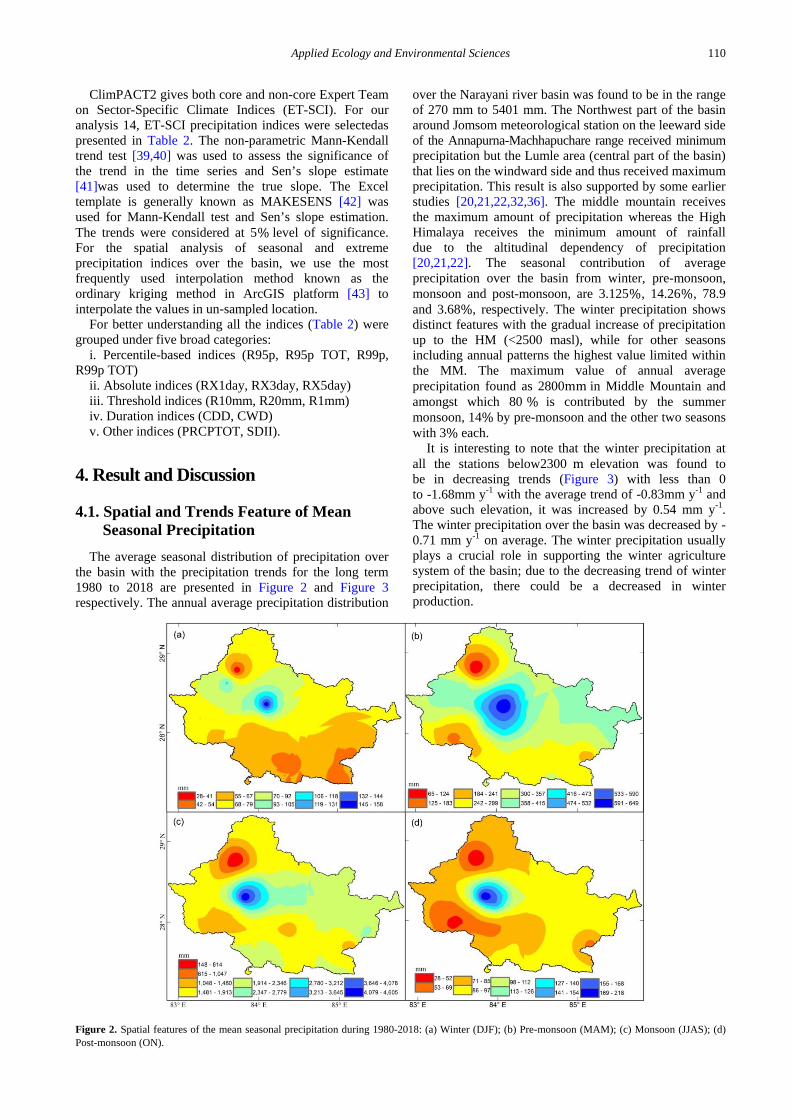
The average seasonal distribution of precipitation over the basin with the precipitation trends for the long term 1980 to 2018 are presented in Figure 2 and Figure 3 respectively. The annual average precipitation distribution
over the Narayani river basin was found to be in the range of 270 mm to 5401 mm. The Northwest part of the basin around Jomsom meteorological station on the leeward side of the Annapurna-Machhapuchare range received minimum precipitation but the Lumle area (central part of the basin) that lies on the windward side and thus received maximum precipitation. This result is also supported by some earlier studies [20,21,22,32,36]. The middle mountain receives the maximum amount of precipitation whereas the High Himalaya receives the minimum amount of rainfall due to the altitudinal dependency of precipitation [20,21,22]. The seasonal contribution of average precipitation over the basin from winter, pre-monsoon, monsoon and post-monsoon, are 3.125%, 14.26%, 78.9 and 3.68%, respectively. The winter precipitation shows distinct features with the gradual increase of precipitation up to the HM (<2500 masl), while for other seasons including annual patterns the highest value limited within the MM. The maximum value of annual average precipitation found as 2800mm in Middle Mountain and amongst which 80 % is contributed by the summer monsoon, 14% by pre-monsoon and the other two seasons with 3% each.
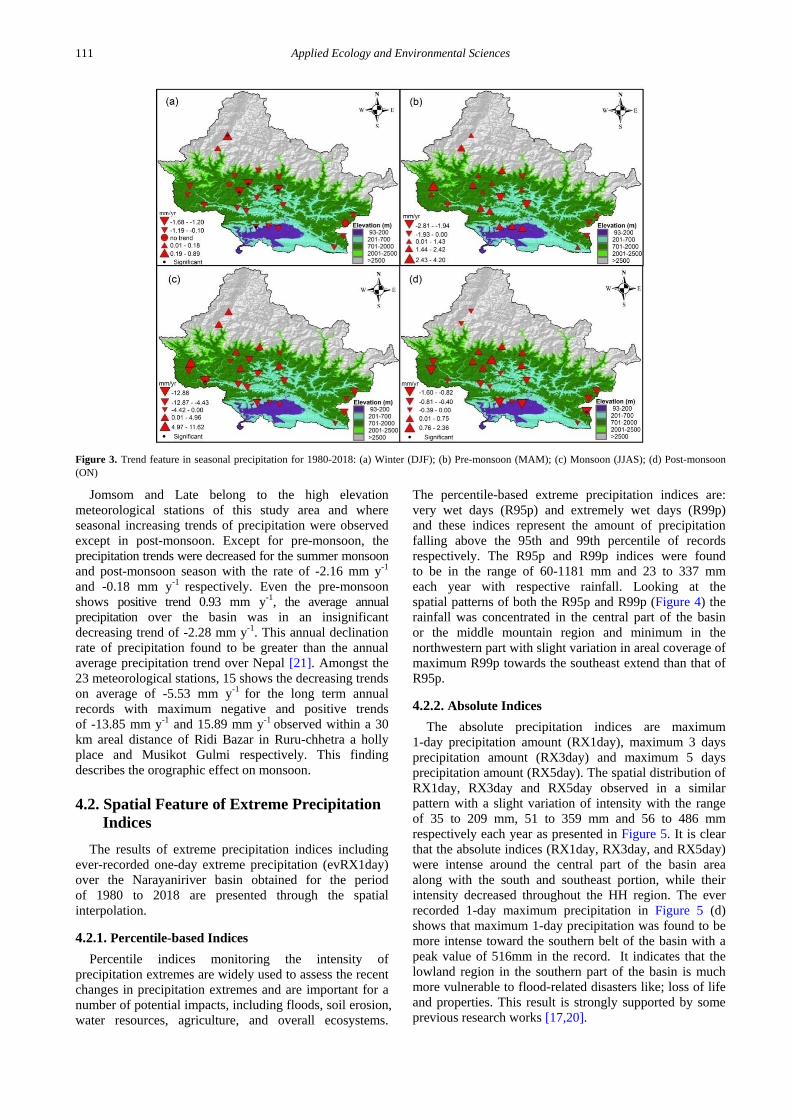
It is interesting to note that the winter precipitation at all the stations below2300 m elevation was found to be in decreasing trends (Figure 3) with less than 0 to -1.68mm y-1 with the average trend of -0.83mm y-1 and above such elevation, it was increased by 0.54 mm y-1. The winter precipitation over the basin was decreased by -0.71 mm y-1 on average. The winter precipitation usually plays a crucial role in supporting the winter agriculture system of the basin; due to the decreasing trend of winter precipitation, there could be a decreased in winter production.
Figure 2. Spatial features of the mean seasonal precipitation during 1980-2018: (a) Winter (DJF); (b) Pre-monsoon (MAM); (c) Monsoon (JJAS); (d) Post-monsoon (ON).
111 Applied Ecology and Environmental Sciences
Figure 3. Trend feature in seasonal precipitation for 1980-2018: (a) Winter (DJF); (b) Pre-monsoon (MAM); (c) Monsoon (JJAS); (d) Post-monsoon (ON)
Jomsom and Late belong to the high elevation meteorological stations of this study area and where seasonal increasing trends of precipitation were observed except in post-monsoon. Except for pre-monsoon, the precipitation trends were decreased for the summer monsoon and post-monsoon season with the rate of -2.16 mm y-1 and -0.18 mm y-1 respectively. Even the pre-monsoon shows positive trend 0.93 mm y-1, the average annual precipitation over the basin was in an insignificant decreasing trend of -2.28 mm y-1. This annual declination rate of precipitation found to be greater than the annual average precipitation trend over Nepal [21]. Amongst the 23 meteorological stations, 15 shows the decreasing trends on average of -5.53 mm y-1 for the long term annual records with maximum negative and positive trends of -13.85 mm y-1 and 15.89 mm y-1 observed within a 30 km areal distance of Ridi Bazar in Ruru-chhetra a holly place and Musikot Gulmi respectively. This finding describes the orographic effect on monsoon.
4.2. Spatial Feature of Extreme Precipitation Indices
The results of extreme precipitation indices including ever-recorded one-day extreme precipitation (evRX1day) over the Narayaniriver basin obtained for the period of 1980 to 2018 are presented through the spatial interpolation.
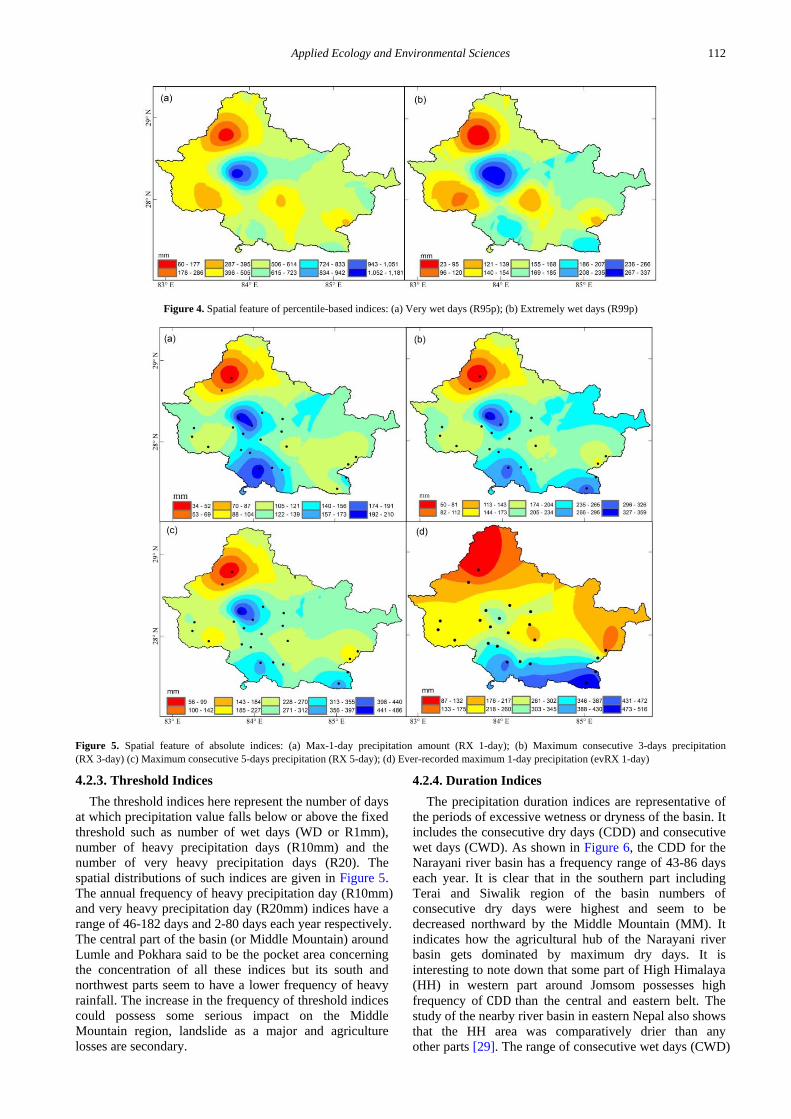
4.2.1. Percentile-based Indices Percentile indices monitoring the intensity of
precipitation extremes are widely used to assess the recent changes in precipitation extremes and are important for a number of potential impacts, including floods, soil erosion, water resources, agriculture, and overall ecosystems.
The percentile-based extreme precipitation indices are: very wet days (R95p) and extremely wet days (R99p) and these indices represent the amount of precipitation falling above the 95th and 99th percentile of records respectively. The R95p and R99p indices were found to be in the range of 60-1181 mm and 23 to 337 mm each year with respective rainfall. Looking at the spatial patterns of both the R95p and R99p (Figure 4) the rainfall was concentrated in the central part of the basin or the middle mountain region and minimum in the northwestern part with slight variation in areal coverage of maximum R99p towards the southeast extend than that of R95p.
4.2.2. Absolute Indices The absolute precipitation indices are maximum
1-day precipitation amount (RX1day), maximum 3 days precipitation amount (RX3day) and maximum 5 days precipitation amount (RX5day). The spatial distribution of RX1day, RX3day and RX5day observed in a similar pattern with a slight variation of intensity with the range of 35 to 209 mm, 51 to 359 mm and 56 to 486 mm respectively each year as presented in Figure 5. It is clear that the absolute indices (RX1day, RX3day, and RX5day) were intense around the central part of the basin area along with the south and southeast portion, while their intensity decreased throughout the HH region. The ever recorded 1-day maximum precipitation in Figure 5 (d) shows that maximum 1-day precipitation was found to be more intense toward the southern belt of the basin with a peak value of 516mm in the record. It indicates that the lowland region in the southern part of the basin is much more vulnerable to flood-related disasters like; loss of life and properties. This result is strongly supported by some previous research works [17,20].
Applied Ecology and Environmental Sciences 112
Figure 4. Spatial feature of percentile-based indices: (a) Very wet days (R95p); (b) Extremely wet days (R99p)
Figure 5. Spatial feature of absolute indices: (a) Max-1-day precipitation amount (RX 1-day); (b) Maximum consecutive 3-days precipitation (RX 3-day) (c) Maximum consecutive 5-days precipitation (RX 5-day); (d) Ever-recorded maximum 1-day precipitation (evRX 1-day) 4.2.3. Threshold Indices
The threshold indices here represent the number of days at which precipitation value falls below or above the fixed threshold such as number of wet days (WD or R1mm), number of heavy precipitation days (R10mm) and the number of very heavy precipitation days (R20). The spatial distributions of such indices are given in Figure 5. The annual frequency of heavy precipitation day (R10mm) and very heavy precipitation day (R20mm) indices have a range of 46-182 days and 2-80 days each year respectively. The central part of the basin (or Middle Mountain) around Lumle and Pokhara said to be the pocket area concerning the concentration of all these indices but its south and northwest parts seem to have a lower frequency of heavy rainfall. The increase in the frequency of threshold indices could possess some serious impact on the Middle Mountain region, landslide as a major and agriculture losses are secondary.
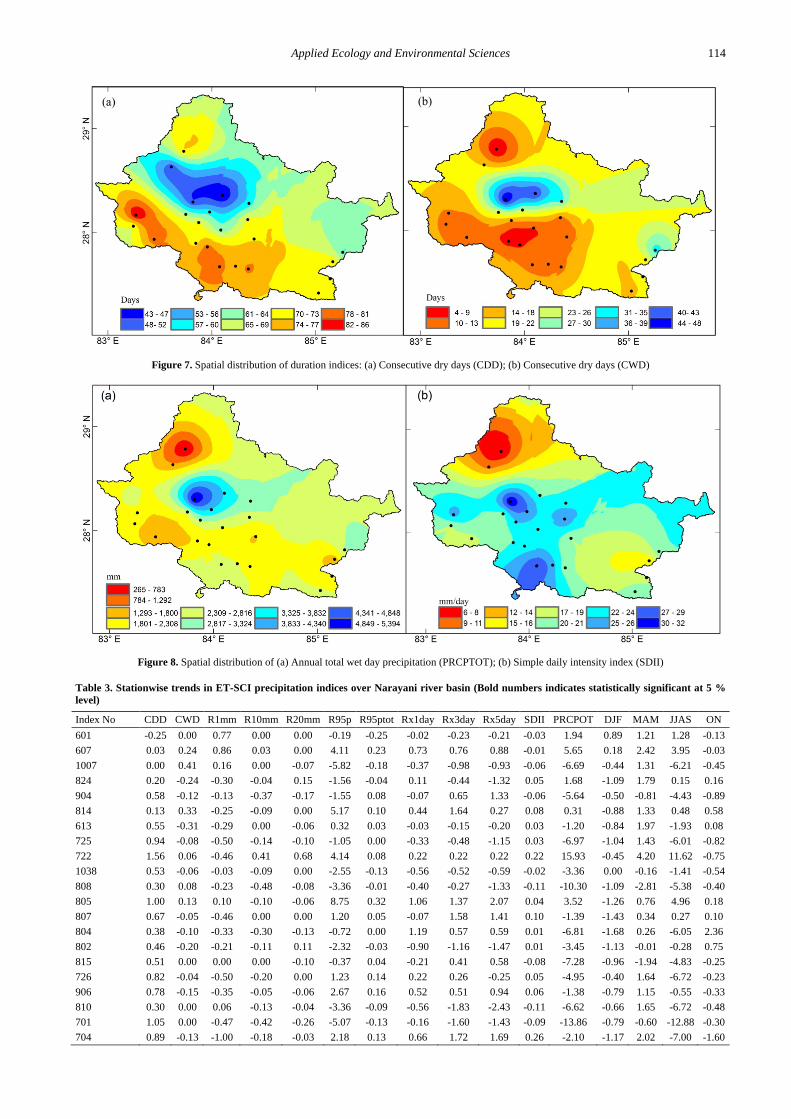
4.2.4. Duration Indices The precipitation duration indices are representative of
the periods of excessive wetness or dryness of the basin. It includes the consecutive dry days (CDD) and consecutive wet days (CWD). As shown in Figure 6, the CDD for the Narayani river basin has a frequency range of 43-86 days each year. It is clear that in the southern part including Terai and Siwalik region of the basin numbers of consecutive dry days were highest and seem to be decreased northward by the Middle Mountain (MM). It indicates how the agricultural hub of the Narayani river basin gets dominated by maximum dry days. It is interesting to note down that some part of High Himalaya (HH) in western part around Jomsom possesses high frequency of CDD than the central and eastern belt. The study of the nearby river basin in eastern Nepal also shows that the HH area was comparatively drier than any other parts [29]. The range of consecutive wet days (CWD)
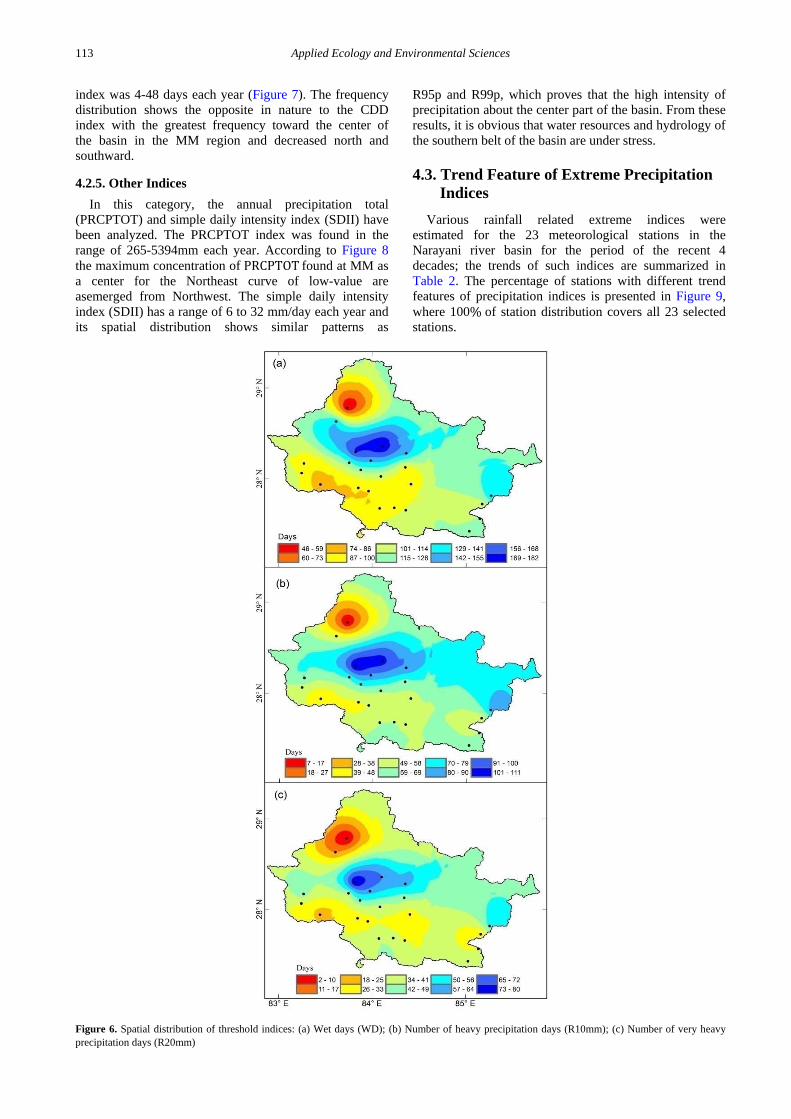
113 Applied Ecology and Environmental Sciences
index was 4-48 days each year (Figure 7). The frequency distribution shows the opposite in nature to the CDD index with the greatest frequency toward the center of the basin in the MM region and decreased north and southward.
4.2.5. Other Indices In this category, the annual precipitation total
(PRCPTOT) and simple daily intensity index (SDII) have been analyzed. The PRCPTOT index was found in the range of 265-5394mm each year. According to Figure 8 the maximum concentration of PRCPTOT found at MM as a center for the Northeast curve of low-value are asemerged from Northwest. The simple daily intensity index (SDII) has a range of 6 to 32 mm/day each year and its spatial distribution shows similar patterns as
R95p and R99p, which proves that the high intensity of precipitation about the center part of the basin. From these results, it is obvious that water resources and hydrology of the southern belt of the basin are under stress.
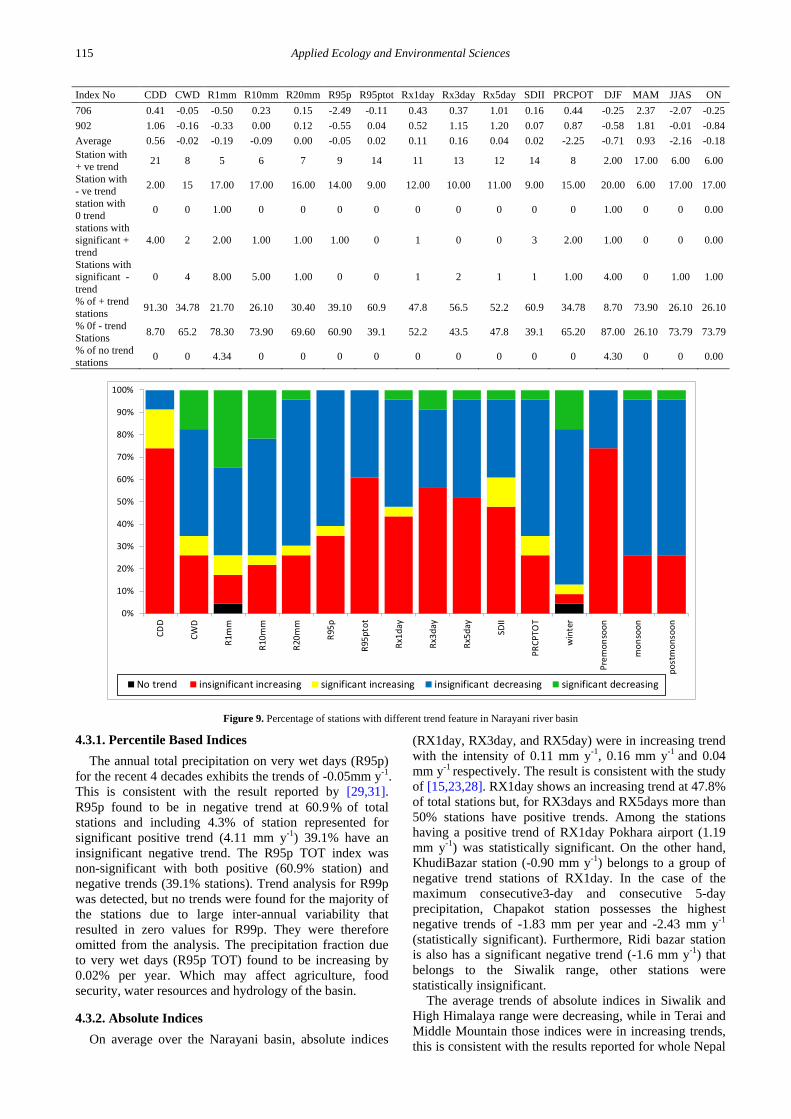
4.3. Trend Feature of Extreme Precipitation Indices
Various rainfall related extreme indices were estimated for the 23 meteorological stations in the Narayani river basin for the period of the recent 4 decades; the trends of such indices are summarized in Table 2. The percentage of stations with different trend features of precipitation indices is presented in Figure 9, where 100% of station distribution covers all 23 selected stations.
Figure 6. Spatial distribution of threshold indices: (a) Wet days (WD); (b) Number of heavy precipitation days (R10mm); (c) Number of very heavy precipitation days (R20mm)
Applied Ecology and Environmental Sciences 114
Figure 7. Spatial distribution of duration indices: (a) Consecutive dry days (CDD); (b) Consecutive dry days (CWD)
Figure 8. Spatial distribution of (a) Annual total wet day precipitation (PRCPTOT); (b) Simple daily intensity index (SDII)
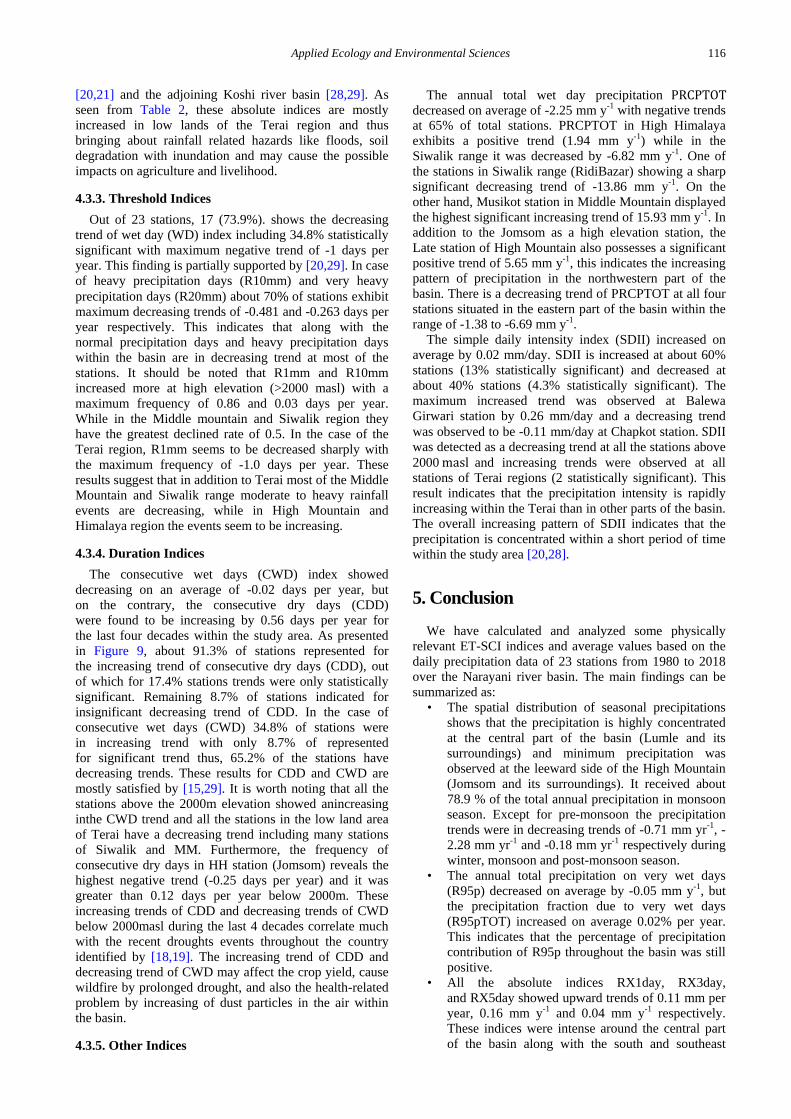
Table 3. Stationwise trends in ET-SCI precipitation indices over Narayani river basin (Bold numbers indicates statistically significant at 5 % level)
Index No CDD CWD R1mm R10mm R20mm R95p R95ptot Rx1day Rx3day Rx5day SDII PRCPOT DJF MAM JJAS ON 601 -0.25 0.00 0.77 0.00 0.00 -0.19 -0.25 -0.02 -0.23 -0.21 -0.03 1.94 0.89 1.21 1.28 -0.13 607 0.03 0.24 0.86 0.03 0.00 4.11 0.23 0.73 0.76 0.88 -0.01 5.65 0.18 2.42 3.95 -0.03 1007 0.00 0.41 0.16 0.00 -0.07 -5.82 -0.18 -0.37 -0.98 -0.93 -0.06 -6.69 -0.44 1.31 -6.21 -0.45 824 0.20 -0.24 -0.30 -0.04 0.15 -1.56 -0.04 0.11 -0.44 -1.32 0.05 1.68 -1.09 1.79 0.15 0.16 904 0.58 -0.12 -0.13 -0.37 -0.17 -1.55 0.08 -0.07 0.65 1.33 -0.06 -5.64 -0.50 -0.81 -4.43 -0.89 814 0.13 0.33 -0.25 -0.09 0.00 5.17 0.10 0.44 1.64 0.27 0.08 0.31 -0.88 1.33 0.48 0.58 613 0.55 -0.31 -0.29 0.00 -0.06 0.32 0.03 -0.03 -0.15 -0.20 0.03 -1.20 -0.84 1.97 -1.93 0.08 725 0.94 -0.08 -0.50 -0.14 -0.10 -1.05 0.00 -0.33 -0.48 -1.15 0.03 -6.97 -1.04 1.43 -6.01 -0.82 722 1.56 0.06 -0.46 0.41 0.68 4.14 0.08 0.22 0.22 0.22 0.22 15.93 -0.45 4.20 11.62 -0.75 1038 0.53 -0.06 -0.03 -0.09 0.00 -2.55 -0.13 -0.56 -0.52 -0.59 -0.02 -3.36 0.00 -0.16 -1.41 -0.54 808 0.30 0.08 -0.23 -0.48 -0.08 -3.36 -0.01 -0.40 -0.27 -1.33 -0.11 -10.30 -1.09 -2.81 -5.38 -0.40 805 1.00 0.13 0.10 -0.10 -0.06 8.75 0.32 1.06 1.37 2.07 0.04 3.52 -1.26 0.76 4.96 0.18 807 0.67 -0.05 -0.46 0.00 0.00 1.20 0.05 -0.07 1.58 1.41 0.10 -1.39 -1.43 0.34 0.27 0.10 804 0.38 -0.10 -0.33 -0.30 -0.13 -0.72 0.00 1.19 0.57 0.59 0.01 -6.81 -1.68 0.26 -6.05 2.36 802 0.46 -0.20 -0.21 -0.11 0.11 -2.32 -0.03 -0.90 -1.16 -1.47 0.01 -3.45 -1.13 -0.01 -0.28 0.75 815 0.51 0.00 0.00 0.00 -0.10 -0.37 0.04 -0.21 0.41 0.58 -0.08 -7.28 -0.96 -1.94 -4.83 -0.25 726 0.82 -0.04 -0.50 -0.20 0.00 1.23 0.14 0.22 0.26 -0.25 0.05 -4.95 -0.40 1.64 -6.72 -0.23 906 0.78 -0.15 -0.35 -0.05 -0.06 2.67 0.16 0.52 0.51 0.94 0.06 -1.38 -0.79 1.15 -0.55 -0.33 810 0.30 0.00 0.06 -0.13 -0.04 -3.36 -0.09 -0.56 -1.83 -2.43 -0.11 -6.62 -0.66 1.65 -6.72 -0.48 701 1.05 0.00 -0.47 -0.42 -0.26 -5.07 -0.13 -0.16 -1.60 -1.43 -0.09 -13.86 -0.79 -0.60 -12.88 -0.30 704 0.89 -0.13 -1.00 -0.18 -0.03 2.18 0.13 0.66 1.72 1.69 0.26 -2.10 -1.17 2.02 -7.00 -1.60
115 Applied Ecology and Environmental Sciences
Index No CDD CWD R1mm R10mm R20mm R95p R95ptot Rx1day Rx3day Rx5day SDII PRCPOT DJF MAM JJAS ON 706 0.41 -0.05 -0.50 0.23 0.15 -2.49 -0.11 0.43 0.37 1.01 0.16 0.44 -0.25 2.37 -2.07 -0.25 902 1.06 -0.16 -0.33 0.00 0.12 -0.55 0.04 0.52 1.15 1.20 0.07 0.87 -0.58 1.81 -0.01 -0.84 Average 0.56 -0.02 -0.19 -0.09 0.00 -0.05 0.02 0.11 0.16 0.04 0.02 -2.25 -0.71 0.93 -2.16 -0.18 Station with + ve trend 21 8 5 6 7 9 14 11 13 12 14 8 2.00 17.00 6.00 6.00
Station with - ve trend 2.00 15 17.00 17.00 16.00 14.00 9.00 12.00 10.00 11.00 9.00 15.00 20.00 6.00 17.00 17.00
station with 0 trend 0 0 1.00 0 0 0 0 0 0 0 0 0 1.00 0 0 0.00
stations with significant + trend
4.00 2 2.00 1.00 1.00 1.00 0 1 0 0 3 2.00 1.00 0 0 0.00
Stations with significant - trend
0 4 8.00 5.00 1.00 0 0 1 2 1 1 1.00 4.00 0 1.00 1.00
% of + trend stations 91.30 34.78 21.70 26.10 30.40 39.10 60.9 47.8 56.5 52.2 60.9 34.78 8.70 73.90 26.10 26.10
% 0f - trend Stations 8.70 65.2 78.30 73.90 69.60 60.90 39.1 52.2 43.5 47.8 39.1 65.20 87.00 26.10 73.79 73.79
% of no trend stations 0 0 4.34 0 0 0 0 0 0 0 0 0 4.30 0 0 0.00
Figure 9. Percentage of stations with different trend feature in Narayani river basin
4.3.1. Percentile Based Indices The annual total precipitation on very wet days (R95p)
for the recent 4 decades exhibits the trends of -0.05mm y-1. This is consistent with the result reported by [29,31]. R95p found to be in negative trend at 60.9% of total stations and including 4.3% of station represented for significant positive trend (4.11 mm y-1) 39.1% have an insignificant negative trend. The R95p TOT index was non-significant with both positive (60.9% station) and negative trends (39.1% stations). Trend analysis for R99p was detected, but no trends were found for the majority of the stations due to large inter-annual variability that resulted in zero values for R99p. They were therefore omitted from the analysis. The precipitation fraction due to very wet days (R95p TOT) found to be increasing by 0.02% per year. Which may affect agriculture, food security, water resources and hydrology of the basin.
4.3.2. Absolute Indices On average over the Narayani basin, absolute indices
(RX1day, RX3day, and RX5day) were in increasing trend with the intensity of 0.11 mm y-1, 0.16 mm y-1 and 0.04 mm y-1 respectively. The result is consistent with the study of [15,23,28]. RX1day shows an increasing trend at 47.8% of total stations but, for RX3days and RX5days more than 50% stations have positive trends. Among the stations having a positive trend of RX1day Pokhara airport (1.19 mm y-1) was statistically significant. On the other hand, KhudiBazar station (-0.90 mm y-1) belongs to a group of negative trend stations of RX1day. In the case of the maximum consecutive3-day and consecutive 5-day precipitation, Chapakot station possesses the highest negative trends of -1.83 mm per year and -2.43 mm y-1 (statistically significant). Furthermore, Ridi bazar station is also has a significant negative trend (-1.6 mm y-1) that belongs to the Siwalik range, other stations were statistically insignificant.
The average trends of absolute indices in Siwalik and High Himalaya range were decreasing, while in Terai and Middle Mountain those indices were in increasing trends, this is consistent with the results reported for whole Nepal
0%
10%
20%
30%
40%
50%
60%
70%
80%
90%
100%
CDD
CWD
R1m
m
R10m
m
R20m
m
R95p
R95p
tot
Rx1d
ay
Rx3d
ay
Rx5d
ay
SDII
PRCP
TOT
win
ter
Prem
onso
on
mon
soon
post
mon
soon
No trend insignificant increasing significant increasing insignificant decreasing significant decreasing
Applied Ecology and Environmental Sciences 116
[20,21] and the adjoining Koshi river basin [28,29]. As seen from Table 2, these absolute indices are mostly increased in low lands of the Terai region and thus bringing about rainfall related hazards like floods, soil degradation with inundation and may cause the possible impacts on agriculture and livelihood.
4.3.3. Threshold Indices Out of 23 stations, 17 (73.9%). shows the decreasing
trend of wet day (WD) index including 34.8% statistically significant with maximum negative trend of -1 days per year. This finding is partially supported by [20,29]. In case of heavy precipitation days (R10mm) and very heavy precipitation days (R20mm) about 70% of stations exhibit maximum decreasing trends of -0.481 and -0.263 days per year respectively. This indicates that along with the normal precipitation days and heavy precipitation days within the basin are in decreasing trend at most of the stations. It should be noted that R1mm and R10mm increased more at high elevation (>2000 masl) with a maximum frequency of 0.86 and 0.03 days per year. While in the Middle mountain and Siwalik region they have the greatest declined rate of 0.5. In the case of the Terai region, R1mm seems to be decreased sharply with the maximum frequency of -1.0 days per year. These results suggest that in addition to Terai most of the Middle Mountain and Siwalik range moderate to heavy rainfall events are decreasing, while in High Mountain and Himalaya region the events seem to be increasing.
4.3.4. Duration Indices The consecutive wet days (CWD) index showed
decreasing on an average of -0.02 days per year, but on the contrary, the consecutive dry days (CDD) were found to be increasing by 0.56 days per year for the last four decades within the study area. As presented in Figure 9, about 91.3% of stations represented for the increasing trend of consecutive dry days (CDD), out of which for 17.4% stations trends were only statistically significant. Remaining 8.7% of stations indicated for insignificant decreasing trend of CDD. In the case of consecutive wet days (CWD) 34.8% of stations were in increasing trend with only 8.7% of represented for significant trend thus, 65.2% of the stations have decreasing trends. These results for CDD and CWD are mostly satisfied by [15,29]. It is worth noting that all the stations above the 2000m elevation showed anincreasing inthe CWD trend and all the stations in the low land area of Terai have a decreasing trend including many stations of Siwalik and MM. Furthermore, the frequency of consecutive dry days in HH station (Jomsom) reveals the highest negative trend (-0.25 days per year) and it was greater than 0.12 days per year below 2000m. These increasing trends of CDD and decreasing trends of CWD below 2000masl during the last 4 decades correlate much with the recent droughts events throughout the country identified by [18,19]. The increasing trend of CDD and decreasing trend of CWD may affect the crop yield, cause wildfire by prolonged drought, and also the health-related problem by increasing of dust particles in the air within the basin.
4.3.5. Other Indices
The annual total wet day precipitation PRCPTOT decreased on average of -2.25 mm y-1 with negative trends at 65% of total stations. PRCPTOT in High Himalaya exhibits a positive trend (1.94 mm y-1) while in the Siwalik range it was decreased by -6.82 mm y-1. One of the stations in Siwalik range (RidiBazar) showing a sharp significant decreasing trend of -13.86 mm y-1. On the other hand, Musikot station in Middle Mountain displayed the highest significant increasing trend of 15.93 mm y-1. In addition to the Jomsom as a high elevation station, the Late station of High Mountain also possesses a significant positive trend of 5.65 mm y-1, this indicates the increasing pattern of precipitation in the northwestern part of the basin. There is a decreasing trend of PRCPTOT at all four stations situated in the eastern part of the basin within the range of -1.38 to -6.69 mm y-1.
The simple daily intensity index (SDII) increased on average by 0.02 mm/day. SDII is increased at about 60% stations (13% statistically significant) and decreased at about 40% stations (4.3% statistically significant). The maximum increased trend was observed at Balewa Girwari station by 0.26 mm/day and a decreasing trend was observed to be -0.11 mm/day at Chapkot station. SDII was detected as a decreasing trend at all the stations above 2000 masl and increasing trends were observed at all stations of Terai regions (2 statistically significant). This result indicates that the precipitation intensity is rapidly increasing within the Terai than in other parts of the basin. The overall increasing pattern of SDII indicates that the precipitation is concentrated within a short period of time within the study area [20,28].
5. Conclusion
We have calculated and analyzed some physically relevant ET-SCI indices and average values based on the daily precipitation data of 23 stations from 1980 to 2018 over the Narayani river basin. The main findings can be summarized as:
• The spatial distribution of seasonal precipitations shows that the precipitation is highly concentrated at the central part of the basin (Lumle and its surroundings) and minimum precipitation was observed at the leeward side of the High Mountain (Jomsom and its surroundings). It received about 78.9 % of the total annual precipitation in monsoon season. Except for pre-monsoon the precipitation trends were in decreasing trends of -0.71 mm yr-1, -2.28 mm yr-1 and -0.18 mm yr-1 respectively during winter, monsoon and post-monsoon season.
• The annual total precipitation on very wet days (R95p) decreased on average by -0.05 mm y-1, but the precipitation fraction due to very wet days (R95pTOT) increased on average 0.02% per year. This indicates that the percentage of precipitation contribution of R95p throughout the basin was still positive.
• All the absolute indices RX1day, RX3day, and RX5day showed upward trends of 0.11 mm per year, 0.16 mm y-1 and 0.04 mm y-1 respectively. These indices were intense around the central part of the basin along with the south and southeast
117 Applied Ecology and Environmental Sciences
portion. It resembles the intense precipitation therein and thus bringing about rainfall related hazards like floods, soil erosion and more.
• The threshold indices over the basin exhibited decreasing trends, most notably, the normal precipitation days (R1mm) and heavy precipitation days (R10mm) were increased more at higher elevation (>2000 masl) while, most of the stations below 2000masl were in decreasing trends. Which indicates that, middle mountain, Siwalik and Terai region leading towards drier conditions.
• More than 90% stations within a Narayani river basin represented for increasing trends (on average 0.56 days per year) of consecutive dry days (CDD) and on the contrary 65% of stations indicted for decreasing trends (on an average of -0.02 days per year) for the consecutive wet days(CWD). It is worth noting that all the stations above the 2000 m elevation showed increasing in the CWD trend and all the stations in the low land area of Terai have decreasing trends including many stations of Siwalik and MM. An increasing trend of CDD and the decreasing trend of CWD linked with the livelihood of the people in the area, which affects the agriculture activities through prolongation of the drought period.
• The simple daily intensity index (SDII) increased on average of 0.02 mm/day (at about 60% stations). SDII was detected as a decreasing trend at all the stations above 2000m and increasing trends were observed at all stations of Terai regions. But, mixed patterns were observed in Mountainous regions.
• PRCPTOT in High Himalaya exhibits a positive trend (1.94 mm y-1) while in the Siwalik range it was decreased by -6.82 mm y-1. There is a decreasing trend of PRCPTOT at all four stations (Hetauda, Chisapani-Gadi, Dhunibesi, Kakani) situated in the eastern part of the basin with the range of -1.38 to -6.69 mm y-1. It suggests that there may be a possible impact on the overall agriculture facilities and food security including water scarcity in the eastern belt of the basin.
Acknowledgements
The authors like to thank Department of Hydrology and Meteorology (DHM), Government of Nepal forthe meteorological data. The corresponding author (BD) is thankful to Kathmandu Center for Research and Education, Chinese Academy of Sciences-Tribhuvan University, (KCRE) for the support.
Conflicts of Interests
The authors declare that there is no conflict of interests regarding this paper.
References [1] WMO, 2017, “Climate Breaks Multiple Records in 2016, with
Global Impacts.,” World Meteorological Organization [Online]. Available: https://public.wmo.int/en/media/press-release/climate-breaks-multiple-records-2016-global-impacts. [Accessed: 30-Mar-2020].
[2] WMO, 2020, “Multi-Agency Report Highlights Increasing Signs and Impacts of Climate Change in Atmosphere, Land and Oceans,” World Meteorological Organization [Online]. Available: https://public.wmo.int/en/media/press-release/multi-agency-report-highlights-increasing-signs-and-impacts-of-climate-change. [Accessed: 30-Mar-2020].
[3] IPCC, 2012, Managing the Risks of Extreme Events and Disasters to Advance Climate Change Adaptation: Special Report of the Intergovernmental Panel on Climate Change, Cambridge University Press, Cambridge.
[4] IPCC, W., 2013, “Climate Change 2013: The Physical Science Basis: Working Group I Contribution to the Fifth Assessment Report of the Intergovernmental Panel on Climate Change,” IPCC WGI. Accessed May, 14, p. 2014.
[5] Zhang, X., Alexander, L., Hegerl, G. C., Jones, P., Tank, A. K., Peterson, T. C., Trewin, B., and Zwiers, F. W., 2011, “Indices for Monitoring Changes in Extremes Based on Daily Temperature and Precipitation Data,” Wiley Interdisciplinary Reviews: Climate Change, 2(6), pp. 851-870.
[6] Trenberth, K. E., Dai, A., Rasmussen, R. M., and Parsons, D. B., 2003, “The Changing Character of Precipitation,” Bulletin of the American Meteorological Society, 84(9), pp. 1205-1218.
[7] Myhre, G., Alterskjær, K., Stjern, C. W., Hodnebrog, Ø., Marelle, L., Samset, B. H., Sillmann, J., Schaller, N., Fischer, E., and Schulz, M., 2019, “Frequency of Extreme Precipitation Increases Extensively with Event Rareness under Global Warming,” Scientific reports, 9(1), pp. 1-10.
[8] Alexander, L. V., Zhang, X., Peterson, T. C., Caesar, J., Gleason, B., Klein Tank, A. M. G., Haylock, M., Collins, D., Trewin, B., and Rahimzadeh, F., 2006, “Global Observed Changes in Daily Climate Extremes of Temperature and Precipitation,” Journal of Geophysical Research: Atmospheres, 111(D5).
[9] Donat, M. G., Lowry, A. L., Alexander, L. V., O’Gorman, P. A., and Maher, N., 2016, “More Extreme Precipitation in the World’s Dry and Wet Regions,” Nature Climate Change, 6(5), pp. 508-513.
[10] Yadav, R. R., 2011, “Long-Term Hydroclimatic Variability in Monsoon Shadow Zone of Western Himalaya, India,” Climate Dynamics, 36(7-8), pp. 1453-1462.
[11] Huang, R., Zhu, H., Liang, E., Grießinger, J., Dawadi, B., and Bräuning, A., 2019, “High-Elevation Shrub-Ring Δ18O on the Northern Slope of the Central Himalayas Records Summer (May-July) Temperatures,” Palaeogeography, palaeoclimatology, palaeoecology, 524, pp. 230-239.
[12] Dawadi, B., Liang, E., Tian, L., Devkota, L. P., and Yao, T., 2013, “Pre-Monsoon Precipitation Signal in Tree Rings of Timberline Betula Utilis in the Central Himalayas,” Quaternary International, 283, pp. 72-77.
[13] Liang, E., Dawadi, B., Pederson, N., Piao, S., Zhu, H., Sigdel, S. R., and Chen, D., 2019, “Strong Link between Large Tropical Volcanic Eruptions and Severe Droughts Prior to Monsoon in the Central Himalayas Revealed by Tree-Ring Records,” Science Bulletin, 64(14), pp. 1018-1023.
[14] Singh, D., Tsiang, M., Rajaratnam, B., and Diffenbaugh, N. S., 2014, “Observed Changes in Extreme Wet and Dry Spells during the South Asian Summer Monsoon Season,” Nature Climate Change, 4(6), pp. 456-461.
[15] Zhan, Y.-J., Ren, G.-Y., Shrestha, A. B., Rajbhandari, R., Ren, Y.-Y., Sanjay, J., Xu, Y., Sun, X.-B., You, Q.-L., and Wang, S., 2017, “Changes in Extreme Precipitation Events over the Hindu Kush Himalayan Region during 1961-2012,” Advances in Climate Change Research, 8(3), pp. 166-175.
[16] MoHA, Dpn. N., and UNDP, O., 2009, Nepal Disaster Report: The Hazardscape and Vulnerability, Jagadamba Press.
[17] Eckstein, D., Hutfils, M.-L., and Winges, M., 2018, Global Climate Risk Index 2019: Who Suffers Most from Extreme Weather Events? Weather-Related Loss Events in 2017 and 1998 to 2017, Germanwatch Nord-Süd Initiative eV.
[18] Sigdel, M., and Ikeda, M., 2010, “Spatial and Temporal Analysis of Drought in Nepal Using Standardized Precipitation Index and Its Relationship with Climate Indices,” Journal of Hydrology and Meteorology, 7(1), pp. 59-74.
[19] Dahal, P., Shrestha, N. S., Shrestha, M. L., Krakauer, N. Y., Panthi, J., Pradhanang, S. M., Jha, A., and Lakhankar, T., 2016,
Applied Ecology and Environmental Sciences 118
“Drought Risk Assessment in Central Nepal: Temporal and Spatial Analysis,” Natural Hazards, 80(3), pp. 1913-1932.
[20] Karki, R., Schickhoff, U., Scholten, T., and Böhner, J., 2017, “Rising Precipitation Extremes across Nepal,” Climate, 5(1), p. 4.
[21] DHM, 2017, Observed Climate Trend Analysis in the Districts and Physiographic Regions of Nepal (1971-2014), Department of Hydrology and Meteorology (DHM) Kathmandu.
[22] Kansakar, S. R., Hannah, D. M., Gerrard, J., and Rees, G., 2004, “Spatial Pattern in the Precipitation Regime of Nepal,” International Journal of Climatology: A Journal of the Royal Meteorological Society, 24(13), pp. 1645-1659.
[23] Baidya, S. K., Shrestha, M. L., and Sheikh, M. M., 2008, “Trends in Daily Climatic Extremes of Temperature and Precipitation in Nepal,” Journal of Hydrology and Meteorology, 5(1), pp. 38-51.
[24] Bohlinger, P., and Sorteberg, A., 2018, “A Comprehensive View on Trends in Extreme Precipitation in Nepal and Their Spatial Distribution,” International Journal of Climatology, 38(4), pp. 1833-1845.
[25] Talchabhadel, R., Karki, R., Thapa, B. R., Maharjan, M., and Parajuli, B., 2018, “Spatio-Temporal Variability of Extreme Precipitation in Nepal,” Int J Climatol, 38(11), pp. 4296-4313.
[26] Sigdel, M., and Ma, Y., 2017, “Variability and Trends in Daily Precipitation Extremes on the Northern and Southern Slopes of the Central Himalaya,” Theoretical and Applied Climatology, 130(1-2), pp. 571-581.
[27] Dahal, N., Shrestha, U. B., Tuitui, A., and Ojha, H. R., 2019, “Temporal Changes in Precipitation and Temperature and Their Implications on the Streamflow of Rosi River, Central Nepal,” Climate, 7(1), p. 3.
[28] Shrestha, A. B., Bajracharya, S. R., Sharma, A. R., Duo, C., and Kulkarni, A., 2017, “Observed Trends and Changes in Daily Temperature and Precipitation Extremes over the Koshi River Basin 1975-2010,” International Journal of Climatology, 37(2), pp. 1066-1083.
[29] Subba, S., Ma, Y., and Ma, W., 2019, “Spatial and Temporal Analysis of Precipitation Extremities of Eastern Nepal in the Last Two Decades (1997-2016),” Journal of Geophysical Research: Atmospheres, 124(14), pp. 7523-7539.
[30] Devkota, R. P., and Bhattarai, U., 2018, “Assessment of Climate Change Impact on Floods from a Techno-Social Perspective,” Journal of Flood Risk Management, 11, pp. S186-S196.
[31] Manandhar, S., Pandey, V. P., and Kazama, F., 2012, “Hydro-Climatic Trends and People’s Perceptions: Case of Kali Gandaki River Basin, Nepal,” Climate research, 54(2), pp. 167-179.
[32] Panthi, J., Dahal, P., Shrestha, M. L., Aryal, S., Krakauer, N. Y., Pradhanang, S. M., Lakhankar, T., Jha, A. K., Sharma, M., and Karki, R., 2015, “Spatial and Temporal Variability of Rainfall in the Gandaki River Basin of Nepal Himalaya,” Climate, 3(1), pp. 210-226.
[33] Bajracharya, S. R., and Shrestha, B. R., 2011, The Status of Glaciers in the Hindu Kush-Himalayan Region, International Centre for Integrated Mountain Development (ICIMOD).
[34] Authority, N. E., 2008, Nepal Electricity Authority Fiscal Year 2007/08—AYear in Review, Kathmandu.
[35] Dandekhya, S., England, M., Ghate, R., Goodrich, C. G., Nepal, S., Prakash, A., Shrestha, A., Singh, S., Shrestha, M. S., and Udas, P. B., 2017, “The Gandaki Basin: Maintaining Livelihoods in the Face of Landslides, Floods, and Drought,” HI-AWARE Working Paper, 9.
[36] Karki, R., Talchabhadel, R., Aalto, J., and Baidya, S. K., 2016, “New Climatic Classification of Nepal,” Theoretical and applied climatology, 125(3-4), pp. 799-808.
[37] Alexander, L., and Herold, N., 2016, “ClimPACT2: Indices and Software.”
[38] Wang, X. L., and Feng, Y., 2013, “Climate Research Division Atmospheric Science and Technology Directorate Science and Technology Branch, Environment Canada Toronto, Ontario, Canada,” Ontario, Canada, 17.
[39] Mann, H. B., 1945, “Nonparametric Tests against Trend,” Econometrica: Journal of the Econometric Society, pp. 245-259.
[40] Kendall, M. G., 1955, “Rank Correlation Methods.” [41] Sen, P. K., 1968, “Estimates of the Regression Coefficient Based
on Kendall’s Tau,” Journal of the American statistical association, 63(324), pp. 1379-1389.
[42] Salmi, T., Määttä, A., Anttila, P., Ruoho-Airola, T., Amnell, T., and Maatta, A., 2002, “Detecting Trends of Annual Values of Atmospheric Pollutants by the Mann-Kendall Test and Sen’s Slope Estimates: The Excel Template Application MAKESENS.”
[43] Zimmerman, D., Pavlik, C., Ruggles, A., and Armstrong, M. P., 1999, “An Experimental Comparison of Ordinary and Universal Kriging and Inverse Distance Weighting,” Mathematical Geology, 31(4), pp. 375-390.
[44] Alexander, L., Yang, H., and Perkins, S., 2013, “Clim PACT,” Indices and software. A document prepared on behalf of The commission for climatology (CCl) expert team on climate risk and sector-Specific Climate Indices (ET CRSCI).
© The Author(s) 2020. This article is an open access article distributed under the terms and conditions of the Creative Commons Attribution (CC BY) license (http://creativecommons.org/licenses/by/4.0/).