\~--4~6?8? - CiteSeerX
118
C c .. 4 STATISTICAL STUDY OF A UNIFORM AND A NORMAL RANDOM NUMBER GENERATOR BY George Chris Canavos Thesis submitted to the Graduate Faculty of the Virginia Polytechnic Institute in candidacy for the degree of MASTER OF SCIENCE in Statistics December 1966 . . ----cam., r,,,rrncD\ (THRU) \ACC.cJJl",. Id"..."-.., c z (CODE) /3 \~--4~6?8? OR TMX OR AD NUMBER) 5 P c y (NASA CR (PA~ES) (CATEGORY) =!
-
Upload
khangminh22 -
Category
Documents
-
view
1 -
download
0
Transcript of \~--4~6?8? - CiteSeerX

C c
.. 4
STATISTICAL STUDY OF A UNIFORM AND
A NORMAL RANDOM NUMBER GENERATOR
BY
George C h r i s Canavos
Thesis submitted t o the Graduate Faculty of the
Virginia Polytechnic I n s t i t u t e
i n candidacy for the degree of
MASTER OF SCIENCE
i n
S t a t i s t i c s
December 1966
. . ----cam., r , , , r r n c D \ (THRU) \ACC.cJJl",. Id"..."-.., c z
(CODE) /3
\~--4~6?8? OR TMX OR AD NUMBER)
5 P c y (NASA CR
( P A ~ E S )
(CATEGORY) =!

APPROVED
I/ .
STATISTICAL STum OF A UNIFOI(M AND
A NORMAL RANDOM NUMBER GENERATOR
by
George Chris Canavos
Thesis submitted t o the Graduate Faculty of the
Virginia Polytechnic I n s t i t u t e
i n candidacy f o r the degree of
MASTER OF SCIENCE
i n
St a t i s t i c s
Chairman, Richard G. Krutchkoff
Boyd Harshbarger Raymond H. Myers
Whitney L. Johnson
nrArrmLan id& YFic.cIyI"bL I,""
Blacksburg, Virginia

- 2 -
TABLE OF CONTENTS
CHAFTER PAGE
I . INTROIWCTION . . . . . . . . . . . . . . . . . . . . . . . 4
1.1 Objectives . . . . . . . . . . . . . . . . . . . . . 4
1.2 Background . . . . . . . . . . . . . . . . . . . . . 4
I1 THEGENERATORS . . 7 2.1 The Uniform Random Number Generator . . . . . . . . . 7
2.2 The Normal Randm Number Generator . . . . . . . . . 11.
1x1 .riy j rL"pm"mibFkTicIi OF 7jTjTj 65 y i .
IBM-7094 COMPUTER . . . . . . . . . . . . . . . . . . . 14 3 . 1 Computer Program . . . . . . . . . . . . . . . . . . 14
IV . TESTSFORRANDOMNESS . . . . . . . . . . . . . . . . . . . 28 4 . i m s ~ e s t . . . . . . . . . . . . . . . . . . . . . . 28
4.2 Runs of Various Lengths . . . . . . . . . . . . . . . 33
4.3 S e r i a l Correlation 36
4.4 Numerical Results . . . . . . . . . . . . . . . . . . 41 V . TESTS FOR NORMALITY AND UNIFORMITY . . . . . . . . . . . . 78
5.1 Chi-square "Goodness-of-Fit" Test . . . . . . . . . . 78
5.1.1 Pearsm's Test of Nomality . . . . . . . . . 81
3.1.2 Pearson's T e s t of Uniformity . . . . . . . . . 83
5.2 Kolmogorov-Smirnov Cri ter ion . . . . . . . . . . . . 84
5.2.1 Kolmogorov-Smirnov T e s t of Normality . . . . . 86
'3.2.2 Kolmogorov-Smirnov Test of Uniformity . . . . 89
89
5.3.1 Tests on Sequence Means . . . . . . . . . . . 90
. . . . . . . . . . . . . . . . .
7.5 rn ..- +- _n crrnrremnn ?deann T T ~ ~ . ~ ~ ~ ~ ~ ~ A b " " 0 V I A u L y u b * A u u A . * C U & & Y -I*- . Y I * U I * " l Y . . . . . . . .
8 ' . I
.

- 3 -
* A
.- CHAPTER PAGE
5.3.2 T e s t s on Sequence V a r i a n c e s . . . . . . . . . . 91
5.4 N u m e r i c a l R e s u l t s . . . . . . . . . . . . . . . . . . 93
V I . SUMMARY.. . . . . . . . . . . . . . . . . . . . . . . . . l.ll
V I I . ACKNOWUZDGMENTS.. . . . . . . . . . . . . . . . . . . . . 113
BIBLIOGRAPHY . . . . . . . . . . . . . . . . . . . . . . . u 4
VITA . . . . . . . . . . . . . . . . . . . . . . . . . . . u 7
- 4 -
I. INTRODUCTION
.
1.1 Objectives
This t h e s i s w i l l present a de ta i led s t a t i s t i c a l study of a uniform
and a normal random number generator as well a s t he implementation of
each on the IBM-7094 d i g i t a l canputer.
Basically, t h i s t h e s i s will attempt t o discover desirable o r unde-
s i r ab le features of such generators by subjecting them t o a f a i r l y
extensive s e t of s t a t i s t i c a l t e s t s .
one should have a f a i r l y good indication concerning such important aspects
as d i s t r ibu t ion propert ies an6 the Ciegree of randomness exhibited by t-he
generators.
the r e s u l t s may indicate a favorable conclusion, one should exercise same
degree of caution not t o be overly optimistic.
the f ac t that the power of some s t a t i s t i c a l t e s t s of hypothesis considered
i n t h i s study cannot be determined.
Based on the r e s u l t s of these tests,
However, it should be pointed out t ha t no matter how strongly
The reason f o r t h i s i s
A computer program has been w r i t t e n by the author t o generate the
necessary pseudo-random numbers f o r the study. The computer program
attempts t o combine the basic advantages of FORTRAN N and MAP (MACRO
ASSEMBLY PROGRAM) camputer languages s o t h a t optimum efficiency can be
at ta ined i n the generation of pseudo-random numbers.
1.2 Background
I n order t o be able t o solve p r a c t i c a l problems i n which t h e con-
s t ruct ion of sane randam process is required, it becmes necessary t o
have some random number generator so tha t t h e randm process may be
simulated. Tne Solutions t o such p rac t i ca l problems depends, of course,

- 5 -
on how good the given pseudo-randan number generator r e a l l y is.
the most widely used generators a re those t h a t generate uniformly dis-
t r i bu ted pseudo-random quant i t ies and normally d is t r ibu ted pseudo-randan
quant i t ies .
obtain randm events obeying other d i s t r ibu t ion functions.
Two of
The former has t h e a t t r a c t i v e feature of being used t o
Since high-speed d i g i t a l computers have become e a s i l y accessible,
it i s desirable and advantageous t o generate by some determinis t ic means
a sequence of pseudo-random numbers obeying some specif ied d i s t r ibu t ion
I'unctizr?.
and longer observation, cer ta in pa t te rns become evident. Therefore, the
essence d such a t a sk i s t o f ind a generator that exhib i t s as f e w
pa t te rns as possible and st i l l maintain i t s s t a t i s t i c a l behavior accord-
ing t z t h e specif ied d i s t r ibu t im functior?. It i s Lqp-tant. t o defim
a sequence of random numbers generated by some determinis t ic means as a
sequence of pseudo-random numbers because the word "random" no longer
maintains i t s basic meaning in i t s en t i re ty . Henceforth, whenever the
word "randam" appears i n t h i s thesis it s h a l l imply pseudo-random.
3xh sen;er?cec may q p a r tr! he rnndm even i f j iqnn closer
Many attempts have been made, with varying degrees of success, t o
contribute t o the state-of-the-art of random number generators. Most of
the ex is t ing uniform random number generators a re of the form
Xi+l = axi + b ( m o d M) i = 1, 2, . . . (1.2.1)
with the modulo depending on whether a given cmputer i s binary or
decimal.
t e s t i n g by t r i a i and e r ro r t o 6etermirie iiie coIistaiite a aiid t the t
A s igni f icant drawback t o these i s the requirement of extensive

appear t o produce the most sa t i s fac tory r e su l t s . I n many papers t h a t
have been writ ten, the determination of a and b overshadows the
investigation. See f o r example reference 20.
It i s the purpose of t h i s t h e s i s t o use a s i p i f i c a n t l y d i f fe ren t
uniform random number generator i n which the parameters a re specif ied
conclusively by the theory of the generator.
e f f o r t i s needed t o produce optimal conditions.
As a r e su l t , no addi t ional
I n addition, the normal
randan number generator is based on a d i r ec t transformation fran t'he
~ ~ n i f c p - to the no-qal d i s t r i b i ~ t i o n t . j n ~ g el i m i nating epp-nxirnate tech-
niques such as that by Hastings.' Briefly, the Hastings technique con-
s ide r s the in t eg ra l
- 1 t 2 .=Im e ' dt 0 < u 5 0.50 x(c)
( 1.2.2) . and approximates X(u) where X - N ( 0 , l ) by the polynomial r e l a t ion
where 7 = In - u'2*

I - -
- 7 -
11. THE GENERATORS
~ 9 - This chapter contains a mathematical presentation of t he uniform and
noma1 random number generators considered f o r t h i s study. The uniform
randan number generator i s based on a sequence of zeros and ones generated
by an nth degree maximal length l i n e a r recursion re la t ion .
i s associated with a primitive polynomial with coeff ic ients whose values
a re either zero or one and a degree
given d i g i t a l computer. As stated previously, the computer toward which
t h i s study i s oriented i s the IBM-'(O$ which i s a binary machine; thus
t'ne choice 01" t'ne ( 0 , ~ ) sequence.
This r e l a t ion
n equal t o the word length of a
The normal random number generator i s based on a d i r ec t transforma-
t i o n from two random variables d is t r ibu ted uniformly on the un i t
i n t e rva l (0,1).
2.1 The Uniform Randan Number Generator
L e t a = (ak}
l i n e a r recursion r e l a t ion
be the sequence of zeros and ones generated by the
ak = Clak-1 + c2ak-2 + . + cnak,, (mod 2 ) (2.1.1)
k = l , 2 , . . . for any given set of integers c i (i = 1, 2, . . ., n) each having the
value of zero or one where c i ( i = 1, 2, . . ., n) a re the coef f ic ien ts
of some polynmia l
f ( X ) = 1 + C l X + c2x 2 + . . . + xn (2.1.2)

- 8 -
I e-
~ , .*
*
Choose f ( X )
two - GF(2).
GF(2) i s tha t f i n i t e f i e l d cantaining the elements zero and one.)
cn = 1 and say t h a t f ( X ) i s a primitive nth degree polynmia l over
GF(2).
t h a t polynomial whose roots are primitive (2n-l)th roots of unity.)
As a result, (ak)
sequence modulo 2 (ref. 1).
so tha t it i s primitive over the Galois f i e l d of order
(One defines a Galois f i e l d a s any f i n i t e f ie ld ; hence,
Let
(A primitive nth degree polynomial over GF(2) may be defined as
i s said t o be a maximal length l i nea r ly recurring
Frm (2.1.1j9 notice that ak is detiemined solely by the n-tuple
(ak-1, ak-2, . . ., t3k-n) of terms preceding it. Similarly, ak+l IS
a function solely of (ak, ak-1, . . ., ak-n+l). As a result, each
such n-tuple has a unique successor governed by the recursion r e l a t ion
(2.1.1).
L e t p be the period of the l i nea r recurring sequence @k} The
period of
repeats. Obviously, p cannot be greater than 2n-1, where n i s the
degree of the polynmia l
followed by (O,O, . . . , O ) .
necessary and suf f ic ien t condition tha t p = 2” - 1 is tha t f(X) be
primitive nth degree polynmial over GF( 2) .
sequences have been extensively studied and used as codes in c m u n i c a -
t i on theory ( r e f . 4) .
(ak) has t o be the same as the period with which an n-tuple
f(X), because the n-tuple (O,O,. . . ,0) is always
It has been shown (refs. 2 and 3) t ha t a
Such l i nea r ly recurring
Two properties of interest are the following (ref. 2):
- 9 -
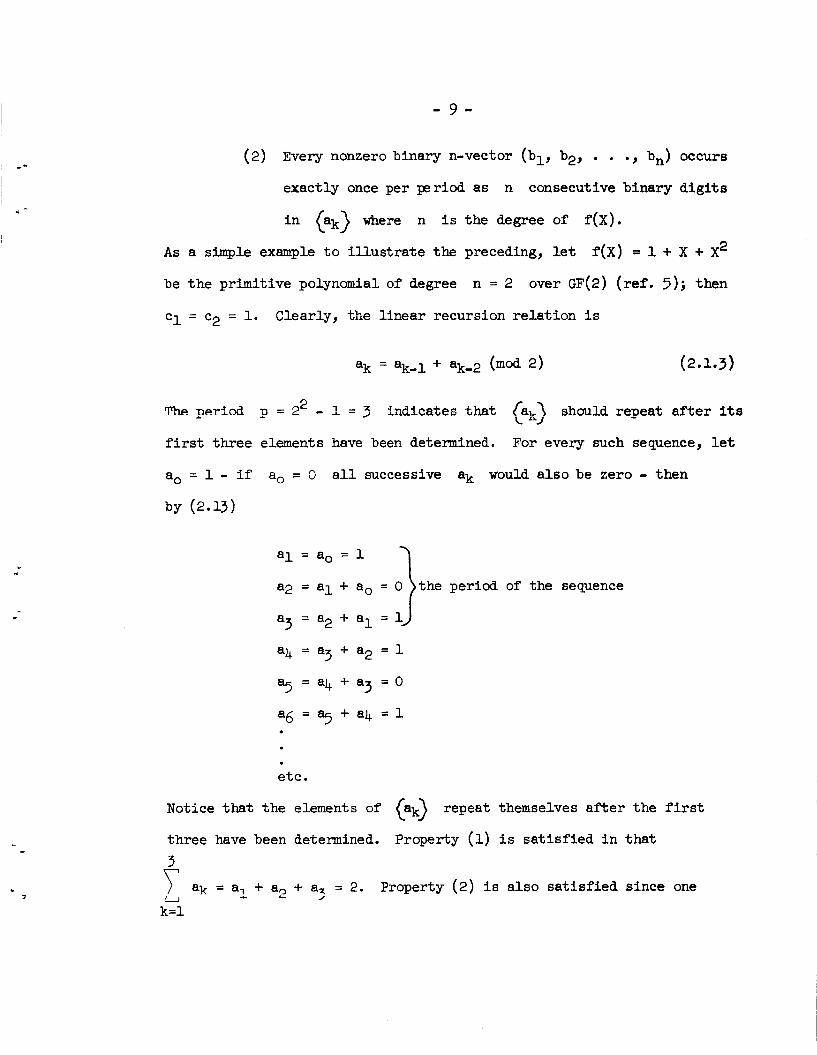
(2) Every nonzero binary n-vector (bl, b2, . . ., bn) occurs
exactly once per period a s n consecutive binary d i g i t s
i n (.k> where n i s the degree of f ( X ) .
As a simple example t o i l l u s t r a t e the preceding, l e t
be the primitive polynomial of degree
c 1 = c2 = 1. Clearly, the l inear recursion re la t ion i s
f ( X ) = 1 + X + X2
over GF(2) (ref. 5 ) ; then n = 2
The period 9 = 22 - 1 = 3 indicates that [alr] should regeat a f t e r i t s
first three elements have been determined.
a, = 1 - i f a, = 0 a l l successive ak would a l so be zero - then
L =/
For every such sequence, l e t
by (2.13)
a2 = a 1 + a. = 0
a3 = a2 + al = 1 I a 1 = a, = 1
a4 = a3 + a2 = 1
a5 = a4 + a3 = 0
the period of the sequence
a6 = a5 + a4 = 1
etc .
Notice t h a t the elements of (.k> repeat themselves a f t e r t he f i rs t
three have been determined. Property (1) i s sa t i s f i ed i n tha t
ak = a, + a, + a, = 2. Property (2) i s also sa t i s f i ed since one / f ‘J I L
k = l

- 10 -
.- ..
has binary vectors (l,O,l), (l,l,O), (O,l,l) t h a t occur exactly once per
period.
More generally, l e t f ( X ) and (.k) be defined. Consider the
sequence of numbers of t h e form
(2.1.4)
t=l
where the optimal value of L i s equal t o n, the degree of f ( X ) ; r is
an a r b i t r a r i l y chosen integer,
greater or equai t o L cnosen so t-mt q and p = 2” - 1 are relative-
0 5 r 5 2” - 1; and q i s any integer
:rhe. Clearly, Yk is the 3Lmq- expansion of a number whose binary
representation i s L consecutive d i g i t s i n a, and each Yk is spaced
q d i g i t s apart. Fran (2.1.4), it can be seen tha t such numbers always
l i e i n the in t e rva l 0 C Yk < 1.
Equation (2.1.4) i s due t o R. C. Tausworthe (ref. 1) who has shown
tha t such sequence of numbers a re uniformly dis t r ibuted on the uni t - - 2’L and variance 62 = 1; hence I 2 inverval (0,l) with mean p =
2 f o r large L, the mean and variance of Yk are ident ica l ly the same as
the mean and variance of the uniform dis t r ibu t ion function. i n the uni t
interval . As a resu l t , equation (2.1.4) represents the uniform random
number generator t h a t i s implemented fo r t h i s study.
A primitive polynmia l of degree 35 which i s equal t o the word
length of the IBM-7094 was obtained frm a t ab le of primitive polynamials
over GF(2) published by Watson ( r e f . 5 ) . The polynamial .
f ( X ) = x35 + x2 + 1

- 11 - i s associated w i t h the l inear ly recurring sequence
ak = 1 if k i s even
ak = 0 i f k i s odd
(2.1.6)
For t h i s study, L and q were se t equal t o 35 which i s re la t ive ly
= 235 - 1. rnL---.O--- --- ^-I --->--e- L-- ----- Fr*e tc perid r r r c r G r u r c , UllC G a l l pLuuur;o, uy ctyua-
t i on (2.1.4), precisely 235 - 1 Y's before repe t i t ion occurs. O f
course, t h i s stucly considers only a small portion of these, say
N = 10,000, and attempts t o discover t h e i r various properties a s w i l l
be seen l a t e r .
2.2 The Normal Random Number Generator
G. E. P. Box and Mervin E. Muller ( r e f . 6) have derived a method t o
obtain a p a i r of independent random variables normally dis t r ibuted with
mean zero and variance one from two independent random variables f rm
the same uniform dis t r ibut ion on the in te rva l (0 , l ) .
t ion of t h e i r approach follows.
A br ie f presenta-
L e t Ul,U2 be independent random variables uniformly dis t r ibuted on
the uni t interval . Consider the random variables
(2.2.1)
(2.2.2)

- 12 - 3y g i v h g a t t e n t i m t o pr incipal values, & t a i n the inverse relat ionships
U1 = e -(Xl2+x22)/2
Then, t he jo in t density of X1,X2 i s
(2.2.4)
(2.2.5) .
but
Hence, X1,X2 are a p a i r of independent random variables f rm the same
normal d i s t r ibu t ion with mean zero and uni t variance.
Box and Muller's approach i s based on the following considerations:
the probabi l i ty densi ty f(X1, q) is constant on c i rc les ; hence
8 = arctan(X2/X1) i s uniformly dis t r ibu ted on the inter i rs l (G,&).
' has Further, t he square of t h e length of radius vector r2 = X1 2 + X2
a chi-squared d i s t r ibu t ion with two degrees of freedom. Since U1 i s
uniformly d is t r ibu ted i n the in t e rva l (O,l), then -2 log, U1 i s dis-
t r ibu ted as a chi-squared with two degrees of freedom.
i n t h e reverse order, Box and Muller a r r ive a t (2.2.1) and (2.2.2).
By proceeding
Since equations (2.2.1) and (2.2.2) contain square roots, trigono-
metric functions, and natural logarithms, t h e i r accuracy depends, i n
par t , on the accuracy of t he avai lable l i b r a r y programs which compute

r
these functions.
accuracy; therefore, for t he major par t , t he accuracy with which equa-
t i ons (2.2.1) and (2.2.2) a re computed depends on the degree of uni-
formity of U1 and U2.
The IEM-709 l i b r a r y programs possess f a i r l y high

111. THE IMPLEMENTATION OF THE GENERATORS ON
THF: IBM-709 COMPUTER
Needless t o say, it would be a colossal task, i f not impossible, t o
attempt t o generate uniform or normal randcm numbers by t h e methods dis-
cussed i n Chapter I1 without the use of sane high-speed d i g i t a l computer.
For t h i s reason, a canputer program has been wri t ten by the author t o
f a c i l i t a t e this study.
The program was wri t ten by considering t h e most desirable fea tures
of tne ~ B M - ~ o $ and i ts in t e rna l ianguage so that a random number may be
generated x i th a iiiiii'mm amfi t of emy~ter uulre. A listing ef t he cam-
puter program appears along with a de ta i led discussion of i t s contents.
3 . 1 Ccmputer Prowam
Basically, the computer program i s wri t ten t o provide two options:
( a ) the generation of one randam number uniformly d is t r ibu ted on the
i n t e r v a l (0,l) according t o equation (2.1.)+), and (b) the generation of
one random number normally d is t r ibu ted with zero mean and un i t variance
according t o equation (2.2.1), and, as a consequence, two randcm numbers
uniformly d is t r ibu ted on the uni t in te rva l .
the first option be chosen whenever one needs only uniformly d i s t r ibu ted
randan numbers, while the second be chosen whenever one's primary
i n t e r e s t is t o obtain normally d i s t r ibu ted randcm numbers.
It i s implici t here t h a t
For ease of discussion, the program i s divided in to four sections.
The first two sect ions a re writ ten i n Fortran IV using in teger arithmetic.
Mainly, these two sections generate the sequence ak of zeros and ones

I
- 15 -
c
'-1__--- ........................................................ __._----..- i
i !
...... ........... .......... .. - - 1 _. _______
. . . . . . .. . . . . . . . . . . . . . _. -. __ - -. . .... ....... . . . . . . . . . - ......... - -

- !
- 16 -
. .~ . . . . - ....... .- . ... - . __ . .... .. ............ - . --.-_--
~. . . . 1 . . . I A j : ? + M I ) = ! T E ; 4 P t l A 2 ( I * M I ! .
\
1 . . _. . - . . . . . . . . .... _ _ j . _ .- I A I ( I . . M I ) = I A 2 ( I r M I ) .- . . . . .
i M A X = 3 5 + I R ( M I ) - I . . . . . . . . . . . . . ___ . . . - ... -. j 1 _ __ _. . N1 =N!+35 ................. - . . -... I ---- - - - -
1.- COT 0-18 ___________ ................ . .
. . . . . . . . . .- __ - . . .
. - I F ( I A-3 ( I 9 M I ) EQ 02 ) I A 3 ( I * ivl I ) = O .. . . . . . . . __ . . . . . . . . . .- .. __ .
\ - ....... _ .- .... - .. - . . - . . . . . . . . . . . . . . . . . . . . 1
!
1~ .- .. ... . ........... ---.
. . . . 1 ........ 17 I ~ ~ ( ! _ , M I ) = I ~ A _ ~ ~ I _ ~ P " I ! ! .. . . . . .
. . . . . . ....... - . . . . . . . . . -
... . - .............. - . - . I
4 . . . . . . . . . . . . . . . . . . . _. . _. .
!.!r:';E:-M.~X~)r.<?T)_7 . . . . - .. .......... . . . . . . . . . . . . - .. .... , -~ ~~- I - . __ . ~~_ . . . . . . . . . _ ... - ............. . ! ...
. . . . . . . . .- . . . . .. . . . . . . . -_ . . . 1 ........ 3 - N 2 = N 1 ? 4 A X . . . . . . . . . . . . . . . . . . . . . . . . . . I ............ _. .... , . _ _ - __ . .
. . . . . . . . . . . __ .. - ..... ____ ............. -__ _. . . . . . . . N 3 = 3 5 - N 2 ... . i. ..__ __-_. -
. . . . ... - ......... - __ - . I . . . ~- . . . . . . . . . 1 . ~ ~ ~ ~ - - - -. . N 4 = N 3 . + _ 1 , . . . .
. -_ -. - . . . . ....
. . . . . . . . . - I F ( N 2 o - E Q . 0 ) G O T 0 3 3 .. . . . . . . . . . . . .
, l ~ A ~ . I z ~ ~ ~ , I ) -=-. ra.i ( i.*-M.I.)~ ..... - - . . . . . . . . _ _ _ _ ~ _ . _. ~ ~_.
i -___
! . ).COT.oi.l ........ ............. - ..
- . . -_____ ~.~ .- ..... ... .. -
. ._ . .- . . . .. .- -_ I .
.- - .- i 23 C 3 N T I N U E .. ... .............. . . I ____ -~
I ~ N3-.~EQ . - ...... .. . . . . . . . . . . . . . . . . . . . . . . . . . . . . . . . . . . _- 'I
. .. _ . . .... ... .... - . . ________ I ~
D 0 4 9 I-=-l 9 N 3 ~~~
.. ... . . . . . . . . . . .
. . . -~ _.
.. . . . . . . . . . . . . . . . .. . . . . . . . . .

- 17 -
---I.-."-- - - - _ - - __. - . . . . . . . . . . . . . ....... ..... -- ....... . --I -_..--_I... . S E C T i O N 2 C O M P U T A T I O N O F S U C C E S S I V E C L E M E N T 5 OF AWRAY IA I N SETS 1
i . . . ... . . . . . . . . . . . . . . . . . . . . . . __
.............. . . . . . . . . . . ...... I . c
! ....... ................. .............. I C f O f 35 F O R - EACH i?ANSj,- -. NUi iF jER -- ...
~..- . . . ...__I.. ........... . . . . ................ . . . . . . . . . . . . . . . . . . . . . . . . . ___ .. .................. I = 1
H E R E
.............. ! S U B
{..-L.p.- .... . -.____ ............. ............................ I I . ................ ......... . .......... ___ - . - ~~. .~ i T ZE !---------- - -
- 18 -
3
1
L O O ?
. . I -
_ - - -_ - . _ _
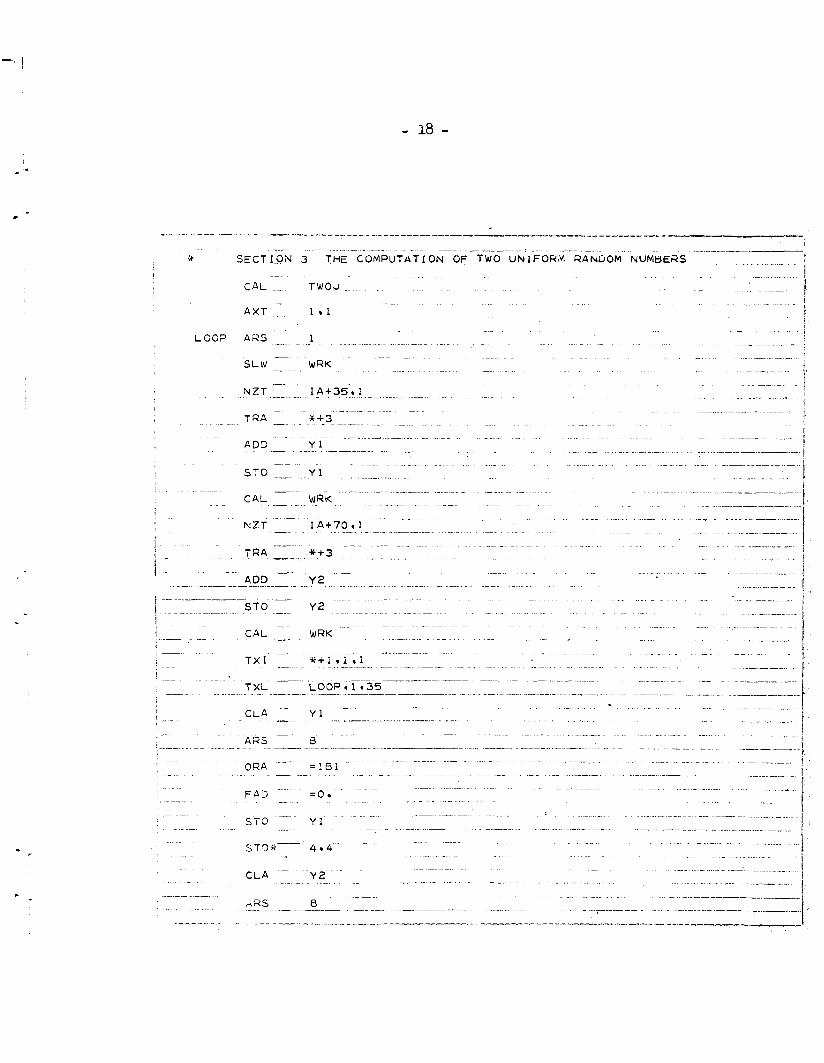
S E C T I O N 3 T H E C O M P U T A T I O N OF TWO UNIFORM RANDOM NUMBEGS _ - -
C A L _ TWOJ..
A XT 1 . I - . . -
.... ... ............. - . -. -. -~ ~
. r n n I IT- . _. . "+3 . ~
. .. ...... .___ . - . - . ...... - . .. -. .-
__ Y 1 *e- . ..... . . . ............
-__ . . ~~. .... . . . . . . . . . . . . . . . . . . . . . . .......... 5 T O y 1 . . . . . . .
.. _ .. .. . . . . . . . . .................
.. . . . . . . . . . . . . . . . . . . ..... . C A L . WPU
. . . . . . . . . . . . . . . . . _ ? . . __ . ~-
. . . . . . . . . . . . . . . . . . . . . . . . . . . . . . . . __ N Z T I A + 7 0 - r 1
..... . . . . . . . . . . . . . . . . . . . . . . .. .... . . . ........ ....
7 . w __ ... ++3 . . . . . . . . . . . . I . - I . . . . . . . . _L... ,Oj . . . ..... - ............. .. .. . ~~ . . . . . . . - ...............
. ... . . . . . . . . . . . . . . . . . . . . . . ... -_ ___ __- y 2 . . . . ... - .... ..... . _ . ~ .-. t _--.-____ ............ . . . . . . . . . . . . . . . ..
................. . . . . . . . . . . . . . . . . . . . . . . . . . . . . . . . . . . ... i -- -: S T 6 - Y 2
.. . . . ...... . . . . . . . . . . . . . . . . . . . . . . . . . . . . .. 1 .:- C A L WRK. ............ ......... . . . . . . . . . . . . -. ~ . . . . . . . . . . . . . i
~ . i>c i . . .--~ . . . . . . . . . . . . . . . . . . .......... . i
.. .... .. . . . . . . . . . . . . . . . . . . . . . . . . - * + i r i 9 1 ... .... ._ ~ .- -. ,
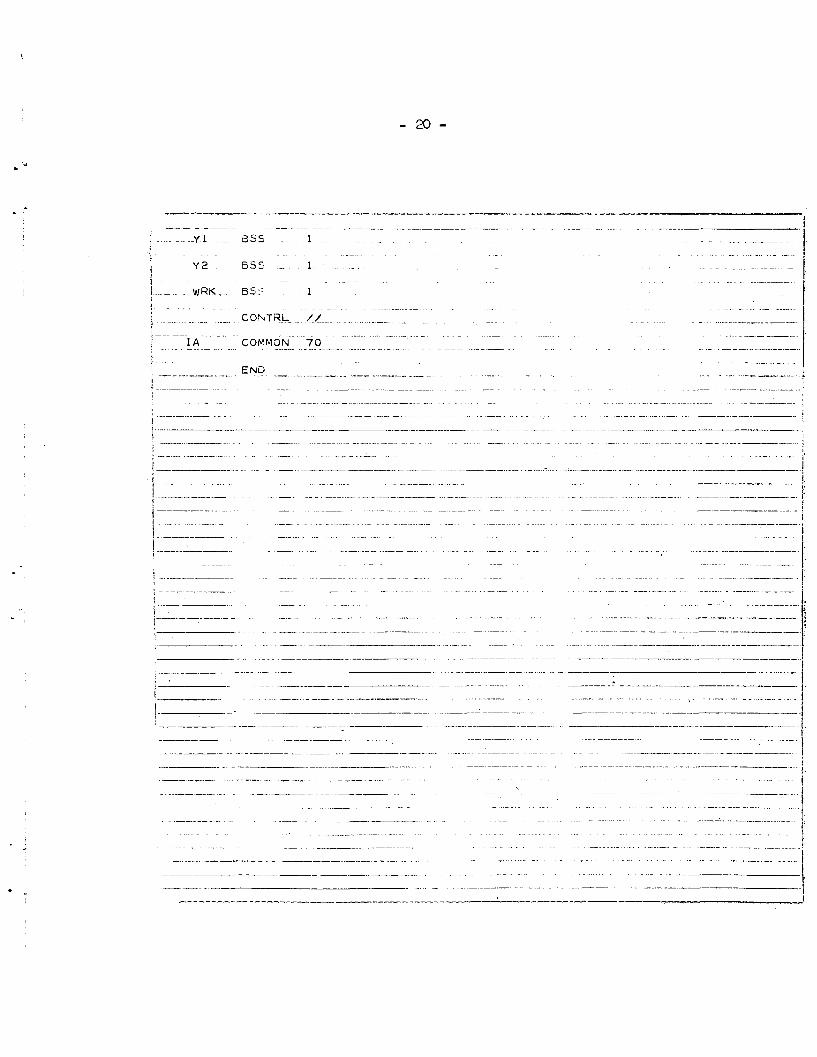
- 2 0 -
1 Y 2 955 - 1
.- . .
- - i ! . w R K . . 8: 1
. . . . . . . . . . . . . I . . . ..
-
-
. . . . .
. . . . . ~ ~ ~ ~. . . . . . . . . . . . . . I -
... ... . . . . .- . ...- - . . ,. ; E N ._ . . ! I - - . ... ...... . . . . . . . . . ... ...........
. . . . . . . - .. ....... ... . . . . . . . -~ . . . . . . . . . ..............
, . . . .. .... . . . . . . . . . .......... .... _. _.~___I_. ! /________-.--...__- . . . . - ... _ _ _ ~ 1 . . . ................ ............. . . . . . . . . -. . . . . . . . . _ _ .
I ____ ___._ . . . - . . ..... __ .-. . . _.
i I..-- ___ - . -. ..... ........... .. . . . . . . . . . . . . . . . . . . . . . . !
1 . - .~ ~. ...... ~- ........... - . . . . . . . . . . . . . . . . . . . . .. -
t .- ...... .-.-I-..-. . . . -. ........... . . . . . . . . . -. ...
. . . . . . _ _ _ _ _ ..... _ _ .. .... .- ... ........
.. - ........ ..... ........... . . . . . . . . . ... - __._ ~
I . . . . . . . . . . . . . . . . . . . . ...__ . . - . . . . . . ..... .- _ . . . . . . . ~. . . ! .
-. ~~~ ~~ ~ ~~ -- ~. .. _. ._ .~ - . ~ ~~
. . . . . . . . . . . . ~ ~ - . . ~ ~ I
.~ . . . . . . . . . . . .~ .. ........ - . . ~~ .~. ...... ; - .-_ . ~~ ~ .. - ...... .
.. . . . . . . . . . . . . . . . . . . . . . . . . . . . . . . . . . . . . . . . . . .-- . ___ , -. -- - - . . . - .. - __ ......... .... . . . . . . .- .. .. ._-__.__I_ .-
. . ._.___.__ . .. ___ . - I . . . . . . . . . . . . .
. . . . .. . . . . . ___ - . .-. . - ..
... .___ . . . .I-__-_ .. - ... . ........ .___________ , .
i---.-..-. . . . . . . . . .. _ _ I_-.--I- .... ..... . . . . ...................................... .... !. _. ~ .... -
_._ __ ~ _ _ _ _ . _.__ - ~ - ~
...... .. - .- ~ ~ .
.... ~ . . . . . . ...~.___
___ .. . . . - ..... ___ -____. .
. .. - . . . . . . . . . . . . . . . . - . . . . . . . . . . . . . . . . . . . . . . . . . . . . . . . . . . . . I . . . .. ...... ... - .
. . . . . . . . . . .................... . . _ . - - . .
. . __ . - .. . ~ . . . . . . . . . . . . . . . . . . . . . . . . . . . . _. ..... . ~.___
. . . . . . . . . . . . . . . . . . . . . . . . . . . . . . . .~ .- .~ .
. . . . . . . . . . . . . . . . .. - ~. - . . . . .- ... ._ _I_._~ ..
. . ._----_ - .. ..... . . . . . . . . . . . . . . . . . . . . . . . . . . . . . . . . . . . . . . . -. . .-. . __ .. __ .... _______~ . . . . ~ .... . . ...~__~__I__
. . . . .. __ -_I -- ________l_l _I_ ̂ _ _ _ _ _ _ _ _ _ _l_ .-cI_ _-__.-

- 21 - , - according t o the l i nea r recursion re la t ion (2.1.6) and the given poly-
n d a l (2.1.3).
the symbolic language of t h e IRM-709.
randm numbers i n the uni t interval and serves a s an intermediate s tep
toward the determination of one normally distributed randan number by
equation (2.2.1). If the first uption i s chosen, Section 3 is anitted
and i t s basic function i s assumed by Section 4 where me uniform randan
number i s generated.
The remaining two sections are wri t ten en t i r e ly i n MAP,
Section 3 generates two uniform
i s the entrance point t o the program.
information fo r the necessary input and expected octput of the program.
The input of the program i s comprised of the argument IR , N, and L. The
argument I R - corresponding t o the integer r of Chapter I1 - is a one-
dimensional array of two different posi t ive fixed integers a r b i t r a r i l y
chosen. For a l l prac t i ca l purposes, t h e i r values could be anywhere
frm, say, 70 t o 200,000. The argument N controls the specif ic point
nf er?t,raEce tc! the cmputer program. For any one of t he two available
options, i f multiple randam numbers are needed, it i s e s sen t i a l that the
i n i t i a l i z a t i o n par t (Section 1) is mitted a f t e r the f irst time the com-
puter program has been called. Hence, f o r the first c a l l of the program
the argument N has t o be equal t o the fixed integer one. Otherwise,
y m-77 --J he en,l=1 tc ep~r fixed in+.eger p n t e r than one. The argpnent L
controls the choice of the two options. If the first option i s chosen,
The ca l l ing sequence contains

I C
- 22 - L has t o be equal t o t h e fixed integer one.
chosen, t he argument
If t h e second option is
L must be equal t o t h e f ixed integer two.
Arguments RN, Y1, and Y2 cons t i tu te t h e output of t h e computer pro-
gram.
random number w i l l be s tored.
and Y2 w i l l contain t h e one normal and t h e two uniform random numbers,
respectively.
sequence are dummy arguments and may be named d i f fe ren t ly .
t h e array I A (35,2) nust be placed i n COMMON by t h e user ,
For the first option, Y1 w i l l be t h e locat ion where t h e one uniform
For t'ne second option, arguments RN, M,
It is worth noting t h a t a l l arguments i n the ca l l ing
Moreover,
A s an example of t h e use of t h e computer program, consider t h e need
for io0 random numbers normaiiy dis t r ibuted w i t h zero mean and uni t
variance. Define an array A i n which these random numbers will be stored.
Then, one way t o obtain these random numbers by using SUBROUTINE GETTRAN
would be as follows :
COMMON IA (35,2)
DINENSION MN ( 2 ) , A (100)
ivm (1) = 3063
Do 1 I = 1,100
CALL GE!TRAN (MN, I, 2, X, Y, Z)
1 A (I) = X
I
STOP

- 22a - iu'otice tnat t n e arguments of the ca i l i ng sequence nave been renamed;
t h a t is, MN, I, 2, X, Y, Z correspond t o IR, N, L, RN, y1, Y2,
respect ively. By replacing the argument N, t h e running subscript I of
t h e DO loop satisfies t h e requirement t h a t i t s value be equal t o one f o r
t h e first c a l l of SUBROUTINE GETTRAN and grea te r than one f o r a l l
subsequent c a l l s .
It has been noted br ie f ly tha t Sections 1 and 2 generate t h e sequence
ak of zeros and ones. More specif ical ly , t h e primary purpose of Section 1
is t h e i n i t i a l i z a t i o n of t h e computer program.
usable 35 elements of
according t o equation (2.1.4) are located and determined.
depends s t r i c t l y on the value of t h e a r b i t r a r i l y chosen integer stored
i n IR(1). Recall that the subscript of (.k> i n
I n t h i s section, t h e first
{ak) necessary t o compute one uniform number
Their locat ion
t=l
depends on t h e value of the integer r ( I R ) and t h e integer q = 35.
Hence f o r m = 1, t h e f i rs t element of
c lear ly ~ i ~ ~ + ~ - ~ , xhlle t he l a s t is a35+r-35 where L = 3 3 . Tne ioca-
t i o n of these 33 elements of {ak} implies t h e immediate calculat ion of
t h e elements of
a according t o t h e l inear recursion r e l a t ion (2.1.6). If t h e
second option i s chosen, t h e procedure i s repeated using t h e second
C i - b i t i - G - i I y C ~ L V ~ ~ I I inieger siiored i n iEi(2.j. Xnerwise, T;ne t a sk oi
Section 1 is completed. For any value of t h e argument N greater t h a n
{ak) needed i n t h e sum i s
{ak> f o r a l l k up t o and including t h e element
33-r -1

one, the cmputer program wi l l assume tha t i n i t i a l i z a t i o n has occurred;
thus, it w i l l mit Section 1 and proceed t o Section 2.
It i s reasonable t o assume that one would want t o c a l l the program
more than once using the same input, except f o r t he value of the argument
N, i n order t o obtain multiple random numbers based on the option chosen.
Hence f o r each c a l l of t he cmputer program a t l e a s t 35 more elements of \
(ak} have t o be determined.
that the first set of 35 elements of @k} with respect t o the integer
IE(2.1 T.TPT~ Inceted a d determined i n Section 1.
This becmes the task of Section 2. Recall
(Of course, the pro-
cedure i s quite the same f o r the integer IR(2), i f it i s required by the
option. ) Therefore, t o cmpute an additional 35 elements, consider
3 5
t=l
when m = 2. Clearly, the first element needed i n t h i s sum i s aTmrml
while the l a s t is a7wr-35. Notice t h a t a70+~-35 i s tha t element
of
set .
are those tha t follow immediately a f t e r the first set of 35 elements
(.k> immediately following a35+r-1y the l a s t element of the f i r s t
Hence, f o r m = 2, the 35 elements of (ak) needed f o r the sum
determined i n Section 1. Therefore, f o r any m it i s only necessary
t o compute 35 elements of
by the theory of the generator i n Chapter 11.
{ak) based on the preceding set a s specified
After in i t i a l i za t ion ,
Section 2 assumes t h i s task.
Recall tha t Section 3 is associated with the second option, and
Section 4 implies the first option. Entrance t o either one of these
sections implies that t h e necessary elements
mined and stored. Because o f t h e s imi l a r i t y
of (.k> have been deter-
i n t h e purpose of these two
sections, it i s only necessary t o discuss Section 4 and imply the pro-
cedure f o r Section 3 .
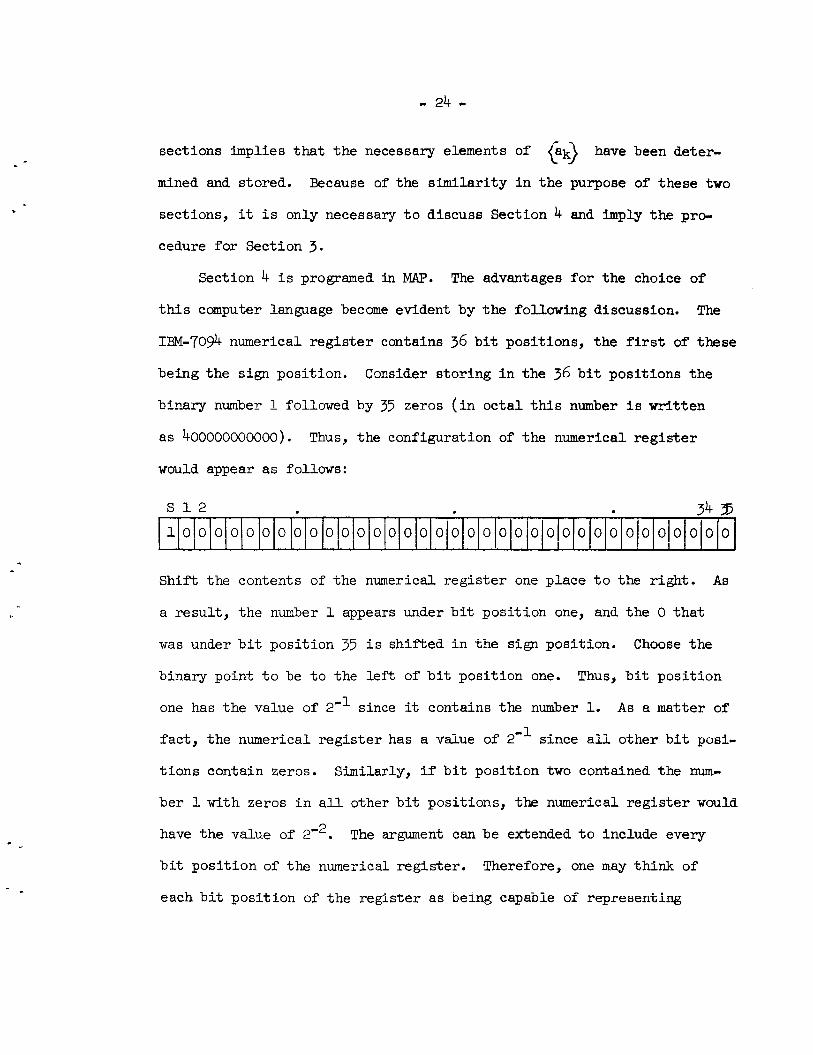
Section 4 i s programed i n MAP. The advantages fo r t he choice of
t h i s computer language become evident by t h e following discussion.
IN-7094 numerical r e g i s t e r contains 36 b i t posit ions, the first of these
being the sign posi t ion.
binary n u b e r 1 followed by 37 zeros ( i n o c t a l t h i s number i s wr i t ten
as 400000000000). Thus, t he configuration of t he numerical r eg i s t e r
would appear a s follows:
The
Consider s tor ing i n t h e 36 b i t posi t ions the
Sh i f t the contents of the numerical r eg i s t e r one place t o the right. As
a resu l t , t he number 1 appears under b i t posi t ion one, and t h e 0 t h a t
was under b i t posi t ion 35 i s sh i f ted i n the sign posit ion. Choose the
binary point t o be t o the l e f t of b i t posi t ion one. Thus, b i t posi t ion
one has t h e value of 2” since it contains the number 1. A s a matter of
fac t , t he numerical r eg i s t e r has a vaiue of 2’’ since a i i other b i t posi-
t i o n s contain zeros.
ber l with zeros i n a l l other b i t posit ions, the numerical r eg i s t e r would
have t h e value of 202.
b i t pos i t ion of t h e numerical reg is te r .
each b i t posi t ion of t he reg is te r as being capabie of representing
Similarly, i f b i t posi t ion two contained the n u -
The argument can be extended t o include every
Therefore, one may think of

- 25 - successive negative powers of the base 2 with the power being equal t o
the b i t posit ion.
Let the value of the numerical r eg i s t e r be equal t o 2-’. Consider,
as an example, same 35 elements of (ak) t o be the following:
f c r t = 1, 2, . . ., 35 and some m. Consider a way t o test each of
these 33 elements sequentiaiiy beginning witn t’ne first t o Cetermine
w ~ d i e r I t s vakie is z e m or cne. --L-.L If it is one, the -;slue of t h e register,
presently equal t o 2” since b i t posit ion one contains the num3er one, i s
added t o a quantity Y1 which i n i t i a l l y was se t equal t o zero. If the
element being t e s t ed i s zero, nothing i s added t o Y1. Hence, f o r the
example, Y1 i s equal t o 2-l because the first element i s one. Proceed
by sh i f t ing the contents of the numerical r eg i s t e r one place t o the r ight .
Now b i t posi t ian two contains the number 1 with zeros in a l l other b i t
positions.
Test the next consecutive element. Add the contents of the r eg i s t e r t o
Y1 only if the value of the element i s one. Otherwise, Y1 remains the
same. For the example, Y1
i s zero. Again sh i f t the contents of the numerical r eg i s t e r one place t o
the right. A s a resul t , t h e number 1 appears under b i t posi t ion three,
and the value of the regis ter i s T ~ . If one,
add the value of the regis ter t o Y1; otherwise, Y1 remains the same.
For t‘ne exampie, the t h i r d eiement i s one; therefore, II i s iiuw equal
This implies tha t the value of the r eg i s t e r is equal t o 2’*.
remains equal t o 2’’ because! the second element
Test the t h i r d element.
-.-

- 26 -
.-
t o 2 -’ + 2 - 3 . Continue t h i s procedure u n t i l a l l 35 elements have been
t e s t ed sequentially. A t the end, Y1 should represent the value of one
random number uniformly dis t r ibuted on the in t e rva l (0,l).
example, Y 1 would be equal t o
For the
-9 + 2-10 + 2 - ~ 3 + ,-14 + ~ ‘ ~ 9 + 2 -21 + 2-26 + 2-1 + 2-3 + 2-4 + 2-8 + 2
+ 2-27 + 2-28
based on the seventeen nonzero elements and the corresponding contents
of the numerical r eg i s t e r .
-_ m e preceding approach offers the a t t r ac t ive advantage of‘ co1isidei;-
able reauction of computer time. Recall that the mathematical def in i t ion
of the uniform number L
implies the multiplication of each element of (.k> needed i n the sum
by the number 2 which has been ra i sed t o some negative power equal t o the
value of the subscript t. The ra i s ing of a given nurciber t o a power,
division, snd mdt.iplication, require considerably more time i n most
d i g i t a l computers than addition or subtraction.
of (.k> a re e i the r zero or one.
Notice t h a t a l l elements
Therefore the prodpct
’ *
- .
-t aqm+r-t
r p e - l l ~ f m ~ l f ~ ~ ndd nfid .-t t.n t.hp s l i m d q e n d i n g on whether the
corresponding element of (.k> i s one or zero. Since the numerical

- 27 -
/I r e g i s t e r of the IBM-7094 was s o constructed t o produce successive
f o r t = 1, 2, . . ., 35, the operations needed t o compute
2’t
I - - -t * aqmtr-t
have been reduced t o one; namely, addition. FORTRAN I V does not have
the necessary f l e x i b i l i t y t o permit t h i s approach; thus the choice of
M A P . From the t e s t s that have been made, it has been determined that
the amount of computer time necessary t o determine one random number by
t.h-is mitJ-1,3,3 is i?ppT,3Yime.t.F1ly 0 - G Q y j SiC‘3f id .

- 28 - I V . TESTS FOR RANDOMNESS
I * -
c
If the formulae discussed i n Chapter I1 are t o be useful i n simu-
l a t i n g random events or processes, it i s e s sen t i a l that each generated
sequence of numbers possess desirable features of randomness.
In tu i t i ve ly speaking, a random sequence of numbers is a sequence
i n which the spec i f ic values of the elements are not a t a l l a function
of t h e i r posi t ion i n the sequence. I n other words, any par t icu lar order
the values 9,f s m e radon sequence present tkmel.;es i s no imre l i k e l y
t o occur than any other ordering.
For the overal l investigation, a t o t a l of two-hundred (200) sequences
each containing 10,000 elements were generated. O f these, one-hundred
were generated using the uniform number generator (2.1.4), f i f t y were
generated using equation (2.2.1), and the remaining f i f t y were generated
using equation (2.2.2).
n o m 1 random number generator.
Equations (2.2.1) and (2.2.2) comprise the
Three t e s t s have been performed on a l l sequences f o r the detect ion
Two of these are runs tests, and the t h i r d i s a t e s t of nonrandomness.
on s e r i a l correlation. These tests are intended t o serve a dual purpose:
(a ) t o detect nonrandomness, and (b) t o create a system of checks between
the r e s u l t s of one t e s t a s compared with the r e su l t s of another. A l l the
necessary computations were performed on the IBM-7094 with the r e su l t s
appearing a t the end of this chapter.
4 . 1 Runs Test
To detect a lack of randomness, one must decide whether a given
sequence of numbers generated by such deterministic means as those of

- 29 -
I - -
Chapter I1 i s l i k e l y t o occur by chance or some assignable causes are
indicated.
on the order i n which the par t icular values of a sequence of numbers
were obtained. Furthermore, t h i s order depends on the number of runs
exhibited i n the sequence.
A technique withwhich such a decision can be made is based
Given a sequence of numbers, consider the assignment of all elements
i n the sequence i n t o two classes, A and B, c lass A containing a l l ele-
ments i n the sequence that are greater than the mean while c lass B con-
t a i n s all elmer?ts t h z t %re l e s s t h a z c r eqzl tc! the m a n cf E? specified
dis t r ibu t ion function. L e t nJA, nE be the t o t a l number of elements
observed i n c lass A and class B, respectively. Then, a run i s defined
as a succession of elements from the same c l a s s contained between ele-
ments of a d i f f e ren t c lass . Hence, f o r a given sequence of numbers,
the t o t a l number of runs i s always one plus the number of unlike neighbors
i n the given sequence. For example, the sequence
a a b a b b a b a a a
has six unlike neighbors and, therefore, seven t o t a l number of runs.
L e t r denote the t o t a l number of runs contained i n a given sequence
of numbers. Since r can take on any value within some domain, then r
i s a random variable that gives an indicat ion on whether a sequence of
numbers may be looked upon as random. This can be i l l u s t r a t e d by con-
sidering the following example: Suppose one tosses a coin f i f t y times
resu l t ing i n a sequence of only two runs consisting of twenty-five heads
f o l l o w P d by t.went.y-fi.sre t.n_fl. ~ Xp ~ q p j l d , ~f c p j r s p , st.rnna1xr ---=>^g - - "c -w s i i c n n m + "

- 30 - t h a t t he probabili ty of success had not been the same from t r i a l t o
t r i a l . If, on the other hand, the sequence of f i f t y tosses contained
f i f t y runs consisting of a l ternat ing heads and t a i l s , the suspicion
would be t h a t t he t r i a l s had not been independent.
Consider the question of t e s t i n g t h e n u l l hypothesis t h a t a given
sequence of numbers appears t o be rando% The argmeE% applied te the
example can a l s o be applied t o tes t t h i s n u l l hypothesis based on t o t a l
number of runs. It i s apparent t h a t i f a given sequence of numbers is
random, the elements of c lass A o r B should be well mixed and r should
neither be too s m a l l nor t o o large. If there ex i s t long successions of
elements of the same c l a s s followed by long successions of elements of
the other c lass , it would be reasonable t o conclude some biased departure
from the t r u e probabili ty structure which would tend t o reduce r. The
other extreme would be when the elements from both classes are alter-
nating with a very high frequency. I n this case, the apparent conclu-
sion would be t h a t t h e value of an element depends on the value of the
preceding one. This, of course, would tend t o make r f a i r l y large.
Therefore, the t e s t i s performed by counting the t o t a l number of runs
ir; a given aeqi-ieiice, accepting the n iu l i hypothesis i f for some specified
number ro and ‘1, ro 5 r 5 rl, and reject ing it otherwise.
I n order t h a t one may specify ro and r1 f o r a given l e v e l of
significance, the dis t r ibut ion of the random variable r i s needed.
It has been shown (refs. 7 and 12) t h a t the density of r i s given
- h - 7 “ J

- 31 - if r i s even and
P ( r ) = k = - r - 1
(4.1.2)
2 (nAni nB)
if r i s odd. Hence t o t e s t t he n u l l hypothesis i n question with a
probabili ty a f o r the Type I error, one finds integers ro and rl
so tha t a s nearly as possible r0
CI
a \ ' P(rj = L l
r=O
and
(4.i.3j
(4.1.4)
and r e j ec t s the n u l l hypothesis if the observed r is e i the r less
than ro or greater than rl. It i s apparent t h a t the canputations
fnvolved i n (4.1.1) or (4.1.2) are qii te lengtkg especially if nA
and nB are f a i r l y large. However, it i s believed that if both nA
and nB are la rger than 10, the d is t r ibu t ion of r becomes approxi-
mately normal (refs. 7 and 17) with a mean
and a variance

- 32 - The approximation i s improved as nA and nB become large. For
N = 10,000, it i s reasonable t o expect t he approximation t o be f a i r l y
good since nA and nB will be qui te l a rge r than 10. Thus t o test t h e
n u l l hypothesis i n question, consider t h e s t a t i s t i c
r - CI, Z S
Qr (4.1.6)
where Z i s the value of a random variable having the standard normal
d is t r ibu t ion , and r i s t h e observed number of runs of a given sequence.
F n r some p m h n b i l i t y n for T y p I errnri the m ~ l l h y y t h e ~ l ~ i s
regected i f t h e computed Z i s less than Z, /a or i f it i s greater
of the standard normal dis t r ibut ion. Rejection implies A/ c
than Z1-*a t ha t t he given sequence may be declared nonrandm based on the tes t on
t o t a l number of runs.
200 sequences generated f o r t h i s study with a equal t o 0.05. The
resu l t s , found i n t ab le s (4.10), (4.11), and (4.12), indicate the
following:
This t e s t has been performed on each of the
( a ) For the one-hundred sequences generated by equation (2.1.4),
four sequences were rejected and declared nonrandam.
chere is an indication t h a t the uniform number generator (2.1.4) generates
sequences t h a t appear t o be random based on the observable number of t o t a l
runs.
By t h i s result,
(b) For the f i f t y sequences generated by equation (2.2.1), three
sequences were rejected and declared nonrandm. This indicates that
equa-cion ( 2 . 2 . i j generates sequences tnat appear t o be random based on
the observable number of t.nt.e1 m m g .

- 33 -
c
( e ) For the f i f t y sequences generated by equation (2 .2 .2 ) , there
were no rejections.
however, fur ther tes t ing,as w i l l be discussed i n the following section,
i s recommended.
The indication i s the same as i n ( a ) and (b) ;
One should note here that the preceding t e s t based on t o t a l number
of runs i s somewhat poor because it i s effect ive i n detecting nonrandomness
only when a given sequence contains too many or too f e w runs.
could a r i s e when a given sequence produces the correct number of t o t a l
Situations
r-iiiis7 'u-ut coiitair,s sei.io-us ty-pes i i u K i r a I i ~ m ~ i e s s . Tor dLKS a
test based on counting t h e number of runs of various lengths will be
discussed i n the following section.
4.2 Runs of Various Lengths
it was pointed out i n the previous section t h a t a tes t based on tne
t o t a l number of runs i n a sequence of numbers can be deceiving.
a t es t based on counting the number of runs of various lengths i s less
l i k e l y t o 'De Oeceived because the Dbservable nimber of t o t a l runs i s
subdivided in to runs of various lengths t h a t can be eas i ly compared t o
t h e i r corresponding theoret ical expectations. A run above or below the
= e m cf the specified d i s t r i 5 u t i e n fuxt ier , i s cleficed as fcllcws: If
2
l e s s ) than the mean, arid both the preceding and following elements a re
l e s s (or greater) than t h e mean, t h i s i s recorded as a run of length
above (zr below) the meaii.
However,
successive elements of a given sequence of numbers are greater ( o r
2
l-,~ +Lo ,-.krnn.rroklo n r - m k n n n f -in- "I - " " - G I . U " I C L A W A L " G & ".. L U A . " cf lcn,-tB 2 kt n n
&A, 1 7 &B, 1
above and below the mean, and mA, mR the t o t a l number of runs of a l l

- 34 -
lengths above and below the mean, respectively. If r i s the t o t a l
number of runs as defined i n 4.1, then
r = mA + mB + 1 (4.2.1)
where m a x 2
mA = 1 rA,2
2=1
f o r any 2 may B, 2 The theore t ica l eqec ta t ions of rA,; and r
be eas i ly computed by t h e following re la t ion (ref. 8):
(4.2.2)
where N i s the number o f elements i n each generated sequence. An
a rb i t r a ry s ize
f o r t h i s study; therefore, t h e expectations of runs above o r below the
N = 10,000 was chosen f o r each sequence t o be t e s t e d
nean follow:

- 35 - Consider t e s t i n g the nu l l hypothesis t h a t the deviations between t h e
observed number of runs of any length and t h e i r corresponding theore t ica l
expectations are f a i r l y s m a l l . By this hypothesis one implies t h a t if
the difference fo r each and every length between observed and expected i s
small, it i s reasonable t o believe t h a t an indication of randomness i s
present f o r a given secpence of ?: observations. To t e s t such a hypothe-
sis, it has been the practice of many t o use Karl Pearson's chi-square
goodness-of-fit t e s t (ref. 16).
see C h q t e r V . > Notice here that one's interest i I?& t o test t he ~ 1 1
hypothesis t h a t the observed number of runs of the various lengths has
some specified d is t r ibu t ion function. Rather, the primary in t e re s t i s
t o determine whether t he difference between observed and expected i s
s ignif icant t o warrant the existence of nonrandomness i n a given sequence
of observations.
(For a f i l l e r discussion of t h i s test,
L e t ri, 2 be the observed number of runs of length 2 , and l e t t h e
corresponding theore t ica l numbers of runs t h a t should be i n the Zth
c l a s s be E ( r i , Z ) . Then from the k = I 2 classes, the tes t s t a t i s t i c
T = ) i = A
i s approxiiiately diatribzited as a chi-scpare with k - 1
freedam since no parameter estlmation i s needed.
hypothesis i n question, the value of 7 is determined and compared with
the upper t a i l of the chi-square d is t r ibu t ion with k - 1 = 11
of freedom and a given l e v e l of significance.
degrees of
Hence, t o tes t t he n u l l
degrees
The n u l l hypothesis i s

- 36 -
1 -
re jected whenever 7 exceeds t h i s c r i t i c a l region. Rejection w a l d be
su f f i c i en t t o suspect nonrandomness i n a given sequence of numbers.
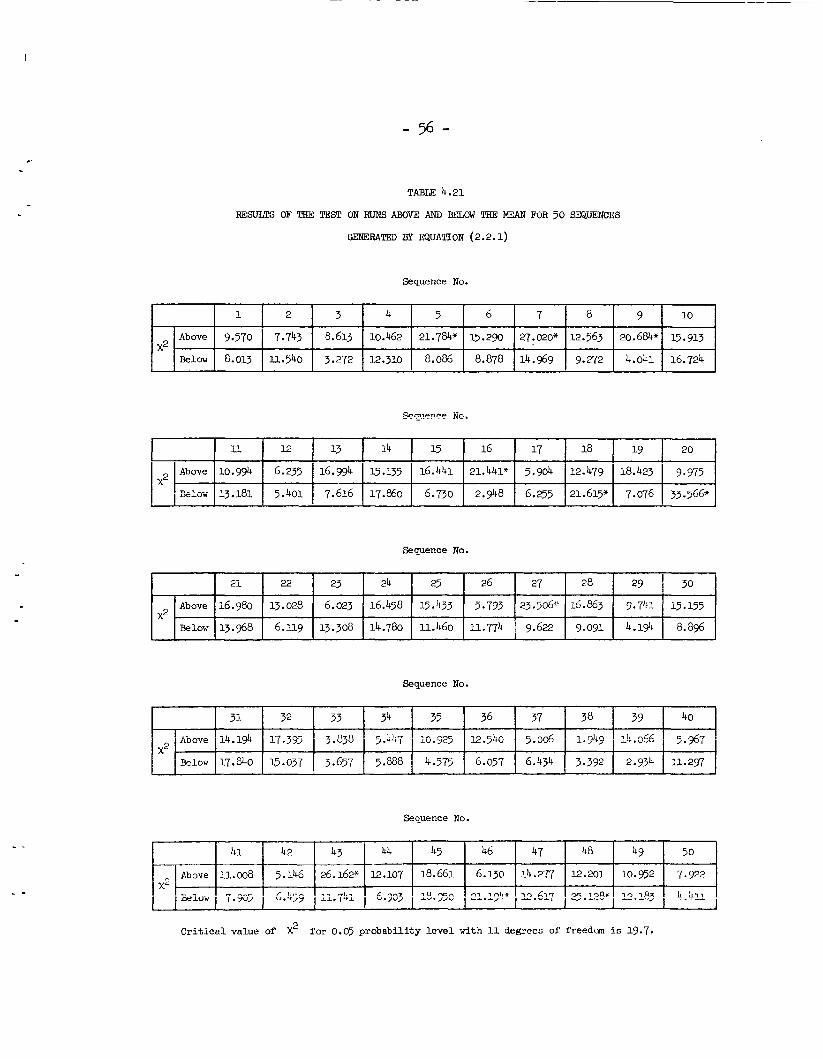
This t e s t was computed f o r runs above or below the mean for each of
the 200 sequences.
(4.22).
The resu l t s appear i n t ab le s (4.20), (4.21), and
The apparent conclusions are t h e following:
(a) For t he 100 sequences generated by equation (2.1.4), there were
six re ject ions fo r runs above and seven f o r runs below of a l l lengths.
This number of re ject ions i s t o be expected. Hence, there i s an indica-
t i o n t h a t equation (2.1.4) generates sequences t h a t appear t o be random
based on t h i s tes t .
(b)
six reject ions f o r runs above and four f o r runs below of a l l lengths.
Hence, the apparent conclusion i s similar t o ( a ) .
For the 50 sequences generated by equation (2.2.1), there were
(c ) For t h e 50 sequences generated by equation (2.2.2), there were
10 reject ions for runs above and only 2 for runs below of a l l lengths.
Because of t h e s ignif icant difference between these two numbers, it
woulii seem -i;o suggest t h a t equation (2.2.2) tends t o produce exceedingly
more runs than expected of values t h a t a re greater than the mean.
some nonrandamness appears t o exist .
4.3 Se r i a l Correlation
Hence,
If E: given sequence of numbers I s t r u l y randon, each element should
be independent of any other. T h a t i s t o say, the correlat ion between an
element xi i n the sequence and another element X i 4 - p should be
negligible.

* 37 "
u
Let x1, x2, . . ., xN be the sequence t o be t e s t ed for randomness.
L e t UJ be equal t o xi+p for i = 1, 2, . . ., N - p. For t h i s
arrangement, t he corresponding values of x and u are indicated i n
t ab le 1.
XL+p x 2+P xi+p . . xN . . .
TABU 1
xN-p . . . I x i . . . x2
The correlat ion coeff ic ient computed by using t h e configuration of table 1
i s ca l led the s e r i a l correlation coeff ic ient with l a g p. Standard
regression and correlat ion nethods a re not applicable here because the
u - ' s no longer const i tute a random sample f o r any fixed set of x ' s . J
A nonparametric method based on s e r i a l correlation can be derived
i f one assumes tha t a l l possible permutations of a given sequence of
numbers a re equally probable. However, the number of permutations becme
extremeiy numerous for N a t a l l large; therefore, it i s necessary t o
use an approximation for the d is t r ibu t ion of the s e r i a l correlat ion
coefficient when N i s large.
Referring t o table 1, N - p p a i r s of elements can be formed.
Baaed on these pairs, the s e r i a l correlat ion coeff ic ient may be expressed
i n the form

- 38 - where
xi - x =
N - p i=1
N-D
i=1
il
su2 = i=1 N - p - 1
For t h i s study, s e r i a l correlation coeff ic ients of lags one through
fifteen, p = 1, 2, . . ., 13, have been computed. This range i s
believed t o be suf f ic ien t t o detect any existence of interdependence
among the e l m e a t s of E! sequence being tes ted.
Consider the use of some approximation fo r the d is t r ibu t ion of the
s e r i a l correlat ion coefficient. For N = 10,000, it i s doubtful whether
the quant i t ies Z, E, sx, su w i l l be appreciably a l te red f o r any l a g
p = 1, 2, . . ., 15. However, the quantity tha t will be affected
s ignif icant ly from one lag t o another is the sum X iX-j+p j the ref ore,
it would be more beneficial t o study the d is t r ibu t ion of t h i s sum ra ther
F i=1
Nip R = i, xixi+p
i=1 (4.3 2)

- 39 - Assume tha t the elements of a generated sequence being t e s t ed const i tute
a randan sample from a dis t r ibut ion possessing low order maments - which
i s the case here - then A. Wald and J. Wolfowitz ( r e f . 9 ) have shown
tha t R i s a rm-dm variable app-aximately d is t r ibu ted as a normal f o r
large N with mean
Sf - s2 E(R) =
N - 1 (493.31
and variance
where N Sk'T xi k L i=l
( 4 3 . 9
Thus, t o t e s t the nu l l hypothesis of zero s e r i a l correlation consider the
standard normal randcxn variable
R - E(R) z = OR
Calculate and compare Z t o the l e f t as well
standard normal - with a probabili ty 0.05 for
(4.3.6)
as the r ight t a i l of the
Type I e r ro r - because
both large posi t ive o r large negative s e r i a l correlations are of i n t e re s t .
Reject the hypothesis i f Z exceeds these l i m i t s and conclude t h a t some
element dependence i s present.
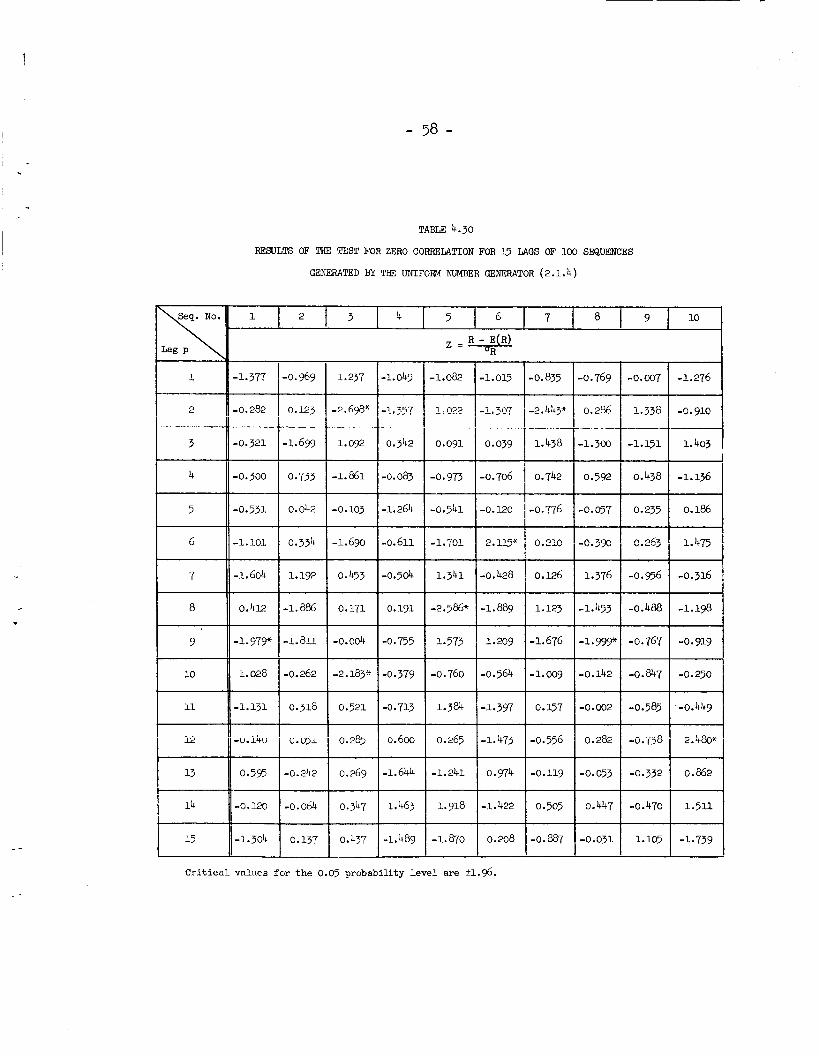
The s e r i a l correlation t e s t i s sensit ive t o per iodic i t ies caused by
the dependence between elements p spaces apart and should offset any

deficiency i n the runs tes t . A6 before, a l l sequences were subjected
t o t h i s t es t w i t h t h e r e s u l t s appearing i n t ab le s (4.30), (4.31), and
(4.32). The results indicate the following:
(a ) For the 100 sequences generated by equation (2.1.4), no one
l a g was rejected s igni f icant ly more than any other.
ne?& f o r any cne l a g of the f i f t e e n considered were t e n f o r l a g p
equal t o two.
was six percent, and this, of course, i s within the framework of the
s t a t i s t i c a l t e s t . Hence, it. i s qpa?.n+ tbt I.,= peri-&zities c ~ ~ s e d
by the dependence between elements seem t o exist.
The most re jec t ions
The overa l l average number of re ject ions f o r any one l a g
(b) For the 30 sequences generated by equation (2.2.1), the most
re ject ions noted f o r any one lag were four with the overal l number of
re ject ions f o r any one l a g being approximately equal t o f i v e percent.
Rence, f o r t he normal random number generator
no element dependence appears t o exist.
(c ) Quite a d i f fe ren t resu l t was noted fo r the sequences generated
ty equation (2.2.2 j . f o r l a g p equal t o one. This fac t indicates strongly the existence
of element dependence one space apart .
conclude t h a t the normal random number generator
A n overwhelming number of 41 re ject ions occurred
Hence, it would be reasonable t o
x2 = (’2 In u1)1’2cos 2xu,

I -
t -
1 -
4.4 Numerical Results
A l l t e s t s described Fn t h i s chapter were performed on each and every
one of the two-hundred (200) sequences generated f o r t h i s study.
necessary calculations were mde on the IBM-7094 coxputer with the r e su l t s
of the t e s t s having been rounded fo r presentation. Rejection i s indicated
by an aster isk.
may be found under each table.
i t s contents.
All
The c r i t i c a l values f o r the appropriate randam variables
Each tab le i s ident i f ied with respect t o

-- I
Sequence no.
1
2
- 42 -
r Kr or IZ=- r - Clr (Obs. no. of runs) (Mean of runs) (S.D. of runs) G r
5052 5000.82 50.00 1.024
5019 5001.00 50.00 0.360
IiEsuuTS OF THE TEST ON TOTAL FUNS OF 100 SEQUENCES OF SIZE 10,OOO EACH
GENERATED BY THE UNIFORM NUMBER GENERATOR (2.1.4)
4
5
6
7
8
9
10
5040 moo. 92 50.00 0.782
5044 5000 97 50.00 0.861
5010 4995.01 49.94 0.300
5051 5000. a1 50.00 1.004
5008 5000.74 49.99 0.145
4997 5000.58 49.99 -0.072
5013 5000.02 49.99 0.260
Cr i t i ca l values fo r the 0.05 probabi l i ty l e v e l are 5.96.
Tj ii
ll I 12
13
14
15
16
17
4960 I 5000.44 I 49.99 i - ~ . & 9
5002 5000.18 49.99 I 0.036
5004 5000.96 50.00 0.061
5110 5000.90 50.00 2.182"
$938 5szo. 39 30.00 -0.278
5024 5000 - 99 50.00 0.460
5010 5001.00 50.00 0.180
5043 5000.68 49.99 0.846

- 43 -
r - 11, rL ,
I =- QS
I r gr Sequence no. (Obs. no. of runs) (Mean of runs) (S.D. of runs) a,
18 4949 5 0 99 50.00 -1.040
TABLE 4.10
20
21
22
RESULTS CIF TKE TEST ON TOTAL RUNS OF 100 SEQUENCES OF SIZE 10,000 EACH
GENERATED BY THE UNIFORM NUMBER G E N E W O R (2.1.4) - Continued
4975, 5001.00 30.00 -0.440
5022 5000. 80 50.00 0.424
~ ~~ ~
24
25
26
27
28
29
n ?El, 5038 5000 30 49 99 V - I/'
4960 5000.44 49.99 -0.809
5063 >OW. 70 49.99 1.246
4974 5000.30 49.99 -0.526
3024 5000.48 49 99 0.470
5060 5001.00 50.00 1.180
30
31
32
33
34
5048 5000.92 50.00 0.942
4937 5001.00 50.00 -1.280
50.00 -0.060 4998 5001.00
5023 4998.88 49.98 0.483
5056 5000. a2 50.00 1.104
C r i t i c a l values f o r the 0.05 probabi l i ty level are k1.96.

- 44 - i - -
TABU 4.10
RESULTS OF THE TEST ON TOTAL F3NS OF 100 SEQUENCES W SIZE 10,000 EACH
GENERATED BY THE UNIFORM NUMBER GENERATOR (2.1.4) - Continued
Pr (Mean of runs) i r Sequence no. //
(Obs. no. of runs) I
50.00 I -0.440 4979 I 5000.99 I 35 II I 36 II 5029 I 5000-50 49-99 1 0.570
I n 27n I 49.99 W * J I y
I I 1.260 50.00
I 39 I! 4978 49.94 I -0.342 I 40 4939 5000.96
4 1 II 5626 I 5000.08
50.00 -1.239
G.519
I 42 II 5021 I 5000.97 50.00 I 0.401 I 50.00 -0.800
0.220
59.00
5001.00
5001.00
5000.77
47 5 017 5000.65 I I 48 II 5027 I 4999.84
3 G O 1 I 49 II 49.94 I 0.117
I 50 II 4999 I 5000.35 49.99 I -0.027 I 51 II 5039 1 5000.65
Cr i t ica l values fo r the 0.05 probabi l i ty level a re 21-96.

- - t
Sequence no.
52
53
54
.. 55
56
57
58
59
60
61
62
63
64
65
66
67
68
- 45 -
r - P r .ar z = - I P ??r (Obs. no. of runs) (Mean of runs) (S.D. of runs) or
5064 5000.78 50.00 1.264
4966 5001.00 50 00 -0.700
q56 5WU.99 50.00 -0. goo
4940 ,--I- 5nnn. 75 Lg * 99 -1 * 315
5040 5000.30 49 99 0.794
5005 5001.00 50.00 0.080
4951 5 GOO. 82 50.00 -0.996
4933 5000- 99 50.00 -1.360
5041 5OOO. 94 50.00 0.801
5173 5000*6 50.00 3.443*
3i60 5000.94 50.00 3 .181~
5 010 5001.00 50.00 0.180
5019 5000 * 97 50.00 0.361
5059 4999.72 49.98 1.186
4986 5001.00 50.00 -0.300
5037 5oOO 93 50.00 0.721
5005 5000.98 50.00 0.080 I
TABLE 4.10
m m T S OF THE TEST ON TOTAL RUNS OF 100 SEQUENCES OF SIZE 10,000 EACH
GENERATED BY THE Ui"0RM NUMBER GENERATOR (2.1.4) - Continued
C r i t i c a l values for the 0.05 probabi l i ty l e v e l a re fL.96.

- 46 -
TABU 4.10
RESUIES OF THE TEST ON TOTAL RUNS OF 100 SEQUENCES OF SIZE 10,000 EACH
GENERATED BY THE UNIFORM NUMBER GENERATOR (2.1.4) - Continued
C r i t i c a l values fo r the 0.07 probabili ty l e v e l are A1.96.

- 47 -
94
95
96
97
98
99
TA- 4.10
RESULTS OF THE TFST ON TOTAL RUNS OF 100 SEQmNCES OF SIZE 10,000 EACH
GENERATED EIY THE UN'IFORM NUMBER GENERATOR (2.1.4) - Concluded
4950 5001.00 50.00 -1.020
4987 5000.98 50.00 1 -0.280
5023 5001.00 50.00 0.440
5 006 5000.02 49.99 0.120
5029 ~OOO. l .8 49.99 V * / I n 577
4978 4999.38 49.98 -0.428
- _
5024 100 I! 3000.86 50.00 0.463
C r i t i c a l values f o r the 0.05 probabi l i ty level are k1.96.

- 48 -
RESULTS OF THE TEST ON MTAL RUNS OF 50 SEQUENCES OF SIZE 10,000
EACH GENERATED BY E&UA!CION (2.2.1)
I -
".
r P r I or Sequence no. (Obs. no. of runs) (Mean of runs) (S.D. of runs) . I
1-- II 5039
-0.700 I
-0.280 I
-0.280
-0.400 I 1.144
0.440 I
~~
0.120
-0.020
0.577 I C r i t i c a l values for the 0.05 probability l eve l are 21.96.
50.00
50.00
49.99
1.420
0.463
-0.767
26
27
5040 5000.30
5005 5001.00
31
32
5173 5000.85
5160 5000.94
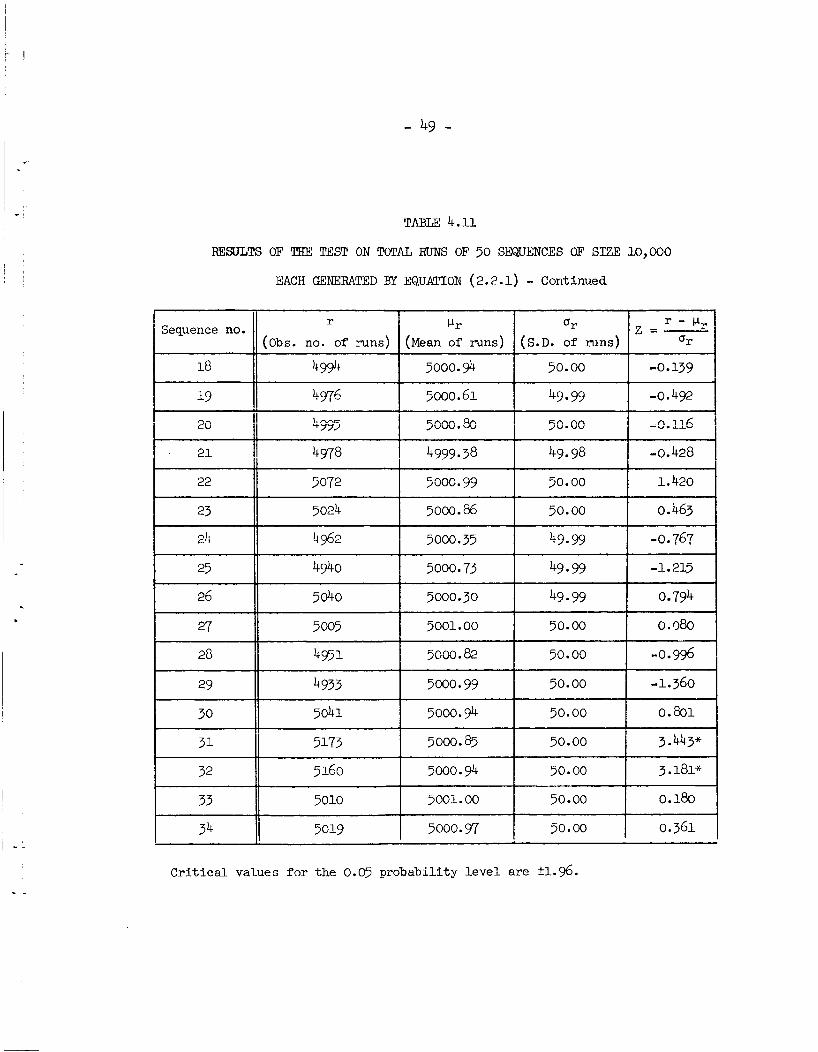
- 49 -
TABLE 4.11
RESULTS OF THE TEST ON TOTAL FUNS OF 50 SEQUENCES OF SIZE 10,000
EACH GENERATED BY EQUATION (2.2.1) - Continued
r Ur (Obs. no. of runs) (Mean of runs)
Sequence no. i I l8 4994 1 5000-$ 50.00 -0.139
G n /V .VV nn &.E6
1 . 21 4918 I I 4999.38
I 25 II 4940 I 5000.73 49.99 I -1.215
49.99 0 794
0.080
50.00 -0.996
50.00 -1.360
50.00
50.00 1 3.443"
50.00 3.181*
50.00
50.00 0.361
I 33 II 5010 I 5001.00
34 5019 I 5000.97 I -:
I I - -
Cr i t i ca l values f o r the 0.05 probability l eve l are k1.96.

- t
TABU 4.11
m m s OF THE TEST ON TOTAL RUNS OF 50 SEQUEXCES OF sm io,ooo EACH GENERATED BY EQUATION (2.2.1) - Concluded
Sequence no. (Obs. no. of runs)
36 I I 4986
5002 39 II 40 I1 5033
41 II 4975
42 II 5045
43 II 4980
44 II 5069
45 5116
46 II 5000
47 II 4974
4996 6 50 II 4950
r - iir P r or z = - ( M e a n of runs) (S.D. of runs) 'r
4999.72 49 98 1.186
5001.00 50.00 -0.300
5000.93 50.00 0.721
5ow. 98 70.00 0.080
5000.74 49.99 0.025
5OO. 88 50.00 -0.518
5000 - 97 50.00 0.881
5001.00 50 00 -0.420
4999 81 49.99 1.384
5000 - 77 2.305"
5000.99 50.00 -0.540
5000.66 I 49.99 1 0.427 I I
~OOl.00 50.00 -1.020
C r i t i c a l values fo r the 0.05 probabili ty leve l a re fi.96.
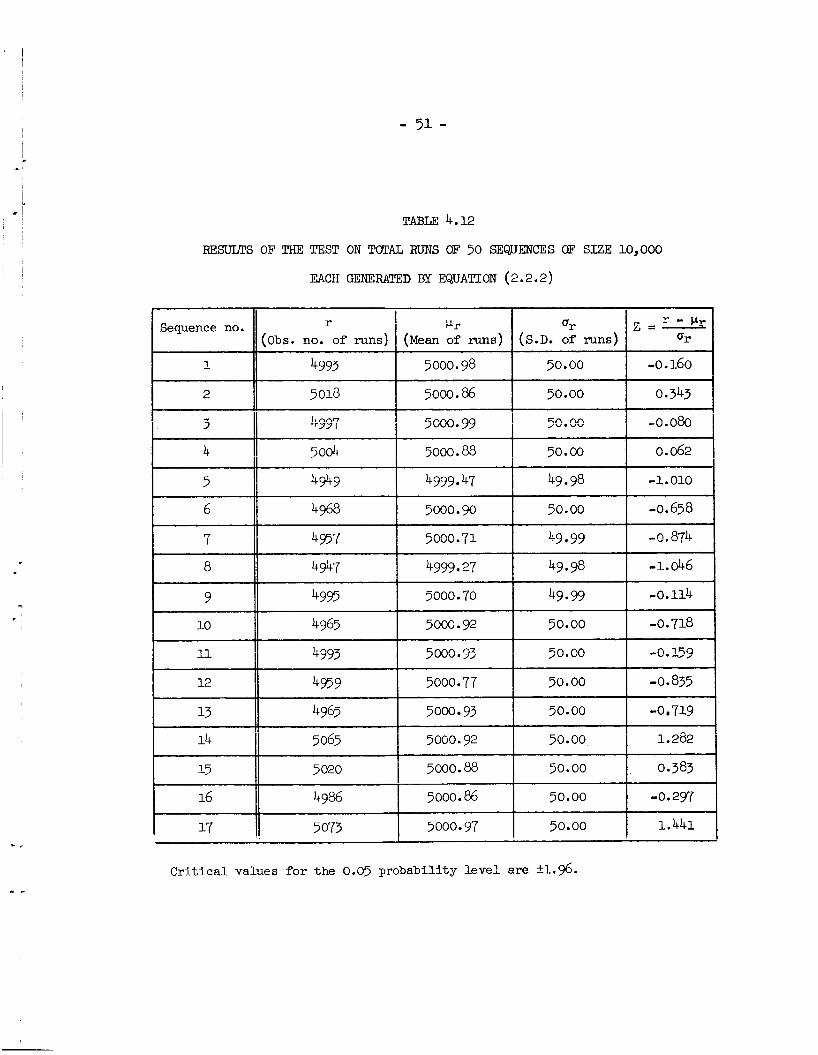
- 51 -
I r - vV Pr or z = - r I Sequence no.
(Obs. no. of runs) (Mean of runs) (S.D. of runs) or
1 4993 7000.98 50.00 -0.160
2 501.8 5000.86 50.00 0 - 343
3
4 5004 5000.88 50.00 0.062
5 4949 4999 47 49 98 -1.010
I , nnrl I F A A n nn ' ,W."W E;n nn I =o.o& I 777 1 / w v v * 77 II I
6 4968 5000.90 50.00 -0.658
" I f7/ 1, X? I 5occ.71 49 99 -0.874
8 4947 4999 27 49.98 -1.046
9 4995 5000.70 49.99 -0.114
10 4965 3000.92 50.00 -0.718
ll k993 5000.33 50.00 -0.159
12 4959 5000.77 50.00 -0.835
13 4965 5000 93 50.00 -0 719
14 5065 5000.92 50.00 1.282
15 5 020 3000.88 50.00 0.383 -.I
16 49% 5000.86 50.00 -0.297
17 5 073 5000- 97 50.00 1.441
I
L * '
' <
- -
TABLE 4.12
FESULTS OF THE TEST ON TOTAL RUNS OF 50 SEQUENCES OF SIZE 10,000
EACH GENERATED BY EQUATION (2.2.2)
C r i t i c a l values for the 0.05 probability l eve l are k 1 . g .

- 52 - I I -
! -
I - *
TABLE 4.12
EJEXILTS OF THE TEST ON TOTAL FUNS OF TO SEQUENCES CE' SIZF: 10,000
EACH GENERATED BY EQUATION (2.2.2) - Continued
I-Ir Qr r - W r
(Mean of runs) (S.D. of runs) r
(Obs. no. of runs) Sequence no.
5000 99 50.00 0.440
4998.88 49.98 0 743
5000- 93 50.00 -0 - 779
-1. i;i7
18 5023
19 5036
*O II 4962
21 li 4943 22 5062
23 4996
24 5 025
25 5024
5000.16 49.99 -0.083
0.481
5000.9 50.00 0.461 I .
5001.00 50.00 -0.100
5000 * 98 50.00 0.841
28 II 5003 5000.98 1 50.00 I 0.040
29 II 5008 5000.89 50.00 0.142
5000.82 50.00 1.284 II 5065
5000.99 I 50.00 I 0.200
32 II 4959 5000.65 49.99 -0.833
5000.88 50.00 0.262
I1 II
33 II 5035
5014 34 II C r i t i c a l values f o r the 0.05 probabili ty l e v e l are a1.96.

- 53 -
TABU 4.12
FESULTS OF THE TEST ON TOTAL RUNS OF 50 SEQUENCES OF SIZE 10,000
EACH GENERATED BY EQUATION (2.2.2) - Concluded
~-
Sequence no. or (S.D. of runs)
r (Obs. no. of runs)
35 5000.33 5019
438' 50.00 -0.280
37 5 037 5000.60
4960 5000- 99 I
50.00 -0.820
49 99 0.958
49.99 0.366
50 00 -1.755
38
39 5000.10 5048
5019 40 5000.68
41 4913 5000.75
42 5001.00 50.00 I 1.280 5065
5079 43 49 99 1.570
50.00 -0 055
49.99 0.207
44 4998 5000. T
45 5011 5000.63
4976 5000.80 46 50.00 -0.4%
49 99
49.98 0.869
47 5 067 5000.74
4999.59 48 5043
5042 ~
49 49.98
50.00
4999.45
5000 97 50 4928
Crit ical values for the 0.05 probabi l i ty l e v e l are k 1 . g .

- 54 -
1 ~~
Above 8 .69 X2
9.624
TAHLE 4.20
RESUYIS ClF' THE TEST ON RUN'S ABOVE AND BELOW THE MEAN FOR 100 SEQUENCES
GENERATED BY THE UNIFORM IWMBER GENERATOR (2.1.4)
2 3 4 5 6 7 8 9 10
3.834 14.523 ll.293 10.324 11.520 l.l.609 3.418 3.602 l3.&
2.848 16.348 8.201 15.352 12.936 9.690 5.286 12.887 10.475
I = 1-12- Above 19.468 8.132
%low 6.733 13.497
I X2
13 14 15 16 17 18 19 20
18.543 15.896 5.176 8.184 9.313 9.043 14.349 3.068
14 .95 25.563* 4.865 11.820 16.547 16.777 16.048 20.651"
Sequence No.
Above X2
21 22 23 24 25 26 27 28 29 30
8.741 13.265 5.807 11.360 14.523 12.065 14.598 8.482 6.496 8.013
16.526 5.535 16.173 5.750 16.348 27.605" 7.685 13.336 11.609 14.627
Sequence No.
Above X*
I I 31 1 32 1 33 I 34 I 35 I 36 I 37 I 38 I 39 I 40 I
41 42 43 44 45 46 47 48 49 50
10.975 5.013 13.400 22.626" 11.410 15.045 U.936 11.735 12.167 20.316~
*".&ji 5,5i& G.j9 j ;*;;> - ,-.LA c -a - 7 - 7 7.L"L , . I , " -.c,* e.379 L5.L'!L 6.6c7
Sequence No.

- I
53
11.540
- 55 -
54 55 56 57 58 59 60
8.013 n.460 11.774 9.622 9.091 4.194 8.896
l------ 63 1 64 I 65 I 66
3.657 5.888 4.575 6.057
j.838 5.447 10.925 23.540~
- c
~~
67 I 68 I 69 I 70
6.434 3.392 2.934 n.297
5.006 1.949 14.066 5.967
. -
I I Above '25.128*
Below 12.201 x2 ,
TABLE 4.20
RESULTS OF THE TEST ON FiUIiS ABOVE AND BELOW THE MEAN FOR 100 SEQUWCES
GENERATED BY THE UNIFORM NIIMBER GENERATOR (2.1.4) - Concluded
9.&2 21.194" 12.617 7.890 9.455 18.950 3.594 23.970* 6.911
15.287 6.130 14.277 13.128 9.943 18.661 9.792 6.744 7.598
51 52
Sequence iio.
E Beiow
Above
~
Sequence No.
I I I I
7.743 I 9.570 I 15.433 I 5.793 I23.506* 116.863 I 9.741 I 15.155 1
I
11.008 I 5.146
Sequence No.
a i 74 I 75 I 76 I 7 7 1 78 I 79 I 8 0 1 I I I I I I I
11.741 I 6.903 1 5.354 I 4.940 118.025 1 2 2 . 2 2 ~ I 12.183 I 16.436
26.162* 132.107 I 7.715 I 4.606 I 9.706 I 11.550 110.952 I 16.683 I
Sequence No.
Sequence No.
Critical value of x2 for 0.05 "rnhnhil.1t.y level vlth 11 Beprerfi nP f r e e d m i n 19-7.
- 56 -
Above x2
- -
9.570 7.743 8.613 10.462 21.784" 15 .29 27.020* 12.563 20.684" 15.913
6.013 11.540 3.272 12.310 8.0% 8.878 14.969 9.272 4.041 16.724
. I
11 l2 13 I x2 1 Above 110.994 1 &rl 1 l::z6 m o Y 13.181
TABLE 4.21
RESULTS OF !WE TEST ON INNS ABOVE AND BELOW THE MEAN FOR 50 SEQUENCES
GEERATED BY EQUATTON (2.2.1)
14 15 16 17 18 1.9 20
15.135 16.441 21.441* 5.904 12.479 18.423 9.975
17.560 6.730 2.948 6.255 21.615* 7.076 33.566"
Sequence No.
Above
B l o w X2
16.980 13.028 6.023 16.458 15.433 5.793 23.j06F 16.863 9.741 15.155
13.968 6.119 15.308 14.780 11.460 11.774 9.622 9.091 4.1% 8.896
31
Kiove i4.19
Below 17.aO x2 ,
Sequence No.
32 33 34 35 36 37 38 39 40
17 .33 3.838 5.447 16.95 l2.j40 5 . 6 6 1.949 14.666 5.707
15.037 3.657 5.888 4.575 6.057 6.434 3.392 2.934 u.297
Sequence No.
Crit ical value of X2 for 0.05 probability level with 11 degrees of freedom i s 19.7.

- 57 -
Above x2
~ e i ~
TABLE 4.22
R E ~ S OF THE TEST ON m s ABOVE AM) BELOW THE MEAN OF 50 SEQUENCES
GENERATED BY h2UATION (2.2.2)
2 1 22 23 24 25 26 27 28 29 30
23.7lY 9.205 27.59* 15.081 5.730 22.715" 9.646 17.790 9.024 6.641
16.275 6.880 12.481 4.808 15.036 7.548 I 7.662 24,815" 5.432 9.007
1 Below 8.198 13.743 9.500
Sequence No.
Sequence No.
Sequence No.
- 38 -
TABLE 4.30
RESULTS OF THE TEST FOR ZERO CORRELATION FOR 15 LAGS OF 100 SEQUENCES
GENEMTED BY THE UNIFORM XBIBER GENERATOR (2.1.4)
.. -
Cri t ica l values for the 0.05 probability level are 21.96.

- 59 -
11 E 13 14 15 16 17
WILE 4.30
msurirs OF THE TEST FOR ZERO CORRELATION FOR 15 LACS OF loo SWENCES
GENFAATED BY THE UNIFORM NUMBER GENERATOR (2.1.4) - Continued
18 19 x,
Lag*\
i 4
-0.450
-0.178
-0.888
0.218
0.277
0.262
h1.136
0.%5
-1.920
-l.$3
-1.288
LU.9
1.005
-0.951
-0.393
@R
-1.289 -2.314" 0.027 -0.415 -1.437 -1.203 0.466 0.595 -1.253
-0.561 -2.275* -0.919 -1.351 -0.864 0.628 -1.801 -2.941* -0.560
0.2g -0.507 -0.920 -0.780 0.159 0.392 0.213 1.296 -1.331
-1.046 0.138 0.606 -0.464 -1.256 -1.213 -0.515 -1.195 -0.735
0.866 -0.256 -1.384 -0.323 0.733 -0.771 -0.856 0 . 2 5 0.065
0.819 -0.950 -1.420 0.700 0.976 -1.865 0.94 -1.550 -0.228
0.664 -0.707 -0.246 0.605 0.044 1 . ~ 4 -0.93 0.310 2 . 6 3 ~
0.264 -1.421 -0.583 -1.591 0.072 -2.957" 1.646 -0.038 0.250
0.149 -0.016 -1.813 0.019 0.366 1.647 0.895 -0.664 -1.438
-0.260 -1.628 1.008 1.555 -0.405 -1.069 -1.585 -2.4291( -1.518
-0.328 1.159 -0.19 -1.707 -0.207 1.271 -0.059 0.593 0.808
1,185 -1.915 0.474 -0.496 1.376 0.087 0.434 0.675 -0.471
-1.940 0 4 0 -0.376 -0.46 -1.861 - 1 . 3 ~ -1.803 0.318 -0.553
0.189 -0.915 -2.303* -1.445 -0.054 1.904 -1.952 -0.426 0.226
-0.360 -1.642 -0.128 1.449 -0.701 -1.768 1.404 0.327 1.172 I C r i t i c a l values f o r t h e 0.0s probabili ty level are k1.96.
.-

- 60 -
TABLE 4.30
REWS OF THE TEST FOR ZERO CORRELATION FOR 15 LAGS OF io0 SEQUENCES
GENERATED BY THE UNIFOFM NLIMBER GZNERATOR (2.1.4) - Continued
Seq. No. 21 22 23 24 25 26 27 28 29 30
1 -0.759
2 1 -i.$j*
-0.784
-1.522
-0.290
-0.188
-0.613
-0.641
~
-0.103 -0.356
I -1.690 I -Os913
-0.010 -0.048 I 1.150 I 0.171 1-0.784 -0.052 -1.028 I 0.575
-0.946
-0.598
-0.646 1-0.879
-0.083 -2.166' I -0.475 -1.007
-0.413 1.532
0.926 0.228
-1.663 -1.213
-0.202 1.934
-0.774 -1.689
-1.324 -1.093 -0.406 I -1.182 0.328
-0.382 -0.753 * 1.073 -2 - 077"
-2.032* 1 1.912 -0.022
-1.724
0.712
-1.264 ----I--
_L_. 1.269 ; -0.062 .-
. " Cr i t i ca l values far the 0.05 probability level are +1.96.

-1.348
-0.666
-1.261
-0.613
-0.311
-0.225
-0.353
-1.378
-1.1.16
-0.621
-0.364
2.262X
-1.610 -0.921 1.212 1.441
-1.613 0.902 -1.786 -0.917
1.383 0.636 0.010 -0.67
-1.087 -1.994* -1.049 0.543
0.179 -0.358 1 I 0.867 0.385
I -0.326 0.706 ' -1.145 1.1%
I
1.347 1 -0.5J-l
I 1.861 i -0.472
! -2.051* 1 0.317
-1.320 -0.445 -1.060
-2.241+ - 2 . 2 3 ~ -0.361
1.104 -1.639 -0.870
- 61 - I . ..
T U 4.30
RESULTS OF TRE TEST FOR ZERO CORRELATION FOR 15 LAGS OF 100 SEQUENCES
GENERATED BY THE UNIF?RM NUMBER GENXFIATOR (2.1.4) - Continued
Seq. No.
z - R - E(R) OR
0.503
-0.986
-0.327'
-0.882
0.471
-1.053
0.073 0.882 2.10~ 0.170 -0.815 -0.668
-1.459 1-1.308 1-0.349 I -2.428+ 1-0.149 -0.651 1-0.279 1.144
-0.U.9
0.672
-1.1go
-1.255
-0.149 1-0.079 -0.108 1 1.50 I I 0,555 I I 1.174 1 0.512 1-0.103 -0.720 2.327* I-O.O&
-0.461 -0.458 -1.917
-1.507 -2.262* 0.320
3 . u * 0.690 0.210
-0.050 -1.03 0.301
-1.384 -1.508 0.115
a 1 1 6 -1.288 1.201
-0.624 0.579 0.029
~~
2.035"
0.230
0.412 -1.601
-0.340 -1.476
-2.850* 0.887
-0.648
-0.253 -0.453
-0.493 0.335
1.310 1.272 .-
? -
Crit ical values for the 0.05 probability level are k1.96.

- 62 -
TAEGE 4.30
RE3ULTS OF THE TEST FOR ZERO CORRELA!TION FOR 15 LAGS OF 100 SEQUENCES
GEXC3PATEI BY THE LTnPOm >LNEE€? GE>E!wJ!OX (2.1.4) - Cofitimed
Seq. No.
t- i -1.254 I -0.817 qq -0.164 -0.276 I
-0.975 -0.381
-0.570 0.858 I
-0.279
-1.232
-0.491
-1.431
-0.820 I I I
-2.263* -0.704 + -0.437 0.040 -2.081* 1 0.189 1-0.698
-0.434 -0.528 1-0.862 -1.199 I I
-1.368 -0.257 -0.456 -1.302 1-0.693 I 0.006
0.014 ' -1.123 0.830 1-1.335 I 0.003
-0.348 -I.,""
0.967 1-0.562
1.609 1-1.523 -2.285*
-0.267 -0.501 -l-t -1.322 -2.09@ -0.856 -1.343 .- Cri t ica l values for the 0.05 probability level are k1.96.

- 63 - ! - I -
I - 1 -
.-
.-
TABLE 4.30
RESLkTS OF THE TEn FOR ZERO CORRELATION FOR 15 LAGS OF 100 SEQUENCES
GENERATED BY TH!3 LTTIFORM NaMBER GETERATOR (2.1-4) - Continued
52 53 54 55 56 57 58 59 60
z = ?+pl
Cri t ica l values for the 0.05 probability level are k1.96.

6 1 62 I 63 64 1 65 1 66 I 67 I 68 69 70
- 64 -
TAELE 4.30
RESULTS CP THE TESI' FOR ZERO CORRELATION FOR 15 LAGS CP 100 SEQUENCES
GENERATED EX TKE UNIFOFM NUMBER GENERATOR (2.1.4) - Continued
-2.833* -2.716* -0.896 -0.290 -1.228 0.422 -0.076 -1.765
-0.376 I
1.248
0.509
-0.067
0.863
-1.216
-0.511
-0.871
0.327
-0.409
2.143*
0.834
1.795
-0-3!%
I -i.&+y i -i.;iTu 1.99 v.eii
-0.097
-0.351
0.858
u. 772
-0.511
-0.36;
0.735
u . iTy -1.581
0.495
-1.188
0 . 6 2
0.248
0.514
0.172
-0.G56
-0.151 1.574 -0.248 -0.952 I 0.169 0.999 -2.317*
-0.409 -1.060 0. '744 -0.713
-1.302 -1.400 -0.989 -0.542
-1.220 -0.517 -1.749 I 0.071 1-0.968 0.302 -0.598
1.456 1.189 -0.527 I 1.651 1-1.123 -1.510 -0.839
-0.931 -0.756 -1,778 -0.688
-0.508 -0.857 0.002 -0.550 1.214 0.243 -0.801
1.224 1.334 -0.282 -0.425 1-519 -0.314 -0.255
-1.023 -1.302 0.003 -1.631 -1.418 -0.284 -0.340
0.843 0.493 -0.126 1.511 1.480 0.594 1.567 0 . 3 0
Cr i t i ca l values for the 0.07 probability level are i1.56.

- 63 -
7 -1.69 0.436 -0.091 -0.49 -2.13P 1.617 0.923 0.488 -0.667 -0.283
8 -1.489 -1.531 -1.27 -0.95 0.529 -1.613 -1.218 0.719 0.106 -0.968
9 1.240 0.266 -1.264 -1.256 0.762 -2.293* -1.254 -0.932 -0.796 -0.085
10 -0.135 1.586 0.626 -0.892 -0.006 -0.133 -1.277 0.846 -0.591 -0.874
11 -3.070* -1.652 -0.587 -1.327 0.702 -0.211 0.692 0.077 -1.188 1.404
12 0.669 -0.412 0.051 1.174 1.202 0.227 0.299 -0.360 0.479 -1.742
1 13 -0.238 0.061 -0.569 1.382 0.084 0.312 I -0.081 0.935 I -1.399 0.646
14 -0.518 -1.081 -2.410* -1.170 -1.112 0.177 -1.453 0.040 1.069 -0.518
15 1.971* 2.077* 0.877 1.321 -1.294 -0.551 -0.81iO -0.715 -2.235* -1.001 L
TABLE 4.30
RESUIIPS OF THE TEST FOR ZERO CORRELATION FOR 15 LACS OF 100 SEQUENCES
GENERATED BY TKE UNIFORM NUMBE3 GENERATOR (2.1.4) - C o n t i n u e d
.-
.-

I
83 84 85 86 82
I
87 88 89 90
- 66 -
z = UR
1 -0.858 -0.704 -0.031 0.166 -1.591 -1.236
I -L*L"7 I -""I" i -'-w I l o Z + O L n x n Z M , -1.229 I - ~ . l i y 2 11 ".E, I
3 -1.439 -0.734 -0.876 0.478 0.260 1.429
4 -0.585 0.612 0.378 0.137 -0.911 1.063
5 0.065 -0.135 0.333 -0.853 0.772 -1.99~
6 1.889 -2.075* 0.745 1.191 0.720 0.876
7 0.474 0.426 -1.138 -0.970 -0.105 0.910
8 0.676 -0.064 0.322 0.514 0.022 1.339
9' 0.252 -0.891 -2.182~ 0.450 0.257 -1.938
10 1.210 0.279 -1.833 -1.652 -0.057 -0 .95
ll 0.142 -0.443 -1.014 -0.09 -0.1221 0.303
I2 -0.684 -0.085 0.438 0.469 1.107 -0.650
13 0.322 0.450 0.442 -1.278 -L@* 0.208
14 0.534 -1.388 -1.162 -1.829 0.133 0.389
15 -0.626 -0.050 -0.727 1.668 -0.262 -0.652 __i.
C r i t i c a l Values for the 0.05 probability level are +1.$.
TABU 4.30
RESUWS OF TBE TEST FOR ZERO CORRELATION FOR 15 LAGS OF 100 SEQUENCES
GENEPATEE By "E4 UNlFOHM NUMB% GENERATOR (2.1.4) - Continued
-1.816 -1.311 -0.020 -2.2773
n 711. i -1.g1 I 4 . 7 9 , -l.LVJ8 "-'-I
0.578 0.424 -0.603 - 0 . ~ 5
0.456 1.281 0.715 0.5%
- 1 . 7 ~ -0.670 0.3% -1.214
-0.329 0.341 0.800 -1.@5
-1.014 0.165 -2.505~ -0.751
1.067 1.309 0.080 -0.508
0.546 -1.027 -1.3% -1.078
-0.817 -0.603 -1.648 -1.135
1.119 0.074 -1.156 -1.205
1.965" -0.511 0.576 0.882
-0.502 1-0.193 I -0.09 1 . O U
0.699 -0.020 -1.010 -1.693
-0.358 -0.7% 0.0% 1.402 .-

I - -
9 93
- 67 -
94 95 97 98 99 100
TABLE 4.30
RESUIIPS OF THE TEST FOR ZERO CORRELATION FOR 15 LAGS OF loo SEQ~TENCES
GEEFATED EX TIE UNIFORV ?JUN!XB GENERATOR (2.1.4) - Concluded
0.069 0.013 -0.308
1 0.685 I -0.733 I -0.096
I
I t
-0.820 -1.175 -0.280
-1.916 -0.501 -2-l21*
-0.180 0.264 0.234
-0.091 1.491 -1.215
-0-584 0 . 0 5 -2.268*
-1.526 -1.734 1.139
I -0.764 0.018 0.530
-0.318 1.778 -0.513
-1.095 -1.788 1.740
- 1 ~ 9 7 6 ~ -0.142 1.2%
-1.242 0.748 0.146
-0.481 -0.269 -1.421
I-- 1 . 4 ~ 1.925 -0.771
Seq. No. T- u g P \
1
= bR
0.391 -0.988 -0.237 -0.365 -1.343 0.445 -0.779
-1.710 -2.482~ -0.877 -0.684 0.403 -1.889 -1.678
0.128 -0.324 -0.804 -0.672 -1.457 1.329 -o.137
-1.U5 0.876 -0.465 -0.333 0.113 -1.562 -0.m
-1.169 -1.000 0.315 -0.4L7 0.938 0.107 -0.597
-0.095 -1.8n 1.060 -0.026 0.~7 -1.584 -0.615
-0.166 0.378 0.502 1.297 1.259 0.212 0.037
-1.915 -0.089 -1.69 -1.200 -1.683 0.119 0.653
0.333 -1.328 0.167 -0.664 -2.613~ -0.934 -0.829
-0.917 0.051 1.825 0.669 -0.434 -2.401~ -0.307
0.740 -1.185 -0.162 -0.943 .i.637 -0.088 0.150
-9.822 -C!.3Q7 -0.056 1.2a -0.208 0.615 0.044
0.715 0.484 0.485 -1.159 0.788 0.289 -1.521
0.949 -1.1ll -0.463 -0.406 0.585 -0.897 0.870
0.417 -0.041 2.017* -0.978 -0.342 0.429 -l.on
n L
3
4
5
6
8
9
10
ll
i2
13
1 4
15 ~~ ~
Cr i t i ca l values for the 0.05 probabillty level are +1..3.

I
- 1
2 3 4 5 6
- 68 -
7 8 9 10
I -2.552* -1.699
TABLE 4.31
RESULTS OF m TEST FOR ZERO CORRELATION FOR 15 LAGS OF 50 SEQUENCE^
GIXEPATEI Ey EQIL4TIQN (2.2.1)
1 -1.544 -0.375 , 0.160
I
i -1.946
-0.251
-2.374"
1.802
0.254
1.963" 0 . ~ 5 0.320 -1.052
0.583 1.645 1.000 -0.850
0.002 -0.515 0.548 0.336
R - E(R) OR
z =
0.768
0.968
-0.444
-0.074
0.263 0.09 0.164 -0.565
-0.778 -0.261 1.262 0.539
0.083 -0.718 -0.958 0.827
-0.405
0.448
0.318
-0.413
a.270
0.476
-0.650
-0 1602 ~- ~
-0.741
-1.033
-2. 8$*
0.849
0.142
0.427
-0.888 1 0.489 1 0.603 1 -0.373 1 -1.052 1 -0.98 , 1.626 , -0.239 ! -0.811 ! 0.452 ,
C r i t i c a l values f o r the 0.05 probability l eve l are 51.96.
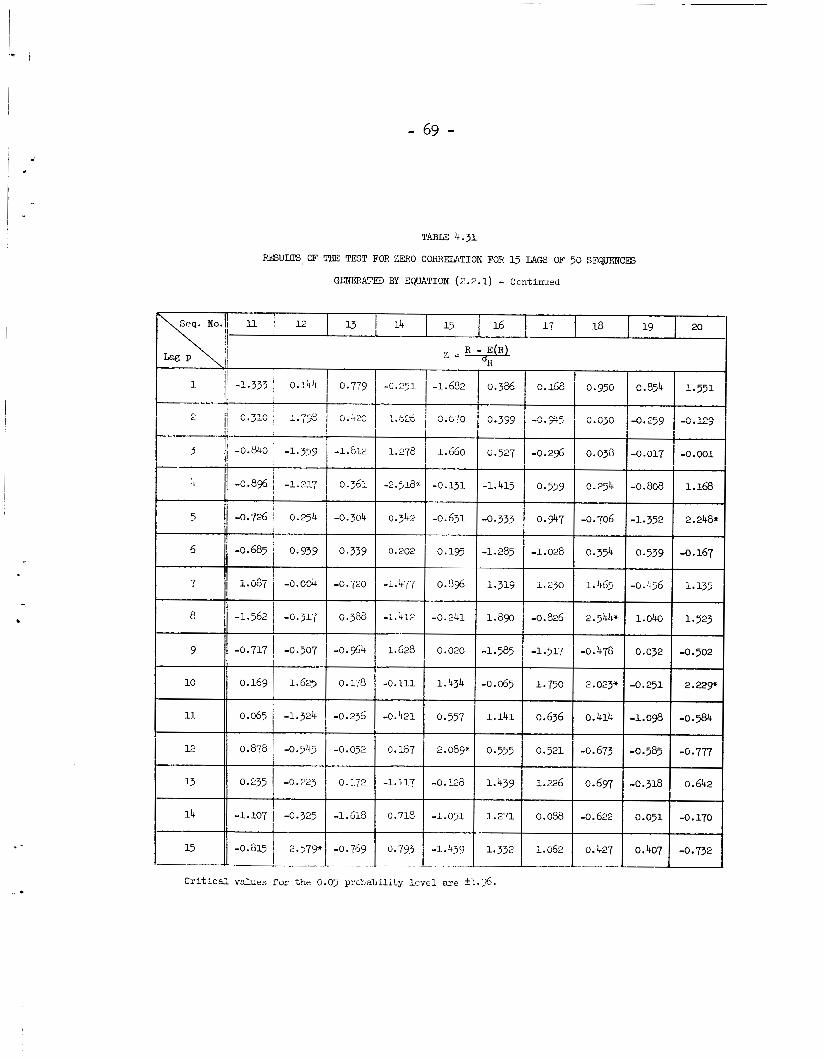
1.040
0.032
1.523
-0.502
- 69 -
TABLE 4.31
RESULTS, OF TIIE TEST FOR ZERO CORRELATION FOR 15 LAGS OF 50 SE-CES
GENEBATED BY EQUATION (2.2.1) - Continued
Seq. No. I-: t- 4
5
6
7
8
9
10
11
___ -
-O.$5 i O.O;O
-0.017 I -0.001
-0.856 -1.217 I 0.361 I -2.518*1 -0.131 1-1.415 -0.808 1.168 I
-1.028 0 * 354
i.23G 1.463
-1.562 j -0.317 1 0.388 I -1.412 1 -0.241 I 1.8% -0.826 2.544*
-0.717 ~ -0.507 1 -0.964 I 1.628 I 0.020 -1.585 5 -1.517 1 -0.478
0.636 0.414 -1.09 I -0.584 0.065 -1.324 -0.236 -0.421 0.557 1.141
0.878 -0.545 -0.052 0.187 2.08~ 0.555
0.235 -0.223 0.172 -1.117 -0.l.28 1.439
-1.107 -0.325 -1.618 0.718 -1.051 1.271
.-
C r i t i c a l values f o r tine 0.05 prijbability level are +I.$.

- 70 -
21 22 23 24 25 Seq. No.
'.;\[ 26 27 28 29 30
i I
3
4
.-
8
9'
TABU 4.31
RESKUIS OF TIFE TEST FOR ZERO CORRE!UTION FOR 15 LAGS OF 50 SEQITENCES
G F ~ E ~ T E D BY EQUATION (2.2.1) - continued
R - E(R) z = - OR
0.098 0.011 -0.855 0.494 0.380 -0.247
-1.162 -0.532 -0.516 -2.58O* -0.889 -1.06
1.489 I 1.629 I -1.104 I 1.604 I -0.132 I 1.070
1.274 1.401 0.996 -0.845
-0.679 I 0.$1
-0.620 I 0.937
0.711 0.571
1.200 0.140 f -1.651 0.029
1.494 0.194
-0.185 -1.343
-0.744
-0.252
-0.732
-1.282
2.148*
i -0.692
-0.339
-1.535
-0.197
-1.604
0.451
-2.097
-0.318
-0.288
-0.139 .
0.423 1.362 0.235 0.659
-0.359 -0.155 0.946 0.627
1.542 -0.467 -0.977 0.030
C r i t i c a l values for the 0.05 probability leve l are 21-36.

- 71 -
TABLE 4.31
RESULTS OF THE TBT FOR ZERO CORREMTION FOR 15 LAGS OF 50 SEQUENCCES
GEKERATED BY EQUATION (2.2.1) - Continued
.-

I
41
- 72 -
42 43 44 45 46 47 48 49 50
-0.285
-2.018~
-0.403
-0.151
-1.370
0.56;
-0.084
0.074
0.465
1.282
-1.97"
-0.372
TABLE 4.31
REXIUPS OF THE TEST FOR ZERO CORRELATION FOR 15 LAGS OF 50 SEQJENCES
GENERATED By EQUATION (2.2.1) - Concluded
Seq. No. p R - E(R) z=- OR 1 -r -0.830 -1.610 0.165 I 0.825 t- 0.573
0.0% O.'t05 -2. 330*
-0.216 -1.372
0.410 1.804
-0.599 0.560
0.017 -0.940
-1.629 1.408
A ?A? 7 TLQ
L- -0.019 -0.174 i -0.395 0.348 I 0.429 0.278 1-0.026 j 0.251 ,I 1.093 0.409 I -O.Og0
O"l21
0.113
2 059X
0.048
0.905
0.643
-0.622
1.724
0.351
-1.258
0.322
-0.359 0.244
-1.781 2.191* b- I 0.361
-1.001
C r i t i c a l values f o r the 0.05 probability level are k1.96.

- 73 -
2 3 11 5 5
I - -
I
7 1 0 9 10
I * *
-0.083
-0.708
-0.194
-1.016
-0.634
-0.573
-0.420
0.795
T.IJ3I.3 4.32
RESULTS OF THE TEST FOR Z3RO CORREZATION FOR 15 LAGS OF 50 SEQUENCES
G E I C S W D BY EQU.iTiON (2 .2 .2 )
0.227 -0.91 0.372
-0.121 -0.126 -0.042
-2.$4* 0.938 -0.9-
0.720 -0.200 0.397
0.585 -1.069 -1.049
0.175 -1.488 1.126
0.719 0.115 2.463*
0.496 2.061* -0.042
R - E(R) z ='aR
I II I I 3 0.216 0.614 1.065 -0.640
4 -0.511. -0.652 1.104 2 . 6 9 7 ~
5 0.348 1.691 2.148* 1.000
6 -0.093 0.200 0.428 -0.284
11 1.358 1.103 1 0.462 1 1.096 j -0.150 -0.310 -1.688 0.319
-0.5% 0 . 3 0 -1.098 -0.536
-2.483*
-0.926
-0.153
-0.773
2.551"
-0.218
-0.481
-0.404
0.702
0.474
1.130
-0.938
0.670
-0.387
0.671
-1.877
O.go0
2.1%*
~
-0.802
-2.419"
4.71';
-0.276
-1.619
0.064
-2.0211
0 * 577
-0.708
-1.383
-0.432
1.150
C r i t i c a l values for the 0.05 probabili ty l e v e l a r e kl.96.

' I
- 74 -
TABLE 4.32
RESULTS OF TEE TEST FOR ZERO CORRFLATION FOR 15 LAGS OF 50 SEQUENCES
GENERA?L3D BY EQLiATiON (2.2.2) - Contimed I
q. No. F
.-' 1
11 12 13 15 16 17 I 18 19 20
R - E(R) z =- OR
-0.258 I 0.398 1-0.902 1-0.369 1 1.488 1 0.290 1 1.226 1-0.931 -0.052 0.964 I -1.960* -0.792 -0.325 -0.300 -1.875 0.098 -0.272 1 . ~ 3 -0.443 -0.125
-0.911 1.626 -1.504 -0.602 0.384 0.047 o.$8 -1.173 1.370 -1.062
-0.858 -1.239 1.524 -0.641 -0.541 -0.167 -0.365 -2.347~ -0.693 -0.581
-1.121 -1.095 -0.265 -1.098 1.723 -1.011 -0.994 1.416 -0.0% -0.783 I
I I I I -0.0% 1 1.480 1-0.458 1-0.267 1-0.053 I 0.026 1 0.052 1-0.493 1-0.114 1-0.69 I
I 1
C r i t i c a l values f o r the 0.05 probabili ty level are 21.96.
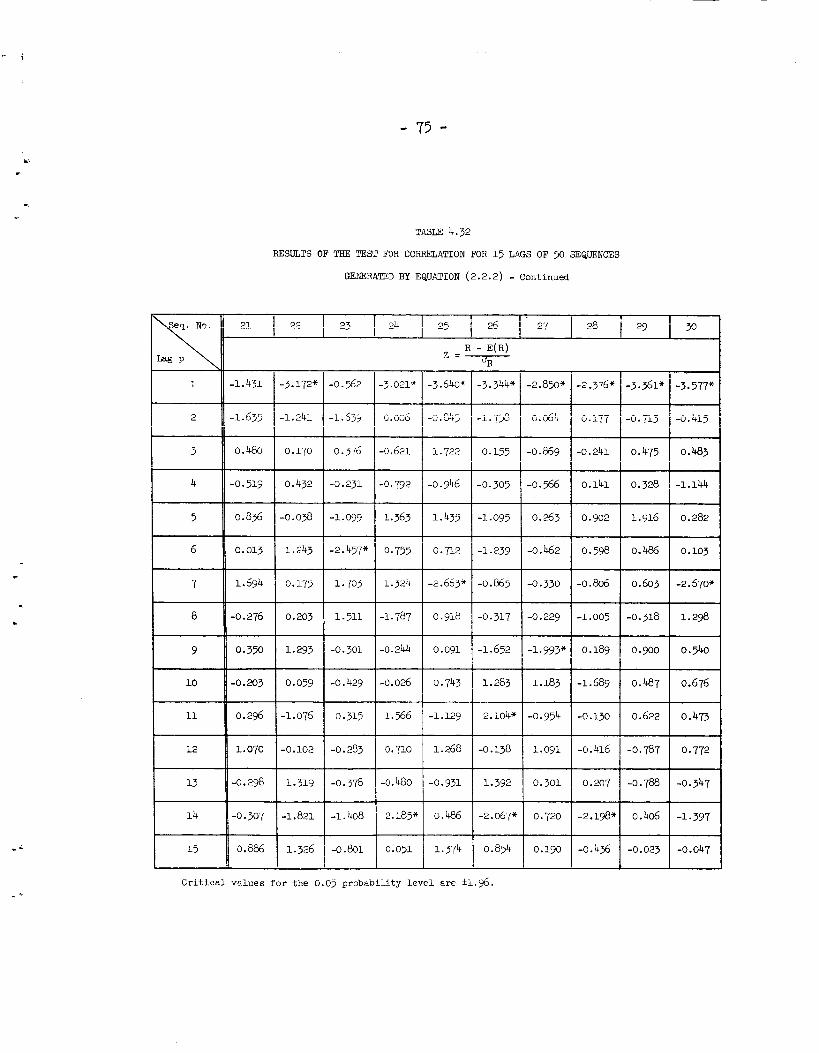
_ _ ?l 1 22 I 23 1 24 25 26 I ' 27 I 28 1 29 1 30
- 75 -
T A B U 4.32
RESULTS OF THE TEST FOR CORPJ~LATION FOR 15 LAGS OF 50 SEQUENCES
GENERATED BY EQUATION (2.2.2) - C o n t i n u e d
I 1 -3.344* .2.850* -2.376" -3.361' -3.577* .1.431
i .Gj2
0.480
.O. 519
0.836
0.013
1.694
.OS 276
0.350
-0.203
0.296
1.070
-0.298
-0.307
0.886
-0.562
-i. 659
0.376
-0.231
-1.099
-2.457*
1.105
1.511
-0.301
-0.429
0 - 315
-0.283
-0.378
-1.408
-0.801
-3.640*
-0. G45
1.722
-3.172"
-i. 241
0.170
0.432
-0.09
1.243
O . l 7 ( 3
0.203
1 293
0-059
-1.076
-0.102
1 319
-1.821
1.326
-3.021*
6. 000
-0.621
-0.792 - 1.363
0.755
1.324
-1.787
-0.244
-0.026
1.566
0.710
-0.480
2.185*
0.051.
-i. 75s 0.64 0. iTi -0. 4i5
0.155 -0.241 0.475 0.483
-0.566 0.141 0.328 -1.144 -0.946
1.435
0.7l2
-2.66j*
0.918
0.091
0.743
-1.129
1.268
-0.931
0.486
1.374
-0.305
-1.095
-1.239
1.916 0.282 0.263
-0.462
-0.330
-0.229
-1 * 993*
1.183
-0.954
1.091
0.301
0.720
0.190
0.902
0.598
-0.W
-1.005
0.189
-1.689
-0.130
-0.416
0.207
-2. i98*
-0.436
0.103 0.486
0.603
-0.318
0.900
0.487
0.622
-0.787
-0.788
0.406
-0.023
-0. 865 -2.5'(0*
, . -0.317 1.298
-1.652 0.540
1.283 0.676
I 0.473 I l1
0.772
-0.347
-1 * 397
-0.047
1 392
-2.067*
0.834 i
C r i t i c a l values f o r the 0.05 probabili ty level are il.$

.'
1 32 I 33 34 1 35 3 6 1 37 I 9
- 76 -
39 40
.:
0.422
-0.308
-1.544
0.932
-1.005
0.0%
1.123
-1.0%
-0.548
1.440
0.517
0.067
-0.531
TABLE 4.32
RESULTS OF THE TEST FOR ZERO CORRFLATION FOR 15 LAGS OF 50 SEQUENCES
GENERATED BY EQUATION (2.2.2) - Continued
-0.383 0.063 -1.017
-1.069 0.107 -0.010
-0.550 0.964 -0.378
1.470 0.120 1.070
-0.265 0.490 0.827
0.275 2.818* -0.452
0.818 -1.208 0.221
1.231 -1.09 0.659
-0.708 -0.029 0.679
-1.083 1.631 1.4W
1.216 0.470 0.179
0.497 0.288 -0.193
-0.157 -0.034 0.133
5
6
7
8
9
10
11
15
- 0.088 1-1.468 1 1.522 0.563 1 0.205 1-0.062 -1.253 -1.500 -0.692
-0 - 405 -0,748 -0.780
-2.883*
-1.689
0.706
-0.255
0.028
-0.752
0: 552
2.721~
-1.580
-1 - 354 -1.126
0.952
-1.453
1.249
0.845
-2.042"
0.934
0 * 570
-0.233
-1.162
-0.478
-0 * 379
0.087
1.304
0.110
0 135
-0.161
-0.112
-0.015
-0.952
-0 * 305
-1.052
0.695
1.160
0.415
-1.153
0.255
0.265
2.213"
0.208
-0 * 7J-9
0 * 937
1.619
- -
C r i t i c a l values for t he 0.05 probabi l i ty l eve l are il.6.

- 77 -
TABm 4.32
RESULTS OF TEE TEST FOR ZERO CORRELATION FOR 15 LAGS OF 50 SEQUENCES
GZWEFATED BY EQUATION (2 .2 .2 ) - Concl iided
.
! p\ II
.~
-0.014 -0.885 -0.018 -1.918 0.492
-2.628~
-1.853
0 333
0.477
1 * 597
-1.167
0.655
1.626
-0.863
1.394
-2.528*
-0.504
0.618
0.200
7- -3.553* -3.597*
-i*072 I 7 n d + -0.220 2.949*
0.281 -0.006
-0.742 -1.412
1.130 0.061
-0.670 0.722
0.001 -0.743
1.069 1.483
-0.051 0.334
-0.g62 0.195
-c. ,-r,
-1.207 -0.553
-0.755 -0.040
C r i t i c a l values for the 0.05 probabili ty l eve l are +I.%.

- 78 -
V. TESTS FOR NORMALITY AND UNIFORMITY
I"
Since f o r each sequence of numbers generated by t h e methods i n
Chapter I1 a d is t r ibu t ion function i s specified, it would be reasonable
t o expect each sequence of numbers t o possess a l l t h e essent ia l proper-
t i e s of the specified d is t r ibu t ion function. One's i n t e re s t i n t h i s
chapter i s somewhat different than i n the previous one. Here one is
concerned mainly on whether or not each sequence of numbers t r u l y comes
f r o m t h e specified dis t r ibut ion.
however, if it does not follow a prescribed dis t r ibut ion, it could be
useless.
A sequence of rmbers may be random;
The t e s t s that follow should indicate with some degree of confidence
whether each sequence follows the uniform dis t r ibu t ion on t h e in t e rna l
(0,l) or the normal dis t r ibut ion w i t h zero mean and uni t variance.
t h i s purpose, 4 tests have been performed on each of t h e 200 sequences
generated by the methods of Chapter I1 f o r t h i s study.
are Karl Pearson's X2 and the Kolmogorov-Smirnov D-test s t a t i s t i c .
Both of these are knam as goodness-of-fit t e s t s .
tests on the seuuence means and variances, respectively.
5.1 Chi-square Goodness-of -F i t Test
For
Two of t he tests
The remaining two are
L e t xl, x2, . , ., xN be N independent observations of some
random variable with an unknown d is t r ibu t ion function
t e s t ing the nul l hypothesis
f ( X ) . Consider
Hg: f ( X ) = f o ( X )

- 79 -
5
where f o ( X ) i s some specified d is t r ibu t ion function. I n general, t h e
problem of tes t ing such a hypothesis i s known as "goodness-of-fitff
problem. If f o ( X ) i s completely specified with regard t o i t s
parameters, (3.1.1) i s referred t o as a simple hypothesis. This case
w i l l be assumed here.
Let xl, ~ 2 , . . ., xN be the N observations of a sequence of
numbers generated by the methods i n Chapter 11. Consider t h e divis ion of
these N observations i n t o k mutually exclusive classes each c l a s s
containing N i observations. Let t h e probabili ty of a n observation
failing i n the ith c la s s b e
i = 1, 2, . . ., k N i P i = N (5.1.2)
where p i = 1. Since it is assumed tha t f o ( X ) is completely i=1
specified, the corresponding class probabi l i t ies according t o the k
mutually exclusive classes may be determined and denoted by pio where,
pi0 = 1. Consider t h e nu l l hypothesis (3.1.1) t o be f necessarily , i=1
s ta r t ed as follows :
Ho: P i = Pi0
i = 1, 2, . . ., k (5.1.3)

- 80 - Then, when Ho i s t rue and from the k mutually exclusive classes, t he
tes t s t a t i s t i c
i s d is t r ibu ted approximately as a chi-square with k - 1
freedom. The nul l hypothesis i s rejected whenever t h e computed T
degrees of
exceeds tlhe llnner In;: of t h e ~hi-gq2-e di&ributfon >,<Cfi :Y, 1 degrees -rr-- ---- of freedom and some given leve l of significance. This i s t h e well-known
m l Pearson's chi-square tes t of goodness-of -f i t (16).
It has been shown by many (17) tha t t h i s tes t s t a t i s t i c i s
asyTqtotically equivdeiit t o the maxiIliiun likelihood r&tie, tes t .
discussion has centered around t h e optimum choice of k f o r a given
number of N observations. Generdly, no power of t h i s t e s t s t a t i s t i c
has yet been determined.
Much
Mann and Wald (18) have shown t h a t if
where N i s the number of observations i n a given sequence and c i s
t 2 ' O0 e - ' d t i s equal t o the probabili ty of 1 determined so that -
t he c r i t i c a l region under the n u l l hypothesis (3.1.3), then the power of
<ne t e s t s t ak i s t i c i s approximateiy u.>u. For a ia rge N , (7. i .3j wouia

- 81 -
.
c
produce a f a i r l y la rge k which could be impractical. However,
W i l l i a m s (19) and Kendall and St& (17) report tha t k can be halved
from (5.1.5) without serious loss of power at t h e 0.70 point.
suggestion i s considered i n t h i s study.
would be an effect ive measure of k whenever N i s subs tan t ia l ly la rge .
3 2.1
This
It i s worth noting that (3.1.5)
Pearam's Test f o r Normality
To apply Pearson's chi-square t e s t t o each sequence generated by
equations (2.2.1) and (2.2.2), one must c l a s s i fy t h e
t ions of each sequence i n t o some k classes. For N = 10,000 and an
a equal t o 0.a f o r t he probabili ty of Ty-pe I error, one determines a
k by (5.1.5) t o be approximately equal t o 140.
N = 10,000 observa-
Recall that
were a pair of independent random variables having t h e same normal
d is t r ibu t ion w i t h mean zero and uni t variance.
c lass arrangement of a given sequence generated by one of the above
equations t
Consider the follawing
This arrangement would produce k = 62 classes of 0.10 width. This is
f a i r l y close t o one-half t h e value of k obtained by (3.1.7). For t h i s
c lass i f ica t ion , t he observed probabi l i t ies , p, may be determined by

- 82 -
dividing t h e number observed i n each class , N i , by N for
i = 1, 2, . . ., 62. The corresponding theo re t i ca l probabi l i t ies , pio,
may be obtained from any tab le of t h e standard normal d is t r ibu t ion .
Thus, t o t e s t t h e nu l l hypothesis
'@io i=l
( 3 9 1 * 3 )
and compare it with t h e upper ta i l of t h e chi-square d is t r ibu t ion with
k - 1 = 61
error . The n u l l hypothesis i s re jec ted i f t h e computed T exceeds t h e
c r i t i c a l region.
sequence of
zero mean and un i t variance.
degrees of freedom and a probabi l i ty of 0.0.5 fo r Type I
9e;ection implies t ha t t h e d is t r ibu t ion of t h e given
N observations i s something other than t h e normal with
The results of t h i s t e s t on t h e 100 sequences generated by equa-
t i ons (2.2.1) and (2.2.2) appear systematically i n tab les (3.10) and
(5.11). Out of t h e possible 100 sequences, 4 were rejected.
r e s u l t s indicate that both equations (2.2 .l) and (2.2.2) generate
sequences t h a t appear t o be normally dis t r ibu ted with zero mean and un i t
variance.
Hence, t h e

I - -
e
> .1.2 Pearson's Test f o r Uniformity
To tes t t h a t a sequence of numbers generated by equation (2.1.4) is
uniformly dis t r ibuted on t h e unit in te rva l , one uses a s i m i l a r approach
as i n t he case w i t h normality.
N = 10,000
Consider t h e c l a s s i f i ca t ion of t h e
observations f o r each sequence t o be t h e following:
(0.00, 0.011, (0.01, 0 . 0 ~ 9 , (0.02, 0.031 . . . (0.98, 0.991, (0.99, 1.00)
This r e s u l t s i n t o k = 100 classes of 0.01 width. It i s apparent t h a t
YIliS is a iiatiii-al divisioil of LL- ..-:A 2.-L ^___^ 1 *
preduce 100 c11cses vtth equal grobabi l i t i es ; Let Ni h e t.he nimber nf
observations falling i n t h e i t h c l a s s . Clearly, the corresponding
theore t ica l c l a s s probabi l i t ies , pio, equal t o 0.01 f o r all
i = 1, 2, . . ., 100. Hence t o tes t the nu l l hypothesis of uniformity,
compute t h e s t a t i s t i c
LAC UULI, LLICICL vai in ~ i i e h G k i y EB to
100 2 p (mi - o.omj-
T I
' = L 0.01N i=1
(5.1.4)
and compare t h e computed
d is t r ibu t ion with 99 degrees of freedom and a = 0.W. Rejection implies
T with t h e upper t a i l of t h e chi-square
t h a t t'ne d is t r ibu t ion of t h e given sequence i s not t h e uniform on t h e
in te rva l (0,1).
Table (5.12) contains the results of t h i s tes t s t a t i s t i c f o r the
100 sequences generated by equation (2.1.4). There was a t o t a l of

- 8 4 - th ree sequences rejected. Therefore, t he apparent conclusion i s t h a t
equation (2.1.4) seems t o generate sequences uniformly d is t r ibu ted on t h e
un i t in te rva l .
5.2 Kolmogorov-Smirnov Criterion
Consider t he cumulative d is t r ibu t ion function FO(X) of some
specified density function f ( X ) . Clear%, f a r any specified value of
the random variable X, the value of Fo(X) i s t h e proportion of
individuals i n the population having values less than or equal t o t h e
sp~cffj .e$ Xi C C n i d p r . fiir+h--, a sequence cf 3; cbse,--.-,ti=ns ths~ght
of having the d is t r ibu t ion - and hence the ci.imiI.la.-kfve It
is qui te reasonable t o expect t h e cumulative step-function of t he sequence
of observations t o be f a i r l y close t o the specified cumulative
d is t r ibu t ion function Fo(X).
ass-me t'nat f ( X j
> - - "I*--
Po(X) - f'(x).
N
If th i s i s not t h e case, one may reasonably
i s not tine d is t r ibu t ion function of the sequence.
L e t Fo(X) be the cumulative d is t r ibu t ion function of t he specified
density function f ( X ) , and FN(X) t he observed cumulative step-function
of the sequence of N observations. That is, FN(X) = k/N where k is
the number of observations less than or equal t o a specified
the dlatrlbii t ion of
X. Then
D = inaxlFN(X) - Fo(X)l 0.2.1)
i s knam and i s independent of Fo(X) if Fo(X) i s continuous. The
l i m i t i n g d i s t r ibu t ion of t h i s test s t a t i s t i c
Kolmogorov (l3j and by Smirnov (14); thus, it i s known as the Kolmogorov-
D has been derived by
SmirEnY g9cc?l?ess-^f-fit t e s t . Eence, ts t e s t t h e x2.1 h y ' p O t h C G i G t h G t a

I *' I . , given sequence of N observations has the specified cumulative d is t r ibu-
t i o n function Fo(X), record i n a t ab le the observed and specified
cumulative d is t r ibu t ion functions and calculate t he m a x i m u m deviation
between them.
exceeds the c r i t i c a l value of the D-stat is t ic with some
b i l i t y of Ty-pe I error .
Reject t he nul l hypothesis whenever t h e maximum deviation
a, the proba-
This t e s t becomes exact whenever t h e observations a r e not grouped
However, f o r most applications t h i s i s prohibit ive. i n t o various classes.
A l t h ~ ~ g h g r ~ q j 5 i i g &sei-fatfoiis f i i to ~ i l i B s iriiervais iencis to iower the
7"rnA~e ef D, fer lmge s m ~ l e n , , the discrqjancy 5 s - ~ s . ~ a J l y -qzrj,, slight
and dl1 cause l i t t l e change i n the appropriate significance leve ls .
addition, some caution must be exercised not t o choose a very small
number of c lass intervals .
I n
It was noted in the preceding section that i n general no power of
Pearson's X2 goodness-of-fit t e s t ex is t s . However, a lower bound of
the power of t h e D-stat is t ic has been derived by Massey (11).
r e s u l t s of h i s work a r e presented below. Let F1(X) be an a l te rna t ive
form of the specified cumulative d is t r ibu t ion function FO(X). Let A
be t h e maximum absolute difference between F1(X) and FO(X). Then f o r
N large, it has been shown (15) that the power of t h e D-statist ic i s
never l e s s than
The
(5.2.2)

, .'
1 -
- 86 -
where N i s t h e number of observations and a ( N ) i s t h e c r i t i c a l value
of t h e D-stat is t ic w i t h a being t h e probabi l i ty of Type I error . Based
on t h e work of Massey (ll), (l?), f igure 5.2 shows t h i s lower bound fo r
the 5 and 1 percent leve ls of significance. Hence, t he f igu re indicates
t h a t t h e D-stat is t ic of Fo(X)
a l te rna t ive Fl(X). A s an example, suppose N = 10,000, and t h e maximum
absolute difference between F1(X) and Fo(X) i s 0.02j then,
A 6 - = 2.00.
5 percent l eve l of significance, a lower bounci of the power or t h i s test
has a t least 0.50 power against t h e
If one tests the specified d is t r ibu t ion Fo(X) a t t h e
ic, fC?2ECi tc be c.89. D,zrzfGTe, the piel. of t 3 L a &- -& beab i s a t ieast 0.89
against t he a l t e r m t i v e Fl(X). I n other words, i f Fl(X) i s correct,
one has at least 89 percent chance of detecting that i s t h e
incorrect cumulative dis t r ibut ion function of the given sequence of
N = 10,000 observations.
F O ( X )
The author has considered both exis t ing t e s t s of goodness-of-fit;
namely, Pearson's X2 and the Kolmogorov-Smirnov D-stat is t ic . I n
general, the power of Pearson's X2
t o t he power of the D-statist ic may be read from figure 5.2 f o r any
a l te rna t ive . Judging on th i s comparison alone, it i s reasonable t o
believe that t h e D-stat is t ic provides t h e be t t e r t es t f o r goodness-of - f i t as long as t h e specified d is t r ibu t ion function i s continuous.
5.2.1 Kolmogorov-Smirnov D-Statistic f o r Normality
i s not known, where a lower bound
To t e s t any sequence of numbers generated by equations (2.2.1) or
(2.2.2) f o r normality using t h e D-statist ic, c lass i fy the observations

- 87 -
c
1.0
0.9
0.8
0 -7
0.6
0.5
0.4
0 03
0.2
0.1
1 r 1 1 1 1 0 - 5 1 .o 1.5 2.0 2.5 3 -0
FIGURE 5.2
Lower bounds fo r the parer of the D test for a. = 0.01 and a = 0.05 (Reproduced from (11))

1 .*'
I - , -
- 88 - i n t o the 62 c lass in te rva ls of 0.10 width as indicated i n 5 J.1.
t h e cumulative d is t r ibu t ion function FO(X) for t h e specified normal
density and t h e above c lass i n t e r v a l s from any appropriate t a b l e of the
standard cumulative normal dis t r ibut ion function.
cumulative step-function FN(X) by dividing t h e number of observations
Obtain
Deterniine t h e observed
i n each c lass in te rva l by
difference
N = 10,000.
D = maxjFll(xj
and compare it with the c r i t i c a l value
"0.05 (10,000) i s given by (11) 1.36 -. 6
Compute t h e maximum absolute
% ( N j , where a = 0.05 and
1.36 = 0.0136. Reject t he V10,000
n u l l hypothesis of normality if t he computed D exceeds D,~05(10,000).
?lie E-s ta t i s t ic has been performed on each of t h e 50 sequences generated
by equation (2.2.1) and t h e 50 sequences generated by equation (2.2.2).
The results appear i n tables (5.20) and (5.21), respectively.
indicate t h a t both equations (2.2.1) and (2.2.2) seem t o be generating
sequences having t h e specified normal d is t r ibu t ion .
Luiib were iioted for any of t he 100 sequences, t h i s should not be an
alarming r e su l t because from the discussion of t he preceding sect ion a
lower bound of t he power of the D-stat is t ic can be easi ly determined.
For example, even if t h e m a x i m u m absolute difference between t h e
specified Fo(X) and some al ternat ive F1(X) i s as small as 0.0175,
one has a t least 76 percent chance of detecting t h e incorrectness of
These
Although no re jec-
I_
F"(X) st t h z 5 I;zrzer;t levzl.

- -
I -
- 89 - 7.2.2 Kolmogorov-Smirnov D-Statistic f o r Uniformity
A very similar procedure m y be followed t o test the n u l l hypothesis
that a sequence of numbers generated by (2.1.4) i s uniformly d is t r ibu ted
on t h e in te rva l (0,l) by considering the 100 c lass in te rva ls of 0.01
width as indicated i n 5.1.2.
dis t r ibu t ion function FO(X), and t h e observed cumulative step-function
FN(X) based on the 100 class intervals , t he s t a t i s t i c
By determining t h e specified cumulative
may be computed and comparedwith D (10,000) = 0.0135 as before.
Rejection implies t h a t the d is t r ibu t ion of t he given sequence i s not the
uniform on the uni t in te rva l . The r e s u l t s of t h i s tes t on t h e
100 sequences generated by equation (2.1.4) may be found i n table (5.22).
The r e s u l t s indicate t h e following:
0.03
A t o t a l of four rejections were noted; t h i s , of course, i s within
AI.. bllc P - r m r n r , L L a u G ~ ~ ~ k of t h e s t a t i s t i c a l t e s t . Therefore, it appears t h a t
equation (2.1.4) does generate sequences t h a t are uniformly d is t r ibu ted
on the in te rva l (0,l).
5.3 Tests on Sequence Means and Variances
S i x e each sequence of fiunbers i s assumed t o be e i ther uniformly
or normally d is t r ibu ted - depending on whichever i s the case - with
some specified mean and variance, it i s reasonable t o expect each mean
and variance of a given sequence t o estimate or be approximately the
same as t h e mean and variance of the specified d is t r ibu t ion function.

- 90 ” To detect, -the depee of Zgreement, t h e fCll0wing con;n;on s t a t i s t i c t l l
tests have been performed on each sequence.
2.3.1 Tests on Sequence Means
L e t X = 1 f X i b e t h e mean of a given sequence xL, x2, . . ., N i=l
X p j . Then, f o r any given d is t r ibu t ion function w i t h mean p and variance
8, x i s normally dis t r ibuted with mean IJ. and variance a2/N, and the -
s t at i s t i c
i s t h e value of a random variable whose d is t r ibu t ion function approaches
that of t he standard normal as N -+ 00. This, of course, is the cent ra l
l i m i t theorem on which one bases a tes t t o determine whether or not t h e
mean of some sequence of numbers i s t r u l y the mean of t he specified
d is t r ibu t ion function of that sequence.
Hence, t o t e s t the null hypothesis Ho: p = PO against HA: p # po,
where po i s equal t o t he mean IJ. of the specified dis t r ibut ion, compute
the s t a t i s t i c - X - L J -
and compare it t o both the l e f t and t h e r igh t tai ls of t he standard
normal w i t h a chosen probabili ty of 0.07 f o r Type I error .
exceeds these limits, r e j ec t the n u l l hypothesis and conclude that the
If Z

- 91 -
mean of the sequence being tes ted i s something other than t h e mean of
the specified d is t r ibu t ion .
Results of t h i s t e s t for the 200 sequences may be found i n
tab les ( 5 .SO), (3.31), and (5.32).
(a)
These r e s u l t s indicate t h e following :
For the 100 sequences generated by equations (2.2.1) and
(2.2.2), no reject ions were noted. As a matter of f ac t , t he agreement
between sequence means and the t h e w e t i c a l mean of zero i s excellent.
( b ) For t he 100 sequences generated by equation (2.1.4), a t o t a l
However, on t h e average the agreement of seven reject ions were noted.
w i t h t he theore t ica l mean of 0.50 was very good.
5 . 3 . 2 Tests on Sequence Variances
Throughout t h l s study, each sequence of numbers i s assumed t o have
one of two dis t r ibut ions, the uniform or the n9rmal.. A t e s t on the
variance of a given sequence assumed t o be normally dis t r ibu ted i s qui te
straightforward. Let the unbiased estimator of 2
n i=l a -
N - 1 ( 5 * 3 93)
be the variance of a given sequence of numbers assumed t o be normally
dist r ibuted. To test the null hypothesis Ho: u = 6 against 2

- 92 -
HA: cr2 # where is equal t o the variance c? of t h e specified
normal d i s t r ibu t ion , compute t h e s t a t i s t i c
whare X2
dis t r ibu t ion with N - 1 degrees of freedom. If X2 < XfeI2 or
X2 > Xi,2 with N - 1 degrees of freedom and a = 0.05, reject t he
r?ull hypothesis and conclude that s2 i s not i n agreement with I?, the
variance of t h e specified d is t r ibu t ion function.
i s a value of a random variable having t h e chi-squaze
NO such exact t e s t exis ts i f t h e d is t r ibu t ion of a sequence is not
assumed t o be t h e normal. Nevertheless, an approximate tes t on t h e
sequence standmd deviation s i s frequently used and of fers a f a i r l y
good approximation if the sample s i z e i s large.
t h a t t h e sample varianae s2 i s an unbiased estimator of 2; but the
It i s common knowledge
sample standard deviation s i s not an unbiased estimator of (1.
However, f o r la rge samples the b i a s i s s m a l l , and it i s common pract ice
t o estimate B with 6.
A s a re su l t , l e t XI, x2, . . ., XN be a generated sequence of
numbers with some specified d is t r ibu t ion function. Define s2 as i n
( 3 . 3 . 3 ) .
conditions, t he d is t r ibu t ion of
closely with a normal havlng t h e mean
u/m, where
Then, f o r a la rge sequence s i z e and under f a i r l y general
s = @ can be approximated (10)
u and a standard deviation
a2 i s the variance of the specified d is t r ibu t ion function.

- 93 - Hence, t o t e s t t h e n u l l hypothesis Ho: 0 = 00 w a i n s t HA: 0 # 00 where uo = F, compute the sta-bistic
(5.3.5)
which is a value of a random variable having approximately t h e standard
normal. dis t r ibu t ion . The c r i t i c a l values of Z may be determined a$
before.
This t e s t has been performed on t he 100 sequences generated by
equation (2.1.&)*
fourid iii tables (5.531, ( 3 . 3 k ) , ana (5.3>).
are the follaring:
The re su l t s fo r t h e e n t i r e 200 sequences may be
Tne apparent conciusions
(a) For t h e 100 sequences generated by equations (2.2.1) and
(2.2.2), there were six and five re ject ions, respectively.
t h i s number i s s l igh t ly higher than expected, t he agreement t o the
theore t ica l variance of unity i s generalAy very good.
Although
(b) For t he 100 sequences generated by equation (2.1.41, no
reject ions w e r e noted,
was only an approximation. Nevertheless, the agreement t o the theore t ica l
variance of 0.083333 is excellent.
5.4 Numerical Resplts
This could be due t o t h e f a c t that t h e t e s t used
Results of the various s t a t i s t i c a l tests described i n th i s chapter
A s before, a l l calcu- appear systematically i n the tab les that follow.
l a t ions were made with the use 9f the IBM 7094 computerj some of the

- 94 -
I * '
I ..'
I -
- -
. -
I
r e s u l t s have been rounded for presentation.
appropriate random variables are indicated i n each t ab le .
r e j ec t ion i s indicated by an as te r i sk .
The c r i t i c a l values for the
A s before,
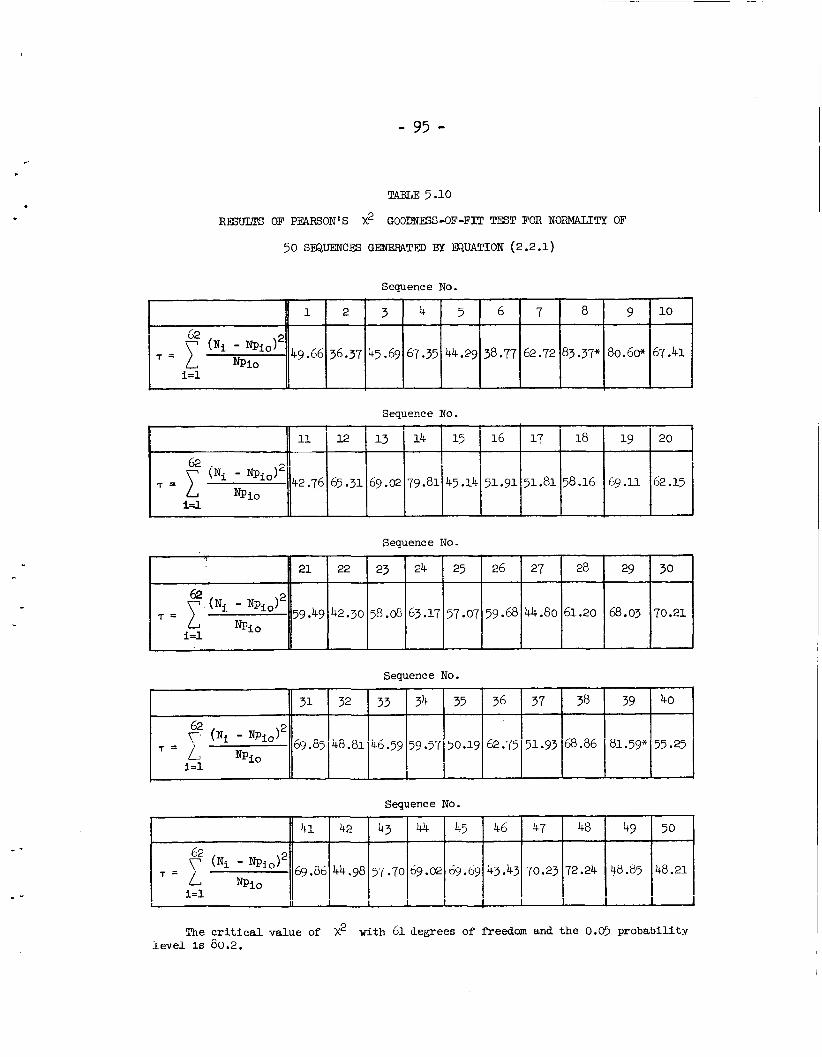
- 95 -
11
62 . 0
42.76 = 1 ( N i - N P i o I c
N P i O i=1
1 -
12 13 14 15 16 17 18 19 20
65.31 69.02 79.81 45.14 51.91 51.81 58.16 69.11 62.15
TABLE 5.10
RESULTS OF PEARSON'S X2 GOODNESS-OF-FIT TEST FOR NORMALITY OF
50 SEQUENCES GENERATED BY EQUATION (2.2.1)
31 32 33 34 35 36
69.85 48.81 46.59 59.57 50.19 62.75 62 2
( N i - N P l o )
= L N P i o i=l
1
37 38 39 40
51.93 68.66 81.59" 55.25
Sequence No.
41 42 43 44 45 46 47 48 49
2 69.86 44.98 57.70 69.02 69.69 43.43 70.23 72.24 48.85 = C ( N i - N P i o )
N P i O i=l
I
36.37 45.69 67.35 44.29 38.77 62.72 83.37* i
50
48.21
Sequence No.
80.60~ 67.41 r+i Sequence N o -
~
42.30 58.08 63.17 57.07 59.68 44.80 61.20
~
42.30 58.08 63.17 57.07 59.68 44.80 61.20
29
68.03
Sequence No.

!
I I 14 I 15 f- 16 17 18 19
~
65.905 64.316 69.098 53.223 49.470 53.087
- 96 -
20
66.270
* -
I -
11 12 13
TABLE 5.11
RESULTS OF PEARSON'S X2 GOODNESS-OF-FIT TEST FOR NORMALITY OF
50 SEQUEKCES GEXERATED BY FQUATION (2.2.2)
41
Sequence No.
42 43
Sequence No.
Sequence No.
24
87.591" 51.955 64.107
Sequence No.
Sequence No. jl 32.&[{ 50.418 '0.914 58.833 69.999 64.023 51.671
The c r i t i c a l va lue of 9 with 61 degrees of freedom and t h e 0.05 p r o b a b i l i t y l e v e l is 80.2.

- 97 -
1 2 3 4 5 6
'00 (Ni - 0.01N)2 i d
96.22 90.26 93.80 68.00 81.06 130.48% = 1 0.01N
c
7 8 9 10
1~5.98 94.90 75.72 101.04
' *
- 1
21 22 23 24 25 26 27 28
88.80 71.12 76.26 106.20 93.80 114.84 99.64 96.88 100
(Ni - 0.01N)2 ' a 0.01N
i=l
- -
29 30
77.14 82.70
TABLE 5.12
RESULTS OF PEARSON'S X2 GOODNESS-OF-FIT TEST FOR UNIFORMITY OF 100 SEBUENCES
GENEBATED BY THE UNIFORM NUMBER GENERATOR (2.1.4)
i
Sequence No.
?
31 32 33 34 35 36
2 ''0 (N; - 0.01N) i=l
83.50 92.52 109.68 104.44 81.60 81.46 ' = )- 0.01N
37 38 39
92.98 89.70 142.36-
sequence :To.
41 42 43 44 45 46 47 48 49
100
/ (Ni - 0.01N)2
0.01N 100.74 110.00 72.98 9.24 75.10 72.40 80.58 107.70 127.74" T =
I I-I
Sequence No.
50
97.78
Sequence No.
Sequence No.

- 98 -
51 52 53 54
= 70 (Ni - 0.01N)2 80.20 87.32 94.22 94.96
0.01N i d
I -
55 56 57 58 59 60
81.02 105.14 83.90 83.62 91.00 78.50
- -
71 72
loo (Ni - 0.01N) 2 72.80 95.84 = 0.01N
i 4
TABLE 5.12
RFSULTS OF PEARSON'S X2 GOODNESS-OF-FIT TEST FOR UNIFORMITY OF 100 SEQUENCES
GINERATED BY THE UNIFORM W E R GENERATOR (2.1.4) - Concluded
73 74 75 76 77 78 79 80
102.04 94.68 85.70 93.34 75.10 78.24 80.80. 113.42
Sequence No.
81 02 83 'r (Ni - O.0lNI2 i=1
85.66 89.50 98.32 81.82 0.01N
85 a6 87 88 89 90
81.42 104.52 89.58 96.82 ~1.98 92.88
Sequence No.
- 91 92 93 94 95 96 97 98
80.50 96.14 90.38 80.50 86.98 101.60 90.62 88.68 loo (Ni - 0.01N)2 i-1
= 0.01N
b
99 m o
103.82 72.68
Sequence KO.
Sequence No.

- 99 -
1 2 3 4 5
% = maxlFN(X) - Fo(X)I 0.0053 0.0035 0.0056 0.0068 0.0031
TABLE 5.20
RESULTS OF THE KOIMCGOROV-SMIFNOV GOODTOSS-OF-FIT TEST FOR NORMALITY OF
50 SEQUENCES GENERATED BY EQUATION (2.2.1)
6 7 8 9 10
0.0056 0.0069 0.0082 0.0083 0.0054
Sequence No.
LA 1 1 12 13 111 15
I)N = nax(FN(X) - FO(X) 0.0053 0.0091 0 .067 0.0076 0.0070 ! 16 17 18 19 20
0.0036 0.0108 0.0037 0.0102 0.0047
21 22 23 24 25
% = maxlFN(X) - FO(X)( 0.0103 0.&9 O.OG50 0.0057 0.0082
Sequence NO.
26 27 28 29 30
O.OG59 0.0056 0.0065 0.0057 0.0056
31 32 33 34 35
% = maxIFN(X) - FO(X)( 0.0054 0.0055 0.0060 0.0090 0.0080
Sequence No.
36 37 38 39 40
0.0049 0.0066 0.0067 0.0076 0.0070
41 42 43
% = mxlF~(X) - F0(x)I 0.0097 0.0056 0.0063
Sequence No.
44 45 46 47 48 49 50
0.0077 0.0101 0.0061 0.0061 0.0063 0.0086 0.0057
~~
The c r i t i c a l va lue of & for N = 10,000 and t h e 0.05 p r o b a b i l i t y lwel is 0.0136.

I
2
- 100 -
3 4 5 6 7 8 9 10
. .
0.0059 0.0039 0.0062 i i
TABLE 5 -21
RESULTS OF THE KOIMOGOROV-SMIRNOV GCQDNE’SS-OF-FIT TEST FOR NORMALITY OF
50 SEQUENCES GENERATED BY EQUATION (2 .2.2)
0.0104 0.0092 0 . 0 ~ 3 3 0 . 0 ~ 9 3 0.0064 0 .0~98 I I 1
II
1 11 12 &, ’-4 I 14
Sequence No.
15 16 2.7 I 18 I 19 I 20
I DN = maxlFN(X) - Fo(x)l i/o.oo3g/ 0.m36~0.00391 0.008zj o.oo60 1 II I
Sequence no.
0.0067’0.0084 0.0a52 o.olo8 0.0056 i i i i I I I
21 22 23
% = max F ~ ( x ) - F ~ ( x ) 0.0079 0.0053 0 .0~99 I 24 25 26 27 28 29 30
0.0066 0.0052 0.0065 O.odk4.g 0.0066 0.0051 0.0071
Sequence No.
41 42 43 44 45 46 47 48 49
% = mx(FN(X) - Fo(X)I 0.0050 0.0043 0.0081 0.0059 0.0079 0.0042 0.0&9 0 . w 2 0-0088
Sequence No.
50
0.0~1
The c r i t i c a l value of % f o r N = 10,000 and t h e 0.m p r o b a b i l i t y l e v e l is 0.9136.

- 101 -
I 1 1 2 3 4 5
= m a x l F N ( X ) - FO(X)( 0.0077 0.0040 0.0069 0.0055 0.0052
TABLE 5.22
RFSULTS OF THE KOIMCGOROV-SMIRNOV GOODNBS-@-FIT TEST FOR UNIFORMITY OF 100 SEQvnUCES
GENERATED BY !U-IE UNIFORM NUMBER GEXEEUlTOR (2.1.4)
6 7 8 9 10
0.0195" 0.0072 O.O@O 0.0087 0.0124
Sequence No.
21 22 23
= m a l F N ( x ) - F o ( X ) 0.0067 0.0074 0.0062 I 30 24 25 26 27 28 29
0.0095 0.0069 0.0059 0.0079 0.0104 0.0@5 O.O@9
Sequence KO.
% = m x l F N ( X ) - Fo(X)I
31 32 33 34 35 36 37 38 39 40
0.0058 0.0059 0.0147* 0.0114 0.0060 0.0051 0.0071 0.0054 0.0192" 0.0067
Sequence No.
42 43
0.0108 0.0043
_ _ ~~
44 45 46 47 48 49 50
0.0046 0.0076 0.0050 0.0079 0.0107 0.0197* 0.0066
~ .
II 41
The critical value of 9(
Sequence No .
for N = 10,000 and t h e 0.05 probability l e v e l i s 0.0136.

1 - . I f
% = =xIFN(X) - Fo(X) I
- 102 -
51 52 53 54 55 56 57 58 59 60
0.0042 0.0066 0.0057 0.0060 0.OOgl 0.0105 0.0062 0.0081 0.0083 0.0057
I -
% = - (FN(X) - FO(X)(
TABLE 5.22
RESULTS OF THE KOIHOGOROV-SMIRNOV GOODNESS-OF-FIT TEST FOR UNIFORMITY OF 100 SEQU3XFS
GENERATED BY THE UNIFORM NUMBER GBEFWLQR (2.1.4) - Concluded
61 62 63 64 65 66 67 68 69 70
0.0064 0.0062 0.0037 0.0107 0.0103 0.a1 0.0089 0.0060 0.0079 O.OOg6
Sequence N o .
71 __
= m x l F N ( X ) - Fo(X)I 0.0056
72 73 74 75 76 77 78 79 80
O.Ol& 0.0071 0.0102 0.0032 0.0068 0.0048 0.0069 0.0079 0.0073
Sequence No.
81 82 83 84
DhT = m a x ] F , r ( X ) - FO(X)I 0.0066 0.0066 0.0068 0.0079
85 86 87 88 89 90
0.0064 0.0076 0.0105 0.0067 0.0095 O.OOg6 I
Sequence N o .
91 92 93 94
% = - IFN(X) - FO(X)( 0.0061 0.0114 0.@07,5 0.00hg
95 96 97 98 93 mo
0.0058 0.010’3 0.0075 0.0086 O.OOg9 0.0072
Sequence No.
Sequence No.
The c r i t i c a l value of & for N = 10,000 and t h e 0.05 probabi l i ty l e v e l is 0.0136.

-103 -
1
Ohserved mean - x 0 . ~ ~ 6
- Z = 0.596
a 1 6
I. i
2 3 4 5 b 7 8 9 10
0.00037 - 0 . 0 ~ 1 6 o.mGa1 -0.00187 0.01150 -0.00456 0.00986 -0.On3.7 -0.00442
0.037 -0.916 0.681 -0.188 1.150 -0.456 0.986 -1.137 -0.442
TABLE 5.30
RESULTS OF A TEST ON THE MFANS OF 50 SEQUENCES GENERATED BY EQUATION (2.2.1)
I 11
Observed mean j ; 0.00352
- Z = 0.351 dfi
Theoretical mean = 0 . ~ 0 0 0
12 ' Ij I-? 1; I" 17 I" i9 20 .o .,- 7 I,
0.00567 -0-O02>Y -0.00886 -0.C03cll; -0.00126 0.01531 0.00130 -O.O&% -0.00623
0.565 -0.259 -0.886 -0.306 -0.126 1.531 0.130 -0.887 -0.623
obswvea mean
z = a//N
21 22 23 24 25 26 27 28 29 30
0.01529 -0.00095 -0.00133 0.00630 0.00220 0.00203 0.00697 0.00677 0.00162 0.00932
1.528 -0.096 -0.133 0.630 0.220 0.203 0.697 0.677 0.162 0.932
31 32 33 34 35
ObServfi 0.00791 0.00848 -0.OC829 -0.00598 -0.01329 mean x
- z = x - l l 0.791 0.a~ -0.829 -0.597 -1.329
016
36 37 38 39 40
-0.00177 -0.00238 0.00011 -0.00166 -0.00309
-0.177 -0.238 0.011 -0.166 -0.3Og

!
1 2 3 4 5 6 7 8
Observed mean y 0.00021 -0.W03 0.00009 -0.00913 0.01333 -0.00105 -0.OOO51 0.01258
- Z = 0.021 -0.803 0.009 -0.913 1.333 -0.105 -0.Ql 1.258
0 1 6
- 104 -
9 10
0.00041 0.00719
0.041 0.719
i - I -
31 32
Observed mean x -0.01114 -0.01479
- Z = 52.k -1.11Lt -1.'179
U / d Z
l - 1 .
33 34
0.00290 0.00476
0.290 0.476
TABLE 5.31
RESULTS OF A TEST ON THE MEANS OF 50 SEQUENCES GENERATED BY EQUATION (2.2.2)
Theoretical mean p = O.oo030
Observed
24 seiue;;e j, 26 ~ 27
-0.00597 -0.00498 0.00839 -0.00532
-0.606 -0.498 0.839 -0.532
=FF -0.00575 -0.00033 0.m78l
-0.575 -0.033 0.781 I 1 I I I I I I
Sequence No.
35 36 37
o.Odi98 -0.00145 -0.00851
Sequence Po.
38 39 40

- 105 -
1 2 3
.Observed mean 3i 0.4ggGl 0.50076 0.49780
z = 3 -0.066 0.263 -0.712 - U / d
'.
c
4 5 6 7 8
0.50183 0.49904 0.W399 0.50346 0.49878
0.632 -0.331 3.1383 1.202 -0,424
TABLE 5.32
RSULTS OF A TET ON THE MFANS OF 100 S ~ U E N C E S GENERATED BY
THE UKIFORM NUMBER GENEFIATOR (2.1.4)
L
ll 7 - IC. 13 1'1 15 16 17 18 19 20 I
O b S e N e d mean 0.50238 0.50086 0.50295 0.50033 0.5&17 0.50145 0.4'3802' 0.49979 0.49493 0.50089
2 = 0.825 0.298 1.022 0.113 1.452 0.500 -0.683 -0.072 -1..756 0.go-c a / f i
c
Theoretical mean p = O.5OooO
Sequence No.
41 42 43 44 45 46 47 48
Observed mean x - 0.50567 0.5&4ri 0.40968 0.50048 0.50281 0.50026 0.50296 0.3859
Z = 1.98oX 1.564 -0.111 O . l @ 0.976 0.092 1.025 1.952 dfi
49 50
0.50908 0.50227
3.173* 0.785
9
0.50226
0.782
0.50601
2 .loo*
Sequence No.
I II 21 I 22 I 23 1 24 I 25 I 20
II I I 1 I I II I I I
1.z = 0.879 10.675 I 0.780 I 1.822 1-0.766 I 0.293 I -~
Sequence No .
* 0.50450 0.49732 0.50182 0.49893
1.569 1-0.920 1 0.628 1-0.368

- 106 -
51 52 53 54 55 56 57
Observed mean y 0.49879 0.50199 0.50167 0.49995 0.49658 0.50550 0.50152
z = x-ll -0.419 0.689 0.578 -0.017 -1.173 1.916 0.529 a/@
TABLE 5.32
RESULTS OF A T a T ON THE MEANS OF 100 SEWEXCES GENERATED BY
M E UNIFORM NUMBm GBW?ATOR (2.1.4) - Concluded
58 59 60
0.49749 0.49600 0.49867
-0.861 -1.387 4.459
Theore t ica l mean p = O.5OOOO
Observed mean 0.50094 0.50190 0.50030 0.50442 0.50482 0.50046 0.50483 0.49791 0.50173
I1 I I - 0.325 0.658 0.18 1.539 I 1.677 0.159 1.677 -0.725 0.596
Observed
Sequence No. * 0.49865 0.50060 0.50280 0.50286
-0.466 10,207 I 0.972 I 0.991 Sequence No.
81 82 83 84 85 86 87 88 89
Observed A crrnl i i A c ~ n l i C - U./VC," "./"L-r" "./VLT, ".-,"," ".,YLLjl n ".,",A, qnz17 n ".," 6 4 n z ", n " .,-. ~lmb.3 .. n ".,",-- snsR7 n ~nn1,z n IhnRzi n sn'36o mean x
1.785
0.50267 7 0.923
C r i t i c a l values of Z
Sequence No.
i 0.724 -1.86 0.838 1.541 1.107 -0.863 -1.691 0.640
for t h e 0.05 probabi l i ty level are 2.96.

I
Observed variance s2 l.o16& l . W O 0 0.93713 0.98226 1.C0070 1.G1665 O.974lO 0.98913
x2 - (N - l ) s2 10,188.38 10,019.00 55'70.34* 9821.64 10,006.00 10,165.48 9740.03 9890.31 ! P
- 107 -
0.974% 1.~625
9748.53 10,001.50
I -
0.99015
9900.51
.
0.99662 0.97182 0.98536 0.98801 1.00273 0.97883
9965.20 9717.23~ 9852.61 9879.11 10,026.30 9787.32
"
31 32 33 34 35
Observed variance ,2 0.98439 0.99557 0.97924 1.00680 0.97745
- 9842.92 9954.70 9791.42 10,067.09 9773.52 x - P
TABLE 5.33
RFSJLTS OF A TFST ON THE VARIANCES OF SO SEQUETiCES GFSIEFUTED BY ERUATION (2.2.1)
36 37 38 39 40
0.99138 1.01921 1.01680 1.01005 0.99281
9912.81 10,191.08 10,166.98 10,099.49 9927.11
Theoretical variance 02 = 1.00ooo
41 42 43 44 45 46 47 48 49 50
Observed variance ,2 0 . 9 ( & ! + 0.9950 0.98150 0.96468 0.98400 0.99270 1.01361 1.02164 0.99776 1 . d t 1 2
X2 = 9b35.4k1 9944.01 9814.02 9645.84* 9839.02 9926.01 10,135.Og 10,215.38 9976.60 10,&0.20 a2
-~ ~~
Sequence No.
-
Sequence No.
Sequence No.
Cr i t i ca l values fo r x2 w i t h 9999 degrees of freedom and t h e 0.e probabili ty level a r e : X2g.rs = 9'723.15; x!025 = 10,277.48.

- 108 -
Observed variance s2
2 - x - 02
I -
1 2 3 4 5 6 7 8 9 10
0.99181 0.99725 i.m&5 0.99772 1.00870 0.95544 0.9748 1.00697 0.99018 0.94887
9917.10 9971.51 10,063.50 9976.20 10,086.00 9553.4oL- 9773.81 10,068.70 900.81 9487.71*
TABLE 5.34
RBULTS OF A TEST ON THE VARIANCES OF 50 SEQUENCES GENEBATED BY EQUATION (2.2.2)
Observed .---> v L u I c L I , ~ . 5 ^ _ ^ ^ ,2
x2 = Os2 2
meoretical variance 2 = 1.00000
I I I 11 12 1 13 I 14 15 i t i 1 1'( 16 iy i PO
o.99380 0.99064i 0.977031 1.00265 0.97562 0.98843 1 0.99545 0.99629 1.01247/0.98584
9937 .OO 9905 .40I 9769.31 10,025.50 9755.20 9883.30 9953.51 9961.90 10,123.70 9857.41 I
Sequence No.
Observed variance ,2
X2 = 02
21 22 23 24 25 26 27 28 29 30
0-99dr8 0.98388 1.01708 0.976'5 1.02144 0.97319 1.01920 0.g8408 1.00199 0.99279
9903.80 9837.80 10,169.81 9708.50:, 10,213.40 9730.90 10,191.00 9839.80 10,018.90 9926.90
Sequence No.
31 32
Observed u;lr,nnce .2 1.00819 1.00165
X2 = Os2 10,@0.90 10,015.50 P
33 34 35 36 37 38 39 40
l.olog7 1.02662 1.00845 0.99C98 0.98147 0.97163 0.97338 0.98282
10,108.70 10,265.20 10,083.51 9908.80 9813.70 9715.3oX 9732.81 9827.21
__
Sequence No.

I
1 2 3 4 5 6 7 8 9
variance Observed s 2 0.08374 0.08304 0.08235 0.08336 0.08359 0.08201 0.08286 0.08312 0.0839
z = B - ( I 0.350 -0.253 -0.839 12.076 0.221 -1.125 -0.404 -0.180 0.516 a/ fi
- log -
10
0.08198
-1.150
"
Observed 2
s - a a / f i
variance s
z = -
.
11 12 13 14 15 16 1: l a 19 20
0.08308 0.08397 0.08338 0.08343 0.08266 0.08381 0.08401 0.08410 0.08291 0.08307
-0.212 0.>42 0.037 0.080 -0372 0.402 0.5(6 o.&> -0.356 -0.227 .
.
Observed variance ,2
z = M a/d%
.
31 32 33 34 35 36 37 38 39 40
O.@+@ 0.08308 0.&& 0.C8215 G . i % Z 0.&529 0.08288 0.08>3 0.08234 O . & J e
1.136 -0.217 -1.269 -1.007 0.607 -0.039 -0.384 -0.205 -0.848 -0.203
TABLE 5.35
RESULTS OF A TEST ON THE STANMRD DEIIIATIGN OF 100 SFQUENCES GENEBATED BY
THE UNIFORM " B E 8 GENERATOR (2.1.4)
Theoretical variance P = 0.08333
Sequence No.
0.08318
-0.133
0.08207 0.03198 0.08348
-1.073 -1.l5b 0.126
Sequence No.
Observed variance E
21 22 23 24 25 26
Sequence No.
Sequence No
t II I I I I I
47 I 48 I 49 I 50
Critical values of 2 for the 0.05 probability level a r e 5.96.

- 110 -
81 82 83 84 85
variance Observed s2 0.08283 0.08233 0.08346 0.08423 0.083a
z = - -0.430 -0.854 0.104 0.760 0.426 s - a LT/ 2N
, *
86 87 88 89 90
0.08288 0.08226 o.@& 0.08317 0.~6297
-0.384 -0.892 -0.433 -0.138 -0.310
TABLE 5.35
REWLTS OF A TEST ON THE STAmRD DEVIATION OF 100 SD4UENCXS GENEFATED BY
THE UNIFORM NUMBER GENERATOR (2.1.4) - Concluded
i
91 92 93 9 95 96 97 ss 99 100
Observed variance ,2 0.d358 0.08277 0.08254 0.08300 0.08268 0.08339 0.08285 0.08385 0.08302 0.08317
0.207 4.483 -0.673 -0.282 -0.558 1 0.&8 1-0.408 ' 0.439 -0.269 -0.139 a/ 2 N z=- I
Theoretical variance & = 0.08333
211 0.08307l 0.08268 I 0.08306 I 0.08258 I 0.08492 I 0.08227 I 0.08281 I 0.0849 Observed variance 6
I1 I I I I I I I I
Sequence No.
' 6 4 65
variance
2,s-a
.
.'
Sequence No.
Observed
6 - a z = -
66 1 67 66 69 ] 70 1 0.08437 I 0.08232 1
w 0.08366 0.08322 0.08305
---t-t-
I I

- 111 -
VI. SUMMARY
0 -
This study inves t iga ted a generator producing numbers assumed t o be
random and uniformly d i s t r ibu ted on t h e i n t e r n a l (O,l), and two equations
each producing numbers assumed t o be random and normally d i s t r i b u t e d w i t h
zero mean and u n i t variance.
A t o t a l of 200 sequences each with 10,000 observations were
generated f o r t h i s study. O f these, io0 were generated by t h e uniform
n r - r n h &&--er generator (2.1.4); 50 by elijgt.tolil ( 2 z 2 s l . ) j nnil t h e r e ~ i ~ i p g 50 by
eqiiation ( 2 . 2 . 2 ) .
purpose.
A computer program was wr i t t en by t h e author f o r t h i s
Based on the r e s u l t s of t he various s t a t i s t i c a l t e s t s performed on
8-11 seqliences I t h e following conclusiens m y be drawn :
(1) It i s apparent that t h e uniform random number generator (2.1.4)
i s generating numbers t h a t seem t o be random and uniformly d i s t r i b u t e d on
t h e u n i t i n t e r v a l . Hence, t he re i s an ind ica t ion tha t t h i s generator
should be a usefu l addi t ion t o t h e state-of -the-art . (2)
nimbers that a p p m t o be rsr?do~ a d , n , c m l l y d i s t r ibu ted with zero mean
and u n i t var ianc e.
It is reasonable t o be l ieve that equation (2.2.1) generates
(3) Although equation (2.2.2) generates numbers that appear t o be
normally d i s t r ibu ted with zero mean and u n i t variance, the existence of
nonrandomness among t h e numbers it generates i s apparent based on t h e
r e s u l t s of t h e tes t for Tern c n r r P l a t i n n end +he t e s t fer rix~ =b~?~,re =E(?
below t h e mean of the specified d i s t r i b u t i o n function. Hence, t h i s study

- 112 - tends t o conclude t h a t equation (2.2.1) i s t h e b e t t e r normal random
number generator.

- 113 -
.
,
The author would l i k e t o express h i s deep apprec ia t ion and
tndebtedness t o his thesis advisor, I&. Richard G. Krutchkoff, f o r h i s
pakience and prudent guidance throughout t h i s study.
Appreciation is a l s o expressed t o M r . Whitney Johnson f o r serving
as coreader and fo r h i s constructive c r i t i c i sm.
The author a l s o wishes t o express h i s deep apprec ia t ion t o
D r . Boyd Harshbarger and the Department of S t a t i s t i c s f o r making poss ib le
a teaching a s s i s t a n t s h i p during prt. of my residmcy.
also expressed t o a l l members of the Department of S t a t i s t i c s fo r their
he lp and guidance.
P.pprecis,ticn i~
Deep apprec ia t ion i s expressed t o the National Aeronautics and
Space Administration and espec ia l ly t o t h e Analysis and Computation
Division, Langley Research Center, f o r f i n a n c i a l support during
two-thirds of my residency and f o r making t h i s study possible.
Kind regards and thanks a r e extended t o M r . Richard D. Hofler f o r
h i s valuable a s s i s t ance i n the computer program.
.-.

- 114 - BIBLIOGRAPHY
1
*
1. Tausworthe, R. C . : Random Numbers Generated by Linear Recurrence
Modulo Two, Mathematics of Computation, Vol. 19, 1963, pp. 201-209.
2. Golomb, S. W.: Sequences with Randomness Properties, Martin Co.,
Baltimore, Md., 1955.
3 . Zierler , Neal: Linear Recurring Sequences, J. SOC. Indust. Appl.
Math., Vol. 7, 1959, pp. 31-48.
4. Baumert, L.? e t a l . : Coding Theory and i t s App1icctt. i nns t.0
Communications Systems, Report 32-167, J e t Propulsion Laboratory,
Pasadena, Calif., 1961.
5 . Watson, E. J . : Primitive Polynomials (Mod 2 ) , Mathematics of
Computation, VOI. 16, 1962, pp. 368-369.
6. Sox, G . E. P. ; and Mldler, M. G. : A Note on t h e Generation of
Random Normal Deviates, The Annals of Mathematical S t a t i s t i c s ,
V O ~ . 29, 1938, pp. 610-611.
7. Mood, A . M.; and Graybill, F. A . : Introduction t o the Theory of
S t a t i s t i c s , McGraw-Hill Book Company, Inc . , New York, 1963,
pp. 4G+G2.
8 . Gorenstein, S. : Random Number Generation f o r t he General Purpose
Systems Simulator, Technical Report 17-161, IB4, Advanced Systems
Development Division, Yorktown Heights, N. Y., 1966.
9. Vald, A . ; and Wolfaritz, J . : An €&act Test f o r Randomness i n the
Guri-Fttrametric Case Based on 8erlaJ. Correlation, Annals of
Mathematical St.wt.i st.f r s ; Vel 14 pp 378-388

- 115 -
s
w-
10. Miller, I.; and Freund, J. E.: Probabili ty and S t a t i s t i c s f o r
Ehgineers, Prentice-Hall, Inc., Englewood C l i f f s , New Jersey,
1965, pp. 219-221.
11. Massey, F. J . Jr.: The Kolmogorov-Smirnov Test f o r Goodness of F i t ,
Journal of t he American S t a t i s t i c a l Association, Vol. 46, 1971,
pp. 68-78.
12. Hoel, P. G. : Introduction t o Mathematical S t a t i s t i c s , 3rd ed.,
John Wiley and Sons, Inc., New York, 1965, pp. 333-341.
~ is t r ibu t iece , ~ e s r m l e dzU. ' Is t i tuto ~ ta i ia r lo degi i ~ t t u m i , 4,
1933, pp. 1-11.
14. Smirnov, H. : Sur les Ecarts de l a Courbe de Distribution mpirique,
Recueil Mathematique, N.S. 6, 1939, pp. 3-26.
15. Massey, F. J., Jr. : A Note on t h e Power of a Non-Parametric T e s t ,
Annals of Mathematical S t a t i s t i c s , Vol. 21, 1950, pp. 440-443.
16. Pesrson, K. : On a C;rft.erion t h a t a Given Systez of Deviations from
t h e Probable i n the Case of a Correlated System of Variables is
Such tha t it Can be Reasonably Supposed t o Have Arisen i n Random
S a P l i W , Phi l* M r t g . 9 ( 5 ) , 50, 157-
17. Kendall, M. G . j and Stuart , A , : The Advanced Theory of S t a t i s t i c s ,
Vol. 11, Hafner Publishing Co., New York, 1961, pp. 420-441.
18. Mann, H. B.; and Wald, A. : On t h e Choice of t he Number of Intervals
i n the Application of the Chi-squase Test, Annals of Mathematical
S t a t i s t i c s , 13, 1942, pp. 306-317.
\

- 116 -
19. W i l l i a m s , C . A , , Jr . : On the Choice of t he Number and Width of
Classes f o r t h e Chi-square Test f o r Goodness of F i t , Journal of t h e
American S t a t i s t i c a l Association, 45, 1950, pp. 77-86.
20. Stockmal, Frank : Calculations with Pseudo-Random Numbers, Journal
of t h e Association f o r Computing Machinery, 11, 1964, pp. 41-72.
t
4

- 117 - VITA
The author w a s born i n Karpenissi, Greece on April 23, 1939. He
received his Bachelor of Science degree i n Mathematics i n June, 1963,
from Virginia Polytechnic Ins t i tu te .
After his graduation, he accepted a position as an Aerospace
Technologist with the National Aeronautics and Space Administration,
E y Research Center, where he has been employed up t o the present.
12 SeFtezber, ~364, he e a r o ~ e d at. ~ t r g i n i a ro~ytechnic ~ n s t i t l ~ e BE B
g:radust.e ~ t l ~ d e ~ t nnd s ince h ~ s been wcrking t m w d the %aster of Science
degree i n S ta t i s t i c s .