Advanced tokamak profile evolution in DIII-D
29
Advanced Tokamak Profile Evolution in DIII–D November 11–15, 2002 Presented at 44th Annual Meeting of the Division of Plasma Physics Orlando, Florida for M.R. Wade, (a) J.C. DeBoo, (b) C.M. Greenfield, (b) T.C. Luce, (b) M.A. Makowski, (c) C.C. Petty, (b) G.M. Staebler, (b) T.S. Taylor, (b) M.E. Austin, (d) D.R. Baker, (b) R.V. Budny, (c) K.H. Burrell, (b) T.A. Casper, (c) M. Choi, (b) J.R. Ferron, (b) A.M. Garofalo, (f) I.A. Gorelov, (b) R.J. Groebner, (b) R. La Haye, (b) A.W. Hyatt, (b) R.J. Jayakumar, (c) K. Kajiwara, (b) J.E. Kinsey, (g) L.L Lao, (b) J. Lohr, (b) D. McCune, (e) R.I. Pinsker, (b) P.A. Politzer, (b) R. Prater, (b) H.E. St. John, (b) and W.P. West, (b) and the DIII-D Team by M. Murakami, (a) (a) Oak Ridge National Laboratory Oak Ridge, Tennessee, 37831 USA email: [email protected] (b) General Atomics, P.O. Box 85608, San Diego, California, 92186-5608 USA (c) Lawrence Livermore National Laboratory, Livemore, California 94551 USA (d) University of Texas, Austin, Texas (e) Princeton Plasma Physics Laboratory, Princeton, New Jersey 08543 USA (f) Columbia University, New York, New York USA (g) Lehigh University, Bethlehem, Pennsylvania 18015 USA R E S E A R C H C E N T E R QTYUIOP Columbia University NATIONAL FUSION FACILITY SAN DIEGO DIII—D
Transcript of Advanced tokamak profile evolution in DIII-D

Advanced TokamakProfile Evolution in DIII–D
November 11–15, 2002
Presented at44th Annual Meeting of
the Division of Plasma PhysicsOrlando, Florida
forM.R. Wade,(a) J.C. DeBoo,(b) C.M. Greenfield,(b) T.C. Luce,(b)
M.A. Makowski,(c) C.C. Petty,(b) G.M. Staebler,(b) T.S. Taylor,(b)
M.E. Austin,(d) D.R. Baker,(b) R.V. Budny,(c) K.H. Burrell,(b)
T.A. Casper,(c) M. Choi,(b) J.R. Ferron,(b) A.M. Garofalo,(f)
I.A. Gorelov,(b) R.J. Groebner,(b) R. La Haye,(b) A.W. Hyatt,(b)
R.J. Jayakumar,(c) K. Kajiwara,(b) J.E. Kinsey,(g) L.L Lao,(b)
J. Lohr,(b) D. McCune,(e) R.I. Pinsker,(b) P.A. Politzer,(b) R. Prater,(b)
H.E. St. John,(b) and W.P. West,(b) and the DIII-D Team
by
M. Murakami,(a)
(a) Oak Ridge National Laboratory Oak Ridge, Tennessee, 37831 USAemail: [email protected]
(b) General Atomics, P.O. Box 85608, San Diego, California, 92186-5608 USA(c) Lawrence Livermore National Laboratory, Livemore, California 94551 USA
(d) University of Texas, Austin, Texas(e) Princeton Plasma Physics Laboratory, Princeton, New Jersey 08543 USA
(f) Columbia University, New York, New York USA(g) Lehigh University, Bethlehem, Pennsylvania 18015 USA
R E S E A R C H C E N T E RQTYUIOPColumbiaUniversityNATIONAL FUSION FACILITY
S A N D I E G O
DIII—D

299-02/MM/JY
ATTRACTIVENESS OF ANY FUSION POWER SYSTEMS RELIES ON PROVIDINGHIGH POWER DENSITY AND HIGH DUTY FACTOR (OR STEADY STATE)
� Goal of DIII–D Advanced Tokamak (AT) Program: Develop physics basis andplasma control methods needed for steady state, high performance operation
� Steady-state operation requires:— Plasma current driven noninductively— High bootstrap current fraction (fBS)
� Self-consistent solution to achieve simultaneously high performance and high fBSrequires:
— Moderately high q— High βN
� Both experimental experience and simulations suggest that:— A relatively small (~10%) amount of current driven at ρ ~ 0.5
— Combined with bootstrap current and NBCD
⇒ steady state current profile compatible with a high β equilibrium

299-02/MM/JY
RECENT DIII-D EXPERIMENTS HAVE DEMONSTRATED OFF-AXISECCD AS AN EFFECTIVE TOOL TO CONTROL THE CURRENT
PROFILE IN ADVANCED TOKAMAK OPERATION
� The experiment using off-axis ECCD has demonstrated integrated AT operation,combining:
— High β (> 3%) at high q (q95 ~ 5)
— Good energy confinement (H89 ~ 2.4)
— High noninductive current fraction ( fBS ~ 55%, fNI ~ 90% )
� Clear evidence of the effectiveness of off-axis ECCD demonstrated in high β plasma with qmin > 2
— Internal transport barrier formed even in the presence of type I ELMs
— Improvements observed in all transport channels
— Increased peaking of profiles lead to higher bootstrap current in core
� In a separate experiment, current profile at high β has been sustained with qmin >1.5— Nearly steady-state current and pressure profiles maintained for 1 s— Good access to the regime demonstrated where higher fBS possible with higher βN
1
2
3
4
5
6
Normalized Radius
q
0.0 0.2 0.4 0.6 0.8 1.0
JECCD
q = 2q = 1.5

299-02/MM/JY
MODELING AND SIMULATION HAVE BECOME ESSENTIALTOOLS FOR THIS EXPERIMENTAL PROGRAM
q (t) 0
minq (t)
2 s
P11
1099085
4
3
2
10 1 2 3 4 5
Saf
ety
Fac
tor
(a) 109908
J (ρ) tot
Normalized Radius, ρ
120
80
40
00.0 0.2 0.4 0.6 0.8 1.0
Cur
rent
Den
sity
(A
/cm
2 ) (b)
Time (s)
ECCD NBI-onlyq0 qmin
t (s) ECCD NBI-only1.53.5
Predictive Modeling Predictive Modeling
3 MW ECCD
� Predictive modeling prior to the experiment based on an existing DIII–D discharge:— Used to develop detailed experimental plans— Successfully predicted main features of the experiment with delightful surprises
� Simulations allow detailed comparison with theory and experiment� Predictive modeling indicates that full noninductive sustainment is possible in near
future
299-02/MM/JY
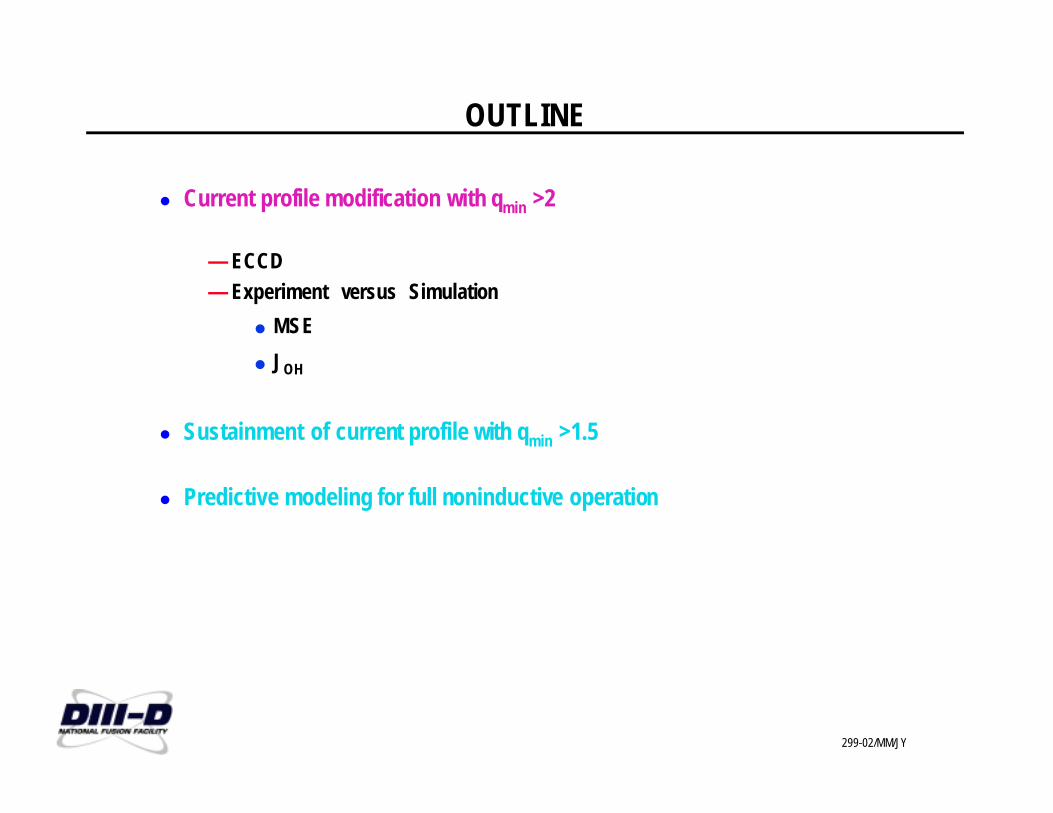
OUTLINE
� Current profile modification with qmin >2
— ECCD— Experiment versus Simulation
� MSE
� JOH
� Sustainment of current profile with qmin >1.5
� Predictive modeling for full noninductive operation

299-02/MM/JY
APPLICATION OF ECCD IN HIGH β WITH qmin > 2 DISCHARGE RESULTSIN FAVORABLE CHANGES TO CURRENT PROFILE AND TRANSPORT
� Early H-mode used to access high qmin
� βN ≈ 2.8, H89 ≈ 2.4 maintained by NBIfeedback
� Robust operation at βN > βN no-wall (≈2.5)made possible by RWM stabilization
� ECCD causes increase in centralmagnetic shear
� Both Te and Ti increases withapplication of ECCD
S. Allen: LO1.001C. Greenfield: LO1.002A. Garofalo: LO1.004J. Ferron: LO1.004

299-02/MM/JY
CURRENT PROFILE MODIFICATION IS DUE TO CURRENT DRIVE RATHER THAN TO HEATING
� ECH: Radial launch; Heating only ECCD: Tangential launch; Heating and CD
� βN ≈ 2.8 maintained in both cases
� ECCD increases q0 and reduces qminrelative to reference case
� Local transport improves with increasesin central Te and Ti observed with ECCD
299-02/MM/JY
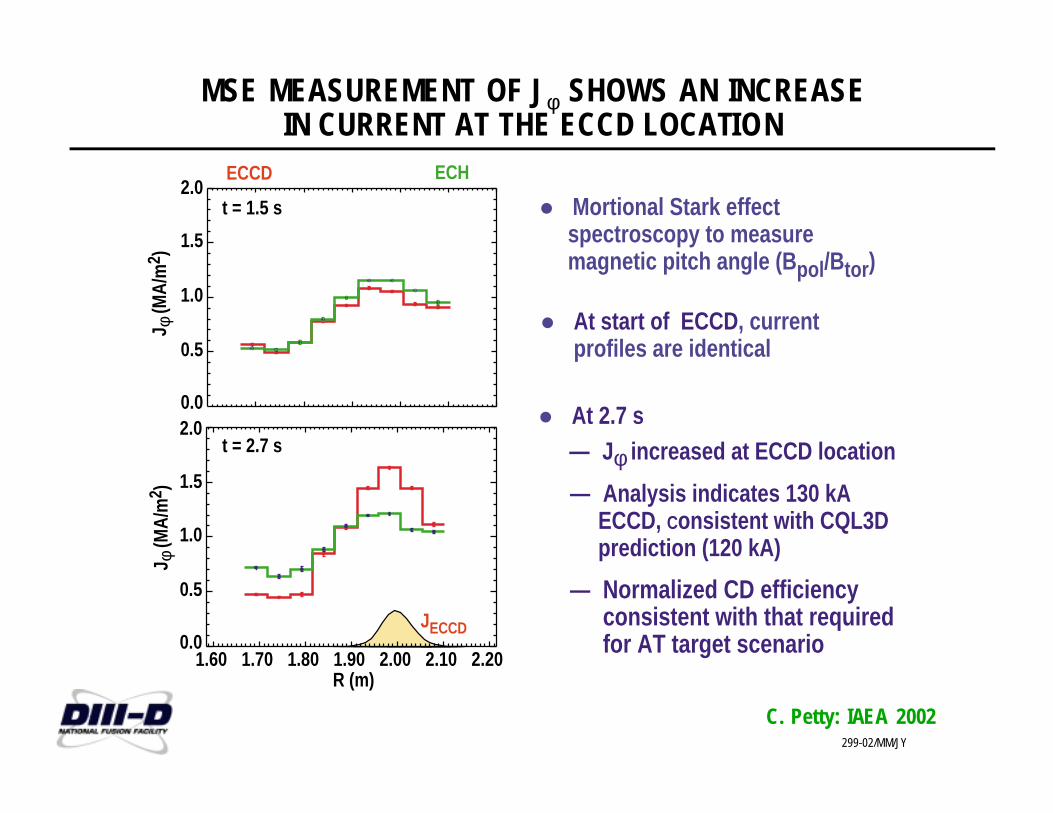
C. Petty: IAEA 2002
MSE MEASUREMENT OF Jφ SHOWS AN INCREASEIN CURRENT AT THE ECCD LOCATION
� At start of ECCD, current profiles are identical
� At 2.7 s— Jφ increased at ECCD location
— Analysis indicates 130 kA ECCD, Consistent with CQL3D prediction (120 kA)
— Normalized CD efficiency consistent with that required for AT target scenario
t = 1.5 s
t = 2.7 s
R (m)
J φ (M
A/m
2 )J φ
(MA/
m2 )
ECCD ECH
0.0
0.5
1.0
1.5
2.0
1.60 1.70 1.80 1.90 2.00 2.10 2.200.0
0.5
1.0
1.5
2.0
JECCD
� Mortional Stark effect spectroscopy to measure magnetic pitch angle (Bpol/Btor)

299-02/MM/JY
MODELING AND SIMULATION ARE ESSENTIALFOR THE EXPERIMENTAL PROGRAM
� TRANSP and ONETWO codes:Simulation: Solve J [Bp(ρ,t) diffusion
equation] with experimental kineticprofile inputs
Predictive modeling: Solve J, Te and Tiequations with experiment-based χeand χI
� TRANSP run using the Fusion Gridcreated by the National FusionCollaboratory Project
� ECCD/ECH— Used 1.2×JECCD(TORAY-GA)
� NBCD— Monte-Carlo slowing down with a modest spatial diffusion of beam ions
� Bootstrap current— Used Hirshman 78 model (Large R/a approx.)— Underestimate by ~10% compared with NCLASS and Sauter models

299-02/MM/JY
SIMULATIONS SHOW THAT ECCD PREVENTSINWARD CURRENT PENETRATION
� With ECH (no CD), the current peak continued to move in

299-02/MM/JY
SIMULATIONS SHOW THAT ECCD PREVENTSINWARD CURRENT PENETRATION
� With ECH (no CD), the current peak continued to move in� ECCD clearly produced an off-axis peaked Jφ
� Slight shift of the current peak position from the ECCD peak due tobootstrap current at ρ < 0.35
299-02/MM/JY
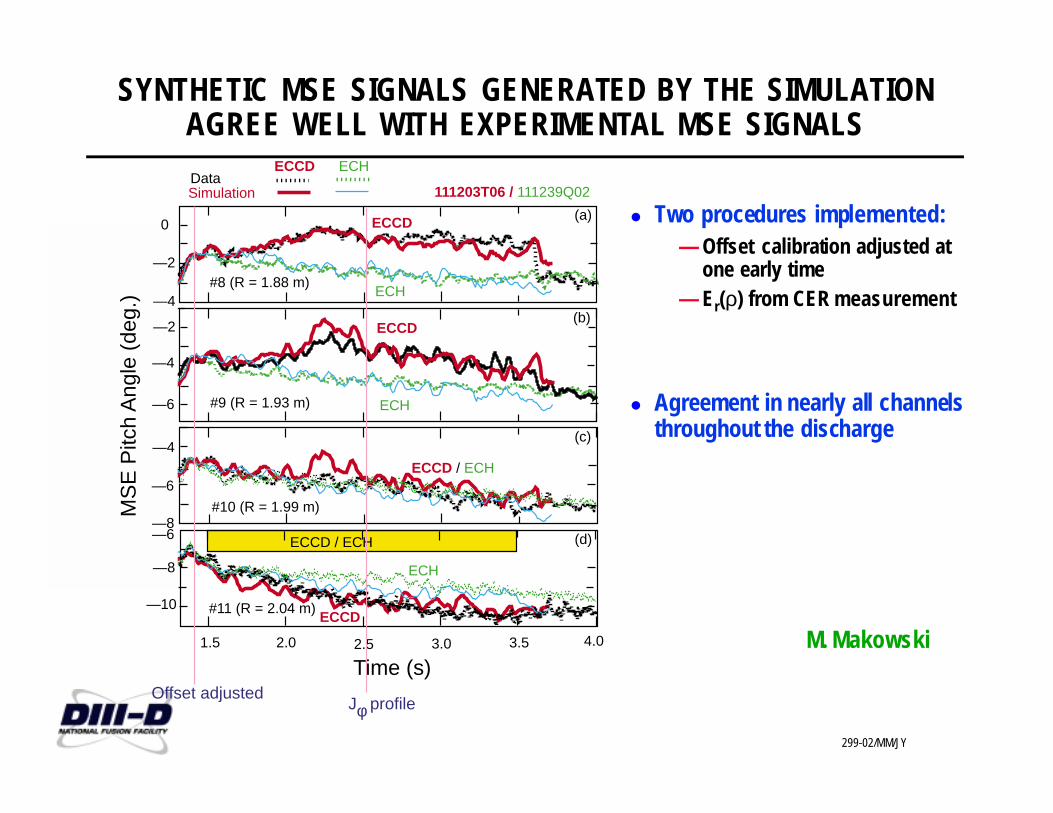
SYNTHETIC MSE SIGNALS GENERATED BY THE SIMULATIONAGREE WELL WITH EXPERIMENTAL MSE SIGNALS
� Two procedures implemented:— Offset calibration adjusted at
one early time— Er(ρ) from CER measurement
� Agreement in nearly all channelsthroughout the discharge
ECCD / ECH
#8 (R = 1.88 m)
#9 (R = 1.93 m) ECH
ECCD
#10 (R = 1.99 m)
1.5 2.0 2.5 3.0 3.5 4.0
Time (s)
(a)
(b)
ECH
ECCD
(c)
111203T06 / 111239Q02
(d)
#11 (R = 2.04 m)
—2
0
—4
—2
—4
—6
—6
—4
—8—6
—8
—10
MS
E P
itch
Ang
le (
deg.
)
ECCD / ECH
ECCD
ECH
SimulationData
ECCD ECH
Offset adjustedJφ profile
M. Makowski

299-02/MM/JY
LOCAL TOROIDAL CURRENT DENSITY PROFILE PREDICTED BYSIMULATION AGREES WELL WITH MSE INFERRED CURRENT PROFILE
Loca
l tor
oida
l cur
rent
den
sity
J (
A/c
m )
φ2
200
150
100
50
0
1.6 1.8 2.0 2.2
Midplane major radius, R (m)2.4
0.0 0.2 0.4 0.6 0.8 1.0—0.2
Normalized minor radius, ρ (approx.)
ρ = 0
Simulation
Tangential MSERadial MSEEdge MSE
ECH
� Broad current profile with ECH

299-02/MM/JY
LOCAL TOROIDAL CURRENT DENSITY PROFILE PREDICTED BYSIMULATION AGREES WELL WITH MSE INFERRED CURRENT PROFILE
Loca
l tor
oida
l cur
rent
den
sity
J (
A/c
m )
φ2
200
150
100
50
0
1.6 1.8 2.0 2.2
Midplane major radius, R (m)2.4
0.0 0.2 0.4 0.6 0.8 1.0—0.2
Normalized minor radius, ρ (approx.)
ρ = 0
Simulation
Tangential MSERadial MSEEdge MSE
ECCD
� Broad current profile with ECH� More off-axis peaked with ECCD

299-02/MM/JY
LOCAL TOROIDAL CURRENT DENSITY PROFILE PREDICTED BYSIMULATION AGREES WELL WITH MSE INFERRED CURRENT PROFILE
Loca
l tor
oida
l cur
rent
den
sity
J (
A/c
m )
φ2
200
150
100
50
0
1.6 1.8 2.0 2.2
Midplane major radius, R (m)2.4
0.0 0.2 0.4 0.6 0.8 1.0—0.2
Normalized minor radius, ρ (approx.)
⟨J ⟩ECρ = 0
Simulation
Tangential MSERadial MSEEdge MSE
ECH
ECCD
� Broad current profile with ECH� More off-axis peaked with ECCD� The current peak is broader than the ECCD driven current due to:
— Substantial Phirsch-Schlüter current component which is averaged out in ⟨Jφ⟩— Bootstrap current

299-02/MM/JY
� Experimental JOH from the loop voltage analysis:
— E|| = –––––– ⇒ JOH = σneo• E||
ALTHOUGH ECCD CONTRIBUTION TO TOTAL NONINDUCTIVECURRENT IS SMALL, ITS EFFECT ON BOOTSTRAP CURRENT
REDUCES OHMIC CURRENT TO LESS THAN ~15%
dΨpol
dt
100
50
0
–50
–1000.0 0.2 0.4
Normalized Radius
0.6 0.8 1.0
J (Simulation)OH
J (Experiment)OH
Ohm
ic C
urre
nt (
A/cm
2 )

299-02/MM/JY
� Experimental JOH from the loop voltage analysis:
— E|| = –––––– ⇒ JOH = σneo• E||
� fBS increased by 10% when ECH ⇒ ECCD
ALTHOUGH ECCD CONTRIBUTION TO TOTAL NONINDUCTIVECURRENT IS SMALL, EFFECT ON BOOTSTRAP CURRENT REDUCES
OHMIC CURRENT TO LESS THAN ~15%
100
50
0
–50
–1000.0 0.2 0.4
Normalized Radius
0.6 0.8 1.0
SauterModel
ECCD + NBCD + Bootstrap
Hirshman 78
ECCD + NBCD
ECCD
1 2 3 4Time (s)
0.0
0.2
0.4
0.6
0.8
1.0Noninductive Current Fractions
fNI (exp)
J (Simulation)OH
J (Experiment)OH
Ohm
ic C
urre
nt (
A/cm
2 )
dΨpol
dt

299-02/MM/JY
IMPROVEMENT IN BOOTSTRAP CURRENT ARISES FROMINCREASED PEAKING OF DENSITY AND TEMPERATURE
� Strong NCS triggered a weak internal transport barrier (ITB)

299-02/MM/JY
REDUCED TRANSPORT COEFFICIENTS OBSERVED INALL TRANSPORT CHANNELS IN CORE
� χ ieff(convective + conductive) ≈ χ i
eff(neoclassical) at ρ < 0.35 with ECCD
χ e
D e
χ φ
(m2 /
s)(m
2 /s)
0.0 0.2 0.4 0.6 0.8 1.0Normalized Radius
0.1
1.0
10.0
0.1
1.0
10.0
0.0 0.2 0.4 0.6 0.8 1.0Normalized Radius
χ ieff
χ i,neoeff
ECHECCD
t = 2.3 - 2.7 s
(a)
(b) (d)
(c)
Region ofNegativeShear

299-02/MM/JY
� High power phase delayed untilqmin < 2.0
� βN ~ 3.1, β ~ 3.3 %, H89 ~ 2.4
� q0 > 2.0, qmin < 2.0 maintained for1.0 s
� Duration limited by onset of smallm=5/n=3 NTM
0.00.51.01.5
0
2
1
2
0
6
0 20
20
Ip (MA)Pinj (10 MW) PECCD (approx.)
βN
4 li
q0
qmin
Ti(0)Te(0)
|B|odd.
1 3 4 5Time (s)
n=3111221
IN SEPARATE EXPERIMENTS, ECCD HAS BEEN USED TOSUSTAIN A STATIONARY CURRENT DENSITY PROFILE
FOR UP TO 1.0 S with qmin>1.5

299-02/MM/JY
CURRENT PROFILE IS STATIONARYFOR FIRST SECOND OF ECCD
� Direct inference of Jφ using MSE data � EFIT reconstruction of equilibrium
J φ (M
A/m
2 )
t = 3.0 s (ECCD turn-on)t = 4.0 s
0.0 0.2
Pressure
0.6 0.8 1.01
2
3
4
5
q
0.0 0.2 0.4 0.6 0.8 1.0
Normalized Radius
0.0
0.5
1.0
1.5
(10
5 Pa)
JECCD @ ρ = 0.4ρ = 0
1.60 1.70 1.80 1.90 2.00 2.10 2.20R (m)
0.0
0.5
1.0
1.5
2.0
0.4

299-02/MM/JY
NONINDUCTIVE CURRENT FRACTION OF ~85% WASOBTAINED IN THE qmin >1.5 REGIME
t = 3.75 s
Simulation
Experiment
Normalized Radius0.0 0.2 0.4 0.6 0.8 1.0
100
50
A/cm
2
0
–50
–100
~

299-02/MM/JY
NONINDUCTIVE CURRENT FRACTION OF ~85% WASOBTAINED IN THE qmin >1.5 REGIME
2.5
ECCD + NBCD
fNI (exp)
ECCD
ECCD + NBCD + Bootstrap
3.0 3.5 4.0 4.5Time (s)
0.0
0.2
0.4
0.6
0.8
1.0Noninductive Current Fractions
SauterModel
Hirshman78 Model
t = 3.75 s
Simulation
Experiment
Normalized Radius0.0 0.2 0.4 0.6 0.8 1.0
100
50
A/cm
2
0
–50
–100
~
299-02/MM/JY
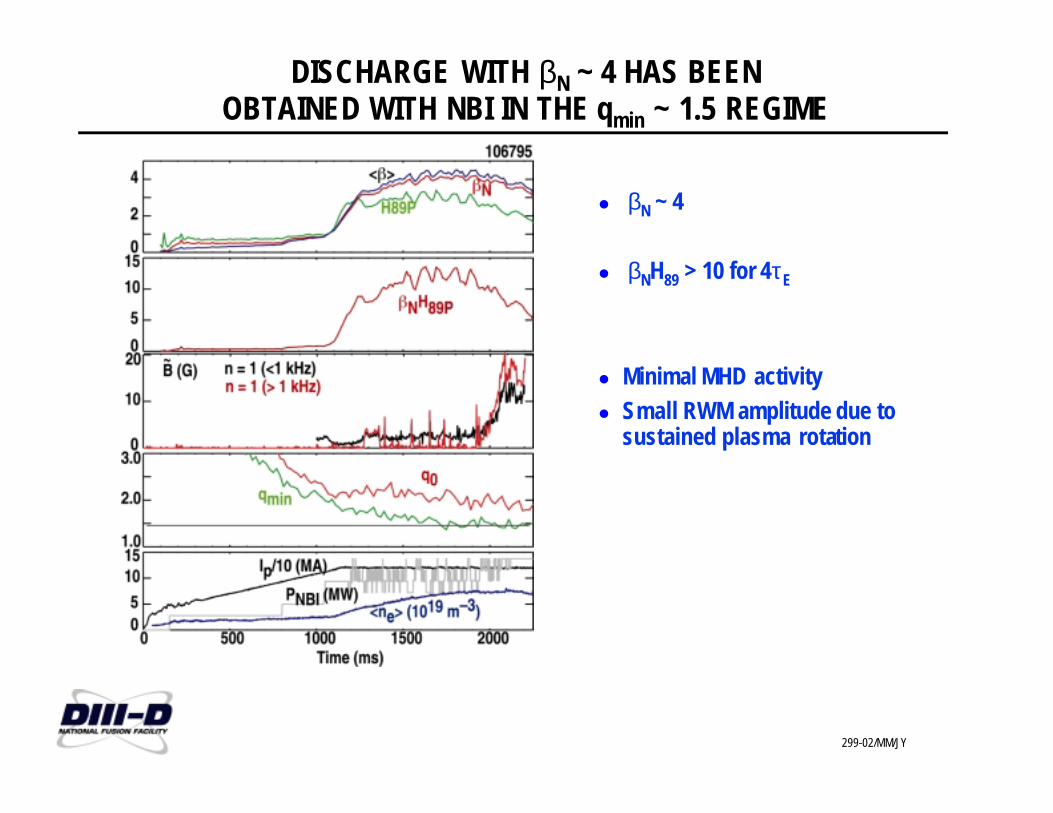
� βN ~ 4
� βNH89 > 10 for 4τE
� Minimal MHD activity� Small RWM amplitude due to
sustained plasma rotation
DISCHARGE WITH βN ~ 4 HAS BEENOBTAINED WITH NBI IN THE qmin ~ 1.5 REGIME
299-02/MM/JY
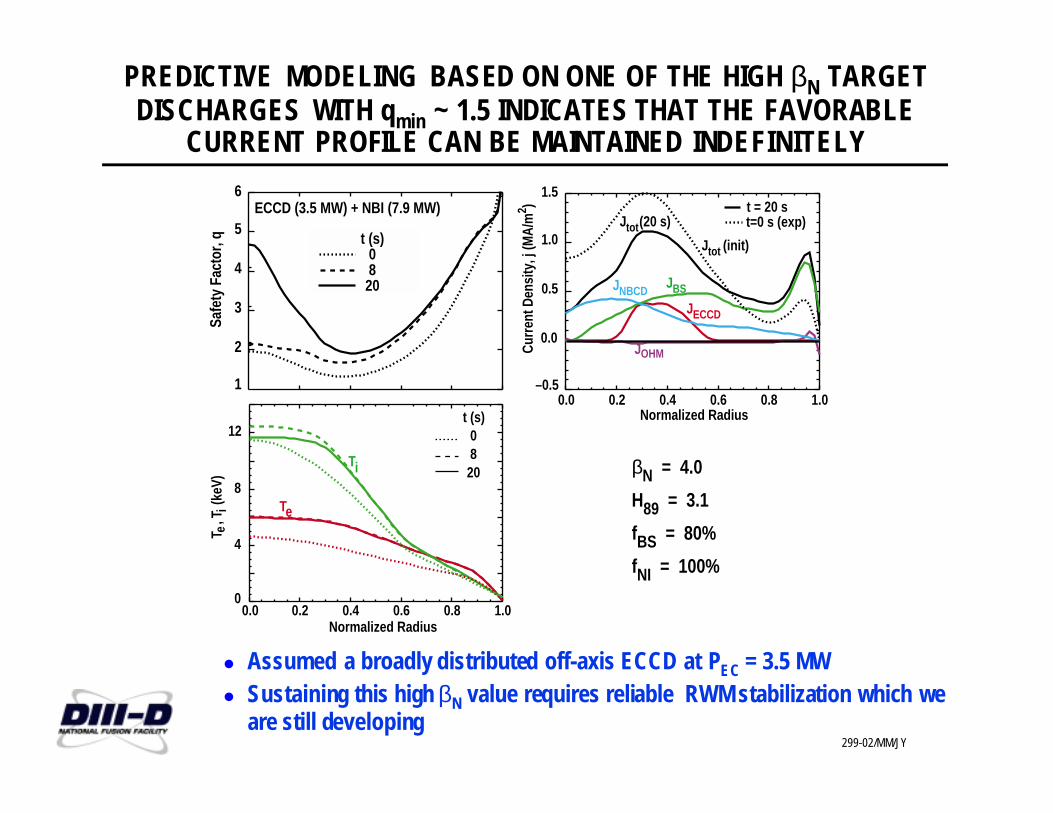
PREDICTIVE MODELING BASED ON ONE OF THE HIGH βN TARGETDISCHARGES WITH qmin ~ 1.5 INDICATES THAT THE FAVORABLE
CURRENT PROFILE CAN BE MAINTAINED INDEFINITELY
0.0 0.2 0.4 0.6 0.8 1.0–0.5
0.0
0.5
1.0
1.5
Curr
ent D
ensi
ty, j
(MA/
m2 )
JBSJNBCD
Jtot
(20 s)
JOHM
JECCD
Jtot (init)
Normalized Radius
Normalized Radius
t = 20 s t=0 s (exp)
0.0 0.2 0.4 0.6 0.8 1.00
4
8
12t (s) 0 820
T e, T
i (ke
V)
Te
Ti βN = 4.0
H89 = 3.1
fBS = 80%
fNI = 100%
1
2
3
4
5
6
0 4 8
121620
t (s)
ECCD (3.5 MW) + NBI (7.9 MW)Sa
fety
Fac
tor,
q t (s)08
20
� Assumed a broadly distributed off-axis ECCD at PEC = 3.5 MW� Sustaining this high βN value requires reliable RWM stabilization which we
are still developing

299-02/MM/JY
PREDICTIVE MODELING SHOWS THAT THE EXISTING qmin > 1.5 ECCDDISCHARGE CAN BE EXTENDED TO FULL NONINDUCTIVITY USING THE
HARDWARE CAPABILITIES AVAILABLE IN THE NEAR TERM
� Estimated power requirements are conservative: H98y2 scaling powerdegradation (χ ∝ χexp• P0.69); kinetic (not magnetic) βN; and bootstrap model
� The DIII–D ECCD capability expected in 2003 includes 4 s (> τCR ) of ECCD atPEC ~ 2.5 MW
J. Lohr: LO1.006
q (r)
t (s)3.85.07.0
6
4
2
0
q = 1.5
Normalized Radius, ρ0.0 0.2 0.4 0.6 0.8 1.0
Jtotal
1.5t = 7.0 s
1.0
0.5
0
-0.5
Safe
ty F
acto
rM
A/m
2
ECCD
ECCD + NBCD
ECCD + NBCD + Bootstrap
Shot 111221
ModelingNo
nind
uctiv
e Cu
rren
t F
ract
ions
0.0
0.2
0.4
0.6
0.8
1.0
1.2
βN
Pinj (14 MW)
β Limit
2 3 4 5 6Time (s)
β N, P
inj/1
0 (MW
)
0
1
2
3
4
Shot 111221
Modeling
4 MW
JNBCD
JBSJECCD
JOH

299-02/MM/JY
SUMMARY
� Current profile at high β has been modified using off-axis ECCD with qmin >2— Strong negative central shear produced— Improvements observed in all transport channels— fBS ~ 55%; fNI ~90% achieved; higher values limited by attainable βN
� Current profile at high β has been sustained with qmin >1.5— Nearly steady-state current and pressure profiles maintained for 1 s— Good access to the regime demonstrated where higher fBS possible with higher βN
� Predictive modeling validated for full noninductive operation with qmin > 1.5 usingnear-term hardware capabilities

299-02/MM/JY
THE CORE REGION OF THE ECCD DISCHARGE MAY BE LIMITED BY RESISTIVE INTERCHANGE MODES
� GKS ⇒ a/LTi(exp) limited by a/LTi(ITG) in the ECH case� Stronger NCS, α-stabilization (and ExB shear) stabilize ITG in the ECCD discharge
� Why not a/LTi(exp) goes up as high as a/LTi(ITG)?� Resistive interchange modes are found to be unstable in core (ρ = 0.15 - 0.41) with
ECCD, as shown by DR >0 there— Some bursts observed in Mirnov signals
� Since GKS code uses the ballooning representation, the code calculation in this regionis invalid
� We also note that χieff(exp) ~ χi
eff(neo) in region ρ < 0.35 for the ECCD case
0.0 0.2 0.4 0.6 0.8 1.0
Normalized radius, ρ
0
2
4
6
8
(a/LTi)ITG
(a/LTi)exp
ECCD (111203F01)
a/L T
i(a/LTi)ITG
(a/LTi)exp
ECH (111232C01)
0
2
4
6
8
a/L T
i
DR×10
0.0 0.2 0.4 0.6 0.8 1.0
Normalized radius, ρ

299-02/MM/JY
ATTAINABLE βN OBSERVED TO DECREASE AS qmin INCREASES
� So far, βN = 3.5 - 4.0 possible with qmin <2
� Robust operation above no-wall, ideal n = 1limit made possible by RWM stabilization
� Stability calculations ⇒ with suitablebroad pressure profiles and RWMstabilization, higher βN may be possiblewith qmin >2
1.5 2.0
Measured no-wall
ECCDCases
β-limit
Maximum experimental β N
qmin
2.5β N
2.0
2.5
3.0
3.5
4.0
J. Ferron: LO1.005A. Garofalo: LO1.004