THE REMOVAL OF HEAVY METAL IONS (COPPER, ZINC, NICKEL AND COBALT) BY NATURAL BENTONITE
Upload
up-dilimanCategory
view
2download
0
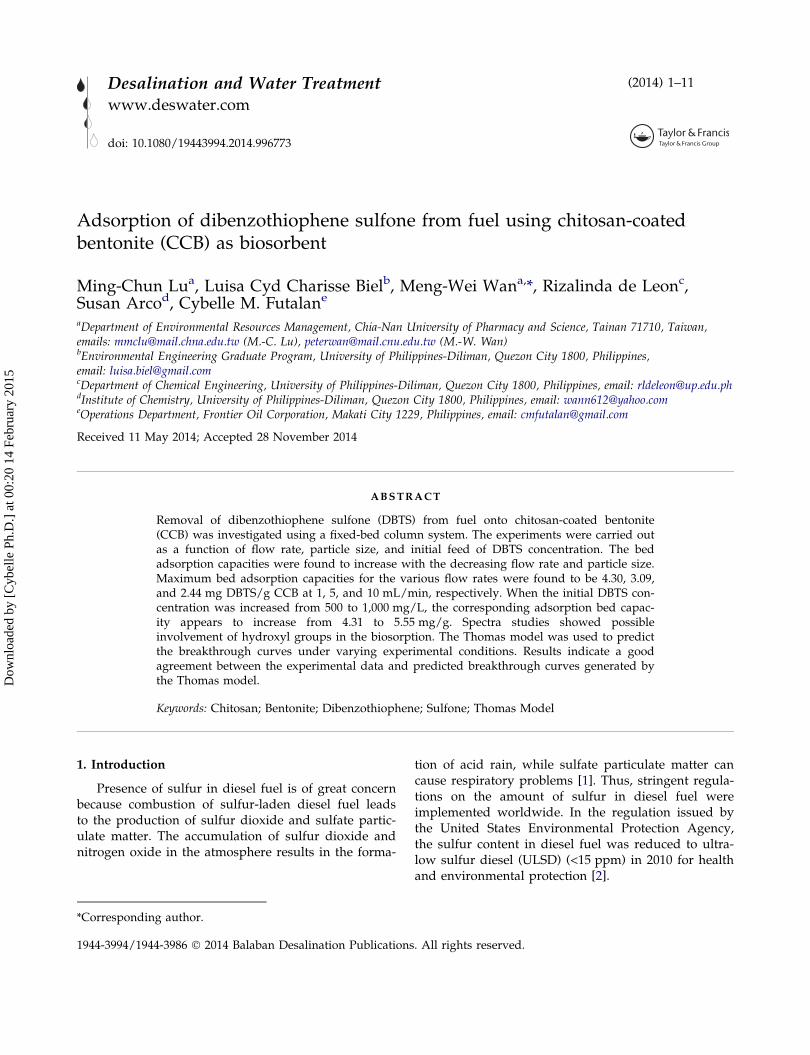
This article was downloaded by: [Cybelle Ph.D.]On: 14 February 2015, At: 00:20Publisher: Taylor & FrancisInforma Ltd Registered in England and Wales Registered Number: 1072954 Registered office: Mortimer House,37-41 Mortimer Street, London W1T 3JH, UK
Click for updates
Desalination and Water TreatmentPublication details, including instructions for authors and subscription information:http://www.tandfonline.com/loi/tdwt20
Adsorption of dibenzothiophene sulfone from fuelusing chitosan-coated bentonite (CCB) as biosorbentMing-Chun Lua, Luisa Cyd Charisse Bielb, Meng-Wei Wana, Rizalinda de Leonc, Susan Arcod &Cybelle M. Futalane
a Department of Environmental Resources Management, Chia-Nan University of Pharmacyand Science, Tainan 71710, Taiwanb Environmental Engineering Graduate Program, University of Philippines-Diliman, QuezonCity 1800, Philippinesc Department of Chemical Engineering, University of Philippines-Diliman, Quezon City 1800,Philippinesd Institute of Chemistry, University of Philippines-Diliman, Quezon City 1800, Philippinese Operations Department, Frontier Oil Corporation, Makati City 1229, PhilippinesPublished online: 02 Jan 2015.
To cite this article: Ming-Chun Lu, Luisa Cyd Charisse Biel, Meng-Wei Wan, Rizalinda de Leon, Susan Arco & Cybelle M.Futalan (2015): Adsorption of dibenzothiophene sulfone from fuel using chitosan-coated bentonite (CCB) as biosorbent,Desalination and Water Treatment, DOI: 10.1080/19443994.2014.996773
To link to this article: http://dx.doi.org/10.1080/19443994.2014.996773
PLEASE SCROLL DOWN FOR ARTICLE
Taylor & Francis makes every effort to ensure the accuracy of all the information (the “Content”) containedin the publications on our platform. However, Taylor & Francis, our agents, and our licensors make norepresentations or warranties whatsoever as to the accuracy, completeness, or suitability for any purpose of theContent. Any opinions and views expressed in this publication are the opinions and views of the authors, andare not the views of or endorsed by Taylor & Francis. The accuracy of the Content should not be relied upon andshould be independently verified with primary sources of information. Taylor and Francis shall not be liable forany losses, actions, claims, proceedings, demands, costs, expenses, damages, and other liabilities whatsoeveror howsoever caused arising directly or indirectly in connection with, in relation to or arising out of the use ofthe Content.
This article may be used for research, teaching, and private study purposes. Any substantial or systematicreproduction, redistribution, reselling, loan, sub-licensing, systematic supply, or distribution in anyform to anyone is expressly forbidden. Terms & Conditions of access and use can be found at http://www.tandfonline.com/page/terms-and-conditions
Adsorption of dibenzothiophene sulfone from fuel using chitosan-coatedbentonite (CCB) as biosorbent
Ming-Chun Lua, Luisa Cyd Charisse Bielb, Meng-Wei Wana,*, Rizalinda de Leonc,Susan Arcod, Cybelle M. Futalane
aDepartment of Environmental Resources Management, Chia-Nan University of Pharmacy and Science, Tainan 71710, Taiwan,emails: [email protected] (M.-C. Lu), [email protected] (M.-W. Wan)bEnvironmental Engineering Graduate Program, University of Philippines-Diliman, Quezon City 1800, Philippines,email: [email protected] of Chemical Engineering, University of Philippines-Diliman, Quezon City 1800, Philippines, email: [email protected] of Chemistry, University of Philippines-Diliman, Quezon City 1800, Philippines, email: [email protected] Department, Frontier Oil Corporation, Makati City 1229, Philippines, email: [email protected]
Received 11 May 2014; Accepted 28 November 2014
ABSTRACT
Removal of dibenzothiophene sulfone (DBTS) from fuel onto chitosan-coated bentonite(CCB) was investigated using a fixed-bed column system. The experiments were carried outas a function of flow rate, particle size, and initial feed of DBTS concentration. The bedadsorption capacities were found to increase with the decreasing flow rate and particle size.Maximum bed adsorption capacities for the various flow rates were found to be 4.30, 3.09,and 2.44 mg DBTS/g CCB at 1, 5, and 10 mL/min, respectively. When the initial DBTS con-centration was increased from 500 to 1,000 mg/L, the corresponding adsorption bed capac-ity appears to increase from 4.31 to 5.55 mg/g. Spectra studies showed possibleinvolvement of hydroxyl groups in the biosorption. The Thomas model was used to predictthe breakthrough curves under varying experimental conditions. Results indicate a goodagreement between the experimental data and predicted breakthrough curves generated bythe Thomas model.
Keywords: Chitosan; Bentonite; Dibenzothiophene; Sulfone; Thomas Model
1. Introduction
Presence of sulfur in diesel fuel is of great concernbecause combustion of sulfur-laden diesel fuel leadsto the production of sulfur dioxide and sulfate partic-ulate matter. The accumulation of sulfur dioxide andnitrogen oxide in the atmosphere results in the forma-
tion of acid rain, while sulfate particulate matter cancause respiratory problems [1]. Thus, stringent regula-tions on the amount of sulfur in diesel fuel wereimplemented worldwide. In the regulation issued bythe United States Environmental Protection Agency,the sulfur content in diesel fuel was reduced to ultra-low sulfur diesel (ULSD) (<15 ppm) in 2010 for healthand environmental protection [2].
*Corresponding author.
1944-3994/1944-3986 � 2014 Balaban Desalination Publications. All rights reserved.
Desalination and Water Treatment (2014) 1–11
www.deswater.com
doi: 10.1080/19443994.2014.996773
Dow
nloa
ded
by [
Cyb
elle
Ph.
D.]
at 0
0:20
14
Febr
uary
201
5

Currently, a combined process of ultrasound-assisted oxidation and adsorption has demonstratedfavorable results in achieving ULSD. The principlebehind these techniques involves the conversion ofrefractory sulfur and other sulfur containing com-pounds into their corresponding sulfoxides and sulf-ones using an oxidant [3,4]. These more polarproducts can be easily removed by solid adsorption atlow temperature and ambient pressure. The adsorp-tion of the oxidized sulfur compounds such as diben-zothiophene sulfone (DBTS) onto solid adsorbentsallows for their removal from fuel without the addi-tion of chemicals [5].
To date, the adsorbents that have been employedfor the removal of DBTS were activated carbon andalumina, specifically acidic alumina. In the study con-ducted by Etemadi and Yen [5], acidic alumina exhib-its good adsorption capacity for oxidized refractorysulfur compound as compared to activated carbon.However, the use of acidic alumina as adsorbent isquite expensive. These constraints have caused thesearch for alternative technologies for the adsorptionof the oxidized sulfur compounds to cost-effectiveenvironmentally acceptable levels.
In recent years, the use of polymeric adsorbentsfor the removal of pollutants in wastewater had beenextensively used due to their adsorption-regenerationproperties and mechanical strength. An example ofthis is chitosan, a polysaccharide produced by alkalinedeacetylation of chitin that is primarily found in shellsof shrimps [6,7]. Chitosan has been proved as a usefulmaterial for removing inorganic and organic sub-stances from wastewater due to the presence of pri-mary, secondary hydroxyl groups, and highly reactiveamino groups. Furthermore, chitosan has the advan-tage of being nontoxic and biodegradable [8]. How-ever, chitosan alone is not an ideal bioadsorbent dueto several disadvantages that include low-surface area,low specific gravity, softness and weak mechanicalproperties [9,10]. Moreover, chitosan easily dissolvesin acidic solutions and at the same time tends to forma hydrogel in aqueous media. This results in the inac-cessibility of its binding sites. Therefore, to improveits strength for practical applications chitosan is modi-fied either chemically or physically [11].
Several investigators have attempted to modify thechitosan in order to facilitate mass transfer and exposethe active binding sites for the enhancement of itsadsorption capacity. These include crosslinking orchitosan derivative based on carboxymethyl and hy-droxamic acid, and coating bentonite with chitosan[9]. But the former is rather costly and/or has compli-cated preparative methods as compared to the latterthat is simple to prepare. In addition, according to
various studies, the latter method greatly reduces theamount of chitosan used during synthesis in order toproduce the needed composite adsorbent materialwith improved mechanical and chemical stability, andas a result lowers the production cost [12,13].
The effectiveness of utilizing chitosan coated onbentonite for the removal of heavy metals in batchstudies and column studies has been demonstrated inseveral studies [12,14,15]. Their experimental resultsshowed that chitosan coated on bentonite was veryeffective in the removal of copper (II) [12,14,15], lead(II) [15], and nickel (II) [15] from aqueous solutions.Previous researches utilized chitosan crosslinked withglutaric dialdehyde and glutarahdehyde in removingDBTS from acetonitrile solution, and showed the effec-tiveness of chitosan in removing oxidized sulfur com-pounds from fuels [16,17]. Moreover, Lu et al.reported on the kinetics and isotherm of the removalof DBTS using chitosan-coated bentonite (CCB) [18].However, there are no fixed-bed studies on chitosanand its derivatives as an adsorbent utilized for cleanfuel production.
Thus, in this work, a composite chitosan bioadsor-bent was investigated in the removal of oxidized sul-fur compound from model diesel fuel in a fixed-bedcolumn system. The CCB is prepared by coating chito-san, a glucosamine biopolymer, over bentonite, a typeof clay material that has a high specific surface areaand is mechanically and chemically stable and formedinto beads. It is expected that more active sites ofchitosan will be available, thus enhancing its adsorp-tion capacity. The CCB beads are characterized beforeand after adsorption of the oxidized sulfur com-pounds by Fourier transform infrared (FTIR) spectros-copy, thermal gravimetric analysis (TGA), andscanning electron microscopy (SEM). The effect ofinfluent concentration, particle, flow rate on the col-umn performance, and the shape of the breakthroughcurves will be evaluated. Kinetic column modelnamely Thomas model will be applied to describe thedynamic performance of the adsorption process andassist in predicting the breakthrough curves.
2. Materials and experimental methods
2.1. Materials
All reagents used were of analytical grade andwere utilized as received without further purification.DBTS with quoted purities of 0.98mass fractions wasobtained from Alfa Aesar. These compounds are rep-resentative of the sulfur compounds found in dieselfuel. Toluene (as solvent), NaOH pellets, and hydro-chloric acid (HCl) fuming 37% were purchased from
2 M.-C. Lu et al. / Desalination and Water Treatment
Dow
nloa
ded
by [
Cyb
elle
Ph.
D.]
at 0
0:20
14
Febr
uary
201
5

Merck Germany with quoted purities of 0.99 massfractions. Low-molecular weight powdered chitosan(MW 340.3322 g/mole extracted from crab shells) with75–85% degree of deacetylation and viscosity of 20 cPwas procured from Sigma-Aldrich. The bentonite, assubstrate, was obtained from First Chemical. Waterused for the preparation of solutions and cleaning theadsorbents was generated in the laboratory by doubledistilling the deionized water in a quartz distillationunit.
2.1.1. Adsorbate
The initial concentrations of the stock solution forthe oxidized sulfur compound (DBTS) were regulatedto approximately 500, 750, and 1,000 ppm. This wasprepared by mixing appropriate amount of DBTS intoluene. The amount of the polar sulfur compound inthe fuel was analyzed using the Gas Chromatography(GC)–Sulfur Chemiluminescence Detector (SCD).
2.1.2. Synthesis of adsorbent
In the synthesis of the adsorbent, about 5 g chito-san was mixed with 300 mL of 5% (v/v) HCl and themixture was stirred for 2 h at the rated speed of300 rpm. Then, 100 g of bentonite was slowly addedinto the solution under continuous stirring and themixture was stirred for another 3 h. Bentonite, whichis composed mainly of montmorillonite clay, was usedas substrate for the preparation of beads. Precipitationof the chitosan on the bentonite was carried out by thedropwise addition of 1 N NaOH. The addition ofNaOH solution was done until neutralization occursand synthesized adsorbent was washed several timeswith deionized water. The adsorbent was then driedin the oven at 65˚C for 24 h and sieved to the desiredparticle size range of 0.1–1.5 mm.
2.2. Experimental methods
A schematic diagram of the fixed-bed column sys-tem utilized in this study is shown in Fig. 1. Dynamicflow adsorption studies were carried out in a columnmade of borosilicate glass from IWAKI glass code7740 with a 1.2 cm internal diameter and 55 cm inheight. The column was first filled with glass beads toserve as support material. Then, 10 g of CCB wasadded by tapping so that the column was filled with-out gaps followed by a glass mesh to control the flowof the inlet solution. The adsorbent was washed thor-oughly with toluene prior to use to ensure all the porespaces were filled.
In a typical experiment, the influent solution wasfed from the top of the column using a peristalticpump (Masterflex CZ 77120-70) at room temperature.Samples were collected at the bottom of the column atregular time intervals. Column experiments were oper-ated in a down flow manner. To study the effect ofparameters such as flow rate (1, 5, and 10 mL/min),particle size (0.1–0.5, 0.5–1.0, and 1.0–1.5 mm), and ini-tial concentration of DBTS (500, 750, and 1,000 ppm),the experiments were conducted by varying oneparameter at a time while keeping all other parametersconstant. The complete cycle of operation of each col-umn experiment includes two steps: obtaining constantsolution flow and adsorption of solute (DBTS) untilcolumn exhaustion occurs. Effluent solution was col-lected at predetermined time intervals and preservedfor analysis. The solutions were diluted appropriatelyprior to analysis. All experiments were carried out atroom temperature. Breakthrough curves were obtainedby plotting the volume of the solution that passedthrough the column against ratio of the column efflu-ent concentration to the initial concentration, Ct/C0.
2.3. Analytical methods and instrumentation
To determine the amount of sulfur in the oxidizedsolution, the Agilent Technologies 7890A GC Systemequipped with a fused-silica capillary HP-5 ms column(30 m) having a thickness of 0.25 mm film (J & W
3
1
2
4
1. Feed Storage
2. Pump
3. Column
4. Sample collection
Fig. 1. Experimental system for fixed-bed column.
M.-C. Lu et al. / Desalination and Water Treatment 3
Dow
nloa
ded
by [
Cyb
elle
Ph.
D.]
at 0
0:20
14
Febr
uary
201
5

Scientific, Folsom, CA, USA) was employed. The GCwas connected to a SCD for higher selectivity and sen-sitivity towards ultra-low sulfur concentration. The GCtemperature was initially set to 100˚C for 3 min andramped up to 300˚C at increasing rate of 20˚C/min.
SEM was performed using a Philips-FEI XL30ESEM-TMP (Philips Electronics Co., Eindhoven) todetermine the morphology of the adsorbent. Images ofvarious materials were obtained at an operating volt-age of 10 kV. Moreover, TGA was performed onfreeze-dried bentonite, chitosan, and CCB samplesusing Rigaku Thermo Plus TG 8120 in the temperaturerange of 30–800˚C at a heating rate of 10˚C/min. TheFTIR spectra of the adsorbent materials were recordedutilizing a Perkin Elmer 1800 model IR spectropho-tometer with operating frequencies that rangesbetween 400 and 4,000 cm−1.
2.4. Analysis of column data
In determining the operation and response of anadsorption column, there are two important character-istics that should be considered. These include thetime at breakthrough and the shape of the break-through curve. The importance of a breakthroughcurve illustrates the uptake of the DBTS in a fixed-bedsystem. This is usually expressed in terms of normal-ized concentration or the ratio of effluent (desulfu-rized feed containing DBTS after adsorption)concentration to influent (desulfurized feed containingDBTS before adsorption) concentration (Ct/C0) as afunction of time or volume of effluent for a given bedheight. The treated effluent volume (Vte) is given byEq. 1:
Vte ¼ Qtex (1)
where Q is the volumetric flow rate (mL/min) and texis the time at exhaustion (min), respectively. Thebreakthrough and exhaustion points refer to when theeffluent reaches 10 and 90% of the influent concentra-tion, respectively.
For the total DBTS adsorbed (qtotal) in the column,this can be determined through the area under thebreakthrough curve (A). The area can be calculated byintegrating the adsorbed DBTS concentration (Cad = in-let DBTS concentration (C0)−outlet DBTS concentration(Ct)) vs. t (min) plot. Total DBTS adsorbed quantity(qtotal; mg) in the column is expressed in Eq. 2:
qtotal ¼ QA
1;000¼ Q
1;000
Z t¼ttotal
t¼0
Caddt (2)
The total amount of DBTS sent to column (mtotal) iscalculated from Eq. 3:
mtotal ¼ C0Qttotal1;000
(3)
Total removal (Y) is shown and calculated from Eq. 4:
Y ð%Þ ¼ qtotalmtotal
� 100 (4)
The equilibrium uptake (qe) or the maximum capacityof the column, which is the weight of adsorbateadsorbed per unit dry weight of adsorbent (mg/g) inthe column, is calculated as follows (Eq. (5)):
qe ¼ qtotalX
(5)
where X is the total dry weight of adsorbent in thecolumn (g).
2.5. Mathematical model
The ability to predict the concentration–time profileor breakthrough curve for the effluent is the determin-ing point in the effective design of a column system.There are a number of mathematical models that canbe employed to describe a fixed-bed column system.One of the simple and most widely used models isthe Thomas or reaction model. The model assumes theLangmuir kinetics of adsorption–desorption and noaxial dispersion in the column adsorption. The reasonfor this is derived from the adsorption that the rate-driving force obeys second-order reversible reactionkinetics. Thomas’ solution also assumes a constantseparation factor but it is applicable to either favorableor unfavorable isotherms [19]. The Thomas modelgiven by the Eq. (6) is as follows [20,21]:
Ct
C0¼ 1
1þ exp kTHQ
� �QeX � C0Vteð Þ
� � (6)
where kTH is the Thomas rate constant (mL/min mg);Qe is the maximum solid-phase concentration of solute(mg/g). X is the amount of adsorbent in the column(g); and Vte is the effluent volume (L); Q is the flowrate (mL/min).
The linearized form of the Thomas model is shownin Eq. 7:
4 M.-C. Lu et al. / Desalination and Water Treatment
Dow
nloa
ded
by [
Cyb
elle
Ph.
D.]
at 0
0:20
14
Febr
uary
201
5

lnC0
Ct� 1
� �¼ kTHQeX
Q� kTHC0Vte
Q(7)
where a plot of ln [(Ct/C0)−1] against C0 at given con-ditions will determine the kinetic coefficient kTH andthe adsorption capacity of the bed Qe.
3. Results and discussion
3.1. Scanning electron microscopic studies
The SEM micrographs of pure chitosan and ben-tonite are shown in Fig. 2(a) and (b), respectively.Fig. 2(a) illustrates the surface texture of the chitosanthat shows a continuous, smooth, and non-porous sur-face [22]. Fig. 2(b) illustrates the morphology of the
bentonite, where coarser and more porous surface areawas observed.
Fig. 2(c) and (d) represents the SEM micrograph ofthe adsorbent before and after adsorption, respec-tively. In Fig. 2(c), the surface morphology of CCBexhibits a structure similar to bentonite but with lesserpores. The coating of chitosan onto bentonite surfacehas lessened the porosity of the bentonite particles.Comparing Fig. 2(c) and (d), there were no significantchanges observed.
3.2. TGA studies
To confirm the successful coating of chitosan ontobentonite, the results from TGA are presented inFig. 3. The chitosan has two decomposition sites: thefirst one is at 50–120˚C that is attributed to loss of
Fig. 2. SEM images of (a) chitosan, (b) bentonite, (c) synthesized CCB before adsorption, and (d) synthesized CCB afteradsorption with oxidized sulfur compound solution.
M.-C. Lu et al. / Desalination and Water Treatment 5
Dow
nloa
ded
by [
Cyb
elle
Ph.
D.]
at 0
0:20
14
Febr
uary
201
5
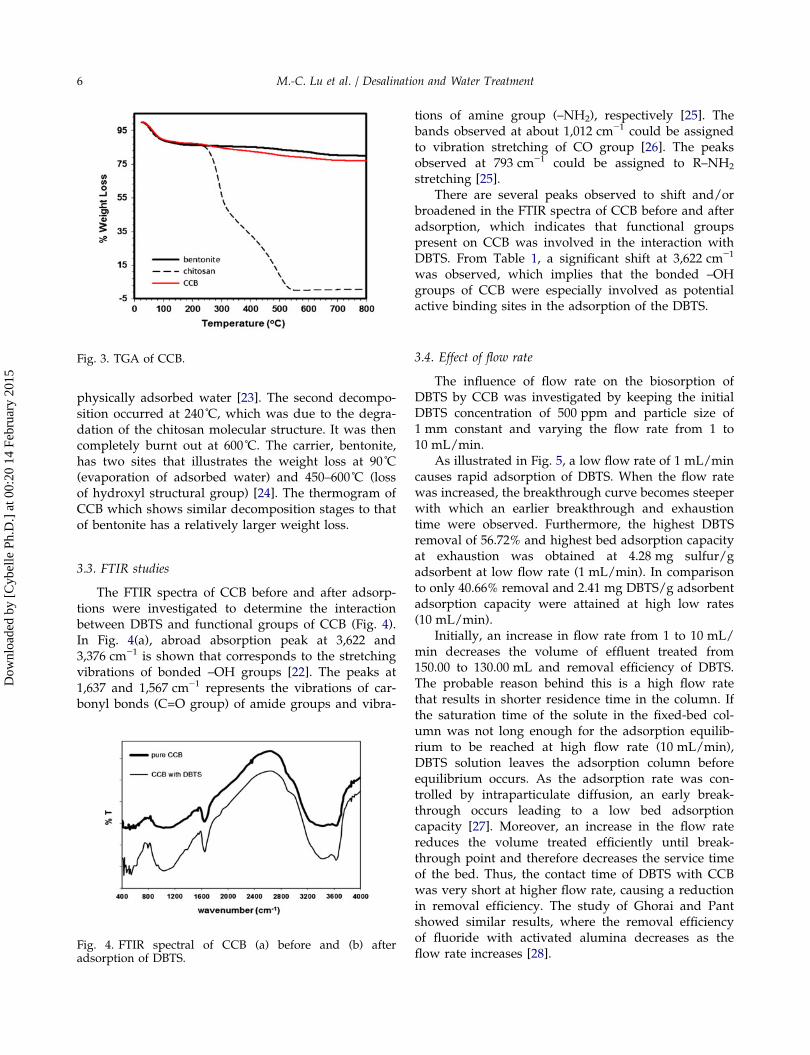
physically adsorbed water [23]. The second decompo-sition occurred at 240˚C, which was due to the degra-dation of the chitosan molecular structure. It was thencompletely burnt out at 600˚C. The carrier, bentonite,has two sites that illustrates the weight loss at 90˚C(evaporation of adsorbed water) and 450–600˚C (lossof hydroxyl structural group) [24]. The thermogram ofCCB which shows similar decomposition stages to thatof bentonite has a relatively larger weight loss.
3.3. FTIR studies
The FTIR spectra of CCB before and after adsorp-tions were investigated to determine the interactionbetween DBTS and functional groups of CCB (Fig. 4).In Fig. 4(a), abroad absorption peak at 3,622 and3,376 cm−1 is shown that corresponds to the stretchingvibrations of bonded –OH groups [22]. The peaks at1,637 and 1,567 cm−1 represents the vibrations of car-bonyl bonds (C=O group) of amide groups and vibra-
tions of amine group (–NH2), respectively [25]. Thebands observed at about 1,012 cm−1 could be assignedto vibration stretching of CO group [26]. The peaksobserved at 793 cm−1 could be assigned to R–NH2
stretching [25].There are several peaks observed to shift and/or
broadened in the FTIR spectra of CCB before and afteradsorption, which indicates that functional groupspresent on CCB was involved in the interaction withDBTS. From Table 1, a significant shift at 3,622 cm−1
was observed, which implies that the bonded –OHgroups of CCB were especially involved as potentialactive binding sites in the adsorption of the DBTS.
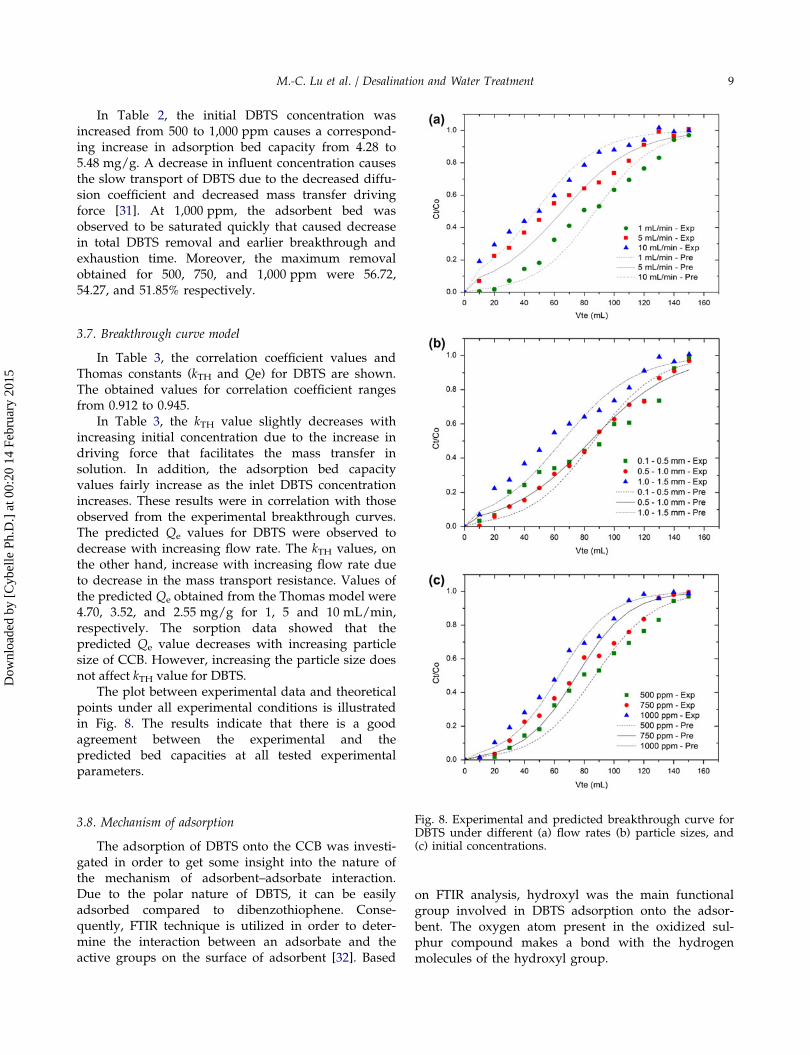
3.4. Effect of flow rate
The influence of flow rate on the biosorption ofDBTS by CCB was investigated by keeping the initialDBTS concentration of 500 ppm and particle size of1 mm constant and varying the flow rate from 1 to10 mL/min.
As illustrated in Fig. 5, a low flow rate of 1 mL/mincauses rapid adsorption of DBTS. When the flow ratewas increased, the breakthrough curve becomes steeperwith which an earlier breakthrough and exhaustiontime were observed. Furthermore, the highest DBTSremoval of 56.72% and highest bed adsorption capacityat exhaustion was obtained at 4.28 mg sulfur/gadsorbent at low flow rate (1 mL/min). In comparisonto only 40.66% removal and 2.41 mg DBTS/g adsorbentadsorption capacity were attained at high low rates(10 mL/min).
Initially, an increase in flow rate from 1 to 10 mL/min decreases the volume of effluent treated from150.00 to 130.00 mL and removal efficiency of DBTS.The probable reason behind this is a high flow ratethat results in shorter residence time in the column. Ifthe saturation time of the solute in the fixed-bed col-umn was not long enough for the adsorption equilib-rium to be reached at high flow rate (10 mL/min),DBTS solution leaves the adsorption column beforeequilibrium occurs. As the adsorption rate was con-trolled by intraparticulate diffusion, an early break-through occurs leading to a low bed adsorptioncapacity [27]. Moreover, an increase in the flow ratereduces the volume treated efficiently until break-through point and therefore decreases the service timeof the bed. Thus, the contact time of DBTS with CCBwas very short at higher flow rate, causing a reductionin removal efficiency. The study of Ghorai and Pantshowed similar results, where the removal efficiencyof fluoride with activated alumina decreases as theflow rate increases [28].
Fig. 3. TGA of CCB.
Fig. 4. FTIR spectral of CCB (a) before and (b) afteradsorption of DBTS.
6 M.-C. Lu et al. / Desalination and Water Treatment
Dow
nloa
ded
by [
Cyb
elle
Ph.
D.]
at 0
0:20
14
Febr
uary
201
5
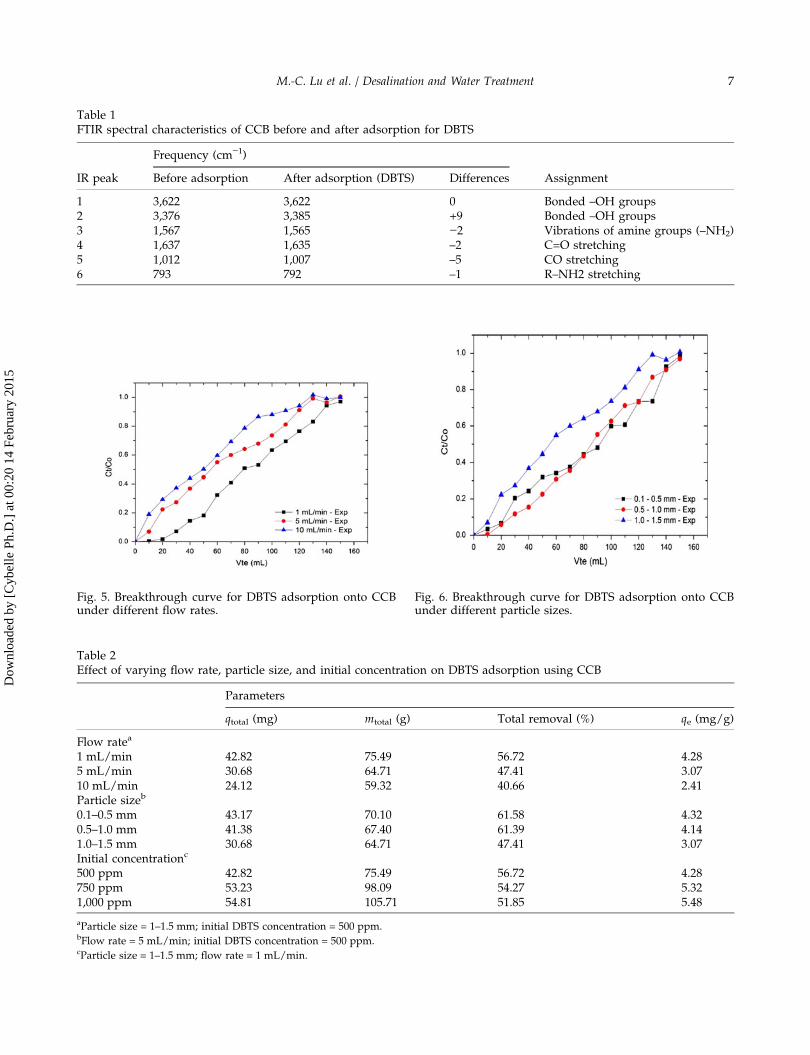
Table 1FTIR spectral characteristics of CCB before and after adsorption for DBTS
IR peak
Frequency (cm−1)
AssignmentBefore adsorption After adsorption (DBTS) Differences
1 3,622 3,622 0 Bonded –OH groups2 3,376 3,385 +9 Bonded –OH groups3 1,567 1,565 −2 Vibrations of amine groups (–NH2)4 1,637 1,635 –2 C=O stretching5 1,012 1,007 –5 CO stretching6 793 792 –1 R–NH2 stretching
Fig. 5. Breakthrough curve for DBTS adsorption onto CCBunder different flow rates.
Fig. 6. Breakthrough curve for DBTS adsorption onto CCBunder different particle sizes.
Table 2Effect of varying flow rate, particle size, and initial concentration on DBTS adsorption using CCB
Parameters
qtotal (mg) mtotal (g) Total removal (%) qe (mg/g)
Flow ratea
1 mL/min 42.82 75.49 56.72 4.285 mL/min 30.68 64.71 47.41 3.0710 mL/min 24.12 59.32 40.66 2.41Particle sizeb
0.1–0.5 mm 43.17 70.10 61.58 4.320.5–1.0 mm 41.38 67.40 61.39 4.141.0–1.5 mm 30.68 64.71 47.41 3.07Initial concentrationc
500 ppm 42.82 75.49 56.72 4.28750 ppm 53.23 98.09 54.27 5.321,000 ppm 54.81 105.71 51.85 5.48
aParticle size = 1–1.5 mm; initial DBTS concentration = 500 ppm.bFlow rate = 5 mL/min; initial DBTS concentration = 500 ppm.cParticle size = 1–1.5 mm; flow rate = 1 mL/min.
M.-C. Lu et al. / Desalination and Water Treatment 7
Dow
nloa
ded
by [
Cyb
elle
Ph.
D.]
at 0
0:20
14
Febr
uary
201
5

3.5. Effect of particle size
DBTS adsorption in fixed-bed column system wastested under varying particle sizes (0.1–1.5 mm) whereinfluent concentration of 500 ppm and flow rate of5 mL/min was kept constant. In Fig. 6, the break-through curves obtained at different particle sizes,0.10–0.50, 0.50–1.00, and 1.00–1.50 mm, were illus-trated. When the particle size was increased from 0.1to 1 mm, an increase in the slope from the point ofbreakthrough up to point of exhaustion was observed.The reason for this is that smaller particles will have ashorter diffusion path, thus allowing the adsorbate topenetrate deeper into the adsorbent particle morequickly. This phenomenon results in a higher rate ofadsorption for 0.1 mm particle size. In addition,
smaller particles have larger total external surface areaper unit volume that permits sufficient amount ofDBTS to be adsorbed onto CCB.
In Table 2, a decrease in the particle size rangefrom 1.00–1.50 to 0.10–0.5 mm results in a significantincrease in DBTS adsorbed, total removal, and adsorp-tion capacity. The increase in treated capacity as theparticle size decreases is probably due to a higheroverall rate of diffusion resulting from the availabilityof greater interfacial area and adsorbent dosage [29]. Itis expected that the smaller diameter will have ahigher adsorption capacity because of greater outersurface area per unit volume. However, it has beenreported that small particle sizes are to be avoided asit results in high-flow resistance of the column [30].
3.6. Effect of initial concentration
Initial DBTS concentrations of 500, 750, and1,000 mg/L were studied while the flow rate of 1 mL/minand particle size of 1 mm were kept constant. In contrastto the previous parameters, the column performed well athighest concentration in terms of adsorption capacity. Anincrease of the initial concentration significantly affectsthe shape of breakthrough curve (Fig. 7). The DBTSbreakthrough curves was observed to become steeper at1,000 ppm.
Higher initial DBTS concentration results to a fas-ter breakthrough as expected. The driving force forbiosorption was the concentration difference betweenDBTS concentration on adsorbent and in solution [20].Thus, a higher driving force caused by high DBTSconcentration resulted in better column performance.
Fig. 7. Breakthrough curve for DBTS adsorption onto CCBat different initial concentrations.
Table 3Column parameters at different flow rates, particle sizes, and initial concentrations obtained through Thomas model
Correlation coefficient, R2 kTH (mL/min mg) Qe (mg/g)
Flow ratea
1 mL/min 0.945 0.090 4.7005 mL/min 0.912 0.386 3.52010 mL/min 0.937 0.890 2.550Particle sizeb
0.1–0.5 mm 0.918 0.430 4.6900.5–1.0 mm 0.943 0.360 4.3901.0–1.5 mm 0.912 0.386 3.520Initial concentrationc
500 ppm 0.945 0.090 4.700750 ppm 0.947 0.075 5.6501,000 ppm 0.946 0.060 6.070
aParticle size = 1–1.5 mm; initial DBTS concentration = 500 ppm.bFlow rate = 5 mL/min; initial DBTS concentration = 500 ppm.cParticle size = 1–1.5 mm; flow rate = 1 mL/min.
8 M.-C. Lu et al. / Desalination and Water Treatment
Dow
nloa
ded
by [
Cyb
elle
Ph.
D.]
at 0
0:20
14
Febr
uary
201
5
In Table 2, the initial DBTS concentration wasincreased from 500 to 1,000 ppm causes a correspond-ing increase in adsorption bed capacity from 4.28 to5.48 mg/g. A decrease in influent concentration causesthe slow transport of DBTS due to the decreased diffu-sion coefficient and decreased mass transfer drivingforce [31]. At 1,000 ppm, the adsorbent bed wasobserved to be saturated quickly that caused decreasein total DBTS removal and earlier breakthrough andexhaustion time. Moreover, the maximum removalobtained for 500, 750, and 1,000 ppm were 56.72,54.27, and 51.85% respectively.
3.7. Breakthrough curve model
In Table 3, the correlation coefficient values andThomas constants (kTH and Qe) for DBTS are shown.The obtained values for correlation coefficient rangesfrom 0.912 to 0.945.
In Table 3, the kTH value slightly decreases withincreasing initial concentration due to the increase indriving force that facilitates the mass transfer insolution. In addition, the adsorption bed capacityvalues fairly increase as the inlet DBTS concentrationincreases. These results were in correlation with thoseobserved from the experimental breakthrough curves.The predicted Qe values for DBTS were observed todecrease with increasing flow rate. The kTH values, onthe other hand, increase with increasing flow rate dueto decrease in the mass transport resistance. Values ofthe predicted Qe obtained from the Thomas model were4.70, 3.52, and 2.55 mg/g for 1, 5 and 10 mL/min,respectively. The sorption data showed that thepredicted Qe value decreases with increasing particlesize of CCB. However, increasing the particle size doesnot affect kTH value for DBTS.
The plot between experimental data and theoreticalpoints under all experimental conditions is illustratedin Fig. 8. The results indicate that there is a goodagreement between the experimental and thepredicted bed capacities at all tested experimentalparameters.
3.8. Mechanism of adsorption
The adsorption of DBTS onto the CCB was investi-gated in order to get some insight into the nature ofthe mechanism of adsorbent–adsorbate interaction.Due to the polar nature of DBTS, it can be easilyadsorbed compared to dibenzothiophene. Conse-quently, FTIR technique is utilized in order to deter-mine the interaction between an adsorbate and theactive groups on the surface of adsorbent [32]. Based
on FTIR analysis, hydroxyl was the main functionalgroup involved in DBTS adsorption onto the adsor-bent. The oxygen atom present in the oxidized sul-phur compound makes a bond with the hydrogenmolecules of the hydroxyl group.
Fig. 8. Experimental and predicted breakthrough curve forDBTS under different (a) flow rates (b) particle sizes, and(c) initial concentrations.
M.-C. Lu et al. / Desalination and Water Treatment 9
Dow
nloa
ded
by [
Cyb
elle
Ph.
D.]
at 0
0:20
14
Febr
uary
201
5
Moreover, isotherm studies conducted by Lu et al.illustrate that DBTS follows the Langmuir isothermwhich indicates that DBTS would only bind to onetype of functional group present in CCB [18]. This fur-ther validates the results of FTIR analysis, wherehydroxyl (–OH) groups are the functional groups inCCB that adsorb DBTS.
The adsorption kinetics follows the pseudo-second-order rate model for DBTS involving valency forcesthrough sharing or exchange of electrons between sor-bent and sorbate [33]. This suggests the main mecha-nism of adsorption was chemisorption that involvesthe formation of strong chemical bonds betweenadsorbent and DBTS.
4. Conclusion
In this study, the removal of DBTS from fuel usingCCB was investigated. The FTIR spectra showed thatbonded –OH groups serve as binding sites for theadsorption of DBTS onto CCB. Result showed that flowrate, influent concentration, and particle size affects theshape of the breakthrough curve. Maximum DBTSadsorption capacity of 4.32 DBTS/g CCB was achievedusing 0.1–0.5 mm (particle size) and 5 mL/min(flow rate). The Thomas model adequately describedthe adsorption of DBTS onto CCB by fixed-bed columnsystem. Thus, this effective biosorbent could be appliedto novel desulfurization technology (UAOD process) toobtain the ultra-low sulfur oil.
Acknowledgments
The authors would like to gratefully acknowledgethe National Science Council of Taiwan (Contract No.NSC 101-2221-E-041-010-MY3) and the EngineeringResearch and Development for Technology for finan-cially supporting this research.
References
[1] T.O. Sachdeva, K.K. Pant, Deep desulfurization of die-sel via peroxide oxidation using phosphotungstic acidas phase transfer catalyst, Fuel Process. Technol. 91(2010) 1133–1138.
[2] H. Lu, C. Deng, W. Ren, X. Yang, Oxidative desulfur-ization of model diesel using [(C4H9)4N]6Mo7O24 asa catalyst in ionic liquids, Fuel Process. Technol. 119(19) (2014) 87–91.
[3] H. Mei, B.W. Mei, T.F. Yen, A new method for obtain-ing ultra-low sulfur diesel fuel via ultrasound assistedoxidative desulfurization, Fuel 82 (2003) 405–414.
[4] M.W. Wan, T.F. Yen, Enhance efficiency of tetraocty-lammonium fluoride applied to ultrasound-assistedoxidative desulfurization (UAOD) process, Appl.Catal., A 319 (2007) 237–245.
[5] O. Etemadi, T.F. Yen, Aspects of selective adsorptionamong oxidized sulfur compounds in fossil fuels,Energy Fuels 21 (2007) 1622–1627.
[6] P.K. Dutta, J. Dutta, V.S. Tripathi, Chitin and chitosan:Chemistry, properties and applications, J. Sci. Ind. Res.63 (2004) 20–31.
[7] M. Rinaudo, Chitin and chitosan: Properties and appli-cations, Prog. Polym. Sci. 31 (2006) 603–632.
[8] G. Crini, Non-conventional low-cost adsorbents fordye removal: A review, Bioresour. Technol. 97 (2006)1061–1085.
[9] M.Y. Chang, R.S. Juang, Adsorption of tannic acid,humic acid, and dyes from water using the compositeof chitosan and activated clay, J. Colloid Interface Sci.278 (2004) 18–25.
[10] S.R. Popuri, Y. Vijaya, V.M. Boddu, K. Abburi,Adsorptive removal of copper and nickel ions fromwater using chitosan coated PVC beads, Bioresour.Technol. 100 (2009) 194–199.
[11] E. Guibal, Interactions of metal ions with chitosanbased sorbents: A review, Sep. Purif. Technol. 38(2004) 43–74.
[12] C.M. Futalan, C.C. Kan, M.L. Dalida, C. Pascua,M.W. Wan, Fixed-bed column studies on the removalof copper using chitosan immobilized on bentonite,Carbohydr. Polym. 83 (2011) 697–704.
[13] L. Wang, A. Wang, Adsorption behaviors of Congored on the N O-carboxymethyl-chitosan/montmoril-lonite nanocomposite, Chem. Eng. J. 143 (2008) 43–50.
[14] M.L.P. Dalida, A.F.P. Mariano, C.M. Futalan,C.C. Kan, W.C. Tsai, M.W. Wan, Adsorptive removal ofCu(II) from aqueous solutions using non-crosslinkedand crosslinked chitosan-coated bentonite beads,Desalination 275 (2011) 154–159.
[15] C.M. Futalan, C.C. Kan, M.L. Dalida, K.J. Hsien, C.Pascua, M.W. Wan, Comparative and competitiveadsorption of copper, lead and nickel using chitosanimmobilized on bentonite, Carbohydr. Polym. 83(2011) 528–536.
[16] J. Aburto, A. Mendez-Orozco, S. Borgne, Hydrogels asadsorbents of organosulphur compounds currentlyfound in diesel, Chem. Eng. Process. 43 (2004)1587–1595.
[17] J. Aburto, S. Le Borgne, Selective adsorption of diben-zothiophene sulfone by an imprinted and stimuli-responsive chitosan hydrogel, Macromolecules 37(2004) 2938–2943.
[18] M.C. Lu, M.L. Agripa, M.W. Wan, M.L.P. Dalida,Removal of oxidized sulfur compounds using differ-ent types of activated carbon, aluminum oxide, andchitosan-coated bentonite, Desalin. Water Treat. 52(2014) 873–879.
[19] P. Suksabye, P. Thiravetyan, W. Nakbanpote, Columnstudy of chromium (VI) adsorption from electroplat-ing industry by coconut coir pith, J. Hazard. Mater.160 (2008) 56–62.
[20] Z. Aksu, F. Gonen, Biosorption of phenol by immobi-lized activated sludge in a continuous packed bed:Prediction of breakthrough curves, Process Biochem.39 (2004) 599–613.
[21] Y. Fu, T. Viraraghavan, Column studies for biosorp-tion of dyes from aqueous solutions on immobilisedAspergillus niger fungal biomass, Water SA 29 (2003)465–472.
10 M.-C. Lu et al. / Desalination and Water Treatment
Dow
nloa
ded
by [
Cyb
elle
Ph.
D.]
at 0
0:20
14
Febr
uary
201
5
[22] A. Kamari, W.S. Ngah, Isotherm, kinetic, and thermo-dynamic studies of lead and copper uptake of H2SO4
modified chitosan, Colloids Surf., B 73 (2009) 257–266.[23] T.S. Anirudhan, S. Rijith, Glutaraldehyde cross-linked
epoxymated chitosan as an adsorbent for the removaland recovery for copper (II) from aqueous media,Colloids Surf., A 351 (2009) 52–59.
[24] G.V. Joshi, B.D. Kevadiya, H.A. Patel, H.C. Bajaj, R.V.Jasra, Montmorillonite as a drug delivery system:Intercalation and in vitro release of timolol maleate,Int. J. Pharm. 374 (2009) 53–57.
[25] C. Paluszkiewicz, E. Stodolak, M. Hasik, M. Blazewicz,FT-IR study of montmorillonite-chitosan nanocompos-ite materials, Spectrochim. Acta, Part A 79 (2011)784–788.
[26] M.L. Duarte, M.C. Ferreira, M.R. Marvao, J. Rocha, Anoptimised method to determine the degree of acetyla-tion of chitin and chitosan by FTIR spectroscopy, Int.J. Biol. Macromol. 31 (2002) 1–8.
[27] V.C. Taty-Costodes, H. Fauduet, C. Porte, Y.S. Ho,Removal of lead (II) ions from synthetic and real efflu-ents using immobilized Pinus sylvestris sawdust:
Adsorption on a fixed bed column, J. Hazard. Mater.123 (2005) 135–144.
[28] S. Ghorai, K.K. Pant, Equilibrium, kinetics and break-through studies for adsorption of fluoride on activatedalumina, Sep. Purif. Technol. 42 (2005) 265–271.
[29] M.J. Rivero, R. Ibanez, M.I. Ortiz, Mathematical mod-elling of styrene drying by adsorption onto activatedalumina, Chem. Eng. Sci. 57 (2002) 2589–2592.
[30] V.J. Inglezakis, H. Grigoropoulou, Effects of operatingconditions on the removal of heavy metals by zeolite infixed bed reactors, J. Hazard. Mater. 112 (2004) 37–43.
[31] T.V.N. Padmesh, K. Vijayaraghavan, G. Sekaran, M.Velan, Batch and column studies on biosorption ofacid dyes on fresh water macro alga Azolla filiculo-ides, J. Hazard. Mater. 125 (2005) 121–129.
[32] P. Monash, G. Pugazhenthi, Adsorption of crystal vio-let dye from aqueous solution using mesoporousmaterials synthesized at room temperature, Adsorp-tion 15 (2009) 390–405.
[33] Y. Sag, Y. Aktay, Kinetic studies on sorption of Cr(VI)and Cu(II) ions by chitin, chitosan and Rhizopusarrhizus, Biochem. Eng. J. 12 (2002) 143–153.
M.-C. Lu et al. / Desalination and Water Treatment 11
Dow
nloa
ded
by [
Cyb
elle
Ph.
D.]
at 0
0:20
14
Febr
uary
201
5
Copyright © 2022 FDOKUMEN