Adipogenic Capacity and the Susceptibility to Type 2 Diabetes and Metabolic Syndrome
6
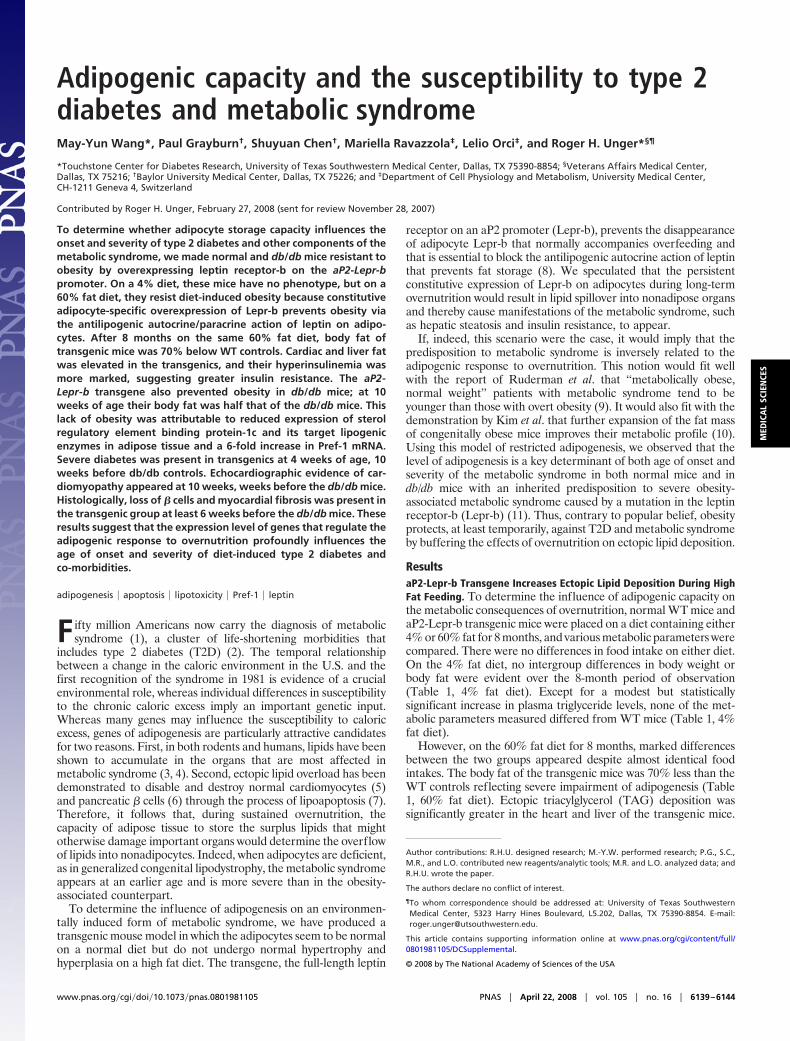
Adipogenic capacity and the susceptibility to type 2 diabetes and metabolic syndrome May-Yun Wang*, Paul Grayburn † , Shuyuan Chen † , Mariella Ravazzola ‡ , Lelio Orci ‡ , and Roger H. Unger* §¶ *Touchstone Center for Diabetes Research, University of Texas Southwestern Medical Center, Dallas, TX 75390-8854; § Veterans Affairs Medical Center, Dallas, TX 75216; † Baylor University Medical Center, Dallas, TX 75226; and ‡ Department of Cell Physiology and Metabolism, University Medical Center, CH-1211 Geneva 4, Switzerland Contributed by Roger H. Unger, February 27, 2008 (sent for review November 28, 2007) To determine whether adipocyte storage capacity influences the onset and severity of type 2 diabetes and other components of the metabolic syndrome, we made normal and db/db mice resistant to obesity by overexpressing leptin receptor-b on the aP2-Lepr-b promoter. On a 4% diet, these mice have no phenotype, but on a 60% fat diet, they resist diet-induced obesity because constitutive adipocyte-specific overexpression of Lepr-b prevents obesity via the antilipogenic autocrine/paracrine action of leptin on adipo- cytes. After 8 months on the same 60% fat diet, body fat of transgenic mice was 70% below WT controls. Cardiac and liver fat was elevated in the transgenics, and their hyperinsulinemia was more marked, suggesting greater insulin resistance. The aP2- Lepr-b transgene also prevented obesity in db/db mice; at 10 weeks of age their body fat was half that of the db/db mice. This lack of obesity was attributable to reduced expression of sterol regulatory element binding protein-1c and its target lipogenic enzymes in adipose tissue and a 6-fold increase in Pref-1 mRNA. Severe diabetes was present in transgenics at 4 weeks of age, 10 weeks before db/db controls. Echocardiographic evidence of car- diomyopathy appeared at 10 weeks, weeks before the db/db mice. Histologically, loss of cells and myocardial fibrosis was present in the transgenic group at least 6 weeks before the db/db mice. These results suggest that the expression level of genes that regulate the adipogenic response to overnutrition profoundly influences the age of onset and severity of diet-induced type 2 diabetes and co-morbidities. adipogenesis apoptosis lipotoxicity Pref-1 leptin F ifty million Americans now carry the diagnosis of metabolic syndrome (1), a cluster of life-shortening morbidities that includes type 2 diabetes (T2D) (2). The temporal relationship between a change in the caloric environment in the U.S. and the first recognition of the syndrome in 1981 is evidence of a crucial environmental role, whereas individual differences in susceptibility to the chronic caloric excess imply an important genetic input. Whereas many genes may influence the susceptibility to caloric excess, genes of adipogenesis are particularly attractive candidates for two reasons. First, in both rodents and humans, lipids have been shown to accumulate in the organs that are most affected in metabolic syndrome (3, 4). Second, ectopic lipid overload has been demonstrated to disable and destroy normal cardiomyocytes (5) and pancreatic cells (6) through the process of lipoapoptosis (7). Therefore, it follows that, during sustained overnutrition, the capacity of adipose tissue to store the surplus lipids that might otherwise damage important organs would determine the overf low of lipids into nonadipocytes. Indeed, when adipocytes are deficient, as in generalized congenital lipodystrophy, the metabolic syndrome appears at an earlier age and is more severe than in the obesity- associated counterpart. To determine the influence of adipogenesis on an environmen- tally induced form of metabolic syndrome, we have produced a transgenic mouse model in which the adipocytes seem to be normal on a normal diet but do not undergo normal hypertrophy and hyperplasia on a high fat diet. The transgene, the full-length leptin receptor on an aP2 promoter (Lepr-b), prevents the disappearance of adipocyte Lepr-b that normally accompanies overfeeding and that is essential to block the antilipogenic autocrine action of leptin that prevents fat storage (8). We speculated that the persistent constitutive expression of Lepr-b on adipocytes during long-term overnutrition would result in lipid spillover into nonadipose organs and thereby cause manifestations of the metabolic syndrome, such as hepatic steatosis and insulin resistance, to appear. If, indeed, this scenario were the case, it would imply that the predisposition to metabolic syndrome is inversely related to the adipogenic response to overnutrition. This notion would fit well with the report of Ruderman et al. that ‘‘metabolically obese, normal weight’’ patients with metabolic syndrome tend to be younger than those with overt obesity (9). It would also fit with the demonstration by Kim et al. that further expansion of the fat mass of congenitally obese mice improves their metabolic profile (10). Using this model of restricted adipogenesis, we observed that the level of adipogenesis is a key determinant of both age of onset and severity of the metabolic syndrome in both normal mice and in db/db mice with an inherited predisposition to severe obesity- associated metabolic syndrome caused by a mutation in the leptin receptor-b (Lepr-b) (11). Thus, contrary to popular belief, obesity protects, at least temporarily, against T2D and metabolic syndrome by buffering the effects of overnutrition on ectopic lipid deposition. Results aP2-Lepr-b Transgene Increases Ectopic Lipid Deposition During High Fat Feeding. To determine the influence of adipogenic capacity on the metabolic consequences of overnutrition, normal WT mice and aP2-Lepr-b transgenic mice were placed on a diet containing either 4% or 60% fat for 8 months, and various metabolic parameters were compared. There were no differences in food intake on either diet. On the 4% fat diet, no intergroup differences in body weight or body fat were evident over the 8-month period of observation (Table 1, 4% fat diet). Except for a modest but statistically significant increase in plasma triglyceride levels, none of the met- abolic parameters measured differed from WT mice (Table 1, 4% fat diet). However, on the 60% fat diet for 8 months, marked differences between the two groups appeared despite almost identical food intakes. The body fat of the transgenic mice was 70% less than the WT controls reflecting severe impairment of adipogenesis (Table 1, 60% fat diet). Ectopic triacylglycerol (TAG) deposition was significantly greater in the heart and liver of the transgenic mice. Author contributions: R.H.U. designed research; M.-Y.W. performed research; P.G., S.C., M.R., and L.O. contributed new reagents/analytic tools; M.R. and L.O. analyzed data; and R.H.U. wrote the paper. The authors declare no conflict of interest. ¶ To whom correspondence should be addressed at: University of Texas Southwestern Medical Center, 5323 Harry Hines Boulevard, L5.202, Dallas, TX 75390-8854. E-mail: [email protected]. This article contains supporting information online at www.pnas.org/cgi/content/full/ 0801981105/DCSupplemental. © 2008 by The National Academy of Sciences of the USA www.pnas.orgcgidoi10.1073pnas.0801981105 PNAS April 22, 2008 vol. 105 no. 16 6139 – 6144 MEDICAL SCIENCES
-
Upload
independent -
Category
Documents
-
view
4 -
download
0
Transcript of Adipogenic Capacity and the Susceptibility to Type 2 Diabetes and Metabolic Syndrome
Adipogenic capacity and the susceptibility to type 2diabetes and metabolic syndromeMay-Yun Wang*, Paul Grayburn†, Shuyuan Chen†, Mariella Ravazzola‡, Lelio Orci‡, and Roger H. Unger*§¶
*Touchstone Center for Diabetes Research, University of Texas Southwestern Medical Center, Dallas, TX 75390-8854; §Veterans Affairs Medical Center,Dallas, TX 75216; †Baylor University Medical Center, Dallas, TX 75226; and ‡Department of Cell Physiology and Metabolism, University Medical Center,CH-1211 Geneva 4, Switzerland
Contributed by Roger H. Unger, February 27, 2008 (sent for review November 28, 2007)
To determine whether adipocyte storage capacity influences theonset and severity of type 2 diabetes and other components of themetabolic syndrome, we made normal and db/db mice resistant toobesity by overexpressing leptin receptor-b on the aP2-Lepr-bpromoter. On a 4% diet, these mice have no phenotype, but on a60% fat diet, they resist diet-induced obesity because constitutiveadipocyte-specific overexpression of Lepr-b prevents obesity viathe antilipogenic autocrine/paracrine action of leptin on adipo-cytes. After 8 months on the same 60% fat diet, body fat oftransgenic mice was 70% below WT controls. Cardiac and liver fatwas elevated in the transgenics, and their hyperinsulinemia wasmore marked, suggesting greater insulin resistance. The aP2-Lepr-b transgene also prevented obesity in db/db mice; at 10weeks of age their body fat was half that of the db/db mice. Thislack of obesity was attributable to reduced expression of sterolregulatory element binding protein-1c and its target lipogenicenzymes in adipose tissue and a 6-fold increase in Pref-1 mRNA.Severe diabetes was present in transgenics at 4 weeks of age, 10weeks before db/db controls. Echocardiographic evidence of car-diomyopathy appeared at 10 weeks, weeks before the db/db mice.Histologically, loss of � cells and myocardial fibrosis was present inthe transgenic group at least 6 weeks before the db/db mice. Theseresults suggest that the expression level of genes that regulate theadipogenic response to overnutrition profoundly influences theage of onset and severity of diet-induced type 2 diabetes andco-morbidities.
adipogenesis � apoptosis � lipotoxicity � Pref-1 � leptin
F ifty million Americans now carry the diagnosis of metabolicsyndrome (1), a cluster of life-shortening morbidities that
includes type 2 diabetes (T2D) (2). The temporal relationshipbetween a change in the caloric environment in the U.S. and thefirst recognition of the syndrome in 1981 is evidence of a crucialenvironmental role, whereas individual differences in susceptibilityto the chronic caloric excess imply an important genetic input.Whereas many genes may influence the susceptibility to caloricexcess, genes of adipogenesis are particularly attractive candidatesfor two reasons. First, in both rodents and humans, lipids have beenshown to accumulate in the organs that are most affected inmetabolic syndrome (3, 4). Second, ectopic lipid overload has beendemonstrated to disable and destroy normal cardiomyocytes (5)and pancreatic � cells (6) through the process of lipoapoptosis (7).Therefore, it follows that, during sustained overnutrition, thecapacity of adipose tissue to store the surplus lipids that mightotherwise damage important organs would determine the overflowof lipids into nonadipocytes. Indeed, when adipocytes are deficient,as in generalized congenital lipodystrophy, the metabolic syndromeappears at an earlier age and is more severe than in the obesity-associated counterpart.
To determine the influence of adipogenesis on an environmen-tally induced form of metabolic syndrome, we have produced atransgenic mouse model in which the adipocytes seem to be normalon a normal diet but do not undergo normal hypertrophy andhyperplasia on a high fat diet. The transgene, the full-length leptin
receptor on an aP2 promoter (Lepr-b), prevents the disappearanceof adipocyte Lepr-b that normally accompanies overfeeding andthat is essential to block the antilipogenic autocrine action of leptinthat prevents fat storage (8). We speculated that the persistentconstitutive expression of Lepr-b on adipocytes during long-termovernutrition would result in lipid spillover into nonadipose organsand thereby cause manifestations of the metabolic syndrome, suchas hepatic steatosis and insulin resistance, to appear.
If, indeed, this scenario were the case, it would imply that thepredisposition to metabolic syndrome is inversely related to theadipogenic response to overnutrition. This notion would fit wellwith the report of Ruderman et al. that ‘‘metabolically obese,normal weight’’ patients with metabolic syndrome tend to beyounger than those with overt obesity (9). It would also fit with thedemonstration by Kim et al. that further expansion of the fat massof congenitally obese mice improves their metabolic profile (10).Using this model of restricted adipogenesis, we observed that thelevel of adipogenesis is a key determinant of both age of onset andseverity of the metabolic syndrome in both normal mice and indb/db mice with an inherited predisposition to severe obesity-associated metabolic syndrome caused by a mutation in the leptinreceptor-b (Lepr-b) (11). Thus, contrary to popular belief, obesityprotects, at least temporarily, against T2D and metabolic syndromeby buffering the effects of overnutrition on ectopic lipid deposition.
ResultsaP2-Lepr-b Transgene Increases Ectopic Lipid Deposition During HighFat Feeding. To determine the influence of adipogenic capacity onthe metabolic consequences of overnutrition, normal WT mice andaP2-Lepr-b transgenic mice were placed on a diet containing either4% or 60% fat for 8 months, and various metabolic parameters werecompared. There were no differences in food intake on either diet.On the 4% fat diet, no intergroup differences in body weight orbody fat were evident over the 8-month period of observation(Table 1, 4% fat diet). Except for a modest but statisticallysignificant increase in plasma triglyceride levels, none of the met-abolic parameters measured differed from WT mice (Table 1, 4%fat diet).
However, on the 60% fat diet for 8 months, marked differencesbetween the two groups appeared despite almost identical foodintakes. The body fat of the transgenic mice was 70% less than theWT controls reflecting severe impairment of adipogenesis (Table1, 60% fat diet). Ectopic triacylglycerol (TAG) deposition wassignificantly greater in the heart and liver of the transgenic mice.
Author contributions: R.H.U. designed research; M.-Y.W. performed research; P.G., S.C.,M.R., and L.O. contributed new reagents/analytic tools; M.R. and L.O. analyzed data; andR.H.U. wrote the paper.
The authors declare no conflict of interest.
¶To whom correspondence should be addressed at: University of Texas SouthwesternMedical Center, 5323 Harry Hines Boulevard, L5.202, Dallas, TX 75390-8854. E-mail:[email protected].
This article contains supporting information online at www.pnas.org/cgi/content/full/0801981105/DCSupplemental.
© 2008 by The National Academy of Sciences of the USA
www.pnas.org�cgi�doi�10.1073�pnas.0801981105 PNAS � April 22, 2008 � vol. 105 � no. 16 � 6139–6144
MED
ICA
LSC
IEN
CES
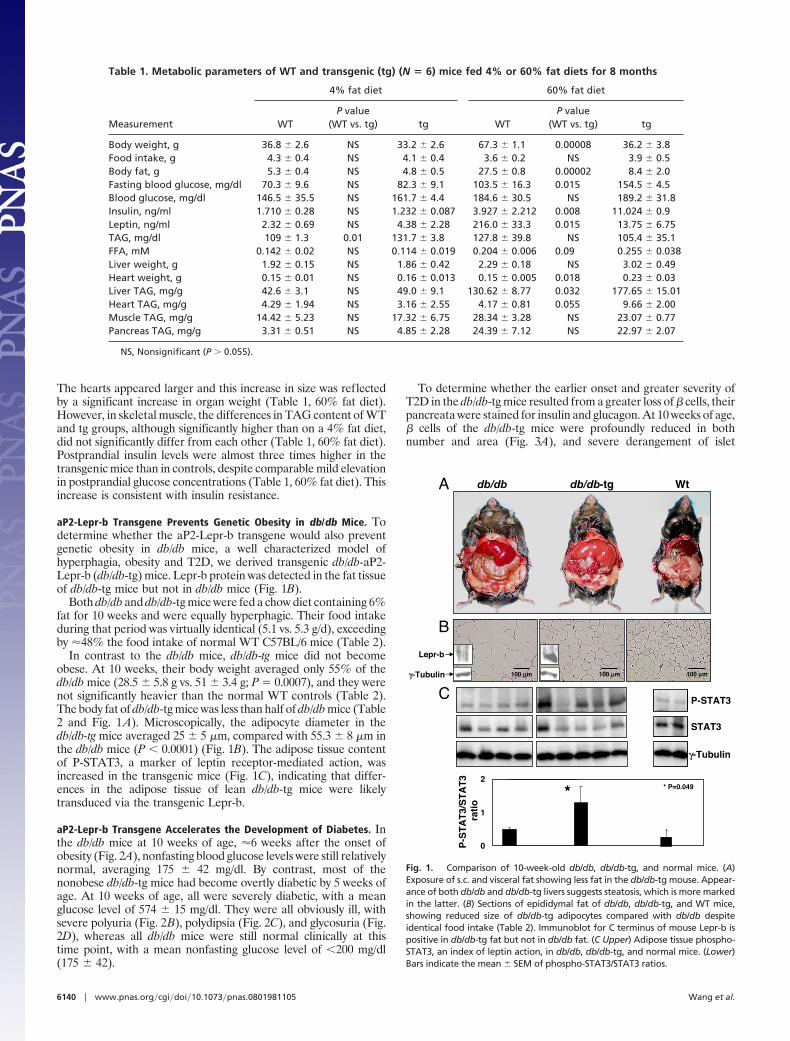
The hearts appeared larger and this increase in size was reflectedby a significant increase in organ weight (Table 1, 60% fat diet).However, in skeletal muscle, the differences in TAG content of WTand tg groups, although significantly higher than on a 4% fat diet,did not significantly differ from each other (Table 1, 60% fat diet).Postprandial insulin levels were almost three times higher in thetransgenic mice than in controls, despite comparable mild elevationin postprandial glucose concentrations (Table 1, 60% fat diet). Thisincrease is consistent with insulin resistance.
aP2-Lepr-b Transgene Prevents Genetic Obesity in db/db Mice. Todetermine whether the aP2-Lepr-b transgene would also preventgenetic obesity in db/db mice, a well characterized model ofhyperphagia, obesity and T2D, we derived transgenic db/db-aP2-Lepr-b (db/db-tg) mice. Lepr-b protein was detected in the fat tissueof db/db-tg mice but not in db/db mice (Fig. 1B).
Both db/db and db/db-tg mice were fed a chow diet containing 6%fat for 10 weeks and were equally hyperphagic. Their food intakeduring that period was virtually identical (5.1 vs. 5.3 g/d), exceedingby �48% the food intake of normal WT C57BL/6 mice (Table 2).
In contrast to the db/db mice, db/db-tg mice did not becomeobese. At 10 weeks, their body weight averaged only 55% of thedb/db mice (28.5 � 5.8 g vs. 51 � 3.4 g; P � 0.0007), and they werenot significantly heavier than the normal WT controls (Table 2).The body fat of db/db-tg mice was less than half of db/db mice (Table2 and Fig. 1A). Microscopically, the adipocyte diameter in thedb/db-tg mice averaged 25 � 5 �m, compared with 55.3 � 8 �m inthe db/db mice (P � 0.0001) (Fig. 1B). The adipose tissue contentof P-STAT3, a marker of leptin receptor-mediated action, wasincreased in the transgenic mice (Fig. 1C), indicating that differ-ences in the adipose tissue of lean db/db-tg mice were likelytransduced via the transgenic Lepr-b.
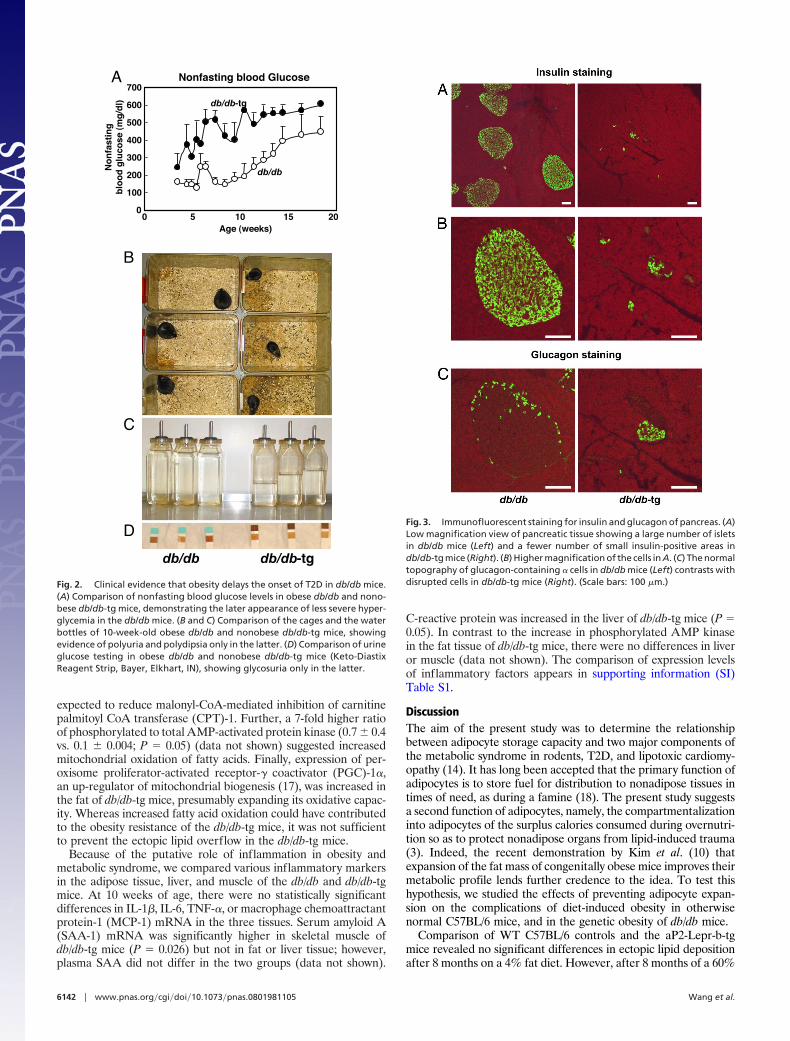
aP2-Lepr-b Transgene Accelerates the Development of Diabetes. Inthe db/db mice at 10 weeks of age, �6 weeks after the onset ofobesity (Fig. 2A), nonfasting blood glucose levels were still relativelynormal, averaging 175 � 42 mg/dl. By contrast, most of thenonobese db/db-tg mice had become overtly diabetic by 5 weeks ofage. At 10 weeks of age, all were severely diabetic, with a meanglucose level of 574 � 15 mg/dl. They were all obviously ill, withsevere polyuria (Fig. 2B), polydipsia (Fig. 2C), and glycosuria (Fig.2D), whereas all db/db mice were still normal clinically at thistime point, with a mean nonfasting glucose level of �200 mg/dl(175 � 42).
To determine whether the earlier onset and greater severity ofT2D in the db/db-tg mice resulted from a greater loss of � cells, theirpancreata were stained for insulin and glucagon. At 10 weeks of age,� cells of the db/db-tg mice were profoundly reduced in bothnumber and area (Fig. 3A), and severe derangement of islet
Table 1. Metabolic parameters of WT and transgenic (tg) (N � 6) mice fed 4% or 60% fat diets for 8 months
Measurement
4% fat diet 60% fat diet
WTP value
(WT vs. tg) tg WTP value
(WT vs. tg) tg
Body weight, g 36.8 � 2.6 NS 33.2 � 2.6 67.3 � 1.1 0.00008 36.2 � 3.8Food intake, g 4.3 � 0.4 NS 4.1 � 0.4 3.6 � 0.2 NS 3.9 � 0.5Body fat, g 5.3 � 0.4 NS 4.8 � 0.5 27.5 � 0.8 0.00002 8.4 � 2.0Fasting blood glucose, mg/dl 70.3 � 9.6 NS 82.3 � 9.1 103.5 � 16.3 0.015 154.5 � 4.5Blood glucose, mg/dl 146.5 � 35.5 NS 161.7 � 4.4 184.6 � 30.5 NS 189.2 � 31.8Insulin, ng/ml 1.710 � 0.28 NS 1.232 � 0.087 3.927 � 2.212 0.008 11.024 � 0.9Leptin, ng/ml 2.32 � 0.69 NS 4.38 � 2.28 216.0 � 33.3 0.015 13.75 � 6.75TAG, mg/dl 109 � 1.3 0.01 131.7 � 3.8 127.8 � 39.8 NS 105.4 � 35.1FFA, mM 0.142 � 0.02 NS 0.114 � 0.019 0.204 � 0.006 0.09 0.255 � 0.038Liver weight, g 1.92 � 0.15 NS 1.86 � 0.42 2.29 � 0.18 NS 3.02 � 0.49Heart weight, g 0.15 � 0.01 NS 0.16 � 0.013 0.15 � 0.005 0.018 0.23 � 0.03Liver TAG, mg/g 42.6 � 3.1 NS 49.0 � 9.1 130.62 � 8.77 0.032 177.65 � 15.01Heart TAG, mg/g 4.29 � 1.94 NS 3.16 � 2.55 4.17 � 0.81 0.055 9.66 � 2.00Muscle TAG, mg/g 14.42 � 5.23 NS 17.32 � 6.75 28.34 � 3.28 NS 23.07 � 0.77Pancreas TAG, mg/g 3.31 � 0.51 NS 4.85 � 2.28 24.39 � 7.12 NS 22.97 � 2.07
NS, Nonsignificant (P � 0.055).
db/db db/db-tg WtA
B
C P-STAT3
STAT3
γ-Tubulin
3T
AT
S/3T
AT
S-P
oitar
0
1
2* P=0.049*
Lepr-b
γ-Tubulin 100 µm 100 µm 100 µm
Fig. 1. Comparison of 10-week-old db/db, db/db-tg, and normal mice. (A)Exposure of s.c. and visceral fat showing less fat in the db/db-tg mouse. Appear-ance of both db/db and db/db-tg livers suggests steatosis, which is more markedin the latter. (B) Sections of epididymal fat of db/db, db/db-tg, and WT mice,showing reduced size of db/db-tg adipocytes compared with db/db despiteidentical food intake (Table 2). Immunoblot for C terminus of mouse Lepr-b ispositive in db/db-tg fat but not in db/db fat. (C Upper) Adipose tissue phospho-STAT3, an index of leptin action, in db/db, db/db-tg, and normal mice. (Lower)Bars indicate the mean � SEM of phospho-STAT3/STAT3 ratios.
6140 � www.pnas.org�cgi�doi�10.1073�pnas.0801981105 Wang et al.
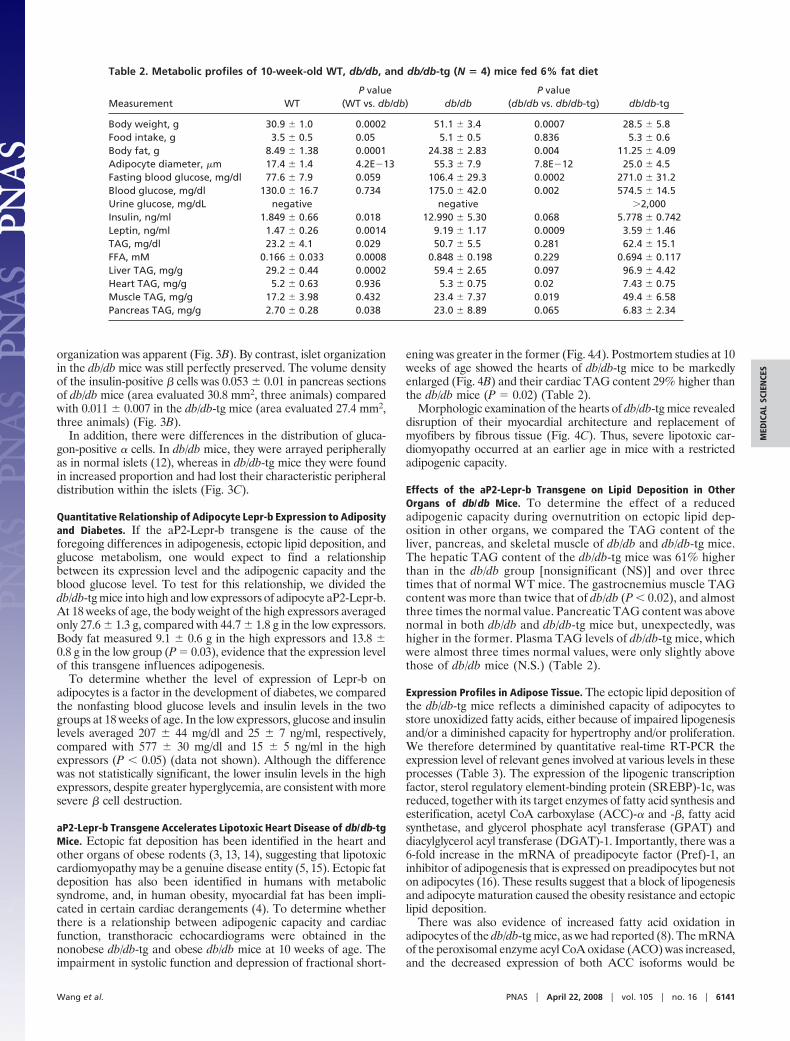
organization was apparent (Fig. 3B). By contrast, islet organizationin the db/db mice was still perfectly preserved. The volume densityof the insulin-positive � cells was 0.053 � 0.01 in pancreas sectionsof db/db mice (area evaluated 30.8 mm2, three animals) comparedwith 0.011 � 0.007 in the db/db-tg mice (area evaluated 27.4 mm2,three animals) (Fig. 3B).
In addition, there were differences in the distribution of gluca-gon-positive � cells. In db/db mice, they were arrayed peripherallyas in normal islets (12), whereas in db/db-tg mice they were foundin increased proportion and had lost their characteristic peripheraldistribution within the islets (Fig. 3C).
Quantitative Relationship of Adipocyte Lepr-b Expression to Adiposityand Diabetes. If the aP2-Lepr-b transgene is the cause of theforegoing differences in adipogenesis, ectopic lipid deposition, andglucose metabolism, one would expect to find a relationshipbetween its expression level and the adipogenic capacity and theblood glucose level. To test for this relationship, we divided thedb/db-tg mice into high and low expressors of adipocyte aP2-Lepr-b.At 18 weeks of age, the body weight of the high expressors averagedonly 27.6 � 1.3 g, compared with 44.7 � 1.8 g in the low expressors.Body fat measured 9.1 � 0.6 g in the high expressors and 13.8 �0.8 g in the low group (P � 0.03), evidence that the expression levelof this transgene influences adipogenesis.
To determine whether the level of expression of Lepr-b onadipocytes is a factor in the development of diabetes, we comparedthe nonfasting blood glucose levels and insulin levels in the twogroups at 18 weeks of age. In the low expressors, glucose and insulinlevels averaged 207 � 44 mg/dl and 25 � 7 ng/ml, respectively,compared with 577 � 30 mg/dl and 15 � 5 ng/ml in the highexpressors (P � 0.05) (data not shown). Although the differencewas not statistically significant, the lower insulin levels in the highexpressors, despite greater hyperglycemia, are consistent with moresevere � cell destruction.
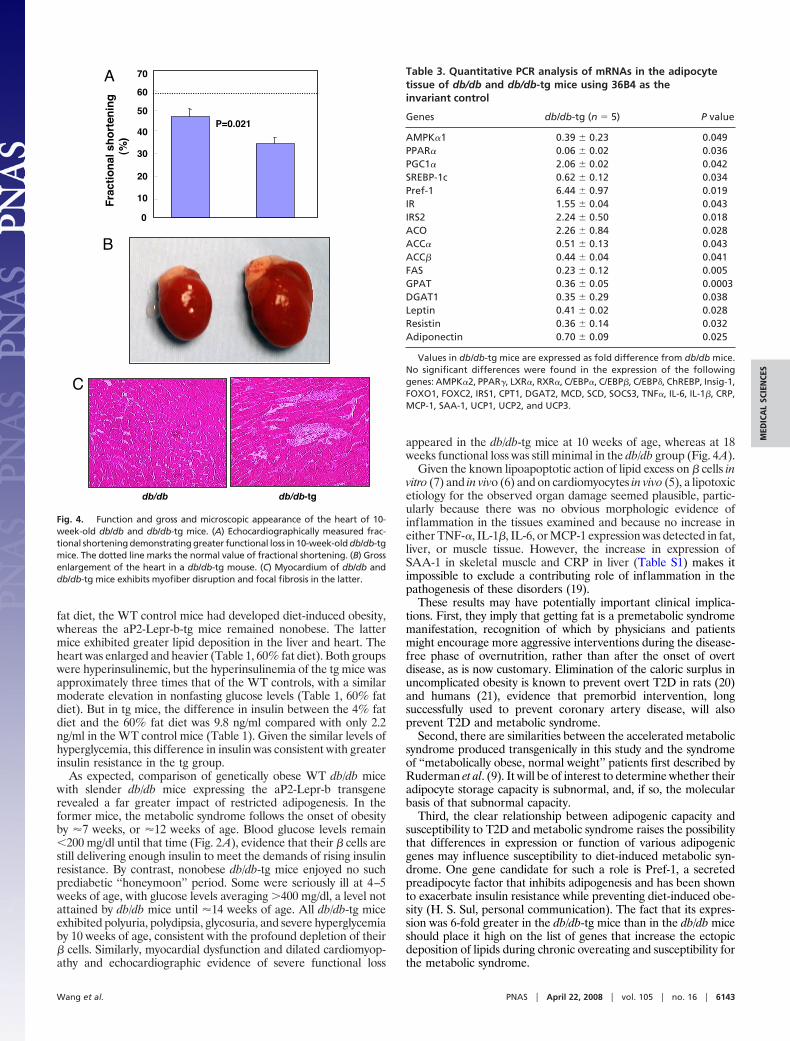
aP2-Lepr-b Transgene Accelerates Lipotoxic Heart Disease of db/db-tgMice. Ectopic fat deposition has been identified in the heart andother organs of obese rodents (3, 13, 14), suggesting that lipotoxiccardiomyopathy may be a genuine disease entity (5, 15). Ectopic fatdeposition has also been identified in humans with metabolicsyndrome, and, in human obesity, myocardial fat has been impli-cated in certain cardiac derangements (4). To determine whetherthere is a relationship between adipogenic capacity and cardiacfunction, transthoracic echocardiograms were obtained in thenonobese db/db-tg and obese db/db mice at 10 weeks of age. Theimpairment in systolic function and depression of fractional short-
ening was greater in the former (Fig. 4A). Postmortem studies at 10weeks of age showed the hearts of db/db-tg mice to be markedlyenlarged (Fig. 4B) and their cardiac TAG content 29% higher thanthe db/db mice (P � 0.02) (Table 2).
Morphologic examination of the hearts of db/db-tg mice revealeddisruption of their myocardial architecture and replacement ofmyofibers by fibrous tissue (Fig. 4C). Thus, severe lipotoxic car-diomyopathy occurred at an earlier age in mice with a restrictedadipogenic capacity.
Effects of the aP2-Lepr-b Transgene on Lipid Deposition in OtherOrgans of db/db Mice. To determine the effect of a reducedadipogenic capacity during overnutrition on ectopic lipid dep-osition in other organs, we compared the TAG content of theliver, pancreas, and skeletal muscle of db/db and db/db-tg mice.The hepatic TAG content of the db/db-tg mice was 61% higherthan in the db/db group [nonsignificant (NS)] and over threetimes that of normal WT mice. The gastrocnemius muscle TAGcontent was more than twice that of db/db (P � 0.02), and almostthree times the normal value. Pancreatic TAG content was abovenormal in both db/db and db/db-tg mice but, unexpectedly, washigher in the former. Plasma TAG levels of db/db-tg mice, whichwere almost three times normal values, were only slightly abovethose of db/db mice (N.S.) (Table 2).
Expression Profiles in Adipose Tissue. The ectopic lipid deposition ofthe db/db-tg mice reflects a diminished capacity of adipocytes tostore unoxidized fatty acids, either because of impaired lipogenesisand/or a diminished capacity for hypertrophy and/or proliferation.We therefore determined by quantitative real-time RT-PCR theexpression level of relevant genes involved at various levels in theseprocesses (Table 3). The expression of the lipogenic transcriptionfactor, sterol regulatory element-binding protein (SREBP)-1c, wasreduced, together with its target enzymes of fatty acid synthesis andesterification, acetyl CoA carboxylase (ACC)-� and -�, fatty acidsynthetase, and glycerol phosphate acyl transferase (GPAT) anddiacylglycerol acyl transferase (DGAT)-1. Importantly, there was a6-fold increase in the mRNA of preadipocyte factor (Pref)-1, aninhibitor of adipogenesis that is expressed on preadipocytes but noton adipocytes (16). These results suggest that a block of lipogenesisand adipocyte maturation caused the obesity resistance and ectopiclipid deposition.
There was also evidence of increased fatty acid oxidation inadipocytes of the db/db-tg mice, as we had reported (8). The mRNAof the peroxisomal enzyme acyl CoA oxidase (ACO) was increased,and the decreased expression of both ACC isoforms would be
Table 2. Metabolic profiles of 10-week-old WT, db/db, and db/db-tg (N � 4) mice fed 6% fat diet
Measurement WTP value
(WT vs. db/db) db/dbP value
(db/db vs. db/db-tg) db/db-tg
Body weight, g 30.9 � 1.0 0.0002 51.1 � 3.4 0.0007 28.5 � 5.8Food intake, g 3.5 � 0.5 0.05 5.1 � 0.5 0.836 5.3 � 0.6Body fat, g 8.49 � 1.38 0.0001 24.38 � 2.83 0.004 11.25 � 4.09Adipocyte diameter, �m 17.4 � 1.4 4.2E�13 55.3 � 7.9 7.8E�12 25.0 � 4.5Fasting blood glucose, mg/dl 77.6 � 7.9 0.059 106.4 � 29.3 0.0002 271.0 � 31.2Blood glucose, mg/dl 130.0 � 16.7 0.734 175.0 � 42.0 0.002 574.5 � 14.5Urine glucose, mg/dL negative negative �2,000Insulin, ng/ml 1.849 � 0.66 0.018 12.990 � 5.30 0.068 5.778 � 0.742Leptin, ng/ml 1.47 � 0.26 0.0014 9.19 � 1.17 0.0009 3.59 � 1.46TAG, mg/dl 23.2 � 4.1 0.029 50.7 � 5.5 0.281 62.4 � 15.1FFA, mM 0.166 � 0.033 0.0008 0.848 � 0.198 0.229 0.694 � 0.117Liver TAG, mg/g 29.2 � 0.44 0.0002 59.4 � 2.65 0.097 96.9 � 4.42Heart TAG, mg/g 5.2 � 0.63 0.936 5.3 � 0.75 0.02 7.43 � 0.75Muscle TAG, mg/g 17.2 � 3.98 0.432 23.4 � 7.37 0.019 49.4 � 6.58Pancreas TAG, mg/g 2.70 � 0.28 0.038 23.0 � 8.89 0.065 6.83 � 2.34
Wang et al. PNAS � April 22, 2008 � vol. 105 � no. 16 � 6141
MED
ICA
LSC
IEN
CES
expected to reduce malonyl-CoA-mediated inhibition of carnitinepalmitoyl CoA transferase (CPT)-1. Further, a 7-fold higher ratioof phosphorylated to total AMP-activated protein kinase (0.7 � 0.4vs. 0.1 � 0.004; P � 0.05) (data not shown) suggested increasedmitochondrial oxidation of fatty acids. Finally, expression of per-oxisome proliferator-activated receptor-� coactivator (PGC)-1�,an up-regulator of mitochondrial biogenesis (17), was increased inthe fat of db/db-tg mice, presumably expanding its oxidative capac-ity. Whereas increased fatty acid oxidation could have contributedto the obesity resistance of the db/db-tg mice, it was not sufficientto prevent the ectopic lipid overflow in the db/db-tg mice.
Because of the putative role of inflammation in obesity andmetabolic syndrome, we compared various inflammatory markersin the adipose tissue, liver, and muscle of the db/db and db/db-tgmice. At 10 weeks of age, there were no statistically significantdifferences in IL-1�, IL-6, TNF-�, or macrophage chemoattractantprotein-1 (MCP-1) mRNA in the three tissues. Serum amyloid A(SAA-1) mRNA was significantly higher in skeletal muscle ofdb/db-tg mice (P � 0.026) but not in fat or liver tissue; however,plasma SAA did not differ in the two groups (data not shown).
C-reactive protein was increased in the liver of db/db-tg mice (P �0.05). In contrast to the increase in phosphorylated AMP kinasein the fat tissue of db/db-tg mice, there were no differences in liveror muscle (data not shown). The comparison of expression levelsof inflammatory factors appears in supporting information (SI)Table S1.
DiscussionThe aim of the present study was to determine the relationshipbetween adipocyte storage capacity and two major components ofthe metabolic syndrome in rodents, T2D, and lipotoxic cardiomy-opathy (14). It has long been accepted that the primary function ofadipocytes is to store fuel for distribution to nonadipose tissues intimes of need, as during a famine (18). The present study suggestsa second function of adipocytes, namely, the compartmentalizationinto adipocytes of the surplus calories consumed during overnutri-tion so as to protect nonadipose organs from lipid-induced trauma(3). Indeed, the recent demonstration by Kim et al. (10) thatexpansion of the fat mass of congenitally obese mice improves theirmetabolic profile lends further credence to the idea. To test thishypothesis, we studied the effects of preventing adipocyte expan-sion on the complications of diet-induced obesity in otherwisenormal C57BL/6 mice, and in the genetic obesity of db/db mice.
Comparison of WT C57BL/6 controls and the aP2-Lepr-b-tgmice revealed no significant differences in ectopic lipid depositionafter 8 months on a 4% fat diet. However, after 8 months of a 60%
db/db db/db-tg
B
C
D
A
0
100
200
300
400
500
600
700
0 5 10 15 20Age (weeks)
gnitsaf
no
N)l
d/g
m( esoc
ulg
do
olb
db/db-tg
db/db
Nonfasting blood Glucose
Fig. 2. Clinical evidence that obesity delays the onset of T2D in db/db mice.(A) Comparison of nonfasting blood glucose levels in obese db/db and nono-bese db/db-tg mice, demonstrating the later appearance of less severe hyper-glycemia in the db/db mice. (B and C) Comparison of the cages and the waterbottles of 10-week-old obese db/db and nonobese db/db-tg mice, showingevidence of polyuria and polydipsia only in the latter. (D) Comparison of urineglucose testing in obese db/db and nonobese db/db-tg mice (Keto-DiastixReagent Strip, Bayer, Elkhart, IN), showing glycosuria only in the latter.
Fig. 3. Immunofluorescent staining for insulin and glucagon of pancreas. (A)Low magnification view of pancreatic tissue showing a large number of isletsin db/db mice (Left) and a fewer number of small insulin-positive areas indb/db-tg mice (Right). (B) Higher magnification of the cells in A. (C) The normaltopography of glucagon-containing � cells in db/db mice (Left) contrasts withdisrupted cells in db/db-tg mice (Right). (Scale bars: 100 �m.)
6142 � www.pnas.org�cgi�doi�10.1073�pnas.0801981105 Wang et al.
fat diet, the WT control mice had developed diet-induced obesity,whereas the aP2-Lepr-b-tg mice remained nonobese. The lattermice exhibited greater lipid deposition in the liver and heart. Theheart was enlarged and heavier (Table 1, 60% fat diet). Both groupswere hyperinsulinemic, but the hyperinsulinemia of the tg mice wasapproximately three times that of the WT controls, with a similarmoderate elevation in nonfasting glucose levels (Table 1, 60% fatdiet). But in tg mice, the difference in insulin between the 4% fatdiet and the 60% fat diet was 9.8 ng/ml compared with only 2.2ng/ml in the WT control mice (Table 1). Given the similar levels ofhyperglycemia, this difference in insulin was consistent with greaterinsulin resistance in the tg group.
As expected, comparison of genetically obese WT db/db micewith slender db/db mice expressing the aP2-Lepr-b transgenerevealed a far greater impact of restricted adipogenesis. In theformer mice, the metabolic syndrome follows the onset of obesityby �7 weeks, or �12 weeks of age. Blood glucose levels remain�200 mg/dl until that time (Fig. 2A), evidence that their � cells arestill delivering enough insulin to meet the demands of rising insulinresistance. By contrast, nonobese db/db-tg mice enjoyed no suchprediabetic ‘‘honeymoon’’ period. Some were seriously ill at 4–5weeks of age, with glucose levels averaging �400 mg/dl, a level notattained by db/db mice until �14 weeks of age. All db/db-tg miceexhibited polyuria, polydipsia, glycosuria, and severe hyperglycemiaby 10 weeks of age, consistent with the profound depletion of their� cells. Similarly, myocardial dysfunction and dilated cardiomyop-athy and echocardiographic evidence of severe functional loss
appeared in the db/db-tg mice at 10 weeks of age, whereas at 18weeks functional loss was still minimal in the db/db group (Fig. 4A).
Given the known lipoapoptotic action of lipid excess on � cells invitro (7) and in vivo (6) and on cardiomyocytes in vivo (5), a lipotoxicetiology for the observed organ damage seemed plausible, partic-ularly because there was no obvious morphologic evidence ofinflammation in the tissues examined and because no increase ineither TNF-�, IL-1�, IL-6, or MCP-1 expression was detected in fat,liver, or muscle tissue. However, the increase in expression ofSAA-1 in skeletal muscle and CRP in liver (Table S1) makes itimpossible to exclude a contributing role of inflammation in thepathogenesis of these disorders (19).
These results may have potentially important clinical implica-tions. First, they imply that getting fat is a premetabolic syndromemanifestation, recognition of which by physicians and patientsmight encourage more aggressive interventions during the disease-free phase of overnutrition, rather than after the onset of overtdisease, as is now customary. Elimination of the caloric surplus inuncomplicated obesity is known to prevent overt T2D in rats (20)and humans (21), evidence that premorbid intervention, longsuccessfully used to prevent coronary artery disease, will alsoprevent T2D and metabolic syndrome.
Second, there are similarities between the accelerated metabolicsyndrome produced transgenically in this study and the syndromeof ‘‘metabolically obese, normal weight’’ patients first described byRuderman et al. (9). It will be of interest to determine whether theiradipocyte storage capacity is subnormal, and, if so, the molecularbasis of that subnormal capacity.
Third, the clear relationship between adipogenic capacity andsusceptibility to T2D and metabolic syndrome raises the possibilitythat differences in expression or function of various adipogenicgenes may influence susceptibility to diet-induced metabolic syn-drome. One gene candidate for such a role is Pref-1, a secretedpreadipocyte factor that inhibits adipogenesis and has been shownto exacerbate insulin resistance while preventing diet-induced obe-sity (H. S. Sul, personal communication). The fact that its expres-sion was 6-fold greater in the db/db-tg mice than in the db/db miceshould place it high on the list of genes that increase the ectopicdeposition of lipids during chronic overeating and susceptibility forthe metabolic syndrome.
db/db db/db-tg
B
C
gni
netro
hs lan
oitcarF
)%(
A
0
10
20
30
40
50
60
P=0.021
70
Fig. 4. Function and gross and microscopic appearance of the heart of 10-week-old db/db and db/db-tg mice. (A) Echocardiographically measured frac-tional shortening demonstrating greater functional loss in 10-week-old db/db-tgmice. The dotted line marks the normal value of fractional shortening. (B) Grossenlargement of the heart in a db/db-tg mouse. (C) Myocardium of db/db anddb/db-tg mice exhibits myofiber disruption and focal fibrosis in the latter.
Table 3. Quantitative PCR analysis of mRNAs in the adipocytetissue of db/db and db/db-tg mice using 36B4 as theinvariant control
Genes db/db-tg (n � 5) P value
AMPK�1 0.39 � 0.23 0.049PPAR� 0.06 � 0.02 0.036PGC1� 2.06 � 0.02 0.042SREBP-1c 0.62 � 0.12 0.034Pref-1 6.44 � 0.97 0.019IR 1.55 � 0.04 0.043IRS2 2.24 � 0.50 0.018ACO 2.26 � 0.84 0.028ACC� 0.51 � 0.13 0.043ACC� 0.44 � 0.04 0.041FAS 0.23 � 0.12 0.005GPAT 0.36 � 0.05 0.0003DGAT1 0.35 � 0.29 0.038Leptin 0.41 � 0.02 0.028Resistin 0.36 � 0.14 0.032Adiponectin 0.70 � 0.09 0.025
Values in db/db-tg mice are expressed as fold difference from db/db mice.No significant differences were found in the expression of the followinggenes: AMPK�2, PPAR�, LXR�, RXR�, C/EBP�, C/EBP�, C/EBP�, ChREBP, Insig-1,FOXO1, FOXC2, IRS1, CPT1, DGAT2, MCD, SCD, SOCS3, TNF�, IL-6, IL-1�, CRP,MCP-1, SAA-1, UCP1, UCP2, and UCP3.
Wang et al. PNAS � April 22, 2008 � vol. 105 � no. 16 � 6143
MED
ICA
LSC
IEN
CES
Materials and MethodsAnimals. C57BL/6 mice were bred locally. All were housed in individual cages ina temperature-controlled environment with 12-h light/12-h dark cycle. All micehadad libitumaccess towaterandpelletedmousechow.Transgenic studieswerecarried out with C57BL/6 mice.
Animals were killed under anesthesia with pentobarbital sodium. Nonfastingblood samples were obtained from the inferior vena cava. All tissues were rapidlyexcised, frozen in liquid nitrogen, and stored at �70°C until use. Institutionalguidelines for animal care and use were followed. The animal protocol wasapproved by the Institutional Animal Care and Research Advisory Committee ofthe University of Texas Southwestern Medical Center at Dallas.
Blood used for glucose determinations was collected in conscious animals bynicked tail vein bleeding between 10:00 and 12:00 a.m. Fasted blood glucosemeasurements were performed between 10:00 and 12:00 a.m., after food re-moval at 4:00 p.m. the previous day.
Transgenic Mice Production. The production of aP2-Lepr-b transgenic mice hasbeen described in ref. 8. Briefly, mouse Lepr-b cDNA was subcloned into anexpression plasmid, pSTEC-1-aP2, under the control of aP2 promoter. The result-ing pSTEC-1-aP2-Lepr-b construct contained a chimeric intron derived from �-globin intron and IgG intron, and a simian virus 40 polyA addition site requiredfor proper processing of the transgene mRNA in vivo. Transgenic mice weregenerated by microinjection of purified aP2-Lepr-b DNA fragments into pronu-clei of fertilized mouse eggs, which were subsequently transferred into fostermothers. Transgenic founders and offspring were screened by PCR genotyping ofgenomic DNA prepared from tail biopsies with specific primers.
Generation of aP2-Lepr-b db/db Mice. Male heterozygous (db/�) mice on theC57BL/6 background (purchased from The Jackson Laboratory) were crossed withaP2-lepr-b transgenic animals that were on the same background. Double het-erozygous (aP2-lepr-b db/�) animals were crossed again with db/� to obtainaP2-lepr-b db/db genotype. Genotyping for db/db was carried out by restrictionfragment-length polymorphism analysis using the enzyme RsaI on a 135-bp PCRproduct generated from genomic DNA isolated from these mice with the primerpair 5�-agaacggacactctttgaagtctc-3� and 5�-cattcaaaccatagtttaggtttgtgt-3�, with35 cycles of 94°C for 30 s, 52°C for 45 s, and 72°C for 45 s (22).
Plasma Measurements. Plasma leptin and insulin were measured by using ELISAkits (Crystal Chem, Downers Grove, IL). Plasma triglycerides were measured byusing a glycerol phosphate oxidase-Trinder triglyceride kit (Sigma). Plasma-freefatty acids were measured by using the Wako NEFA kit (Wako Chemical USA,Richmond, VA).
Triacylglycerol (TAG) Content of Tissues. Mice were anesthetized with pento-barbital sodium. Tissues were rinsed with PBS (pH 7.4), dissected, and placed inliquid nitrogen immediately. Total lipids from tissues were extracted and driedunder N2 gas. TG content was assayed as described in ref. 23.
Real-Time Quantitative Polymerase Chain Reaction (RT-QPCR). Total RNA wasextracted from fat tissues by TRIzol isolation method (Life Technologies, Rock-ville, MD). All PCRs were done in triplicate. mRNA was calculated by using thestandard curve method. 36B4 RNA was used as the invariant control. Primersequences of genes used for quantification of mRNA by RT-QPCR are shown inTable S2.
Immunoblotting. Total cell extracts prepared from fat tissues of mice wereresolved by SDS/PAGE and transferred to a poly(vinylidene difluoride) membrane(Amersham Pharmacia). The blotted membrane was blocked in 1 TBS contain-ing 0.1% Tween (TBST) and 5% nonfat dry milk (MLK) for 1 h at room temper-ature with gentle, constant agitation. After incubation with primary antibodiesanti-phospho-STAT-3 (Tyr-705), anti-STAT-3, anti-phospho-AMPK (Thr-172), anti-AMPK (Cell Signaling Technology, Beverly, MA), anti-serum amyloid A (a giftfrom P. E. Scherer, University of Texas Southwestern Medical Center at Dallas) oranti-�-tubulin (Sigma) in freshly prepared TBST-MLK at 4°C overnight with agi-tation, the membrane was washed twice with TBST buffer followed by incubat-ing with goat anti-rabbit or anti-mouse HRP-conjugated IgG in TBST-MLK for 1 hat room temperature with agitation. The membrane was then washed threetimes with TBST buffer, and the proteins of interest on immunoblots weredetected by using an enhanced chemiluminescence detection system (AmershamPharmacia).
Islet Morphology. Pancreata were processed for immunocytochemistry as de-scribed in ref. 24 by using insulin or glucagon antibodies. The volume density ofimmunofluorescent cells was determined by the point counting method ofWeibel (25).
Mouse Echocardiography. Transthoracic echocardiography was performed on10-week-old mice under ketamine/xylazine anesthesia by using a 12-MHz probeas described (8, 26). Two-dimensional echocardiography in midventricular short-axis view guided left ventricular (LV) end-diastolic and end-systolic dimensions,fractional shortening, and wall thickness measurements.
Statistical Analysis. Results are presented as means � SEM and were evaluatedby using Student’s t test for two groups.
ACKNOWLEDGMENTS. We thank J. Shelton and J. Richardson of the MolecularPathology Core Lab at University of Texas Southwestern Medical Center for theircontributions, the Scherer lab for adiponectin measurements, and Han-Yu Wangfor help with genotyping. We thank P. Gorden, C. Newgard, N. Ruderman, and P.Scherer for critical review of the manuscript. We thank K. McCorkle for technicalassistance with the art work, and P. McCravy for outstanding administrativeassistance. This work was supported by grants from the National Institute ofDiabetes and Digestive and Kidney Diseases, the Department of Veterans AffairsMerit Review, the Juvenile Diabetes Research Foundation (R.H.U.), and by theSwiss National Science Foundation (L.O.).
1. Ford ES, Giles WH, Dietz WH (2002) Prevalence of the metabolic syndrome among USadults: Findings from the third National Health and Nutrition Examination Survey.J Am Med Assoc 287:356–359.
2. Reaven G, Abbasi F, McLaughlin T (2004) Obesity, insulin resistance, and cardiovasculardisease. Recent Prog Horm Res 59:207–223.
3. Lee Y, et al. (2001) Liporegulation in diet-induced obesity: The antisteatotic role ofhyperleptinemia. J Biol Chem 276:5629–5635.
4. Szczepaniak LS, et al. (2003) Myocardial triglycerides and systolic function in humans:In vivo evaluation by localized proton spectroscopy and cardiac imaging. Magn ResonMed 49:417–423.
5. Chiu HC, et al. (2001) A novel mouse model of lipotoxic cardiomyopathy. J Clin Invest107:813–822.
6. Lee Y, et al. (2007) Metabolic mechanisms of failure of intraportally transplantedpancreatic beta-cells in rats: Role of lipotoxicity and prevention by leptin. Diabetes56:2295–2301.
7. Shimabukuro M, et al. (1998) Lipoapoptosis in beta-cells of obese prediabetic fa/fa rats:Role of serine palmitoyltransferase overexpression. J Biol Chem 273:32487–32490.
8. Wang MY, Orci L, Ravazzola M, Unger RH (2005) Fat storage in adipocytes requiresinactivation of leptin’s paracrine activity: Implications for treatment of human obesity.Proc Natl Acad Sci USA 102:18011–18016.
9. Ruderman N, Chisholm D, Pi-Sunyer X, Schneider S (1998) The metabolically obese,normal-weight individual revisited. Diabetes 47:699–713.
10. Kim JY, et al. (2007) Obesity-associated improvements in metabolic profile throughexpansion of adipose tissue. J Clin Invest 117:2621–2637.
11. Chen H, et al . (1996) Evidence that the diabetes gene encodes the leptin receptor:Identification of a mutation in the leptin receptor gene in db/db mice. Cell 84:491–495.
12. Orci L, Unger RH (1975) Functional subdivision of islets of Langerhans and possible roleof D cells. Lancet 2:1243–1244.
13. Higa M, et al. (1999) Troglitazone prevents mitochondrial alterations, beta cell de-struction, and diabetes in obese prediabetic rats. Proc Natl Acad Sci USA 96:11513–11518.
14. Zhou YT, et al. (2000) Lipotoxic heart disease in obese rats: Implications for humanobesity. Proc Natl Acad Sci USA 97:1784–1789.
15. Unger RH, Orci L (2001) Diseases of liporegulation: New perspective on obesity andrelated disorders. FASEB J 15:312–321.
16. Wang Y, Kim KA, Kim JH, Sul HS (2006) Pref-1, a preadipocyte secreted factor thatinhibits adipogenesis. J Nutr 136:2953–2956.
17. Wu Z, et al . (1999) Mechanisms controlling mitochondrial biogenesis and respirationthrough the thermogenic coactivator PGC-1. Cell 98:115–124.
18. Neel JV (1962) Diabetes mellitus: A‘‘thrifty’’ genotype rendered detrimental by‘‘progress’’? Am J Hum Genet 14:353–362.
19. Shoelson SE, Lee J, Goldfine AB (2006) Inflammation and insulin resistance. J Clin Invest116:1793–1801.
20. Ohneda M, Inman LR, Unger RH (1995) Caloric restriction in obese pre-diabetic ratsprevents beta-cell depletion, loss of beta-cell GLUT 2 and glucose incompetence.Diabetologia 38:173–179.
21. Knowler WC, et al. (2002) Reduction in the incidence of type 2 diabetes with lifestyleintervention or metformin N Engl J Med 346:393–403.
22. Fiedorek FT Jr, Kay ES (1994) Mapping of PCR-based markers for mouse chromosome4 on a backcross penetrant for the misty (m) mutation. Mamm Genome 5:479–485.
23. Danno H, Jincho Y, Budiyanto S, Furukawa Y, Kimura S (1992) A simple enzymaticquantitative analysis of triglycerides in tissues. J Nutr Sci Vitaminol (Tokyo) 38:517–521.
24. Orci L, et al. (1976) Hypertrophy and hyperplasia of somatostatin-containing D-cells indiabetes Proc Natl Acad Sci USA 73:1338–1342.
25. Weibel ER (1969) Stereological principles for morphometry in electron microscopiccytology. Int Rev Cytol 26:235–302.
26. Kedzierski RM, et al. (2003) Cardiomyocyte-specific endothelin A receptor knockoutmice have normal cardiac function and an unaltered hypertrophic response to angio-tensin II and isoproterenol. Mol Cell Biol 23:8226–8232.
6144 � www.pnas.org�cgi�doi�10.1073�pnas.0801981105 Wang et al.