ADHD and College Students: Exploratory and Confirmatory Factor Structures With Student and Parent...
12
ADHD and College Students: Exploratory and Confirmatory Factor Structures With Student and Parent Data Joseph J. Glutting University of Delaware Eric A. Youngstrom Case Western Reserve University Marley W. Watkins Pennsylvania State University Exploratory factor analyses (EFAs) and confirmatory factor analyses (CFAs) were used to investigate the structure of the Student Report Inventory (SRI) and Parent Report Inventory (PRI) of the College Attention-Deficit/Hyperactivity Disorder (ADHD) Response Evaluation. The sample was composed of 1,080 college students and their parents and was stratified by ethnicity, gender, ability level, age, grade, region of residence, and psychoeducational classification status. Results varied according to the infor- mation source (self-report vs. parent). EFA uncovered and CFA confirmed 3 distinct and reliable dimensions for student reports: Inattention, Hyperactivity, and Impulsivity. By contrast, EFA and CFA uncovered a reliable 2-dimension structure for the parent-report data. Factor structures replicated across genders (3 factors for the SRI, and 2 factors for the PRI). Results are discussed in terms of the divergence of structures. Individuals with an attention-deficit/hyperactivity disorder (ADHD) are likely to have lifelong problems (Barkley, 1990; Barkley, Fischer, Smallish, & Fletcher, 2002; Biederman et al., 1998; Fergusson, Lynskey, & Horwood, 1997; Loeber, Green, Lahey, Frick, & McBurnett, 2000). It was previously thought that ADHD symptoms subsided in adolescence (e.g., Eisenberg, 1966), but prospective, longitudinal studies have shown otherwise. For example, among 6- to 12-year-old ADHD children who were followed for 10 to 25 years, nearly two thirds continued to man- ifest at least one of the disabling symptoms of ADHD (e.g., inattention, hyperactivity, impulsivity) as adolescents and adults (Gittelman, Mannuzza, Shenker, & Bonagura, 1985; Weiss & Hechtman, 1993). Additionally, adults with ADHD had obtained less formal education and/or lower ranks while in high school (Barkley et al., 2002; Mannuzza, Gittelman-Klein, Bessler, Mal- loy, & LaPadula, 1993) and were more likely to experience ad- verse family functioning, other psychiatric illnesses, substance abuse, and trouble with the law (Barkley, Fischer, Edelbrock, & Smallish, 1990; Barkley et al., 2002; Biederman, 2003; Biederman et al., 1998; Klein & Manuzza, 1991; Peterson, Pine, Cohen, & Brook, 2001). By contrast, about one third of adults with a history of ADHD had positive outcomes. Although some symptoms remained, prob- lems were not present to a significant degree. Most were em- ployed, and many sought training and/or education beyond high school. Therefore, it is not surprising to find that individuals with ADHD are entering colleges and universities in record numbers (Latham, 1995; Richard, 1995). Estimates suggest 1% to 4% of the college population has ADHD (DuPaul et al., 2001; Heiligenstein, Conyers, Berns, & Smith, 1998; Weyandt, Linterman, & Rice, 1995). However, the figures are only rough estimates because no study used a nationally representative sample (Glutting, Mon- aghan, Adams, & Sheslow, 2002). Less is known about ADHD at the college level than with children or adults (DuPaul et al., 2001; Heiligenstein et al., 1998; Heiligenstein, Guenther, Levy, Savino, & Fulwiler, 1999). More- over, there is reason to believe that outcomes obtained for children with ADHD may not hold for college students (Glutting, Mon- aghan, et al., 2002; Heiligenstein et al., 1998). College students with ADHD are likely to have (a) higher ability levels, (b) greater academic success during primary and secondary school, and (c) better compensatory skills than individuals with ADHD from the general population. College students with ADHD also experience a different set of stressors than adults with the condition who do not seek postsecondary training. In particular, they must adapt to the academic challenges and demands that accompany a college education. Therefore, college students with ADHD may constitute a distinct subset of individuals with the disorder. Factor Structure of ADHD Inadequate knowledge about ADHD at the college level is compounded by methodological issues (Spencer, Biederman, Wilens, & Faraone, 1994). Primary among them is that no psy- chopathology originating in childhood has undergone as much renaming and reconceptualizing as ADHD (Gomez, Harvey, Quick, Scharer, & Harris, 1999). Different organizations of ADHD Joseph J. Glutting, School of Education, University of Delaware; Eric A. Youngstrom, Department of Psychology, Case Western Reserve Univer- sity; Marley W. Watkins, Department of Educational and School Psychol- ogy and Special Education, Pennsylvania State University. Joseph J. Glutting is a coauthor of the College ADHD Response Eval- uation, which is published by Wide Range, Inc., and he receives royalties from its sale. Correspondence concerning this article should be addressed to Joseph J. Glutting, School of Education, University of Delaware, Newark, DE 19716-2922. E-mail: [email protected] Psychological Assessment Copyright 2005 by the American Psychological Association 2005, Vol. 17, No. 1, 44 –55 1040-3590/05/$12.00 DOI: 10.1037/1040-3590.17.1.44 44
Transcript of ADHD and College Students: Exploratory and Confirmatory Factor Structures With Student and Parent...

ADHD and College Students: Exploratory and Confirmatory FactorStructures With Student and Parent Data
Joseph J. GluttingUniversity of Delaware
Eric A. YoungstromCase Western Reserve University
Marley W. WatkinsPennsylvania State University
Exploratory factor analyses (EFAs) and confirmatory factor analyses (CFAs) were used to investigate thestructure of the Student Report Inventory (SRI) and Parent Report Inventory (PRI) of the CollegeAttention-Deficit/Hyperactivity Disorder (ADHD) Response Evaluation. The sample was composed of1,080 college students and their parents and was stratified by ethnicity, gender, ability level, age, grade,region of residence, and psychoeducational classification status. Results varied according to the infor-mation source (self-report vs. parent). EFA uncovered and CFA confirmed 3 distinct and reliabledimensions for student reports: Inattention, Hyperactivity, and Impulsivity. By contrast, EFA and CFAuncovered a reliable 2-dimension structure for the parent-report data. Factor structures replicated acrossgenders (3 factors for the SRI, and 2 factors for the PRI). Results are discussed in terms of the divergenceof structures.
Individuals with an attention-deficit/hyperactivity disorder(ADHD) are likely to have lifelong problems (Barkley, 1990;Barkley, Fischer, Smallish, & Fletcher, 2002; Biederman et al.,1998; Fergusson, Lynskey, & Horwood, 1997; Loeber, Green,Lahey, Frick, & McBurnett, 2000). It was previously thought thatADHD symptoms subsided in adolescence (e.g., Eisenberg, 1966),but prospective, longitudinal studies have shown otherwise. Forexample, among 6- to 12-year-old ADHD children who werefollowed for 10 to 25 years, nearly two thirds continued to man-ifest at least one of the disabling symptoms of ADHD (e.g.,inattention, hyperactivity, impulsivity) as adolescents and adults(Gittelman, Mannuzza, Shenker, & Bonagura, 1985; Weiss &Hechtman, 1993). Additionally, adults with ADHD had obtainedless formal education and/or lower ranks while in high school(Barkley et al., 2002; Mannuzza, Gittelman-Klein, Bessler, Mal-loy, & LaPadula, 1993) and were more likely to experience ad-verse family functioning, other psychiatric illnesses, substanceabuse, and trouble with the law (Barkley, Fischer, Edelbrock, &Smallish, 1990; Barkley et al., 2002; Biederman, 2003; Biedermanet al., 1998; Klein & Manuzza, 1991; Peterson, Pine, Cohen, &Brook, 2001).
By contrast, about one third of adults with a history of ADHDhad positive outcomes. Although some symptoms remained, prob-
lems were not present to a significant degree. Most were em-ployed, and many sought training and/or education beyond highschool. Therefore, it is not surprising to find that individuals withADHD are entering colleges and universities in record numbers(Latham, 1995; Richard, 1995). Estimates suggest 1% to 4% of thecollege population has ADHD (DuPaul et al., 2001; Heiligenstein,Conyers, Berns, & Smith, 1998; Weyandt, Linterman, & Rice,1995). However, the figures are only rough estimates because nostudy used a nationally representative sample (Glutting, Mon-aghan, Adams, & Sheslow, 2002).
Less is known about ADHD at the college level than withchildren or adults (DuPaul et al., 2001; Heiligenstein et al., 1998;Heiligenstein, Guenther, Levy, Savino, & Fulwiler, 1999). More-over, there is reason to believe that outcomes obtained for childrenwith ADHD may not hold for college students (Glutting, Mon-aghan, et al., 2002; Heiligenstein et al., 1998). College studentswith ADHD are likely to have (a) higher ability levels, (b) greateracademic success during primary and secondary school, and (c)better compensatory skills than individuals with ADHD from thegeneral population. College students with ADHD also experiencea different set of stressors than adults with the condition who donot seek postsecondary training. In particular, they must adapt tothe academic challenges and demands that accompany a collegeeducation. Therefore, college students with ADHD may constitutea distinct subset of individuals with the disorder.
Factor Structure of ADHD
Inadequate knowledge about ADHD at the college level iscompounded by methodological issues (Spencer, Biederman,Wilens, & Faraone, 1994). Primary among them is that no psy-chopathology originating in childhood has undergone as muchrenaming and reconceptualizing as ADHD (Gomez, Harvey,Quick, Scharer, & Harris, 1999). Different organizations of ADHD
Joseph J. Glutting, School of Education, University of Delaware; Eric A.Youngstrom, Department of Psychology, Case Western Reserve Univer-sity; Marley W. Watkins, Department of Educational and School Psychol-ogy and Special Education, Pennsylvania State University.
Joseph J. Glutting is a coauthor of the College ADHD Response Eval-uation, which is published by Wide Range, Inc., and he receives royaltiesfrom its sale.
Correspondence concerning this article should be addressed to Joseph J.Glutting, School of Education, University of Delaware, Newark, DE19716-2922. E-mail: [email protected]
Psychological Assessment Copyright 2005 by the American Psychological Association2005, Vol. 17, No. 1, 44–55 1040-3590/05/$12.00 DOI: 10.1037/1040-3590.17.1.44
44
symptoms can be found in each of the last three revisions of theDiagnostic and Statistical Manual of Mental Disorders (DSM) ofthe American Psychiatric Association. Beginning with the thirdedition of the DSM (DSM–III; American Psychiatric Association,1980), ADHD was theorized to include three interrelated factors:Inattention, Hyperactivity, and Impulsivity. Later, the factors werebelieved to be so interrelated that the revised edition of the DSM–III (DSM–III–R; American Psychiatric Association, 1987) col-lapsed ADHD to a single dimension. The most recent revision ofthe DSM, the fourth edition (DSM–IV; American Psychiatric As-sociation, 1994), portrays ADHD as containing two dimensions(Inattention and Hyperactivity/Impulsivity), with elevated perfor-mance on both dimensions indicating the presence of a combinedADHD type.
Changes in the DSM–IV’s definition were partially the result offactor analyses of teacher, parent, and clinician ratings of ADHD(Frick et al., 1994; Lahey et al., 1994; McBurnett, Lahey, &Pfiffner, 1993). A substantial number of factor analyses supporteda two-factor structure for both clinic-referred and community-based samples of children (Bauermeister, Alegria, Bird, Robio-Stipec, & Canino, 1992; Burns et al., 1997; Collett, Crowley,Gimpel, & Greenson, 2000; DuPaul, 1991; Holland, Gimpel, &Merrell, 1998; Lahey et al., 1994; Molina, Smith, & Pelham, 2001;Pelham, Gnagy, Greenslade, & Milich, 1992; Wolraich, Hannah,Pinnock, Baumgaertel, & Brown, 1996). By contrast, a smallernumber of studies obtained a three-factor structure that conformedto the DSM–III model of ADHD, that is, Inattention, Hyperactiv-ity, and Impulsivity (Gomez et al., 1999; Pillow, Pelham, Hoza,Molina, & Stulz, 1998).
Factor Structure of ADHD at the College Level
The above investigations focused on children. As a result, eachrelied on either teacher or parent ratings and did not incorporateself-reports because of age limitations that could affect the abilityof children to comprehend the nature of their problems and/orreasons for the assessment (Edelbrock, 1988; McDermott, 1986).Furthermore, with only a few exceptions (Holland et al., 1998;Molina et al., 2001; Pillow et al., 1998), the factor analyses reliedon orthogonal (i.e., uncorrelated) rotations even though it is rec-ognized that ADHD dimensions correlate substantially (DuPaul,1991; Pelham et al., 1992; Pillow et al., 1998).
It is interesting that, despite an upsurge of ADHD on collegecampuses, only three studies examined the factor structure ofADHD among postsecondary students. DuPaul et al.’s (2001)notable study sampled 799 undergraduates from the United States.Dependent variables were self-report data and comprised students’responses to 24 items, 18 of which were taken from the 18 ADHDcriteria in the DSM–IV. An exploratory factor analysis (EFA) withoblique rotation uncovered a two-factor structure corresponding tothe ADHD organization in the DSM–IV. The structure replicatedacross genders and for undergraduates from New Zealand (n �213). However, it did not hold for older students from Italy (n �197), where four factors were obtained. In the second investiga-tion, Smith and Johnson (1998) used self-report data from 1,524students. Items comprised the 18 ADHD criteria in the DSM–IV.Both an EFA and a confirmatory factor analysis (CFA) supportedthe two-factor structure in the DSM–IV, with the structures repli-cating across genders. Most recently, Span, Earleywine, and Stry-
bel (2002) used self-reports, and a CFA was completed with asample of 262 undergraduates. The CFA was then repeated with asecond sample of 237 students. In this study, too, items came fromthe 18 ADHD criteria in the DSM–IV. Each analysis supported athree-factor structure similar to the one found in the DSM–III.
The present study further tests assumptions underlying the as-sessment of ADHD at the college level. The investigation expandsunderstanding in three ways. First, a basic tenet of assessment isthat cross-informant methods are likely to be more encompassingand accurate (Achenbach, McConaughy, & Howell, 1987; Meyeret al., 2001). Therefore, the current study uses student self-reportdata as well as parent-report data to increase the ecological validityof outcomes. Second, no prior study used either EFA or CFA withparent data. Third, the current investigation goes well beyondcriteria in the DSM–IV and includes 44 items in the studentself-report measure and 30 items in the parent-report measure.
Method
Measures
Methods exist for the assessment of ADHD with adults. The earliest wasthe Wender Utah Rating Scale (WURS), which attempts to establish thepresence of ADHD by having adults describe their own behavior aschildren (Wender, 1995; Wender, Reimherr, & Wood, 1981). Some nor-mative data are available, and WURS scores were able to distinguish adultswith ADHD from normal controls and individuals with agitated depression(Wender, 1995). Despite its value in promoting the study of ADHD inadulthood, the WURS has been criticized because of its (a) association witholder (DSM–III) criteria for ADHD and (b) inclusion of symptoms such as“hot temper” and “stress intolerance” that may confound ADHD with otheradult conditions and opposition defiance disorder (Conners et al., 1999;Kane, Mikalac, Benjamin, & Barkley, 1990). Two other tools for assessingADHD in adults include Conners’ Adult ADHD Rating Scales (Conners,Erhardt, & Sparrow, 1999) and the Brown Attention-Deficit DisordersScales (Brown, 1996). Although useful, these instruments were not de-signed specifically for college students.
All data in the present investigation come from the standardizationsample of the College ADHD Response Evaluation (CARE; Glutting,Sheslow, & Adams, 2002). The CARE can be used for two purposes,depending on an examiner’s background and training. Its primary use is bypostsecondary disability service providers, whose background may not bein assessment. For these professionals, the CARE can be applied forscreening purposes to identify college students who are at risk for ADHD.Alternatively, examiners with appropriate training can use the CARE aspart of a comprehensive ADHD assessment.
The CARE encourages consensual validity because its assessmentsinclude conormed student and parent measures: the Student ResponseInventory (SRI) and the Parent Response Inventory (PRI). Results may beinterpreted with reference to general national norms for college students orto gender-specific norms. Each instrument is described below.
SRI. The SRI is a 44-item self-rating scale; 18 items come directlyfrom criteria in the DSM–IV. The SRI is relatively brief, taking less than 10min to complete.
A problem can occur when item development is limited to criteria foundin popular classification systems, such the DSM–IV (Kline, 1988; McDer-mott, 1994). Criteria (i.e., items) changed with each successive revision ofthe DSM. Furthermore, the DSM–IV criteria have been criticized for notbeing developmentally sensitive to variations that take place with ADHDamong adolescents and adults (Barkley, 1998). The SRI, by contrast, goesbeyond the DSM–IV and includes a variety of age-appropriate correlates ofADHD. Item development was heavily influenced by mental health pro-fessionals experienced in working with ADHD students at the college
45FACTOR STRUCTURE OF ADHD AMONG COLLEGE STUDENTS

level. Postsecondary disability service providers, college counselors, psy-chologists, and psychiatrists with appropriate knowledge and backgroundwere interviewed and asked to write items. Results were then obtainedfrom an EFA conducted during item tryout (N � 680). The SRI item poolwas finalized only after mental health professionals reviewed the EFAoutput and agreed about the types of phenomena they thought wereimportant to the diagnosis and treatment of ADHD at the postsecondarylevel.
Overuse of negative statements is another disadvantage of many ADHDmeasures. Seeing only negatively worded items, students may assume theyare expected to find something wrong with themselves. The CARE wasconstructed to balance negatively worded items with positively wordeditems that reduce bias. Twenty-two percent of the SRI’s items are posi-tively worded, and the remaining 78% are negatively worded. Furthermore,although it is essential to learn whether college students have ADHD, it isequally important to understand the circumstances and settings in whichproblems take place. Contextual knowledge of how, when, and whereADHD phenomena occur can provide valuable insights for tailoring inter-ventions (Danforth, Barkley, & Stokes, 1991; Shapiro & Skinner, 1990;Waschbusch, Kipp, & Pelham, 1998). Consequently, 48% of the SRI’sitems are couched in specific contexts related to college life. Settings usedby the SRI include studying and doing homework, sitting through lectures,answering questions, taking notes, taking exams, completing class assign-ments, keeping (or not keeping) a daily calendar, writing (or not writing)down assignments, remembering to bring pencils or pens to class, watchingTV, interacting during mealtimes, and engaging in leisure activities.
For each item, students indicate whether they agree, disagree, or areundecided about how an item’s content applies to their day-to-day life. Thisformat differs from that in some ADHD measures, in which symptoms arerated by 4-point scaling (e.g., not at all, just a little, pretty much, verymuch). The SRI’s use of a neutral or middle-point alternative is consistentwith findings that forced-choice systems (e.g., 4-, 6-, or 8-point ratings)result in less response discrimination on personality measures, with raterssystematically collapsing the two middle alternatives into a single neutralcategory (Glutting & Oakland, 1993; McKelvie, 1978; Tseng, 1983).Attempts to attain precision by adding a large number of options with aneutral alternative (e.g., 5-point scaling) can also lead to inaccurate re-sponses (McDermott, 1986). This situation arises when raters do not makesubtle choices imposed by the item format (e.g., differentiating between thegradations strongly agree and agree). Likert scaling was attempted with theCARE, but the methodology was abandoned when item-tryout analysesrevealed that approximately 10% of respondents failed to use all fivepoints.
PRI. The majority of postsecondary students with ADHD are referredbecause of difficulties in attention, concentration, and behavioral regula-tion. These very same problems might also affect their responses toquestionnaires. Compounding the problem of response distortion is the factthat ADHD students have been found to underreport key symptoms(Fischer, Barkley, Fletcher, & Smallish, 1993; Hinshaw, Henker, &Whalen, 1984; Youngstrom, Loeber, & Stouthamer-Loeber, 1999). The neteffect is that an ADHD assessment that relies solely on self-reports runscertain risks and may under- or overreport clinically important phenomena.Therefore, following well-established findings in the child psychopathol-ogy literature (Achenbach et al., 1987; Bird, Gould, & Staghezza, 1992;Loeber, Green, Lahey, & Stouthamer-Loeber, 1989), we hypothesized thatparent ratings might be as effective as, if not more accurate and predictivethan, the self-ratings of college students.
The PRI was developed to supplement and enhance data supplied bystudents on the SRI. The PRI is an objective rating scale completed by astudent’s parent. It contains 30 items, 18 of which come directly fromADHD criteria in the DSM–IV. The PRI takes 5 to 10 min to complete anduses the same item format as the SRI, with parents indicating whether theyagree, disagree, or are undecided about how an item’s content applies totheir child.
Although the assertion is controversial (Wender, 1995), the DSM–IVmandates that ADHD symptoms must be present by age 7 (AmericanPsychiatric Association, 1994). Parents are in a better position to recall thebehavior of their offspring as children. Therefore, the PRI asks parents toframe the duration and history of symptoms of their children using thefollowing retrospective framework: “Please give an opinion about whatyour son/daughter was like when he or she was IN ELEMENTARYSCHOOL (APPROXIMATELY 5–8-YEARS OLD).” The PRI’s use ofhistorical circumstances also helps examiners clarify whether a student’sdifficulties are persistent or whether they are a reaction to stressful eventsthat took place more recently.
The PRI’s initial item pool was developed from input from professionalsworking with ADHD students at the college level. The PRI avoids prob-lems associated with the overuse of negative wording as well as problemswith response sets, because 41% of its items are positively worded and theother 59% are negatively worded. Likewise, 43% of the PRI’s items wereplaced in developmental situations common to the experiences of children(e.g., doing homework, sitting still during meals, completing chores).
Diagnostic Validity
The CARE’s manual (Glutting, Sheslow, & Adams, 2002) presentsstudies that examined external validity. One study evaluated diagnosticvalidity. It used receiver operator characteristic curves calculated betweenstudents with ADHD (n � 58) and nonclassified contemporaries (n �1,022). To be eligible for placement in the ADHD group, individuals hadto have (a) been administered a parent or teacher rating scale during the last3 years for which the ADHD score was at least 1.5 standard deviationsabove the national mean (i.e., a score at or above the 92nd percentile), (b)received a clinic or school diagnosis of DSM–IV ADHD during highschool, (c) received academic services for ADHD during high school (e.g.,extra time during examinations, resource room help, note-taking assis-tance), and (d) been found eligible for continued academic assistanceduring college by the student disability services unit on their campus.
The receiver operator characteristic analyses were all statistically sig-nificant ( ps � .001). Therefore, areas under the curve (AUCs) wereinterpreted. Values ranged from .71 to .82 for the SRI and from .77 to .94for the PRI. The AUC is a measure of effect size. Values between .50 and.59 represent low diagnostic accuracy (i.e., a small effect size), valuesbetween .60 and .65 indicate medium accuracy, and values between .66 and1.00 denote high accuracy (Rice & Harris, 1995). Every AUC for the SRIand for the PRI exceeded the critical value for a large effect size.
A benefit of AUCs is that they are easy to understand. For instance, thelowest (i.e., least accurate) AUC for the CARE was .71. This value meansthat if a student with ADHD and a student without ADHD were chosenrandomly and compared, then 71% of the time college students withADHD would obtain a higher (i.e., more pathological) score. Therefore, inthis one study, results show that the CARE possesses fairly high levels ofdiagnostic accuracy.
Procedure
A network of postsecondary service providers was used to identifycolleges and universities willing to participate in the CARE’s standardiza-tion. Informed consent procedures were approved by all participatinginstitutions. Students and parents were asked in person to complete the SRIor PRI, and the ratings were obtained either at the time of new studentorientations (at most, 2 months prior to the beginning of the fall semester)or when families brought their students to college (the beginning of the fallsemester). Respondents were informed that all questionnaires were confi-dential but not anonymous, so that it would be possible to track students.At the request of participating institutions, response rates were not moni-tored directly. Nevertheless, the participation rate approximated 35% onthe basis of the number of returned questionnaires. Each student completed
46 GLUTTING, YOUNGSTROM, AND WATKINS
the SRI, and one of the parents completed the PRI. Norms were obtainedin two stages: 1999 (n � 460) and 2000 (n � 620). More parents thanstudents returned ratings. Participants were included in the standardizationsample only when ratings were obtained from both a student and acorresponding parent. More mothers than fathers completed ratings.
Sample
Most individuals with ADHD are identified with the disorder prior tolate adolescence (Barkley, 1998; Robin, 1998). Consequently, the CARE’sstandardization sample was intentionally confined to freshmen so that itsnorms would be sensitive to the postsecondary age at which students aremost likely to seek ADHD services. The sample ranged from 17 through 22years of age. The average age was 18.7 years (SD � 0.7 years).
The CARE’s standardization model explicitly accounted for age, eth-nicity, gender, and ability level. Geographic region and classification status(i.e., the presence or absence of ADHD) were not explicit stratificationvariables, but they were monitored. Geographic region was not included asa stratification variable because a college’s location can be independent ofstudent origin. The sample included students enrolled in degree programsat colleges and universities on the Northeast, Mid-Atlantic, Northwest, andSouthwest corridors of the United States. No colleges or universities tookpart from the South. Nevertheless, families (students and parents) camefrom 38 states, including the southern states of Florida, Georgia, Kentucky,Louisiana, North Carolina, South Carolina, and Tennessee.
With respect to classification status, 5.5% (n � 58) of the students hadbeen previously diagnosed with ADHD, and another 3.6% (n � 39)reported having a learning disability (LD). Participants were placed in theADHD cohort according to the procedure described earlier. Placement inthe LD category was less formal and occurred when student and parentreports both agreed that the student had a history of LD.
Weighting was used to stratify the CARE’s sample according to threevariables: gender, ethnicity, and ability level. Slightly more women(53.8%) than men (46.2%) attend postsecondary programs (Barbett &Korb, 1997). Nevertheless, the CARE’s standardization sample wasweighted to equivalence on gender. Five categories of race–ethnicityserved as strata (i.e., Anglo, Black, Hispanic, Asian, and other). Weightingfor race–ethnicity was based on demographic data available from theNational Center for Educational Statistics Fall Enrollment Survey forstudents attending 4-year colleges and universities throughout the UnitedStates (Barbett & Korb, 1997).
The Guide to the Assessment of Test Session Behavior for the WISC–IIIand WIAT (GATSB; Glutting & Oakland, 1993) is an observation systemthat was conormed with the standardization sample of the Wechsler Intel-ligence Scale—Third Edition (WISC–III; Wechsler, 1991). The GATSBprovides a factor-based inattentiveness scale, and it showed a meaningfulrelationship with ability level (average r � .21 to the WISC–III full scaleIQ). Of greater note is that, during development, IQ was the most importantstratification variable affecting GATSB ratings of inattentiveness (Glutting& Oakland, 1993). Therefore, in light of this information and the fact thatcolleges explicitly select on the basis of SAT scores, ability level consti-tuted a critical stratification variable for the CARE.
Weighting on ability level was based on data from the EducationalTesting Service for the SAT for the years corresponding to the CARE’sstandardization (College Board, 2000). Respective means and standarddeviations for the standardization sample versus the national average wereas follows: composite SAT total score (M � 522, SD � 66, vs. M � 522,SD � 111), SAT Verbal scale score (M � 517, SD � 72, vs. M � 520,SD � 110), and SAT Quantitative scale score (M � 527, SD � 77, vs. M �524, SD � 112). The comparisons reveal that, with the exception of mildrange restrictions, mean ability levels for the sample corresponded to theirnational values.
Data Analyses
The standardization data were randomly divided into two subsamples.One sample had 539 participants, and the other had 540 (1 participant hadmissing data). The two samples were essentially equivalent in terms ofgender, ethnicity, SAT total, and scores on all the parcels (all ps � .10,two-tailed). A coin toss determined which sample was used for the EFAversus the CFA. The sample of 540 was used for the EFA of the SRI andthe CFA of the PRI, and the sample of 539 was used to cross-validate theresults of the EFA on the SRI as well as to perform the initial EFA of thePRI.
Item factoring versus miniscales. Outcomes can be inaccurate or un-replicable when EFAs directly analyze item scores (Gorsuch, 1997). Infact, the problem is so severe that some measurement authorities recom-mend against direct item factoring (e.g., Nunnally & Bernstein, 1994).Multiple procedures have been advanced to overcome the limitations ofexploratory item factoring. Among the methods are nonlinear factor anal-ysis (Steinberg & Jorgensen, 1996), the application of CFA in an explor-atory manner (Muthen & Muthen, 1998), and the collapsing of items intominiscales (Gorsuch, 1983, p. 294; see also Fabrigar, Wegener, MacCal-lum, & Strahan, 1999; Joreskog, 1993). Researchers achieve miniscaleanalysis by adding several item scores together into meaningful groupingsthat produce larger variances, which alleviates problems associated withthe constricted variances in item scores (Gorsuch, 1997; Zwick, 1987).Thereafter, traditional methods of EFA are applied. An advantage of theminiscale approach is that CFA can be used as an independent, second-stage strategy to support or disconfirm results from the EFAs. This cannotbe done when CFA is first used in an exploratory manner.
EFA performed on the entire sample with item-level data suggested athree-factor solution with the SRI and a two-factor solution with the PRI(on the basis of Cattell’s, 1966, scree test and the minimum average partialsmethod). Items loading on a particular factor during the first-stage, direct-item EFA of the SRI and PRI served as the basis for forming miniscales.Because item scores in the SRI and PRI range from 0 to 2 (2 � agree, 1 �undecided, and 0 � disagree), miniscales were constructed in groups ofthree to four items so that score ranges in each miniscale would vary from0 to 6–8 points. (Gorsuch, 1983, recommended that one form miniscalesby grouping items so that the minimum score range varies from 0 to 4–6points.) Thus, placement of items in miniscales was based on results fromdirect item factoring and was not influenced by a priori theoretical expec-tations, which is a common drawback to miniscale factoring (Zwick, 1987).In addition, each miniscale was constructed so items possessing highendorsement rates (i.e., item difficulties [p values]) were included in thesame miniscale as items possessing low p values. Thereby, difficulty levelswere approximately equal across all miniscales, and the procedure de-creased the probability of the EFAs identifying difficulty factors—the mostcommon problem in item factoring (Gorsuch, 1997; Nunnally & Bernstein,1994; Zwick, 1987). Simultaneously, the procedure prevented the place-ment of several higher loading (i.e., stronger) items from the direct itemfactoring together with a lower loading (weaker) item. Because two dif-ferent empirical criteria—endorsement rates and item factor loadings—dictated the composition of miniscales, it was possible for these scales toform contrary to theory. Thus, the factor analyses provided a test ofwhether the data conformed to prevailing theoretical models of ADHD.
Determining the number of factors. The utility of each EFA solutionwas evaluated against the following criteria for factor retention: Theaccepted configuration (a) accounted for 50% or more of the total variance,(b) satisfied Cattell’s (1966) scree test, (c) met the requirements of Glor-feld’s (1995) extension of parallel analysis (PA), and (d) showed the lowestminimum average partial correlation (MAP). PA was developed by Horn(1965) and compares obtained eigenvalues against those generated fromrandom data. Components were kept when their eigenvalues were largerthan those from the 95th percentile in multiple simulations using randomdata. MAP was introduced by Velicer (1976) and examines off-diagonalpartial correlations. The average of these correlations is calculated, and
47FACTOR STRUCTURE OF ADHD AMONG COLLEGE STUDENTS
components are retained when the averaged square partial correlationreaches its lowest value. Results from several studies demonstrate thatMAP and PA methods provide the two best criteria for determining thecorrect number of factors to accept (Buja & Eyuboglu, 1992; Glorfeld,1995; Velicer, Eaton, & Fava, 2000; Zwick & Velicer, 1986).
Results
Comparison of the Two Subsamples
Results are presented separately for the SRI and the PRI. Severaltypes of factor extraction (principal-axis factoring, maximum like-lihood) and rotation (varimax, direct oblimin) were used duringEFAs with the SRI and PRI. Results were essentially equivalent.To save space, EFA findings are limited to results from theminiscale analysis completed via principal axis factor analysiswith promax rotation. This system provided the most parsimoniouscoverage of the data and had the added benefit of supplyingcorrelations among the retained factors. EFA findings for eachinstrument (SRI, PRI) are followed by CFA results, also completedwith miniscales.
EFA of the SRI
The miniscales analysis revealed that a three-factor solution forthe SRI was best. MAP and scree criteria both suggested that threefactors be retained for rotation, but PA suggested a two-factorsolution. This pattern of results suggests that a three-factor solutionis likely if the results appear interpretable. The three retainedfactors accounted for 60.9% of the total variance in the SRI. Table1 displays the rotated pattern matrix for these three factors. Thethird column of Table 1 shows endorsement rates (i.e., p values)for the miniscales entering the analysis. The p values were bal-anced across miniscales expected to load on a particular factor;thus, the placement of items within a miniscale was not affected bytheoretical bias. Table 1 reveals that every miniscale showed onlyone salient pattern coefficient (i.e., at least .40).
Each of the three factors was interpreted according to themagnitude and meaning of its salient pattern coefficients. The firstfactor was characterized by items describing low levels of vigi-lance, alertness, and sustained attention along with high levels ofdistractibility. Consequently, the first factor was named Inatten-tiveness. The second factor was defined by items describing inap-propriate levels of activity, feelings of restlessness, fidgeting, andunnecessary body movements, so this factor was named Hyperac-tivity. Finally, the third factor suggested a configuration ofthoughts and behaviors characterized by the inability to delay ordefer gratification, inhibit responses, and wait for instructionsbefore responding. As a result, the third factor was namedImpulsivity.
Cronbach’s (1951) coefficient alpha was used to estimateinternal-consistency reliability for the three factors: .82, .87, and.77 for Inattentiveness, Hyperactivity, and Impulsivity, respec-tively. Reliabilities were greater than the .70 criterion recom-mended by leading measurement textbooks (e.g., Allen & Yen,1979; Thorndike, 1982) and comparable to levels reported forother ADHD scales used with adolescents and adults (cf. Brown,1996; Conners, Erhardt, & Sparrow, 1999). In addition, we eval-uated the relative independence of scores among the SRI’s three
scales by comparing correlations among the rotated factors as wellas examining the correlations among the three scale scores. Thehighest associations were between the Inattentiveness and Hyper-activity scales and the Hyperactivity and Impulsivity scales (rs �.47) and indicated that, at a minimum, 76% of the variance in eachscale was independent of scores from the other two scales. TheInattentiveness and Impulsivity scales correlated .46.
CFA of the SRI
The three-factor solution indicated by the EFA was cross-validated on the half of the sample held out from the EFA. Thereplication sample was also used to test one-factor (all parcelsloading onto a general ADHD factor, similar to the DSM–III–Rmodel) and a two-factor (Hyperactivity and Impulsivity combinedas one factor, and Inattention constituting the second factor, as perDSM–IV) model using CFA. This provides a more restrictive testof the SRI’s underlying factor structure than does EFA by explic-itly modeling the nature of relations among the variables and theirhypothesized latent dimensions. Several measures of fit exist forevaluating the quality of CFA models, each developed under asomewhat different theoretical framework and focusing on differ-ent components of fit (Browne & Cudeck, 1993; Hu & Bentler,1995). For this reason, it is generally recommended that multiplemeasures be considered to highlight different aspects of fit(Tanaka, 1993). Given the well-known problems with chi-squareas a stand-alone measure of fit (Hu & Bentler, 1995; Kaplan,1990), use of this statistic was limited to testing differences amongnested models (e.g., one-factor vs. two-factor vs. three-factormodel comparisons).
The goodness-of-fit index (GFI), adjusted GFI, Tucker–Lewisindex (TLI), comparative fit index (CFI), root-mean-square errorof approximation (RMSEA), and parsimony GFI are reported foreach model. These four measures generally range between .00 and1.00, with larger values reflecting better fit. Traditionally, valuesof .90 or greater are interpreted as evidence of models that fit well(Bentler & Bonett, 1980). However, the more recent literaturesuggests that better fitting models produce values around .95 (Hu& Bentler, 1995). By contrast, smaller RMSEA values supportbetter fitting models, with values of .05 or less indicating good fit(Browne & Cudeck, 1993). Finally, the Akaike information crite-rion and expected cross-validation index are two fit indices thatindicate the likelihood of the present model replicating on anindependent sample of data; for both measures, lower scoresindicate better fit. All models were estimated with the softwareprogram AMOS (Arbuckle & Wothke, 1999) via maximum-likelihood estimation on covariance matrices derived from stan-dard scores.
Measures of fit for the one-, two-, and three-factor CFA modelsare presented in Table 2. The three-factor solution fit best, with allthree-factor model fit measures exceeding those for the one- andtwo-factor models. Moreover, there was a statistically significantreduction in chi-square when we moved from the two-factor modelto the three-factor model, ��2(2) � 274.01, p � .001, and whenwe moved from the one-factor model to the two-factor model,��2(1) � 419.96, p � .001. Thus, results from the CFA align withthose from the EFA analysis to show that the three-factor solutionbest accounted for the structure and organization of constructs
48 GLUTTING, YOUNGSTROM, AND WATKINS

measured by the SRI. Table 1 presents the standardized factorloadings from the CFA, which are consistently close to the promaxpattern coefficients from the other sample.
According to Kline (1998), good measurement models demon-strate moderate to high factor loadings (convergent validity) and
factor correlations that are not unreasonably high (less than .85;discriminant validity). In this context, discriminant validity per-tains to factor distinctiveness. As can be seen in Table 1, all factorloadings were appreciable, ranging from .59 to .89. In addition, aseparate, multigroup CFA found that the three-factor structure
Table 1Promax Pattern Coefficients and Confirmatory Factor Analysis Loadings for Student Report Miniscales
Miniscaleno. Items in each miniscale
Hypothesizedfactor ofminiscale
Miniscalep value
Factor loading
1 2 3
1 I daydream in class. Inattentiveness .28 .69.68I find it difficult staying tuned in with tasks like this questionnaire.
I am good at organizing activities.a
2 I make careless mistakes on homework, exams, and other activities. Inattentiveness .29 .52.64I often lose things necessary for school tasks or activities.
I rush through assignments or projects just to get them done.3 I start out doing one thing and end up doing something else. Inattentiveness .29 .67
.69When oral assignments are given, I write them down correctly.a
I notice important details in an assignment.a
4 My class notes are borrowed.a Inattentiveness .29 .75.62I avoid, dislike, or am reluctant to engage in school tasks that require sustained
mental effort.I am known for getting things done on time.a
5 I get lost in my thoughts. Inattentiveness .29 .65.70I am known as someone who can be expected to be “on time.”a
I am forgetful in daily activities.6 I can get down to work easily.a Inattentiveness .29 .69
.70I find myself borrowing pen, pencil, or paper in class.I rush through assignments or projects just to get them done.
7 So I do not forget things, I keep a daily calendar or assignment book.a Inattentiveness .30 .68.54I get all of the things done I need to during the week.a
I think things through before deciding.8 I fidget with my hand or feet and squirm in my seat. Hyperactivity .45 .97
.87I have difficulty remaining seated.When seated some part of me is moving.
9 I move some part of my body while doing seatwork. Hyperactivity .46 .80.88I feel “squirmy.”
I am easily distracted by extraneous stimuli.“Restless” is a word that describes me.
10 I fiddle with things near where I am standing. Hyperactivity .45 .81.81When watching TV, eating, or studying, I’m moving or fidgeting.
It’s easy for me to stay seated for a whole class lecture.a
11 My thoughts race quickly from one thing to the next, and there’s no stoppingthem.
Impulsivity .26 .46.72
I do not seem to listen when spoken to directly.I have difficulty engaging in leisure time activities.
12 I make running commentaries on activities taking place around me. Impulsivity .25 .68.65I get into arguments more than other people.
I blurt out answers before questions have been completed.I make unusual vocal noises.
13 I am patient when waiting my turn.a Impulsivity .27 .63.65I talk out of turn to others.
I interrupt people’s conversations or activities.14 I talk excessively. Impulsivity .45 .92
.70I hum, make noises, or talk too loudly.I start to answer questions while the other person is still talking.
Note. N � 1,079, randomly divided into two samples used for principal-axis factoring extraction exploratory factor analysis with promax rotation (n �540) and confirmatory factor analysis of the hypothesized structure (n � 539). Pattern coefficients greater than or equal to .40 are considered salient.Interpretation was simplified through the presentation of only salient coefficients for the exploratory factor analysis. All nonzero loadings from theconfirmatory factor analysis model are presented. In the factor loadings, the first coefficient given is the promax pattern coefficient, and the second is theconfirmatory factor analysis factor loading. The miniscale p value represents the averaged difficulty level of items in the miniscale. Thus, if a miniscalecontained three items with p values that showed 22% of respondents answered agree, 20% of respondents answered agree, and 18% of respondentsanswered agree, the p value for the miniscale would equal .20 (i.e., [.22 � .20 � .18]/3). Test items from The College ADHD Response Evaluation (CARE),by J. Glutting, D. Sheslow, & W. Adams. Copyright 2002 by Wide Range, Inc. Reproduction of items for test use is prohibited. Reprinted with permission.a Questions stated in the affirmative were reverse coded for all analyses—that is, agree (0 points), undecided (1 point), and disagree (2 points).
49FACTOR STRUCTURE OF ADHD AMONG COLLEGE STUDENTS

replicated across genders: �2(189, N � 1,079) � 487.70, GFI �.94, CFI � .95, RMSEA � .040.
EFA of the PRI
The EFAs were repeated for miniscales developed for the PRIusing the randomly drawn sample of 539. PA, MAP, and screecriteria strongly indicated that two factors be retained for rotation.Consequently, two factors that accounted for 62.4% of the totalvariance of the PRI were retained. Because three factors appearedinterpretable for the SRI, we also examined a three-factor solutionfor the PRI. The third factor had an unrotated eigenvalue of only.591, and after rotation only one parcel showed a loading greaterthan .20 (pattern coefficient � .42).
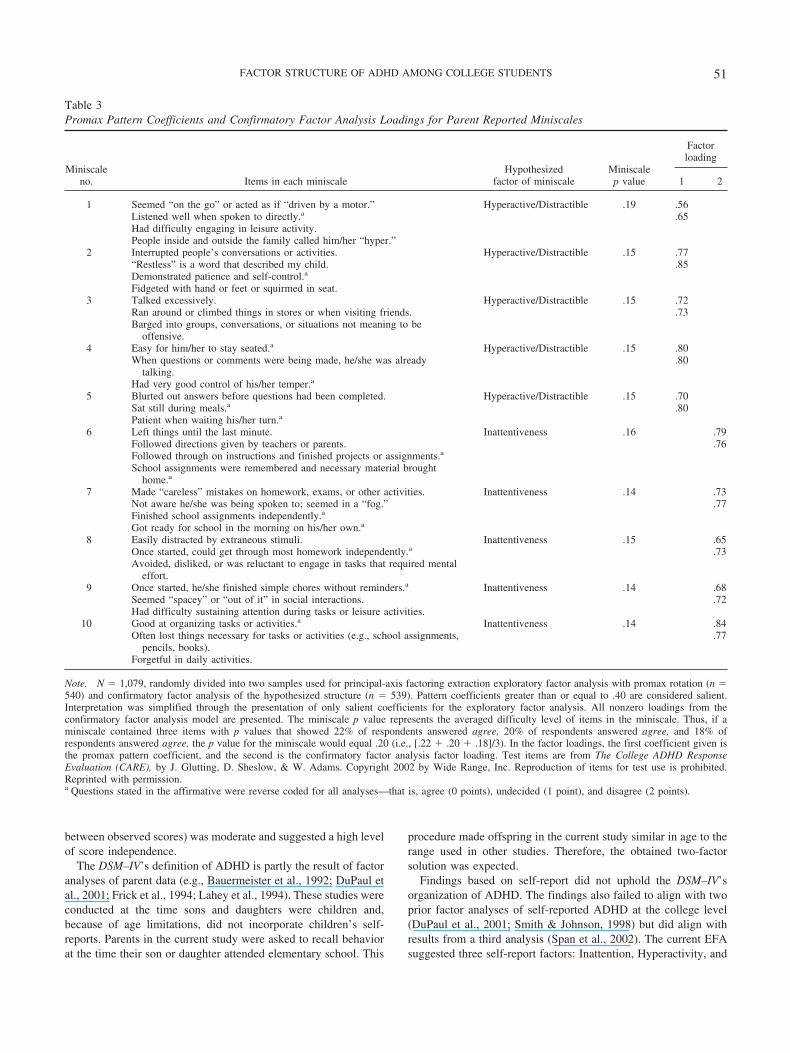
The two retained factors were interpreted according to the sizeof salient pattern coefficients. Table 3 displays the rotated patternmatrix for the two factors. Every miniscale showed only onesalient pattern coefficient. Column 2 in Table 3 lists the specificitems loading on each factor. The first dimension was defined byitems portraying restless behavior, fidgeting, impatience, interrupt-ing other people, and the inability to inhibit responses. As a result,the factor was termed Hyperactivity/Impulsivity. The second di-mension was characterized by items describing poor organization,inability to follow through on instructions, forgetfulness, and lowlevels of vigilance and sustained attention. Therefore, the factorwas named Inattentiveness. Unlike findings for the SRI, the PRI’stwo-factor solution showed a strong resemblance to the currenttwo-factor model of ADHD in the DSM–IV. Internal-consistencyreliability estimates for the two factors were .85 and .86, respec-tively. Furthermore, the relation between the PRI’s two factors(r � .48 for the factors, and r � .44 for the two observed scalescores) was moderate and indicated that examiners can interpretthe two scores separately because 77% of their variance isindependent.
CFA of the PRI
CFA was used to cross-validate the results of the EFA on thesample (n � 540) held out from the exploratory analyses. CFA
also evaluated the fit of one-factor and three-factor models for thePRI. Measures of fit for the CFA models are presented in Table 4.Preference was clearly indicated for the two-factor solution, withall two-factor model fit measures exceeding those for the one-factor model. Moreover, there was a statistically significant reduc-tion in chi-square when we moved from the one-factor model tothe two-factor model, ��2(1) � 723.32, p � .001. Conversely,there was no significant improvement in fit when we moved froma two- to a three-factor model, and some of the cross-validationindices actually degraded with the more complicated three-factormodel. Thus, results from the CFA analysis aligned with thosefrom the EFA analysis to show that a two-factor solution bestaccounted for the structure and organization of constructs mea-sured by the PRI.
The preferred two-factor model is presented in Table 3, alongwith its standardized values. As illustrated, all factor loadings wereappreciable, ranging from .59 to .83. Last, a multigroup CFA alsofound that the two-factor structure replicated across genders:��2(89) � 324.84, GFI � .94, adjusted GFI � .93, CFI � .95,RMSEA � .050.
Comparison of Student and Parent Reports
Student and parent reports on the CARE showed moderatecorrelations. Student and parent Inattentiveness scales correlated.32, and the parent Hyperactivity/Impulsivity scale correlated .28with the student Impulsivity and .23 with the student Hyperactivityscale (all ps � .0005, two-tailed). Contrary to previous findingswith younger samples, the college students actually reported sig-nificantly higher levels of concerns than did their parents. Usingpaired t tests to compare the average item score for parents versusstudents, we found that students reported more concerns aboutinattentiveness (student M � 0.42 vs. 0.24 for parents), t(1079) �15.70, p � .0005. Similarly, the student means for Hyperactivity(M � 0.70) and Impulsivity (M � 0.35) were both significantlyhigher than the parent report of hyperactive and impulsive symp-toms (M � 0.25), ts(1079) � 25.58 and 8.88, respectively.
Discussion
The present study evaluated construct (factorial) validity forADHD ratings obtained at the college level. Both student andparent reports were examined. Two earlier investigations foundADHD factors among college students that corresponded to theDSM–IV’s organization: (a) Inattentiveness and (b) Hyperactivity/Impulsivity (DuPaul et al., 2001; Smith & Johnson, 1998). Bycontrast, a third study found a three-factor solution analogous tothe one offered in the DSM–III: (a) Inattentiveness, (b) Hyperac-tivity, and (c) Impulsivity (Span et al., 2002). All three priorstudies used student self-reports.
In the present study, parent-reported symptoms aligned wellwith the DSM–IV’s organization. An EFA using a random draw ofhalf of the sample uncovered two factors: Inattention and Hyper-activity/Impulsivity. This structure was supported through CFA onthe other half of the sample, and the factors replicated by gender.Reliability estimates for the two parent-report factors were appre-ciable (Inattention � .85, Hyperactivity/Impulsivity � .86). Inaddition, the correlation between the two factors (r � .48, or .44
Table 2One-, Two-, and Three-Factor CFA Model Fit Statistics forStudent Report
Goodness of fitOne-factor
modelTwo-factor
modelThree-factor
model
df 77 76 74�2 921.758 501.801 227.792GFI .749 .858 .941AGFI .658 .804 .916TLI .682 .838 .940CFI .731 .865 .951RMSEA .143 .102 .062AIC 977.76 559.80 289.79ECVI 1.817 1.041 0.539
Note. The sample used was the cross-validation sample of 539 partici-pants held out of the initial exploratory factor analysis. CFA � confirma-tory factor analysis; GFI � goodness-of-fit index; AGFI � adjusted GFI;TLI � Tucker–Lewis index; CFI � comparative fit index; RMSEA �root-mean-square error of approximation; AIC � Akaike’s informationcriterion; ECVI � expected cross-validation index.
50 GLUTTING, YOUNGSTROM, AND WATKINS
between observed scores) was moderate and suggested a high levelof score independence.
The DSM–IV’s definition of ADHD is partly the result of factoranalyses of parent data (e.g., Bauermeister et al., 1992; DuPaul etal., 2001; Frick et al., 1994; Lahey et al., 1994). These studies wereconducted at the time sons and daughters were children and,because of age limitations, did not incorporate children’s self-reports. Parents in the current study were asked to recall behaviorat the time their son or daughter attended elementary school. This
procedure made offspring in the current study similar in age to therange used in other studies. Therefore, the obtained two-factorsolution was expected.
Findings based on self-report did not uphold the DSM–IV’sorganization of ADHD. The findings also failed to align with twoprior factor analyses of self-reported ADHD at the college level(DuPaul et al., 2001; Smith & Johnson, 1998) but did align withresults from a third analysis (Span et al., 2002). The current EFAsuggested three self-report factors: Inattention, Hyperactivity, and
Table 3Promax Pattern Coefficients and Confirmatory Factor Analysis Loadings for Parent Reported Miniscales
Miniscaleno. Items in each miniscale
Hypothesizedfactor of miniscale
Miniscalep value
Factorloading
1 2
1 Seemed “on the go” or acted as if “driven by a motor.” Hyperactive/Distractible .19 .56.65Listened well when spoken to directly.a
Had difficulty engaging in leisure activity.People inside and outside the family called him/her “hyper.”
2 Interrupted people’s conversations or activities. Hyperactive/Distractible .15 .77.85“Restless” is a word that described my child.
Demonstrated patience and self-control.a
Fidgeted with hand or feet or squirmed in seat.3 Talked excessively. Hyperactive/Distractible .15 .72
.73Ran around or climbed things in stores or when visiting friends.Barged into groups, conversations, or situations not meaning to be
offensive.4 Easy for him/her to stay seated.a Hyperactive/Distractible .15 .80
.80When questions or comments were being made, he/she was alreadytalking.
Had very good control of his/her temper.a
5 Blurted out answers before questions had been completed. Hyperactive/Distractible .15 .70.80Sat still during meals.a
Patient when waiting his/her turn.a
6 Left things until the last minute. Inattentiveness .16 .79.76Followed directions given by teachers or parents.
Followed through on instructions and finished projects or assignments.a
School assignments were remembered and necessary material broughthome.a
7 Made “careless” mistakes on homework, exams, or other activities. Inattentiveness .14 .73.77Not aware he/she was being spoken to; seemed in a “fog.”
Finished school assignments independently.a
Got ready for school in the morning on his/her own.a
8 Easily distracted by extraneous stimuli. Inattentiveness .15 .65.73Once started, could get through most homework independently.a
Avoided, disliked, or was reluctant to engage in tasks that required mentaleffort.
9 Once started, he/she finished simple chores without reminders.a Inattentiveness .14 .68.72Seemed “spacey” or “out of it” in social interactions.
Had difficulty sustaining attention during tasks or leisure activities.10 Good at organizing tasks or activities.a Inattentiveness .14 .84
.77Often lost things necessary for tasks or activities (e.g., school assignments,pencils, books).
Forgetful in daily activities.
Note. N � 1,079, randomly divided into two samples used for principal-axis factoring extraction exploratory factor analysis with promax rotation (n �540) and confirmatory factor analysis of the hypothesized structure (n � 539). Pattern coefficients greater than or equal to .40 are considered salient.Interpretation was simplified through the presentation of only salient coefficients for the exploratory factor analysis. All nonzero loadings from theconfirmatory factor analysis model are presented. The miniscale p value represents the averaged difficulty level of items in the miniscale. Thus, if aminiscale contained three items with p values that showed 22% of respondents answered agree, 20% of respondents answered agree, and 18% ofrespondents answered agree, the p value for the miniscale would equal .20 (i.e., [.22 � .20 � .18]/3). In the factor loadings, the first coefficient given isthe promax pattern coefficient, and the second is the confirmatory factor analysis factor loading. Test items are from The College ADHD ResponseEvaluation (CARE), by J. Glutting, D. Sheslow, & W. Adams. Copyright 2002 by Wide Range, Inc. Reproduction of items for test use is prohibited.Reprinted with permission.a Questions stated in the affirmative were reverse coded for all analyses—that is, agree (0 points), undecided (1 point), and disagree (2 points).
51FACTOR STRUCTURE OF ADHD AMONG COLLEGE STUDENTS

Impulsivity. This structure closely parallels the three-factor modelof ADHD in the DSM–III. Each of the three factors showedreasonable reliability estimates (Inattention � .82, Hyperactiv-ity � .87, Impulsivity � .77). The three-factor organization wasalso confirmed through a CFA on an independent sample andagain by gender. In addition, moderate correlations between thethree factors (highest r � .47) indicated that each dimensionrepresents a distinct, albeit correlated, aspect of ADHDsymptomatology.
The difference between student and parent results is not surpris-ing. Prior investigations with parents and adolescents showed lowagreement about attention problems (Rohde et al., 1999). Parent-and student-report results for the current sample showed moderatecorrelations (rs � .23–.32 for similar constructs), which is consis-tent with or slightly larger than expected for parent–youth agree-ment about attention problems and externalizing behaviors(Achenbach, 1991; Achenbach et al., 1987; Achenbach & Res-corla, 2001).
The divergence in student structures cannot be attributed to theinformant. The three prior studies, as well as the current investi-gation, used self-reports. The differences also cannot be due to age,ability level, or sample size, because all four investigations exam-ined individuals attending college and used large sample sizes,each of which included 400 or more participants. Likewise, fac-toring methods may not fully account for the discrepancies. Twostudies used EFA, and three used CFA. Moreover, one of theformer studies, as well as the current investigation, used both EFAand CFA. However, it is worth noting that the present study is thefirst in this content area to use what methodologists agree are themost accurate decision rules for determining the number of factors:PA (Glorfeld, 1995; Horn, 1965) and the MAP method (Velicer,1976). Prior investigations have relied on algorithms (maximum-likelihood estimation chi-square and derivative fit indices, or theKaiser criterion of retaining eigenvalues greater than 1.0) that havedemonstrated a tendency to retain too many factors (Velicer et al.,2000). It would be valuable to reanalyze prior data sets using PAand MAP to see whether these more conservative and accuratemethods consistently suggest a two-factor structure.
It remains an open question whether a two- or a three-factormodel best accounts for student-reported ADHD. A small numberof studies using adolescent self-reports found a three-factor struc-ture similar to the one obtained here (Gomez et al., 1999; Pillow etal., 1998). However, the most plausible reason why the currentstudy obtained a three-factor solution relates to its extensive sam-pling of impulsivity content. The three earlier studies used either18 items, 1 for each ADHD criterion in the DSM–IV (Smith &Johnson, 1998; Span et al., 2002), or 24 items, 18 of which camedirectly from the DSM–IV (DuPaul et al., 2001). These items wereused to define the entire content domain of ADHD. Yet only threeof the DSM–IV’s ADHD criteria evaluate impulsivity. The SRI,conversely, augments domain sampling by going beyond theDSM–IV. Mental health professionals who work with collegestudents with ADHD developed items appropriate to the specificcontexts and demands of college life (e.g., studying and doinghomework, sitting through lectures, answering questions, takingexams, completing projects on time). As a result, the SRI uses 13items to sample impulsivity content. This is over four times morethan the three criteria in the DSM–IV. Therefore, the emergence ofan Impulsivity factor may be a consequence of the current studyincluding developmentally appropriate items that provide a morethorough assessment of impulsivity content.
The majority of constructs used to describe child adjustment andwell-being are tied to observable behaviors (Edelbrock, 1988;McDermott, 1986). Such objective phenomena are usually evalu-ated through ratings completed by knowledgeable adults (e.g.,parents and teachers). It may be the case that symptoms associatedwith impulsivity become more internalized and concealed by thetime individuals reach college age. If so, an Impulsivity factor isless likely to emerge when ADHD ratings are obtained fromparents, friends, or employers. Alternatively, hyperactivity andimpulsivity may serve as a single construct in childhood becauseself-monitoring skills have not developed fully (Span et al., 2002).For these reasons, self-reported impulsivity levels not only areuseful but also may be necessary to obtain a full understanding ofADHD at the college level.
Results were unexpected for specific criteria in the DSM–IV.Although 15 of the 18 items in the student-report analysis loadedon their hypothesized factor, 3 items were problematic. TwoDSM–IV items theoretically should have loaded on the Inattentive-ness dimension but showed appreciable pattern coefficients on theHyperactivity factor (i.e., “I am easily distracted by extraneousstimuli,” and “I do not seem to listen when spoken to directly”).Likewise, the item “I talk excessively” was expected to load onHyperactivity but instead loaded on the Impulsivity factor. Thesethree items were previously found to be problematic during anEFA of the DSM–IV’s criteria (cf. Glutting, Sheslow, & Adams,2002). Thus, findings for specific items align with results fromabove to suggest that, by themselves, the DSM–IV criteria may beinsensitive to the developmental expression of how, when, andwhere ADHD occurs with college students.
Outcomes from the current study need to be replicated andextended. One limitation of the study is that only 5% of the samplewas known to have ADHD. Current factor structures obtained withboth students and parents need to be further explored with clinicalsamples. A second limitation is that the study did not addressdiagnostic utility. A prior investigation reported high levels ofdiscriminant validity for the CARE, but the ADHD group was
Table 4One-, Two-, and Three-Factor CFA Model Fit Statistics forParent Report
Goodnessof fit
One-factormodel
Two-factormodel
Three-factormodel
df 35 34 33�2 776.483 53.165 52.556GFI .670 .980 .981AGFI .482 .968 .968TLI .633 .990 .990CFI .715 .993 .992RMSEA .198 .032 .033AIC 816.483 95.165 96.556ECVI 1.515 0.177 0.179
Note. Sample (n � 540) was the cross-validation sample held out of theinitial exploratory factor analysis. CFA � confirmatory factor analysis;GFI � goodness-of-fit index; AGFI � adjusted GFI; TLI � Tucker–Lewisindex; CFI � comparative fit index; RMSEA � root-mean-square error ofapproximation; AIC � Akaike’s information criterion; ECVI � expectedcross-validation index.
52 GLUTTING, YOUNGSTROM, AND WATKINS

restricted to 55 participants (Glutting, Sheslow, & Adams, 2002).Further validation is required with larger and more varied clinicalsamples (e.g., comparing CARE results of those with ADHD vs.those with LD and of student vs. parent raters). Likewise, associ-ations to important criteria such as college grade point average areneeded to determine the extent to which ADHD impedes academicperformance.
A benefit of the CARE is its use of multiple informants. Al-though current results show that the CARE has good factorialvalidity, the findings are incomplete because they did not separatetrait variance from source variance. When only a single source isused to evaluate the properties of ADHD measures, it is impossibleto separate the amount of trait variance (e.g., inattentiveness,hyperactivity, impulsivity) from that due to source variance (i.e.,the rater). Two recent studies with children demonstrated that up to59% of the common variance between parent and teacher ratingsof ADHD was due to source rather than trait variance (Burns,Walsh, & Gomez, 2003; Gomez, Burns, Walsh, & Moura, 2003).Similar analyses need to be conducted between student and parentratings from the CARE to determine whether strong source effectsare also present in ADHD assessments at the college level.
It is surprising that students in the current study reported higheraverage symptom scores than did parents, which differs fromprevious reports with younger adolescents who underreportedsymptoms (Cantwell, Lewinsohn, Rohde, & Seeley, 1997). It ispossible that college students might have more insight into theirown symptoms than is typical for youths with externalizing prob-lems, by virtue of either their age or their above-average cognitiveability. The parent and student inventories did not include exactlythe same item content, but this seems unlikely to explain thedifferences fully, as parent report of hyperactive and impulsivesymptoms was lower than the averages for both hyperactive andimpulsive items considered separately for student reports. Giventhe discrepancies obtained here, it is likely that examiners need toadminister both the SRI and the PRI to enhance the ecologicalvalidity of ADHD assessments by emphasizing the value of cross-informant inputs. In addition, like most personality measures, theSRI and PRI are dependent on the insight and accuracy of raters.Examiners need to be aware of this limitation and take into accountthat the validity of the SRI and PRI is compromised wheneverraters lack insight or purposively over- or underreport symptoms.
References
Achenbach, T. M. (1991). Integrative guide for the 1991 CBCL/4–18, YSR,and TRF profiles. Burlington: University of Vermont, Department ofPsychiatry.
Achenbach, T. M., McConaughy, S. H., & Howell, C. T. (1987). Child/adolescent behavioral and emotional problems: Implications of cross-informant correlations for situational specificity. Psychological Bulletin,101, 213–232.
Achenbach, T. M., & Rescorla, L. (2001). Achenbach System of Empiri-cally Based Assessment. Burlington: University of Vermont, Departmentof Psychiatry.
Allen, M. J., & Yen, W. M. (1979). Introduction to measurement theory.Monterey, CA: Brooks/Cole.
American Psychiatric Association. (1980). Diagnostic and statistical man-ual of mental disorders (3rd ed.). Washington, DC: Author.
American Psychiatric Association. (1987). Diagnostic and statistical man-ual of mental disorders (3rd ed., rev.). Washington, DC: Author.
American Psychiatric Association. (1994). Diagnostic and statistical man-ual of mental disorders (4th ed.). Washington, DC: Author.
Arbuckle, J. L., & Wothke, W. (1999). AMOS 4.0: Users guide. Chicago:Small Works.
Barbett, S. F., & Korb, R. A. (1997). Enrollment in higher education: Fall1995 (NCES 97–440). Washington, DC: National Center for Educa-tional Statistics, U. S. Department of Education, Office of EducationalResearch and Improvement.
Barkley, R. A. (1990). Attention deficit hyperactivity disorder: A handbookfor diagnosis and treatment. New York: Guilford Press.
Barkley, R. A. (1998). Attention-deficit hyperactivity disorder: A handbookof diagnosis and treatment (2nd ed.). New York: Guilford Press.
Barkley, R. A., Fischer, M., Edelbrock, C. S., & Smallish, L. (1990). Theadolescent outcome of hyperactive children diagnosed by research cri-teria: I. An 8-year prospective follow-up study. Journal of the AmericanAcademy of Child and Adolescent Psychiatry, 29, 546–557.
Barkley, R. A., Fischer, M., Smallish, L., & Fletcher, K. (2002). Thepersistence of attention-deficit/hyperactivity disorder into young adult-hood as a function of reporting source and definition of disorder. Journalof Abnormal Psychology, 111, 279–289.
Bauermeister, J. J., Alegria, M., Bird, H., Robio-Stipec, M., & Canino, G.(1992). Are attentional-hyperactivity deficits unidimensional or multi-dimensional syndromes? Empirical findings from a community survey.Journal of the American Academy of Child and Adolescent Psychiatry,31, 423–431.
Bentler, P. M., & Bonett, D. G. (1980). Significance tests and goodness offit in the analysis of covariance structures. Psychological Bulletin, 88,588–606.
Biederman, J. (2003). Pharmacotherapy for attention-deficit/hyperactivitydisorder (ADHD) decreases the risk for substance abuse: Findings froma longitudinal follow-up of youths with and without ADHD. Journal ofClinical Psychiatry, 64, 3–8.
Biederman, J. Faraone, S. V., Taylor, A., Sienna, M., Williamson, S., &Fine, C. (1998). Diagnostic continuity between child and adolescentADHD: Findings from a longitudinal clinical sample. Journal of theAmerican Academy of Child Adolescent Psychiatry, 37, 305–313.
Bird, H. R., Gould, M. S., & Staghezza, B. (1992). Aggregating data frommultiple informants in child psychiatry epidemiological research. Jour-nal of the American Academy of Child and Adolescent Psychiatry, 31,78–85.
Brown, T. E. (1996). Brown Attention-Deficit Disorders Scales. San An-tonio, TX: Psychological Corporation.
Browne, M. W., & Cudeck, R. (1993). Alternative ways of assessing modelfit. In K. A. Bollen & J. S. Long (Eds.), Testing structural equationmodels (pp. 136–162). Newbury Park, CA: Sage.
Buja, A., & Eyuboglu, N. (1992). Remarks on parallel analysis. Multivar-iate Behavioral Research, 27, 509–540.
Burns, G. L., Walsh, J. A., & Gomez, R. (2003). Convergent and discrimi-nant validity of trait and source effects in ADHD-inattention and hyper-activity/impulsivity measures across a 3-month interval. Journal ofAbnormal Child Psychology, 31, 529–541.
Burns, G. L., Walsh, J. A., Patterson, D. R., Holte, C. S., Sommers-Flanagan, R., & Parker, C. M. (1997). Internal validity of the disruptivebehavior disorder symptoms: Implications from parent ratings for adimensional approach to symptom validity. Journal of Abnormal ChildPsychology, 25, 307–319.
Cantwell, D. P., Lewinsohn, P. M., Rohde, P., & Seeley, J. R. (1997).Correspondence between adolescent report and parent report of psychi-atric diagnostic data. Journal of the American Academy of Child &Adolescent Psychiatry, 36, 610–619.
Cattell, R. B. (1966). The scree test for the number of factors. MultivariateBehavioral Research, 1, 245–276.
College Board. (2000). National SAT averages. Retrieved November,2000, from www.collegeboard.org/stat/cbsenior/html/sat00c.html
53FACTOR STRUCTURE OF ADHD AMONG COLLEGE STUDENTS

Collett, B. R., Crowley, S. L., Gimpel, G. A., & Greenson, J. N. (2000).The factor structure of DSM–IV attention deficit-hyperactivity symp-toms: A confirmatory factor analysis of the ADHD:SRS. Journal ofPsychoeducational Assessment, 18, 361–373.
Conners, C. K., Erhardt, D., Epstein, J. N., Parker, J. D., Sitarenios, G., &Sparrow, E. (1999). Self-ratings of ADHD symptoms in adults: I. Factorstructure and normative data. Journal of Attention Disorders, 3, 141–151.
Conners, C. K., Erhardt, D., & Sparrow, E. (1999). Conners’ Adult ADHDRating Scales (CAARS): Technical manual. Odessa, FL: PsychologicalAssessment Resources.
Cronbach, L. J. (1951). Coefficient alpha and the internal structure of tests.Psychometrika, 16, 297–334.
Danforth, J. S., Barkley, R. A., & Stokes, T. F. (1991). Observations ofparent-child interactions with hyperactive children: Research and clini-cal implications. Clinical Psychology Review, 11, 703–727.
DuPaul, G. J. (1991). Parent and teacher ratings of ADHD symptoms:Psychometric properties in a community-based sample. Journal of Clin-ical Child Psychology, 20, 242–253.
DuPaul, G. J., Schaughency, E. A., Weyandt, L. L., Weyandt, G. T.,Kiesner, J., Ota, K., & Stanish, H. (2001). Self-report of ADHD symp-toms in university students: Cross-gender and cross-national prevalence.Journal of Learning Disabilities, 34, 370–379.
Edelbrock, C. S. (1988). Informant reports. In E. S. Shapiro & T. R.Kratchowill (Eds.), Behavioral assessment in schools: Conceptual foun-dations and practical applications (pp. 352–373). New York: GuilfordPress.
Eisenberg, L. (1966). The management of the hyperkinetic child. Devel-opmental Medical Child Neurology, 8, 593–632.
Fabrigar, L. R., Wegener, D. T., MacCallum, R. C., & Strahan, E. J.(1999). Evaluating the use of exploratory factor analysis in psycholog-ical research. Psychological Methods, 4, 272–299.
Fergusson, D. M., Lynskey, M. T., & Horwood, L. J. (1997). Attentionaldifficulties in middle childhood and psychosocial outcomes in youngadulthood. Journal of Child Psychology & Psychiatry & Allied Disci-plines, 38, 633–644.
Fischer, M., Barkley, R. A., Fletcher, K. E., & Smallish, L. (1993). Thestability of dimensions of behavior in ADHD and normal children overan 8 year period. Journal of Abnormal Child Psychology, 21, 315–337.
Frick, P. J., Lahey, B. B., Appelgate, B., Kerdyk, L., Ollendick, T., Hynd,G. W., et al. (1994). DSM–IV field trials for the disruptive and attentiondeficit disorders: Diagnostic utility of symptoms. Journal of the Amer-ican Academy of Child and Adolescent Psychiatry, 33, 529–539.
Gittelman, R., Mannuzza, S., Shenker, R., & Bonagura, N. (1985). Hyper-active boys almost grown up: I. Psychiatric status. Archives of GeneralPsychiatry, 42, 937–947.
Glorfeld, L. W. (1995). An improvement on Horn’s parallel analysismethodology for selecting the correct number of factors to retain. Edu-cational and Psychological Measurement, 55, 377–393.
Glutting, J., & Oakland, T. (1993). GATSB: Guide to the assessment of testsession behavior for the WISC-III and WIAT. San Antonio, TX: Psy-chological Corporation.
Glutting, J., Sheslow, D., & Adams, W. (2002). The College ADHDResponse Evaluation (CARE). Wilmington, DE: Wide Range, Inc.
Glutting, J. J., Monaghan, M. C., Adams, W., & Sheslow, D. (2002). Somepsychometric properties of a system to measure ADHD among collegestudents: Factor pattern, reliability, and one-year predictive validity.Measurement and Evaluation in Counseling and Development, 34, 194–208.
Gomez, R., Burns, G. L., Walsh, J. A., & Moura, M. A. (2003). Trait,source, and error variance in ADHD symptoms in Australian and Bra-zilian children: A multitrait–multisource confirmatory factor analyticapproach to the construct validity of ADHD rating scales. PsychologicalAssessment, 15, 3–16.
Gomez, R., Harvey, J., Quick, C., Scharer, I., & Harris, G. (1999). DSM–VAD/HD: Confirmatory factor models, prevalence, and gender and agedifferences based on parent and teacher ratings of Australian primaryschool children. Journal of Child Psychology and Psychiatry, 40, 265–274.
Gorsuch, R. L. (1983). Factor analysis (2nd ed.). Hillsdale, NJ: Erlbaum.Gorsuch, R. L. (1997). Exploratory factor analysis: Its role in item analysis.
Journal of Personality Assessment, 68, 532–560.Heiligenstein, E., Conyers, L. M., Berns, A. R., & Smith, M. A. (1998).
Preliminary normative data on DSM–IV attention deficit hyperactivitydisorder in college students. College Health, 46, 185–188.
Heiligenstein, E., Guenther, G., Levy, A., Savino, F., & Fulwiler, J. (1999).Psychological and academic functioning in college students with atten-tion deficit hyperactivity disorder. College Health, 47, 181–185.
Hinshaw, S. P., Henker, B., & Whalen, C. K. (1984). Cognitive–behavioraland pharmacologic interventions for hyperactive boys: Comparative andcombined effects. Journal of Consulting and Clinical Psychology, 52,739–749.
Holland, M. L., Gimpel, G. A., & Merrell, K. (1998). Innovations inassessing ADHD: Development, psychometric properties, and factorstructure of the ADHD Symptoms Rating Scale (ADHD-SRS). Journalof Psychopathology and Behavioral Assessment, 20, 307–332.
Horn, J. L. (1965). A rationale and test for the number of factors in factoranalysis. Psychometrika, 30, 179–185.
Hu, L., & Bentler, P. M. (1995). Evaluating model fit. In R. Hoyle (Ed.),Structural equation modeling, issues, concepts, and applications (pp.76–99). Newbury Park, CA: Sage.
Joreskog, K. G. (1993). Testing structural equation models. In K. A. Bollen& J. S. Long (Eds.), Testing structural equation models (pp. 294–316).Newbury Park, CA: Sage.
Kane, R. L., Mikalac, C., Benjamin, S., & Barkley, R. A. (1990). Assess-ment and treatment of adults with ADHD. In R. A. Barkley (Eds.),Attention deficit hyperactivity disorder: A handbook for diagnosis andtreatment (pp. 121–150). New York: Guilford Press.
Kaplan, D. (1990). Evaluating and modifying covariance structure models:A review and recommendation. Multivariate Behavioral Research, 25,137–155.
Klein, R. G., & Mannuzza, S. (1991). Long-term outcome of hyperactivechildren. Journal of the American Academy of Child and AdolescentPsychiatry, 30, 383–387.
Kline, R. B. (1988). Methodological considerations in the evaluation of theconvergence of psychiatric diagnoses and parent-informant checklists.Journal of Abnormal Child Psychology, 16, 289–298.
Kline, R. B. (1998). Principles and practice of structure equation model-ing. New York: Guilford Press.
Lahey, B. B., Applegate, B., McBurnett, K., Biederman, J., Greenhill, L.,Hynd, G., et al. (1994). DSM–IV field trials for attention deficit/hyper-activity disorder in children and adolescents. Journal of the AmericanAcademy of Child and Adolescent Psychiatry, 151, 1673–1685.
Latham, P. H. (1995). Legal issues to the postsecondary student with ADD.Journal of Postsecondary Education and Disability, 11, 53–61.
Loeber, R., Green, S. M., Lahey, B. B., Frick, P. J., & McBurnett, K.(2000). Findings on disruptive behavior disorders from the first decadeof the developmental trends study. Clinical Child and Family Psychol-ogy Review, 3, 37–60.
Loeber, R., Green, S. M., Lahey, B. B., & Stouthamer-Loeber, M. (1989).Optimal informants on childhood disruptive behaviors. Developmentand Psychopathology, 1, 317–337.
Mannuzza, S., Gittelman-Klein, R., Bessler, A., Malloy, P., & LaPadula,M. (1993). Adult outcomes of hyperactive boys: Educational achieve-ment, occupational rank, and psychiatric status. Archives of GeneralPsychiatry, 50, 565–576.
McBurnett, K., Lahey, B. B., & Pfiffner, L. J. (1993). Diagnosis of
54 GLUTTING, YOUNGSTROM, AND WATKINS

attention deficit disorders in DSM–IV: Scientific basis and implicationsfor education. Exceptional Children, 60, 108–117.
McDermott, P. A. (1986). The observation and classification of exceptionalchild behavior. In R. T. Brown & C. R. Reynolds (Eds.), Psychologicalperspectives on childhood exceptionality: A handbook (pp. 136–180).New York: Wiley.
McDermott, P. A. (1994). Adjustment scales for children and adolescents.Philadelphia: Edumetric and Clinical Science.
McKelvie, S. J. (1978). Graphic rating scales—How many categories?British Journal of Psychology, 69, 185–202.
Meyer, G. J., Finn, S. E., Eyde, L. D., Kay, G. G., Moreland, K. L., Dies,R. R., et al. (2001). Psychological testing and psychological assessment:A review of evidence and issues. American Psychologist, 56, 128–165.
Molina, B. S. G., Smith, B. H., & Pelham, W. E. (2001). Factor structureand criterion validity of secondary school teacher ratings of ADHD andODD. Journal of Abnormal Child Psychology, 29, 71–82.
Muthen, L. K., & Muthen, B. O. (1998). Mplus: The comprehensivemodeling program for applied researchers. Los Angeles: Author.
Nunnally, J. C., & Bernstein, I. H. (1994). Psychometric theory (3rd ed.).New York: McGraw-Hill.
Pelham, W. E., Gnagy, E., Greenslade, K. E., & Milich, R. (1992). Teacherratings of DSM–III–R symptoms for the disruptive behavior disorders.Journal of the American Academy of Child and Adolescent Psychiatry,31, 210–217.
Peterson, B. S., Pine, D. S., Cohen, P., & Brook, J. S. (2001). Prospective,longitudinal study of tic, obsessive-compulsive, and attention-deficit/hyperactivity disorders in an epidemiological sample. Journal of theAmerican Academy of Adolescent Psychiatry, 40, 685–695.
Pillow, D. R., Pelham, W. E., Hoza, B., Molina, B. S. G., & Stulz, C. H.(1998). Confirmatory factor analyses examining attention deficit hyper-activity disorder symptoms and other childhood disruptive behaviors.Journal of Abnormal Child Psychology, 26, 293–309.
Rice, M. E., & Harris, G. T. (1995). Violent recidivism: Assessing pre-dictive validity. Journal of Consulting and Clinical Psychology, 63,737–748.
Richard, M. M. (1995). Pathways to success for the college student withADD: Accommodations and preferred practices. Journal of Postsecond-ary Education and Disability, 11, 16–30.
Robin, A. L. (1998). ADHD in adolescents: Diagnosis and treatment. NewYork: Guilford Press.
Rohde, L. A., Biederman, J., Busnello, E. A., Zimmermann, H., Schmitz,M., Martins, S., & Tramontina, S. (1999). ADHD in a school sample ofBrazilian adolescents: A study of prevalence, comorbid conditions, andimpairments. Journal of the American Academy of Child and AdolescentPsychiatry, 38, 716–722.
Shapiro, E. S., & Skinner, C. H. (1990). Principles of behavioral assess-ment. In C. R. Reynolds & R. W. Kamphaus (Eds.), Handbook ofpsychological and educational assessment of children: Personality, be-havior, and context (Vol. 2, pp. 343–363). New York: Guilford Press.
Smith, E. V., & Johnson, B. D. (1998). Factor structure of the DSM–IV:Criteria for college students using the adult behavior checklist. Mea-surement and Evaluation in Counseling and Development, 31, 164–183.
Span, S. A., Earleywine, M., & Strybel, T. Z. (2002). Confirming the factorstructure of attention deficit hyperactivity disorder symptoms in adult,nonclinical samples. Journal of Psychopathology and Behavioral As-sessment, 24, 129–136.
Spencer, T., Biederman, J., Wilens, T., & Faraone, S. V. (1994). Is
attention-deficit hyperactivity disorder in adults a valid disorder? Har-vard Review of Psychiatry, 1, 326–385.
Steinberg, L., & Jorgensen, P. (1996). Assessing the MMPI-based Cook–Medley Hostility Scale: The implications of dimensionality. Journal ofPersonality and Social Psychology, 56, 1281–1287.
Tanaka, J. S. (1993). Multifaceted conceptions of fit in structural equationmodels. In K. S. Bollen & J. S. Long (Eds.), Testing structural equationmodels (pp. 10–39). Newbury Park, CA: Sage.
Thorndike, R. L. (1982). Applied psychometrics. Boston: Houghton Miff-lin.
Tseng, O. C. (1983). A comparative evaluation of four response formats inpersonality ratings. Educational and Psychological Measurement, 43,935–950.
Velicer, W. F. (1976). Determining the number of components from thematrix of partial correlations. Psychometrika, 31, 321–327.
Velicer, W. F., Eaton, C. A., & Fava, J. L. (2000). Construct explicationthrough factor or component analysis: A review and evaluation ofalternative procedures for determining the number of factors or compo-nents. In R. D. Goffin & E. Helmes (Eds.), Problems and solutions inhuman assessment: A fetschrift to Douglas Jackson at seventy (pp.41–71). Norwell, MA: Kluwer Academic.
Waschbusch, D. A., Kipp, H. L., & Pelham, W. E., Jr. (1998). Generali-zation of behavioral and psychostimulant treatment of attention-deficit/hyperactivity disorder (ADHD): Discussion and examples. BehaviorResearch and Therapy, 36, 675–694.
Wechsler, D. E. (1991). Wechsler Intelligence Scale for Children (3rd ed.).San Antonio, TX: Psychological Corporation.
Weiss, G., & Hechtman, L. (1993). Hyperactive children grown up (2nded.). New York: Guilford Press.
Wender, P. H. (1995). Attention-deficit hyperactivity disorder in adults.New York: Oxford University Press.
Wender, P. H., Reimherr, F. W., & Wood, D. R. (1981). Attention deficitdisorder (minimal brain dysfunction) in adults: A replication study ofdiagnosis and drug treatment. Archives of General Psychiatry, 38, 449–456.
Weyandt, L. L., Linterman, I., & Rice, J. A. (1995). Reported prevalenceof attention difficulties in a general sample of college students. Journalof Psychopathology and Behavioral Assessment, 17, 293–304.
Wolraich, M. L., Hannah, J. N., Pinnock, T. Y., Baumgaertel, A., &Brown, J. (1996). Comparison of diagnostic criteria for attention-deficithyperactivity disorder in a county-wide sample. Journal of the AmericanAcademy of Child and Adolescent Psychiatry, 35, 319–324.
Youngstrom, E. A., Loeber, R., & Stouthamer-Loeber, M. (1999, August).Factors influencing youth self-report agreement with parent/teacherbehavior ratings. Paper presented at the 107th Annual Convention of theAmerican Psychological Association, Boston.
Zwick, R. (1987). Assessment of dimensionality of year 15 reading data. InA. E. Baton (Ed.), Implementing the new design: The NAEP technicalreport (Tech. Rep. No. 121). Princeton, NJ: Educational Testing Service.
Zwick, W. R., & Velicer, W. F. (1986). Comparison of five rules fordetermining the number of components to retain. Psychological Bulletin,117, 253–269.
Received July 2, 2003Revision received August 18, 2004
Accepted September 8, 2004 �
55FACTOR STRUCTURE OF ADHD AMONG COLLEGE STUDENTS