Addressing potent single molecule AFM study in prediction of swelling and dissolution rate in...
9
Research paper Addressing potent single molecule AFM study in prediction of swelling and dissolution rate in polymer matrix tablets Biljana Govedarica a,⇑ , Tamás Sovány b , Klara Pintye-Hódi b , Miha Škarabot c , Saša Baumgartner a , Igor Muševic ˇ c , Stane Src ˇic ˇ a a Department of Pharmaceutical Technology, University of Ljubljana, Ljubljana, Slovenia b Department of Pharmaceutical Technology, University of Szeged, Szeged, Hungary c Department of Condensed Matter Physics, Joz ˇef Stefan Institute, Ljubljana, Slovenia article info Article history: Received 3 July 2011 Accepted in revised form 12 September 2011 Available online 21 September 2011 Keywords: AFM Xanthan Single molecule Nanoindentation Matrix tablets Swelling abstract Our goal was to understand and thus be able to predict the swelling behavior of xanthan matrix tablets in media of various pH and ionic strengths using data obtained from single xanthan molecules and films with atomic force microscopy. Imaging was performed in 1-butanol using contact mode AFM in order to characterize single xanthan chains prepared from various solutions. Image analysis was used to calculate the molecular contour, per- sistence length, and radius of gyration. Nanoindentation measurements of xanthan films were carried out to evaluate their mechanical properties. Increasing the ionic strength of solutions induced reductions in chain parameters such as molecular contour, persistence length, and radius of gyration. Nanomechanical measurements demonstrated that Young’s moduli of xanthan films prepared from solutions with higher ionic strengths are twice as large as those prepared at lower ionic strengths. This may help explain xan- than matrix tablets’ reduced degree of swelling and faster dissolution rate in the presence of salts or ions. We successfully come to conclusion that microscopic polymer properties such as radius of gyration and persistence length are responsible for the macroscopic polymer behavior. For instance, longer persistence lengths and radius of gyration of xanthan’s chains result in a higher degree of swelling, corresponding to softer polymer films, increased gel layers in matrix, and a slower release rate of the incorporated drug from the tablets. Ó 2011 Elsevier B.V. All rights reserved. 1. Introduction Drug delivery is an important drug life-cycle management tool. Controlled-release technology (CRT) evolved in the 1950s with matrix technology in order to achieve a constant release rate of the incorporated drug. Since that time, the industry has invented a number of innovative oral controlled-release dosage forms, with new patents being awarded at a rapid pace. Recent advances in oral CRT are mostly attributed to the development and implementation of novel biocompatible polymers. To date, the main drug-delivery approach that has seen ongoing success over time has been the matrix systems made of swellable and non-swellable polymers [1]. Xanthan gum (Xan) is one of the most-used hydrocolloids in the pharmaceutical industry. There are various reasons for this, but it is usually utilized alone or in combination with other polysaccha- rides as a controlled-release matrix constituent [2]. Its primary structure is presented in Fig. 1a. The presence of glucuronic acid as well as the pyruvate acid groups in the Xan molecule is mainly responsible for its anionic character (Fig. 1a) [3,4]. Xan adopts a helical structure in order to reduce steric and elec- trostatic repulsions between the charged groups in side chains. This is schematically represented in Fig. 1b [5]. Polysaccharides exhibit chemical and structural variability that is unique among biopolymers. The functional versatility of polysac- charides in pharmaceutical practice is mostly associated with the modification of viscosity due to swelling. Theoretically, this prop- erty is related to the transition of glucose units of polymeric chains through a vast range of different energy states or conformations [6]. Because polysaccharides have numerous hydroxyl, acidic, and charged groups, they have a tendency to form regular or ordered structures such as single or multiple helices that are stabilized by hydrogen bonds, ionic bridges, and van der Waals interactions [7]. Conformational data on the Xan molecule are still questionable despite the fact that the numerous experimental methods have 0939-6411/$ - see front matter Ó 2011 Elsevier B.V. All rights reserved. doi:10.1016/j.ejpb.2011.09.008 Abbreviations: CRT, controlled-release technology; Xan, xanthan; AFM, atomic force microscopy. ⇑ Corresponding author. Faculty of Pharmacy, University of Ljubljana, Aškerc ˇeva 7, 1000 Ljubljana, Slovenia. Tel.: +386 1 476 9617; fax: +386 1 425 8031. E-mail address: [email protected] (B. Govedarica). European Journal of Pharmaceutics and Biopharmaceutics 80 (2012) 217–225 Contents lists available at SciVerse ScienceDirect European Journal of Pharmaceutics and Biopharmaceutics journal homepage: www.elsevier.com/locate/ejpb
-
Upload
independent -
Category
Documents
-
view
0 -
download
0
Transcript of Addressing potent single molecule AFM study in prediction of swelling and dissolution rate in...

European Journal of Pharmaceutics and Biopharmaceutics 80 (2012) 217–225
Contents lists available at SciVerse ScienceDirect
European Journal of Pharmaceutics and Biopharmaceutics
journal homepage: www.elsevier .com/locate /e jpb
Research paper
Addressing potent single molecule AFM study in prediction of swellingand dissolution rate in polymer matrix tablets
Biljana Govedarica a,⇑, Tamás Sovány b, Klara Pintye-Hódi b, Miha Škarabot c, Saša Baumgartner a,Igor Muševic c, Stane Srcic a
a Department of Pharmaceutical Technology, University of Ljubljana, Ljubljana, Sloveniab Department of Pharmaceutical Technology, University of Szeged, Szeged, Hungaryc Department of Condensed Matter Physics, Jozef Stefan Institute, Ljubljana, Slovenia
a r t i c l e i n f o
Article history:Received 3 July 2011Accepted in revised form 12 September2011Available online 21 September 2011
Keywords:AFMXanthanSingle moleculeNanoindentationMatrix tabletsSwelling
0939-6411/$ - see front matter � 2011 Elsevier B.V. Adoi:10.1016/j.ejpb.2011.09.008
Abbreviations: CRT, controlled-release technologyforce microscopy.⇑ Corresponding author. Faculty of Pharmacy, Univ
7, 1000 Ljubljana, Slovenia. Tel.: +386 1 476 9617; faE-mail address: [email protected] (B.
a b s t r a c t
Our goal was to understand and thus be able to predict the swelling behavior of xanthan matrix tablets inmedia of various pH and ionic strengths using data obtained from single xanthan molecules and filmswith atomic force microscopy.
Imaging was performed in 1-butanol using contact mode AFM in order to characterize single xanthanchains prepared from various solutions. Image analysis was used to calculate the molecular contour, per-sistence length, and radius of gyration. Nanoindentation measurements of xanthan films were carried outto evaluate their mechanical properties. Increasing the ionic strength of solutions induced reductions inchain parameters such as molecular contour, persistence length, and radius of gyration. Nanomechanicalmeasurements demonstrated that Young’s moduli of xanthan films prepared from solutions with higherionic strengths are twice as large as those prepared at lower ionic strengths. This may help explain xan-than matrix tablets’ reduced degree of swelling and faster dissolution rate in the presence of salts or ions.We successfully come to conclusion that microscopic polymer properties such as radius of gyration andpersistence length are responsible for the macroscopic polymer behavior. For instance, longer persistencelengths and radius of gyration of xanthan’s chains result in a higher degree of swelling, corresponding tosofter polymer films, increased gel layers in matrix, and a slower release rate of the incorporated drugfrom the tablets.
� 2011 Elsevier B.V. All rights reserved.
1. Introduction
Drug delivery is an important drug life-cycle management tool.Controlled-release technology (CRT) evolved in the 1950s withmatrix technology in order to achieve a constant release rate ofthe incorporated drug. Since that time, the industry has inventeda number of innovative oral controlled-release dosage forms, withnew patents being awarded at a rapid pace. Recent advances in oralCRT are mostly attributed to the development and implementationof novel biocompatible polymers. To date, the main drug-deliveryapproach that has seen ongoing success over time has been thematrix systems made of swellable and non-swellable polymers [1].
Xanthan gum (Xan) is one of the most-used hydrocolloids in thepharmaceutical industry. There are various reasons for this, but it
ll rights reserved.
; Xan, xanthan; AFM, atomic
ersity of Ljubljana, Aškercevax: +386 1 425 8031.Govedarica).
is usually utilized alone or in combination with other polysaccha-rides as a controlled-release matrix constituent [2]. Its primarystructure is presented in Fig. 1a. The presence of glucuronic acidas well as the pyruvate acid groups in the Xan molecule is mainlyresponsible for its anionic character (Fig. 1a) [3,4].
Xan adopts a helical structure in order to reduce steric and elec-trostatic repulsions between the charged groups in side chains.This is schematically represented in Fig. 1b [5].
Polysaccharides exhibit chemical and structural variability thatis unique among biopolymers. The functional versatility of polysac-charides in pharmaceutical practice is mostly associated with themodification of viscosity due to swelling. Theoretically, this prop-erty is related to the transition of glucose units of polymeric chainsthrough a vast range of different energy states or conformations[6]. Because polysaccharides have numerous hydroxyl, acidic, andcharged groups, they have a tendency to form regular or orderedstructures such as single or multiple helices that are stabilized byhydrogen bonds, ionic bridges, and van der Waals interactions[7]. Conformational data on the Xan molecule are still questionabledespite the fact that the numerous experimental methods have
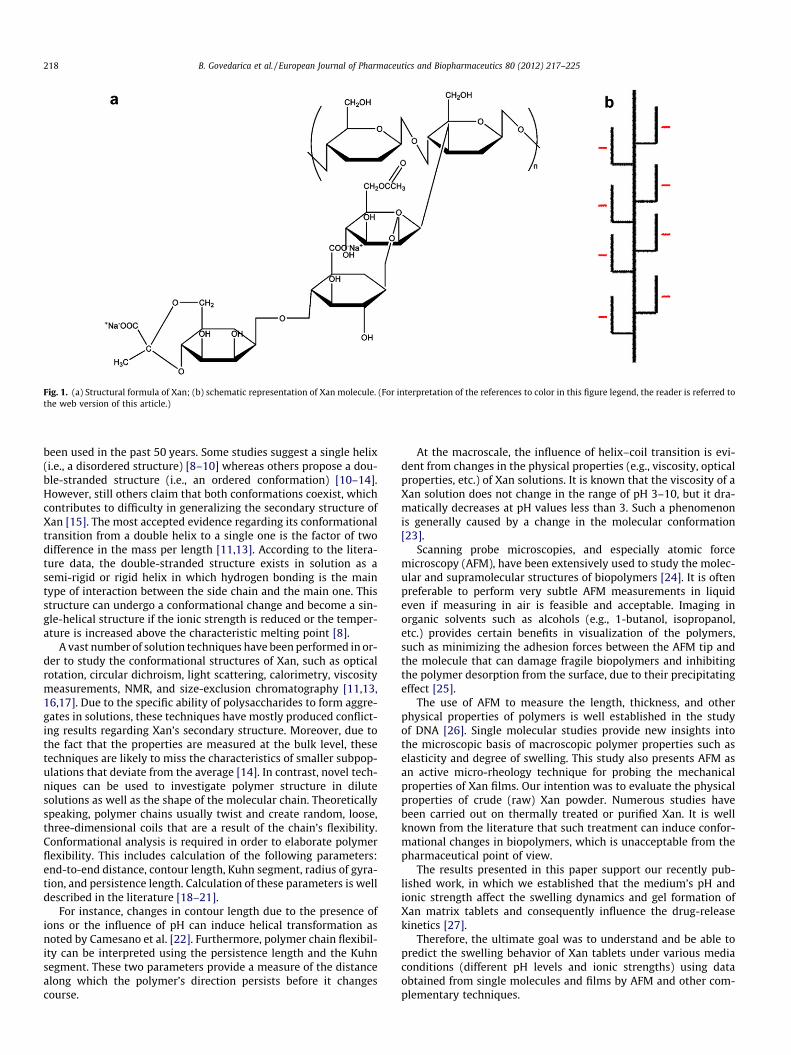
Fig. 1. (a) Structural formula of Xan; (b) schematic representation of Xan molecule. (For interpretation of the references to color in this figure legend, the reader is referred tothe web version of this article.)
218 B. Govedarica et al. / European Journal of Pharmaceutics and Biopharmaceutics 80 (2012) 217–225
been used in the past 50 years. Some studies suggest a single helix(i.e., a disordered structure) [8–10] whereas others propose a dou-ble-stranded structure (i.e., an ordered conformation) [10–14].However, still others claim that both conformations coexist, whichcontributes to difficulty in generalizing the secondary structure ofXan [15]. The most accepted evidence regarding its conformationaltransition from a double helix to a single one is the factor of twodifference in the mass per length [11,13]. According to the litera-ture data, the double-stranded structure exists in solution as asemi-rigid or rigid helix in which hydrogen bonding is the maintype of interaction between the side chain and the main one. Thisstructure can undergo a conformational change and become a sin-gle-helical structure if the ionic strength is reduced or the temper-ature is increased above the characteristic melting point [8].
A vast number of solution techniques have been performed in or-der to study the conformational structures of Xan, such as opticalrotation, circular dichroism, light scattering, calorimetry, viscositymeasurements, NMR, and size-exclusion chromatography [11,13,16,17]. Due to the specific ability of polysaccharides to form aggre-gates in solutions, these techniques have mostly produced conflict-ing results regarding Xan’s secondary structure. Moreover, due tothe fact that the properties are measured at the bulk level, thesetechniques are likely to miss the characteristics of smaller subpop-ulations that deviate from the average [14]. In contrast, novel tech-niques can be used to investigate polymer structure in dilutesolutions as well as the shape of the molecular chain. Theoreticallyspeaking, polymer chains usually twist and create random, loose,three-dimensional coils that are a result of the chain’s flexibility.Conformational analysis is required in order to elaborate polymerflexibility. This includes calculation of the following parameters:end-to-end distance, contour length, Kuhn segment, radius of gyra-tion, and persistence length. Calculation of these parameters is welldescribed in the literature [18–21].
For instance, changes in contour length due to the presence ofions or the influence of pH can induce helical transformation asnoted by Camesano et al. [22]. Furthermore, polymer chain flexibil-ity can be interpreted using the persistence length and the Kuhnsegment. These two parameters provide a measure of the distancealong which the polymer’s direction persists before it changescourse.
At the macroscale, the influence of helix–coil transition is evi-dent from changes in the physical properties (e.g., viscosity, opticalproperties, etc.) of Xan solutions. It is known that the viscosity of aXan solution does not change in the range of pH 3–10, but it dra-matically decreases at pH values less than 3. Such a phenomenonis generally caused by a change in the molecular conformation[23].
Scanning probe microscopies, and especially atomic forcemicroscopy (AFM), have been extensively used to study the molec-ular and supramolecular structures of biopolymers [24]. It is oftenpreferable to perform very subtle AFM measurements in liquideven if measuring in air is feasible and acceptable. Imaging inorganic solvents such as alcohols (e.g., 1-butanol, isopropanol,etc.) provides certain benefits in visualization of the polymers,such as minimizing the adhesion forces between the AFM tip andthe molecule that can damage fragile biopolymers and inhibitingthe polymer desorption from the surface, due to their precipitatingeffect [25].
The use of AFM to measure the length, thickness, and otherphysical properties of polymers is well established in the studyof DNA [26]. Single molecular studies provide new insights intothe microscopic basis of macroscopic polymer properties such aselasticity and degree of swelling. This study also presents AFM asan active micro-rheology technique for probing the mechanicalproperties of Xan films. Our intention was to evaluate the physicalproperties of crude (raw) Xan powder. Numerous studies havebeen carried out on thermally treated or purified Xan. It is wellknown from the literature that such treatment can induce confor-mational changes in biopolymers, which is unacceptable from thepharmaceutical point of view.
The results presented in this paper support our recently pub-lished work, in which we established that the medium’s pH andionic strength affect the swelling dynamics and gel formation ofXan matrix tablets and consequently influence the drug-releasekinetics [27].
Therefore, the ultimate goal was to understand and be able topredict the swelling behavior of Xan tablets under various mediaconditions (different pH levels and ionic strengths) using dataobtained from single molecules and films by AFM and other com-plementary techniques.
B. Govedarica et al. / European Journal of Pharmaceutics and Biopharmaceutics 80 (2012) 217–225 219
2. Materials and methods
2.1. AFM analysis of single Xan polymer chains
The commercial Xan sample (G1253) was supplied by Sigma–Aldrich of St. Louis, MO, USA, as a yellow-to-tan powder with theprovided specifications (Mw = 4 � 106 g/mol and [g] = 800–1200 mPa s for 1% solution). The powder was dispersed in mediawith various pH and ionic strengths as follows: distilled water (pH7; l = 0 M), HCl solution (pH 1.2; l = 0.08 M), HCl solution (pH3.0; l = 0.001 M), and CH3COONH4 solution (pH 3.0; l = 0.2 M). AllXan solutions were prepared in the concentrations of 1 g/L, gentlystirred overnight and diluted with the media mentioned above in or-der to yield a final concentration of 0.2 mg/L (dilute Xan solution).
To freshly cleaved mica, 10 ll of dilute Xan solution was appliedand left for 1–2 min in open air at room temperature. The liquidcell was positioned on the sample plate, and AFM imaging in1-butanol was performed using a liquid imaging cell sealed withan O-ring. All measurements were performed using a NanoscopeIII multimode scanning probe microscope equipped with an E-typescanner (Veeco, Santa Barbara, CA, USA). Silicon nitride cantilevers(MSCT, Veeco, Santa Barbara, CA, USA) with a spring constant of0.1 N/m were used for imaging. Data were recorded at a scan rateof 3 Hz and stored in 512 � 512 pixel format. Images were pro-cessed using the Nanoscope software. For optimal image qualityof structural details, second-order flattening was applied. For eachcondition, at least 30 individual polymer chains were analyzed.
Using 2D Single Molecule Software (Clarkson University, Pots-dam, NY) contour lines of polymer chains were digitized into thepixels yielding the spatial coordinates of each position along thepolymer. Only those chains meeting the following criteria were in-cluded in the calculation of the chain’s dimensions: (a) both endsof the chain were visible; (b) the chain was not in contact withor crossed by any other chain.
From the image data, the parameters that describe the polymersin solutions, such as the root-mean-square radius of gyration,contour length, and end-to-end distance, were calculated. Thepersistence length was computed assuming the validity of worm-like-chain (WMC) model [28]. According to this model, the proba-bility density function of the angle between consecutive links ofthe chain is Gaussian and can be interpreted using Eq. (1) [19]:
PðhðlÞÞ ¼ Lp
2pl
� �12
expLph
2
2l
!ð1Þ
where h is the bend angle, l is the distance between segments, andLp is the persistence length of the polymer.
The persistence length is than calculated according to the fol-lowing relationship (Eq. (2)):
hh2ðlÞi ¼ lLp
� �ð2Þ
To obtained h as a function of l from the images, a series of equallength vectors (equals to about the pixel size in units of the imagescale in nm) was projected into the digitized trace of the polymercontours. The angle h between consecutive vectors was calculatedover the length of the molecule. Since AFM is a surface technique,the fashion in which Xan molecules adhere to the surface must beaddressed.
Kinetically trapped molecules reflect information contained inthe 3D conformation of the polymer chains (opposite to equilib-rium trapping in which the molecules are rearranged in the 2Dmanner). In this case, 3D angle h between two segments duringkinetic trapping will be preserved. Moreover, the Eq. (2) has al-ready been applied in 3D manner by Bednar et al. [29] and Abelset al. [30].
Eventually, for the interpretation of the results and for the pre-dictions of Xan behavior in the bulk (films), only 3D trapped poly-mer chains were considered.
2.2. Nanoindentation measurements
Xan was dissolved in the following media: distilled water(l = 0 M), HCl solution (pH 1.2; l = 0.08 M), HCl solution (pH3.0; l = 0.001 M), and NaCl solution (pH 7.0; l = 0.2 M) in concen-trations of 20 g/l and stirred overnight using a magnetic stirrer.The each solution (m = 5 g) was cast in matrices (equal size) onTeflon plates and dried under ambient conditions for 24 h. Afterdrying, the transparent film was carefully peeled off the surface.The thickness of the film samples was measured using a microm-eter (Mitutoyo, Kawasaki, Japan) and the mean thickness wascalculated.
In order to evaluate the elastic properties of Xan films, nanoin-dentation measurements were performed by collecting the forcecurves on the investigated samples and cleaved mica as a non-deformable reference. AFM force spectroscopy was carried out ona NanoScope IIIa (Veeco, Santa Barbara, CA, USA) using siliconnitride cantilevers with pyramidal tips (PPP-FM, nominal springconstant 2.8 N/m, resonance frequency 75 kHz; Nanosensors,Wetzler, Germany). The spring constants (k) of the cantileverswere determined using the thermal noise method.
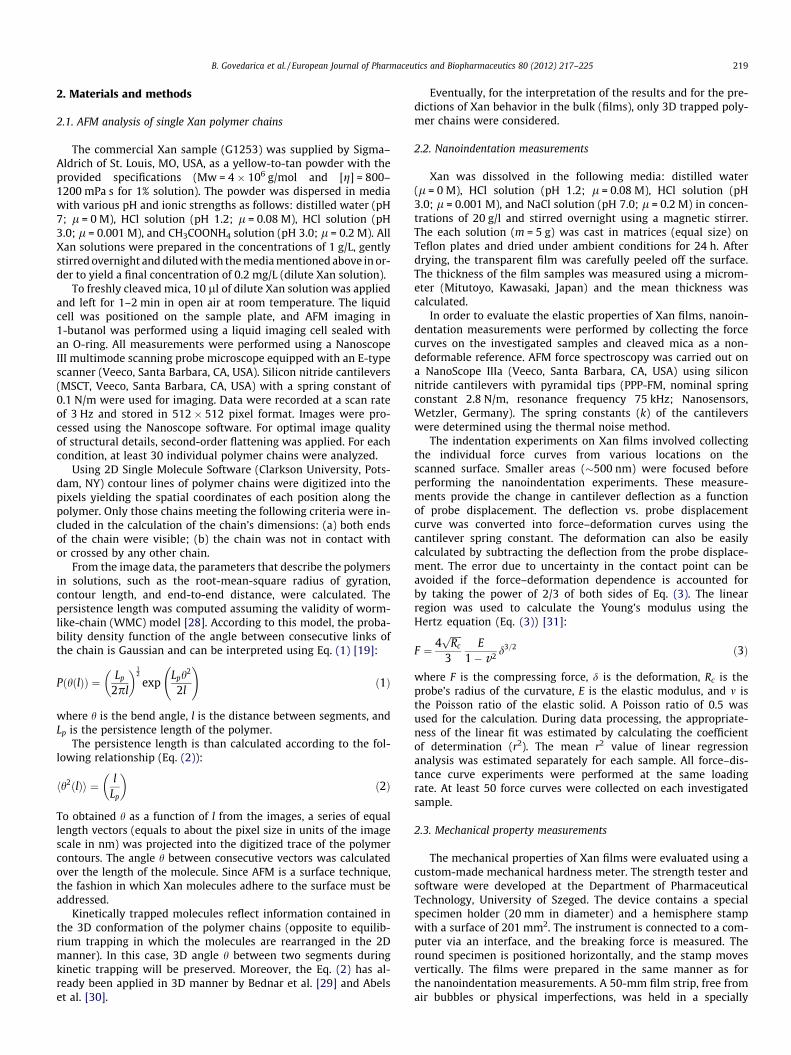
The indentation experiments on Xan films involved collectingthe individual force curves from various locations on thescanned surface. Smaller areas (�500 nm) were focused beforeperforming the nanoindentation experiments. These measure-ments provide the change in cantilever deflection as a functionof probe displacement. The deflection vs. probe displacementcurve was converted into force–deformation curves using thecantilever spring constant. The deformation can also be easilycalculated by subtracting the deflection from the probe displace-ment. The error due to uncertainty in the contact point can beavoided if the force–deformation dependence is accounted forby taking the power of 2/3 of both sides of Eq. (3). The linearregion was used to calculate the Young’s modulus using theHertz equation (Eq. (3)) [31]:
F ¼ 4ffiffiffiffiffiRcp
3E
1� v2 d3=2 ð3Þ
where F is the compressing force, d is the deformation, Rc is theprobe’s radius of the curvature, E is the elastic modulus, and m isthe Poisson ratio of the elastic solid. A Poisson ratio of 0.5 wasused for the calculation. During data processing, the appropriate-ness of the linear fit was estimated by calculating the coefficientof determination (r2). The mean r2 value of linear regressionanalysis was estimated separately for each sample. All force–dis-tance curve experiments were performed at the same loadingrate. At least 50 force curves were collected on each investigatedsample.
2.3. Mechanical property measurements
The mechanical properties of Xan films were evaluated using acustom-made mechanical hardness meter. The strength tester andsoftware were developed at the Department of PharmaceuticalTechnology, University of Szeged. The device contains a specialspecimen holder (20 mm in diameter) and a hemisphere stampwith a surface of 201 mm2. The instrument is connected to a com-puter via an interface, and the breaking force is measured. Theround specimen is positioned horizontally, and the stamp movesvertically. The films were prepared in the same manner as forthe nanoindentation measurements. A 50-mm film strip, free fromair bubbles or physical imperfections, was held in a specially

220 B. Govedarica et al. / European Journal of Pharmaceutics and Biopharmaceutics 80 (2012) 217–225
designed ring sample holder. The breaking force was determinedfrom the curves. Measurements were performed at least five timesfor each film.
2.4. Dissolution study
Xan and the drug (pentoxifylline, Krka, Novo Mesto, Slovenia)were mixed homogeneously using a laboratory model drum blen-der; 100 mg of pentoxifylline was directly compressed (SP 300, Kil-ian, Cologne, Germany) to form circular flat-faced tablets with amass of 0.50 g ± 0.01 g, a diameter of 12 mm, and a crushingstrength of 100 ± 10 N. Dissolution tests were performed on a fullycalibrated dissolution apparatus using the redesigned paddlemethod (VanKel Dissolution Apparatus, VK 7000, Cary, NC, USA).The measurement settings were the following: 50 rpm (paddlespeed), temperature 37 �C ± 0.5 �C, and 900 ml medium volume.At predetermined time intervals, 10 ml samples were withdrawnwithout being replaced. The collected samples were filteredthrough 10 lm filters, suitably diluted with the release medium,and the absorbance was measured spectrophotometrically at274 nm (HP Agilent 8453 Diode Array UV–VIS Spectrophotometer,Waldbronn, Germany). Experiments were performed in six media:water (l = 0 M), water + NaCl (l = 0.2 M), HCl (pH 1.2; l = 0.08 M),HCl (pH 1.2) + NaCl (l = 0.28 M), HCl (pH 3.0; l = 0.001 M), andHCl (pH 3.0) + NaCl (l = 0.201 M). Finally, analysis of the influence
Fig. 2. (a) Release profiles of pentoxifylline from Xan tablets in various media; (b)the influence of medium replacement (denoted by arrow) simulating physiologicalconditions on the release of pentoxifylline from Xan tablets: HCl (pH 1.2) + NaClmedium was replaced after 2 h by water. For comparison, release of pentoxifyllinefrom Xan in water and in HCl (pH 1.2) + NaCl is presented.
of medium replacement simulating physiological conditions on therelease of pentoxifylline from Xan tablets was performed.
3. Results
3.1. Dissolution study
A dissolution test was conducted as a standard method fordetermining the drug release rate from Xan matrix tablets. Therelease rate differences observed were the main reason for carryingout AFM, as well as other complementary techniques, in order todiscover the basic reason for such behavior.
Before pentoxifylline diffuses out of the matrix, water has topenetrate the polymer matrix, leading to polymer swelling anddrug dissolution. The enhanced mobility of the polymeric chainsfavors the transport of water, drug dissolution, and the drug’s dif-fusion out of the tablets. However, the arrangement of water mol-ecules within hydrophilic polymers is very important because itinfluences the formation of the polymeric gel network and there-fore also drug diffusion.
Our results demonstrate a slow dissolution rate of pentoxifyl-line from Xan matrix tablets in media such as water and HCl (pH3.0). Increasing the ionic strength significantly accelerated the dis-solution rate of the model drug (Fig. 2a).
The results of drug release performed under simulated physio-logical conditions, in which the HCl (pH 1.2) medium was replacedwith water, proved that not only the gel layer thickness, but alsothe drug release rate from Xan tablets responds quickly to alteredenvironmental conditions (Fig. 2b). The release is much faster dur-ing the first 2 h than after the replacement of the medium, when agradually decreasing dissolution rate was observed. From thisresult, it can be concluded that swelling and consequently drugrelease from Xan tablets will be distinct in the stomach and intes-tinal environments.
3.2. AFM single molecule study
The appearance of Xan chains adsorbed on the surface of micadepends on the solvent medium used to prepare the sample. Sam-ple preparation is the crucial issue for this microscopy techniquewhen the aim is to visualize the individual molecules. In order toavoid aggregation artifacts in Xan samples for AFM imaging, verylow concentrations of polymer (0.2 mg/l) in media of differentionic strengths and pH were used. Because the range of ionicstrengths in gastrointestinal fluid is from 0.01 to 0.166 M [32],the ionic strengths of solutions were adjusted from 0 to 0.20 Musing HCl or CH3COONH4. The characteristic appearances of singlepolymer chains surface-adsorbed from different solutions are pre-sented in Fig. 3.
The images of samples prepared in these media reveal elon-gated polymer chains with occasional loops (Fig. 3d) and bifurca-tions (Fig. 3c and e). According to the literature, these loops areattributed to the existence of a single-helical structure or unravel-ing of a double or triple helix into a single one [20].
Furthermore, some knots (Fig. 3b) can also be observed. Knotsare present at specific sites where intermolecular associationscan occur and they are usually attributed to apolar contaminantssuch as the acetate groups.
The measured heights of the Xan’s chains in media with low(H2O and HCl pH 3.0) and high ionic strengths (HCl pH 1.2 andCH3COONH4 pH 3.0) are 0.6 ± 0.1 nm and 1.3 ± 0.2 nm, respectively(Fig. 3g and e). Due to the insufficient resolution of AFM imagesand small helical pitch [33] of the Xan’s molecule (4.9 nm), thehelical structure was not visualized. However, the conformationaltransition is supported by the chain’s height being two times

B. Govedarica et al. / European Journal of Pharmaceutics and Biopharmaceutics 80 (2012) 217–225 221
greater in media with higher ionic strength compared to water andHCl (pH 3.0).
3.3. Chain statistics
Reconstruction of the Xan conformation was performed using a2-D image analysis based on the work of Frontali et al. [19]. Theheterogeneity of the sample can be assessed using the AFM imagesand can be quantitatively confirmed by the large standarddeviations of our results. The contour lengths of the Xan molecules
Fig. 3. Xan’s polymer chains in water (l = 0 M) (a); HCl pH 1.2 (l = 0.08 M) solution (b(l = 0.001 M) solution (d) loops can be observed (magnification); CH3COONH4 pH 3.0 (lXan’s chain in water (height 0.6 ± 0.1 nm) (f); cross-section of Xan’s chain in HCl pH 1.2legend, the reader is referred to the web version of this article.)
decreased in the progression from water to solutions with higherionic strengths or low pH (HCl 1.2) (see Fig. 4).
Persistence length is a basic mechanical property quantifyingthe stiffness of a long polymer. It is sometimes defined as the poly-mer’s resistance to bending. Our results, presented in Fig. 5, dem-onstrate the decreasing persistence length with increasing ionicstrength. Longer chains of Xan as observed in water and HCl (pH3.0) behave more like wormlike coils in contrast to shorter chains,in which the contour length is almost comparable with the persis-tence length and the structure is rigid and rod-like. Our experi-mental results are in agreement with the other literature data
); HCl pH 3.0 (l = 0.001 M) solution (c) bifurcation can be visualized; HCl pH 3.0= 0.2 M) solution – bifurcation can be observed (magnification) (e); cross-section of(height 1.3 ± 0.2 nm) (g). (For interpretation of the references to color in this figure
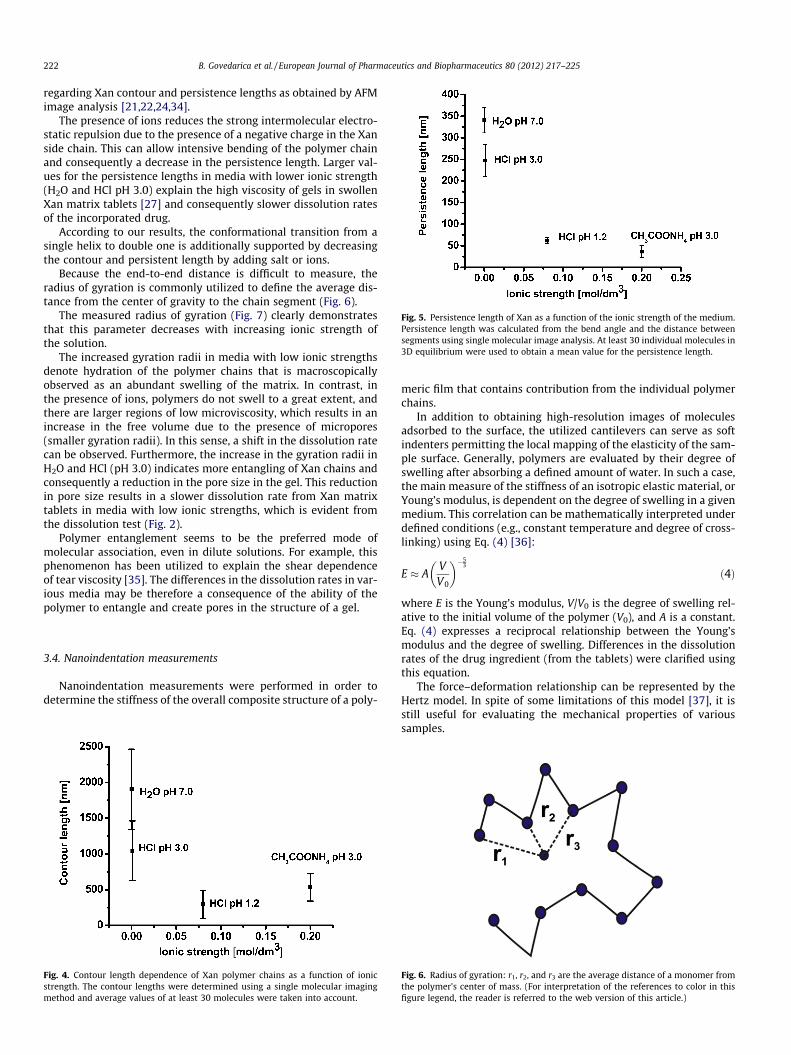
Fig. 5. Persistence length of Xan as a function of the ionic strength of the medium.Persistence length was calculated from the bend angle and the distance betweensegments using single molecular image analysis. At least 30 individual molecules in3D equilibrium were used to obtain a mean value for the persistence length.
222 B. Govedarica et al. / European Journal of Pharmaceutics and Biopharmaceutics 80 (2012) 217–225
regarding Xan contour and persistence lengths as obtained by AFMimage analysis [21,22,24,34].
The presence of ions reduces the strong intermolecular electro-static repulsion due to the presence of a negative charge in the Xanside chain. This can allow intensive bending of the polymer chainand consequently a decrease in the persistence length. Larger val-ues for the persistence lengths in media with lower ionic strength(H2O and HCl pH 3.0) explain the high viscosity of gels in swollenXan matrix tablets [27] and consequently slower dissolution ratesof the incorporated drug.
According to our results, the conformational transition from asingle helix to double one is additionally supported by decreasingthe contour and persistent length by adding salt or ions.
Because the end-to-end distance is difficult to measure, theradius of gyration is commonly utilized to define the average dis-tance from the center of gravity to the chain segment (Fig. 6).
The measured radius of gyration (Fig. 7) clearly demonstratesthat this parameter decreases with increasing ionic strength ofthe solution.
The increased gyration radii in media with low ionic strengthsdenote hydration of the polymer chains that is macroscopicallyobserved as an abundant swelling of the matrix. In contrast, inthe presence of ions, polymers do not swell to a great extent, andthere are larger regions of low microviscosity, which results in anincrease in the free volume due to the presence of micropores(smaller gyration radii). In this sense, a shift in the dissolution ratecan be observed. Furthermore, the increase in the gyration radii inH2O and HCl (pH 3.0) indicates more entangling of Xan chains andconsequently a reduction in the pore size in the gel. This reductionin pore size results in a slower dissolution rate from Xan matrixtablets in media with low ionic strengths, which is evident fromthe dissolution test (Fig. 2).
Polymer entanglement seems to be the preferred mode ofmolecular association, even in dilute solutions. For example, thisphenomenon has been utilized to explain the shear dependenceof tear viscosity [35]. The differences in the dissolution rates in var-ious media may be therefore a consequence of the ability of thepolymer to entangle and create pores in the structure of a gel.
3.4. Nanoindentation measurements
Nanoindentation measurements were performed in order todetermine the stiffness of the overall composite structure of a poly-
Fig. 4. Contour length dependence of Xan polymer chains as a function of ionicstrength. The contour lengths were determined using a single molecular imagingmethod and average values of at least 30 molecules were taken into account.
meric film that contains contribution from the individual polymerchains.
In addition to obtaining high-resolution images of moleculesadsorbed to the surface, the utilized cantilevers can serve as softindenters permitting the local mapping of the elasticity of the sam-ple surface. Generally, polymers are evaluated by their degree ofswelling after absorbing a defined amount of water. In such a case,the main measure of the stiffness of an isotropic elastic material, orYoung’s modulus, is dependent on the degree of swelling in a givenmedium. This correlation can be mathematically interpreted underdefined conditions (e.g., constant temperature and degree of cross-linking) using Eq. (4) [36]:
E � AVV0
� ��53
ð4Þ
where E is the Young’s modulus, V/V0 is the degree of swelling rel-ative to the initial volume of the polymer (V0), and A is a constant.Eq. (4) expresses a reciprocal relationship between the Young’smodulus and the degree of swelling. Differences in the dissolutionrates of the drug ingredient (from the tablets) were clarified usingthis equation.
The force–deformation relationship can be represented by theHertz model. In spite of some limitations of this model [37], it isstill useful for evaluating the mechanical properties of varioussamples.
Fig. 6. Radius of gyration: r1, r2, and r3 are the average distance of a monomer fromthe polymer’s center of mass. (For interpretation of the references to color in thisfigure legend, the reader is referred to the web version of this article.)

Fig. 7. Radius of gyration of Xan as a function of the ionic strength. The radius ofgyration is a geometrical calculation and for polymers coils can be computedaccording to the mean-square value of the end-to-end distance. Fig. 8. The force–deformation curve obtained using AFM force spectroscopy on Xan
film prepared from a water solution. (For interpretation of the references to color inthis figure legend, the reader is referred to the web version of this article.)
B. Govedarica et al. / European Journal of Pharmaceutics and Biopharmaceutics 80 (2012) 217–225 223
There are some issues that should be kept in mind, such as thefit range and composition of the sample in order to yield reason-able and reproducible results. It is worth noting that the Hertzmodel is valid only for small indentation depths in which thesubstrate cannot affect the calculations [28]. The elasticity of thesample is determined from the first part of the curve, which repre-sents a linear relationship between the force to the power of 2/3and the deformation, compared to the part of the curve where nodeformation is visible, representing the stiffness of the substratesurface (Fig. 8).
As a rule of thumb, it should be kept in mind that the stiffness ofthe cantilever should be close to the stiffness of the sample.
Fig. 9. Histograms of Young’s modulus for various Xan films from water, HCl (pH 3.0EðHCl pH1:2Þ ¼ 1:4� 0:3 GPa; EðNaClÞ ¼ 1:6� 0:7 GPa).
Accordingly, we utilized soft cantilevers to determine the Young’smodulus of the polymeric films. In order to account for the Hertzmodel limitations regarding substrate influence, we prepared filmsmore than 90-lm thick, which exceeds the maximum indentation.
Fig. 9 shows the histograms of the Young’s moduli for variousXan films. Films made from solutions with lower ionic strengthshow greater elasticity than films prepared in HCl (pH 1.2) andNaCl solution.
The neutralization of COO� groups in pH 1.2 or electrophilicshielding by NaCl is probable reasons for the re-association ofthe hydrogen bonds that contributes to the enhanced rigidity of
), HCl (pH 1.2), and NaCl (EðH2OÞ ¼ 0:6� 0:3 GPa; EðHCl pH3:0Þ ¼ 0:69� 0:2 GPa;

224 B. Govedarica et al. / European Journal of Pharmaceutics and Biopharmaceutics 80 (2012) 217–225
these films (a larger Young’s modulus) and lower swelling capacity(Eq. (4)). Subsequently, this lower swelling capacity restricted theformation of abundant gel layer on tablet surface, thus increaseddissolution rate of the model drug from Xan matrix tablets isobserved and confirmed by the dissolution test (Fig. 2).
On the other hand, in solutions with lower ionic strengths aswell as neutral media such as water, these COO� groups aredeionized and cause breakage of the hydrogen bonds. Fasterwater ingress allows hydration of polymer chains and swellingof the matrix. According to Eq. (4), a larger degree of swelling isaccompanied by a lower Young’s modulus of such films (Fig. 9)and is related to slower release rate of the incorporated drug(Fig. 2).
The AFM nanoindentation data were also compared with themeasurements of the breaking forces of Xan polymer films deter-mined with a mechanical hardness meter. Xan films prepared inwater, HCl (pH 1.2), and NaCl solution were chosen for themechanical property evaluation. Table 1 shows the collectedresults of these measurements. It can be clearly observed thatthe Xan films prepared from solutions with higher ionic strengthexhibit significantly higher breaking forces compared with the filmprepared in water. These data correspond very well to the Young’smoduli obtained for the same films using AFM.
3.5. Single vs. bulk correlations
Fig. 10a represents the correlation between microscopic poly-mer property such as radius of gyration and macroscopic charac-teristic such as the film thickness. According to our results,polymer’s radius of gyration is controlling factor of the film thick-ness, which is verified from the strong linear correlation betweenthese two parameters (Fig. 10a). This is explained by the radiusof gyration effect on polymer packing in the structure of the film.Radius of gyration gives a sense of the size of the polymer chains.Therefore, in media with higher ionic strength, reduced radius ofgyration is related to smaller polymer size. Consequently, this con-tributes to closer packing of the polymer chains and reduced filmthickness. Moreover, minimized electrostatic repulsion betweenthe individual polymers chains in such media provides also closerorganization of the polymer chains in the final structure of the film.On the other hand, loose and more prominent Xan’s films areobserved in media such as H2O and HCl pH 3.0 due to increasedsteric exclusion (more extended Xan chains – larger radius of gyra-tion) and increased electrostatic repulsion between individualpolymer molecules.
Decreasing of the film thickness with the increasing of the solu-tion ionic strength has already been observed in the literature [38].Nevertheless, our study provide experimental data (radius of gyra-tion) in order to elucidate ionic strength effect on polymer filmthickness.
Even more, observed correlation excellently corresponds toanother bulk property such as increased gel layer thickness inswelled Xan’s matrix tablets, according to our recently publishedresults in which magnet resonance imaging was performed fordynamic observation of Xan’s tablets swelling behavior [27].
Table 1Breaking forces for Xan films.
Xanthan films(20 g/L)
Ionic strength(M)
Breaking force(N)
Film thickness(mm)
Water 0 3.2 ± 1.5 0.18 ± 0.05HCl (pH 3.0) 0.001 3.3 ± 1.4 0.15 ± 0.08HCl (pH 1.2) 0.08 10.4 ± 3.4 0.05 ± 0.008NaCl 0.2 12.7 ± 3.0 0.09 ± 0.02
The relationship between another micro- (persistence length)and macroscopic parameter (Young’s modulus of Xan’s film) isdemonstrated in Fig. 10b.
Variations in the Young’s modulus of the Xan’s films preparedfrom the solutions with different ionic strength can be predictedby calculating the molecular persistence length (Fig. 10b). For in-stance, smaller persistence length of individual polymer chains isascribed to more compact and stiffer structure of Xan’s films(larger Young’s modulus) in media with higher ionic strengths.The obtained correlation is in agreement with the inversely inter-preted relationship between these intrinsic properties, accordingto the literature data [39].
4. Conclusion
Here, we introduced sample preparation, single molecular imag-ing, and data analysis technique in conjunction with nanomechan-ical testing to gain insights into the importance of single polymerproperties for the prediction of the bulk attributes such as swellingand dissolution rate from Xan’s matrix tablets. We successfullycome to the conclusion that microscopic polymer properties suchas radius of gyration and persistence length are responsible forthe macroscopic polymer behavior.
For example, longer persistence lengths and radius of gyrationof Xan’s chains result in a higher degree of swelling, corresponding
Fig. 10. (a) Film thickness vs. radius of gyration of Xan molecules in media withdifferent ionic strength; (b) relationship between Young’s modulus of Xan’s filmsand molecular persistence length in media with different ionic strengths. (Forinterpretation of the references to color in this figure legend, the reader is referredto the web version of this article.)

B. Govedarica et al. / European Journal of Pharmaceutics and Biopharmaceutics 80 (2012) 217–225 225
to softer polymer films, increased gel layers in matrix and a slowerrelease rate of the incorporated drug from the tablets.
We expect that quantification of the intrinsic properties of poly-mers on a single and bulk scale is important in pre-formulationstudy of polymer matrix systems for several reasons. First of all,it gives data of physical and mechanical properties of polymersused for the preparation of matrix tablets. Furthermore, it providesa possibility to relatively predict dissolution rates without involv-ing the time and material-consuming dissolution test in pre-formulation phase of product design. Moreover, it offers the basisfor understanding of the dissolution rates of final tablet products.
Acknowledgment
The authors express special thanks to research assistant profes-sor Yuri Roiter from the Clarkson University, Department of Chem-istry and Biomolecular Science, New York, for providing the SingleMolecule Software.
References
[1] R. Langer, N. Peppas, Present and future applications of biomaterials incontrolled drug delivery system, Biomaterials 2 (1981) 201–214.
[2] B. Katzbauer, Properties and applications of xanthan gum, Polym. Degrad. Stab.59 (1998) 81–84.
[3] P.E. Jansson, L. Kenne, B. Lindberg, Structure of extracellular polysaccharidefrom Xanthomonas campestris, Carbohydr. Res. 45 (1975) 275–282.
[4] L.D. Melton, L. Mindt, D.A. Rees, G.R. Sanderson, Covalent structure of theextracellular polysaccharide from Xanthomonas campestris: evidence frompartial hydrolysis studies, Carbohydr. Res. 46 (1976) 245–257.
[5] H. Yanai, T. Sato, Local conformation of the cellulosic chain in solution, Polym.J. 38 (2006) 226–233.
[6] D. Brant, Versatile Polysaccharides: Ropes, Rings and Rods, 2005. <http://www.bbcm.univ.trieste.it/~cesaro/brant/lectio.pdf> (25.06.2011).
[7] Q. Zhang, P.E. Marszalek, Solvent effects on the elasticity of polysaccharidemolecules in disordered and ordered states by single-molecule forcespectroscopy, Polymer 47 (2006) 2526–2532.
[8] I. Capron, G. Brigand, G. Muller, About the native and renatured conformationof xanthan exopolysaccharide, Polymer 38 (1997) 5289–5295.
[9] I.T. Norton, D.M. Goodall, S.A. Frangou, E.R. Morris, D.A. Rees, Mechanism anddynamics of conformational ordering in xanthan polysaccharide, J. Mol. Biol.175 (1984) 371–394.
[10] G. Holzwarth, E. Prestridge, Multistranded helix in xanthan polysaccharide,Science 197 (1977) 757–759.
[11] G. Paradossi, D.A. Brant, Light scattering study of a series of xanthan fractionsin aqueous solution, Macromolecules 15 (1982) 874–879.
[12] T. Sato, T. Kakihara, A. Teramoto, Isotropic-liquid crystal phase equilibrium insemiflexible polymer solutions: xanthan, a rigid polyelectrolyte, Polymer 5(1990) 824–828.
[13] A. Gamini, M. Mandel, Physicochemical properties of aqueous xanthansolutions: static light scattering, Biopolymers 34 (1994) 783–797.
[14] I. Capron, S. Alexandre, G. Muller, An atomic force microscopy study of themolecular organisation of xanthan, Polymer 39 (1998) 5725–5730.
[15] B.T. Stokke, A. Elgsaeter, O. Smidsrod, Electron microscopic study of single-anddouble-stranded xanthan, Int. J. Biol. Macromol. 8 (1986) 217–225.
[16] V.J. Morris, D. Franklin, K. I’Anson, Rheology and microstructure of dispersionsand solutions of the microbial polysaccharide from Xanthomonas campestris(xanthan gum), Carbohydr. Res. 121 (1983) 13–30.
[17] M . Milas, M. Rinaudo, R. Duplessix, R. Borsali, P. Lindner, Small angle neutronscattering from polyelectrolyte solutions: from disordered to ordered xanthanchain conformation, Macromolecules 28 (1995) 3119–3124.
[18] H. Li, T.A. Witten, Fluctuations and persistence length of charged flexiblepolymers, Macromolecules 28 (1995) 5921–5927.
[19] C. Frontali, E. Dore, A. Ferrauto, E. Gratton, A. Bettini, M.R. Pozzan, et al., Anabsolute method for the determination of the persistence length of native DNAfrom electron micrographs, Biopolymers 18 (1979) 1353–1373.
[20] A.R. Kirby, P. Gunning, V.J. Morris, Imaging xanthan gum by atomic forcemicroscopy, Carbohydr. Res. 267 (1995) 161–166.
[21] M. Rinaudo, Relation between the molecular structure of somepolysaccharides and original properties in sol and gel states, FoodHydrocolloids 15 (2001) 433–440.
[22] T.A. Camesano, K.J. Wilkinson, Single molecule study of xanthan conformationusing atomic force microscopy, Biomacromolecules 2 (2001) 1184–1191.
[23] M.M. Talukdar, R. Kinget, Swelling and drug release behaviour of xanthan gummatrix tablets, Int. J. Pharm. 120 (1995) 63–72.
[24] T.M. McIntire, D.A. Brant, Imaging of individual biopolymers andsupramolecular assemblies using noncontact atomic force microscopy,Biopolymers 8 (1997) 133–146.
[25] A. Alessandrini, P. Facci, AFM: a versatile tool in biophysics, Meas. Sci. Technol.16 (2005) R65–R92.
[26] D.I. Cherny, A. Fourcade, F. Svinarchuk, P.E. Nielsen, C. Malvy, E. Delain,Analysis of various sequence-specific triplexes by electron and atomic forcemicroscopies, Biophys. J. 74 (1998) 1015–1023.
[27] U. Mikac, A. Sepe, J. Kristl, S. Baumgartner, A new approach combiningdifferent MRI methods to provide detailed view on swelling dynamics ofxanthan tablets influencing drug release at different pH and ionic strength, J.Control. Release 145 (2010) 247–256.
[28] O. Kratky, G. Porod, Rontgenuntersuchung gelosre faden-molekule, Recl. Trav.Chim. Pays-Bas. 68 (1949) 1106.
[29] J. Bednar, P. Furrer, V. Katritch, Z. Stasiak, J. Dubochet, A. Stasiak,Determination of DNA persistence length by cryo-electron microscopy.Separation of the static and dynamic contributions to the apparentpersistence length of DNA, J. Mol. Biol. 254 (1995) 579–594.
[30] J. Abels, F. Moreno-Herrero, T. van der Heijden, G. Dekker, N. Dekker, Single-Molecule measurements of the persistence length of double-stranded RNA,Biophys. J. 88 (2005) 2737–2744.
[31] H. Hertz, Über die Berührung fester elastischer Körper, J. reine angew. Math. 92(1826) 156–171.
[32] J. Johnson, J. Holinej, M. Williams, Influence of ionic strength on matrixintegrity and drug release from hydroxypropyl cellulose compacts, Int. J.Pharm. 90 (1993) 151–159.
[33] T. Sho, T. Sato, T. Norisuye, Viscosity behaviour and persistence length ofsodium xanthan in aqueous sodium chloride, Biophys. Chem. 25 (1986) 307–313.
[34] V. Parpura, J.M. Fernandez, Atomic force microscopy study of the secretorygranule lumen, Biophys. J. 71 (1996) 2356–2366.
[35] M. Radmacher, M. Fritz, P. Hansma, Imaging soft samples with the atomic forcemicroscope: gelatin in water and propanol, Biophys. J. 69 (1995) 264–270.
[36] W. Winter, Polysaccharide structure by X-ray fiber diffraction, MethodsEnzymol. 83 (1982) 87–104.
[37] J.M. Tiffany, Viscoelastic properties of human tears and polymer solutions,Adv. Exp. Med. Biol. 350 (1994) 267–270.
[38] K.S. Sorbie, Y. Huang, The effect of pH on the flow behavior of xanthan solutionthrough porous media, J. Colloid Interf. Sci. 149 (1991) 303–313.
[39] H. Morawetz, Macromolecules in Solution, Wiley, New York, 1975.