Adaptive tuning of an electrodynamically driven thermoacoustic cooler
8
Adaptive tuning of an electrodynamically driven thermoacoustic cooler Yaoyu Li, Brian L. Minner, George T.-C. Chiu, Luc Mongeau, and James E. Braun Ray W. Herrick Laboratories, School of Mechanical Engineering, Purdue University, West Lafayette, Indiana 47907 ~Received 16 August 2000; revised 16 April 2001; accepted 31 August 2001! The commercial development of thermoacoustic coolers has been hampered in part by their low efficiencies compared to vapor compression systems. A key component of electrodynamically driven coolers is the electromechanical transducer, or driver. The driver’s electroacoustic transduction efficiency, defined as the ratio of the acoustic power delivered to the working gas by the moving piston and the electrical power supplied, must be maintained near its maximum value if a high overall system efficiency is to be achieved. Modeling and experiments have shown that the electroacoustic efficiency peaks sharply near the resonance frequency of the electro-mechano-acoustic system. The optimal operating frequency changes as the loading condition changes, and as the properties of the working gas vary. The driver efficiency may thus drop significantly during continuous operation at a fixed frequency. In this study, an on-line driver efficiency measurement scheme was implemented. It was found that the frequency for maximum electroacoustic efficiency does not precisely match any particular resonance frequency, and that the efficiency at resonance can be significantly lower than the highest achievable efficiency. Therefore, a direct efficiency measurement scheme was implemented and validated using a functional thermoacoustic cooler. An adaptive frequency-tuning scheme was then implemented. Experiments were performed to investigate the effectiveness of the control scheme to maintain the maximum achievable driver efficiency for varying operating conditions. © 2002 Acoustical Society of America. @DOI: 10.1121/1.1413755# PACS numbers: 43.35.Ud, 43.58.Fm @SGK# I. INTRODUCTION Research efforts have been made over the past 20 years to develop thermoacoustic heat pumping systems for air- conditioning, refrigeration, and other cooling applications. 1–3 These systems do not require refrigerants. They use environ- mentally benign, inert gases as the working fluid. They are mechanically simple, requiring no sliding seals or lubrica- tion. At this stage of their development, the performance of thermoacoustic systems has been poor relative to traditional vapor compression systems. However, existing models based on linear theory suggest that better performance is achiev- able. One key to improving performance relates to the maxi- mization of efficiency. The overall efficiency of an electrodynamically driven thermoacoustic heat pumping device is a function of heat pumping effectiveness and electroacoustic transduction effi- ciency. In this study, methods to maintain optimal electroa- coustic efficiency for varying operating conditions were in- vestigated. This efficiency is defined as the ratio between the acoustic power delivered and the electrical power supplied. The acoustic power is defined as the time-averaged product of the acoustic pressure over the driving piston and the pis- ton volume velocity. The electrical input power is the time- averaged product of the voltage fed to the coil and the cor- responding coil current. Both the acoustic and the electric power are very sensitive to the phase difference between the pressure and velocity signals, or between the voltage and current signals. The acoustic power, and thus the electroa- coustic transduction efficiency, is highly frequency depen- dent. In practical applications as well as in the laboratory, it is imperative to maintain peak efficiency in order to mini- mize power consumption, and thus operating costs. In opera- tion, variations in refrigeration loads cause the temperature of the working gas and the heat exchangers to vary, which alters the acoustic load impedance and thus the input electri- cal impedance. This in turn changes the frequency of optimal electroacoustic efficiency of the driver, referred to here as the ‘‘tuned frequency.’’ The design of thermoacoustic coolers has been the ob- ject of many previous studies. Minner et al. 4 performed sys- tematic design optimization for a few different applications. Grant 5 investigated the use of a passive mass element to replace the gas-filled half-wavelength resonance tube. The selection of electrodynamic drivers for thermoacoustic re- frigerators was discussed recently in a study by Wakeland, 6 which investigated the effects of key parameters and fre- quency on driver efficiency. The optimization processes uti- lized in these 4–6 and other studies may be designated as a priori or ‘‘off-line’’ tuning since they do not require the knowledge ~in real-time! of measured quantities. In practice, thermoacoustic phenomena often involve nonlinear, time- varying processes affected by many operating and design factors. Even carefully designed and fabricated devices are subject to uncertainty, and variability which cannot be ac- counted for using existing linear models. 7 From a control system viewpoint, the system needs to adapt to transient variations of the plant. It must be able to tune itself without user intervention, a posteriori or after the initial tuning pro- 1251 J. Acoust. Soc. Am. 111 (3), March 2002 0001-4966/2002/111(3)/1251/8/$19.00 © 2002 Acoustical Society of America
-
Upload
independent -
Category
Documents
-
view
1 -
download
0
Transcript of Adaptive tuning of an electrodynamically driven thermoacoustic cooler

Adaptive tuning of an electrodynamically driventhermoacoustic cooler
Yaoyu Li, Brian L. Minner, George T.-C. Chiu, Luc Mongeau, and James E. BraunRay W. Herrick Laboratories, School of Mechanical Engineering, Purdue University, West Lafayette,Indiana 47907
~Received 16 August 2000; revised 16 April 2001; accepted 31 August 2001!
The commercial development of thermoacoustic coolers has been hampered in part by their lowefficiencies compared to vapor compression systems. A key component of electrodynamicallydriven coolers is the electromechanical transducer, or driver. The driver’s electroacoustictransduction efficiency, defined as the ratio of the acoustic power delivered to the working gas bythe moving piston and the electrical power supplied, must be maintained near its maximum value ifa high overall system efficiency is to be achieved. Modeling and experiments have shown that theelectroacoustic efficiency peaks sharply near the resonance frequency of theelectro-mechano-acoustic system. The optimal operating frequency changes as the loading conditionchanges, and as the properties of the working gas vary. The driver efficiency may thus dropsignificantly during continuous operation at a fixed frequency. In this study, an on-line driverefficiency measurement scheme was implemented. It was found that the frequency for maximumelectroacoustic efficiency does not precisely match any particular resonance frequency, and that theefficiency at resonance can be significantly lower than the highest achievable efficiency. Therefore,a direct efficiency measurement scheme was implemented and validated using a functionalthermoacoustic cooler. An adaptive frequency-tuning scheme was then implemented. Experimentswere performed to investigate the effectiveness of the control scheme to maintain the maximumachievable driver efficiency for varying operating conditions. ©2002 Acoustical Society ofAmerica. @DOI: 10.1121/1.1413755#
PACS numbers: 43.35.Ud, 43.58.Fm@SGK#
ea
iroarao
onasiex
neaefoain-th
iedupie-otrt
aron
, iti-era-ureichctri-malthe
ob-
s.t toThere-d,
fre-uti-s
e,e-
signarec-
ientut
I. INTRODUCTION
Research efforts have been made over the past 20 yto develop thermoacoustic heat pumping systems forconditioning, refrigeration, and other cooling applications.1–3
These systems do not require refrigerants. They use envmentally benign, inert gases as the working fluid. Theymechanically simple, requiring no sliding seals or lubriction. At this stage of their development, the performancethermoacoustic systems has been poor relative to traditivapor compression systems. However, existing models bon linear theory suggest that better performance is achable. One key to improving performance relates to the mamization of efficiency.
The overall efficiency of an electrodynamically drivethermoacoustic heat pumping device is a function of hpumping effectiveness and electroacoustic transductionciency. In this study, methods to maintain optimal electrcoustic efficiency for varying operating conditions werevestigated. This efficiency is defined as the ratio betweenacoustic power delivered and the electrical power supplThe acoustic power is defined as the time-averaged proof the acoustic pressure over the driving piston and theton volume velocity. The electrical input power is the timaveraged product of the voltage fed to the coil and the cresponding coil current. Both the acoustic and the elecpower are very sensitive to the phase difference betweenpressure and velocity signals, or between the voltagecurrent signals. The acoustic power, and thus the electcoustic transduction efficiency, is highly frequency depe
J. Acoust. Soc. Am. 111 (3), March 2002 0001-4966/2002/111(3)/1
arsir-
n-e-faledv-i-
tfi--
ed.ct
s-
r-ichenda--
dent. In practical applications as well as in the laboratoryis imperative to maintain peak efficiency in order to minmize power consumption, and thus operating costs. In option, variations in refrigeration loads cause the temperatof the working gas and the heat exchangers to vary, whalters the acoustic load impedance and thus the input elecal impedance. This in turn changes the frequency of optielectroacoustic efficiency of the driver, referred to here as‘‘tuned frequency.’’
The design of thermoacoustic coolers has been theject of many previous studies. Minneret al.4 performed sys-tematic design optimization for a few different applicationGrant5 investigated the use of a passive mass elemenreplace the gas-filled half-wavelength resonance tube.selection of electrodynamic drivers for thermoacousticfrigerators was discussed recently in a study by Wakelan6
which investigated the effects of key parameters andquency on driver efficiency. The optimization processeslized in these4–6 and other studies may be designated aapriori or ‘‘off-line’’ tuning since they do not require theknowledge~in real-time! of measured quantities. In practicthermoacoustic phenomena often involve nonlinear, timvarying processes affected by many operating and defactors. Even carefully designed and fabricated devicessubject to uncertainty, and variability which cannot be acounted for using existing linear models.7 From a controlsystem viewpoint, the system needs to adapt to transvariations of the plant. It must be able to tune itself withouser intervention,a posteriorior after the initial tuning pro-
1251251/8/$19.00 © 2002 Acoustical Society of America

he
FIG. 1. Sketch of the thermoacoustic cooler and ton-line efficiency measurement scheme.y
fi-n
ofee
egeg
uonamec
effite
llycc
l anauac
gond
. Ai
thchffi
hamr ie
th
inICasanxi-
sedo a
d-inbyuxa
oilleghhenger.vesheithanywies.rtedthehezed
inde-.Ther aon
g
cess, utilizing dynamic signals fed to and processed bdigital processor. This is referred to as ‘‘on-line’’ tuning.
On-line monitoring and control of electroacoustic efciency to maintain peak efficiency for varying operating coditions is possible. Garrett8 developed a passive methodfrequency compensation for changes in the temperaturthe working gas by placing a gas mixture and an adsorbwithin the resonator. Hofler9 used a method for real-timacoustic power measurements. In Hofler’s work, a voltacontrolled-frequency~VCF! signal generator was used alonwith a proportional-plus-integral~PI! controller to tune thedriving frequency for acoustic resonance, i.e., for pressand velocity to be in phase on the piston. Another PI ctroller was used to maintain a constant output pressureplitude. Issues such as filtering and overload protection wconsidered. The system was implemented using analogcuits.
In the present study, a method for acoustic power msurement similar to that in Ref. 9 was used. Real-time eciency monitoring and control schemes were implemenusing a DSP~digital signal processor!. The electroacousticefficiency is not a directly measurable quantity. It is usuacalculated ‘‘off-line’’ from measured pressure, piston veloity, coil voltage, and current data. Either time or frequendomain methods can be used to calculate the acousticaelectrical power. The approach here utilized digital sigprocessing techniques to calculate the instantaneous acoand electrical power of the driver for a prototype thermocoustic cooler on-line. The instantaneous driver efficienwas supplied to a real-time adaptive frequency tuning alrithm to ensure maximum driver efficiency for changing auncertain operating conditions.
The remainder of the paper is organized as followsbrief description of the prototype thermoacoustic coolergiven in the next section, followed by the description andanalysis of the on-line driver efficiency measurement tenique. It is then shown that there can be a significant eciency loss if the system is operated at resonance, and tdirect measurement of efficiency is required. The real-tiadaptive algorithm for tuning the electromechanical drivefinally described. Some implementation details are includin the hope that they may be of some assistance to oworkers in the field.
1252 J. Acoust. Soc. Am., Vol. 111, No. 3, March 2002
a
-
ofnt
-
re--
reir-
a--d
-yndlstic-y-
se--t aesder
II. DESCRIPTION OF THE THERMOACOUSTICCOOLER
The thermoacoustic cooler is shown schematicallyFig. 1. The system was driven by a moving-magnet CFModel B-300 electromechanical transducer. The driver wdesigned to deliver 300 W acoustic power at 33 Hz, withelectroacoustic transduction efficiency of 70% and a mamum displacement of 6 mm. The alternator was compriof radially extending neodymium magnet arms mounted tcentral plunger~the moving element! and copper woundlaminated iron pole pieces~the stationary element!, whichextend inward from the outer periphery. The outwardirected magnet fingers~each comprised of two magnetscontact! were thus separated by gaps, which were filledthe inward-directed laminated iron fingers. The magnetic flpathlines in such devices go circumferentially throughmagnet finger and a pole piece, radially up through the cto the outer periphery, circumferentially to the other popiece adjacent to the magnet finger, radially down throuthe coil and back to the magnet finger. Each pole piece tsupports two flux paths, one for each adjacent magnet finThe alternating current causes a fluctuated force that mothe magnet-mounted plunger axially back and forth. Tplunger-mounted piston was mounted within a bore, wextremely tight clearance seals extending over a length mtimes the piston displacement. This minimized ‘‘blodown,’’ or gas leakage between the rear and front cavitThe plunger was balanced and self-centering, and suppoby a single flexure. Leaf springs were added to increaseresonance frequency of the driver in-vacuo to 154 Hz. Tdriver was fully enclosed, and the static pressure equaliacross the piston.
The measured specifications of the driver are listedTable I. The equivalent linear parameters of the driver,scribed for example in Beranek’s text,10 were measuredThey were found to depend on amplitude and frequency.values listed in Table I are thus only approximations ovenarrow range of piston displacements. More informationthe driver characteristics is available in Refs. 11 and 12.
The other components of the system included~1! astack, made of rolled up polyester film,~2! finned-tube cop-per heat exchangers, and~3! a pressure vessel. The workin
Li et al.: Adaptive tuning of thermoacoustic cooler

urt
pl
Ar
umatoteCtere
ar
icu
lealis
si.t
onacroP
d
terin
eded
-
sticthewasre-ssurethe
is
ger ance
cy
ure-
fluid was a 55% helium–argon mixture with a mean pressup to 2 MPa. A single-frequency sinusoidal signal was feda power amplifier~TECHRON Model 5530! using a signalgenerator. Since the power amplifier itself could not supthe required current~up to 20 A-rms!, a transformer wasinstalled between the amplifier and the coil. Two TALEMUR0500 500-VA transformers connected in parallel weused, each with a 1:5 winding ratio. The resulting maximloading condition was 21 A-rms at 24 V-rms. A capacitor wconnected in series with the coil to improve the power facof the device. A PCB U353B16 piezoelectric acceleromewas attached to the moving part of the driver, and a Pdynamic pressure sensor was installed in the duct nearpiston. The coil voltage was measured with a voltage dividand the coil current was measured using a HP 1146A curprobe.
III. ONLINE EFFICIENCY MEASUREMENTPROCEDURES
Recall that the acoustic power and electrical powerdefined as
AP51
TE0
T
PY •VY dt, ~1!
EP51
TE0
T
UY • IY dt, ~2!
where AP and EP denote acoustic power and electrpower, respectively. Driver pressure, piston velocity, inpvoltage, and current are denoted byP, V, U, and I, respec-tively. The arrows indicate that these are complex variabThe averaging time interval,T, was chosen to be an integrnumber of periods. The discrete form of these equations
AP51
N (i 51
N
P~ i ! V~ i !, ~3!
EP51
N (i 51
N
U~ i ! I ~ i !, ~4!
whereN is the number of averaging time steps. The baon-line efficiency measurement scheme is shown in FigThe signals for the four measured quantities were sent toA/D ports of a dSPACE DSP controller board. The pistvelocity was obtained by integrating the signal from thecelerometer. All real-time computations and the filtering pcesses were performed using a TI TMSC31 DSMATLAB ® Real-Time Workshop and SIMULINK were use
TABLE I. Specifications of CFIC-B300 driver.
Parameter Notation Value Unit
Force constant Bl 9 N/AStiffness K 74 kN/mMech. resistance b 25 N s/mMass M 1.63 kgPiston area S 0.0068 m2
Coil resistance~DC! R 0.11 VCoil inductance L 0.9 mH
J. Acoust. Soc. Am., Vol. 111, No. 3, March 2002
eo
y
e
srr
Bher,nt
e
alt
s.
c1.he
--.
for developing the embedded system software.To compensate for the DC drift of the accelerome
signal, a high-pass filter was used to eliminate DC offsetsthe integrated signal. High frequency noise was minimizthrough the application of a low-pass filter. The combinband-pass filter frequency response was
Fbp~s!
51.578 643108~s218.79631023s13.947831025!
~s21879.6s163 165!~s2117 592.9s11.579 163108!,
~5!
wheres5 j v is the Laplacian operator, withv the angularfrequency~rad/s!. A Bode plot of the filter’s frequency response is shown in Fig. 2. The23 dB criterion was used fora 10 Hz to 2000 Hz pass band. Since the thermoacoucooler driving frequency was between 100 and 200 Hz,pass band response for the driving frequency rangewithin 0.002 dB. To compensate for the filter’s phasesponse, the same band-pass filter was applied to the presignal. Note that the band-pass filter was implemented inSimulink program for the efficiency measurement.
Averaging a data sequence over a time intervalequivalent to a low pass FIR~Finite Impulse Response! fil-tering process with a very low cutoff frequency and a larroll-off. The computational requirements of averaging ovelarge number of data samples to obtain acceptable variain the estimates may limit the bandwidth of the efficienmeasurement. To solve this problem, an IIR~Infinite ImpulseResponse! filter was employed instead. It is known that
Fn~z21!5122z211z22
122rz211r 2z22~r ,1! ~6!
is a notch filter with a notch at DC,13 where the discrete-timeoperator isz5esTs, with s the Laplacian operator andTs thesampling period. So the complementary filter
Fcn~z21!512Fn~z21!52~12r !z211~r 221!z22
122rz211r 2z22~7!
FIG. 2. Frequency response of the band-pass filter for the velocity measments.
1253Li et al.: Adaptive tuning of thermoacoustic cooler

r40
e
acea
ath
e-oc%n
yuTh
cal.y-r--ed
or
esrderthe
ent,thewer
theonus-ar-
pre-t of
ra
acts as a low-pass filter. Whenr gets very close to 1, asteeper notch is obtained for~6! and thus a sharper roll-off isobtained for~7!. The frequency response of such a filter for5 0.99 and a sampling rate of 1 kHz is plotted in Fig. 3. AdB roll-off is obtained at about 30 Hz. The computation timfor averaging 100 samples was about 220ms. Use of an IIRfilter reduced the computational time to 15ms. Both digitalfilters were implemented in the Simulink program.
A comparison was made between the on-line approjust described and an off-line approach. The off-line msurement was performed using a Bru¨el & Kjær PULSE sys-tem to acquire the four sensor signals. The acousticalelectrical power were obtained from the cross spectra ofsignals using 1 second long records and a 2 kHz samplingrate. The results in the vicinity of the best efficiency frquency are shown in Fig. 4. Excellent agreement wastained, except around the frequency of maximum efficienwhere the largest relative error in efficiency was about 4which was deemed acceptable. Note that the error on tufrequency is very small.
IV. EFFICIENCY ANALYSIS
Analytical expressions were derived for the electrodnamic efficiency of the driver in terms of the acoustic inpimpedance of the thermoacoustic cooler at the piston.
FIG. 3. Frequency response of the IIR filter used to compute the avepower.
FIG. 4. Efficiency versus frequency.
1254 J. Acoust. Soc. Am., Vol. 111, No. 3, March 2002
h-
nde
b-y,
ed
-te
effects of feedback control and those of adding electricapacitors for power factor improvement were evaluated
Figure 5~a! shows a block diagram of the electrodnamic driver with piston velocity feedback. A transfefunction formulation is used in the following, which is consistent with the impedance-based circuit formulation uselsewhere.10 Transfer function models are convenient ffeedback control. In this figure,U~s! is the driving voltage,Kis the power amplification factor,Uc(s) is the voltage on theoutput side of the amplifier, andGe(s)51/@Ls1R1(1/Cs)# is the electrical impedance of the coil in seriwith a capacitor. The added capacitor created a second opole in the system frequency response. This reducedphase difference between delivered voltage and currthereby reducing the power required by the amplifier forsame delivered power. This enabled a higher electrical pooutput around the driving frequency.Bl is the electrome-chanical transduction coefficient~N/A!. The mechanical im-pedance of the driver itself isGm(s)5s/ms21bs1k, wherem, b, andk are the mass, the mechanical resistance, andstiffness of the driver, respectively. The transfer functiGpv(s) is the equivalent mechanical impedance of the acotic load at the piston, denoting the relationship between pticle velocity and sound pressure at that point.A is the pistonarea. The sound pressure exerts a force on the driver, resented in the diagram as a negative feedback at the inpu
FIG. 6. Electrodynamic efficiency versus frequency.
geFIG. 5. Block diagrams of thermoacoustic driver.
Li et al.: Adaptive tuning of thermoacoustic cooler

k-t.is-
theferto
the driver element. The driver velocity results in a ‘‘bacemf‘‘ Eb(s) fed back to the input of the electrical elemen
An equivalent block transformation including an admsible feedback controller,H~s!, is shown in Fig. 5~b!. The
ree.ie
ncth6
cyhri
adine
fi-
J. Acoust. Soc. Am., Vol. 111, No. 3, March 2002
frequency response of the electroacoustic efficiency ofdriver was obtained from the block diagram. The transfunctions from the input voltage to the piston velocity andthe acoustic pressure are given by
l current
ge
V~s!
U~s!5
~Bl !Gm~s!Cs
@LCs21RCs11#@11AGPV~s!Gm~s!#1~Bl !@Bl1KH~s!#Gm~s!Cs~8!
and
P~s!
U~s!5
Gm~s!GPV~s!Cs
@LCs21RCs11#@11AGPV~s!Gm~s!#1~Bl !@Bl1KH~s!#Gm~s!Cs. ~9!
The acoustic power delivered by the piston is given by AP(v)5 12AuP( j v)uuV( j v)ucos(FPV), whereA is the piston area
andFPV is the phase difference between the pressure and velocity. The transfer functions from input voltage to the coiand to the coil voltage are
I ~s!
U~s!5
@11AGPV~s!Gm~s!#Cs
@LCs21RCs11#@11AGPV~s!Gm~s!#1~Bl !@Bl1KH~s!#Gm~s!Cs~10!
and
Uc~s!
U~s!5
Cs$@Ls1R#@11AGPV~s!Gm~s!#1~Bl !@Bl1KH~s!#Gm~s!%
@LCs21RCs11#@11AGPV~s!Gm~s!#1~Bl !@Bl1KH~s!#Gm~s!Cs. ~11!
The electrical power is given by EP(v)5 12uUC( j v)uuI ( j v)ucos(FUcI), whereFUcl is the phase angle between the coil volta
and current. The electroacoustic efficiency is then
h~v!5AP~v!
EP~v!5
AuGPV~ j v!uUV~ j v!
U~ j v!U2
cos~FPV!
UUC~ j v!
U~ j v!UU I ~ j v!
U~ j v!Ucos~FUcI!
. ~12!
Substituting Eqs.~8!, ~10!, and~11! into Eq. ~12! we have
h~v!5AuGPV~s!u~Bl !2uGm~s!u2cos~FPV!
u11AGPV~s!Gm~s!uu@Ls1R#@11AGPV~s!Gm~s!#1~Bl !2ucos~FUcI!. ~13!
d-ffi-s
offre-n-to
Equation~13! shows that the electroacoustic efficiency islated to driver parameters and to the acoustic impedancthe tube. Note that the capacitanceC does not appear in Eq~13!. This shows that the addition of a capacitor in serwith the coil does not affect efficiency.
The predicted and measured electroacoustic efficieresponses of the thermoacoustic system operating wi55% helium–argon mixture at 2 MPa are shown in Fig.The maximum efficiency is found within a narrow frequenrange near the overall system resonance frequency, at wthe electrical input reactance is zero. This resonance vafor different static pressures and different refrigeration loing conditions. For example, the resonance frequencycreases from about 173 Hz to 178 Hz for an increase in mpressure from 0.5 to 2 MPa.
To determine the impact of velocity feedback on efciency, the numerator and denominator of Eq.~12! may bedivided by uUc( j v)u2. The efficiency response becomes
-of
s
ya
.
iches--
an
h~v!5AP~v!
EP~v!5
AuGPV~ j v!uU V~ j v!
Uc~ j v!U2
cos~FPV!
U I ~ j v!
Uc~ j v!Ucos~FUcI!
.
~14!
The terms on the right-hand side of Eq.~14! involve only thequantities within the shaded block in Fig. 5~b!, i.e., inside thefeedback loop. None of them is influenced by velocity feeback. Therefore velocity feedback does not affect the eciency for this particular problem. A similar conclusion waalso obtained for current feedback.
Hofler9 used a phased-lock loop to enforce operationthe electrodynamic driver at the acoustic resonancequency. This was considered an ‘‘indirect efficiency cotrol.’’ The acoustic resonance may not always correspond
1255Li et al.: Adaptive tuning of thermoacoustic cooler

elss of/m
therer-ncy
theer.ndals-
ed-
Thense.
y.
FIG. 7. Frequency response of total mechanical impedanceF/V.
FIG. 8. Frequency response of system impedanceUcI .
FIG. 9. Efficiency and phase of acoustic impedance versus frequenc
1256 J. Acoust. Soc. Am., Vol. 111, No. 3, March 2002
the optimal operating frequency. To show this, the moddescribed earlier were exercised for a mechanical stiffnes300 KN/m, a mechanical resistance coefficient 25 N s~these values are representative of the driver!, and assumingthe working gas was air at mean pressure of 1 MPa. Oparameters are shown in Table I. All computation was pformed over a frequency range 50–150 Hz with a frequeinterval of 0.01 Hz.
Here the specific acoustic impedance is defined asratio of sound pressure and particle velocity at the drivThe driver mechanical impedance is the ratio of force apiston velocity for the driver in vacuo. The total mechanicimpedance is the ratio of force and piston velocity in preence of the acoustic load. Referring to Fig. 5~a!, the totalimpedance is the sum of the driver and the acoustic impance, i.e.,
F
V5
1
Gm1GPVA5S ms21bs1k
s D1GPVA. ~15!
The system impedance is defined as the coil voltage~afterthe capacitor! over current,UcI ~Fig. 5!. Figure 7 shows thefrequency response of the total mechanical impedance.anti-resonance at 61.78 Hz is related to the driver respo
FIG. 10. The algorithm for adaptive frequency tuning.
TABLE II. Variable of interest in the frequency tuning scheme.
f 0 Previous driving frequency f Next driving frequencyD f 0 Previous frequency shift Df Next frequency shifte0 Previous efficiency e Currently measured efficiency
Li et al.: Adaptive tuning of thermoacoustic cooler
’’
FIG. 11. Experimental results of the ‘‘pressure jumptest.4frethet
ret-
esthaThea
ay
to, ac
atg.ya
di-tic
r aeret
, at aof
ted
ee-d.is
pre-e ast, and-
cyise,
The resonance at 134.05 Hz and the anti-resonance at 13Hz are due to the acoustic load. Figure 8 shows thequency response of the system impedance. Similarly,resonance at 61.75 Hz is due to the driver. The resonanc133.98 Hz and the antiresonance at 134.87 Hz are due toacoustic load.
Figure 9 shows the driver efficiency and the phasesponse of the acoustic impedance of the tube. There arepeaks~local maxima! for efficiency, related to the antiresonance of the mechanical driver and one acoustic duct rnance. This is an agreement with the results in Ref. 6. Inexample, the overall maximum efficiency is achieved134.8 Hz, close to the acoustic resonance at 133.98 Hz.other local maximum efficiency at 60.47 Hz is close to tantiresonance of the mechanical driver at 61.78 Hz. Increing stiffness or reducing the damping of the driver mchange the relative amplitudes of these maxima.
The global maximum efficiency at 134.8 Hz is closebut not the same as the acoustic resonance at 133.98 Hzalso different from the neighboring resonance/antiresonanin Figs. 7 and 8. Similarly, the local maximum efficiency60.47 Hz is close to the anti-resonance at 61.78 Hz in Fiand the resonance at 61.75 Hz in Fig. 8. This discrepancdue to the complexity of the interplay among different prameters of the system, as evidenced in Eqs.~12!, ~13!, and~14!. Peak efficiencies~either local or global! do not per-
J. Acoust. Soc. Am., Vol. 111, No. 3, March 2002
.82-eathe
-wo
o-isthe
s-
ndes
7is-
fectly coincide with any resonance or antiresonance contion. For example, in Fig. 9, the efficiency at the acousresonance frequency~133.98 Hz! is 7.4% which is about 4times less than the optimal value of 27.4%. This occurs fomere 0.8 Hz change in frequency. Similar observations wreported by Hunt:14 ‘‘ While it is customary to assume thathe maximum efficiency always occurs at ‘resonance’closer examination of Eqs (4.19) and (4.20) reveals thastill higher efficiency can be obtained for some other valuefrequency or reactance than the one for which p505XM
1XL . ’ ’
V. ADAPTIVE FREQUENCY TUNING PROCEDURES
The adaptive frequency tuning scheme was implemenusing a dSPACE DS1102 controller board~Refs. 15 and 16!.Table II lists the variables of interest. A flow diagram for thfrequency tuning algorithm is shown in Fig. 10. The frquency, frequency shift, and efficiency are first initializeAfter reading the efficiency value, a new target efficiencycalculated. If the efficiency change does not exceed adefined threshold, the frequency change is kept the samfor the previous step. If the efficiency change is significandecision on the next frequency adjustment is made depeing on if the change is positive of negative. If the efficienis increasing, the sign of the adjustment is kept; otherwthe sign is reversed.
1257Li et al.: Adaptive tuning of thermoacoustic cooler
os
msec
com
%anep, aefr-thtue
lea
aco
aornn
fi-
’’on-heions
ofE
rig-
n.6,ory
ator,
sity
-
ent
,
.96.
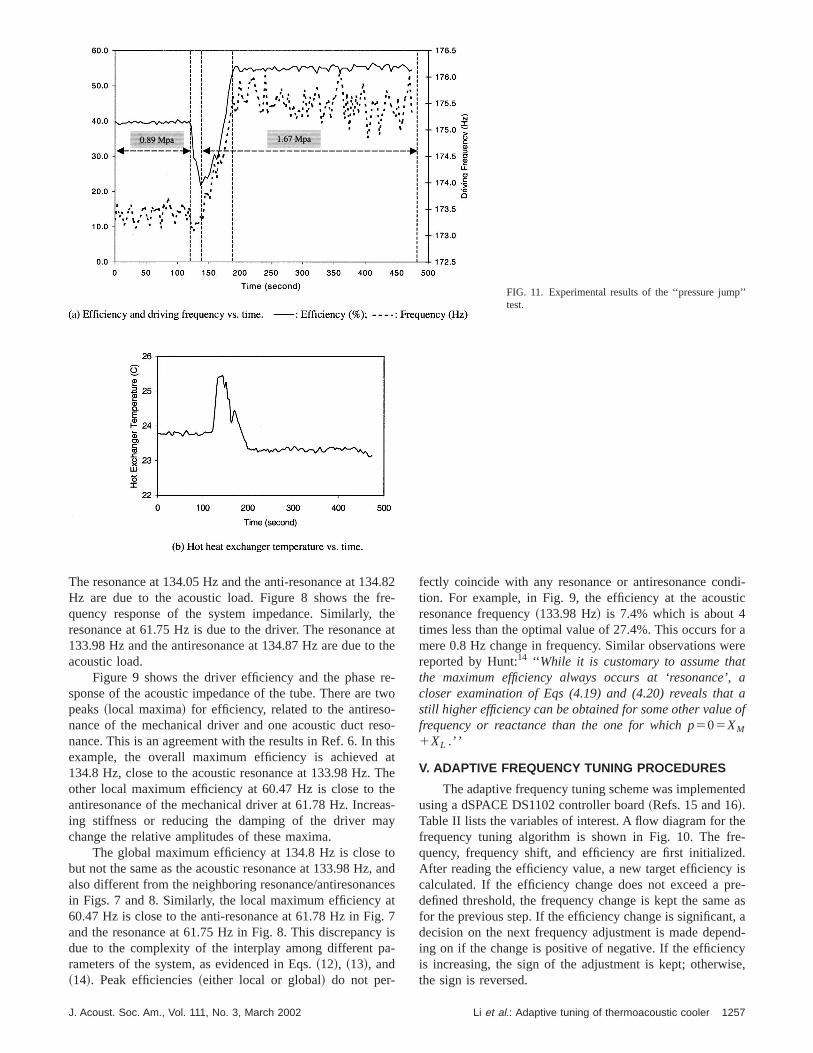
To verify the effectiveness of this adaptive tuning algrithm, a test was designed to expose the thermoacoucooler to a ‘‘sudden’’ change in operating conditions~notnecessarily representative of typical transients during noroperation!. The mean pressure of the cooler was increafrom 0.89 MPa to 1.67 MPa over a time period of 20 seonds. The measured electrodynamic efficiency and theresponding driving frequency are shown as functions of tiin Fig. 11~a!. The test started at the instantt5120 s. Ini-tially, the driver efficiency dropped from 40% to about 21due to the change in resonance frequency. The performdegraded dramatically while the driving frequency was kconstant. The adaptive tuning, within about 45 secondslowed the system performance to reach a new peakciency of 55% at a new driving frequency of 176.2 Hz. Duing the pressurization process, the temperature withintube also experienced a transient evolution. The temperaprofile near the center of the heat exchanger on the hot sidshown in Fig. 11~b!. A temperature fluctuation around 4 F~2C! was observed.
VI. CONCLUSIONS
An on-line efficiency measurement scheme was impmented for a functional electrodynamically driven thermocoustic cooler. It was found by analysis that regular feedbshould not change the optimal electrodynamic efficiencythe driver. The acoustic resonance frequency does not mthe frequency for optimal efficiency, and a significant perfmance drop can result from operation at acoustic resonaAn adaptive frequency tuning algorithm was proposed aimplemented to maintain the driver at its maximum ef
1258 J. Acoust. Soc. Am., Vol. 111, No. 3, March 2002
-tic
ald-r-e
cetl-
fi-
ereis
--kf
tch-ce.d
ciency for varying operating conditions. A ‘‘pressure jumptest was performed to illustrate the effectiveness of the ctroller in dealing with transients in the tuned frequency. Tapproach can deal with most changes in operating conditduring normal operation.
1G. W. Swift, ‘‘Thermoacoustic engines,’’ J. Acoust. Soc. Am.84, 1145–1180 ~1988!.
2G. W. Swift, ‘‘Thermoacoustic engines and refrigerators,’’ Phys. Today48,22–28~1995!.
3S. L. Garrett, and S. Backhaus, ‘‘The power of sound,’’ Am. Sci.88,516–525~2000!.
4B. L. Minner, J. E. Braun, and L. G. Mongeau, ‘‘Theoretical evaluationthe optimal performance of a thermoacoustic refrigerator,’’ ASHRATrans.103, 873–887~1997!. ASHRAE, Atlanta, GA, USA.
5L. A. Grant, Master thesis, Naval Postgraduate School, 1992.6R. S. Wakeland, ‘‘Use of electrodynamic drivers in thermoacoustic referators,’’ J. Acoust. Soc. Am.107, 827–832~2000!.
7B. Ward and G. Swift, Tutorial and User’s Guide for DELTAE: DesigEnvironment for Low-Amplitude Thermoacoustic Engines, Version 41998. Available at no charge from the Los Alamos National Laboratweb site: www.lanl.gov/thermoacoustics.
8S. L. Garrett, Passive Frequency Stabilization in an Acoustic ResonU.S. Patent No. 5857340, 1999.
9T. Hofler, ‘‘Accurate acoustic power measurements with a high-intendriver,’’ J. Acoust. Soc. Am.83, 777–786~1988!.
10L. L. Beranek,Acoustics~The Acoustical Society of America, Washington, DC, 1996!.
11G. A. Yarr and J. A. Corey, Linear Electrodynamic Machine, U.S. PatNo. 5389844, 1995.
12CFIC Inc., www.cficinc.com, Troy, NY.13J. G. Proakis and D. G. Manolakis,Introduction to Digital Signal Process-
ing ~Macmillan, New York, 1988!.14Hunt, Electroacoustics ~Harvard University Press, Cambridge, MA
1954!.15DSPACE GmbH, User’s Guide: Floating-Point Controller Board, 199616DSPACE GmbH, User’s Guide: Real-Time Interface to Simulink 2, 19
Li et al.: Adaptive tuning of thermoacoustic cooler