Tūtū's Hawaiian and the Emergence of a Neo Hawaiian Language
Upload
independentCategory
view
1download
0
Oecologia (2008) 155:455–467
DOI 10.1007/s00442-007-0936-3PHYSIOLOGICAL ECOLOGY - ORIGINAL PAPER
Adaptive radiation of photosynthetic physiology in the Hawaiian lobeliads: dynamic photosynthetic responses
Rebecca A. Montgomery · Thomas J. Givnish
Received: 26 May 2007 / Accepted: 1 December 2007 / Published online: 22 January 2008© Springer-Verlag 2008
Abstract Hawaiian lobeliads have radiated into habitatsfrom open alpine bogs to densely shaded rainforest interi-ors, and show corresponding adaptations in steady-statephotosynthetic light responses and associated leaf traits.Shaded environments are not uniformly dark, however, butpunctuated by sunXecks that carry most of the photosyn-thetically active light that strikes plants. We asked whetherlobeliads have diversiWed in their dynamic photosyntheticlight responses and how dynamic responses inXuence dailyleaf carbon gain. We quantiWed gas exchange and dynamiclight regimes under Weld conditions for ten species repre-senting each major Hawaiian sublineage. Species in shadierhabitats experienced shorter and less numerous sunXecks:average sunXeck length varied from 1.4 § 1.7 min for Cya-nea Xoribunda in shaded forest understories to 31.2 §2.1 min for Trematolobelia kauaiensis on open ridges. Asexpected, the rate of photosynthetic induction increasedsigniWcantly toward shadier sites, with assimilation after60 s rising from ca. 30% of fully induced rates in speciesfrom open environments to 60% in those from denselyshaded habitats. Uninduced light use eYciency—actualphotosynthesis versus that expected under steady-state
conditions—increased from 10 to 70% across the samegradient. In silico transplants—modeling daily carbon gainusing one species’ photosynthetic light response in its ownand other species’ dynamic light regimes—demonstratedthe potential adaptive nature of species diVerences: under-story Cyanea pilosa in its light regimes outperformed gap-dwelling Clermontia parviXora, while Clermontia in itslight regimes outperformed Cyanea. The apparent cross-over in daily photosynthesis occurred at about the samephoton Xux density where dominance shifts from Cyanea toClermontia in the Weld. Our results further support ourhypothesis that the lobeliads have diversiWed physiologi-cally across light environments in Hawaiian ecosystemsand that those shifts appear to maximize the carbon gain ofeach species in its own environment.
Keywords SunXecks · Dynamic response of photosynthesis · Light heterogeneity · Induction · Light use eYciency
Introduction
The native Hawaiian lobeliads (six genera, ca. 125 species)have undergone striking adaptive radiations in habitat, leafform, and Xoral morphology (Carlquist 1970; Givnish et al.1995, 2004; Givnish 1998). Given that they have invadednearly the entire spectrum of light environments on moistsites at mid to high elevations—from open alpine bogs andsea cliVs to densely shaded rainforest understories—theHawaiian lobeliads provide a model system with which tostudy the evolution of photosynthetic adaptations to diVer-ent light regimes (Givnish et al. 2004). Previous researchon 11 species representing each of the major Hawaiiansublineages showed that they occupy habitats that receive
Communicated by Robert Pearcy.
Electronic supplementary material The online version of this article (doi:10.1007/s00442-007-0936-3) contains supplementary material, which is available to authorized users.
R. A. Montgomery (&)Department of Forest Resources, University of Minnesota, St Paul, MN 55108, USAe-mail: [email protected]
T. J. GivnishDepartment of Botany, University of Wisconsin, Madison, WI 53706, USA
123

456 Oecologia (2008) 155:455–467
2.1–30.0 mol m¡2 day¡1 photon Xux density (PFD), andthat species show coordinated responses in several compo-nents of their steady-state photosynthetic light responses tothis light gradient (Givnish et al. 2004). As expected fromeconomic theory, maximum photosynthetic rates (Amax),half saturation, dark respiration, maximum carboxylationrate, carboxylation eYciency, electron transport capacity,leaf nitrogen content, and leaf mass per unit area measuredin the Weld all increase with native PFD. Furthermore, area-based photosynthetic rates show adaptive crossover, withspecies native to higher PFD having higher assimilation athigher PFD than species native to lower PFD, and lowerassimilation at lower PFD than species native to lowerPFD. These results strongly suggest that diVerences insteady-state photosynthetic light responses are adaptive.Instantaneous leaf compensation points lay far below theactual minimum PFD levels inhabited by each species, butwhole-plant compensation points—which incorporate thecosts of leaf and non-leaf construction—correspondedmuch better to minimum PFD levels (Givnish et al. 2004).
Shaded environments are not uniformly dark, but punc-tuated by sunXecks, short bursts of bright light, that carryup to 90% of the photosynthetically active light that strikesplants (Pearcy 1990; Poorter and Oberbauer 1993; Naum-burg et al. 2001). SunXecks a few seconds or minutes longcan account for up to 65% of total carbon gain in forestunderstories (Chazdon 1988; PWtsch and Pearcy 1989). Theability of a leaf to use sunXecks depends on: (1) the rate ofphotosynthetic induction once a leaf is strongly illuminated,(2) the rate of loss of induction between sunXecks, and (3)the ability to continue Wxing carbon at high rates after asunXeck (post-illumination carbon Wxation). The relativecontribution of photosynthesis during sunXecks to dailycarbon gain also depends on: (4) the “resting” photosyn-thetic rate in dim light, (5) the maximum photosyntheticrate achievable, and (6) the lengths of sunXecks and inter-Xeck periods. Photosynthetic induction and loss of induc-tion are dependent on three processes operating at diVerenttime-scales. RuBP regeneration activates rapidly in sun-Xecks and deactivates rapidly in shade; Rubisco activationin sunXecks and slower deactivation in shade is a slowerprocess, typically operating over a few minutes; and stoma-tal opening in sunXecks and slower closing in shade pro-ceeds slower yet, and is usually the only cause of shifts inassimilation after 10 min at saturating PFD (Pearcy 1990;Sassenrath-Cole and Pearcy 1994).
To maximize use of dynamic light, understory plantsshould undergo physiological induction and open their sto-mata rapidly in response to sunXecks, and slowly loseinduction and close stomata afterwards, while sun-adaptedspecies should undergo induction more slowly and lose itmore rapidly. Such patterns have been observed in severalstudies (e.g., Chazdon and Pearcy 1986a, b; Poorter and
Oberbauer 1993; Tinoco-Ojanguren and Pearcy 1995;Valladares et al. 1997; Cai et al. 2005). In some cases, therate of induction was inXuenced by vapor pressure deWcit(VPD) and its eVect on the rate of stomatal opening andclosure (e.g., Tinoco-Ojanguren and Pearcy 1993). Inalmost every study to date, however, comparisons haveonly been made between two or three species, or two orthree categories of species based on their relative distribu-tions along a light gradient. Never has a quantitative rela-tionship been drawn between measures of the light regimesinhabited by several species and the dynamic photosyn-thetic responses of those species.
Here we document variation in the dynamic lightregimes and dynamic photosynthetic light responses of 11species of Hawaiian lobeliads that span a 13-fold diVerencein daily PFD. We ask whether species in habitats character-ized by infrequent, short sunXecks are capable of rapid pho-tosynthetic induction and eYcient light use in sunXecks andhow dynamic responses inXuence daily carbon gain. Fortwo common species that inhabit rainforest understories(Cyanea pilosa subsp. longipedunculata) and gaps (Cler-montia parviXora) on windward Hawai‘i, we quantify ratesof stomatal opening, closure, and physiological gains andloss of induction in response to dynamic light environ-ments. We use these measurements to parameterize a modelfor carbon uptake, and then relate the diVerential distribu-tion of these species along the light gradient to the condi-tions under which each has a carbon gain advantage, usingin silico transplants to the dynamic light regimes experi-enced by both species in the Weld.
Materials and methods
Study sites and species
We studied 11 species that together represent each majorclade of Hawaiian lobeliads and span a gradient in dailyPFD from 2.3 to 30.0 mol m¡2 day¡1 (Tables 1, 2; Givnishet al. 2004). We selected species native to a narrow eleva-tion range (1,000–1,250 m) with moderate to heavy rainfall(>1,500 mm year¡1). Brighamia does not meet these crite-ria, but is adapted to cooler, eVectively moister conditionsthan expected based on its elevation, given the strongonshore breezes and trade winds in its natural sea-cliV habi-tat. Whenever possible, we measured light availability,photosynthetic physiology, and leaf traits in three popula-tions growing under natural conditions. It proved impossi-ble to access the rare natural populations of two federallyendangered species, Brighamia insignis and Delissea rhyti-dosperma. These species were instead studied at outplan-tings established from wild seed sources by the NationalTropical Botanic Garden at Limahuli on Kaua‘i.
123

Oecologia (2008) 155:455–467 457
Light regimes
We measured daily courses of PFD (�mol photosyntheti-cally active photons m¡2 s¡1) over Wve to 12 individuals ineach study population using GaAsP photodiodes (G1118;Hammamatsu, New Jersey) connected to dataloggers(Campbell ScientiWc, Utah). We mounted photodiodes onplastic poles directly above the crowns of ten to 15 individ-uals of each species in each of three populations (total of30–45 sensors per species). Sensor height varied amongindividuals and species due to height diVerence of individu-als and is expected to represent the variation in light arriv-ing at the crowns of adults of our study species. PFD levelswere logged at 10-s intervals during daylight hours. Fordetailed description of calibration of sensors and measure-ments, see Givnish et al. (2004). We deWned a sunXeck as
any period during which PFD continuously exceeded150 �mol m¡2 s¡1. We based this threshold on our contem-poraneous measurements of steady-state photosyntheticlight responses on the same individual plants: average lightsaturation point across species was 147 § 10 �mol m¡2 s¡1
under steady-state conditions. Based on 168–785 sensor-days per species, we calculated the mean § SE of minutesof sunXecks per day, sunXeck length, and maximum sun-Xeck length per day, and constructed histograms of sunXecklength for each species.
Gas exchange measurements
We measured dynamic photosynthetic light responses byquantifying rates of photosynthetic induction during contin-uous periods of strong illumination (induction curves) and
Table 1 Habitat distributions, elevational range and number of study populations of the 11 species of Hawaiian lobeliads investigateda
a For population localities see Givnish et al. (2004)b Habitat and elevation data from Lammers (1999) and R. A. Montgomery and T. J. Givnish (personal observations)c Habitat terminology follows Wagner et al. (1990)
Species Habitatb,c Elevational rangeb (m) n
Cyanea Xoribunda Wet forest understories 460–1,520 3
Cyanea pilosa subsp. longipedunculata Wet forest understories 610–1,520 3
Cyanea hirtella Wet forest understories 1,030–1,400 1
Cyanea leptostegia Diverse mesic forest 1,000–1,300 3Clermontia parviXora In gaps and as epiphytes, wet forest 120–1,460 3
Lobelia yuccoides Ridges and openings, diverse mesic forest 750–1,200 2
Delissea rhytidosperma Diverse mesic forest 300–1,000 1
Clermontia fauriei Openings, diverse mesic to wet forest 365–1,400 3
Trematolobelia kauaiensis Openings, wet forest 650–1,575 2
Lobelia villosa Summit bogs on windswept ridges 1,200–1,580 2
Brighamia insignis Sea cliVs 0–400 1
Table 2 Daily sunXeck activity experienced by Weld populations of 11 species of Hawaiian lobeliads. Means which diVer signiWcantly from eachother are indicated by diVerent letters. PFD Photon Xux density
Species Daily PFD (mol m¡2) SunXeck length (min) Daily minutes of sunXecks
Mean SE Sensors (n) Mean SE Maximum SE Mean SE Sensors (n)
Cyanea Xoribunda 2.3 a 0.2 49 1.4 e 1.7 21.4 g 19.6 31 f 21 48
Cyanea pilosa 3.2 a 0.4 52 1.5 e 2.3 30.3 fg 27.2 67 ef 29 25
Cyanea hirtella 6.2 ab 0.9 11 2.9 de 3.5 117.5 efg 41.0 191 cde 43 11
Cyanea leptostegia 7.0 b 0.6 29 6.0 de 2.2 140.6 ef 25.3 195 d 27 29
Clermontia parviXora 8.3 b 0.8 52 8.8 cde 1.6 215.7 de 18.2 243 d 19 56
Lobelia yuccoides 15.1 c 2.4 25 1.9 e 2.1 28.3 fg 24.4 384 b 26 31
Delissea rhytidosperma 15.3 c 2.1 13 19.7 abc 3.7 392.5 bc 60.5 384 51 14
Clermontia fauriei 15.8 c 1.3 59 13.2 bcd 1.9 291.5 cd 21.5 340 bc 23 40
Trematolobelia kauaiensis 21.1 d 2.1 31 31.2 a 2.1 505.3 ab 24.8 517 a 26 30
Lobelia villosa 28.4 e 1.1 23 25.0 abc 4.8 640.6 a 55.5 533 ab 59 6
Brighamia insignis 30.0 e 3.0 12 24.9 ab 3.4 220.3 de 39.3 226 cde 42 12
123

458 Oecologia (2008) 155:455–467
during a series of simulated sunXecks (Valladares et al.1997). Gas exchange was measured in the Weld on attached,fully expanded leaves from Wve individuals whose lightregimes and static photosynthetic light responses hadbeen quantiWed (Givnish et al. 2004). We used a LI-6400portable photosynthesis system (Li-Cor, Lincoln, Neb.)equipped with a red/blue LED light source and a CO2 mix-ing system. All measurements were made under ambientrelative humidity (ca. 75%), leaf temperature (20–25°C)and CO2 concentration (360–380 p.p.m.). For inductioncurves, leaves were shaded in early morning with blackcloth and covered with white paper to reXect heat; leaveswere not shaded the day before due to the constant possibil-ity of torrential rain at remote Weld sites. Measurementswere started after leaves had been darkened for at least60 min. Leaves were clamped into the measurement cuvetteand allowed to equilibrate at low light (10 �mol m¡2 s¡1),after which they were exposed to saturating light(1,000 �mol m¡2 s¡1). Gas exchange was then loggedevery second until the photosynthetic rate stabilized (ca.30–60 min). Induction state (% of fully induced photosyn-thetic rate) was calculated as a function of time since illu-mination; induction state at 60 s was tabulated to facilitatecomparisons with other studies (Chazdon 1988). Photosyn-thetic responses to simulated sunXecks were measured onboth uninduced leaves (shaded for at least 60 min) andinduced leaves (exposed to saturating irradiance prior tostudy). Uninduced leaves were treated as for the inductioncurves. Induced leaves were exposed to saturating irradi-ance until gas exchange stabilized. In each case, leaveswere then given a series of sunXecks of duration 2, 5, 10,20, 40, 60 and 80 s. SunXecks were 1,000 �mol m¡2 s¡1 inintensity, and leaves were returned to 10 �mol m¡2 s¡1 for60 s between sunXecks; sunXecks were always given in thesame order (see Valladares et al. 1997).
Modeling the eVects of dynamic responses
We modeled daily carbon gain in response to dynamic lightregimes for individuals of Cyanea pilosa var. longi-pedunculata and Clermontia parviXora. These species co-occur in wet montane forests on windward Hawai‘i, withCyanea occurring in shaded understories while Clermontiainhabits forest gaps and edges (Givnish et al. 2004). Forboth species, we quantiWed: (1) the rate of physiologicalinduction after the start of illumination (see above), (2) therate of stomatal opening after the start of illumination, (3)the rate of loss of physiological induction after entry intoshaded conditions (10 �mol m¡2 s¡1), and (4) the rate ofstomatal closure after entry into the same shaded condi-tions. These measurements and associated variables (Giv-nish et al. 2004) were used to parameterize the model ofNaumburg et al. (2001) for the response of carbon uptake to
a dynamic light regime under conditions in which moistureis not limiting (S1).
We conducted in silico transplants to evaluate daily car-bon uptake for each species in its own dynamic light regimeand in that of the other species. Models for each specieswere run using light-sensor data collected simultaneouslyover individuals of each species for a total of 8 days spreadevenly over the year. Daily PFD ranged from 0.3 to 9.4 molm¡2 day¡1 in Cyanea’s understory microhabitat, and 1.9–35.8 mol m¡2 day¡1 in Clermontia’s gap microhabitat.Daily carbon uptake was plotted against total daily PFD foreach model run and Wt to a Michaelis–Menten equation fol-lowing Givnish et al. (2004); the resulting responses wereused to evaluate the point at which mean carbon uptake forClermontia exceeds that of Cyanea, and to quantify theeVective compensation point for each species under adynamic light regime. In addition, we compared theexpected photosynthetic performance during sunXecksusing the dynamic model against the expectation usingsteady-state photosynthetic rates, in order to evaluate pho-tosynthetic limitation during sunXecks due to dynamicresponses for each species as a function of light conditions.In silico “transplants” diVer from true transplants in thatthey do not incorporate acclimation of species to the growthenvironment (including light and other factors), but theyprecisely capture what the photosynthetic properties of aspecies in its native habitat would imply, if unchanged, forcarbon uptake in other habitats. We note that we have con-ducted common studies on this group and Wnd strong evi-dence for genetically based changes among species in theirsteady-state photosynthetic responses (unpublished data).
To examine the mechanisms responsible for diVerencesin model results for Clermontia and Cyanea, we assessedthe relative roles of biochemical versus stomatal limitationsduring induction, initial stomatal conductance, and photo-synthetic rates during intervals between sunXecks follow-ing Allen and Pearcy (2000). We recalculated assimilationrate (A) throughout induction to a constant ci equal to that atAmax. At any moment during induction, the relative diVer-ence between this recalculated assimilation rate (A*) andAmax—that is, (Amax ¡ A*)/Amax—reXects the limitationimposed by incomplete biochemical activation. Con-versely, the limitation due to stomatal conductance is (A* ¡A)/Amax; the total limitation relative to steady-stateresponses is (Amax ¡ A)/Amax. From the time courses ofthese limitations, we calculated the time required for bio-chemical limitation to relax to 50% (Lm50) and maximumstomatal limitation (Lsmax) at any point during induction.
Statistical analysis
Data were analyzed using general linear models that com-pared photosynthetic responses based on species (categorical
123

Oecologia (2008) 155:455–467 459
variables) and light regime (continuous variables). Weexamined bivariate relationships using standardized majoraxis regression calculated using (S)MATR (version 2.0;Falster et al. 2006), given that there were errors in the esti-mation of the mean values of all parameters (Sokal andRohlf 1995). Phylogenetically structured analyses (e.g.,Felsenstein 1985; Pagel 1999) were not employed becausewe believe they are inappropriate for the kind of datareported here, which reXect both genetic diVerences amongrelated species and diVerences among those species in lighthabitat. Given that photosynthetic light responses arehighly plastic in response to conditioning light levels andthat diVerent species/lineages of Hawaiian lobeliads occurin substantially diVerent light environments, using a phylo-genetically structured analysis on Weld data would conXatethe eVects of phylogeny and ecology (see Givnish et al.2004).
Results
Light environments
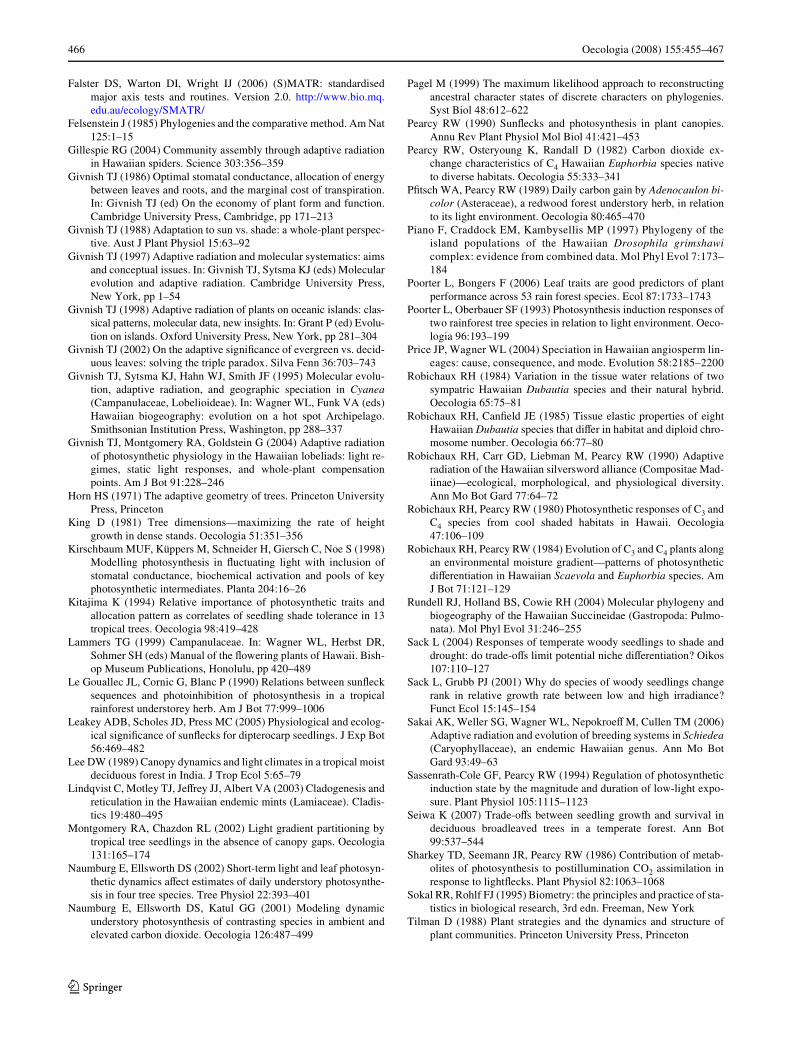
SunXeck length and frequency were signiWcantly related toestimates of total daily PFD across species (Table 2). Ingeneral, species in habitats with low daily PFD experiencedshort and numerous sunXecks, while those in sunnier habi-tats experienced much longer and less numerous sunXecks.Average sunXeck length increased signiWcantly with dailyPFD (Fig. 1; r = 0.829, P < 0.005), and varied from
1.4 § 1.7 min for Cyanea Xoribunda in shaded forestunderstories to 31.2 § 2.1 min for Trematolobelia kauaien-sis on open ridges (Table 2). Total minutes of sunXecksvaried from 31 § 21 min day¡1 for C. Xoribunda to533 § 59 min day¡1 in Lobelia villosa in open alpine bogsites (Table 3), and also increased signiWcantly with dailyPFD across species (r = 0.649, P < 0.05). Average sunXecklength, maximum sunXeck length, and total minutes of sun-Xecks all increased signiWcantly with each other (r = 0.723–0.874, P < 0.02–0.001), but maximum sunXeck length wasnot signiWcantly correlated to daily PFD (P > 0.08). Despitestrong diVerences in average length and total minutes ofsunXecks, it appears that all species can experience quitelong sunXecks (Table 2). Even the most shaded species,C. Xoribunda, occasionally experienced sunXecks as longas 21 min.
The distribution of sunXeck lengths varied substantiallyamong species (three representative species shown inFig. 2). For example, 26% of sunXecks in the shadedunderstories where C. pilosa occurs were <20 s in duration.In contrast, only 9% of sunXecks were <20 s long on theopen ridges where T. kauaiensis grows. The gap-inhabitingspecies Clermontia parviXora (Fig. 2) had a distributionof sunXeck lengths intermediate between those of shade-dwelling Cyanea pilosa (Fig. 2) and ridge-dwellingT. kauaiensis (Fig. 2).
Dynamic photosynthetic responses
Across species, instantaneous photosynthetic ratesincreased with the amount of time previously uninducedleaves spent in bright light. After 60 s of illumination, aver-age induction states across species ranged from 30 to 59%of fully induced photosynthetic rates. Species diVeredsigniWcantly in induction state after 60 s (F1,9 = 2.78,P < 0.015): species from low-light habitats were moreinduced after 60 s of high light than species from high-lighthabitats (Fig. 3). There was a tighter decline in percentageinduction after 60 s with average sunXeck length whenL. yuccoides was excluded (Fig. 3). L. yuccoides showedunusually low induction after 60 s, but its light regime alsohad unusually short sunXecks for its moderate total dailyPFD (Fig. 1).
Average uninduced light use eYciency (LUE) rangedfrom 10 to 75% across species, with both extremes of therange occurring in very short, 2-s simulated sunXecks(Fig. 2). As Xeck length increased, uninduced LUEinitially declined for species from shadier microsites (e.g.,C. pilosa) and increased for species from sunnier microsites(e.g., Trematolobelia); the general tendency for uninducedLUE to increase in longer Xecks across species (Fig. 2)reXects induction within those Xecks and during preceding,shorter Xecks to which leaves were exposed during the
Fig. 1 Average Xeck length (min) as a function of average daily pho-ton Xux density (PFD) for ten representative species of Hawaiian lobel-iads. Data points and error bars represent the mean § SE of light datafrom all datalogged individuals of each species. The line represents thereduced major-axis regression. Lobelia yuccoides is the outlier lyingbelow the left end of the regression line
Daily PFD (mol day-1)
0 5 10 15 20 25 30 35
Ave
rage
sun
fleck
leng
th (
min
)
-10
0
10
20
30
40
123

460 Oecologia (2008) 155:455–467
experimental protocol. The opposing trends in uninducedLUE between sun and shade species resulted in a signiWcantspecies £ lightXeck length interaction (F40,165 = 1.96,P < 0.01).
Average induced LUE ranged from 36 to 160% acrossspecies, with the extremes in L. yuccoides and C. pilosa,respectively; induced LUE was always was higher thanuninduced LUE (Fig. 2). Both extremes of induced LUEagain occurred in 2-s Xecks. In general, induced LUEdecreased with Xeck length in all species, although these
trends were much stronger in shaded species and strongestamong the shortest Xecks across all species (Fig. 2). Therewas again a signiWcant species £ lightXeck length interac-tion (F40,150 = 3.18, P < 0.0001), largely due to diVerencesduring short Xecks among species. Across species, therewas no signiWcant correlation of induced LUE in 2-s Xecksto any measure of the light environment across species. Incontrast, uninduced LUE in 2-s Xecks declined signiWcantlywith total minutes of sunXecks (Fig. 4; r = 0.678, P < 0.045across species).
Table 3 Trait values and model parameters related to diVerences in estimated daily carbon gaina for Cyanea pilosa subsp. longipedunculatab andClermontia parviXorab in the Ola‘a Tract, Hawai‘i Volcanoes National Park
a A full list of parameters used in the photosynthesis model are found in S1b Cyanea occurs in shaded forest understories that average 3.2 mol photons m¡2 day¡1. In contrast, Clermontia occurs in gaps and along forestedges that average 8.3 mol photons m¡2 day¡1
c Values without SE represent parameters used in the model that were Wt to composite responses of each speciesd For values § SE, those in bold indicate signiWcant diVerence between species at the P < 0.01 level in a t-test
Symbol Description Clermontia parviXora Cyanea pilosa
Trait or parameter value (§1 SE)
�gi Time constant for biochemical opening signal for stomata (s) 400c 5.5
�gd Time constant for biochemical closing signal for stomata (s) 1,000 550
�Rd Time constant for Rubisco deactivation and loss of induction (s) 578 1,318
Lm50 Time to 50% relaxation of biochemical limitation (s) 93 § 20 150 § 83
Lsmax Maximum stomatal limitation during induction (%) 13 § 2.3 9 § 1.9
gsini Stomatal conductance prior to induction (�mol m¡2 s¡1) 0.19 § 0.01 0.23 § 0.04
AinterXeck Assimilation rate in low light periods between Xecks (�mol m¡2 s¡1) 0.22 § 0.04d 0.35 § 0.02
Rd Dark respiration rate (�mol m¡2 s¡1) 1.09 § 0.10 0.47 § 0.08
Fig. 2 Histograms of sunXeck lengths (upper panels) and light use eYciency (LUE) in simu-lated lightXecks (lower panels) for three species of Hawaiian lobeliads that represent low-, moderate- and high-light envi-ronments occupied by species in the lineage. Data points and error bars represent the mean § SE of photosynthetic data for Wve individuals of each species. Histograms are from PFD measurements for all data-logged individuals of each spe-cies. LUE was calculated as the percent of CO2 assimilated in a lightXeck compared to the amount that would have been assimilated with an instanta-neous response to PFD change. Closed circles Induced leaves, open circles uninduced leaves
A B C
D E F
Clermontia parviflora
Lightfleck length (s)
2 5 10 20 40 80
Cyanea pilosa
2 5 10 20 40 80
Ligh
tflec
k U
se E
ffici
ency
(%
)
0
50
100
150
200
Trematolobelia kauaiensis
2 5 10 20 40 80
0.2
0.5 1 2 4 8 16 32 64
> 64 0.
20.
5 1 2 4 8 16 32 64>
64 0.2
0.5 1 2 4 8 16 32 64
> 64
Rel
ativ
e fr
eque
ncy
0.00
0.05
0.10
0.15
0.20
0.25
0.30
Sunfleck length (min)
123

Oecologia (2008) 155:455–467 461
Simulation models
In silico “transplants” of Cyanea pilosa and ClermontiaparviXora in each other’s dynamic light regime showedadaptive crossover in the area-based daily photosynthetic
rates of these species, with Cyanea outperforming Cler-montia below a daily PFD of roughly 3.5 mol m¡2 day¡1,and Clermontia outperforming Cyanea in more sunlitmicrosites (Fig. 5). The distributions of both species alongthe daily PFD gradient exhibit similar crossover, with Cya-nea being relatively more common (69% of all sampledindividuals) below 3.5 mol m¡2 day¡1 and Clermontiabeing relatively more common (70% of all individuals)above that level (Fig. 5). Mass-based rates of photosynthe-sis for Cyanea and Clermontia also exhibit crossover, but atsubstantially higher total PFDs (ca. 7.5 mol m¡2 day¡1)than did the area-based rates (data not shown).
On average, Cyanea gained 6.1 mmol CO2 m¡2 day¡1
more than Clermontia across the range of light environ-ments occupied by Cyanea. Similarly, Clermontia gained24.3 mmol CO2 m
¡2 day¡1 more than Cyanea in light envi-ronments Clermontia inhabited. Although the absoluteadvantage in carbon gain per unit area was greater at highPFD, the proportional diVerences were much higher at lowlight levels. Cyanea gained an average of 14% less carbonthan Clermontia in Clermontia light environments, whileClermontia gained an average of 183% less carbon thanCyanea in Cyanea light environments. In fact, in many ofthe microsites occupied by Cyanea, Clermontia showednegative daily assimilation, even without taking intoaccount nighttime respiration or the amortized costs of leafand non-leaf tissue construction.
We Wt a simple Michaelis–Menten function to our simu-lation results for each species and calculated daytime leafcompensation points of 1.77 mol m¡2 day¡1 for Clermontiaand 0.92 mol m¡2 day¡1 for Cyanea. These values comparewith instantaneous leaf compensation points of 10.4 and
Fig. 3 Leaf induction state as a function of average daily PFD (left-hand panel) and average sunXeck length (right-hand panel) for ten rep-resentative species of Hawaiian lobeliads. Data points and error barsrepresent the mean § SE of photosynthetic data from Wve individualsof each species, and the mean § SE of PFD measurements for alldatalogged individuals of each species. Leaf induction state was
calculated as the percent of maximum photosynthesis rates achievedafter 60 s of illumination following a long period in low light. Curvesrepresent best Wt reduced major axis regression lines; in the right-handpanel the dashed line excludes the outlier L. yuccoides (y = 62.3¡19.9ln x; r2 = 0.83, P = 0.006 for 7 df)
Daily PFD (mol day-1)
0 10 20 30 4010
20
30
40
50
60
70
Indu
ctio
n st
ate
60 s
econ
ds a
fter
ini
tial i
llum
inat
ion
(%)
y = 70.8 - 28.0 (log)x r2=0.71 P = 0.002
Average sunfleck length (min)
0 10 20 30 40
y = 60.0 - 20.1 (log)x r2=0.32 p = 0.09 A B
Fig. 4 LUE in a 2-s lightXeck by uninduced leaves as a function ofdaily minutes of sunXecks for ten representative species of Hawaiianlobeliads. Data points and error bars represent the mean § SE of pho-tosynthetic data from Wve individuals of each species, and themean § SE of PFD measurements for all datalogged individuals ofeach species. LUE was calculated as the percent of CO2 assimilated inthe lightXeck compared to the amount that would have been assimi-lated with an instantaneous response to PFD change. The line repre-sents the best Wt reduced major axis regression line. For abbreviations,see Figs. 1 and 2
Daily totals of sunflecks (min)
0 100 200 300 400 500 600
Uni
nduc
ed li
ght u
se e
ffici
ency
(%
)
-20
0
20
40
60
80
100
y = 83.3 - 0.13x R2=0.46 p = 0.045
123

462 Oecologia (2008) 155:455–467
2.8 �mol m¡2 s¡1, respectively—or roughly 0.45 and0.12 mol m¡2 day¡1—based on steady-state light responsesfor these species. Steady-state rates thus understate com-pensation points by a factor of 3.9–7.7 for Clermontia andCyanea, respectively. On 19% of the individual-days mod-eled, Cyanea pilosa received daily PFD less than or equalto its apparent compensation point; no individual of Cler-montia parviXora received less than its apparent compensa-tion point (Fig. 5).
A comparison of dynamic and steady-state light responsesshows that both species operate well below the steady-stateexpectations at low daily PFD totals (<ca. 4 mol m¡2 day¡1),with Cyanea showing a deWcit of up to 25% and Clermontiashowing much larger deWcits, up to 60% (Fig. 6). Dynamiclimitations to sunXeck photosynthesis declined as daily PFDrose, and average sunXeck length increased, with such limita-tions essentially disappearing above ca. 5 mol m¡2 day¡1 inCyanea, and above ca. 8 mol day¡1 in Clermontia (Fig. 6).As expected, understory Cyanea shows faster stomatalresponses to the beginning and end of sunXecks than gap-dwelling Clermontia (Table 3). However, both species shownearly the same stomatal conductance under shady condi-tions (0.23 vs. 0.19 �mol m¡2 s¡1) and almost the samedegree of maximum stomatal limitation (13 vs. 9%). A majorreason for the divergent behavior of these species insteadappears to be the much lower initial biochemical limitation(i.e., higher low-light rates of photosynthesis) of shadedleaves in Cyanea versus Clermontia. Higher respiration ratesin Clermontia (1.09 vs. 0.46 �mol CO2 m¡2 s¡1) also appearto be important and lead to substantial carbon loss betweensunXecks. In microsites receiving less than 3.5 mol PFDm¡2 day¡1, Clermontia lost an average of 6.1 mmol C m¡2
day¡1, whereas Cyanea gained an average of 8.3 mmol Cm¡2 day¡1.
Discussion
Adaptive radiation—the rise of a diversity of ecologicalroles and attendant adaptations—is a fundamental process
Fig. 5 Total daily photosynthesis (mmol CO2 m¡2 day¡1) as a func-tion of daily PFD for Cyanea pilosa subsp. longipedunculata and Cler-montia parviXora in the Ola‘a Tract, Hawai‘i Volcanoes NationalPark. The graph on the left is an enlargement of the responses at lowPFD. The stacked histogram inset on the left represents the distributionof average daily PFD for each species: Cyanea (solid bars) and Cler-montia (hollow bars). Each data point represents simulated of photo-
synthesis from a single daily PFD trace from a single sensor. Circlesrepresent simulations using average physiological data of Wve individ-uals of Clermontia and daily PFD data from Clermontia’s habitat(open circles) or from Cyanea’s habitat (light gray circles). Invertedtriangles represent simulations using average physiological data ofWve individuals of Cyanea and daily PFD data from Cyanea’s habitat(black triangles) or from Clermontia’s habitat (dark gray triangles)
Daily PFD (mol m-2)
0 10 20 30 40
Daily PFD (mol m-2)
0 2 4 6 8 10 12 14
Dai
ly a
ssim
ilatio
n (m
mol
m-2
)
-50
0
50
100
150
200
Clermontia parviflora in home environmentClermontia parviflora in Cyanea environmentCyanea pilosa in Clermontia environment Cyanea pilosa in home environment
<0.
50.
5-1
1-2
2-4
4-6
6-8
8-10
10-1
212
-14
14-1
6>
16
Fre
quen
cy (
%)
0102030405060
Fig. 6 Photosynthesis in sunXecks predicted by the dynamic model asa percentage of that predicted from steady-state photosynthetic lightresponses for Cyanea pilosa subsp. longipedunculata and ClermontiaparviXora in the Ola‘a Tract, Hawai‘i Volcanoes National Park. Eachdata point represents the results of a simulation model based on a sin-gle daily PFD trace. For both species, there are data points that exceed100%. These correspond to models where average stomatal conduc-tance was lower in the steady-state models than in the dynamic models
Daily PFD (mol m-2)
0 2 4 6 8 10 12 14
% s
unfle
ck p
hoto
synt
hesi
s (d
ynam
ic/in
stan
tane
ous
mod
el)
40
60
80
100
Clermontia parvifloraCyanea pilosa
123

Oecologia (2008) 155:455–467 463
linking ecology and evolution (Givnish 1997). While therehave been tremendous advances in our knowledge of theorigin and phylogeny of Hawaiian plant and animal radia-tions (e.g., see Baldwin et al. 1991; Givnish et al. 1995;Piano et al. 1997; Lindqvist et al. 2003; Gillespie 2004;Price and Wagner 2004; Rundell et al. 2004; Sakai et al.2006), for many of these radiations we lack the functionaldata necessary to understand the ecological signiWcance ofphenotypic divergences seen within them.
A body of work has developed on functional trait varia-tion in Hawaiian plant radiations, notably on Euphorbiaand Scaevola (Robichaux and Pearcy 1980, 1984; Pearcyet al. 1982), the silversword alliance (Robichaux 1984;Robichaux and CanWeld 1985; Robichaux et al. 1990), andSchiedea (Sakai et al. 2006). Our research on the Hawaiianlobeliads adds to this body of literature and contributes toour understanding of the extent of habitat divergence andaccompanying functional diversiWcation in the most spe-cies-rich Hawaiian Xowering plant lineage. Previously, wedemonstrated that the lobeliads occupy a broad range oflight habitats and have diversiWed in steady-state photosyn-thetic physiology in an apparently adaptive fashion (Giv-nish et al. 2004). Here we have shown that the lobeliadshave also diversiWed in their dynamic photosyntheticresponses to their light regimes, that these shifts appear tomaximize carbon gain of each species in their own lightenvironment, and thus appear to be adaptive.
Light regimes and dynamic photosynthetic responses
This study is the Wrst to report a statistically signiWcantincrease across species in the rapidity of photosyntheticinduction with decreasing daily PFD (Fig. 3), which isitself closely correlated with sunXeck length (Fig. 1). Asexpected, species from habitats with shorter sunXecks showmore rapid rates of induction. Similarly, uninduced LUE inshort Xecks declined signiWcantly with total minutes of sun-Xecks across species (Fig. 4). That is, in the absence ofinduction, species from habitats with shorter sunXecks andless total sunXeck time were able to achieve a higher frac-tion of potential photosynthesis during short sunXecks. Pre-vious studies have compared the dynamic responses of onlytwo or three species—or two or three categories of spe-cies—that diVer in light regime (e.g., Chazdon and Pearcy1986a, b; Valladares et al. 1997; Cai et al. 2005). Thus,while such studies have generally found that plants fromshadier habitats show faster induction, the agreement withtheory in each individual study has necessarily been quali-tative. Our analysis substantially extends this prior researchby demonstrating a strong quantitative relationship betweendynamic photosynthetic traits and dynamic light environ-ments across a large group of closely related species(Figs. 2, 3, 4, 5). These results parallel our Wndings for
steady-state photosynthetic light responses (Givnish et al.2004) and provide additional evidence for the adaptivediversiWcation of photosynthetic physiology in the Hawai-ian lobeliads.
We found that sunXeck length was positively correlatedwith total daily PFD across sites and species, consistentwith results from a number of other studies (e.g., Chazdonet al. 1988; Chazdon and Pearcy 1991; Leakey et al. 2005).However, Hawaiian forests appear to be brighter than othertropical forests (Givnish et al. 2004) and have correspond-ingly longer sunXecks (see Chazdon et al. 1988; Lee 1989;Pearcy and Chazdon 1990; Valladares et al. 1997). Indeed,species from the lowest PFD regimes in this study canexperience Xecks as long as 20 min; such long sunXecks areknown to cause photoinhibition in other Hawaiian plants(e.g., Cibotium tree ferns; Durand and Goldstein 2001).Because total daily PFD and sunXeck length are generallystrongly correlated, it is diYcult to determine which is astronger driver of the observed dynamic responses.Increased average sunXeck length accounts more power-fully for the drop in induction after 60 s seen in brighterenvironments if L. yuccoides is excluded, but L. yuccoidesexperiences unusually short sunXecks for its light regime,and total daily PFD is more explanatory when all speciesare included. Taken together, these Wndings suggest thatboth sunXeck length and total daily PFD help shapedynamic photosynthetic light responses.
Despite the signiWcant relationships of dynamic photo-synthetic responses to dynamic light regimes across spe-cies, our data showed substantial dynamic limitation ofphotosynthesis during sunXecks, especially in microsites oron days with low daily PFD (see Figs. 2, 6). Uninducedleaves showed only 10–75% LUE across species, withuninduced LUE generally higher in longer (and later) sun-Xecks, and in species receiving lower daily PFDs in nature.In shady microsites, it is likely that leaf induction state isoften below 100%, as our model for daily photosynthesisby Cyanea pilosa and Clermontia parviXora demonstrated(Figs. 5, 6). As expected, induced LUE was generally about100% across species for sunXecks >5 s in duration (Fig. 2).LUE exceeded 100% only in induced leaves during short,2-s sunXecks (Fig. 2), reXecting post-illumination carbonWxation (Sharkey et al. 1986; Kirschbaum et al. 1998).
Based on our analyses, understory Cyanea and mostespecially gap-dwelling Clermontia appear to be limited bydynamic photosynthetic responses at low daily PFDs(Fig. 6). Our results are thus similar to those of Naumburget al. (2001) and Naumburg and Ellsworth (2002) for tem-perate tree species, in that diVerences in dynamic lightresponses are most important in densely shaded microsites,and are least important in species with faster rates of induc-tion and slower rates of loss of induction. Our data suggestthat the most important diVerences between Cyanea and
123

464 Oecologia (2008) 155:455–467
Clermontia are the latter’s much greater biochemical limi-tation of photosynthesis in uninduced leaves, and muchgreater rate of dark respiration. In low-PFD environments,Clermontia thus loses substantial amounts of carbonbetween sunXecks, and never gets fully induced duringshort to moderately long sunXecks. Our data clearly indi-cate the importance of moving beyond steady-state photo-synthetic light responses, and the need to incorporatedynamic responses in analyses of adaptation to diVerentlight regimes.
Adaptive nature of responses
Our previous work showed that the steady-state lightresponse curves of Cyanea pilosa and Clermontia parviX-ora exhibit adaptive crossover, with Clermontia havinghigher instantaneous, mass-based assimilation rates thanCyanea at light levels >ca. 300 �mol m¡2 s¡1 and Cyaneahaving higher assimilation rates than Clermontia at lowerlight levels (Givnish et al. 2004). Here we provide similarevidence of adaptive crossover in our estimates of daily,area-based assimilation using in silico transplants that takedynamic photosynthetic responses into account (Fig. 5).For daily PFDs less than 3.5 mol m¡2 day¡1, Cyanea hadhigher rates of daily carbon gain; above 3.5 mol m¡2 day¡1,Clermontia had an advantage. Furthermore, the crossoverPFD observed corresponds roughly to the crossover in therelative abundance of Cyanea versus Clermontia (Fig. 5).Clermontia had an large absolute (24.3 mmol CO2
m¡2 day¡1) but relatively small (14%) photosyntheticadvantage over Cyanea in the microsites occupied by Cler-montia. Cyanea had an small absolute (6.1 mmol CO2
m¡2 day¡1) but relatively huge (183%) advantage overClermontia in the microsites occupied by Cyanea.
In silico “transplants” permit analyses that focus on theeVects of diVerences among sites in one or more speciWcenvironmental factors (e.g., daily trajectories of PFD) onperformance by plants as a function of one or more speciWcphysiological parameters. This approach is, we believe, apowerful means of quantifying the potential advantages ofparticular traits in various environments. However, it mustbe recognized that in silico transplants diVer from truetransplants in two important respects; they do not include:(1) the eVects of environmental diVerences other than those(i.e., PFD trajectories) speciWcally incorporated in themodel, and (2) the eVects of plasticity in creating additionaldiVerences in physiological responses in plants that developunder diVerent conditions.
Strong inputs of radiant energy during sunXecks not onlyincrease PFD, but also leaf temperature, vapor pressuredeWcit (VPD), leaf water potential, and the extent of pho-toinhibition as well (Young and Smith 1979; Robichauxand Pearcy 1980; Chazdon 1988; Le Gouallec et al. 1990;
Watling et al. 1997; Valladares and Pearcy 2002). Thus,photosynthesis in a dynamically varying light environmentmay respond not only to PFD but also to temperature, VPD,and plant water supply. Leakey et al. (2005) recentlyshowed that shifts in leaf temperature during sunXecks inShorea leprosula growing in rainforest in lowland Sabahsubstantially reduced carbon uptake during sunXecks, giventhat leaf temperatures could rise by up to 10°C and reach38°C during sunXecks, and given that steady-state photo-synthesis was 40% lower at 38°C than at its optimum at29°C. Low VPD in lowland rainforest understories, high airtemperatures, intense PFD during sunXecks, and low sto-matal conductance in uninduced leaves, should all work toelevate leaf temperatures substantially during sunXecks.Given that our study species mostly occur in cool, mid-ele-vation cloud forests, it seems unlikely that excursions inleaf temperature have a substantial eVect on lobeliad photo-synthesis during sunXecks. However, we do believe thatshifts in leaf water potential and/or plant water content dur-ing sunXecks and over the course of the day could have asubstantial impact on photosynthesis. During the course ofthis and other studies in Hawai‘i, we observed drop-oVsin photosynthetic rate after mid-day—similar to those seenin many other venues—that seem most easily explained interms of shifts in plant water status. To explore this issue,we have now begun research on the interaction of light andmoisture supply in determining photosynthetic rate.
It is widely recognized that the light environment inwhich a plant develops aVects its photosynthetic morphol-ogy and physiology (e.g., Ellsworth and Reich 1992;Kitajima 1994; Valladares et al. 2005). It is almost surelythe case, therefore, that had we actually transplanted indi-viduals of Cyanea pilosa and Clermontia parvifolia intomicrosites diVering in daily PFD, plastic responses to lightregime would have inXuenced the response of daily carbonuptake to daily PFD. However, given the rate at which ratsand other introduced herbivores attack lobeliads, and thelegally protected status of most areas that continue tosupport these often rare plants, it was impossible for us toconduct physical transplants for the species involved.Nevertheless, we believe that the in silico transplants havegreat value because they show how photosyntheticresponses would provide an advantage under certainconditions and not under others, and conWrm that the photo-synthetic characteristics shown by two diVerent speciesappear to Wt them to the diVerent ranges of dynamic lightregimes that each species inhabits.
Including dynamic photosynthetic light responses raisedcompensation points compared with those calculated fromsteady-state photosynthetic responses (see Results). Theseresults parallel those of Timm et al. (2002), and reXect theslower rise of photosynthesis during sunXecks whendynamic constraints are included, balanced against a Wxed
123

Oecologia (2008) 155:455–467 465
rate of dark respiration. These calculated increases inapparent compensation point are independent of those thatwould result from including the costs of constructing leafand non-leaf tissue, and which can substantially increasethe whole-plant compensation point (Givnish 1988; Givnishet al. 2004). The increase in compensation point due toincorporating dynamic responses does, however, raise animportant question: does the rate of respiration actuallyremain constant in induced and uninduced leaves? Some ofthe published traces of net carbon uptake in induced vs.uninduced leaves (e.g., see Chazdon and Pearcy 1991) sug-gest that respiration may be elevated somewhat in inducedleaves. If this were to be shown to be the case generally, itwould cast considerable light on the most nagging questionregarding photosynthetic induction: what is the disadvan-tage of rapid induction, such that many sun-adapted specieslack it?
Finally, our model for daily carbon uptake by Cyaneapilosa and Clermontia parviXora provides yet anotherexample of adaptive crossover, a reversal in the rank of spe-cies by growth or photosynthetic rate along an environmen-tal gradient. This concept, though unnamed until recently,entered the modern physiological literature with Horn’s(1971) analysis of optimal leaf arrangement in tree crownsas a function of light availability in early versus late succes-sion, and has been implicit or explicit in dozens of optimal-ity models since then (e.g., Cowan and Farquhar 1977; King1981; Givnish 1986, 2002; Tilman 1988). In each of thesestudies, the “optimal” strategy—which maximizes growthrelative to that resulting from other strategies—varied withenvironmental conditions, creating qualitative or quantita-tive predictions regarding the expected distribution of spe-cies with diVerent strategies. Such models have played animportant role in plant ecophysiology, allowing us to movefrom studies of functional diVerences associated with diVer-ent morphologies or physiologies to rigorous predictionsregarding the expected distributions of diVerent kinds ofplants, and ultimately should shed light on the structure ofdiVerent kinds of plant communities and their relationshipto variation in speciWc environmental factors. The notion ofcrossover and rank reversal in empirical plant studies beganwith comparisons by Björkman et al. (1972) of photosyn-thetic rates among leaves of Atriplex triangularis grown atdiVerent light levels, and has proceeded to the present insimilar studies by Givnish (1988), Sack and Grubb (2001),Montgomery and Chazdon (2002), Givnish et al. (2004),Sack (2004), Poorter and Bongers (2006), and Seiwa(2007). Studies such as these should—especially whencombined with both common garden experiments and Weldstudies—continue to provide new, tightly reasoned insightsinto the foundation for diVerences in the distributions ofindividual plant species and the composition and structureof plant communities.
Acknowledgements The authors gratefully acknowledge the re-search support provided by grant IBN-9904366 from the Ecologicaland Evolutionary Physiology Program of the US National ScienceFoundation. We thank Hawai‘i Volcanoes National Park, the NationalTropical Botanical Garden, the Koke‘e Natural History Museum,Limahuli Garden and the University of Hawai‘i Agricultural ExperimentStation in Volcano for important logistical assistance. Ken Wood, Lin-da Pratt, and Katie Cassel provided invaluable aid in locating popula-tions of several rare species. We are deeply grateful to Wayne Souzaof Kaua‘i State Parks, Edwin Pettys of Kaua‘i Division of Forestry andWildlife, David Foote and Linda Pratt of the US Geological SurveyBiological Resources Division, Betsy Gagné, Randy Kennedy, BillStormont, and Jon GiVen of Hawai‘i Natural Areas Reserves, SusanCordell and Julie Denslow of the US Department of Agriculture ForestService and Sterling Keeley of the University of Hawai‘i for their sup-port in helping us obtain research permits and access to research facil-ities. Mahalo to Aubrey Kelly, Leilani Durand, Nicole Kuamo‘o andKen Wood for help and camaraderie in the Weld and for their commit-ment in helping to achieve the objectives of this research. We thankElke Naumburg for sharing the dynamic model, and both Elke Naum-burg and Ned Fetcher for advice in model implementation. We thankMegan Kranz-McGuire for her work on the dynamic model simula-tions and Vlad Bluvstein for his programming assistance in the sun-Xeck analysis. These experiments comply with current laws of theUSA.
References
Allen MT, Pearcy RW (2000) Stomatal versus biochemical limitationsto dynamic photosynthetic performance in four tropical rainforestshrub species. Oecologia 122:479–486
Baldwin BG, Kyhos DW, Dvorak J, Carr GD (1991) Chloroplast DNAevidence for a North American origin of the Hawaiian silverswordalliance (Asteraceae). Proc Natl Acad Sci USA 88:1840–1843
Björkman O, Ludlow MM, Morrow PA (1972) Photosynthetic perfor-mance of two rainforest species in their native habitat and analysisof their gas exchange. Carnegie Inst Wash Yearb 71:94–102
Cai ZQ, Rijkers T, Bongers F (2005) Photosynthetic acclimation tolight changes in tropical monsoon forest woody species diVeringin adult stature. Tree Physiol 25:1023–1031
Carlquist S (1970) Hawaii: a natural history. Natural History Press,New York
Chazdon RL (1988) SunXecks and their importance to forest under-story plants. Adv Ecol Res 18:1–63
Chazdon RL, Pearcy RW (1986a) Photosynthetic responses to lightvariation in rainforest species. 1. Induction under constant andXuctuating light conditions. Oecologia 69:517–523
Chazdon RL, Pearcy RW (1986b) Photosynthetic responses to lightvariation in rainforest species. 2. Carbon gain and photosyntheticeYciency during lightXecks. Oecologia 69:524–531
Chazdon RL, Pearcy RW (1991) The importance of sunXecks for forestunderstory plants. BioScience 41:760–766
Chazdon RL, Williams K, Field CB (1988) Interactions betweencrown structure and light environment in Wve rain forest Piperspecies. Am J Bot 75:1459–1471
Cowan IR, Farquhar GD (1977) Stomatal function in relation toleaf metabolism and environment. Soc Exp Biol Symp31:471–505
Durand LZ, Goldstein G (2001) Photosynthesis, photoinhibition, andnitrogen use eYciency in native and invasive tree ferns in Hawaii.Oecologia 126:345–354
Ellsworth DS, Reich PB (1992) Leaf mass per area, nitrogen contentand photosynthetic carbon gain in Acer saccharum seedlings incontrasting forest light environments. Funct Ecol 6:423–435
123
466 Oecologia (2008) 155:455–467
Falster DS, Warton DI, Wright IJ (2006) (S)MATR: standardisedmajor axis tests and routines. Version 2.0. http://www.bio.mq.edu.au/ecology/SMATR/
Felsenstein J (1985) Phylogenies and the comparative method. Am Nat125:1–15
Gillespie RG (2004) Community assembly through adaptive radiationin Hawaiian spiders. Science 303:356–359
Givnish TJ (1986) Optimal stomatal conductance, allocation of energybetween leaves and roots, and the marginal cost of transpiration.In: Givnish TJ (ed) On the economy of plant form and function.Cambridge University Press, Cambridge, pp 171–213
Givnish TJ (1988) Adaptation to sun vs. shade: a whole-plant perspec-tive. Aust J Plant Physiol 15:63–92
Givnish TJ (1997) Adaptive radiation and molecular systematics: aimsand conceptual issues. In: Givnish TJ, Sytsma KJ (eds) Molecularevolution and adaptive radiation. Cambridge University Press,New York, pp 1–54
Givnish TJ (1998) Adaptive radiation of plants on oceanic islands: clas-sical patterns, molecular data, new insights. In: Grant P (ed) Evolu-tion on islands. Oxford University Press, New York, pp 281–304
Givnish TJ (2002) On the adaptive signiWcance of evergreen vs. decid-uous leaves: solving the triple paradox. Silva Fenn 36:703–743
Givnish TJ, Sytsma KJ, Hahn WJ, Smith JF (1995) Molecular evolu-tion, adaptive radiation, and geographic speciation in Cyanea(Campanulaceae, Lobelioideae). In: Wagner WL, Funk VA (eds)Hawaiian biogeography: evolution on a hot spot Archipelago.Smithsonian Institution Press, Washington, pp 288–337
Givnish TJ, Montgomery RA, Goldstein G (2004) Adaptive radiationof photosynthetic physiology in the Hawaiian lobeliads: light re-gimes, static light responses, and whole-plant compensationpoints. Am J Bot 91:228–246
Horn HS (1971) The adaptive geometry of trees. Princeton UniversityPress, Princeton
King D (1981) Tree dimensions—maximizing the rate of heightgrowth in dense stands. Oecologia 51:351–356
Kirschbaum MUF, Küppers M, Schneider H, Giersch C, Noe S (1998)Modelling photosynthesis in Xuctuating light with inclusion ofstomatal conductance, biochemical activation and pools of keyphotosynthetic intermediates. Planta 204:16–26
Kitajima K (1994) Relative importance of photosynthetic traits andallocation pattern as correlates of seedling shade tolerance in 13tropical trees. Oecologia 98:419–428
Lammers TG (1999) Campanulaceae. In: Wagner WL, Herbst DR,Sohmer SH (eds) Manual of the Xowering plants of Hawaii. Bish-op Museum Publications, Honolulu, pp 420–489
Le Gouallec JL, Cornic G, Blanc P (1990) Relations between sunXecksequences and photoinhibition of photosynthesis in a tropicalrainforest understorey herb. Am J Bot 77:999–1006
Leakey ADB, Scholes JD, Press MC (2005) Physiological and ecolog-ical signiWcance of sunXecks for dipterocarp seedlings. J Exp Bot56:469–482
Lee DW (1989) Canopy dynamics and light climates in a tropical moistdeciduous forest in India. J Trop Ecol 5:65–79
Lindqvist C, Motley TJ, JeVrey JJ, Albert VA (2003) Cladogenesis andreticulation in the Hawaiian endemic mints (Lamiaceae). Cladis-tics 19:480–495
Montgomery RA, Chazdon RL (2002) Light gradient partitioning bytropical tree seedlings in the absence of canopy gaps. Oecologia131:165–174
Naumburg E, Ellsworth DS (2002) Short-term light and leaf photosyn-thetic dynamics aVect estimates of daily understory photosynthe-sis in four tree species. Tree Physiol 22:393–401
Naumburg E, Ellsworth DS, Katul GG (2001) Modeling dynamicunderstory photosynthesis of contrasting species in ambient andelevated carbon dioxide. Oecologia 126:487–499
Pagel M (1999) The maximum likelihood approach to reconstructingancestral character states of discrete characters on phylogenies.Syst Biol 48:612–622
Pearcy RW (1990) SunXecks and photosynthesis in plant canopies.Annu Rev Plant Physiol Mol Biol 41:421–453
Pearcy RW, Osteryoung K, Randall D (1982) Carbon dioxide ex-change characteristics of C4 Hawaiian Euphorbia species nativeto diverse habitats. Oecologia 55:333–341
PWtsch WA, Pearcy RW (1989) Daily carbon gain by Adenocaulon bi-color (Asteraceae), a redwood forest understory herb, in relationto its light environment. Oecologia 80:465–470
Piano F, Craddock EM, Kambysellis MP (1997) Phylogeny of theisland populations of the Hawaiian Drosophila grimshawicomplex: evidence from combined data. Mol Phyl Evol 7:173–184
Poorter L, Bongers F (2006) Leaf traits are good predictors of plantperformance across 53 rain forest species. Ecol 87:1733–1743
Poorter L, Oberbauer SF (1993) Photosynthesis induction responses oftwo rainforest tree species in relation to light environment. Oeco-logia 96:193–199
Price JP, Wagner WL (2004) Speciation in Hawaiian angiosperm lin-eages: cause, consequence, and mode. Evolution 58:2185–2200
Robichaux RH (1984) Variation in the tissue water relations of twosympatric Hawaiian Dubautia species and their natural hybrid.Oecologia 65:75–81
Robichaux RH, CanWeld JE (1985) Tissue elastic properties of eightHawaiian Dubautia species that diVer in habitat and diploid chro-mosome number. Oecologia 66:77–80
Robichaux RH, Carr GD, Liebman M, Pearcy RW (1990) Adaptiveradiation of the Hawaiian silversword alliance (Compositae Mad-iinae)—ecological, morphological, and physiological diversity.Ann Mo Bot Gard 77:64–72
Robichaux RH, Pearcy RW (1980) Photosynthetic responses of C3 andC4 species from cool shaded habitats in Hawaii. Oecologia47:106–109
Robichaux RH, Pearcy RW (1984) Evolution of C3 and C4 plants alongan environmental moisture gradient—patterns of photosyntheticdiVerentiation in Hawaiian Scaevola and Euphorbia species. AmJ Bot 71:121–129
Rundell RJ, Holland BS, Cowie RH (2004) Molecular phylogeny andbiogeography of the Hawaiian Succineidae (Gastropoda: Pulmo-nata). Mol Phyl Evol 31:246–255
Sack L (2004) Responses of temperate woody seedlings to shade anddrought: do trade-oVs limit potential niche diVerentiation? Oikos107:110–127
Sack L, Grubb PJ (2001) Why do species of woody seedlings changerank in relative growth rate between low and high irradiance?Funct Ecol 15:145–154
Sakai AK, Weller SG, Wagner WL, NepokroeV M, Cullen TM (2006)Adaptive radiation and evolution of breeding systems in Schiedea(Caryophyllaceae), an endemic Hawaiian genus. Ann Mo BotGard 93:49–63
Sassenrath-Cole GF, Pearcy RW (1994) Regulation of photosyntheticinduction state by the magnitude and duration of low-light expo-sure. Plant Physiol 105:1115–1123
Seiwa K (2007) Trade-oVs between seedling growth and survival indeciduous broadleaved trees in a temperate forest. Ann Bot99:537–544
Sharkey TD, Seemann JR, Pearcy RW (1986) Contribution of metab-olites of photosynthesis to postillumination CO2 assimilation inresponse to lightXecks. Plant Physiol 82:1063–1068
Sokal RR, Rohlf FJ (1995) Biometry: the principles and practice of sta-tistics in biological research, 3rd edn. Freeman, New York
Tilman D (1988) Plant strategies and the dynamics and structure ofplant communities. Princeton University Press, Princeton
123

Oecologia (2008) 155:455–467 467
Timm HC, Stegemann J, Küppers M (2002) Photosynthetic inductionstrongly aVects the light compensation point of net photosynthesisand coincidentally the apparent quantum yield. Trees Struct Funct16:47–62
Tinoco-Ojanguren C, Pearcy RW (1993) Stomatal dynamics and itsimportance to carbon gain in 2 rainforest Piper species. 1. VPDeVects on the transient stomatal response to lightXecks. Oeclogia94:388–394
Tinoco-Ojanguren C, Pearcy RW (1995) A comparison of light qualityand quantity eVects on the growth and steady-state and dynamicphotosynthetic characteristics of 3 tropical tree species. FunctEcol 9:222–230
Valladares F, Pearcy RW (2002) Drought can be more critical in theshade than in the sun: a Weld study of carbon gain and photo-inhi-bition in a Californian shrub during a dry El Nino year. Plant CellEnviron 25:749–759
Valladares F, Allen MT, Pearcy RW (1997) Photosynthetic responsesto dynamic light under Weld conditions in six tropical rainforestshrubs occurring along a light gradient. Oecologia 111:505–514
Valladares F, Arrieta S, Aranda I, Lorenzo D, Sanchez-Gomez D, TenaD, Suarez F, Pardos JA (2005) Shade tolerance, photoinhibitionsensitivity and phenotypic plasticity of Ilex aquifoliium in conti-nental Mediterranean sites. Tree Physiol 25:1041–1052
Wagner WL, Herbst DR, Sohmer SH (1990) Manual of the Xoweringplants of Hawai'i. University of Hawaii Press,Bishop MuseumPress, Honolulu
Watling JR, Robinson SA, Woodrow IE, Osmond CB (1997) Respons-es of rainforest understorey plants to excess light during sun-Xecks. Aust J Plant Physiol 24:17–25
Young DR, Smith WK (1979) InXuence of sunXecks on the tempera-ture and water relations of two subalpine understorey congeners.Oecologia 43:195–205
123

Appendix 1. All parameters used by the dynamic photosynthesis model to estimate daily photosynthesis for Cyanea pilosa subsp.
longipedunculata and Clermontia parviflora in the Ola‘a Tract, Hawai‘i Volcanoes National Park. Cyanea occurs in shaded forest
understories that average 3.2 mol photons m-2 day-1. In contrast, Clermontia occurs in gaps and along forest edges that average 8.3
mol photons m-2 day-1.
Clermontia parviflora Cyanea pilosa Symbol Description Parameter value Source Stomatal module gwsat Light saturated stomatal
conductance to water vapor 305 mmol m-2 s-1 100 mmol m-2 s-1 PFD response curve
αg Initial slope of gw light response 0.472 1.496 PFD response curve θg Curvature parameter 0.719 0.600 PFD response curve τgi Time constant for biochemical
opening signal 400 5.5 fit stomatal response to shade period and
subsequent saturating PFD τgd Time constant for biochemical
closing signal 1000 550 fit stomatal response to shade period and
subsequent saturating PFD τgk Time constant for osmotica in-
/efflux 50 85 fit stomatal response to shade period and
subsequent saturating PFD τgw Time constant for water in-/efflux 1 5.5 fit stomatal response to shade period and
subsequent saturating PFD Photosynthetic module ca Atmospheric CO2 concentration 365 365 Vcmax Maximal Rubisco activation in
high light 27.2 11.2 CO2 response curve
Vcmin Minimal Rubisco activation in dark 2.7 1.1 10% of Vcmax αR Initial slope of Rubisco activation
light response 0.093 0.102 PFD response curve

light response θR curvature parameter of Rubisco
activation light response 0.558 0.697 PFD response curve
τRi time constant for Rubisco activation in light
98 82 time constant for increase in biochemical induction during initial saturating PFD in controlled light experiments
τRd Time constant for Rubisco deactivation
578 1318 time constant for decrease in biochemical induction when leaves are moved from saturating light to darkness
VFmax Maximal RuBP regeneration rate in high PFD
49.0 20.2 1.8 x Vcmax (Naumburg et al. 2001; Pearcy et al. 1997; Leuning 1995)
VFmin Minimal RuBP regeneration rate in dark
0.10 0.10 ~0.2% of VFmax (Naumburg et al 2001; Sassenrath-Cole and Pearch 1994)
αf Initial slope of RuBP regneration light response
0.3 0.3 Naumburg et al. 2001; Sassenrath-Cole and Pearcy 1994
θf Curvature parameter of RuBP regeneration rate light response
0.95 0.95 Naumburg et al. 2001; Sassenrath-Cole and Pearcy 1994
τfi Time constant for RuBP regeneration activation in light
90 90 Naumburg et al. 2001; Sassenrath-Cole and Pearcy 1994
τfd Time constant for RuBP regeneration deactivation
180 180 Naumburg et al. 2001; Sassenrath-Cole and Pearcy 1994
VJmax Maximum electron transport in high light
99.64 36.42 CO2 response curve
αj Quantum yield of electron transport
0.093 0.102 PFD response curve
θj Curvature parameter of electron transport
0.558 0.697 PFD response curve
Rmax Maximum RuBP pool size 27.24 11.208 1 x Vcmax (Naumburg et al. 2001) KR Apparent Michaelis-Menton
constant for RuBP utilization by 1 1 Naumburg et al. 2001; Kirschbaum et al.
1998

Rubisco Tmax Maximum triose phosphate pool
size 13.62 5.604 ~0.5 x Vcmax (Naumburg et al. 2001)
KT Apparent Michaelis-Menton constant for RuBP regeneration
15 15 Naumburg et al. 2001; Kirschbaum et al. 1998
Rd Non-photorespiratory day respiration
1.09 0.47 PFD response curve
Ψ Decay rate of glycolate pool intermediates
0.1 0.1 Naumburg et al. 2001
Copyright © 2022 FDOKUMEN