Acute changes in substrate oxidation do not affect short-term food intake in healthy boys and men
10
ARTICLE Acute changes in substrate oxidation do not affect short-term food intake in healthy boys and men Sascha Hunschede, Dalia El Khoury, Sophie Antoine-Jonville, Christopher Smith, Scott Thomas, and G. Harvey Anderson Abstract: The acute relationship between substrate oxidation as measured by respiratory exchange ratio (RER) and food intake (FI) has not been defined. The purpose of the study was to determine acute relationships between RER, modified by exercise and a glucose load, and FI and net energy balance (NEB) in physically active normal-weight boys and men. In a crossover design, 15 boys (aged 9–12 years) and 15 men (aged 20–30 years) were randomly assigned to 4 conditions: (i) water and rest, (ii) glucose-drink and rest, (iii) water and exercise, and (iv) glucose-drink and exercise. Indirect calorimetry was used to determine RER, energy expenditure, and carbohydrate and fat oxidation. Subjective appetite and blood glucose were also measured. RER was higher after glucose (0.91 ± 0.01) compared with water (0.87 ± 0.01) (p < 0.0001), and after exercise (0.91 ± 0.01) compared with rest (0.88 ± 0.01) (p = 0.0043) in men (0.91 ± 0.01) compared with boys (0.88 ± 0.01) (p = 0.0002). FI (kcal·m −2 ) did not differ between boys and men. Glucose (582 ± 24 kcal·m −2 ) reduced FI compared with water (689 ± 25 kcal·m −2 )(p < 0.0001), and further decreased FI when combined with exercise (554 ± 34 kcal·m −2 )(p = 0.0303). NEB was reduced with exercise (573 ± 25 kcal·m −2 ) compared with the sedentary condition (686 ± 24 kcal·m −2 )(p < 0.0001), but was higher after the glucose drink (654 ± 27 kcal·m −2 ) compared with water (605 ± 25 kcal·m −2 )(p = 0.0267). No correlations were found between RER and FI or NEB in boys and men, except in the control condition of resting with water. In conclusion, the short-term modification of substrate oxidation by glucose and/or exercise in normal weight and active boys and men did not affect FI and NEB. Key words: energy balance, appetite, exercise, respiratory exchange ratio, metabolism. Résumé : La relation immédiate entre l’apport alimentaire (« FI ») et l’oxydation des substrats telle que mesurée par le ratio d’échanges gazeux (« RER ») n’est pas encore définie. Cette étude se propose d’évaluer la relation immédiate entre le RER, modifié par l’exercice physique et par une charge glucidique et FI et le bilan énergétique net (« NEB ») chez des garçons et des hommes physiquement actifs de poids normal. Selon un devis croisé, on répartit aléatoirement 15 garçons (âgé de 9–12 ans) et 15 hommes (20–30 ans) dans quatre conditions : 1) eau et repos, 2) boisson glucosée et repos, 3) eau et exercice physique et 4) boisson glucosée et exercice physique. On utilise la calorimétrie indirecte pour évaluer le RER, la dépense énergétique et le taux d’oxydation des sucres et des gras. On évalue aussi la sensation de faim et le taux sanguin de glucose. Le RER est plus élevé dans la condition de glucose (0,91 ± 0,01) comparativement a ` la condition de l’eau (0,87 ± 0,01) (p < 0,0001) et dans la condition de l’exercice physique (0,91 ± 0,01) comparativement a ` la condition de repos (0,88 ± 0,01) (p = 0,0043) chez les hommes (0,91 ± 0,01) comparativement aux garçons (0,88 ± 0,01) (p = 0,0002). FI (kcal·m −2 ) ne diffère pas entre les garçons et les hommes. Le glucose (582 ± 24 kcal·m −2 ) suscite une diminution de FI comparativement a ` l’eau (689 ± 25 kcal·m −2 )(p < 0,0001); combiné a ` l’exercice physique, FI diminue davantage (554 ± 34 kcal·m −2 )(p = 0,0303). L’exercice physique diminue le NEB (573 ± 25 kcal·m −2 ) comparativement a ` la condition de repos (686 ± 24 kcal·m −2 )(p < 0,0001), mais le NEB est plus élevé après la boisson glucosée (654 ± 27 kcal·m −2 ) comparativement a ` l’eau (605 ± 25 kcal·m −2 )(p = 0,0267). On n’observe aucune corrélation entre RER et FI ou NEB chez les garçons et les hommes, sauf dans la condition de contrôle avec de l’eau. La modification a ` court terme de l’oxydation des substrats par le glucose et/ou l’exercice physique chez des garçons et des hommes de poids normal physiquement actifs n’a pas d’impact sur FI et NEB. [Traduit par la Rédaction] Mots-clés : équilibre énergétique, appétit, exercice physique, ratio d’échanges gazeux, métabolisme. Introduction Substrate oxidation has long been thought to play an important role in the homeostatic control of food intake (FI). Many factors affect oxidation and availability of substrates, including FI and composition (Van Wymelbeke et al. 2001), aerobic exercise (Thompson et al. 1998), obesity (Zunquin et al. 2009), and pubertal status (Riddell et al. 2008). However, it remains unclear if short- term FI is affected by either the ratio of carbohydrate oxidation to fat oxidation or the absolute amounts of each macronutrient be- ing oxidized. In the 1950s, the glucostatic and lipostatic theories of appetite regulation proposed a negative feedback model of FI, which is designed to maintain the body’s stored macronutrient levels at a set point (Kennedy 1953; Mayer 1953). Particularly, carbohydrates Received 23 May 2014. Accepted 5 October 2014. S. Hunschede, D. El Khoury, and C. Smith. Department for Nutritional Sciences, Faculty of Medicine, University of Toronto, Toronto, ON M5S 3E2, Canada. S. Antoine-Jonville. Sports Sciences Department ACTES Laboratory, University of the French West Indies and French Guiana, EA 3596, 97157 Pointe-a `- Pitre Cédex, Guadeloupe, French West Indies. S. Thomas.* Faculty of Kinesiology and Physical Education, University of Toronto, Toronto, ON M5S 2W6, Canada. G.H. Anderson. Department for Nutritional Sciences, Faculty of Medicine, University of Toronto, Toronto, ON M5S 3E2, Canada; Department of Physiology, Faculty of Medicine, University of Toronto, Toronto ON M5S 2J7, Canada. Corresponding author: G. Harvey Anderson (e-mail: [email protected]). *All editorial decisions for this paper were made by Jeffrey Horowitz and Terry Graham. 168 Appl. Physiol. Nutr. Metab. 40: 168–177 (2015) dx.doi.org/10.1139/apnm-2014-0188 Published at www.nrcresearchpress.com/apnm on 22 October 2014. Appl. Physiol. Nutr. Metab. Downloaded from www.nrcresearchpress.com by University of Toronto on 02/10/15 For personal use only.
Transcript of Acute changes in substrate oxidation do not affect short-term food intake in healthy boys and men
ARTICLE
Acute changes in substrate oxidation do not affect short-termfood intake in healthy boys and menSascha Hunschede, Dalia El Khoury, Sophie Antoine-Jonville, Christopher Smith, Scott Thomas,and G. Harvey Anderson
Abstract: The acute relationship between substrate oxidation as measured by respiratory exchange ratio (RER) and food intake(FI) has not been defined. The purpose of the study was to determine acute relationships between RER, modified by exercise anda glucose load, and FI and net energy balance (NEB) in physically active normal-weight boys and men. In a crossover design,15 boys (aged 9–12 years) and 15 men (aged 20–30 years) were randomly assigned to 4 conditions: (i) water and rest, (ii) glucose-drink andrest, (iii) water and exercise, and (iv) glucose-drink and exercise. Indirect calorimetry was used to determine RER, energyexpenditure, and carbohydrate and fat oxidation. Subjective appetite and blood glucose were also measured. RER was higherafter glucose (0.91 ± 0.01) compared with water (0.87 ± 0.01) (p < 0.0001), and after exercise (0.91 ± 0.01) compared with rest (0.88 ±0.01) (p = 0.0043) in men (0.91 ± 0.01) compared with boys (0.88 ± 0.01) (p = 0.0002). FI (kcal·m−2) did not differ between boys andmen. Glucose (582 ± 24 kcal·m−2) reduced FI compared with water (689 ± 25 kcal·m−2) (p < 0.0001), and further decreased FI whencombined with exercise (554 ± 34 kcal·m−2) (p = 0.0303). NEB was reduced with exercise (573 ± 25 kcal·m−2) compared with thesedentary condition (686 ± 24 kcal·m−2) (p < 0.0001), but was higher after the glucose drink (654 ± 27 kcal·m−2) compared withwater (605 ± 25 kcal·m−2) (p = 0.0267). No correlations were found between RER and FI or NEB in boys and men, except in thecontrol condition of resting with water. In conclusion, the short-term modification of substrate oxidation by glucose and/orexercise in normal weight and active boys and men did not affect FI and NEB.
Key words: energy balance, appetite, exercise, respiratory exchange ratio, metabolism.
Résumé : La relation immédiate entre l’apport alimentaire (« FI ») et l’oxydation des substrats telle que mesurée par le ratio d’échangesgazeux (« RER ») n’est pas encore définie. Cette étude se propose d’évaluer la relation immédiate entre le RER, modifié par l’exercicephysique et par une charge glucidique et FI et le bilan énergétique net (« NEB ») chez des garçons et des hommes physiquement actifsde poids normal. Selon un devis croisé, on répartit aléatoirement 15 garçons (âgé de 9–12 ans) et 15 hommes (20–30 ans) dans quatreconditions : 1) eau et repos, 2) boisson glucosée et repos, 3) eau et exercice physique et 4) boisson glucosée et exercice physique. Onutilise la calorimétrie indirecte pour évaluer le RER, la dépense énergétique et le taux d’oxydation des sucres et des gras. On évalueaussi la sensation de faim et le taux sanguin de glucose. Le RER est plus élevé dans la condition de glucose (0,91 ± 0,01) comparativementa la condition de l’eau (0,87 ± 0,01) (p < 0,0001) et dans la condition de l’exercice physique (0,91 ± 0,01) comparativement a la conditionde repos (0,88 ± 0,01) (p = 0,0043) chez les hommes (0,91 ± 0,01) comparativement aux garçons (0,88 ± 0,01) (p = 0,0002). FI (kcal·m−2) nediffère pas entre les garçons et les hommes. Le glucose (582 ± 24 kcal·m−2) suscite une diminution de FI comparativement a l’eau (689 ±25 kcal·m−2) (p < 0,0001); combiné a l’exercice physique, FI diminue davantage (554 ± 34 kcal·m−2) (p = 0,0303). L’exercice physiquediminue le NEB (573 ± 25 kcal·m−2) comparativement a la condition de repos (686 ± 24 kcal·m−2) (p < 0,0001), mais le NEB est plusélevé après la boisson glucosée (654 ± 27 kcal·m−2) comparativement a l’eau (605 ± 25 kcal·m−2) (p = 0,0267). On n’observe aucunecorrélation entre RER et FI ou NEB chez les garçons et les hommes, sauf dans la condition de contrôle avec de l’eau. Lamodification a court terme de l’oxydation des substrats par le glucose et/ou l’exercice physique chez des garçons et des hommesde poids normal physiquement actifs n’a pas d’impact sur FI et NEB. [Traduit par la Rédaction]
Mots-clés : équilibre énergétique, appétit, exercice physique, ratio d’échanges gazeux, métabolisme.
IntroductionSubstrate oxidation has long been thought to play an important
role in the homeostatic control of food intake (FI). Many factorsaffect oxidation and availability of substrates, including FI andcomposition (Van Wymelbeke et al. 2001), aerobic exercise(Thompson et al. 1998), obesity (Zunquin et al. 2009), and pubertalstatus (Riddell et al. 2008). However, it remains unclear if short-
term FI is affected by either the ratio of carbohydrate oxidation tofat oxidation or the absolute amounts of each macronutrient be-ing oxidized.
In the 1950s, the glucostatic and lipostatic theories of appetiteregulation proposed a negative feedback model of FI, which isdesigned to maintain the body’s stored macronutrient levels at aset point (Kennedy 1953; Mayer 1953). Particularly, carbohydrates
Received 23 May 2014. Accepted 5 October 2014.
S. Hunschede, D. El Khoury, and C. Smith. Department for Nutritional Sciences, Faculty of Medicine, University of Toronto, Toronto, ON M5S 3E2, Canada.S. Antoine-Jonville. Sports Sciences Department ACTES Laboratory, University of the French West Indies and French Guiana, EA 3596, 97157 Pointe-a-Pitre Cédex, Guadeloupe, French West Indies.S. Thomas.* Faculty of Kinesiology and Physical Education, University of Toronto, Toronto, ON M5S 2W6, Canada.G.H. Anderson. Department for Nutritional Sciences, Faculty of Medicine, University of Toronto, Toronto, ON M5S 3E2, Canada; Department of Physiology, Facultyof Medicine, University of Toronto, Toronto ON M5S 2J7, Canada.Corresponding author: G. Harvey Anderson (e-mail: [email protected]).*All editorial decisions for this paper were made by Jeffrey Horowitz and Terry Graham.
168
Appl. Physiol. Nutr. Metab. 40: 168–177 (2015) dx.doi.org/10.1139/apnm-2014-0188 Published at www.nrcresearchpress.com/apnm on 22 October 2014.
App
l. Ph
ysio
l. N
utr.
Met
ab. D
ownl
oade
d fr
om w
ww
.nrc
rese
arch
pres
s.co
m b
y U
nive
rsity
of
Tor
onto
on
02/1
0/15
For
pers
onal
use
onl
y.
receive a high metabolic priority because of their limited storagecapacity. To maintain carbohydrate stores, carbohydrate oxida-tion needs to be closely reflected by short-term carbohydrate in-take. Thus, it was hypothesized that short-term FI is linked tosubstrate oxidation (Flatt 1987; Galgani and Ravussin 2008).
Animal models showed a relationship between carbohydrateoxidation and FI (Friedman and Tordoff 1986). In humans, how-ever, only indirect evidence has emerged. One study linked sub-strate oxidation with the liking of sweet and fatty foods (Brondelet al. 2011). Another study showed that an increased carbohydrateoxidation, caused by a meal high in carbohydrates, prolongs sati-ety, and delays the onset of the next meal when compared with ameal containing less carbohydrates (Van Wymelbeke et al. 2001).Similarly, acute exercise decreases postexercise appetite (Martinset al. 2007) and increases the oxidation of substrates coming fromcarbohydrates (Van Loon et al. 2001).
With age, carbohydrate relative to fat oxidation increases.Adults exhibit relatively higher rates of carbohydrate oxidationcompared with younger individuals, and postpubertal boys grad-ually rely less on fat oxidation when compared with prepubertalboys (Riddell et al. 2008). Furthermore, overweight and obeseindividuals have a reduced ability to switch between fat andcarbohydrate oxidation, which may contribute to an impairedregulation of FI and excess energy intake (Hopkins et al. 2011).However, boys and men represent an ideal model to investigatethe effect of different oxidative profiles on FI regulation withoutobesity-relatedhyperphagiaasconfoundingfactor (Berthoudetal.2011).
However, evidence to support a direct link between substrateoxidation and compensatory eating is weak (Stubbs et al. 1993;Brondel et al. 2011) and no study has investigated an acute associ-ation between substrate oxidation and FI control within subjects.Therefore, the objective of this study was to examine the relation-ship between acute substrate oxidation and short-term FI regula-tion. We hypothesized that acute increases in carbohydraterelative to fat oxidation will be associated with increased FI.Carbohydrate- relative to fat oxidation, was increased by a glucosepreload and exercise at moderate intensities at 44%–49% of peakoxygen consumption (VO2peak) in young adult men and pre-pubertal boys and followed by measurement of FI at an ad libitumpizza lunch.
Materials and methods
Subjects and study designUsing a single-blinded within-subject 2 × 2 × 2 factorial
repeated-measures randomized design, 15 normal-weight boys (aged
9–11 years) and 15 normal weight male adults (aged 20–29 years)completed the study. The study treatments consisted of glucosepreload or water control combined with moderate exercise for40 min (two 20-min bouts with a 5-min rest interposed) or restingfor each age group (Fig. 1). Participants were recruited throughadvertisements at the University of Toronto Athletic Center andsports clubs in the immediate vicinity between September 2011and May 2012. Primary measurements for this study included re-spiratory exchange ratio (RER), FI, and net energy balance (NEB).Secondary measurements included carbohydrate and fat oxida-tion, blood glucose levels, and visual analog scale (VAS) measure-ments of subjective appetite and physical comfort. Tanner stagingwas assessed during the screening session of the boys becausechildren and adolescents decrease their ability to oxidize fat asthey go through puberty until they reach adulthood (Riddell et al.2008). Boys with Tanner stage 1–2 and men with Tanner stage 5were chosen to take part in the study. Participants were bornfull-term and had a normal body weight at birth. Eligibility for thestudy was determined via a telephone screening questionnaire.Smokers; dieters; individuals with lactose intolerance, allergies tomilk and dairy products, gastrointestinal problems, diabetes, orother metabolic diseases; and those scoring ≥11 on an Eating HabitQuestionnaire were excluded from the study (Tamam et al. 2012).Procedures were approved by the University of Toronto HealthSciences Research Ethics Board, and informed consent was ob-tained from all adult participants and the parents of the childrenas well as assent from the children themselves. Six participantsdid not complete the study because of time-scheduling difficultiesand elevated fasting blood glucose levels.
TreatmentsFor adults, the preload beverages consisted of either 350 mL
water or glucose to provide 1.1 g·kg−1 body weight of glucosemonohydrate (Grain Process Enterprises, Toronto, Ont., Canada)and 1.6 g of aspartame-sweetened orange-flavoured crystals (SugarFree Kool-Aid, Kraft Canada Inc., Don Mills, Ont., Canada). Forboys, the preload consisted of 250 mL of water or a glucose drinkcontaining 1.31 g·kg−1 body weight of glucose monohydrate and1.1 g of aspartame- sweetened orange-flavoured crystals in 250 mLof water. The glucose monohydrate was adjusted with a correctionfactor of 1.1 to match a glucose load of 1.0 g·kg−1 body weight ofglucose in adults and 1.2 g·kg−1 body weight of glucose in boys. Apreload providing 1.0 g·kg−1 body weight of glucose in men, in-stead of 1.2 g·kg−1 body-weight in boys, was selected to reduce therisk of nausea, which is caused by high glucose intake (Schwartz
Fig. 1. Overview of study protocol. a, End of ad libitum pizza meal for men; b, end of ad libitum pizza meal for boys.
Hunschede et al. 169
Published by NRC Research Press
App
l. Ph
ysio
l. N
utr.
Met
ab. D
ownl
oade
d fr
om w
ww
.nrc
rese
arch
pres
s.co
m b
y U
nive
rsity
of
Tor
onto
on
02/1
0/15
For
pers
onal
use
onl
y.
et al. 1990). However, the caloric content for the preload adjustedfor body surface area (BSA), were similar for boys at 36 g·m−2 andmen at 39 g·m−2. Drinks were prepared the day prior to the studysession in covered, opaque cups, and refrigerated at 4 °C. Partici-pants were instructed to finish the glucose or water drink within5 min by drinking at a constant pace.
Aerobic fitness and exercise intensity for subsequent metabolictesting were determined during the screening session, by a con-tinuous incremental walking protocol on a motorized treadmill(Harrell et al. 2005). The protocol was carried out on a motorizedTrackmaster TMX 425 CP treadmill (Full Vision, Newton, Kans.,USA), with nine 2-min stages of increasing slope and grade, until avoluntary exhaustion was reached. This protocol was used to de-termine VO2peak, which is often used as a marker for physicalfitness. During this VO2peak test, 1 of the following 3 criteria wereestablished. If oxygen consumption remained at a steady state,despite an increase in workload, the average oxygen consumption(VO2) value of the 6 highest consecutive breaths was used to de-termine VO2peak as the first and main criteria. Similarly, if the RERwas greater than 1.15, a VO2peak was established as the average VO2
for the 6 highest consecutive breaths. The third criterion was aheart rate (HR) greater than 190 beats·min−1 in adults and200 beats·min−1 in children. Out of 15 adults, 11 reached the VO2plateau, 15 reached RERs greater than 1.15, and 9 reached an HRequal to 190 beats·min−1. In children, 7 reached a VO2 plateau,5 reached an RER of greater than 1.15, and 6 reached an HR of200 beats·min−1. If a participant failed to reach 1 of the abovemen-tioned criteria, he had to retake the test again within 2 weeks afterthe experimental sessions were completed. The measurement ofventilatory gases identified the ventilatory threshold (VET), andthe RER of 0.82, which translates into an approximate oxidationof 40% of carbohydrates and 60% of fat. The VET is often used as apractical and noninvasive estimate of an individual’s anaerobicthreshold (Loat and Rhodes 1993). The slope and speed required toachieve the exercise intensity associated with an RER of 0.82 wereidentified. Each participant’s uniquely identified slope and speed,corresponding to an RER of 0.82, were then employed during theexperimental exercise sessions.
ProtocolFor each session, participants attended the Human Perfor-
mance and Physiology Laboratory at the University of Torontoafter a 12-h overnight fast, and were permitted to drink water upto 1 h before the study session. To minimize within-subject vari-ability, each participant was asked to arrive at the same time andon the same day of the week for each treatment, to refrain fromalcohol consumption, and to maintain the same dietary and exer-cise patterns the evening before each test. The sessions were con-ducted 1 week apart. To measure feelings of subjective appetite,physical comfort, thirst, and preload/food palatability, partici-pants completed a 100-mm VAS questionnaire, which was usedand validated in previous studies (Akhavan et al. 2010; Panahiet al. 2013). Participants were instructed to read each question andplace an “X” along a 100-mm line depending on how they felt atthe current moment.
Before the beginning of each test, participants provided a base-line finger prick capillary blood sample using a Monoejector Lan-cet device (Sherwood Medical, St. Louis, Mo., USA). Blood glucosewas measured using a glucose meter (Accu-Chek Compact; RocheDiagnostics Canada, Laval, Que., Canada). A baseline glucose mea-surement of >5.5 mmol·L−1 suggested noncompliance with thefasting instructions, and participants were rescheduled accord-ingly.
After completion of the baseline measurements, participantsrandomly received 1 of the 4 treatments: (i) water preload followedby resting (control), (ii) glucose preload followed by resting,(iii) water preload followed by exercise, and (iv) glucose preloadfollowed by exercise. Participants were blinded about the type of
treatment until the start of each session. Treatment order wasrandomized using randomization block design, which was gener-ated in SAS version 9.2 (SAS Institute Inc., Cary, N.C., USA). Tomeasure palatability, pleasantness, taste, and texture of treat-ments were assessed and compared using VAS questionnaires.After consumption of the preloads, participants were each fittedwith a facemask (Hans Rudolph Inc., Shawnee, Kans., USA) and anHR monitor (Polar Electro Inc., Lake Success, N.Y., USA) to collectventilatory gases and HR measurements, at both exercise andsedentary conditions. At 10 min post-ingestion, participantsstarted 2 consecutive 20-min bouts of ventilatory gas collectionwith a 5-min break between. During the 20-min bouts, subjectswere either conducting exercise on a treadmill or being seden-tary, reading comics or books, or playing board games. The face-mask was removed during the 5-min break and immediately afterthe second measurement of respiratory gases. The 5-min breakbetween the two 20-min exercise bouts ensured the assessment ofappetite via VAS and increased the comfort of the participants byremoving the head strap and allowed the investigators to cleanand readjust the face mask. VAS questionnaires, measuring sub-jective motivation to eat, thirst, and physical comfort, were com-pleted at baseline (0 min), 5 min, 15 min, 35 min, 60 min, and85 min in men but the latter at 95 min in boys after the start ofeach session. Blood glucose measurements were conducted atstart (0 min), 15 min, 35 min, and 60 min, in both boys and men,after the start of the session (Fig. 1).
To detect an association between FI and RER, participants wereprovided with an ad libitum pizza meal within 5 min after com-pletion of the ventilatory gas collection. Two varieties of 5-inchdiameter pizza (Deep and Delicious, McCain Foods Ltd., Flor-enceville, N.B., Canada) were offered at a test meal. Boys wereserved a total of 9 pizzas, with 3 pizzas per tray at 10-min intervals.Men were served a total of 12 pizzas, with 4 pizzas per tray at6:30 min intervals. The intervals and numbers of pizzas requiredfor measuring FI to completion were determined in previous stud-ies, in our lab, on adults and children. The studies found thatchildren were more distracted and needed longer feeding periodswhen compared with adults (Tamam et al. 2012; Panahi et al. 2013).This particular brand of pizza was selected because of the pizza’slack of crust and uniform composition. Each pepperoni pizza con-tained 180 kcal, 25% fat; 52% carbohydrates, and 20% protein,while cheese pizzas contained 180 kcal, 25% fat, 52% carbohy-drates, and 23% protein. Participants had the option of choosingbetween Three Cheese, Pepperoni, or a combination of both piz-zas. Pizzas were cooked and then weighed and cut into 4 equalpieces. Pizzas were then served and the amount left over after themeal was subtracted from the initial weight of the pizza to deter-mine the net weight consumed in grams. Different varieties ofpizza were weighed separately. The energy consumed (kcal) wascalculated by converting the consumed net weight of the pizza (g)using information provided by the manufacturer. A 500-mL bottleof spring water (Danone Crystal Springs, Quebec City, Que., Can-ada) was provided with the meal, and additional bottles weresupplied if requested. Subjects were asked to remain seated forthe duration of the meal, and were instructed to eat until com-fortably full. Energy intake from the pizza meal was calculatedbased on the weight consumed and the compositional informa-tion provided by the manufacturer, whereas water intake wasmeasured by weight. The NEB was derived from the calories in-gested by the preload and the pizza meal minus the calories ex-pended during the two 20 min of resting or exercising.
Collection of ventilatory gasesVentilatory gases were collected using a Moxus metabolic cart
(AEI Technologies Inc., Pittsburgh, Pa., USA), a facemask, and a2-way nonrebreathing valve (Hans Rudolph Inc.). Inspiratory ven-tilation was measured with a pneumotachometer, the O2 and CO2contents of mixed expired gas with an S-3A Oxygen Analyzer, and
170 Appl. Physiol. Nutr. Metab. Vol. 40, 2015
Published by NRC Research Press
App
l. Ph
ysio
l. N
utr.
Met
ab. D
ownl
oade
d fr
om w
ww
.nrc
rese
arch
pres
s.co
m b
y U
nive
rsity
of
Tor
onto
on
02/1
0/15
For
pers
onal
use
onl
y.
CO2 content with a CD-3A Carbon Dioxide Analyzer (AEI Technol-ogies Inc.). Known gas concentrations of 16.04% O2 and 4.06% CO2,and 20% O2 and 0.03% CO2 were used to calibrate the metaboliccart, prior to each test. One study found a high reliability andvalidity of the Moxus metabolic cart over a wide measurementrange using 2 sensors for ventilation against the Douglas bagmethod (Rosdahl et al. 2013).
Measurement of physical fitnessPhysical fitness was assessed based on individual’s VO2peak and
VET. The VO2peak was assessed by averaging 6 consecutive breathsof the highest achieved values of the VO2peak test. The VET wasassessed via 2 methods: first, the ratio of pulmonary ventilation(VE) divided by VO2 and carbon dioxide volume (VCO2), in whichthe VET is identified as the point at which a rise of VE/VO2 takesplace without an increase in VE/VCO2 (Caiozzo et al. 1982); andsecond, the V-Slope method, which was used if the first methodwas inconclusive. The V-Slope method describes the VET as thepoint at which a change in slope occurs if VCO2 is plotted over VO2
(Beaver et al. 1986).
Anthropometric measurementsPhysical measurements of height (cm) and weight (kg) were
used to calculate body mass index (BMI) and to identify partici-pants with healthy body weight, according to the Centers forDisease Control and Prevention (2000) growth charts (Flegal et al.2002). Boys were classified as normal-weight if they were betweenthe 15th and 85th percentile for their BMI to age, and men wereclassified as normal-weight if they had a BMI of 20–25 kg·m−2. Forcomparison purposes between boys and men, physical measure-ments of height and weight were used to calculate BSA using theHaycock equation (Haycock et al. 1978). Food intake, energy ex-penditure (EE), NEB, and fat and carbohydrate oxidation wereadjusted for BSA, expressed per kcal·m−2.
Body fat percentage (%BF) was estimated using a Harpendenskinfold caliper (Cambridge Scientific Industries, Cambridge,Md., USA). Skinfold thickness (SKF) was recorded to 0.2 mm at4 sites (biceps, triceps, subscapular, and suprailiac crest). Age-specific regression equations were used to determine %BF in men(Womersley and Durnin 1973) and boys (Durnin and Rahaman2003), using the mean SKF of the 3 measurements at each site. Thedensity value was converted to %BF using the Siri Equation(Brozek 1961).
Substrate oxidation and EEThe measurement of ventilatory gases provided the values to
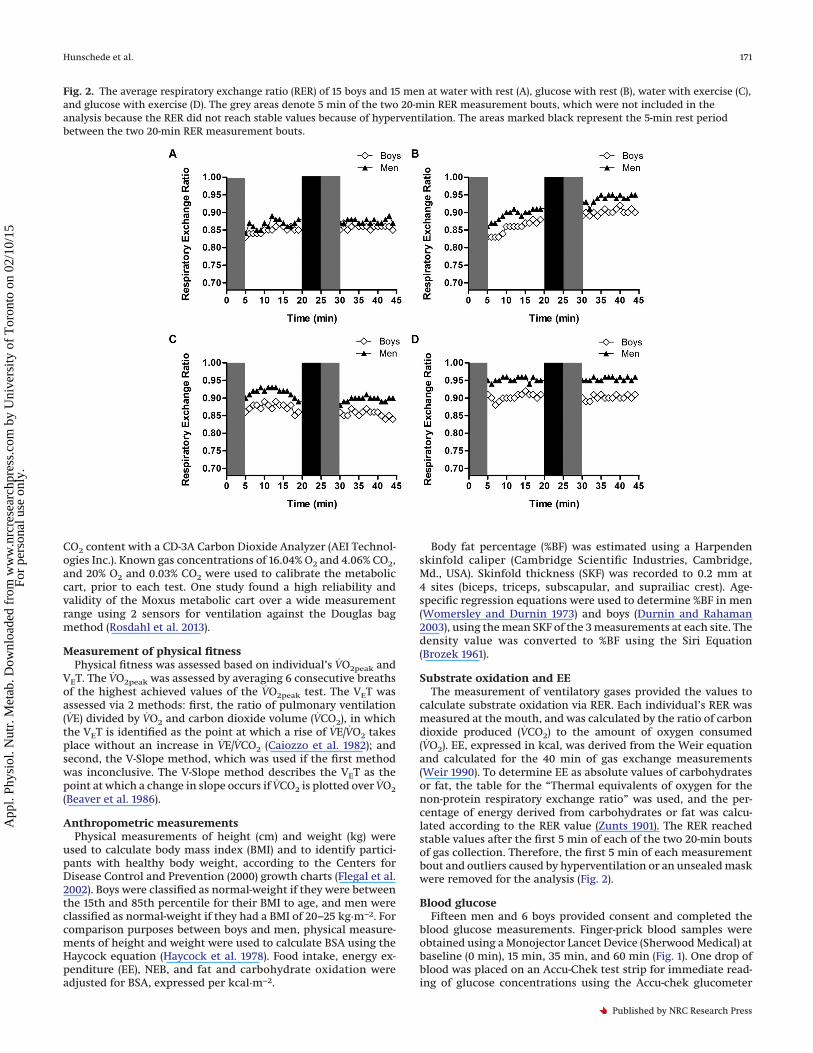
calculate substrate oxidation via RER. Each individual’s RER wasmeasured at the mouth, and was calculated by the ratio of carbondioxide produced (VCO2) to the amount of oxygen consumed(VO2). EE, expressed in kcal, was derived from the Weir equationand calculated for the 40 min of gas exchange measurements(Weir 1990). To determine EE as absolute values of carbohydratesor fat, the table for the “Thermal equivalents of oxygen for thenon-protein respiratory exchange ratio” was used, and the per-centage of energy derived from carbohydrates or fat was calcu-lated according to the RER value (Zunts 1901). The RER reachedstable values after the first 5 min of each of the two 20-min boutsof gas collection. Therefore, the first 5 min of each measurementbout and outliers caused by hyperventilation or an unsealed maskwere removed for the analysis (Fig. 2).
Blood glucoseFifteen men and 6 boys provided consent and completed the
blood glucose measurements. Finger-prick blood samples wereobtained using a Monojector Lancet Device (Sherwood Medical) atbaseline (0 min), 15 min, 35 min, and 60 min (Fig. 1). One drop ofblood was placed on an Accu-Chek test strip for immediate read-ing of glucose concentrations using the Accu-chek glucometer
Fig. 2. The average respiratory exchange ratio (RER) of 15 boys and 15 men at water with rest (A), glucose with rest (B), water with exercise (C),and glucose with exercise (D). The grey areas denote 5 min of the two 20-min RER measurement bouts, which were not included in theanalysis because the RER did not reach stable values because of hyperventilation. The areas marked black represent the 5-min rest periodbetween the two 20-min RER measurement bouts.
Hunschede et al. 171
Published by NRC Research Press
App
l. Ph
ysio
l. N
utr.
Met
ab. D
ownl
oade
d fr
om w
ww
.nrc
rese
arch
pres
s.co
m b
y U
nive
rsity
of
Tor
onto
on
02/1
0/15
For
pers
onal
use
onl
y.
(Accu-Chek Compact and Compact-Plus; Roche Diagnostics Can-ada). The accuracy of the Accu-Check compact glucometer waspreviously evaluated and considered to be interchangeable withlaboratory reference systems (Kozar et al. 2008). The meters andtest strips were standardized against Assayed Human Multi-sera(Randox Laboratories Ltd., Antrim, UK).
VASStandardized VAS questionnaires were used to measure sub-
jective appetite, physical comfort, energy/fatigue, and stress aswell as preload and pizza meal palatability and sweetness. Age-appropriate versions were used for the assessment of physicalcomfort and food/preload palatability as previously described(Tamam et al. 2012; Panahi et al. 2013). VAS questionnaires wereadministered at baseline (0 min), 5 min, 15 min, 35 min, 60 min,and 85 min (men)/95 min (boys) after initiation of each session(Fig. 1).
Statistical analysisBecause of differences in body weight between our 2 study
groups, the measurements for FI, EE, NEB, and fat and carbohy-drate oxidation were adjusted for BSA. Adjusting for BSA is pref-erable to body weight adjustment because boys have higher EEand basic metabolic rates compared with adults on a per kilogrambody weight basis (Plowman and Smith 2007). This is caused by agreater heat loss because of a larger BSA to volume ratio in chil-dren when compared with adults (Plowman and Smith 2007). Fur-thermore, BSA has been used to predict EE in adults (Kinney et al.1963) and consequently FI (Hall 2010). We therefore adjusted allmeasurements per metre squared of BSA.
A composite score of the VAS questionnaires was calculated toobtain the average scores for motivation to eat and physical com-fort for statistical analysis (Tamam et al. 2012).
Statistical analyses were conducted using SAS version 9.2 (SASInstitute Inc.). All results are presented as means ± SE. Statisticalsignificance was concluded with a p value less than 0.05. Baselineanthropometric measurements were compared between boys andmen using unpaired Students’ t test.
Food intake, NEB, RER, EE, and HR were analyzed using a3-factor PROC MIXED ANOVA with a Tukey–Kramer’s post hocanalysis test, with preload drink (glucose vs. water), activity (exer-cise vs. rest), and age (boys vs. men) as the independent variables.When a significant interaction for age with glucose, exercise, orglucose and exercise combined was revealed, ANOVA analysis wasconducted separately for boys and men. VAS scores for appetiteand blood glucose levels were analyzed using a 4-factor PROCMIXED ANOVA with a Tukey–Kramer’s post hoc analysis test, withpreload drink (glucose vs. water), activity (exercise vs. rest), age(boys vs. men), and time (0 min, 15 min, 35 min, 60 min) as theindependent variables. When a treatment and time significantinteraction was revealed, 1-factor ANOVA followed by Tukey’spost hoc test was performed to investigate the effect of treatmentson changes from baseline for appetite and blood glucose at eachtime of measurement.
Pearson correlation coefficients were calculated to identify as-sociations between FI, RER, EE, NEB, and carbohydrate and fatoxidation.
Results
Subjects’ characteristicsThirty participants, 15 normal-weight men (age: 23.5 years, BMI:
23.1 kg·m−2) and 15 normal-weight boys (age: 10.9 years, BMI per-centile: 50th percentile), completed the study (Table 1).
The data for all dependent measures are shown in Figs. 3, 4, and 5.All measurements were adjusted for BSA because of the rela-tionship of EE as measured by basal metabolic rate to BSA(Rowland et al. 1987). To assess the effectiveness of scaling, inter-class correlations were performed between adjusted values of BSA
and FI (r = −0.32, p = 0.09), NEB (r = −0.31, p = 0.1), and EE (r = 0.15,p = 0.42). No correlations between the parameters were found,indicating that our adjustments for BSA were effective. Therefore,only the results of the statistical analyses of the BSA-adjusted dataare shown in the following.
RER, fat oxidation, and carbohydrate oxidationThe treatments markedly affected RER and were reflected over
the course of 40 min (Figs. 2 and 4A). The first 5 min of the first andsecond exercise bouts of RER measurements were excluded fromthe analysis (grey areas) as seen in Fig. 2. Exercise (p < 0.0001) andthe glucose drink (p = 0.0043) increased RER and RER was higherin men when compared with boys (p = 0.0002). The interactiontrend between exercise and age (p = 0.087) is explained by lowervalues of RER in boys in comparison with men after exercise. Fatoxidation (kcal·m−2) was increased by exercise (p < 0.0001), re-duced by the glucose drink (p = 0.0002), and highest with exercisealone. Boys had higher rates of fat oxidation in comparison withmen (p = 0.0027), with a greater increase during exercise thanmen (interaction, p = 0.0445). Finally, carbohydrate oxidation(kcal·m−2) was increased by both exercise (p < 0.0001) and theglucose drink (p < 0.0001), which led to a synergistic stimulatoryeffect of exercise combined with the glucose drink on carbohy-drate oxidation (p = 0.006) (Fig. 4C). Conversely to fat oxidation,boys had lower rates of carbohydrate oxidation compared withmen (p = 0.0014) and this difference was greater during exercisethan at rest (interaction of exercise with age (p = 0.0003).
FI, EE, and net energy balanceFI (kcal·m−2) in response to the treatments is shown in Fig. 3A.
The glucose drink (p < 0.0001) suppressed FI, and was greaterwhen combined with exercise (p = 0.0303). Neither exercise alone(p = 0.2604) nor age (p = 0.0884) significantly affected FI. EE(kcal·m−2) tended to increase after the glucose drink (p = 0.0663).EE was also increased by exercise (p < 0.0001) and was higher inboys when compared with men (p = 0.0254) (Fig. 3B). Overall, EEwas not different between boys and men (p = 0.4115). Finally, NEB(kcal·m−2) was decreased by exercise (p < 0.0001) and increased byglucose (p = 0.0267), but was not affected by age (p = 0.1135).
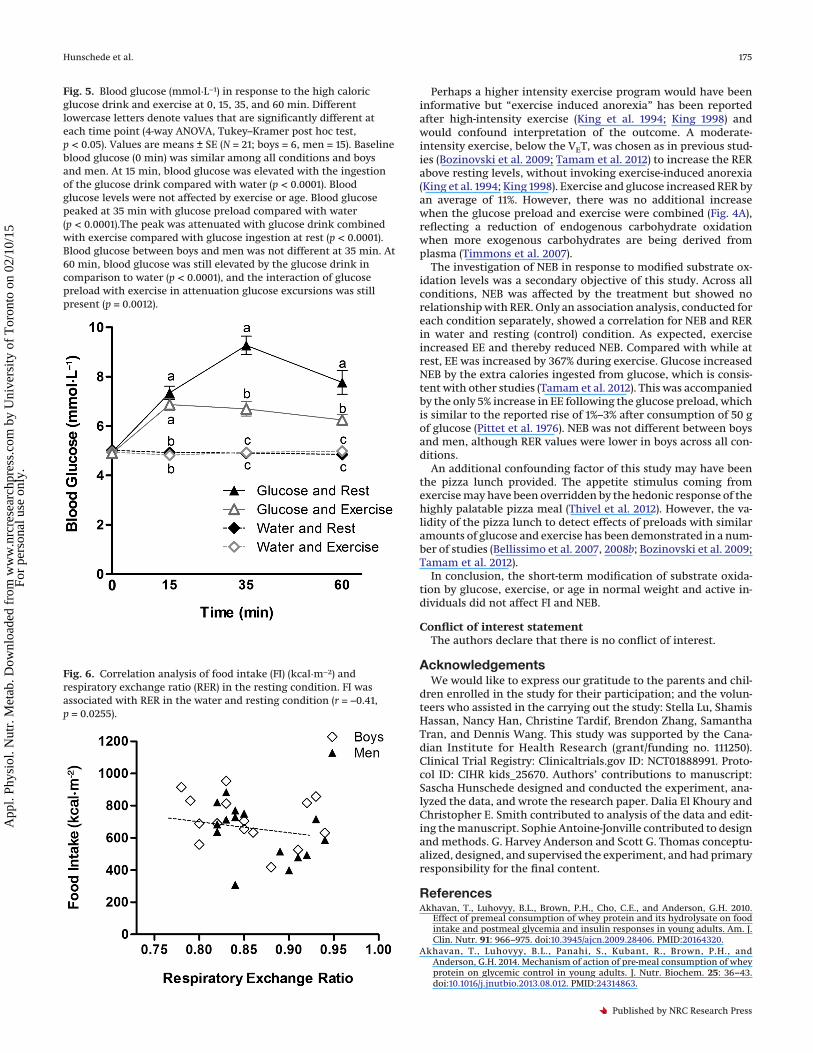
Blood glucose and VAS questionnairesBlood glucose concentrations were increased by the glucose
drink (p < 0.0001), decreased with exercise (p < 0.0001), and werecumulatively similar in boys and men (p = 0.8018) (Fig. 5). A signif-icant interaction (p < 0.0001) occurred because the rise in bloodglucose concentration was reduced when the glucose drink wascombined with exercise. Blood glucose levels were also affected bytime (p < 0.0001), reaching their peak at 35 min. Similarly, pre-meal VAS motivation to eat scores increased over time (p < 0.0001)
Table 1. Baseline characteristics of boys and men.
Subject characteristics Boys Men
Age (y) 10.9±0.3* 23.5±0.8Weight (kg) 36.0±1.3* 70.5±2.4Height (cm) 144.9±2.5* 174.3±1.5BSA (m2) 1.2±0.1* 1.8±0.1BMI (kg·m−2) 23.1±0.6BMI percentile 50.2±5.6SKF body fat (%) 17.6±1.0* 13.5±0.9VET (mL·kg−1·min−1) 29.2±1.6 25.7±0.9%VET of VO2peak 67.6±1.9* 58.2±2.0VO2peak (mL·kg−1·min−1) 43.5±2.0 43.5±1.2Exercise intensity (%VO2peak) 49.4±1.3* 44.4±1.4
Note: Values are means ± SE; n = 30 (n = 15 boys and n = 15 men).BMI, body mass index; BSA, body surface area; SKF, skinfoldthickness; VO2peak, maximum oxygen consumption; VET, venti-lation threshold; %VET, percentage VET of VO2peak.
*Significantly different from men by unpaired t test (p < 0.05).
172 Appl. Physiol. Nutr. Metab. Vol. 40, 2015
Published by NRC Research Press
App
l. Ph
ysio
l. N
utr.
Met
ab. D
ownl
oade
d fr
om w
ww
.nrc
rese
arch
pres
s.co
m b
y U
nive
rsity
of
Tor
onto
on
02/1
0/15
For
pers
onal
use
onl
y.

from baseline (0 min) to a peak at 60 min (4.5 ± 1.5). They werereduced after the glucose drink (−0.6 ± 0.8) when compared withwater (1.2 ± 0.6) (p = 0.0446), but not affected by exercise (−0.4 ± 0.8)when compared with rest (1.0 ± 0.6) (p = 0.1094). Time and ageinteracted to affect pre-meal VAS scores (p < 0.0001)because of ahigher motivation to eat score over time in boys (3.8 ± 0.8) incomparison with men (−3.2 ± 0.6). The ad libitum pizza lunchreduced motivation to eat ratings (p < 0.0001), more in boys(−72.35 ± 6.6) compared with men (−54.3 ± 5.2) (p = 0.0283). VASscores were collected directly after meal completion, at 95 min inboys and 85 min in men. Final VAS scores were collected earlier inmen because of their faster eating intervals, which were previ-ously determined in our lab (Tamam et al. 2012; Panahi et al. 2013).
Correlations between parametersAcross all conditions FI was not associated with RER, fat oxida-
tion, or carbohydrate oxidation. Analysis within each conditionshowed that FI correlated with RER only in the rest condition(r = −0.41, p = 0.0255) (Fig. 6).There was also a correlation betweenNEB and RER (r = −0.41, p = 0.0258).
DiscussionIn contrast with our hypothesis, FI and NEB, both measured as
kcal·m−2, were not affected by short-term increases in carbohy-drate relative to fat oxidation as modified by glucose, exercise, orage. Several lines of evidence showedn that substrate oxidation,modified by glucose and exercise, was not a factor determining FI.First, the glucose preload increased RER and decreased FI. Second,exercise increased RER but did not affect FI. Third, exercise com-bined with the glucose preload did not affect RER but decreasedFI. Finally, FI was not different between boys and men, althoughmen had significantly higher rates of carbohydrate oxidation(kcal·m−2) and lower rates of fat oxidation (kcal·m−2) comparedwith boys.
The treatments were clearly successful in modifying RER, allow-ing an examination of the relationship between substrate oxida-tion and FI over a significant amount of time. The RERs werestable for 40 min immediately preceding the pizza meal (Fig. 2).Thus the design was optimized to detect an effect of substrateoxidation on FI. However, our hypothesis that substrate oxidationdrives FI was based primarily on the increase in oxidation of car-bohydrates with increasing exercise intensity, age, and carbohy-drate intake (Riddell et al. 2008; Zunquin et al. 2009). The latterstudies measured fasted and 24-h RER and concluded that an in-creased carbohydrate oxidation contributed to increased FI andweight gain in the long term (Seidell et al. 1992; Pannacciulli et al.2007). In contrast with this suggestion, correlation analysis withineach treatment showed that a lower FI was associated with a
higher RER in the water and resting conditions. Thus the relation-ship of a stable and fasted RER to FI in the short term is unclearand needs further investigation.
The comparison of the substrate oxidation rates, altered byglucose and exercise, between boys and men provided additional
Fig. 3. Food intake (kcal·m−2) (A), energy expenditure (kcal·m−2) (B),and net energy balance (kcal·m−2) (C) in response to a high caloricglucose preload and exercise. Different lowercase letters denotevalues that are significantly different (3-way ANOVA, Tukey–Kramerpost hoc test, p < 0.05). Values are means ± SE (N = 30; boys = 15,men = 15). (A) Food intake was decreased by glucose (p < 0.0001) butnot by exercise (p = 0.2604) or age (p = 0.0887). There was aninteraction of glucose with exercise, resulting in an additionalsuppression of food intake (p = 0.0303). No other interactions werefound among the factors. (B) Energy expenditure was increased byexercise (p < 0.0001) and glucose (p = 0.0092), but was not differentbetween boys and men (p = 0.4115). There was an interaction for ageand exercise (p = 0.0414), resulting in boys having a higher energyexpenditure during exercise. No other interactions were foundamong the factors. (C) Net energy balance was increased withglucose (p = 0.0267) and decreased with exercise (p < 0.0001), but wasnot different between boys and men (p = 0.1135). No interactionswere found among the factors.
Hunschede et al. 173
Published by NRC Research Press
App
l. Ph
ysio
l. N
utr.
Met
ab. D
ownl
oade
d fr
om w
ww
.nrc
rese
arch
pres
s.co
m b
y U
nive
rsity
of
Tor
onto
on
02/1
0/15
For
pers
onal
use
onl
y.
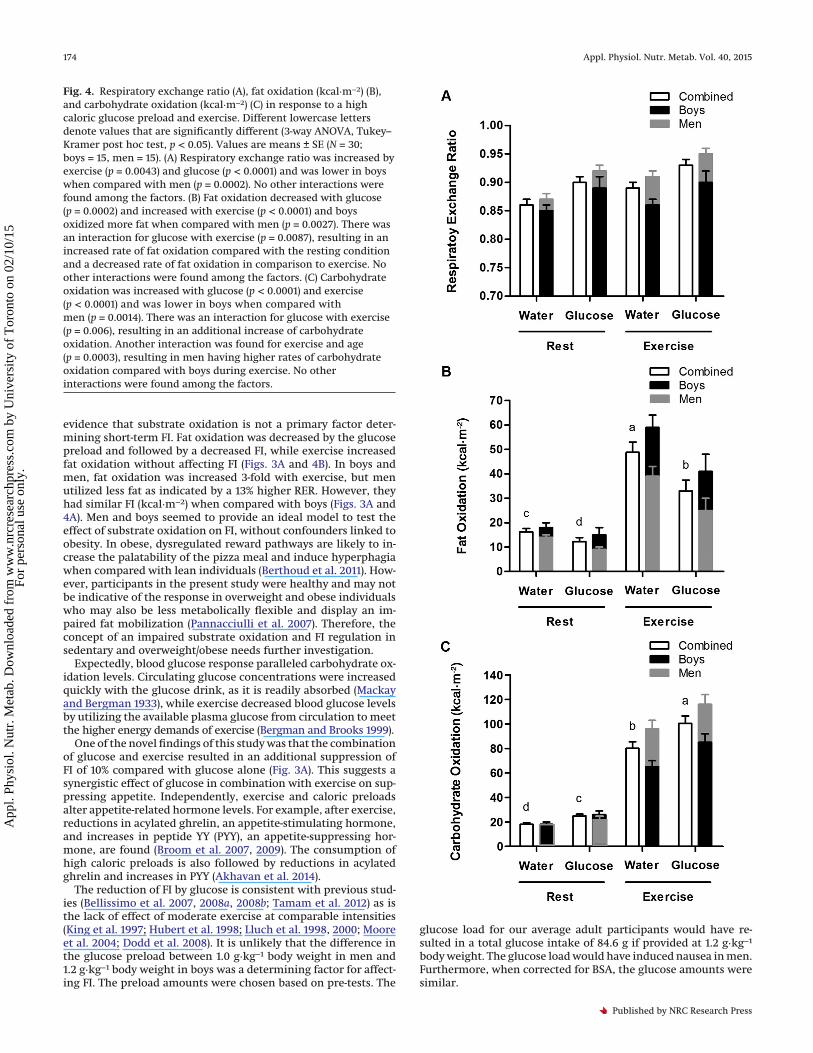
evidence that substrate oxidation is not a primary factor deter-mining short-term FI. Fat oxidation was decreased by the glucosepreload and followed by a decreased FI, while exercise increasedfat oxidation without affecting FI (Figs. 3A and 4B). In boys andmen, fat oxidation was increased 3-fold with exercise, but menutilized less fat as indicated by a 13% higher RER. However, theyhad similar FI (kcal·m−2) when compared with boys (Figs. 3A and4A). Men and boys seemed to provide an ideal model to test theeffect of substrate oxidation on FI, without confounders linked toobesity. In obese, dysregulated reward pathways are likely to in-crease the palatability of the pizza meal and induce hyperphagiawhen compared with lean individuals (Berthoud et al. 2011). How-ever, participants in the present study were healthy and may notbe indicative of the response in overweight and obese individualswho may also be less metabolically flexible and display an im-paired fat mobilization (Pannacciulli et al. 2007). Therefore, theconcept of an impaired substrate oxidation and FI regulation insedentary and overweight/obese needs further investigation.
Expectedly, blood glucose response paralleled carbohydrate ox-idation levels. Circulating glucose concentrations were increasedquickly with the glucose drink, as it is readily absorbed (Mackayand Bergman 1933), while exercise decreased blood glucose levelsby utilizing the available plasma glucose from circulation to meetthe higher energy demands of exercise (Bergman and Brooks 1999).
One of the novel findings of this study was that the combinationof glucose and exercise resulted in an additional suppression ofFI of 10% compared with glucose alone (Fig. 3A). This suggests asynergistic effect of glucose in combination with exercise on sup-pressing appetite. Independently, exercise and caloric preloadsalter appetite-related hormone levels. For example, after exercise,reductions in acylated ghrelin, an appetite-stimulating hormone,and increases in peptide YY (PYY), an appetite-suppressing hor-mone, are found (Broom et al. 2007, 2009). The consumption ofhigh caloric preloads is also followed by reductions in acylatedghrelin and increases in PYY (Akhavan et al. 2014).
The reduction of FI by glucose is consistent with previous stud-ies (Bellissimo et al. 2007, 2008a, 2008b; Tamam et al. 2012) as isthe lack of effect of moderate exercise at comparable intensities(King et al. 1997; Hubert et al. 1998; Lluch et al. 1998, 2000; Mooreet al. 2004; Dodd et al. 2008). It is unlikely that the difference inthe glucose preload between 1.0 g·kg−1 body weight in men and1.2 g·kg−1 body weight in boys was a determining factor for affect-ing FI. The preload amounts were chosen based on pre-tests. The
glucose load for our average adult participants would have re-sulted in a total glucose intake of 84.6 g if provided at 1.2 g·kg−1
body weight. The glucose load would have induced nausea in men.Furthermore, when corrected for BSA, the glucose amounts weresimilar.
Fig. 4. Respiratory exchange ratio (A), fat oxidation (kcal·m−2) (B),and carbohydrate oxidation (kcal·m−2) (C) in response to a highcaloric glucose preload and exercise. Different lowercase lettersdenote values that are significantly different (3-way ANOVA, Tukey–Kramer post hoc test, p < 0.05). Values are means ± SE (N = 30;boys = 15, men = 15). (A) Respiratory exchange ratio was increased byexercise (p = 0.0043) and glucose (p < 0.0001) and was lower in boyswhen compared with men (p = 0.0002). No other interactions werefound among the factors. (B) Fat oxidation decreased with glucose(p = 0.0002) and increased with exercise (p < 0.0001) and boysoxidized more fat when compared with men (p = 0.0027). There wasan interaction for glucose with exercise (p = 0.0087), resulting in anincreased rate of fat oxidation compared with the resting conditionand a decreased rate of fat oxidation in comparison to exercise. Noother interactions were found among the factors. (C) Carbohydrateoxidation was increased with glucose (p < 0.0001) and exercise(p < 0.0001) and was lower in boys when compared withmen (p = 0.0014). There was an interaction for glucose with exercise(p = 0.006), resulting in an additional increase of carbohydrateoxidation. Another interaction was found for exercise and age(p = 0.0003), resulting in men having higher rates of carbohydrateoxidation compared with boys during exercise. No otherinteractions were found among the factors.
174 Appl. Physiol. Nutr. Metab. Vol. 40, 2015
Published by NRC Research Press
App
l. Ph
ysio
l. N
utr.
Met
ab. D
ownl
oade
d fr
om w
ww
.nrc
rese
arch
pres
s.co
m b
y U
nive
rsity
of
Tor
onto
on
02/1
0/15
For
pers
onal
use
onl
y.
Perhaps a higher intensity exercise program would have beeninformative but “exercise induced anorexia” has been reportedafter high-intensity exercise (King et al. 1994; King 1998) andwould confound interpretation of the outcome. A moderate-intensity exercise, below the VET, was chosen as in previous stud-ies (Bozinovski et al. 2009; Tamam et al. 2012) to increase the RERabove resting levels, without invoking exercise-induced anorexia(King et al. 1994; King 1998). Exercise and glucose increased RER byan average of 11%. However, there was no additional increasewhen the glucose preload and exercise were combined (Fig. 4A),reflecting a reduction of endogenous carbohydrate oxidationwhen more exogenous carbohydrates are being derived fromplasma (Timmons et al. 2007).
The investigation of NEB in response to modified substrate ox-idation levels was a secondary objective of this study. Across allconditions, NEB was affected by the treatment but showed norelationship with RER. Only an association analysis, conducted foreach condition separately, showed a correlation for NEB and RERin water and resting (control) condition. As expected, exerciseincreased EE and thereby reduced NEB. Compared with while atrest, EE was increased by 367% during exercise. Glucose increasedNEB by the extra calories ingested from glucose, which is consis-tent with other studies (Tamam et al. 2012). This was accompaniedby the only 5% increase in EE following the glucose preload, whichis similar to the reported rise of 1%–3% after consumption of 50 gof glucose (Pittet et al. 1976). NEB was not different between boysand men, although RER values were lower in boys across all con-ditions.
An additional confounding factor of this study may have beenthe pizza lunch provided. The appetite stimulus coming fromexercise may have been overridden by the hedonic response of thehighly palatable pizza meal (Thivel et al. 2012). However, the va-lidity of the pizza lunch to detect effects of preloads with similaramounts of glucose and exercise has been demonstrated in a num-ber of studies (Bellissimo et al. 2007, 2008b; Bozinovski et al. 2009;Tamam et al. 2012).
In conclusion, the short-term modification of substrate oxida-tion by glucose, exercise, or age in normal weight and active in-dividuals did not affect FI and NEB.
Conflict of interest statementThe authors declare that there is no conflict of interest.
AcknowledgementsWe would like to express our gratitude to the parents and chil-
dren enrolled in the study for their participation; and the volun-teers who assisted in the carrying out the study: Stella Lu, ShamisHassan, Nancy Han, Christine Tardif, Brendon Zhang, SamanthaTran, and Dennis Wang. This study was supported by the Cana-dian Institute for Health Research (grant/funding no. 111250).Clinical Trial Registry: Clinicaltrials.gov ID: NCT01888991. Proto-col ID: CIHR kids_25670. Authors’ contributions to manuscript:Sascha Hunschede designed and conducted the experiment, ana-lyzed the data, and wrote the research paper. Dalia El Khoury andChristopher E. Smith contributed to analysis of the data and edit-ing the manuscript. Sophie Antoine-Jonville contributed to designand methods. G. Harvey Anderson and Scott G. Thomas conceptu-alized, designed, and supervised the experiment, and had primaryresponsibility for the final content.
ReferencesAkhavan, T., Luhovyy, B.L., Brown, P.H., Cho, C.E., and Anderson, G.H. 2010.
Effect of premeal consumption of whey protein and its hydrolysate on foodintake and postmeal glycemia and insulin responses in young adults. Am. J.Clin. Nutr. 91: 966–975. doi:10.3945/ajcn.2009.28406. PMID:20164320.
Akhavan, T., Luhovyy, B.L., Panahi, S., Kubant, R., Brown, P.H., andAnderson, G.H. 2014. Mechanism of action of pre-meal consumption of wheyprotein on glycemic control in young adults. J. Nutr. Biochem. 25: 36–43.doi:10.1016/j.jnutbio.2013.08.012. PMID:24314863.
Fig. 5. Blood glucose (mmol·L−1) in response to the high caloricglucose drink and exercise at 0, 15, 35, and 60 min. Differentlowercase letters denote values that are significantly different ateach time point (4-way ANOVA, Tukey–Kramer post hoc test,p < 0.05). Values are means ± SE (N = 21; boys = 6, men = 15). Baselineblood glucose (0 min) was similar among all conditions and boysand men. At 15 min, blood glucose was elevated with the ingestionof the glucose drink compared with water (p < 0.0001). Bloodglucose levels were not affected by exercise or age. Blood glucosepeaked at 35 min with glucose preload compared with water(p < 0.0001).The peak was attenuated with glucose drink combinedwith exercise compared with glucose ingestion at rest (p < 0.0001).Blood glucose between boys and men was not different at 35 min. At60 min, blood glucose was still elevated by the glucose drink incomparison to water (p < 0.0001), and the interaction of glucosepreload with exercise in attenuation glucose excursions was stillpresent (p = 0.0012).
Fig. 6. Correlation analysis of food intake (FI) (kcal·m−2) andrespiratory exchange ratio (RER) in the resting condition. FI wasassociated with RER in the water and resting condition (r = −0.41,p = 0.0255).
Hunschede et al. 175
Published by NRC Research Press
App
l. Ph
ysio
l. N
utr.
Met
ab. D
ownl
oade
d fr
om w
ww
.nrc
rese
arch
pres
s.co
m b
y U
nive
rsity
of
Tor
onto
on
02/1
0/15
For
pers
onal
use
onl
y.
Beaver, W.L., Wasserman, K., and Whipp, B.J. 1986. A new method for detectinganaerobic threshold by gas exchange. J. Appl. Physiol. 60: 2020–2027. PMID:3087938.
Bellissimo, N., Pencharz, P.B., Thomas, S.G., and Anderson, G.H. 2007. Effect oftelevision viewing at mealtime on food intake after a glucose preload in boys.Pediatr. Res. 61: 745–749. doi:10.1203/pdr.0b013e3180536591. PMID:17426650.
Bellissimo, N., Desantadina, M.V., Pencharz, P.B., Berall, G.B., Thomas, S.G., andAnderson, G.H. 2008a. A comparison of short-term appetite and energy in-takes in normal weight and obese boys following glucose and whey-proteindrinks. Int. J. Obes. (Lond.), 32: 362–371. doi:10.1038/sj.ijo.0803709. PMID:17700578.
Bellissimo, N., Thomas, S.G., Pencharz, P.B., Goode, R.C., and Anderson, G.H.2008b. Reproducibility of short-term food intake and subjective appetitescores after a glucose preload, ventilation threshold, and body compositionin boys. Appl. Physiol. Nutr. Metab. 33: 326–337. doi:10.1139/H07-194. PMID:18347688.
Bergman, B.C., and Brooks, G.A. 1999. Respiratory gas-exchange ratios duringgraded exercise in fed and fasted trained and untrained men. J. Appl. Physiol.(1985), 86: 479–487. PMID:9931180.
Berthoud, H.R., Lenard, N.R., and Shin, A.C. 2011. Food reward, hyperphagia, andobesity. Am. J. Physiol. Regul. Integr. Comp. Physiol. 300: R1266–R1277. doi:10.1152/ajpregu.00028.2011. PMID:21411768.
Bozinovski, N.C., Bellissimo, N., Thomas, S.G., Pencharz, P.B., Goode, R.C., andAnderson, G.H. 2009. The effect of duration of exercise at the ventilationthreshold on subjective appetite and short-term food intake in 9 to 14 yearold boys and girls. Int. J. Behav. Nutr. Phys. Act. 6: 66. doi:10.1186/1479-5868-6-66. PMID:19818131.
Brondel, L., Landais, L., Romer, M.A., Holley, A., and Penicaud, L. 2011. Substrateoxidation influences liking, wanting, macronutrient selection, and con-sumption of food in humans. Am. J. Clin. Nutr. 94: 775–783. doi:10.3945/ajcn.111.017319. PMID:21795442.
Broom, D.R., Stensel, D.J., Bishop, N.C., Burns, S.F., and Miyashita, M. 2007.Exercise-induced suppression of acylated ghrelin in humans. J. Appl. Physiol.102: 2165–2171. doi:10.1152/japplphysiol.00759.2006. PMID:17347386.
Broom, D.R., Batterham, R.L., King, J.A., and Stensel, D.J. 2009. Influence ofresistance and aerobic exercise on hunger, circulating levels of acylated ghre-lin, and peptide YY in healthy males. Am. J. Physiol. Regul. Integr. Comp.Physiol. 296: R29–R35. doi:10.1152/ajpregu.90706.2008. PMID:18987287.
Brozek, J. 1961. Body Composition: The relative amounts of fat, tissue, and watervary with age, sex, exercise, and nutritional state. Science, 134: 920–930.doi:10.1126/science.134.3483.920. PMID:17812916.
Caiozzo, V.J., Davis, J.A., Ellis, J.F., Azus, J.L., Vandagriff, R., Prietto, C.A., andMcMaster, W.C. 1982. A comparison of gas exchange indices used to detectthe anaerobic threshold. J. Appl. Physiol. 53: 1184–1189. PMID:7174412.
Dodd, C.J., Welsman, J.R., and Armstrong, N. 2008. Energy intake and appetitefollowing exercise in lean and overweight girls. Appetite, 51: 482–488. doi:10.1016/j.appet.2008.03.009. PMID:18485530.
Durnin, J.V., and Rahaman, M.M. 2003. The assessment of the amount of fat inthe human body from measurements of skinfold thickness. 1967. Br. J. Nutr.89: 147–155. PMID:12572562.
Flatt, J.P. 1987. Dietary fat, carbohydrate balance, and weight maintenance:effects of exercise. Am. J. Clin. Nutr. 45: 296–306. PMID:3799520.
Flegal, K.M., Wei, R., and Ogden, C. 2002. Weight-for-stature compared withbody mass index-for-age growth charts for the United States from the Centersfor Disease Control and Prevention. Am. J. Clin. Nutr. 75: 761–766. PMID:11916765.
Friedman, M.I., and Tordoff, M.G. 1986. Fatty acid oxidation and glucose utiliza-tion interact to control food intake in rats. Am. J. Physiol. 251: R840–R845.PMID:3777211.
Galgani, J., and Ravussin, E. 2008. Energy metabolism, fuel selection and bodyweight regulation. Int. J. Obes. (Lond.), 32(Suppl. 7): S109–S119. doi:10.1038/ijo.2008.246. PMID:19136979.
Hall, K.D. 2010. Predicting metabolic adaptation, body weight change, and en-ergy intake in humans. Am. J. Physiol. Endocrinol. Metab. 298: E449–E466.doi:10.1152/ajpendo.00559.2009. PMID:19934407.
Harrell, J.S., McMurray, R.G., Baggett, C.D., Pennell, M.L., Pearce, P.F., andBangdiwala, S.I. 2005. Energy costs of physical activities in children andadolescents. Med. Sci. Sports Exerc. 37: 329–336. doi:10.1249/01.MSS.0000153115.33762.3F. PMID:15692331.
Haycock, G.B., Schwartz, G.J., and Wisotsky, D.H. 1978. Geometric method formeasuring body surface area: a height-weight formula validated in infants,children, and adults. J. Pediatr. 93: 62–66. doi:10.1016/S0022-3476(78)80601-5.PMID:650346.
Hopkins, M., Jeukendrup, A., King, N.A., and Blundell, J.E. 2011. The relationshipbetween substrate metabolism, exercise and appetite control: does glycogenavailability influence the motivation to eat, energy intake or food choice?Sports Med. 41: 507–521. doi:10.2165/11588780-000000000-00000. PMID:21615191.
Hubert, P., King, N.A., and Blundell, J.E. 1998. Uncoupling the effects of energyexpenditure and energy intake: appetite response to short-term energy def-icit induced by meal omission and physical activity. Appetite, 31: 9–19. doi:10.1006/appe.1997.0148. PMID:9716432.
Kennedy, G.C. 1953. The role of depot fat in the hypothalamic control of food
intake in the rat. Proc. R. Soc. Lond. B Biol. Sci. 140: 578–596. doi:10.1098/rspb.1953.0009. PMID:13027283.
King, N.A. 1998. The relationship between physical activity and food intake.Proc. Nutr. Soc. 57: 77–84. doi:10.1079/PNS19980013. PMID:9571712.
King, N.A., Burley, V.J., and Blundell, J.E. 1994. Exercise-induced suppression ofappetite: effects on food intake and implications for energy balance. Eur. J.Clin. Nutr. 48: 715–724. PMID:7835326.
King, N.A., Lluch, A., Stubbs, R.J., and Blundell, J.E. 1997. High dose exercise doesnot increase hunger or energy intake in free living males. Eur. J. Clin. Nutr.51: 478–483. doi:10.1038/sj.ejcn.1600432. PMID:9234032.
Kinney, J.M., Lister, J., and Moore, F.D. 1963. Relationship of Energy Expenditureto Total Exchangeable Potassium. Ann. N.Y. Acad. Sci. 110: 711–722. doi:10.1111/j.1749-6632.1963.tb15793.x. PMID:14061676.
Kozar, J., Šimundic, A., Nikolac, N., Žirovic, M., and Topic, E. 2008. Accu ChekCompact Plus blood glucometer evaluation. Biochem. Med. 3: 361–367. doi:10.11613/BM.2008.032.
Lluch, A., King, N.A., and Blundell, J.E. 1998. Exercise in dietary restrained wom-en: no effect on energy intake but change in hedonic ratings. Eur. J. Clin.Nutr. 52: 300–307. doi:10.1038/sj.ejcn.1600555. PMID:9578343.
Lluch, A., King, N.A., and Blundell, J.E. 2000. No energy compensation at themeal following exercise in dietary restrained and unrestrained women. Br. J.Nutr. 84: 219–225. doi:10.1017/S0007114500001458. PMID:11029973.
Loat, C.E., and Rhodes, E.C. 1993. Relationship between the lactate and ventila-tory thresholds during prolonged exercise. Sports Med. 15: 104–115. doi:10.2165/00007256-199315020-00004. PMID:8446822.
Mackay, E.M., and Bergman, H.C. 1933. The rate of Absorption of Glucose fromthe Intestinal Tract. J. Biol. Chem. 101: 453–463.
Martins, C., Morgan, L.M., Bloom, S.R., and Robertson, M.D. 2007. Effects ofexercise on gut peptides, energy intake and appetite. J. Endocrinol. 193:251–258. doi:10.1677/JOE-06-0030. PMID:17470516.
Mayer, J. 1953. Glucostatic mechanism of regulation of food intake. N. Engl. J.Med. 249: 13–16. doi:10.1056/NEJM195307022490104. PMID:13063674.
Moore, M.S., Dodd, C.J., Welsman, J.R., and Armstrong, N. 2004. Short-termappetite and energy intake following imposed exercise in 9- to 10-year-oldgirls. Appetite, 43: 127–134. doi:10.1016/j.appet.2004.02.008. PMID:15458799.
Panahi, S., Luhovyy, B.L., Liu, T.T., Akhavan, T., El Khoury, D., Goff, H.D., andAnderson, G.H. 2013. Energy and macronutrient content of familiar bever-ages interact with pre-meal intervals to determine later food intake, appetiteand glycemic response in young adults. Appetite, 60: 154–161. doi:10.1016/j.appet.2012.09.018. PMID:23022554.
Pannacciulli, N., Salbe, A.D., Ortega, E., Venti, C.A., Bogardus, C., and Krakoff, J.2007. The 24-h carbohydrate oxidation rate in a human respiratory chamberpredicts ad libitum food intake. Am. J. Clin. Nutr. 86: 625–632. PMID:17823426.
Pittet, P., Chappuis, P., Acheson, K., De Techtermann, F., and Jequier, E. 1976.Thermic effect of glucose in obese subjects studied by direct and indirectcalorimetry. Br. J. Nutr. 35: 281–292. doi:10.1079/BJN19760033. PMID:1252403.
Plowman, S.A., and Smith, D.L. 2007. Exercise physiology for health, fitness, andperformance. Lippincott Williams & Wilkins, Baltimore, Md., USA.
Riddell, M.C., Jamnik, V.K., Iscoe, K.E., Timmons, B.W., and Gledhill, N. 2008. Fatoxidation rate and the exercise intensity that elicits maximal fat oxidationdecreases with pubertal status in young male subjects. J. Appl. Physiol. 105:742–748. doi:10.1152/japplphysiol.01256.2007. PMID:18535137.
Rosdahl, H., Lindberg, T., Edin, F., and Nilsson, J. 2013. The Moxus Modularmetabolic system evaluated with two sensors for ventilation against theDouglas bag method. Eur. J. Appl. Physiol. 113: 1353–1367. doi:10.1007/s00421-012-2551-1. PMID:23224357.
Rowland, T.W., Auchinachie, J.A., Keenan, T.J., and Green, G.M. 1987. Physiologicresponses to treadmill running in adult and prepubertal males. Int. J. SportsMed. 8: 292–297. doi:10.1055/s-2008-1025672. PMID:3667027.
Schwartz, J.G., Phillips, W.T., and Aghebat-Khairy, B. 1990. Revision of the oralglucose tolerance test: a pilot study. Clin. Chem. 36: 125–128. PMID:2297902.
Seidell, J.C., Muller, D.C., Sorkin, J.D., and Andres, R. 1992. Fasting respiratoryexchange ratio and resting metabolic rate as predictors of weight gain: theBaltimore Longitudinal Study on Aging. Int. J. Obes. Relat. Metab. Disord. 16:667–674. PMID:1328091.
Stubbs, R.J., Murgatroyd, P.R., Goldberg, G.R., and Prentice, A.M. 1993. Carbohy-drate balance and the regulation of day-to-day food intake in humans. Am. J.Clin. Nutr. 57: 897–903. PMID:8503359.
Tamam, S., Bellissimo, N., Patel, B.P., Thomas, S.G., and Anderson, G.H. 2012.Overweight and obese boys reduce food intake in response to a glucose drinkbut fail to increase intake in response to exercise of short duration. Appl.Physiol. Nutr. Metab. 37: 520–529. doi:10.1139/h2012-038. PMID:22530879.
Thivel, D., Duche, P., and Morio, B. 2012. Discussion of “overweight and obeseboys reduce food intake in response to a glucose drink but fail to increaseintake in response to exercise of short duration”. Appl. Physiol. Nutr. Metab.37: 1014–1015; discussion 1016–1017. doi:10.1139/h2012-090. PMID:22827511.
Thompson, D.L., Townsend, K.M., Boughey, R., Patterson, K. and Bassett, D.R., Jr.1998. Substrate use during and following moderate- and low-intensity exer-cise: implications for weight control. Eur. J. Appl. Physiol. Occup. Physiol. 78:43–49. doi:10.1007/s004210050385. PMID:9660155.
Timmons, B.W., Bar-Or, O., and Riddell, M.C. 2007. Energy substrate utilizationduring prolonged exercise with and without carbohydrate intake in preado-
176 Appl. Physiol. Nutr. Metab. Vol. 40, 2015
Published by NRC Research Press
App
l. Ph
ysio
l. N
utr.
Met
ab. D
ownl
oade
d fr
om w
ww
.nrc
rese
arch
pres
s.co
m b
y U
nive
rsity
of
Tor
onto
on
02/1
0/15
For
pers
onal
use
onl
y.
lescent and adolescent girls. J. Appl. Physiol. 103: 995–1000. doi:10.1152/japplphysiol.00018.2007. PMID:17615283.
Van Loon, L.J., Greenhaff, P.L., Constantin-Teodosiu, D., Saris, W.H., andWagenmakers, A.J. 2001. The effects of increasing exercise intensity on mus-cle fuel utilisation in humans. J. Physiol. 536: 295–304. doi:10.1111/j.1469-7793.2001.00295.x. PMID:11579177.
Van Wymelbeke, V., Louis-Sylvestre, J., and Fantino, M. 2001. Substrate oxidationand control of food intake in men after a fat-substitute meal compared withmeals supplemented with an isoenergetic load of carbohydrate, long-chaintriacylglycerols, or medium-chain triacylglycerols. Am. J. Clin. Nutr. 74: 620–630. PMID:11684530.
Weir, J.B. 1990. New methods for calculating metabolic rate with special refer-ence to protein metabolism. 1949. Nutrition, 6: 213–221. PMID:2136000.
Womersley, J., and Durnin, J.V. 1973. An experimental study on variability ofmeasurements of skinfold thickness on young adults. Hum. Biol. 45: 281–292.PMID:4714567.
Zunquin, G., Theunynck, D., Sesboue, B., Arhan, P., and Bougle, D. 2009. Com-parison of fat oxidation during exercise in lean and obese pubertal boys:clinical implications. Br. J. Sports Med. 43: 869–870. doi:10.1136/bjsm.2007.044529. PMID:18385189.
Zunts, N. 1901. Ueber die Beduetung der verschiedenen Naehrstoffe als Erzeugerder Muskelkraft. Arch. Gesamte Physiol., Bonn, Ger. 83: 557–571. doi:10.1007/BF01746509.
Hunschede et al. 177
Published by NRC Research Press
App
l. Ph
ysio
l. N
utr.
Met
ab. D
ownl
oade
d fr
om w
ww
.nrc
rese
arch
pres
s.co
m b
y U
nive
rsity
of
Tor
onto
on
02/1
0/15
For
pers
onal
use
onl
y.