
Morphometric Spatial Patterns Differentiating Boys With Fragile X Syndrome, Typically Developing...
22
Morphometric Spatial Patterns Differentiate Fragile X Syndrome, Typical Developing and Developmentally Delayed Boys of Ages One to Three Fumiko Hoeft, MD PhD 1 , Amy A. Lightbody, PhD 1 , Heather Hazlett, PhD 2 , Swetapadma Patnaik, MS 1 , Joseph Piven, MD 2 , and Allan L Reiss, MD 1 1 Center for Interdisciplinary Brain Sciences Research (CIBSR), Stanford University School of Medicine, 401 Quarry Rd. Stanford CA 94305-5795 2 Neurodevelopmental Disorders Research Center, University of North Carolina, Chapel Hill, Neurosciences Hospital, 1st Floor, 101 Manning Drive, Chapel Hill, NC 27514 Abstract Context—Brain maturation starts well before birth and occurs as a unified process with developmental interaction among different brain regions. Gene and environment play large roles in such process. Studies of genetic disorders such as fragile X syndrome (FXS) which is a disorder caused by a single gene mutation resulting in abnormal dendritic and synaptic pruning, together with healthy individuals may provide valuable information. Objective—To examine morphometric spatial patterns that differentiate between FXS from controls in early childhood. Design—A cross-sectional in-vivo neuroimaging study Setting—Academic medical centers Participants—A total of 101 children of ages 1 to 3; 51 boys with FXS, 32 typically developing (TD) boys and 18 boys with idiopathic developmental delay (DD) Main Outcome Measures—Regional gray matter volume as measured by voxel-based morphometry and manual tracing, supplemented by permutation analyses. Regression analyses between gray and white matter volumes and IQ and fragile X mental retardation protein (FMRP). Linear support vector machine analyses to classify group membership. Results—In addition to aberrant brain structures reported previously in older individuals with FXS, we found reduced gray matter volumes in regions such as the hypothalamus, insula and medial and lateral prefrontal cortices. These findings are consistent with the cognitive and behavioral phenotypes of FXS. Further, multivariate pattern classification analyses discriminated FXS from TD and DD controls with over 90 % prediction accuracy. The spatial patterns that classified FXS from controls included those that may have been difficult to identify previously using other methods. These included medial to lateral gradient of increased and decreased regional brain volumes in the posterior vermis, amygdala and hippocampus. Conclusions—These findings are critical in understanding interplay among gene, environment, brain and behavior, and signify the importance of examining detailed spatial patterns of healthy and perturbed brain development. Correspondence: Tel (650) 245-7016 Fax (650) 724-4794 [email protected]. NIH Public Access Author Manuscript Arch Gen Psychiatry. Author manuscript; available in PMC 2010 May 5. Published in final edited form as: Arch Gen Psychiatry. 2008 September ; 65(9): 1087–1097. doi:10.1001/archpsyc.65.9.1087. NIH-PA Author Manuscript NIH-PA Author Manuscript NIH-PA Author Manuscript
Transcript of Morphometric Spatial Patterns Differentiating Boys With Fragile X Syndrome, Typically Developing...

Morphometric Spatial Patterns Differentiate Fragile X Syndrome,Typical Developing and Developmentally Delayed Boys of AgesOne to Three
Fumiko Hoeft, MD PhD1, Amy A. Lightbody, PhD1, Heather Hazlett, PhD2, SwetapadmaPatnaik, MS1, Joseph Piven, MD2, and Allan L Reiss, MD11Center for Interdisciplinary Brain Sciences Research (CIBSR), Stanford University School ofMedicine, 401 Quarry Rd. Stanford CA 94305-57952Neurodevelopmental Disorders Research Center, University of North Carolina, Chapel Hill,Neurosciences Hospital, 1st Floor, 101 Manning Drive, Chapel Hill, NC 27514
AbstractContext—Brain maturation starts well before birth and occurs as a unified process withdevelopmental interaction among different brain regions. Gene and environment play large roles insuch process. Studies of genetic disorders such as fragile X syndrome (FXS) which is a disordercaused by a single gene mutation resulting in abnormal dendritic and synaptic pruning, together withhealthy individuals may provide valuable information.
Objective—To examine morphometric spatial patterns that differentiate between FXS fromcontrols in early childhood.
Design—A cross-sectional in-vivo neuroimaging study
Setting—Academic medical centers
Participants—A total of 101 children of ages 1 to 3; 51 boys with FXS, 32 typically developing(TD) boys and 18 boys with idiopathic developmental delay (DD)
Main Outcome Measures—Regional gray matter volume as measured by voxel-basedmorphometry and manual tracing, supplemented by permutation analyses. Regression analysesbetween gray and white matter volumes and IQ and fragile X mental retardation protein (FMRP).Linear support vector machine analyses to classify group membership.
Results—In addition to aberrant brain structures reported previously in older individuals with FXS,we found reduced gray matter volumes in regions such as the hypothalamus, insula and medial andlateral prefrontal cortices. These findings are consistent with the cognitive and behavioral phenotypesof FXS. Further, multivariate pattern classification analyses discriminated FXS from TD and DDcontrols with over 90 % prediction accuracy. The spatial patterns that classified FXS from controlsincluded those that may have been difficult to identify previously using other methods. Theseincluded medial to lateral gradient of increased and decreased regional brain volumes in the posteriorvermis, amygdala and hippocampus.
Conclusions—These findings are critical in understanding interplay among gene, environment,brain and behavior, and signify the importance of examining detailed spatial patterns of healthy andperturbed brain development.
Correspondence: Tel (650) 245-7016 Fax (650) 724-4794 [email protected].
NIH Public AccessAuthor ManuscriptArch Gen Psychiatry. Author manuscript; available in PMC 2010 May 5.
Published in final edited form as:Arch Gen Psychiatry. 2008 September ; 65(9): 1087–1097. doi:10.1001/archpsyc.65.9.1087.
NIH
-PA Author Manuscript
NIH
-PA Author Manuscript
NIH
-PA Author Manuscript
INTRODUCTIONHuman brain maturation is a complex process that can now be examined in detail using invivo neuroimaging techniques 1. Early neuroimaging investigations focused on region, lobe ortotal brain volumes 1. However, more recent studies have begun to examine brain structuresusing finer voxel-wise resolution and temporal dynamics. These new approaches have provenuseful in advancing our understanding of associations between cognition and healthy braindevelopment 2.
Pediatric neuroimaging studies to date have primarily focused on healthy children ages 4 yearsand older using univariate approaches. However, brain maturation starts well before birth andoccurs as a unified process with inter-regional interactions and dependencies. It is thereforecritical to investigate spatial neurodevelopmental patterns using multivariate approaches inchildren soon after birth. It is also important to examine abnormal brain states to more fullyunderstand normal brain maturational processes. Studies of fragile X syndrome (FXS) in earlychildhood may provide such unique opportunities.
Unlike many developmental disorders that are symptomatically defined and therefore likelyto be heterogeneous, FXS has a well-characterized genetic etiology. FXS, an X-linked disorder,is caused by a mutation of the fragile X mental retardation-1 (FMR1) gene leading to diminishedproduction of the associated protein (FMRP). In turn, diminished FMRP negatively impactssynaptic maturation and plasticity and thus, cerebral development 3. The disorder results inimpaired cognition and aberrant behavior, including deficits in executive and social function,learning and memory, visuo-spatial skills, and emotion regulation 4.
As a component of an ongoing longitudinal study of brain development in FXS, we examinedmagnetic resonance images (MRI) of 51 boys with FXS, 32 typically developing boys (TD)and 18 boys with idiopathic developmentally delay (DD) of ages one to three. The main goalof the study was to examine structural brain abnormalities in FXS compared to both TD andDD and to examine neurodevelopmental differences in these very young FXS subjects relativeto findings reported in older FXS 4–7. Primary analytical methods included univariatebetween-group comparisons and multivariate pattern classification methods. We hypothesizedthat regions best distinguishing the young FXS group from controls such as the caudate wouldshow associations with FMRP as well as with cognitive measures (IQ). Negative associationsbetween FMRP and caudate volumes have been shown in youth and adults, but not in childrenof this age-range 5, 8. We further hypothesized that morphometric patterns would accuratelyclassify participants into their respective groups. The study protocols were approved by thehuman subjects committees at Stanford University School of Medicine and University of NorthCarolina – Chapel Hill (UNC) and consent was obtained from parents.
METHODSParticipants
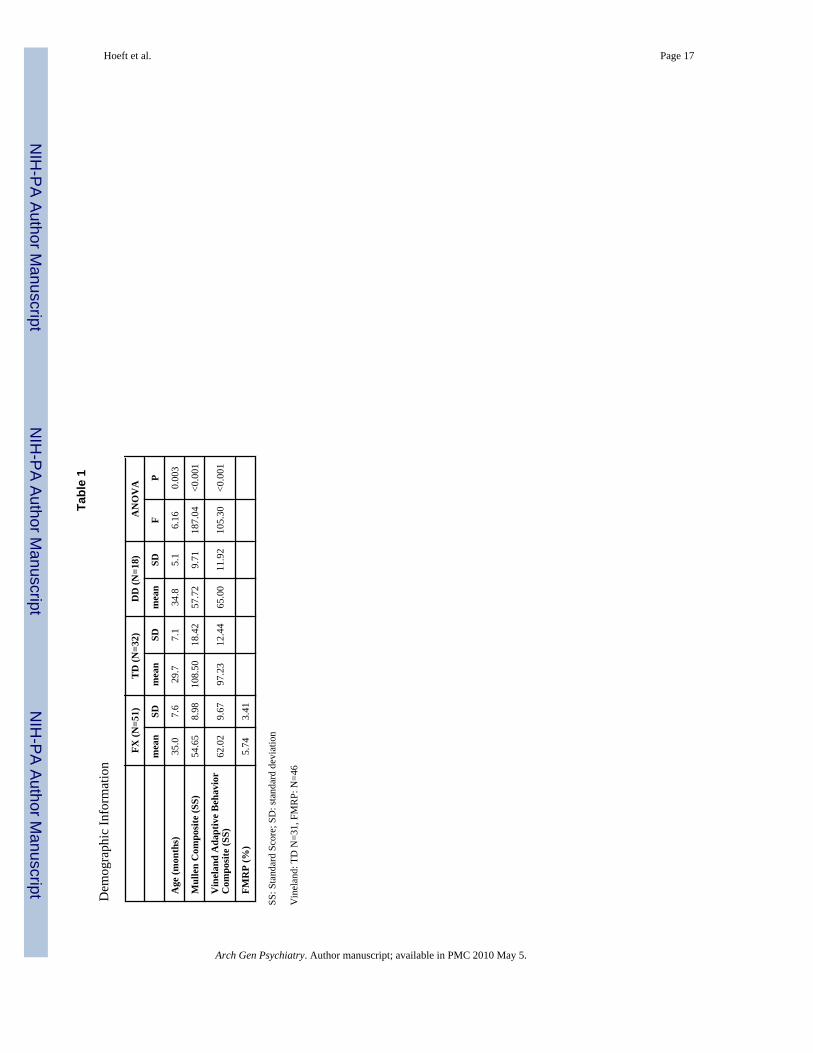
Subjects included 51 boys with FXS (mean age 35.0 months ± standard deviation, SD 7.6), 32TD boys (29.7 ± 7.1 months) and 18 boys with idiopathic DD (34.8 ± 5.1 months). Five FXSand three TD participants have been included in a previous report 9.
Subjects in all groups were recruited by Stanford University and UNC. Recruitment of childrenwith FXS was accomplished utilizing both the Stanford and UNC registry databases, frequentpostings on the National Fragile X Foundation website and quarterly newsletter, and mailingsto regional fragile X organizations. Children with DD and TD were recruited locally throughearly intervention programs, preschools, child care centers, community media, and state runagencies (Regional Center system in California and Child Development Service Agencies in
Hoeft et al. Page 2
Arch Gen Psychiatry. Author manuscript; available in PMC 2010 May 5.
NIH
-PA Author Manuscript
NIH
-PA Author Manuscript
NIH
-PA Author Manuscript
North Carolina). Inclusion in the FXS group required DNA testing confirming the fragile Xfull mutation as diagnosed with standard Southern Blot technique. Participants in the DD groupincluded children with developmental delays of unknown etiology who did not exhibitsymptoms indicative of an autism spectrum disorder. All children in this group demonstrateda composite standard score below 85 (<1 SD) on the Mullen Scales of Early Learning 10.Exclusion criteria for all groups included pre-term birth (< 34 weeks), low birth weight (< 2000grams), evidence of a genetic condition or syndrome, sensory impairments, and any seriousmedical or neurological condition affecting growth and development (e.g., seizure disorder,diabetes, congenital heart disease).
DNA testing for the typical FMR1 expansion mutation was performed to confirm the presenceof the full mutation in all subjects with FXS for whom diagnostic status was uncertain and torule out FXS in DD controls. Standard Southern blot was performed followed by FMR1-specific probe hybridization 11. FMRP expression was ascertained by calculating thepercentage of peripheral lymphocytes containing FMRP using immunostaining techniques12.
Subjects were given a standard battery of measures including the Mullen Scales of EarlyLearning 10, the Vineland Adaptive Behavior Scales 13, the Child Behavior Checklist (CBCL)14, and the Repetitive Behavior Scales (RBS) 15, 16. There was a significant difference in agebetween FXS and TD (P = 0.001) and DD and TD (P = 0.015) but not between FXS and DD(P = 0.91). Vineland adaptive behavior composite standard scores (SS) were also significantlydifferent between FXS and TD (P < 0.001) and DD and TD (P < 0.001) but not between FXSand DD (P = 0.33). Mullen composite SS were significantly different between FXS and TD (P< 0.001) and DD and TD (P < 0.001) but not between FXS and DD (P = 0.38). Please see Table1 for details of the three groups and between group statistics.
Overall, 50 subjects were recruited at Stanford University and 51 subjects at UNC. There wereno significant differences between sites in the proportion of diagnoses (chi = 1.51, P = 0.47).For each diagnostic group, age (P = 0.31 – 0.73), Vineland SS (P = 0.20 – 0.94), Mullen SS(P = 0.43 – 0.61) and FMRP (P = 0.62, FXS only) did not differ between sites. Four FXS andtwo DD individuals were on medication (FXS: one on bethanechol, one on piracetam, and twoon clonidine; DD: one on memantine and the other on lamotrigine).
Magnetic Resonance Imaging (MRI) Preparation and AcquisitionAll subjects with FXS or DD were sedated during their MRI. A pediatric anesthesiologistadministered and monitored the sedation throughout the scan. TD children were scanned whilesleeping. For the sleep scans, parents were instructed to wake their child up a little earlier onthe morning of the scan and to shorten their nap time. Scans were scheduled for after theparticipants’ normal bedtime to ensure the children would be able to sleep during the scan.Parents received a packet of preparation materials for the scan which included a CD of scannersounds to desensitize the children to the noise of the scanner while sleeping. Further, thesesubjects participated in a simulated MRI situation to practice holding still and to alleviate fearshould the child awaken during the MRI.
General Electric 1.5 Tesla Signa LX scanners (GE Imagine Systems, Milwaukee, WI) andstandard transmit/receive 4 channel head coils were used for MR image acquisition. Scanswere obtained from 2003 through 2007, and performed at Stanford - Lucile Packard Children’sHospital and UNC – Brain Imaging and Analysis Center. Identical pulse sequence protocolswere used at both scan-sites, which were designed to maximize contrast between gray, whiteand cerebro-spinal fluid (CSF) for the participants’ age-range. This included a coronal T1 –weighted sequence with the following parameters: inversion recovery preparation pulse, 300ms; repetition time, 12 ms; echo time, 5 ms; flip angle, 20 °; thickness, 1.5 mm; number of
Hoeft et al. Page 3
Arch Gen Psychiatry. Author manuscript; available in PMC 2010 May 5.
NIH
-PA Author Manuscript
NIH
-PA Author Manuscript
NIH
-PA Author Manuscript
excitations, 1; field of view, 20 cm; and matrix, 256 × 192. An MR Quality Control (QC)phantom (MRI/QC/P, Data Systems, Inc., Hillsboro, N.C.) was scanned after each subject atboth sites to standardize assessments over sites, individuals and time.
Image ProcessingVBM Analyses—VBM analyses of T1 MR images were performed using SPM5(http://www.fil.ion.ucl.ac.uk/spm) and VBM5 (http://dbm.neuro.uni-jena.de/vbm). After biascorrection, T1 images were segmented to gray matter (GM), white matter (WM) and CSF.Hidden Markov Random Field (prior probability weight 0.3) was used to encode spatialinformation through spatial constraints of neighboring voxels. Normalization was performedusing the following parameters: 12 parameter affine transformation and three dimensionaldiscrete cosine transformation (DCT) basis function (12 × 12 × * where * is calculated to yielda spatial cut-off that is 25 in all directions). Linear and non-linear Jacobian modulation wasthen applied (reflecting GM volume [GMV] and WM volume [WMV]), followed by smoothingwith an isotropic Gaussian kernel with full-width at half-maximum (FWHM) of 8 mm.Smoothing was also performed at 4 mm and the same regions were detected. For example, theFXS > TD, DD contrast showed caudate, thalamus, hypothalamus, fusiform gyrus and occipitalregions, and the TD, DD > FXS contrast showed superior temporal gyrus, hippocampus, insula,orbitofrontal and medial prefrontal cortices at P = 0.05 family-wise error (FWE) corrected.Customized GM and WM templates created from all subjects were used for VBM processing.Segmentation and normalization for each subject was confirmed by manual inspection of theimages. Two DD participants were excluded as a result of poor segmentation and was excludedfrom this study (final N = 18).
Volumetric Measures—Left and right total caudate nuclei volumes were obtained usingthe Automated Segmentation of Caudate Nucleus algorithm 17 using BrainImageJava (BIJ)(http://cibsr.stanford.edu), a public domain program for morphological image processingoriginally developed as a component of the National Institutes of Health Human Brain Project.The validity of the algorithm was tested with 55 high-resolution T1 – weighted MRI datasets,and the segmentation results were overlaid onto the original image data for visual inspection.The algorithm was run on the registered and inhomogenity corrected images. The right andleft caudate volumes for each subject were checked manually and were corrected if needed.
The amygdala was manually traced on high resolution T1 images aligned along the long axisof the HIP using the IRIS/SNAP tool at UNC. The protocol developed by the Center forNeuroscience and the M.I.N.D. at University of California (UC) Davis was used 18 (seehttp://www.psychiatry.unc.edu/autismresearch/mri/ROIs/Amygdala.pdf for details). We firstestablished reliability with the UC Davis group (average inter-rater reliability = 0.92).Subsequently, reliability was established on scans from a sample of 18–35 month olds.Reliability was obtained by two raters who made independent measurements on a set of 15images, which included 5 images repeated 3 times (in random order). Intra-rater and inter-raterreliabilities (intraclass correlation) were 0.90 and 0.78, respectively. Two raters (who had thereliability of 0.90) performed all the amygdala traces. There were 7 cases (4 TDs, 2 DDs and1 FXS) that were of insufficient quality to obtain an amygdala trace.
The cerebellar vermis was manually delineated into anterior vermis (I-V lobules), mid vermis(VI - VII lobules) and the posterior vermis (VIII-X lobules) using BrainImage 3.7(http://cibsr.stanford.edu). The protocol required selecting the best midsagittal slice, as definedby prioritizing clarity of the following structures: cerebellar vermis, cerebral aqueduct, corpuscallosum and the brain stem. All the analyses were performed independently by two raters whowere blinded on subject's diagnosis and achieved inter-rater reliability of 0.95. The raters madetwo tracings of the three vermal regions for each subject and the values were averaged.
Hoeft et al. Page 4
Arch Gen Psychiatry. Author manuscript; available in PMC 2010 May 5.
NIH
-PA Author Manuscript
NIH
-PA Author Manuscript
NIH
-PA Author Manuscript
Statistical AnalysisCross-Site Analysis—We undertook a number of procedures to ensure compatibility ofMR images across sites. First, we used the same pulse sequence and the same scanner type ateach site. Second, to characterize scanner quality, we calculated signal-to-noise ratio (SNR)for 24 random phantom scans (12 per scanner, selected across the entire period of the study bya blind research assistant) using the method described in 19. Two SNR measurements wereperformed and were not significantly different across sites (P = 0.39 and P = 0.22, respectively).
Third, we examined whether brain volumes differed as a function of scan-site. GMV, WMV,CSF and total tissue volume (TTV, GMV + WMV) were not significantly different across sites(all P’s > 0.05). Volumetric measures of caudate nuclei, amygdala and vermis did not differsignificantly across scan-sites (P’s > 0.05). All regions that we report below which showedsignificant differences in regional brain volumes between groups also did not show significantdifferences between scan-sites except for the following regions: right cerebellar GMV, (region‘G’ in Table 2), and pre-, postcentral GMV (regions ‘C’, ‘d’, ‘m’ in Table 2) and WMV (region‘a’ in Table 3). Fourth, we included scan-site as a nuisance variable in all analyses that wereport because of the small (non-significant) differences found between sites. Finally, werepeated the VBM analyses for each scan-site separately. While this reduced the sample-sizeto half, the only regions that were no longer significant was a right anterior cerebellar GMregion (region ‘G’ in Table 2), and regions that showed only trends for significant differenceswere two of the three right medial frontal WM regions (region ‘c’ and ‘i’ in Table 3).
Analyses of GMV, WMV and CSF—We examined total GMV, WMV and TTV obtainedfrom VBM analyses using univariate general linear model (GLM) followed by post-hocanalyses. Diagnostic group and scan-site were included as fixed factors, and age as a covariate.Site by diagnosis interaction was not modeled as this factor was not significant (P’s > 0.10)for any comparisons performed. Further analyses were performed by including IQ (MullenComposite SS) as a covariate.
VBM Analysis—We examined regional GM and WM differences between FXS and controlsusing whole-brain analysis of covariance (ANCOVA) covarying out age, scan-site, globalsand total GMV / WMV (for regional GM and WM analyses, respectively). For this analysis,we initially combined the TD and DD groups (N = 50) and compared with the FXS group (N= 51) to match sample sizes. We confirmed the results by performing a one-way ANCOVA(same covariates as above) but by treating the FXS, TD and DD participants as three separategroups (this showed similar results). To ensure that the significant effects were not driven byone of the control groups, the following analyses were performed. First, mean values fromsignificant brain regions in the whole brain VBM analyses above were extracted for eachsubject. These values were then adjusted for age, scan-site and total GMV and WMV for GMand WM analyses, respectively. Values were adjusted by performing linear multiple regressionanalysis with age, scan-site and total GMV/WMV as independent variables, and obtaining theresiduals. These adjusted brain volumes were compared between FXS and TD and FXS andDD separately.
Statistical threshold of P = 0.05 FWE corrected with an extent threshold of 200 was employed,correcting for non-isotropic smoothness. Statistical images were overlaid onto normalized GMand WM images from a representative TD, DD or FXS subject. Brain regions with significanteffects are reported based on their anatomical locations overlaid on the custom template andseveral sample FXS, TD and DD T1 images from this study. While it is not necessarily validto report Talairach coordinates and Brodmann Areas because of the very young study sampleand the use of custom templates, we report these as reference for comparisons with otherstudies. The reported Talairach coordinates were converted from MNI space using the mni2tal
Hoeft et al. Page 5
Arch Gen Psychiatry. Author manuscript; available in PMC 2010 May 5.
NIH
-PA Author Manuscript
NIH
-PA Author Manuscript
NIH
-PA Author Manuscript

function (http://www.mrc-cbu.cam.ac.uk/Imaging/Common/mnispace.shtml) and BrodmannAreas were identified using Talairach Daemon (Research Imaging Center, University of TexasHealth Science Center in San Antonio (RIC UTHSCSA, TX USA) which were confirmed withthe Talairach atlas 20.
To examine the consistency of the results, probabilistic GM maps of the VBM results wereconstructed by performing leave-one-out permutation analysis. Aforementioned between-group VBM GM analysis was repeated 100 times leaving one subject out at a time. Thestatistical images were thresholded similarly, binarized and summed to create probabilisticmaps. The results were overlaid on a custom GM template.
Volumetric Analysis of Caudate Nuclei, Amygdala and Vermis—We examinedvolumes of left and right caudate nuclei, left and right amygdala and anterior, middle andposterior vermis adjusting for age, scan-site and TTV or total GMV (for total and GM caudatevolumes, respectively) using the same method as described above for GMV, WMV and TTVcomparisons. The only difference was that we performed additional analyses including TTVas a covariate.
Covariation between brain volumes and FMRP or IQ—Based on previous studies inolder FXS individuals, we hypothesized that caudate volumes would show significant negativecorrelation with FMRP 4 (note that lower FMRP is thought to be correlated with greater severityof FXS). We therefore correlated caudate GMV which showed significant differences betweenFXS and controls in VBM and caudate volumes from manual measurements with FMRP inthe FXS group. Regression analysis with IQ (Mullen composite standard score, SS) as thedependent measure was also performed for TD, FXS and DD groups separately. Statisticalthreshold with a joint-expected probability 21 of P = 0.01 for height and extent was used.
Multivariate Pattern Classification Analyses—The final analysis was designed toidentify regions where spatially distributed GMV patterns carried information specific to FXSusing a machine learning approach, support vector machine (SVM) analysis 22–25. First, weresampled unsmoothed GMV maps to 4 × 4 mm voxels within the custom GM template, andcomputed a n-dimentional GMV vector vf,1…n for each FXS subject f and vc,1…n for eachcontrol subject except for one subject (leave-one-out cross-validation). These represent spatialGMV patterns for n voxels. This was transformed to normalized GMV vectors Vf,1…n andVc,1…n. Next, we performed principle component analysis (PCA) to reduce the number offeatures and used the number of eigenvectors that accounted for variance above 80 %, whichgave Ff,1…N and Fc,1…N for N (3) features. We assigned the vectors for n-1 subjects as a trainingdata-set that was used to train a linear support vector pattern classifier (with fixed regularizationparameter C = 1) to correctly identify GMV patterns of the nth subject which was repeated ntimes. Prediction accuracy, sensitivity, specificity and positive predictive values werecalculated. Weight vectors were transformed back to voxel-space as described in 25. Werepeated the analyses to classify FXS from TD and FXS from DD separately as well as toclassify DD from TD. Because there were only 18 DD subjects (vs. 51 FXS subjects), weensured that the low classification accuracy of DD from TD was not due to small sample-sizeby randomly selecting 18 FXS subjects and classifying these FXS subject from TD (whichyielded high classification accuracy). Classification accuracies of FXS and TD, and DD andTD were statistically compared using permutation analyses.
We also performed identical SVM analyses but used different methods to define features. Theaforementioned method including all GM 4×4 mm voxels are referred to as the Voxel-wisefeature selection method. To compare with this method, we coregistered all 116 brain regionsin the Automated Talairach Atlas Label (AAL) (http://www.cyceron.fr/freeware/) to subjects’unsmoothed normalized images and extracted GMV from all regions and repeated the analysis
Hoeft et al. Page 6
Arch Gen Psychiatry. Author manuscript; available in PMC 2010 May 5.
NIH
-PA Author Manuscript
NIH
-PA Author Manuscript
NIH
-PA Author Manuscript

(Region-wise). Classification accuracies of the Voxel-wise and Region-wise Methods werestatistically compared using permutation analyses.
Since caudate volumes on their own were relatively good classifiers, we also repeated the‘Voxel-wise’ analysis including all GM voxels but excluding voxels in the caudate (Voxel-wise excl. Caudate). Caudate was defined using the AAL. These methods were also performedin a leave-one-out fashion.
Discriminating volumes (weight vectors transformed back into brain-space) were presented intwo ways. First, we show weights of all voxels without any thresholding. We also show voxelsthat exceeded a specified statistical threshold using permutation analysis (random assignmentof classes 2000 times; P = 0.05, weight = ± 0.0054).
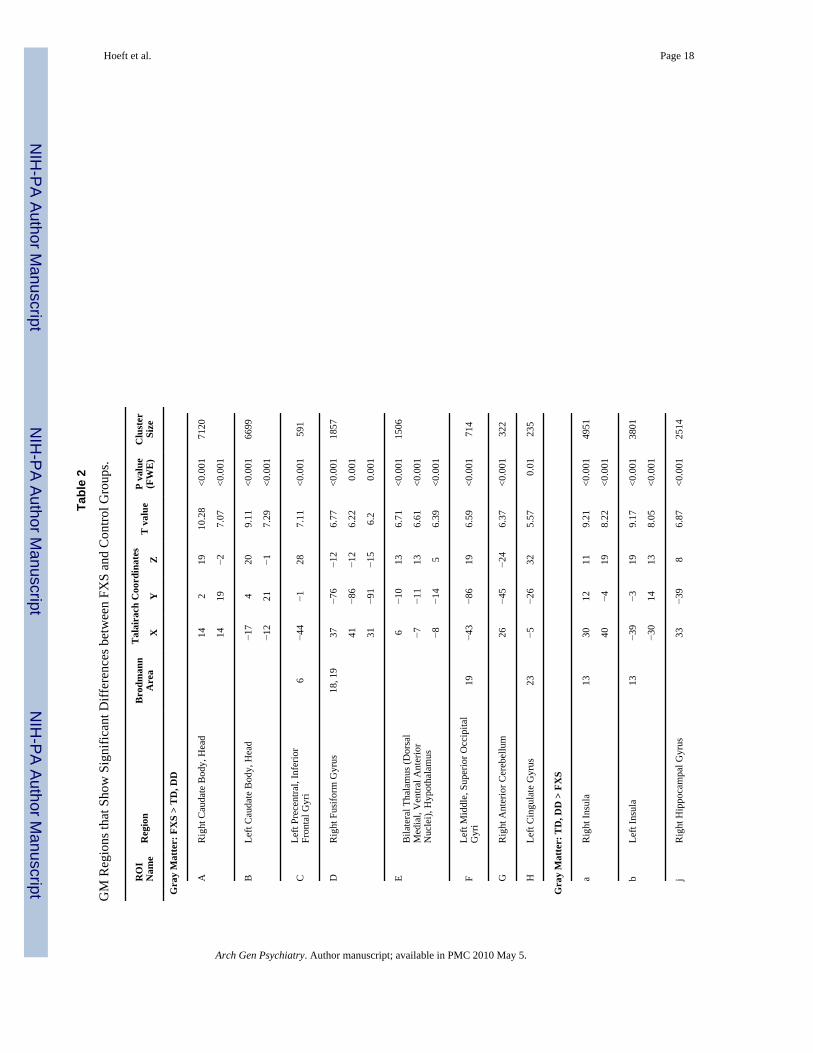
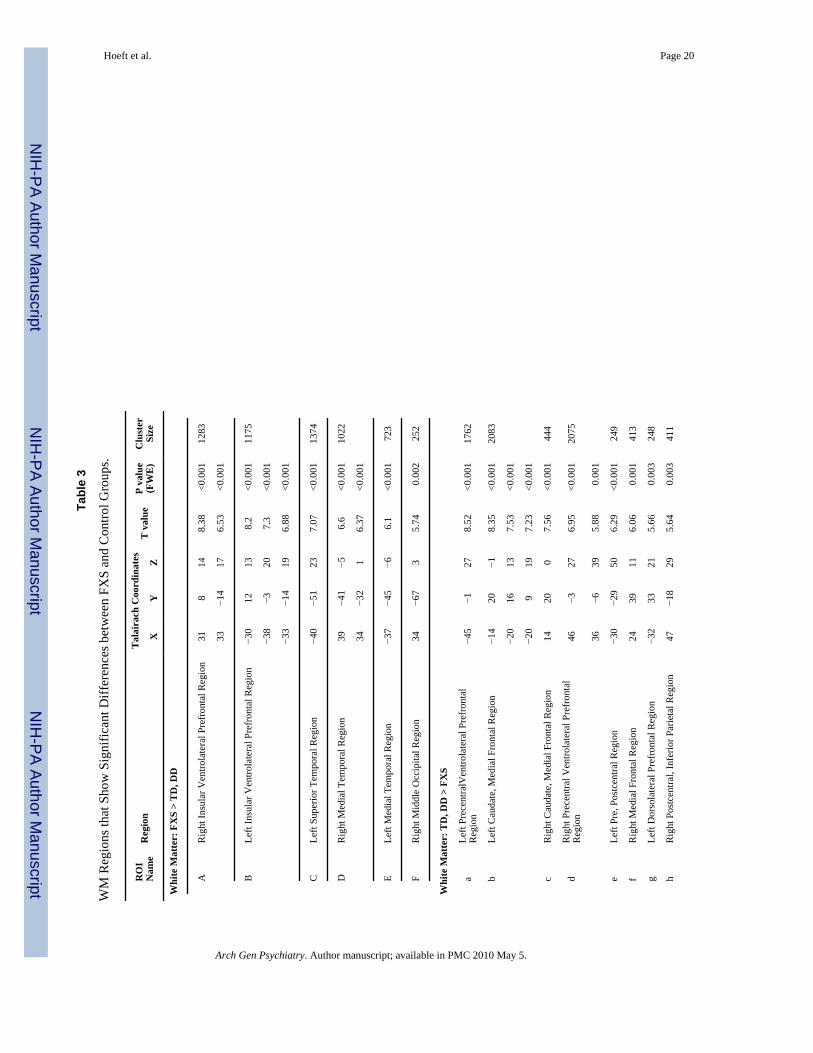
RESULTSUnivariate whole-brain voxel-wise analysis showed significantly greater GMV in FXScompared to TD and to DD controls in specific regions that included bilateral caudate, occipitalcortex including fusiform gyrus (FG), hypothalamus and thalamus. In contrast, FXS showedsignificantly reduced GMV in superior temporal gyrus (STG), hippocampus, insula,orbitofrontal cortex (OFC) and medial prefrontal cortices (mPFC) compared to TD and DD(Fig. 1 a, b, Table 2). Probabilistic maps from permutation analysis show the highly reliablenature of the results (Fig. 2). Volumetric measures were consistent with the whole-brain results(Fig. 3, Table 4). Results from white matter (WM) regions showing significantly different whitematter volumes between FXS and controls in the prefrontal and temporal regions are alsoreported in Fig. 4 and Table 3. Within FXS, FMRP levels were significantly (negatively)correlated with bilateral caudate volumes identified from both VBM and volumetric analyses(P’s < 0.05).
When covariation between cognitive functioning (IQ) and morphometric patterns wasexamined, in TD, IQ showed significant positive correlation with cerebellar hemispheres (left> right), vermis and FG GMV, and negative correlations with right dorsolateral PFC (DLPFC),bilateral mPFC/OFC GMV and mPF WMV (Fig. 5). DD showed significant positivecorrelation between IQ and GMV in bilateral parieto-temporal regions and negative correlationbetween IQ and WMV in a mPF region adjacent to that found in TD. In contrast, significant(negative) brain-IQ associations were observed in FXS in the left parieto-temporal region only,similar to DD, but not in other regions.
We adopted machine learning algorithms to examine whether whole-brain voxel-wise spatialpatterns of GMV could discriminate between groups. While the spatial resolution of humanneuroimaging is limited, hence leaving most studies to examine extended regions of the brain,it has recently been shown that MRI can be used to study fine-grained neural representations,even when they are encoded at a finer scale than the resolution of the measurement grid23.Using a leave-one-out linear SVM approach, FXS was discriminated from controls with 92.9% classification accuracy (Fig. 6a(i)). Classification accuracy between FXS and TD wassignificantly better than between DD and TD even when matched for small sample-size of DDs(P < 0.001) (Fig. 6a(iv) and (v)). Comparisons across SVM methods showed the importanceof voxel-wise spatial information in classification accuracy rather than using more coarseregion-based measures (116 anatomical labels, http://www.cyceron.fr/freeware/) of GMV (P< 0.001) (Fig. 6a(iii)). This was presumably due to the mixture of voxels that showed bothincreased and decreased GMV in a given region (e.g. medial vs. lateral amygdala, hippocampusand posterior vermis, Fig. 6b). Finally, because enlarged caudate volume is the mostcharacteristic morphometric feature in FXS, we repeated the classification analysis excludingcaudate voxels, and still obtained high classification accuracy (88.9 %) (Fig. 6a(ii)).
Hoeft et al. Page 7
Arch Gen Psychiatry. Author manuscript; available in PMC 2010 May 5.
NIH
-PA Author Manuscript
NIH
-PA Author Manuscript
NIH
-PA Author Manuscript
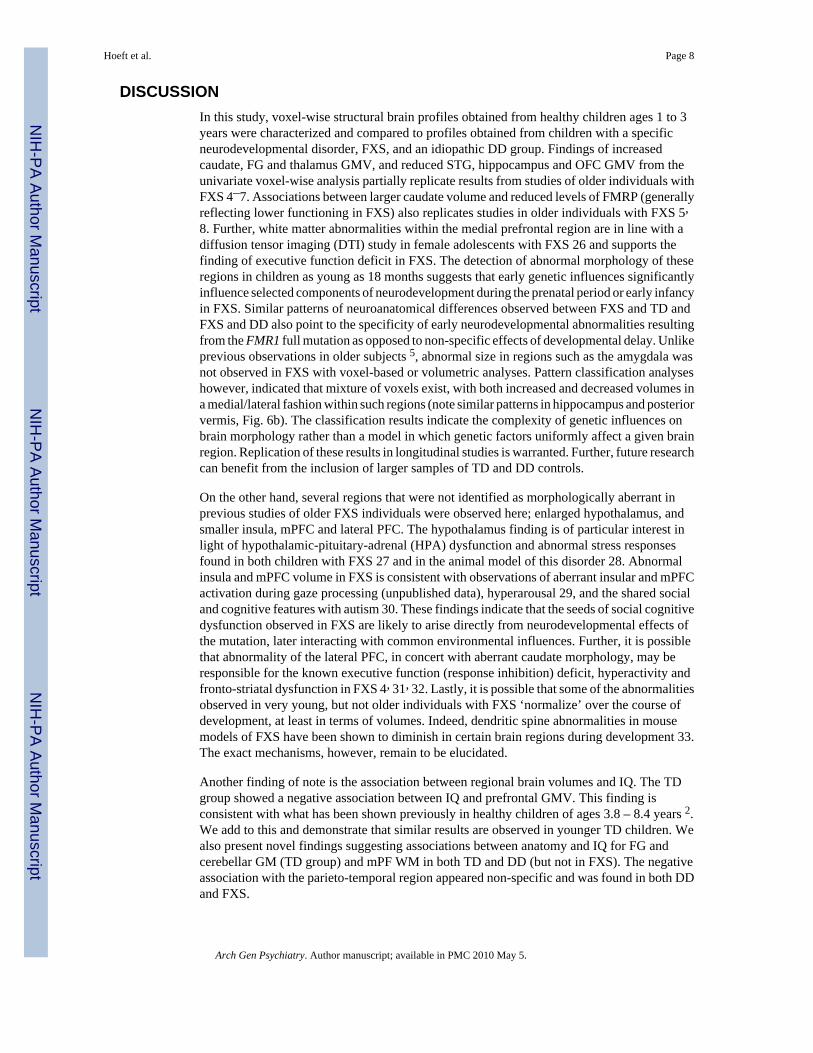
DISCUSSIONIn this study, voxel-wise structural brain profiles obtained from healthy children ages 1 to 3years were characterized and compared to profiles obtained from children with a specificneurodevelopmental disorder, FXS, and an idiopathic DD group. Findings of increasedcaudate, FG and thalamus GMV, and reduced STG, hippocampus and OFC GMV from theunivariate voxel-wise analysis partially replicate results from studies of older individuals withFXS 4–7. Associations between larger caudate volume and reduced levels of FMRP (generallyreflecting lower functioning in FXS) also replicates studies in older individuals with FXS 5,8. Further, white matter abnormalities within the medial prefrontal region are in line with adiffusion tensor imaging (DTI) study in female adolescents with FXS 26 and supports thefinding of executive function deficit in FXS. The detection of abnormal morphology of theseregions in children as young as 18 months suggests that early genetic influences significantlyinfluence selected components of neurodevelopment during the prenatal period or early infancyin FXS. Similar patterns of neuroanatomical differences observed between FXS and TD andFXS and DD also point to the specificity of early neurodevelopmental abnormalities resultingfrom the FMR1 full mutation as opposed to non-specific effects of developmental delay. Unlikeprevious observations in older subjects 5, abnormal size in regions such as the amygdala wasnot observed in FXS with voxel-based or volumetric analyses. Pattern classification analyseshowever, indicated that mixture of voxels exist, with both increased and decreased volumes ina medial/lateral fashion within such regions (note similar patterns in hippocampus and posteriorvermis, Fig. 6b). The classification results indicate the complexity of genetic influences onbrain morphology rather than a model in which genetic factors uniformly affect a given brainregion. Replication of these results in longitudinal studies is warranted. Further, future researchcan benefit from the inclusion of larger samples of TD and DD controls.
On the other hand, several regions that were not identified as morphologically aberrant inprevious studies of older FXS individuals were observed here; enlarged hypothalamus, andsmaller insula, mPFC and lateral PFC. The hypothalamus finding is of particular interest inlight of hypothalamic-pituitary-adrenal (HPA) dysfunction and abnormal stress responsesfound in both children with FXS 27 and in the animal model of this disorder 28. Abnormalinsula and mPFC volume in FXS is consistent with observations of aberrant insular and mPFCactivation during gaze processing (unpublished data), hyperarousal 29, and the shared socialand cognitive features with autism 30. These findings indicate that the seeds of social cognitivedysfunction observed in FXS are likely to arise directly from neurodevelopmental effects ofthe mutation, later interacting with common environmental influences. Further, it is possiblethat abnormality of the lateral PFC, in concert with aberrant caudate morphology, may beresponsible for the known executive function (response inhibition) deficit, hyperactivity andfronto-striatal dysfunction in FXS 4, 31, 32. Lastly, it is possible that some of the abnormalitiesobserved in very young, but not older individuals with FXS ‘normalize’ over the course ofdevelopment, at least in terms of volumes. Indeed, dendritic spine abnormalities in mousemodels of FXS have been shown to diminish in certain brain regions during development 33.The exact mechanisms, however, remain to be elucidated.
Another finding of note is the association between regional brain volumes and IQ. The TDgroup showed a negative association between IQ and prefrontal GMV. This finding isconsistent with what has been shown previously in healthy children of ages 3.8 – 8.4 years 2.We add to this and demonstrate that similar results are observed in younger TD children. Wealso present novel findings suggesting associations between anatomy and IQ for FG andcerebellar GM (TD group) and mPF WM in both TD and DD (but not in FXS). The negativeassociation with the parieto-temporal region appeared non-specific and was found in both DDand FXS.
Hoeft et al. Page 8
Arch Gen Psychiatry. Author manuscript; available in PMC 2010 May 5.
NIH
-PA Author Manuscript
NIH
-PA Author Manuscript
NIH
-PA Author Manuscript

Finally, we illustrate that fine spatial patterns of GMV accurately predict whether a child hasFXS. Similar analytic strategies as applied to functional neuroimaging data have been shownto be a powerful tool in decoding mental states within individuals where traditional massiveunivariate general linear models fail 23. Here we show its usefulness in classifying diseaseusing structural neuroimaging data. These findings may inform future studies predictingcognitive outcome in FXS as well as research focused on children with otherneurodevelopmental syndromes. Further, these findings have implications for understandingthe genetic control of healthy brain development.
AcknowledgmentsThis study was funded by MH64708-05 (A.L.R., J.P.), MH61696 (J.P.) and HD03110-36 (J.P.) and Child HealthResearch Program (CHRP) from Stanford University School of Medicine (F.H.). The corresponding author had fullaccess to all of the data in the study and takes responsibility for the integrity of the data and the accuracy of the dataanalysis. We sincerely thank all of the families who made this study possible. We also thank Chad Chappell, NancyGarrett, Michael Graves, Cindy Hagan, Cindy Johnston, Arianna Martin, Robin Morris, Judy Morrow, MatthewMosconi, Rachel G. Smith, Cristiana Vattuone, Christa Watson and Anh Weber for their invaluable work on theproject.
REFERENCE1. Toga AW, Thompson PM, Sowell ER. Mapping brain maturation. Trends Neurosci 2006 Mar;29(3):
148–159. [PubMed: 16472876]2. Shaw P, Greenstein D, Lerch J, et al. Intellectual ability and cortical development in children and
adolescents. Nature 2006 Mar 30;440(7084):676–679. [PubMed: 16572172]3. Greenough WT, Klintsova AY, Irwin SA, Galvez R, Bates KE, Weiler IJ. Synaptic regulation of protein
synthesis and the fragile X protein. Proc Natl Acad Sci U S A 2001 Jun 19;98(13):7101–7106.[PubMed: 11416194]
4. Reiss AL, Dant CC. The behavioral neurogenetics of fragile X syndrome: analyzing gene-brain-behavior relationships in child developmental psychopathologies. Dev Psychopathol 2003;15(4):927–968. Fall. [PubMed: 14984133]
5. Gothelf D, Furfaro JA, Hoeft F, et al. Neuroanatomy of fragile X syndrome is associated with aberrantbehavior and FMRP. Annals of Neurology. 2007 Oct 11;
6. Kates WR, Folley BS, Lanham DC, Capone GT, Kaufmann WE. Cerebral growth in Fragile Xsyndrome: review and comparison with Down syndrome. Microsc Res Tech 2002 May 1;57(3):159–167. [PubMed: 12112452]
7. Lee AD, Leow AD, Lu A, et al. 3D pattern of brain abnormalities in Fragile X syndrome visualizedusing tensor-based morphometry. Neuroimage 2007 Feb 1;34(3):924–938. [PubMed: 17161622]
8. Reiss AL, Abrams MT, Greenlaw R, Freund L, Denckla MB. Neurodevelopmental effects of theFMR-1 full mutation in humans. Nat Med 1995 Feb;1(2):159–167. [PubMed: 7585014]
9. Gothelf D, Furfaro JA, Hoeft F, et al. Neuroanatomy of fragile X syndrome is associated with aberrantbehavior and FMRP. Annals of Neurology. in press.
10. Mullen, EM. Mullen Scales of Early Learning AGS Edition. Circle Pines, MN: American GuidanceService, Inc; 1995.
11. Oberle I, Rousseau F, Heitz D, et al. Instability of a 550-base pair DNA segment and abnormalmethylation in fragile X syndrome. Science 1991 May 24;252(5010):1097–1102.
12. Willemsen R, Mohkamsing S, de Vries B, et al. Rapid antibody test for fragile X syndrome. Lancet1995 May 6;345(8958):1147–1148. [PubMed: 7723547]
13. Sparrow, SS.; Balla, DA.; Cicche, HV. Vineland Adaptive Behavior Scales-Interview Edition SurveyForm Manual. Circle Pines: American Guidance Service, Inc; 1984.
14. Achenbach TM, Ruffle TM. The Child Behavior Checklist and related forms for assessing behavioral/emotional problems and competencies. Pediatr Rev 2000 Aug;21(8):265–271. [PubMed: 10922023]
15. Bodfish JW, Crawford TW, Powell SB, Parker DE, Golden RN, Lewis MH. Compulsions in adultswith mental retardation: prevalence, phenomenology, and comorbidity with stereotypy and self-injury. Am J Ment Retard 1995 Sep;100(2):183–192. [PubMed: 8527113]
Hoeft et al. Page 9
Arch Gen Psychiatry. Author manuscript; available in PMC 2010 May 5.
NIH
-PA Author Manuscript
NIH
-PA Author Manuscript
NIH
-PA Author Manuscript
16. Bodfish, JW.; Symons, F.; Lewis, MH. The Repetitive Behavior Scales. Western Carolina CenterResearch Reports; 1999.
17. Xia Y, Bettinger K, Shen L, Reiss AL. Automatic segmentation of the caudate nucleus from humanbrain MR images. IEEE Trans Med Imaging 2007 Apr;26(4):509–517. [PubMed: 17427738]
18. Schumann CM, Hamstra J, Goodlin-Jones BL, et al. The amygdala is enlarged in children but notadolescents with autism; the hippocampus is enlarged at all ages. J Neurosci 2004 Jul 14;24(28):6392–6401. [PubMed: 15254095]
19. Henkelman RM. Measurement of signal intensities in the presence of noise in MR images. Med Phys1985 Mar-Apr;12(2):232–233. [PubMed: 4000083]
20. Talairach, J.; Tournoux, P. Co-planar stereotaxic atlas of the human brain. New York: Thieme; 1988.21. Poline JB, Worsley KJ, Evans AC, Friston KJ. Combining spatial extent and peak intensity to test
for activations in functional imaging. Neuroimage 1997 Feb;5(2):83–96. [PubMed: 9345540]22. Burges C. A tutorial on support vector machines for pattern recognition. Data Min.Knowl. Discov
1998;2(2):144–152.23. Haynes JD, Rees G. Decoding mental states from brain activity in humans. Nat Rev Neurosci 2006
Jul;7(7):523–534. [PubMed: 16791142]24. Haynes JD, Sakai K, Rees G, Gilbert S, Frith C, Passingham RE. Reading hidden intentions in the
human brain. Curr Biol 2007 Feb 20;17(4):323–328. [PubMed: 17291759]25. Mourao-Miranda J, Reynaud E, McGlone F, Calvert G, Brammer M. The impact of temporal
compression and space selection on SVM analysis of single-subject and multi-subject fMRI data.Neuroimage 2006 Dec;33(4):1055–1065. [PubMed: 17010645]
26. Barnea-Goraly N, Eliez S, Hedeus M, et al. White matter tract alterations in fragile X syndrome:preliminary evidence from diffusion tensor imaging. Am J Med Genet B Neuropsychiatr Genet 2003Apr 1;118(1):81–88. [PubMed: 12627472]
27. Hessl D, Rivera SM, Reiss AL. The neuroanatomy and neuroendocrinology of fragile X syndrome.Ment Retard Dev Disabil Res Rev 2004;10(1):17–24. [PubMed: 14994284]
28. Lauterborn JC. Stress induced changes in cortical and hypothalamic c-fos expression are altered infragile X mutant mice. Brain Res Mol Brain Res 2004 Nov 24;131(1–2):101–109. [PubMed:15530658]
29. Miller LJ, McIntosh DN, McGrath J, et al. Electrodermal responses to sensory stimuli in individualswith fragile X syndrome: a preliminary report. Am J Med Genet 1999 Apr 2;83(4):268–279.[PubMed: 10208160]
30. Belmonte MK, Bourgeron T. Fragile X syndrome and autism at the intersection of genetic and neuralnetworks. Nat Neurosci 2006 Oct;9(10):1221–1225. [PubMed: 17001341]
31. Hoeft F, Hernandez A, Parthasarathy S, Watson CL, Hall SS, Reiss AL. Fronto-striatal dysfunctionand potential compensatory mechanisms in male adolescents with fragile X syndrome. Hum BrainMapp 2007 Jun;28(6):543–554. [PubMed: 17437282]
32. Menon V, Leroux J, White CD, Reiss AL. Frontostriatal deficits in fragile X syndrome: relation toFMR1 gene expression. Proc Natl Acad Sci U S A 2004 Mar 9;101(10):3615–3620. [PubMed:14993603]
33. Bagni C, Greenough WT. From mRNP trafficking to spine dysmorphogenesis: the roots of fragile Xsyndrome. Nat Rev Neurosci 2005 May;6(5):376–387. [PubMed: 15861180]
Hoeft et al. Page 10
Arch Gen Psychiatry. Author manuscript; available in PMC 2010 May 5.
NIH
-PA Author Manuscript
NIH
-PA Author Manuscript
NIH
-PA Author Manuscript
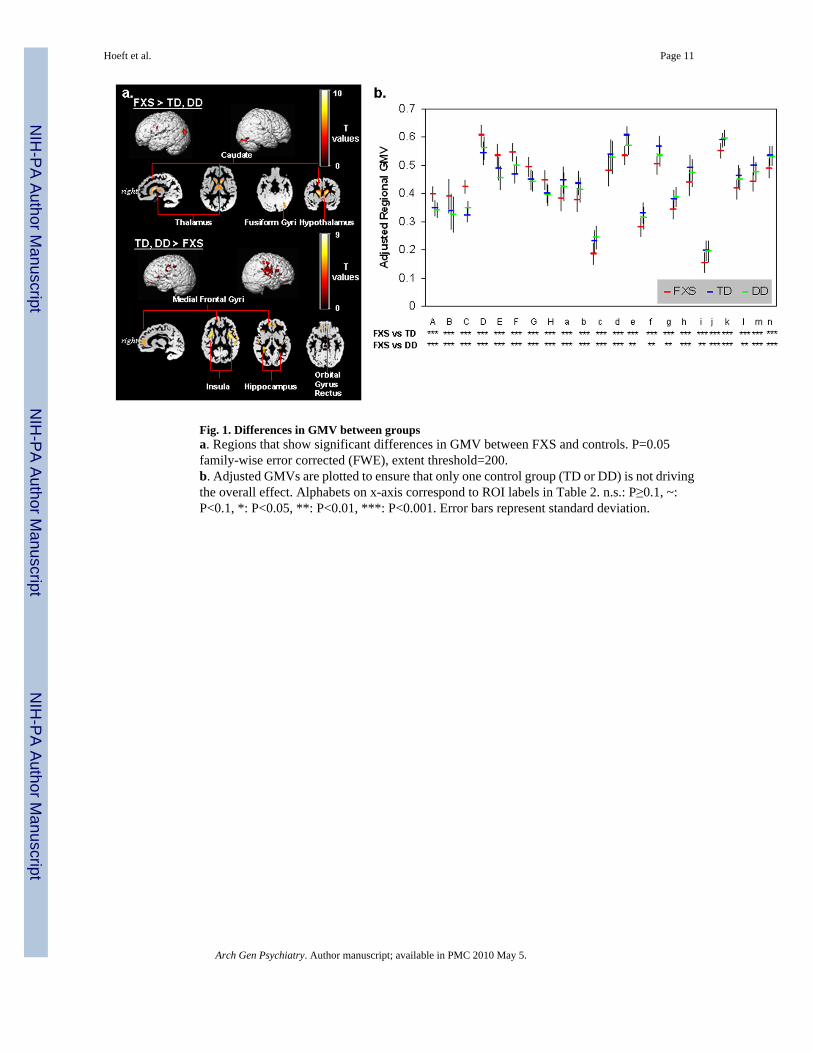
Fig. 1. Differences in GMV between groupsa. Regions that show significant differences in GMV between FXS and controls. P=0.05family-wise error corrected (FWE), extent threshold=200.b. Adjusted GMVs are plotted to ensure that only one control group (TD or DD) is not drivingthe overall effect. Alphabets on x-axis correspond to ROI labels in Table 2. n.s.: P≥0.1, ~:P<0.1, *: P<0.05, **: P<0.01, ***: P<0.001. Error bars represent standard deviation.
Hoeft et al. Page 11
Arch Gen Psychiatry. Author manuscript; available in PMC 2010 May 5.
NIH
-PA Author Manuscript
NIH
-PA Author Manuscript
NIH
-PA Author Manuscript

Fig. 2. Probabilistic maps of regional GMV differences between groupsGM regions that show significantly greater and less volumes in FXS compared to TD and DDgroups was examined using leave-one out cross-validation analysis permuted 102 times.Scaling bars represent T-values. A value of 1 in a given voxel indicates that all permutationsshowed significant effects (at a threshold of P = 0.05 family-wise error corrected (FWE), extentthreshold = 200). Age, scan-site and total GMV are entered as nuisance variables. Statisticalmaps are overlaid on a custom GM template. Most regions showing a value of 1 indicate theconsistency of results. Left hemisphere is shown on left-side.
Hoeft et al. Page 12
Arch Gen Psychiatry. Author manuscript; available in PMC 2010 May 5.
NIH
-PA Author Manuscript
NIH
-PA Author Manuscript
NIH
-PA Author Manuscript
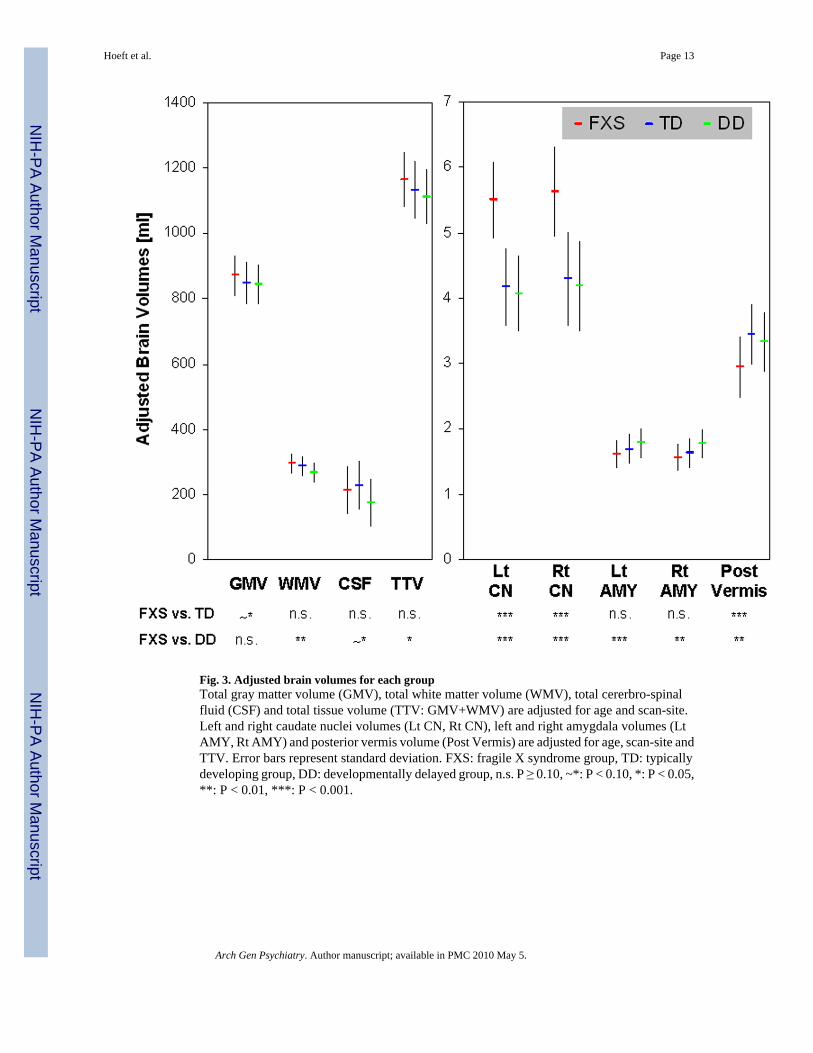
Fig. 3. Adjusted brain volumes for each groupTotal gray matter volume (GMV), total white matter volume (WMV), total cererbro-spinalfluid (CSF) and total tissue volume (TTV: GMV+WMV) are adjusted for age and scan-site.Left and right caudate nuclei volumes (Lt CN, Rt CN), left and right amygdala volumes (LtAMY, Rt AMY) and posterior vermis volume (Post Vermis) are adjusted for age, scan-site andTTV. Error bars represent standard deviation. FXS: fragile X syndrome group, TD: typicallydeveloping group, DD: developmentally delayed group, n.s. P ≥ 0.10, ~*: P < 0.10, *: P < 0.05,**: P < 0.01, ***: P < 0.001.
Hoeft et al. Page 13
Arch Gen Psychiatry. Author manuscript; available in PMC 2010 May 5.
NIH
-PA Author Manuscript
NIH
-PA Author Manuscript
NIH
-PA Author Manuscript
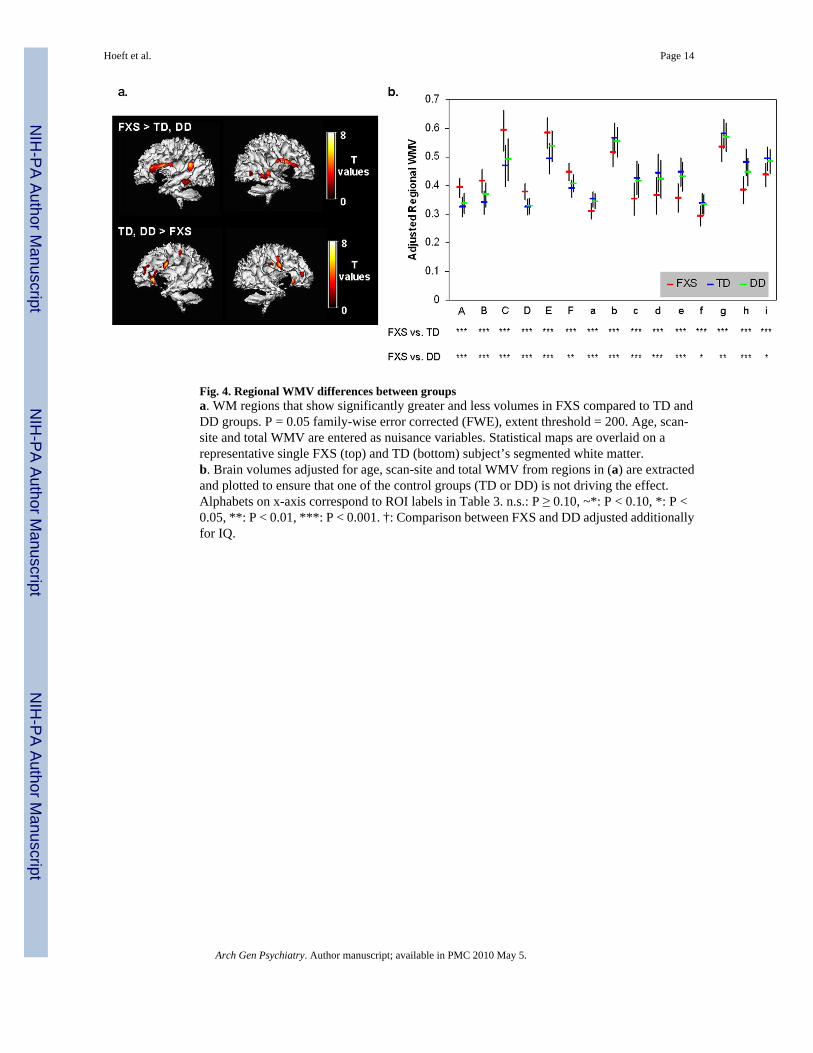
Fig. 4. Regional WMV differences between groupsa. WM regions that show significantly greater and less volumes in FXS compared to TD andDD groups. P = 0.05 family-wise error corrected (FWE), extent threshold = 200. Age, scan-site and total WMV are entered as nuisance variables. Statistical maps are overlaid on arepresentative single FXS (top) and TD (bottom) subject’s segmented white matter.b. Brain volumes adjusted for age, scan-site and total WMV from regions in (a) are extractedand plotted to ensure that one of the control groups (TD or DD) is not driving the effect.Alphabets on x-axis correspond to ROI labels in Table 3. n.s.: P ≥ 0.10, ~*: P < 0.10, *: P <0.05, **: P < 0.01, ***: P < 0.001. †: Comparison between FXS and DD adjusted additionallyfor IQ.
Hoeft et al. Page 14
Arch Gen Psychiatry. Author manuscript; available in PMC 2010 May 5.
NIH
-PA Author Manuscript
NIH
-PA Author Manuscript
NIH
-PA Author Manuscript

Fig. 5. Covariation of regional brain volumes and IQGM and WM regions that show significant correlation with IQ (Mullen Composite StandardScore) in TD and DD groups (FXS group showed no significant correlation). P = 0.01 corrected.Controlled for age, scan-site and total GMV (for GM regions) / WMV (for WM regions).Statistical maps are overlaid on a representative single TD (for correlations in the TD group)or DD (for correlations in the DD group) subject’s segmented GM (for GM regions) or WM(for WM regions). Scaling bars represent T-values. Left side shows left hemispheres exceptwhen noted.
Hoeft et al. Page 15
Arch Gen Psychiatry. Author manuscript; available in PMC 2010 May 5.
NIH
-PA Author Manuscript
NIH
-PA Author Manuscript
NIH
-PA Author Manuscript

Fig. 6. Pattern classification resultsa. Classification accuracy. SVM results classifying FXS and controls using all GM voxels(i), all GM voxels except caudate voxels (ii), and 116 brain regions (iii). To the right is SVMresults classifying DD from TD using all GM voxels (iv), and FXS from TD in a subset ofrandomly selected FXS (N=18) to match sample-size of DD (v).b. Whole-brain representation of pattern classification results from FXS vs. TD/DD using allGM voxels. Axial brain images of weight vectors from leave-one-out SVM for all voxels (top),and spatial patterns of most significant voxels when thresholded at P=0.05 (according to 2000permutations) (bottom).
Hoeft et al. Page 16
Arch Gen Psychiatry. Author manuscript; available in PMC 2010 May 5.
NIH
-PA Author Manuscript
NIH
-PA Author Manuscript
NIH
-PA Author Manuscript
NIH
-PA Author Manuscript
NIH
-PA Author Manuscript
NIH
-PA Author Manuscript
Hoeft et al. Page 17
Tabl
e 1
Dem
ogra
phic
Info
rmat
ion
FX (N
=51)
TD
(N=3
2)D
D (N
=18)
AN
OV
A
mea
nSD
mea
nSD
mea
nSD
FP
Age
(mon
ths)
35.0
7.6
29.7
7.1
34.8
5.1
6.16
0.00
3
Mul
len
Com
posi
te (S
S)54
.65
8.98
108.
5018
.42
57.7
29.
7118
7.04
<0.0
01
Vin
elan
d A
dapt
ive
Beh
avio
rC
ompo
site
(SS)
62.0
29.
6797
.23
12.4
465
.00
11.9
210
5.30
<0.0
01
FMR
P (%
)5.
743.
41
SS: S
tand
ard
Scor
e; S
D: s
tand
ard
devi
atio
n
Vin
elan
d: T
D N
=31,
FM
RP:
N=4
6
Arch Gen Psychiatry. Author manuscript; available in PMC 2010 May 5.
NIH
-PA Author Manuscript
NIH
-PA Author Manuscript
NIH
-PA Author Manuscript
Hoeft et al. Page 18
Tabl
e 2
GM
Reg
ions
that
Sho
w S
igni
fican
t Diff
eren
ces b
etw
een
FXS
and
Con
trol G
roup
s.
RO
IN
ame
Reg
ion
Bro
dman
nA
rea
Tal
aira
ch C
oord
inat
esT
val
ueP
valu
e(F
WE
)C
lust
erSi
zeX
YZ
Gra
y M
atte
r: F
XS
> T
D, D
D
AR
ight
Cau
date
Bod
y, H
ead
142
1910
.28
<0.0
0171
20
1419
−27.
07<0
.001
BLe
ft C
auda
te B
ody,
Hea
d−1
74
209.
11<0
.001
6699
−12
21−1
7.29
<0.0
01
CLe
ft Pr
ecen
tral,
Infe
rior
Fron
tal G
yri
6−4
4−1
287.
11<0
.001
591
DR
ight
Fus
iform
Gyr
us18
, 19
37−7
6−1
26.
77<0
.001
1857
41−8
6−1
26.
220.
001
31−9
1−1
56.
20.
001
EB
ilate
ral T
hala
mus
(Dor
sal
Med
ial,
Ven
tral A
nter
ior
Nuc
lei),
Hyp
otha
lam
us
6−1
013
6.71
<0.0
0115
06
−7−1
113
6.61
<0.0
01
−8−1
45
6.39
<0.0
01
FLe
ft M
iddl
e, S
uper
ior O
ccip
ital
Gyr
i19
−43
−86
196.
59<0
.001
714
GR
ight
Ant
erio
r Cer
ebel
lum
26−4
5−2
46.
37<0
.001
322
HLe
ft C
ingu
late
Gyr
us23
−5−2
632
5.57
0.01
235
Gra
y M
atte
r: T
D, D
D >
FX
S
aR
ight
Insu
la13
3012
119.
21<0
.001
4951
40−4
198.
22<0
.001
bLe
ft In
sula
13−3
9−3
199.
17<0
.001
3801
−30
1413
8.05
<0.0
01
jR
ight
Hip
poca
mpa
l Gyr
us33
−39
86.
87<0
.001
2514
Arch Gen Psychiatry. Author manuscript; available in PMC 2010 May 5.

NIH
-PA Author Manuscript
NIH
-PA Author Manuscript
NIH
-PA Author Manuscript
Hoeft et al. Page 19
RO
IN
ame
Reg
ion
Bro
dman
nA
rea
Tal
aira
ch C
oord
inat
esT
val
ueP
valu
e(F
WE
)C
lust
erSi
zeX
YZ
30−5
717
5.55
0.00
4
cR
ight
Pos
tcen
tral G
yrus
,In
ferio
r Par
ieta
l Lob
ule
(IPL
)40
,1,3
57−2
720
6.74
<0.0
0158
99
58−1
643
6.62
<0.0
01
62−7
166.
41<0
.001
dR
ight
Pos
tcen
tral G
yrus
, IPL
4049
−30
486.
68<0
.001
556
62−2
841
5.54
0.01
1
eR
ight
Med
ial F
ront
al G
yrus
1013
52−6
6.48
<0.0
0148
4
fR
ight
Infe
rior F
ront
al G
yrus
44,4
553
1718
6.44
<0.0
0111
62
599
195.
950.
002
gLe
ft M
iddl
e Fr
onta
l Gyr
us11
−22
41−1
36.
34<0
.001
431
hLe
ft M
edia
l Fro
ntal
Gyr
us−1
053
56.
190.
001
1372
−12
4413
5.95
0.00
2
−943
05.
680.
006
kLe
ft H
ippo
cam
pal G
yrus
−33
−37
66.
14<0
.001
468
iLe
ft IP
L, P
ostc
entra
l Gyr
us40
−62
−34
386.
090.
001
395
jR
ight
Med
ial F
ront
al G
yrus
116
44−1
45.
960.
002
408
1539
−15
5.8
0.00
4
kLe
ft Pr
ecen
tral G
yrus
6,4
−62
−427
5.87
0.00
310
83
−61
−10
385.
760.
005
−65
−19
425.
150.
045
lLe
ft Su
perio
r Tem
pora
l,Pr
ecen
tral G
yri
22,4
−62
−83
5.59
0.00
923
2
−54
−85
5.39
0.01
9
Arch Gen Psychiatry. Author manuscript; available in PMC 2010 May 5.
NIH
-PA Author Manuscript
NIH
-PA Author Manuscript
NIH
-PA Author Manuscript
Hoeft et al. Page 20
Tabl
e 3
WM
Reg
ions
that
Sho
w S
igni
fican
t Diff
eren
ces b
etw
een
FXS
and
Con
trol G
roup
s.
RO
IN
ame
Reg
ion
Tal
aira
ch C
oord
inat
esT
val
ueP
valu
e(F
WE
)C
lust
erSi
zeX
YZ
Whi
te M
atte
r: F
XS
> T
D, D
D
AR
ight
Insu
lar V
entro
late
ral P
refr
onta
l Reg
ion
318
148.
38<0
.001
1283
33−1
417
6.53
<0.0
01
BLe
ft In
sula
r Ven
trola
tera
l Pre
fron
tal R
egio
n−3
012
138.
2<0
.001
1175
−38
−320
7.3
<0.0
01
−33
−14
196.
88<0
.001
CLe
ft Su
perio
r Tem
pora
l Reg
ion
−40
−51
237.
07<0
.001
1374
DR
ight
Med
ial T
empo
ral R
egio
n39
−41
−56.
6<0
.001
1022
34−3
21
6.37
<0.0
01
ELe
ft M
edia
l Tem
pora
l Reg
ion
−37
−45
−66.
1<0
.001
723
FR
ight
Mid
dle
Occ
ipita
l Reg
ion
34−6
73
5.74
0.00
225
2
Whi
te M
atte
r: T
D, D
D >
FX
S
aLe
ft Pr
ecen
tralV
entro
late
ral P
refr
onta
lR
egio
n−4
5−1
278.
52<0
.001
1762
bLe
ft C
auda
te, M
edia
l Fro
ntal
Reg
ion
−14
20−1
8.35
<0.0
0120
83
−20
1613
7.53
<0.0
01
−20
919
7.23
<0.0
01
cR
ight
Cau
date
, Med
ial F
ront
al R
egio
n14
200
7.56
<0.0
0144
4
dR
ight
Pre
cent
ral V
entro
late
ral P
refr
onta
lR
egio
n46
−327
6.95
<0.0
0120
75
36−6
395.
880.
001
eLe
ft Pr
e, P
ostc
entra
l Reg
ion
−30
−29
506.
29<0
.001
249
fR
ight
Med
ial F
ront
al R
egio
n24
3911
6.06
0.00
141
3
gLe
ft D
orso
late
ral P
refr
onta
l Reg
ion
−32
3321
5.66
0.00
324
8
hR
ight
Pos
tcen
tral,
Infe
rior P
arie
tal R
egio
n47
−18
295.
640.
003
411
Arch Gen Psychiatry. Author manuscript; available in PMC 2010 May 5.

NIH
-PA Author Manuscript
NIH
-PA Author Manuscript
NIH
-PA Author Manuscript
Hoeft et al. Page 21
RO
IN
ame
Reg
ion
Tal
aira
ch C
oord
inat
esT
val
ueP
valu
e(F
WE
)C
lust
erSi
zeX
YZ
iR
ight
Sup
erio
r, M
edia
l Fro
ntal
Reg
ion
−21
4019
5.49
0.00
522
4
−24
399
5.22
0.01
4
Arch Gen Psychiatry. Author manuscript; available in PMC 2010 May 5.
NIH
-PA Author Manuscript
NIH
-PA Author Manuscript
NIH
-PA Author Manuscript
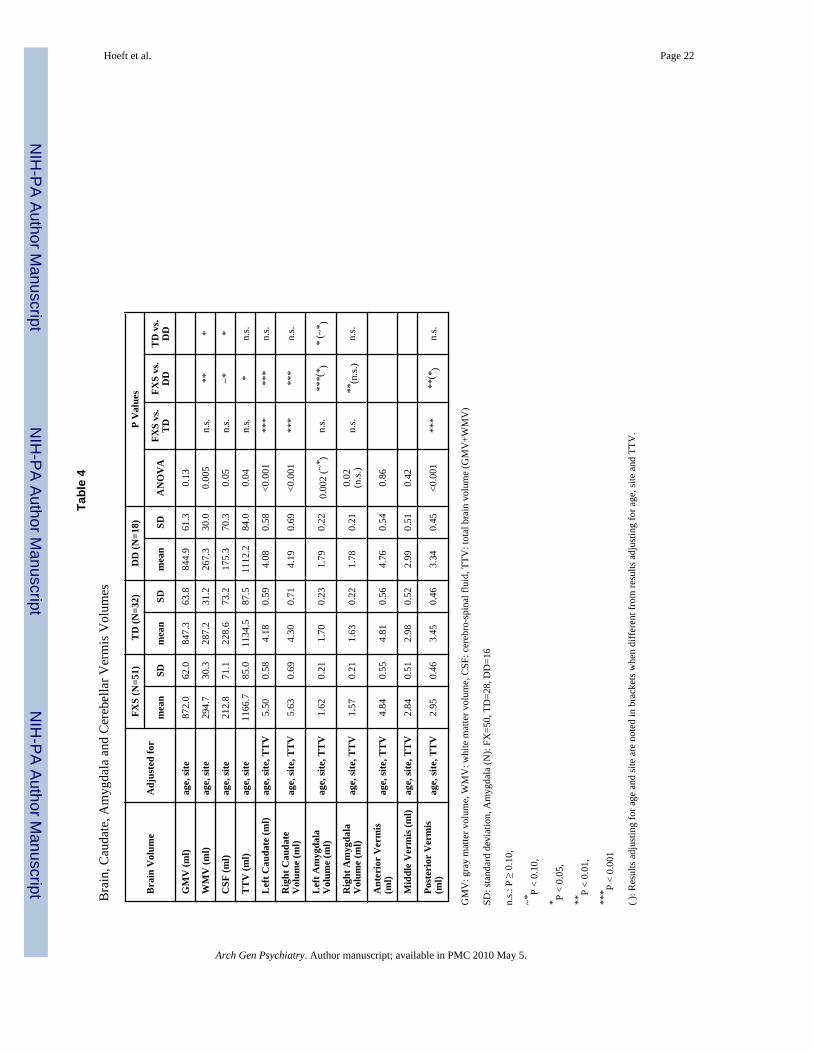
Hoeft et al. Page 22
Tabl
e 4
Bra
in, C
auda
te, A
myg
dala
and
Cer
ebel
lar V
erm
is V
olum
es
Bra
in V
olum
eA
djus
ted
for
FXS
(N=5
1)T
D (N
=32)
DD
(N=1
8)P
Val
ues
mea
nSD
mea
nSD
mea
nSD
AN
OV
AFX
S vs
.T
DFX
S vs
.D
DT
D v
s.D
D
GM
V (m
l)ag
e, si
te87
2.0
62.0
847.
363
.884
4.9
61.3
0.13
WM
V (m
l)ag
e, si
te29
4.7
30.3
287.
231
.226
7.3
30.0
0.00
5n.
s.**
*
CSF
(ml)
age,
site
212.
871
.122
8.6
73.2
175.
370
.30.
05n.
s.~*
*
TT
V (m
l)ag
e, si
te11
66.7
85.0
1134
.587
.511
12.2
84.0
0.04
n.s.
*n.
s.
Lef
t Cau
date
(ml)
age,
site
, TT
V5.
500.
584.
180.
594.
080.
58<0
.001
***
***
n.s.
Rig
ht C
auda
teV
olum
e (m
l)ag
e, si
te, T
TV
5.63
0.69
4.30
0.71
4.19
0.69
<0.0
01**
***
*n.
s.
Lef
t Am
ygda
laV
olum
e (m
l)ag
e, si
te, T
TV
1.62
0.21
1.70
0.23
1.79
0.22
0.00
2 (~
* )n.
s.**
*(* )
* (~
* )
Rig
ht A
myg
dala
Vol
ume
(ml)
age,
site
, TT
V1.
570.
211.
630.
221.
780.
210.
02(n
.s.)
n.s.
**(n
.s.)
n.s.
Ant
erio
r V
erm
is(m
l)ag
e, si
te, T
TV
4.84
0.55
4.81
0.56
4.76
0.54
0.86
Mid
dle
Ver
mis
(ml)
age,
site
, TT
V2.
840.
512.
980.
522.
990.
510.
42
Post
erio
r V
erm
is(m
l)ag
e, si
te, T
TV
2.95
0.46
3.45
0.46
3.34
0.45
<0.0
01**
***
(*)
n.s.
GM
V: g
ray
mat
ter v
olum
e, W
MV
: whi
te m
atte
r vol
ume,
CSF
: cer
ebro
-spi
nal f
luid
, TTV
: tot
al b
rain
vol
ume
(GM
V+W
MV
)
SD: s
tand
ard
devi
atio
n, A
myg
dala
(N):
FX=5
0, T
D=2
8, D
D=1
6
n.s.:
P ≥
0.1
0,
~*P
< 0.
10,
* P <
0.05
,
**P
< 0.
01,
*** P
< 0.
001
( ): R
esul
ts a
djus
ting
for a
ge a
nd si
te a
re n
oted
in b
rack
ets w
hen
diff
eren
t fro
m re
sults
adj
ustin
g fo
r age
, site
and
TTV
.
Arch Gen Psychiatry. Author manuscript; available in PMC 2010 May 5.