Acreage response of rice in Côte D'ivoire: Macro-level response and some policy implications
10
International Journal of Agricultural Policy and Research Vol.1 (9), pp. 288-297, November 2013 Available online at http://www.journalissues.org/journals-home.php?id=1 © 2013 Journal Issues ISSN 2350-1561 Original Research Paper Acreage response of rice in Côte D’ivoire: Macro-level response and some policy implications Accepted 26 October, 2013 Boansi David Center for Development Research (ZEF), University of Bonn, Germany. Author E-mail: [email protected] Tel.: +4915218152877 To help inform policy decisions on how current and future supply deficits in rice for Côte d’Ivoire can be bridged, the current study estimated the acreage response of rice to some selected price and non-price factors over the period 1966-2009. Coefficients of the acreage response model were estimated through the Ordinary Least Squares (OLS) and tested for appropriate standard Gaussian properties. Results of the study shows that, Cote d’Ivoire could improve its rice supply by employing measures to increase land area under cultivation, ensure harmonization between yield and area cultivated, reduce labor shortages, address adverse fiscal effects of the exchange rate system and promote stakeholder participation in development of the rice supply chain to help address current inefficiencies in the marketing and distribution network. A surprising discovery from the current study was that rice farmers in the country respond more to changes in producer price of maize than to producer price of rice. Key words: Labour shortage, marketing system, supply deficit, co-integration INTRODUCTION Côte d’Ivoire possess significant land area suitable for cultivation of rice, experienced farmers, high-yielding rice varieties with good sensory properties and satisfactory economic and institutional environment among others (MoA, 2012). In spite of all these advantages, the country is exposed to food insecurity for rice by virtue of its strong dependence on import. Self-sufficiency of the country in rice has generally remained below 50% (according to estimates of FAO, FAOSTAT 2013) for more than two decades regardless of various aggressive policy measures that have been devised and implemented to develop the local rice industry. As of the year 2012, national rice production (703,566 MT milled equivalent) met less than 40% of the domestic consumption needs (1,825,733 MT) with 1,222,207 MT deficiency bridged through imports (MoA, 2012). Production and consumption forecast as published by the Ministry of Agriculture and displayed in Figure (1) indicates that in case of the absence of comprehensive action, the country will have to import 1,731,583 MT of rice by the year 2020 to bridge the anticipated gap in rice supply. This would result in major outflow of foreign exchange and expose the country to shocks on the world market due to uncertainties in future supply and the volatile nature of prices on the market. To help inform future policy decisions in meeting the expected deficit in supply, there is a need to identify and appropriately address the significant drivers of local rice supply. Due to declines observed in area cultivated of rice in the country since the year 1995 . The current study would be focused on estimating acreage response as a dimension of supply. Emphasis on acreage cultivated is of significance for identification of the limitations of area expansion and boosters if any. Findings from this study could be useful to policy makers, prospective investors and in agribusiness planning. Rice policy and government assistance Rice consumption in Côte d’Ivoire has been reported to account for more than half of the cereal intake. It is a major staple food consumed in the country, and the need to reach food security and attain self-sufficiency has been the focus of the country’s agricultural development policies. In its pursuit of providing food security and reducing poverty in
Transcript of Acreage response of rice in Côte D'ivoire: Macro-level response and some policy implications
International Journal of Agricultural Policy and Research Vol.1 (9), pp. 288-297, November 2013 Available online at http://www.journalissues.org/journals-home.php?id=1 © 2013 Journal Issues ISSN 2350-1561
Original Research Paper
Acreage response of rice in Côte D’ivoire: Macro-level response and some policy implications
Accepted 26 October, 2013
Boansi David
Center for Development Research (ZEF), University of Bonn,
Germany.
Author E-mail: [email protected]
Tel.: +4915218152877
To help inform policy decisions on how current and future supply deficits in rice for Côte d’Ivoire can be bridged, the current study estimated the acreage response of rice to some selected price and non-price factors over the period 1966-2009. Coefficients of the acreage response model were estimated through the Ordinary Least Squares (OLS) and tested for appropriate standard Gaussian properties. Results of the study shows that, Cote d’Ivoire could improve its rice supply by employing measures to increase land area under cultivation, ensure harmonization between yield and area cultivated, reduce labor shortages, address adverse fiscal effects of the exchange rate system and promote stakeholder participation in development of the rice supply chain to help address current inefficiencies in the marketing and distribution network. A surprising discovery from the current study was that rice farmers in the country respond more to changes in producer price of maize than to producer price of rice. Key words: Labour shortage, marketing system, supply deficit, co-integration
INTRODUCTION Côte d’Ivoire possess significant land area suitable for cultivation of rice, experienced farmers, high-yielding rice varieties with good sensory properties and satisfactory economic and institutional environment among others (MoA, 2012). In spite of all these advantages, the country is exposed to food insecurity for rice by virtue of its strong dependence on import. Self-sufficiency of the country in rice has generally remained below 50% (according to estimates of FAO, FAOSTAT 2013) for more than two decades regardless of various aggressive policy measures that have been devised and implemented to develop the local rice industry.
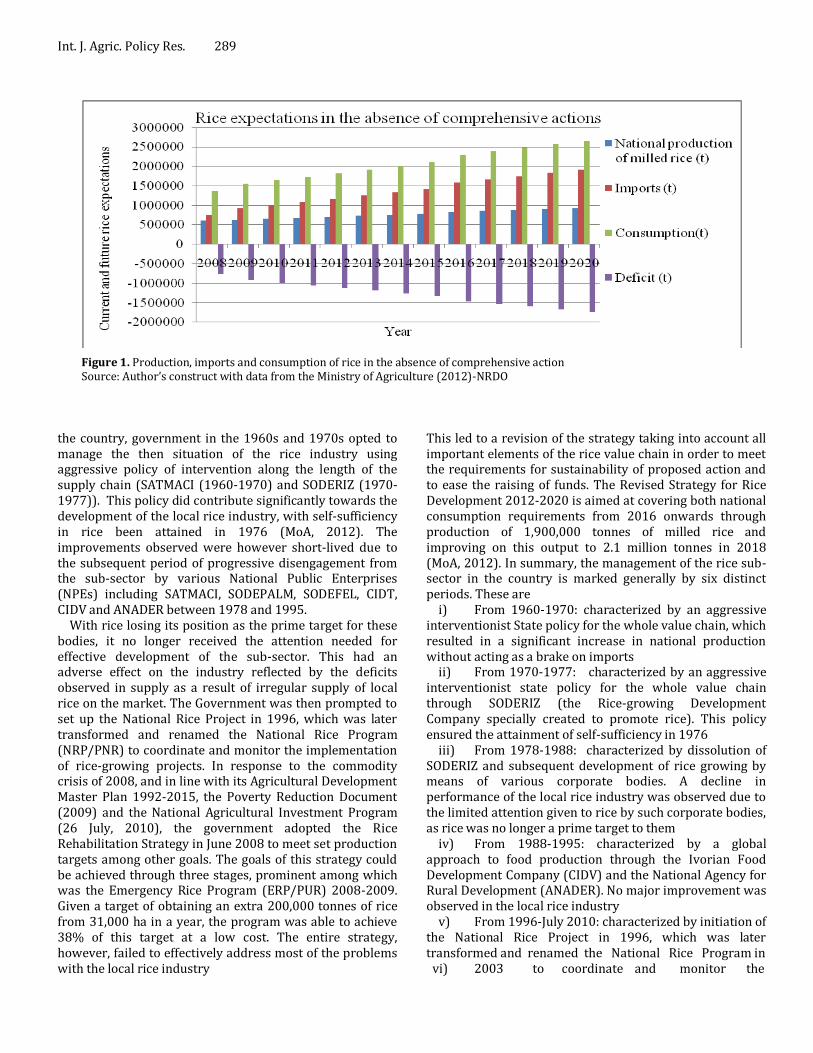
As of the year 2012, national rice production (703,566 MT milled equivalent) met less than 40% of the domestic consumption needs (1,825,733 MT) with 1,222,207 MT deficiency bridged through imports (MoA, 2012). Production and consumption forecast as published by the Ministry of Agriculture and displayed in Figure (1) indicates that in case of the absence of comprehensive action, the country will have to import 1,731,583 MT of rice by the year 2020 to bridge the anticipated gap in rice supply.
This would result in major outflow of foreign exchange
and expose the country to shocks on the world market due to uncertainties in future supply and the volatile nature of prices on the market. To help inform future policy decisions in meeting the expected deficit in supply, there is a need to identify and appropriately address the significant drivers of local rice supply. Due to declines observed in area cultivated of rice in the country since the year 1995 . The current study would be focused on estimating acreage response as a dimension of supply. Emphasis on acreage cultivated is of significance for identification of the limitations of area expansion and boosters if any. Findings from this study could be useful to policy makers, prospective investors and in agribusiness planning.
Rice policy and government assistance
Rice consumption in Côte d’Ivoire has been reported to account for more than half of the cereal intake. It is a major staple food consumed in the country, and the need to reach food security and attain self-sufficiency has been the focus of the country’s agricultural development policies. In its pursuit of providing food security and reducing poverty in
Int. J. Agric. Policy Res. 289
Figure 1. Production, imports and consumption of rice in the absence of comprehensive action Source: Author’s construct with data from the Ministry of Agriculture (2012)-NRDO
the country, government in the 1960s and 1970s opted to manage the then situation of the rice industry using aggressive policy of intervention along the length of the supply chain (SATMACI (1960-1970) and SODERIZ (1970-1977)). This policy did contribute significantly towards the development of the local rice industry, with self-sufficiency in rice been attained in 1976 (MoA, 2012). The improvements observed were however short-lived due to the subsequent period of progressive disengagement from the sub-sector by various National Public Enterprises (NPEs) including SATMACI, SODEPALM, SODEFEL, CIDT, CIDV and ANADER between 1978 and 1995.
With rice losing its position as the prime target for these bodies, it no longer received the attention needed for effective development of the sub-sector. This had an adverse effect on the industry reflected by the deficits observed in supply as a result of irregular supply of local rice on the market. The Government was then prompted to set up the National Rice Project in 1996, which was later transformed and renamed the National Rice Program (NRP/PNR) to coordinate and monitor the implementation of rice-growing projects. In response to the commodity crisis of 2008, and in line with its Agricultural Development Master Plan 1992-2015, the Poverty Reduction Document (2009) and the National Agricultural Investment Program (26 July, 2010), the government adopted the Rice Rehabilitation Strategy in June 2008 to meet set production targets among other goals. The goals of this strategy could be achieved through three stages, prominent among which was the Emergency Rice Program (ERP/PUR) 2008-2009. Given a target of obtaining an extra 200,000 tonnes of rice from 31,000 ha in a year, the program was able to achieve 38% of this target at a low cost. The entire strategy, however, failed to effectively address most of the problems with the local rice industry
This led to a revision of the strategy taking into account all important elements of the rice value chain in order to meet the requirements for sustainability of proposed action and to ease the raising of funds. The Revised Strategy for Rice Development 2012-2020 is aimed at covering both national consumption requirements from 2016 onwards through production of 1,900,000 tonnes of milled rice and improving on this output to 2.1 million tonnes in 2018 (MoA, 2012). In summary, the management of the rice sub-sector in the country is marked generally by six distinct periods. These are
i) From 1960-1970: characterized by an aggressive interventionist State policy for the whole value chain, which resulted in a significant increase in national production without acting as a brake on imports
ii) From 1970-1977: characterized by an aggressive interventionist state policy for the whole value chain through SODERIZ (the Rice-growing Development Company specially created to promote rice). This policy ensured the attainment of self-sufficiency in 1976
iii) From 1978-1988: characterized by dissolution of SODERIZ and subsequent development of rice growing by means of various corporate bodies. A decline in performance of the local rice industry was observed due to the limited attention given to rice by such corporate bodies, as rice was no longer a prime target to them
iv) From 1988-1995: characterized by a global approach to food production through the Ivorian Food Development Company (CIDV) and the National Agency for Rural Development (ANADER). No major improvement was observed in the local rice industry
v) From 1996-July 2010: characterized by initiation of the National Rice Project in 1996, which was later transformed and renamed the National Rice Program in
vi) 2003 to coordinate and monitor the
Boansi 290
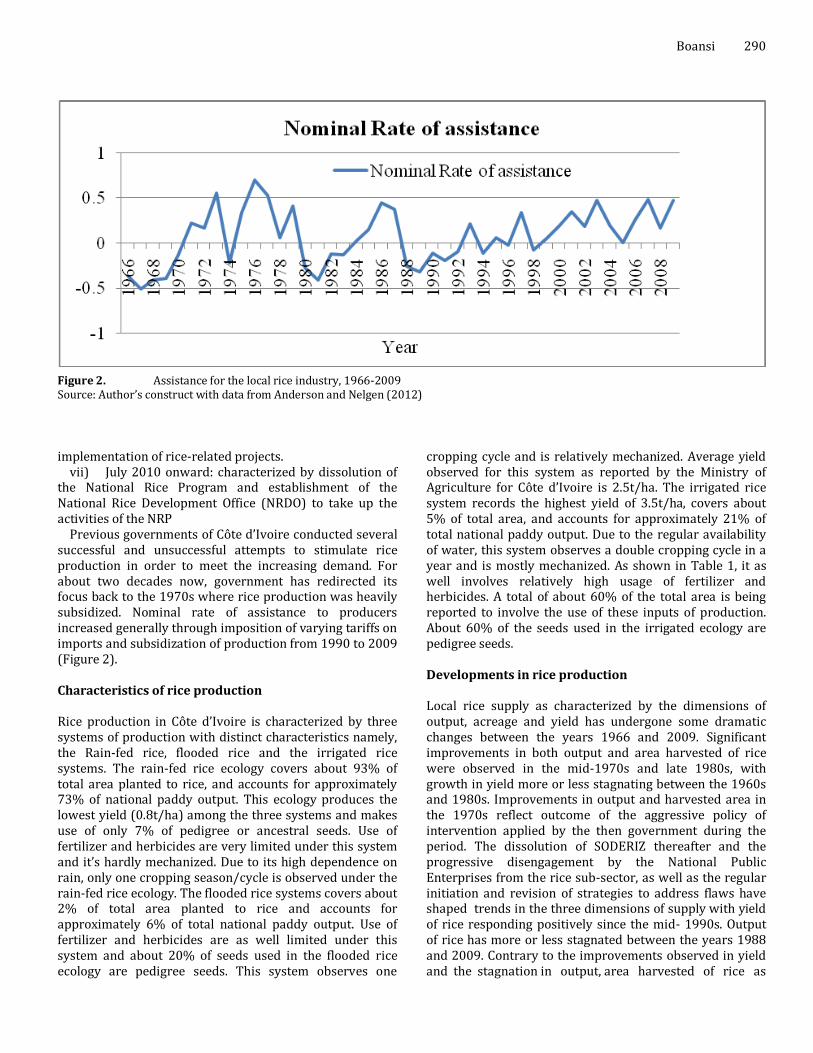
Figure 2. Assistance for the local rice industry, 1966-2009 Source: Author’s construct with data from Anderson and Nelgen (2012)
implementation of rice-related projects.
vii) July 2010 onward: characterized by dissolution of the National Rice Program and establishment of the National Rice Development Office (NRDO) to take up the activities of the NRP
Previous governments of Côte d’Ivoire conducted several successful and unsuccessful attempts to stimulate rice production in order to meet the increasing demand. For about two decades now, government has redirected its focus back to the 1970s where rice production was heavily subsidized. Nominal rate of assistance to producers increased generally through imposition of varying tariffs on imports and subsidization of production from 1990 to 2009 (Figure 2). Characteristics of rice production Rice production in Côte d’Ivoire is characterized by three systems of production with distinct characteristics namely, the Rain-fed rice, flooded rice and the irrigated rice systems. The rain-fed rice ecology covers about 93% of total area planted to rice, and accounts for approximately 73% of national paddy output. This ecology produces the lowest yield (0.8t/ha) among the three systems and makes use of only 7% of pedigree or ancestral seeds. Use of fertilizer and herbicides are very limited under this system and it’s hardly mechanized. Due to its high dependence on rain, only one cropping season/cycle is observed under the rain-fed rice ecology. The flooded rice systems covers about 2% of total area planted to rice and accounts for approximately 6% of total national paddy output. Use of fertilizer and herbicides are as well limited under this system and about 20% of seeds used in the flooded rice ecology are pedigree seeds. This system observes one
cropping cycle and is relatively mechanized. Average yield observed for this system as reported by the Ministry of Agriculture for Côte d’Ivoire is 2.5t/ha. The irrigated rice system records the highest yield of 3.5t/ha, covers about 5% of total area, and accounts for approximately 21% of total national paddy output. Due to the regular availability of water, this system observes a double cropping cycle in a year and is mostly mechanized. As shown in Table 1, it as well involves relatively high usage of fertilizer and herbicides. A total of about 60% of the total area is being reported to involve the use of these inputs of production. About 60% of the seeds used in the irrigated ecology are pedigree seeds. Developments in rice production Local rice supply as characterized by the dimensions of output, acreage and yield has undergone some dramatic changes between the years 1966 and 2009. Significant improvements in both output and area harvested of rice were observed in the mid-1970s and late 1980s, with growth in yield more or less stagnating between the 1960s and 1980s. Improvements in output and harvested area in the 1970s reflect outcome of the aggressive policy of intervention applied by the then government during the period. The dissolution of SODERIZ thereafter and the progressive disengagement by the National Public Enterprises from the rice sub-sector, as well as the regular initiation and revision of strategies to address flaws have shaped trends in the three dimensions of supply with yield of rice responding positively since the mid- 1990s. Output of rice has more or less stagnated between the years 1988 and 2009. Contrary to the improvements observed in yield and the stagnation in output, area harvested of rice as

Int. J. Agric. Policy Res. 291
Table 1.Characteristics of the three rice cropping systems
Indicator Rainfed rice Flooded rice Irrigated rice Area planted About 600,000 ha, or 93% of total area About 15,000ha or 2% of total area 35,000 ha or 5% of total area Average yield 0.8t/ha 2.5t/ha 3.5t/ha Number of cycles/year 1 1 2 Production About 480,000 t of paddy About 37,000 t of paddy About 140,000 t of paddy Use of pedigree seed 7% of total area 20% of total area 60% of total area Use of fertilizer and herbicides Low usage of herbicides and fertilizers 60% of total area Mechanization Hardly any tractors Use of tractors, rotary tillers and threshers Development services ANADER, Agricultural Professional Organizations (OPA), NGOs Producers’ organizations 44 Cooperatives, two Union of Cooperatives, one National Association (ANARIZCI), one Development
Management Council (CGA) for each developed scheme
Source: MoA (2012), NRDO – Côte d’Ivoire: NRDS 2012-2020
Figure 3. Developments in output, acreage and yield of rough rice Source: Author’s construct with data from IRRI- (World Rice Statistics, FAO data)
shown in Figure (3), has declined dramatically from 650,000 hectares for the year 1995 to 377,000 hectares in the year 2009 (a decrease of approximately 42%). This observation has been attributed to migration out of rural areas as a result of political instability in Côte d’Ivoire and to unfavorable rainfall distribution (Rakotoarisoa, 2006). In addition, this could be due to security effects from the land tenure system in the country. With output stagnating between 1988 and 2009 despite the improvements observed in yield, it is believed that bridging of the anticipated deficit in future supply would require the development and appropriate implementation of policies along with improvements in yield to put more land under cultivation. Role of rice in economic development of Côte D’ivoire Rice, through production, processing and marketing, serves as an important element in the fight against rural poverty in
Côte d’Ivoire. It is a source of livelihood through production to over 2 million growers (MoA, 2012). It contributes significantly to sustenance of most households who depend on it through processing and marketing. Local rice production serves as a driver for economic development through its gradual substitution of imports, thereby ensuring the reservation of a portion of foreign exchange that could have been drained through imports. Such reserves could be invested in other vital areas to help promote food security and reduce poverty in the country. Literature review For over four decades various theories have been developed, adapted and applied by economists to explain the dynamics of supply in agriculture on a broader perspective and its sub-sectors in the narrow view. Ideally, supply function in economic theory according to Bingxen and Shenggen (2009) is estimated directly on the

assumption in which the basic determinants of market supply of a given commodity are inputs and output prices and the state of technology. Ahmed and Siddiqui (1994) claimed that supply is considered as a function of output and input prices, together with quasi-fixed inputs and supply shifters like technical change and policy intervention. Development of rice production depends to a large extent on the biophysical and socio-economic environments (Molua, 2010). Defoer et al., (2004) mentioned three major options for increasing production of rice including: area expansion, increase in cropping intensity and increase in yield.
Supply response is equivalent to the response of acreage under cultivation to changes in economic and non-economic factors (Cummings, 1975; Holt, 1999). Mahmood et al., (2007) stated that paddy planted area is a function of a decrease in planted area, yield, and paddy price. Planned supply has a positive association with own producer price, but a negative association with prices of competitive crops and structural breaks related to changes in the economic systems (Abou-Talb and Bagawy, 2008). Furthermore, the supply of “Irri” and “Basmati” rice has been reported to be positively dependent on lagged harvested area of rice (Nosheen et al., 2011). In effort to identify the economic factors affecting rice production in Thailand, Sachchamarga and Williams (2004) found out that area planted to rice is more responsive to changes in area planted in the previous years, the amount of rainfall and the availability of agricultural labor than to changes in paddy rice prices. Gulati and Tim (1999) observed that the price factor in a given supply response model is not a significant variable explaining area changes.
According to Dercon (1993), however, prices are the general conduit through which economic policies are expected to affect agricultural variables such as output, supply, exports and income. Analyzing supply response to changing prices is, therefore, a crucial element in assessing the effects of increasing openness of the economy. In estimating agricultural responses to prices in sub-Saharan African countries, Bond (1983) showed that supply response to prices do exist although they are relatively small. According to Badawi (2004) sustainable response of rice production systems depend on four major areas:
Government policy and commitment to the implementation of programs
Improved technology and better management of crops to maximize yield
External support for marketing inputs and outputs and
Farmer participation and acceptance of new technology
Various approaches were used for arriving at the conclusions drawn by the works acknowledged in this section including OLS estimation of static models, the Nerlove framework (Nerlove, 1958), the Autoregressive Distributed Lag or bound test (Pesaran et al., 2001) and co-
Boansi 292 integration analysis. The co-integration analysis approach was used in this study. Three main methods, namely the Engle-Granger Method (Engle-Granger, 1987), the Phillips-Ouliaris residual-based test (Phillips and Oualiaris, 1988) and Johansen’s procedure which builds co-integrated variables directly on maximum likelihood estimation method (Johansen and Juselius, 1998) have been identified for testing co-integration and related relationships. The Engle-Granger approach is the choice approach for this study. Although flawed by small-sample biases (Stock, 1987; Bannerjee et al., 1986), the Engle-Granger approach has the advantage of being intuitive and easy to perform (Ssekuma, 2011) Methods, data and model specification Secondary data on area cultivated to rice and other vital price and non-price variables (namely producer price of rice, producer price of maize, yield of rough rice, exchange rate, agricultural labor force, price of urea fertilizer, nominal rate of assistance and world price of rice and maize) were used to estimate parameters for the respective long- and short-run acreage response models in the current study. Data on all the variables were collected from the World Rice Statistics of IRRI and the agricultural production database of FAO (FAOSTAT). The nominal prices of rice and maize were deflated with the 2005-based consumer price index sourced from the IRRI website.
Time series data employed in estimation of the parameters according to Wei (2006) are flawed by two central properties of non-stationarity (unit root) and time volatility. Estimation of a regression involving the use of non-stationary time series data produces spurious results (Townsend, 2001). Such results are output of nonsense correlation between unrelated random walk (Yule, 1926). Non-stationarity, however, in a given set of time series data does not preclude equilibrium relationship among such series. A set of series HAt and RPt could be non-stationary at level, but with a linear combination between them being stationary. Whenever such a situation is witnessed, the variables are said to be co-integrated (Engle and Granger, 1987). By this, whenever two or more series are linked to form an equilibrium relationship that spans the long-run, then even though the series themselves are non-stationary, they move closely together over time and the difference between them remains constant. According to Harris and Sollis (2003), co-integration is an economic concept which mimics the existence of long-run equilibrium among economic time series, and for two variables to be co-integrated, they are usually expected to be integrated of the same order.
The Engle-Granger approach is a two-step estimation procedure. Given two time series data HAt and RPt of order I(1), the following co-integration relationship is specified
HAt = β0 + β1 RPt + ut ……………………………eq(1)
Int. J. Agric. Policy Res. 293
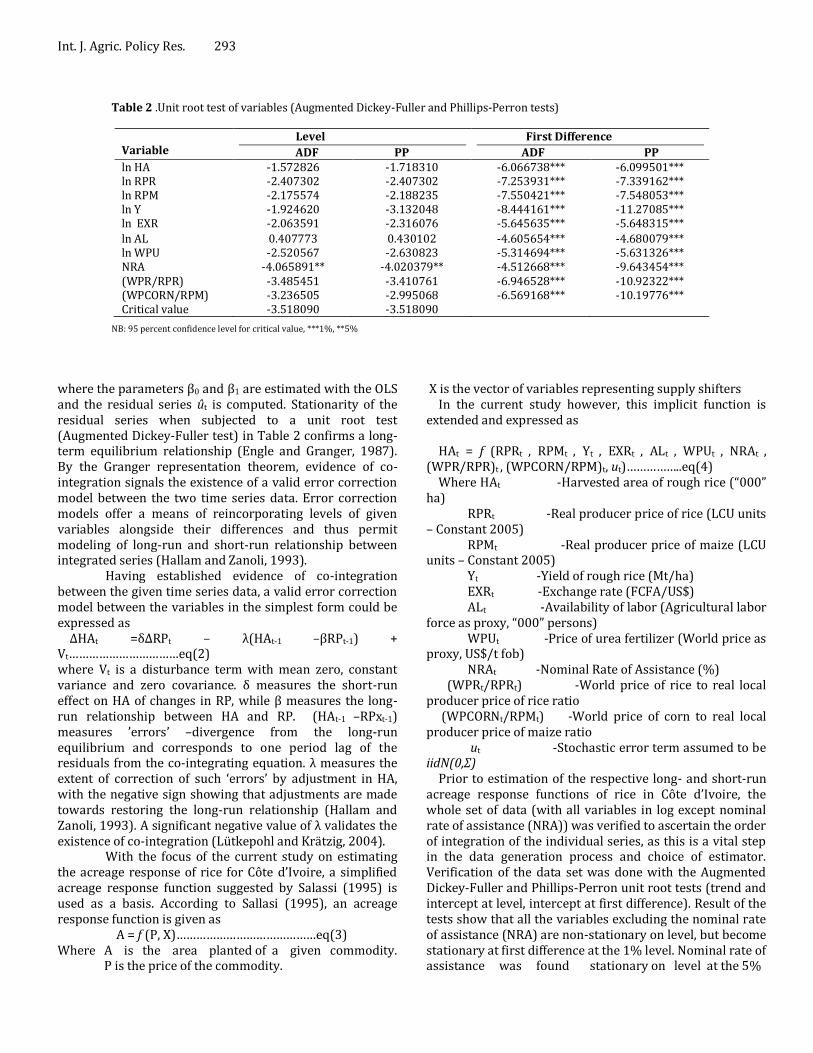
Table 2 .Unit root test of variables (Augmented Dickey-Fuller and Phillips-Perron tests)
Variable
Level
ADF PP
First Difference
ADF PP ln HA -1.572826 -1.718310 -6.066738*** -6.099501*** ln RPR -2.407302 -2.407302 -7.253931*** -7.339162*** ln RPM -2.175574 -2.188235 -7.550421*** -7.548053*** ln Y -1.924620 -3.132048 -8.444161*** -11.27085*** ln EXR -2.063591 -2.316076 -5.645635*** -5.648315***
ln AL 0.407773 0.430102 -4.605654*** -4.680079*** ln WPU -2.520567 -2.630823 -5.314694*** -5.631326*** NRA -4.065891** -4.020379** -4.512668*** -9.643454*** (WPR/RPR) -3.485451 -3.410761 -6.946528*** -10.92322*** (WPCORN/RPM) -3.236505 -2.995068 -6.569168*** -10.19776*** Critical value -3.518090 -3.518090
NB: 95 percent confidence level for critical value, ***1%, **5%
where the parameters β0 and β1 are estimated with the OLS and the residual series ût is computed. Stationarity of the residual series when subjected to a unit root test (Augmented Dickey-Fuller test) in Table 2 confirms a long-term equilibrium relationship (Engle and Granger, 1987). By the Granger representation theorem, evidence of co-integration signals the existence of a valid error correction model between the two time series data. Error correction models offer a means of reincorporating levels of given variables alongside their differences and thus permit modeling of long-run and short-run relationship between integrated series (Hallam and Zanoli, 1993).
Having established evidence of co-integration between the given time series data, a valid error correction model between the variables in the simplest form could be expressed as
ΔHAt =δΔRPt – λ(HAt-1 –βRPt-1) + Vt……………………………eq(2) where Vt is a disturbance term with mean zero, constant variance and zero covariance. δ measures the short-run effect on HA of changes in RP, while β measures the long-run relationship between HA and RP. (HAt-1 –RPxt-1) measures ’errors’ –divergence from the long-run equilibrium and corresponds to one period lag of the residuals from the co-integrating equation. λ measures the extent of correction of such ‘errors’ by adjustment in HA, with the negative sign showing that adjustments are made towards restoring the long-run relationship (Hallam and Zanoli, 1993). A significant negative value of λ validates the existence of co-integration (Lütkepohl and Krätzig, 2004).
With the focus of the current study on estimating the acreage response of rice for Côte d’Ivoire, a simplified acreage response function suggested by Salassi (1995) is used as a basis. According to Sallasi (1995), an acreage response function is given as
A = f (P, X)……………………………………eq(3) Where A is the area planted of a given commodity. P is the price of the commodity.
X is the vector of variables representing supply shifters In the current study however, this implicit function is
extended and expressed as HAt = f (RPRt , RPMt , Yt , EXRt , ALt , WPUt , NRAt ,
(WPR/RPR)t , (WPCORN/RPM)t, ut)……………..eq(4) Where HAt -Harvested area of rough rice (“000”
ha) RPRt -Real producer price of rice (LCU units
– Constant 2005) RPMt -Real producer price of maize (LCU
units – Constant 2005) Yt -Yield of rough rice (Mt/ha) EXRt -Exchange rate (FCFA/US$) ALt -Availability of labor (Agricultural labor
force as proxy, “000” persons) WPUt -Price of urea fertilizer (World price as
proxy, US$/t fob) NRAt -Nominal Rate of Assistance (%) (WPRt/RPRt) -World price of rice to real local
producer price of rice ratio (WPCORNt/RPMt) -World price of corn to real local
producer price of maize ratio ut -Stochastic error term assumed to be
iidN(0,Σ) Prior to estimation of the respective long- and short-run
acreage response functions of rice in Côte d’Ivoire, the whole set of data (with all variables in log except nominal rate of assistance (NRA)) was verified to ascertain the order of integration of the individual series, as this is a vital step in the data generation process and choice of estimator. Verification of the data set was done with the Augmented Dickey-Fuller and Phillips-Perron unit root tests (trend and intercept at level, intercept at first difference). Result of the tests show that all the variables excluding the nominal rate of assistance (NRA) are non-stationary on level, but become stationary at first difference at the 1% level. Nominal rate of assistance was found stationary on level at the 5%

Boansi 294
Table 3. Long-run and short-run estimates of acreage response of rice
Variables Short-run
Coefficients t-statistic
Long-run
Coefficients t-statistic Intercept -0.017063 -1.285180 -5.664506 -2.551074** ∆ ln HAt-1 0.300697 2.547896** ln RPRt ∆ ln RPRt
-0.024499
-0.309764
0.023708 0.251961
ln RPMt ∆ ln RPMt
-0.214052
-2.253907**
-0.211351 1.691980*
ln Yt ∆ ln Yt
-0.574389
-6.662467***
-0.860404 -9.381363***
ln EXRt ∆ ln EXRt
0.015976
0.179509
-0.258069 -3.392694***
ln ALt ∆ ln ALt
2.004337
3.784297***
1.708119 8.373778***
ln WPUt ∆ ln WPUt
0.141027
3.210788***
0.134001 2.243332**
NRA 0.018665 0.500459 -0.028655 -0.429275 ln (WPRt/RPRt) ∆ ln (WPRt/RPRt)
-0.037940
-0.639126
-0.097566 -1.147212
ln (WPCORNt/RPMt) ∆ ln (WPCORNt/RPMt)
-0.227938
-3.014933***
-0.146334 -1.267346
RESIDUAL (-1) -0.759117 -4.634475*** Adj. R2 F-statistic Prob (F-statistic) Log likelihood Durbin Watson Akaike info criterion Schwarz criterion Hannan-Quinn criter. Mean dependent var. S.E. of regression Jarque-Bera BG-LM Test (1), (2) Q-stat (1), (2) Arch Test Reset Test
0.646000 7.801734 0.000004 65.26560 2.192836 -2.536457 -2.039980 -2.354479 0.005392 0.060528 1.270283 (0.529860) 1.563419 (0.2212) ; 1.361128 (0.2728) 0.5253 (0.469) ; 1.6990 (0.428) 0.196682 (0.6599) 1.786366 (0.1918)
0.890708 39.93783 0.000000 53.17374 1.927645 -1.962443 -1.556945 -1.812065 5.977222 0.082207 0.825828 (0.661719) 0.011428 (0.9155); 0.289344 (0.7507) 0.0122 (0.912); 0.6732 (0.714) 0.114590 (0.7367) 2.182009 (0.1491)
significance level. The results of the unit root test therefore underscore the presence of unit root in all data series.
The acreage response functions were estimated for the long-run and short run effects using the Engle-Granger approach to co-integration. Nominal rate of assistance was included in the long-run equation to capture the effect of distortion through State intervention on rice supply in Côte d’Ivoire. Diagnostic tests for normality, serial correlation, structural stability and misspecification of the function through a Reset test were applied on both the long run and short-run estimates, and the result shows that the functions passed all the diagnostic tests. The Jarque-Bera values observed for both the long- and short-run estimates were below the critical values, thus, implying a normal distribution in the residuals for the respective equations. The Breusch-Godfrey serial correlation LM test and the Q-stat values confirmed the absence of first and second order serial correlation in the residuals of both the long- and
short-run equations, with the ARCH test confirming a homoscedastic nature of the residual series. The insignificant value for the Reset test observed for both the long-run and short-run equations reflect appropriate specification of the regression equations. RESULTS AND DISCUSSION Acreage cultivated to rice is driven in the long-run by real producer price of maize, yield of rough rice, exchange rate, availability of agricultural labour and price of urea fertilizer. In the short-run, however, it depends on area cultivated to rice in the previous year, real producer price of maize, yield of rough rice, availability of agricultural labor, price of urea fertilizer, and the ratio of world price of corn to real producer price of maize (Table 3).The effects of real producer price of rice, and the ratio of world rice price

Int. J. Agric. Policy Res. 295 to local producer price of rice were found to be insignificant in both the short and long run. In contrast to the finding of Dercon (1993) who suggested that prices are the general conduit affecting economic policies related to supply, this result indicated that area planted to rice is more responsive to changes in area planted in the previous years and availability of labour than to changes in paddy rice prices, which was confirmed by Sachcharmarga and Williams (2004). With incentives towards boosting local rice production in most West African countries including Côte d’Ivoire being import-restricting and price-oriented (Aker et al., 2011; Lançon and David-Benz, 2007), outcome of this investigation could, to a greater extent, preclude achievement of vital food security and self-sufficiency goals of the country. The insignificant response of rice farmers to own-price incentives could be attributed to the high cost of production, processing and marketing of paddy in the country, high cost of collection and transport which creates surtax on the producer price, the absence of guarantee mechanism for incentive prices and the failure of most buyers to observe contract terms (MoA, 2012).
Lagged area devoted for rice cultivation with a coefficient of 0.301 implies that the area cultivated to rice depends significantly on that one used for the same purpose in the previous year, and increases 1% in year t-1 with a likely increase of 0.301 in area cultivated for year t. This low figure reflects slow annual adjustments in harvested area of rice towards desired level. Shortage of farmers’ expertise, importance and fixed nature of vital inputs like machinery, problems with the availability of credit (with high interest rates) and land tenure system in most West African countries, tend to preclude rapid expansion of cultivated area. The 0.301 obtained for the current study falls within the short-run range of between 0.161 and 0.302 obtained by Cameroon (Molua, 2010). However, higher values of coefficient ranging between 0.516 and 0.871 have been reported for different rice varieties in different countries (Nosheen et al., 2011; Sachcharmarga and Williams, 2004; Mahmood et al., 2007; Yeong-sheng et al., 2009).
Real producer price of maize had a coefficient of -0.214 in the short-run and -0.211 in the long run, indicating that for a unit increase in the real producer price of maize, area cultivated to rice decreases by 0.214% in the short-run and 0.211% in the long run. With improvement of the rice sub-sector hindered due to inefficient and poor marketing systems which promotes poor transmission of increments in prices, as rationale beings and mostly risk averse in nature, rice farmers tend to pull resources out of rice production into maize production in times increasing maize prices. Unlike the maize sub-sector, the rice subsector has been reported to lack confirmed and regular buyers (MoA, 2012) and most buyers fail to observe contracts. This gives rice farmers’ limited incentive to expand their present fields and any increase in the price of competitive maize crop serves as vital avenues for making profit to meet household needs and vital production costs, as well as
making up for past losses.
A unit increase in yield of rice leads to a 0.574% decrease in area cultivated to rice in the short-run and 0.860% decrease in the long run. Contrary to the significant 0.351 coefficient observed by Mahmood et al., (2007) for lagged yield in Pakistan, but in line with the -0.245 observed by Yeong-sheng et al., (2009) for Malaysia, yield of rice in the current study was found to have a significant inverse association with area devoted for rice cultivation, and this result could be a reflection of consolidation and increasing efficiency of production to meet the anticipated gap in future supply deficit. , Increasing productivity of current fields without a corresponding increase in cultivated area would lead to stagnation in output or even a decline in rice cultivation. Increasing yields could be a great basis for farmers to increase their output by putting in place vital intensification measures along with increasing current field production. An increase in area and productivity however, depends on the land tenure system in the country. When the land tenure system prohibits rapid expansion in land area, farmers fail to respond appropriate to incentives from increasing productivity of their fields. Improvement in output (supply) could, therefore, be achieved by improving both yield and area, rather than increasing yield alone due to the significant inverse association observed in the current study.
A unit increase in the exchange rate leads to a 0.258% decrease in rice cultivation in the long run, which presumably lead to stimulation of exports. In addition, increasing price of importing competing basic foods like rice in Côte d’Ivoire, leads to increases in the price of imported intermediate inputs of production like pesticides, fertilizer, insecticides, and fungicides. High cost of imports induced by increasing exchange rate creates room for exploitation of opportunities on the local market by farmers. Since farmers in the country are mostly financially constrained (MoA, 2012) and uncertain about future changes in the market, they fail to exploit such benefits and to expand the current cultivated area likely due to increase in the price of intermediate inputs. Stimulation of exports by increasing exchange rate also enhances land diversion in favour of export-oriented crops (cash crops) which leads to increase in land cost assigned for rice production. Most farmers don't obtain major incentive to invest in land expansion when there is an opportunity for diversion to a more profitable venture.
Labor availability had coeffecients of 1.708 and 2.004 respectively in the long- and short-run, respectively, indicating that, an available unit increase increases rice field by 1.708% and 2.004% in the long- and short-run, respectively. This result affirms the importance of labor to rice cultivation in the country. These elastic responses indicate that shortage of labor, mostly as a result of migration from rural areas, political instability and chaos in the country is a major element for the dramatic decline in cultivated area. Abundancy in labor ceteris paribus leads to

a decrease in the cost of cultural practices such as timely weed control and harvesting. Enhancing rice production could be acieved by a decline in labor shortages rather than annual adjustments in real rice price. The coefficients for labor observed in the this study are in agreement with that oserved by Sachscharmarga and Williams (2004) in Thailand. This shows that rice production is more labor intensive in Côte d’Ivoire, and minimizing labor shortages could contribute to expansion in area devoted to rice cultivation and to stimulation of supply in the process.
Mixed significant signals were observed in the coefficients for price of urea fertilizer, persumably due to limited usage of fertilizer in the rain-fed ecology which accounts for about 93% of the total rice area, and to differences between the world and local price subsidized by government. Nominal rate of assistance offered by State intervention seems to have insignificant effect on acreage cultivated in both the long-run and short-run due to increase in intermediate input prices through secondary distortions induced by nominal rate of assistance of rice imports tariffs.
World price of corn to real producer price of maize ratio was observed to have a coefficeint of -0.228. This implies to a unit increase in this ratio leading to a significant 0.228% decrease in area grown with rice. Besides pulling of resources from rice production into maize production, an increase in this ratio stimulates increase in maize production not only for domestic production, but for exports. This incentive could lure more farmers to go into maize production in the short-run leading to significant decreases in the area harvested. With uncertainty in the local and global market, however, prices for agricultural commodities fluctuate, leading to a decreasing incentive for maize production. The coefficient observed in the current study is above those ones obtained by Molua (2010) for Cameroon, which reveals that farmers in Côte d’Ivoire respond more to price incentives on competitve field crop (maize in this case) than their Cameroonian counterparts
Area cultivated to rice as is expected to decrease significantly in the long run, the decrease in rice cultivation in the countries of West African region, reflects structural, major economic and biophysical challenges in the rice sub-sector. In the long run, a total of about 89.07% of variations observed in the area cultivated to rice in Côte d’Ivoire is explained by variables expressed in the implicit function of eq (4), whereas in the short-run 64.60% of such variations is explained by variables in the associated error correction model to eq (4). Approximately 76% of deviations from the long run equilibrium are restored in the current period, and the overall effects of all the variables on area cultivated in both the short- and long-runs are highly significant. CONCLUSIONS AND RECOMMENDATIONS Local rice output of Côte d’Ivoire has been more or less in
Boansi 296 stagnation in spite of increasing yields since 1995, due to decrease in cultivated area. Major policies were implemented in the country to help boost local rice output, but the gap between demand and supply has been widening since the early 1990s. In the absence of comprehensive action, the country is expected to face a deficit of 1,731,583Mt in rice supply by 2020 which may lead to a reduction in welfare via drainage of foreign exchange and food insecurity. To mitigate such deficit in supply, the current study estimated how area harvested to rice changes with changes in some selected price and non-price factors for Côte d’Ivoire. Results showed that, Cote d’Ivoire could improve its rice supply by putting in place measures to increase land area under cultivation, ensure harmonization between yield and area cultivated, reduce labor shortages, address significant adverse fiscal effects of the exchange rate system and promote stakeholder participation in the development of the rice supply chain to address current inefficiencies in the marketing and distribution network. REFERENCES Abou-Talb AEM, Begawy MAMKH (2008). Supply response
for some crops in Egypt: A Vector Error Correction Approach, J. Appl. Sci. Res., 4(12): 1647-1657.
Ahmed AM, Siddiqui R (1994). Supply response in Pakistan with “Endogenous” Technology. The Pakistan Dev. Rev. 33(4): 871-888.
Aker JC, Block S, Ramachandran V, Timmer PC (2011). West African Experience with the World Rice Crisis, 2007-2008. CGD Working Paper 242, Washington, D.C.: Center for Global Development. http://www.cgdev.org/content/publications/detail/1424823
Anderson K, Nelgen S (2012). Updated National and Global Agricultural Trade and Welfare Reduction Indexes, 1955 to 2010. World Bank, Washington DC, March
Badawi TA (2004). “Rice-based Production Systems for Food Security and Poverty Alleviation in the Near East and North Africa: New Challenges and Technological Opportunities.” Proceedings of FAO Rice Conference, Rome, Italy, 12-13 February 2004
Bannerjee A, Dolado JJ, Hendry DF, Smith GW (1986). Exploring equilibrium relationships in econometrics through static models: some Monte Carlo evidence. Oxford Bull. Econ. Stat. 48(3):253-277.
Bingxin Y, Shenggen F (2009). Rice production response in Cambodia. Contributed Paper prepared for presentation at the Int. Assoc. Agric. Econ. Conf., Beijing, China,pp. 16-22.
Bond M (1983). Agricultural responses to prices in Sub-Saharan African countries. IMF Staff Papers, 30: 3-4.
Cummings J (1975). The Supply Responsiveness of Indian Farmers in the Post-Independence Period: Major Cereal and Cash Crops: Indian J. Agric. Econ., 30(1):25-40.

Int. J. Agric. Policy Res. 297 Defoer T, Wopereis MCS, Jones MP, Lanҫon F, Erenstein O,
Guei RG (2004). Challenges and Technical Opportunities for Rice-based production systems for food security and poverty alleviation in Sub-Saharan Africa. Proceedings of FAO Rice Conference, Rome, Italy, pp.12-13 .
Dercon S (1993). Peasant Supply Response and Macroeconomic Policies: Cotton in Tanzania. J. Afri. Econ., 2(2):157-194.
Engle RF, Granger CWJ (1987). Cointegration and Error Correction: Representation, Estimation and Testing. Econometrica, 55:251-276.
FAOSTAT. (2013).Agricultural Production Database. Food and Agriculture Organization of the United Nations. (Online). Available: http://faostat.fao.org/site/703/default.aspx#ancor. Accessed on June 4, 2013
Gulati A Tim K (1999). Trade Liberalization and Indian Agriculture, Oxford University Press
Hallam D, Zanoli R (1993). Error Correction Models and Agricultural Supply Response. Eur. Rev. Agric. Econ. 20:151-166.
Harris R, Sollis R (2003). Applied time series modeling and forecasting. Durham University. John Wiley & Sons Ltd.
Holt M (1999). A Linear Approximate Acreage Allocation Model. J. Agric. Res. Econ., 24(2): 383-397.
IRRI(2013).International Rice Research Institute,. World Rice Statistics: (Online), Available :http://ricestat.irri.org:8080/wrs/. Accessed on June 4, 2013
Johansen R, Juselius K (1998). Testing structural hypothesis in multivariate cointegration of the PPP and the UIP for UK. Econ., 53:211-244
Lançon F, David-Benz H (2007). Rice Imports in West Africa: Trade Regimes and Food policy formulation. Pro-poor development in Low Income Countries. Food, Agriculture, Trade and Environment
Lütkepohl H, Krätzig M (2004). Applied time series econometrics. Cambridge University Press, New York
Mahmood MA, Sheikh AD, Kashif M (2007). Acreage supply response of rice in Punjab, Pakistan. J. Agric. Res., 45 (3):231-236
MoA (2012). Revised National Rice Development Strategy for the Côte d’Ivoire Rice Sector (NRDS) 2012-2020. National Rice Development Office (NRDO), Ministry of Agriculture Republic of Ivory Coast.
Molua EL (2010). Response of rice yields in Cameroon:
Some implications for Agricultural Price Policy. Libyan Agric. Res. Center J. Int. 1 (3): 182-194. Molua, E.L. (2010). Price and non-price determinants and acreage response of rice in Cameroon. ARPN J. Agric. Biol. Sci. 5(3):20-25. Nerlove M (1958). The Dynamics of Supply: Estimation of
Farm Supply Response to Price. John Hopkins University Press, Baltimore.
Nosheen M, Rahman AU, Ullah S, Igbal J (2011). Farmers’ response to price and other factors of rice in Pakistan. Afri. J. Agric. Res. 6 (12):2743-2748.
Pesaran MH, Shin Y, Smith R (2001). “Bounds testing approaches to the analysis of level relationships”. Journal of Applied Econometrics 16(3):289-326.
Phillips PCB, Ouliaris S (1998). Testing for cointegration using principal component methods. Economics Dynamic and Control, 12:205-230.
Rakotoarisoa MA (2006). Policy distortions in the segmented rice market. Markets, Trade and Institutions Division, IFPRI. MTID Discussion Paper No 94.
Sachchamarga K, Williams GW (2004). Economic factors affecting rice production in Thailand. Texas Agribusiness Market Research Center (TAMRC) International Research Report No. IM-03-04.
Salassi ME (1995). The responsiveness of U.S. rice acreage to price and production costs. J. Agric. Appl. Econ., 27:386-399.
Ssekuma R (2011). A study of cointegration models with applications. A thesis submitted in accordance with the requirements for the degree of Master of Commerce in the subject Statistics at the University of South Africa.
Stock JH (1987). Asymptotic properties of least squares estimators of cointegrating vectors. Econ. 55(4):1035-1056.
Townsend TP (2001). World Cotton Market Conditions. Beltwide Cotton Conference, Proceedings, Cotton Economics and Marketing Conference, National Cotton Council, Memphis, TN, pp. 401-405.
Wei WS (2006). Time series analysis: univariate and multivariate. Boston: Pearson.
Yeong-Sheng T, Suryani D, Aswani FMN, Nurjihan I (2009). Acreage response of rice: A case study in Malaysia. MPRA Paper No 15300. University Library of Munich, Germany.
Yule GU(1926). Why do we sometimes get nonsense correlation between time series? A study on sampling and the nature of time series. J. Royal Stat. Soc. 89: 1-64.
Cite this article as :Boansi D (2013).Acreage response of rice in Côte D’ivoire: Macro-level response and some policy implications. Int. J. Agric. Policy Res.1(9):288-297.