Living Conditions in Côte D'ivoire and Ghana, 1925–1985: What do Survey Data on Height Stature...
28
55 Economic History of Developing Regions Vol. 26 (2) 2011 ISSN Print 2078-0389, Online 2078-0397 © Economic History Society of Southern Africa pp 55–82 DOI: 10.1080/20780389.2011.625240 LIVING CONDITIONS IN CÔTE D’IVOIRE AND GHANA, 1925–1985: WHAT DO SURVEY DATA ON HEIGHT STATURE TELL US? Denis Cogneau and Léa Rouanet * * Denis Cogneau: Paris School of Economics – IRD, and UMR 225 DIAL. Email: [email protected] Léa Rounanet: Paris School of Economics and CREST. Email: [email protected] 1 We wish to thank the World Bank and the National Statistical Institutes of Côte d’Ivoire and Ghana, as well as DHS Data Archive of Macro International Inc., for making the survey data available for this research. A special thanks goes to Eric Denis and to the project e-Geopolis (Sedet, Université Paris-7 and CNRS) for providing data on cities growth, as well as to Ronan Balac (Université d’Amiens) and Rémi Jedwab (PSE) for data on cocoa production. We also thank two anonymous referees, as well as seminar participants at the Paris School of Economics, especially Sylvie Lambert, Gilles Postel-Vinay and Martin Ravallion, of the African economic history workshop at London School of Economics (May 6, 2009) and of the World Economic History Congress (August 3–7, 2009), especially Gareth Austin and Alexander Moradi. The usual disclaimer applies. ABSTRACT Survey data reveals that the pace of increase in height stature experienced by successive cohorts born in Côte d’Ivoire and Ghana during the late colonial period (1925–1960) is almost as high as the pace observed in France and Great Britain during the period 1875 to 1975, even when correcting for the bias arising from old-age shrinking. By contrast, the early post-colonial period (1960–1985) is characterised by stagnation or even reversion in Côte d’Ivoire and Ghana. This article argues that the selection effects linked for instance to measuring the height of women rather than men, mothers rather than women, and, most importantly, the interactions between height and mortality, cannot account for these figures. It then disaggregates these national trends by parental background and district of birth, and match individual data with district-level historical data on export crop (cocoa) expansion, urban density and colonial investment in health and education. Finally, it provides evidence that a significant share of the increase in height stature may be related to the early stages of urbanisation and cocoa production. JEL code: N37 Keywords: cocoa production, Cote d’Ivoire, Ghana, height surveys, living conditions, urbanisation 1 INTRODUCTION Not much is known about living conditions in Africa during the colonial period. While the comparative economics literature shows a renewed interest in long-term historical
-
Upload
independent -
Category
Documents
-
view
2 -
download
0
Transcript of Living Conditions in Côte D'ivoire and Ghana, 1925–1985: What do Survey Data on Height Stature...
55
Economic History of Developing Regions Vol. 26 (2) 2011ISSN Print 2078-0389, Online 2078-0397© Economic History Society of Southern Africa pp 55–82DOI: 10.1080/20780389.2011.625240
LIVING CONDITIONS IN CÔTE D’IVOIRE AND GHANA, 1925–1985: WHAT DO SURVEY DATA ON HEIGHT STATURE TELL US?
Denis Cogneau and Léa Rouanet*
* Denis Cogneau: Paris School of Economics – IRD, and UMR 225 DIAL. Email: [email protected] Léa Rounanet: Paris School of Economics and CREST. Email: [email protected]
1 We wish to thank the World Bank and the National Statistical Institutes of Côte d’Ivoire and Ghana, as well as DHS Data Archive of Macro International Inc., for making the survey data available for this research. A special thanks goes to Eric Denis and to the project e-Geopolis (Sedet, Université Paris-7 and CNRS) for providing data on cities growth, as well as to Ronan Balac (Université d’Amiens) and Rémi Jedwab (PSE) for data on cocoa production. We also thank two anonymous referees, as well as seminar participants at the Paris School of Economics, especially Sylvie Lambert, Gilles Postel-Vinay and Martin Ravallion, of the African economic history workshop at London School of Economics (May 6, 2009) and of the World Economic History Congress (August 3–7, 2009), especially Gareth Austin and Alexander Moradi. The usual disclaimer applies.
ABSTRACTSurvey data reveals that the pace of increase in height stature experienced by successive cohorts born in Côte d’Ivoire and Ghana during the late colonial period (1925–1960) is almost as high as the pace observed in France and Great Britain during the period 1875 to 1975, even when correcting for the bias arising from old-age shrinking. By contrast, the early post-colonial period (1960–1985) is characterised by stagnation or even reversion in Côte d’Ivoire and Ghana. This article argues that the selection effects linked for instance to measuring the height of women rather than men, mothers rather than women, and, most importantly, the interactions between height and mortality, cannot account for these figures. It then disaggregates these national trends by parental background and district of birth, and match individual data with district-level historical data on export crop (cocoa) expansion, urban density and colonial investment in health and education. Finally, it provides evidence that a significant share of the increase in height stature may be related to the early stages of urbanisation and cocoa production.
JEL code: N37Keywords: cocoa production, Cote d’Ivoire, Ghana, height surveys, living conditions, urbanisation
1 INTRODUCTIONNot much is known about living conditions in Africa during the colonial period. While the comparative economics literature shows a renewed interest in long-term historical
Book 1.indb 55 2011/12/13 12:10:41 PM
56
Denis Cogneau and Léa Rouanet
perspectives, empirical work trying to explain differences in development are most often bound to correlate some characteristics of the colonial intervention like European settlement, indigenous population density, slave trade, land administration, and so on with post-colonial outcomes. In contrast to broad-brush macroeconomic correlations (e.g., Acemoglu, Johnson and Robinson 2002), recent works prove that regional data can be a more interesting and relevant alternative (e.g., on India: Banerjee and Iyer 2005; on Western Africa: Huillery 2009; for a review: Nunn 2009). These works are in particular able to document colonial policies more precisely, plot their evolution across time, and explore a larger span of post-colonial welfare than only gross domestic product (GDP) per capita. They are still, however, confronted with the lack of data on outcomes during the colonial period; hence they still run the risk of compressing the history of different periods and paths, as underlined by Austin (2008). Correcting this is no easy task. Colonial archives offer one possible solution, particularly the data on army recruits (Austin, Baten and Moradi 2007 for Ghana; Moradi 2009 for Kenya).
Here another source is exploited: household surveys implemented since the 1980s, in which older cohorts were born, raised and received their education during the colonial era. In particular, the so-called Living Standard Measurement Surveys (LSMSs) for Côte d’Ivoire (1985–1988) and Ghana (1987–1989) are old enough to contain samples of reasonable sizes for cohorts born between 1925 and 1960; they also share the unique feature of having measured the height stature of both adult men and women. Additionally, they collected precious pieces of information on individuals’ parental background and district of birth. Unfortunately, these LSMSs were the first to be implemented in Africa, and were never repeated in their original form in other countries. Regarding height stature of adults, the best alternative source comes from Demographic and Health Surveys (DHSs) that have been implemented regularly in most African countries since the beginning of the 1990s; however, as they only measured the height of mothers between 15 and 49 years of age, they do not allow researchers to go back before 1945 (e.g., Moradi 2010).
The analysis of height stature in historical economics is now a well-established sub-field, since the work of Fogel (1993, 1994), Steckel (2008), Komlos and Baten (2004) and others with various kinds of sources (skeletons, military, slave trade, surveys). The study of human growth is also an active sub-field of human biology and physical anthropology (e.g., Bogin 2006). Height developments are related to improvements in living conditions during childhood, and above all to the quantity and quality of nutrition received. This variable is also assumed to reflect parental income, which then allows one to trace income and labour productivity evolutions across long periods of time. This series of inferences is, however, questioned by Deaton (2007), who points out that: (i) exposure to pathogens and hence the health infrastructure also come into play; and (ii) at high levels of child mortality height stature evolutions may be affected by large selection effects. In this article, we consider health infrastructure improvements by drawing from colonial administrative data on that aspect; we also thoroughly scrutinise the selection argument and try to assess its potential influence on our results.
We start from a very striking figure revealed by the survey data on Côte d’Ivoire and Ghana: a steep increase in the height stature of populations born during the late
Book 1.indb 56 2011/12/13 12:10:41 PM
57
Living conditions in Côte d’Ivoire and Ghana, 1925–1985
colonial period (1925–1960). Section 2 provides a brief presentation of both countries’ general features and patterns of structural change; it then establishes the basic height figures for both men and women, and further reveals a trend break in the post-colonial era for Côte d’Ivoire and Ghana. Section 3 scrutinises the robustness of these figures with respect to the survey used (LSMS vs. DHS), to the population considered (men, women, mothers), to potential selection effects linked to adult and child mortality, and most importantly, to shrinking at ages above forty. Section 4 then disaggregates these figures by parental background and district of birth. It provides evidence that a significant share of the increase in height stature during colonial times may be related to the structural changes of the economy and their correlated income gains: cocoa expansion, industry diversification and urbanisation. Section 5 concludes the article.
2 LIVING CONDITIONS AND HEIGHT STATURE GROWTH, 1925–1985
We start by describing the structural changes in Côte d’Ivoire and Ghana during the late colonial and early post-colonial periods. We then provide evidence on height stature growth that we wish to relate to those structural changes. In the third section, we ask whether the observed height trends are biased, by addressing the issues of selective mortality and shrinkage.
2.1 Structural changes in Côte d’Ivoire and GhanaThe colonies of Côte d’Ivoire and Gold Coast (present-day Ghana) were respectively created by the French and the British powers at the end of the nineteenth century, just after the end of the conquest wars against the Diula leader Samori Toure on the French side, and against the Ashanti Empire on the British side. The boundary between the two neighbouring colonies was definitely agreed in 1905. Ghana became an independent state in 1957, and Côte d’Ivoire followed in 1960. The geography of both countries is very much alike: the northern savannah region opposes the more populated and wealthier coastal South. Today, the two countries also share many common economic features, for example: they are the two leading cocoa producers in the world and they display relatively close population and income figures, even if their colonial and post-colonial trajectories have been very different, both in political and in economic terms.2
The timing of economic structural change was particularly different. Table 1 displays the evolutions of three variables that illustrate this difference of timing in the urbanisation process, in the expansion of the cocoa sector, and in the diversification of activities out of agriculture. The definitions of these variables and the data allowing their construction are presented in section 3 thereafter (see also the table footnotes).
2 Maddison’s (2003) figures are respectively 1 095 (Côte d’Ivoire) and 1 650 (Ghana) for PPP GDP per capita in 2008 (1990 international dollars), but African Development Indicators (World Bank 2010) figures are 1 526 and 1 342 for the same year (2000 international dollars). Total population is respectively 20.6 and 23.3 millions, urbanisation rate 49 and 50%.
Book 1.indb 57 2011/12/13 12:10:41 PM
58
Denis Cogneau and Léa Rouanet
Table 1: Urbanisation, cocoa production and diversification out of agriculture
Côte d’Ivoire Ghana
Year of birth Urban pop. Cocoa prod. Father Urban pop. Cocoa prod. Father
density(a) density(b) Farmer density(a) density(b) Farmer
1925–1934 0,09 0,13 96% 2,25 1,88 82%
1935–1944 0,28 0,26 92% 3,61 1,94 80%
1945–1954 1,35 0,26 89% 8,18 1,86 76%
1955–1964 5,34 0,74 78% 19,39 2,36 67%
1965–1974 15,24 1,14 63% 39,51 1,82 57%
1975–1984 28,84 2,00 57% 52,44 1,55 55%
Source: LSMS data matched with data on urban population (e-Geopolis) and on cocoa production per district, authors’ calculations. Missing data for urban population and cocoa production are exponentially or linearly interpolated.Note: Weighted averages over the population of native men and women aged 20 to 60 years old in the LSMS surveys. These weighted averages are used to compute the decompositions commented in sections 4.3 and 4.4.(a): Number of people living in cities per square kilometre in the district of birth at the time of birth, see
also text (section 4.1). (b): Cocoa production per square kilometre in the district of birth at the time of birth, see also text
(section 4.1).
According to our urbanisation data, Côte d’Ivoire had only two cities of more than 2 000 inhabitants in 1930, namely Abidjan and Bouake, with only 13 000 people living there. During the same period, Ghana had 18 cities, with an estimated population of 218 000 people. Rough total population estimates allow computing urbanisation rates as different as 0.5 and 7%. In 1960, Côte d’Ivoire had not yet caught up with Ghana with 750 000 versus 1 800 000 people living in urban areas, and an urbanisation rate of 21 versus 26%.3 In absolute numbers, this catching-up process was only achieved in 1980 when both countries reached around 3 million people living in urban areas. As Côte d’Ivoire has more land area, it still lagged behind in terms of urban population density, that is 23.8 versus 46.1, although the difference is exaggerated by the fact that a higher share of Côte d’Ivoire land area is not arable. Urbanisation rates ended up being very close.
Likewise, according to the cocoa data, Côte d’Ivoire was producing no more than 22 000 tons of cocoa beans in 1930, whereas Ghana was already producing around 10 times that number (212 500 tons).4 In the Gold Coast southern forest, cocoa production began in the 1880s near Accra and expanded westward reaching a first apex as early
3 Ghana’s population was twice the level of Côte d’Ivoire’s in 1960: 6.8 vs. 3.4 millions. Côte d’Ivoire caught up later, thanks to international migration inflows from Burkina Faso and Mali.
4 Jedwab (2011) shows that an important share of urbanisation can be causally linked to cocoa expansion in those two countries.
Book 1.indb 58 2011/12/13 12:10:41 PM
59
Living conditions in Côte d’Ivoire and Ghana, 1925–1985
as the mid-1930s. After 1938, production decreased a bit because of the combination of the swollen shoot virus epidemics, the Great Depression and World War II. In 1950, cocoa production came back to pre-crisis and pre-war levels, but barely increased afterward, and collapsed between 1960 and 1985 because of low producer prices and bad management.5 In Côte d’Ivoire, some cocoa production appeared at the border with Ghana in the 1920s, but it reached significant levels only during the 1950s. In 1960, Côte d’Ivoire’s cocoa output was still 3 times lower than Ghana’s: 93 000 versus 260 000 tons. Then cocoa production developed at exponential rates until 2000, here again moving westward, from the border with Ghana to the borders with Liberia and Guinea (Jedwab 2011).
A correlate of urbanisation is diversification out of agriculture. According to the surveys we utilise in this article, the share of individuals having farmers as fathers in the earliest cohorts (born 1925–1934) was higher by 14 percentage points in Côte d’Ivoire (96%) compared to Ghana (82%). Between 1930 and 1960, this share decreased by around 18 percentage points in Côte d’Ivoire, and by almost the same amount (15 points) in Ghana. As with urbanisation, convergence was achieved in the 1980s, the 1975 to 1984 cohorts displaying very close figures (57 and 55% respectively).
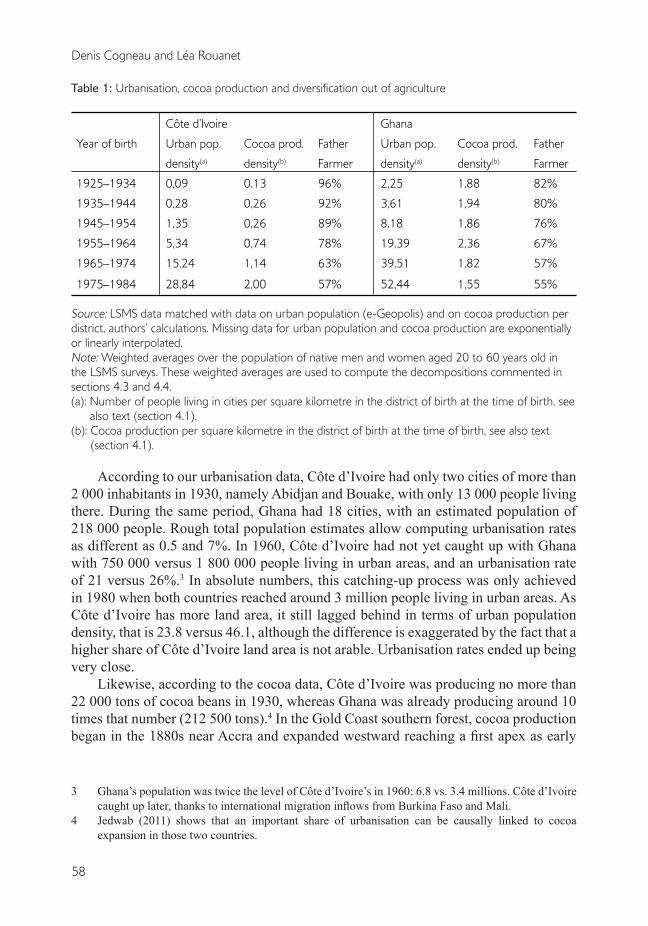
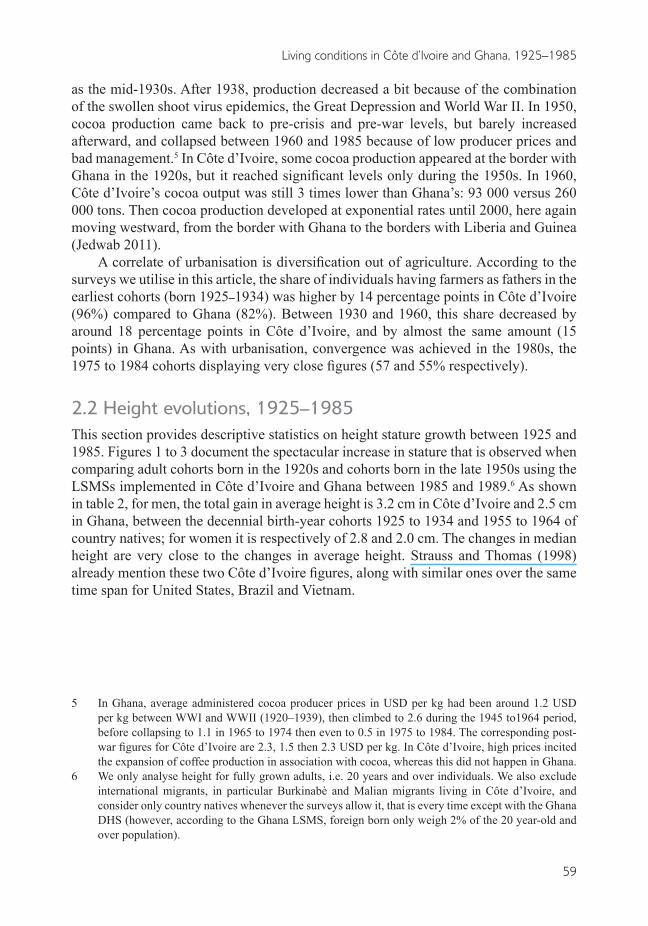
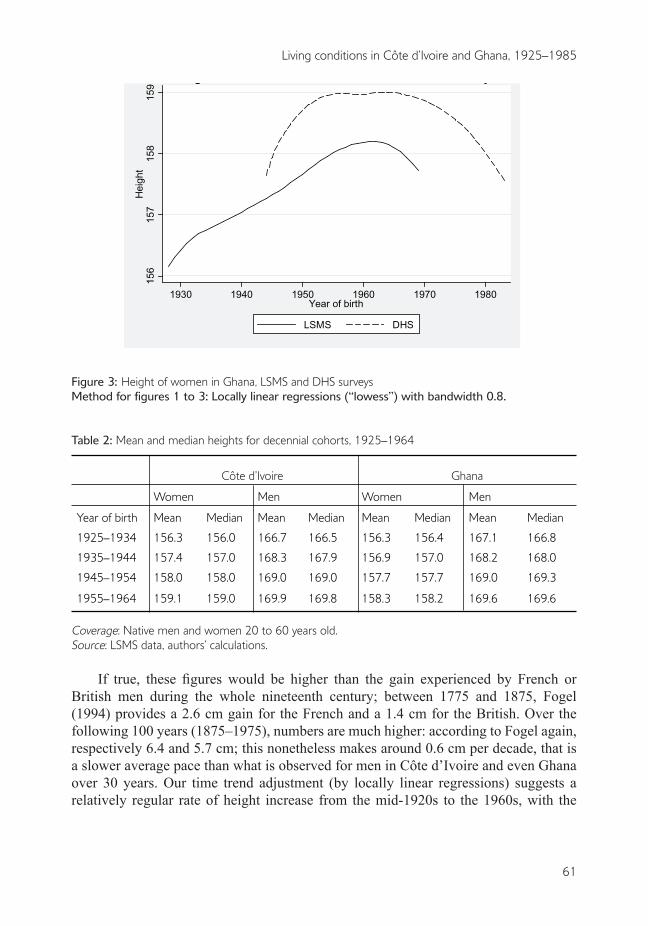
2.2 Height evolutions, 1925–1985This section provides descriptive statistics on height stature growth between 1925 and 1985. Figures 1 to 3 document the spectacular increase in stature that is observed when comparing adult cohorts born in the 1920s and cohorts born in the late 1950s using the LSMSs implemented in Côte d’Ivoire and Ghana between 1985 and 1989.6 As shown in table 2, for men, the total gain in average height is 3.2 cm in Côte d’Ivoire and 2.5 cm in Ghana, between the decennial birth-year cohorts 1925 to 1934 and 1955 to 1964 of country natives; for women it is respectively of 2.8 and 2.0 cm. The changes in median height are very close to the changes in average height. Strauss and Thomas (1998) already mention these two Côte d’Ivoire figures, along with similar ones over the same time span for United States, Brazil and Vietnam.
5 In Ghana, average administered cocoa producer prices in USD per kg had been around 1.2 USD per kg between WWI and WWII (1920–1939), then climbed to 2.6 during the 1945 to1964 period, before collapsing to 1.1 in 1965 to 1974 then even to 0.5 in 1975 to 1984. The corresponding post-war figures for Côte d’Ivoire are 2.3, 1.5 then 2.3 USD per kg. In Côte d’Ivoire, high prices incited the expansion of coffee production in association with cocoa, whereas this did not happen in Ghana.
6 We only analyse height for fully grown adults, i.e. 20 years and over individuals. We also exclude international migrants, in particular Burkinabè and Malian migrants living in Côte d’Ivoire, and consider only country natives whenever the surveys allow it, that is every time except with the Ghana DHS (however, according to the Ghana LSMS, foreign born only weigh 2% of the 20 year-old and over population).
Book 1.indb 59 2011/12/13 12:10:41 PM
60
Denis Cogneau and Léa Rouanet
Figure 1: Height of men in Côte d’Ivoire and Ghana, LSMSs
Figure 2: Height of women in Côte d’Ivoire, LSMS and DHS surveys
166
168
170
172
174
Hei
ght
1920 1930 1940 1950 1960 1970Year of birth
Côte d'ivoire Ghana
Height of men in Côte d'Ivoire and Ghana, LSMS surveys
156
157
158
159
Hei
ght
1920 1940 1960 1980Year of birth
LSMS DHS
Height of women in Côte d'Ivoire, LSMS and DHS surveys
Book 1.indb 60 2011/12/13 12:10:41 PM
61
Living conditions in Côte d’Ivoire and Ghana, 1925–1985
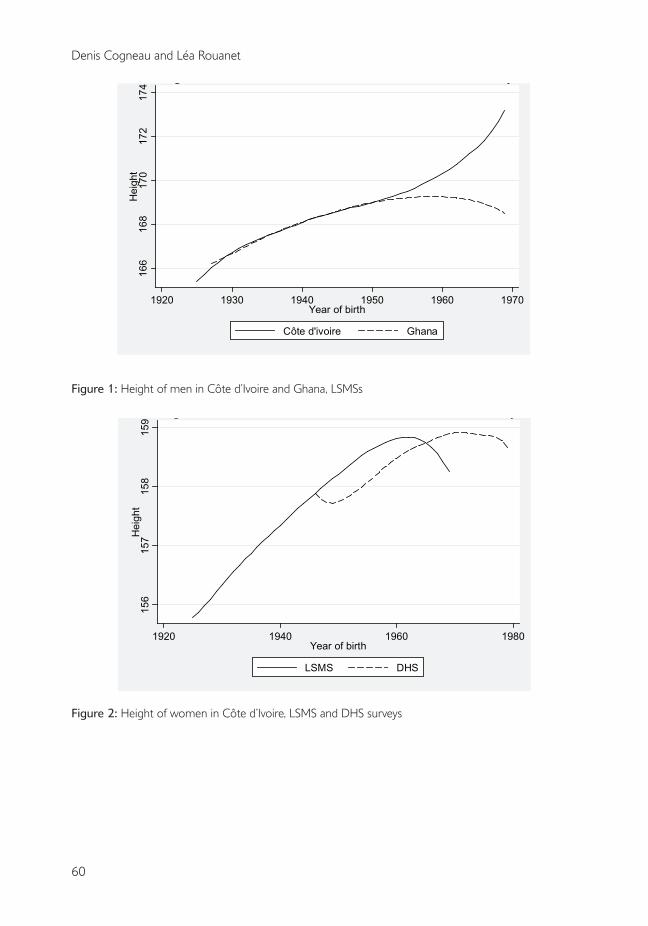
Figure 3: Height of women in Ghana, LSMS and DHS surveysMethod for figures 1 to 3: Locally linear regressions (“lowess”) with bandwidth 0.8.
Table 2: Mean and median heights for decennial cohorts, 1925–1964
Côte d’Ivoire Ghana
Women Men Women Men
Year of birth Mean Median Mean Median Mean Median Mean Median
1925–1934 156.3 156.0 166.7 166.5 156.3 156.4 167.1 166.8
1935–1944 157.4 157.0 168.3 167.9 156.9 157.0 168.2 168.0
1945–1954 158.0 158.0 169.0 169.0 157.7 157.7 169.0 169.3
1955–1964 159.1 159.0 169.9 169.8 158.3 158.2 169.6 169.6
Coverage: Native men and women 20 to 60 years old.Source: LSMS data, authors’ calculations.
If true, these figures would be higher than the gain experienced by French or British men during the whole nineteenth century; between 1775 and 1875, Fogel (1994) provides a 2.6 cm gain for the French and a 1.4 cm for the British. Over the following 100 years (1875–1975), numbers are much higher: according to Fogel again, respectively 6.4 and 5.7 cm; this nonetheless makes around 0.6 cm per decade, that is a slower average pace than what is observed for men in Côte d’Ivoire and even Ghana over 30 years. Our time trend adjustment (by locally linear regressions) suggests a relatively regular rate of height increase from the mid-1920s to the 1960s, with the
156
157
158
159
Hei
ght
1930 1940 1950 1960 1970 1980Year of birth
LSMS DHS
Height of women in Ghana, LSMS and DHS surveys
Book 1.indb 61 2011/12/13 12:10:41 PM
62
Denis Cogneau and Léa Rouanet
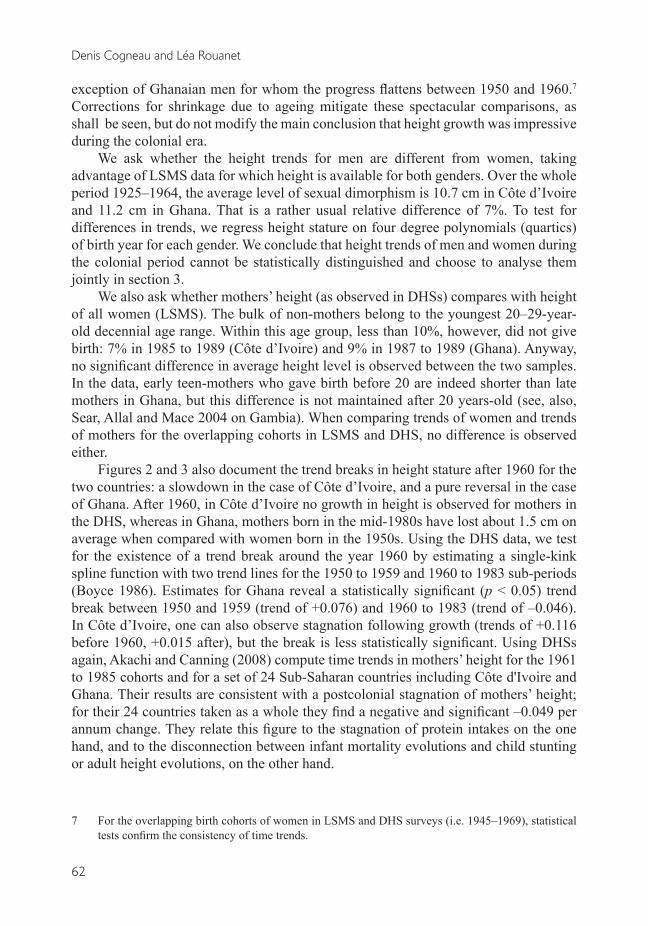
exception of Ghanaian men for whom the progress flattens between 1950 and 1960.7 Corrections for shrinkage due to ageing mitigate these spectacular comparisons, as shall be seen, but do not modify the main conclusion that height growth was impressive during the colonial era.
We ask whether the height trends for men are different from women, taking advantage of LSMS data for which height is available for both genders. Over the whole period 1925–1964, the average level of sexual dimorphism is 10.7 cm in Côte d’Ivoire and 11.2 cm in Ghana. That is a rather usual relative difference of 7%. To test for differences in trends, we regress height stature on four degree polynomials (quartics) of birth year for each gender. We conclude that height trends of men and women during the colonial period cannot be statistically distinguished and choose to analyse them jointly in section 3.
We also ask whether mothers’ height (as observed in DHSs) compares with height of all women (LSMS). The bulk of non-mothers belong to the youngest 20–29-year-old decennial age range. Within this age group, less than 10%, however, did not give birth: 7% in 1985 to 1989 (Côte d’Ivoire) and 9% in 1987 to 1989 (Ghana). Anyway, no significant difference in average height level is observed between the two samples. In the data, early teen-mothers who gave birth before 20 are indeed shorter than late mothers in Ghana, but this difference is not maintained after 20 years-old (see, also, Sear, Allal and Mace 2004 on Gambia). When comparing trends of women and trends of mothers for the overlapping cohorts in LSMS and DHS, no difference is observed either.
Figures 2 and 3 also document the trend breaks in height stature after 1960 for the two countries: a slowdown in the case of Côte d’Ivoire, and a pure reversal in the case of Ghana. After 1960, in Côte d’Ivoire no growth in height is observed for mothers in the DHS, whereas in Ghana, mothers born in the mid-1980s have lost about 1.5 cm on average when compared with women born in the 1950s. Using the DHS data, we test for the existence of a trend break around the year 1960 by estimating a single-kink spline function with two trend lines for the 1950 to 1959 and 1960 to 1983 sub-periods (Boyce 1986). Estimates for Ghana reveal a statistically significant (p < 0.05) trend break between 1950 and 1959 (trend of +0.076) and 1960 to 1983 (trend of –0.046). In Côte d’Ivoire, one can also observe stagnation following growth (trends of +0.116 before 1960, +0.015 after), but the break is less statistically significant. Using DHSs again, Akachi and Canning (2008) compute time trends in mothers’ height for the 1961 to 1985 cohorts and for a set of 24 Sub-Saharan countries including Côte d'Ivoire and Ghana. Their results are consistent with a postcolonial stagnation of mothers’ height; for their 24 countries taken as a whole they find a negative and significant –0.049 per annum change. They relate this figure to the stagnation of protein intakes on the one hand, and to the disconnection between infant mortality evolutions and child stunting or adult height evolutions, on the other hand.
7 For the overlapping birth cohorts of women in LSMS and DHS surveys (i.e. 1945–1969), statistical tests confirm the consistency of time trends.
Book 1.indb 62 2011/12/13 12:10:41 PM
63
Living conditions in Côte d’Ivoire and Ghana, 1925–1985
3 THE POTENTIAL IMPACTS OF SELECTIVE MORTALITY AND OF SHRINKAGE
The use of height stature as a proxy for long-term health conditions can be threatened by two phenomena, namely: selective mortality and shrinkage. In this section, we address these two issues. Most of the literature on stature growth considers that shorter people have a greater risk of dying earlier, what we shall call positive selection. For Africa, this is especially confirmed for childhood, while for adults the evidence is scarce (see thereafter). Under positive selection, mortality first selects taller people over the life-cycle. Then, comparing cohorts at different ages may lead to an underestimation of the height trends; conversely, shrinkage at old ages pushes in the opposite direction. Second, mortality decreases (resp. increases) can bias height trends downward (resp. upward). In the following section, we successively examine the potential bias linked to high levels of adult mortality, to variations in child or adult mortality, and to old-age shrinkage. Although we focus on the most consensual hypothesis, that is positive selection, we remain agnostic and even consider the reverse possibility of negative selection.
3.1 The case for a constant selective adult mortality across time
The study of a cohort of Norwegian males by Waaler (1984) showed that relative mortality risks between 40 and 69 are twice as high for the shortest as for the tallest; this differential was used by Fogel to explain the secular decline of mortality in Europe by the improvement of nutrition (Fogel 1993, 1994). Other studies in Northern countries also show a negative gradient of late adult mortality with height, although it is hard to derive from them a causal inference, as height is also correlated to labour conditions and socio-economic status (Leon et al. 1995; Jousilahti et al. 2000).
If this differential mortality held, it would select taller individuals in early birth years, as shorter individuals would have died, and bias downward the time trends we observe. With a rather extreme Waaler-like gradient, that is relative mortality doubling from the first quartile of height to the third quartile, simple computations show that the Côte d’Ivoire increase in height stature from 1925 to 1960 could be underestimated by around 1.5 cm.
Little evidence is available on height-related mortality risks for African countries. One exception is Sear, Allal and Mace (2004), who estimate an event-history model for death spells on a sample of around 600 Gambian women observed in a rural area between 1950 and 1975. They obtain a U-curved parabolic relationship between mortality risk and adult height after 20 years of age: the shortest women die earlier, but so do the tallest women. However, the range of variation of mortality risks with respect to height is such that between the first quartile of height (around 154 cm in the Côte d’Ivoire LSMS) and the third quartile (162 cm) mortality risk is equal to the one prevailing at the median (flat part of the U); only the first and last 5% (vintiles) of the height distribution reach estimated mortality risk that are double the median.
Book 1.indb 63 2011/12/13 12:10:42 PM
64
Denis Cogneau and Léa Rouanet
To test for selective mortality in our data, we offer two estimations. First, we follow the argument of Gørgens, Meng and Vaithianathan (2007) and Meng and Qian (2009) according to which the attenuation bias due to positive (resp. negative) selection should be lower at the top (resp. bottom) of the height distribution. Under the assumption that the shortest women die earlier (positive selection), we should find that the first quartile of height increases more than the median, and even more than the third quartile. Using the three editions of DHSs from 1993 to 2003, we observe the reverse in Ghana where the first quartile moves more slowly than the median, and even more slowly than the third quartile.8 This result leads us to conclude that our sample exhibits little signs of positive selection by mortality, rather perhaps some negative selection. This kind of selection could stem from the fact that tall women do not receive enough food to sustain their higher energetic needs and die early because of a lack of somatic maintenance. However, if mortality risks were indeed higher for taller people due to low nutrition, we would expect them to be underweight, as revealed for instance by a low Body Mass Index (BMI). Conversely, in the case of Ghana, men and women in the third quartile of height are even a little bit fatter when compared with the first quartile; it is also true for women in Côte d’Ivoire, whereas in this country tall men are just as fat (relatively speaking) as short men.
We finally conclude that there is no indication of a constant height selective adult mortality significantly affecting the height growth trends we observe, whether upward or downward.
3.2 The case for variations in child or adult mortality across time or space
The African continent is characterised by very high child mortality rates. Child mortality, just like adult mortality, can affect observed adult heights. Of course constant child mortality is not an issue for us, as all cohorts are measured after 20 years of age. Our concern is that child or adult mortality rates could have varied during the period we study, making selection patterns also vary over the period. Hence, we ask in this section whether changes in mortality could drive our descriptive results.
Available evidence for Africa also goes toward positive selection, that is short children dying earlier (Smedman et al. 1987 for Guinea-Bissau; Salama et al. 2001 for Ethiopia; Fawzi et al. 2001 for Sudan). Bozzoli, Deaton and Quintana-Domeque (2008) argue that at high levels of child mortality, the positive selection effect could dominate the “scarring” effect so that mortality increases (resp. decreases) could be associated with overall height gains rather than height losses (resp. gains). Deaton (2007) proposes that child mortality accounts for the tall average stature observed in Africa compared to other regions in the world. Moradi (2011) does not reject positive selection, but argues that its magnitude is limited and cannot generate large bias. We will also put forward the same argument about orders of magnitude.
8 We do not run this estimation on Ivorian data because the time span is not large enough.
Book 1.indb 64 2011/12/13 12:10:42 PM
65
Living conditions in Côte d’Ivoire and Ghana, 1925–1985
We unfortunately know little about child mortality during the colonial period, except for the late years. In Côte d’Ivoire, it is estimated that the child mortality rate fell from 186 to 130 per thousand between 1950 and 1954 and from 1970 to 1974, and in Ghana from 149 to 108 (Tabutin and Schoumaker 2004). With positive selection, the post-1950 progress on the child mortality front could account for some part of the break in height trends that we observe after 1960. However, these numbers indicate that height selective mortality has to be very strong, or changes in mortality very large, to have an influence on height evolutions. For instance, with around 5% additional lives of children being saved between 1950 and 1970, in order to give account of only 10% of the observed loss of 1.5 cm (i.e., only 1.5 mm) among women born during this period in Ghana, the height gap between old and new survivors would have to be as large as 3 cm = (1.5 cm × 0.10)/0.05. The same reasoning applies to potential mortality increases during the colonial period: both the increase itself and the magnitude of selection have to be very large to account for the steep height growth we observe (see also Moradi 2011).
Even if we feel that this order of magnitude argument is already discarding the potential for a large mortality bias, let us further explore the scenario of a large increase in child mortality between 1925 and 1960 being followed by a quick fall in the post-independence period.9 The colonial increase in mortality could have been driven by rapid urbanisation, if cities were places where mortality was higher, like in the much documented “urban penalty” that prevailed in 18th and 19th century Europe (e.g. Woods 2003). Moreover, colonial urbanisation could have also extended exposure to new pathogens carried by the Europeans. After World War II, despite the continuation of those trends, mortality would have started to fall thanks to increased health investments and more evenly distributed income growth.
We feel that this scenario is dubious. We have no indication of large epidemics in the early colonial period, neither in Côte d’Ivoire nor in Ghana, although some research is still warranted to better document this aspect. Besides, we observe no “urban penalty” with respect to childhood mortality in late 20th century Africa. All DHS surveys implemented since the end of the 1980s confirm that under-five mortality is higher in rural areas by around 40% on average. Balk et al. (2003) further show that the risk of infant death (before one year of age) is greatest in the sparsest rural areas and is lowest in the densest urban areas; it also increases with the distance to populated spaces. Yet, we know nothing about this rural-urban gap before 1980. However, the results of section 3 in this article show that Côte d’Ivoire’s 1925 to 1969 height stature gains are correlated to being born in a more urbanised area and from educated parents working outside of agriculture, and also to the medical staff (nurses, doctors) in the district of birth at the
9 Remaining agnostic, if mortality rather favours shorter individuals (negative selection), a quick decrease in child mortality during colonial times would make taller individuals more and more likely to survive, pushing the positive trend in height we observe. If this decrease was followed by a slowdown in the mortality decrease velocity, it could also result in the trend breaks we observe. However, in that case the height changes would still reflect the improvements of health conditions, through mortality improvements.
Book 1.indb 65 2011/12/13 12:10:42 PM
66
Denis Cogneau and Léa Rouanet
time of birth. It would be very surprising if such factors were correlated with higher mortality. Even if increases in medical staff could respond to the needs of communities being more exposed to diseases, it is difficult to believe that endogenous placement of health investments would completely reverse their correlation with health outcomes.
The only remaining possibility would be that mortality increased in both urban and rural areas, at least up to the 1940s, thus generating a general upward bias in the height trend, even if the progresses of urbanisation (and the associated health services) contributed to mitigate this general increase. We cannot entirely exclude this scenario. According to the orders of magnitude of the computations presented above, it is hardly credible that such a general mortality increase, and the ensuing positive selection, have a large influence on height trends. They could still account for a residual part that our analysis of the impacts of urbanisation and cocoa expansion will not be able to capture.
Finally, we again build a more direct test of selective mortality bias. Once again, if mortality selects the tallest, the selection bias on height evolutions should be attenuated when looking at the top percentiles of the height distribution. For each gender and each birth year between 1925 and 1964, we therefore compute the average height of individuals belonging to the top quartile (25% tallest) of the height distribution; we also try the top decile (10% tallest). The evolutions obtained are not different from the evolutions of mean or median heights from table 2. For Ghanaian men, the height growth of the top quartiles is even a bit lower than the height growth of the birth year averages (1.9 for the top quartile, 2.2 for the top decile versus 2.5 cm for the mean). Hence, we detect no significant impact of height selective mortality.
3.3 The case for shrinkage above 40 years of ageShrinkage at later ages constitutes the final robustness issue. After discussing the potential impact of shrinkage on our results, we propose shrinkage-corrected height trends.
If ageing significantly reduces individual height stature, then part of the height trend we observe is spurious, as we do not compare individuals at the same age, like we would do with military data on young age recruits. This is a matter for early cohorts who are observed at ages above 40: up to now, in the human biology literature, longitudinal studies on Western countries have all agreed on the fact that shrinkage is not significant before 40 years.10 Sorkin, Muller and Andres (1999) provide a survey of 16 longitudinal studies of the impact of ageing on height stature; unfortunately all recorded studies are for Western populations. Drawing from these studies, they propose a “consensual” rate at which height is lost at any age and for each gender. Cumulative loss in height is derived as a quadratic function of age: 0.1258age – 0.0021age² for men; 0.1727age – 0.0027age² for women. According to these two functions, height at 40 is not significantly different from height at 20, but both genders lose about 0.75 cm between 40 and 50. At age 60, men (resp. women) are about 1.75 cm (resp. 2cm)
10 Likewise, the age of 20 is widely recognised as the threshold above which no significant individual growth is observed on average.
Book 1.indb 66 2011/12/13 12:10:42 PM
67
Living conditions in Côte d’Ivoire and Ghana, 1925–1985
shorter than at 20. As the oldest cohorts we analyse have ages ranging between 50 and 60, such a shrinking effect seriously affects the magnitude of the height trends outlined above.
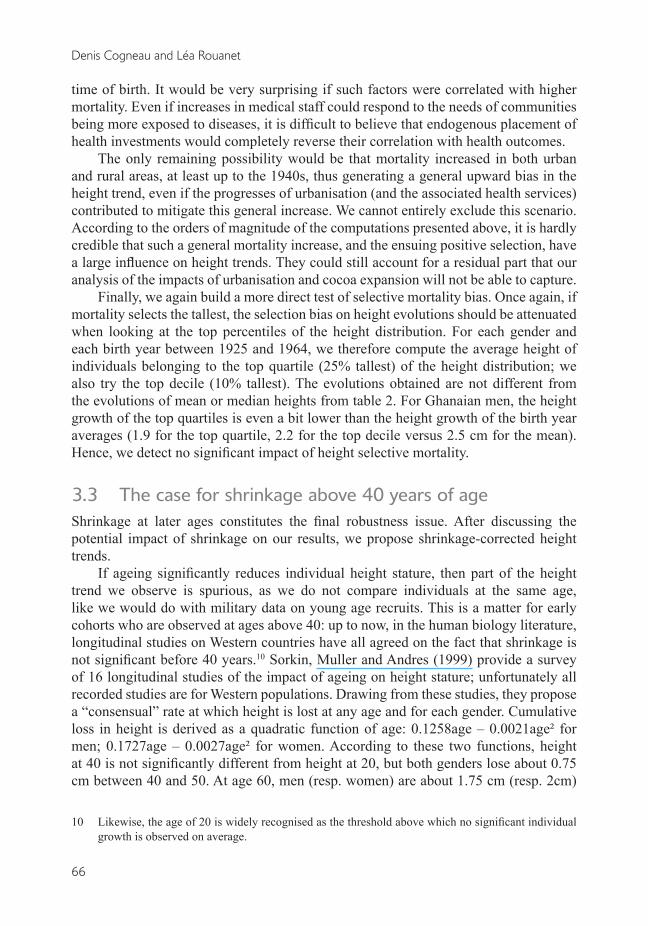
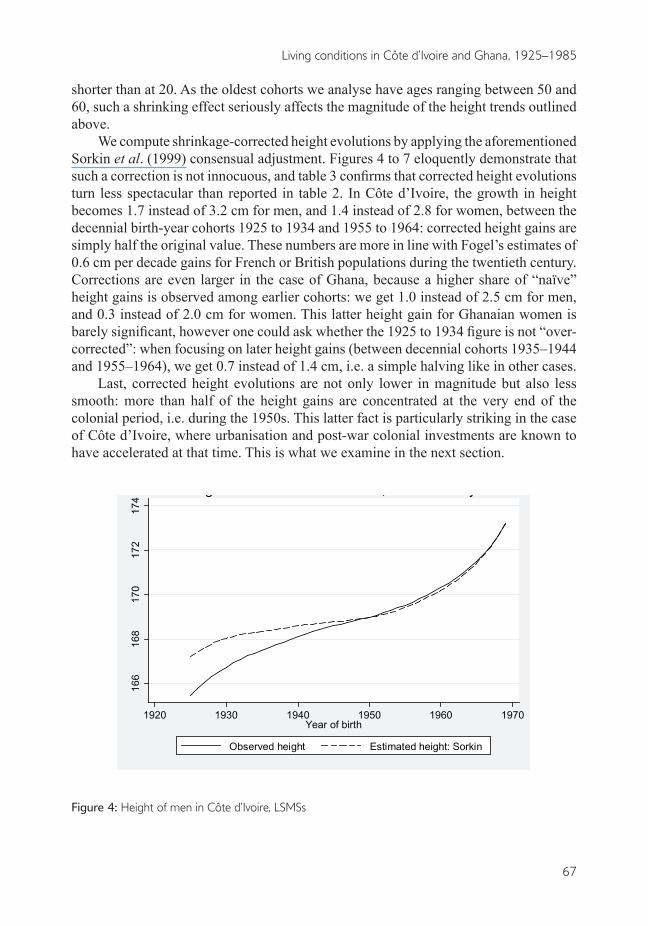
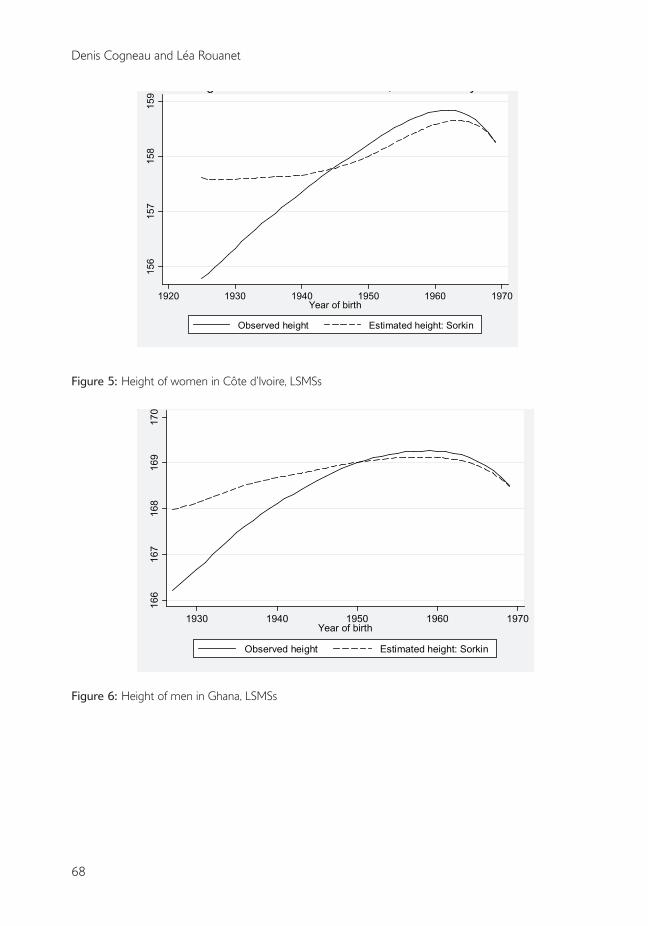
We compute shrinkage-corrected height evolutions by applying the aforementioned Sorkin et al. (1999) consensual adjustment. Figures 4 to 7 eloquently demonstrate that such a correction is not innocuous, and table 3 confirms that corrected height evolutions turn less spectacular than reported in table 2. In Côte d’Ivoire, the growth in height becomes 1.7 instead of 3.2 cm for men, and 1.4 instead of 2.8 for women, between the decennial birth-year cohorts 1925 to 1934 and 1955 to 1964: corrected height gains are simply half the original value. These numbers are more in line with Fogel’s estimates of 0.6 cm per decade gains for French or British populations during the twentieth century. Corrections are even larger in the case of Ghana, because a higher share of “naïve” height gains is observed among earlier cohorts: we get 1.0 instead of 2.5 cm for men, and 0.3 instead of 2.0 cm for women. This latter height gain for Ghanaian women is barely significant, however one could ask whether the 1925 to 1934 figure is not “over-corrected”: when focusing on later height gains (between decennial cohorts 1935–1944 and 1955–1964), we get 0.7 instead of 1.4 cm, i.e. a simple halving like in other cases.
Last, corrected height evolutions are not only lower in magnitude but also less smooth: more than half of the height gains are concentrated at the very end of the colonial period, i.e. during the 1950s. This latter fact is particularly striking in the case of Côte d’Ivoire, where urbanisation and post-war colonial investments are known to have accelerated at that time. This is what we examine in the next section.
Figure 4: Height of men in Côte d’Ivoire, LSMSs
166
168
170
172
174
1920 1930 1940 1950 1960 1970Year of birth
Observed height Estimated height: Sorkin
Heights of men in Côte d'Ivoire, LSMS surveys
Book 1.indb 67 2011/12/13 12:10:42 PM
68
Denis Cogneau and Léa Rouanet
Figure 5: Height of women in Côte d’Ivoire, LSMSs
Figure 6: Height of men in Ghana, LSMSs
166
167
168
169
170
1930 1940 1950 1960 1970Year of birth
Observed height Estimated height: Sorkin
Heights of men in Ghana, LSMS surveys
156
157
158
159
1920 1930 1940 1950 1960 1970Year of birth
Observed height Estimated height: Sorkin
Heights of women in Côte d'Ivoire, LSMS surveys
Book 1.indb 68 2011/12/13 12:10:42 PM
69
Living conditions in Côte d’Ivoire and Ghana, 1925–1985
Figure 7: Height of women in Ghana, LSMSs
Method for figures 4 to 7: Locally linear regressions (“lowess”) with bandwidth 0.8.
Table 3: Height evolutions corrected for shrinkage
Côte d’Ivoire Ghana
Women Men Women Men
Year of birth Mean Median Mean Median Mean Median Mean Median
1925–1934 157.4 157.1 168.0 167.8 157.7 157.7 168.4 168.2
1935–1944 157.7 157.3 168.7 168.3 157.3 157.3 168.7 168.5
1945–1954 157.7 157.6 168.9 168.9 157.5 157.4 168.9 169.3
1955–1964 158.8 158.6 169.7 169.7 158.0 157.9 169.4 169.4
Coverage: Native men and women aged 20 to 60 years old. Source: LSMS data, authors’ calculations.Note: Corrected heights according to the Sorkin, Muller and Andres (1999) quadratic model for cumulative losses in height due to ageing (see section 3.3 in the text).
4 DISAGGREGATING HEIGHT TRENDS
4.1 DataThe LSMSs provide a wealth of information on adult individuals’ parental background, i.e. education and the main occupation (over the life course) of the father and of the
156
156.
515
715
7.5
158
1930 1940 1950 1960 1970Year of birth
Observed height Estimated height: Sorkin
Heights of women in Ghana, LSMS surveys
Book 1.indb 69 2011/12/13 12:10:42 PM
70
Denis Cogneau and Léa Rouanet
mother, and on the district of birth.11 We construct two dummy variables indicating whether the father or the mother of the individual ever attended school, and another dummy variable indicating whether the father was/is in agriculture (farmer, fisherman or livestock farmer).
The LSMSs as well as the DHSs also provide a rough measurement of the urbanisation level (capital or large city, city, town) of the place of residence when the interviewed individual was a child. This measurement however relies on self-declaration with fuzzy categories like “large city”, “town” or “small village”. Moreover, in the LSMSs the measurement is only recorded for migrants and has to be completed with administrative categories for non-migrants (the locality natives). We do not make use of these rough measurements in our main analysis.
In the case of the LSMSs, we prefer to reconstruct urbanisation levels in the district of birth. We make use of the data recently gathered by the e-Geopolis project about urbanisation in Africa, which provides estimates for the size of each country’s main cities (with more than 5 000 inhabitants around 2000) for each decennial year between 1920 and 1970. For the other years, we interpolate urban population assuming exponential growth, except when the initial urban population is zero in which case we apply linear interpolation up to the next decennial year. With this data, we compute for each individual the district of birth urban population density, i.e. number of people in cities and towns per square kilometre, at the date of birth.12
Likewise, the wide expansion of cocoa production during colonial times is frequently cited as one of the main factors driving economic and social change in Côte d’Ivoire and Ghana (on cocoa history: Ruf 1995; Clarence-Smith and Ruf 1997; on Ghana: Austin 2005; on Côte d’Ivoire: Balac 1998). Thanks to the work of Jedwab (2011), we have access to district-level disaggregated series of cocoa production for years 1924, 1930, 1936 and 1945–1997 in Côte d’Ivoire, and for years 1926, 1936, 1950, 1961–1965, 1969–1975 and 1980–1982 in Ghana. We linearly interpolate cocoa production of missing years. The expansion of cocoa production is a “Conquest of the West” story, that is the progressive exploitation of wild forest spaces in the south-western part of each country. We check that these series fit with aggregate maps depicting the evolution of cocoa production among broad regions (for Côte d’Ivoire: Léonard 1997; for Ghana: ECOWAS-SWAC/OECD 2007). For each individual, we then compute the cocoa production in tons per square kilometre in the district of birth at the year of birth.
We could have wished to have a series of real cocoa producer prices in order to compute real income derived from cocoa production; unfortunately no consumer price deflator is available for the colonial period, hence we stick to the volume of cocoa production. Anyway, as our preferred specification includes year fixed effects, the influence of nationwide variation of producer prices is partially absorbed. Incorporating
11 In Côte d’Ivoire, 35 districts of birth can be distinguished (even 50 in the case of the 1986–1988 surveys, but we remain with the 1985 administrative areas). Unfortunately only 10 districts can be distinguished in Ghana.
12 Data source: http://www.e-geopolis.eu/. In e-Geopolis data, only 30 areas can be distinguished for Côte d’Ivoire, so that the disaggregation of the urban density variable is bounded at that level of detail, instead of 50 districts of birth.
Book 1.indb 70 2011/12/13 12:10:42 PM
71
Living conditions in Côte d’Ivoire and Ghana, 1925–1985
nominal producer prices, that is analysing the value of cocoa production in 2000 USD instead of volumes, provides similar results (available on request).
Last, for Côte d’Ivoire we make use of the data collected in French colonial archives by Huillery (2008).13 These data are extracted from the budgets of French colonial administrative districts (“cercles”) between 1910 and 1956. They record in particular the number of teachers and medical staff (doctors, nurses, etc.) allocated to each of the 19 colonial “cercles” (literal translation is “circle”) of 1925 Côte d’Ivoire, for years 1923, 1928, 1930, 1933, 1939, 1946 and 1949. We linearly interpolate missing data, up to 1954 (extrapolating the 1946–1949 time trend to 1949–1954). To each individual born between 1925 and 1954, we attribute the value of these variables for the circle of birth at year of birth, divided by the number of square kilometres of the circle of birth. The same kind of data is unfortunately not available for Ghana.
4.2 MethodologyWe want to explain height stature by individual and regional characteristics, and to relate height trends to long-term changes. To do so we estimate the following equation for the height of individual i born in district d at year t:
Hidt = α + Pidtβp + γ1.Udt + γ2.Udt² + θ1.Cdt + θ2.Cdt² + λ.Sidt + Xdtδ + εidt (1)
Where P stands for the three variables of parental background and U and C are respectively the above-cited indicators for urban population density and for cocoa production density; Regarding these latter two variables, we adopt a quadratic specification because we expect to capture decreasing returns to urban population growth and cocoa production growth.14 If this is the case, we should find γ1 > 0 and θ1 > 0, γ2 < 0 and θ2 < 0. S controls for sexual dimorphism; and X is a set of controls of district of birth and cohort fixed effects described thereafter. For each country, we estimate three models labelled I, II and III, with each corresponding to a different set of controls.
Aside from our five explanatory variables, model I only introduces the sex dummy variable to control for a constant sexual dimorphism – readers may recall that we did not identify any difference in height trends between men and women. Model II puts into X a series of district of birth dummies, that is controls for differences in average height levels between districts of birth. Model III also adds into X a series of birth year dummies, that is the national height growth trend. These estimates cannot claim to capture a very clean causal impact of each of our explanatory variables; for this, we lack appropriate natural experiments. However, our preferred estimates lie in-between
13 These data were collected within a broader research project “Long-term history and resource distribution in Africa” funded by the French Ministry of Research and directed by Denis Cogneau.
14 We also tried adding two dummy variables, one for no urban population (at the beginning of the period some districts have no cities at all), and another for no cocoa production, but they did not add any explanatory power.
Book 1.indb 71 2011/12/13 12:10:42 PM
72
Denis Cogneau and Léa Rouanet
model II and model III, and probably closer to the latter. Model I is only reported for comparison; it mixes the decomposition of the height trend with inter-regional differences in height, for instance between northern and southern districts. Model II cancels out those permanent between-districts contrasts. However, as all variables including height share a common increasing trend – later cohorts have more educated parents and are more often born in towns or a cocoa producing district, we run the risk of attributing too much of the height increase to the time variation of these variables. Conversely, model III only analyses district level deviations from the national trend for the urbanisation and cocoa expansion variables; both between districts deviations and within district (-cohorts) variation, for parental background variables which are defined at the individual level. In that respect, model III is also immune to any old-age shrinkage bias, provided those bias do not vary according to parental background or district of birth. Hence, although model III can be deemed more satisfactory in terms of causality inference, it may also attribute too few of the national height increase to the time variation of explanatory variables, in particular urban density and cocoa production, as the model disregards entirely the aggregate correlation between national trends.15 We will nonetheless grant our preference to model III estimates, in order to remain rather conservative.
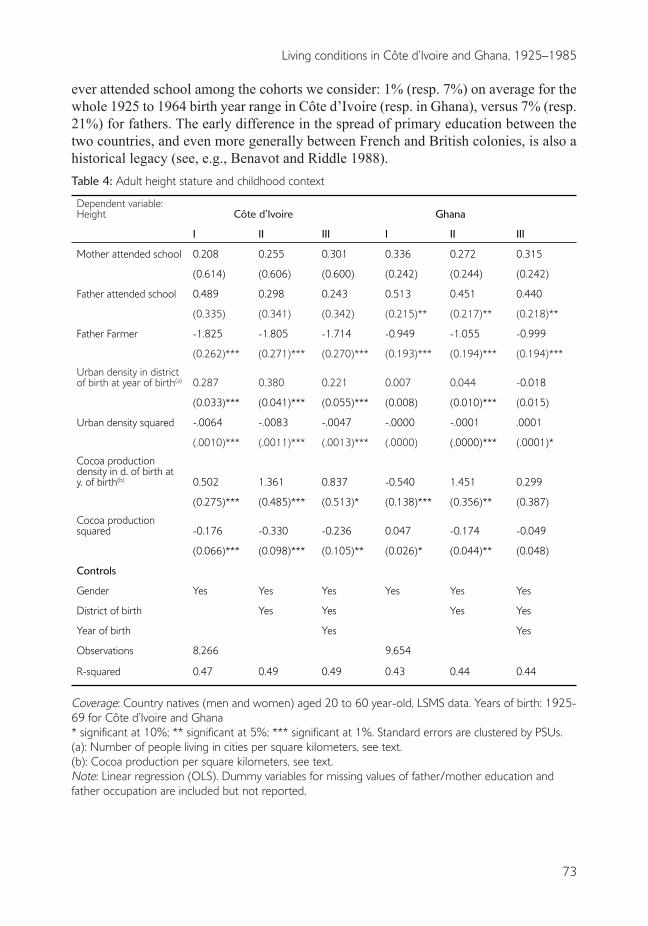
4.3 ResultsIn table 4, we provide the results of the estimation of the three models we mentioned. In contrast with cocoa expansion and urbanisation, which are necessarily identified in the longitudinal dimension of the data, table 4 shows that the effects of parental background variables are essentially identified in the cross-sectional dimension. Indeed their coefficients change little between the three models. Within a given cohort born in a given district, having a father farmer is a persistent handicap. Interestingly enough, this effect of father’s agricultural occupation does not even bite on the coefficient of urban population when we introduce the two variables successively. According to the three models, a father farmer means a height handicap at adult age of around 1.7 cm in Côte d’Ivoire. This handicap of having a father farmer only reaches 1 cm in Ghana; however, an uneducated father also decreases adult height by 0.4 cm in this country. One explanation of the difference between the two countries could be that income dualism against agriculture is historically less pronounced in Ghana than in Côte d’Ivoire (Cogneau and Mesplé-Somps 2008). Apart from income, this impact of father’s occupation could, however, also reflect local supply factors like access to clean water and sanitation, proximity of dispensaries and hospitals, etc., even if we partially control for them through district of birth variables.
The two parental education variables have less explanatory power; only father’s primary education provides a significant 0.4 cm advantage in Ghana. Only a few mothers
15 In order to avoid over-optimistic statistical inference for the urban population and cocoa production variables which only vary at the district-cohort of birth level, we tried clustering the models’ standard errors at this level rather than at primary sample units level; we checked that this alternative choice changed very little the precision of our estimates.
Book 1.indb 72 2011/12/13 12:10:42 PM
73
Living conditions in Côte d’Ivoire and Ghana, 1925–1985
ever attended school among the cohorts we consider: 1% (resp. 7%) on average for the whole 1925 to 1964 birth year range in Côte d’Ivoire (resp. in Ghana), versus 7% (resp. 21%) for fathers. The early difference in the spread of primary education between the two countries, and even more generally between French and British colonies, is also a historical legacy (see, e.g., Benavot and Riddle 1988).Table 4: Adult height stature and childhood context
Dependent variable: Height Côte d’Ivoire Ghana
I II III I II III
Mother attended school 0.208 0.255 0.301 0.336 0.272 0.315
(0.614) (0.606) (0.600) (0.242) (0.244) (0.242)
Father attended school 0.489 0.298 0.243 0.513 0.451 0.440
(0.335) (0.341) (0.342) (0.215)** (0.217)** (0.218)**
Father Farmer -1.825 -1.805 -1.714 -0.949 -1.055 -0.999
(0.262)*** (0.271)*** (0.270)*** (0.193)*** (0.194)*** (0.194)***
Urban density in district of birth at year of birth(a) 0.287 0.380 0.221 0.007 0.044 -0.018
(0.033)*** (0.041)*** (0.055)*** (0.008) (0.010)*** (0.015)
Urban density squared -.0064 -.0083 -.0047 -.0000 -.0001 .0001
(.0010)*** (.0011)*** (.0013)*** (.0000) (.0000)*** (.0001)*
Cocoa production density in d. of birth at y. of birth(b) 0.502 1.361 0.837 -0.540 1.451 0.299
(0.275)*** (0.485)*** (0.513)* (0.138)*** (0.356)** (0.387)
Cocoa production squared -0.176 -0.330 -0.236 0.047 -0.174 -0.049
(0.066)*** (0.098)*** (0.105)** (0.026)* (0.044)** (0.048)
Controls
Gender Yes Yes Yes Yes Yes Yes
District of birth Yes Yes Yes Yes
Year of birth Yes Yes
Observations 8,266 9,654
R-squared 0.47 0.49 0.49 0.43 0.44 0.44
Coverage: Country natives (men and women) aged 20 to 60 year-old, LSMS data. Years of birth: 1925-69 for Côte d’Ivoire and Ghana* significant at 10%; ** significant at 5%; *** significant at 1%. Standard errors are clustered by PSUs.(a): Number of people living in cities per square kilometers, see text.(b): Cocoa production per square kilometers, see text.Note: Linear regression (OLS). Dummy variables for missing values of father/mother education and father occupation are included but not reported.
Book 1.indb 73 2011/12/13 12:10:43 PM
74
Denis Cogneau and Léa Rouanet
In contrast with the family background variables, the three models provide rather contrasting results for the district of birth level variables, that is urban population and cocoa production at the time of birth. The changes in the coefficients between model I and model II reflect the initial height level disadvantage of southern forest regions that are suitable for cocoa production, when compared with northern savannah. Individuals born in northern districts were indeed on average 2 cm taller in the 1920s. In Côte d’Ivoire, their average stature stagnates over the entire period, while people born in the South catch up with them; in Ghana, the height trends of both birth regions are rather parallel, although the extreme North (Upper East and Upper West) also exhibits below average performance.16 These initial regional contrasts may have to do with nutrition differences between regions. For instance, northern cattle breeders eat more meat and more milk and hence benefit from higher protein intakes. Anyway, thanks to the expansion of cocoa, and perhaps also due to their proximity to new trade opportunities on the coast, the southern areas also experienced a higher rate of cities growth. Hence, the same upward move is observed between model I and model II for the coefficients of urban population and of cocoa production, in both countries. Conversely, when shifting from model II to model III, the absorption of the common aggregate trends between height, urban population and cocoa production leads to a decrease in the coefficients of the two explanatory variables; in the Côte d’Ivoire case, both are halved but remain large and very significant, while in Ghana both turn small and insignificant. 17
We may use the evolutions of birth cohort averages, observed between 1925 and 1934 and 1954 and 1964, to get an intuitive idea of the magnitude of effects; those evolutions are reported in table 1 and have already been commented on in section 2. We mainly refer to the most conservative model III specification. In Côte d’Ivoire, the increase in urban population density over 30 years, from 0.1 to 5.7 people per square km, corresponds to a +1.0 cm height growth. Likewise, for cocoa production, the average increase of +0.42 tons of cocoa per square km translates into a height gain of +0.4 cm. Even if urban growth started earlier in Ghana, that is at the beginning of the twentieth century, 1925 to 1964 urban growth was still higher in absolute terms than in Côte d’Ivoire, that is from 2.3 to 19.5. Yet, the model II for Ghana translates this urban growth into a +0.7 cm height gain only, and the model III indicates no impact. Starting again from a much higher level (1.9 tons per square kilometre compared to 0.1
16 Recall international migrants are excluded from analysis, in particular Burkinabè and Malian migrants in Côte d’Ivoire, who represent more than 15% of the 20 year-old population. With respect to height level and trend, the foreign born in Côte d’Ivoire look alike the country northerners: they are much taller than Côte d’Ivoire natives in the oldest cohorts (above 170 cm for men, 160 cm for women) but progressively lose this advantage over time. In model II or III specifications, we also checked that including ethnic group dummies did not change the results (recall that we already control for district of birth dummies).
17 Estimating model II with the old-age shrinkage correction already used above reduces the coefficients for urban population and for cocoa production without changing their statistical significance, to values very close to those obtained in model III. Once again, as the correction is simply a function of age and hence of year of birth, the correction changes nothing to model III results.
Book 1.indb 74 2011/12/13 12:10:43 PM
75
Living conditions in Côte d’Ivoire and Ghana, 1925–1985
in Côte d’Ivoire in 1925–1934), Ghana achieved the same average increase in cocoa production (+0.47) as Côte d’Ivoire. Here again, the models estimated on Ghanaian data attribute a negligible height gain to the expansion and growth of cocoa production.
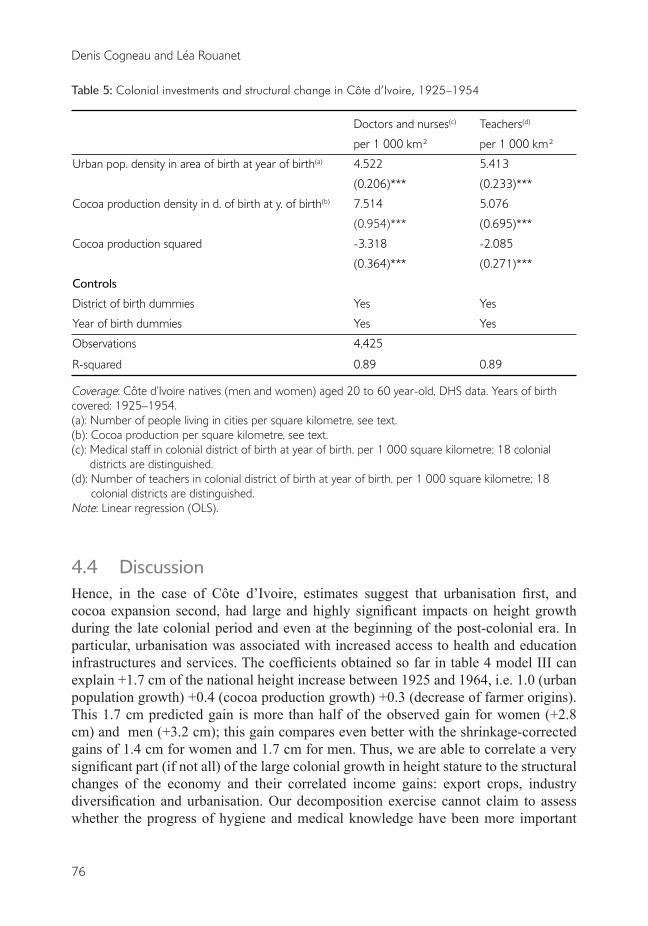
For cohorts born between 1925 and 1954 in Côte d’Ivoire, two additional explanatory variables are available, namely: the number of nurses and doctors and the number of teachers (per square kilometre) in the colonial district of birth at the time of birth. We regress those colonial investments on cocoa production and urban density. The estimated equation, whose results can be found in table 5, is the following:
Investidt. = α + λ.Udt + μ.Cdt +vd + wt + η idt (2)
The dependent variable Invest is successively the number of nurses and doctors per 1 000 km², and the number of teachers per 1 000 km² in the district of birth at the year of birth of individual i. The specification of fixed effects is the same as in model III: district of birth and year of birth dummies.18 We drop parental background variables that play no role and also the square term for urban population as we find no decreasing returns for this variable. Not surprisingly, we find that colonial investments in health and education are very much correlated, both across space and time, with urban population density. District of birth dummies and birth year dummies already account for 63% of the variance of the number of doctors and nurses, and 49% for the number of teachers. The remainder of the variance is made of colonial districts’ deviations from the national time trend. Adding urban population density growth brings the ratio of explained variance to 89% as testified by the two R-squares of table 5. While coming out with significant coefficients, cocoa production density adds little. According to the urban population coefficient, 1 000 more urban inhabitants per square kilometre are associated with 4.5 to 5.4 additional health or education agents. Of course, this means that the ratios of medical or educational staff to urban population fell tremendously (from 11 in 1925 to less than 3 per 1 000 urban people in 1950). However, the ratios to total population increased a lot (from 0.05 to 0.20 per 1 000), urbanisation implying a more widespread access to basic health and education services. Due to their very strong correlation with urbanisation, the introduction of these variables in equation (1) brings nothing more and even makes identification difficult. These results suggest that colonial investments mainly matter as correlates of urbanisation.
18 We here stick to estimates on the population of individuals, in order to preserve a straightforward comparison with table 4, even if real information only stems from 18 colonial districts over 30 years. Making the regressions on the corresponding 540 points makes very little change.
Book 1.indb 75 2011/12/13 12:10:43 PM
76
Denis Cogneau and Léa Rouanet
Table 5: Colonial investments and structural change in Côte d’Ivoire, 1925–1954
Doctors and nurses(c) Teachers(d)
per 1 000 km² per 1 000 km²
Urban pop. density in area of birth at year of birth(a) 4.522 5.413
(0.206)*** (0.233)***
Cocoa production density in d. of birth at y. of birth(b) 7.514 5.076
(0.954)*** (0.695)***
Cocoa production squared -3.318 -2.085
(0.364)*** (0.271)***
Controls
District of birth dummies Yes Yes
Year of birth dummies Yes Yes
Observations 4,425
R-squared 0.89 0.89
Coverage: Côte d’Ivoire natives (men and women) aged 20 to 60 year-old, DHS data. Years of birth covered: 1925–1954.(a): Number of people living in cities per square kilometre, see text. (b): Cocoa production per square kilometre, see text.(c): Medical staff in colonial district of birth at year of birth, per 1 000 square kilometre; 18 colonial
districts are distinguished.(d): Number of teachers in colonial district of birth at year of birth, per 1 000 square kilometre; 18
colonial districts are distinguished.Note: Linear regression (OLS).
4.4 DiscussionHence, in the case of Côte d’Ivoire, estimates suggest that urbanisation first, and cocoa expansion second, had large and highly significant impacts on height growth during the late colonial period and even at the beginning of the post-colonial era. In particular, urbanisation was associated with increased access to health and education infrastructures and services. The coefficients obtained so far in table 4 model III can explain +1.7 cm of the national height increase between 1925 and 1964, i.e. 1.0 (urban population growth) +0.4 (cocoa production growth) +0.3 (decrease of farmer origins). This 1.7 cm predicted gain is more than half of the observed gain for women (+2.8 cm) and men (+3.2 cm); this gain compares even better with the shrinkage-corrected gains of 1.4 cm for women and 1.7 cm for men. Thus, we are able to correlate a very significant part (if not all) of the large colonial growth in height stature to the structural changes of the economy and their correlated income gains: export crops, industry diversification and urbanisation. Our decomposition exercise cannot claim to assess whether the progress of hygiene and medical knowledge have been more important
Book 1.indb 76 2011/12/13 12:10:43 PM
77
Living conditions in Côte d’Ivoire and Ghana, 1925–1985
than improvements in nutrition for explaining gains in height stature; it cannot either claim to disentangle the effects of public services and of private income. However, it corroborates the reality that this height increase reflects long-term structural changes across the whole economy and society.
In contrast, urbanisation and cocoa expansion are found to have little impact in the case of Ghana. Furthermore, shrinkage corrected height gains are less impressive in Ghana than in Côte d’Ivoire: between 1925–1934 and 1955–1964, only 1 cm for men and 0.3 cm for women (or 0.7 cm when starting in 1935–1944).19 How can we explain this discrepancy?
Part of the explanation might stem from the lack of disaggregation of the district of birth variable, which only distinguishes ten districts in Ghana. However we tried to assess the influence of aggregation on the Côte d’Ivoire data: we collapsed the 35 districts of birth into 10 broad regions of birth and found that the coefficients were little affected except for their statistical precision (standard errors). Hence this explanation may not be the right one.
Regarding cocoa expansion, decreasing returns can provide a sufficient explanation for the difference between the two countries, as Ghana production started at much higher levels and only slightly increased in comparison with Côte d’Ivoire. Even if we apply the Côte d’Ivoire coefficients to Ghana data, the height gain attributable to cocoa production growth is small because of strong decreasing returns. We conclude that only the first stages of cocoa production expansion had a significant separate impact on height stature evolutions.
This conclusion is less straightforward in the case of urbanisation. It is not that decreasing returns do not hold in the Côte d’Ivoire model. If we make an out-of-sample forecast for this country and for the two decennial cohorts born between 1965 and 1984, urban growth still accounts for a +1.2 cm height gain between 1960 and 1970 but its impact finally exhausts between 1970 and 1980, even if urban population density almost doubles (see table 1 last two rows).20 Still, according to the Côte d’Ivoire model, Ghana’s urban population spurt between 1930 and 1960 should have generated a +2.0 cm height gain.
Is it that Ghanaian cities were unhealthier and/or poorer than Ivorian ones? When exploiting the self-declared urban status of the place of birth, either using
LSMS data (for cohorts born 1925–1969) or DHS data (1945–1974), we do not detect any significant height handicap of Ghanaian cities compared to Ivorian cities. In DHS
19 As already mentioned, model III could be over-conservative by only relying on district deviations. With model II that can be taken as a higher bound, we account for a 1.31 cm gain = 0.72 (urbanisation) + 0.34 (cocoa expansion) +0.26 (family background). However, model II with shrinkage-corrected data makes us lose the urbanisation effect while still keeping a significant cocoa effect although with large decreasing returns (+0.15 cm gain only).
20 When comparing Côte d’Ivoire and Ghana estimates, we may wonder whether our coarse measure of urbanisation could be more efficient in measuring progresses at low levels of urbanisation (extensive margin) than improvements at higher levels (intensive margin), even when decreasing returns are taken into account.
Book 1.indb 77 2011/12/13 12:10:43 PM
78
Denis Cogneau and Léa Rouanet
data for instance, being born in a the capital or a “large city” in Côte d’Ivoire brings on average a 0.9 cm gain, compared to 0.7 cm for being born in a “city” in Ghana; hence the difference is not large enough to account for the contrasting impacts of urbanisation. Postcolonial data on child mortality also invalidate the idea of unhealthier cities in Ghana: data from World Fertility Surveys (WFS) and DHS covering the 1979 to 1999 period suggest that under-five mortality was even lower in urban areas of Ghana compared to Côte d’Ivoire; in both countries, the urban-rural gap also increased over these 20 years, revealing a quicker decline of mortality in cities (Garenne 2010). However, adult height gains seem to be rather disconnected from child mortality decreases in Africa, and more linked to caloric or protein intakes and income (Akachi and Canning 2008; Moradi 2010). On this latter dimension, the urban-rural gap in income poverty has stayed rather stable over the last decade (1993–2002) in Sub-Saharan Africa (Ravallion, Chen and Sangraula 2007) despite important progress in urbanisation, so that it is unclear that urbanisation should come with a dramatic increase in poverty.
The same LSMS data that we use for analysing height reveal that the urban-rural income gap was much more pronounced in Côte d’Ivoire than in Ghana at the end of the 1980s, as was the income dualism against agriculture (Cogneau and Mesplé-Somps 2008), at a time when urbanisation rates had become very close. However, the 1980s and even the 20 years since independence (1960–1980), are not easy to extrapolate to other periods, as during those years the two countries very significantly diverged in terms of income. According to Maddison’s estimates (2003), Côte d’Ivoire and Ghana had approximately the same level of GDP per capita in the 1950s.
Can the timing of height gains provide a clue? Indeed the timing is very different between the two countries, at least for men. In Côte d’Ivoire height growth pretty much accelerated during the 1950s, whereas in Ghana the bulk of the gains was completed before 1950. We also know that public investment in former French Africa (Afrique Occidentale Française) increased a lot after 1946, thanks to a specific fund called Fonds de Développement Economique et Social (FIDES) but also to higher fiscal revenue (Huillery 2008). For instance, in Côte d’Ivoire the number of doctors and nurses increased by 81% and the number of teachers by 63% in three years between 1946 and 1949, this latter year being the apex of the FIDES transfer. At the same time, the steady and gradual expansion of cocoa was fuelling both urban demographic growth and urban income, as well as fiscal revenue (Jedwab 2011). We unfortunately could not find comparable figures for post-war colonial Gold Coast. In Sederberg (1971) total expenditures for the years 1901 through 1939 reveal a large drop following the Great Depression. Frankema (2011) emphasises the absence of a developmental stance before 1940. After 1940, we can guess that the post-1938 collapse of cocoa production – that only recovered lately in the 1950s, could have resulted in an increase in poverty and in a loss of fiscal revenue. More research is warranted to see whether British public investments were increasingly lagging behind urbanisation. This could account for the concomitant stagnation of height during the 1950s.
After independence, as already mentioned, decreasing returns to urbanisation easily explain the slowdown of height growth in Côte d’Ivoire. In Ghana, the macroeconomic downturn and the collapse of the cocoa sector can also straightforwardly account for the
Book 1.indb 78 2011/12/13 12:10:43 PM
79
Living conditions in Côte d’Ivoire and Ghana, 1925–1985
height losses of cohorts born in the 1970s and 1980s. Moradi (2010) provides support for this macroeconomic story on a large sample of African countries.
5 CONCLUSIONEven when correcting for the bias arising from old-age shrinkage, we find with survey data that the pace of increase in height stature experienced by successive cohorts born in Côte d’Ivoire and Ghana during the late colonial period (1925–1960) was almost as high as the pace observed in France and Great-Britain over the 1875 to 1975 period. By contrast, the early post-colonial period (1960–1985) was characterised by a slowdown of height growth in Côte d’Ivoire and even reversion in Ghana. The selection effects linked to the interactions between height and mortality cannot account for these figures. We disaggregate national trends by parental background and district of birth, and match individual data with district-level historical data on urban population density, export crop (cocoa) production, and colonial investment in health and education. In Côte d’Ivoire, we provide evidence that a significant share of the increase in height stature may be related to the early stages of urbanisation. Even if we are still unable to definitely discriminate between demand-side (private income) and supply-side (health infrastructures) explanations, we corroborate the reality and importance of height gains during the late colonial period in Côte d’Ivoire and Ghana. This colonial height growth is found to reflect long-term structural changes across the whole economy and society.
REFERENCESAcemoglu D., Johnson, S. and Robinson, J.A. 2002. Reversal of fortune: geography and institutions
in the making of the modern world income distribution. Quarterly journal of economics. 117 (4), 1231–1294.
Akachi, Y. and D. Canning. 2010. The Health trends in Sub-Saharan Africa: Conflicting evidence from infant mortality rates and adult heights Economics & Human Biology 8(2) 273-288
Austin, G. 2005. Labour, land and capital – from slavery to free labour in Asante, 1807–1956. University of Rochester Press.
_____. 2008. The “reversal of fortune” thesis and the compression of history: perspectives from African and comparative economic history. Journal of international development, 20 (8), 996–1027.
Austin, G., Baten, J. and Moradi, A. 2007. Exploring the evolution of living standards in Ghana: an antrhopometric approach. Unpublished paper.
Balac R., 1998. Gens de terres, gens de réseaux: mécanismes de production et lien social: pour une nouvelle mise en perspective de l’économie de plantation en Côte d’Ivoire. Thèse de doctorat en Démographie Economique. Institut d’Etudes Politiques de Paris.
Balk D., Pullum, T., Storeygard, A., Greenwell, F. and Neuman, M. 2003. Spatial analysis of childhood mortality in West Africa. Calverton, MD: ORC Macro and CIESIN, Columbia University.
Banerjee, A. and Iyer, L. 2005. History, institutions and economic performance: the legacy of colonial land tenure systems in India. American economic review, 95 (4), 1190–1213.
Book 1.indb 79 2011/12/13 12:10:43 PM
80
Denis Cogneau and Léa Rouanet
Benavot, A. and Riddle, P. 1988. The expansion of primary education, 1870–1940: trends and issues. Sociology of education, 61 (3), 191–210.
Bogin, B. 1999. Patterns of human growth. Cambridge: Cambridge University Press, 2nd ed. 2006.Boyce, J.K. 1986. Kinked exponential models for growth rates estimation. Oxford bulletin of
economics and statistics, 48 (4), 385–391.Bozzoli, C., Deaton, A. and Quintana-Domeque, C. 2009. Adult height and childhood disease.
Demography, 46 (4), 647–-669.Clarence-Smith, W.G. and Ruf, F. 1996. Cocoa pioneer fronts: the historical determinants. In: W.G.
Clarence Smith, ed. Cocoa pioneer fronts since 1800. London: MacMillan, 1–22.Cogneau, D. and Mesplé-Somps, S. 2008. Inequality of opportunity for income in five countries of
Africa. In: J. Bishop and B. Zheng, eds. Inequality and opportunity: papers from the Second Ecineq Society Meeting. Research on economic inequality, 16, Emerald.
Cutler, D., Deaton, A. and Lleras-Muney, A. 2006. The determinants of mortality. Journal of economic perspectives, 20 (3), 97–120.
Deaton, A. 2007. Height, health and development. Proceedings of the national academy of sciences, 104 (33), 13232–13237.
ECOWAS-SWAC/OECD. 2007. Cocoa in West Africa. Atlas on regional integration in West Africa, SWAC/OECD.
Fawzi, W.W., Herrera, M.G., Spiegelman, D.L., El Amin, A., Nestel, P. and Mohamed, K.A. 1997. A prospective study of malnutrition in relation to child mortality in the Sudan. American journal of clinical nutrition, 65, 1062–1069.
Fogel, R.W. 1993. New sources and new techniques for the study of secular trends in nutritional status, health, mortality, and the process of ageing. Historical methods, 26 (1), 5–43.
_____. 1994. Economic growth, population theory and physiology: the bearing of long-term processes on the making of economic policy. American economic review, 84 (3), 369–395.
Frankema, E. 2011. Colonial taxation and government spending in British Africa, 1880–1940: maximizing revenue or minimizing effort? Explorations in economic history, 48 (1), 136–149.
Garenne, M. 2010. Urbanisation and child health in resource poor settings with special reference to under-five mortality in Africa. Archives in childhood disease, doi:10.1136/adc.2009.172585
Gørgens T., Meng, X. and Vaithianathan, R. 2007. Stunting and selection effects of famine: a case study of the great Chinese famine. IZA DP 2543.
Huillery, E. 2008. Histoire coloniale, développement et inégalités dans l’ancienne Afrique Occidentale Française. Thèse de doctorat. Paris: Ecole des Hautes Etudes en Sciences Sociales.
_____. History matters: the long term impact of colonial public investment in French West Africa. American economic journal: applied economics, 1 (2), 176–215.
Jedwab, R., 2011. Why Is Africa Urbanized But Poor? Evidence From Resource Booms in Ghana and Ivory Coast. Mimeograph. Paris School of Economics.
Jousilahti, P., Tuomilehto, J., Vartiainen, E., Eriksson, J. and Puska, P. 2000. Relation of adult height to cause-specific and total mortality: a prospective follow-up study of 31,119 middle-aged men and women in Finland. American journal of epidemiology, 151 (11), 1112–1120.
Komlos, J. and Baten, J. 2004. Looking backward and looking forward – anthropometric research and the development of Social Science History. Social science history, 28 (2), 191–210.
Leon, D.A., Smith, G.D., Shipley, M. and Strachan, D. 1995. Adult height and mortality in London: early life, socioeconomic confounding, or shrinkage?. Journal of epidemiology and community health, 49, 5–9.
Book 1.indb 80 2011/12/13 12:10:43 PM
81
Living conditions in Côte d’Ivoire and Ghana, 1925–1985
Léonard, E. 1997. Transformations et reproduction d’un système agraire pionnier en Côte d’Ivoire: Après la forêt, quelle agriculture?. In: C. Blanc-Pamard and J. Boutrais, coord. Thème et variations: nouvelles recherches rurales au sud. Paris: ORSTOM (Colloques et Séminaires).
Maddison, A. 2003. The world economy: historical statistics. Development Centre Studies, Paris: OECD. See also: http://www.ggdc.net/maddison/
Meng, X. and Qian, N. 2009. The long term consequences of famine on survivors: evidence from a unique natural experiment using China’s great famine. NBER working paper 14917. Cambridge, MA: National Bureau of Economic Research.
Moradi, A. 2009. Towards an objective account of nutrition and health in colonial Kenya: a study of stature in African army recruits and civilians, 1880–1980. Journal of economic history, 96 (3), 720–755.
_____. 2010. Nutritional status and economic development in Sub-Saharan Africa, 1950–1980. Journal of economics and human biology, 8 (1), 16–29.
_____. 2011. Selective mortality or growth after childhood? What really is key to understand the puzzlingly tall adult heights in Sub-Saharan Africa. Mimeograph. University of Sussex.
Nunn, N. 2009. The importance of history for economic development. Annual review of economics, 1 (1), 65–92.
Ravallion, M., Chen, S. and Sangraula, P. 2007. New evidence on the urbanization of global poverty. Population and development review, 33 (4), 667–701.
Ruf, F. 1995. Booms et crises du cacao. Paris: Karthala.Salama, P., Assefa, F., Talley, L., Spiegel, P., van der Veen, A. and Gotwa, C.A. 2001. Malnutrition,
measles, mortality and the humanitarian response during a famine in Ethiopia. Journal of the American medical association, 286 (5), 563–571.
Sear, R., Allal, N. and Mace, R. 2004. Height, marriage and reproductive success in Gambian women. Research in economic anthropology, 23, 203–224.
Sederberg P.C. 1971. The Gold Coast under colonial rule: an expenditure analysis. African studies review, 14 (2), 179–204.
Smedman, L., Sterky, G., Mellander, L. and Wall, S. 1987. Anthropometry and subsequent mortality in children aged 6–59 months in Guinea-Bissau. American journal of clinical nutrition, 46, 369–373.
Sorkin, J.D., Muller, D.C. and Andres, R. 1999. Longitudinal change in the heights of men and women: consequential effects on body mass index. Epidemiologic reviews, 21 (2), 247–260.
Steckel, R.H. 2008. Heights and human welfare: recent developments and new directions. NBER Working Paper 14536. Cambridge, MA: National Bureau of Economic Research.
Strauss, J. and Thomas, D. 1998. Health, nutrition and economic development. Journal of economic literature, 36 (2).
Tabutin, D. and Schoumaker, B. 2004. La démographie de l’Afrique Sub-Saharienne des années 1950 aux années 2000 – Synthèse des changements et bilan statistique. Population, 59 (3–4), 521–622.
Waaler H. T., 1984. Height. Weight and Mortality The Norwegian Experience. Acta Medica Scandinavia, 215 ( S679) 1–56.
Woods, R. 2003. Urban-rural mortality differentials: an unresolved debate. Population and development review, 29 (1), 29–46.
World Bank. 2010. African development indicators. Washington, DC: World Bank publications.
Book 1.indb 81 2011/12/13 12:10:43 PM
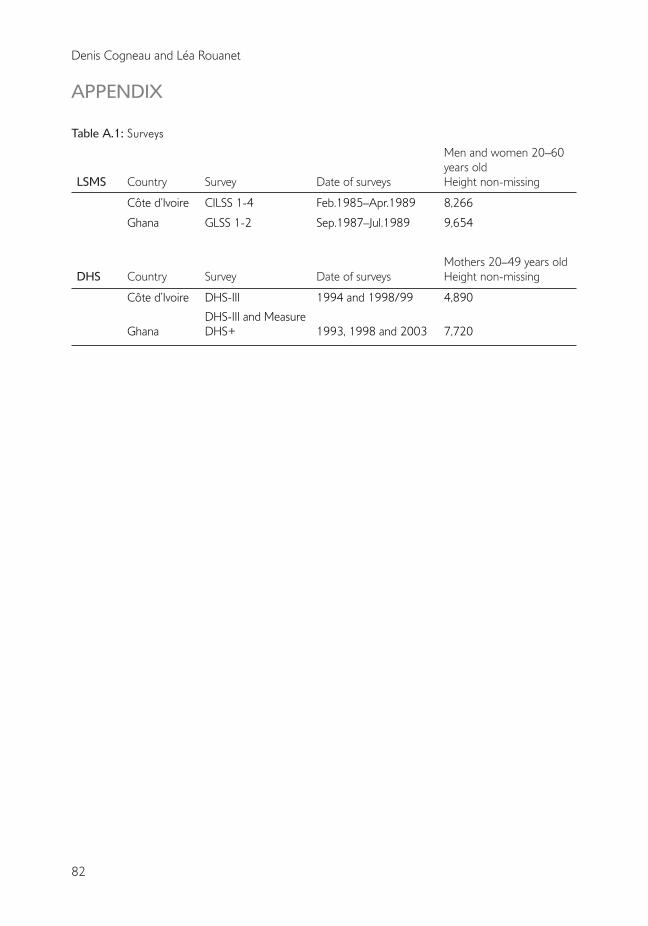
82
Denis Cogneau and Léa Rouanet
APPENDIX
Table A.1: Surveys
LSMS Country Survey Date of surveys
Men and women 20–60 years oldHeight non-missing
Côte d’Ivoire CILSS 1-4 Feb.1985–Apr.1989 8,266
Ghana GLSS 1-2 Sep.1987–Jul.1989 9,654
DHS Country Survey Date of surveysMothers 20–49 years oldHeight non-missing
Côte d’Ivoire DHS-III 1994 and 1998/99 4,890
GhanaDHS-III and Measure DHS+ 1993, 1998 and 2003 7,720
Book 1.indb 82 2011/12/13 12:10:43 PM