Reversible addition fragmentation chain transfer polymerization - RAFT
Upload
independentCategory
view
0download
0
This article was published in the above mentioned Springer issue.The material, including all portions thereof, is protected by copyright;all rights are held exclusively by Springer Science + Business Media.
The material is for personal use only;commercial use is not permitted.
Unauthorized reproduction, transfer and/or usemay be a violation of criminal as well as civil law.
ISSN 0960-3115, Volume 19, Number 8

ORI GIN AL PA PER
Monitoring tropical forest fragmentationin the Zagne-Taı area (west of Taı National Park,Cote d’Ivoire)
C. Chatelain • A. Bakayoko • P. Martin • L. Gautier
Received: 18 June 2009 / Accepted: 31 March 2010 / Published online: 18 April 2010� Springer Science+Business Media B.V. 2010
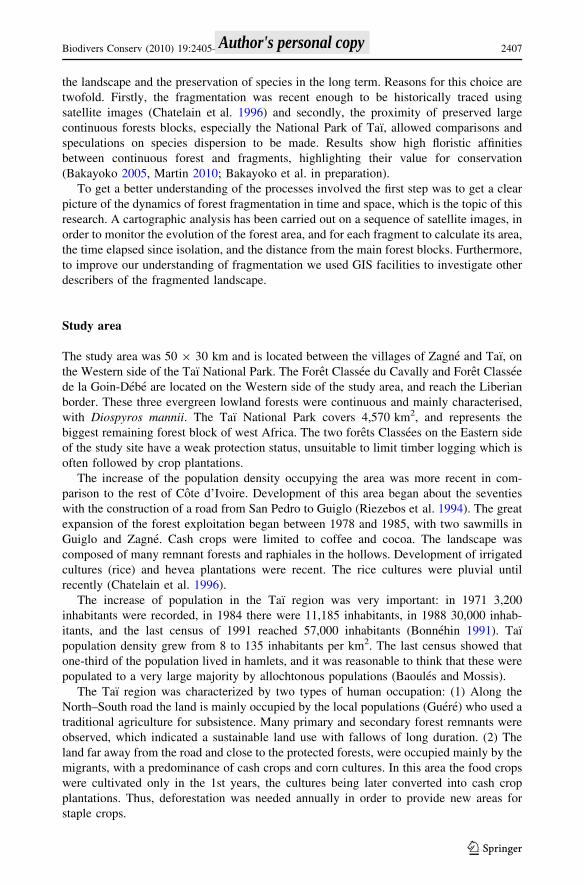
Abstract Deforestation west of the Tai National Park over the last 3 decades has been
dramatic, with forest cover of rural areas decreasing from 89.6% in 1974 to 6.7% in 2003.
The process comprised 3 major steps. During the 10 first years, deforestation was limited to
a ca. 5 km band each side of the main north–south track. From 1984 to 1990 there was a
massive increase in deforestation whose front met the limits of the protected areas, leaving
many forest fragments of various sizes forming a mosaic in the landscape. From 1990 to
2003 these fragments were further deforested by being either totally destroyed or reduced
in size, or further split into smaller units. During these latter 13 years their number was
halved, their average area was reduced by an 8th, and their total area reduced by an 11th. In
addition, a moving cost analysis has indicated that most of the area could now be out of
reach for forest species dispersion. This critical situation may be explained by the increase
of population pressure (due to internal increment as well as massive immigration) causing
increased land cultivation and a growing trend to permanent cash crop cultivation, which
removed important surfaces from the traditional shifting cultivation cycle. Without the
implementation of a forest fragment protection policy local population demands for wood
and non-timber forest products would likely be entirely dependant on protected areas in the
future. Furthermore, deforestation pressure is likely to reach the protected areas which had,
until recently, remained relatively untouched (despite a minor deforestation peak between
1984 and 1990).
Keywords Deforestation � Forest fragmentation � Tropical forest � West Africa �Cote d’Ivoire � Taı National Park
C. Chatelain (&) � P. Martin � L. GautierConservatoire et Jardin botaniques de la Ville de Geneve, Case Postale 60, 1292 Chambesy,Switzerlande-mail: [email protected]
A. BakayokoCentre Suisse de Recherches Scientifiques, B.P. 1303, Abidjan 01, Rep de Cote d’Ivoire
A. BakayokoUFR Sciences de la Nature, Universite d’Abobo-Adjame, B.P. 801, Abidjan 02, Rep de Cote d’Ivoire
123
Biodivers Conserv (2010) 19:2405–2420DOI 10.1007/s10531-010-9847-4
Author's personal copy

Introduction
Deforestation is a major phenomenon in humid West Africa, as elsewhere in the inter-
tropical zone. It implies the decrease and the loss of natural resources for populations
(Usher 1987; Turner 1996). However, deforestation in West Africa is different from, for
instance, Latin America, where deforestation proceeds abruptly, due to total destruction of
forest cover by logging and large-scale agricultural or pastoral purposes. In West Africa
deforestation is a gradual phenomenon which starts with selective timber exploitation and
continues with charcoal production, traditional shifting agriculture, and small-scale cash
crop cultivation. This type of land use leads to a secondary landscape with small forest
fragments scattered among a mosaic of various secondary, post-cultural, successional
vegetation types.
Global forest cover assessments, based on low-resolution satellite imagery, show a
general decline in forest area but do not take into account the fragments \10,000 ha and
thus lead to a pessimistic point of view. However, detailed forest cover assessments based
on high-resolution satellite imagery demonstrated that smaller forest fragments can
account for 10–30% of forest cover (Chatelain et al. 2004).
Conservation incentives have mainly focused on protected areas (National Parks; Clas-
sified Forests; etc.). However, conservation of small forest fragments can play an important
role in conservation of forest plant and animals species (Cordeiro and Howe 2003), firstly,
because they represent an important part in the forest cover, and secondly, because they can
play a role in the connectivity between larger forest areas. On the other hand, these fragments
often represent the only remaining forest product resources for rural populations, so, if these
fragments are overlooked in forest assessments there will be no incentives to promote their
conservation. A recent study in the same area (Kone et al. 2009), demonstrates the influence
of primates on tree regeneration in fragmented forests: 48% of the trees species used by the
local populations are monkey-dispersed. These results highlight the links between forest
fragmentation, regeneration, conservation, and human needs.
At the population level there is conflict between allochtonous populations (migrants
often coming from drier areas to cultivate cash crops) and autochtonous ones, and amongst
these populations between older and younger generations. There is a need to consider both
ethnic (the cultural identity of the forest people) and economic reasons (useful plants) in
helping to promote conservation by reinforcing the position of local stakeholders, and
encouraging them to have a more favourable attitude towards the conservation of these
fragments.
It is important to assess to what extent the conservation of these small forest areas could
have a biological value for the maintenance of natural resources (Kapos 1989). The sus-
tainability of the biological potentialities of these fragments depends on their area, which
has an impact on the size of the plant populations and the stability of the ecological factors
inside them (Saunders et al. 1991; Laurance et al. 1998). The proximity between fragments
to the main continuous forest have an influence on reproduction and propagation of species
(Kadmon and Pulliam 1993; Aizen et al. 2002), thus the research for spatial measurements
seems essential to evaluate the chances of conservation of plant populations (Fahrig and
Merriam 1994).
The importance of forest fragments in conserving species has been widely documented
in South America (Chiarello 1999; Pither and Kellman 2002) and some in Asia (Turner
et al. 1994, 1996), but similar studies in West Africa are obviously needed. The Zagne-Taı
area has been selected to evaluate the changes from continuous forest vegetation into
fragmented forest, and to advance the interest of their conservation for the maintenance of
2406 Biodivers Conserv (2010) 19:2405–2420
123
Author's personal copy
the landscape and the preservation of species in the long term. Reasons for this choice are
twofold. Firstly, the fragmentation was recent enough to be historically traced using
satellite images (Chatelain et al. 1996) and secondly, the proximity of preserved large
continuous forests blocks, especially the National Park of Taı, allowed comparisons and
speculations on species dispersion to be made. Results show high floristic affinities
between continuous forest and fragments, highlighting their value for conservation
(Bakayoko 2005, Martin 2010; Bakayoko et al. in preparation).
To get a better understanding of the processes involved the first step was to get a clear
picture of the dynamics of forest fragmentation in time and space, which is the topic of this
research. A cartographic analysis has been carried out on a sequence of satellite images, in
order to monitor the evolution of the forest area, and for each fragment to calculate its area,
the time elapsed since isolation, and the distance from the main forest blocks. Furthermore,
to improve our understanding of fragmentation we used GIS facilities to investigate other
describers of the fragmented landscape.
Study area
The study area was 50 9 30 km and is located between the villages of Zagne and Taı, on
the Western side of the Taı National Park. The Foret Classee du Cavally and Foret Classee
de la Goin-Debe are located on the Western side of the study area, and reach the Liberian
border. These three evergreen lowland forests were continuous and mainly characterised,
with Diospyros mannii. The Taı National Park covers 4,570 km2, and represents the
biggest remaining forest block of west Africa. The two forets Classees on the Eastern side
of the study site have a weak protection status, unsuitable to limit timber logging which is
often followed by crop plantations.
The increase of the population density occupying the area was more recent in com-
parison to the rest of Cote d’Ivoire. Development of this area began about the seventies
with the construction of a road from San Pedro to Guiglo (Riezebos et al. 1994). The great
expansion of the forest exploitation began between 1978 and 1985, with two sawmills in
Guiglo and Zagne. Cash crops were limited to coffee and cocoa. The landscape was
composed of many remnant forests and raphiales in the hollows. Development of irrigated
cultures (rice) and hevea plantations were recent. The rice cultures were pluvial until
recently (Chatelain et al. 1996).
The increase of population in the Taı region was very important: in 1971 3,200
inhabitants were recorded, in 1984 there were 11,185 inhabitants, in 1988 30,000 inhab-
itants, and the last census of 1991 reached 57,000 inhabitants (Bonnehin 1991). Taı
population density grew from 8 to 135 inhabitants per km2. The last census showed that
one-third of the population lived in hamlets, and it was reasonable to think that these were
populated to a very large majority by allochtonous populations (Baoules and Mossis).
The Taı region was characterized by two types of human occupation: (1) Along the
North–South road the land is mainly occupied by the local populations (Guere) who used a
traditional agriculture for subsistence. Many primary and secondary forest remnants were
observed, which indicated a sustainable land use with fallows of long duration. (2) The
land far away from the road and close to the protected forests, were occupied mainly by the
migrants, with a predominance of cash crops and corn cultures. In this area the food crops
were cultivated only in the 1st years, the cultures being later converted into cash crop
plantations. Thus, deforestation was needed annually in order to provide new areas for
staple crops.
Biodivers Conserv (2010) 19:2405–2420 2407
123
Author's personal copy

Methodology
Image processing
Six remote sensing images have been used for this study. They have been georeferenced,
then classified. The classifications have been subjected to spatial analyses and combined
for a spatio-temporal study. The choice of the image types and the times of observation
have been heavily dependant on availability of images because the study area was usually
hidden by a significant cloud cover. The references of the images used are: LANDSAT
MSS (01.1974), LANDSAT MSS (12.1984), LANDSAT5 TM (12.1990), SPOT XS
(03.1997), SPOT XI (02.2000), LANDSAT ETM (01.2003).
The SPOT image of 1997 was orthorectified in UTM 29 North based on 21 GPS points,
using a linear transformation with residual error of 0.333 pixels. The other images were
orthorectified by using land-mark points resulting from the rectified image of 1997. This
procedure allowed an optimal superimposition of images. A pixel resolution of 20 m for all
images was chosen.
Only the 1997 SPOT image required radiometric corrections. The original digital values
of the blue channel were replaced by a new channel resulting from principal component
analysis, in order to eliminate the very significant haze effect on several zones.
The procedure used for LANDSAT images classification has been described in an earlier
paper (Chatelain et al. 1996). Regarding SPOT images, two different procedures were used.
The SPOT image of 1997 was classified semi-automatically in 20 classes, whereas the SPOT
image of 2000 and LANDSAT image of 2003 were classified automatically by the isocluster
method (a procedure included in the IDRISI software using the minimum distance algorithm
by successive reiterations) in 20 classes. The strong heterogeneity of forest cover required the
use of 5 classes of forest, including the secondary forests, the swamp forests, the depleted
forests and two types of primary forests. After ground-truthing, classes have been grouped in
a secondary class forest and a primary class forest.
Hevea plantations and Raphia-dominated areas identification was almost impossible
with SPOT images whereas they were possible with LANDSAT images. It was also
extremely difficult to separate the secondary thickets from the coffee and cocoa planta-
tions, thus these classes were grouped in a ‘‘thicket-culture’’ class.
Ground-truthing was based on ca. 100 points visited between 1994 and 2000. Further
validation of the classifications has been done by checking the logic sequence of classi-
fication of pixels on the images (e.g.: it was considered that a forest could not have been a
culture 3 or 10 years before). Classifications of 1990 and 2000 images which have infrared
channels and low haze cover are more reliable than those of 1984 or 1997.
Multitemporal analysis
Due to the disparity of the sources of the available images, it was not possible to perform
quantitative comparisons based directly on the reflectance values of the pixels. Instead a
qualitative approach was used, comparing six binary images: forest (F) or non-forest (N).
They have been combined, resulting in an image with 64 classes. The interpretation of
these classes, through merging and elimination of improbable sequences, has resulted in a
final map with only 8 classes, which are shown on the caption of the maps.
Expression of results, especially in annual percentage of deforestation, were of course
dependant on the reference area (inside or outside protected areas). In this respect it is
important to mention that the limits of these protected areas, according to official maps and
2408 Biodivers Conserv (2010) 19:2405–2420
123
Author's personal copy

documents, were not always in accordance with the field reality, the edge of the continuous
forest being sometimes far inside the official limits (e.g. North of the FC du Cavally on
Figs. 1 and 2) and sometimes the reverse. However, official maps and documents were the
only permanent limits on which any sound comparisons could rely.
The total deforestation rate is the annual percentage of deforestation, with respect to
total area (outside as well as inside protected areas), whereas the relative deforestation
rates was the annual percentage of deforestation, with respect to the forest area left in the
preceding image.
Because available images were separated by several years, it was impossible to evaluate
precisely the extent of the deforestation for each particular year. Nevertheless, an attempt
was made to approximate this aspect by identifying cleared zones or culture areas on the
images. The bare soil was classified by calculating the NDVI for each image, and extracting
the corresponding values through density slicing. The pixels classified as bare soil on all
1990, 1997 and 2000 images were considered as permanent bare soil (villages, roads or
rocks) and were not taken into account for calculations, whereas pixels classified as bare soil
only in one or two images were considered as belonging to cleared zones, i.e. cultures.
Fragment analysis
The identification of the fragments has been performed automatically by grouping all forest
pixels that were contiguous by one or more sides, without taking the diagonal connexions
into account. Some large fragments linked to the continuous forest by narrow corridors
were manually separated on the images of 1997 and 2000. This manual separation has not
been used for the 1990 image, because at this date there was still a very important
networking of the forest fragments through broad corridors. Instead, a filter eliminating a
4-pixels wide band around forests was applied and the automatic identification of the
fragments and continuous forest were run again. Before performing further analyses the
fragments less than 0.12 ha (4 pixels) were discarded. The end-product was a map for each
image, with three classes: continuous forest, forest fragments and non-forest. The year of
isolation of a fragment was the year of the first image on which this fragment appeared as
separated from the continuous forest.
For each image, the size of all fragments was measured and the number of fragments
greater than 0.12; 1 and 4 ha were counted. The mean area of all fragments was calculated,
as well as the mean area of fragments greater than 1 ha.
The analysis of fragment areas only could be misleading. Many fragments along hol-
lows had a high area but were elongated, implying much more edge effects than for a
circular fragment of the same area. To take this into account the minimum distance from
the centre of the fragment was measured to the nearest edge. The fragments, having an
internal minimum distance to edge greater than 80 m, have been counted and the others
were not involved in the spatial analysis.
The spatial distribution of fragments is of great importance in evaluating the possibil-
ities of genetic exchange. In the processes of species dispersion, the distance between the
continuous forest where a species is present and the fragment forest where this species
could be dispersed, and vice versa, was of paramount importance, especially for zooch-
orous species. This distance has been measured for each fragment. The mean distance
between all fragments greater than 1 ha has also been calculated for the 2003 image.
However, the spatial distribution of the fragments forming corridors or networks
enhances the chances of genetic exchanges. The more distant the fragments were from each
other, the less dispersion events would be likely. The question of the possibilities of genetic
Biodivers Conserv (2010) 19:2405–2420 2409
123
Author's personal copy

Fig. 1 Evolution map of forest cover in the Taı-Zagne region between 1974 and 1990
2410 Biodivers Conserv (2010) 19:2405–2420
123
Author's personal copy

Fig. 2 Evolution map of forest cover in the Taı-Zagne region between 1990 and 2003
Biodivers Conserv (2010) 19:2405–2420 2411
123
Author's personal copy
exchanges between fragments was addressed by evaluating the density of forest in the
surroundings. However, the calculation of forest density was confined to a reference area and
not to a fragment. The forest density was defined by measuring, the distance to the three
nearest fragments for each fragment, only taking into account fragments more than 1 ha.
An approach integrating distance to continuous forest and density of forest appeared to
be the best way to represent fragmentation and to gauge the chances of species dispersion.
Different friction values were assigned to forest and non-forest areas and the moving cost
to any pixel in the area from the closest forest was calculated. This was performed on the
maps of 1990, 1997, 2000, and 2003 with algorithms proposed by Elkie et al. (1999) in
ARCVIEW, based on work of Mc Garigal and Marks (1994). A first calculation was based
on the assumption that species could only disperse from continuous forests. If all the
fragments had disappeared, the dispersion cost would be a function of the distance to the
continuous forest only. The area of cost lower than 600 units would correspond then to a
zone 1,400 m broad around the continuous forest. A second calculation was performed
assuming that species could also disperse from the biggest fragments, those having an
internal distance in excess of 100 m.
Results
Evolution of global forest cover between 1974 and 2003
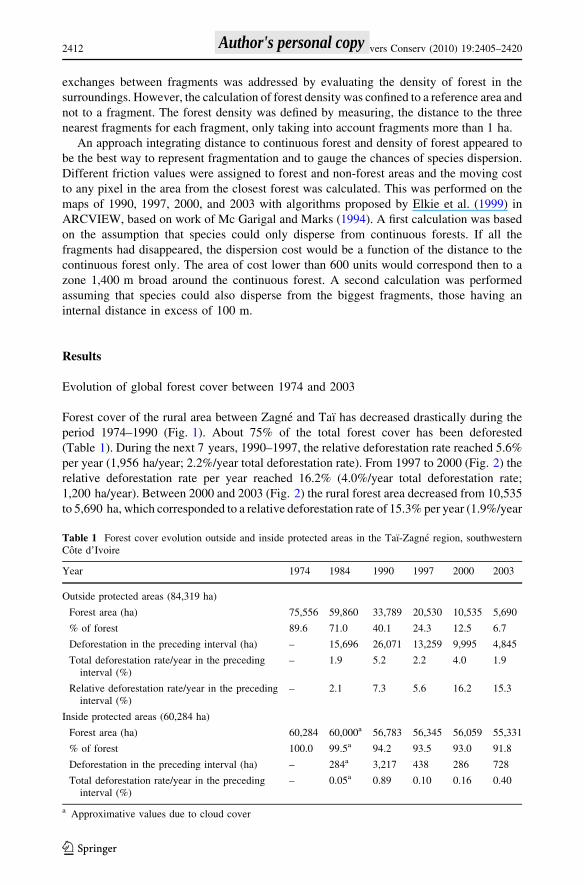
Forest cover of the rural area between Zagne and Taı has decreased drastically during the
period 1974–1990 (Fig. 1). About 75% of the total forest cover has been deforested
(Table 1). During the next 7 years, 1990–1997, the relative deforestation rate reached 5.6%
per year (1,956 ha/year; 2.2%/year total deforestation rate). From 1997 to 2000 (Fig. 2) the
relative deforestation rate per year reached 16.2% (4.0%/year total deforestation rate;
1,200 ha/year). Between 2000 and 2003 (Fig. 2) the rural forest area decreased from 10,535
to 5,690 ha, which corresponded to a relative deforestation rate of 15.3% per year (1.9%/year
Table 1 Forest cover evolution outside and inside protected areas in the Taı-Zagne region, southwesternCote d’Ivoire
Year 1974 1984 1990 1997 2000 2003
Outside protected areas (84,319 ha)
Forest area (ha) 75,556 59,860 33,789 20,530 10,535 5,690
% of forest 89.6 71.0 40.1 24.3 12.5 6.7
Deforestation in the preceding interval (ha) – 15,696 26,071 13,259 9,995 4,845
Total deforestation rate/year in the precedinginterval (%)
– 1.9 5.2 2.2 4.0 1.9
Relative deforestation rate/year in the precedinginterval (%)
– 2.1 7.3 5.6 16.2 15.3
Inside protected areas (60,284 ha)
Forest area (ha) 60,284 60,000a 56,783 56,345 56,059 55,331
% of forest 100.0 99.5a 94.2 93.5 93.0 91.8
Deforestation in the preceding interval (ha) – 284a 3,217 438 286 728
Total deforestation rate/year in the precedinginterval (%)
– 0.05a 0.89 0.10 0.16 0.40
a Approximative values due to cloud cover
2412 Biodivers Conserv (2010) 19:2405–2420
123
Author's personal copy

total deforestation rate; 1,200 ha/year) (Fig. 3). However, these values only reflected
deforestation outside protected areas and global figures, taking into account the whole study
zone, were higher. Between 1974 and 2003, the forest surface in protected areas included in
this study site also decreased from 60,284 to 55,331 ha. Moreover, just outside the study
area, large forest areas were deforested (Cavally hevea block, interior of Goin-Debe pro-
tected forest, North-East of Taı National Park).
The total area cleared annually for cultivation was relatively stable: 2,050 ha on the
January 1990 image, 1,850 ha in March 1997 and 2,500 ha in February 2000. More than
half (from 50% (2000) to 71% (1997)) of these cleared area were already included in the
deforested zones before 1990 and only 15% were recently cleared forest (1997–2000).
Evolution of landscape fragmentation
Evolution of fragments size and number
The majority of the fragments were separated from the continuous forest between 1984 and
1990 (Chatelain et al. 1996). In 1990, 947 fragments greater than 1 ha were observed.
These fragments covered a total of 26,133 ha, with an average area of 28 ha per fragment.
In 2003, the number of fragments was 393, representing 1,923 ha, with an average area of
5 ha (Table 2). Since 1990, a significant portion of the fragments was completely
0
10000
20000
30000
40000
50000
60000
70000
80000
1970 1975 1980 1985 1990 1995 2000 2005
year
hec
tare
s
Fig. 3 Graph of deforestationarea between 1974 and 2003
Table 2 Evolution of the characteristics of forest fragments outside protected areas in the Taı-Zagneregion, southwestern Cote d’Ivoire
Year 1990 1997 2000 2003
Total area of fragments (ha) 26,633 13,885 5,953 2,375
Fragments nb. [ 0.12 ha 2,079 3,110 3,193 1,561
Fragments nb C 1 ha 947 1,273 945 393
Fragments nb C 4 ha 342 487 294 103
Mean area of all fragments (ha) 12.8 3.9 2.2 1.5
Mean area of fragments C 1 ha (ha) 28 10.7 6.3 4.9
Mean of minimum dist. center to edge (m) 55 37 36 35
Fragments nb with minimum dist. C 80 m 374 373 211 74
Mean distance to forest for fragments C 1 ha (m) 1,829 3,112 2,597 2,121
Biodivers Conserv (2010) 19:2405–2420 2413
123
Author's personal copy

deforested and disappeared (60% of fragments bigger than 1 ha were lost between 2000
and 2003), other fragments were partially deforested or further separated into smaller
fragments. With respect to the total fragment area in 1990, the maps show that 41% was
deforested between 1990 and 1997, then another 29% from 1997 to 2000 and 10.6% from
2000 to 2003 (e.g. Fig. 4).
In short, until 1990 deforestation led to the isolation process (Fig. 1) and after 1990
deforestation resulted in fragment destruction or reduction of their size (Fig. 2).
Minimum distance from the center to the edge
In 1990 a mean internal distance value of 55 m was observed, but with maximum values
reaching 400 or even 700 m (Table 2). This mean value decreased to 37 m in 1997 and
remained stable in 2000 and 2003. There were more than 40 fragments having a distance
greater than 200 m in 1990, compared with only 9 fragments in 2000 and none in 2003.
The number of fragments having an internal distance greater than 80 m was similar
between 1990 and 1997 (374 and 373 resp.), but it decreased to 211 in 2000 and then
decreased severely in 2003 (74 fragments).
Topographic distribution
In 2000, 70% of the fragments were localised in hollows. In 2003, the proportion was even
higher. This was noteworthy because on the maps these forest fragments displayed an
elongated shape, but agricultural practices and timber exploitation by the foresters can
explain this situation. Generally, in the majority of the hollows, forests are preserved
because they are unsuitable for coffee, cocoa, hevea, and upland rice cultures. However,
recent development of irrigated rice will undoubtedly contribute to the disappearance of
these last fragments.
Fig. 4 Evolution of forest cover around the village of Tchinkoulay, between 1990 and 2003
2414 Biodivers Conserv (2010) 19:2405–2420
123
Author's personal copy

Distance to continuous forest and period of isolation
The mean distance of fragments greater than 1 ha to continuous forest increased from 1990
to 1997, indicating that continuous forest edge was getting farther from the fragments.
Since 2000 and through 2003 this value was decreasing, due to the fact that deforestation
had reached the limits of the protected areas, while fragments farther away were being
destroyed.
There was no strong correlation between the fragment number and their distance to the
continuous forest. In some places fragment number effectively decreased with increasing
distance from the forest edge, but this was not the general situation. In addition, correlation
between fragment number and age of deforestation in the surrounding area was strong. The
majority of fragments extant in 2000 were located in areas deforested between 1984 and
1990, less than 1,000 m from the continuous forest (Fig. 5; Table 3).
Distance between fragments
In 2000, the majority of fragments (54%) were between 200 and 400 m from their nearest
neighbour, the highest value in the whole area reaching 1,900 m. Considering the average
distance by fragment, 64% of the fragments had values lower than 300 m, with a mean of
438 m.
Comparing 2000 with 2003, there was a twofold increase in the fragments with a nearest
neighbour further than 300 m, indicating that forest fragments were increasingly reduced.
Fig. 5 Moving costs to the nearest forest patch bigger than a minimum internal distance of 100 m in 1990and 2000 (for 2000, all fragments are added on the in blue-green)
Biodivers Conserv (2010) 19:2405–2420 2415
123
Author's personal copy

Moving cost
Calculation of the moving cost from the continuous forest produced a map showing that in
1990 it was possible to reach 96% of the rural area from the continuous forest with a cost
lower than 600 units, against 50% only in 2000. Consistently, the average moving cost was
ten times higher in 2000 than in 1990 to reach any given place in the study zone starting
from continuous forest.
Mapping moving costs from continuous forest or from medium or large fragments (i.e.
with a minimum internal distance in excess of 100 m or approximatively 3–5 ha) showed
that in 2000, the area which could be reached with a cost of less than 600 units was
drastically reduced compared with 1990 (Fig. 5), which revealed a very severe isolation of
the remaining forest fragments. It is noteworthy that there was still an important forest
potential in the central part of the rural area in 2000, despite the fact that these areas were
deforested mostly before the northern or southern part, which in turn displayed very low
possibilities of incoming forest species dispersion.
Discussion
Until 1974, deforestation was restricted to the northern part of the study area, 5 km on both
sides of the main north–south track. From 1974 to 1984, deforestation extended to the
southern part, but was again limited to the surroundings of the track (Chatelain et al. 1996).
From 1984 to 1990, the deforested area and total deforestation rates were maximum and
occurred more or less all over the rural zone of the study area. Human pressure was so
Table 3 Number of forest fragments in 2000 per distance to the continuous forest, area, and isolationperiod
Fragments area
Distance to continuousforest (m)
Isolation period B2 ha 2–4 ha 4–8 ha 8–16 ha 16–32 ha Total
0–1,000 Before 1974 2 0 0 0 0 2
1974–1984 68 2 3 1 0 74
1984–1990 672 59 53 27 17 828
1,000–2,000 Before 1974 16 1 0 0 0 17
1974–1984 114 8 1 1 0 124
1984–1990 336 38 29 15 8 426
2,000–4,000 Before 1974 23 0 0 0 0 23
1974–1984 227 7 4 4 1 243
1984–1990 395 52 22 13 8 490
4,000–6,000 Before 1974 92 9 1 0 0 102
1974–1984 265 19 10 7 1 302
1984–1990 182 35 11 6 5 239
6,000–10,000 Before 1974 68 1 2 0 1 72
1974–1984 88 1 2 2 1 94
1984–1990 63 9 4 3 0 79
Total 2,611 241 142 79 42 3,115
2416 Biodivers Conserv (2010) 19:2405–2420
123
Author's personal copy

intense since 1984 that deforestation encroached severely inside protected areas. It was
during this period that the fragmentation process started with an increasing number of
forest fragments (Chatelain et al. 1996).
From 1990 to 1997 the total deforestation rate decreased markedly but further frag-
mentation proceeded. The highest numbers of fragments[1 ha and[4 ha were recorded in
1997. During this time total fragment area and fragment size decreased sharply, indicating
that fragments were either reduced from the edges, or further separated into smaller units.
The north western part of the study area, as well as the western buffer zone of the Taı
National Park, lost most of their large fragments. There was also a significant increase in
the mean distance of the fragments to the continuous forest, which indicated that ancient
fragments persisted while continuous forest was drawing back. The calculation of moving
costs showed that, apart from the extreme north, the whole study zone was still under
potential dispersion from forests. Deforestation inside protected areas decreased.
From 1997 to 2000, total deforestation rate increased again and almost 90% of the rural
area was now deforested. The pressure on the remaining forest was very high: the relative
deforestation rate outside protected areas reached its maximum value of 16.2%. The total
number of fragments increased slightly, but there was a dramatic decrease in the number of
fragments C 4 ha, and in the mean area of fragments. The distance of fragments to forest
decreased as the main deforestation front had reached the limits of the protected areas and
fragments in the centre part of the study zone were destroyed. The map of moving costs
showed a dramatic decrease in potential dispersion of forest species. Deforestation inside
protected areas remained low.
From 2000 to 2003, the trends observed in the preceding interval persisted, that is, the
destruction of the remaining forest outside protected areas (forest cover decreases to 6.7%),
with a decrease in the number and size of forest fragments, as well as their distance to
continuous forest. This indicated a further destruction of fragments, especially in the
central part of the study area. Furthermore, fragments in hollows and on steep slopes were
increasingly destroyed for cultivation, threatening the many species associated with this
kind of topography. It was noteworthy that a wide zone inside the Taı National Park, just
East of Taı that had been partially deforested between 1984 and 1990, has reverted to
forest.
It will be likely that the vast majority of the fragments mapped in 2003 will be destroyed
within a few years. The remaining forests were mainly located in hollows or on heavy
slopes, which were hitherto considered unsuitable for cultivation, but recently hollows
were used for irrigated rice, and cash crops were grown even on heavy slopes.
The deforestation rates measured outside protected areas in this study were very high.
For comparison, the mean world annual rate reached 0.5% (FAO/UNEP 1981), and rates in
the Abidjan region, were estimated to be 7.6% during 1990–2000 (Chatelain et al. 2004).
In this study area, since 2000, the total rate was getting lower, mainly because there was
not much forest land left outside protected areas., Nevertheless, the relative rate was very
high (15.3%).
Due to different prevailing conditions comparison of mechanisms and consequences of
forest fragmentation with other studies still remained difficult. The experimental studies on
fragmentation in South America (Laurance 1994; Ferreira and Laurance 1997; Laurance
et al. 1998; Tabarelli et al. 1999) or in Europe (Schmitt and Seitz 2002) concerned large
fragments isolated and preserved for a long time. In Africa fragments were continuously
submitted to anthropic pressure, which made their long-term conservation hazardous (Hill
and Curran 2003; Chapman et al. 2003a, b).
Biodivers Conserv (2010) 19:2405–2420 2417
123
Author's personal copy

In the Taı-Zagne area, the processes of fragmentation were extremely rapid and led to
total disappearance of forest (Chatelain et al. 1996; Bakayoko et al. 2002; Bakayoko
2005). Deforestation was the first consequence of timber extraction, but, much more
important was the human pressure for the establishment of new crops (Le Houerou and
Gillet 1986). The traditional land tenure system, which linked the appropriation of the
forests to the act of clearing, increased the dynamics of destruction, especially in
the context of the high demographic rise due to the incoming migrants. According to the
information gathered in the villages and camps (in 2000 and 2001), land requirement was
considerable and many people wished to be allowed to clear the surrounding continuous
forest inside the protected areas. The very high population increase (due to internal pop-
ulation and massive migrant influx) clearly explained this situation, especially when
considering that cash-crop permanent cultures were always growing traditional staple food,
thus shifting cultivation forward. In this context, disappearance of fragments seemed
unavoidable. Due to the high floristic variability observed in the area (Bakayoko et al.
2004; Bakayoko 2005), the consequences of such deforestation on biodiversity conser-
vation were dramatic. Besides, to satisfy their daily requirements for wood, non-timber
forest products and bush meat, the local population would have no other alternative than
protected areas, especially Taı National Park.
The results presented here were obtained in order to help design the field sampling for a
study of forest fragmentation. Originally this study was aiming, firstly, at understanding the
dynamic processes involved in fragmentation and secondly, at giving arguments and a
scientific framework for a forest fragment conservation policy in the study area. While the
first goal has been achieved, the second has almost lost its relevance. The rapidity of
fragment destruction and the ivoirian civil war have not permitted the implementation of
the results obtained in the area of study. In most parts of the study area, the maps appear
outdated and the field inventories (Bakayoko et al. 2004; Bakayoko 2005) will probably be
the first and last available on these fragments.
However, at the same time, there is an encouraging trend towards the conservation of
so-called ‘‘forets villageoises’’ by the PACPNT project (Bonnehin 2000). These forests
have been preserved until now in a traditional way. The forests of Pauleoula, Gouliako II,
Gahably, Zaipobly, Djidoubaye and Zagne have been visited personally, but present
knowledge indicates that only one of these village forests is preserved, for its magical
status.
Regarding protected areas, the official limits mapped from the administrative docu-
ments do not correspond to the actual limits in the field (e.g. North of the FC du Cavally on
Figs. 1 and 2). This situation was very detrimental to conservation and protection of the
forests, especially regarding the credibility of the land law and policy. However, this study
has shown that recent reinforcement of protection around the National Park of Taı has
limited encroachment on this forest and even allowed regeneration in the area illegally
deforested to the East of Taı, in the south eastern part of the study site. On the other hand,
the situation in the Forets Classees is getting worse. Although not yet apparent on the
images analyzed in this study, information collected in the field showed the initiation of a
degradation process in the Foret Classee du Cavally due to timber over-exploitation. The
potential losses are irreplaceable as this forest is known for its particular flora with many
rare narrow-endemic species like Didelotia unifoliata (Alonso et al. 2005; Bakayoko et al.
2004). The classified forests of Goin and Cavally, being much less protected than the
National Park of Taı, are presently under severe threat, especially that of Cavally, where
much timber exploitation—often the first step towards deforestation—has recently been
observed.
2418 Biodivers Conserv (2010) 19:2405–2420
123
Author's personal copy
From a methodological point of view, the implementation of the moving costs analysis
was interesting and gave an integrated graphic representation of the spatial distribution of
fragments. However, the calculation presented here has been performed simply with two
friction coefficients: a low coefficient for the forest and a high coefficient for the non-
forest. The maps derived should thus be considered as raw global approximations. The
actual moving cost for a given species depended on numerous factors like type of fruit and
ethology of animal species in the case of zoochory. The calculations should be performed
separately for each species taking these factors into account when attributing the friction
coefficients. Moreover, a finer approach would imply using a refined vegetation classifi-
cation, with corresponding friction coefficients assigned to each class. Furthermore, each
fragment could even be attributed a diffusion value depending on its size or its vegetation
structure. Integration of these maps with botanical data and with zoological approach on
primates (Kone et al. 2009) or rodents draws further attention on the importance of the
fragments and on the urgent need to stop deforestation in this area.
Acknowledgments Part of field work and image acquisition was supported by the Swiss Academy forNatural Sciences (ASSN) in 1997. The finalization of this study has been possible through a grant of theSwiss National Fund for Research (Grant N� 059469). The Global Land Cover Facility of Maryland hasprovided the most recent images. Logistic and scientific support in the field were supplied by Centre Suissede Recherches Scientifiques en Cote d’Ivoire (CSRS), PACPNT and the Taı Station of the CRA. Thanks areexpressed to the local population for their help in field assistance, discussions, and accommodation. Andmany thanks to Carol Price for English corrections.
References
Aizen MA, Ashworth L, Galetto L (2002) Reproductive success in fragmented habitats: do compatibilitysystems and pollination specialization matter? J Veg Sci 13(6):885–892
Alonso LE, Laugenie F, Rondeau G (2005) A rapid biological assessment of two classified forests in southwestern Cote d’Ivoire. RAP bulletin of biological assessment 34. Conservation International, Wash-ington, DC
Bakayoko A (2005) Influence de la fragmentation forestiere sur la composition floristique et la structurevegetale dans le Sud-Ouest de la Cote d’Ivoire. Universite de Cocody, U.F.R. Biosciences, Abidjan
Bakayoko A, Martin P, Gautier L, Chatelain C, Traore D (2002) Fragmentation forestiere au Sud-Ouest de laCote d’Ivoire: Approche satellitaire et resultats preliminaires. Bioterre, Rev.Inter.Sci.de la Vie et de laTerre N� Special: Actes du colloque international «La recherche en partenariat pour un developpementdurable en Afrique de l’Ouest». Centre Suisse, 27–29 Aout 2001, Abidjan, pp 71–85
Bakayoko A, Martin P, Gautier L, Chatelain C, Traore D, Spichiger R (2004) Etude comparative des massifsforestiers entourant la zone de Taı a Zagne (sud-ouest de la Cote d’Ivoire). Candollea 59(2):191–229
Bonnehin L (1991) Le projet ‘‘Parc National de Taı’’ Situation economique et demographique de la sous-prefecture de Taı et propositions d’activites pilotes. Rapport Convention GTZ/KFW, Abidjan
Bonnehin L (2000) Domestication paysanne des arbres fruitiers forestiers. Cas de Coulas edulis Baill.,Olacaceae, et de Tieghemella heckelii Pierre ex A. Chev., Sapotaceae, autour du Parc National de Taı,Cote d’Ivoire. Tropenbos, Abidjan, Cote d’Ivoire
Chapman CA, Chapman LJ, Vulinec K, Zanne AE, Lawes MJ (2003a) Fragmentation and alteration of seeddispersal processes: an initial evaluation of dung Beetles, seed fate, and seedling diversity. Biotropica35(3):382–393
Chapman CA, Lawes MJ, Naugthon-Treves L, Gillepsie TR (2003b) Primate survival in community-ownedforest fragments: are metapopulation models useful amidst intensive use? In: Marsh LK (ed) Primatesin fragments: ecology and conservation. Kluwer Academic/Plenum Publishers, New York
Chatelain C, Gautier L, Spichiger R (1996) A recent history of forest fragmentation in southwestern IvoryCoast. Biodivers Conserv 5(1):37–53
Chatelain C, Dao H, Gautier L, Spichiger R (2004) Forest cover changes in Cote d’Ivoire and upper Guinea.In: Poorter L, Bongers F, FN’ Kouame, Hawthorne WD (eds) Biodiversity of west African forests, anecological atlas of woody plant species. CAB International, Wageningen, Netherlands
Biodivers Conserv (2010) 19:2405–2420 2419
123
Author's personal copy

Chiarello AG (1999) Effects of fragmentation of the Atlantic forest on mammal communities in south-eastern Brazil. Biol Conserv 89(1):71–82
Cordeiro NJ, Howe HF (2003) Forest fragmentation severs mutualism between seed dispersers and anendemic African tree. Proc Natl Acad Sci USA 100:14052–14054
Elkie PC, Rempel RS, Carr AP (1999) Patch analyst user’s manual: a tool for quantifying landscapestructure. Ont. Min. Nat. Resourc., Northwest Sci. and Technol. Thunder Bay, Ont. NWST Tech. Man.TM-002
Fahrig L, Merriam G (1994) Conservation of fragmented populations. Conserv Biol 8(1):50–59FAO/UNEP (1981) Tropical forest resources assessment, vol 2. Forest resources of tropical Africa, FAO,
RomeFerreira LV, Laurance WF (1997) Effects of forest fragmentation on mortality and damage of selected trees
in central Amazonia. Conserv Biol 11(3):797–801Hill JL, Curran PJ (2003) Area, shape and isolation of tropical forest fragments: effects on tree species
diversity and implications for conservation. J Biogeogr 30(9):1391–1403Kadmon R, Pulliam HR (1993) Island biogeography: effect of geographical isolation on species compo-
sition. Ecology 74(4):977–981Kapos V (1989) Effects of isolation on the water status of forest patches in the Brazilian Amazon. J Trop
Ecol 5:173–185Kone I, Lambert JE, Refisch J, Bakayoko A (2009) Primate seed dispersal and its potential role in main-
taining useful tree species in the Taı region, Cote-d’Ivoire: implications for the conservation of forestfragments. Trop Conserv Sci 1(3):293–306
Laurance WF (1994) Rainforest fragmentation and structure of small mammal communities in tropicalQueensland. Biol Conserv 69:23–32
Laurance WF, Ferreira LV, Merona JMR, Laurance SG, Hutchings RW, Lovejoy TE (1998) Effects of forestfragmentation on recruitment patterns in Amazonian tree communities. Conserv Biol 12(2):460–464
Le Houerou HN, Gillet H (1986) Conservation versus desertization in African arid lands. In: Soule ME (ed)Conservation biology: the science of scarcity and diversity. Sinauer Associates, Sunderland
Martin P (2010) Influence de la fragmentation forestiere sur la regeneration des especes arborees dans leSud-Ouest de la Cote d’Ivoire. Phd, University of Geneva
Mc Garigal K, Marks BJ (1994) Fragstats, spatial pattern analysis program for quantifying landscapestructure. Oregon State University, Corvallisa
Pither R, Kellman M (2002) Tree species diversity in small, tropical riparian forest fragments in Belize,Central America. Biodivers Conserv 11(9):1623–1636
Riezebos EP, Vooren AP, Guillaumet J-L (1994) Le Parc National de Taı, Cote d’Ivoire 1. Synthese desconnaissances. Tropenbos serie 8. Pays-Bas, Wageningen
Saunders DA, Hobbs RJ, Margules CR (1991) Biological consequences of ecosystem fragmentation:a review. Conserv Biol 5(1):18–32
Schmitt T, Seitz A (2002) Influence of habitat fragmentation on the genetic structure of Polyommatuscoridon (Lepidoptera: Lycaenidae): implications for conservation. Biol Conserv 107(3):291–297
Tabarelli M, Mantovani W, Peres CA (1999) Effects of habitat fragmentation on plant guild structure in themontane Atlantic forest of southeastern Brazil. Biol Conserv 91(2–3):119–127
Turner IM (1996) Species loss in fragments of tropical rain forest: a review of the evidence. J Appl Ecol33(2):200–209
Turner IM, Tan HTW, Wee YC, Ibrahim AB, Chew PT, Corlett RT (1994) A study of plant speciesextinction in Singapore: lessons for the conservation of tropical biodiversity. Conserv Biol 8(3):705–712
Turner IM, Chua KS, Ong JSY, Soong BC, Tan HTW (1996) A century of plant species loss from anisolated fragment of lowland tropical rain forest. Conserv Biol 10(4):1229–1244
Usher MB (1987) Effects of fragmentation on communities and populations: a review with application tiwildlife conservation. In: Saunders DA (ed) Nature conservation: the role of remnants of nativevegetation. Surney Bealty and Sons, Australia
2420 Biodivers Conserv (2010) 19:2405–2420
123
Author's personal copy
Copyright © 2022 FDOKUMEN