nal-technical-brochures.pdf - National Aerospace Laboratories
Upload
khangminh22Category
view
4download
0
Multimodal Technologies and Interaction
Article
Acquisition and User Behavior in Online Science Laboratoriesbefore and during the COVID-19 Pandemic
Raghu Raman 1,* , Ricardo Vinuesa 2,* and Prema Nedungadi 1
�����������������
Citation: Raman, R.; Vinuesa, R.;
Nedungadi, P. Acquisition and User
Behavior in Online Science
Laboratories before and during the
COVID-19 Pandemic. Multimodal
Technol. Interact. 2021, 5, 46. https://
doi.org/10.3390/mti5080046
Academic Editor: Mu-Chun Su
Received: 16 June 2021
Accepted: 6 August 2021
Published: 16 August 2021
Publisher’s Note: MDPI stays neutral
with regard to jurisdictional claims in
published maps and institutional affil-
iations.
Copyright: © 2021 by the authors.
Licensee MDPI, Basel, Switzerland.
This article is an open access article
distributed under the terms and
conditions of the Creative Commons
Attribution (CC BY) license (https://
creativecommons.org/licenses/by/
4.0/).
1 Amrita School of Engineering, Amritapuri, Amrita Vishwa Vidyapeetham, Kerala 690525, India;[email protected]
2 Engineering Mechanics, KTH Royal Institute of Technology, SE-10044 Stockholm, Sweden* Correspondence: [email protected] (R.R.); [email protected] (R.V.)
Abstract: The COVID-19 pandemic has resulted in the closure of schools at every level, globally,forcing education to move online. Meeting the needs of students online for Science Lab classes, inparticular, is a challenge since the physical labs are not available to the teachers or students. OLabs isa virtual Science Lab providing a complete learning environment of theory, experimental procedures,videos, animations, simulations, and assessments that capture real lab experiences with the relevantpedagogy. This study looks at the acquisition and behaviors of users, on the OLabs platform, duringpre and COVID-19 times. Using Google Analytics, we observe that, during the pandemic time, usersincreasingly adopted OLabs as a new learning pedagogy for performing experiments as indicated byparameters like the number of users; the number of unique pages viewed per session; time spent onviewing content; bounce rate; and preference for content types such as theory, simulations, videos,and animations.
Keywords: online laboratories; virtual laboratories; COVID-19; simulations; science; school
1. Introduction
The recent COVID-19 crisis has impacted every social sector, and education is noexception. Throughout the world, schools have shifted to online classes. The long-termsocioeconomic impacts of COVID-19 on education are yet to be known. However, thislarge-scale obstruction to the established teaching–learning paradigm is likely to affectmore than 1.6 billion learners of various ages. The World Bank projects that through thelifetime of these students, the monetary cost of this shutdown in terms of lost lifetimeearnings could be up to USD 10 trillion [1]. UNESCO has claimed that the pandemic hasdisrupted the learning of 9 out of 10 students globally [2]. The closure is also more likelyto affect disadvantaged communities and female students more acutely, with many beingforced out of education as family income levels drop due to the pandemic [3]. The adverseeffects are likely to be more pronounced in underdeveloped and developing countrieswhere the education system is less capable of handling this sudden change. In addition,high school students are more likely to be affected given the higher chances of droppingout due to financial vulnerability and the greater challenges involved in learning morecomplex topics [4].
India, with more than 320 million students in school, is no exception to the challengesposed by the pandemic. Education in India is further complicated with multiple languagesof instruction, and many state and national boards controlling the syllabi in variousschools. In general, the approach has been to migrate to online education throughout thecountry. This has largely been necessitated by the nationwide lockdown implementedto minimize the spread of COVID-19. While the country has a relatively high mobilepenetration, providing universal access to online education has been challenging andhas been addressed with varying degrees of success by various states [5]. Despite theseefforts, students, especially those in classes 9 to 12, are affected negatively by this shift.
Multimodal Technol. Interact. 2021, 5, 46. https://doi.org/10.3390/mti5080046 https://www.mdpi.com/journal/mti
Multimodal Technol. Interact. 2021, 5, 46 2 of 16
While theoretical topics can be taught online with a certain degree of efficiency, conductinglaboratory experiments poses additional challenges. This has been addressed globallythrough online laboratories [6], the potential of which in the context of SDG 4 (on qualityeducation) has been discussed in the literature [7]. Multiple platforms have been set up toaddress the need for laboratory learning. The EU, for example, uses a platform termed Go-Lab, which was set up via a consortium of 12 countries [8]. Labster is another applicationthat provides online laboratories for high school students, largely targeting schools inthe United States [9]. Similarly, in India, OLabs, funded by the Government of India,has been the primary provider of online laboratories [10]. The platform was establishedbefore the advent of COVID-19 to provide low-cost lab access to students, removing theconstraints of time and geography. The syllabus of OLabs is compliant with NationalCouncil of Educational Research and Training (NCERT) and Central Board of SecondaryEducation (CBSE) standards, and is the syllabus followed by more than 21,000 centralgovernment-approved schools in India. Despite variations in regional boards, it is possiblefor state examinations boards to use OLabs with minimal modifications.
This study assesses the role of online laboratories in providing laboratory training ofstudents in India during the pandemic. Users of the OLabs platform, which is hosted onthe National Knowledge Network, were from all parts of the country. Specifically, the focuswas on analyzing the acquisition and behaviour patterns of OLabs platform users beforeand during COVID-19 using Google Analytics (GA), while trying to answer the followingresearch questions:
• Did OLabs platform usage increase during COVID-19 as compared to pre COVID-19?• Are there specific OLabs that learners accessed more than others?• What were user preferences for skill types, such as simulation, animation, theory, etc.?• Are there patterns in terms of new users vs. returning users?• Which subjects were most accessed?• Is there a gender bias in terms of OLabs access?• Did users have preference for a device type while accessing OLabs?
2. Literature Review
Online or virtual labs have existed since before the pandemic, providing affordableand accessible science and technology education. In fact, science, technologies, engineeringand maths (STEM) online laboratories have been recognized as an approach to enabling safeand cost-effective exposure to these subjects without the limitations posed by geography orsocioeconomic constraints [11]. Lynch and Ghergulescu [12] reviewed existing platforms forvirtual online labs such as Go-Lab, which is an online ecosystem collecting online labs forworldwide sources aimed at European primary, secondary, and high school students. Theplatform allows instructors to build on existing courses, thereby providing an open platformfor educational enhancement. Similar virtual learning platforms such as Chemcollective,Open-source Physics, and Random provide virtual chemistry, physics, and mathematicslaboratories, respectively. Many of these existing platforms are open source and allowusers to build on each other’s work.
To mention a few more concrete examples, virtual laboratories have also been em-ployed to teach basic electrical concepts [13], principles of material measurements [14],and engineering in general including the use of augmented reality [15–17]. More complexand specific subjects such as neurosurgery are also supported in this space. Though notexactly a virtual laboratory, Neurosurgery Atlas allows users to access information onneurosurgery. It has been shown that the information on this platform can be used tofacilitate an online neurosurgery course [18]. Other universities have addressed the crisisby postponing laboratory courses until the coming academic year and delivering theoreticalcourses through online interfaces. This is especially true in core science and medicine [19].In general, virtual laboratories are accepted as a viable alternative to traditional labs in im-parting practical skills to students and professionals and have a positive effect on students’learning process [11,20–22]. Virtual learning has also gained greater acceptance, especially
Multimodal Technol. Interact. 2021, 5, 46 3 of 16
among STEM students. Naturally, the relevance of such laboratories has become moreevident during the COVID-19 crisis and keeping in mind the possibilities to tailor certainaspects of the learning process by these means [23]. However, a complete lack of practicalexperience may have adverse effects on students, and this will be the first time in recenthistory that high school students across the world graduate with little or no hands-on labexperience [24].
Using virtual laboratories instead or in combination with wet laboratories also hascognitive advantages [25]. Compared to direct instruction, virtual labs are more engag-ing [26], and compared to working with real laboratories in virtual laboratories, studentscan more easily make quick exploratory experiments, and virtual labs can show elementsof a system that cannot be seen in reality. Overall, experimental studies show advantagesin learning performance for learning from virtual labs over direct instruction and often alsoover real laboratories [8]. This work, however, also shows that the inquiry process involvedin learning from labs should be supported to make it effective. This support can be givenby the teacher, but also by providing students with supplemental material like in OLabs orwith interactive apps like in Go-Lab. A second caveat is that students need to be preparedwith the right prior knowledge before entering the learning stage with virtual labs.
The use of virtual laboratories became necessary when the facilities that sustain suchendeavors were not yet in place. For example, an attempt at online chemistry classes in Riode Janeiro was hampered by the lack of necessary technology (smart phones, tablets, orcomputers) among students of lower socioeconomic strata, lack of adequate training of thefaculty to address the shift in platform and pedagogy, and the limitations of the platformitself. In fact, without significant improvements, the approach would not be a validsubstitute for chemistry laboratories [27]. However, an approach based on collaborationby a team of international instructors to facilitate laboratory style learning outside of thetraditional platforms was more valued and had better utility [28]. It should be noted thatthe countries involved in this study were predominantly developed nations where studentswere more likely to have access to technology. The University of Toronto combined shortcampus visits and Labster enabled virtual laboratories to convey the necessary physics,chemistry, and biology lab skills to high school students during the pandemic [29].
In India, OLabs has been the key platform of online laboratory access for high schoolstudents. The platform has more than 173 science labs, and nearly 10,000 teachers acrossthe country have been trained [30]. Additionally, the platform is entirely free and providesanimations, simulations, and questions aimed at providing a deeper theoretical under-standing. Due to these benefits, OLabs has an advantage over its alternatives in India. Infact, practical or laboratory exams carry 30% weightage for science subjects [31]. Earlierstudies on OLabs have shown that while OLabs does not entirely replace the classroomexperience, it does provide a platform for supplementary learning, allowing users to repeatexperiments without any additional cost. This platform also provides a better understand-ing of the theoretical concepts, and most teachers favored the use of OLabs [32]. The needfor reliable technology was also highlighted in previous studies, as teachers correlated theeffectiveness of the software to its speed and responsiveness [30].
In general, the literature identifies online learning and virtual laboratories as usablelearning interventions that can help students during this time of crisis. To understand theeffects of a completely virtual laboratory environment, it is safe to assume virtual labora-tories are likely to be a part of future education even after the COVID-19 pandemic [33].Therefore, it is essential to understand more about their functioning and utility during thepandemic.
While there are reports that virtual labs have been employed by schools, no scientificanalysis on their usage during a pandemic situation is available. This study hopes tocontribute to the literature by studying how a virtual learning platform like OLabs helpedlearners during the pandemic. OLabs is an appropriate platform for this study as it is freeand easily accessible. This allows students of every economic class to access it. Additionally,given that it caters to CBSE and NCERT syllabi it will be relevant to students all over India,
Multimodal Technol. Interact. 2021, 5, 46 4 of 16
thus eliminating any regional or socioeconomic biases from the study. Learner access andregistration is free and unlimited for all content, though students need to log in to accesssome of the simulation content.
Our study paper is structured as follows: first (Section 3), we review OLabs with itskey features as it relates to this paper. Then in Section 4, we discuss the study methodologyand related studies that have used Google Analytics (GA) for acquisition and behavior ofusers. Following this, in Section 5, we interpret and discuss research findings presentedthrough statistical data collected by GA. The final Section 6 is about conclusions and futurescope of research.
3. About OLabs—Online Laboratories for Science Experiments
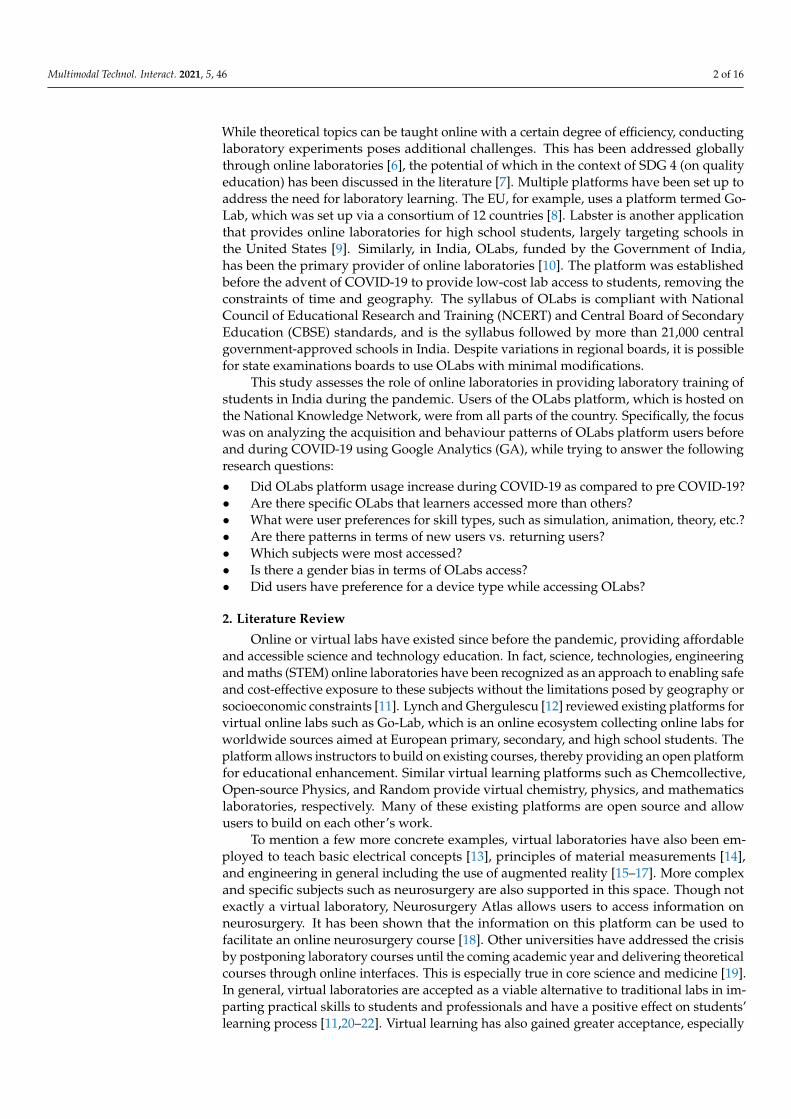
OLabs for school lab experiments provides the ease and convenience of conductinglaboratory experiments online using the internet. Experiments can be done less expensivelyand efficiently. At present, 173 OLabs in physics, chemistry, and biology are available as anopen educational resource on http://www.olabs.edu.in/ (accessed on 13 March 2021). Allthe labs are available in English and translated to local Indian languages including Hindi,Marathi, and Malayalam. For schools with limited internet usage, an offline version is alsoavailable. Typically each lab will have 6 to 8 tabs for different skill types, such as theory,procedure, animation, simulator, video, resources, etc., as shown in Figure 1.
Multimodal Technol. Interact. 2021, 5, x FOR PEER REVIEW 4 of 16
While there are reports that virtual labs have been employed by schools, no scientific analysis on their usage during a pandemic situation is available. This study hopes to con-tribute to the literature by studying how a virtual learning platform like OLabs helped learners during the pandemic. OLabs is an appropriate platform for this study as it is free and easily accessible. This allows students of every economic class to access it. Addition-ally, given that it caters to CBSE and NCERT syllabi it will be relevant to students all over India, thus eliminating any regional or socioeconomic biases from the study. Learner ac-cess and registration is free and unlimited for all content, though students need to log in to access some of the simulation content.
Our study paper is structured as follows: first (Section 3), we review OLabs with its key features as it relates to this paper. Then in Section 4, we discuss the study methodol-ogy and related studies that have used Google Analytics (GA) for acquisition and behav-ior of users. Following this, in Section 5, we interpret and discuss research findings pre-sented through statistical data collected by GA. The final Section 6 is about conclusions and future scope of research.
3. About OLabs—Online Laboratories for Science Experiments OLabs for school lab experiments provides the ease and convenience of conducting
laboratory experiments online using the internet. Experiments can be done less expen-sively and efficiently. At present, 173 OLabs in physics, chemistry, and biology are avail-able as an open educational resource on http://www.olabs.edu.in/ (accessed on 13 March 2021). All the labs are available in English and translated to local Indian languages includ-ing Hindi, Marathi, and Malayalam. For schools with limited internet usage, an offline version is also available. Typically each lab will have 6 to 8 tabs for different skill types, such as theory, procedure, animation, simulator, video, resources, etc., as shown in Figure 1.
Figure 1. OLabs experiment showing different skill types. Figure 1. OLabs experiment showing different skill types.
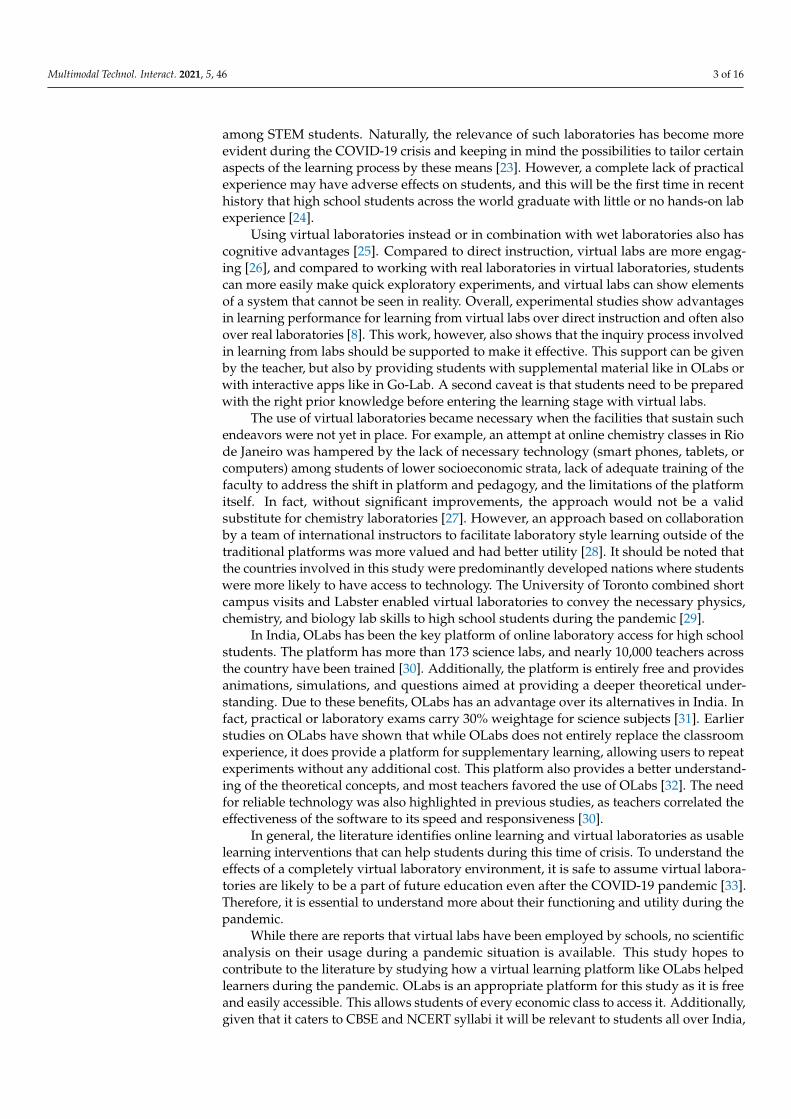
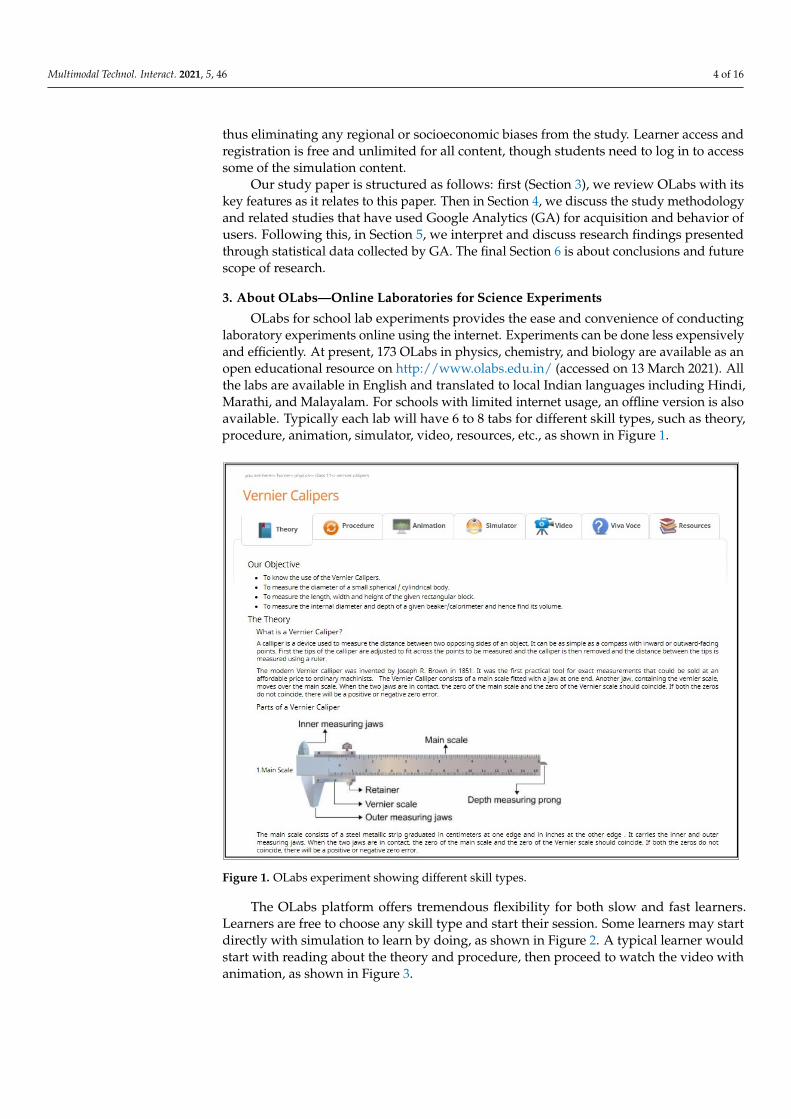
The OLabs platform offers tremendous flexibility for both slow and fast learners.Learners are free to choose any skill type and start their session. Some learners may startdirectly with simulation to learn by doing, as shown in Figure 2. A typical learner wouldstart with reading about the theory and procedure, then proceed to watch the video withanimation, as shown in Figure 3.
Multimodal Technol. Interact. 2021, 5, 46 5 of 16
Multimodal Technol. Interact. 2021, 5, x FOR PEER REVIEW 5 of 16
The OLabs platform offers tremendous flexibility for both slow and fast learners. Learners are free to choose any skill type and start their session. Some learners may start directly with simulation to learn by doing, as shown in Figure 2. A typical learner would start with reading about the theory and procedure, then proceed to watch the video with animation, as shown in Figure 3.
Figure 2. OLabs physics experiment using simulation.
.
Figure 3. OLabs physics experiment using video.
4. Study Methodology Using Google Analytics Google Analytics was chosen, as it has already been employed for similar analysis in
previous studies. For example, Google Analytics data of the Enocta Academic Education Platform (EAEP) were used to analyze user needs and behavior patterns [34]. A similar approach was used to aid teachers in achieving learning goals of students using the eLearning environment Virtual W [35] and online courses [36,37]. Therefore, this paper
Figure 2. OLabs physics experiment using simulation.
Multimodal Technol. Interact. 2021, 5, x FOR PEER REVIEW 5 of 16
The OLabs platform offers tremendous flexibility for both slow and fast learners. Learners are free to choose any skill type and start their session. Some learners may start directly with simulation to learn by doing, as shown in Figure 2. A typical learner would start with reading about the theory and procedure, then proceed to watch the video with animation, as shown in Figure 3.
Figure 2. OLabs physics experiment using simulation.
.
Figure 3. OLabs physics experiment using video.
4. Study Methodology Using Google Analytics Google Analytics was chosen, as it has already been employed for similar analysis in
previous studies. For example, Google Analytics data of the Enocta Academic Education Platform (EAEP) were used to analyze user needs and behavior patterns [34]. A similar approach was used to aid teachers in achieving learning goals of students using the eLearning environment Virtual W [35] and online courses [36,37]. Therefore, this paper
Figure 3. OLabs physics experiment using video.
4. Study Methodology Using Google Analytics
Google Analytics was chosen, as it has already been employed for similar analysis inprevious studies. For example, Google Analytics data of the Enocta Academic EducationPlatform (EAEP) were used to analyze user needs and behavior patterns [34]. A similarapproach was used to aid teachers in achieving learning goals of students using theeLearning environment Virtual W [35] and online courses [36,37]. Therefore, this paperuses Google Analytics data on OLabs to study how this platform was used during thepandemic to support laboratory education.
Google Analytics provides analytical information about the most viewed pages, num-ber of unique visits per page, the average time spent on a page, the bounce rate, newvisitors, and returning visitors used to access the pages and so on [38,39]. Google Analyticsalso provided data on the types of devices used for access. Such information can allow usto consider whether developing a mobile app for OLabs would be helpful or not. The three
Multimodal Technol. Interact. 2021, 5, 46 6 of 16
main devices of interest to the current investigation were desktops, tablets, and mobilephones.
Several indicators from Google Analytics that would allow inference of a level ofengagement for OLabs were retrieved and analyzed. Selected Google Analytic variablesincluded user behavior, content analysis, how users were acquired, overall website engage-ment including pages visited per session, bounce rate, utilization rate of specific labs, anduser access mode and location, etc.
For our study, Google Analytics usage data from 1 April to 30 December 2019 was re-trieved and compared to a similar timeframe in 2020. We called the period April–December2019 pre-COVID-19 and April–December 2020 the COVID-19 period. We assessed theimpact of COVID-19 on school education and usage trends of OLabs between the pre-COVID-19 and COVID-19 periods.
Definitions of the Google—Analytics Indicators
• Pageviews—This indicator specifies the total number of pages viewed, including thoseviewed by the same user several times.
• Unique Pageviews—This indicator considers the number of unique users who haveviewed a page at least once and eliminates users accessing the same page severaltimes.
• Avg. Time on Pages—The average amount of time users spend viewing a specificpage.
• Bounce Rate—This shows how many users leave a website after visiting only onepage. For example, if you read a single article or page on a website and then leave,this is considered a bounce and is considered when calculating the bounce rate.
• New vs. Returning Visitors—New visitors are individuals that have not engaged witha given website in a particular time, while returning site visitors will have made aminimum of one visit to at least one page of a given site in that duration.
5. OLabs Analytics—Usage, Skill Type, Subject, Gender, Device5.1. OLabs Platform Usage Trends
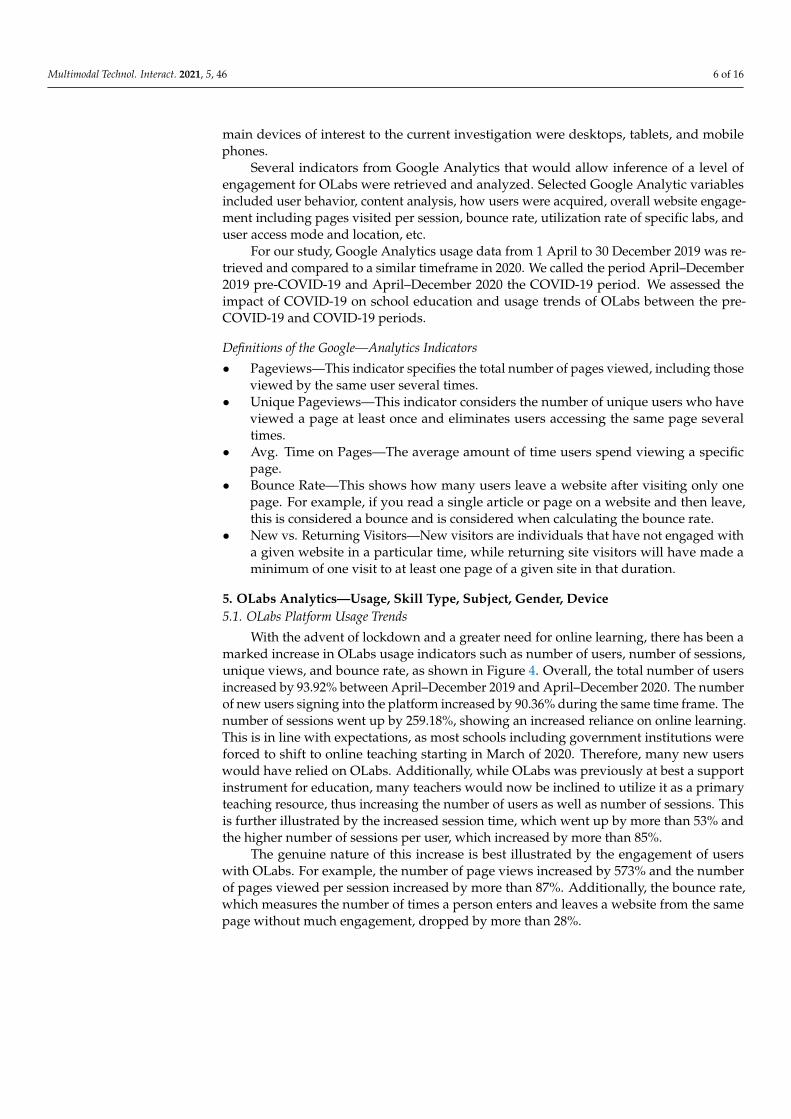
With the advent of lockdown and a greater need for online learning, there has been amarked increase in OLabs usage indicators such as number of users, number of sessions,unique views, and bounce rate, as shown in Figure 4. Overall, the total number of usersincreased by 93.92% between April–December 2019 and April–December 2020. The numberof new users signing into the platform increased by 90.36% during the same time frame. Thenumber of sessions went up by 259.18%, showing an increased reliance on online learning.This is in line with expectations, as most schools including government institutions wereforced to shift to online teaching starting in March of 2020. Therefore, many new userswould have relied on OLabs. Additionally, while OLabs was previously at best a supportinstrument for education, many teachers would now be inclined to utilize it as a primaryteaching resource, thus increasing the number of users as well as number of sessions. Thisis further illustrated by the increased session time, which went up by more than 53% andthe higher number of sessions per user, which increased by more than 85%.
The genuine nature of this increase is best illustrated by the engagement of userswith OLabs. For example, the number of page views increased by 573% and the numberof pages viewed per session increased by more than 87%. Additionally, the bounce rate,which measures the number of times a person enters and leaves a website from the samepage without much engagement, dropped by more than 28%.
Multimodal Technol. Interact. 2021, 5, 46 7 of 16Multimodal Technol. Interact. 2021, 5, x FOR PEER REVIEW 7 of 16
Figure 4. OLabs analytics dashboard comparing April-December 2019 vs. April-December 2020.
The genuine nature of this increase is best illustrated by the engagement of users with OLabs. For example, the number of page views increased by 573% and the number of pages viewed per session increased by more than 87%. Additionally, the bounce rate, which measures the number of times a person enters and leaves a website from the same page without much engagement, dropped by more than 28%.
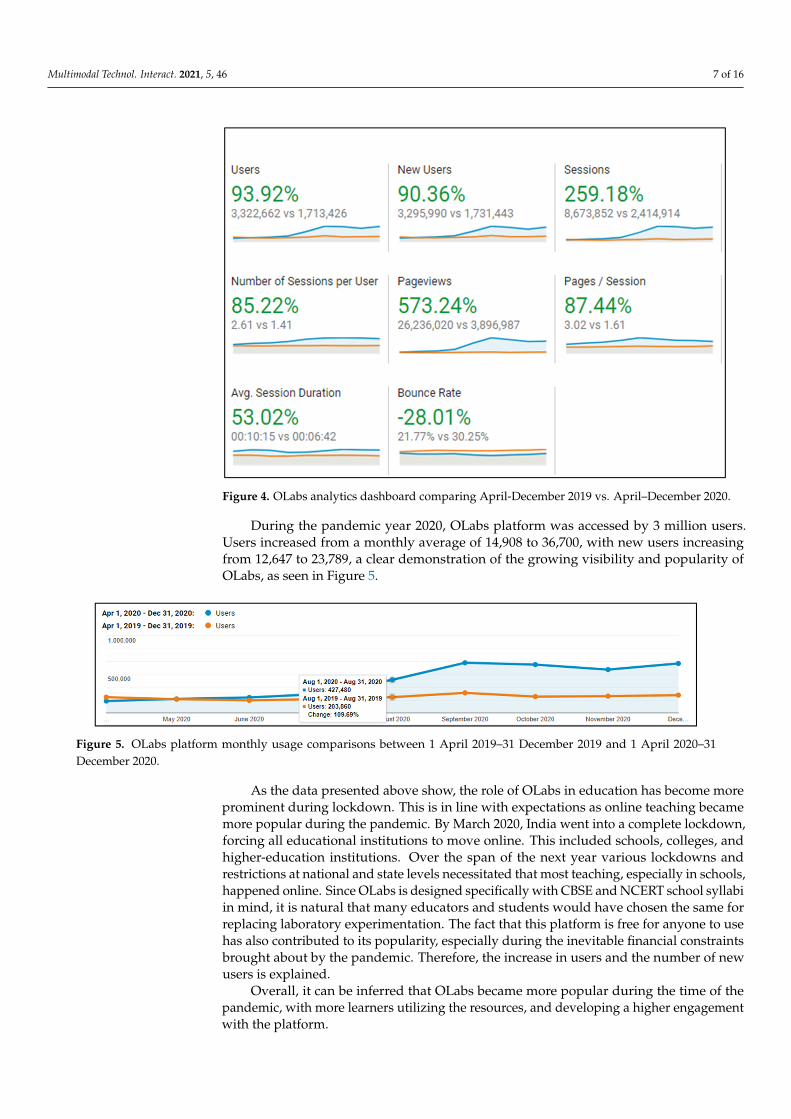
During the pandemic year 2020, OLabs platform was accessed by 3 million users. Users increased from a monthly average of 14,908 to 36,700, with new users increasing from 12,647 to 23,789, a clear demonstration of the growing visibility and popularity of OLabs, as seen in Figure 5.
Figure 5. OLabs platform monthly usage comparisons between 1 April 2019–31 December 2019 and 1 April 2020–31 De-
cember 2020.
As the data presented above show, the role of OLabs in education has become more prominent during lockdown. This is in line with expectations as online teaching became more popular during the pandemic. By March 2020, India went into a complete lockdown, forcing all educational institutions to move online. This included schools, colleges, and higher-education institutions. Over the span of the next year various lockdowns and re-strictions at national and state levels necessitated that most teaching, especially in schools, happened online. Since OLabs is designed specifically with CBSE and NCERT school syl-labi in mind, it is natural that many educators and students would have chosen the same for replacing laboratory experimentation. The fact that this platform is free for anyone to
Figure 4. OLabs analytics dashboard comparing April-December 2019 vs. April–December 2020.
During the pandemic year 2020, OLabs platform was accessed by 3 million users.Users increased from a monthly average of 14,908 to 36,700, with new users increasingfrom 12,647 to 23,789, a clear demonstration of the growing visibility and popularity ofOLabs, as seen in Figure 5.
Multimodal Technol. Interact. 2021, 5, x FOR PEER REVIEW 7 of 16
Figure 4. OLabs analytics dashboard comparing April-December 2019 vs. April-December 2020.
The genuine nature of this increase is best illustrated by the engagement of users with OLabs. For example, the number of page views increased by 573% and the number of pages viewed per session increased by more than 87%. Additionally, the bounce rate, which measures the number of times a person enters and leaves a website from the same page without much engagement, dropped by more than 28%.
During the pandemic year 2020, OLabs platform was accessed by 3 million users. Users increased from a monthly average of 14,908 to 36,700, with new users increasing from 12,647 to 23,789, a clear demonstration of the growing visibility and popularity of OLabs, as seen in Figure 5.
Figure 5. OLabs platform monthly usage comparisons between 1 April 2019–31 December 2019 and 1 April 2020–31 De-
cember 2020.
As the data presented above show, the role of OLabs in education has become more prominent during lockdown. This is in line with expectations as online teaching became more popular during the pandemic. By March 2020, India went into a complete lockdown, forcing all educational institutions to move online. This included schools, colleges, and higher-education institutions. Over the span of the next year various lockdowns and re-strictions at national and state levels necessitated that most teaching, especially in schools, happened online. Since OLabs is designed specifically with CBSE and NCERT school syl-labi in mind, it is natural that many educators and students would have chosen the same for replacing laboratory experimentation. The fact that this platform is free for anyone to
Figure 5. OLabs platform monthly usage comparisons between 1 April 2019–31 December 2019 and 1 April 2020–31December 2020.
As the data presented above show, the role of OLabs in education has become moreprominent during lockdown. This is in line with expectations as online teaching becamemore popular during the pandemic. By March 2020, India went into a complete lockdown,forcing all educational institutions to move online. This included schools, colleges, andhigher-education institutions. Over the span of the next year various lockdowns andrestrictions at national and state levels necessitated that most teaching, especially in schools,happened online. Since OLabs is designed specifically with CBSE and NCERT school syllabiin mind, it is natural that many educators and students would have chosen the same forreplacing laboratory experimentation. The fact that this platform is free for anyone to usehas also contributed to its popularity, especially during the inevitable financial constraintsbrought about by the pandemic. Therefore, the increase in users and the number of newusers is explained.
Overall, it can be inferred that OLabs became more popular during the time of thepandemic, with more learners utilizing the resources, and developing a higher engagementwith the platform.
Multimodal Technol. Interact. 2021, 5, 46 8 of 16
5.2. Most Viewed OLabs
Learners had a preference for labs of certain subjects and within those subjects aninclination to certain skill types, namely theory, simulator, etc., during the COVID-19period. Labs related to physics (Ohm’s law and resistance, Vernier calipers, screw gaugeand Vernier calipers) were the most viewed followed by biology (onion and cheek cells)and chemistry (separation of mixtures using different techniques, tests for the functionalgroups) as observed in Table 1. Learners from class 12 had much higher unique page views,an indication that they were more concerned with school closures and the impendingschool leaving examinations. While the theory skill type was the most viewed (Ohm’slaw and resistance), analyzing the count of views for simulators and average time spenton them, an argument can be made that those learners of theories and skill types relatingto Ohm’s law and resistance and Vernier calipers also used corresponding simulators toreinforce their learnings.
Table 1. Most viewed OLabs as measured by unique pageviews.
Name of the Lab UniquePageviews Skill Type Class Subject Avg. Time on
Page
Ohm’s Law and Resistance 222,798 Theory Class 12 Physics 00:02:25Vernier Calipers 132,498 Theory Class 11 Physics 00:04:23
Ohm’s Law and Resistance 124,846 Simulator Class 12 Physics 00:09:41Onion and Cheek Cells 119,411 Theory Class 9 Biology 00:05:24
Screw Gauge 119,053 Theory Class 11 Physics 00:04:38Vernier Calipers 107,233 Simulator Class 11 Physics 00:13:32
Separation of Mixtures Using DifferentTechniques 102,749 Theory Class 9 Chemistry 00:08:43
Tests for the Functional Groups 83,675 Theory Class 12 Chemistry 00:10:31Determination of Concentration of
KMnO4 solution 79,440 Theory Class 12 Chemistry 00:04:23
Decomposition Reaction 78,108 Theory Class 10 Chemistry 00:07:08Screw Gauge (Simulator) 77,686 Simulator Class 11 Physics 00:09:09
Study of Pollen Germination 71,698 Theory Class 12 Biology 00:02:36Single Displacement Reaction 68,641 Theory Class 10 Chemistry 00:04:40
Separation of Mixtures Using DifferentTechniques 65,523 Theory Class 9 Chemistry 00:26:42
The Potentiometer: Comparison of EMF 65,217 Theory Class 12 Physics 00:03:49
5.3. Understanding Learner Preferences
Science labs are an integral part of high school education and access to these labs hasbeen very limited during lockdowns. Hence, user behavior has varied during the COVID-19 pandemic. While the OLabs videos and animations explain concepts and demonstratehow to perform the experiments in the physical lab, simulations are interactive virtualexperiments that could be used as substitutes for hands-on physical labs. Simulations arehighly interactive, and students may repeat them in case of errors.
We observe that visitors overall have spent more time with interactive simulationsthan watching animations and videos. This is confirmed by the average bounce rate (12.3%),which is lower in the case of simulations with more unique page views of the simulations(3621.6), as seen in Table 2. Hence, it can be inferred that there is preference for simulations.Nevertheless, this could also be attributed to the fact that, due to school closures duringCOVID-19, physical lab work was not possible, making simulations the next best choice tolearn by doing.
Multimodal Technol. Interact. 2021, 5, 46 9 of 16
Table 2. Unique pageviews and average bounce rate.
Total Visitors Average of UniquePageviews Average of Bounce Rate
Simulations 3621.6 12.3%Animations and Video 1915.5 14.0%
5.4. How Many Visitors Are Returning?
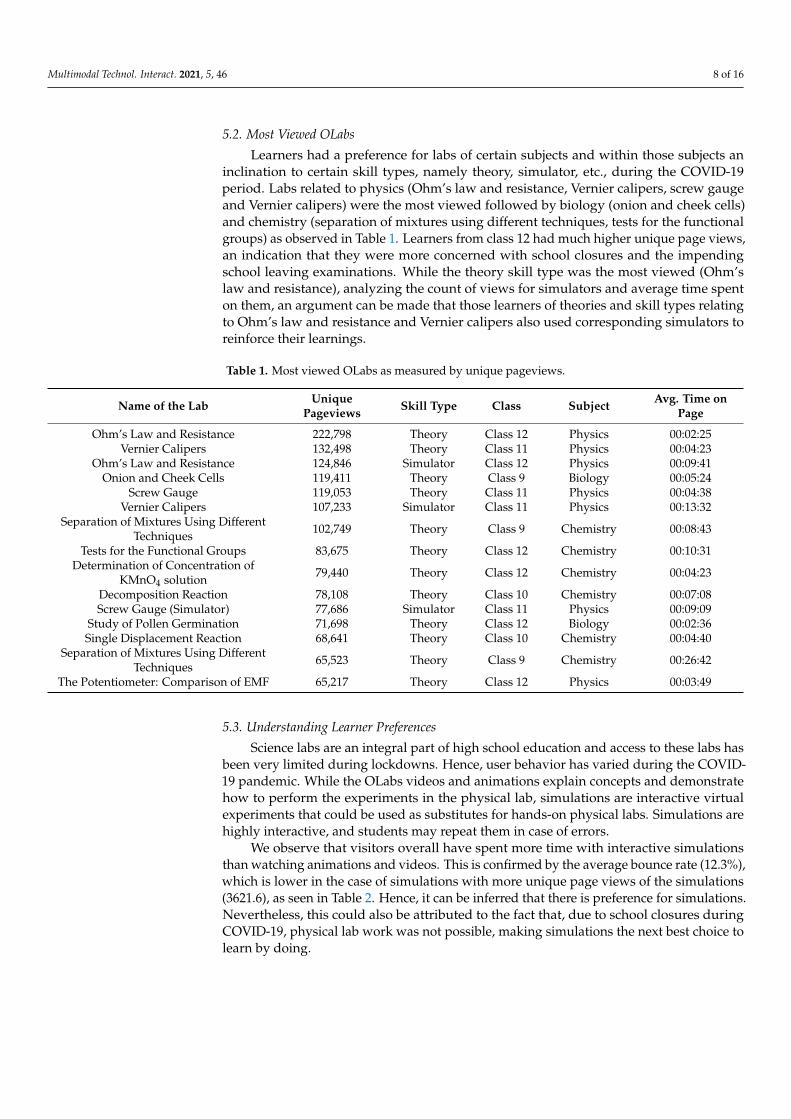
Another indication on the usefulness of the OLabs platform is based on type of visitorsand their preference for skills of a certain type. Both new and returning visitors viewedmore simulations when compared with animations and video, though simulations wereclearly preferred by returning visitors, as seen in Figure 6 (left). As seen in Figure 6 (right),the bounce rate was lower for simulations when compared with animations and video andthese numbers are even lower for returning visitors. This is probably an indication thatboth types of visitors found the learn-by-doing experience with simulations useful.
Multimodal Technol. Interact. 2021, 5, x FOR PEER REVIEW 9 of 16
(12.3%), which is lower in the case of simulations with more unique page views of the simulations (3621.6), as seen in Table 2. Hence, it can be inferred that there is preference for simulations. Nevertheless, this could also be attributed to the fact that, due to school closures during COVID-19, physical lab work was not possible, making simulations the next best choice to learn by doing.
Table 2. Unique pageviews and average bounce rate.
Total Visitors Average of Unique
Pageviews Average of Bounce Rate
Simulations 3621.6 12.3% Animations and Video 1915.5 14.0%
5.4. How Many Visitors Are Returning? Another indication on the usefulness of the OLabs platform is based on type of visi-
tors and their preference for skills of a certain type. Both new and returning visitors viewed more simulations when compared with animations and video, though simulations were clearly preferred by returning visitors, as seen in Figure 6(left). As seen in Figure 6(right), the bounce rate was lower for simulations when compared with animations and video and these numbers are even lower for returning visitors. This is probably an indi-cation that both types of visitors found the learn-by-doing experience with simulations useful.
Figure 6. (Left) Unique pageviews (right) and bounce rate for simulations compared to animations and video combined.
5.5. Top skill Types Used by Learners When data for learners’ interest in various skill types is compared, it is encouraging
to see that theory had the highest average time (10 m 15 s) spent on a page with highest unique pageviews (4,823,389), as observed in Table 3. An interpretation of this result could be that the learners start with reading the theory about the experiment and then try out doing the experiment using simulations and finally they explore other skill types, such as procedure, animations, etc.
Table 3. Time spent, bounce rate, and unique views for various skill types.
Skill Type Avg. Time on Page Avg. of Bounce
Rate Unique Pageviews
Theory 00:10:15 19% 4,823,389 Simulation 00:09:29 9% 2,124,868 Procedure 00:07:00 21% 1,324,577
Video 00:06:00 15% 473,059 Viva Voce 00:04:01 21% 344,163
Figure 6. (Left) Unique pageviews (right) and bounce rate for simulations compared to animations and video combined.
5.5. Top Skill Types Used by Learners
When data for learners’ interest in various skill types is compared, it is encouragingto see that theory had the highest average time (10 m 15 s) spent on a page with highestunique pageviews (4,823,389), as observed in Table 3. An interpretation of this result couldbe that the learners start with reading the theory about the experiment and then try outdoing the experiment using simulations and finally they explore other skill types, such asprocedure, animations, etc.
Table 3. Time spent, bounce rate, and unique views for various skill types.
Skill Type Avg. Time on Page Avg. of Bounce Rate Unique Pageviews
Theory 00:10:15 19% 4,823,389Simulation 00:09:29 9% 2,124,868Procedure 00:07:00 21% 1,324,577
Video 00:06:00 15% 473,059Viva Voce 00:04:01 21% 344,163Animation 00:03:15 11% 729,666Resources 00:02:00 14% 119,087
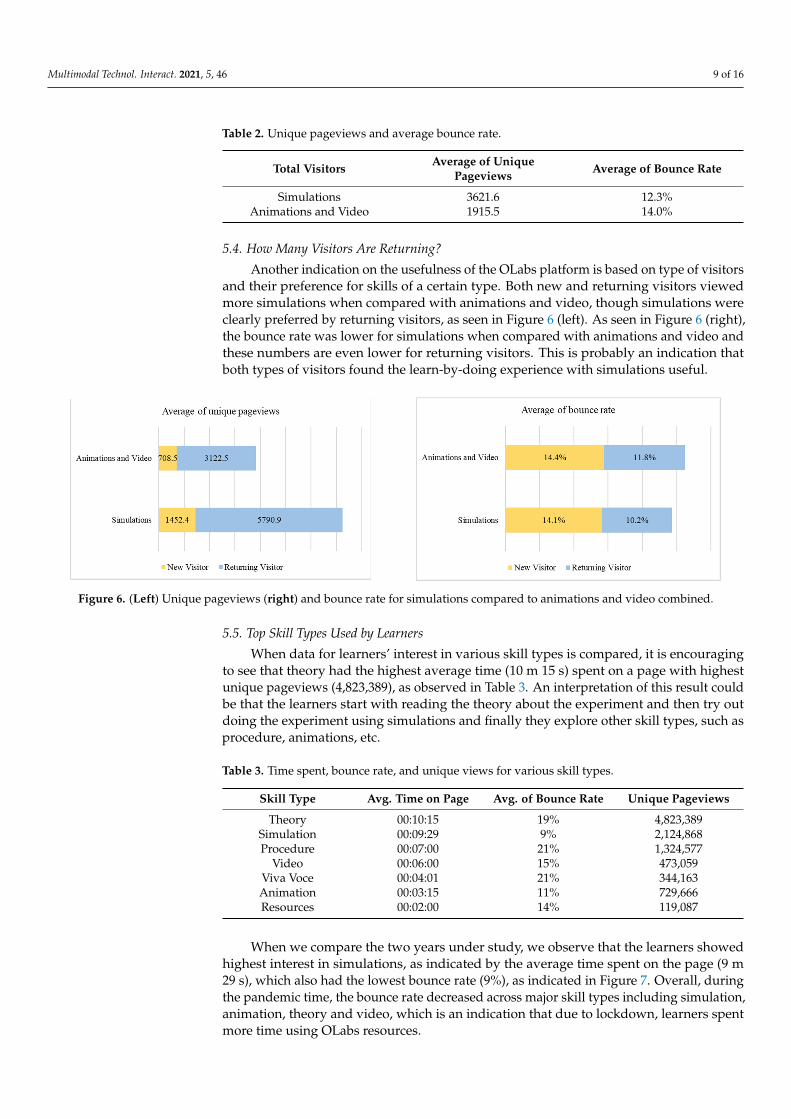
When we compare the two years under study, we observe that the learners showedhighest interest in simulations, as indicated by the average time spent on the page (9 m29 s), which also had the lowest bounce rate (9%), as indicated in Figure 7. Overall, duringthe pandemic time, the bounce rate decreased across major skill types including simulation,animation, theory and video, which is an indication that due to lockdown, learners spentmore time using OLabs resources.
Multimodal Technol. Interact. 2021, 5, 46 10 of 16
Multimodal Technol. Interact. 2021, 5, x FOR PEER REVIEW 10 of 16
Animation 00:03:15 11% 729,666 Resources 00:02:00 14% 119,087
When we compare the two years under study, we observe that the learners showed highest interest in simulations, as indicated by the average time spent on the page (9 m 29 s), which also had the lowest bounce rate (9%), as indicated in Figure 7. Overall, during the pandemic time, the bounce rate decreased across major skill types including simula-tion, animation, theory and video, which is an indication that due to lockdown, learners spent more time using OLabs resources.
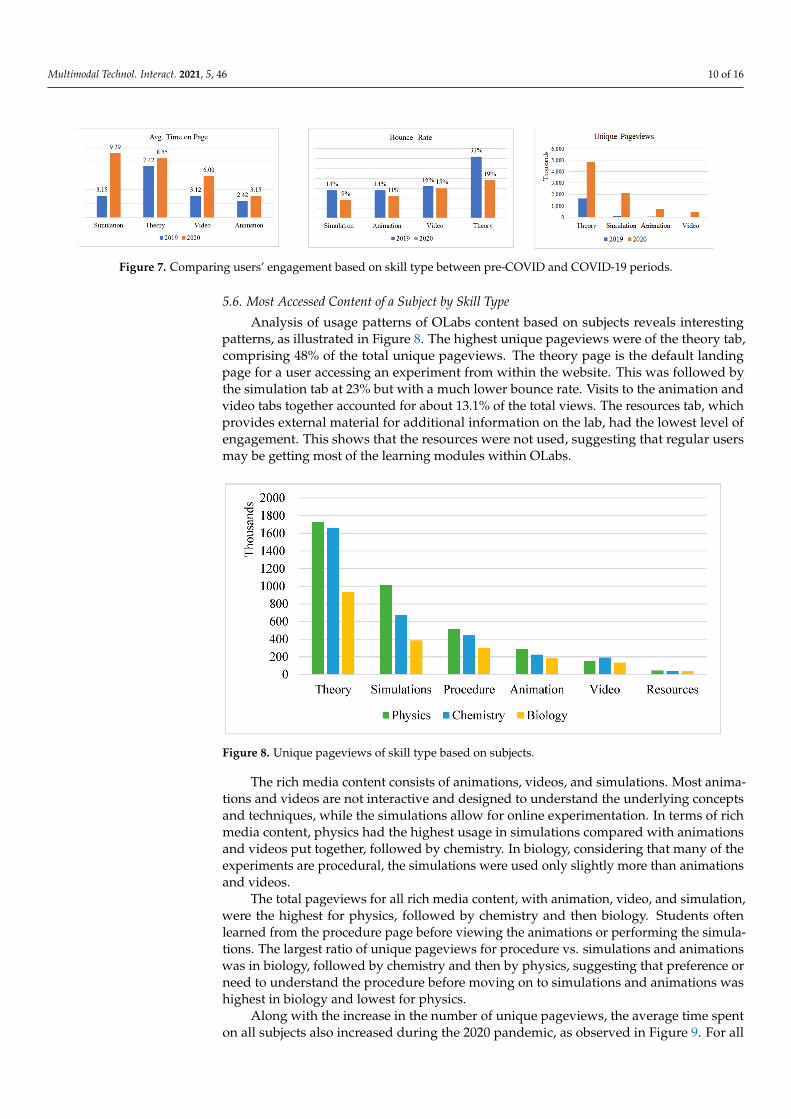
Figure 7. Comparing users’ engagement based on skill type between pre-COVID and COVID-19 periods.
5.6. Most Accessed Content of a Subject by Skill Type Analysis of usage patterns of OLabs content based on subjects reveals interesting
patterns, as illustrated in Figure 8. The highest unique pageviews were of the theory tab, comprising 48% of the total unique pageviews. The theory page is the default landing page for a user accessing an experiment from within the website. This was followed by the simulation tab at 23% but with a much lower bounce rate. Visits to the animation and video tabs together accounted for about 13.1% of the total views. The resources tab, which provides external material for additional information on the lab, had the lowest level of engagement. This shows that the resources were not used, suggesting that regular users may be getting most of the learning modules within OLabs.
Figure 8. Unique pageviews of skill type based on subjects.
The rich media content consists of animations, videos, and simulations. Most anima-tions and videos are not interactive and designed to understand the underlying concepts and techniques, while the simulations allow for online experimentation. In terms of rich media content, physics had the highest usage in simulations compared with animations and videos put together, followed by chemistry. In biology, considering that many of the
Figure 7. Comparing users’ engagement based on skill type between pre-COVID and COVID-19 periods.
5.6. Most Accessed Content of a Subject by Skill Type
Analysis of usage patterns of OLabs content based on subjects reveals interestingpatterns, as illustrated in Figure 8. The highest unique pageviews were of the theory tab,comprising 48% of the total unique pageviews. The theory page is the default landingpage for a user accessing an experiment from within the website. This was followed bythe simulation tab at 23% but with a much lower bounce rate. Visits to the animation andvideo tabs together accounted for about 13.1% of the total views. The resources tab, whichprovides external material for additional information on the lab, had the lowest level ofengagement. This shows that the resources were not used, suggesting that regular usersmay be getting most of the learning modules within OLabs.
Multimodal Technol. Interact. 2021, 5, x FOR PEER REVIEW 10 of 16
Animation 00:03:15 11% 729,666 Resources 00:02:00 14% 119,087
When we compare the two years under study, we observe that the learners showed highest interest in simulations, as indicated by the average time spent on the page (9 m 29 s), which also had the lowest bounce rate (9%), as indicated in Figure 7. Overall, during the pandemic time, the bounce rate decreased across major skill types including simula-tion, animation, theory and video, which is an indication that due to lockdown, learners spent more time using OLabs resources.
Figure 7. Comparing users’ engagement based on skill type between pre-COVID and COVID-19 periods.
5.6. Most Accessed Content of a Subject by Skill Type Analysis of usage patterns of OLabs content based on subjects reveals interesting
patterns, as illustrated in Figure 8. The highest unique pageviews were of the theory tab, comprising 48% of the total unique pageviews. The theory page is the default landing page for a user accessing an experiment from within the website. This was followed by the simulation tab at 23% but with a much lower bounce rate. Visits to the animation and video tabs together accounted for about 13.1% of the total views. The resources tab, which provides external material for additional information on the lab, had the lowest level of engagement. This shows that the resources were not used, suggesting that regular users may be getting most of the learning modules within OLabs.
Figure 8. Unique pageviews of skill type based on subjects.
The rich media content consists of animations, videos, and simulations. Most anima-tions and videos are not interactive and designed to understand the underlying concepts and techniques, while the simulations allow for online experimentation. In terms of rich media content, physics had the highest usage in simulations compared with animations and videos put together, followed by chemistry. In biology, considering that many of the
Figure 8. Unique pageviews of skill type based on subjects.
The rich media content consists of animations, videos, and simulations. Most anima-tions and videos are not interactive and designed to understand the underlying conceptsand techniques, while the simulations allow for online experimentation. In terms of richmedia content, physics had the highest usage in simulations compared with animationsand videos put together, followed by chemistry. In biology, considering that many of theexperiments are procedural, the simulations were used only slightly more than animationsand videos.
The total pageviews for all rich media content, with animation, video, and simulation,were the highest for physics, followed by chemistry and then biology. Students oftenlearned from the procedure page before viewing the animations or performing the simula-tions. The largest ratio of unique pageviews for procedure vs. simulations and animationswas in biology, followed by chemistry and then by physics, suggesting that preference orneed to understand the procedure before moving on to simulations and animations washighest in biology and lowest for physics.
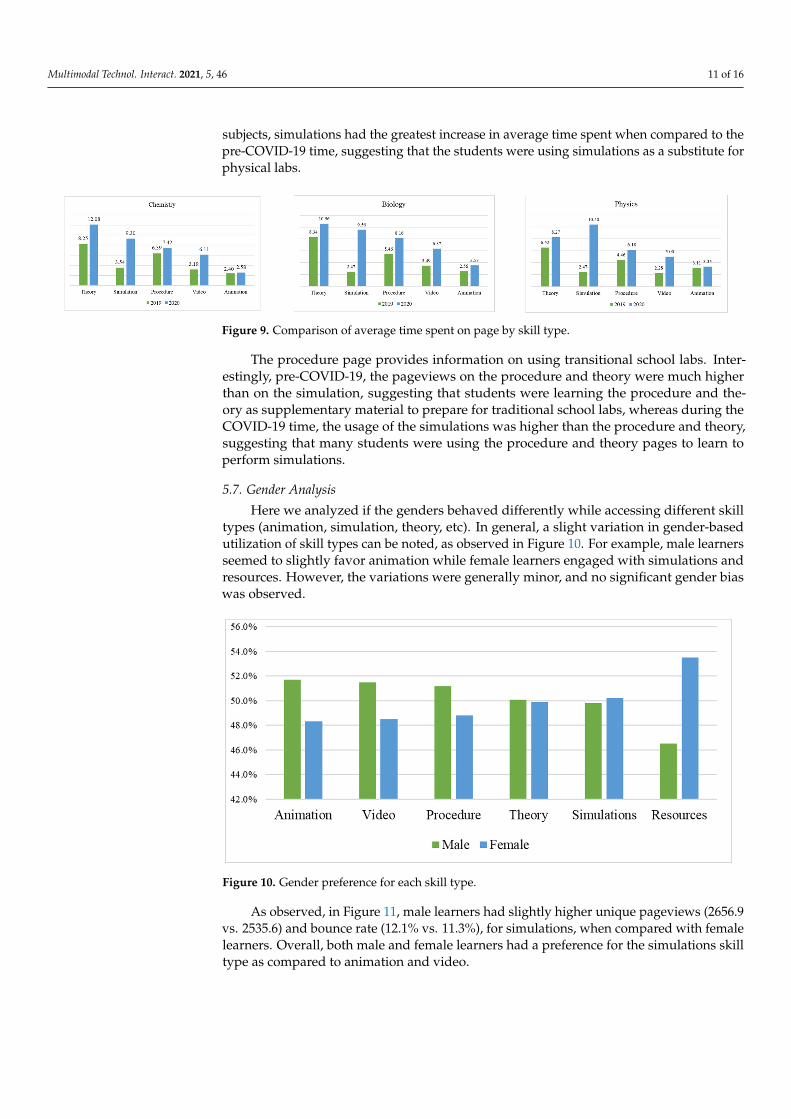
Along with the increase in the number of unique pageviews, the average time spenton all subjects also increased during the 2020 pandemic, as observed in Figure 9. For all
Multimodal Technol. Interact. 2021, 5, 46 11 of 16
subjects, simulations had the greatest increase in average time spent when compared to thepre-COVID-19 time, suggesting that the students were using simulations as a substitute forphysical labs.
Multimodal Technol. Interact. 2021, 5, x FOR PEER REVIEW 11 of 16
experiments are procedural, the simulations were used only slightly more than anima-tions and videos.
The total pageviews for all rich media content, with animation, video, and simula-tion, were the highest for physics, followed by chemistry and then biology. Students often learned from the procedure page before viewing the animations or performing the simu-lations. The largest ratio of unique pageviews for procedure vs. simulations and anima-tions was in biology, followed by chemistry and then by physics, suggesting that prefer-ence or need to understand the procedure before moving on to simulations and anima-tions was highest in biology and lowest for physics.
Along with the increase in the number of unique pageviews, the average time spent on all subjects also increased during the 2020 pandemic, as observed in Figure 9. For all subjects, simulations had the greatest increase in average time spent when compared to the pre-COVID-19 time, suggesting that the students were using simulations as a substi-tute for physical labs.
Figure 9. Comparison of average time spent on page by skill type.
The procedure page provides information on using transitional school labs. Interest-ingly, pre-COVID-19, the pageviews on the procedure and theory were much higher than on the simulation, suggesting that students were learning the procedure and theory as supplementary material to prepare for traditional school labs, whereas during the COVID-19 time, the usage of the simulations was higher than the procedure and theory, suggesting that many students were using the procedure and theory pages to learn to perform simulations.
5.7. Gender Analysis Here we analyzed if the genders behaved differently while accessing different skill
types (animation, simulation, theory, etc). In general, a slight variation in gender-based utilization of skill types can be noted, as observed in Figure 10. For example, male learners seemed to slightly favor animation while female learners engaged with simulations and resources. However, the variations were generally minor, and no significant gender bias was observed.
Figure 9. Comparison of average time spent on page by skill type.
The procedure page provides information on using transitional school labs. Inter-estingly, pre-COVID-19, the pageviews on the procedure and theory were much higherthan on the simulation, suggesting that students were learning the procedure and the-ory as supplementary material to prepare for traditional school labs, whereas during theCOVID-19 time, the usage of the simulations was higher than the procedure and theory,suggesting that many students were using the procedure and theory pages to learn toperform simulations.
5.7. Gender Analysis
Here we analyzed if the genders behaved differently while accessing different skilltypes (animation, simulation, theory, etc). In general, a slight variation in gender-basedutilization of skill types can be noted, as observed in Figure 10. For example, male learnersseemed to slightly favor animation while female learners engaged with simulations andresources. However, the variations were generally minor, and no significant gender biaswas observed.
Multimodal Technol. Interact. 2021, 5, x FOR PEER REVIEW 12 of 16
Figure 10. Gender preference for each skill type.
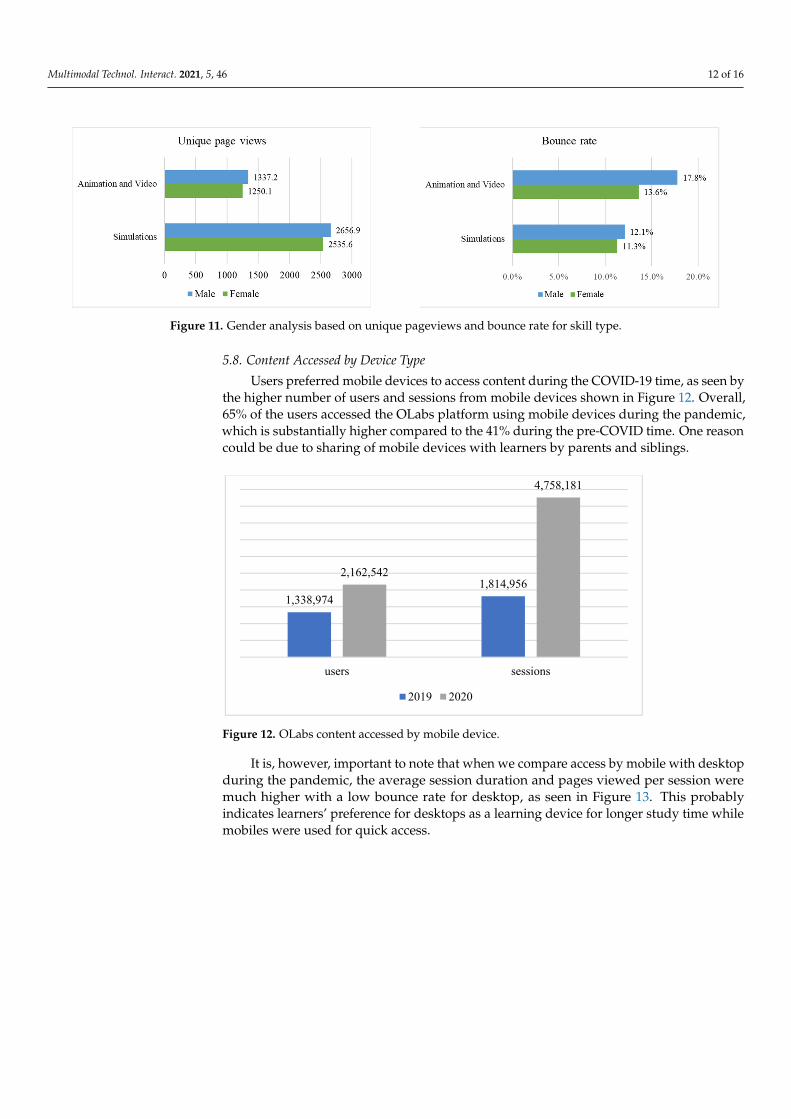
As observed, in Figure 11, male learners had slightly higher unique pageviews (2656.9 vs. 2535.6) and bounce rate (12.1% vs. 11.3%), for simulations, when compared with female learners. Overall, both male and female learners had a preference for the sim-ulations skill type as compared to animation and video.
Figure 11. Gender analysis based on unique pageviews and bounce rate for skill type.
5.8. Content Accessed by Device Type Users preferred mobile devices to access content during the COVID-19 time, as seen
by the higher number of users and sessions from mobile devices shown in Figure 12. Over-all, 65% of the users accessed the OLabs platform using mobile devices during the pan-demic, which is substantially higher compared to the 41% during the pre-COVID time. One reason could be due to sharing of mobile devices with learners by parents and sib-lings.
Figure 10. Gender preference for each skill type.
As observed, in Figure 11, male learners had slightly higher unique pageviews (2656.9vs. 2535.6) and bounce rate (12.1% vs. 11.3%), for simulations, when compared with femalelearners. Overall, both male and female learners had a preference for the simulations skilltype as compared to animation and video.
Multimodal Technol. Interact. 2021, 5, 46 12 of 16
Multimodal Technol. Interact. 2021, 5, x FOR PEER REVIEW 12 of 16
Figure 10. Gender preference for each skill type.
As observed, in Figure 11, male learners had slightly higher unique pageviews (2656.9 vs. 2535.6) and bounce rate (12.1% vs. 11.3%), for simulations, when compared with female learners. Overall, both male and female learners had a preference for the sim-ulations skill type as compared to animation and video.
Figure 11. Gender analysis based on unique pageviews and bounce rate for skill type.
5.8. Content Accessed by Device Type Users preferred mobile devices to access content during the COVID-19 time, as seen
by the higher number of users and sessions from mobile devices shown in Figure 12. Over-all, 65% of the users accessed the OLabs platform using mobile devices during the pan-demic, which is substantially higher compared to the 41% during the pre-COVID time. One reason could be due to sharing of mobile devices with learners by parents and sib-lings.
Figure 11. Gender analysis based on unique pageviews and bounce rate for skill type.
5.8. Content Accessed by Device Type
Users preferred mobile devices to access content during the COVID-19 time, as seen bythe higher number of users and sessions from mobile devices shown in Figure 12. Overall,65% of the users accessed the OLabs platform using mobile devices during the pandemic,which is substantially higher compared to the 41% during the pre-COVID time. One reasoncould be due to sharing of mobile devices with learners by parents and siblings.
Multimodal Technol. Interact. 2021, 5, x FOR PEER REVIEW 13 of 16
Figure 12. OLabs content accessed by mobile device.
It is, however, important to note that when we compare access by mobile with desk-top during the pandemic, the average session duration and pages viewed per session were much higher with a low bounce rate for desktop, as seen in Figure 13. This probably indi-cates learners’ preference for desktops as a learning device for longer study time while mobiles were used for quick access.
Figure 13. OLabs access comparison between mobile and desktop.
6. Discussion Our results first indicate a significant increase of online learning resources after the
start of the COVID-19 pandemic. This increase is reflected not only in terms of access numbers, but also when it comes to the time spent on the platform by students. The cur-rent pandemic has set up an excellent platform to assess the potential of novel e-learning technologies [40], including for instance the potential of augmented-reality (AR) and vir-tual-reality (VR) methods to enhance teaching, as shown by [17]. Focusing on the time spent on the platform, it is important to note that the increase during the pandemic was observed for all the courses, i.e., chemistry, biology and physics, with very similar results among courses. This suggests that the three topics are similarly suited for novel e-learning approaches. Focusing on the types of activities, the most prominent increase of time spent in the platform was observed in the simulation category, where clearly one can develop a number of illustrative and novel techniques in the context of OLabs. Theory, which tradi-tionally has been one of the most challenging aspects for the students, also exhibited a significant increase across the three courses; this indicates that there is significant potential
1,338,9741,814,956
2,162,542
4,758,181
users sessions
2019 2020
Figure 12. OLabs content accessed by mobile device.
It is, however, important to note that when we compare access by mobile with desktopduring the pandemic, the average session duration and pages viewed per session weremuch higher with a low bounce rate for desktop, as seen in Figure 13. This probablyindicates learners’ preference for desktops as a learning device for longer study time whilemobiles were used for quick access.

Multimodal Technol. Interact. 2021, 5, 46 13 of 16
Multimodal Technol. Interact. 2021, 5, x FOR PEER REVIEW 13 of 16
Figure 12. OLabs content accessed by mobile device.
It is, however, important to note that when we compare access by mobile with desk-top during the pandemic, the average session duration and pages viewed per session were much higher with a low bounce rate for desktop, as seen in Figure 13. This probably indi-cates learners’ preference for desktops as a learning device for longer study time while mobiles were used for quick access.
Figure 13. OLabs access comparison between mobile and desktop.
6. Discussion Our results first indicate a significant increase of online learning resources after the
start of the COVID-19 pandemic. This increase is reflected not only in terms of access numbers, but also when it comes to the time spent on the platform by students. The cur-rent pandemic has set up an excellent platform to assess the potential of novel e-learning technologies [40], including for instance the potential of augmented-reality (AR) and vir-tual-reality (VR) methods to enhance teaching, as shown by [17]. Focusing on the time spent on the platform, it is important to note that the increase during the pandemic was observed for all the courses, i.e., chemistry, biology and physics, with very similar results among courses. This suggests that the three topics are similarly suited for novel e-learning approaches. Focusing on the types of activities, the most prominent increase of time spent in the platform was observed in the simulation category, where clearly one can develop a number of illustrative and novel techniques in the context of OLabs. Theory, which tradi-tionally has been one of the most challenging aspects for the students, also exhibited a significant increase across the three courses; this indicates that there is significant potential
1,338,9741,814,956
2,162,542
4,758,181
users sessions
2019 2020
Figure 13. OLabs access comparison between mobile and desktop.
6. Discussion
Our results first indicate a significant increase of online learning resources after thestart of the COVID-19 pandemic. This increase is reflected not only in terms of accessnumbers, but also when it comes to the time spent on the platform by students. Thecurrent pandemic has set up an excellent platform to assess the potential of novel e-learning technologies [40], including for instance the potential of augmented-reality (AR)and virtual-reality (VR) methods to enhance teaching, as shown by [17]. Focusing on thetime spent on the platform, it is important to note that the increase during the pandemicwas observed for all the courses, i.e., chemistry, biology and physics, with very similarresults among courses. This suggests that the three topics are similarly suited for novele-learning approaches. Focusing on the types of activities, the most prominent increaseof time spent in the platform was observed in the simulation category, where clearlyone can develop a number of illustrative and novel techniques in the context of OLabs.Theory, which traditionally has been one of the most challenging aspects for the students,also exhibited a significant increase across the three courses; this indicates that there issignificant potential in using e-learning for improved teaching of theoretical concepts,including support material to enhance the engagement. Interestingly, animation did notshow a notable difference after the pandemic, which suggests that this type of resourcemay not be the most appealing on the OLab platform, perhaps due to the fact that otheralternative resources can be found online for this. Despite small differences in gender, wedid not observe any bias associated with this in our results.
7. Conclusions
Sophisticated virtual-learning platforms with interactivity, animations and simu-lations and remote-lab connections are finding increased usage during the COVID-19pandemic [41,42]. According to the Oxford COVID-19 Government Response Tracker(OxCGRT), India had one of the strictest lockdowns during the year 2020. The averagemonthly stringency score (77.9) was the highest for India for more than nine months in2020. There was complete closure of educational institutions with researchers having verylimited access to physical labs to perform experiments [43,44].
While OLabs has been used as a support tool for school education, as with many onlinelearning platforms, its utility has increased significantly during the pandemic as laboratoryexperimentation in schools could not be conducted due to lockdown restrictions. Schoolteachers are being trained to conduct experiments online using OLabs with emphasis onthe teacher’s role in facilitating active student engagement with the content and with eachother. In line with the National Education Policy 2020 from the Government of India,OLabs will allow for all students to have equal access to quality practical and hands-onexperiment-based learning experiences.
Multimodal Technol. Interact. 2021, 5, 46 14 of 16
The effectiveness of the OLabs platform is best illustrated by the nature of engagementexhibited by the users. For example, the drop in bounce rate indicates that users arewillfully using the platform for learning, not leaving after a superficial interaction. Theincrease in the number of pages viewed per session and an increase in session lengthshow that users are engaging with multiple topics in the same session, spending a longertime engaging in science experiments online. Since no real laboratory work has beenpossible during the pandemic, it is likely that many schoolteachers and students utilizedthis platform as an alternative to laboratory experimentation. In general, the results show agreater degree of engagement and utilization of OLabs during the pandemic. This pointsout that online learning platforms such as OLabs are viewed as viable teaching tools bystudents and teachers. It also points to the fact that OLabs provides value to these users, asindicated by longer sessions and multiple page engagements.
In a country such as India with relatively high internet penetration and low access toeconomic resources, a free online laboratory that aids students is of great relevance. Thiscould be part of the reason why user engagement increased during the pandemic, sinceOLabs is a free platform that could be accessed by students of all socioeconomic strata.Using data obtained from Google Analytics, it is safe to conclude that OLabs and suchplatforms have a role to play in online education. It is also likely that a portion of userswho discovered these platforms due to the lockdown will continue to use them, at least as asupport tool even after the pandemic subsides and normal teaching and learning resumes.Additionally, providing free access to information and scientific learning is crucial in acountry such as India where students typically have access to limited resources.
Considering the substantially increased usage of OLabs, we have proposed that theGovernment of India build a new version of OLabs with more than 350 laboratoriescovering middle school students in new subjects including English and maths. Newage technologies such as augmented reality (AR) and virtual reality (VR) will add a newdimension to OLabs. Select OLabs across subjects and grade levels will have an AR/VRcomponent and we will further study their efficacy. We also intend to build OLabs that arealigned with the Indian Sign Language (ISL) standards for use by students with hearingimpairment.
Author Contributions: Conceptualization, R.R.; methodology, P.N.; software, P.N.; validation, R.R.and P.N.; data curation, R.R.; writing—original draft preparation, R.R. and P.N.; writing—review andediting, R.V. and P.N.; visualization, R.R. All authors have read and agreed to the published versionof the manuscript.
Funding: This research received no external funding.
Data Availability Statement: All data are included in the manuscript itself.
Acknowledgments: This work derived direction and ideas from the Chancellor of Amrita VishwaVidyapeetham, Mata Amritanandamayi Devi.
Conflicts of Interest: The authors declare no conflict of interest.
References1. Pant, A.; Scott, S.; Nguyen, P.H. How to Support Students and the Learning Process during India’s Covid-19 School Closures. 2020.
Available online: https://www.ifpri.org/blog/how-support-students-and-learning-process-during-indias-covid-19-school-closures (accessed on 7 January 2021).
2. ICEF. With 9 in 10 Students Affected by Covid-19 Closures, How Is the Shift to Online Going So Far? 2020. Available online: https://monitor.icef.com/2020/04/with-9-in-10-students-affected-by-covid-19-closures-how-is-the-shift-to-online-going-so-far/ (ac-cessed on 7 January 2021).
3. Aristovnik, A.; Keržic, D.; Ravšelj, D.; Tomaževic, N.; Umek, L. Impacts of the Covid-19 pandemic on life of higher educationstudents: A global perspective. Sustainability 2020, 12, 8438. [CrossRef]
4. Qazi, A.; Naseer, K.; Qazi, J.; AlSalman, H.; Naseem, U.; Yang, S.; Hardaker, G.; Gumaei, A. Conventional to online educationduring Covid-19 pandemic: Do develop and underdeveloped nations cope alike. Child. Youth Serv. Rev. 2020, 119, 105582.[CrossRef] [PubMed]
Multimodal Technol. Interact. 2021, 5, 46 15 of 16
5. Nair, S. Online Education Has a Mountain of Problems in India, but It Can Become Accessible, Inclusive If States Are MoreProactive—India News, Firstpost. 2020. Available online: https://www.firstpost.com/india/online-education-has-a-mountain-of-problems-in-india-but-it-can-become-accessible-inclusive-if-states-are-more-proactive-8571541.html (accessed on 7 January2021).
6. Pennisi, E. During the Pandemic, Students Do Field and Lab Work Without Leaving Home. 2020. Available online: https://www.sciencemag.org/news/2020/07/during-pandemic-students-do-field-and-lab-work-without-leaving-home (accessed on7 January 2021).
7. Vinuesa, R.; Azizpour, H.; Leite, I.; Balaam, M.; Dignum, V.; Domisch, S.; Felländer, A.; Langhans, S.D.; Tegmark, M.; Nerini,F.F. The role of artificial intelligence in achieving the Sustainable Development Goals. Nat. Commun. 2020, 11, 233. [CrossRef][PubMed]
8. de Jong, T. The guided inquiry learning principle in multimedia learning. In The Cambridge Handbook of Multimedia Learning, 3rded.; Mayer, R.E., Fiorella, L., Eds.; Cambridge University Press: Cambridge, UK, 2005.
9. Thisgaard, M.; Makransky, G. Virtual learning simulations in high school: Effects on cognitive and non-cognitive outcomes andimplications on the development of STEM academic and career choice. Front. Psychol. 2017, 8, 805. [CrossRef] [PubMed]
10. Nedungadi, P.; Malini, P.; Raman, R. Inquiry based learning pedagogy for chemistry practical experiments using OLabs. InAdvances in Intelligent Informatics; Springer: Cham, Switzerland, 2015; pp. 633–642.
11. Stegman, M.A. Comment on Zacharia et al., A review of data about effectiveness of guidance in computer supported, inquirybased learning laboratories and simulations. Educ. Technol. Res. Dev. 2021, 69, 259–262. [CrossRef]
12. Lynch, T.; Ghergulescu, I. Review of virtual labs as the emerging technologies for teaching STEM subjects. In Proceedings of theINTED2017 11th International Technology Education Development Conference, Valencia, Spain, 6–8 March 2017; pp. 6082–6091.
13. Gunawan, G.; Harjono, A.; Sahidu, H.; Herayanti, L. Virtual laboratory to improve students’ problem-solving skills on electricityconcept. J. Pendidik. IPA Indones. 2017, 6, 257–264. [CrossRef]
14. Jannati, E.D.; Setiawan, A.; Siahaan, P.; Rochman, C. Virtual laboratory learning media development to improve science literacyskills of mechanical engineering students on basic physics concept of material measurement. J. Phys. Conf. Ser. 2018, 1013, 012061.[CrossRef]
15. Available online: http://kth.diva-portal.org/smash/record.jsf?pid=diva2%3A1424456&dswid=-3870 (accessed on 12 April 2021).16. Ramírez, J.; Soto, D.; López, S.; Akroyd, J.; Nurkowski, D.; Botero, M.L.; Bianco, N.; Brownbridge, G.; Kraft, M.; Molina, A. A
virtual laboratory to support chemical reaction engineering courses using real-life problems and industrial software. Educ. Chem.Eng. 2020, 33, 36–44. [CrossRef]
17. Hedenqvist, C.; Romero, M.; Vinuesa, R. Improving the Learning of Mechanics through Augmented Reality. Technol. Knowl. Learn.2021, 1–22. [CrossRef]
18. Davidson, B.; Alotaibi, N.M.; Hendricks, B.K.; Cohen-Gadol, A.A. Popularity of online multimedia educational resources inneurosurgery: Insights from The Neurosurgical Atlas project. J. Surg. Educ. 2018, 75, 1615–1623. [CrossRef]
19. Amir, L.; Tanti, I.; Maharani, D.A.; Wimardhani, Y.; Julia, V.; Sulijaya, B.; Puspitawati, R. Student Perspective of Classroom andDistance Learning Method During Covid-19 Pandemic in The Undergraduate Dental Study Program. BMC Med. Educ. 2020, 20,392. [CrossRef] [PubMed]
20. Achuthan, K.; Nedungadi, P.; Kolil, V.; Diwakar, S.; Raman, R. Innovation Adoption and Diffusion of Virtual Laboratories; InternationalAssociation of Online Engineering: Wien, Austria, 2020.
21. De Jong, T.; Linn, M.C.; Zacharia, Z.C. Physical and virtual laboratories in science and engineering education. Science 2013, 340,305–308. [CrossRef] [PubMed]
22. Ma, J.; Nickerson, J.V. Hands-on, simulated, and remote laboratories: A comparative literature review. ACM Comput. Surv.(CSUR) 2006, 38, 7-es. [CrossRef]
23. Zhai, X. Advancing automatic guidance in virtual science inquiry: From ease of use to personalization. Educ. Technol. Res. Dev.2021, 69, 255–258. [CrossRef]
24. India Today Web. From Lab Work to Placements: How Graduating Students Can Deal with Covid-19 Lockdown Crisis.2020. Available online: https://www.indiatoday.in/education-today/featurephilia/story/covid-19-lockdown-how-graduating-students-can-deal-with-year-end-crisis-1669087-2020-04-20 (accessed on 7 January 2021).
25. Menon, R.; Sridharan, A.; Sankar, S.; Gutjahr, G.; Chithra, V.V.; Nedungadi, P. Transforming attitudes to science in rural Indiathrough activity based learning. AIP Conf. Proc. 2021, 2336, 040003.
26. Haridas, M.; Nedungadi, P.; Raman, R. Incorporating CTML principles in tablet-based learning. In Proceedings of the 2017International Conference on Technological Advancements in Power and Energy (TAP Energy), Kollam, India, 21–23 December2017; pp. 1–6.
27. Soares, R.; de Mello, M.C.S.; da Silva, C.M.; Machado, W.; Arbilla, G. Online Chemistry Education Challenges for Rio de JaneiroStudents during the Covid-19 Pandemic. J. Chem. Educ. 2020, 97, 3396–3399. [CrossRef]
28. Campbell, C.D.; Challen, B.; Turner, K.L.; Stewart, M.I. #DryLabs20: A New Global Collaborative Network to Consider andAddress the Challenges of Laboratory Teaching with the Challenges of Covid-19. J. Chem. Educ. 2020, 97, 3023–3027.
29. Callaghan, N.I.; Khaira, S.; Ouyang, A.; Cadavid, J.L.; Chang, H.H.; Diep, P.; Ivanov, N.; Li, G.; Li, N.T.; Tran-Nguyen, N.;et al. Discovery: Virtual Implementation of Inquiry-Based Remote Learning for Secondary STEM Students During the Covid-19Pandemic. Biomed. Eng. Educ. 2020, 1, 87–94. [CrossRef]
Multimodal Technol. Interact. 2021, 5, 46 16 of 16
30. Chandrashekhar, P.; Prabhakaran, M.; Gutjahr, G.; Raman, R.; Nedungadi, P. Teacher Perception of OLabs Pedagogy. In FourthInternational Congress on Information and Communication Technology; Springer: Singapore, 2020; pp. 419–426.
31. ZeeBiz. CBSE 2021 Exam: Big Changes in Class 12 Question Paper Pattern, Check Details Here. 2020. Available on-line: https://www.zeebiz.com/education/news-cbse-2021-exam-big-changes-in-class-12-question-paper-pattern-check-details-here-141494 (accessed on 7 January 2021).
32. Prabhakaran, M.; Pantina, C.; Gutjahr, G.; Raman, R.; Nedungadi, P. Effectiveness of Online Labs Teacher Training Workshop. InProceedings of the 2018 IEEE 18th International Conference on Advanced Learning Technologies (ICALT), Mumbai, India, 9–13July 2018; pp. 249–251.
33. Glassey, J.; Magalhães, F.D. Virtual labs–love them or hate them, they are likely to be used more in the future. Educ. Chem. Eng.2020, 33, 76–77. [CrossRef]
34. Özen, Z.; Kartal, E.; Emre, I.E. Analysis of a learning management system by using Google analytics: A case study from Turkey.In Technology Management in Organizational and Societal Contexts; IGI Global: Hershey, PA, USA, 2018; pp. 198–220.
35. Benito, J.C.; García-Peñalvo, F.J.; Therón, R.; Maderuelo, C.; Pérez-Blanco, J.S.; Zazo, H.; Martín-Suárez, A. Using softwarearchitectures to retrieve interaction information in eLearning environments. In Proceedings of the 2014 International Symposiumon Computers in Education (SIIE), Logrono, Spain, 12–14 November 2014; pp. 117–120.
36. Luo, H.; Rocco, S.; Schaad, C. Using Google Analytics to understand online learning: A case study of a graduate-level onlinecourse. In Proceedings of the 2015 International Conference of Educational Innovation through Technology (EITT), Wuhan,China, 16–18 October 2015; pp. 264–268.
37. Sheu, F.R.; Shih, M. Evaluating NTU’s OpenCourseWare project with Google Analytics: User characteristics, course preferences,and usage patterns. Int. Rev. Res. Open Distrib. Learn. 2017, 18, 100–122. [CrossRef]
38. Google Analytics Overview. Data Collection and Management. 2016. Available online: https://www.google.com/analytics/standard/features/ (accessed on 27 June 2017).
39. Google Analytics. Understanding Traffic Sources in Google Analytics. 2017. Available online: http://www.practicalecommerce.com/Understanding-Traffic-Sources-in-Google-Analytics (accessed on 27 June 2017).
40. Dickson-Deane, C. Moving practical learning online. Educ. Technol. Res. Dev. 2021, 69, 235–237. [CrossRef]41. Raman, R.; Sairam, B.; Veena, G.; Vachharajani, H.; Nedungadi, P. Adoption of online proctored examinations by university
students during COVID-19: Innovation diffusion study. Educ. Inf. Technol. 2021, 1–20. [CrossRef]42. Radhamani, R.; Kumar, D.; Nizar, N.; Achuthan, K.; Nair, B.; Diwakar, S. What virtual laboratory usage tells us about laboratory
skill education pre-and post-COVID-19: Focus on usage, behavior, intention and adoption. Educ. Inf. Technol. 2021, 1–19.[CrossRef]
43. Hale, T.; Thomas, B.; Noam, A.; Cameron-Blake, E.; Hallas, L.; Kira, B.; Majumdar, S.; Petherick, A.; Phillips, T.; Tatlow, H.; et al.“Variation in Government Responses to COVID-19” Version 9.0. In Blavatnik School of Government Working Paper; University ofOxford: Oxford, UK, 2020. Available online: www.bsg.ox.ac.uk/COVIDtracker (accessed on 10 December 2020).
44. Raman, R.; Vinuesa, R.; Nedungadi, P. Bibliometric Analysis of SARS, MERS, and COVID-19 Studies from India and Connectionto Sustainable Development Goals. Sustainability 2021, 13, 7555. [CrossRef]
Copyright © 2022 FDOKUMEN