Epidemiological Study on Hospital Acquired Infections and ...
J. theor. Biol. (1999) 196, 473–482Article No. jtbi.1998.0837, available online at http://www.idealibrary.com.on
0022–5193/99/004473+10 $30.00/0 7 1999 Academic Press
Acquired Immunity of a Schistosomiasis Transmission Model—Analysisof the Stabilizing Effects
H M Y*† F A B C‡
*IMECC—Depart. Mat. Aplicada, Universidade Estadual de Campinas,Caixa Postal 6065, CEP 13081-970 Campinas, SP, Brasil and
‡USP-M, DIM, Av. Dr. Arnaldo, 455, SP, Brasil
(Received on 15 September 1998, Accepted on 21 September 1998)
A semi-stochastic model for schistosomiasis was developed based on the immune responsebuilt up by human host after elapsing a fixed period of time L from the first infection, andon the parasite infection with multiple occurrences.
Both acquired immunity and multiple parasite infections reproduced a great endemicstability for the disease and a high value for the basic reproduction ratio.
7 1999 Academic Press
1. Introduction
In a previous paper (Yang et al., 1997), wedeveloped a semi-stochastic model taking intoaccount the acquired immunity and the multipleentrance of cercaria per infective event. Whenthe model is fitted to the data, it matches the ageprevalence data well but can only capture thegeneral trends for the egg output and dispersionof this output.
However, we would like to stress that thegoodness of fit by itself should not be consideredsufficient for accessing to model adequacy. Forinstance, the model by Holford & Hardy (1976),which encompasses the age-dependent frequencycontact with infested water, fits the prevalenceextremely well with four parameters, but it failsin two aspects: to explain the observed strongstability, as in May’s model (see below), andunderestimates more than May’s model the basic
reproduction ratio (Yang, 1985). Holford &Hardy explained the descendent phase of theprevalence curve due to the reduction in thewater contact rate with age (Chandiwana &Woolhouse, 1991; Dalton & Pole, 1978). This isnot entirely supported by experimental evidence(Barbour, 1985; Wilkins, 1977). The latter workcompared the egg outputs by males and femalesand found essentially no difference, although thetwo groups have different water contact rates.Therefore, the model should explain the ob-served stability of the steady state.
First, we transport the following steady-statefindings from Yang et al. (1997). The forces ofinfection ls and lc for the non-immune andimmune individuals, respectively, were assumedto be related by
lc = f(z)ls, (1)
where z is the time interval counted from the firstinfection and f(z) represents the effect of
†Author to whom correspondence should be addressed.E-mail: hyunyang.ime.unicamp.br
. . . . . 474
immunity and for the purposes of this paper weconsider
f(z)=6 1;fQ 1
for 0E zQLfor zeL.
(2)
The other result is the average number of adultworms per person in a community m, given by
m=v $ ls
mw + mh−01−
lc
ls1×
l2s e− mhL
(ls + mh) (mw + mh)1, (3)
where mw and mh are, respectively, the harboredworm by host and the human host mortalityrates, L is the time period elapsed to build up theimmunity, and v is the average parasite entranceper infective event.
Equation (3) for the average number of wormsper person in a community itself is not acomplete schistosomiasis model. In fact, ls and lc
are unrelated up to this moment to the snailpopulation. Hence, we need the proportion ofsnails that are infected and shedding cercaria toclose the vital cycle, and then, to perform theanalysis of the stability of the steady state. Inorder to do this we shall use May’s model (May,1977) for the snail population. Briefly, May’smodel treats deterministically a constant sizesnail population and considers that the snailsbegin to release cercaria (shedding snails) after aperiod of time t from the first infection (calledlatent snails, those already infected but notreleasing cercaria yet) (Sturrock & Webbe, 1971).
In this paper we address the problem: isacquired immunity capable of explaining thestability of the steady state? We conclude that wecan improve on this with our model.
2. Epidemiological Implications of AcquiredImmunity
In this section we analyse the main epidemio-logical implications of the acquired immunity ona schistosomiasis transmission model. As we
shall see, a model without immunity is almostincapable of explaining the stability of thedisease, a point already stressed by Barbour(1978, 1982). To perform the stability analysis,we use the result of May’s model (May, 1977) forsnails. From this model, the proportion ofshedding snails, z, in equilibrium, is given by
z=0 m0sase− m'st
+1z*1−1, (4)
where as is the snail transmission rate, m's is themortality rate of latent snails, m0s is the mortalityrate of the shedding snails, i.e. the infected snails(latents) that had survived the incubation periodt and are eliminating cercaria, and z* is themaximum attainable value for the proportion ofshedding snails which is
z*=e− u'st
m0sm's
−0m0sm's
−11 e− m'st
. (5)
May’s model is a modification of Macdonald’s(1965) model encompassing the above differen-tial mortality rates and the incubation period t.
The average number of adult worms perperson in a community, eqn (3), and the averageproportion of shedding snails, eqn (4), give thestationary scenario of the epidemic. It is usual toexpress these average values in terms of twodimensionless transmission parameters T1 and T2
(Bradley & May, 1978) and the basic reproduc-tion ratio R0. The latter can also be expressed interms of T1 and T2. For completeness we definethe two dimensionless transmission parametersT1 and T2, which were used by Nasell & Hirsch(1973) and May (1977).
The parameter T1 is the overall transmissionfrom human to snail which encompasses all theprobabilistic events occurring in the environ-ment. It is given by
T1 =
12hEP1Nh
m0s(6)
where hE is the number of eggs shed by eachcouple of schistosomes per unit of time; P1 is theprobability of a released egg to develop to
— 475
miracidia and to infect a snail and Nh is the totalpopulation of human host. As we are notconcerned about the mating between male andfemale worms, given by mating function f(m)(May, 1977), for this reason we set a half for theprobability of mating when there is m averageadult worms per person. This constant matingfunction also describes hermaphroditichelminthiasis modelling (Nasell, 1985).
The second parameter T2 is the overalltransmission from snail to human whichencompasses all the probabilistic events occur-ring in the environment. It is given by
T2 =hCP2Ns
mw(7)
where hC is the number of cercaria released by aninfected snail per unit of time; P2 is theprobability of a cercariae to infect a human hostand Ns is the total population of snails.
Therefore, the stationary picture can be seen interms of the transmission parameters T1 and T2.Hence, the parasite transmission rate amongnon-immune individuals (ls), the parasite trans-mission rate among immune individuals (lc) andthe snail transmission rate (as) must be defined interms of these parameters. The snail trans-mission rate can be defined as
as = m0s mT1 (8)
and the parasite transmission rate amongnon-immune individuals as
ls =(mw + mh) zT2 (9)
Both rates are dependent on the environmentthrough T1 and T2. The two transmission ratescome from the migration rates in the stochasticmodel by Nasell & Hirsch (1973) set to beproportional to the expected values of sheddingsnails and mated worms. Finally, the parasitetransmission rate among immune individualswill be defined separately according to ourassumptions regarding to it (obviously ls isalways dependent on the environment):
(1) lc is dependent on the environment, thatis, it is proportional to both the proportion of
shedding snails and the dimensionless trans-mission parameters (Subsection 2.1);
(2) lc is independent on the environment, butis determined only by immunity, that is, it is notproportional to both the proportion of sheddingsnails and the dimensionless transmission par-ameters (Subsection 2.2).
Next, we analyse the stability of the epidemio-logical parameters to the variations of T1 and T2,which are expected to vary widely from region toregion. We show that a much greater variationin T1 and T2 is allowed in a model with acquiredimmunity than in Macdonald’s and May’smodels.
Let us first consider a model without immunity(May, 1977), that is, we present the May’s modelfindings. From the average number of adultworms per person given by May’s model(m= ls/mw) and from eqn (4), using thedefinitions (8) and (9), we can rewrite theproportion of shedding snails as
z(R0)= z* 01−1R01, (10)
where R0 is the basic reproduction ratio,
R0 = e− m'stT1T2, (11)
and T1 and T2 are the two dimensionlesstransmission parameters, which were definedabove.
In our model, the average number of adultworms per person is given by (3) and theproportion of shedding snails is given by (4) asMay’s model. Using definitions (8) for the snailtransmission rate and (9) for the parasitetransmission rate among non-immune individ-uals, we can rewrite the average number of adultworms per person and the proportion ofshedding snails at equilibrium in terms of one ofthe transmission parameters, say T2, and of thereproduction ratio R. Since the parasite trans-mission rate among immune individuals lc willbe defined in following subsections according tocases (1) and (2) above, meanwhile we canexpress m and z as functions of genericparameters M1 and M2 related to the expressions
. . . . . 476
concerned to lc. Hence, after some algebraicmanipulations, we obtained
where the reproduction ratio R is
R=ve− m'stM2
dT1T2 (14)
and the relative life expectancy between wormsand humans is
d=Lw
Lh(15)
with the life expectancy of humans and wormsbeing Lh =(mh)−1 and Lw =(mw + mh)−1, respect-ively.
2.1. 1: lc
In this case, we set the parasite transmissionrate among immune individuals, substituting f(z)in eqn (1) by b, as
lc = bls (16)
with, of course, 0E bQ 1. As ls depends on theenvironment, then the relation (16) reflects thefact that the environment also affects thetransmission of parasite among individuals whohad built up the immune response.
When lc depends on the environment, theexpressions M1 and M2 take the forms
M1 =1−(1− b) e− mhL (17)
andM2 = d (18)
whereas R is here defined as the basicreproduction ratio R0 as (from M2 = d)
R0 =ve− m'stT1T2 (19)
This value of R0 is identical to that obtained inMay’s model, eqn (11), when multiple entries ofcercaria are allowed. This result is in agreementwith Anderson & May’s (1991) statement thatimmunity does not affect R0.
Let us observe now how this model fits to thefield data. From data described by Sturrock, forBiomphalaria glabrata (1972) and for Bulinus(Physopsis) nasutus productus (1967) snails, usingm's =10.8 years−1, m0s =21.6 years−1 andt=0.083 years, we first estimate the snailtransmission rate. The result was as =0.921years−1 (Yang, 1990). Those values of m's , m0s andt will be applied to fit the model toepidemiological data from Touros region (Biom-phalaria glabrata) and from Misungwi region(Bulinus truncatus). The resulted estimation of z*is about 0.25 for both regions. The steady-statevalue for z was arbitrarily set at 0.1.
By doing this, the results of the model with lc
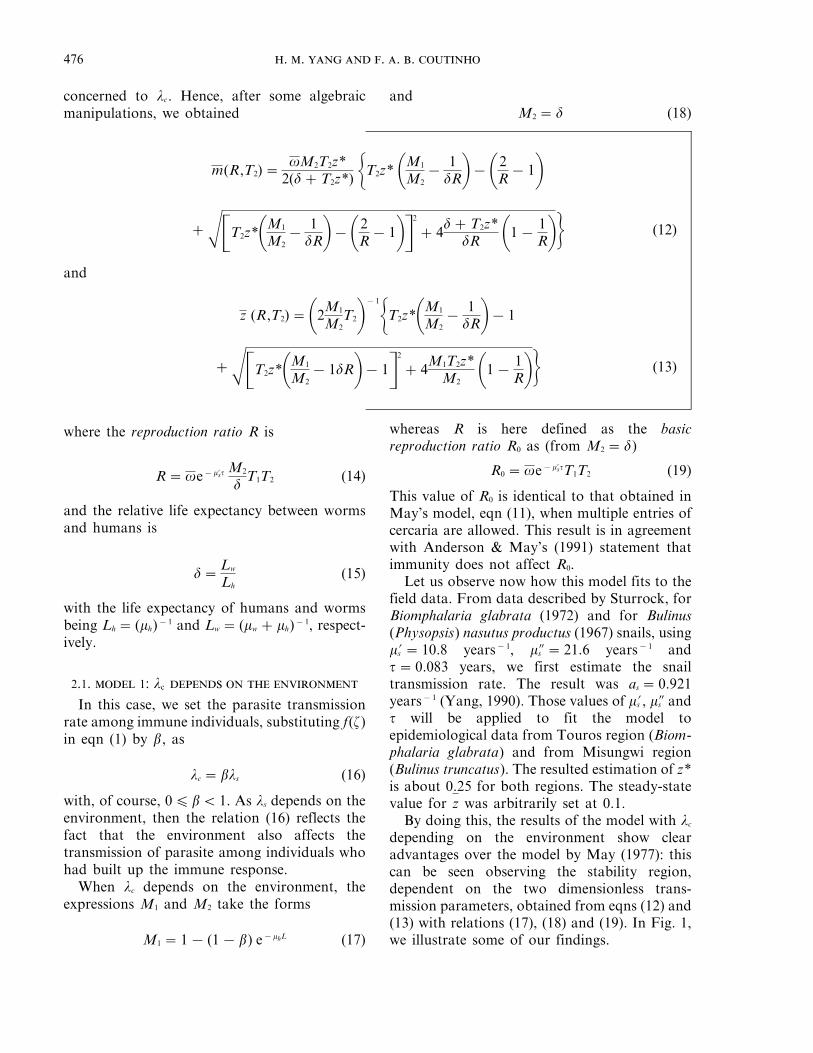
depending on the environment show clearadvantages over the model by May (1977): thiscan be seen observing the stability region,dependent on the two dimensionless trans-mission parameters, obtained from eqns (12) and(13) with relations (17), (18) and (19). In Fig. 1,we illustrate some of our findings.
m(R,T2)=vM2T2z*
2(d+T2z*) 6T2z* 0M1
M2−
1dR1−02
R−11
+X$T2z*0M1
M2−
1dR1−02
R−11%
2
+4d+T2z*
dR 01−1R17 (12)
and
z (R,T2)=02M1
M2T21
−1
6T2z*0M1
M2−
1dR1−1
+X$T2z*0M1
M2−1dR1−1%
2
+4M1T2z*
M2 01−1R17 (13)

��������
��������
����
���������
���
����
���� ����
���
���� ����
��� ���
4
0
2
–2–1–2 0 1
log (T1)
log
(T
2)
m1
m21
R21R1 z1z21
4
0
2
–2–1–2 0 1
log (T1)
log
(T
2)
z1
z21
��� ���
��� ���
���� ��� ����
��� ���
���
��
��������
������
����
������
R21
m21
m1
R1
— 477
F. 1. Stability region for the model 1: lc depends on theenvironment, for r=1 (thin curves, with region demarcatedby ///) and 21 (thick curves, with region demarcated by :).
region, for r=1 and 21, respectively. The pointat which the curve mr crosses the curve zr
represents the values of T1 and T2 at which themodel shows best fit to the data. The regionbounded by the intersection among mr, zr and Rr
curves represents how much T1 and T2 can varybefore reaching the threshold lines Rr. In Fig. 2we illustrated the same set of curves for themodel by May.
Although R0 is not affected by acquiredimmunity, the range of T1 and T2, for which theexistence of disease is possible, is greatlyenlarged.
From Figs 1 and 2, we can observe that theinfluence of multiple entrance is to increase theregion of the parameters T1 and T2 where thedisease can exist, since the threshold lines moveto the origin of the axis with increasing r. Asnoted before, the basic reproduction ratio is notinfluenced by immunity in this model. On theother hand, for values of T1 lower than 1, weobserve that acquired immunity influencesstrongly the stability of the disease and the rangeof variation in T2 is greatly enlarged in thismodel, as compared with May’s. This is a highlydesirable feature in models dealing with schisto-somiasis because, in fact, T1 and T2 are expectedto vary greatly from region to region in anuncorrelated fashion for the same epidemiologi-cal pattern.
2.2. 2: lc
In this case the relation (1) is not obeyed, andb' is a bounded constant that does not dependenton z and T2. Here we set the parasitetransmission rate among immune individuals as
lc =(mw + mh) b' (20)
where the new parameter b',
0E b'E b'max,
could be chosen as a function of the time periodelapsed to build up the immunity and thenumber of parasite entrance per infective event,or as a constant to be fitted to data, and thesupremum of transmission rate among immuneindividuals obeys
limb'04 b'max
lc = ls. (21)
The figure shows two sets of curves for m[from Table II of Yang et al. (1997)], z=0.1,and the thresholds (R0 =1, which we took, forpractical purposes, as the threshold; see,however, Nasell, 1993 for stochastic thresholdvalues). The m-curves correspond to the best fitfor the average number of adult worms perperson m=0.819 and 3.327, for Misungwi
F. 2. Stability region for the model proposed by May,for r=1 (thin curves, with region demarcated by ///) and21 (thick curves, with region demarcated by :).

��
����
�����
�
����
������
�
����
�����
��4
0
2
–2–1–2 0 1
log (T1)
log
(T
2)
z1z21
m21
R1
m1
���
����
��� ���
���� ���� ����
��� ���
R21 R1
. . . . . 478
Note that if ls =0, both m and z are zero evenwhen lc $ 0. The significance of this will bediscussed later.
When lc does not depend on the environment,the expressions M1 and M2 take the forms
M1 =1−e− mhL (22)
and
M2 = d+ b'e− mhL, (23)
whereas R is here defined as the net reproductionratio R* as
R*=ve− m'st(1+8)T1T2, (24)
where 8 is the immunity contribution to the netreproduction ratio given by
8=b'e− mhL
d. (25)
This value of R* is different from that obtainedin the May’s model even if considering multipleentries of cercaria. Equation (24) demonstrateshow acquired immunity affects the reproductionratio for schistosomiasis. The expression for R*is a composition of the environment (R0) and theacquired immunity (Rim) contributions. It isbetter seen from the particular form that theexpression M2 takes for the two models, (18) formodel 1 and (23) for model 2: both expressionsdepend on the relative life expectancy of theparasites and the humans, while the latter alsodepends on the immunity parameters.
The definition for the basic reproduction ratiois the average number of female offspringproduced throughout the lifetime of a maturefemale parasite, which themselves achieve repro-ductive maturity in the absence of density-depen-dent constraints (Anderson & May, 1991). Basedon this definition, model 1 produces the very wellunderstood basic reproduction ratio. But inmodel 2 we have dependencies on the immunityparameters and, therefore, we called it as netreproduction ratio (R*=R0 +Rim). In the ab-sence of immunity, the average number of femaleoffspring during Lw appears in the basicreproduction ratio R0. But, when the immunity isbuilt up, it implies decreasing in the averagenumber of adult worms and, hence, the eggproduction is increased by the density-dependent
F. 3. Stability region for the model 2: lc does notdepend on the environment, for r=1 (thin curves, withregion demarcated by ///) and 21 (thick curves, with regiondemarcated by :).
constraints, which appears in the immunityconstrained reproduction ratio Rim.
In model 1 the two parasite transmission rates(ls and lc) are affected by the environment dueto T2. So the overall disease transmission isaffected only by the environment. But in model2 only one of the transmission rates (ls) isdependent on T2 and the other (lc) isindependent of this transmission parameter butdependent only on the immunity parameters.Then the overall disease transmission is con-trolled by both the environment and the humanacquired immunity.
The fitting to the data was performed asbefore. The values of b' obtained from bothstudied areas are very similar (Yang et al., 1997).This is probably due to the fact that both areasare highly endemic, so b' is close to b'max.
By doing this the results of the model with lc
independent of the environment show clearadvantages over our first model (model 1) inwhich immunity is considered to depend also onthe environment: now, R* resulted in values (seeDiscussion) much higher than those resultingfrom May’s model for any set of T1 and T2. Thisis in sharp contrast with the previous model ofimmunity, and in disagreement with Anderson &May (1991). Furthermore, the range of T1 and
����
����
��� ���
�����
���� ����
��� ��
��
4
0
2
–2–1–2 0 1
log (T1)
log
(T
2) ���
������
�
�����������
�������
��R'11
m'11=m11
z'11
R11 z11
m*
— 479
T2, for which the existence of disease is possible,is even more enlarged. This can be seen fromeqns (12) and (13) with relations (22), (23) and(24). Figure 3 illustrates some of our findings.
Figure 3 shows two sets of curves for m [fromTable II of Yang et al. (1997)], z=0.1 and thethreshold, calculated by setting R*=1. Them-curves correspond to the best fit for theaverage number of adult worms per person, forMisungwi region, for r=1 and 21. The point atwhich the curve mr crosses the curve zr representsthe values of T1 and T2 which the model fits bestto the data. The region represents how much T1
and T2 can vary before reaching the thresholdlines Rr. We have set arbitrarily z=0.1.Nevertheless, if we set the proportion ofshedding snails at lower (higher) than the fixedvalue, then the upper frontier of stability regionmoves inward (outward) to the origin of the axis,diminishing (increasing) the region.
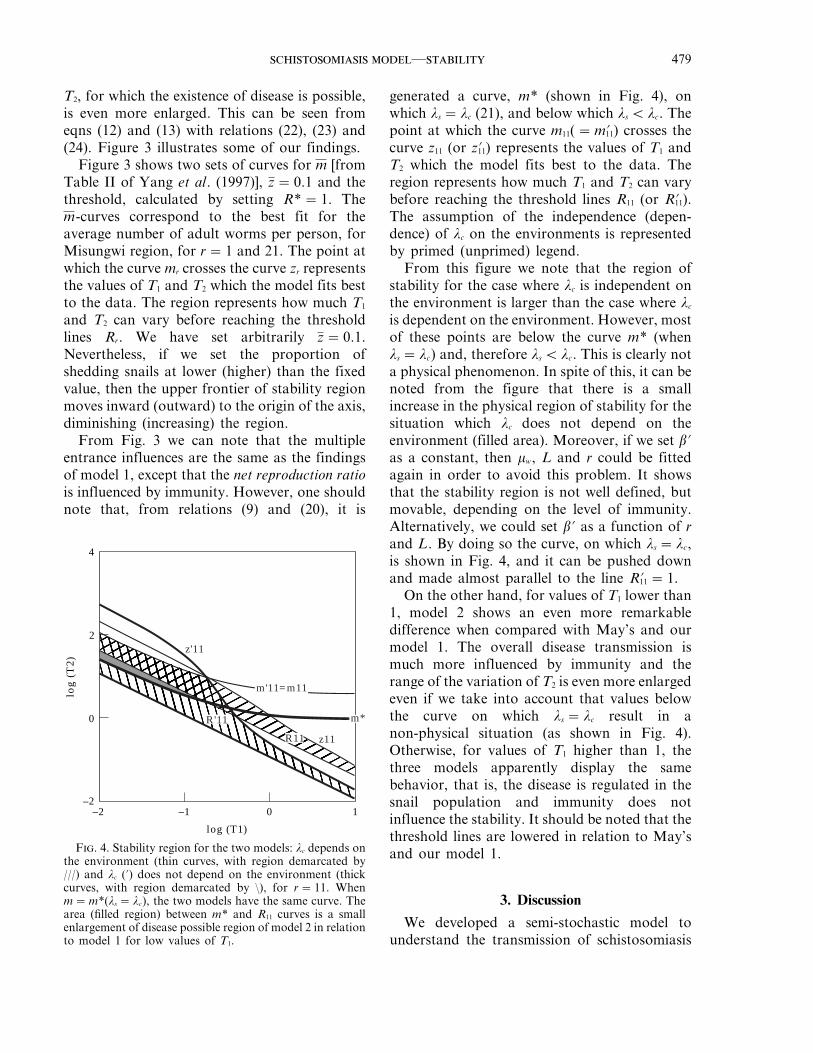
From Fig. 3 we can note that the multipleentrance influences are the same as the findingsof model 1, except that the net reproduction ratiois influenced by immunity. However, one shouldnote that, from relations (9) and (20), it is
generated a curve, m* (shown in Fig. 4), onwhich ls = lc (21), and below which ls Q lc. Thepoint at which the curve m11(=m'11) crosses thecurve z11 (or z'11) represents the values of T1 andT2 which the model fits best to the data. Theregion represents how much T1 and T2 can varybefore reaching the threshold lines R11 (or R'11).The assumption of the independence (depen-dence) of lc on the environments is representedby primed (unprimed) legend.
From this figure we note that the region ofstability for the case where lc is independent onthe environment is larger than the case where lc
is dependent on the environment. However, mostof these points are below the curve m* (whenls = lc) and, therefore ls Q lc. This is clearly nota physical phenomenon. In spite of this, it can benoted from the figure that there is a smallincrease in the physical region of stability for thesituation which lc does not depend on theenvironment (filled area). Moreover, if we set b'as a constant, then mw, L and r could be fittedagain in order to avoid this problem. It showsthat the stability region is not well defined, butmovable, depending on the level of immunity.Alternatively, we could set b' as a function of rand L. By doing so the curve, on which ls = lc,is shown in Fig. 4, and it can be pushed downand made almost parallel to the line R'11 =1.
On the other hand, for values of T1 lower than1, model 2 shows an even more remarkabledifference when compared with May’s and ourmodel 1. The overall disease transmission ismuch more influenced by immunity and therange of the variation of T2 is even more enlargedeven if we take into account that values belowthe curve on which ls = lc result in anon-physical situation (as shown in Fig. 4).Otherwise, for values of T1 higher than 1, thethree models apparently display the samebehavior, that is, the disease is regulated in thesnail population and immunity does notinfluence the stability. It should be noted that thethreshold lines are lowered in relation to May’sand our model 1.
3. Discussion
We developed a semi-stochastic model tounderstand the transmission of schistosomiasis
F. 4. Stability region for the two models: lc depends onthe environment (thin curves, with region demarcated by///) and lc (') does not depend on the environment (thickcurves, with region demarcated by :), for r=11. Whenm=m*(ls = lc), the two models have the same curve. Thearea (filled region) between m* and R11 curves is a smallenlargement of disease possible region of model 2 in relationto model 1 for low values of T1.
. . . . . 480
in highly endemic areas. One of the main pointsof our model is the role of human acquiredimmunity in explaining the remarkable stabilityof the disease. When T1 is higher than 1 (T2 islower than 10) May’s model, and our models 1and 2 have the same stability, but when T1 islower than 1 (T2 is higher than 10) May’s modeland our models 1 and 2 display quite differentbehavior.
In fact regions where the environment is notfavorable for the surviving and mobility ofmiracidia to find and infect intermediate host, wehave low values for the overall transmission fromhuman to snail (T1). The disease can bemaintained if this hostile inhabitat is overcomeby an increase in egg output. This is possible byan increase in the overall transmission from snailto human (T2). As a consequence, the meanworm burden of the community increases. In theabsence of immunity in the human host, we musthave hyper-infection to maintain the disease.But, if the human host mounts an acquiredimmunity, which regulates the transmission ofschistosomiasis, we do not need to have thishyper-infection (models 1 and 2). The hyper-in-fection is avoided because the acquired immunityboth protects the human host from furthercercaria invasions avoiding the high wormburden in the community, and over-disperses theworm harbored by this community [see Table IIin Yang et al. (1997)] explaining why there is acore of individuals who have a heavy wormcharge whilst the population as a whole has a lowworm burden. The latter consideration makesreasonable our approximation of half value tothe mating function introduced by May (1977).Conversely, when T1 has high values (favorableenvironment), the acquired immunity does notmatter because in this region the human host isexposed to low values of T2 and the populationhas low worm burden.
Both acquired immunity models 1 and 2present the same values for the mean wormburden and dispersion as a function of the fittedmodel’s parameters. However, the picture isdifferent when the stability of the disease isanalysed. When the relation (1) is obeyed (model1), the acquired immunity would enlarge thestability region but the environment dependencein the transmission of schistosomiasis prevents
T 1The basic (May’s model and model 1) andnet (model 2) reproduction ratios forTouros, Brazil and region of Misungwi,
TanzaniaMay’s Model& Model 1 Model 2
r Touros & Misungwi Touros Misungwi
1 1.199 4.672 4.4694 2.997 11.014 10.5938 5.394 20.976 19.157
11 7.193 28.466 25.78016 10.189 40.431 36.29621 13.186 50.721 46.32931 19.180 78.760 70.88335 21.578 84.820 78.231
this enlargement of the stability region. On theother hand, when (1) is not obeyed (model 2),then in the immune individuals only the acquiredimmunity influences the transmission of schisto-somiasis, and the stability region is enlarged.Consequently a model with acquired immunityhas the transmission of schistosomiasis betterregulated than a model where only environmentregulates the transmission. When T2 has lowvalues (the overall transmission from snail tohuman is not favorable) the model 1 is betterthan the model 2. The reason is due to the lowforce of infection (contact with parasite) andthere is not full build up of the immunity, hencethis community, with only partially effectiveacquired immunity, suffers the influence of theenvironment to regulate the disease. Conversely,when the cercariae has high efficiency to searchand penetrate the human host (high values ofT2), the acquired immunity is well establishedand further invasion of cercaria in humans iscontrolled exclusively by this immunity mechan-ism.
The other main factor that affects the stabilityregion is the multiple entrance of parasites ineach contact with infested water. The stabilityregion, with width practically unchanged, isshifted downwardly increasing the region wherethe disease can exit, when the multiple entranceparameter is increased. The multiple entrance ofparasites allows much lower values for thetransmission parameters T1 and T2, thus increas-ing the stability region as described above. The
— 481
multiple entrance also over-disperses the harbor-ing of parasites in the community.
Finally, we analysed the effect of acquiredimmunity and the multiple entrance of parasiteson the basic (net) reproduction ratio. The twooverall transmission parameters were arbitrarilyset from Figs 1, 2 and 3 as T1 0 0.6 and T2 0 12,and assumed equal for both regions, Touros(Brazil) and Misungwi (Tanzania). These overalltransmission parameters provide the basicreproduction ratio for May’s model (singlecercariae penetration per contact with infestedwater), R0 =1.199, which is lower than thatpredicted by Macdonald’s (1965) model,R0 =7.2. In Table 1 we show the basicreproduction ratio for the modified May’s modeland our model 1, given by eqn (19), and netreproduction ratio for our model 2, given byeqn (24).
We observe that May’s model and our model1 have the same value for the basic reproductionratio, which increases with increasing of themaximum number of parasite entrance perinfective contact. This is a consequence of thefact that in both models the transmission isregulated by environmental factors. The basicreproduction ratio is higher than that predictedby Macdonald’s model only for rq 11. Ourmodel 2 with acquired immunity also controllingthe transmission presents much higher valuesthan model 1 for the net reproduction ratio anddiffers for both regions. In the region of Tourosthe net reproduction ratio is slightly higher thanin Misungwi region. In the former we have S.mansoni and for the latter, S. haematobium. Thenet reproduction ratio is higher than thatpredicted by Macdonald’s model for rq 2. Table1 shows that the immunity constrained reproduc-tion ratio (Rim) increases faster than the basicreproduction ratio (R0) when the maximumnumber of invading viable cercaria (r) increases.Hence, both acquired immunity and the multipleentrance of parasites in each infective event haveto be considered in efforts towards controllingthe disease (Jordan, 1969; Warren, 1973).
We summarize our findings in three points.(1) For values of T1 higher than 1, the stability
regions for all the three models are similar, butfor values of T1 lower than 1 the model 2 showedthe stability region greatly enlarged. The model
by May and our model 1 have well defined andfixed stability region. However, our model 2presents a flexible stability region which impliesan extra source of difficulty to control thedisease.
(2) The effect of allowing multiple parasiteentering although does not influence theestimation of the prevalence curve parameters, itacts strongly on the basic (net) reproduction ratioand on the stability region. In our model we didnot explore totally this heterogeneity when wefixed the form of the distribution of the numberof worms allowed to enter the host in eachcontagious event. The number of invadingcercaria can be assumed to be a constant valueor any form of distribution probability (we useda binomial distribution). In fact, Barbour &Kafetzaki (1993) assumed that when a host isexposed to infection then he (or she) acquires anumber of parasites which has a Poissondistribution. This assumption is sufficient toobtain the over-dispersion of the worms in thehost.
(3) The incorporation of the acquired immu-nity to schistosomiasis transmission modellingimproved in the problems of fitting model’sparameters (Yang et al., 1997), of explaining thestability of the disease and of controlling thedisease. But, models without immunity fail togive a satisfactory answer to the above questions.For instance, the model developed by Holford &Hardy (1976) comprising the age structuredfrequency of contact with infested water(age-dependent exposure model) fits very wellthe prevalence curve, but their model predictsquite the same small stability region as the modelby May and underestimates basic reproductionratio (Yang, 1985).
We thank Professor Klaus Dietz, ProfessorIngemar Nasell and anonymous referees for theirhelpful suggestions which improved this paper. HMYwas supported by FAPESP Grant No. 86/0046-1.
REFERENCES
A, R. M. & M, R. M. (1991). Infectious Diseasesof Human. Dynamics and Control. Oxford: OxfordUniversity Press.
B, A. D. (1978). A stochastic model for thetransmission of bilharzia. Math. Biosci. 38, 303–312.
. . . . . 482
B, A. D. (1982). Schistosomiasis. In: PopulationDynamics of Infectious Diseases (Anderson, R. M., ed.).London: Chapman & Hall.
B, A. D. (1985). The importance of age and watercontact patterns in relation to Schistosoma haematobiuminfection. Trans. R. Soc. Trop. Med. Hyg. 79, 152–153.
B, A. D. & K, M. (1993). A host–parasitemodel yielding heterogeneous parasite load. J. Math.Biol. 31, 157–176.
B, D. J. & M, R. M. (1978). Consequences ofhelminth Aggregation for The Dynamics of Schistosomi-asis. Trans. R. Soc. Trop. Med. Hyg. 72(3), 262–273.
C, S. K. & W, M. E. (1991). Hetero-geneities in water contact pattern and the epidemiology ofSchistosoma haematobium. Parasitology 103, 363–370.
D, P. R. & P, D. (1978). Water contact patterns inrelation to Schistosoma haematobium infection. Bull.WHO 56, 417–426.
H, T. R. & H, R. J. (1976). A stochastic modelfor the analysis of age-specific prevalence curves inschistosomiasis. J. Chron. Dis. 29, 445–458.
J, P. (1969). Schistosomiasis: research to control.Am. J. Trop. Med. Hyg. 26, 877–886.
M, R. M. (1977). Togetherness amongst schistosome: itseffects on the dynamics of the infection. Math. Biosci. 35,301–343.
M, G. (1965). The dynamics of helminthinfections, with special reference to schistosomes. Trans.R. Soc. Trop. Med. Hyg. 5, 489–506.
N, I. & H, W. M. (1973). The transmissiondynamics of schistosomiasis. Comm. Pr. Appl. Math. 26,395–453.
N, I. (1985). Hybrid models of tropical infections. In:Springer Verlag Lecture Notes in Biomathematics 59.Berlin: Springer.
N, I. (1993). The threshold concept in deterministicand stochastic models (pre-print).
S, B. M. (1967). The effects of infection withSchistosoma haematobium on the growth and reproduc-tion rates of Bullinus (physopsis) nasutus productus. Ann.Trop. Med. Para. 61, 321–325.
S, R. F. & W, G. (1971). The application ofcatalytic models to schistosomiasis in snails. J. Helmintol.45, 189–200.
S, R. F. (1972). Field studies on the transmissionof Schistosoma mansoni and on the bionomics of itsintermediate host Biomphalaria glabrata on Santa Lucia,West Indies. Int. J. Para. 3, 175–194.
W, K. S. (1973). Regulation of prevalence andintensity of schistosomiasis in man: immunology orecology? J. Infect. Dis. 127, 595–609.
W, H. A. (1977). Schistosoma haematobium in aGambiam community—I: The intensity and prevalence ofinfection. Ann. Trop. Med. Parasitol. 71, 53–58.
Y, H. M. (1985). Esquistossomıase: modelo matematicoincorporando a imunidade concomitante (port.). Disser-tation. Instituto de Fısica da USP.
Y, H. M. (1990). Estudo Matematico do Mecanismo deRegulac� ao da Esquistossomıase (port.). Doctoral Thesis.Instituto de Fısica da USP.
Y, H. M., C, F. A. B. & M, E. (1997).Acquired immunity on a schistosomiasis trans-mission model—fitting the data. J. theor. Biol. 188,495–506.
Copyright © 2022 FDOKUMEN