Accurate quantification of dimethylamine (DMA) in human urine by gas chromatography–mass...
10
Journal of Chromatography B, 851 (2007) 240–249 Accurate quantification of dimethylamine (DMA) in human plasma and serum by GC–MS and GC–tandem MS as pentafluorobenzamide derivative in the positive-ion chemical ionization mode Kristine Chobanyan, Anja Mitschke, Frank-Mathias Gutzki, Dirk O. Stichtenoth, Dimitrios Tsikas ∗ Institut f ¨ ur Klinische Pharmakologie, Medizinische Hochschule Hannover, Carl-Neuberg-Strasse 1, D-30625 Hannover, Germany Received 22 December 2006; accepted 5 March 2007 Available online 19 March 2007 Abstract Dimethylamine (DMA) circulates in human blood and is excreted in the urine. Major precursor for endogenous DMA is asymmetric dimethy- larginine (ADMA), an endogenous inhibitor of nitric oxide (NO) synthesis. ADMA is hydrolyzed to DMA and l-citrulline by dimethylarginine dimethylaminohydrolase (DDAH). In previous work, we reported a GC–MS method for the quantification of DMA in human urine. This method involves simultaneous derivatization of endogenous DMA and the internal standard (CD 3 ) 2 NH by pentafluorobenzoyl chloride (PFBoylCl) and extraction of the pentafluorobenzamide derivatives by toluene. In the present work, we optimized this derivatization/extraction procedure for the quantitative determination of DMA in human plasma. Optimized experimental parameters included vortex time and concentration of PFBoylCl, carbonate and internal standard. The GC–MS method was thoroughly validated and applied to measure DMA concentrations in human plasma and serum samples. GC–MS quantification was performed by selected-ion monitoring of the protonated molecules at m/z 240 for DMA and m/z 246 for (CD 3 ) 2 NH in the positive-ion chemical ionization mode. Circulating DMA concentration in healthy young women (n = 18) was determined to be 1.43 ± 0.23 M in serum, 1.73 ± 0.17 M in lithium heparin plasma, and 9.84 ± 1.43 M in EDTA plasma. DMA was identified as an abundant contaminant in EDTA vacutainer tubes (9.3 ± 1.9 nmol/monovette, n = 6). Serum and lithium heparin vacutainer tubes contained considerably smaller amounts of DMA (0.42 ± 0.01 and 0.95 ± 0.01 nmol/monovette, respectively, each n = 6). Serum is recommended as the most appropriate matrix for measuring DMA in human blood. The present GC–MS method should be useful for the determination of systemic and whole body DDAH activity by measuring circulating and excretory DMA in experimental and clinical studies. © 2007 Elsevier B.V. All rights reserved. Keywords: ADMA; Contamination; DDAH; Derivatization; Nitric oxide; Validation 1. Introduction Dimethylamine [DMA, (CH 3 ) 2 NH)] is the most abundant short-chain aliphatic amine present in human urine and blood [1–6]. DMA is also present in other biological fluids includ- ing saliva, gastric juice and vaginal secretions [7,8]. Origin and significance of DMA in humans are of particular impor- tance. Besides exogenous sources, endogenous biosynthetic This paper is part of a special issue entitled “Analysis of the l-arginine/NO pathway”, guest edited by D. Tsikas. ∗ Corresponding author at: Institute of Clinical Pharmacology, Hannover Med- ical School, Carl-Neuberg-Strasse 1, 30625 Hannover, Germany. Tel.: +49 511 532 3959; fax: +49 511 532 2750. E-mail address: [email protected] (D. Tsikas). pathways have been proposed to produce DMA, such as the N-methylation of monomethylamine which is metaboli- cally derived from sarcosine or glycine [9,10]. More recently, special attention has been paid to DMA since its identifica- tion as the metabolic product of N G ,N G -dimethyl-l-arginine (asymmetric dimethylarginine, ADMA) (reviewed in ref. [11]), which is an endogenous inhibitor of nitric oxide (NO) syn- thesis from l-arginine (reviewed in ref. [12]). The enzyme N G ,N G -dimethyl-l-arginine dimethylaminohydrolase (DDAH) specifically hydrolyzes ADMA to yield DMA and l-citrulline [13] (Fig. 1). ADMA has been shown to be actively metab- olized to DMA by DDAH in humans in vivo [6]. The relative contribution of exogenous and endogenous sources to DMA and the pathophysiological significance of DMA are currently two challenging tasks [11]. 1570-0232/$ – see front matter © 2007 Elsevier B.V. All rights reserved. doi:10.1016/j.jchromb.2007.03.006
-
Upload
independent -
Category
Documents
-
view
3 -
download
0
Transcript of Accurate quantification of dimethylamine (DMA) in human urine by gas chromatography–mass...

A
ldieqcsfbcsmD©
K
1
s[iat
p
iT
1d
Journal of Chromatography B, 851 (2007) 240–249
Accurate quantification of dimethylamine (DMA) in human plasmaand serum by GC–MS and GC–tandem MS as pentafluorobenzamide
derivative in the positive-ion chemical ionization mode�
Kristine Chobanyan, Anja Mitschke, Frank-Mathias Gutzki,Dirk O. Stichtenoth, Dimitrios Tsikas ∗
Institut fur Klinische Pharmakologie, Medizinische Hochschule Hannover, Carl-Neuberg-Strasse 1, D-30625 Hannover, Germany
Received 22 December 2006; accepted 5 March 2007Available online 19 March 2007
bstract
Dimethylamine (DMA) circulates in human blood and is excreted in the urine. Major precursor for endogenous DMA is asymmetric dimethy-arginine (ADMA), an endogenous inhibitor of nitric oxide (NO) synthesis. ADMA is hydrolyzed to DMA and l-citrulline by dimethylarginineimethylaminohydrolase (DDAH). In previous work, we reported a GC–MS method for the quantification of DMA in human urine. This methodnvolves simultaneous derivatization of endogenous DMA and the internal standard (CD3)2NH by pentafluorobenzoyl chloride (PFBoylCl) andxtraction of the pentafluorobenzamide derivatives by toluene. In the present work, we optimized this derivatization/extraction procedure for theuantitative determination of DMA in human plasma. Optimized experimental parameters included vortex time and concentration of PFBoylCl,arbonate and internal standard. The GC–MS method was thoroughly validated and applied to measure DMA concentrations in human plasma anderum samples. GC–MS quantification was performed by selected-ion monitoring of the protonated molecules at m/z 240 for DMA and m/z 246or (CD3)2NH in the positive-ion chemical ionization mode. Circulating DMA concentration in healthy young women (n = 18) was determined toe 1.43 ± 0.23 �M in serum, 1.73 ± 0.17 �M in lithium heparin plasma, and 9.84 ± 1.43 �M in EDTA plasma. DMA was identified as an abundant
ontaminant in EDTA vacutainer tubes (9.3 ± 1.9 nmol/monovette, n = 6). Serum and lithium heparin vacutainer tubes contained considerablymaller amounts of DMA (0.42 ± 0.01 and 0.95 ± 0.01 nmol/monovette, respectively, each n = 6). Serum is recommended as the most appropriateatrix for measuring DMA in human blood. The present GC–MS method should be useful for the determination of systemic and whole bodyDAH activity by measuring circulating and excretory DMA in experimental and clinical studies.2007 Elsevier B.V. All rights reserved.ation
ptcst
eywords: ADMA; Contamination; DDAH; Derivatization; Nitric oxide; Valid
. Introduction
Dimethylamine [DMA, (CH3)2NH)] is the most abundanthort-chain aliphatic amine present in human urine and blood1–6]. DMA is also present in other biological fluids includ-
ng saliva, gastric juice and vaginal secretions [7,8]. Originnd significance of DMA in humans are of particular impor-ance. Besides exogenous sources, endogenous biosynthetic� This paper is part of a special issue entitled “Analysis of the l-arginine/NOathway”, guest edited by D. Tsikas.∗ Corresponding author at: Institute of Clinical Pharmacology, Hannover Med-
cal School, Carl-Neuberg-Strasse 1, 30625 Hannover, Germany.el.: +49 511 532 3959; fax: +49 511 532 2750.
E-mail address: [email protected] (D. Tsikas).
(wtNs[octc
570-0232/$ – see front matter © 2007 Elsevier B.V. All rights reserved.oi:10.1016/j.jchromb.2007.03.006
athways have been proposed to produce DMA, such ashe N-methylation of monomethylamine which is metaboli-ally derived from sarcosine or glycine [9,10]. More recently,pecial attention has been paid to DMA since its identifica-ion as the metabolic product of NG,NG-dimethyl-l-arginineasymmetric dimethylarginine, ADMA) (reviewed in ref. [11]),hich is an endogenous inhibitor of nitric oxide (NO) syn-
hesis from l-arginine (reviewed in ref. [12]). The enzymeG,NG-dimethyl-l-arginine dimethylaminohydrolase (DDAH)
pecifically hydrolyzes ADMA to yield DMA and l-citrulline13] (Fig. 1). ADMA has been shown to be actively metab-
lized to DMA by DDAH in humans in vivo [6]. The relativeontribution of exogenous and endogenous sources to DMA andhe pathophysiological significance of DMA are currently twohallenging tasks [11].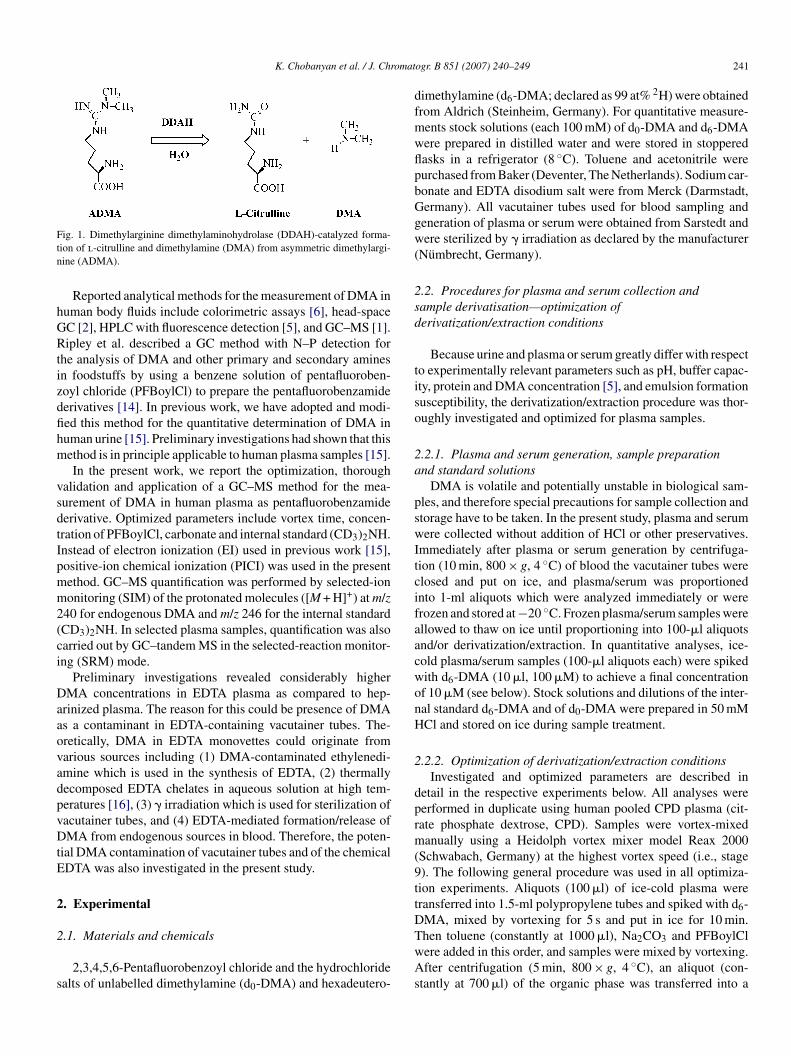
K. Chobanyan et al. / J. Chromat
Ftn
hGRtizdfihm
vsdtIpmm2(ci
DaaovadpvDtE
2
2
s
dfmwflpbGgw(
2sd
tiso
2a
pswItcifaacwonH
2
dprm(9ttD
ig. 1. Dimethylarginine dimethylaminohydrolase (DDAH)-catalyzed forma-ion of l-citrulline and dimethylamine (DMA) from asymmetric dimethylargi-ine (ADMA).
Reported analytical methods for the measurement of DMA inuman body fluids include colorimetric assays [6], head-spaceC [2], HPLC with fluorescence detection [5], and GC–MS [1].ipley et al. described a GC method with N–P detection for
he analysis of DMA and other primary and secondary aminesn foodstuffs by using a benzene solution of pentafluoroben-oyl chloride (PFBoylCl) to prepare the pentafluorobenzamideerivatives [14]. In previous work, we have adopted and modi-ed this method for the quantitative determination of DMA inuman urine [15]. Preliminary investigations had shown that thisethod is in principle applicable to human plasma samples [15].In the present work, we report the optimization, thorough
alidation and application of a GC–MS method for the mea-urement of DMA in human plasma as pentafluorobenzamideerivative. Optimized parameters include vortex time, concen-ration of PFBoylCl, carbonate and internal standard (CD3)2NH.nstead of electron ionization (EI) used in previous work [15],ositive-ion chemical ionization (PICI) was used in the presentethod. GC–MS quantification was performed by selected-iononitoring (SIM) of the protonated molecules ([M + H]+) at m/z
40 for endogenous DMA and m/z 246 for the internal standardCD3)2NH. In selected plasma samples, quantification was alsoarried out by GC–tandem MS in the selected-reaction monitor-ng (SRM) mode.
Preliminary investigations revealed considerably higherMA concentrations in EDTA plasma as compared to hep-
rinized plasma. The reason for this could be presence of DMAs a contaminant in EDTA-containing vacutainer tubes. The-retically, DMA in EDTA monovettes could originate fromarious sources including (1) DMA-contaminated ethylenedi-mine which is used in the synthesis of EDTA, (2) thermallyecomposed EDTA chelates in aqueous solution at high tem-eratures [16], (3) � irradiation which is used for sterilization ofacutainer tubes, and (4) EDTA-mediated formation/release ofMA from endogenous sources in blood. Therefore, the poten-
ial DMA contamination of vacutainer tubes and of the chemicalDTA was also investigated in the present study.
. Experimental
.1. Materials and chemicals
2,3,4,5,6-Pentafluorobenzoyl chloride and the hydrochloridealts of unlabelled dimethylamine (d0-DMA) and hexadeutero-
TwAs
ogr. B 851 (2007) 240–249 241
imethylamine (d6-DMA; declared as 99 at% 2H) were obtainedrom Aldrich (Steinheim, Germany). For quantitative measure-ents stock solutions (each 100 mM) of d0-DMA and d6-DMAere prepared in distilled water and were stored in stopperedasks in a refrigerator (8 ◦C). Toluene and acetonitrile wereurchased from Baker (Deventer, The Netherlands). Sodium car-onate and EDTA disodium salt were from Merck (Darmstadt,ermany). All vacutainer tubes used for blood sampling andeneration of plasma or serum were obtained from Sarstedt andere sterilized by � irradiation as declared by the manufacturer
Numbrecht, Germany).
.2. Procedures for plasma and serum collection andample derivatisation—optimization oferivatization/extraction conditions
Because urine and plasma or serum greatly differ with respecto experimentally relevant parameters such as pH, buffer capac-ty, protein and DMA concentration [5], and emulsion formationusceptibility, the derivatization/extraction procedure was thor-ughly investigated and optimized for plasma samples.
.2.1. Plasma and serum generation, sample preparationnd standard solutions
DMA is volatile and potentially unstable in biological sam-les, and therefore special precautions for sample collection andtorage have to be taken. In the present study, plasma and serumere collected without addition of HCl or other preservatives.
mmediately after plasma or serum generation by centrifuga-ion (10 min, 800 × g, 4 ◦C) of blood the vacutainer tubes werelosed and put on ice, and plasma/serum was proportionednto 1-ml aliquots which were analyzed immediately or wererozen and stored at −20 ◦C. Frozen plasma/serum samples werellowed to thaw on ice until proportioning into 100-�l aliquotsnd/or derivatization/extraction. In quantitative analyses, ice-old plasma/serum samples (100-�l aliquots each) were spikedith d6-DMA (10 �l, 100 �M) to achieve a final concentrationf 10 �M (see below). Stock solutions and dilutions of the inter-al standard d6-DMA and of d0-DMA were prepared in 50 mMCl and stored on ice during sample treatment.
.2.2. Optimization of derivatization/extraction conditionsInvestigated and optimized parameters are described in
etail in the respective experiments below. All analyses wereerformed in duplicate using human pooled CPD plasma (cit-ate phosphate dextrose, CPD). Samples were vortex-mixedanually using a Heidolph vortex mixer model Reax 2000
Schwabach, Germany) at the highest vortex speed (i.e., stage). The following general procedure was used in all optimiza-ion experiments. Aliquots (100 �l) of ice-cold plasma wereransferred into 1.5-ml polypropylene tubes and spiked with d6-MA, mixed by vortexing for 5 s and put in ice for 10 min.
hen toluene (constantly at 1000 �l), Na2CO3 and PFBoylClere added in this order, and samples were mixed by vortexing.fter centrifugation (5 min, 800 × g, 4 ◦C), an aliquot (con-tantly at 700 �l) of the organic phase was transferred into a
2 omat
1ats
2tdwtaaw
2ewooaw
2asuoa
2iifiaaT
2qmcs(TNtawcov
2
a
rsCadD(t1r22pseDD
2a
nTsamppaostawatP
(tEa
2
qmActA
42 K. Chobanyan et al. / J. Chr
.5-ml autosampler glass vial for GC–MS analysis. The peakrea of the internal standard added to the plasma samples orhe concentration of endogenous DMA measured in the plasmaamples were used to evaluate the effects of the variables.
.2.2.1. The effect of pentafluorobenzoylchloride concen-ration. To investigate the effect of PFBoylCl on DMAerivatization, 10-�l aliquots of a 10-�M solution of d6-DMAere added to the plasma samples to achieve a final concentra-
ion of 1 �M. Na2CO3 was added as 10-�l aliquots of a 20-mMqueous solution. PFBoylCl was added as 5-, 10-, 20- and 40-�lliquots of a 10 vol% solution in acetonitrile. The vortex timeas constant at 1 min.
.2.2.2. The effect of carbonate concentration. In this set ofxperiments, 10-�l aliquots of a 10-�M solution of d6-DMAere added to plasma samples to achieve a final concentrationf 1 �M. Na2CO3 was added as 10-�l aliquots of 0, 20, 40, 80r 160 mM aqueous solutions. PFBoylCl was added as 10-�lliquots of a 10 vol% solution in acetonitrile. The vortex timeas constant at 1 min.
.2.2.3. The effect of vortex time. In these experiments, 10-�lliquots of a 10-�M solution of d6-DMA were added to plasmaamples to achieve a final concentration of 1 �M. Sample vol-me and concentration of the other reagents added were 10 �lf 20 mM for Na2CO3 and 10 �l of 10 vol% of PFBoylCl incetonitrile. Samples were vortex-mixed for 1, 2, 3, 4 or 5 min.
.2.2.4. The effect of internal standard concentration. Thenternal standard d6-DMA (2–20-�l aliquots of a 50 �M solutionn 50 mM HCl) was added to plasma samples at the followingnal concentrations: 1, 2, 4, 6, 8, or 10 �M. Na2CO3 was addeds 10-�l aliquots of a 20-mM aqueous solution. PFBoylCl wasdded as 10-�l aliquots of a 10 vol% solution in acetonitrile.he vortex time was kept constant at 5 min.
.2.2.5. Optimum derivatization/extraction conditions foruantitative analysis. On the basis of the results from opti-ization experiments (see Section 3) the following specific
onditions in the derivatization/extraction procedure were cho-en and used for quantitative analyses. Ice-cold plasma/serum100-�l aliquots) was pipetted into 1.5-ml polypropylene tubes.he internal standard (10 �l, 100 �M), toluene (1000 �l),a2CO3 (10 �l, 20 mM) and PFBoylCl (10 �l, 10 vol% in ace-
onitrile) were added to plasma/serum samples in this order,nd samples were put in an ice-bath for 1 min. Then samplesere mixed manually in duplicate by vortexing for 5 min. After
entrifugation (5 min, 800 × g, 4 ◦C), an aliquot (700 �l) of therganic phase was transferred into 1.5-ml autosampler glassials for GC–MS analysis.
.3. Validation of the method
A series of experiments was performed to determine intra-ssay (two experiments) and inter-assay (one experiment
lwa3
ogr. B 851 (2007) 240–249
epeated on five days) accuracy (recovery, %) and impreci-ion (RSD, %) of the method for DMA in human pooledPD plasma using the optimum experimental conditions andn added final concentration of 10 �M for the internal stan-ard in all experiments. The concentration of endogenous basalMA in the CPD plasma was determined to be 1.84 ± 0.16 �M
n = 10). DMA was added at potentially relevant final concen-rations in the range 0–10 �M [5], i.e. at 0, 2, 4, 6, 8, and0 �M. In addition, the method was validated for the nar-ow range of added DMA concentrations, i.e. between 0 and.4 �M, in particular at 0, 100, 300, 600, 1200, 1600 and400 nM. In all validation experiments, unspiked plasma sam-les were analyzed in quadruplicate, whereas spiked plasmaamples were analyzed in duplicate. Recovery was calculated forach added concentration as follows: recovery (%) = [(measuredMA concentration minus basal DMA concentration): addedMA concentration)] × 100.
.4. Determination of the DMA content of vacutainer tubesnd of the chemical EDTA
For simplicity the vacutainer tubes (monovettes) used areamed for their declared volume and anticoagulation agent.hus, each six monovettes of 3-ml citrate, 9-ml EDTA, 7.5-mlerum, 9-ml lithium heparin, and 4.5-ml ammonium hep-rin were analyzed for their DMA content as follows. Theonovettes were filled with 3, 9, 7, 9 and 4 ml of potassium
hosphate buffered saline (PBS, 100 mM potassium phos-hate, 500 mM NaCl, pH 7.4), respectively, shaken gentlynd allowed to stand for 10 min. Each two 100-�l aliquotsf the supernatants and six 100-�l aliquots of PBS werepiked each with 10 �M of d6-DMA, samples were deriva-ized/extracted using the optimum conditions reported abovend analyzed by GC–MS. The DMA content of the monovettesas calculated from the respective concentrations measured
nd volumes of PBS added to the monovettes after subtrac-ion of the DMA amount present in the equivalent volume ofBS.
Presence of DMA as a contaminant in the chemical EDTAi.e., ethylenediamine tetraacetic acid disodium salt) was inves-igated by analyzing in duplicate freshly prepared solutions ofDTA in PBS at relevant final concentrations (0, 1, 2, 3, 4, 5,nd 10 mM).
.5. GC–MS and GC–tandem MS conditions
GC–MS was performed on a ThermoElectron DSQuadrupole mass spectrometer connected directly to a Ther-oElectron Focus gas chromatograph and to an autosamplerS 3000 (ThermoElectron, Dreieich, Germany). A fused-silica
apillary column Optima-17 (15 m × 0.25 mm i.d., 0.25 �m filmhickness) from Macherey-Nagel (Duren, Germany) was used.liquots (1 �l) of the toluene extracts were injected in the split-
ess mode. The following oven temperature program was usedith helium (constant flow of 1 ml/min) as the carrier gas: 1 min
t 70 ◦C, then increased to 280 ◦C at a rate of 30 ◦C/min, and to00 ◦C at a rate of 10 ◦C/min. Interface, injector and ion-source
omatogr. B 851 (2007) 240–249 243
wafctuo
oTwagcnosiraatwes
2
c(s
3
3d
Di(NQcmcpatd
oPtmP
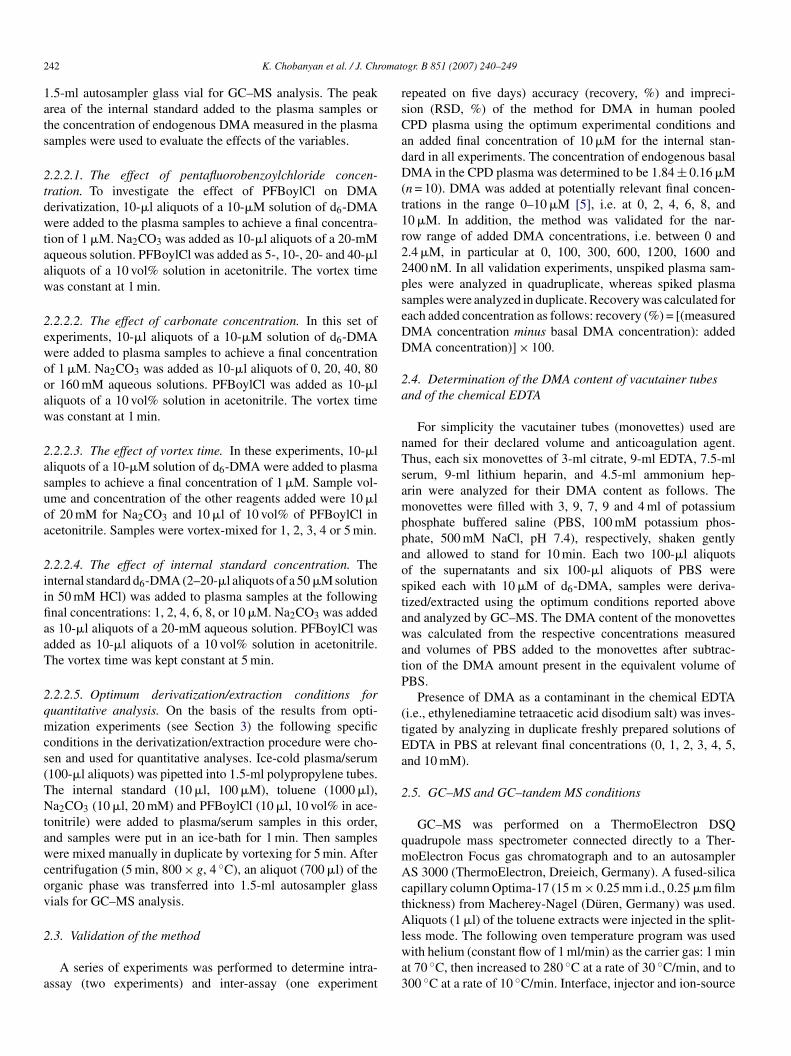
Fig. 2. PICI mass spectra of the pentafluorobenzamide derivatives of unlabelledDo
otmmlaagIcocm
tppSt
K. Chobanyan et al. / J. Chr
ere kept at 260, 200 and 250 ◦C, respectively. Electron energynd electron current were set to 50 eV and 120 �A, respectively,or PICI with methane (2.4 ml/min) as the reagent gas. Quantifi-ation by GC–MS in the PICI mode was performed by SIM ofhe ions at m/z 240.15 for d0-DMA and m/z 246.15 for d6-DMAsing a dwell-time of 50 ms and an electron multiplier voltagef 1.5 kV.
GC–tandem MS analyses in the PICI mode were performedn a triple-stage quadrupole mass spectrometer ThermoElectronSQ 7000 (Finnigan MAT, San Jose, CA) directly interfacedith a Trace 2000 series gas chromatograph equipped with
n autosampler AS 2000 (CE Instruments, Austin, TX). Theas chromatograph was equipped with a fused-silica capillaryolumn Optima-XLB (30 m × 0.25 mm i.d., 0.25 �m film thick-ess) from Macherey-Nagel (Duren, Germany). The followingven temperature program was used with helium (at a con-tant flow of 1 ml/min) as the carrier gas: 1 min at 70 ◦C, thenncreased to 280 ◦C at a rate of 30 ◦C/min, and to 300 ◦C at aate of 10 ◦C/min. Interface, injector and ion-source were keptt 250 ◦C, 200 ◦C and 180 ◦C, respectively. Electron energynd electron current was set to 50 eV and 120 �A, respec-ively. Methane (530 Pa) and argon (0.2 Pa collision pressure)ere used as reagent and collision gases, respectively. Collision
nergy was set to 25 eV. Aliquots (1 �l) were injected in theplitless mode by means of the autosampler.
.6. Ethics
Approval from the local Ethics Committee of the Medi-al School of Hannover was obtained for the clinical studydescribed in Section 3.4), as was informed written consent fromtudy participants.
. Results and discussion
.1. PICI GC–MS and GC–tandem MS of d0-DMA and6-DMA pentafluorobenzamide derivatives
The pentafluorobenzamide derivatives of unlabelled (d0-MA) and 2H-labelled (d6-DMA) DMA have been previously
dentified by GC–MS in the negative-ion chemical ionizationNICI) and EI mode as N,N-dimethyl-pentafluorobenzamide and,N-[2H6]dimethyl-pentafluorobenzamide, respectively [15].uantitative determination of DMA in human urine revealed
omparable accuracy and precision both in the NICI and EIode [15]. Preliminary investigations had shown that EI is prin-
ipally suitable for the GC–MS quantification of DMA in humanlasma. In the present study, we investigated the utility of PICIs an alternative ionization mode for the quantitative determina-ion of circulating DMA by GC–MS as pentafluorobenzamideerivative.
PICI GC–MS full scan analysis of separate reaction mixturesf synthetic d0-DMA and d6-DMA with the derivatizating agent
FBoylCl showed several GC peaks. The PICI mass spectra ofhe reaction products emerging from the GC column at approxi-ately 3.5 min are shown in Fig. 2. The most intense ions in theICI mass spectra of the d0-DMA and d6-DMA derivatives were
ain(
MA (A) and deuterated DMA (d6-DMA) (B). Insertions show the structuresf the pentafluorobenzamide derivatives.
bserved at m/z 240 and m/z 246, respectively, and correspond tohe protonated molecules ([M + H]+) (Fig. 2). In the EI and NICI
ass spectra of these derivatives the corresponding ions were/z 239 and m/z 245 due to M+ and M−, respectively [15]. The
ess intense ions at m/z 268 and m/z 280 from d0-DMA (Fig. 2A)nd at m/z 274 and m/z 286 from d6-DMA (Fig. 2B) are due todducts of the corresponding DMA derivatives with the reagentas methane, i.e. [M + C2H5]+ and [M + C3H5]+, respectively.n contrast to NICI [15], the mass spectra depicted in Fig. 2learly show protonation and adduct formation of the pentaflu-robenzamide derivatives of d0-DMA and d6-DMA under PICIonditions; also unlike in NICI, no intense ions were observe at/z values below 240 in PICI.The exact m/z values of 240.15 and 246.16 obtained in
he PICI mass spectra were used in quantitative analyses. Theentafluorobenzamide derivatives of d0-DMA and d6-DMA areartially separated by GC. For accurate quantification in theIM mode the dwell-time was set to 50 ms for each ion. Quan-
itative GC–MS analysis of plasma DMA by SIM of m/z 240nd m/z 246 provided chromatograms mainly containing two
ntense peaks corresponding to endogenous DMA and the inter-al standard d6-DMA within a relevant retention time windowFig. 3).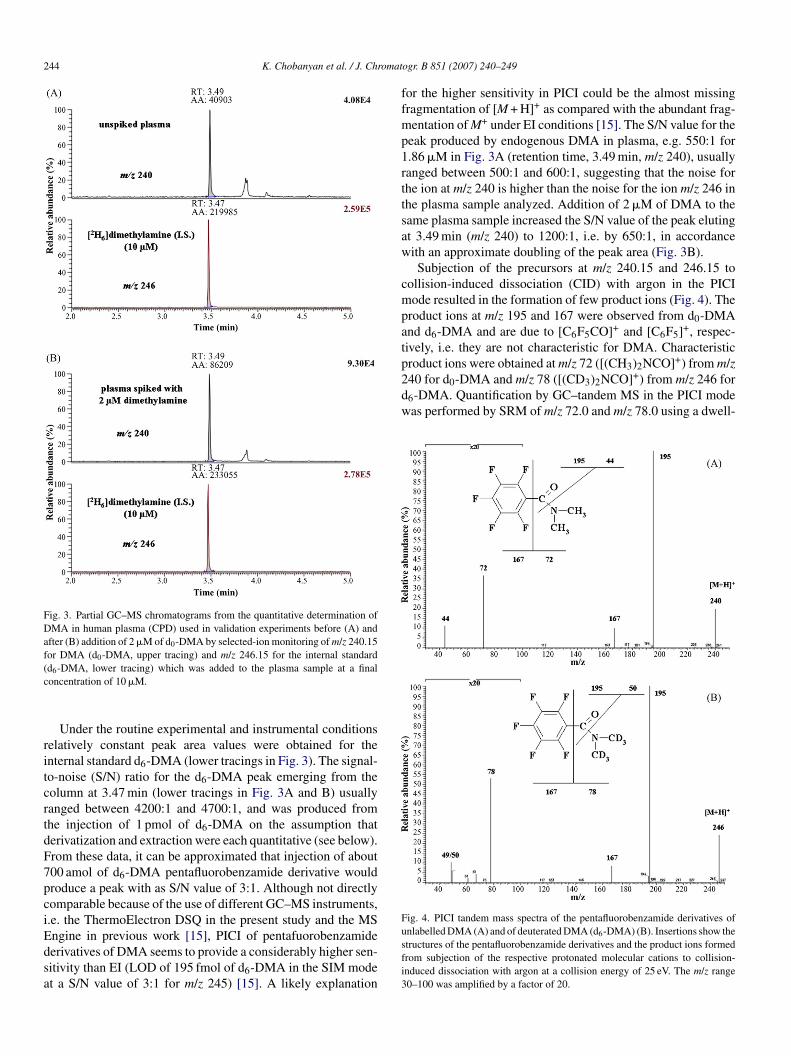
244 K. Chobanyan et al. / J. Chromat
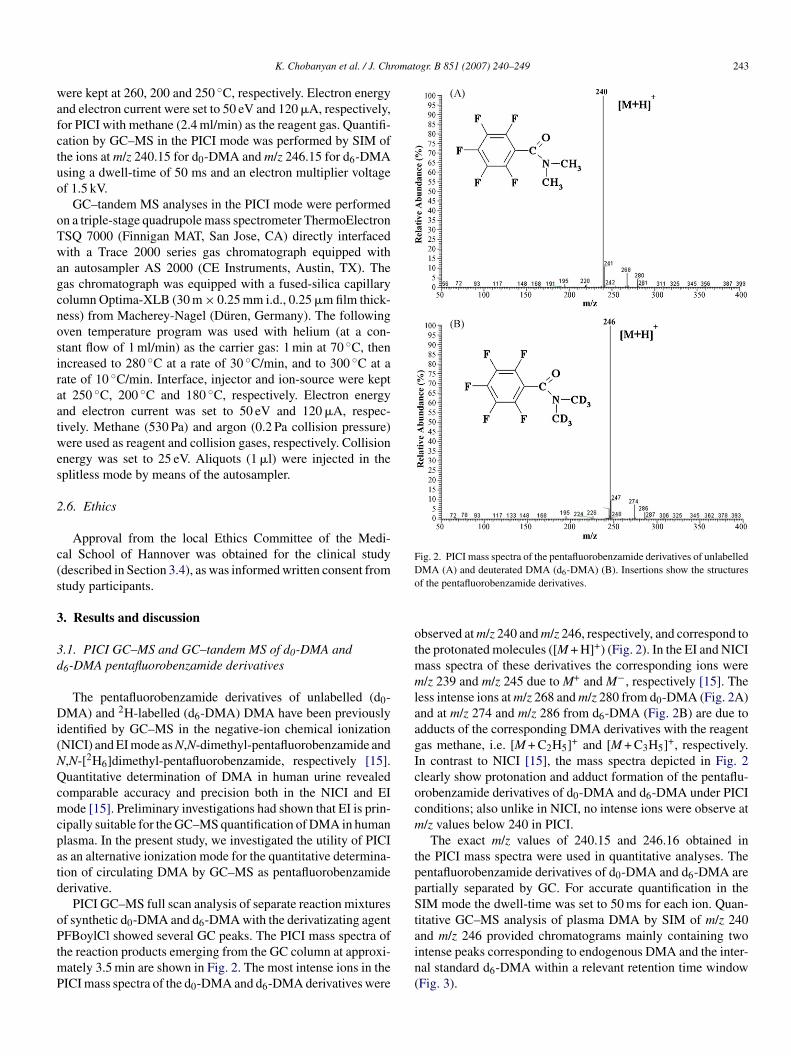
Fig. 3. Partial GC–MS chromatograms from the quantitative determination ofDMA in human plasma (CPD) used in validation experiments before (A) andafter (B) addition of 2 �M of d0-DMA by selected-ion monitoring of m/z 240.15for DMA (d0-DMA, upper tracing) and m/z 246.15 for the internal standard(c
ritcrtdF7pciEdsa
ffmp1rttsaw
cmpatproduct ions were obtained at m/z 72 ([(CH3)2NCO] ) from m/z240 for d0-DMA and m/z 78 ([(CD3)2NCO]+) from m/z 246 ford6-DMA. Quantification by GC–tandem MS in the PICI modewas performed by SRM of m/z 72.0 and m/z 78.0 using a dwell-
Fig. 4. PICI tandem mass spectra of the pentafluorobenzamide derivatives of
d6-DMA, lower tracing) which was added to the plasma sample at a finaloncentration of 10 �M.
Under the routine experimental and instrumental conditionselatively constant peak area values were obtained for thenternal standard d6-DMA (lower tracings in Fig. 3). The signal-o-noise (S/N) ratio for the d6-DMA peak emerging from theolumn at 3.47 min (lower tracings in Fig. 3A and B) usuallyanged between 4200:1 and 4700:1, and was produced fromhe injection of 1 pmol of d6-DMA on the assumption thaterivatization and extraction were each quantitative (see below).rom these data, it can be approximated that injection of about00 amol of d6-DMA pentafluorobenzamide derivative wouldroduce a peak with as S/N value of 3:1. Although not directlyomparable because of the use of different GC–MS instruments,.e. the ThermoElectron DSQ in the present study and the MS
ngine in previous work [15], PICI of pentafuorobenzamideerivatives of DMA seems to provide a considerably higher sen-itivity than EI (LOD of 195 fmol of d6-DMA in the SIM modet a S/N value of 3:1 for m/z 245) [15]. A likely explanationusfi3
ogr. B 851 (2007) 240–249
or the higher sensitivity in PICI could be the almost missingragmentation of [M + H]+ as compared with the abundant frag-entation of M+ under EI conditions [15]. The S/N value for the
eak produced by endogenous DMA in plasma, e.g. 550:1 for.86 �M in Fig. 3A (retention time, 3.49 min, m/z 240), usuallyanged between 500:1 and 600:1, suggesting that the noise forhe ion at m/z 240 is higher than the noise for the ion m/z 246 inhe plasma sample analyzed. Addition of 2 �M of DMA to theame plasma sample increased the S/N value of the peak elutingt 3.49 min (m/z 240) to 1200:1, i.e. by 650:1, in accordanceith an approximate doubling of the peak area (Fig. 3B).Subjection of the precursors at m/z 240.15 and 246.15 to
ollision-induced dissociation (CID) with argon in the PICIode resulted in the formation of few product ions (Fig. 4). The
roduct ions at m/z 195 and 167 were observed from d0-DMAnd d6-DMA and are due to [C6F5CO]+ and [C6F5]+, respec-ively, i.e. they are not characteristic for DMA. Characteristic
+
nlabelled DMA (A) and of deuterated DMA (d6-DMA) (B). Insertions show thetructures of the pentafluorobenzamide derivatives and the product ions formedrom subjection of the respective protonated molecular cations to collision-nduced dissociation with argon at a collision energy of 25 eV. The m/z range0–100 was amplified by a factor of 20.
omat
t1
3o
Pcoawotd1t
Fz(2of
itewuwofgp
D
K. Chobanyan et al. / J. Chr
ime of 50 ms for each ion and an electron multiplier voltage of.9 kV.
.2. Derivatization/extraction procedure and concentrationf the internal standard d6-DMA
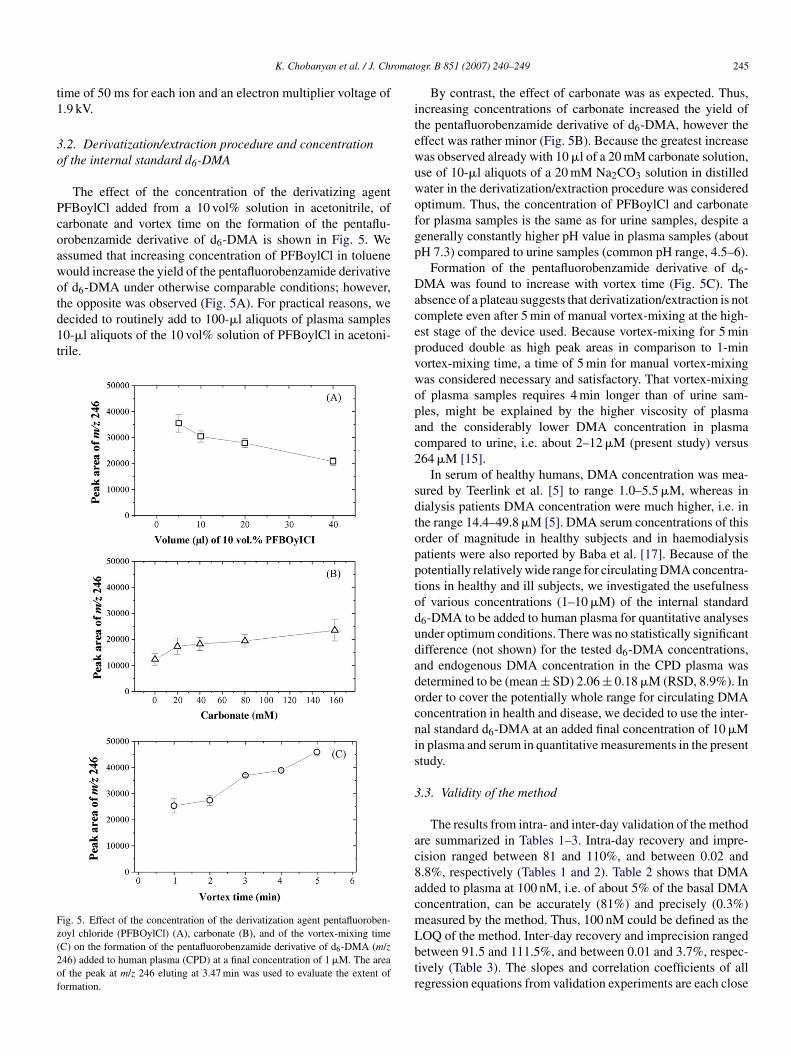
The effect of the concentration of the derivatizing agentFBoylCl added from a 10 vol% solution in acetonitrile, ofarbonate and vortex time on the formation of the pentaflu-robenzamide derivative of d6-DMA is shown in Fig. 5. Wessumed that increasing concentration of PFBoylCl in tolueneould increase the yield of the pentafluorobenzamide derivativef d6-DMA under otherwise comparable conditions; however,
he opposite was observed (Fig. 5A). For practical reasons, weecided to routinely add to 100-�l aliquots of plasma samples0-�l aliquots of the 10 vol% solution of PFBoylCl in acetoni-rile.ig. 5. Effect of the concentration of the derivatization agent pentafluoroben-oyl chloride (PFBOylCl) (A), carbonate (B), and of the vortex-mixing timeC) on the formation of the pentafluorobenzamide derivative of d6-DMA (m/z46) added to human plasma (CPD) at a final concentration of 1 �M. The areaf the peak at m/z 246 eluting at 3.47 min was used to evaluate the extent oformation.
acepvwopac2
sdtopptodudadocnis
3
ac8acmLbtr
ogr. B 851 (2007) 240–249 245
By contrast, the effect of carbonate was as expected. Thus,ncreasing concentrations of carbonate increased the yield ofhe pentafluorobenzamide derivative of d6-DMA, however theffect was rather minor (Fig. 5B). Because the greatest increaseas observed already with 10 �l of a 20 mM carbonate solution,se of 10-�l aliquots of a 20 mM Na2CO3 solution in distilledater in the derivatization/extraction procedure was consideredptimum. Thus, the concentration of PFBoylCl and carbonateor plasma samples is the same as for urine samples, despite aenerally constantly higher pH value in plasma samples (aboutH 7.3) compared to urine samples (common pH range, 4.5–6).
Formation of the pentafluorobenzamide derivative of d6-MA was found to increase with vortex time (Fig. 5C). The
bsence of a plateau suggests that derivatization/extraction is notomplete even after 5 min of manual vortex-mixing at the high-st stage of the device used. Because vortex-mixing for 5 minroduced double as high peak areas in comparison to 1-minortex-mixing time, a time of 5 min for manual vortex-mixingas considered necessary and satisfactory. That vortex-mixingf plasma samples requires 4 min longer than of urine sam-les, might be explained by the higher viscosity of plasmand the considerably lower DMA concentration in plasmaompared to urine, i.e. about 2–12 �M (present study) versus64 �M [15].
In serum of healthy humans, DMA concentration was mea-ured by Teerlink et al. [5] to range 1.0–5.5 �M, whereas inialysis patients DMA concentration were much higher, i.e. inhe range 14.4–49.8 �M [5]. DMA serum concentrations of thisrder of magnitude in healthy subjects and in haemodialysisatients were also reported by Baba et al. [17]. Because of theotentially relatively wide range for circulating DMA concentra-ions in healthy and ill subjects, we investigated the usefulnessf various concentrations (1–10 �M) of the internal standard6-DMA to be added to human plasma for quantitative analysesnder optimum conditions. There was no statistically significantifference (not shown) for the tested d6-DMA concentrations,nd endogenous DMA concentration in the CPD plasma wasetermined to be (mean ± SD) 2.06 ± 0.18 �M (RSD, 8.9%). Inrder to cover the potentially whole range for circulating DMAoncentration in health and disease, we decided to use the inter-al standard d6-DMA at an added final concentration of 10 �Mn plasma and serum in quantitative measurements in the presenttudy.
.3. Validity of the method
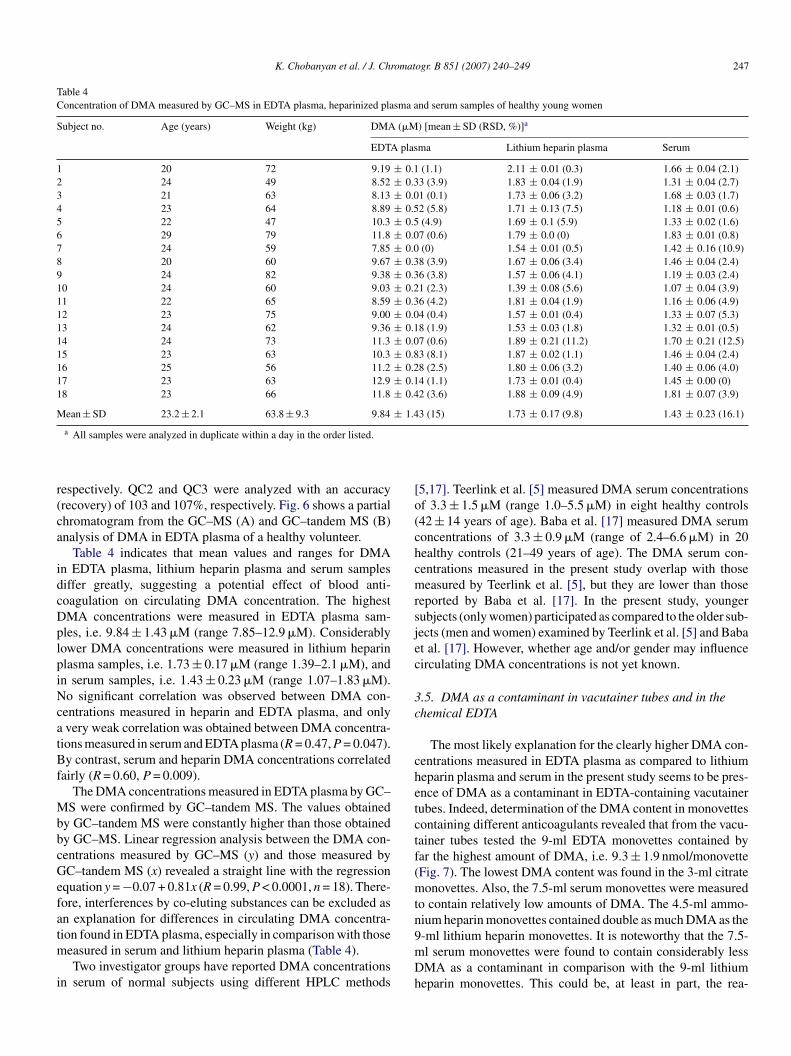
The results from intra- and inter-day validation of the methodre summarized in Tables 1–3. Intra-day recovery and impre-ision ranged between 81 and 110%, and between 0.02 and.8%, respectively (Tables 1 and 2). Table 2 shows that DMAdded to plasma at 100 nM, i.e. of about 5% of the basal DMAoncentration, can be accurately (81%) and precisely (0.3%)easured by the method. Thus, 100 nM could be defined as the
OQ of the method. Inter-day recovery and imprecision rangedetween 91.5 and 111.5%, and between 0.01 and 3.7%, respec-ively (Table 3). The slopes and correlation coefficients of allegression equations from validation experiments are each close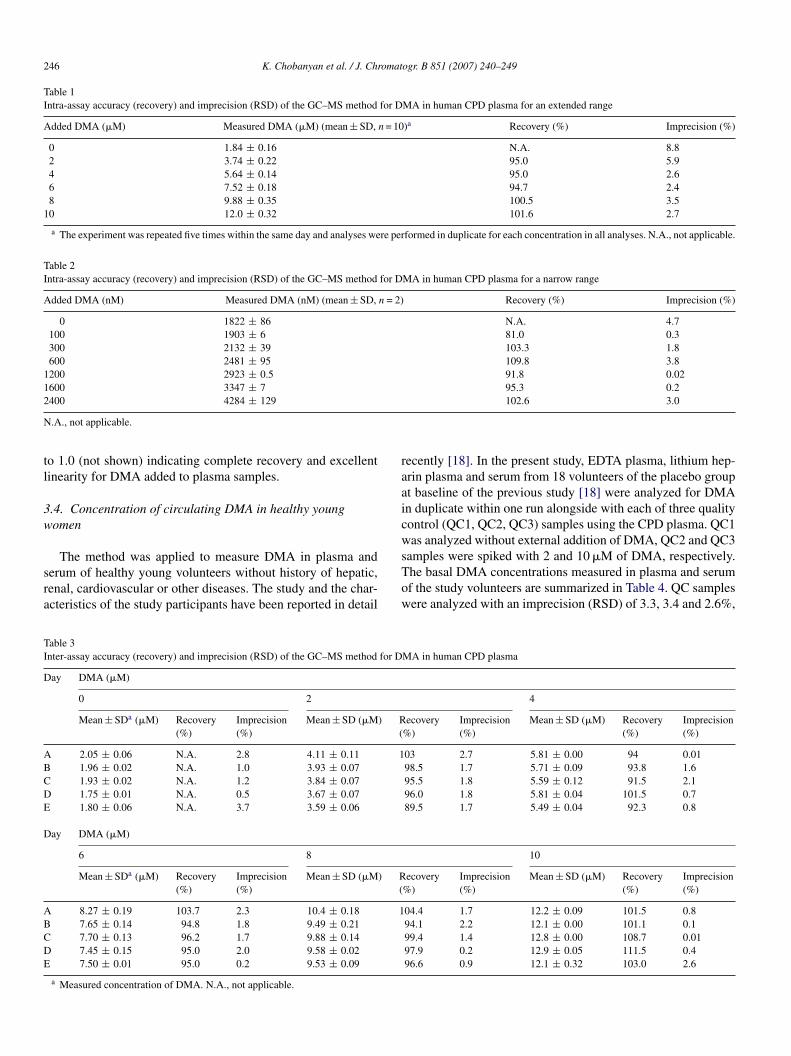
246 K. Chobanyan et al. / J. Chromatogr. B 851 (2007) 240–249
Table 1Intra-assay accuracy (recovery) and imprecision (RSD) of the GC–MS method for DMA in human CPD plasma for an extended range
Added DMA (�M) Measured DMA (�M) (mean ± SD, n = 10)a Recovery (%) Imprecision (%)
0 1.84 ± 0.16 N.A. 8.82 3.74 ± 0.22 95.0 5.94 5.64 ± 0.14 95.0 2.66 7.52 ± 0.18 94.7 2.48 9.88 ± 0.35 100.5 3.5
10 12.0 ± 0.32 101.6 2.7
a The experiment was repeated five times within the same day and analyses were performed in duplicate for each concentration in all analyses. N.A., not applicable.
Table 2Intra-assay accuracy (recovery) and imprecision (RSD) of the GC–MS method for DMA in human CPD plasma for a narrow range
Added DMA (nM) Measured DMA (nM) (mean ± SD, n = 2) Recovery (%) Imprecision (%)
0 1822 ± 86 N.A. 4.7100 1903 ± 6 81.0 0.3300 2132 ± 39 103.3 1.8600 2481 ± 95 109.8 3.8
1200 2923 ± 0.5 91.8 0.021600 3347 ± 7 95.3 0.22
N
tl
3w
sra
raaicw
TI
D
ABCDE
D
ABCDE
400 4284 ± 129
.A., not applicable.
o 1.0 (not shown) indicating complete recovery and excellentinearity for DMA added to plasma samples.
.4. Concentration of circulating DMA in healthy youngomen
The method was applied to measure DMA in plasma anderum of healthy young volunteers without history of hepatic,enal, cardiovascular or other diseases. The study and the char-cteristics of the study participants have been reported in detail
sTow
able 3nter-assay accuracy (recovery) and imprecision (RSD) of the GC–MS method for D
ay DMA (�M)
0 2
Mean ± SDa (�M) Recovery(%)
Imprecision(%)
Mean ± SD (�M) R(
2.05 ± 0.06 N.A. 2.8 4.11 ± 0.11 11.96 ± 0.02 N.A. 1.0 3.93 ± 0.071.93 ± 0.02 N.A. 1.2 3.84 ± 0.071.75 ± 0.01 N.A. 0.5 3.67 ± 0.071.80 ± 0.06 N.A. 3.7 3.59 ± 0.06
ay DMA (�M)
6 8
Mean ± SDa (�M) Recovery(%)
Imprecision(%)
Mean ± SD (�M) R(
8.27 ± 0.19 103.7 2.3 10.4 ± 0.18 17.65 ± 0.14 94.8 1.8 9.49 ± 0.217.70 ± 0.13 96.2 1.7 9.88 ± 0.147.45 ± 0.15 95.0 2.0 9.58 ± 0.027.50 ± 0.01 95.0 0.2 9.53 ± 0.09
a Measured concentration of DMA. N.A., not applicable.
102.6 3.0
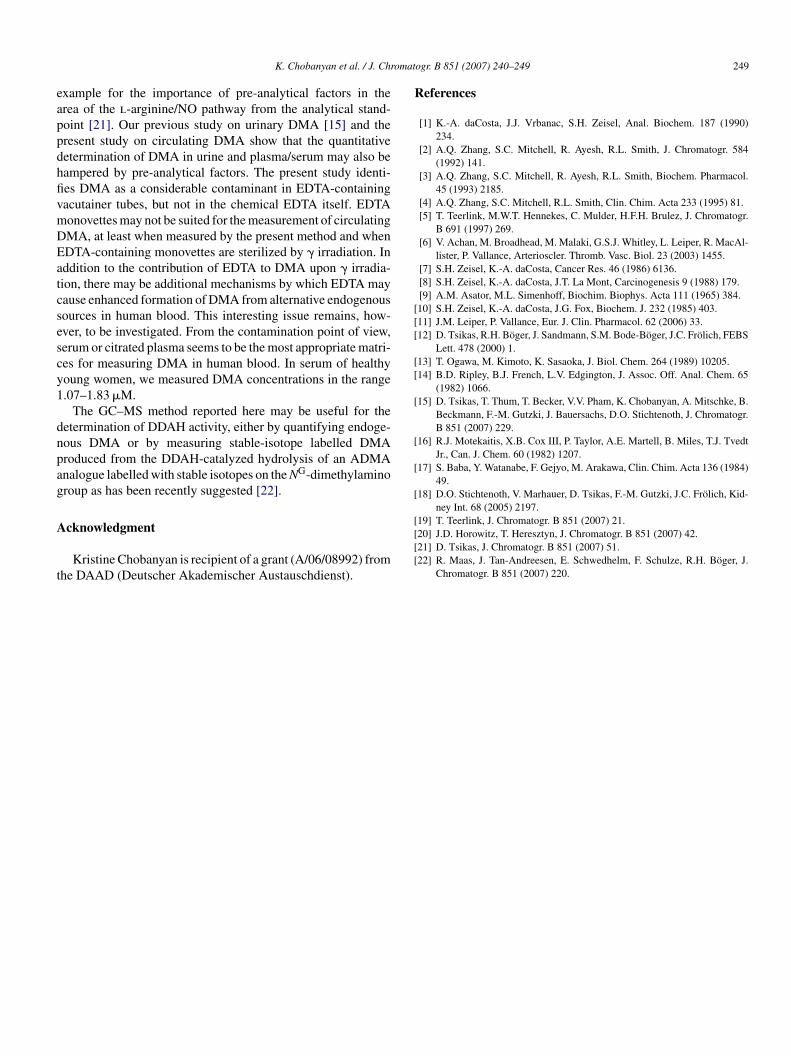
ecently [18]. In the present study, EDTA plasma, lithium hep-rin plasma and serum from 18 volunteers of the placebo groupt baseline of the previous study [18] were analyzed for DMAn duplicate within one run alongside with each of three qualityontrol (QC1, QC2, QC3) samples using the CPD plasma. QC1as analyzed without external addition of DMA, QC2 and QC3
amples were spiked with 2 and 10 �M of DMA, respectively.he basal DMA concentrations measured in plasma and serumf the study volunteers are summarized in Table 4. QC samplesere analyzed with an imprecision (RSD) of 3.3, 3.4 and 2.6%,
MA in human CPD plasma
4
ecovery%)
Imprecision(%)
Mean ± SD (�M) Recovery(%)
Imprecision(%)
03 2.7 5.81 ± 0.00 94 0.0198.5 1.7 5.71 ± 0.09 93.8 1.695.5 1.8 5.59 ± 0.12 91.5 2.196.0 1.8 5.81 ± 0.04 101.5 0.789.5 1.7 5.49 ± 0.04 92.3 0.8
10
ecovery%)
Imprecision(%)
Mean ± SD (�M) Recovery(%)
Imprecision(%)
04.4 1.7 12.2 ± 0.09 101.5 0.894.1 2.2 12.1 ± 0.00 101.1 0.199.4 1.4 12.8 ± 0.00 108.7 0.0197.9 0.2 12.9 ± 0.05 111.5 0.496.6 0.9 12.1 ± 0.32 103.0 2.6
K. Chobanyan et al. / J. Chromatogr. B 851 (2007) 240–249 247
Table 4Concentration of DMA measured by GC–MS in EDTA plasma, heparinized plasma and serum samples of healthy young women
Subject no. Age (years) Weight (kg) DMA (�M) [mean ± SD (RSD, %)]a
EDTA plasma Lithium heparin plasma Serum
1 20 72 9.19 ± 0.1 (1.1) 2.11 ± 0.01 (0.3) 1.66 ± 0.04 (2.1)2 24 49 8.52 ± 0.33 (3.9) 1.83 ± 0.04 (1.9) 1.31 ± 0.04 (2.7)3 21 63 8.13 ± 0.01 (0.1) 1.73 ± 0.06 (3.2) 1.68 ± 0.03 (1.7)4 23 64 8.89 ± 0.52 (5.8) 1.71 ± 0.13 (7.5) 1.18 ± 0.01 (0.6)5 22 47 10.3 ± 0.5 (4.9) 1.69 ± 0.1 (5.9) 1.33 ± 0.02 (1.6)6 29 79 11.8 ± 0.07 (0.6) 1.79 ± 0.0 (0) 1.83 ± 0.01 (0.8)7 24 59 7.85 ± 0.0 (0) 1.54 ± 0.01 (0.5) 1.42 ± 0.16 (10.9)8 20 60 9.67 ± 0.38 (3.9) 1.67 ± 0.06 (3.4) 1.46 ± 0.04 (2.4)9 24 82 9.38 ± 0.36 (3.8) 1.57 ± 0.06 (4.1) 1.19 ± 0.03 (2.4)10 24 60 9.03 ± 0.21 (2.3) 1.39 ± 0.08 (5.6) 1.07 ± 0.04 (3.9)11 22 65 8.59 ± 0.36 (4.2) 1.81 ± 0.04 (1.9) 1.16 ± 0.06 (4.9)12 23 75 9.00 ± 0.04 (0.4) 1.57 ± 0.01 (0.4) 1.33 ± 0.07 (5.3)13 24 62 9.36 ± 0.18 (1.9) 1.53 ± 0.03 (1.8) 1.32 ± 0.01 (0.5)14 24 73 11.3 ± 0.07 (0.6) 1.89 ± 0.21 (11.2) 1.70 ± 0.21 (12.5)15 23 63 10.3 ± 0.83 (8.1) 1.87 ± 0.02 (1.1) 1.46 ± 0.04 (2.4)16 25 56 11.2 ± 0.28 (2.5) 1.80 ± 0.06 (3.2) 1.40 ± 0.06 (4.0)17 23 63 12.9 ± 0.14 (1.1) 1.73 ± 0.01 (0.4) 1.45 ± 0.00 (0)18 23 66 11.8 ± 0.42 (3.6) 1.88 ± 0.09 (4.9) 1.81 ± 0.07 (3.9)
Mean ± SD 23.2 ± 2.1 63.8 ± 9.3 9.84 ± 1.43 (15) 1.73 ± 0.17 (9.8) 1.43 ± 0.23 (16.1)
r(ca
idcDplpiNcatBf
MbbcGefatm
i
[o(chcmrsjec
3c
chetctf(mtn
a All samples were analyzed in duplicate within a day in the order listed.
espectively. QC2 and QC3 were analyzed with an accuracyrecovery) of 103 and 107%, respectively. Fig. 6 shows a partialhromatogram from the GC–MS (A) and GC–tandem MS (B)nalysis of DMA in EDTA plasma of a healthy volunteer.
Table 4 indicates that mean values and ranges for DMAn EDTA plasma, lithium heparin plasma and serum samplesiffer greatly, suggesting a potential effect of blood anti-oagulation on circulating DMA concentration. The highestMA concentrations were measured in EDTA plasma sam-les, i.e. 9.84 ± 1.43 �M (range 7.85–12.9 �M). Considerablyower DMA concentrations were measured in lithium heparinlasma samples, i.e. 1.73 ± 0.17 �M (range 1.39–2.1 �M), andn serum samples, i.e. 1.43 ± 0.23 �M (range 1.07–1.83 �M).o significant correlation was observed between DMA con-
entrations measured in heparin and EDTA plasma, and onlyvery weak correlation was obtained between DMA concentra-
ions measured in serum and EDTA plasma (R = 0.47, P = 0.047).y contrast, serum and heparin DMA concentrations correlated
airly (R = 0.60, P = 0.009).The DMA concentrations measured in EDTA plasma by GC–
S were confirmed by GC–tandem MS. The values obtainedy GC–tandem MS were constantly higher than those obtainedy GC–MS. Linear regression analysis between the DMA con-entrations measured by GC–MS (y) and those measured byC–tandem MS (x) revealed a straight line with the regression
quation y = −0.07 + 0.81x (R = 0.99, P < 0.0001, n = 18). There-ore, interferences by co-eluting substances can be excluded asn explanation for differences in circulating DMA concentra-
ion found in EDTA plasma, especially in comparison with thoseeasured in serum and lithium heparin plasma (Table 4).Two investigator groups have reported DMA concentrations
n serum of normal subjects using different HPLC methods
9mDh
5,17]. Teerlink et al. [5] measured DMA serum concentrationsf 3.3 ± 1.5 �M (range 1.0–5.5 �M) in eight healthy controls42 ± 14 years of age). Baba et al. [17] measured DMA serumoncentrations of 3.3 ± 0.9 �M (range of 2.4–6.6 �M) in 20ealthy controls (21–49 years of age). The DMA serum con-entrations measured in the present study overlap with thoseeasured by Teerlink et al. [5], but they are lower than those
eported by Baba et al. [17]. In the present study, youngerubjects (only women) participated as compared to the older sub-ects (men and women) examined by Teerlink et al. [5] and Babat al. [17]. However, whether age and/or gender may influenceirculating DMA concentrations is not yet known.
.5. DMA as a contaminant in vacutainer tubes and in thehemical EDTA
The most likely explanation for the clearly higher DMA con-entrations measured in EDTA plasma as compared to lithiumeparin plasma and serum in the present study seems to be pres-nce of DMA as a contaminant in EDTA-containing vacutainerubes. Indeed, determination of the DMA content in monovettesontaining different anticoagulants revealed that from the vacu-ainer tubes tested the 9-ml EDTA monovettes contained byar the highest amount of DMA, i.e. 9.3 ± 1.9 nmol/monovetteFig. 7). The lowest DMA content was found in the 3-ml citrateonovettes. Also, the 7.5-ml serum monovettes were measured
o contain relatively low amounts of DMA. The 4.5-ml ammo-ium heparin monovettes contained double as much DMA as the
-ml lithium heparin monovettes. It is noteworthy that the 7.5-l serum monovettes were found to contain considerably lessMA as a contaminant in comparison with the 9-ml lithiumeparin monovettes. This could be, at least in part, the rea-
248 K. Chobanyan et al. / J. Chromat
Fig. 6. Partial chromatograms from the quantitative determination of DMA inEDTA plasma of a healthy young female (volunteer No. 5, see Table 4) by (A)GC–MS (SIM mode) and (B) GC–tandem MS (SRM mode) for DMA (uppertracings) and the internal standard (d6-DMA, lower tracings) which was addedto the plasma sample at a final concentration of 10 �M.
Fig. 7. DMA content of tested vacutainer tubes as measured by GC–MS. Eachsix monovettes were used. See the text for more details. HepLi: lithium heparin;HepNH4: ammonium heparin.
ssstm
wptddoibmb
ttimsiptunsbdDtlciDdIduaaa
4
ts1dafo
eo
ogr. B 851 (2007) 240–249
on for the slightly lower DMA concentrations measured inerum samples compared to those determined in heparin plasmaamples (Table 4), as well as for the merely moderate correla-ion (R = 0.60, P = 0.009) found between DMA concentrations
easured in heparin plasma and serum samples.EDTA added to PBS at final concentrations of up to 10 mM
as found not to contribute to DMA when measured by theresent GC–MS method (data not shown). This finding suggestshat the chemical EDTA does not contain DMA. The failure toetect DMA in EDTA-containing PBS suggests that EDTA itselfoes not contribute to DMA by thermal decomposition or byther ways during GC–MS analysis, most likely because EDTAs not derivatized with PFBoylCl and EDTA itself is not extractedy toluene. All findings together strongly suggest that DMAeasured in EDTA monovettes is produced during sterilization
y � irradiation.The present study does not allow reliable evaluation of
he contribution of the DMA contaminant in the vacutainerubes to the total DMA concentration measured in the clin-cal study samples (Table 4) for the following reasons. The
onovettes used to measure DMA contamination in the presenttudy are not from the same charge that was previously usedn the clinical study [18]; the blood volumes taken and thelasma/serum volumes generated are unknown; the distribu-ion of DMA between plasma or serum and erythrocytes isnknown; and the DMA contamination may vary considerably,otably in EDTA monovettes (Fig. 7). Nevertheless, our presenttudy cannot exclude alternative, EDTA-involving mechanismsy which endogenous substances, such as lecithin, sarcosine andimethylglycine [9,10], could have contributed to circulatingMA measured in EDTA plasma. Because ADMA concentra-
ions in plasma and serum are very similar and furthermoreower, i.e. about 0.4 �M [19,20], than plasma/serum DMAoncentrations measured by our and other groups [5,17], its unlikely that the anticoagulant EDTA could have enhancedDAH-catalyzed hydrolysis of ADMA to DMA and L-citrullineuring blood sampling to produce several �M-units of DMA.t is noteworthy that blood anticoagulation may be a majoreterminant of circulating l-arginine concentration, with thenderlying mechanism being still unknown; obviously, l-rginine concentrations are constantly higher (by 58%) in serums compared with plasma and not related to contaminating l-rginine [19].
. Conclusions
The present GC–MS method involving simultaneous deriva-ization and extraction of DMA from human plasma orerum is accurate, precise, simple and rapid. Routinely,00 plasma/serum samples can be worked up by a person peray and can be analyzed daily by this method using our GC–MSnd GC–tandem MS instruments. These characteristics allowor automated and high-throughput quantitative determination
f DMA in human plasma/serum in the frame of clinical studies.Contamination of vacutainer tubes and other laboratoryquipment with nitrite and nitrate as well as dietary intakef these anions are well recognized and the most prominent
omat
eappdhfivmDEatcsescy1
dnpag
A
t
R
[[[
[[
[
[
[
[
K. Chobanyan et al. / J. Chr
xample for the importance of pre-analytical factors in therea of the l-arginine/NO pathway from the analytical stand-oint [21]. Our previous study on urinary DMA [15] and theresent study on circulating DMA show that the quantitativeetermination of DMA in urine and plasma/serum may also beampered by pre-analytical factors. The present study identi-es DMA as a considerable contaminant in EDTA-containingacutainer tubes, but not in the chemical EDTA itself. EDTAonovettes may not be suited for the measurement of circulatingMA, at least when measured by the present method and whenDTA-containing monovettes are sterilized by � irradiation. Inddition to the contribution of EDTA to DMA upon � irradia-ion, there may be additional mechanisms by which EDTA mayause enhanced formation of DMA from alternative endogenousources in human blood. This interesting issue remains, how-ver, to be investigated. From the contamination point of view,erum or citrated plasma seems to be the most appropriate matri-es for measuring DMA in human blood. In serum of healthyoung women, we measured DMA concentrations in the range.07–1.83 �M.
The GC–MS method reported here may be useful for theetermination of DDAH activity, either by quantifying endoge-ous DMA or by measuring stable-isotope labelled DMAroduced from the DDAH-catalyzed hydrolysis of an ADMAnalogue labelled with stable isotopes on the NG-dimethylaminoroup as has been recently suggested [22].
cknowledgment
Kristine Chobanyan is recipient of a grant (A/06/08992) fromhe DAAD (Deutscher Akademischer Austauschdienst).
[[[[
ogr. B 851 (2007) 240–249 249
eferences
[1] K.-A. daCosta, J.J. Vrbanac, S.H. Zeisel, Anal. Biochem. 187 (1990)234.
[2] A.Q. Zhang, S.C. Mitchell, R. Ayesh, R.L. Smith, J. Chromatogr. 584(1992) 141.
[3] A.Q. Zhang, S.C. Mitchell, R. Ayesh, R.L. Smith, Biochem. Pharmacol.45 (1993) 2185.
[4] A.Q. Zhang, S.C. Mitchell, R.L. Smith, Clin. Chim. Acta 233 (1995) 81.[5] T. Teerlink, M.W.T. Hennekes, C. Mulder, H.F.H. Brulez, J. Chromatogr.
B 691 (1997) 269.[6] V. Achan, M. Broadhead, M. Malaki, G.S.J. Whitley, L. Leiper, R. MacAl-
lister, P. Vallance, Arterioscler. Thromb. Vasc. Biol. 23 (2003) 1455.[7] S.H. Zeisel, K.-A. daCosta, Cancer Res. 46 (1986) 6136.[8] S.H. Zeisel, K.-A. daCosta, J.T. La Mont, Carcinogenesis 9 (1988) 179.[9] A.M. Asator, M.L. Simenhoff, Biochim. Biophys. Acta 111 (1965) 384.10] S.H. Zeisel, K.-A. daCosta, J.G. Fox, Biochem. J. 232 (1985) 403.11] J.M. Leiper, P. Vallance, Eur. J. Clin. Pharmacol. 62 (2006) 33.12] D. Tsikas, R.H. Boger, J. Sandmann, S.M. Bode-Boger, J.C. Frolich, FEBS
Lett. 478 (2000) 1.13] T. Ogawa, M. Kimoto, K. Sasaoka, J. Biol. Chem. 264 (1989) 10205.14] B.D. Ripley, B.J. French, L.V. Edgington, J. Assoc. Off. Anal. Chem. 65
(1982) 1066.15] D. Tsikas, T. Thum, T. Becker, V.V. Pham, K. Chobanyan, A. Mitschke, B.
Beckmann, F.-M. Gutzki, J. Bauersachs, D.O. Stichtenoth, J. Chromatogr.B 851 (2007) 229.
16] R.J. Motekaitis, X.B. Cox III, P. Taylor, A.E. Martell, B. Miles, T.J. TvedtJr., Can. J. Chem. 60 (1982) 1207.
17] S. Baba, Y. Watanabe, F. Gejyo, M. Arakawa, Clin. Chim. Acta 136 (1984)49.
18] D.O. Stichtenoth, V. Marhauer, D. Tsikas, F.-M. Gutzki, J.C. Frolich, Kid-ney Int. 68 (2005) 2197.
19] T. Teerlink, J. Chromatogr. B 851 (2007) 21.20] J.D. Horowitz, T. Heresztyn, J. Chromatogr. B 851 (2007) 42.21] D. Tsikas, J. Chromatogr. B 851 (2007) 51.22] R. Maas, J. Tan-Andreesen, E. Schwedhelm, F. Schulze, R.H. Boger, J.
Chromatogr. B 851 (2007) 220.