Accuracy Type Test for Rogowski Coils Subjected to Distorted ...
20
Sensors 2022, 22, 1397. https://doi.org/10.3390/s22041397 www.mdpi.com/journal/sensors Article Accuracy Type Test for Rogowski Coils Subjected to Distorted Signals, Temperature, Humidity, and Position Variations Alessandro Mingotti *, Federica Costa, Lorenzo Peretto and Roberto Tinarelli Department of Electrical, Electronic and Information Engineering, Guglielmo Marconi Alma Mater Studiorum, University of Bologna, Viale del Risorgimento 2, 40136 Bologna, Italy; [email protected] (F.C.); [email protected] (L.P.); [email protected] (R.T.) * Correspondence: [email protected] Abstract: Low-Power Instrument Transformers (LPITs) are becoming the first choice for distributed measurement systems for medium voltage networks. However, there are still a lot of challenges related to their operation. Such challenges include their accuracy variation when several influence quantities are acting on them. Among the most significant influence quantities are temperature, electromagnetic field, humidity, etc. Another aspect that increases the importance of studying the LPITs’ accuracy behavior is that, once installed, they cannot be calibrated for several years; hence, one cannot compensate for in-field conditions. Hence, this work aims at introducing a simple type test for a specific LPIT, the Rogowski coil. First, an experimental setup to assess the effect of tem- perature, humidity, and positioning on the power quality accuracy performance of the Rogowski coil is described. Second, from the results and the experience of the authors it has been possible to design a specific type test. The test has the aim of finding the limits of the accuracy variations of a single Rogowski coil. Afterwards, such limits can be used to compensate for the in-field measure- ments, obtaining an overall higher accuracy. The results of this work may contribute to the always- evolving standardization work on LPITs. Keywords: accuracy; type test; low-power instrument transformer; Rogowski coil; temperature; humidity; positioning; measurements 1. Introduction The concept of a smart grid would not exist without measurements. In fact, a smart grid is defined as an “electric power system that utilizes information exchange and control technologies, distributed computing and associated sensors and actuators, for purposes such as (i) to integrate the behavior and actions of the network users and other stakehold- ers, (ii) to efficiently deliver sustainable, economic and secure electricity supplies” [1]. Therefore, the collection and exchange of information is based on measurements. Such measurements are manipulated and converted by intelligent electronic devices (IEDs). However, the measurement stage is achieved by means of instrument transformers (ITs) and low-power instrument transformers (LPITs). LPITs are also referred to as nonconven- tional instrument transformers (NCITs) or simply sensors. The choice of the IT also depends on the voltage level. For example, high voltage (HV) applications in the transmission network (TN) typically adopt legacy ITs [2,3]. This is mainly due to the need for consolidated reliability and to the significant availability of funds and space for the equipment installation. In other words, the LPIT technology is considered too “young” to be fully trusted by system operators (SOs). However, some encouraging HV applications with LPITs can be found in the literature [4,5]. Turning to the distribution side of the network (DN), the LPITs are becoming the main choice for several reasons. For example, they feature larger bandwidth, smaller size, lighter weight, reduced output, etc., compared to the ITs. Such characteristics, in addition to their cost-effectiveness, make the LPITs suitable for massive installation in the medium Citation: Mingotti, A.; Costa, F.; Peretto, L.; Tinarelli, R. Accuracy Type Test for Rogowski Coils Subjected to Distorted Signals, Temperature, Humidity, and Position Variations. Sensors 2022, 22, 1397. https://doi.org/10.3390/ s22041397 Academic Editor: Tomoyuki Yokota Received: 13 January 2022 Accepted: 9 February 2022 Published: 11 February 2022 Publisher’s Note: MDPI stays neu- tral with regard to jurisdictional claims in published maps and institu- tional affiliations. Copyright: © 2022 by the authors. Li- censee MDPI, Basel, Switzerland. This article is an open access article distributed under the terms and con- ditions of the Creative Commons At- tribution (CC BY) license (https://cre- ativecommons.org/licenses/by/4.0/).
-
Upload
khangminh22 -
Category
Documents
-
view
0 -
download
0
Transcript of Accuracy Type Test for Rogowski Coils Subjected to Distorted ...
Sensors 2022, 22, 1397. https://doi.org/10.3390/s22041397 www.mdpi.com/journal/sensors
Article
Accuracy Type Test for Rogowski Coils Subjected to Distorted
Signals, Temperature, Humidity, and Position Variations
Alessandro Mingotti *, Federica Costa, Lorenzo Peretto and Roberto Tinarelli
Department of Electrical, Electronic and Information Engineering, Guglielmo Marconi Alma Mater
Studiorum, University of Bologna, Viale del Risorgimento 2, 40136 Bologna, Italy;
[email protected] (F.C.); [email protected] (L.P.); [email protected] (R.T.)
* Correspondence: [email protected]
Abstract: Low-Power Instrument Transformers (LPITs) are becoming the first choice for distributed
measurement systems for medium voltage networks. However, there are still a lot of challenges
related to their operation. Such challenges include their accuracy variation when several influence
quantities are acting on them. Among the most significant influence quantities are temperature,
electromagnetic field, humidity, etc. Another aspect that increases the importance of studying the
LPITs’ accuracy behavior is that, once installed, they cannot be calibrated for several years; hence,
one cannot compensate for in-field conditions. Hence, this work aims at introducing a simple type
test for a specific LPIT, the Rogowski coil. First, an experimental setup to assess the effect of tem-
perature, humidity, and positioning on the power quality accuracy performance of the Rogowski
coil is described. Second, from the results and the experience of the authors it has been possible to
design a specific type test. The test has the aim of finding the limits of the accuracy variations of a
single Rogowski coil. Afterwards, such limits can be used to compensate for the in-field measure-
ments, obtaining an overall higher accuracy. The results of this work may contribute to the always-
evolving standardization work on LPITs.
Keywords: accuracy; type test; low-power instrument transformer; Rogowski coil; temperature;
humidity; positioning; measurements
1. Introduction
The concept of a smart grid would not exist without measurements. In fact, a smart
grid is defined as an “electric power system that utilizes information exchange and control
technologies, distributed computing and associated sensors and actuators, for purposes
such as (i) to integrate the behavior and actions of the network users and other stakehold-
ers, (ii) to efficiently deliver sustainable, economic and secure electricity supplies” [1].
Therefore, the collection and exchange of information is based on measurements. Such
measurements are manipulated and converted by intelligent electronic devices (IEDs).
However, the measurement stage is achieved by means of instrument transformers (ITs)
and low-power instrument transformers (LPITs). LPITs are also referred to as nonconven-
tional instrument transformers (NCITs) or simply sensors.
The choice of the IT also depends on the voltage level. For example, high voltage
(HV) applications in the transmission network (TN) typically adopt legacy ITs [2,3]. This
is mainly due to the need for consolidated reliability and to the significant availability of
funds and space for the equipment installation. In other words, the LPIT technology is
considered too “young” to be fully trusted by system operators (SOs). However, some
encouraging HV applications with LPITs can be found in the literature [4,5].
Turning to the distribution side of the network (DN), the LPITs are becoming the
main choice for several reasons. For example, they feature larger bandwidth, smaller size,
lighter weight, reduced output, etc., compared to the ITs. Such characteristics, in addition
to their cost-effectiveness, make the LPITs suitable for massive installation in the medium
Citation: Mingotti, A.; Costa, F.;
Peretto, L.; Tinarelli, R. Accuracy
Type Test for Rogowski Coils
Subjected to Distorted Signals,
Temperature, Humidity, and
Position Variations. Sensors 2022, 22,
1397. https://doi.org/10.3390/
s22041397
Academic Editor: Tomoyuki Yokota
Received: 13 January 2022
Accepted: 9 February 2022
Published: 11 February 2022
Publisher’s Note: MDPI stays neu-
tral with regard to jurisdictional
claims in published maps and institu-
tional affiliations.
Copyright: © 2022 by the authors. Li-
censee MDPI, Basel, Switzerland.
This article is an open access article
distributed under the terms and con-
ditions of the Creative Commons At-
tribution (CC BY) license (https://cre-
ativecommons.org/licenses/by/4.0/).

Sensors 2022, 22, 1397 2 of 20
and low voltage sides (MV and LV) of the network. As a matter of fact, any expensive
device could not spread among the node-crowded structure of the LV network.
In terms of standards, the work on ITs and LPITs is vivid. The reference standard
series is the IEC 61869. It contains the IEC 61860-1 [6] and IEC 61860-6 [7], which are the
general-purpose documents for ITs and LPITs, respectively. In addition, another 13 doc-
uments treat specifically each kind of transformer, such as IEC 61869-10 [8] and IEC 61860-
11 [9], which deal with low-power current and voltage transformers (LPCTs and LPVTs),
respectively. Of course, the documents relevant to ITs, such as IEC 61869-2 [10] and IEC
61860-3 [11], are the result of more years of studies than those for LPITs.
The focus of this work is on a widespread kind of LPCT; the Rogowski coil (RC). It is
almost obvious that the peculiarities of such a device are suitable for several applications
within, but not limited to, the power system scenario [12]. For example, they are used for
fault detection in induction motors [13] and for measuring fast transients [14]. In [15], they
were used as current sensors connected to the protections; while in [16], they were used
for measuring high-frequency currents. It can be than concluded that the literature is full
of studies on Rogowski coils, and new ones are published every day. With this work then;
the authors want to extend the general knowledge on the accuracy performance of a
Rogowski coil. This is completed by presenting a new and simple type test for assessing
the accuracy performance of RCs when affected by several influence quantities. The type
test originates from experimental measurements performed on off-the-shelf RCs and from
previous literature (and experience). In particular, the experimental tests described in
what follows include temperature, humidity, and position variation. Furthermore, the
adopted current test signals were distorted, to reflect actual in-field measurements. The
results were then evaluated in terms of the most adopted indices: ratio error and phase
displacement.
Several papers related to the main topic of this work were found. For example, the
single effect of distorted signals injected through the Rogowski coil was studied in [17,18].
In [19–21], instead, the effect of geometry on their performance was discussed and stud-
ied. As for [22, 23], they dealt with the error evaluation and the effect of shielding on
Rogowski coils, respectively. Finally, the authors in [24] started this research on Rogowski
coils, analyzing the effect of positioning and temperature injecting ideal signals.
The added value of this work is the accuracy evaluation when the combination of the
most influencing quantities with actual signals (typical in-field signals) is acting on RCs.
The result is a complete guide, for manufacturers and Rogowski coil final users, in the
form of a type test. Such a test can be performed to enhance the available information on
the device accuracy. Note that the final user is guided in the design of their own test. Then,
the information on the obtained accuracy can be used to correct in-field measurement re-
sults. This aspect is stressed in Section 2.
The remainder of this work is structured as follows: Section 2 describes the motiva-
tions for the need for new tests to be performed on Rogowski coils. This is achieved
through discussion of the existing literature and relevant standards. In Section 3, the meas-
urement setup to perform the experimental tests is described. The tests and their results
are given in Sections 4 and 5, respectively. Section 5 also contains the discussion of the
results. Finally, Section 6 is the conclusion of the work with its achievements and the fu-
ture directions for the research.
2. Importance of Testing
In this section the importance of testing is analyzed, whether for Rogowski coils or
any device. The importance of calibrating equipment is, in fact, too often underestimated.
To achieve accurate measurement results, it is not sufficient to buy and install a device.
On the contrary, a full knowledge of the device performance should be achieved.

Sensors 2022, 22, 1397 3 of 20
2.1. Calibration Process
From [1], the calibration is the “set of operations which establishes, by reference to
standards, the relationship which exists, under specified conditions, between an indica-
tion and a result of a measurement”. The significance of such a process becomes clear if
accurate measurement results are desired. However, if the calibration is quite a simple
task for a single object, as in the case of a research lab, the same does not hold for a man-
ufacturer. They deal with thousand devices per day/week; therefore, a calibration process
should be simple, smart, and not time-consuming. In the ideal case, if each single device
could be tested, there would be an increase in the knowledge about that device and its
accuracy.
To support the importance of the calibration procedure, it is sufficient to analyze the
amount of work in the literature. For example, [25,26] present a calibration system for ITs.
In [27], the authors studied the calibration of direct current (DC) current transformers
(CT); while in [28] it was conducted for digital ITs. A calibration procedure for legacy CTs
was presented in [29], while different kinds of LPITs were calibrated in [30–32]. All of
these works were extremely important for enhancing knowledge of ITs.
2.2. Modelling
The calibration (or characterization) of a device is often the first step for modeling it.
Ideally, if the exact model of a device is known, any user could predict (hence, correct) the
behavior of a device. The models are also used inside many software programs to simulate
the power network and its operations. However, a mathematic approach alone is not suf-
ficient to obtain a reliable model. In fact, it often happens that several unexpected non-
idealities are introduced in the manufacturing process. Therefore, testing a device is al-
ways a recommended procedure.
In the literature, this is confirmed by many publications. For example, models for ITs,
and, in particular, for CTs and voltage transformers (VTs), are developed in [33–35] re-
spectively. As for LPITs, they have been modeled in [36, 37] for LPVTs and Rogowski
coils, respectively.
2.3. Periodical Calibration
The final, and most critical, aspect to be considered before and during the installation
of a device is its periodic assessment. In fact, there is no guideline in the IEC 61869 series
about the time interval between the calibrations of an IT. Therefore, each manufacturer
provides (even if not very often) information about the validity over time of their device’s
accuracy. This typically ranges between 2 and 10 years, with peaks of 20 years in some
cases. Note that the processes and methods that led to those timings are not regulated.
Therefore, the final user is forced to trust the manufacturer’s experience. However, this
could be avoided by including in the standards specific tests and/or recommendations on
the periodic calibration of ITs.
Even the literature does not provide much information on this topic. However, re-
searchers are sensitive to the issue, and they are working on on-site calibration for ITs. For
example, on-site calibration systems have been developed for inductive VTs and CTs in
[38–42]. In [43], instead, authors present an on-site calibration system for electronic ITs.
All in all, with this work, the authors want to introduce a complete type test, whose
effectiveness has been experimentally validated. The test will provide information on the
device accuracy in the most significant operating conditions. Furthermore, the test will
guide the user on the test selection, depending on the target accuracy and/or the available
testing equipment. Therefore, during the on-site operation of the device, it would be pos-
sible to adjust the measurement results and increase the overall accuracy.

Sensors 2022, 22, 1397 4 of 20
3. Measurement Setup
The measurement setup dedicated to the type test is depicted in Figure 1.
Figure 1. Measurement setup developed for the type test.
It consists of:
A current source. The combination of the Fluke calibrator 6105 A and the transcon-
ductance 52120 A provides ideal or distorted currents. Such currents, referred to as
Iref in Figure 1, are injected into both the devices under tests (DUTs) and the reference
measurement device. The manufacturer of the calibrator and the transconductance
guarantees an accuracy performance of 0.009% of output error and 0.002% of range
error for frequencies between 10 Hz and 850 Hz, 0.04% of output error and 0.004% of
range error for frequencies between 850 Hz and 6 kHz.
A reference measurement device. The measurements collected from the DUTs are
compared with those of a resistive current shunt. The device, which has been fully
characterized vs. temperature and vs. frequency, features an overall 0.01% of uncer-
tainty. The shunt has a full scale of 100 A, and it consists of a 1 mΩ resistor. The
output voltage of the shunt is referred to as Vref (see Figure 1).
A small note on the source and the reference: it is not strictly necessary to have both
a reference source of current and a reference measurement device. Only one of them
is sufficient to guarantee the traceability of the performed measurements. However,
considering their availability, in this work both references have been used to ensure
the accuracy level.
A climatic chamber. It is a 550 L chamber, whose temperature can be varied between
–40 °C and 180 °C (with an accuracy of 0.3 °C). Its relative humidity can be varied
from 10% to 98% (with an accuracy between 1% and 3%) in the temperature range 10
°C to 95 °C. The chamber features two holes on the sides, which allow the user to
insert power and communication cables.
A set of three Rogowski coils (RCs). Each RC was made by a different manufacturer,
but they all feature a 1% accuracy and a conversion ratio of 100 mV/1 kA. From now,
they are referred to as R1, R2, and R3 for the sake of simplicity. The temperature
ranges of the RCs are –20 °C to 70 °C, –40 °C to 80 °C, and –20 °C to 80 °C for R1, R2,
and R3, respectively. Note, even the geometrical dimensions of the RCs are similar.
They feature diameters between 8 cm and 10 cm. No other information is given by
the manufacturers.
A data acquisition (DAQ) system. The output voltage of the DUTs (Vr1, Vr2, and Vr3,
for R1, R2, and R3, respectively) and Vref are collected by using a NI9238. The DAQ
has a full scale of ±500 mV, which is suitable considering the RCs conversion ratios.
As for its accuracy, the NI9238 has a gain error of ±0.07% and offset error of ±0.005%.
Finally, other interesting features of the DAQ are a 24-bit converter, 50 kSa/s/ch, and
1 GΩ input impedance. All the collected data are then computed via Labview soft-
ware to obtain the desired parameters.

Sensors 2022, 22, 1397 5 of 20
In brief, and explained further in Section 4, the desired distorted (or not) currents are
injected through the DUTs and the reference shunt. Simultaneously, they are subjected to
thermic, humidity, and position variations inside the chamber. Finally, the four acquired
signals are manipulated to obtain the typical accuracy indices used to evaluate the
Rogowski coils performance.
4. Experimental Tests
The design of the experimental tests was the result of a 3-step process. The first step
consisted of selecting the temperature and relative humidity variations. The second step
was used to fix the currents to be injected and measured by the DUTs. The third and last
step had the aim of evaluating which positions of the DUTs were appropriated for the
testing. Each step is discussed in the following subsections.
4.1. Temperature and Humidity
For outdoor devices, temperature is probably one of the most significant influence
quantities to be considered. All ITs are divided into three temperature categories. Accord-
ing to [6], these are –5/40, –20/40, and –40/40. The first number indicates the allowed min-
imum temperature, while the second number refers to the maximum. In [7], a new test for
LPITs, to assess the accuracy vs. temperature, was added. The temperature cycle to be
implemented is schematized in Figure 2.
Figure 2. Accuracy vs. temperature test specified in [7].
In Figure 2, first, the minimum temperature was set according to the temperature
class of the DUT. Second, the time interval between two temperature values and for a
temperature plateau are given in terms of multiples of the DUT thermal constant. How-
ever, manufacturers do not always provide such information (as in the case of the DUTs
tested in this work).
In light of the above, the selected temperature range was –5 °C to 40 °C, and the ther-
mal constant was 1 h. The first choice was based on the average winter temperature in
Italy, while the second choice was the result of experience in addition to the geometry of
the DUTs. Therefore, as it can be seen in Figure 2, the temperature plateaus last for 4 h.
Turning to humidity, the decision is simpler considering that no indication is given
in the IEC 61869 series. Therefore, what has been considered is to vary relative humidity
between reasonable and practical values, 30%, 50%, and 80%.
Overall, the test involves a temperature cycle and three humidity values. In detail,
the temperature cycle in Figure 2 is repeated for each humidity value.

Sensors 2022, 22, 1397 6 of 20
4.2. Current Signals
The ambient conditions were fixed in Section 4.1. In this section, the test currents are
described. Three current signals, referred to as H0, H1, and H2 were used. H0 is a 50 Hz
sinusoidal signals without any kind of distortion. Signals H1 and H2 are identical to H0
but with a mix of superimposed harmonics. The description of the three signals is sum-
marized in Table 1. Note that the percentage of the harmonics with respect to the 50 Hz
component was selected as the maximum limit given in the Standard EN 50160 [44]. Fur-
thermore, the rms value of the three signals was fixed at 80 A.
Table 1. Characteristic of the Adopted Current Signals.
Signal THD (%) Description
H0 0 Pure 50 Hz signal
H1 4.8 H0 + 3rd, 11th, 17th, 23rd, and 35th
H2 9.2 H0 + H1 + all odd harmonics up to the 41st
The choice behind the adoption of the signals H0, H1, and H2 was made considering
the actual conditions at which the DUTs operate in field. Furthermore, signal H0 can be
considered ideal; then, it represents a reference signal for further comparison. Signal H1
and H2, instead, have typical total harmonic distortion (THD) values according to the
Standard IEEE 519 [45].
4.3. DUT Positioning
The last step of the test design process concerns the positioning of the RC. The need
to fix the position originates from the fact that RCs are seldom centered with respect to
the conductor they are mounted on. Among the reasons behind the uncentered positions,
there is the (i) unavailability of centering systems or supports; and the (ii) lack of space in
the installation cabinet (or secondary substation).
Standard [8] include a set of positions in which the accuracy of the RCs needs to be
tested. The four positions, referred to T1, T2, T3, and T4, are depicted in Figure 3.
Figure 3. Testing positions for Rogowski coils according to [8].
Position T1 is the centered one, with the RC axes perpendicular to the conductor axis.
Position T4 is identical to T1 but another conductor, carrying the same current as the main
one, is close to the external surface of the RC. T4 can be also considered as the position
that tests the effect of external magnetic fields on the performance of an RC.
Turning to positions T2 and T3, they are defined introducing the concept of position-
ing factor (PF). It is a parameter that ranges between 0 and 1, and it evaluates the angle
between the conductor axis and the RC axis. For example, T1 has a PF = 0, while T3 has a
PF = 1. As for T2, it has a 0 < PF < 1 to complete the possible cases. Finally, from the picture,
it can be noted how the standard has defined a set of positions, which reflects the actual
positions that an RC may assume in field.

Sensors 2022, 22, 1397 7 of 20
All positions T1 to T4 were tested in this work.
4.4. Acquisition Details and Final Notes
Considering the details given in Sections 4.1–4.3, it can be summarized that (i) three
current signals (H0, H1, and H2) were injected through R1, R2, and R3, while (ii) a tem-
perature cycle was repeated three times with three relative humidity levels (30%, 50%,
and 80%), and (iii) four positions were tested one after the other. The overall combination
of the conditions resulted in 36 tests for each RC.
During each test:
One measurement was performed every 10 min.
Every measurement consisted of 100 repetitions of a 200 ms window.
For each repetition, the discrete Fourier transform (DFT) was applied on the acquired
window (of the four signals), and the ratio error � and phase displacement ∆� were
computed as:
� =�������
��× 100, (1)
∆� = �� − ��. (2)
The ratio error contains the nominal transformation ratio �� of the DUT, the rms
voltage at the secondary terminals of the DUT (��), and the rms of the primary current
flowing through the conductor (��). As for the phase displacement, it contains the phase-
angle of the desired frequency component collected from the DUT (��) and the primary
conductor (��), hence, from the reference shunt (Vref signal).
Consequently, in each measurement the mean value of the 100 � and 100 ∆� was
computed and saved.
5. Experimental Results
This section begins with the results obtained from the tests described in Section 4.
Then, the results are used to define the characteristic of a comprehensive type test to be
performed on RCs.
5.1. Results for H0 and T1 tests
The first set of results was obtained from the test that involves the temperature and
humidity cycle, signal H0, and position T1. This test can be considered as the reference
one for a clear understanding. For this purpose, Figure 4 depicts, for the three RCs, � and
∆� variations in graphs (a) and (b), respectively. Note that the results are obtained sub-
tracting each � and ∆� from the first value obtained in the test (at 23 °C and in reference
conditions). Furthermore, to increase � readability, R1 and R2 are graphed in the primary
vertical axis, while R3 is in the secondary axis (right hand side).

Sensors 2022, 22, 1397 8 of 20
(a) (b)
Figure 4. Results of the reference test performed with H0 and T1: (a) ratio error; (b) phase displace-
ment.
A first comment is on ∆�. For all RCs, its variation was quite limited compared to
the accuracy classes. In fact, from Section 3, the given accuracy was 1%, hence, it may be
associated to a 1 accuracy class, with limits 1% and 18 mrad for � and ∆�, respectively.
Another comment on ∆� is on the overall behavior; there was no significant effect due to
the humidity variations. However, R3 behavior clearly followed the temperature cycles,
highlighting a huge dependence on temperature (not reported for R1 and R2).
Turning to � variations, the graph shows its dependency on the temperature. As a
matter of fact, � perfectly followed the temperature behavior for all RCs. What is different
among the RCs under test was the sign of the variation. While R1 and R3 presented a
negative variation with a temperature increase, R2 was coherent with the positive increase
in the temperature. This result indicates that each device had a specific response to a tem-
perature variation.
Finally, it can be observed from the graph that a change in the humidity value had a
slight influence for R3, while the effect was more evident for R1 and R2. More details can
be found in [46], which is dedicated to ideal testing on RCs.
Turning to the accuracy of the presented graphs (and the one of the following ones),
� and ∆� were measured with an accuracy of 10�� (considering the% notation) and
10�� rad, respectively. The values are standard deviation of the mean (100 values). Fur-
thermore, they can be considered acceptable compared to the target uncertainty of the
work.
5.2. Results for Positioning Tests T1 to T4
At this point it is interesting to understand the combined effect of temperature, hu-
midity, and positioning on the accuracy performance of the DUTs when distorted signals
are measured (H1 and H2). Note that the single effect of distorted signals has already been
evaluated in [47].
Figures 5 and 6 present � and ∆� variations, respectively. In detail, Figure 5 in-
cludes graphs (a), (b), and (c), for R1, R2, and R3, respectively. Each graph depicts, with a
different color, the four positions T1 to T4. Analogously, Figure 6 depicts the same graphs
for ∆�.

Sensors 2022, 22, 1397 9 of 20
(a)
(b)

Sensors 2022, 22, 1397 10 of 20
(c)
Figure 5. � results of the test performed with H1 and all positions (a) R1, (b) R2, and (c) R3.
(a)

Sensors 2022, 22, 1397 11 of 20
(b)
(c)
Figure 6. ∆� results of the test performed with H1 and all positions for (a) R1, (b) R2, and (c) R3.
Starting from Figure 5, the overall comment is that the accuracy of the DUTs is sev-
erally affected by their positioning. Furthermore, from the graph it can be understood
what affected each single RC the most. In detail:
Position T4, which assesses the proximity effect, significantly affected all RCs, with
variations of � up to 1% (which is also the limit of the accuracy class).
Positions T2 and T3 did not significantly affect the accuracy of the three RCs. The
only exception was R2, whose � experienced a 0.3% variation with position T3. Such a
position corresponds to a PF of 1 (the most severe).
R3 was overall more affected by temperature than by positioning. This emphasizes
the need of testing each different RC.
The combination of positioning and humidity did not worsen the effect of the latter.
Turning to Figure 6, it confirms the behavior described in Figure 4. R1 and R2 showed
random variations of ∆�, while R3 presented a strong correlation with the temperature
cycle. However, if such a correlation masks the effect of positioning on R3, this is not true
for R1 and R2. Note in graphs (a) and (b) how position T4 influences ∆�. In fact, a positive

Sensors 2022, 22, 1397 12 of 20
and negative shift is observed for R1 and R2, respectively. These results confirm the influ-
ence of T4 on the accuracy of an RC.
A final comment is on the absolute value of the variations. Despite the above com-
ments, in absolute terms, ∆� variations were almost negligible compared to the accuracy
limits of the DUTs.
The same tests were performed, as previously described, with signal H2. The results,
omitted here for the sake of brevity, presented coherent behaviors without any significant
variation due to a different THD. However, more interesting comments on the harmonic
evaluation are included in the following subsection.
5.3. Effect on the Harmonic Evaluation
Considering the increasing levels of pollution of the power network, it is more and
more significant to assess the effect of distorted signals on the electrical assets. Therefore,
this subsection focuses on the accuracy performance of the three RCs in terms of measured
THD and harmonic components.
The first set of results is given in Figure 7. For each RC, graphs (a), (b), and (c), re-
spectively, the THD variation for all positions and during the temperature/humidity cycle
is presented. The THD is plotted in terms of difference between the ideal value (e.g., 4.8%
for H1) and the measured one.
(a)

Sensors 2022, 22, 1397 13 of 20
(b)
(c)
Figure 7. THD variations obtained with H1 and all positions, for (a) R1, (b) R2, and (c) R3.
The general comment is that THD was not affected either by positioning, tempera-
ture, nor humidity. Note, in fact, that the maximum recorded variations are in the order
of 0.2% for R1. However, looking in more details the graphs, it can be observed that for
R2 and R3 each position slightly moved the average value of the THD. This can be better
perceived focusing on the yellow cloud of points obtained for R3 during the test with
positioning T3.
The same results were obtained from the tests with the signal H2. Therefore, for the
sake of brevity, only the results of R3 are presented in Figure 8. This confirms that THD
(a parameter that involves many quantities), and in particular its computation process,
was not affected by the studied influence quantities.

Sensors 2022, 22, 1397 14 of 20
Figure 8. THD variations obtained with H2 and all positions for R3.
The assessment of the harmonic evaluation proceeded with a focus on the single har-
monics. To this purpose, Figure 9 shows the third harmonic (in ampere absolute value)
extracted from the tests with signal H1 and positions T1 to T4 (hence, the same tests as
Figure 7).
(a)

Sensors 2022, 22, 1397 15 of 20
(b)
(c)
Figure 9. Third harmonic from tests with H1 and all positions, for (a) R1, (b) R2, and (c) R3.
The first comment is a comparison with Figures 7 and 8. Whereas from THD it is not
possible to appreciate the presence of influence quantities affecting the RC, the opposite
is true focusing on a single harmonic. Note the behavior of the third harmonic for all RCs
strictly followed the temperature and humidity variations. Furthermore, the positioning
affected R1 (T4) and R2 (T3), while R3 was insensitive to all positions.
Quantifying the variations, 10 mA, 10 mA, and 45 mA were observed for R1, R2, and
R3, respectively.
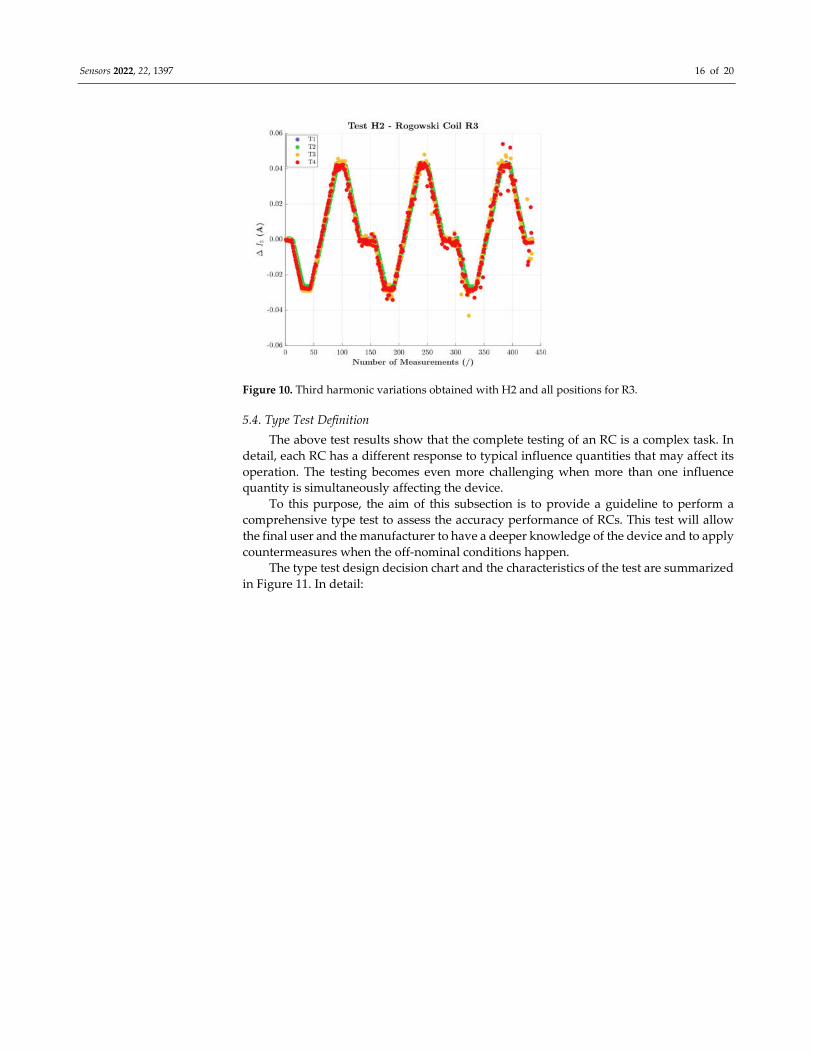
As for the tests with H2, the same results as in the case of H1 were obtained. There-
fore, for the sake of brevity, the results for R3 are depicted in Figure 10.
Sensors 2022, 22, 1397 16 of 20
Figure 10. Third harmonic variations obtained with H2 and all positions for R3.
5.4. Type Test Definition
The above test results show that the complete testing of an RC is a complex task. In
detail, each RC has a different response to typical influence quantities that may affect its
operation. The testing becomes even more challenging when more than one influence
quantity is simultaneously affecting the device.
To this purpose, the aim of this subsection is to provide a guideline to perform a
comprehensive type test to assess the accuracy performance of RCs. This test will allow
the final user and the manufacturer to have a deeper knowledge of the device and to apply
countermeasures when the off-nominal conditions happen.
The type test design decision chart and the characteristics of the test are summarized
in Figure 11. In detail:

Sensors 2022, 22, 1397 17 of 20
Figure 11. Type test design decision chart.
For a type test, each product (LPCT) has its own rated values for current, burden,
and temperature class. Note that the there is no rated current for RCs, just some recom-
mended values. Otherwise, the rated current depends on the application. As for the mix
of harmonic to superimpose to the main component, this can be conducted according to
the standard [44]. However, the choice can be customized depending on the final applica-
tion of the RC.
A manufacturer may have either a climatic or a thermostatic chamber to perform the
tests. The tests over temperature are fundamental to evaluate the accuracy of the RCs. On
the contrary, humidity variations have minor effects on the RC performance. Therefore,
they could be used if a deeper knowledge is desired.
A critical aspect related to RCs is their positioning. However, a manufacturer may
provide a centering device to fix the RC position once installed. Therefore, if that is the
case it is sufficient to test the RC at the centered position T1 and at T4, which assesses the
effect of magnetic fields. Otherwise, it is recommended to test also with T3, whose rele-
vance has been demonstrated in this work.
Finally, all the tests provide ranges of variation and behaviors of � and ∆�, which
can be used to adjust the accuracy of each RC during its normal operation.
A final comment on the presented test is on the need for combined tests. It is not
possible to rely on tests that assess one quantity at the time (as is the case in the actual
version of the standard). On the contrary, there is the need to assess the instrumentation
in as much a realistic condition as possible to simulate the in-field operations. For this
purpose, the presented test may be helpful for the next version of the standards.

Sensors 2022, 22, 1397 18 of 20
6. Conclusions
This paper presents a type test for Rogowski coils aimed at increasing the knowledge
of their accuracy. The need for such a test comes from the in-field conditions in which the
device operates. In fact, once installed, the Rogowski coil is typically subjected to more
than one influence quantity that alters its accuracy. Therefore, even during its preliminary
testing, the Rogowski coil should undergo actual tests with simultaneous application of
several influence quantities. For this purpose, from the authors’ experience and from the
results of this work, a specific type test was designed. Of course, it is a starting point for
further standard versions. However, the test involves the main influence quantities that
affect a Rogowski coil the most. Such quantities have been selected analyzing the per-
formed experimental results. Finally, the aim of this test was to provide limits of variation
for � and ∆� of each type of Rogowski. After, such values can be used to adjust their in-
field measured accuracy.
Author Contributions: Conceptualization, R.T. and A.M.; methodology, L.P.; software, F.C.; vali-
dation, L.P.; formal analysis, A.M.; investigation, F.C.; resources, L.P.; data curation, F.C.; writing—
original draft preparation, A.M.; supervision, R.T. All authors have read and agreed to the pub-
lished version of the manuscript.
Funding: The 19NRM05 IT4PQ project received funding from the EMPIR programme co-financed
by the Participating States and from the European Union’s Horizon 2020 research and innovation
programme.
Institutional Review Board Statement: Not applicable.
Informed Consent Statement: Not applicable.
Data Availability Statement: Not applicable.
Conflicts of Interest: The authors declare no conflicts of interest. The funders had no role in the
design of the study; in the collection, analyses, or interpretation of data; in the writing of the manu-
script, or in the decision to publish the results.
References
1. IEC 60050. International Electrotechnical Vocabulary. Available online: https://www.electropedia.org (accessed on 17 December
2021).
2. Khalyasmaa, A.; Vinter, I.; Eroshenko, S.; Bolgov, V. The methodology of high-voltage instrument transformers technical state
index assessment. In Proceedings of the 2020 21st International Symposium on Electrical Apparatus and Technologies, SIELA
2020–Proceedings, Bourgas, Bulgaria, 3–6 June 2020.
3. Zhou, F.; Jiang, C.; Lei, M.; Lin, F. Improved Stepup Method to Determine the Errors of Voltage Instrument Transformer With
High Accuracy. IEEE Trans. Instrum. Meas. 2019, 69, 1308–1312.
4. Kim, J.B.; Choi, T.S.; Kim, M.S.; Song, W.P.; Lee, H.S. Experience of non-conventional instrument transformer for high voltage
gis in real commercial 154kv substation. In Proceedings of the 42nd International Conference on Large High Voltage Electric
Systems 2008, CIGRE 2008, Paris, France, 24–29 August 2008.
5. Chen, Q.; Li, H.-B.; Huang,. B.-X. An innovative combined electronic instrument transformer applied in high voltage lines. Meas.
2010, 43, 960–965.
6. IEC 61869-1:2010; Instrument Transformers—Part 1: General Requirements; International Standardization Organization: Geneva,
Switzerland, 2010.
7. IEC 61869-6; Instrument Transformers—Part 6: Additional General Requirements for Low-Power Instrument Transformers; Interna-
tional Standardization Organization: Geneva, Switzerland, 2016.
8. IEC 61869-10; Instrument Transformers—Part 10: Additional Requirements for Low-Power Passive Current Transformers; International
Standardization Organization: Geneva, Switzerland, 2018.
9. IEC 61869-11:2018; Instrument Transformers—Part 11: Additional Requirements for Low-Power Passive Voltage Transformers; Interna-
tional Standardization Organization: Geneva, Switzerland, 2018.
10. IEC 61869-2:2011; Instrument Transformers—Part 2: Additional Requirements for Current Transformers; International Standardiza-
tion Organization: Geneva, Switzerland, 2011.
11. IEC 61869-3:2011; Instrument Transformers—Part 3: Additional Requirements for Inductive Voltage Transformers; International Stand-
ardization Organization: Geneva, Switzerland, 2011.
12. Rigoni, M.; Garcia, J.S.D.; Garcia, A.P.; Da Silva, P.A., Jr.; Batistela, N.J.; Kuo-Peng, P. Rogowski coil current meters in
nonconventional applications. IEEE Potentials 2008, 27, 40–45.

Sensors 2022, 22, 1397 19 of 20
13. Poncelas, O.; Rosero, J.A.; Cusido, J.; Ortega, J.A.; Romeral, L. Design and application of rogowski coil current sensor without
integrator for fault detection in induction motors. In Proceedings of the IEEE International Symposium on Industrial Electronics,
Cambridge, UK, 30 June–2 July 2008; pp. 558–563.
14. Hewson, C.R.; Ray, W.F. Optimising the high frequency bandwidth and immuntity to interference of rogowski coils in
measurement applications with large local dV/dt. In Proceedings of the IEEE Applied Power Electronics Conference and
Exposition—APEC, Palm Springs, CA, USA, 21–25 February 2010; pp. 2050–2056, https://doi.org/10.1109/APEC.2010.5433517
Retrieved from www.scopus.com.
15. Kojovic, L.A. Rogowski coil performance characteristics for advanced relay protection. In Proceedings of the IET Conference
Publications, (536 CP), Glasgow, UK, 17–20 March 2008; pp. 406–411.
16. Ray, W.F.; Hewson, C.R.; Metcalfe, J.M. High frequency effects in current measurement using rogowski coils. In Proceedings of
the 2005 European Conference on Power Electronics and Applications, Dresden, Germany, 11–14 September 2005.
17. Shen, D.; Hu, B.; Wang, H.O.; Zhu, M.; Wang, L.; Lu, W. Research on harmonic characteristic of electronic current transformer
based on the rogowski coil. In Proceedings of the IOP Conference Series: Materials Science and Engineering, Shanghai, China,
24–26 March 2017; Volume 199.
18. Crotti, G.; Giordano, D.; Morando, A. Analysis of rogowski coil behavior under non ideal measurement conditions. In
Proceedings of the 19th IMEKO World Congress 2009, Lisbon, Portugal, 6−11 September 2009; Volume 3, pp. 1953–1958.
19. Chen, Q.; Li, H.; Zhang, M.; Liu, Y. Design and characteristics of two rogowski coils based on printed circuit board. IEEE Trans.
Instrum. Meas., 2006; 55, pp. 939–943.
20. Fu, S.; Deng, E.; Peng, C.; Zhang, G.; Zhao, Z.; Cui, H.O. Method of turns arrangement of noncircular rogowski coil with
rectangular section. IEEE Trans. Instrum. Meas. 2020, 70, 1–10.
21. Pang, F.; Gao, L.; Yuan, Y.; Bu, Q.; Ji, J. Effects of geometrical parameters on the performance of rogowski coil for current
measuring. In Proceedings of the Asia-Pacific Power and Energy Engineering Conference, APPEEC, Xi’an, China, 25–28 October
2016; pp. 232–236.
22. Lu, S.M.; Song, W.W.; Huang, C. Study of measuring error of rogowski coil. In Proceedings of the 2019 Photonics and
Electromagnetics Research Symposium-Fall, PIERS-Fall, Xiamen, China, 17–20 December 2019; pp. 1436–1442.
23. Hemmati, E.; Shahrtash, S.M. Evaluation of unshielded rogowski coil for measuring partial discharge signals. In Proceedings
of the 2012 11th International Conference on Environment and Electrical Engineering, EEEIC, Venice, Italy, 18–25 May 2012;
pp. 434–439.
24. Mingotti, A.; Peretto, L.; Tinarelli, R. Effects of multiple influence quantities on rogowski-coil-type current transformers. IEEE
Trans. Instrum. Meas., 2019; 69, pp. 4827–4834.
25. Alanazi, S.S.; Alayli, A.R.; Alrumie, R.A.; Alrobaish, A.M.; Ayhan, B.; Cayci, H. Establishment of an instrument transformer
calibration system at SASO NMCC. In Proceedings of the CPEM 2018—Conference on Precision Electromagnetic
Measurements, Paris, France, 8–13 July 2018.
26. Santos, J.C.; De Sillos, A.C.; Nascimento, C.G.S. On-field instrument transformers calibration using optical current and voltage
transformes. In Proceedings of the 2014 IEEE International Workshop on Applied Measurements for Power Systems, AMPS,
Aachen, Germany, 24–26 September 2014; pp. 18–22.
27. Callegaro, L.; Cassiago, C.; Gasparotto, E. On the calibration of direct-current current transformers (DCCT). IEEE Trans. Instrum.
Meas. 2014, 64, 723–727.
28. Chen, Y.; Crotti, G.; Dubowik, A.; Letizia, P.S.; Mohns, E.; Luiso, M.; Bruna, J. (2021). Novel calibration systems for the dynamic
and steady-state testing of digital instrument transformers. In Proceedings of the AMPS 2021–2021 11th IEEE International
Workshop on Applied Measurements for Power Systems, Cagliari, Italy, 29 September–1 October 2021.
29. Draxler, K.; Hlavacek, J.; Styblikova, R. Calibration of instrument current transformer test sets. In Proceedings of the
International Conference on Applied Electronics, Pilsen, Czech Republic, 10–11 September 2019.
30. Mingotti, A.; Peretto, L.; Tinarelli, R. Smart Characterization of Rogowski Coils by Using a Synthetized Signal. Sensors 2020, 20,
3359.
31. Xie, Y.; Chen, J. Research on the Calibration Instrument for the Medium-Voltage Electronic Instrument Transformers. Adv.
Mater. Res. 2012, 433-440, 7471–7478, https://doi.org/10.4028/www.scientific.net/AMR.433-440.7471.
32. Mingotti, A.; Peretto, L.; Tinarelli, R. Calibration Procedure to Test the Effects of Multiple Influence Quantities on Low-Power
Voltage Transformers. Sensors 2020, 20, 1172.
33. Torre, F.D.; Faifer, M.; Morando, A.P.; Ottoboni, R.; Cherbaucich, C.; Gentili, M; Mazza, P. Instrument transformers: A different
approach to their modeling. In Proceedings of the 2011 IEEE International Workshop on Applied Measurements for Power
Systems, AMPS, Aachen, Germany, 28–30 September 2011; pp. 37–41.
34. Afonso, J.I.; Toscano, P.; Briozzo, I. Current transformer model validation on EMTP-ATP software. In Proceedings of the 2020
IEEE PES Transmission and Distribution Conference and Exhibition—Latin America, Montevideo, Uruguay, 28 September–2
October 2020.
35. Dadić, M.; Župan, T.; Kolar, G. FIR modeling of voltage instrument transformers from frequency response data. In Proceedings
of the 2018 1st International Colloquium on Smart Grid Metrology, SmaGriMet, Split, Croatia, 24–27 April 2018; pp. 1–6.
36. Ghaderi, A.; Mingotti, A.; Peretto, L.; Tinarelli, R. Low-Power Voltage Transformer Smart Frequency Modeling and Output
Prediction up to 2.5 kHz, Using Sinc-Response Approach. Sensors 2020, 20, 4889.

Sensors 2022, 22, 1397 20 of 20
37. Mingotti, A.; Peretto, L.; Tinarelli, R. A simple modelling procedure of rogowski coil for power systems applications. In
Proceedings of the AMPS 2019—2019 10th IEEE International Workshop on Applied Measurements for Power Systems, Aachen,
Germany, 25–27 September 2019.
38. Brandão Jr., A.F.; Da Silva, I.P.; De Silos, A.C.; Ivanov, D.; Dias, E.M. On site calibration of inductive voltage transformers. In
Proceedings of the 8th WSEAS International Conference on System Science and Simulation in Engineering, ICOSSSE ′09,
Genova, Italy, 17–19 October 2009; pp. 265–272.
39. Jung, J.K.; Lee, S.H.; Kang, J.H.; Kwon, S.W.; Park, Y.T. (2010). Development and application of an on-site calibration method
for voltage transformer testing systems. In Proceedings of the 17th Symposium IMEKO TC4—Measurement of Electrical
Quantities, 15th International Workshop on ADC Modelling and Testing, and 3rd Symposium IMEKO TC19—Environmental
Measurements, Kosice, Slovakia, 8–10 September 2014; pp. 67–471.
40. Zhao, S.; Huang, Q.; Lei, M. Compact system for onsite calibration of 1000 kV voltage transformers. IET Sci. Meas. Technol. 2018,
12, 368–374.
41. Trigo, L.; Aristoy, G.; Santos, A.; Slomovitz, D. On site calibration of current transformers. In Proceedings of the Conference
Record—IEEE Instrumentation and Measurement Technology Conference, Montevideo, Uruguay, 12–15 May 2014; pp. 1245–
1246.
42. Jung, J.K.; Lee, S.H.; Kang, J.H. Development of on-site calibration method for current transformer testing system. In
Proceedings of the 20th IMEKO World Congress, Korea, 9–12 September 2012; Volume 2 pp. 1378–1381.
43. Zhang, M.; Li, K.; Wang, J.; He, S. An on-site calibration system for electronic instrument transformers based on LabVIEW.
Metrol. Meas. Syst. 2014, 21, 257–270.
44. EN 50160:2011; Voltage Characteristics of Electricity Supplied by Public Electricity Networks; European Committee for
Standardization: Brussels, Belgium, 2017.
45. IEEE Std 519-2014; Recommended Practice and Requirements for Harmonic Control in Electric Power Systems; IEEE: New York, NY,
USA, 2014.
46. Mingotti, A.; Costa, F.; Peretto, L.; Tinarelli, R. 2022, Effects on the Accuracy Performance of Rogowski Coils Due to Temperature
and Humidity. In Proceedings of the I2MTC Conference, Ottawa, OH, Canada, 16–19 May 2022.
47. Costa, F.; Mingotti, A.; Peretto, L.; Tinarelli, R. Combined Effect of Temperature and Humidity on Distorted Currents Measured
by Rogowski Coils. In Proceedings of the ICHQP, Naples, Italy, 29 May–1 June 2022.