Accounting in Action
1285
John Wiley & Sons, Inc. © 2005 Chapter 1 Chapter 1 Accounting in Action Accounting Principles, 7 Accounting Principles, 7 th th Edition Edition Weygandt Weygandt • Kieso Kieso • Kimmel Kimmel Prepared by Naomi Karolinski Prepared by Naomi Karolinski Monroe Community College Monroe Community College and and Marianne Bradford Marianne Bradford Bryant College Bryant College
-
Upload
khangminh22 -
Category
Documents
-
view
1 -
download
0
Transcript of Accounting in Action

John Wiley & Sons, Inc. © 2005
Chapter 1Chapter 1
Accounting in Action
Accounting Principles, 7Accounting Principles, 7thth EditionEdition
Weygandt Weygandt •• Kieso Kieso •• KimmelKimmel
Prepared by Naomi KarolinskiPrepared by Naomi KarolinskiMonroe Community CollegeMonroe Community College
andand
Marianne BradfordMarianne BradfordBryant CollegeBryant College
• 1 Explain what accounting is.
• 2 Identify users and uses of accounting.
• 3 Understand why ethics is a fundamental business concept.
• 4 Explain the meaning of generally accepted accounting principles and the cost principle.
After studying this chapter, you should be able to:
CHAPTER CHAPTER 11
ACCOUNTING IN ACTIONACCOUNTING IN ACTION

• 5 Explain the meaning of the monetary unit assumption and the economic entity assumption.
• 6 State the basic accounting equation and explain the meaning of assets, liabilities, and owner’s equity.
• 7 Analyze the effect of business transactions on the basic accounting equation.
• 8 Understand what the four financial statements are and how they are prepared.
CHAPTER CHAPTER 11ACCOUNTING IN ACTIONACCOUNTING IN ACTION
After studying this chapter, you should be able to:

• Accounting is an information system that
• Identifies
• Records
• Communicates the economic events of an organization to interested users
WHAT IS ACCOUNTING?WHAT IS ACCOUNTING?STUDY OBJECTIVE STUDY OBJECTIVE 11

THE ACCOUNTING THE ACCOUNTING PROCESSPROCESS

QUESTIONS ASKED BY QUESTIONS ASKED BY INTERNAL USERSINTERNAL USERS
STUDY OBJECTIVE STUDY OBJECTIVE 22

QUESTIONS ASKED BY QUESTIONS ASKED BY EXTERNAL USERSEXTERNAL USERS

• AccountingIncludes bookkeepingAlso includes much more
• BookkeepingThe recording of economic eventsOne part of accounting
BOOKKEEPING DISTINGUISHED BOOKKEEPING DISTINGUISHED FROM ACCOUNTINGFROM ACCOUNTING

THE ACCOUNTING PROFESSIONTHE ACCOUNTING PROFESSION
• Public AccountantsService to the general public through the services they perform.
• Private AccountantsIndividuals in companies involved in activities including cost and tax accounting, systems, and internal auditing.
• Not For Profit AccountantsReporting and control for government units, foundations, hospitals, labor unions, colleges/universities, and charities.

• EthicsStandards by which actions are judged as right or wrong, honest or dishonest.
• Generally Accepted Accounting PrinciplesEstablished by the F.A.S.B and the S.E.C.
• Assumptions– Monetary Unit
Only data that can be expressed in terms of money is included in the accounting records.
– Economic Entity
Includes any organization or unit in society.
THE BUILDING BLOCKS OF THE BUILDING BLOCKS OF ACCOUNTINGACCOUNTING
STUDY OBJECTIVES STUDY OBJECTIVES 3, 4 & 53, 4 & 5

BUSINESS ENTERPRISESBUSINESS ENTERPRISES
• ProprietorshipOwned by one person.
• PartnershipOwned by two or more persons.
• CorporationOrganized as a separate legal entity under state corporation law and having ownership divided into transferable shares of stock.

The accounting process is correctly sequenced as
– identification, communication, recording.
– recording, communication, identification.
– identification, recording, communication.
– communication, recording, identification.

The accounting process is correctly sequenced as
– identification, communication, recording.
– recording, communication, identification.
– identification, recording, communication.
– communication, recording, identification.

BASIC ACCOUNTING BASIC ACCOUNTING EQUATIONEQUATION
STUDY OBJECTIVE STUDY OBJECTIVE 66
Assets Liabilities Owner’s Equity= +

ASSETS AS A BUILDING ASSETS AS A BUILDING BLOCKBLOCK
• Assets are resources owned by a business.
• They are used in carrying out such activities as production, consumption and exchange.

LIABILITIES AS A LIABILITIES AS A BUILDING BLOCKBUILDING BLOCK
• Liabilities
• are creditor claims against assets
• are existing debts and obligations

• Owner’s Equity = total assets minus total liabilities. (A - L = O.E.)
• Owner’s Equity represents the ownership claim to total assets.
• Subdivisions of Owner’s Equity:
1 Capital or Investments by Owner (+)
2 Drawing (-)
3 Revenues (+)
4 Expenses (-)
OWNEROWNER’’S EQUITY AS A S EQUITY AS A BUILDING BLOCKBUILDING BLOCK

INVESTMENTS BY OWNERS AS A INVESTMENTS BY OWNERS AS A BUILDING BLOCKBUILDING BLOCK
• Investments
• are the assets the owner puts in the business
• increase owner’s equity

• Drawings• are withdrawals of cash or other
assets by the owner for personal use
• decrease owner’s equity
DRAWINGS AS A BUILDING DRAWINGS AS A BUILDING BLOCKBLOCK
REVENUES AS A REVENUES AS A BUILDING BLOCKBUILDING BLOCK
• Revenues
• gross increases in owner’s equity from business activities entered into for the purpose of earning income
• may result from sale of merchandise, services, rental of property, or lending money
• usually result in an increase in an asset

EXPENSES AS A EXPENSES AS A BUILDING BLOCKBUILDING BLOCK
Expenses
• decreases in owner’s equity that result from operating the business
• cost of assets consumed or services used in the process of earning revenue
• examples: utility expense, rent expense, supplies expense, and tax expense

INCREASES AND INCREASES AND DECREASES IN OWNERDECREASES IN OWNER’’S S
EQUITYEQUITY
INCREASES DECREASES
Investments by Owner
Revenues
Owner’s Equity
Withdrawals by Owner
Expenses

TRANSACTION IDENTIFICATION PROCESSSTUDY OBJECTIVE STUDY OBJECTIVE 66

TRANSACTION ANALYSISTRANSACTION ANALYSISTRANSACTION TRANSACTION 11
• Ray Neal decides to open a computer programming service.
• On September 1, he invests $15,000 cash in the business, which he names Softbyte.
Softbyte

TRANSACTION ANALYSISTRANSACTION 1 SOLUTION
• Assets = Liabilities + Owner’s Equity
Cash R. Neal, Capital
+ 15,000 Investment + 15,000
$15,000 = $15,000
There is an increase in the asset Cash, $15,000, and an equal increase in the owner’s equity, R. Neal, Capital, $15,000.
There is an increase in the asset Cash, $15,000, and an equal increase in the owner’s equity, R. Neal, Capital, $15,000.

TRANSACTION ANALYSISTRANSACTION ANALYSISTRANSACTIONTRANSACTION 22
• Softbyte purchases computer equipment for $7,000 cash.
• Softbyte purchases computer equipment for $7,000 cash.

TRANSACTION ANALYSISTRANSACTION 2 SOLUTION
• Assets = Liabilities + Owner’s Equity
• Cash + Equipment = + R. Neal, Capital
• Old
• $15,000 = $15,000
• (2) - 7,000 + 7,000______________________________
• New
• $ 8,000 + $7,000 = $15,000
Cash is decreased by $7,000 and the asset Equipment is increased by $7,000.

• Softbyte purchases supplies expected to last for several months for $1,600 from Acme Supply Company.
• Acme agrees to allow Softbyte to pay this bill next month, in October.
• This transaction is referred to as a purchase on account or a credit purchase.
Softbyte
Acme Supply
Company
TRANSACTION ANALYSISTRANSACTION ANALYSISTRANSACTIONTRANSACTION 33

TRANSACTION ANALYSISTRANSACTION 3 SOLUTION
• Assets = Liabilities + Owner’s Equity
• Cash + Supplies + Equip. = Accts. Pay. + R. Neal, Capital
• Old $8,000 + $7,000 = $15,000
• (3) _____ + $1,600 _______ + $1,600 ________
• New $8,000 + $1,600 + $7,000 = + $1,600 + $15,000
•
• $16,600 $16,600
The asset Supplies is increased by $1,600, and the liability Accounts Payable is increased by the same amount.
The asset Supplies is increased by $1,600, and the liability Accounts Payable is increased by the same amount.
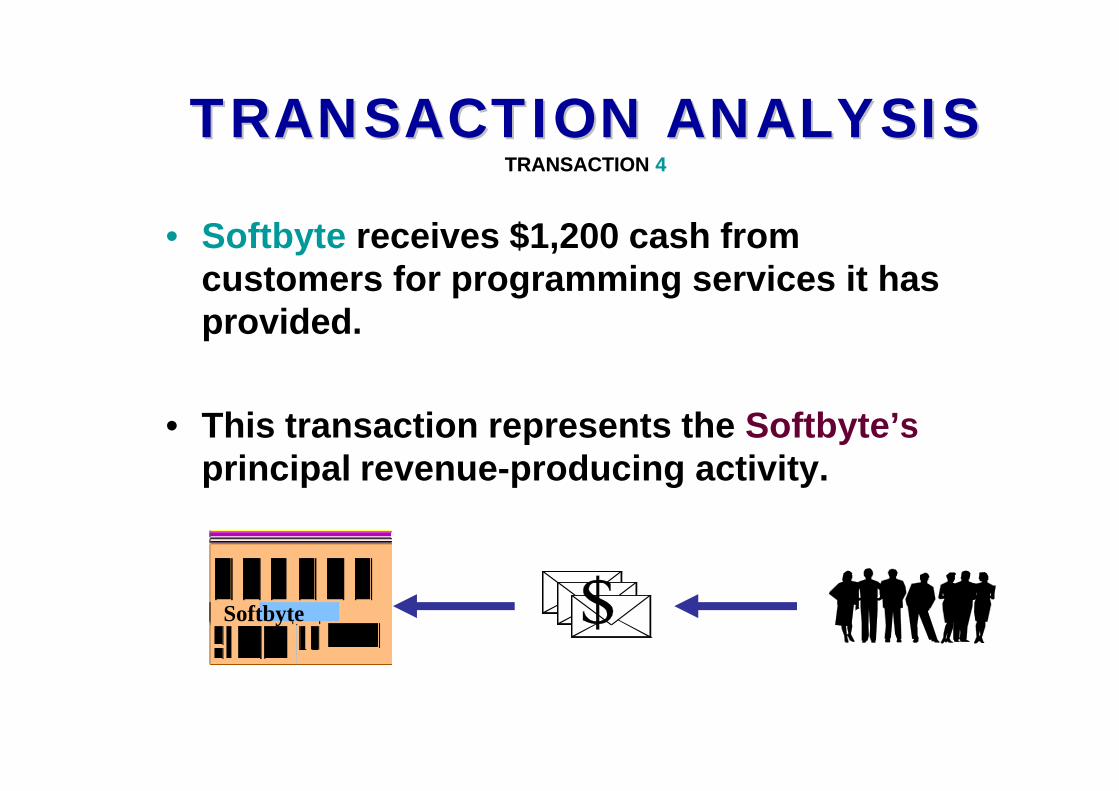
• Softbyte receives $1,200 cash from customers for programming services it has provided.
• This transaction represents the Softbyte’s principal revenue-producing activity.
Softbyte
TRANSACTION ANALYSISTRANSACTION ANALYSISTRANSACTIONTRANSACTION 44
TRANSACTION ANALYSISTRANSACTION 4 SOLUTION
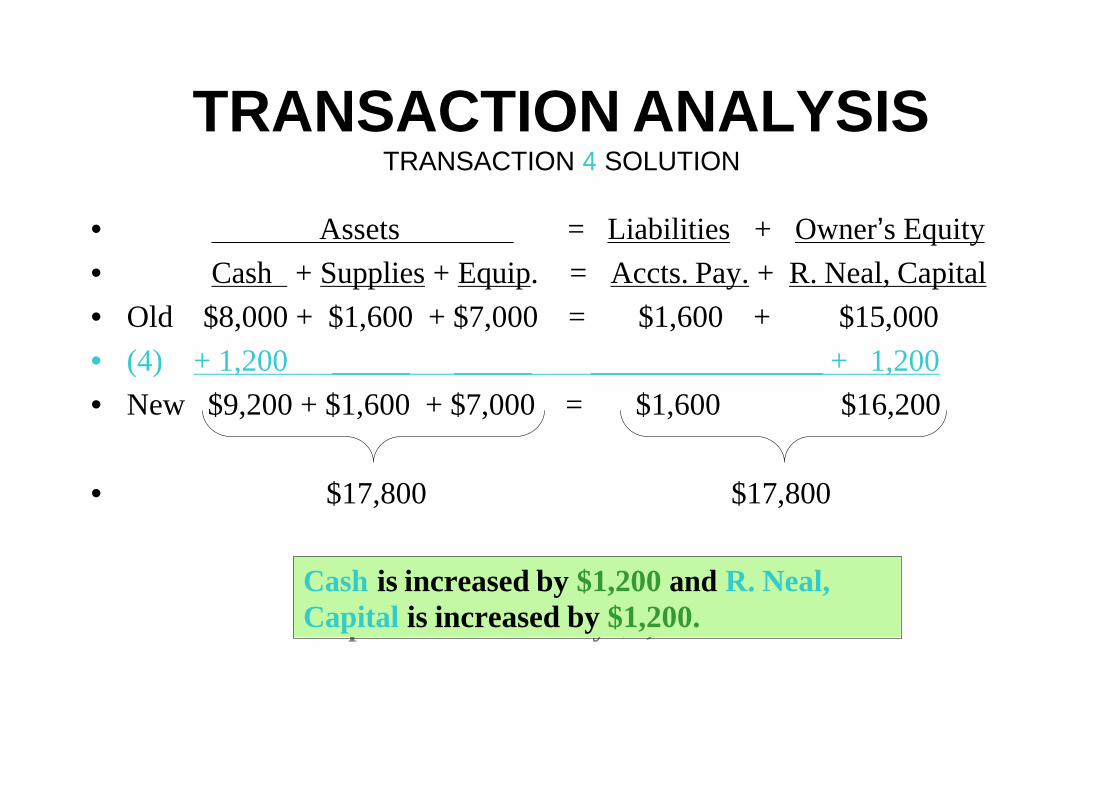
• Assets = Liabilities + Owner’s Equity
• Cash + Supplies + Equip. = Accts. Pay. + R. Neal, Capital
• Old $8,000 + $1,600 + $7,000 = $1,600 + $15,000
• (4) + 1,200 _____ _____ _______________ + 1,200
• New $9,200 + $1,600 + $7,000 = $1,600 $16,200
• $17,800 $17,800
Cash is increased by $1,200 and R. Neal, Capital is increased by $1,200.
Cash is increased by $1,200 and R. Neal, Capital is increased by $1,200.

•Softbyte receives a bill for $250from the Daily News for advertising but postpones payment of the bill until a later date.
•Softbyte receives a bill for $250from the Daily News for advertising but postpones payment of the bill until a later date.
TRANSACTION ANALYSISTRANSACTION ANALYSISTRANSACTIONTRANSACTION 55
Softbyte
News
Bill
Daily

TRANSACTION ANALYSISTRANSACTION 5 SOLUTION
• Assets = Liabilities + Owner’s Equity
• Cash + Supplies + Equip. = Accts. Pay. + R. Neal, Capital
• Old $9,200 + $1,600 + $7,000 = $1,600 + $16,200
• (5) ___Advertising Expense__ + 250 _- 250
• New $9,200 + $1,600 + $7,000 = $1,850 + $15,950
• $17,800 $17,800
Accounts Payable is increased by $250 and R. Neal, Capital is decreased by $250.
Accounts Payable is increased by $250 and R. Neal, Capital is decreased by $250.

• Softbyte provides $3,500 of programming services for customers.
• Cash of $1,500 is received from customers, and the balance of $2,000 is billed on account.
SoftbyteBill
TRANSACTION ANALYSISTRANSACTION ANALYSISTRANSACTIONTRANSACTION 66

TRANSACTION ANALYSISTRANSACTION 6 SOLUTION
• Assets = Liabilities + Owner’s Equity
• Cash + Accts. Rec. + Supplies + Equip. = Accts. Pay. + R. Neal, Capital
• Old
• $ 9,200 + $1,600 + $7,000 = $1,850 + $15,950
• (6)
• + 1,500 + 2,000 + 3,500
• New
• $10,700 + $2,000 + $1,600 + $7,000 = $1,850 + $19,450
• $21,300 $21,300
Cash is increased by $1,500; Accounts Receivable is increased by $2,000, and R. Neal, Capital is increased by $3,500.
Cash is increased by $1,500; Accounts Receivable is increased by $2,000, and R. Neal, Capital is increased by $3,500.

•Expenses paid in cash for September are store rent, $600; employees’salaries, $900; and utilities, $200.
•Expenses paid in cash for September are store rent, $600; employees’salaries, $900; and utilities, $200.
Softbyte
$600$600
$900$900
$200$200
TRANSACTION ANALYSISTRANSACTION ANALYSISTRANSACTIONTRANSACTION 77

TRANSACTION ANALYSISTRANSACTION 7 SOLUTION
• Assets = Liabilities + Owner’s Equity
• Cash + Accts. Rec. + Supplies + Equip. = Accts. Pay. + R. Neal, Capital
• Old
• $10,700 + $2,000 + $1,600 + $7,000 = $1,850 + $19,450
• (7)
• - 1,700 Rent Expense - 600
• Salaries Expense - 900
• Utilities Expense - 200
• New
• $ 9,000 + $2,000 + $1,600 + $7,000 = $1,850 + $17,750
• $19,600 $19,600Cash is decreased by $1,700 and R. Neal, Capital is decreased by the same amount.
Cash is decreased by $1,700 and R. Neal, Capital is decreased by the same amount.

• Softbyte pays its $250Daily News advertising bill in cash.
• Softbyte pays its $250Daily News advertising bill in cash.
TRANSACTION ANALYSISTRANSACTION ANALYSISTRANSACTIONTRANSACTION 88
Softbyte
Daily News

TRANSACTION ANALYSISTRANSACTION 8 SOLUTION
• Assets = Liabilities + Owner’s Equity
• Cash + Accts. Rec. + Supplies + Equip. = Accts. Pay. + R. Neal, Capital
• Old
• $9,000 + $2,000 + $1,600 + $7,000 = $1,850 + $17,750
• (8)- 250 - 250 .
• New
• $8,750 + $2,000 + $1,600 + $7,000 = $1,600 + $17,750
• $19,350 $19,350
Both Cash and Accounts Payable are decreased by $250. Since the expense was previously recorded, it is not recorded now.
Both Cash and Accounts Payable are decreased by $250. Since the expense was previously recorded, it is not recorded now.

•The sum of $600 in cash is received from customers who have previously been billed for services (in Transaction 6).
•The sum of $600 in cash is received from customers who have previously been billed for services (in Transaction 6).
TRANSACTION ANALYSISTRANSACTION ANALYSISTRANSACTIONTRANSACTION 99
Softbyte
TRANSACTION ANALYSISTRANSACTION 9 SOLUTION
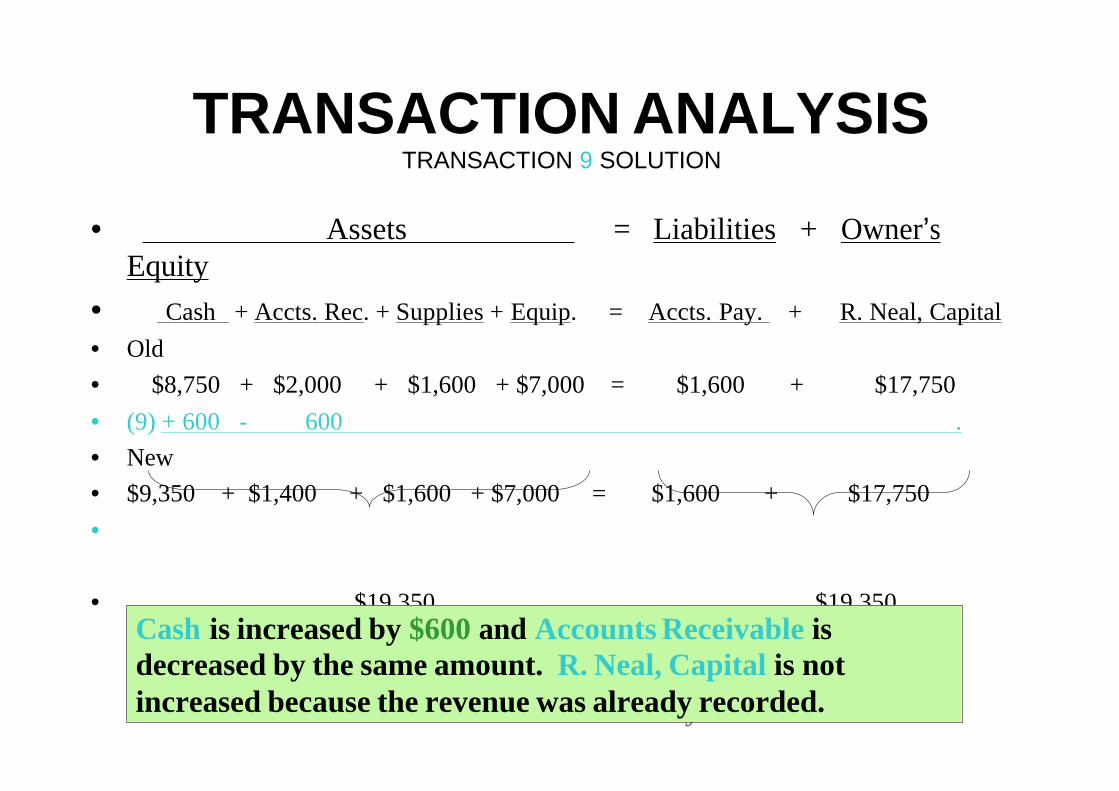
• Assets = Liabilities + Owner’s Equity
• Cash + Accts. Rec. + Supplies + Equip. = Accts. Pay. + R. Neal, Capital
• Old
• $8,750 + $2,000 + $1,600 + $7,000 = $1,600 + $17,750
• (9) + 600 - 600 .
• New
• $9,350 + $1,400 + $1,600 + $7,000 = $1,600 + $17,750
•
• $19,350 $19,350
Cash is increased by $600 and Accounts Receivable is decreased by the same amount. R. Neal, Capital is not increased because the revenue was already recorded.
Cash is increased by $600 and Accounts Receivable is decreased by the same amount. R. Neal, Capital is not increased because the revenue was already recorded.

•Ray Neal withdraws $1,300 in cash from the business for his personal use.
•Ray Neal withdraws $1,300 in cash from the business for his personal use.
$1,300$1,300Softbyte
TRANSACTION ANALYSISTRANSACTION ANALYSISTRANSACTIONTRANSACTION 1010

TRANSACTION ANALYSISTRANSACTION 10 SOLUTION
• Assets = Liabilities + Owner’s Equity
• Cash + Accts. Rec. + Supplies + Equip = Accts. Pay. + R. Neal, Capital
• Old
• $9,350 + $1,400 + $1,600 + $7,000 = $1,600 + $17,750
• (10)
• - 1,300 Drawing - 1,300
• New
• $8,050 + $1,400 + $1,600 + $7,000 = $1,600 + $16,450
• $18,050 $18,050
Cash is decreased by $1,300 and R. Neal, Capital is decreased by the same amount. This is not an expense, but rather a withdrawal of owner’s equity.

FINANCIAL STATEMENTSFINANCIAL STATEMENTSSTUDY OBJECTIVE STUDY OBJECTIVE 88
•Four financial statements are prepared from the summarized accounting data:
• Income Statementrevenues and expenses and resulting net income or net loss for a specific period of time
• Owner’s Equity Statementchanges in owner’s equity for a specific period of time
• Balance Sheetassets, liabilities, and owner’s equity at a specific date
• Statement of Cash Flowscash inflows (receipts) and outflows (payments) for a specific period of time

FINANCIAL STATEMENTS AND THEIR INTERRELATIONSHIPSFINANCIAL STATEMENTS AND THEIR INTERRELATIONSHIPS
$ 2,750
Net income of $2,750 shown on the income statement is added to the beginning balance of owner’s capital in the owner’s equity statement.
SOFTBYTE, INC.
Income Statement
For the Month Ended September 30, 2005Revenues
Service revenue $ 4,700
Expenses
Salaries expense $ 900
Rent expense 600
Advertising expense 250
Utilities expense 200
Total expenses 1,950
Net income

FINANCIAL STATEMENTS AND FINANCIAL STATEMENTS AND THEIR INTERRELATIONSHIPSTHEIR INTERRELATIONSHIPS
SOFTBYTE, INC.Owner’s Equity Statement
For the Month Ended September 30, 2005Retained earnings, September 1, 2005 $ -0-Add: Investments $ 15,000
Net income 2,750 17,750
17,750Less: Drawings 1,300
Retained earnings, September 30, 2005 $16,450
Net income of $2,750 carried forward from the income statement to the owner’s equity statement. The owner’s capital of $16,450 at the end of the reporting period is shown as the final total of the owner’s equity column of the Summary of Transactions (Illustration 1-8).

FINANCIAL STATEMENTS AND THEIR FINANCIAL STATEMENTS AND THEIR INTERRELATIONSHIPSINTERRELATIONSHIPS
Owner’s capital of $16,450 at the end of the reporting period shown in the owner’s equity statement is shown on the balance sheet.
SOFTBYTE, INC.Balance Sheet
September 30, 2005Assets
Cash $ 8,050Accounts receivable 1,400Supplies 1,600Equipment 7,000
Total assets $ 18,050
Liabilities and Owner’s EquityLiabilities
Accounts payable $ 1,600Owner’s equity
R. Neal, capital
Total liabilities and owner’s equity $ 18,050 16,450

FINANCIAL STATEMENTS AND FINANCIAL STATEMENTS AND THEIR INTERRELATIONSHIPSTHEIR INTERRELATIONSHIPS
Cash of $8,050 on the balance sheet is reported on the statement of cash flows.
SOFTBYTE, INC.Balance Sheet
September 30, 2005Assets
CashAccounts receivable 1,400Supplies 1,600
Equipment 7,000
Total assets $ 18,050
Liabilities and Owner’s EquityLiabilities
Accounts payable $ 1,600
Owner’s equity
R. Neal, capital 16,450
Total liabilities and owner’s equity $ 18,050
$ 8,050

FINANCIAL STATEMENTS AND FINANCIAL STATEMENTS AND THEIR INTERRELATIONSHIPSTHEIR INTERRELATIONSHIPS
SOFTBYTE, INC.Statement of Cash Flows
For the Month Ended September 30, 2005Cash flows from operating activities
Cash receipts from revenues $ 3,300Cash payments for expenses (1,950)Net cash provided by operating activities 1,350
Cash flows from investing activitiesPurchase of equipment (7,000)
Cash flows from financing activitiesSale of common stock $ 15,000Payment of cash dividends (1,300)
Net cash provided by financing activities 13,700
Net increase in cash 8,050Cash at the beginning of the period –0–
Cash at the end of the period $ 8,050
Cash of $8,050 on the balance sheet and statement of cash flows is shown as the final total of the cash column of the Summary of Transactions (Illustration 1-8).

Which of the following is not an advantage of the corporate form of
business organization?
– Limited liability of stockholders
– Transferability of ownership
– Unlimited personal liability for stockholders
– Unlimited life

Which of the following is not an advantage of the corporate form of
business organization?
– Limited liability of stockholders
– Transferability of ownership
– Unlimited personal liability for stockholders
– Unlimited life

John Wiley & Sons, Inc. © 2005
Chapter 2Chapter 2
The Recording Process
Prepared by Naomi KarolinskiPrepared by Naomi KarolinskiMonroe Community CollegeMonroe Community College
andand
Marianne BradfordMarianne BradfordBryant CollegeBryant College
Accounting Principles, 7Accounting Principles, 7thth EditionEdition
Weygandt Weygandt •• Kieso Kieso •• KimmelKimmel

After studying this chapter, you should be able to:
CHAPTER 2THE RECORDING PROCESS
1 Explain what an account is and how it helps in the recording process
2 Define debits and credits and explain how they are used to record business transactions
3 Identify the basic steps in the recording process
4 Explain what a journal is and how it helps in the recording process

5 Explain what a ledger is and how it helps in the recording process
6 Explain what posting is and how it helps in the recording process
7 Prepare a trial balance and explain its purpose
After studying this chapter, you should be able to:
CHAPTER CHAPTER 22THE RECORDING PROCESSTHE RECORDING PROCESS

THE ACCOUNTTHE ACCOUNTSTUDY OBJECTIVE STUDY OBJECTIVE 11
• An account is an individual accounting record of increases and decreases in a specific asset, liability, or owner’s equity item.
• There are separate accounts for the items we used in transactions such as cash, salaries expense, accounts payable, etc.
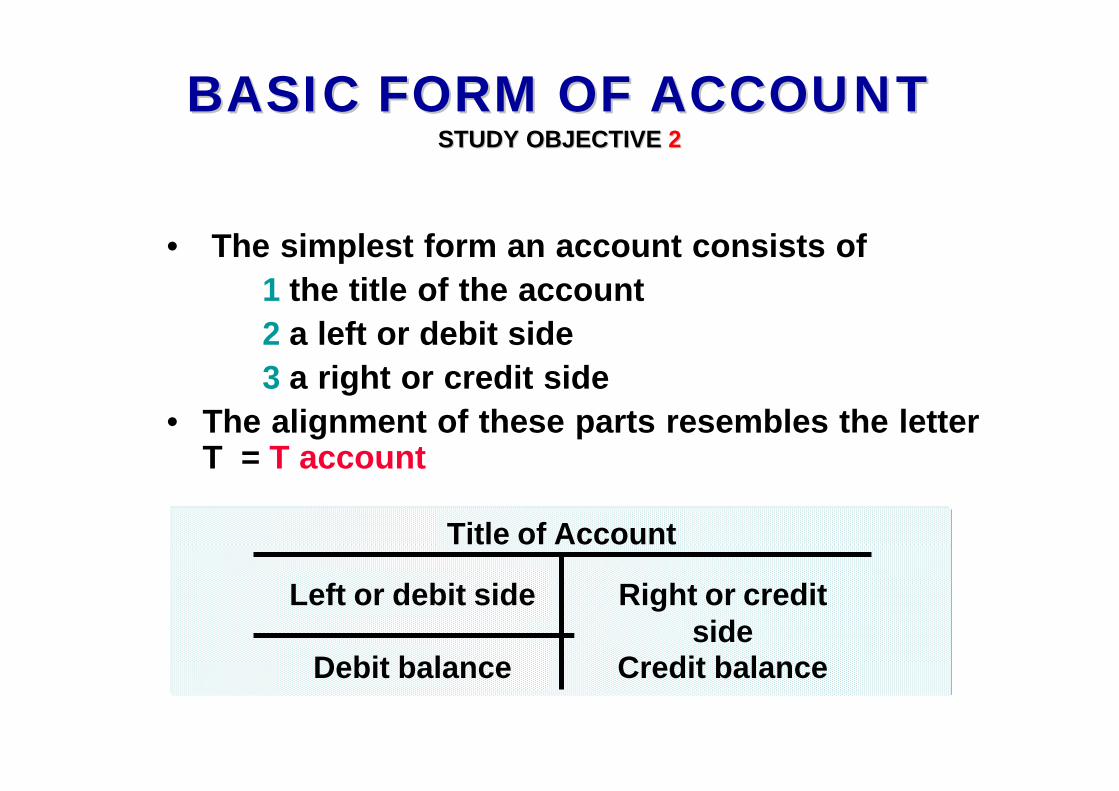
BASIC FORM OF ACCOUNTBASIC FORM OF ACCOUNTSTUDY OBJECTIVE STUDY OBJECTIVE 22
• The simplest form an account consists of
1 the title of the account
2 a left or debit side
3 a right or credit side
• The alignment of these parts resembles the letter T = T account
Left or debit side
Title of Account
Right or credit side
Debit balance Credit balance

DEBITS AND CREDITSDEBITS AND CREDITS
• Debit indicates left and Credit indicates right
• Recording $ on the left side of an account is debiting the account
• Recording $ on the right side is crediting the account
• If the total of debit amounts is bigger than credits, the account has a debit balance
• If the total of credit amounts is bigger than debits, the account has a credit balance

TABULAR SUMMARY COMPARED TABULAR SUMMARY COMPARED TO ACCOUNT FORMTO ACCOUNT FORM

Cash
Debits Credits
15,000
Example: The owner makes an initial investment of $15,000 to start the business. Cash is debited as the owner’s Capital is credited.
Example: The owner makes an initial investment of $15,000 to start the business. Cash is debited as the owner’s Capital is credited.
DEBITING AN ACCOUNTDEBITING AN ACCOUNT

Example: Monthly rent of $7,000 is paid. Cash is credited as RentExpense is debited.
Example: Monthly rent of $7,000 is paid. Cash is credited as RentExpense is debited.
CREDITING AN ACCOUNTCREDITING AN ACCOUNT
Cash
Debits Credits
7,000

DEBITING / CREDITING AN DEBITING / CREDITING AN ACCOUNTACCOUNT
Cash
Debits Credits
15,000 7,000
8,000
Example: Cash is debited for $15,000and credited for $7,000, leaving a debit balance of $8,000.
Example: Cash is debited for $15,000and credited for $7,000, leaving a debit balance of $8,000.

DOUBLEDOUBLE--ENTRY SYSTEMENTRY SYSTEM
• equal debits and credits made accounts for each transaction
• total debits always equal the total credits
• accounting equation always stays in balance
Assets Liabilities Equity

DEBIT AND CREDIT EFFECTS —ASSETS AND LIABILITIES
Debits Credits
Increase assets Decrease assets
Decrease liabilities Increase liabilities

NORMAL BALANCENORMAL BALANCE
• every account has a designated normal balance. – It is either a debit or credit.
• accounts rarely have an abnormal balance.
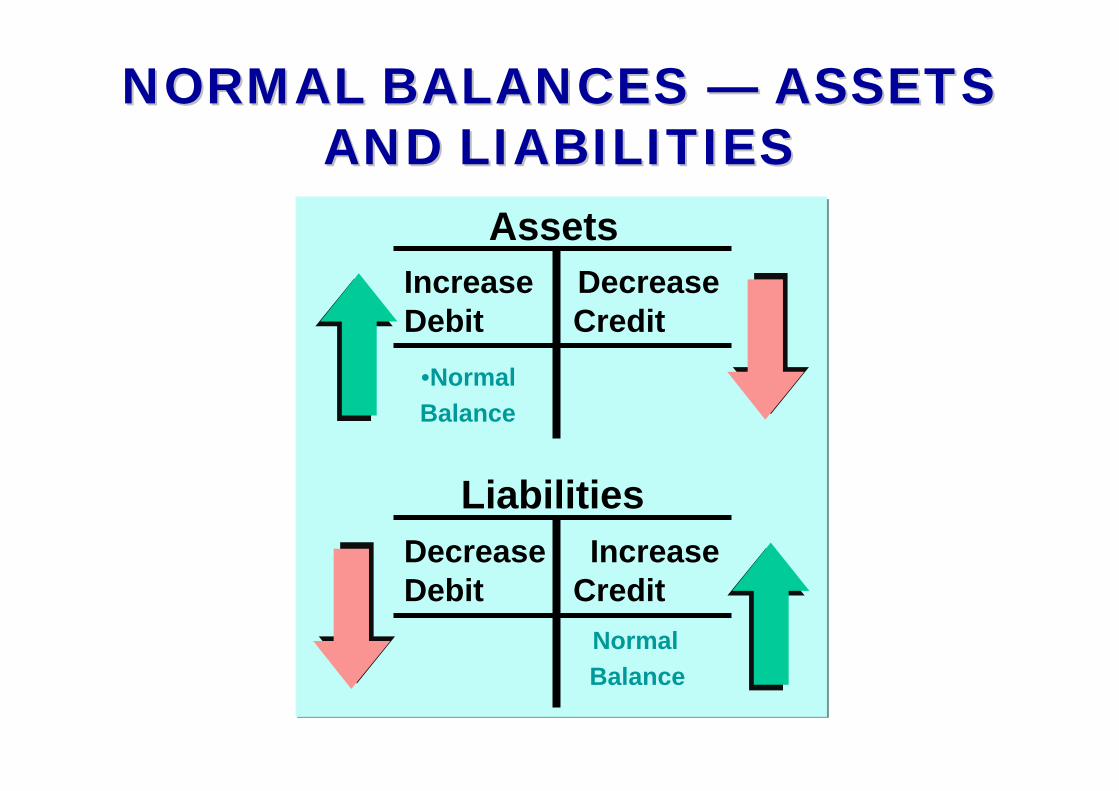
NORMAL BALANCES NORMAL BALANCES —— ASSETS ASSETS AND LIABILITIESAND LIABILITIES
Assets
Increase Decrease Debit Credit
Decrease Increase Debit Credit
Liabilities
•Normal
Balance
Normal
Balance

DEBIT AND CREDIT EFFECTS DEBIT AND CREDIT EFFECTS ——OWNEROWNER’’S CAPITALS CAPITAL
Debits Credits
Decrease owner’s capital Increase owner’s capital

NORMAL BALANCE NORMAL BALANCE —— OWNEROWNER’’S S CAPITALCAPITAL
Owner’s Capital
Decrease Increase Debit Credit
Normal Balance

DEBIT AND CREDIT EFFECTS DEBIT AND CREDIT EFFECTS ——OWNEROWNER’’S DRAWINGS DRAWING
Debits CreditsIncrease owner’s drawing Decrease owner’s
drawing
Remember, Drawing is a contra-account – an account that is backwards from the account it accompanies (the Capitalaccount).
Remember, Drawing is a contra-account – an account that is backwards from the account it accompanies (the Capitalaccount).

NORMAL BALANCE NORMAL BALANCE —— OWNEROWNER’’S S DRAWINGDRAWING
Owner’s Drawing
Normal Balance
Increase Decrease Debit Credit

DEBIT AND CREDIT EFFECTS —REVENUES AND EXPENSES
Decrease revenues Increase revenues Increase expenses Decrease expenses
Debits Credits
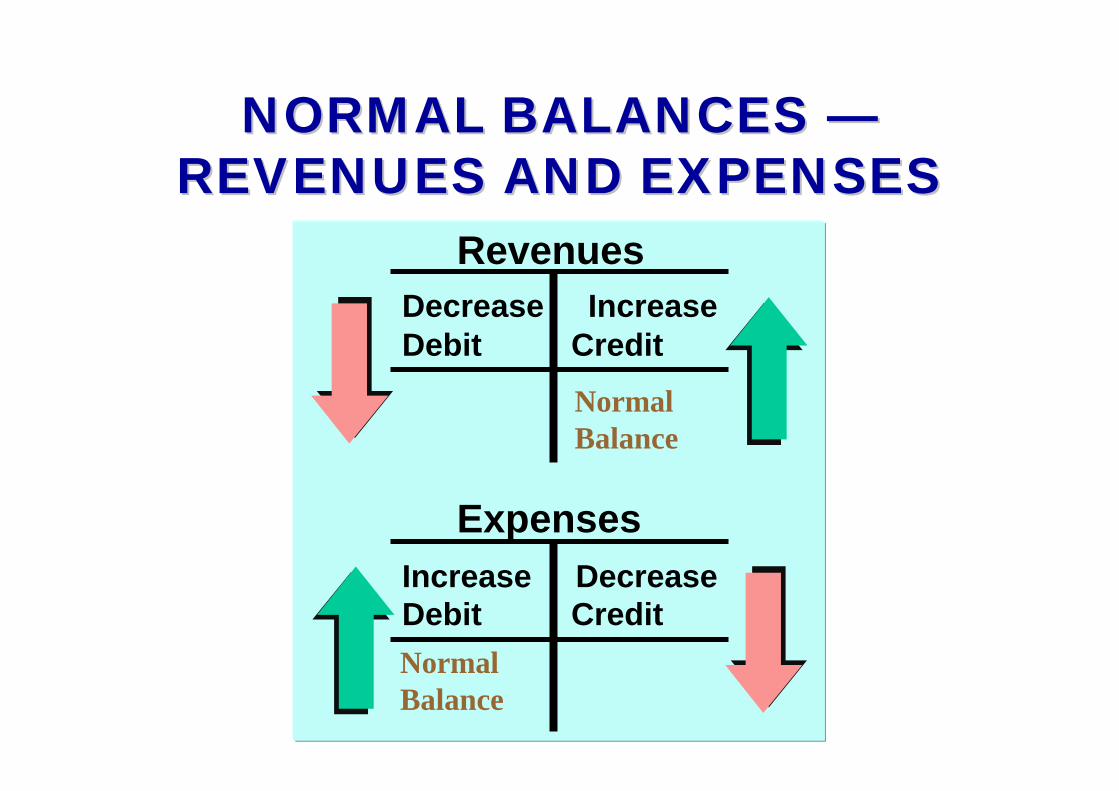
NORMAL BALANCES NORMAL BALANCES ——REVENUES AND EXPENSESREVENUES AND EXPENSES
Increase Decrease Debit Credit
Expenses
Revenues
Decrease Increase Debit Credit
NormalBalance
NormalBalance

EXPANDED BASIC EQUATION EXPANDED BASIC EQUATION AND DEBIT/CREDIT RULES AND AND DEBIT/CREDIT RULES AND
EFFECTSEFFECTSLiabilitiesAssets Owner’s Equity
= + -
+=
+ -
Assets
Dr. Cr.+ -
Liabilities
Dr. Cr.- +
Dr. Cr.
Owner’s Drawing
+ -
Dr. Cr.
Revenues
- +Dr. Cr.
Expenses
+ -
Dr. Cr.
Owner’s Capital
- +

Chapter 2
Which of the following is not true of the terms debit and credit.
a. They can be abbreviated as Dr. and Cr.
b. They can be interpreted to mean increase and decrease.
c. They can be used to describe the balance of an account.
d. They can be interpreted to mean left and right.

Chapter 2
Which of the following is not true of the terms debit and credit.
a. They can be abbreviated as Dr. and Cr.
b. They can be interpreted to mean increase and decrease.
c. They can be used to describe the balance of an account.
d. They can be interpreted to mean left and right.

THE RECORDING THE RECORDING PROCESSPROCESS
STUDY OBJECTIVE STUDY OBJECTIVE 33
1 analyze each transaction (+, -)
2 enter transaction in a journal
3 transfer journal information to ledger accounts

THE JOURNALTHE JOURNALSTUDY OBJECTIVE STUDY OBJECTIVE 44
• Transactions – Are initially recorded in chronological
order before they are transferred to the ledger accounts.
• A general journal has
1 spaces for dates
2 account titles and explanations
3 references
4 two amount columns

A journal makes several contributions to recording process:
1 discloses in one place the complete effect of a transaction
2 provides a chronological record of transactions
3 helps to prevent or locate errors as debit and credit amounts for each entry can be compared
THE JOURNALTHE JOURNAL

JOURNALIZINGJOURNALIZING
• Entering transaction data in the journal is known as journalizing.
• Separate journal entries are made for each transaction.
• A complete entry consists of:1 the date of the transaction,2 the accounts and amounts to be
debited and credited,3 a brief explanation of transaction.

TECHNIQUE OF TECHNIQUE OF JOURNALIZINGJOURNALIZING
The date of the transaction is entered into the date column.
The date of the transaction is entered into the date column.
GENERAL JOURNAL J1
Date Account Titles and Explanation Ref. Debit Credit2005
Sept. 1 Cash 15,000R. Neal, Capital 15,000
(Invested cash in business)
1 Computer Equipment 7,000Cash 7,000
(Purchased equipment forcash)

TECHNIQUE OF TECHNIQUE OF JOURNALIZINGJOURNALIZING
The debit account title is entered at the extreme left margin of the Account Titles and Explanation column. The credit account title is indented on the next line.
The debit account title is entered at the extreme left margin of the Account Titles and Explanation column. The credit account title is indented on the next line.
GENERAL JOURNAL J1
Date Account Titles and Explanation Ref. Debit Credit2005
Sept. 1 Cash 15,000R. Neal, Capital 15,000
(Invested cash in business)
1 Computer Equipment 7,000Cash 7,000
(Purchased equipment forcash)

TECHNIQUE OF TECHNIQUE OF JOURNALIZINGJOURNALIZING
The amounts for the debits are recorded in the Debit column and the amounts for the credits are recorded in the Credit column.
The amounts for the debits are recorded in the Debit column and the amounts for the credits are recorded in the Credit column.
GENERAL JOURNAL J1
Date Account Titles and Explanation Ref. Debit Credit
2005 Sept. 1 Cash 15,000 R. Neal, Capital 15,000 (Invested cash in business) 1 Computer Equipment 7,000 Cash 7,000 (Purchased equipment for cash)

TECHNIQUE OF TECHNIQUE OF JOURNALIZINGJOURNALIZING
A brief explanation of the transaction is given.A brief explanation of the transaction is given.
GENERAL JOURNAL J1
Date Account Titles and Explanation Ref. Debit Credit
2005 Sept. 1 Cash 15,000 R. Neal, Capital 15,000 (Invested cash in business) 1 Computer Equipment 7,000 Cash 7,000 (Purchased equipment for cash)

TECHNIQUE OF TECHNIQUE OF JOURNALIZINGJOURNALIZING
A space is left between journal entries. The blank space separates individual journal entries and makes the entire journal easier to read.
A space is left between journal entries. The blank space separates individual journal entries and makes the entire journal easier to read.
GENERAL JOURNAL J1
Date Account Titles and Explanation Ref. Debit Credit2005
Sept. 1 Cash 15,000R. Neal, Capital 15,000
(Invested cash in business)
1 Computer Equipment 7,000Cash 7,000
(Purchased equipment forcash)

TECHNIQUE OF TECHNIQUE OF JOURNALIZINGJOURNALIZING
The column entitled Ref. is left blank at the time journal entry is made and is used later when the journal entries are transferred to the ledger accounts.
The column entitled Ref. is left blank at the time journal entry is made and is used later when the journal entries are transferred to the ledger accounts.
GENERAL JOURNAL J1
Date Account Titles and Explanation Ref. Debit Credit
2005
Sept. 1 Cash 15,000
R. Neal, Capital 15,000
(Invested cash in business)
1 Computer Equipment 7,000
Cash 7,000
(Purchased equipment for
cash)

GENERAL JOURNAL J1
Date Account Titles and Explanation Ref. Debit Credit
2005 July 1 Cash 20,000 K. Browne, Capital 20,000 (Invested cash in the business)
If an entry involves only two accounts, one debit and one credit, it is considered a simple entry.
If an entry involves only two accounts, one debit and one credit, it is considered a simple entry.
SIMPLE AND COMPOUND SIMPLE AND COMPOUND JOURNAL ENTRIESJOURNAL ENTRIES

When three or more accounts are required in one journal entry, the entry is referred to as a compound entry.
When three or more accounts are required in one journal entry, the entry is referred to as a compound entry.
COMPOUND JOURNAL COMPOUND JOURNAL ENTRYENTRY
2
1
3
GENERAL JOURNAL J1
Date Account Titles and Explanation Ref. Debit Credit
2005 July 1 Delivery Equipment 14,000 Cash 8,000 Accounts Payable 6,000 (Purchased truck for cash with balance on account)

GENERAL JOURNAL J1
Date Account Titles and Explanation Ref. Debit Credit
2005 July 1 Cash 8,000 Delivery Equipment 14,000 Accounts Payable 6,000 (Purchased truck for cash with balance on account)
COMPOUND JOURNAL COMPOUND JOURNAL ENTRYENTRY
This is the wrong format; all debits must be listed before the credits are listed.
This is the wrong format; all debits must be listed before the credits are listed.

THE LEDGERTHE LEDGERSTUDY OBJECTIVE STUDY OBJECTIVE 55
A Group of accounts maintained by a company is called the ledger.
A general ledger contains all the assets, liabilities, and owner’s equity accounts

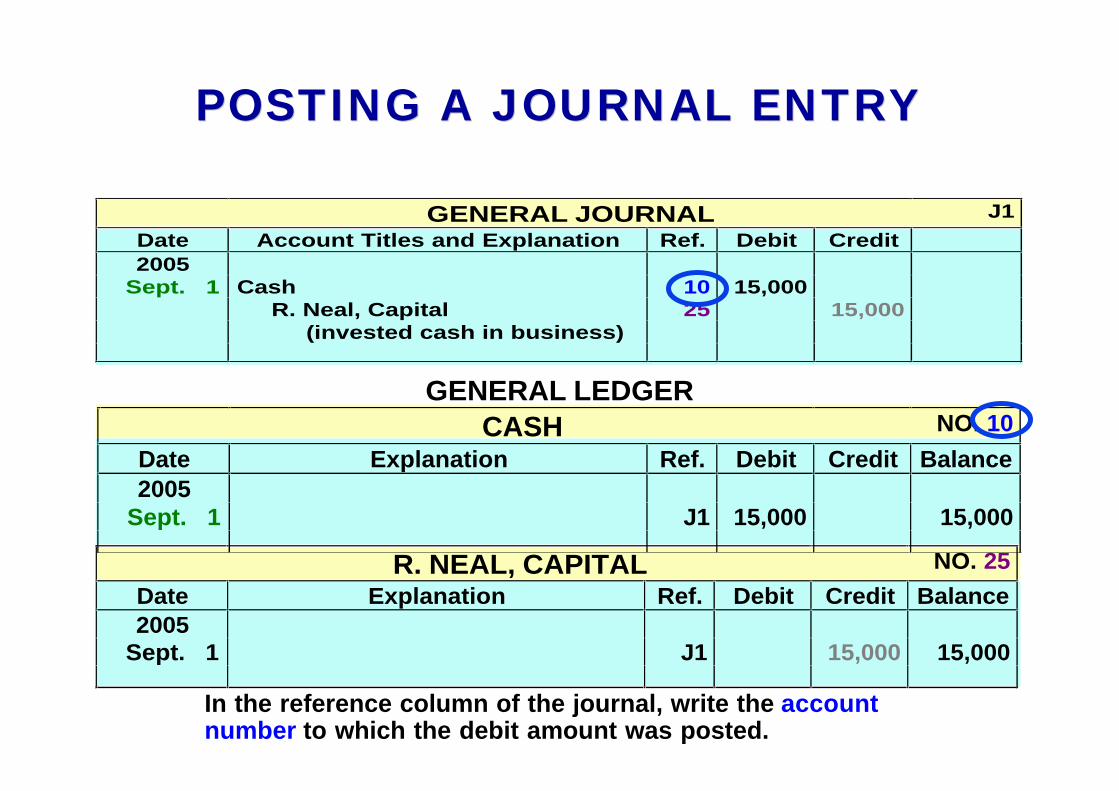
POSTING A JOURNAL ENTRYPOSTING A JOURNAL ENTRY
In the ledger, enter in the appropriate columns of the account(s) debited the date, journal page, and debit amount shown in the journal.
GENERAL JOURNAL J1
Date Account Titles and Explanation Ref. Debit Credit
2005 Sept. 1 Cash 10 15,000 R. Neal, Capital 25 15,000 (invested cash in business)
R. NEAL, CAPITAL NO. 25
Date Explanation Ref. Debit Credit Balance
2005 Sept. 1 J1 15,000 15,000
GENERAL LEDGER CASH NO. 10
Date Explanation Ref. Debit Credit Balance
2005 Sept. 1 J1 15,000 15,000
POSTING A JOURNAL ENTRYPOSTING A JOURNAL ENTRY
R. NEAL, CAPITAL NO. 25
Date Explanation Ref. Debit Credit Balance
2005 Sept. 1 J1 15,000 15,000
GENERAL JOURNAL J1
Date Account Titles and Explanation Ref. Debit Credit
2005 Sept. 1 Cash 10 15,000 R. Neal, Capital 25 15,000 (invested cash in business)
GENERAL LEDGER
CASH NO. 10
Date Explanation Ref. Debit Credit Balance
2005 Sept. 1 J1 15,000 15,000
In the reference column of the journal, write the account number to which the debit amount was posted.

POSTING A JOURNAL ENTRYPOSTING A JOURNAL ENTRY
In the ledger, enter in the appropriate columns of the account(s) credited the date, journal page, and credit amount shown in the journal.
R. NEAL, CAPITAL NO. 25
Date Explanation Ref. Debit Credit Balance
200 5 Sept. 1 J1 15,000 15,000
GENERAL JOURNAL J1
Date Account Titles and Explanation Ref. Debit Credit
2005 Sept. 1 Cash 10 15,000 R. Neal, Capital 25 15,000 (invested cash in business)
GENERAL LEDGER
CASH NO. 10
Date Explanation Ref. Debit Credit Balance2005
Sept. 1 J1 15,000 15,000

POSTING A JOURNAL ENTRYPOSTING A JOURNAL ENTRY
In the reference column of the journal, write the account number to which the credit amount was posted.
R. NEAL, CAPITAL NO. 25
Date Explanation Ref. Debit Credit Balance
2005 Sept. 1 J1 15,000 15,000
GENERAL JOURNAL J1
Date Account Titles and Explanation Ref. Debit Credit
2005 Sept. 1 Cash 10 15,000 R. Neal, Capital 25 15,000 (invested cash in business)
GENERAL LEDGER CASH NO. 10
Date Explanation Ref. Debit Credit Balance
2005 Sept. 1 J1 15,000 15,000

A Chart of Accounts lists the accounts and the account numbers which identify their location in the ledger.
A Chart of Accounts lists the accounts and the account numbers which identify their location in the ledger.
CHART OF ACCOUNTSCHART OF ACCOUNTS

INVESTMENT OF CASH BY OWNER
BasicAnalysis
Debit-CreditAnalysis
TransactionOctober 1, C.R. Byrd invests $10,000 cash in an advertising business known as:
The Pioneer Advertising Agency.
•The asset Cash is increased $10,000
•Owner’s equity, C. R. Byrd, Capital is increased $10,000.
Debits increase assets: debit Cash $10,000.Credits increase owner’s equity: credit C.R. Byrd, Capital $10,000.
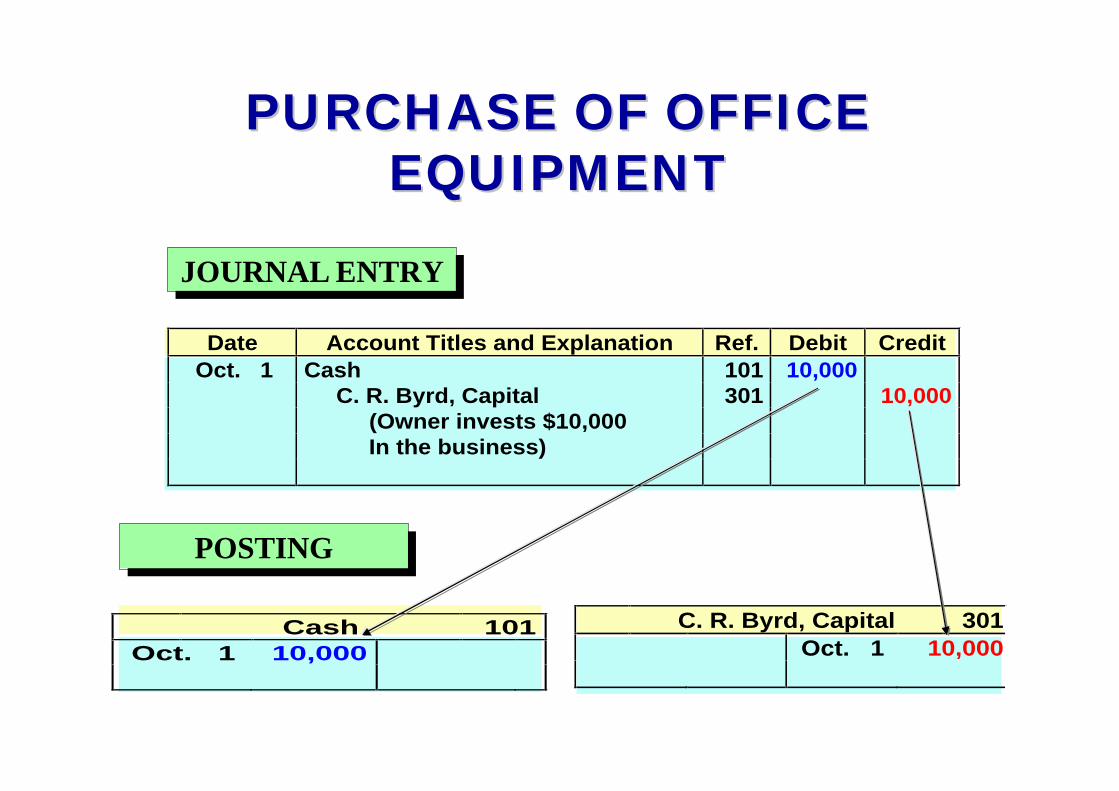
PURCHASE OF OFFICE PURCHASE OF OFFICE EQUIPMENTEQUIPMENT
C. R. Byrd, Capital 301
Oct. 1 10,000
Cash 101
Oct. 1 10,000
Date Account Titles and Explanation Ref. Debit Credit
Oct. 1 Cash 101 10,000 C. R. Byrd, Capital 301 10,000 (Owner invests $10,000 In the business)
JOURNAL ENTRYJOURNAL ENTRY
POSTINGPOSTING

INVESTMENT OF CASH BY OWNER
BasicAnalysis
Debit-CreditAnalysis
TransactionOctober 1, C. R. Byrd purchases $5,000 of equipment by issuing a 3-month, 12% note payable.
•The asset Office Equipment is increased $5,000.
•The liability, Notes Payable is increased $5,000.
Debits increase assets: debit Office Equipment $5,000.Credits increase liabilities: credit Notes Payable $5,000.

PURCHASE OF OFFICE PURCHASE OF OFFICE EQUIPMENTEQUIPMENT
Notes Payable 200
Oct. 1 5,000
Office Equipment
157
Oct. 1 5,000
Date Account Titles and Explanation Ref. Debit Credit
Oct. 1 Office Equipment 157 5,000 Notes Payable 200 5,000 (Issued 3-month, 12% note for office equipment)
JOURNAL ENTRYJOURNAL ENTRY
POSTINGPOSTING

RECEIPT OF CASH FOR RECEIPT OF CASH FOR FUTURE SERVICEFUTURE SERVICE
BasicAnalysis
Debit-CreditAnalysis
TransactionOctober 2, a $1,200 cash advance is received from a client, for advertising services expected to be completed by December 31.
Asset Cash is increased $1,200
Liability Unearned Fees is increased $1,200 •Service has not been rendered yet.
Liabilities often have the word “payable” in their title, Unearned fees are a liability.
Debits increase assets: debit Cash $1,200. Credits increase liabilities: credit Unearned Fees $1,200.

RECEIPT OF CASH FOR FUTURE SERVICE
Unearned Fees 209
Oct. 2 1,200
Cash 101
Oct. 1 10,000 2 1,200
Date Account Titles and Explanation Ref. Debit Credit
Oct. 2 Cash 101 1,200 Unearned Fees 209 1,200 (Received advance from R. Knox for future services)
JOURNAL ENTRYJOURNAL ENTRY
POSTINGPOSTING

PAYMENT OF MONTHLY PAYMENT OF MONTHLY RENTRENT
BasicAnalysis
Debit-CreditAnalysis
TransactionOctober 3, office rent for October is paid in cash, $900.
The expense Rent is increased $900 Payment pertains only to the current monthAsset Cash is decreased $900.
Debits increase expenses: debit Rent Expense $900. Credits decrease assets: credit Cash $900.

PAYMENT OF RENT EXPENSE
Cash 101
Oct. 1 10,000 Oct. 3 900 Oct. 2 1,200
Rent Expense 729
Oct. 3 900
Date Account Titles and Explanation Ref. Debit Credit
Oct. 3 Rent Expense 729 900 Cash 101 900 (Paid $900 for October rent)
JOURNAL ENTRYJOURNAL ENTRY
POSTINGPOSTING

PAYMENT FOR INSURANCEPAYMENT FOR INSURANCE
-Asset Prepaid Insurance increases $600
-Payment extends to more than the current month
-Asset Cash is decreased $600.
-Payments of expenses benefiting more than one period are prepaid expenses or prepayments.
TransactionOctober 4, $600 Paid one-year insurance policy-expires next year on September 30.
Debit-CreditAnalysis
Debits increase assets: debit Prepaid Insurance $600. Credits decrease assets: credit Cash $600.
BasicAnalysis

PAYMENT FOR PAYMENT FOR INSURANCEINSURANCE
Cash 101
Oct. 1 10,000 Oct. 3 900 2 1,200 4 600
Date Account Titles and Explanation Ref. Debit Credit
Oct. 4 Prepaid Insurance 130 600 Cash 101 600 (Paid one-year policy; effective date October 1)
JOURNAL ENTRYJOURNAL ENTRY
POSTINGPOSTING
Prepaid Insurance 130 Oct. 4 600

PURCHASE OF SUPPLIES PURCHASE OF SUPPLIES ON CREDITON CREDIT
BasicAnalysis
Debit-CreditAnalysis
TransactionOctober 5, an estimated 3-month supply of advertising materials is purchased on account from Aero Supply for $2,500.
The asset Advertising Supplies is increased $2,500; the liability Accounts Payable is increased $2,500.
Debits increase assets: debit Advertising Supplies $2,500. Credits increase liabilities: credit Accounts Payable $2,500.

PURCHASE OF SUPPLIES PURCHASE OF SUPPLIES ON CREDITON CREDIT
Accounts Payable 201
Oct. 5 2,500
Advertising Supplies 126
Oct. 5 2,500
Date Account Titles and Explanation Ref. Debit Credit
Oct. 5 Advertising Supplies 126 2,500 Accounts Payable 201 2,500 (Purchased supplies on account from Aero Supply)
JOURNAL ENTRYJOURNAL ENTRY
POSTINGPOSTING

HIRING OF EMPLOYEESHIRING OF EMPLOYEES
BasicAnalysis
Debit-CreditAnalysis
Transaction
October 9, hire four employees to begin work on October 15. Each employee is to receive a weekly salary of $500 for a 5-day work week, payable every 2 weeks -- first payment made on October 26.
A business transaction has not occurred only an agreement between the employer and the employees to enter into a business transaction beginning on October 15.
A debit-credit analysis is not needed because there is no accounting entry.

WITHDRAWAL OF CASH BY WITHDRAWAL OF CASH BY OWNEROWNER
BasicAnalysis
Debit-CreditAnalysis
TransactionOctober 20, C. R. Byrd withdraws $500 cash for personal use.
The owner’s equity account C. R. Byrd, Drawing is increased $500.The asset Cash is decreased $500.
Debits increase drawings: debit C. R. Byrd, Drawing $500. Credits decrease assets: credit Cash $500.

WITHDRAWAL OF CASH BY WITHDRAWAL OF CASH BY OWNEROWNER
C. R. Byrd, Drawing 306
Oct. 20 500
Cash 101
Oct. 1 10,000 Oct. 3 900 2 1,200 4 600
20 500
Date Account Titles and Explanation Ref. Debit Credit
Oct. 20 C. R. Byrd, Drawing 306 500 Cash 101 500 (Withdrew cash for personal use)
JOURNAL ENTRYJOURNAL ENTRY
POSTINGPOSTING
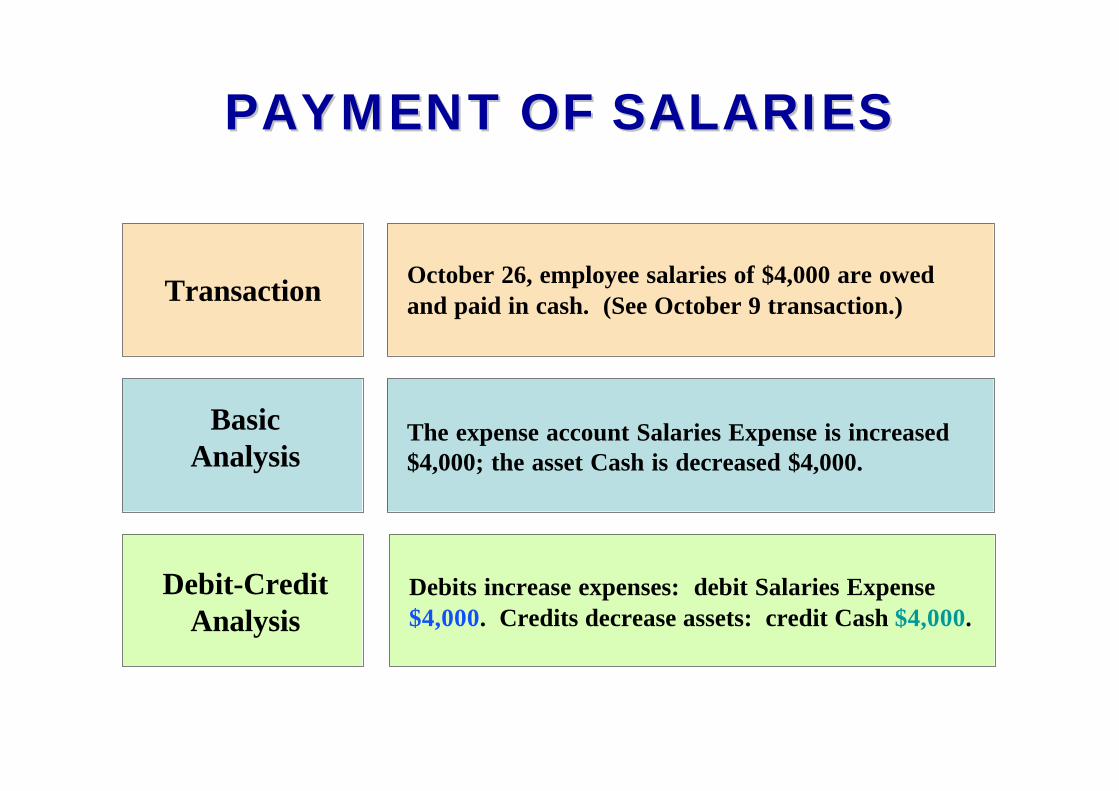
PAYMENT OF SALARIESPAYMENT OF SALARIES
BasicAnalysis
Debit-CreditAnalysis
TransactionOctober 26, employee salaries of $4,000 are owed and paid in cash. (See October 9 transaction.)
The expense account Salaries Expense is increased $4,000; the asset Cash is decreased $4,000.
Debits increase expenses: debit Salaries Expense $4,000. Credits decrease assets: credit Cash $4,000.

PAYMENT OF SALARIESPAYMENT OF SALARIES
Date Account Titles and Explanation Ref. Debit Credit
Oct. 26 Salaries Expense 726 4,000 Cash 101 4,000 (Paid salaries to date)
Cash 101
Oct. 1 10,000 Oct. 3 900 2 1,200 4 600
20 500 26 4,000
JOURNAL ENTRYJOURNAL ENTRY
POSTINGPOSTING
Salaries Expense 726 Oct. 26 4,000

RECEIPT OF CASH FOR FEES RECEIPT OF CASH FOR FEES EARNEDEARNED
BasicAnalysis
Debit-CreditAnalysis
TransactionOctober 31, received $10,000 in cash from CopaCompany for advertising services rendered in October.
The asset Cash is increased $10,000; the revenue Fees Earned is increased $10,000.
Debits increase assets: debit Cash $10,000. Credits increase revenues: credit Fees Earned $10,000.

RECEIPT OF CASH FOR FEES RECEIPT OF CASH FOR FEES EARNEDEARNED
Cash 101
Oct. 1 10,000 Oct. 3 900 2 1,200 4 600 31 10,000 20 500
26 4,000
Date Account Titles and Explanation Ref. Debit Credit
Oct. 31 Cash 101 10,000 Fees Earned 400 10,000 (Received cash for fees earned)
Fees Earned 400
Oct. 31 10,000
JOURNAL ENTRYJOURNAL ENTRY
POSTINGPOSTING

THE TRIAL BALANCETHE TRIAL BALANCESTUDY OBJECTIVE STUDY OBJECTIVE 77
• The trial balance is a list of accounts and their balances at a given time.
• The primary purpose of a trial balance is to prove debits = credits after posting.
• If debits and credits do not agree, the trial balance can be used to uncover errors in journalizing and posting.

THE TRIAL BALANCE
The Steps in preparing the Trial Balance are:1. List the account titles and balances
2. Total the debit and credit columns
3. Prove the equality of the two columns

PIONEER ADVERTISING AGENCY
Trial Balance
October 31, 2005
Debit Credit
Cash $ 15,200 Advertising Supplies 2,500 Prepaid Insurance 600 Office Equipment 5,000 Notes Payable $ 5,000 Accounts Payable 2,500 Unearned Fees 1,200 C. R. Byrd, Capital 10,000 C. R. Byrd, Drawing 500 Fees Earned 10,000 Salaries Expense 4,000 Rent Expense 900
$ 28,700 $ 28,700
The total debits must equal the
total credits.
The total debits must equal the
total credits.
A TRIAL BALANCEA TRIAL BALANCE

LIMITATIONS OF A LIMITATIONS OF A TRIAL BALANCETRIAL BALANCE
• A trial balance does not prove all transactions have been recorded or the ledger is correct.
• Numerous errors may exist even though the trial balance columns agree. For example, the trial balance may balance even when:– a transaction is not journalized– a correct journal entry is not posted– a journal entry is posted twice– incorrect accounts used in journalizing or
posting– offsetting errors are made in recording

Chapter 2
Which one of the following represents the expanded basic accounting equation?
a. Assets = Liabilities + Owner’s Capital + Owner’s Drawings – Revenue - Expenses.
b. Assets + Owner’s Drawings + Expenses = Liabilities + Owner’s Capital + Revenue.
c. Assets – Liabilities – Owner’s Drawings = Owner’s Capital + Revenue – Expenses.
d. Assets = Revenue + Expenses – Liabilities.

John Wiley & Sons, Inc. © 2005
Chapter 3Chapter 3
Adjusting the Accounts
Accounting Principles, 7Accounting Principles, 7thth EditionEdition
Weygandt Weygandt •• Kieso Kieso •• KimmelKimmel
Prepared by Naomi KarolinskiPrepared by Naomi KarolinskiMonroe Community CollegeMonroe Community College
andand
Marianne BradfordMarianne BradfordBryant CollegeBryant College

After studying this chapter, you should be able to:
CHAPTER 3ADJUSTING THE ACCOUNTS
1 Explain the time period assumption
2 Explain the accrual basis of accounting
3 Explain why adjusting entries are needed
4 Identify the major types of adjusting entries
5 Prepare adjusting entries for prepayments
6 Prepare adjusting entries for accruals
7 Describe the nature and purpose of an adjusted trial balance

TIME-PERIOD ASSUMPTIONSTUDY OBJECTIVE STUDY OBJECTIVE 11
• The time period (or periodicity) assumption– assumes the economic life of a business can be divided
into artificial time periods
• Accounting time periods – generally month, a quarter, or a year
• Accounting time period of one year in length– referred to as a fiscal year

ACCRUAL BASIS OF ACCOUNTINGSTUDY OBJECTIVE STUDY OBJECTIVE 22
• Revenue recognition and matching principles
– Used under the accrual basis of accounting
• Cash basis accounting– revenue is recorded when cash is received
– expenses are recorded when cash is paid
• GAAP requires accrual basis accounting– cash basis often causes misleading financial
statements.

REVENUE RECOGNITION PRINCIPLE
• Revenue recognition principle
– Revenue must be recognized in the accounting period in which it is earned, not just when money is exchanged.
– In a service business, revenue is earned at the time the service is performed.

THE MATCHING PRINCIPLE
• Expense recognition is the matching principle.
• Efforts (expenses) must be matched with accomplishments (revenues).
Revenues earned
this month
are offset against....
Expensesincurred in
earning the
revenue

GAAP RELATIONSHIPS IN REVENUE AND EXPENSE RECOGNITION
Time-Period Assumption
Economic life of businesscan be divided into
artificial time periods
Revenue-Recognition Principle
Revenue recognized in the accounting period in
which it is earned
Matching Principle
Expenses matched with revenuesin the same period when efforts are
expended to generate revenues

ADJUSTING ENTRIESSTUDY OBJECTIVE STUDY OBJECTIVE 33
Adjusting entries are made in order for:
• revenues to be recorded in the period in which they are earned
• expenses to be recognized in the period in which they are incurred

Adjusting entries– required each time financial statements are
prepared
•Adjusting entries are classified as
–Prepayments (prepaid expenses and unearned revenues) OR
– Accruals (accrued revenues and accrued expenses)
ADJUSTING ENTRIES
STUDY OBJECTIVE STUDY OBJECTIVE 44

TYPES OF ADJUSTING ENTRIES
Prepayments
• Prepaid Expenses
Expenses paid in cash - recorded as assets before
used or consumed
•Unearned Revenues
Cash received - recorded as liabilities before
the revenue is earned

TYPES OF ADJUSTING ENTRIES
Accruals
• Accrued Revenues
revenues earned but not yet received in cash or
recorded
• Accrued Expenses
expenses incurred but not yet paid in cash or recorded

TRIAL BALANCE
PIONEER ADVERTISING AGENCYTrial Balance
October 31, 2005Debit Credit
Cash $ 15,200Advertising Supplies 2,500Prepaid Insurance 600Office Equipment 5,000Notes Payable $ 5,000Accounts Payable 2,500Unearned Revenue 1,200C. R. Byrd, Capital 10,000C. R. Byrd, Drawing 500Service Revenue 10,000Salaries Expense 4,000Rent Expense 900
$ 28,700 $ 28,700
The Trial Balance is the starting place
for adjusting entries.
The Trial Balance is the starting place
for adjusting entries.

PREPAYMENTSSTUDY OBJECTIVE STUDY OBJECTIVE 55
Prepayments
•The first category of adjusting entry is prepayments.
•Required to record revenues earned and expenses incurred–Also ensures that assets and liabilities are not overstated
•The adjusting entry for prepayments:
–Increases an income statement account
–Decreases a balance sheet account

ADJUSTING ENTRIES FOR PREPAYMENTS
Adjusting Entries
Asset
Unadjusted Balance
Credit Adjusting Entry (-)
Expense
Debit Adjusting Entry (+)
Prepaid Expenses
Liability
Unadjusted Balance
Debit Adjusting Entry (-)
Revenue
Credit Adjusting Entry (+)
Unearned Revenues

• Prepaid expenses – expenses paid in cash and recorded as
assets before they are used or consumed– Prepaid expenses expire with the passage
of time or through use and consumption
• An asset-expense account relationship exists with prepaid expenses
PREPAID EXPENSES

• Prior to adjustment– assets are overstated and expenses are understated
• Adjusting entry – debit expense account
– credit asset account
• Examples – prepaid expenses include supplies,
insurance, and depreciation
PREPAID EXPENSES

Advertising Supplies Expense Oct. 31 1,500
Advertising Supplies Oct. 5 2,500 Oct. 31 1,500 31 1,000
Date Account Titles and Explanation Debit Credit
Oct. 31 Advertising Supplies Expense 1,500 Advertising Supplies 1,500 (To record supplies used)
JOURNAL ENTRYJOURNAL ENTRY
POSTINGPOSTING
ADJUSTMENTADJUSTMENT October 31, an inventory count reveals that $1,000 of $2,500 of supplies are still on hand.
ADJUSTING ENTRIES FOR
PREPAYMENTS SUPPLIES

ADJUSTING ENTRIES FOR PREPAYMENTS INSURANCE
Date Account Titles and Explanation Debit Credit Oct. 31 Insurance Expense 50
Prepaid Insurance 50 (To record insurance expired)
JOURNAL ENTRYJOURNAL ENTRY
POSTINGPOSTING
ADJUSTMENTADJUSTMENT October 31, an analysis of the policy reveals that $50 of insurance expires each month.
Prepaid Insurance10
Oct. 4 600 Oct. 31 50
31 550
Insurance Expense 63Oct. 31 50

Depreciation
• the allocation of the cost of an asset to expense over its useful life in a rational and systematic manner
• Equipment or a building
– viewed as a long-term prepayment of services
– allocated in the same manner as other prepaid expenses
DEPRECIATION

DEPRECIATION
• Depreciation– is an estimate rather than a factual measurement
of the cost that has expired
• Recording depreciation– Debit Depreciation Expense
– Credit Accumulated Depreciation (contra asset)
Depreciation ExpenseXXX
Accumulated DepreciationXXX
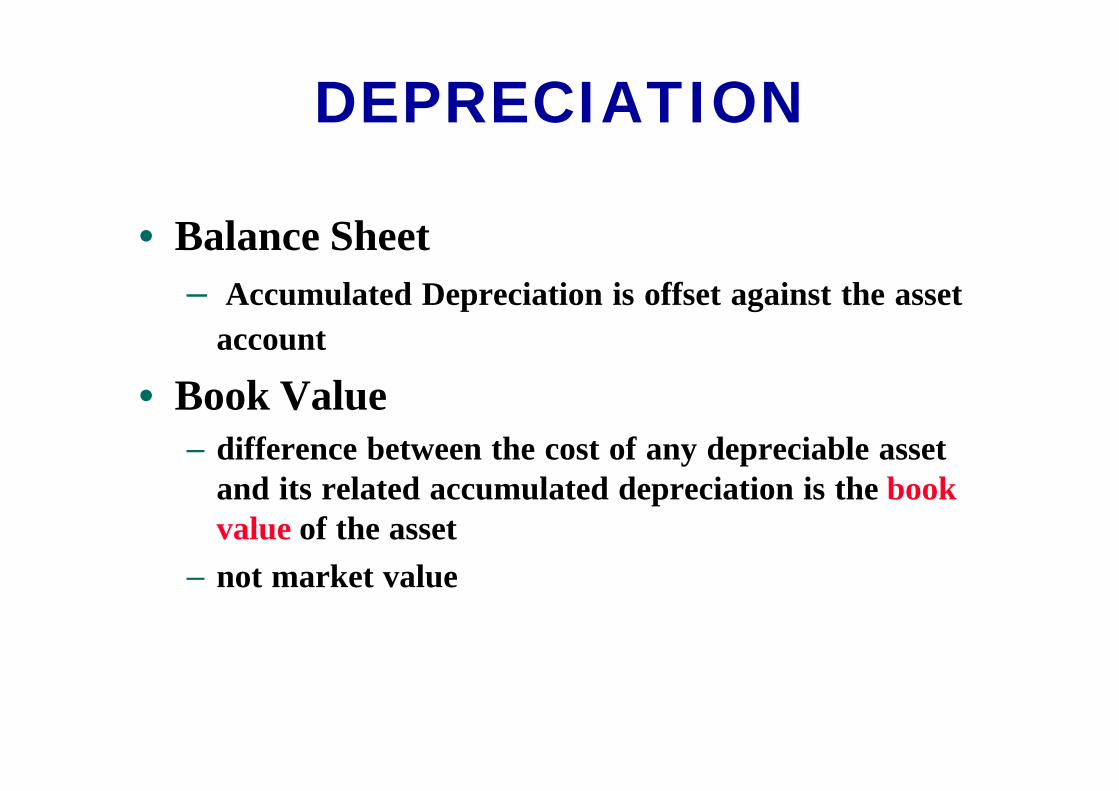
• Balance Sheet
– Accumulated Depreciation is offset against the asset
account
• Book Value– difference between the cost of any depreciable asset
and its related accumulated depreciation is the book value of the asset
– not market value
DEPRECIATION

ADJUSTING ENTRIES FOR PREPAYMENTS
DEPRECIATION
Accumulated Depreciation -Office Equipment
Oct. 31 40
Date Account Titles and Explanation Debit CreditOct. 31 Depreciation Expense 40
Accumulated Depreciation - Office Equipment 40(To record monthly depreciation)
JOURNAL ENTRYJOURNAL ENTRY
POSTINGPOSTING
ADJUSTMENTADJUSTMENT October 31, depreciation on the office equipment is estimated to be $480 a year, or $40 per month.
Depreciation ExpenseOct. 31 40

• Unearned revenues
– revenues received and recorded as liabilities before they are earned
• Unearned revenues
– earned by rendering a service to a customer
• A liability-revenue account relationship exists with unearned revenues
UNEARNED REVENUES

• Prior to adjustment
– liabilities are overstated and revenues are
understated
• Adjusting entry
– debit to a liability account
– credit to a revenue account
• Examples
– rent, magazine subscriptions and customer deposits for future services
UNEARNED REVENUES

ADJUSTING ENTRIES FOR PREPAYMENTS UNEARNED
REVENUES
Service Revenue
Oct. 31 10,000 31 400
Unearned Revenue
Oct. 31 400 Oct. 2 1,200
31 800
JOURNAL ENTRYJOURNAL ENTRY
POSTINGPOSTING
ADJUSTMENTADJUSTMENT October 31, analysis reveals that, of $1,200 in fees, $400 has been earned in October.
Date Account Titles and Explanation Debit Credit Oct. 31 Unearned Revenue 400
Service Revenue 400 (To record revenue for services provided)

ACCRUALSSTUDY OBJECTIVE STUDY OBJECTIVE 66
• Second category of adjusting entries is accruals
• Adjusting entries
– required to record revenues earned and expenses incurred in the current period
• Adjusting entry for accruals
– increase both a balance sheet and an income statement account

Adjusting Entries
Asset
Debit Adjusting Entry (+)
Accrued Revenues
Revenue
Credit Adjusting Entry (+)
Accrued Expenses
Expense
Debit Adjusting Entry (+)
Liability
Credit Adjusting Entry (+)
ADJUSTING ENTRIES FOR ACCRUALS

• Accrued revenues– accumulate with the passing of time or through
services performed but not billed or collected
– An asset-revenue account relationship exists
– Prior to adjustment, assets and revenues are understated
• Adjusting entry – debit an asset account
– credit a revenue account
ACCRUED REVENUES

ADJUSTING ENTRIES FOR ACCRUALS
ACCRUED REVENUES
Service Revenue
Oct. 31 10,000 31 400 31 200
31 10,600
Date Account Titles and Explanation Debit Credit Oct. 31 Accounts Receivable 200
Service Revenue 200 (To accrue revenue for services provided)
October 31, the agency earned $200 for advertising services that were not billed to clients before October 31.
JOURNAL ENTRYJOURNAL ENTRY
POSTINGPOSTING
ADJUSTMENTADJUSTMENT
Accounts ReceivableOct. 31 200

• Accrued expenses – Expenses incurred but not paid yet
– A liability-expense account relationship exists
– Prior to adjustment, liabilities and expenses are understated
• Adjusting Entry – debit an expense account
– credit a liability account
ACCRUED EXPENSES
ADJUSTING ENTRIES FOR ACCRUALS
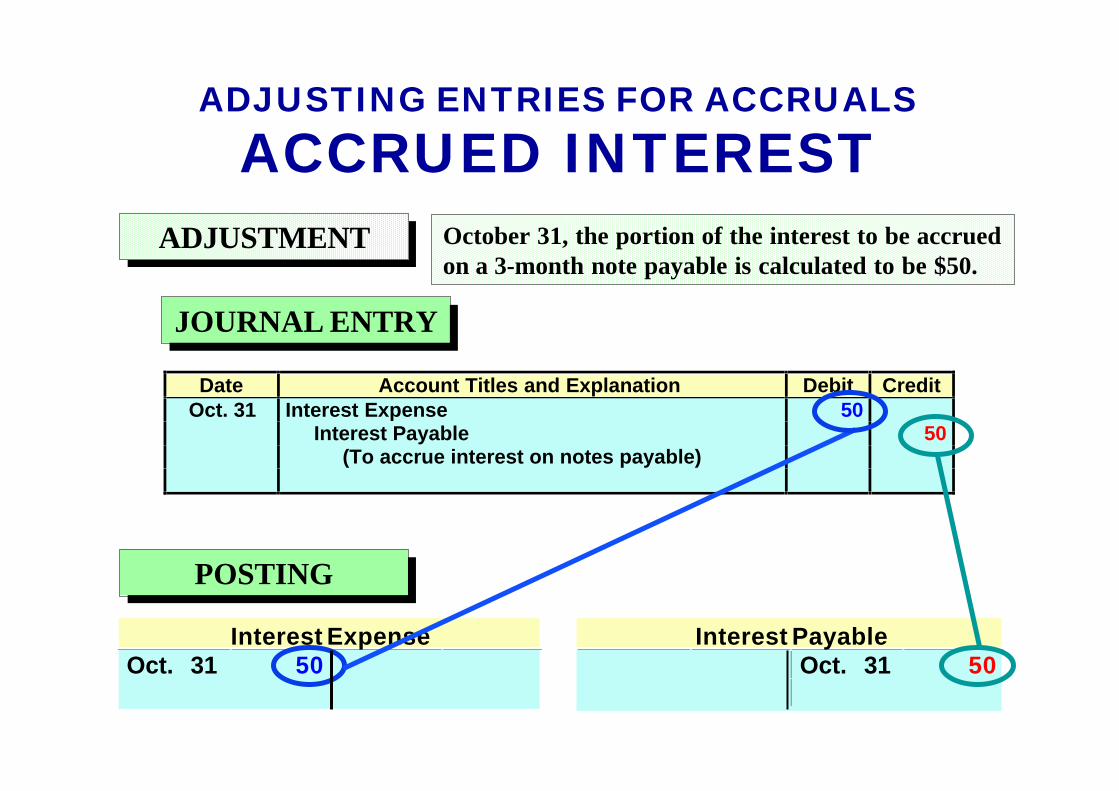
ACCRUED INTEREST
Interest PayableOct. 31 50
Interest ExpenseOct. 31 50
Date Account Titles and Explanation Debit Credit Oct. 31 Interest Expense 50
Interest Payable 50 (To accrue interest on notes payable)
JOURNAL ENTRYJOURNAL ENTRY
POSTINGPOSTING
ADJUSTMENTADJUSTMENT October 31, the portion of the interest to be accrued on a 3-month note payable is calculated to be $50.

ADJUSTING ENTRIES FOR ACCRUALS
ACCRUED SALARIES
Salaries PayableOct. 31 1,200
Date Account Titles and Explanation Debit Credit Oct. 31 Salaries Expense 1,200
Salaries Payable 1,200 (To record accrued salaries)
JOURNAL ENTRYJOURNAL ENTRY
POSTINGPOSTING
ADJUSTMENTADJUSTMENT October 31, accrued salaries are calculated to be $1,200.
Salaries ExpenseOct. 26 4,000 31 1,200 31 5,200

SUMMARY OF ADJUSTING ENTRIES
1 Prepaid Assets and Assets overstated Dr. Expenses expenses expenses Expenses understated Cr. Assets
2 Unearned Liabilities and Liabilities overstated Dr. Liabilities revenues revenues Revenues understated Cr. Revenues
3 Accrued Assets and Assets understated Dr. Assets revenues revenues Revenues understated Cr. Revenues
4 Accrued Expenses and Expenses understated Dr. Expenses expenses liabilities Liabilities understated Cr. Liabilities
Type of Account Accounts before Adjusting Adjustment Relationship Adjustment Entry

Chapter 3
Which of the following statements concerning accrual-basis accounting is incorrect?
a. Accrual-basis accounting follows the revenue recognition principle.
b. Accrual-basis accounting is the method required by generally accepted accounting principles.
c. Accrual-basis accounting recognizes expenses when they are paid.
d. Accrual-basis accounting follows the matching principle.

Chapter 3
Which of the following statements concerning accrual-basis accounting is incorrect?
a. Accrual-basis accounting follows the revenue recognition principle.
b. Accrual-basis accounting is the method required by generally accepted accounting principles.
c. Accrual-basis accounting recognizes expenses when
they are paid.
d. Accrual-basis accounting follows the matching principle.

ADJUSTED TRIAL BALANCE
STUDY OBJECTIVE STUDY OBJECTIVE 77
• Adjusted Trial Balance – prepared after all adjusting entries have been
journalized and posted
– purpose is to prove equality of the total debit and credit balances in the ledger after adjustments have been made
• Financial statements– prepared directly from the adjusted trial balance

PIONEER ADVERTISING AGENCYAdjusted Trial Balance
October 31, 2005Before After
Adjustment Adjustment
Debit Credit Debit Credit
Cash $ 15,200 $ 15,200Accounts Receivable 200Advertising Supplies 2,500 1,000
Prepaid Insurance 600 550Office Equipment 5,000 5,000Accumulated Depreciation - Office Equipment $ 40Notes Payable $ 5,000 5,000Accounts Payable 2,500 2,500Interest Payable 50Unearned Revenue 1,200 800Salaries Payable 1,200C. R. Byrd, Capital 10,000 10,000
C. R. Byrd, Drawing 500 500Service Revenue 10,000 10,600Salaries Expense 4,000 5,200Advertising Supplies Expense 1,500Rent Expense 900 900Insurance Expense 50Interest Expense 50Depreciation Expense 40
$ 28,700 $ 28,700 $ 30,190 $ 30,190
TRIAL BALANCE AND ADJUSTED TRIAL BALANCE COMPARED

PREPARING FINANCIAL STATEMENTS
Financial statements are prepared directly from the adjusted trial balance
• Income statement– use the revenue and expense accounts
• Owner’s Equity Statement– use the owner’s capital and drawing accounts and the net income
(or net loss) from the Income Statement
• Balance sheet – use asset and liability accounts and ending owner’s capital
balance reported in Owner’s Equity Statement

PIONEER ADVERTISING AGENCYAdjusted Trial Balance
October 31, 2005
Debit Credit
Cash $ 15,200
Accounts Receivable 200Advertising Supplies 1,000Prepaid Insurance 550
Office Equipment 5,000Accumulated Depreciation - Office Equipment $ 40Notes Payable 5,000
Accounts Payable 2,500Interest Payable 50
Unearned Revenue 800Salaries Payable 1,200
C. R. Byrd, Capital 10,000C. R. Byrd, Drawing 500
Service Revenue 10,600Salaries Expense 5,200
Advertising Supplies Expense 1,500Rent Expense 900
Insurance Expense 50Interest Expense 50
Depreciation Expense 40
$ 30,190 $ 30,190
PREPARATION OF THE INCOME STATEMENT AND THE OWNER’S EQUITY STATEMENT FROM
THE ADJUSTED TRIAL BALANCE
PREPARATION OF THE INCOME STATEMENT AND THE OWNER’S EQUITY STATEMENT FROM THE
ADJUSTED TRIAL BALANCE
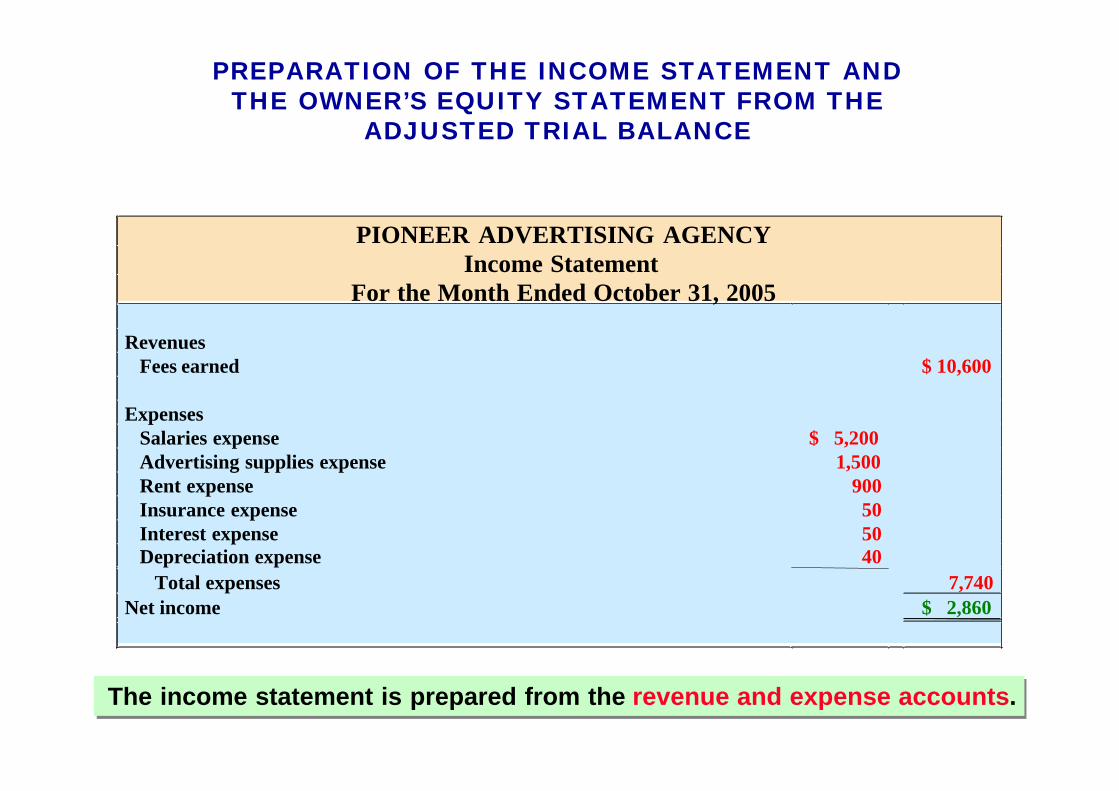
PIONEER ADVERTISING AGENCYIncome Statement
For the Month Ended October 31, 2005
RevenuesFees earned $ 10,600
ExpensesSalaries expense $ 5,200Advertising supplies expense 1,500Rent expense 900Insurance expense 50Interest expense 50Depreciation expense 40
Total expenses 7,740Net income $ 2,860
The income statement is prepared from the revenue and expense accounts.The income statement is prepared from the revenue and expense accounts.

PIONEER ADVERTISING AGENCYAdjusted Trial Balance
October 31, 2005
Debit Credit
Cash $ 15,200Accounts Receivable 200Advertising Supplies 1,000Prepaid Insurance 550Office Equipment 5,000Accumulated Depreciation – Office Equipment $ 40Notes Payable 5,000Accounts Payable 2,500Interest Payable 50Unearned Revenue 800Salaries Payable 1,200C. R. Byrd, Capital 10,000C. R. Byrd, Drawing 500Service Revenue 10,600Salaries Expense 5,200Advertising Supplies Expense 1,500Rent Expense 900Insurance Expense 50Interest Expense 50Depreciation Expense 40
$ 30,190 $ 30,190
PREPARATION OF THE INCOME STATEMENT AND THE OWNER’S EQUITY STATEMENT FROM THE ADJUSTED
TRIAL BALANCE

PREPARATION OF THE INCOME STATEMENT AND THE OWNER’S EQUITY STATEMENT FROM THE ADJUSTED
TRIAL BALANCE
PIONEER ADVERTISING AGENCYOwner’s Equity Statement
For the Month Ended October 31, 2005
C.R. Byrd, Capital, October 1 $ -0-Add: Investments $ 10,000
Net income 2,860 12,86012,860
Less: Drawings 500C.R . Byrd, Capital, October 31 $ 12,360
The owner’s equity statement is prepared from the owner’s capital and drawing accounts and the net income (or net loss) shown in the income statement.

PIONEER ADVERTISING AGENCYAdjusted Trial Balance
October 31, 2005
Debit Credit
Cash $ 15,200Accounts Receivable 200Advertising Supplies 1,000Prepaid Insurance 550Office Equipment 5,000Accumulated Depreciation – Office Equipment $ 40Notes Payable 5,000Accounts Payable 2,500Interest Payable 50Unearned Revenue 800Salaries Payable 1,200C. R. Byrd, Capital 10,000C. R. Byrd, Drawing 500Service Revenue 10,600Salaries Expense 5,200Advertising Supplies Expense 1,500Rent Expense 900Insurance Expense 50Interest Expense 50Depreciation Expense 40
$ 30,190 $ 30,190
PREPARATION OF THE BALANCE SHEET FROM THE ADJUSTED TRIAL BALANCE

PREPARATION OF THE BALANCE SHEET FROM THE ADJUSTED TRIAL BALANCE
PIONEER ADVERTISING AGENCYBalance Sheet
October 31, 2005
Assets Liabilities and Owner’s Equity
Cash $ 15,200 LiabilitiesAccounts receivable 200 Notes payable $ 5,000Advertising supplies 1,000 Accounts payable 2,500Prepaid insurance 550 Interest payable 50Office equipment $ 5,000 Unearned fees 800Less: Accumulated Salaries payable 1,200
depreciation 40 4,960 Total liabilities 9,550Owner’s equity
C.R. Byrd, Capital 12,360Total liabilities and owner’s
Total assets $ 21,910 equity $ 21,910
The balance sheet is then prepared from the asset and liability accounts and the ending owner’s capital balance as reported in the owner’s equity
statement.

ALTERNATIVE TREATMENTOF PREPAID EXPENSES AND
UNEARNED REVENUES
• Alternative treatment uses Income Statement accounts initially
– Debit the expense for prepaid expenses when cash is paid
– Credit the revenue at the time cash is received
• After adjustments, alternative treatment of prepaid expenses and unearned revenues will result in the same effect to financial statements as the initial entries to the balance sheet accounts STUDY OBJECTIVE STUDY OBJECTIVE 88

ALTERNATIVE ADJUSTMENTS FOR PREPAYMENTS SUPPLIES
Advertising Supplies Expense Oct. 5 2,500 Oct. 31 1,000 31 1,500
Advertising SuppliesOct. 31 1,000
Date Account Titles and Explanation Debit Credit Oct. 31 Advertising Supplies 1,000
Advertising Supplies Expense 1,000 (To record supplies inventory)
JOURNAL ENTRYJOURNAL ENTRY
POSTINGPOSTING
ADJUSTMENTADJUSTMENT October 31, an inventory count reveals that $1,000 of $2,500 of supplies are still on hand.

ALTERNATIVE ADJUSTMENTS FOR PREPAYMENTS
UNEARNED REVENUESALTERNATIVE ADJUSTMENTS FOR PREPAYMENTS
UNEARNED REVENUES
Service Revenue
Oct. 31 800 Oct. 2 1,200
31 400
Date Account Titles and Explanation Debit Credit Oct. 31 Service Revenue 800
Unearned Revenue 800 (To record unearned revenue)
JOURNAL ENTRYJOURNAL ENTRY
POSTINGPOSTING
ADJUSTMENTADJUSTMENT October 31, analysis reveals that, of $1,200 in fees, $400 has been earned in October.
Unearned Revenue
Oct. 31 800

SUMMARY OF BASIC RELATIONSHIPS FOR PREPAYMENTS
1 Prepaid Assets and a Prepaid expenses Assets overstated Dr Expenses Expenses Expenses initially recorded in Expenses understated Cr Assets
asset accounts have been used.
b Prepaid expenses Assets understated Dr Assets initially recorded in Expenses overstated Cr Expenses
expense accounts have not been used.
2 Unearned Liabilities and a Unearned revenues Liabilities overstated Dr Liabilities Revenues Revenues initially recorded in Revenues understated Cr Revenues
liability accountshave been earned.
b Unearned revenues Liabilities understated Dr Revenuesinitially recorded in Revenues overstated Cr Liabilities
revenue accountshave not been earned.
Type of Account Reason for Account Balances Adjusting Adjustment Relationship Adjustment before Adjustment Entry

Chapter 3
Which of the statements below is not true?
1. An adjusted trial balance should show ledger account balances.
2. An adjusted trial balance can be used to prepare financial statements.
3. An adjusted trial balance proves the mathematical equality of debits and credits in the ledger.
4. An adjusted trial balance is prepared before all transactions have been posted from the journal.

John Wiley & Sons, Inc. © 2005
Chapter 4Chapter 4
Completion of the Accounting Cycle
Prepared by Naomi KarolinskiPrepared by Naomi KarolinskiMonroe Community CollegeMonroe Community College
andand
Marianne BradfordMarianne BradfordBryant CollegeBryant College
Accounting Principles, 7Accounting Principles, 7thth EditionEdition
Weygandt Weygandt •• Kieso Kieso •• KimmelKimmel

After studying this chapter, you should be able to:
1 prepare a work sheet
2 explain the process of closing the books
3 describe the content and purpose of a post-closing trial balance
4 state the required steps in the accounting cycle
5 explain the approaches to preparing correcting entries
6 identify the sections of a classified balance sheet
CHAPTER 4 COMPLETION OF THE ACCOUNTING CYCLE

• Work Sheet
– multiple-column form used for the adjustment process and preparing financial statements
– a working tool for the accountant
– not a permanent accounting record
• Work Sheet
– makes preparation of adjusting entries and financial statements easier
WORK SHEETSTUDY OBJECTIVE STUDY OBJECTIVE 11

FORM AND PROCEDURE FOR A WORK SHEET

• Work sheet– is not a permanent accounting record
• When used– financial statements are prepared from
the work sheet
– adjustments are journalized and posted from the work sheet after financial statements
WORK SHEET

STEPS IN PREPARING A WORK SHEET
1 prepare trial balance
2 enter adjustments in the adjustments columns
3 enter adjusted balances in adjusted trial balance columns
4 extend adjusted trial balance amounts to appropriate financial statement columns
5 total the statement columns, compute net income (loss), and complete the work sheet

PREPARING A WORK SHEET 1 PREPARING A TRIAL BALANCE
PIONEER ADVERTISING AGENCYWork Sheet
For the Month Ended October 31, 200 5Adjusted
Trial Balance Adjustments Trial Balance
Account Titles Dr. Cr. Dr. Cr. Dr. Cr.
Cash
Advertising SuppliesPrepaid Insurance
Office Equipment quipmentNotes PayableAccounts PayableUnearned RevenueC.R. Byrd, CapitalC.R. Byrd, Drawing
Service Revenue
Salaries ExpenseRent Expense
Totals
.
0015,200
0002,500
0000600
0005,000
5,000
2,500
1,200
000010,000
0000500
10,000
0004,000
0000900
0028,700 28,700

PREPARING A WORK SHEET 2 ENTER THE ADJUSTMENTS
PIONEER ADVERTISING AGENCYWork Sheet
For the Month Ended October 31, 2005Adjusted
Trial Balance Adjustments Trial Balance
Account Titles Dr. Cr. Dr. Cr. Dr. Cr.
Cash 15,200Advertising Supplies 2,500Prepaid Insurance 600Office Equipment 5,000
Notes Payable 5,000Accounts Payable 2,500Unearned Revenue 1,200C.R. Byrd, Capital 10,000C.R. Byrd, Drawing 500Service Revenue 10,000
Salaries Expense 4,000Rent Expense 900
Totals 28,700 28,700
Advertising Supplies Expense
Insurance ExpenseAccum. Depr – Off Equip—Depreciation Expense
Accounts ReceivableInterest Expense
Interest Payable
Salaries PayableTotals 3,440 3,440
a 1,500
b 50
d 400
d 400
e 200
g 1,200
a 1,500
b 50
c 40
c 40
e 200
f 50
f 50
g 1,200

PREPARING A WORK SHEET 3 ENTER ADJUSTED BALANCES
PIONEER ADVERTISING AGENCYWork Sheet
For the Month Ended October 31, 2005Adjusted
Trial Balance Adjustments Trial Balance
Account Titles Dr. Cr. Dr. Cr. Dr. Cr.
Cash 15,200 15,2001,000
5505,000
500
5,200900
1,50050
4050
200
5,0002,500
80010,000
10,600
40
501,200
Advertising Supplies 2,500 a 1,500Prepaid Insurance 600 b 50Office Equipment 5,000
Notes Payable 5,000Accounts Payable 2,500Unearned Revenue 1,200 d 400C.R. Byrd, Capital 10,000C.R. Byrd, Drawing 500Service Revenue 10,000 d 400
e 200
Salaries Expense 4,000 g 1,200Rent Expense 900
Totals 28,700 28,700
Advertising Supplies Expense a 1,500Insurance Expense b 50Accum. Depr – Off Equip— c 40Depre ciation Expense c 40Interest Expense f 50
Accounts Receivable e 200
Interest Payable f 50Salaries Payable g 1,200
Totals 3,440 3,440 30,190 30,190

PREPARING A WORK SHEET 4 EXTEND ADJUSTED BALANCES
PIONEER ADVERTISING AGENCYWork Sheet
For the Month Ended October 31, 200 5Adjusted Income
Trial Balance Statement Balance Sheet
Account Titles Dr. Cr. Dr. Cr. Dr. Cr.
Cash 15,200Advertising Supplies 1,000
Prepaid Insurance 550Office Equipment 5,000
Notes Payable 5,000
Accounts Payable 2,500
Unearned Revenue 800
C.R. Byrd, Capital 10,000
C.R. Byrd, Drawing 500
Service Revenue 10,600
Salaries Expense 5,200Rent Expense 90 0
Advertising Supplies Expense 1,500
Insurance Expense 50
Accum. Depr. — Office Equip. 40
Depreciation Expense 40
Interest Expense 50
Accounts Receivable 200
Interest Payable 50Salaries Payable 1,20 0
Totals 30,190 30,190 7,740 10,600
Net Income 2,860
Totals 10,600 10,600
10,600.0
5,200.0 0000000
900.00000000
1,500.000000000
50.0000000
40
550

PREPARING A WORK SHEET 4 EXTEND ADJUSTED BALANCES
PIONEER ADVERTISING AGENCYWork Sheet
For the Month Ended October 31, 2005Adjusted Income
Trial Balance Statement Balance Sheet
Account Titles Dr. Cr. Dr. Cr. Dr. Cr.
Cash 15,200
Advertising Supplies 1,000Prepaid Insurance 550
Office Equipment 5,000
Notes Payable 5,000Accounts Payable 2,500
Unearned Revenue 800C.R. Byrd, Capital 10,000
C.R. Byrd, Drawing 500
Service Revenue 10,600 10,600Salaries Expense 5,200 5,200
Rent Expense 900 900Advertising Supplies Expense 1,500 1,500
Insurance Expense 50 50
Accum. Depr. — Office Equip. 40Depreciation Expense 40 40
Interest Expense 50 50Accounts Receivable 200
Interest Payable 50
Salaries Payable 1,200
Totals 30,190 30,190 7,740 10,600 22,450 19,590
Net Income 2,860 2,860
Totals 10,600 10,600 22,450 22,450
15,200
1,000
5 550
5,000
5,000
2,500
800
10,000
5500
40
200
50
1,200

ADJUSTING ENTRIES JOURNALIZED
GENERAL JOURNALDate Account Titles and Explanation Ref. Debit Credit2005 a
Oct. 31
b31
c31
d31
e31
f31
g31
Advertising Supplies Expense 1,500
Advertising Supplies 1,500
Insurance Expense 50
Prepaid Insurance 50Depreciation Expense 40
Accumulated Expense 40
Unearned Fees 400
Fees Earned 400
Accounts Receivable 200
Fees Earned 200Interest Expense 50
Interest Payable 50
Salaries Expense 1,200
Salaries Payable 1,200

PREPARATION OF FINANCIAL STATEMENTS
INCOME STATEMENTPIONEER ADVERTISING AGENCY
Income StatementFor the Month Ended October 31, 2005
RevenuesService revenue
ExpensesSalaries expenseAdvertising supplies expenseRent expenseInsurance expenseInterest expenseDepreciation expense
Total expenses
Net income
The income statement is prepared from the income statement columns of the
work sheet.
$10,600
$5,2001,500
900505040
7,740$ 2,860

PREPARATION OF FINANCIAL STATEMENTS
OWNER’S EQUITY STATEMENT
PIONEER ADVERTISING AGENCYOwner’s Equity Statement
For the Month Ended October 31, 2005
C.R. Byrd, Capital, October 1Add: Investments
Net income
Less: Drawings
C.R. Byrd, Capital, October 31
The owner’s equity statement is prepared from the balance sheet columns
of the work sheet.
$ -0-$10,000
2,860 12,86012,860
500$12,360

PREPARATION OF FINANCIAL STATEMENTS
BALANCE SHEET
The balance sheet is prepared from the balance sheet columns of the work sheet.
PIONEER ADVERTISING AGENCY Balance Sheet October 31, 2005 Assets Liabilities and Owner’s Equity Cash Liabilities Accounts receivable Notes payable Advertising supplies Accounts payable Prepaid insurance Interest payable Office equipment Unearned revenue Less: Accumulated Salaries payable
depreciation Total liabilities
Owner’s equity C.R. Byrd, Capital
Total liabilities and owner’s Total assets equity
$ 15,200
200
1,000
550
$5,000
40 4,960
$21,910
$ 5,000
2,500
50
800
1,200
9,550
12,360
$21,910

Chapter 4
A work sheet can be thought of as a(n)
a. permanent accounting record
b. optional device used by accountants
c. part of the general ledger
d. part of the journal

Chapter 4
A work sheet can be thought of as a(n)
a. permanent accounting record
b. optional device used by accountants
c. part of the general ledger
d. part of the journal

TEMPORARY VERSUS PERMANENT ACCOUNTS
STUDY OBJECTIVE STUDY OBJECTIVE 22
TEMPORARY (NOMINAL) PERMANENT (REAL) These accounts are closed These accounts are not closed
All revenue accounts All asset accounts
All expense accounts All liability accounts
Owner’s drawing Owner’s capital account

CLOSING ENTRIES
• Closing entries– Formally transfers net income (loss) and owner’s
drawings to owner’s capital
– Journalizing and posting is a required step in the accounting cycle
• Income Summary– A temporary account
– Used in closing revenue and expense accounts
– Minimizes the details in the permanent owner’s capital account

DIAGRAM OF CLOSING PROCESSPROPRIETORSHIP
INCOME SUMMARY
(INDIVIDUAL)REVENUES
12
1 Debit each revenue account for its balance, and credit Income Summary for total revenues.
2 Debit Income Summary for total expenses, and credit each expense account for its balance.
1 Debit each revenue account for its balance, and credit Income Summary for total revenues.
2 Debit Income Summary for total expenses, and credit each expense account for its balance.
(INDIVIDUAL)EXPENSES

DIAGRAM OF CLOSING PROCESS
3
3 Debit (credit) Income Summary and credit (debit) owner’s capital for the amount of net income (loss).
3 Debit (credit) Income Summary and credit (debit) owner’s capital for the amount of net income (loss).
INCOME SUMMARY
OWNER’SCAPITAL

DIAGRAM OF CLOSING PROCESSDIAGRAM OF CLOSING PROCESS
4
4 Debit owner’s capital for the balance in the owner’s drawing account and credit owner’s drawing for the same amount.
4 Debit owner’s capital for the balance in the owner’s drawing account and credit owner’s drawing for the same amount.
OWNER’SCAPITAL
OWNER’S DRAWING

CLOSING ENTRIES JOURNALIZED
CLOSING ENTRIES JOURNALIZED
SERVICE REVENUE No. 350
Date Explanation Debit Credit Balance
2002 Oct. 31 10,600
–0–
INCOME SUMMARY No. 400
Date Explanation Debit Credit Balance
2002 Oct. 31 10,60010,600
10,600
GENERAL JOURNAL
Date Account Titles and Explanation Ref. Debit Credit 2005 Oct. 31 Service Revenue 400 10,600 Income Summary 350 10,600 (To close revenue account)

CLOSING ENTRIES JOURNALIZED
CLOSING ENTRIES JOURNALIZED
INCOME SUMMARY No. 350
Date Explanation Debit Credit Balance
2002 Oct. 31 10,600 10,600 31 2,860
7,7405,2001,500
900505040
GENERAL JOURNAL
Date Account Titles and Explanation Ref. Debit Credit 2005 Oct. 31 Income Summary 350 Salaries Expense 726 Advertising Supplies Expense 631 Rent Expense 729 Insurance Expense 722 Interest Expense 905 Depreciation Expense 911 (To close expense accounts)
7,740

CLOSING ENTRIES JOURNALIZEDCLOSING ENTRIES JOURNALIZED
C. R. BYRD, CAPITAL No. 301
Date Explanation Debit Credit Balance
2002 Oct. 31 10,000 10,000 31 12,860
INCOME SUMMARY No. 350 Date Explanation Debit Credit Balance 2005 Oct. 31 10,600 10,600 31 7,740 2,860 31 2,860 –0–
GENERAL JOURNAL
Date Account Titles and Explanation Ref. Debit Credit 2005 (3) Oct. 31 Income Summary 350 2,860 C. R. Byrd, Capital 301 2,860 (To close net income to capital)
2,860

CLOSING ENTRIES JOURNALIZED
CLOSING ENTRIES JOURNALIZED
C. R. BYRD, CAPITAL No. 301
Date Explanation Debit Credit Balance
2002 Oct. 31 10,000 10,000 31 12,860 31 12,360
C. R. BYRD, DRAWING No. 350 Date Explanation Debit Credit Balance 2005 Oct. 31 500 500 31 –0–
500 500
GENERAL JOURNALDate Account Titles and Explanation Ref. Debit Credit
2005 (4)Oct. 31 C. R. Byrd, Capital 350
C. R. Byrd, Drawing 301(To close net income tocapital)
500500

CAUTIONS RELATING TO CLOSING ENTRIES
Caution:
•Avoid doubling revenue and expense balances
•Owner’s Drawing does not move to the Income Summary account. Owner’s drawing is not an expense and it is not a factor in determining net income.

POSTING CLOSING ENTRIES
• Temporary accounts– All temporary accounts will have zero balances after posting
the closing entries
– Temporary accounts (revenues and expenses) are totaled, balanced and double ruled
• Owner’s capital – Total equity of the owner at the end of the accounting period
– No entries are journalized and posted to owner’s capital during the year
• Permanent accounts (assets, liabilities, and owner’s capital) not closed

Depreciation Expense 711
40 (2) 40
Interest Expense 905
50 (2) 50
Insurance Expense 722
50 (2) 50
Rent Expense 729
900 (2) 900
Advertising SuppliesExpense
631
1,500 (2) 1,500
Salaries Expense 726
4,000 (2) 5,2001,200
5,200 5,200
2
2
C. R. Byrd, Drawing 306
500 (4) 500
C. R. Byrd, Capital 301
(4) 500 10,000(3) 2,860
12,360
Income Summary 350
(2) 7,740 (1) 10,600(3) 2,860
10,600 10,600
Service Revenue 400
(1) 10,600 10,000400200
10,600 10,600
4
3
1
POSTING OF CLOSING ENTRIES

POST-CLOSING TRIAL BALANCESTUDY OBJECTIVE STUDY OBJECTIVE 33
After all closing entries have been journalized the post-closing trial balance is prepared from the ledger.
The purpose of this trial balance is to prove the equality of the permanent account balances that are carried forward into the next accounting period.

POST-CLOSING TRIAL BALANCE
POST-CLOSING TRIAL BALANCE

1 Analyze business transactions
2 Journalize the transactions
3 Post to ledger accounts
4 Prepare a trial balance
5 Journalize and post adjusting entries
STEPS IN THE ACCOUNTING CYCLE
STUDY OBJECTIVE STUDY OBJECTIVE 44

6 Prepare an adjusted trial balance
7 Prepare financial statements: Income Statement, Owner’s Equity Statement, Balance Sheet
8 Journalize and post closing entries
9 Prepare a post-closing trial balance
STEPS IN THE ACCOUNTING CYCLE

• Reversing entry – Made at the beginning of the next
accounting period
– Purpose is to simplify the recording of a subsequent transaction related to an adjusting entry
– Most often used to reverse two types of adjusting entries: accrued revenues and accrued expenses
REVERSING ENTRIES

ILLUSTRATIVE EXAMPLE OF REVERSING ENTRY

CORRECTING ENTRIESSTUDY OBJECTIVE STUDY OBJECTIVE 55
• Correcting Entries– errors should be corrected as soon as discovered
– correcting entries are unnecessary if records are free of errors
– can be journalized and posted whenever an error is discovered
– involve any combination of balance sheet and income statement accounts

ILLUSTRATIVE EXAMPLE OF
CORRECTING ENTRY 1
Incorrect Entry May 10
(To record collection from customer an account)
Correct Entry 10
(To record collection from customer an account)
Correcting Entry 20
(To correct entry of May 10)
Cash 50
Service Revenue 50
Cash 50
Accounts Receivable 50
Service Revenue 50
Accounts Receivable 50

ILLUSTRATIVE EXAMPLE OF
CORRECTING ENTRY 2
Incorrect Entry May 18
(To record purchase of equipment on account)
Correct Entry 18
(To record purchase of equipment on account)
Correcting Entry June 3
(To correct entry of May 18)
Delivery Equipment 45Accounts Payable 45
Office Equipment 450Accounts Payable 450
Office Equipment 450Delivery Equipment 45Accounts Payable 405

Chapter 4
The closing entry process consists of closing
a. all asset and liability accounts
b. out the owner's capital account
c. all permanent accounts
d. all temporary accounts

Chapter 4
The closing entry process consists of closing
a. all asset and liability accounts
b. out the owner's capital account
c. all permanent accounts
d. all temporary accounts

STANDARD BALANCE SHEET CLASSIFICATIONS
STUDY OBJECTIVESTUDY OBJECTIVE 66
Assets Liabilities and Owner’s Equity
• Financial statements become more useful when the elements are classified into significant subgroups.
• A classified balance sheet generally has the following standard classifications:
Current Assets Current Liabilities
Long-Term Investments Long-Term Liabilities
Property, Plant and Owner’s (Stockholders’) Equity Equipment
Intangible Assets

• Current assets– Cash and other resources that are reasonably expected to
be realized in cash or sold or consumed in the business within one year of the balance sheet date or the company’s operating cycle, whichever is longer
– Current assets are listed in the order of their liquidity
• Operating cycle of a company– This is the average time required to go from cash to cash
in producing revenues
• Examples– Inventory, accounts receivable and cash
CURRENT ASSETS

• Long-term investments– Resources which can be realized in cash
– Their conversion into cash is not expected within one year or the operating cycle, whichever is longer
• Examples– Investments in bonds of another company or
investment in land held for resale
XYZ stock
LONG-TERM INVESTMENTS

• Property, plant, and equipment
– Tangible resources, relatively permanent nature, used in the business, and not intended for sale
• Examples
– Land, buildings, and machinery
PROPERTY, PLANT, AND EQUIPMENT

• Intangible assets
– Non-current resources that do not have physical substance
• Examples
– Includes patents, copyrights, trademarks, or trade names, gives the holder exclusive right of use for a specified period of time
INTANGIBLE ASSETS

• Current liabilities– Obligations reasonably expected to be paid
from existing current assets or through the creation of other current liabilities within one year or the operating cycle, whichever is longer
• Examples– Accounts payable, wages payable, interest
payable and current maturities of long-term debt
CURRENT LIABILITIES
CURRENT LIABILITIES
Liquidity is the ability of a company to pay obligations that are expected to become due within the next year or operating cycle.

• Long-term liabilitiesObligations expected to be paid after one year
• Examples –Long-term notes payable, bonds
payable, mortgages payable, and lease liabilities
LONG-TERM LIABILITIES

• The content of the owner’s equity section – Varies with the form of business organization
• Proprietorship – A single owner’s equity account called
(Owner’s Name), Capital
• Partnership– Separate capital accounts for each partner
• Corporation– Called stockholders’ equity, and it consists of two
accounts: Capital Stock and Retained Earnings
OWNER’S EQUITY

CLASSIFIED BALANCE SHEET IN ACCOUNT FORM
A classified balance sheet 1 availability of assets to meet debts 2 claims of short- and long-term creditors on total assets
PIONEER ADVERTISING AGENCY
Balance Sheet
October 31, 2005
Assets Current assets Cash Accounts receivable Advertising supplies Prepaid insurance Total current assets Property, plant, and equipment Office equipment Less: Accumulated depreciation Total assets
$ 15,200200
1,000550
16,950
$5,000
40 4,960
$21,910

CLASSIFIED BALANCE SHEET IN REPORT FORM
CLASSIFIED BALANCE SHEET IN REPORT FORM
The balance sheet is most often presented in the report form, with the assets above liabilities and owner’s equity.
$ 1,0002,500
50800
1,2005,5504,000
9,550
12,360$21,910
Liabilities and Owner’s EquityCurrent liabilities
Notes payableAccounts payableInterest payableUnearned revenueSalaries payable
Total current liabilitiesLong-term liabilities
Notes payableTotal liabilities
Owner’s equityC. R. Byrd, Capital
Total liabilities and owner’s equity

Chapter 4
A current asset is
a. the last asset purchased by a business
b. an asset which is currently being used to produce a product or service
c. usually found as a separate classification in the income statement
d. expected to be realized in cash, sold or consumed within one year of the balance sheet or the company's operating cycle, whichever is longer

John Wiley & Sons, Inc. © 2005
Chapter 5Chapter 5
Accounting for Merchandising
Operations
Prepared by Naomi KarolinskiPrepared by Naomi KarolinskiMonroe Community CollegeMonroe Community College
andand
Marianne BradfordMarianne BradfordBryant CollegeBryant College
Accounting Principles, 7Accounting Principles, 7thth EditionEdition
Weygandt Weygandt •• Kieso Kieso •• KimmelKimmel

After studying this chapter, you should be able to:
1 identify the differences between a service enterprise and a merchandising company
2 explain the entries for purchases under a perpetual inventory system
3 explain the entries for sales revenues under a perpetual inventory system
4 explain the steps in the accounting cycle for a merchandising company
CHAPTER 5ACCOUNTING FOR MERCHANDISING
OPERATIONS

5 distinguish between a multiple-step and a single-step income statement
6 explain the computation and importance of gross profit
7 determine the cost of goods sold under a periodic system
CHAPTER 5ACCOUNTING FOR MERCHANDISING
OPERATIONS
After studying this chapter, you should be able to:

MERCHANDISING COMPANY
A merchandising company buys and sells goods to earn a profit.
1) Wholesalers sell to retailers
2) Retailers sell to consumers
Primary source of revenue is Sales

• Expenses for a merchandiser are divided into two categories:
1 Cost of goods sold
– The total cost of merchandise sold during the period
2 Operating expenses
– Expenses incurred in the process of earning sales revenue (Examples: sales salaries and insurance expense)
• Gross profit is equal to Sales Revenue less Cost of Goods Sold
MEASURING NET INCOME

INCOME MEASUREMENT PROCESS FOR A MERCHANDISING COMPANY

OPERATING CYCLES FOR A SERVICE COMPANY AND A MERCHANDISING
COMPANY

INVENTORY SYSTEMS
Merchandising entities may use either:
1) Perpetual InventoryDetailed records of the cost of each item are maintained, and the cost of each item sold is determined from records when the sale occurs.
2) Periodic InventoryCost of goods sold is determined only at the end of an accounting period.

PERPETUAL VS. PERIODIC

COST OF GOODS SOLD
To determine the cost of goods sold under a periodic inventory system:
1) Determine the cost of goods on hand at the beginning of the accounting period,
2) Add to it the cost of goods purchased, and
3) Subtract the cost of goods on hand at the end of the accounting period.

• Merchandise is purchased for resale to customers, the account
– Merchandise Inventory is debited for the cost of goods.
• Like sales, purchases may be made for cash or on account (credit).
• The purchase is normally recorded by the purchaser when the goods are received from the seller.
• Each credit purchase should be supported by a purchase invoice.
PURCHASES OF MERCHANDISESTUDY OBJECTIVESTUDY OBJECTIVE 22

PURCHASES OF MERCHANDISE
SALES INVOICE

PURCHASES OF MERCHANDISE
For purchases on account, Merchandise Inventory is debited and Accounts Payable is credited.
GENERAL JOURNAL
Date Account Titles and Explanation Dr. Cr.
May 4 Merchandise Inventory Accounts Payable (To record goods purchased on account, terms 2/10, n/30, from Sellers Electronix)
3,8003,800

• A purchaser may be dissatisfied with merchandise received because the goods:
1) are damaged or defective,
2) are of inferior quality, or
3) are not in accord with the purchaser’s specifications.
• The purchaser initiates the request for a reduction of the balance due through the issuance of a debit memorandum (purchaser’s debit decreases A/P!).
• The debit memorandum is a document issued by a buyer to inform a seller that the seller’s account has been debited because of unsatisfactory merchandise.
PURCHASE RETURNS AND ALLOWANCES

PURCHASE RETURNS AND ALLOWANCES
For purchases returns and allowances, Accounts Payable is debited and Merchandise Inventory is credited.
GENERAL JOURNAL
Date Account Titles and Explanation Dr. Cr. May 8 Accounts Payable Merchandise Inventory (To record return of inoperable goods received from Sellers Electronix, DM No. 126)
300300

A sales agreement should indicate whether the seller or the buyer is to pay the cost of transporting the goods to the buyer’s place of business.
• FOB Shipping Point
1) Goods placed free on board the carrier by seller
2) Buyer pays freight costs
• FOB Destination
1) Goods placed free on board at buyer’s business
2) Seller pays freight costs
FREE ON BOARD

• Merchandise Inventory is debited if buyer pays freight.
• Freight-out (or Delivery Expense) is debited if seller pays freight.
ACCOUNTING FOR FREIGHT COSTS

ACCOUNTING FOR FREIGHT COSTS
When the purchaser directly incurs the freight costs, the account Merchandise Inventory is debited and Cash is credited.
GENERAL JOURNALDate Account Titles and Explanation Dr. Cr.
May 6 Merchandise Inventory Cash (To record payment of freight, terms FOB shipping point)
150150

ACCOUNTING FOR FREIGHT COSTS
Freight costs incurred by the seller on outgoing merchandise are debited to Freight-out (or Delivery Expense) and Cash is credited.
GENERAL JOURNALDate Account Titles and Explanation Dr. Cr.
May 4 Freight-out (Delivery Expense) Cash (To record payment of freight on goods sold FOB destination)
150150

PURCHASE DISCOUNTS
• Credit terms may permit the buyer to claim a cash discount for the prompt payment of a balance due.
• The buyer calls this discount a purchase discount.
• Like a sales discount, a purchase discount is based on the invoice cost less returns and allowances, if any.

PURCHASE DISCOUNTS
If payment is made within the discount period, Accounts Payable is debited, Cash is credited, and Merchandise inventory is credited for the discount taken.
GENERAL JOURNALDate Account Titles and Explanation Dr. Cr.
May 14 Accounts Payable Cash Merchandise Inventory (To record payment within discount period)
3,5003,430
70

PURCHASE DISCOUNTS
If payment is made after the discount period, Accounts Payable is debited and Cash is credited for the full amount.
GENERAL JOURNALDate Account Titles and Explanation Debit Credit
June 3 Accounts Payable Cash (To record payment with no discount taken)
3,5003,500

SAVINGS OBTAINED BY TAKING PURCHASE DISCOUNT
Discount of 2% on $3,500 $ 70.00 Interest received on $3,500 (for 20 days at 10%) ( 19.44)
Savings by taking the discount $ 50.56
A buyer should usually take all available discounts.
If Beyer Video takes the discount, it pays $70 less in cash.
If it forgoes the discount and invests the $3,500 for 20 days at 10% interest, it will earn only $19.44 in interest.
The savings obtained by taking the discount is calculated as follows:
• Revenues – (Revenue recognition principle)–Earned when the goods are transferred
from seller to buyer
• All sales should be supported by a document such as a cash register tape or sales invoice.
SALES TRANSACTIONSSTUDY OBJECTIVESTUDY OBJECTIVE 33

RECORDING CASH SALES
l For cash sales, Cash is debited and Sales is credited.l For the cost of goods sold for cash, Cost of Goods
Sold is debited and Merchandise Inventory is credited.
GENERAL JOURNALDate Account Titles and Explanation Dr. Cr.
May 4 Cash Sales (To record daily cash sales)
4 Cost of Goods Sold Merchandise Inventory (To record cost of merchandise sold for cash)
2,2002,200
1,4001,400

RECORDING CREDIT SALES
l For credit sales, Accounts Receivable is debited and Sales is credited.l For the cost of goods sold on account, Cost of Goods Sold is debited
and Merchandise Inventory is credited.
GENERAL JOURNAL
Date Account Titles and Explanation Dr. Cr. May 4 Accounts Receivable Sales (To record credit sales to Beyer Video per invoice #731) 4 Cost of Goods Sold Merchandise Inventory (To record cost of merchandise sold on invoice #731 to Beyer Video)
3,8003,800
2,4002,400

• Sales Returns – Customers dissatisfied with merchandise
and are allowed to return the goods to the seller for credit or a refund.
• Sales Allowances– Result when customers are dissatisfied and
the seller allows a deduction from the selling price.
SALES RETURNS AND ALLOWANCES

• Credit memorandum
– the seller prepares a form to inform the customer that a credit has been made to the customer’s account receivable
• Sales Returns and Allowances
– Contra revenue account to the Sales account
• The normal balance of Sales Returns and Allowances is a debit
SALES RETURNS AND ALLOWANCES

RECORDING SALES RETURNS AND ALLOWANCES
The seller’s entry to record a credit memorandum involves a debit to the Sales Returns and Allowances account and a credit to Accounts Receivable. The entry to record the cost of the returned goods involves a debit to Merchandise Inventory and a credit to Cost Goods Sold.
GENERAL JOURNAL
Date Account Titles and Explanation Dr. Cr. May 8 Sales Returns and Allowances Accounts Receivable (To record return of inoperable goods delivered to Beyer Video, per credit memorandum) 8 Merchandise Inventory Cost of Goods Sold (To record cost of goods returned per credit memorandum)
300300
140140

• Sales discount– Offer of a cash discount to a customer for the prompt
payment of a balance due
– Is a contra revenue account with a normal debit balance
• Example: Credit sale has the terms 3/10, n/30, a 3% discount is allowed if payment is made within 10 days. After 10 days there is no discount, and the balance is due in 30 days.
SALES DISCOUNTS

T E R M S E X P L A N A T I O N
CREDIT TERMSCREDIT TERMS
Credit terms specify the amount and time period for the cash discount
– Indicates the length of time in which the purchaser is expected to pay the full invoice price
2/10, n/30 A 2% discount may be taken if payment is madewithin 10 days of the invoice date.
1/10 EOM A 1% discount is available if payment is madeby the 10th of the next month.

RECORDING SALES DISCOUNTS
When cash discounts are taken by customers, the seller debits Sales Discounts.
GENERAL JOURNAL
Date Account Titles and Explanation Dr. Cr. May 14 Cash Sales Discounts Accounts Receivable (To record collection within 2/10, n/30 discount period from Beyer Video)
3,43070
3,500

CLOSING ENTRIESSTUDY OBJECTIVESTUDY OBJECTIVE 44
l Adjusting entries are journalized from the adjustment columns of the work sheet.
l All accounts that affect the determination of net income are closed to Income Summary.
l Data for the preparation of closing entries may be obtained from the income statement columns of the work sheet.
GENERAL JOURNAL
Date Account Titles and Explanation Debit Credit
2005 (1) Dec. 31 Sales Income Summary (To close income statement accounts with credit balances)
480,000480,000

CLOSING ENTRIES
Cost of Goods Sold is a new account that must be closed to Income Summary.
GENERAL JOURNAL
Date Account Titles and Explanation Debit Credit 2005 (2) Dec. 31 Income Summary 140,000 Sales Returns and Allowances 12,000 Sales Discounts 8,000 Cost of goods sold 316,000 Store Salaries Expense 45,000 Rent Expense 19,000 Freight-out 7,000 Advertising Expense 16,000 Utilities Expense 17,000 Depreciation Expense 8,000 Insurance Expense 2,000 (To close income statement accounts with debit balances)

CLOSING ENTRIES
l After the closing entries are posted, all temporary accounts have zero balances
l It addition, R. A. Lamb, Capital has a credit balance of $98,000 ($83,000 + $30,000 - $15,000).
GENERAL JOURNAL
Date Account Titles and Explanation Debit Credit 2005 (3) Dec. 31 Income Summary 30,000 R. A. Lamb, Capital 30,000 (To close net income to capital) (4) 31 R. A. Lamb, Capital 15,000 R. A. Lamb, Drawing 15,000 (To close drawings to capital)

Chapter5
Under a perpetual inventory system, acquisition of merchandise for resale is debited to the
a. purchases account
b. supplies account
c. merchandise inventory account
d. cost of goods sold account

Chapter5
Under a perpetual inventory system, acquisition of merchandise for resale is debited to the
a. purchases account
b. supplies account
c. merchandise inventory account
d. cost of goods sold account

• Includes sales revenue, cost of goods sold, and gross profit sections
• Additional nonoperating sections may be added for:
1) revenues and expenses resulting from secondary or auxiliary operations
2) gains and losses unrelated to operations
MULTIPLE-STEP INCOME STATEMENT
STUDY OBJECTIVE 5STUDY OBJECTIVE 5

Operating expenses may be subdivided into:
a) Selling expenses
b) Administrative expenses
Nonoperating sections are reported after income from operations and are classified as:
a) Other revenues and gains
b) Other expenses and losses
MULTIPLE-STEP INCOME STATEMENT

SELLERS ELECTRONIX
Income Statement
For the Year Ended December 31, 2005
Revenues Net sales $ 460,000 Interest revenue 3,000 Gain on sale of equipment 600
Total revenues 463,600 Expenses Cost of goods sold $ 316,000 Selling expenses 76,000 Administrative expenses 38,000 Interest expense 1,800 Casualty loss from vandalism 200
Total expenses 432,000
Net income $ 31,600
SINGLE-STEP INCOME STATEMENT
All data are classified under two categories: 1
Revenues
2 Expenses
Only one step is required in determining net income or net
loss.
All data are classified under two categories: 1
Revenues
2 Expenses
Only one step is required in determining net income or net
loss.

Gross profit is determined as follows:
Net sales $ 460,000
Cost of goods sold 316,000
Gross profit $ 144,000
COMPUTATION OF GROSS PROFIT
STUDY OBJECTIVESTUDY OBJECTIVE 66

OPERATING EXPENSES IN COMPUTING NET INCOME
Net income is determined as follows:
Gross profit $ 144,000
Operating expenses 114,000
Net income $ 30,000

Chapter5
Gross profit for a merchandiser is net sales minus
a. operating expenses
b. cost of goods sold
c. sales discounts
d. cost of goods available for sale

Chapter5
Gross profit for a merchandiser is net sales minus
a. operating expenses
b. cost of goods sold
c. sales discounts
d. cost of goods available for sale

PERIODIC INVENTORY SYSTEMS
Appendix 5A
• Revenues from the sale of merchandise are recorded when sales are made in the same way as in a perpetual system
• No attempt is made on the date of sale to record the cost of merchandise sold
• Physical inventories are taken at end of period to determine:– The cost of merchandise on hand
– The cost of the goods sold during the period

Determining Cost of Goods SoldPeriodicSTUDY OBJECTIVESTUDY OBJECTIVE 77

• Purchases
– Merchandise purchased for resale to customers
– May be made for cash or on account (credit)
– Normally recorded by the purchaser when the goods are received from the seller
– Credit purchase should be supported by a purchase invoice
RECORDING MERCHANDISE TRANSACTIONS UNDER A
PERIODIC INVENTORY SYSTEM

RECORDING PURCHASES OF MERCHANDISE
To illustrate the recording of merchandise transactions under a periodic system, we will use the purchase/sale transactions between Seller and Buyer. For purchases on account, Purchases is debited and Accounts Payable is credited for merchandise ordered from Seller.
Date Account Titles Debit Credit
General Journal
May 4 Purchases 3,800Accounts Payable 3,800

• A sales return and allowance on the seller’s books is recorded as a purchase return and allowance on the books of the purchaser.
• Purchase Returns and Allowances
– contra account to Purchases
– Normal credit balance
• Debit memorandum
– Purchaser initiates the request for a reduction of the balance due through the issuance of a debit memorandum
– A document issued by a buyer to inform a seller that the seller’s account has been debited because of unsatisfactory merchandise
PURCHASE RETURNS AND ALLOWANCES

RECORDING PURCHASE RETURNS AND ALLOWANCES
For purchases returns and allowances, Accounts Payable is debited and Purchase Returns and Allowances is credited. Because $300 of merchandise received from Seller is inoperable, Buyer returns the goods and issues a debit memo.
Date Account Titles Debit Credit
General Journal
May 8 Accounts Payable 300Purchase Returns and Allowances 300

• Freight-in is debited if buyer pays freight
• Freight-out (or Delivery Expense) is debited if seller pays freight
ACCOUNTING FOR FREIGHT COSTS

ACCOUNTING FOR FREIGHT COSTS
When the purchaser directly incurs the freight costs, the account Freight-in (or Transportation-in) is debited and Cash is credited. In this example, Buyer pays Acme Freight Company $150 for freight charges on its purchase from Seller.
Date Account Titles Debit Credit
General Journal
May 9 Freight-in 150Cash 150

PURCHASE DISCOUNTS
• Credit terms may permit the buyer to claim a cash discount for the prompt payment of a balance due.
• The buyer calls this discount a purchase discount.
• Like a sales discount, a purchase discount is based on the invoice cost less returns and allowances, if any.

PURCHASE DISCOUNTS
If payment is made within the discount period, Accounts Payable is debited, Purchase Discounts is credited for the discount taken, and Cash is credited. On May 14 Buyer pays the balance due on account to Seller taking the 2% cash discount allowed by Seller for payment within 10 days.
Date Account Titles Debit Credit
General Journal
May 14 Accounts Payable 3,500Purchase Discounts 70Cash 3,430

For credit sales, Accounts Receivable is debited and Sales is credited. In this illustration, the sale of $3,800 of merchandise to Buyer on May 4 is recorded by the Seller.
RECORDING SALES OF MERCHANDISE
Date Account Titles Debit Credit
General Journal
May 4 Accounts Receivable 3,800Sales
3,800

RECORDING SALES RETURNS AND ALLOWANCES
The seller’s entry to record a credit memorandum involves a debit to the Sales Returns and Allowancesaccount and a credit to Accounts Receivable. Based on the debit memo received from Buyer on May 8 for returned goods, Seller records the $300 sales returns above.
Date Account Titles Debit Credit
General Journal
May 8 Sales Returns and Allowances 300Accounts Receivable 300

RECORDING SALES DISCOUNTS
When cash discounts are taken by customers, the seller debits Sales Discounts. On May 15, Seller receives payment of $3,430 on account from Buyer. Seller honors the 2% discount and records the payment of Buyer’s accounts receivable.
Date Account Titles Debit Credit
General Journal
May 15 Cash 3,430Sales Discounts 70Accounts Receivable 3,500

WORK SHEET FOR A MERCHANDISING COMPANY

USING A WORK SHEETAppendix 5B
Trial Balance Columns
1 Data from the trial balance are obtained from the ledger balances of Sellers Electronix at December 31
2 The amount shown for Merchandise Inventory, $40,500, is the year-end inventory amount which results from the application of a perpetual inventory system
USING A WORK SHEET
Adjustments Columns
1 A merchandising company usually has the same types of adjustments as a service company
2 Work sheet adjustments b, c, and d are for insurance, depreciation, and salaries
Adjusted Trial Balance - The adjusted trial balance shows the balance of all accounts after adjustment at the end of the accounting period

USING A WORK SHEET
Income Statement Columns
1 The accounts and balances that affect the income statement are transferred from the adjusted trial balance columns to the income statement columns for Sellers Electronix at December 31
2 All of the amounts in the income statement credit column should be totaled and compared to the total of the amounts in the income statement debit column

USING A WORK SHEET
Balance Sheet Columns
1 The major difference between the balance sheets of a service company and a merchandising company is inventory
2 For Sellers Electronix, the ending Merchandise Inventory amount of $40,000 is shown in the balancesheet debit column
3 The information to prepare the owner’s equity statement is also found in these columns

John Wiley & Sons, Inc. © 2005
Chapter 6Chapter 6
Inventories
Prepared by Naomi KarolinskiPrepared by Naomi KarolinskiMonroe Community CollegeMonroe Community College
andand
Marianne BradfordMarianne BradfordBryant CollegeBryant College
Accounting Principles, 7Accounting Principles, 7thth EditionEdition
Weygandt Weygandt •• Kieso Kieso •• KimmelKimmel

CHAPTER 6INVENTORIES
After studying this chapter, you should be able to:
1 Describe steps in determining inventory quantities
2 Explain the basis of accounting for inventories and describe the inventory cost flow methods
3 Explain the financial statements and the tax effects of each inventory cost flow method
4 Explain the lower of cost or market basis of accounting for inventories
5 Indicate the effects of inventory errors on the financial statements
6 Compute and interpret inventory turnover

• Balance sheet of merchandising and manufacturing companies– inventory significant current asset
• Income statement– inventory is vital in determining results
• Gross profit– (net sales - cost of goods sold)
• watched by management, owners, and others
INVENTORY BASICS

Merchandise inventory
1 Owned by the company
2 In a form ready for sale
MERCHANDISE INVENTORY CHARACTERISTICS

•Manufacturing inventories– may not yet be ready for sale
•Classified into three categories:1 Finished goods
ready for sale2 Work in process
various stages of production(not completed)
3 Raw materials components on hand waiting to be used
CLASSIFYING INVENTORY IN A MANUFACTURING ENVIRONMENT

To prepare financial statements determine
1. the number of units in inventory by taking a physical inventory of goods on hand physical inventory by counting, weighing or measuring
2. The ownership of goods
DETERMINING INVENTORY QUANTITIES
STUDY OBJECTIVE 1

DETERMINING COSTOF GOODS ON HAND
3. apply unit costs to the total units on hand for each item
4. total the cost of each item of inventory to determine total cost of goods on hand
TAKING A PHYSICAL INVENTORY
Internal control principles for inventory:
1 Segregation of duties
counting by employees not having custodial responsibility for the inventory
2 Establishment of responsibility
each counter should establish the authenticity of each inventory item

TAKING A PHYSICAL INVENTORY
3 Independent internal verification
second count by another employee
4 Documentation procedures
pre-numbered inventory tags
5 Independent internal verification
designated supervisor checks all inventory items tags, no items have more than one tag

• Goods in transit:included in the inventory of the party that has legal title to the goods
• FOB (Free on Board) shipping point:
ownership of the goods passes to the buyer when the public carrier accepts the goods from the seller
• FOB destination point:
legal title to the goods remains with the seller until the goods reach the buyer
OWNERSHIP OF GOODS IN TRANSIT

TERMS OF SALE

Consignment: the holder of the goods (consignee) does not own the goods – ownership remains with the consignor of the
goods until the goods are sold – consigned goods should be included in the
consignor’s inventory, not the consignee’sinventory
Consignee Company
CONSIGNED GOODS
Owned by a consignor; do not count in consignee inventory

INVENTORY ACCOUNTING SYSTEMS
1 Perpetual• detailed records • cost of each item maintained • cost of each item sold is determined when
sale occurs
2 Periodic• cost of goods sold is determined at the end
of accounting period

Basis of Accounting for InventoriesPeriodic Cost Flow Methods
STUDY OBJECTIVE 2
• Revenues from the sale of merchandise are recorded when sales are made in the same way as in a perpetual system.
• No calculation of cost of goods sold is made at the time of sale of the merchandise.
• Physical inventories are taken at end of period to determine:– the cost of merchandise on hand
– the cost of the goods sold during the period

ALLOCATING INVENTORIABLE COSTS
• Inventory costs- periodic inventory system– allocated between ending inventory and cost of goods sold
– allocation is made at the end of the accounting period
1 the costs assignable to the ending inventory are determined
2 the cost of the ending inventory is subtracted from the cost of goods available for sale to determine the cost of goods sold
3 cost of goods sold is then deducted from sales revenues in accordance with the matching principle to get gross profit

COST OF GOODS SOLD
Cost of Goods Sold –Review
Periodic inventory system
Three steps are required:
1. record purchases of merchandise,
2. determine the cost of goods purchased,
3. determine the cost of goods on hand at the beginning and end of the accounting period

To determine Cost of Goods Purchased:
1 subtract contra purchase accounts of Purchases Discounts and Purchases Returns and Allowances from Purchases to get Net Purchases
2 add Freight-in to Net Purchases
DETERMINING COST OF GOODS PURCHASED

Pool of Costs
Cost of Goods Available for Sale
Beginning inventory $ 20,000Cost of goods purchased 100,000
Cost of goods available for sale
Step 1 Step 2
Ending Inventory Cost of Goods Sold
Unit Total Cost of goods available for sale $120,000 Units Cost Cost Less: Ending inventory 15,000
5,000 $ 3.00 Cost of goods sold
ALLOCATION (MATCHING) OF POOL OF COSTS
STUDY OBJECTIVE 5
$15,000 $105,000
$ 120,000

The cost of goods available for sale is allocated between
a. beginning inventory and ending inventory.
b. beginning inventory and cost of goods on hand.
c. cost of goods purchased and cost of goods sold.
d. beginning inventory and cost of goods purchased.

The cost of goods available for sale is allocated between
a. beginning inventory and ending inventory.
b. beginning inventory and cost of goods on hand.
c. cost of goods purchased and cost of goods sold.
d. beginning inventory and cost of goods purchased.

USING ACTUAL PHYSICAL
FLOW COSTING• Costing of the inventory is complicated because
specific items of inventory on hand may have been purchased at different prices.
• The specific identification method tracks the actual physical flow of the goods.
• Each item of inventory is marked, tagged, or coded with its specific unit cost.
• Items still in inventory at the end of the year are specifically costed to arrive at the total cost of the ending inventory.

SPECIFIC IDENTIFICATION METHOD

USING ASSUMED COST FLOW METHODS
• Other cost flow methods are allowed since specific identification is often impractical.
• These methods assume flows of costs that may be unrelated to the physical flow of goods.
• For this reason we call them assumed cost flow methods or cost flow assumptions. They are:
1 First-in, first-out (FIFO).
2 Last-in, first-out (LIFO).
3 Average cost.

FIFO
• The FIFO method– earliest goods purchased are the first to be sold.
– often parallels the actual physical flow of merchandise.
– the costs of the earliest goods purchased are the first to be recognized as cost of goods sold.

FIFO

Step 1 Step 2
Ending Inventory Cost of Goods Sold
Unit TotalDate Units Cost Cost
11/27 400 $ 13 $ 5,200 Cost of goods available for sale $ 12,00008/24 50 12 600 Less: Ending inventory 5,800
450 Cost of goods sold
ALLOCATION OF COSTS - FIFO METHOD
Pool of Costs
Cost of Goods Available for Sale
Unit TotalDate Explanation Units Cost Cost
01/01 Beginning inventory 100 $10 $ 1,00004/15 Purchase 200 11 2,20008/24 Purchase 300 12 3,60011/27 Purchase 400 13 5,200
Total 1,000
$ 5,800 $ 6,200
$ 12,000

PROOF OF COST OF GOODS SOLD
The accuracy of the cost of goods sold can be verified by recognizing that the first units acquired are the first units sold.
Unit TotalDate Units Cost Cost
01/01 X =04/15 X =08/24 X =
Total
100 $ 10 $ 1,000 200 11 2,200 250 12 3,000
550 $ 6,200

LIFO• The LIFO method assumes that the latest
goods purchased are the first to be sold.
• LIFO seldom coincides with the actual physical flow of inventory.
• Under LIFO, the costs of the latest goods purchased are the first goods to be sold.

LIFO

Step 1 Step 2
Ending Inventory Cost of Goods Sold
Unit TotalDate Units Cost Cost
01/01 100 $ 10 $ 1,00004/15 200 11 2,200 Cost of goods available for sale $ 12,00008/24 150 12 1,800 Less: Ending inventory 5,000
450 Cost of goods sold
ALLOCATION OF COSTS - LIFO METHOD
Pool of Costs
Cost of Goods Available for Sale
Unit TotalDate Explanation Units Cost Cost
01/01 Beginning inventory 100 $10 $ 1,00004/15 Purchase 200 11 2,20008/24 Purchase 300 12 3,60011/27 Purchase 400 13 5,200
Total 1,000 $ 12,000
$ 5,000 $ 7,000

PROOF OF COST OF GOODS SOLD
The cost of the last goods in are the first to be assigned to cost of goods sold. Under a periodic inventory system, all goods purchased during the period are assumed to be available for the first sale, regardless of the date of purchase.
Unit TotalDate Units Cost Cost
11/27 X =X =08/24
Total
400 $ 13 $ 5,200 150 12 1,800
550 $ 7,000

AVERAGE COST
The average cost method±assumes goods available for sale are homogeneous.
±the cost of goods available for sale is allocated on the basis of the weighted average unit cost incurred.
±weighted average unit cost is applied to the units on hand to determine cost of the ending inventory.

AVERAGE COST

Step 1 Step 2
Ending Inventory Cost of Goods Sold
$ 12,000 ÷ 1,000 = $12.00Unit Total Cost of goods available for sale $ 12,000
Units Cost Cost Less: Ending inventory 5,400
450 x $ 12.00 = Cost of goods sold
ALLOCATION OF COSTS -AVERAGE COST METHOD
Pool of Costs
Cost of Goods Available for Sale
Unit TotalDate Explanation Units Cost Cost
01/01 Beginning inventory 100 $10 $ 1,00004/15 Purchase 200 11 2,20008/24 Purchase 300 12 3,60011/27 Purchase 400 13 5,200
Total 1,000$ 12,000
$ 5,400 $ 6,600

USE OF COST FLOW METHODS IN MAJOR U.S. COMPANIES
44% FIFO
30% LIFO
21% Average
Cost5% Other
Companies adopt different inventory cost flow methods for various reasons. Usually one of the following factors is involved: 1) income statement effects, 2) balance sheet effects, or 3) tax effects.

A company had the following inventory information for the month of May:
Assuming the company is using the Lifo method of inventory:Calculate the value of the ending inventory if there are 100 units in ending inventory on May 31st.
$15,610Total units 1,100
$ 6,360$10.60 =@600 units
Purchase20
$ 5,250$10.50 =@500 units
Purchase8
$ 4,000$10.00 =@400 units
Beg. Inventory
May 1

Under LIFO, the ending inventory consists of the oldest 100 units, therefore ending inventory = 100 units X $10 = $1,000.

INCOME STATEMENT EFFECTS COMPARED
STUDY OBJECTIVE 3
LIFO FIFOCost of goods sold 4,000 (200 x $20) 4,800 (200 x $24)
Kralik Company buys 200 XR492s at $20 per unit on January 10 and 200 more on December 31 at $24 each. During the year, 200 units are sold at $30 each. Under LIFO, the company recovers the current replacement cost ($4,800) of the units sold. Under FIFO, however, the company recovers only the January 10 cost ($4,000). To replace the units sold, it must invest $800 (200 x $4) of the gross profit. Thus, $800 of the gross profit is said to be phantom or illusory profits. As a result, reported net income is overstated in real terms.

USING INVENTORY COST FLOW METHODS CONSISTENTLY
• Consistency – Companies needs to use its chosen cost flow
method from one period to another.
– Consistent application makes financial statements comparable over successive time periods.
– If a company adopts a different cost flow method:
• The change and its effects on net income must be disclosed in the financial statements
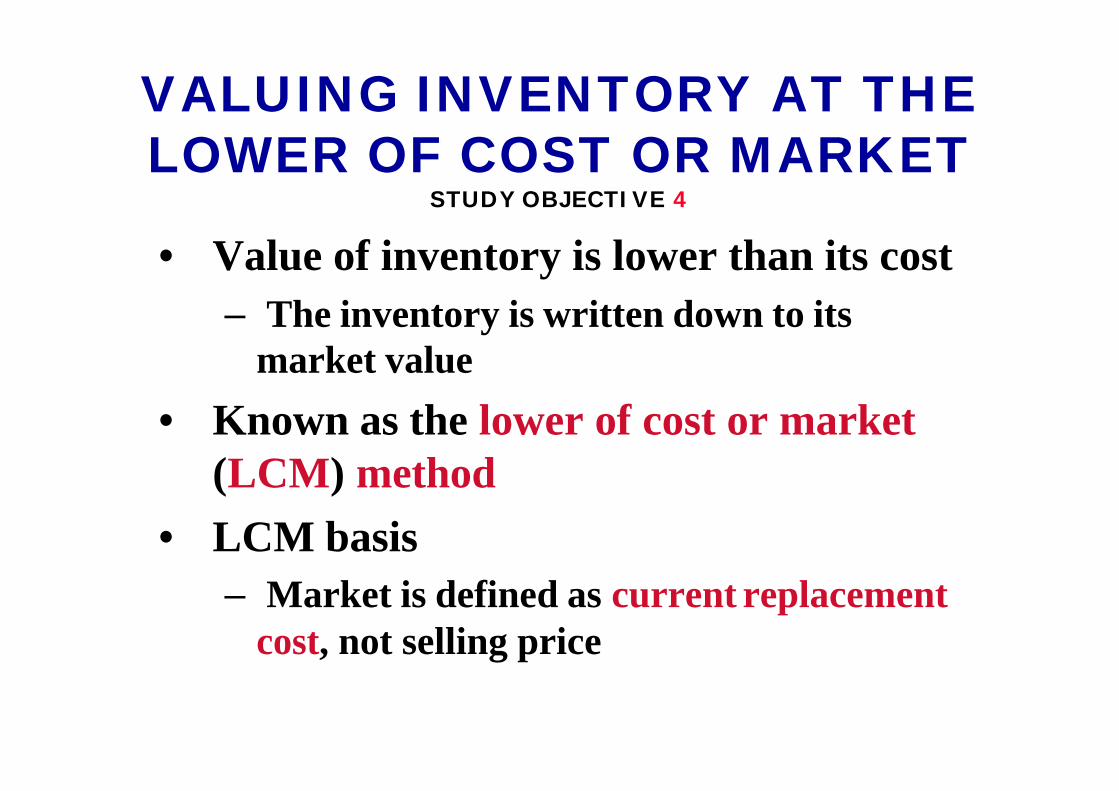
• Value of inventory is lower than its cost
– The inventory is written down to its market value
• Known as the lower of cost or market (LCM) method
• LCM basis
– Market is defined as current replacement cost, not selling price
VALUING INVENTORY AT THE LOWER OF COST OR MARKET
STUDY OBJECTIVE 4

COMPUTATION OF LOWER OF
COST OR MARKET
Lower of
Cost or
Cost Market Market
Television sets Consoles $ 60,000 $ 55,000 $ 55,000 Portables 45,000 52,000 45,000
Total 105,000 107,000
Video equipment Recorders 48,000 45,000 45,000 Movies 15,000 14,000 14,000
Total 63,000 59,000
Total inventory $ 168,000 $ 166,000
$ 159,000

• both beginning and ending inventories appear on the income statement
• ending inventory of one period automatically becomes the beginning inventory of the next period
• inventory errors– affect the determination of cost of
goods sold and net income
INVENTORY ERRORS - INCOME STATEMENT EFFECTS
STUDY OBJECTIVE 5

FORMULA FOR COST OF GOODS SOLD
+ =BeginningInventory
Cost of Goods
Purchased
EndingInventory
Cost of GoodsSold
_
the effects on cost of goods sold can be determined by entering the incorrect data in the above formula and then substituting the correct data
the effects on cost of goods sold can be determined by entering the incorrect data in the above formula and then substituting the correct data

EFFECTS OF INVENTORY ERRORS ON CURRENT YEAR’S
INCOME STATEMENT
Cost of Inventory Error Goods Sold Net Income
Understate beginning inventory Understated Overstated
Overstate beginning inventory Overstated Understated
Understate ending inventory Overstated Understated
Overstate ending inventory Understated Overstated
An error in ending inventory of the current period will have a
reverse effect on net income of the next period.

Assets = Liabilities + Owners Equity
the effect of ending inventory errors on the balance sheet can be determined by the basic accounting equation:
ENDING INVENTORY ERROR -BALANCE SHEET EFFECTS

Ending InventoryError Assets Liabilities Owner’s Equity
Errors in the ending inventory have the following effects on these components:
Overstated Overstated None Overstated Understated Understated None Understated
ENDING INVENTORY ERROR -BALANCE SHEET EFFECTS

Note 1. Summary of accounting policiesInventoriesThe company uses the retail, last-in, first-out (LIFO) method for the Wal-Mart Stores segment, cost LIFO for the SAM’S CLUB segment, and other cost methods, including the retail first-in, first-out (FIFO) and average costs methods, for the International segment. Inventories are not recorded in excess of market value.
INVENTORY DISCLOSURES
• Inventory – classified as a current asset after receivables in the balance
sheet• Cost of goods sold – subtracted from sales in the income statement
•Disclosure either in the balance sheet or in accompanying notes for:1 major inventory classifications2 basis of accounting (cost or lower of cost or market)3 costing method (FIFO, LIFO, or average cost)
Wal-Mart Stores, IncNotes to the Financial Statements

The inventory turnover ratio measures the number of times, on average, the inventory is sold during the period – which measures the liquidity of the inventory. It is computed by dividing cost of goods sold by average inventory during the year. Assume that Wal-Mart, Inc. has a beginning inventory of $21,442 million and ending inventory of $21,614 and cost of goods sold for 2002 of $171,562; its inventory turnover formula and computation is shown below:
INVENTORY TURNOVER FORMULA AND COMPUTATION
STUDY OBJECTIVE 6
COST OF GOODS SOLD INVENTORY TURNOVER = ————————————
AVERAGE INVENTORY
7.97 times = $171,562
($21,442 + $21,614) /2

APPENDIX 6AINVENTORY COST FLOW METHODS IN
PERPETUAL INVENTORY SYSTEMS
To illustrate the application of the 3assumed cost flow methods (FIFO, Average Cost, and LIFO), the data shown below for Bow Valley Electronics’ product Z202 AstroCondenser is used.
To illustrate the application of the 3assumed cost flow methods (FIFO, Average Cost, and LIFO), the data shown below for Bow Valley Electronics’ product Z202 AstroCondenser is used.
Bow Valley ElectronicsZ202 Astro Condensers
Unit TotalDate Explanation Units Cost Cost
01/01 Beginning inventory 100 $10 $ 1,00004/15 Purchase 200 11 2,20008/24 Purchase 300 12 3,60011/27 Purchase 400 13 5,200
Total $ 12,000

PERPETUAL SYSTEM - FIFO
Under FIFO, the cost of the earliest goods on hand prior to each sale is charged to cost of goods sold. Therefore, the cost of goods sold on September 10 consists of the units on hand January 1 andthe units purchased April 15 and August 24.
Under FIFO, the cost of the earliest goods on hand prior to each sale is charged to cost of goods sold. Therefore, the cost of goods sold on September 10 consists of the units on hand January 1 andthe units purchased April 15 and August 24.
Date Purchases Sales Balance
January 1 (100 @ $10) $1,000
April 15 (200 @ $11) $2,200 (100 @ $10) (200 @ $11) $3,200
August 24 (300 @ $12) $3,600 (100 @ $10) (200 @ $11) (300 @ $12) $6,800
September 10 (100 @ $10) (200 @ $11) $6,200 (250 @ $12)
(50 @ $12) $600
November 27 (400 @ $13) $5,200 (50 @ $12) (400 @ $13) $5,800

Under the LIFO method using a perpetual system, the cost of the most recent purchase prior to sale is allocated to the units sold. The cost of the goods sold on September 10 consists entirely of goods from the August 24 and April 15 purchases and 50 of the units in beginning inventory.
Under the LIFO method using a perpetual system, the cost of the most recent purchase prior to sale is allocated to the units sold. The cost of the goods sold on September 10 consists entirely of goods from the August 24 and April 15 purchases and 50 of the units in beginning inventory.
Date Purchases Sales Balance
January 1 (100 @ $10) $1,000
April 15 (200 @ $11) $2,200 (100 @ $10) (200 @ $11) $3,200
August 24 (300 @ $12) $3,600 (100 @ $10) (200 @ $11) (300 @ $12) $6,800
September 10 (300 @ $12) (200 @ $11) $6,300 (50 @ $10)
(50 @ $10) $500
November 27 (400 @ $13) $5,200 (50 @ $10) (400 @ $13) $5,700
PERPETUAL SYSTEM - LIFO

PERPETUAL SYSTEM -AVERAGE COST
The average cost method in a perpetual inventory system is called the moving average method. Under this method a new average is computed after each purchase. The average cost is computed by dividing the cost of goods available for sale by the units on hand. The average cost is then applied to
1. the units sold, to determine the cost of goods sold, and,
2. the remaining units on hand, to determine the ending inventory amount.

As indicated below, a new average is computed each time a purchase is made. On April 15, after 200 units are purchased for $2,200, a total of 300 units costing $3,200 ($1,000 + $2,200) are on hand. The average cost is $10.667 ($3,200/300).
PERPETUAL SYSTEM -AVERAGE COST METHOD
Date Purchases Sales Balance
January 1 (100 @ $100) $1,000 April 15 (200 @ $11) $2,200 (300 @ $10.667) $3,200
August 24 (300 @ $12) $3,600 (600 @ $11.333) $6,800
September 10 (550 @ $11.333) $6,233 (50 @ $11.333) $567
November 27 (400 @ $13) $5,200 (450 @ $12.816) $5,767
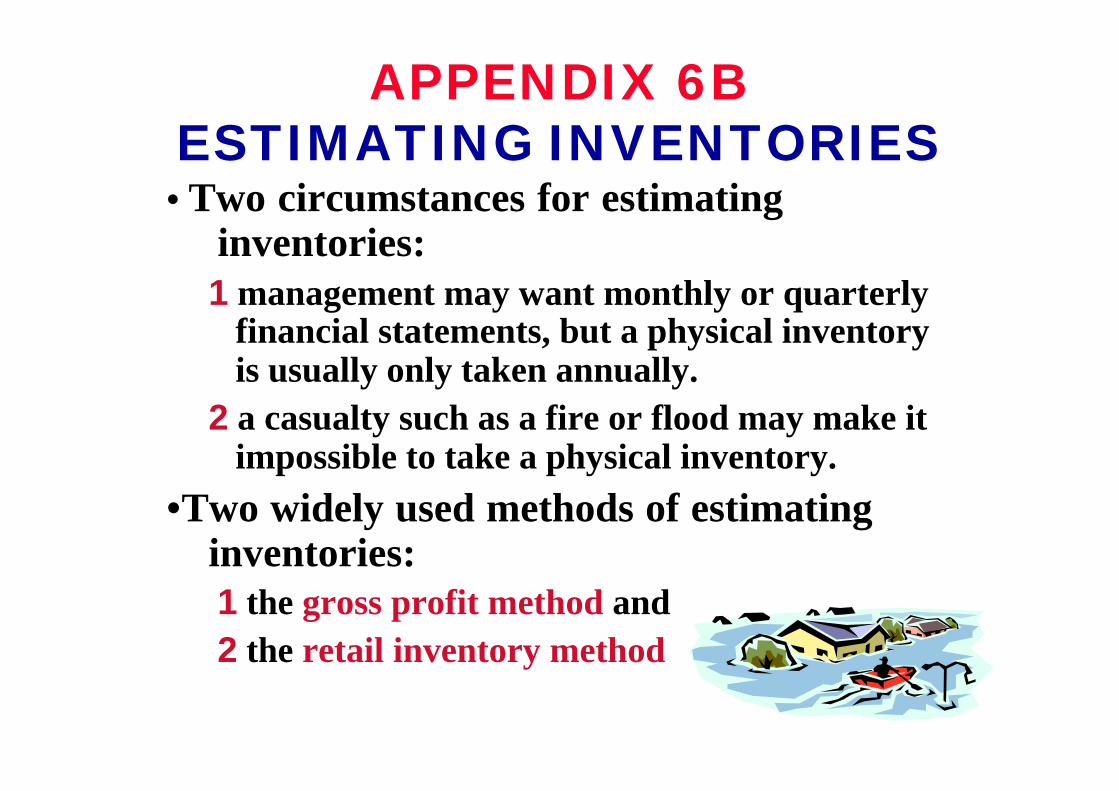
APPENDIX 6BESTIMATING INVENTORIES• Two circumstances for estimating
inventories:1 management may want monthly or quarterly
financial statements, but a physical inventory is usually only taken annually.
2 a casualty such as a fire or flood may make it impossible to take a physical inventory.
•Two widely used methods of estimating inventories:1 the gross profit method and
2 the retail inventory method

• Gross profit method– Estimates the cost of ending inventory by applying
a gross profit rate to net sales
• used in preparing monthly financial statements under a periodic system
• should NOT be used in preparing the company’s financial statements at year-end
• is assumed to remain constant from one year to the next
GROSS PROFIT METHOD

Step 2 Cost of goods available for sale less estimated cost of goods sold (from Step 1) equals the estimated cost of ending inventory.
Net SalesEstimated
Gross Profit
Cost of GoodsAvailable for
Sale
EstimatedCost of
Goods Sold
EstimatedCost of
Goods Sold
EstimatedCost of Ending
Inventory
Step 1 Net sales less estimated gross profit equals estimated cost of goods sold.
GROSS PROFIT METHOD FORMULAS

• A store has many different types of merchandise at low unit costs– the retail inventory method is often used
– a company’s records must show both the cost and retail value of the goods available for sale
• Major disadvantage– it is an averaging technique
RETAIL INVENTORY METHOD

Ending Inventoryat Retail
Step 1
Cost to RetailRatio
GoodsAvailable forSale at Retail
Net Sales
GoodsAvailable forSale at Cost
GoodsAvailable forSale at Retail
Step 2
EstimatedCost of Ending
Inventory
Step 3
EndingInventoryat Retail
Cost toRetailRatio
hh
RETAIL INVENTORY METHOD FORMULAS

DETERMINING COST OF GOODS ON HAND
Under the periodic method, cost of inventory on hand is determined from a physical inventory requiring:
1 counting the units on hand for each item of inventory
2 applying unit costs to the total units on hand for each item
3 totaling the cost of each item of inventory to determine total cost of goods on hand

A company had the following inventory information for the month of May:
Assuming the company is using the LIFO method of inventory:
Calculate the value of the ending inventory if there are 100 units in ending inventory on May 31.
$15,610Total units and cost 1,500
$ 6,360$10.60 =@600 unitsPurchase20
$ 5,250$10.50 =@500 units Purchase8
$ 4,000$10.00 =@400 units Beg. InventoryMay 1

A company had the following inventory information for the month of May:
Assume an ending inventory of 100 units, then ending inventory would consist of the oldest layer:
100 units @ $10.00 = $1,000
(Cost of Goods sold would be equal to (Cost of Goods available for Sale - Ending Inventory)
$15,610Total units and cost 1,500
$ 6,360$10.60 =@600 unitsPurchase20
$ 5,250$10.50 =@500 units Purchase8
$ 4,000$10.00 =@400 units
Beg. Inventory
May 1
$15,610-$1,000= $14,610

John Wiley & Sons, Inc. © 2005
Chapter 7Chapter 7
Accounting Information Systems
Prepared by Naomi KarolinskiPrepared by Naomi KarolinskiMonroe Community CollegeMonroe Community College
andand
Marianne BradfordMarianne BradfordBryant CollegeBryant College
Accounting Principles, 7Accounting Principles, 7thth EditionEdition
Weygandt Weygandt •• Kieso Kieso •• KimmelKimmel

After studying this chapter, you should be able to:
1 Identify basic principles of accounting information
systems.
2 Explain the major phases in the development of an
accounting system.
3 Describe the nature and purpose of a subsidiary ledger.
4 Explain how special journals are used in journalizing.
5 Indicate how a multi-column journal is posted.
CHAPTER 7 ACCOUNTING INFORMATION
SYSTEMS

Accounting information system (AIS)
• Collects and processes data.
• Disseminates financial information to interested parties.
• Can either be manual or computerized.
ACCOUNTING INFORMATION SYSTEMSSTUDY OBJECTIVE STUDY OBJECTIVE 11

PRINCIPLES OF AN EFFICIENT PRINCIPLES OF AN EFFICIENT AND EFFECTIVE ACCOUNTING AND EFFECTIVE ACCOUNTING
INFORMATION SYSTEMINFORMATION SYSTEM

PHASES IN THE DEVELOPMENT OF AN ACCOUNTING SYSTEM
Study Objective 2
Analysis
Follow-up Design
Implementation
Planning and identifying information needs and
sources
Monitoring and correcting any weaknesses
Creating forms, documents, procedures,
job descriptions, and reports
Installing the system, training personnel, and
making the system wholly operational

• Small businesses-
– begin operations with manual accounting systems and convert to computerized systems as business grows
• To understand computerized accounting systems-
– one must understand how manual accounting systems work
MANUAL VS. COMPUTERIZED SYSTEMS

• A group of accounts– With a common characteristic for example, all
accounts receivable
– Facilitates the recording process freeing the general ledger from details concerning individual balances
• Two common subsidiary ledgers – Accounts Receivable Ledger
– Accounts Payable Ledger
SUBSIDIARY LEDGERSSTUDY OBJECTIVE STUDY OBJECTIVE 33

• Control account– General Ledger account which
summarizes subsidiary ledger data
• Subsidiary Ledger– general ledger control account
balance equals the composite balance of the individual accounts in the subsidiary ledger
CONTROL ACCOUNT

RELATIONSHIP OF GENERAL LEDGERS AND SUBSIDIARY
ACCOUNTS

RELATIONSHIP BETWEEN LEDGERS
ACCOUNTS RECEIVABLE SUBSIDIARY LEDGER Aaron Co.
Date Ref. Debit Credit Balance
2005 Jan. 10 6,000 6,000 19 4,000 2,000
Branden Inc.
Date Ref. Debit Credit Balance
2005 Jan. 12 3,000 3,000 21 3,000 –0–
Caron Co.
Date Ref. Debit Credit Balance
2005 Jan. 20 3,000 3,000 29 1,000 2,000
GENERAL LEDGER Accounts Receivable Date Ref. Debit Credit Balance
2005 Jan. 31 12,000 12,000 31 8,000 4,000
The subsidiary ledger is separatefrom the general ledger.
Accounts Receivable is a control account.

Advantages
1 Shows transactions affecting one customer or one creditor in a single account
2 Frees the general ledger of excessive details
3 Helps locate errors in individual accounts
4 Reduces the number of accounts in one ledger and by using control accounts
5 Division of labor in posting – One employee posts to the general ledger – Another employee posts to the subsidiary ledger
SUBSIDIARY LEDGERS

• Special journals – used to group similar types of transactions
– permits greater division of labor and reduces time needed to complete the posting process
• If a transaction cannot be recorded in a special journal, it is recorded in the general journal.
SPECIAL JOURNALSSTUDY OBJECTIVE STUDY OBJECTIVE 44

USE OF SPECIAL JOURNALS AND THE GENERAL JOURNAL
SalesJournal
Cash ReceiptsJournal
Purchases Journal
Cash PaymentsJournal
GeneralJournal
Used for:
All sales ofmerchandiseon account
Used for:
All cash received
(includingcash sales)
Used for:
All purchases
of merchandiseon account
Used for:
All cash paid
(includingcash
purchases)
Used for:
Transactionsthat cannotbe enteredin a special
journal, including
correcting, adjusting, and closing entries
The types of special journals used depend largely on the types of transactions that occur frequently in a business enterprise.
The types of special journals used depend largely on the types of transactions that occur frequently in a business enterprise.

• Under a perpetual inventory system, one entry at selling price in the Sales Journal results in a debit to Accounts Receivable and a credit to Sales.
• Another entry at cost results in a debit to Cost of Goods Sold and a credit to Merchandise Inventory.
• Only one line is needed to record each transaction and all entries are made from sales invoices.
JOURNALIZING THE SALES JOURNALPERPETUAL INVENTORY SYSTEM

PROVING THE EQUALITY OF THE POSTINGS FROM THE SALES
JOURNAL
To prove the ledgers it is necessary to determine that 1 the total of the general ledger debit balances must equal the total of the general ledger credit balances and 2 the sum of the subsidiary ledger balances must equal the balance in the control account.
To prove the ledgers it is necessary to determine that 1 the total of the general ledger debit balances must equal the total of the general ledger credit balances and 2 the sum of the subsidiary ledger balances must equal the balance in the control account.

1 One-line entry
• saves time
• not necessary to write out four account titlesfor each transaction
2 Only totals are posted to the general ledger
• saves posting time
• reduces the possibilities of errors in posting
3 Division of labor• one individual may take responsibility for the
sales journal
ADVANTAGES OF A SALES JOURNAL
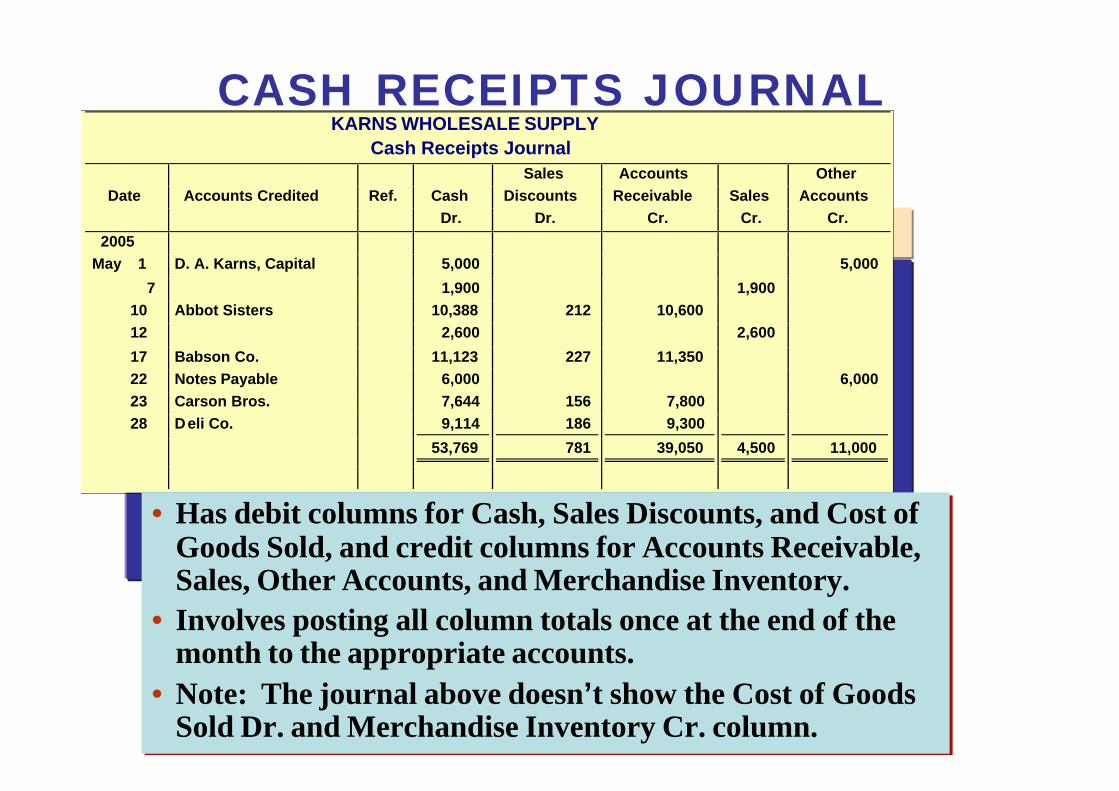
KARNS WHOLESALE SUPPLY
Cash Receipts Journal
Sales Accounts Other
Date Accounts Credited Ref. Cash Discounts Receivable Sales Accounts
Dr. Dr. Cr. Cr. Cr.
2005
May 1 D. A. Karns, Capital 5,000 5,000
7 1,900 1,900
10 Abbot Sisters 10,388 212 10,600
12 2,600 2,600
17 Babson Co. 11,123 227 11,350
22 Notes Payable 6,000 6,000
23 Carson Bros. 7,644 156 7,800
28 Deli Co. 9,114 186 9,300
53,769 781 39,050 4,500 11,000
• Has debit columns for Cash, Sales Discounts, and Cost of Goods Sold, and credit columns for Accounts Receivable, Sales, Other Accounts, and Merchandise Inventory.
• Involves posting all column totals once at the end of the month to the appropriate accounts.
• Note: The journal above doesn’t show the Cost of Goods Sold Dr. and Merchandise Inventory Cr. column.
CASH RECEIPTS JOURNAL

If a customer returns goods for credit, an entry is normally made in the:
a. cash payments journal.
b. sales journal.
c. general journal.
d. cash receipts journal.

a. cash payments journal.
b. sales journal.
c. general journal.
d. cash receipts journal.
If a customer returns goods for credit, an entry is normally made in the:

– The total of the Other Accounts column is not posted. The individual amounts comprising the total are posted separately to the general ledger accounts specified in the Accounts Credited column.
– The individual amounts in a column are posted daily to the subsidiary ledger account specified in the Accounts Creditedcolumn.
CASH RECEIPTS JOURNAL

PROVING THE EQUALITY OF THE CASH RECEIPTS JOURNAL
Debits
Cash $53,769 Sales Discounts 781Cost of goods sold
$57,480
Credits
Accounts Receivable $ 39,050Sales 4,500Other Accounts 11,000Merchandise Inventory 2,930
$ 57,480
When the journalizing of a multi-column journal has been completed, the amount columns are totaled (footing), and the totals are compared to prove the equality of the debits and credits (cross-footing).
When the journalizing of a multi-column journal has been completed, the amount columns are totaled (footing), and the totals are compared to prove the equality of the debits and credits (cross-footing).
2,930

PROVING THE LEDGERS AFTER POSTING THE SALES AND THE CASH RECEIPTS JOURNALS
STUDY OBJECTIVE STUDY OBJECTIVE 55
General Ledger
Debits
Cash $ 53,769Accounts Receivable 51,180Sales Discounts 781Cost of Goods Sold 65,120
$ 170,850
Credits
Notes Payable $ 6,000D. A. Karns, Capital 5,000Sales 94,730Merchandise Inventory 65,120
$ 170,850
Accounts ReceivableSubsidiary Ledger
Abbot Sisters $ 15,400Babson Co. 14,570Deli Co. 21,210
$ 51,180
After the posting of the cash receipts journal is completed, it is necessary to prove the ledgers. The general ledger totals are in agreement. Also, the sum of the subsidiary ledger balances equals the control account balance.
After the posting of the cash receipts journal is completed, it is necessary to prove the ledgers. The general ledger totals are in agreement. Also, the sum of the subsidiary ledger balances equals the control account balance.
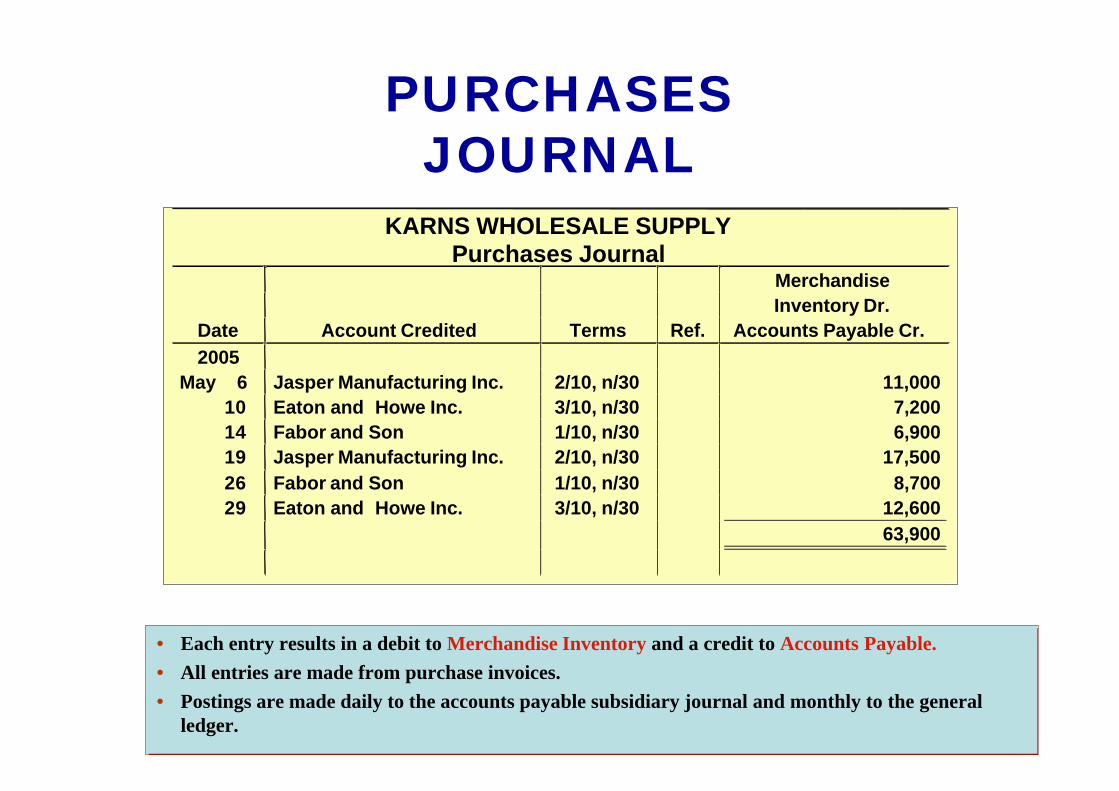
PURCHASES JOURNAL
• Each entry results in a debit to Merchandise Inventory and a credit to Accounts Payable.
• All entries are made from purchase invoices.
• Postings are made daily to the accounts payable subsidiary journal and monthly to the general ledger.
• Each entry results in a debit to Merchandise Inventory and a credit to Accounts Payable.
• All entries are made from purchase invoices.
• Postings are made daily to the accounts payable subsidiary journal and monthly to the general ledger.
KARNS WHOLESALE SUPPLYPurchases Journal
Merchandise
Inventory Dr.
Date Account Credited Terms Ref. Accounts Payable Cr.
2005
May 6 Jasper Manufacturing Inc. 2/10, n/30 11,000
10 Eaton and Howe Inc. 3/10, n/30 7,200
14 Fabor and Son 1/10, n/30 6,900
19 Jasper Manufacturing Inc. 2/10, n/30 17,500
26 Fabor and Son 1/10, n/30 8,700
29 Eaton and Howe Inc. 3/10, n/30 12,600
63,900

PROVING THE EQUALITY OF THE PURCHASES JOURNAL
To prove the ledgers it is necessary to determine that 1 the total of the general ledger debit balances equals the total of the general ledger credit balances and 2 the sum of the subsidiary ledger balances equals the balance in the control account.
To prove the ledgers it is necessary to determine that 1 the total of the general ledger debit balances equals the total of the general ledger credit balances and 2 the sum of the subsidiary ledger balances equals the balance in the control account.

CASH PAYMENTS JOURNAL
KARNS WHOLESALE SUPPLY Cash Payments Journal
Other Accounts Merchandise Date Ck. Accounts Debited Ref. Accounts Payable Inventory Cash
No. Dr. Dr. Cr. Cr.
2005 May 1 101 Prepaid Insurance 1,200 1,200 3 102 Freight -in 100 100 8 103 Purchases 4,400 4,400 10 104 Jasper Manufacturing Inc. 11,000 220 10,780 19 105 Eaton and Howe Inc. 7,200 216 6,984 23 106 Fabor and Son 6,900 69 6,831 28 107 Jasper Manufacturin g Inc. 17,500 350 17,150 30 108 D. A. Karns, Drawing 500 500
6,200 42,600 855 47,945
• Has multiple columns because of the multiple reasons that cash payments may be made.
• Journalizing procedures are similar to cash receipts journal.
• All entries are made from pre-numbered checks.
• Posting procedures are also like the cash receipts journal.
• Has multiple columns because of the multiple reasons that cash payments may be made.
• Journalizing procedures are similar to cash receipts journal.
• All entries are made from pre-numbered checks.
• Posting procedures are also like the cash receipts journal.

• Only transactions that cannot be entered in a special journal are recorded in the general journal.
• When the entry involves both control and subsidiary accounts:
1 In journalizing, control and subsidiary accounts must be identified.
2 In posting there must be a dual posting (to the control account and subsidiary ledger).
EFFECTS ON GENERAL JOURNAL

Karns Wholesale Supply
GENERAL JOURNAL
Date Account Titles and Explanation Debit Credit 2005 May 31 Accounts Payable — Fabor and Son 500 Merchandise Inventory 500 (Received credit for returned goods)
JOURNALIZING AND POSTING THE GENERAL JOURNAL
ACCOUNTS PAYABLE SUBSIDIARY LEDGER Fabor and Son
Date Ref. Debit Credit Balance
2005 May 14 P1 6,900 6,900 23 CP1 6,900 –0– 26 P1 8,700 8,700 31 G1 8,200
GENERAL LEDGER Accounts Payable
Date Ref. Debit Credit Balance
2005 May 31 P1 63,900 63,900 31 CP1 42,600 21,300 31 G1 20,800
Merchandise Inventory
Date Ref. Debit Credit Balance
2005 May 31 G1 (500)
500
500
500

Postings from the purchases journal to the subsidiary ledger are generally made:
a. yearly.
b. monthly.
c. weekly.
d. daily.

a. yearly.
b. monthly.
c. weekly.
d. daily.
Postings from the purchases journal to the subsidiary ledger are generally made:

John Wiley & Sons, Inc. © 2005
Chapter 8Chapter 8
Internal Control and Cash
Prepared by Naomi KarolinskiPrepared by Naomi KarolinskiMonroe Community CollegeMonroe Community College
andand
Marianne BradfordMarianne BradfordBryant CollegeBryant College
Accounting Principles, 7Accounting Principles, 7thth EditionEdition
Weygandt Weygandt •• Kieso Kieso •• KimmelKimmel

CHAPTER 8INTERNAL CONTROL AND CASH
After studying this chapter, you should be able to:
1 Define internal control.
2 Identify the principles of internal control.
3 Explain the applications of internal control principles to cash receipts.
4 Explain the applications of internal control principles to cash disbursements.
5 Describe the operation of a petty cash fund.
6 Indicate the control features of a bank account.
7 Prepare a bank reconciliation.
8 Explain the reporting of cash.

Internal Control1. Safeguards an organization’s assets
2. Enhances the accuracy and reliability of accounting records
INTERNAL CONTROLSTUDY OBJECTIVE STUDY OBJECTIVE 11

PRINCIPLES OF INTERNAL CONTROL
STUDY OBJECTIVE STUDY OBJECTIVE 22

• Establishment of responsibility:
• most effective when only one person is responsible for a given task
• Segregation of duties:
• the work of one employee should provide a reliable basis for evaluating the work of another employee
• Documentation procedures:
• documents provide evidence that transactions and events have occurred
PRINCIPLES OF INTERNAL CONTROL

• Physical, mechanical, and electronic controls:
safeguarding of assets and enhancing accuracy and
reliability of the accounting records.
• Independent internal verification:
the review, comparison, and reconciliation of information from two sources.
• Other controls:
bonding of employees who handle cash, rotating employee’s duties, and requiring employees to take vacations.
PRINCIPLES OF INTERNAL CONTROL

u Locked warehouses and storage cabinets for inventories and records
u Safes, vaults, and safety deposit boxes for cash and business papers
u Time clocks for recording time worked
u Computer facilities with pass key access
u Alarms to prevent break-ins
u Television monitors and garment sensors to deter theft
PHYSICAL, MECHANICAL, AND ELECTRONIC CONTROLS

PHYSICAL, MECHANICAL, AND ELECTRONIC CONTROLS

Maximum benefit
Independent internal verification:
1 Made on periodic or surprise basis
2 Should be done by someonewho is independent of the employee responsible for the information
3 Report discrepancies and exceptions to a management level that can take appropriate corrective action
INDEPENDENT INTERNAL VERIFICATION

COMPARISON OF SEGREGATION OF DUTIES PRINCIPLE WITH INDEPENDENT INTERNAL
VERIFICATION PRINCIPLE

u Costs of establishing control procedures should not exceed their expected benefits
u The human element is an important factor in every system of internal control.
• A good system can become ineffective through employee fatigue, carelessness, or indifference.
u Collusion may result.
• Two or more individuals work together to get around prescribed controls and may significantly impair the effectiveness of a system.
LIMITATIONS OF INTERNAL CONTROL
u Cash
• Coins, currency, checks, money orders, and money on hand or on deposit at a bank or similar depository
u Internal control over cash is imperative
• Safeguards cash and assure the accuracy
of the accounting records for cash
CASH

• Only designated personnel should be authorized to handle or have access to cash receipts.
• Different individuals should:
1 receive cash
2 record cash receipt transactions
3 have custody of cash
CONTROL OVER CASH RECEIPTS
STUDY OBJECTIVE STUDY OBJECTIVE 33

• Documents should include:
1 Remittance advices
2 Cash register tapes
3 Deposit slips
• Cash should be stored in safes and bank vaults
• Access to storage areas should be limited to authorized personnel
• Cash registers should be used in executing over-the-counter receipts
CONTROL OVER CASH RECEIPTS

Internal control is used in a business to enhance the accuracy and reliability of its accounting records and to:a. safeguard its assets.
b. prevent fraud.
c. produce correct financial statements.
d. deter employee dishonesty.

Internal control is used in a business to enhance the accuracy and reliability of its accounting records and to:
a. safeguard its assets.
b. prevent fraud.
c. produce correct financial statements.
d. deter employee dishonesty.

• Daily cash counts and daily comparisons of total receipts.
• All personnel who handle cash receipts should be bonded and required to take vacations.
• Control of over-the-counter receipts is centered on cash registers that are visible to customers.
CONTROL OVER CASH RECEIPTS


• Payments are made by check rather than by cash, except for petty cash transactions.
• Only specified individuals should be authorized to sign checks.
• Different departments or individuals should be assigned the duties of approving an item for payment and paying it.
CONTROL OVER CASH DISBURSEMENTS
STUDY OBJECTIVE STUDY OBJECTIVE 44

u Prenumbered checks should be used and each check should be supported by an approved invoice or other document.
u Blank checks should be stored in a safe.
1 Access should be restricted to authorized
personnel.
2 A check writer machine should be used to imprint the amount on the check in indelible ink.
CONTROL OVER CASH DISBURSEMENTS

u Each check should be compared with the approved invoice before it is issued.
u Following payment, the approved invoice should be stamped “PAID”.
Paid
CONTROL OVER CASH DISBURSEMENTS


u The voucher systemu Is often used to enhance the internal control over
cash disbursements.
uIs an extensive network of approvals by authorized individuals acting independently to ensure that all disbursements by check are proper.
u A voucher is an authorization form prepared for each expenditure.
u Vouchers are recorded in a journal called the voucher register.
VOUCHER SYSTEM

• Checks processing is expensive• New methods are being developed to transfer
funds among parties without the use of paper
• Electronic Funds Transfer (EFT) SystemA disbursement system that uses wire, telephone, telegraph, or computer to transfer cash from one location to another
ELECTRONIC FUNDS TRANSFER SYSTEM

u A petty cash fund is used to pay relatively small amounts
u Operation of the fund, often called an imprestsystem, involves:
1 Establishing the fund
2 Making payments from the fund
3 Replenishing the fund
u Accounting entries are required when:
1 The fund is established
2 The fund is replenished
3 The amount of the fund is changed
PETTY CASH FUNDSTUDY OBJECTIVE STUDY OBJECTIVE 55

ESTABLISHING THE FUND
• Two essential steps in establishing a petty
cash fund are:
1 appointing a petty cash custodian who
will be responsible for the fund and
2 determining the size of the fund.
• Ordinarily, the amount is expected to cover
anticipated disbursements for a 3 to 4 week
period.
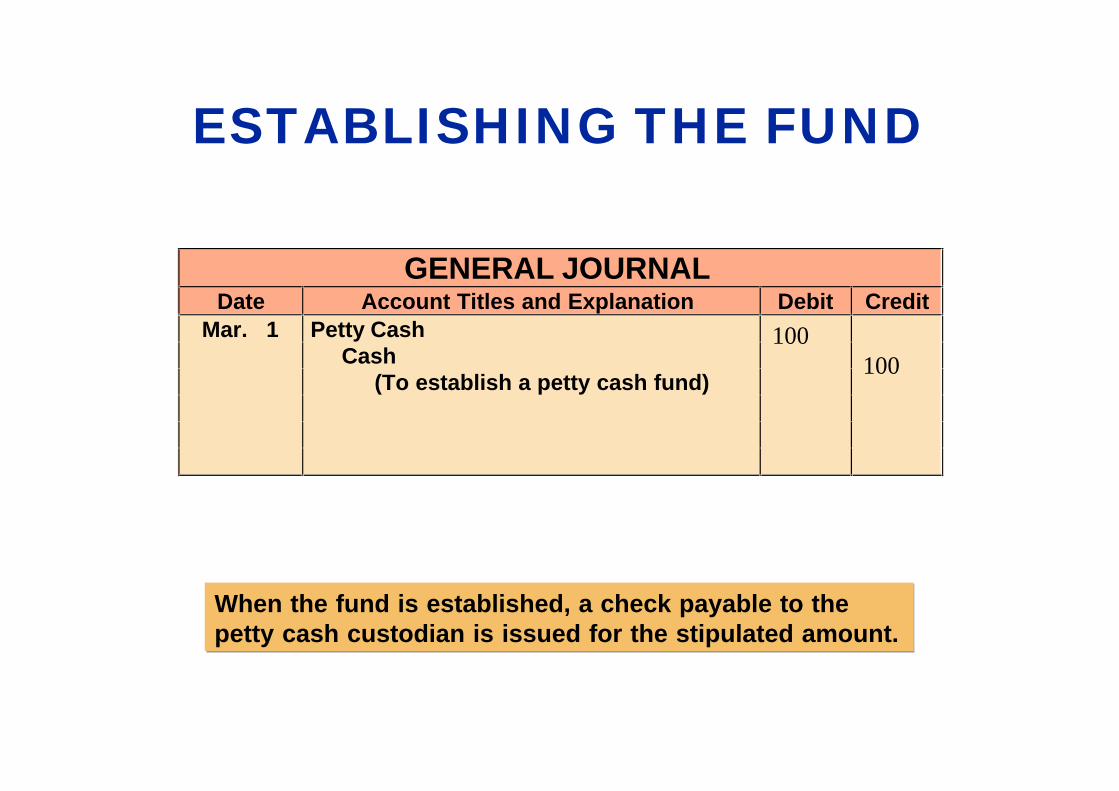
ESTABLISHING THE FUND
GENERAL JOURNAL
Date Account Titles and Explanation Debit Credit
Mar. 1 Petty Cash Cash (To establish a petty cash fund)
When the fund is established, a check payable to the petty cash custodian is issued for the stipulated amount.
100100

REPLENISHING THE FUND
uWhen the money in the petty cash fund reaches a minimum level, the fund is replenished.
u The request for reimbursement is initiated by the
petty cash custodian.
u The petty cash custodian prepares a schedule of
the payments that have been made and sends the
schedule, with supporting documentation, to the
treasurer’s office.

REPLENISHING THE FUND
On March 15 the petty cash custodian requests a check for $87. The fund contains $13 cash and petty cash receipts for postage, $44, freight-out, $38, and miscellaneous expenses, $5.
GENERAL JOURNALDate Account Titles and Explanation Debit Credit
Mar. 15 Postage ExpenseFreight-outMiscellaneous Expense Cash (To replenish petty cash fund)
4438
587

REPLENISHING THE FUND
On March 15 the petty cash custodian requests a check for $88. The fund contains $12 cash and petty cash receipts for postage, $44, freight-out, $38, and miscellaneous expenses, $5.
GENERAL JOURNALDate Account Titles and Explanation Debit Credit
Mar. 15 Postage ExpenseFreight-outMiscellaneous ExpenseCash Over and Short Cash (To replenish petty cash fund)
4438
51
88

u The use of a bank minimizes the amount of currency that must be kept on hand and contributes significantly to good internal
control over cash.
u A company can safeguard its cash by using a bank as a depository and as a clearing house for checks received and checks written.
USE OF A BANKSTUDY OBJECTIVE STUDY OBJECTIVE 66

u A check is a written order signed by the depositor directing the bank to pay a specified sum of money to a designated recipient.
u Three parties to a check are:
1 Maker (drawer) issues the check
2 Bank (payer) on which check is drawn
3 Payee to whom check is payable
WRITING CHECKS

WRITING CHECKS

BANK STATEMENTS
A bank statement shows:1 Checks paid and other debits charged against the
account
2 Deposits and other credits made to the account
3 Account balance after each day’s transactions
A bank statement shows:1 Checks paid and other debits charged against the
account
2 Deposits and other credits made to the account
3 Account balance after each day’s transactions

u Bank debit memoranda• Indicate charges against the
depositor’s account.
Example: ATM service charges
u Bank credit memoranda• Indicate amounts that will increase
the depositor’s account.
Example: interest income on account
balance
MEMORANDA

RECONCILING THE BANK ACCOUNT
STUDY OBJECTIVESTUDY OBJECTIVE 77
uReconciliation
• Necessary as the balance per bank and balance per books are seldom in agreement due to time lags and errors.
uA bank reconciliation
• Should be prepared by an employee
who has no other responsibilities
pertaining to cash.

u Steps in preparing a bank reconciliation:
1 Determine deposits in transit
2 Determine outstanding checks
3 Note any errors discovered
4 Trace bank memoranda to the records
u Each reconciling item used in determining the adjusted cash balance per books should be recorded by the depositor.
RECONCILING THE BANK ACCOUNT

BANK RECONCILIATION

BANK RECONCILIATION
W. A. LAIRD COMPANY
Bank Reconciliation
April 30, 2005
Cash balance per bank statement $ 15,907.45 Add: Deposits in transit 2,201.40 18,108.85 Less: Outstanding checks No. 453 $ 3,000.00 No. 457 1,401.30 No. 460 1,502.70 5,904.00
Cash balance per books $ 11,589.45 Add: Collection of $1,000 note receivable plus interest earned $50, less collection fee $15 $ 1,035.00 Error in recording check 443 36.00 1,071.00 12,660.45 Less: NSF check 425.60 Bank service charge 30.00 455.60
Adjusted cash balance per bank $ 12,204.85
Adjusted cash balance per books $ 12,204.85
The bank statement for the Laird Company shows a balance per bank of $15,907.45 on April 30, 2005.
On this date the balance of cash per books is $11,589.45.

ENTRIES FROM BANK RECONCILIATION
Collection of Note Receivable: This entry involves four accounts. Interest of $50 has not been accrued and the collection fee is charged to Miscellaneous Expense.
GENERAL JOURNALDate Account Titles and Explanation Debit Credit
Apr. 30 CashMiscellaneous Expense Notes Receivable Interest Revenue (To record collection of notes receivable by bank)
103515
100050

ENTRIES FROM BANK RECONCILIATION
Book Error: An examination of the cash disbursements journal shows that check No. 443 was a payment on account to Andrea Company, a supplier. The check, with a correct amount of $1,226.00, was recorded at $1,262.00.
GENERAL JOURNALDate Account Titles and Explanation Debit Credit
Apr. 30 Cash Accounts Payable — Andrea Company (To correct error in recording check No. 443)
3636

ENTRIES FROM BANK RECONCILIATION
NSF Check: An NSF check becomes an accounts receivable to the depositor.
GENERAL JOURNALDate Account Titles and Explanation Debit Credit
Apr. 30 Accounts Receivable — J. R. Baron Cash (To record NSF check)
425.60425.60

ENTRIES FROM BANK RECONCILIATION
Bank Service Charges: Check printing charges (DM) and other bank service charges (SC) are debited to Miscellaneous Expense because they are usually nominal in amount.
GENERAL JOURNALDate Account Titles and Explanation Debit Credit
Apr. 30 Miscellaneous Expense Cash (To record charge for printing company checks)
3030
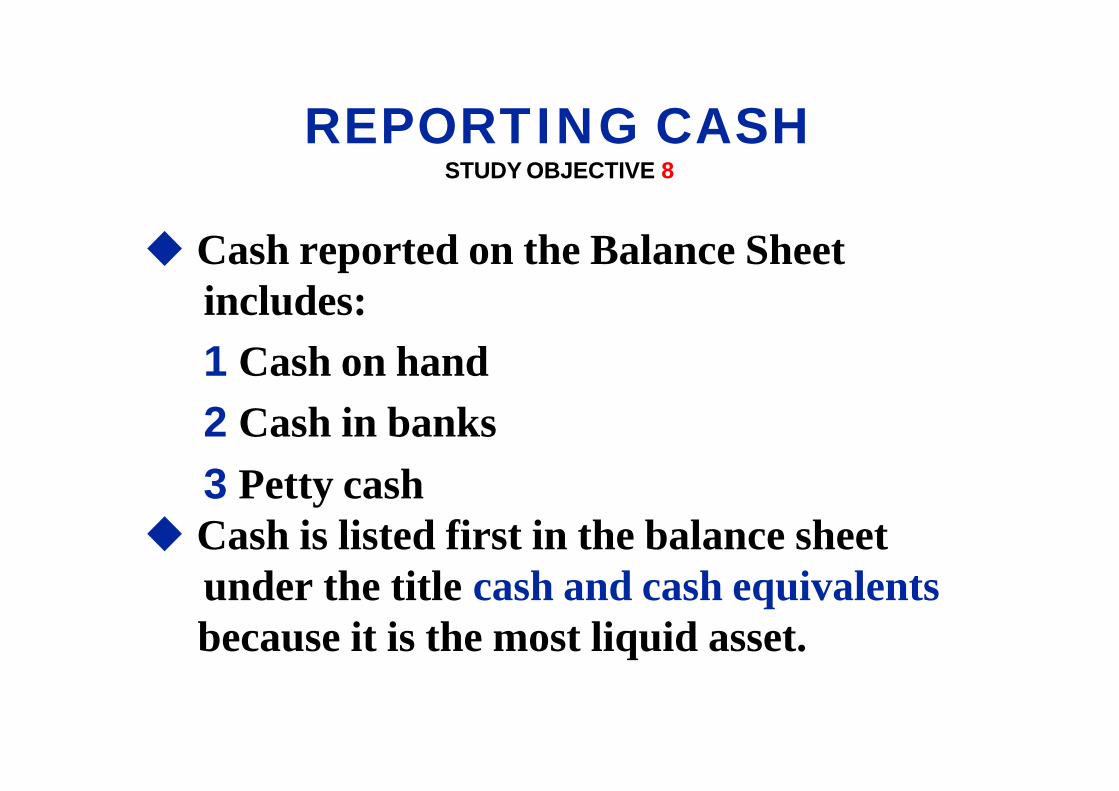
u Cash reported on the Balance Sheet includes:
1 Cash on hand
2 Cash in banks
3 Petty cashu Cash is listed first in the balance sheet
under the title cash and cash equivalentsbecause it is the most liquid asset.
REPORTING CASHSTUDY OBJECTIVE STUDY OBJECTIVE 88

uCash equivalents• Are highly liquid investments that can be
converted into a specific amount of cash
• Typically have maturities of 3 months or less when purchased
Examples: Money market funds, bank certificates of deposit, and U.S. Treasury bills and notes
CASH EQUIVALENTS

The statement that correctly describes the reporting of cash is:
a. Cash cannot be combined with cash equivelants.
b. Restricted cash funds may be combined with
Cash.
c. Cash is listed first in the current assets.
d. Restricted cash funds cannot be reported as a
current asset.

The statement that correctly describes the reporting of cash is:
a. Cash cannot be combined with cash equivelants.
b. Restricted cash funds may be combined with Cash.
c. Cash is listed first in the current assets.
d. Restricted cash funds cannot be reported as a current asset.

John Wiley & Sons, Inc. © 2005
Chapter 9Chapter 9
Accounting for Receivables
Prepared by Naomi KarolinskiPrepared by Naomi KarolinskiMonroe Community CollegeMonroe Community College
andand
Marianne BradfordMarianne BradfordBryant CollegeBryant College
Accounting Principles, 7Accounting Principles, 7thth EditionEdition
Weygandt Weygandt •• Kieso Kieso •• KimmelKimmel

CHAPTER 9ACCOUNTING FOR RECEIVABLES
After studying this chapter, you should be able to:
1 Identify the different types of receivables.
2 Explain how accounts receivable are
recognized in the accounts.
3 Distinguish between the methods and bases
used to value accounts receivable.
4 Describe the entries to record the disposition
of accounts receivable.
5 Compute the maturity date of and interest on
notes receivable.

CHAPTER 9ACCOUNTING FOR
RECEIVABLES
6 Explain how notes receivable are recognized in
the accounts.
7 Describe how notes receivable are valued.
8 Describe the entries to record the disposition of
notes receivable.
9 Explain the statement presentation and analysis
of receivables.
After studying this chapter, you should be able to:

•Amounts due from individuals and other companies– claims expected to be collected in cash
• Three major classes of receivables are
1 Accounts Receivable
- amounts owed by customers on account
2 Notes Receivable
- claims for which formal instruments of credit are issued
3 Other Receivables –
- non-trade receivables
Examples: interest receivable and advances to
employees
RECEIVABLESSTUDY OBJECTIVE 1

Three primary accounting issues with accounts receivable:
1 Recognizing accounts receivable.
2 Valuing accounts receivable.
3 Disposing of accounts receivable.
ACCOUNTS RECEIVABLEACCOUNTS RECEIVABLE

RECOGNIZING ACCOUNTS RECEIVABLE
STUDY OBJECTIVE 2
When a business sells merchandise to a customer on credit, Accounts Receivable is debited and Sales is credited. Assume credit terms are 2/10, n/30.
Date Account Titles Debit Credit
General Journal
July 1 Accounts Receivable – Polo Co. 1,000
Sales 1,000

Date Account Titles Debit Credit
General Journal
RECOGNIZING ACCOUNTS RECEIVABLE
When a business sells merchandise to a customer on credit, Accounts Receivable is debited and Sales is credited.
When a business receives returned merchandise previously sold to a customer on credit, Sales Returns and Allowancesis debited and Accounts Receivable is credited.
July 5 Sales Returns and Allowances 100
Accounts Receivable – Polo Company 100

RECOGNIZING ACCOUNTS RECEIVABLE
When a business sells merchandise to a customer on credit, Accounts Receivable is debited and Sales is credited.
When a business collects cash from a customer for merchandise previously sold on credit during the discount period, Cash and Sales Discounts are debited and Accounts Receivable is credited.
Cash ($900-$18) Sales Discounts ($900 x .02) Accounts Receivable – Polo Company
(To record collection of AR)
88218
900

• Cash (net) realizable value– net amount expected to be received in cash and excludes
amounts that the company estimates it will not be able to collect
• Credit losses
– debited to Bad Debts Expense
– considered a normal and necessary risk of doing business.
• Two methods of accounting for uncollectible accounts are:
1 Direct write-off method2 Allowance method
VALUING ACCOUNTS RECEIVABLE
STUDY OBJECTIVE 3

• Direct write-off method– Bad debt losses are not anticipated and no allowance
account is used
– No entries are made for bad debts until an account is determined to be uncollectible at which time the loss is charged to Bad Debts Expense
• No matching
• No cash realizable value of accounts receivable on the balance sheet
• Not acceptable for financial reporting purposes
DIRECT WRITE-OFF METHOD

DIRECT WRITE-OFF METHOD
Warden Co. writes off M. E. Doran’s $200 balance as uncollectible on December 12. When this method is used, Bad Debts Expense will show only actual losses from uncollectibles.
Date Account Titles Debit Credit
General Journal
Dec. 12 Bad Debts Expense 200Accounts Receivable – M.E. Doran 200

• Allowance method– required when bad debts are deemed
to be material in amount.
• Uncollectible accounts are estimated– expense for the uncollectible accounts
is matched against sales in the sameaccounting period in which the sales occurred.
THE ALLOWANCE METHOD

Estimated uncollectibles are debited to Bad Debts Expense and credited to Allowance for Doubtful Accounts at the end of each period.
THE ALLOWANCE METHOD
Date Account Titles Debit Credit
General Journal
Dec. 31 Bad Debts Expense 12,000Allowance for Doubtful Accounts 12,000

Actual uncollectibles are debited to Allowance for Doubtful Accounts and credited to Accounts Receivable at the time the specific account is written off.
THE ALLOWANCE METHOD
Date Account Titles Debit Credit
General Journal
Mar. 1 Allowance for Doubtful Accounts 500
Accounts Receivable - R. A. Ware 500

When there is recovery of an account that has been written off: 1 reverse the entry made to write off the account and...
THE ALLOWANCE METHOD
Date Account Titles Debit Credit
General Journal
July 1 Accounts Receivable – R. A. Ware 500Allowance for Doubtful Accounts 500

THE ALLOWANCE METHOD
2 record the collection in the usual manner.
Date Account Titles Debit Credit
General Journal
July 1 Cash 500Accounts Receivable 500

• Companies use one of two methods in the estimation of uncollectibles:
1 Percentage of sales
2 Percentage of receivables
• Both bases are GAAP; the choice is a management decision.
BASES USED FOR THE ALLOWANCE METHOD

COMPARISON OF BASES OF ESTIMATING
UNCOLLECTIBLES
Percentage of SalesPercentage of Receivables
Cash Realizable Value
Allowance Accounts for Receivable Doubtful Accounts
Matching
Sales Bad Debts
Expense
Emphasis on Income Statement Emphasis on Balance Sheet
Relationships Relationships

• Management estimates what percentage of credit sales will be uncollectible.
• Expected bad debt losses are determined by applying the percentage to the sales base of the current period.
• Better match
– Expenses with revenues
PERCENTAGE OF SALES BASIS

PERCENTAGE OF SALES BASIS
If net credit sales for the year are $800,000, the estimated bad debts expense is $8,000 (1% X $800,000).
Date Account Titles Debit Credit
General Journal
Dec. 31 Bad Debts Expense 8,000Allowance for Doubtful Accounts 8,000

• Management estimates what percentage of receivables will result in losses from uncollectible accounts.
• Amount of the adjusting entry – difference between the required balance
and the existing balance in the allowance
account
• Produces the better estimate of cash realizable value of receivables.
PERCENTAGE OF RECEIVABLES BASIS

Which of the following approaches for bad debts is best described as a balance sheet method?
a. Percentage of receivables basis.
b. Direct write-off method.
c. Percentage of sales basis.
d. Both a and b.

Which of the following approaches for bad debts is best described as a balance sheet method?
a. Percentage of receivables basis.
b. Direct write-off method.
c. Percentage of sales basis.
d. Both a and b.

PERCENTAGE OF RECEIVABLES BASIS
If the trial balance shows Allowance for Doubtful Accounts with a credit balance of $528, and the required ending balance in the account is $2,228, an adjusting entry for $1,700 ($2,228 - $528) is necessary.
Date Account Titles Debit Credit
General Journal
Dec. 31 Bad Debts Expense 1,700Allowance for Doubtful Accounts 1,700

• Companies frequently dispose of accounts
receivable in one of two ways:
1 sell to a factor such as a finance company or a bank
| factor buys receivables from businesses for a fee and collects the payments
directly from customers
2 make credit card sales
DISPOSING OF ACCOUNTS RECEIVABLE
STUDY OBJECTIVE 4

SALE OF RECEIVABLES
Hendrendon Furniture factors $600,000 of receivables to Federal Factors, Inc. Federal Factors assesses a service charge of 2% of the amount of receivables sold.
Date Account Titles Debit Credit
General Journal
Cash 588,000
Service Charge Expense (2% x $600,000) 12,000
Accounts Receivable 600,000

• Credit cards– used by retailers who wish to avoid the
paperwork of issuing credit– cash is received quickly from the credit card
issuer
• National credit cards– Visa, MasterCard, Discover, and American
Express
CREDIT CARD SALES
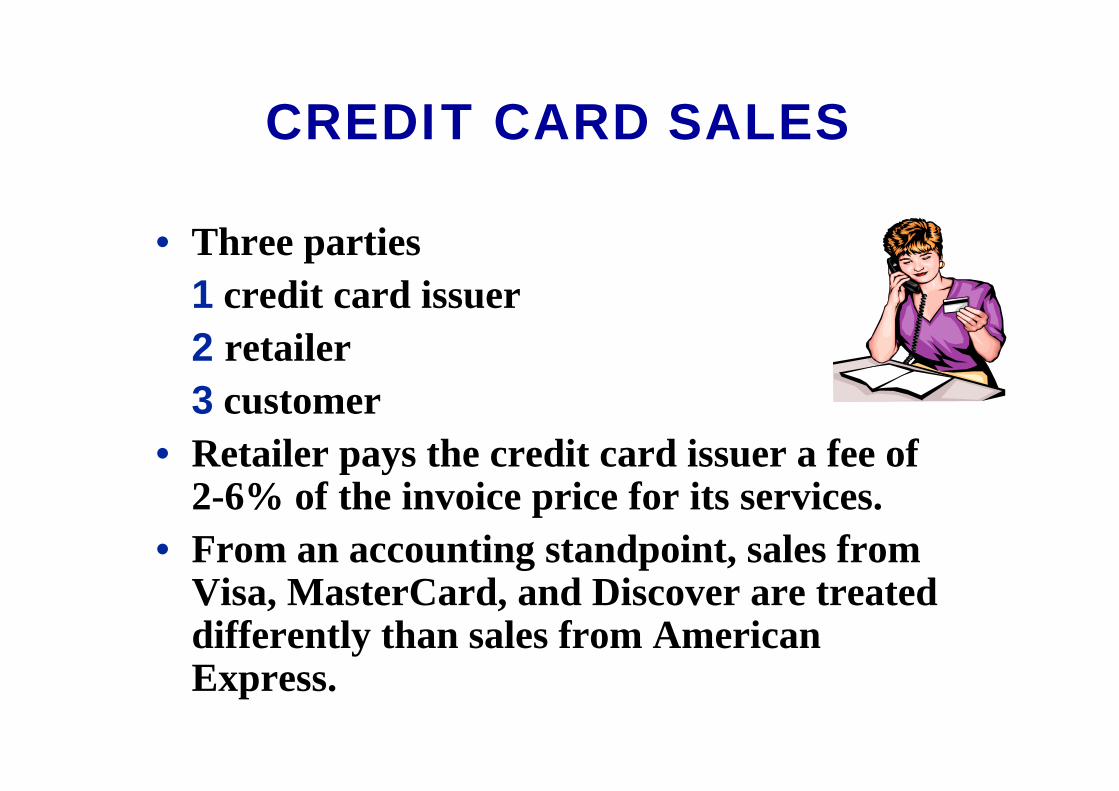
• Three parties
1 credit card issuer
2 retailer
3 customer
• Retailer pays the credit card issuer a fee of 2-6% of the invoice price for its services.
• From an accounting standpoint, sales from Visa, MasterCard, and Discover are treated differently than sales from American Express.
CREDIT CARD SALES

VISA, MASTERCARD, AND DISCOVER SALES
• VISA, MasterCard, and Discover– cards issued by banks
– considered cash sales by the retailer
• Upon receipt of credit card sales slips from a retailer– the bank immediately adds the amount to the
seller’s bank balance

VISA, MASTERCARD, AND DISCOVER SALES
Anita Ferreri purchases a number of compact discs for her restaurant from Karen Kerr Music Co. for $1,000 using her VISA First Bank Card. The service fee that First Bank charges is 3%.
Date Account Titles Debit Credit
General Journal
Cash 970
Service Charge Expense 30
Sales 1,000

AMERICAN EXPRESS SALES
• American Express cards
–reported as credit sales, not cash sales
• Conversion to cash does not occur until the American Express remits the net amount to the seller.

AMERICAN EXPRESS SALES
Four Seasons Restaurant accepts an American Express card for a $300 bill. The service fee that American Express charges is 5%.
Date Account Titles Debit Credit
General Journal
Accounts Receivable – American Express 285
Service Charge Expense 15
Sales 300

• Promissory note– written promise to pay a specified amount
of money on demand or at a definite time.
• Maker– The party making the promise.
• Payee– The party to whom
payment is made.
NOTES RECEIVABLE

• Life of the note expressed in terms of months
– the due date is found by counting the
months from the date of issue
• Example: The maturity date of a 3-month note dated May 31 is August 31.
NOTES RECEIVABLE

• Life of the note is expressed in terms of days
– you need to count the days.
– the date of issue is omitted but the due date is included.
• Example: The maturity date of a 60-day note dated July 17 is:
DETERMINING THE MATURITY DATE
STUDY OBJECTIVE 5
Term of note 60July 31 – 17 14August 31 45
Maturity date: September 15

The basic formula for computing interest on an interest-bearing note is:
The interest rate specified on the note is an annual rate of interest.
FORMULA FOR COMPUTING INTEREST
Face Valueof Note
Annual Interest
Rate
Timein Terms of
One YearInterestX X =

Helpful hint: The interest rate specified is the annual rate.
Terms of Note Interest Computation
Face X Rate X Time = Interest$ 730, 18%, 120 days$1,000, 15%, 6 months$2,000, 12%, 1 year
$ 730 X 18% X 120/360 = $ 43.80 $1,000 X 15% X 6/12 = $ 75.00 $2,000 X 12% X 1/1 = $240.00
COMPUTATION OF INTEREST

RECOGNIZING NOTES RECEIVABLE
STUDY OBJECTIVE 6
Wilma Company receives a $1,000, 2-month, 12% promissory note from Brent Company to settle an open account.
Date Account Titles Debit Credit
General Journal
May 1 Notes Receivable 1,000Accounts Receivable – Brent Company 1,000

• Like accounts receivable, short-term notes receivable are reported at their cash (net) realizable value.
• The notes receivable allowance account is Allowance for Doubtful Accounts.
VALUING NOTES RECEIVABLE
STUDY OBJECTIVE 7

HONOR OF NOTES
RECEIVABLESTUDY OBJECTIVE 8
l A note is honored when it is paid in full at its maturity date.
l For an interest-bearing note, the amount due at maturity is
the face value of the note plus interest for the length of
time specified on the note.
l Betty Co. lends Wayne Higley Inc. $10,000 on June 1, accepting a 5-month, 9% interest-bearing note.
l Betty Co. collects the maturity value of the note from Wayne Higley Inc. on November 1.
Nov. 1 Cash 10,375
Notes Receivable 10,000 Interest Revenue 375 (To record collection of Higley
Inc. note)

HONOR OF NOTES RECEIVABLE
If Betty Co. prepares prepares financial statements as of September 30, interest for 4 months, or $300, would be accrued.
Sept. 30 Interest Receivable
Interest Revenue (To accrue 4 months’ interest)
300300

HONOR OF NOTES RECEIVABLE
When interest has been accrued, it is necessary to credit Interest Receivable at maturity.
Nov. 1 Cash 10,375
Notes Receivable 10,000 Interest Receivable 300 Interest Revenue 75

DISHONOR OF NOTES RECEIVABLE
l A dishonored note is a note that is not paid in full at maturity.
l A dishonored note receivable is no longer negotiable.
l Since the payee still has a claim against the maker of the note, the balance in Notes Receivable is usually transferred to Accounts Receivable.
Date Account Titles Debit Credit
General Journal
Nov. 1 Accounts Receivable 10,375Notes Receivable 10,000Interest Revenue 375

BALANCE SHEET PRESENTATION OF RECEIVABLES
STUDY OBJECTIVE 9
• In the balance sheet, short-term receivables are reported in the current assets section below short-term investments.
• Report both the gross amount of receivables and the allowance for doubtful accounts.

ACCOUNTS RECEIVABLE TURNOVER RATIO AND
COMPUTATION• Ratios are computed to evaluate the liquidity of a
company’s accounts receivable.• Accounts receivables turnover ratio used to assess the
liquidity of the receivables.• If Cisco had net credit sales of $18, 915 million for the year
and beginning net accounts receivable balance of $1,466 million and ending net accounts receivable balance of $1,105 million, then:
$18,915 / ($1,466 + $1,105)/2 = 14.7 times
Net CreditSales
Average Net Receivables
AccountsReceivableTurnover
/ =

AVERAGE COLLECTION PERIOD FOR RECEIVABLES FORMULA
AND COMPUTATION• Variant of the turnover ratio that makes liquidity even
more evident. • This is done by dividing the turnover ratio into 365
days. The general rule is that the collection period should not exceed the credit term period.
• Cisco’s turnover ratio is computed as:
Days in Year/AR Turnover = Average Collection Period in Days
365 days / 14.7 times = 24.8 days

Which of the following statements about VISA credit card sales is incorrect?
a. The credit card issuer makes the
credit investigation of the customer.
b. The retailer is not involved in the
collection process.
c. Two parties are involved.

Which of the following statements about VISA credit card sales is incorrect?
a. The credit card issuer makes the credit investigation of the customer.
b. The retailer is not involved in the collection process.
c. Two parties are involved.

John Wiley & Sons, Inc. © 2005
Chapter 10Chapter 10
Plant Assets, Natural Resources, and
Intangible Assets
Prepared by Naomi KarolinskiPrepared by Naomi KarolinskiMonroe Community CollegeMonroe Community College
andand
Marianne BradfordMarianne BradfordBryant CollegeBryant College
Accounting Principles, 7Accounting Principles, 7thth EditionEdition
Weygandt Weygandt •• Kieso Kieso •• KimmelKimmel

CHAPTER 10PLANT ASSETS, NATURAL RESOURCES,
AND INTANGIBLE ASSETS
After studying this chapter, you should be able to:
1 Describe how the cost principle applies to plant assets.
2 Explain the concept of depreciation.
3 Compute periodic depreciation using different methods.
4 Describe the procedure for revising periodic depreciation.
5 Distinguish between revenue and capital expenditures, and explain the entries for these expenditures.

PLANT ASSETS, NATURAL RESOURCES, AND INTANGIBLE
ASSETS
After studying this chapter, you should be able to:
6 Explain how to account for the disposal of a plant asset.
7 Compute periodic depletion of natural resources.
8 Explain the basic issues related to accounting for intangible assets.
9 Indicate how plant assets, natural resources, and intangible assets are reported and analyzed.

• Plant assets– tangible resources used in the operations of a business
– not intended for sale to customers
• Plant assets are subdivided into four classes:
1 Land
2 Land improvements
3 Buildings
4 Equipment
PLANT ASSETS

• Plant assets are recorded at cost in accordance with the cost principle.
• Cost – consists of all expenditures necessary to
acquire the asset and make it ready for its intended use
– includes purchase price, freight costs, and installation costs
• Expenditures that are not necessary– recorded as expenses, losses, or other assets
DETERMINING THE COST OF PLANT ASSETS
STUDY OBJECTIVE 1

• The cost of Land includes:
1 cash purchase price
2 closing costs such as title and
attorney’s fees
3 real estate brokers’ commissions
4 accrued property taxes and other liens on the
land assumed by the purchaser.
• All necessary costs incurred to make land ready
for its intended use are debited to the Land
account.
LAND

COMPUTATION OF COST OF LAND
Land
Cash price of property $ 100,000Net removal cost of warehouse 6,000Attorney’s fee 1,000Real estate broker’s commission 8,000
Cost of land $ 115,000
Sometimes purchased land has a building on it that must be removed before construction of a new building. In this case, all demolition and removal costs, less any proceeds from salvaged materials are debited to the Land account.
Sometimes purchased land has a building on it that must be removed before construction of a new building. In this case, all demolition and removal costs, less any proceeds from salvaged materials are debited to the Land account.

The cost of land improvements includes:
all expenditures needed to make the improvements ready for their intended use such as:
1 parking lots
2 fencing
3 lighting
LAND IMPROVEMENTS

• The cost– includes all necessary expenditures relating to the purchase or
construction of a building:– costs include the purchase price, closing costs, and broker’s
commission
• Costs to make the building ready for its intended use include– expenditures for remodeling and replacing or
repairing the roof, floors, wiring, and plumbing
• If a new building is constructed, costs include– contract price plus payments for architects’
fees, building permits, interest payments duringconstruction, and excavation costs
BUILDINGS

• Cost of equipment
– consists of the cash purchase price and certain related costs
– costs include sales taxes, freight charges, and insurance paid by the purchaser during transit
– includes all expenditures required in assembling, installing, and testing the unit
• Recurring costs such as licenses and insurance are expensed as incurred.
EQUIPMENT

Factory Machinery
Cash price $ 50,000Sales taxes 3,000Insurance during shipping 500Installation and testing 1,000
Cost of factory machinery $ 54,500
ENTRY TO RECORD PURCHASE OF MACHINERY
The summary entry to record the cost of the factory machinery and related expenditures is as follows:
Factory Machinery 54,500
Cash 54,500

COMPUTATION OF COST OF DELIVERY TRUCK
The cost of equipment consists of the cash purchase price, sales taxes, freight charges, and insurance during transit paid by the purchaser. It also includes expenditures required in assembling, installing, and testing the unit. However, motor vehicle licenses and accident insurance on company cars and trucks are expensed as incurred, since they represent annual recurring events that do not benefit future periods.
The cost of equipment consists of the cash purchase price, sales taxes, freight charges, and insurance during transit paid by the purchaser. It also includes expenditures required in assembling, installing, and testing the unit. However, motor vehicle licenses and accident insurance on company cars and trucks are expensed as incurred, since they represent annual recurring events that do not benefit future periods.
Delivery Truck
Cash price $ 22,000 Sales taxes 1,320 Painting and lettering 500
Cost of delivery truck $ 23,820

Delivery Truck
Cash price $ 22,000Sales taxes 1,320Painting and lettering 500
Cost of delivery truck $ 23,820
ENTRY TO RECORD PURCHASE OF TRUCK
The entry to record the cost of the delivery truck and related expenditures is as follows:
Account Titles and Explanation Debit Credit
Delivery Truck License Expense Prepaid Insurance Cash (To record purchase of delivery truck and related expenditures)
23,82080
1,600
25,500

• Depreciation– allocation of the cost of a plant asset to expense over its
useful (service) life in a rational and systematic manner.
• Cost allocation – provides for the proper matching of expenses with revenues
in accordance with the matching principle.
• Usefulness may decline because of wear and tear or obsolescence.
• Depreciation does not result in an accumulation of cash for the replacement of the asset.
• Land – is the only plant asset that is not depreciated.
DEPRECIATIONSTUDY OBJECTIVE 2

THREE FACTORS THAT AFFECT THE THREE FACTORS THAT AFFECT THE COMPUTATION OF DEPRECIATION ARE:COMPUTATION OF DEPRECIATION ARE:
1 Cost:all expenditures necessary to acquire the asset and make it
ready for intended use
2 Useful life: estimate of the expected life based on need for repair,
service life, and vulnerability to obsolescence
3 Salvage value:estimate of the asset’s value at the end of its useful life
FACTORS IN COMPUTING DEPRECIATION

DEPRECIATION

Depreciation is a process of:
a. valuation.
b. cost allocation.
c. cash accumulation.
d. appraisal.

Depreciation is a process of:
a. valuation.
b. cost allocation.
c. cash accumulation.
d. appraisal.

USE OF DEPRECIATION METHODS IN 600 LARGE U.S.
COMPANIESSTUDY OBJECTIVE 3
Three methods of recognizing depreciation are: 1 Straight-line, 2 Units of activity, and 3 Declining-balance. Each method is acceptable under generally accepted accounting principles. Management selects the method that is appropriate in the circumstances. Once a method is chosen, it should be applied consistently.
Three methods of recognizing depreciation are: 1 Straight-line, 2 Units of activity, and 3 Declining-balance. Each method is acceptable under generally accepted accounting principles. Management selects the method that is appropriate in the circumstances. Once a method is chosen, it should be applied consistently.
82% Straight-line
4% Declining balance
5% Units-of-activity
9% Other
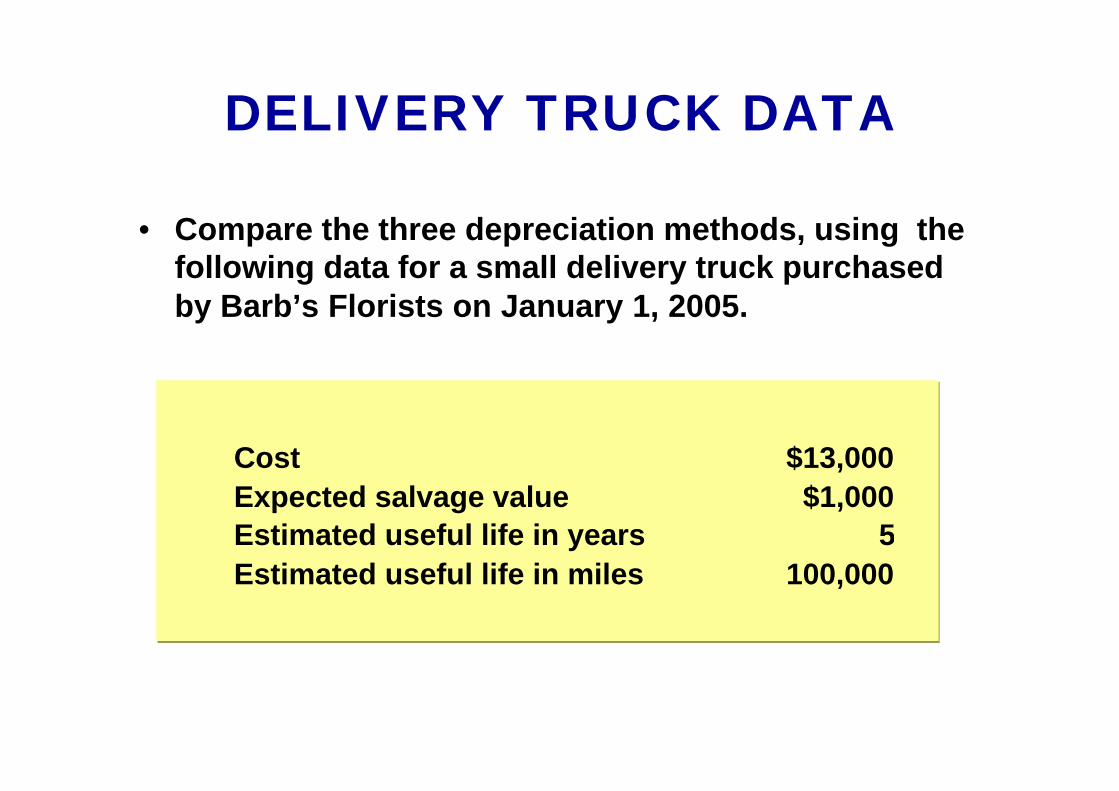
DELIVERY TRUCK DATA
• Compare the three depreciation methods, using the following data for a small delivery truck purchased by Barb’s Florists on January 1, 2005.
Cost $13,000
Expected salvage value $1,000
Estimated useful life in years 5
Estimated useful life in miles 100,000

• Straight-line method– Depreciation is the same for each year of the
asset’s useful life.
– It is measured solely by the passage of time.
• It is necessary to determine depreciable cost.
• Depreciable cost– total amount subject to depreciation and is
computed as follows:
• Cost of asset - salvage value
STRAIGHT-LINE

FORMULA FOR STRAIGHT-LINE METHOD
The formula for computing annual depreciation expense is:
Depreciable Cost / Useful Life (in years) = Depreciation Expense
The formula for computing annual depreciation expense is:
Depreciable Cost / Useful Life (in years) = Depreciation Expense
CostSalvage
ValueDepreciable
Cost
UsefulLife (in Years)
Annual Depreciation
Expense
DepreciableCost
hh
$13,000 - $1,000 = $12,000
$12,000 ÷ 5 = $2,400

• Useful life = total units of production or total expected use expressed in hours, miles, etc.
• Depreciable Cost ÷ Total Units of Activity = Depreciation Cost per Unit
• Depreciation Cost per Unit X Units of Activity During the Year = Annual Depreciation Expense
– It is often difficult to make a reasonable estimate of total activity.
• When productivity varies from one period to another, this method results in the best matching of expenses with revenues.
UNITS-OF-ACTIVITY

FORMULA FOR UNITS-OF-ACTIVITY METHOD
To use the units-of-activity method, 1) the total units of activity for the entire useful life are estimated, 2) the amount is divided into depreciable cost to determine the depreciation cost per unit, and 3) the depreciation cost per unit is then applied to the units of activity during the year to determine the annual depreciation.
To use the units-of-activity method, 1) the total units of activity for the entire useful life are estimated, 2) the amount is divided into depreciable cost to determine the depreciation cost per unit, and 3) the depreciation cost per unit is then applied to the units of activity during the year to determine the annual depreciation.
Depreciable Cost
Total Units of Activity
DepreciableCost per Unit
$12,000 ÷ 100,000 miles = $0.12
hh
Units ofActivity during
the Year
Annual Depreciation
Expense
DepreciableCost per Unit
$0.12 x 15,000 miles = $1,800

DECLINING-BALANCE
• Decreasing annual depreciation expense over the asset’s useful life
• Periodic depreciation is based on a *declining book value– (cost - accumulated depreciation)
• To compute annual depreciation expense– Multiply the book value at the beginning of the
year by the declining-balance depreciation rate
• Depreciation rate remains constant from year to year– book value declines each year

• Book value for the first year is the cost of the asset. – Balance in accumulated depreciation at the beginning of the asset’s
useful life is zero
• In subsequent years, book value is the difference between cost and accumulated depreciation at the beginning of the year.
• Formula for computing depreciation expense:
• Book Value at Beginning of Year x Declining Balance Rate = Annual Depreciation Expense
• Method compatible with the matching principle – the higher depreciation in early years is matched with the higher
benefits received in these years.
DECLINING-BALANCE

FORMULA FOR DECLINING-BALANCE METHOD
Unlike the other depreciation methods, salvage value is ignored in determining the amount to which the declining balance rate is applied.
A common application of the declining-balance method is the double-declining-balance method, in which the declining-balance rate is double the straight-line rate.
If Barb’s Florists uses the double-declining-balance method, the depreciation is 40% (2 X the straight-line rate of 20%).
Units ofActivity during
the Year
Annual Depreciation
Expense
DepreciableCost per Unit
$13,000 x 40% = $5,200
=

PATTERNS OF DEPRECIATION

• Changes should be made
– Excessive wear and tear or obsolescence indicate that annual depreciation estimates are inadequate.
• When a change is made
– No correction of previously recorded depreciation expense
– Depreciation expense for current and future years is revised
• To determine the new annual depreciation expense
– The depreciable cost at the time of the revision is divided by the
remaining useful life.
REVISING PERIODIC
DEPRECIATIONSTUDY OBJECTIVE 4

REVISED DEPRECIATION COMPUTATION
Barb’s Florists decides on January 1, 2008, to extend the useful life of the truck one year because of its excellent condition. The company has used the straight-line method to depreciate the asset to date, and book value is $5,800 ($13,000 - $7,200). The new annual depreciation is $1,600, calculated as follows:
Barb’s Florists decides on January 1, 2008, to extend the useful life of the truck one year because of its excellent condition. The company has used the straight-line method to depreciate the asset to date, and book value is $5,800 ($13,000 - $7,200). The new annual depreciation is $1,600, calculated as follows:
Book value, 1/1/08 $5,800Less: Salvage value 1,000Depreciable cost $4,800
Remaining useful life 3 years (2008-2010)
Revised annual depreciation ($4,800 ÷ 3) $1,600

• Ordinary repairs–expenditures to maintain the operating
efficiency and productive life of the unit
–such repairs are debited to Repairs Expense as
incurred and are often referred to as revenue
expenditures.
EXPENDITURES DURING USEFUL LIFE
STUDY OBJECTIVE 5

•Capital expenditures
• Additions and improvements – increase the operating efficiency, productive
capacity, or useful life of a plant asset
1 Usually material in amount and occur
infrequently.
2 Increase the company’s investment in
productive facilities.
Debit the plant asset affected.
EXPENDITURES DURING USEFUL LIFE

• Retirement
– Plant asset is scrapped or discarded.
– Eliminate the book value of the plant asset at the date of sale by debiting Accumulated Depreciation and crediting the asset account for its cost.
– Debit Cash to record the cash proceeds from the sale.
– Compute gain or loss.
• If the cash proceeds > the book value– recognize a gain by crediting Gain on Disposal for the
difference.
• If the cash proceeds are < the book value– recognize a loss by debiting Loss on Disposal for the
difference.
PLANT ASSET DISPOSALSSTUDY OBJECTIVE 6

PLANT ASSET DISPOSALS
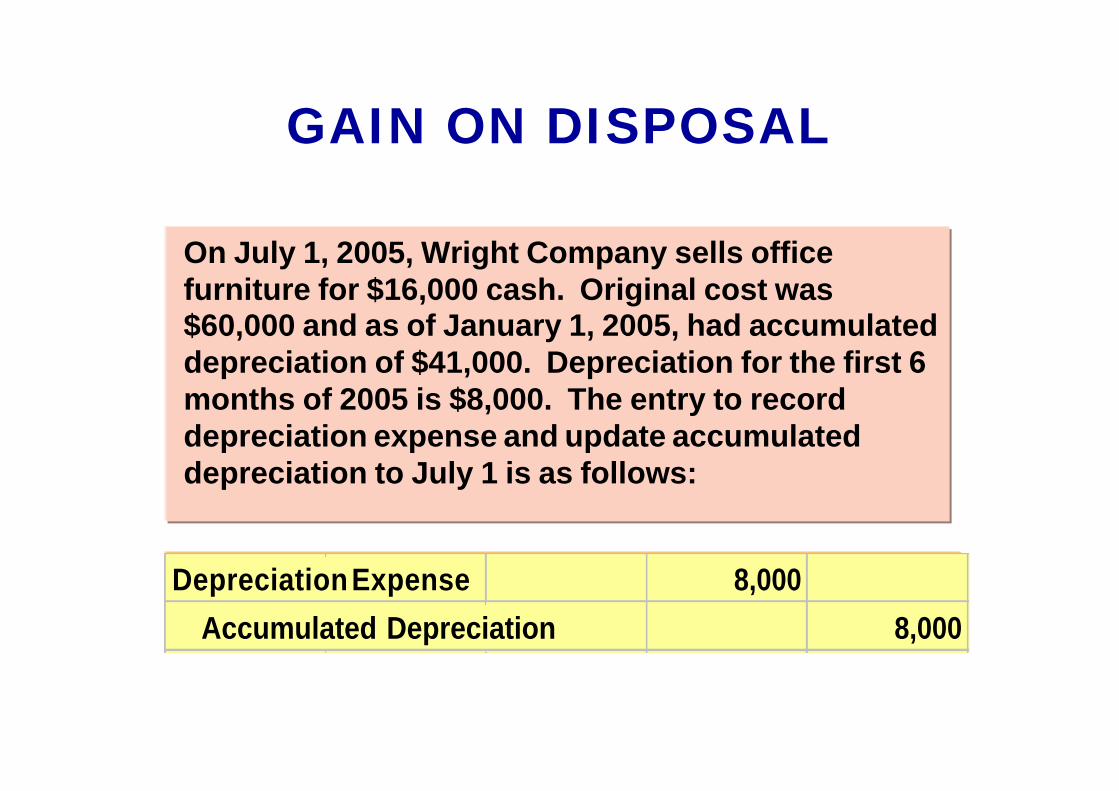
On July 1, 2005, Wright Company sells office furniture for $16,000 cash. Original cost was $60,000 and as of January 1, 2005, had accumulated depreciation of $41,000. Depreciation for the first 6 months of 2005 is $8,000. The entry to record depreciation expense and update accumulated depreciation to July 1 is as follows:
GAIN ON DISPOSAL
Depreciation Expense 8,000
Accumulated Depreciation 8,000

GAIN ON DISPOSAL
After the accumulated depreciation is updated, a gain on disposal of $5,000 is computed:
Cost of office furniture $ 60,000 Less: Accumulated depreciation ($41,000 + $8,000) 49,000
Book value at date of disposal 11,000 Proceeds from sale 16,000
Gain on disposal $ 5,000
The entry to record the sale and
the gain on disposal is as follows:
Cash 16,000
Accumulated Depr.-Office Furniture 49,000
Office Furniture 60,000
Gain on Disposal 5,000

LOSS ON DISPOSAL
Instead of the selling the office furniture for $16,000, Wright sells it for $9,000. In this case, a loss of $2,000 is computed:
Cost of office furniture $ 60,000Less: Accumulated depreciation ($41,000 + $8,000) 49,000
Book value at date of disposal 11,000Proceeds from sale 9,000
Loss on disposal $ 2,000
The entry to record the sale and the loss on disposal is as follows:
Cash 9,000
Accumulated Depr.-Office Furniture 49,000
Loss on Disposal 2,000
Office Furniture 60,000

• Natural resources– consists of standing timber and underground deposits
of oil, gas, and minerals
• These long-lived productive assets have two distinguishing characteristics:
1 They are physically extracted in operations.
2 They are replaceable only by an act of nature.
NATURAL RESOURCESSTUDY OBJECTIVE 7

DEPLETION
DEPLETION
• Allocation of the cost of natural resources to expense in a rational and systematic manner over the resource’s useful life.
• Units-of-activity method is generally used to compute depletion.
– depletion generally is a function of the units extracted during the year

FORMULA TO COMPUTE DEPLETION EXPENSE
Total Estimated
Units
DepletionCost per
Unit
hh
Total Cost minus Salvage
Value
DepletionCost per
Unit
Number ofUnits
Extracted and Sold
Annual DepletionExpense
Helpful hint: This computation for depletion is similar to the computation for depreciation using the units-of-activity method of depreciation.
Helpful hint: This computation for depletion is similar to the computation for depreciation using the units-of-activity method of depreciation.

RECORDING DEPLETION
The Lane Coal Company invests $5 million in a mine estimated to have 10 million tons of coal and no salvage value. In the first year, 800,000 tons of coal are extracted and sold. Using the formulas, the calculations are as follows:
$5,000,000 ÷ 10,000,000 = $.50 depletion cost per ton$.50 X 800,000 = $400,000 depletion expense
The entry to record depletion expense for the first year of operations is as follows:
Depletion Expense 400,000
Accumulated Depletion 400,000

STATEMENT PRESENTATION OFACCUMULATED DEPLETION
Accumulated Depletion is a contra asset account similar to accumulated depreciation. It is deducted from the cost of the natural resource in the balance sheet as follows:
Lane Coal Company Balance Sheet (partial)
Coal mine $5,000,000
Less: Accumulated depletion 400,000 $4,600,000

• Intangible assets– Rights, privileges, and competitive advantages
that result from the ownership of long lived assets that do not possess physical substance
– May arise from government grants, acquisition of another business, and private monopolistic arrangements
INTANGIBLE ASSETSStudy Objective 8
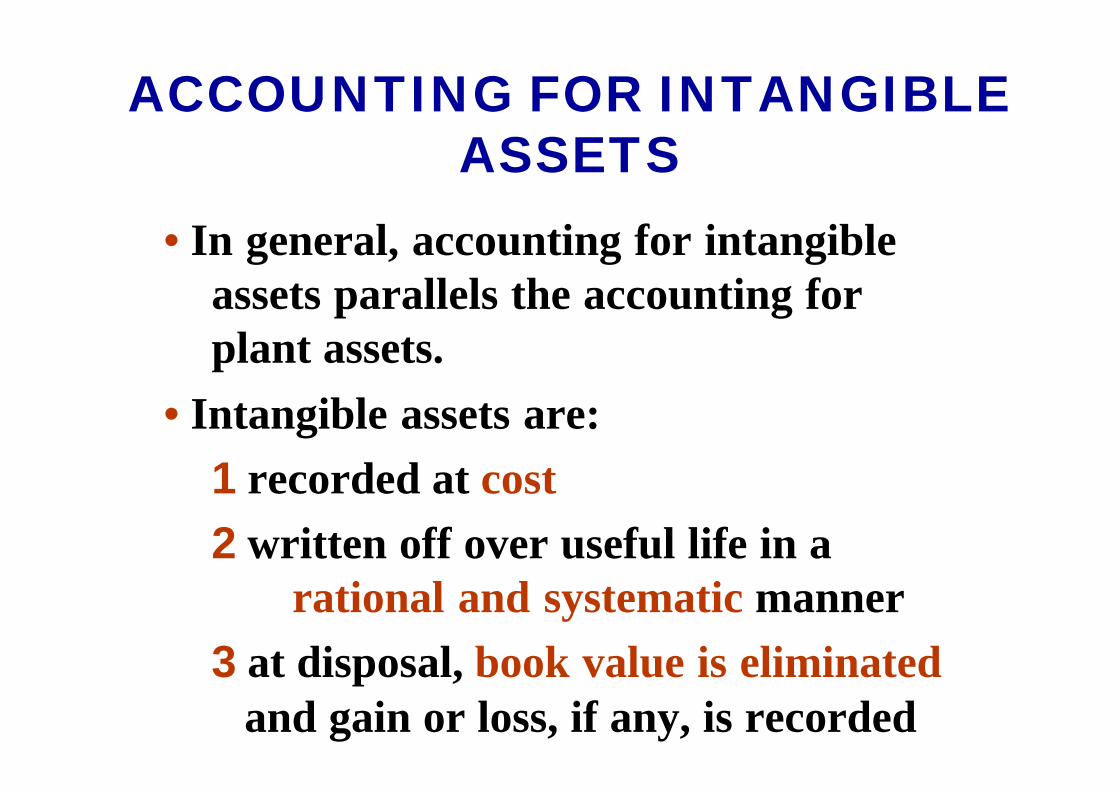
• In general, accounting for intangible assets parallels the accounting for plant assets.
• Intangible assets are:
1 recorded at cost
2 written off over useful life in a rational and systematic manner
3 at disposal, book value is eliminatedand gain or loss, if any, is recorded
ACCOUNTING FOR INTANGIBLE ASSETS

• Key differences between accounting for intangible assets and accounting for plant assets include:– The systematic write-off of an intangible asset is
referred to as amortization
• To record amortization– Debit Amortization Expense and credit the
specific intangible asset – Intangible assets typically amortized on a straight-
line basis
ACCOUNTING FOR INTANGIBLE ASSETSSTUDY OBJECTIVE 8

• A patent– exclusive right issued by the Patent Office – manufacture, sell, or otherwise control an invention
for a period of 20 years from the date of grant
• Cost of a patent– initial cost is the cash or cash equivalent price paid to
acquire the patent– legal costs – amount an owner incurs in successfully
defending a patent are added to the Patentaccount and amortized over the remaining useful life of the patent
– should be amortized over its 20-year legal life or its useful life, whichever is shorter.
PATENTS

RECORDING PATENTS
National Labs purchases a patent at a cost of $60,000. If the useful life of the patent is 8 years, the annual amortization expense is $7,500 ($60,000 ÷ 8). Amortization Expense is classified as an operating expense in the income statement. The entry to record the annual patent amortization is:
Amortization Expense 7,500
Patents 7,500

• Copyrights
– grants from the federal government
– gives the owner the exclusive right to reproduce and sell an artistic or published work
• Copyrights extend for the life of the creator plus 70 years.
• The cost of a copyright is the cost of acquiring and defending it.
COPYRIGHTS

• A trademark or trade name– word, phrase, jingle or symbol identifying a
particular enterprise or product
• Trademark or trade name purchased– the cost is purchase price
• Trademark developed by a company– the cost includes attorney’s fees, registration
fees, design costs and successful legal defense
fees
TRADEMARKS AND TRADE NAMES
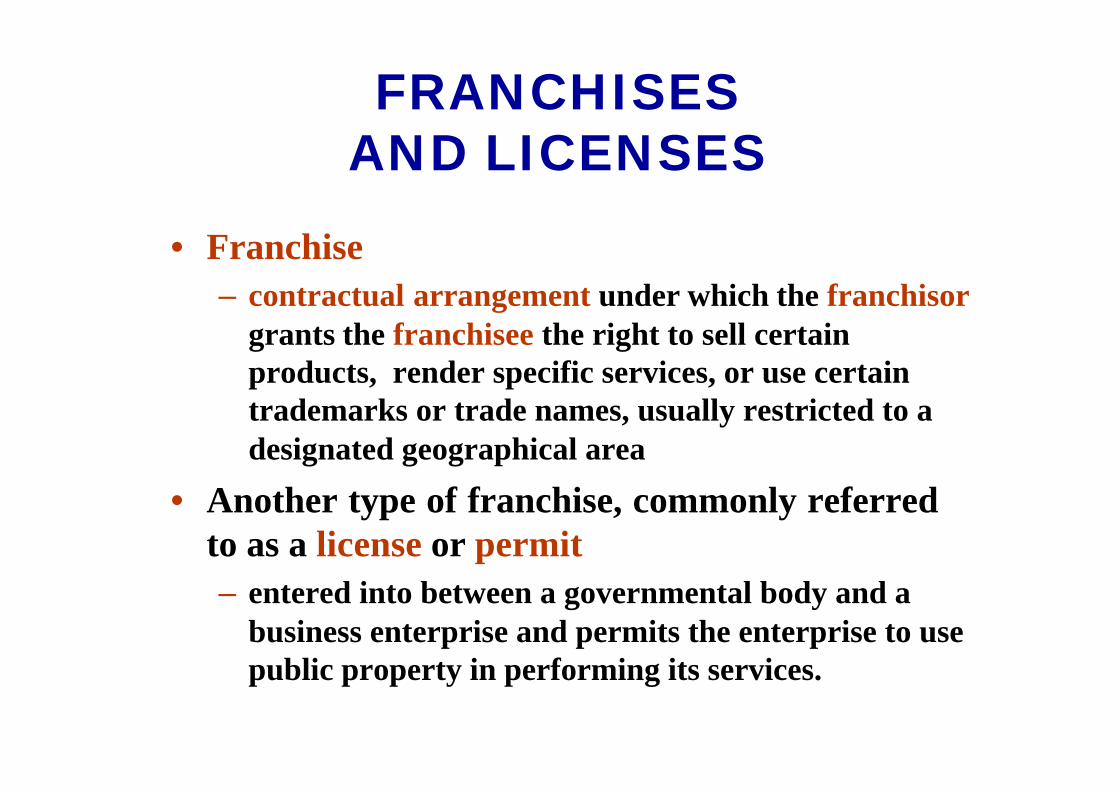
• Franchise
– contractual arrangement under which the franchisorgrants the franchisee the right to sell certain products, render specific services, or use certain trademarks or trade names, usually restricted to a designated geographical area
• Another type of franchise, commonly referred to as a license or permit
– entered into between a governmental body and a business enterprise and permits the enterprise to use public property in performing its services.
FRANCHISES AND LICENSES

• Goodwill– value of all favorable attributes that relate to a
business enterprise
– attributes may include exceptional management, desirable location, good customer relations and skilled employees
– cannot be sold individually in the marketplace; it can be identified only with the business as a whole
GOODWILL

• Goodwill– recorded only when a transaction involves the
purchase of an entire business
– excess of cost over the fair market value of the net assets (assets less liabilities) acquired
– not amortized
– reported under Intangible Assets
GOODWILL

• Research and development costs– pertain to expenditures incurred to develop
new products and processes
• These costs are not intangible costs– recorded as an expense when incurred
RESEARCH AND DEVELOPMENT COSTS

• Plant assets and natural resources– Under “property, plant, and equipment” in the
balance sheet
– Major classes of assets, such as land, buildings, and equipment, and accumulated depreciation by major classes or in total should be disclosed
– Depreciation and amortization methods that were used should be described. Finally, the amount of depreciation and amortization expense for the period should be disclosed
• Intangibles are shown separately under intangible assets
FINANCIAL STATEMENT PRESENTATION
STUDY OBJECTIVE 9

LANDS’ END’S PRESENTATION OF PROPERTY, PLANT, AND EQUIPMENT,
AND INTANGIBLES
The financial statement presentation of property, plant, and equipment by Lands’ End in its 2005 balance sheet is quite brief, as shown below:
The notes to Lands’ End financial statements present greater details, namely, that “intangibles” contains goodwill and trademarks…
Jan. 28, 2005 Jan. 29, 2004
Property, plant and equipment, at costs
Land and buildings 102,776 102,018
Fixtures and equipment 175,910 154,663
Leasehold improvements 4,453 5,475
Total property, plant and equipment 283,139 262,156
Less: accumulated depr. and amort. 117,317 101,570
Property, plant and equipment, net 165,822 160,586
Intangibles, net 966 1,030
Balance Sheet - Partial
December 31, 2005 (in thousands)

PRESENTATION OF PROPERTY, PLANT, AND EQUIPMENT AND
INTANGIBLE ASSETS
OWENS-ILLINOIS, INC.Balance Sheet - Partial(In millions of dollars)
Property, plant, and equipment
Timberlands, at cost, less accumulated depletion $ 95.4Buildings and equipment, at cost $ 2,207.1Less: Accumulated depreciation 1,229.0 978.1
Total property, plant, and equipment $ 1,073.5Intangibles
Patents 410.0
Total $ 1,483.5
A more comprehensive presentation of property, plant, and equipmentis excerpted from the balance sheet of Owens-Illinois and shown below.

• Exchanges – can be for similar or dissimilar assets
– For similar assets, the new asset performs the same function as the old asset
• Necessary to determine two things:
1) the cost of the asset acquired
2) the gain or loss on the asset given up
EXCHANGES OF PLANT ASSETS

• Losses on exchange of similar assets
– recognized immediately
• Cost of the new asset received
– equal to the fair market value of the old asset exchanged plus any cash or other consideration given up
• Losses result when the book value is greater than the fair market value of the asset given up.
LOSS TREATMENT

Fair market value of old office equipment $ 10,000 Cash 81,000
Cost of new office equipment $ 91,000
COMPUTATION OF COST OF NEW OFFICE EQUIPMENT
Roland Company exchanges old office equipment for new similar office equipment. The book value of the old office equipment is $26,000 ($70,000 cost less $44,000 accumulated depreciation), AND its fair market value is $10,000, and $81,000 of cash is paid. The cost of the new office equipment, $91,000, is calculated as follows:
Roland Company exchanges old office equipment for new similar office equipment. The book value of the old office equipment is $26,000 ($70,000 cost less $44,000 accumulated depreciation), AND its fair market value is $10,000, and $81,000 of cash is paid. The cost of the new office equipment, $91,000, is calculated as follows:

Through this exchange, a loss on disposal of $16,000 is incurred. A loss results when the book value is greater than the fair market value of the asset given up. The calculation is as follows:
COMPUTATION OF LOSS ON DISPOSAL
Book value of old office equipment ($70,000 — $44,000) $ 26,000Fair market value of old office equipment 10,000
Loss on disposal $ 16,000
In recording the exchange at a loss three steps are required: 1) eliminate the book value of the asset given up, 2) record the cost of the asset acquired, and 3) recognize the loss on disposal.
Office Equipment (new) 91,000
Accumulated Depreciation-Office Equipment 44,000
Loss on Disposal 16,000
Office Equipment (old) 70,000
Cash 81,000

• Gains of similar assets– not recognized immediately, but, are deferred
by reducing the cost basis of the new asset
• Cost of the new asset – fair market value of the old asset exchanged
plus any cash or other consideration given up
• Gains result when the fair market value is greater than the book value of the asset given up
GAIN TREATMENT

COST OF NEW EQUIPMENT (BEFORE DEFERRAL OF GAIN)
Fair market value of old delivery equipment $ 19,000 Cash 3,000
Cost of new delivery equipment (before deferral of gain) $ 22,000
Mark’s Express Delivery exchanges old delivery equipment plus $3,000 cash for new delivery equipment. The book value of the old delivery equipment is $12,000 ($40,000 cost less $28,000 accumulated depreciation), its fair market value is $19,000. The cost of the new delivery equipment, $22,000, is calculated as follows:
Mark’s Express Delivery exchanges old delivery equipment plus $3,000 cash for new delivery equipment. The book value of the old delivery equipment is $12,000 ($40,000 cost less $28,000 accumulated depreciation), its fair market value is $19,000. The cost of the new delivery equipment, $22,000, is calculated as follows:

Fair market value of old delivery equipment $ 19,000
Book value of old delivery equipment ($40,000 – $28,000)
12,000
Gain on disposal $ 7,000
For Mark’s Express Delivery, there is a gain of $7,000, calculated as follows, on the disposal:
For Mark’s Express Delivery, there is a gain of $7,000, calculated as follows, on the disposal:
COMPUTATION OF GAIN ON DISPOSAL

COST OF NEW DELIVERY EQUIPMENT (AFTER DEFERRAL
OF GAIN)
The $7,000 gain on disposal is then offset against the $22,000 cost of the new delivery equipment. The result is a $15,000 cost of the new delivery equipment, after deferral of the gain.
Cost of new delivery equipment (before deferral of gain) $ 22,000Less: Gain on disposal 7,000
Cost of new delivery equipment (after deferral of gain) $ 15,000
The entry to record the exchange is as follows:
Delivery Equipment (new) 15,000
Accumulated Depreciation - Delivery Equipment (old) 28,000
Delivery Equipment (old) 40,000
Cash 3,000

ACCOUNTING RULES FOR PLANT EXCHANGES
LossRecognize immediately by debiting Loss on Disposal
GainDefer and reduce cost of newasset
Type of Event Recognition

In exchanges of similar assets:
a. neither gains nor losses are recognized immediately.
b. gains, but not losses, are recognized immediately.
c. losses, but not gains, are recognized immediately.
d. both gains and losses are recognized immediately.

In exchanges of similar assets:
a. neither gains nor losses are recognized immediately.
b. gains, but not losses, are recognized immediately.
c. losses, but not gains, are recognized immediately.
d. both gains and losses are recognized immediately.

John Wiley & Sons, Inc. © 2005
Chapter 11Chapter 11
Current Liabilities and Payroll Accounting
Prepared by Naomi KarolinskiPrepared by Naomi KarolinskiMonroe Community CollegeMonroe Community College
andand
Marianne BradfordMarianne BradfordBryant CollegeBryant College
Accounting Principles, 7Accounting Principles, 7thth EditionEdition
Weygandt Weygandt •• Kieso Kieso •• KimmelKimmel

After studying this chapter, you should be able to:1 Explain a current liability, and identify the
major types of current liabilities.2 Describe the accounting for notes payable.3 Explain the accounting for other current
liabilities.4 Explain the financial statement presentation
and analysis of current liabilities.5 Describe the accounting and disclosure
requirements for contingent liabilities.
CHAPTER 11CURRENT LIABILITIES AND PAYROLL
ACCOUNTING

6 Discuss the objectives of internal control for payroll.
7 Compute and record the payroll for a pay period.
8 Describe and record employer payroll taxes.
CHAPTER 11CURRENT LIABILITIES AND PAYROLL
ACCOUNTING
After studying this chapter, you should be able to:

• A Current Liability is a debt with two key features:
1) expected to be paid from existing currents assets or through the creation of other current liabilities
2) paid within one year or the operating cycle, whichever is longer.
• Current liabilities include:
1) Notes Payable
2) Accounts Payable
3) Unearned Revenues
4) Accrued Liabilities
ACCOUNTING FOR CURRENT LIABILITIES
STUDY OBJECTIVE 1

The time period for classifying a liability as current is one year or the operating cycle, whichever is:
a. longer.
b. shorter.
c. probable.
d. possible.

The time period for classifying a liability as current is one year or the operating cycle, whichever is:
a. longer.
b. shorter.
c. probable.
d. possible.
• Obligations in the form of written promissory notes are recorded as notes payable.
• Those notes due for payment within one year of the balance sheet date are usually classified as current liabilities.
NOTES PAYABLESTUDY OBJECTIVE 2

When an interest-bearing note is issued, the assets received generally equal the face value of the note. Assume First National Bank agrees to lend $100,000 on March 1, 2005, if Cole Williams Co. signs a $100,000, 12%, 4-month note. Cash is debited and Notes Payable is credited.
NOTES PAYABLE
Date Account Titles Debit Credit
General Journal
March 1 Cash 100,000Notes Payable 100,000

Formula for computing interest
$100,000 x 12% x 4/12 = $4,000
Face Valueof Note
Annual Interest
Rate
Time in Terms
of One Year
Interest
The formula for computing interestand its application to Cole Williams Co.are shown below:

NOTES PAYABLENOTES PAYABLE
Interest accrues over the life of the note and must be recorded periodically. If Cole Williams Co. prepares financial statements semiannually, an adjusting entry is required to recognize interest expense and interest payable of $4,000 at June 30.
Date Account Titles Debit Credit
General Journal
June 30 Interest Expense 4,000Interest Payable 4,000

NOTES PAYABLENOTES PAYABLE
At maturity, Notes Payable is debited for the face value of the note, Interest Payable is debited for the amount of accrued interest, and Cash is credited for the maturity value of the note.
Date Account Titles Debit Credit
General Journal
July 1 Notes Payable 100,000Interest Payable 4,000
Cash 104,000

SALES TAXES PAYABLEStudy Objective 3
Sales tax is a stated percentage of the sales price on goods sold to customers by a retailer.
• The retailer collects the tax from the customer when the sale occurs.
• The retailer serves only as a collection agent for the taxing authority.

Cash register readings are used to credit Sales and Sales Taxes Payable. If on March 25th cash register readings for Cooley Grocery show sales of $10,000 and sales taxes of $600 (sales tax rate is 6%), the entry is a debit to Cash for the total, and a credit to Sales for the actual sales and Sales Taxes Payable for the amount of the sales tax.
SALES TAXES PAYABLESALES TAXES PAYABLE
Date Account Titles Debit Credit
General Journal
Mar. 25 Cash 10,600Sales 10,000Sales Tax Payable
600

n When sales taxes are not rung up separately on the cash register they must be extracted from the total receipts
n If Cooley Grocery “rings up” total receipts, which are $10,600, and the sales tax percentage is 6%, we can figure sales as follows:
$10,600 ÷ 1.06 = $10,000
SALES TAXES PAYABLESTUDY OBJECTIVE 3

• Unearned Revenues (advances from customers)– a company receives cash before a service is rendered
• Examples:– airline sells a ticket for future flights
– attorney receives legal fees before work is done
UNEARNED REVENUES

If Superior University sells 10,000 season football tickets at $50 each for its five-game home schedule, the entry for the sale of the tickets is a debit to Cash for the advance received, and a credit to Unearned Football Ticket Revenue, a current liability.
UNEARNED REVENUESUNEARNED REVENUES
Date Account Titles Debit Credit
General Journal
Aug. 6 Cash 500,000Unearned Football TicketRevenue 500,000

As each game is completed, the Unearned Football Ticket Revenue account is debited for 1/5 of the unearned revenue, and the earned revenue, Football Ticket Revenue, is credited.
UNEARNED REVENUESUNEARNED REVENUES
Date Account Titles Debit Credit
General Journal
Sept. 7 Unearned Football Ticket Rev. 100,000Football Ticket Revenue 100,000

Unearned and earned revenue accounts
Shown below are specific unearned and earned revenue accounts used in selected types of businesses.
Type of Business Unearned Revenue Earned Revenue
Airline
Unearned Passenger
Ticket Revenue
Passenger
Revenue
Magazine
Publisher
Unearned
Subscription
Revenue
Subscription
Revenue
Hotel
Unearned Rental
Revenue Rental Revenue
Insurance
Company
Unearned Premium
Revenue Premium Revenue
Account Title

CURRENT MATURITIES OF LONG-TERM DEBT
Current maturities of long-term debt
• classified as a current liability
• long-term debt due within one year

FINANCIAL STATEMENT PRESENTATION
STUDY OBJECTIVE 4
• Current liabilities– first category under liabilities on the balance sheet
– each of the principal types of current liabilities is listed separately
– seldom listed in the order of maturity
• Common methods of presenting current liabilities:
– to list them by order of magnitude, with the largest ones first
– many companies, as a matter of custom, show notes payable and accounts payable first regardless of amount.


WORKING CAPITAL FORMULA AND COMPUTATION
$14,628 - $11, 344 = $3,284
The excess of current assets over current liabilities is working capital. The formula for the computation of Caterpillar, Inc. working capital is shown below.
CurrentAssets
CurrentLiabilities
WorkingCapital- =

CURRENT RATIO AND COMPUTATION
$14,628 / = $11, 344 = 1.29:1
CurrentAssets
CurrentLiabilities
CurrentRatio/ =
The current ratio permits us to compare the liquidity of different sized companies and of a single company at different times. The current ratio for Caterpillar, Inc. is shown below.

CONTINGENT LIABILITIESSTUDY OBJECTIVE 5
Contingent liability
A potential liability that may become an actual liability in the future.

PRODUCT WARRANTIESPRODUCT WARRANTIES
n Product warranties
n example of a contingent liability that should be recorded in the accounts
n The estimated cost of honoring product warranty contracts should be recognized as an expense in the period in which the sale occurs.
n Warranty Expense is reported under selling expenses in the income statement, and estimating warranty liability is classified as a current liability on the balance sheet.

Number of units sold 10,000 Estimated rate of defective units X 5%
Total estimated defective units 500 Average warranty repair cost X $ 80
Estimated product warranty liability $ 40,000
COMPUTATION OF ESTIMATED PRODUCT WARRANTY
LIABILITY
In 2005 Denson Manufacturing Company sells 10,000washers and dryers at an average price of $600 each. The selling price includes a one-year warranty on parts. It is expected that 500 units (5%) will be defective and that warranty repair costs will average $80 per unit. The calculation of of estimated product costs on 2005 sales is as follows:
In 2005 Denson Manufacturing Company sells 10,000washers and dryers at an average price of $600 each. The selling price includes a one-year warranty on parts. It is expected that 500 units (5%) will be defective and that warranty repair costs will average $80 per unit. The calculation of of estimated product costs on 2005 sales is as follows:

ENTRIES TO RECORD WARRANTY COSTS
Denson Manufacturing Company makes the adjusting entry above to accrue the estimated warranty costs on 2005 sales. Warranty Expense is debited while Estimated Warranty Liability is credited for $40,000 at December 31.
Date Account Titles Debit Credit
General Journal
Dec 31 Warranty Expense 40,000Estimated Warranty Liability 40,000

ENTRIES TO RECORD WARRANTY COSTS
Denson Manufacturing Company makes the $24,000 (300 X $80) summary entry above to record repair costs incurred in 2005 to honor warranty contracts on 2005 sales. Estimated Warranty Liability is debited while Repair Partsand Wages Payable are credited by December 31.
Date Account Titles Debit Credit
General Journal
Jan. 1- Estimated Warranty Liability 24,000
Dec. 31 Repair Parts/Wages Payable 24,000

ENTRIES TO RECORD WARRANTY COSTS
ENTRIES TO RECORD WARRANTY COSTS
Denson Manufacturing Company replaced defective units in January 2006 for $1,600 (20 X $80) and made the summary entry above. Estimated Warranty Liability is debited while Repair Parts and Wages Payable are credited.
Date Account Titles Debit Credit
General Journal
Jan. 31 Estimated Warranty Liability 1,600Repair Parts/Wages Pay. 1,600

• Payroll pertains to both salaries and wages.
• Managerial, administrative, and sales personnel are generally paid salaries. Salaries are often expressed in terms of a specified amount per month or year.
• Store clerks, factory employees and manual laborers are normally paid wages based on a rate per hour.
• Payments made to professional individuals who are independent contractors are called fees.
• Government regulations relating to the payment and reporting of payroll taxes apply only to employees.
PAYROLL ACCOUNTINGSTUDY OBJECTIVE 6

INTERNAL CONTROLS FOR PAYROLL
• The objectives of internal accounting control concerning payroll are:
1 to safeguard company assets from unauthorized payments of payrolls and
2 to ensure the accuracy and reliability of the accounting records pertaining to payrolls.
• Payroll activities involve four functions:1 hiring employees,2 timekeeping,3 preparing the payroll, and4 paying the payroll.

HIRING EMPLOYEES
• The human resources department is responsible for ensuring the accuracy of the personnel authorization form.
• The human resources department is also responsible for authorizing changes in employment status:
1 changes in pay rates
2 termination of employment.

TIMEKEEPING
• Hourly employees are usually required to record time worked by “punching” a time clock. Times of arrival and departure are automatically recorded by the employee by inserting a time card into the clock.
• In large companies time clock procedures are often monitored by a supervisor or security guard to make sure an employee punches only one card.
• The employee’s supervisor:
1 approves the hours shown by signing the time card at the end of the pay period and
2 authorizes any overtime hours for an employee.

PREPARING THE PAYROLL
The payroll is prepared in the payroll department on the basis of two inputs:
1 human resources department authorizations
2 approved time cards.

DETERMINING AND PAYING THE PAYROLL
STUDY OBJECTIVE 7
• Determining the payroll involves computing three amounts:
1 gross earnings
2 payroll deductions
3 net pay
• The payroll is paid by the treasurer’s department.
1 Payment by check minimizes the risk of loss from theft and
2 the endorsed check provides proof of payment.

Gross Type of Pay Hours X Rate = Earnings
Regular 40 X $ 12.00 = $ 480.00 Overtime 4 X 18.00 = 72.00
Total wages $ 552.00
• Gross earnings is the total compensation earned by an employee.
• It consists of wages or salaries, plus any bonuses and commissions.
• Total wages are determined by multiplying the hours worked by the hourly rate of pay.
• Most companies are required to pay a minimum of 1 1/2 the regular hourly rate for overtime work.
COMPUTATION OF TOTAL WAGES

PAYROLL DEDUCTIONS
• The difference between gross pay and the amount actually received is attributable to payroll deductions.
• Mandatory deductions consist of FICA taxes and income taxes.
• The employer is merely a collection agent and subsequently transfers the amounts deducted to the government and designated recipients.

PAYROLL DEDUCTIONS

FICA TAXES
• FICA taxes (or social security taxes) are designed to provide workers with supplemental retirement, employment disability, and medical benefits.
• The benefits are financed by a tax levied on employees’ earnings.
• The tax rate and tax base for FICA taxes are set by Congress.

• Income taxes are required to be withheld from employees each pay period
• Amount is determined by 3 variables:
1 the employee’s gross earnings
2 the number of allowances claimed by the employee
3 the length of the pay period
• To indicate to the Internal Revenue Service the
number of allowances claimed, the employee must
complete an Employee’s Withholding Certificate
(Form W-4).
INCOME TAXES

VOLUNTARY DEDUCTIONS
• Voluntary Deductions – pertain to withholdings for charitable,
retirement, and other purposes
– authorized in writing by the employee.

Gross earnings $ 552.00Payroll deductions: FICA taxes $ 44.16 Federal income taxes 49.00 State income taxes 11.04 United Fund 10.00 Union dues 5.00 119.20Net pay $ 432.80
Net pay (or take-home pay) is determined by subtracting payroll deductions from gross earnings. Assuming an employee’s wages are $552 each week, the employee will earn $28,704 for the year (52 weeks X $552). Thus, all earnings are subject to FICA taxes.
Net pay (or take-home pay) is determined by subtracting payroll deductions from gross earnings. Assuming an employee’s wages are $552 each week, the employee will earn $28,704 for the year (52 weeks X $552). Thus, all earnings are subject to FICA taxes.
COMPUTATION OF NET PAYCOMPUTATION OF NET PAY

• Employee earnings record 1 determines when an employee has earned
the maximum earnings subject to FICA taxes
2 file state and federal payroll tax returns
3 provides each employee with a statement of gross earnings and tax withholdings for the year
• Many companies use a payroll register to accumulate the gross earnings, deductions, and net pay by employee for each period.
RECORDING THE PAYROLLRECORDING THE PAYROLL

RECOGNIZING PAYROLL EXPENSES AND LIABILITIES
Academy Company records its payroll for the week ending January 14, 2005 with the journal entry above. Office Salaries Expense ($5,200) and Wages Expense ($12,010) are debited in total for $17,210 in gross earnings. Specific liability accounts are credited for the deductions made during the pay period. Salaries and Wages Payable is credited for $11,462.50 in net earnings.
Date Account Titles Debit Credit
General Journal
Jan 14 Office Salaries Expense 5,200.00
Wages Expense 12,010.00
FICA Taxes Payable 1,376.80
Federal Income Taxes Pay. 3,490.00
State Income Taxes Pay. 344.20
United Fund Pay. 421.50
Union Dues Pay. 115.00
Salaries and Wages Pay. 11,462.50

The entry to record payment of the Academy Company payroll is a debit to Salaries and Wages Payable and a credit to Cash. When currency is used in payment, one check is prepared for the amount of net earnings ($11,462.50).
RECORDING PAYMENT OF THE
PAYROLL
Date Account Titles Debit Credit
General Journal
Jan. 14 Salaries and Wages Pay. 11,462.50Cash 11,462.50

Payroll Tax Expense- three taxes levied on employers by governmental agencies.
1 Employer must match each employee’s FICA contribution
2 Federal unemployment taxes (FUTA)
3 State unemployment taxes (SUTA)
EMPLOYER PAYROLL TAXESSTUDY OBJECTIVE 8

RECORDING EMPLOYER PAYROLL TAXES
RECORDING EMPLOYER PAYROLL TAXES
The entry to record the payroll tax expense associated with the Academy Company payroll results in a debit to Payroll Tax Expense for $2,443.82, a credit to FICA Taxes Payable for $1,376.80 ($17,210 X 8%), a credit to FUTA Payable for $137.68 ($17,210 X 0.8%), and a credit to SUTA Payable for $929.34 ($17,210 X 5.4%).
Date Account Titles Debit Credit
General Journal
Jan 14 Payroll Tax Expense 2,443.82
FICA Taxes Payable 1,376.80
Fed. Unemployment Taxes Pay. 137.68
State Unemployment Taxes Pay. 929.34

EMPLOYER PAYROLL TAXES
EMPLOYER PAYROLL TAXES

FILING AND REMITTING PAYROLL TAXES
• Preparation of payroll tax returns is the responsibility of the payroll department. Payment of the taxes is made by the treasurer’s department.
• FICA taxes and Federal income taxes (FIT) withheld are combined for reporting and remitting purposes.
• The taxes are reported quarterly – no later than one month after the close of each quarter.
• FUTA taxes are generally filed and remitted annually on or prior to January 31 of the subsequent year.
• SUTA taxes must be filed and paid by the end of the month following each quarter.
• The employer is required to provide each employee with a Wage and Tax Statement (Form W-2) by January 31 following the end of the calendar year.

................................
AppendixAdditional Fringe Benefits

ADDITIONAL FRINGE BENEFITSPAID ABSENCES
ADDITIONAL FRINGE BENEFITSPAID ABSENCES
Employees often are given rights to receive compensation for absences when certain conditions of employment are met. Such compensation may relate to 1) paid vacations, 2) sick pay benefits, and 3) paid holidays. A liability should be accrued for paid future absences if 1) its payment is probable and 2) the amount can be reasonably estimated. Academy Company employees are entitled to one day’s vacation for each month worked. If 30 employees earn an average of $110 per day in a given month, the accrual for vacation benefits for January is $3,300 ($110 X 30). The liability is recognized at January 31 by the following adjusting entry:
Date Account Titles Debit Credit
General Journal
Jan. 31 Vacation Benefits Expense 3,300Vacation Benefits Payable 3,300

ADDITIONAL FRINGE BENEFITS
PAID ABSENCES
ADDITIONAL FRINGE BENEFITS
PAID ABSENCES
When vacation benefits are paid, Vacation Benefits Payable is debited and Cash is credited. If Academy Company pays such benefits for 10 employees in July, the journal entry to record the payment is for $1,100($110 X 10).
Date Account Titles Debit Credit
General Journal
July 31 Vacation Benefits Pay. 1,100Cash 1,100

POSTRETIREMENT BENEFITS
POSTRETIREMENT BENEFITS
• Postretirement benefits are benefits provided by employers to retired employees for:
1 health care and life insurance
2 pensions
• Both types of postretirement benefits are accounted for on the accrual basis.

PENSION PLANS
• A pension plan is an agreement whereby an employer provides benefits to employees after they retire.
• Three parties are generally involved in a pension plan.
1) The employer sponsors the pension plan.
2) The plan administrator receives the contributions from the employer, invests the pension assets, and makes the benefit payments.
3) The retired employees receive the pension payments.

PARTIES IN A PENSION PLAN
PARTIES IN A PENSION PLAN
Employer
Plan Administrator
Pension Recipients
Contributions
Benefits

The department that should pay the payroll is the:
a. timekeeping department.
b. human resources department.
c. payroll department.
d. treasurer’s department.

The department that should pay the payroll is the:
a. timekeeping department.
b. human resources department.
c. payroll department.
d. treasurer’s department.
John Wiley & Sons, Inc. © 2005
Chapter 12Chapter 12
Accounting Principles
Prepared by Naomi KarolinskiPrepared by Naomi KarolinskiMonroe Community CollegeMonroe Community College
andand
Marianne BradfordMarianne BradfordBryant CollegeBryant College
Accounting Principles, 7Accounting Principles, 7thth EditionEdition
Weygandt Weygandt •• Kieso Kieso •• KimmelKimmel

After studying this chapter, you should be able to:
1 Explain the meaning of generally accepted accounting principles and identify the key items of the conceptual framework.
2 Describe the basic objectives of financial reporting.
3 Discuss the qualitative characteristics of accounting information and elements of financial statements.
CHAPTER 12ACCOUNTING PRINCIPLES

CHAPTER 12 ACCOUNTING PRINCIPLES
4 Identify the basic assumptions used by accountants.
5 Identify the basic principles of accounting.
6 Identify the two constraints in accounting.
7 Explain the accounting principles used in international operations.
After studying this chapter, you should be able to:

CONCEPTUAL FRAMEWORK OF ACCOUNTING
STUDY OBJECTIVE 1
• Generally accepted accounting principles – set of standards and rules that are recognized as a general
guide for financial reporting
• Generally accepted– means that these principles must have substantial
authoritative support
• Financial Accounting Standards Board (FASB) and Securities and Exchange Commission (SEC)
• The FASB has the responsibility for developing accounting principles in the United States.

FASB’S CONCEPTUAL FRAMEWORK
• The conceptual framework developed by the FASB serves as the basis for resolving accounting and reporting problems.
• The conceptual framework consists of:
1) objectives of financial reporting;
2) qualitative characteristics of accounting information;
3) elements of financial statements; and
4) operating guidelines (assumptions, principles, and constraints).

OBJECTIVES OF FINANCIAL REPORTING
STUDY OBJECTIVE 2
FASB objectives of financial reporting are to provide information that is:
1 useful to those making investment and credit decisions
2 helps in assessing future cash flows
3 identifies the economic resources (assets), the claims to those resources (liabilities), and the changes in those resources and claims

QUALITATIVE CHARACTERISTICS OF ACCOUNTING INFORMATION
STUDY OBJECTIVE 3
To be useful, information should possess the following qualitative characteristics:
1 relevance
2 reliability
3 comparability
4 consistency

RELEVANCE
• Accounting information has relevance if it makes a difference in a decision.
• Relevant information helps users forecast future events (predictive value), or it confirms or corrects prior expectations (feedback value).
• Information must be available to decision makers before it loses its capacity to influence their decisions (timeliness).
RELIABILITY
• Reliability of information means that the information is free of error and bias, in short, it can be depended on.
• To be reliable, accounting information
must be verifiable.

COMPARABILITY AND CONSISTENCY
2005 2006 2007
• Comparability means that the information should be comparable with accounting information about other enterprises.
• Consistency means that the same accounting principles and methods should be used from year to year within a company.

Relevance1 Predictive value
2 Feedback value
3 Timeliness
Reliability1 Verifiable
2 Faithful representation
3 Neutral
Comparability
Useful Financial
Information has:
QUALITATIVE CHARACTERISTICS OF
ACCOUNTING INFORMATION
Consistency

CHARACTERISTICS OF USEFUL INFORMATION

Assumptions
Monetary unit Economic entity Time period Going concern
Principles
Revenue recognition Matching Full disclosure Cost
Constraints
Materiality Conservatism
• Operating guidelines are classified as assumptions, principles, and constraints.
• Assumptions provide a foundation for the accounting process.
• Principles indicate how transactions and other economic events should be recorded.
• Constraints on the accounting process allow for a relaxation of the principles under certain circumstances.
THE OPERATING GUIDELINES OF ACCOUNTING

ASSUMPTIONS
USED IN ACCOUNTING

The primary criterion by which accounting information can be judged is:
a. consistency.
b. predictive value.
c. decision-usefulness.
d. comparability.

The primary criterion by which accounting information can be judged is:
a. consistency.
b. predictive value.
c. decision-usefulness.
d. comparability.

Monetary unit assumption:
– only transaction data expressed in terms of money can be included in the accounting records
Example: employee satisfaction and percent of international employees are not transactions that should be included in the financial records.
ASSUMPTIONSSTUDY OBJECTIVE 4
Customer Satisfaction
Percentage of International Employees
Salaries paidShould be includedin accounting records

ECONOMIC ENTITY ASSUMPTION
Activities of the entity kept separate
and distinct from the activities of the owner
and all other economic entities.Example: BMW activities
can be distinguished fromthose of other carmanufacturers such as Mercedes.

Economic life of a business divided into
artificial time periods.
QTR 1QTR 2QTR 3QTR 4
2005 2006 2007JAN FEB MAR APR MAY JUN JUL AUG SEPT OCT NOV DEC
TIME PERIOD ASSUMPTION

GOING CONCERN ASSUMPTION
Enterprise will continue in operation long enough to carry out its existing objectives.
Implications: depreciation and amortization are used, plant assets recorded at cost instead of liquidation value, items are labeled as fixed or long-term.

• Revenue recognition principle
dictates that revenue should be
recognized in the accounting
period in which it is earned.
• When a sale is involved, revenue is recognized at the point of sale.
PRINCIPLES
REVENUE RECOGNITIONSTUDY OBJECTIVE 5

PERCENTAGE-OF-COMPLETION METHOD OF REVENUE
RECOGNITION• In long-term construction contracts, revenue
recognition is usually required before the contract is completed.
• The percentage-of-completion method recognizes revenue on the basis of reasonable estimates of progress toward completion.
• A project’s progress toward completion is measured by comparing the costs incurred in a year to total estimated costs of the entire project.

FORMULA TO RECOGNIZE REVENUE IN THEPERCENTAGE-OF-COMPLETION METHOD
Costs Incurred(Current Period)
÷ =Total
Estimated Cost
PercentComplete(Current Period)
Total RevenueX =Revenue
Recognized(Current Period)
Percent Complete(Current Period)

FORMULA TO COMPUTE GROSS PROFITIN CURRENT PERIOD
Cost Incurred(Current Period)
X =Gross ProfitRecognized
(Current Period)
RevenueRecognized
(Current Period)
The costs incurred in the current period are then subtracted from the revenue recognized during the current period to arrive at the gross profit.
The costs incurred in the current period are then subtracted from the revenue recognized during the current period to arrive at the gross profit.

Warrior Construction Co. has a contract to build a dam for $400 million. It will take 3 years (starting in 2005) at a construction cost of $360 million. Assume that Warrior incurs $54 million in 2005, $180 million in 2006, and $126 million in 2007 on the dam project. The portion of the $400 million of revenue recognized in each of the 3 years is shown below:
REVENUE RECOGNIZEDPERCENTAGE-OF-COMPLETION METHOD
Costs Percent Revenue Incurred Total Complete Recognized (Current Estimated (Current Total (Current Year Period) ÷ Cost - Period) X Revenue - Period)
2005 $ 54,000,000 $ 360,000,000 15% $ 400,000,000 $ 60,000,000 2006 180,000,000 360,000,000 50% 400,000,000 200,000,000 2007 126,000,000 Balance required to complete the contract 140,000,000
Totals $ 360,000,000 $ 400,000,000

The gross profit recognized each period for Warrior Construction Co. is as shown below. Use of the percentage-of-completion methodinvolves some subjectivity. As a result, errors are possible in determining the amount of revenue recognized. To wait until completion would seriously distort the financial statements. If it is not possible to obtain dependable estimates of costs and progress, then the revenue should be recognized at the completion date and not by the percentage-of-completion method.
GROSS PROFIT RECOGNIZED PERCENTAGE-OF-COMPLETION METHOD
Revenue Actual Cost Gross Profit Recognized Incurred Recognized (Current (Current (Current Year Period) – Period) - Period)
2005 $ 60,000,000 $ 54,000,000 $ 6,000,000 2006 200,000,000 180,000,000 20,000,000 2007 140,000,000 126,000,000 14,000,000
Totals $ 400,000,000 $ 360,000,000 $ 40,000,000

Cash Collections from Customers
Gross Profit Percentagex =
Gross Profit Recognized during the
Period
GROSS PROFIT FORMULAINSTALLMENT METHOD
• Under installment method, each cash collection from a customer consists of
1) a partial recovery of the cost of goods sold and
2) partial gross profit from the sale.
• The formula to recognize gross profit is shown below.
• Under installment method, each cash collection from a customer consists of
1) a partial recovery of the cost of goods sold and
2) partial gross profit from the sale.
• The formula to recognize gross profit is shown below.

An Iowa farm machinery dealer had installment sales in its first year of operations of $600,000 and a cost of goods sold on installment of $420,000. Therefore, total gross profit is $180,000 ($600,000 - $420,000), and the gross profit percentage is 30% ($180,000 ÷ $600,000). The collections on the installment sales were: First year, $280,000 (down payments plus monthly payments), second year, $200,000, and third year, $120,000. The collections of cash and recognition of the gross profit are summarized below (ignoring interest charges).
An Iowa farm machinery dealer had installment sales in its first year of operations of $600,000 and a cost of goods sold on installment of $420,000. Therefore, total gross profit is $180,000 ($600,000 - $420,000), and the gross profit percentage is 30% ($180,000 ÷ $600,000). The collections on the installment sales were: First year, $280,000 (down payments plus monthly payments), second year, $200,000, and third year, $120,000. The collections of cash and recognition of the gross profit are summarized below (ignoring interest charges).
GROSS PROFIT RECOGNIZEDINSTALLMENT METHOD
Cash Gross Profit Gross Profit Year Collected X Percentage = Recognized
200 5 $ 280,000 30% $ 84,000 200 6 200,000 30% 60,000 200 7 120,000 30% 36,000
Totals $ 600,000 $ 180,000

Expense recognition is traditionally tied to revenue recognition.
• referred to as the matching principle
• dictates that expenses be matched with revenues in the period in which efforts are made to generate revenues.
MATCHING
(EXPENSE RECOGNITION)

Unexpired costs become expenses in two ways:
1) Cost of goods merchandise inventory becomes expensed when
the inventory is sold
2) Operating expenses
other unexpired costs through use or consumption or through the passage of time
MATCHING (EXPENSE RECOGNITION)
PRINCIPLE

CostIncurred
Asset Expense
EXPENSE RECOGNITION PATTERN
Operating expenses contribute to the revenues of the period but their association with revenues is less direct than for cost of goods sold.
Operating expenses contribute to the revenues of the period but their association with revenues is less direct than for cost of goods sold.
Benefits Decrease
Provides FutureBenefit
Provides No Apparent FutureBenefits

FULL DISCLOSURE PRINCIPLE
• Requires that circumstances and events that make a difference to financial statement users be disclosed.
• Compliance with the full disclosure principle
1) data in the financial statements
2) notes that accompanying the statements
• Summary of significant accounting policiesusually the first note to the financial statements

COST PRINCIPLE
• The cost principle dictates that assets be recorded at their cost.
• Cost is used because it is both relevant and reliable.
1) Cost is relevant because it represents a) the price paid, b) the assets sacrificed, or c) the commitment made at the date of acquisition.
2) Cost is reliable because it is a) objectively measurable, b) factual, and c) verifiable.

BASIC PRINCIPLES USED IN ACCOUNTING

CONSTRAINTS IN ACCOUNTINGSTUDY OBJECTIVE 6
Two constraints
• Materiality– relates to an item’s impact on a firm’s overall
financial condition and operations.
• Conservatism – dictates that when in doubt, choose the method that
will be the least likely to overstate assets and income

CONSTRAINTS IN ACCOUNTING

CONCEPTUAL FRAMEWORK
Objectives of Financial Reporting
Assumptions Principles
Operating Guidelines
Qualitative Characteristics of
Accounting Information
Elements of Financial Statements

FOREIGN SALES AND TYPE OF PRODUCTSTUDY OBJECTIVE 7
• World markets are becoming increasingly intertwined, and foreigners consume American goods.
• Americans use goods from many other countries.
• Firms that conduct operations in more than one country through subsidiaries, divisions, or branches in foreign countries are referred to as multinational corporations.
• International transactions must be translated into U.S. dollars.

The organization that issues international accounting standards is the:
a. Financial Accounting Standards Board
b. International Accounting Standards Board.
c. International Auditing Standards Committee.
d. None of the above.

The organization that issues international accounting standards is the:
a. Financial Accounting Standards Board
b. International Accounting Standards Board.
c. International Auditing Standards Committee.
d. None of the above.

John Wiley & Sons, Inc. © 2005
Chapter 13Chapter 13
Accounting for Partnerships
Prepared by Naomi KarolinskiPrepared by Naomi KarolinskiMonroe Community CollegeMonroe Community College
andand
Marianne BradfordMarianne BradfordBryant CollegeBryant College
Accounting Principles, 7Accounting Principles, 7thth EditionEdition
Weygandt Weygandt •• Kieso Kieso •• KimmelKimmel

CHAPTER 13ACCOUNTING FOR PARTNERSHIPS
After studying this chapter, you should be able to:1 Identify the characteristics of the
partnership form of business organization.2 Explain the accounting entries for the
formation of a partnership.3 Identify the basis for dividing net income or
net loss.4 Describe the form and content of partnership
financial statements.5 Explain the effects of the entries to record
liquidation of a partnership.

PARTNERSHIP FORM OF ORGANIZATIONSTUDY OBJECTIVE 1
• Uniform Partnership Act– basic rules for the formation and operation
of partnerships in more than 90 percent of the states
– defines a partnership
• an association of two or more
persons to carry on as
co-owners of a business for
a profit.

CHARACTERISTICS OF PARTNERSHIPS
Principal characteristics of a partnership
1 Association of individuals
2 Mutual agency
3 Limited life
4 Unlimited liability
5 Co-ownership of property

PARTNERSHIP CHARACTERISTICS

MUTUAL AGENCY
• Mutual agency
– each partner acts on behalf of the partnership when engaging in partnership business
– act of any partner is binding on all other partners
• (true even when partners act beyond the scope of their authority, so long as the act appears to be appropriate for the partnership)

ASSOCIATION OF INDIVIDUALS
• Association of individuals– may be based on as simple an act as a handshake, it is
preferable to state the agreement in writing
• A partnership
– legal entity for certain purposes (i.e., property can be owned in the name of the partnership)
– accounting entity for financial reporting purposes
• Net income of a partnership– not taxed as a separate entity– each partner’s share of income is taxable at personal tax rates

LIMITED LIFE
• Partnerships
– have a limited life
– dissolution• whenever a partner withdraws or a new partner is
admitted
– ends involuntarily • by death or incapacity of a partner
– may end voluntarily
• through acceptance of a new partner or withdrawal of a partner

UNLIMITED LIABILITY
• Unlimited liability
– each partner is personally and individually liable for all partnership liabilities.
– creditors’ claims attach first to partnership assets
– if insufficient assets• claims then attach to the personal resources of any
partner, irrespective of that partner’s capital equity in the company

CO-OWNERSHIP OF PROPERTY
• Partnership Assets
– assets invested in the partnership are owned jointly by all the partners
• Partnership Income or Loss
– co-owned; if the partnership contract does not specify to the contrary, net income or net loss is shared equally by the partners

ADVANTAGES AND DISADVANTAGES OF A PARTNERSHIP
Advantages Disadvantages
Combining skills and resources of two or more individuals Mutual agency Ease of formation Limited life Freedom from governmental regulations and restrictions Unlimited liability Ease of decision making

THE PARTNERSHIPAGREEMENT
Partnership agreement (Articles of co-partnership)
– written contract
1 Names and capital contributions of the partners.
2 Rights and duties of partners.
3 Basis for sharing net income or net loss.
4 Provision for withdrawals of assets.
5 Procedures for submitting disputes to arbitration.
6 Procedures for the withdrawal or addition of a partner.
7 Rights and duties of surviving partners in the event of a partner’s death.

Which of the following is not a characteristic of a partnership:
a. Taxable entity.
b. Co-ownership of property.
c. Mutual agency.
d. Limited Life.

Which of the following is not a characteristic of a partnership:
a. Taxable entity.
b. Co-ownership of property.
c. Mutual agency.
d. Limited Life.

FORMING A PARTNERSHIPSTUDY OBJECTIVE 2
• Initial investment – recorded at the fair market value of the assets at
the date of their transfer to the partnership– values assigned must be agreed to by all of the
partners
• Once partnership has been formed– accounting is similar to accounting for
transactions of any other type of business organization
Computer recorded at its FMV of $2,500 instead of book value, which after depreciation may be much lower.

BOOK AND MARKET VALUEOF ASSETS INVESTED
Book Value Market Value
A. Rolfe T. Shea A. Rolfe T. Shea
Cash $ 8,000 $ 9,000 $ 8,000 $ 9,000Office equipment 5,000 4,000Accumulated depreciation ( 2,000)Accounts receivable 4,000 4,000Allowance for doubtful accounts ( 700) ( 1,000)
$ 11,000 $ 12,300 $ 12,000 $ 12,000
A. Rolfe and T. Shea combine their proprietorships to start a partnership. They have the following assets prior to the formation of the partnership:
A. Rolfe and T. Shea combine their proprietorships to start a partnership. They have the following assets prior to the formation of the partnership:

RECORDING INVESTMENTS IN A
PARTNERSHIP
Entries to record the investments are:
Account Titles and Explanation Debit Credit Investment of A. Rolfe Cash 8,000 Office Equipment 4,000 A. Rolfe, Capital 12,000 (To record investment of Rolfe) Investment of T. Shea Cash 9,000 Accounts Receivable 4,000 Allowance for Doubtful Accounts 1,000 T. Shea, Capital 12,000 (To record investment of Shea)

DIVIDING NET INCOME OR NET LOSS
• Partnership net income or net loss
– shared equally unless the partnership contract indicates otherwise
– is called the income ratio or the profit and loss ratio
– partner’s share of net income or net loss is recognized in the accounts through closing entries

CLOSING ENTRIES
4 closing entries are required for a partnership:
1) Debit each revenue account for its balance and credit Income Summary for total revenues.
2) Debit Income Summary for total expenses and credit each expense account for its balance.
3) Debit (credit) Income Summary for its balance and credit (debit) each partner’s capital account for his or her share of net income (net loss).
4) Debit each partner’s capital account for the balance in that partner's drawing account and credit each partner’s drawing account for the same amount.

CLOSING ENTRIES
The first 2 entries are the same as a proprietorship, while the last 2 entries are different because:
1) there are 2 or more owners’
capital and drawing accounts
2) it is necessary to divide net
income or loss among the partners.

CLOSING NET INCOME AND DRAWING ACCOUNTS
Date Account Titles and Explanation Debit Credit
Dec. 31 Income Summary 32,000 L. Arbor, Capital ($32,000 X 50%) 16,000 D. Barnett, Capital ($32,000 X 50%) 16,000 (To transfer net income to owners’ capital accounts) 31 L. Arbor, Capital 8,000 D. Barnett, Capital 6,000 L. Arbor, Drawing 8,000 D. Barnett, Drawing 6,000 (To close drawing accounts to capital accounts)
The AB Company has net income of $32,000 for 2005. The partners, L. Arbor and D. Barnett, share net income and net loss equally, and drawings for the year were Arbor $8,000 and Barnett $6,000. The last two closing entries are:

Beginning capital balance is $47,000 for Arbor and $36,000 for Barnett,the capital anddrawing accountswill show thefollowing afterposting the closingentries:
L. Arbor, Capital
12/31 Closing 8,000 1/1 Balance 47,00012/31 Closing 16,000
12/31 Balance 55,000
L. Arbor, Drawing
12/31 Balance 8,000 12/31 Closing 8,000
D. Barnett, Capital
12/31 Closing 6,000 1/1 Balance 36,00012/31 Closing 16,000
12/31 Balance 46,000
D. Barnett, Drawing
12/31 Balance 6,000 12/31 Closing 6,000
PARTNERS’ CAPITAL ANDDRAWING ACCOUNTS AFTER
CLOSING

INCOME RATIOSSTUDY OBJECTIVE 3
The partnership agreement should specify the basis for sharing net income or net loss. Typical income ratios:
1 A fixed ratio– expressed as a proportion (6:4), a percentage (70% and 30%), or a
fraction (2/3 and 1/3).
2 A ratio based on either:
– capital balances at the beginning of the year or
– on average capital balances during the year
3 Salaries to partners and the remainder on a fixed ratio.
4 Interest on partners’ capital balances and the remainder on a fixed ratio
5 Salaries to partners, interest on partners’ capitals, and the remainder on a fixed ratio

TYPICAL INCOME-SHARING RATIOSSalaries, Interest and the Remainder on a Fixed
Ratio
Sara King and Ray Lee agree to
A. Salary Allowance of $8,400 to King, $6,000 to Lee
B. Interest of 10% on Capital Balances
C. Remainder Equally

TYPICAL INCOME-SHARING RATIOSSalaries, Interest and the Remainder on a Fixed
Ratio
Capital balances - January 1, 2005Sara King – $28,000Ray Lee – $24,000

KINGSLEE COMPANY
Income Statement
For the Year Ended December 31, 2005
Sales $200,000 Net income $22,000
Division of Net Income Sara Ray King Lee Total
Salary al lowance $ 8,400 $6,000 $14,400 Interest allowance on partner’s behalf Sara King ($28,000 X 10%) 2,800 Ray Lee ($24,000 X 10%) 2,400 Total interest allowances 5,200
Total salaries and interest 11,200 8,400 19,600
Remaining income – $2,400 Sara King ($2,400 X 50%) 1,200 Ray Lee ($2,400 X 5 0%) 1,200 Total remainder 2,400
Total division $ 12,400 $9,600 $22,000
INCOME STATEMENT WITH DIVISION OF NET
INCOMESara King and Ray
Lee are copartners in the Kingslee
Company. The partnership
agreement provides for 1) salary
allowances of $8,400 for Sara and $6,000 for Ray, 2) interest
allowances of 10% on capital balances at the beginning of the year, and 3) the remainder equally. The division
of the 2005 net income of $22,000 is as
follows:
Sara King and Ray Lee are copartners in
the KingsleeCompany. The
partnership agreement provides
for 1) salary allowances of $8,400 for Sara and $6,000 for Ray, 2) interest
allowances of 10% on capital balances at the beginning of the year, and 3) the remainder equally. The division
of the 2005 net income of $22,000 is as
follows:

SALARIES, INTEREST, AND REMAINDER ON A FIXED
RATIO
Date Account Titles and Explanation Debit Credit
Dec. 31 Income Summary 22,000 Sara King, Capital 12,400 Ray Lee, Capital 9,600 (To close net income to partners’ capitals)

TYPICAL INCOME-SHARING RATIOS CAPITAL BALANCES
•Income-sharing ratio– may be based either on capital balances
at the beginning of the year
– or on average capital balances during the year.
• Capital balances income-sharing – may be equitable when a manager is
hired to run the business and the partners do not plan to take an active role in daily operation.

TYPICAL INCOME-SHARING RATIOS BASED ON
SALARIES ALLOWANCES
Income-sharing based on salary allowancesmay be:
1) Salary allowances to partners and the remainder
on a fixed ratio or
2) Salary allowances to partners, interest on
partners’ capitals, and the remainder on a fixed ratio.
* Salaries to partners and interest on partner’s capital
balances are not expenses-these items are not included in
determination of net income or net loss.

The NBC Company reports net income of $60,000. If partners N, B, and C have an income ratio of 50%, 30%, and 20%, respectively, C’s share of net income is:
a. $30,000.
b. $12,000.
c. $18,000.
d. No correct answer is given.

The NBC Company reports net income of $60,000. If partners N, B, and C have an income ratio of 50%, 30%, and 20%, respectively, C’s share of net income is:
a. $30,000.
b. $12,000.
c. $18,000.
d. No correct answer is given.

PARTNER’S CAPITAL STATEMENTSTUDY OBJECTIVE 4
The owners’equity statement for a partnership is called the partners’ capital statement. Its function is to explain the changes 1) in each partner’s capital account and 2) in total partnership capital during the year. The enclosed partners’capital statement for the Kingslee Company is based on the division of $22,000 of net income.
KINGSLEE COMPANYPartners’ Capital Statement
For the Year Ended December 31, 2005
Sara RayKing Lee Total
Capital, January 1 $ 28,000 $ 24,000 $52,000Add: Additional investment 2,000 2,000
Net income 12,400 9,600 22,000
42,400 33,600 76,000Less: Drawings 7,000 5,000 12,000
Capital, December 31 $ 35,400 $ 28,600 $ 64,000

The partners’capital statement is prepared from the income statement and the partners’ capital and drawing accounts. The balance sheet for
a partnership is the same as for a proprietorship except in the owners’ equity section. The capital balances of the partners are shown in the balance sheet. The owners’ equity section of the balance sheet for Kingslee Company is enclosed.
OWNER’S EQUITY SECTION OF A PARTNERSHIP BALANCE
SHEET
KINGSLEE COMPANY Balance Sheet - partial December 31, 2005 Total liabilities (assumed amount) $ 115,000 Owners’ equity Sara King, Capital $ 35,400 Ray Lee, Capital 28,600
Total owners’ equity 64,000
Total liabilities and owners’ equity $ 179,000

LIQUIDATION OF A PARTNERSHIP
The liquidation of a partnership terminates the business. In a liquidation, it is necessary to:
1) sell noncash assets for cash and recognize a gain or loss on realization
2) allocate gain/loss on realization to the partners based on their income ratios
3) pay partnership liabilities in cash, and
4) distribute remaining cash to partners on the basis of their remaining capital balances
Each of the steps:
1) must be performed in sequence- Creditors must be paid before partners receive any cash distributions and
2) must be recorded by an accounting entry

ACCOUNT BALANCES PRIOR TO LIQUIDATIONSTUDY OBJECTIVE 5
Assets Liabilities and Owners’ Equity
Cash $ 5,000 Notes payable $ 15,000Accounts receivable 15,000 Accounts payable 16,000Inventory 18,000 R. Arnet, Capital 15,000Equipment 35,000 P. Carey, Capital 17,800Accumulated depreciation – equipment ( 8,000) W. Eaton, Capital 1,200
$ 65,000 $ 65,000
•No capital deficiency –all partners have credit balances in their capital accounts
•Capital deficiency–one partner’s capital account has a debit balance
Ace Company is liquidated with these balances:
•No capital deficiency –all partners have credit balances in their capital accounts
•Capital deficiency–one partner’s capital account has a debit balance
Ace Company is liquidated with these balances:

LIQUIDATION OF A PARTNERSHIPNO CAPITAL DEFICIENCY
1. Noncash assets are sold for $75,000.
2. Book value of these assets is $60,000
3. A gain of $15,000 is realized on the sale
Account Titles and Explanation Debit Credit (1) Cash 75,000 Accumulated Depreciation – Equipment 8,000 Accounts Receivable 15,000 Inventory 18,000 Equipment 35,000 Gain on Realization 15,000 (To record realization of noncash assets)
Ace Company partners decide to liquidate. The income ratios are 3:2:1

LIQUIDATION OF A PARTNERSHIPNO CAPITAL DEFICIENCY
2. The gain on realization of $15,000 is allocated to the partners on their income ratios, which are 3:2:1. The entry is:
Account Titles and Explanation Debit Credit (2) Gain on Realization 15,000 R. Arnet, Capital ($15,000 X 3/6) 7,500 P. Carey, Capital ($15,000 X 2/6) 5,000 W. Eaton, Capital ($15,000 X 1/6) 2,500 (To allocate gain to partners’ capitals)

LIQUIDATION OF A PARTNERSHIPNO CAPITAL DEFICIENCY
3. Partnership liabilities consist of Notes Payable $15,000 and Accounts Payable $16,000. Creditors are paid in full by a cash payment of $31,000. The entry is:
Account Titles and Explanation Debit Credit (3) Notes Payable 15,000 Accounts Payable 16,000 Cash 31,000 (To record payment of partnership liabilities)

4. The remaining cash is distributed to the partners on the basis of their capital balances. After the entries in the first 3 steps are
posted, all partnership accounts – including Gain on Realization – will have zero balances except for 4
accounts: Cash $49,000; R. Arnet, Capital $22,500; P. Carey, Capital $22,800; and W. Eaton, Capital $3,700 – as shown below:
Cash R. Arnet, Capital
Bal. 5,000 (3) 31,000 Bal. 15,000(1) 75,000 (2) 7,500
Bal. 49,000 Bal. 22,500
P. Carey, Capital W. Eaton, Capital
Bal. 17,800 Bal. 1,200(2) 5,000 (2) 2,500
Bal. 22,800 Bal. 3,700
LEDGER BALANCES BEFORE DISTRIBUTION OF CASH

LIQUIDATION OF A PARTNERSHIPDISTRIBUTION OF CASH WITH NO
CAPITAL DEFICIENCY4. The remaining cash is distributed to the partners on the basis of
their capital balances. After the entries in the first 3 steps are posted, all partnership accounts, including Gain on Realization, will have zero balances except for 4 accounts: Cash $49,000; R. Arnet, Capital $22,500; P. Carey, Capital $22,800; and W. Eaton, Capital $3,700. The last journal entry is as follows:
Account Titles and Explanation Debit Credit (4) R. Arnet, Capital P. Carey, Capital W.Eaton, Capital Cash (To close remaining accounts)
22,500
22,800
3,700
49,000

LIQUIDATION OF A PARTNERSHIPCAPITAL DEFICIENCY
1. The entry for the realization of noncash assets is:
Account Titles and Explanation Debit Credit
(1)CashAccumulated Depreciation – EquipmentLoss on Realization Accounts Receivable Inventory Equipment (To record realization of noncash assets)
A capital deficiency may be caused by 1) recurring net losses, 2) excessive drawings before liquidation, or 3) losses from realization suffered through liquidation. Ace Company is on the brink of bankruptcy. The partners decide to liquidate by having a “going-out-of-business” sale in which 1) merchandise is sold at substantial discounts and 2) the equipment is sold at auction. Cash proceeds from 1) these sales and 2) collections from customers total only $42,000. Therefore, the loss from liquidation is $18,000
($60,000 –$42,000). The steps in the
liquidation process are
as follows:
42,0008,000
18,00015,00018,00035,000

LIQUIDATION OF A PARTNERSHIPCAPITAL DEFICIENCY
2. The loss on realization is allocated to the partners on the basis of their income ratios. The entry is:
Account Titles and Explanation Debit Credit
(2)R. Arnet, Capital ($18,000 X 3/6)P. Carey, Capital ($18,000 X 2/6)W. Eaton, Capital ($18,000 X 1/6) Loss on Realization (To allocate loss on realization to partners)
9,0006,0003,000
18,000

3. Partnership liabilities are paid. The entry is the same as in the previous example.
LIQUIDATION OF A PARTNERSHIPCAPITAL DEFICIENCY
Account Titles and Explanation Debit Credit
(3)Notes PayableAccounts Payable Cash (To record payment of partnership liabilities)
15,00016,000
31,000

4. After posting the 3 entries 2 accounts will have debit balances – Cash $16,000 and W. Eaton, Capital $1,800 – and 2 accounts will have credit balances –R. Arnet, Capital $6,000 and P. Carey, Capital $11,800, as shown below. Eaton has a capital deficiency of $1,800 and therefore owes the partnership
$1,800. Arnet and Carey have a legally enforceable claim against Eaton’s personal assets. The distribution of cash is still made on the basis of capital balances, but the amount will vary depending on how the deficiency is settled.
Cash R. Arnet, Capital
Bal. 5,000 (3) 31,000 (2) 9,000 Bal. 15,000(1) 42,000
Bal. 16,000 Bal. 6,000
P. Carey, Capital W. Eaton, Capital
(2) 6,000 Bal. 17,800 (2) 3,000 Bal. 1,200
Bal. 11,800 Bal. 1,800
LEDGER BALANCESBEFORE DISTRIBUTION OF CASH

LEDGER BALANCESAFTER PAYING CAPITAL DEFICIENCY
Cash R. Arnet, Capital
Bal. 5,000 (3) 31,000 (2) 9,000 Bal. 15,000(1) 42,000(a) 1,800
Bal. 17,800 Bal. 6,000
P. Carey, Capital W. Eaton, Capital
(2) 6,000 Bal. 17,800 (2) 3,000 Bal. 1,200(a) 1,800
Bal. 11,800 Bal. –0–
Partner with the capital deficiency pays the amount owed partnership. Deficiency eliminated.
Eaton pays $1,800 to the partnership, the entry is:
Account Titles and Explanation Debit Credit
(a)Cash W. Eaton, Capital (To record payment of capital deficiency by Eaton)
1,8001,800

LIQUIDATION OF A PARTNERSHIPCAPITAL DEFICIENCY
The cash balance of $17,800 is now equal to the credit balances in the capital accounts (Arnet $6,000 + Carey $11,800), and cash is distributed on the basis of these balances. The entry (shown below) – once it is posted – will cause all accounts to have zero balances.
Account Titles and Explanation Debit Credit
R. Arnet, CapitalP. Carey, Capital Cash (To record distribution of cash to the partners)
6,00011,800
17,800

LEDGER BALANCES AFTER NONPAYMENT OF CAPITAL
DEFICIENCY
Cash R. Arnet, Capital
Bal. 5,000 (3) 31,000 (2) 9,000 Bal. 15,000(1) 42,000 (a) 1,080
Bal. 16,000 Bal. 4,920
P. Carey, Capital W. Eaton, Capital
(2) 6,000 Bal. 17,800 (2) 3,000 Bal. 1,200(a) 720 (a) 1,800
Bal. 11,080 Bal. –0–
Partner with the capital deficiency unable to pay the amount owed.Partners with credit balances must absorb the loss.Allocated on the basis of pre-existing ratios of partners with credit balances. Income ratios of Arnet and Carey are 3/5 and 2/5, respectively. Entry is made to remove Eaton’s capital deficiency.
After posting this entry, the cash and capital accounts will have the following balances:
Account Titles and Explanation Debit Credit
(a)R. Arnet, Capital ($1,800 X 3/5)P. Carey, Capital ($1,800 X 2/5) W. Eaton, Capital (To record write-off of capital deficiency)
1,080720
1,800

LIQUIDATION OF A PARTNERSHIPCAPITAL DEFICIENCY
The cash balance of $16,000 now equals the credit balances in the capital accounts (Arnet $4,920 + Carey $11,080). The entry (shown below) – once it is posted –will cause all accounts to have zero balances.
Account Titles and Explanation Debit Credit
R. Arnet, CapitalP. Carey, Capital Cash (To record distribution of cash to the partners)
4,92011,080
16,000

APPENDIX
ADMISSION AND WITHDRAWAL OF PARTNERS

• The admission of a new partner
– results in legal dissolution of the existing partnership and the beginning a new one
• To recognize economic effects
– it is necessary only to open a capital account for each new partner.
• A new partner may be admitted either by:
1) Purchasing the interest of an existing partner or
2) Investing assets in a partnership.
ADMISSION OF A PARTNERSTUDY OBJECTIVE 6

PROCEDURES IN ADDING PARTNERS
I. Purchase of a Partner’s Interest
The admission of a partner by purchase of an interest in the firm is a personal transaction between one or more existing partners and the new partner. The price paid is negotiated and determined by theindividuals involved; it may be equal to or different from the capital equity acquired. Any money or other consideration exchanged is the personal property of the participants and not the property of the partnership.

PROCEDURES IN ADDING PARTNERS
When a partner is admitted by investment, both the total net assets and the total partnership capital change. When the new partner’s investment differs from the capital equity acquired, the difference is considered a bonus either to: 1) The existing (old) partners or 2) The new partner.
I. Investment of Assets in Partnership

PROCEDURES IN ADDING PARTNERS

LEDGER BALANCES AFTER PURCHASE OF A PARTNER’S
INTEREST
Net Assets C. Ames, Capital
60,000 10,000 30,000
Balance 20,000
D. Barker, Capital L. Carson, Capital
10,000 30,000 20,000
Balance 20,000
L. Carson agrees to pay $10,000 each to to C. Ames and D. Barker for 1/3 of their interest in the Ames-Barker partnership. At the time of the admission of Carson, each partner has a $30,000 capital balance. Both partnerstherefore give up $10,000 oftheir capitalequity. Theentry to record the admission of Carson is shown.
Account Titles and Explanation Debit Credit
C. Ames, CapitalD. Barker, Capital L. Carson, Capital (To record admission of Carson by purchase)
10,00010,000
20,000

LEDGER BALANCES AFTER INVESTMENT OF ASSETS
Net Assets C. Ames, Capital
60,000 30,00030,000
Balance 90,000
D. Barker, Capital L. Carson, Capital
30,000 30,000
Assume that instead of purchasing an interest, Carson invests $30,000 in cash in the Ames-Barker partnership for a 1/3 capital interest. In such a case, the entry would be as shown. The effects of this transaction on the partnership accounts are shown in the t-accounts.
Account Titles and Explanation Debit Credit
Cash L. Carson, Capital (To record admission of Carson by investment)
30,00030,000

The different effects of the purchase of an interest and admission by investment are shown in the comparison of net assets and capital balances. When an interest is purchased, the total net assets and total capital of the partnership do not change. On the other hand, when a partner is admitted by investment, both the total net assets and the total capital change. For an admission by investment, when the new partner’s investment and the capital equity acquiredare different, the difference is considered a bonus to 1) the old partners or
2) the new partner.
COMPARISON OF PURCHASE OF AN INTEREST AND ADMISSION BY INVESTMENT
Purchase Admissionof an by
Interest Investment
Net Assets $ 60,000 $ 90,000
Capital
C. Ames $ 20,000 $ 30,000 D. Barker 20,000 30,000 L. Carson 20,000 30,000
Total capital $ 60,000 $ 90,000

BONUS TO OLD PARTNERS
Bonus to old partners-new partner’s investment in the firm is greater than the credit to his capital account on the date of admittance.
To determine new partner’s capital credit and the bonus to the old partners
1) Determine the total capital of the new partnership:
• new partner’s investment + capital of the old partnership.
2) Determine the new partner’s capital credit
multiply the total capital of the new partnership by the new partner’s ownership interest
3) Determine the amount of bonus:
• subtract the new partner’s capital credit from the new partner’s investment
4) Allocate the bonus to the old partners on the basis of their
income ratios.

BONUS TO OLD PARTNERS
Sam Bart and Tom Cohen with total capital of $120,000 agree to admit Lea Eden to the business. Lea acquires a 25% ownership interest by making a cash investment of $80,000 in the partnership. The determination of Lea’s capital credit and the bonus to the old partners is as follows:
1. Determine the total capital of the new partnership by adding the new partner’s investment to the total capital of the old partnership. In this case, the
total capital of the new firm is $200,000, calculated as follows:
Total capital of existing partnership $ 120,000 Investment by new partner, Eden 80,000
Total capital of new partnership $ 200,000
2. Determine the new partner’s capital credit by multiplying the
total capital of the new partnership by the new partner’s ownership interest. Eden’s capital credit is $50,000 ($200,000 X 25%).

BONUS TO OLD PARTNERS
The entry to record the admission is:
3. Determine the amount of bonus by subtracting the new partner’s capital credit from the new partner’s investment. The bonus in this case is $30,000 ($80,000 – $50,000).
4. Allocate the bonus to the old partners on the basis of their income ratios. Assuming the ratios are Bart, 60% and Cohen, 40%, the allocationis: Bart, $18,000 ($30,000 X 60%) and Cohen, $12,000 ($30,000 X 40%).
Account Titles and Explanation Debit Credit Cash Sam Bart, Capital Tom Cohen, Capital Lea Eden, Capital (To record admission of Eden and bonus to old partners)
80,00018,00012,00050,000

BONUS TO NEW PARTNER
• A bonus to a new partner– results when the new partner’s investment is less
than his or her capital credit in the firm.
– capital balances of the old partners are decreased based on their income ratios before the admission of the new partner.
BONUS

COMPUTATION OF CAPITAL CREDIT AND BONUS TO NEW PARTNER
Lea Eden invests $20,000 in cash for a 25% ownership interest in the Bart-Cohen partnership. The calculations for Eden’s capital credit and the bonus are as follows:1. Total capital of Bart-Cohen partnership $ 120,000
Investment by new partner, Eden 20,000
Total capital of new partnership $ 140,000
2. Eden’s capital credit (25% X $140,000) $ 35,000
3. Bonus to Eden ($35,000 – $20,000)
$ 15,000
4. Allocation of bonus: Bart ($15,000 X 60%) $ 9,000 Cohen ($15,000 X 40%) 6,000 $ 15,000
The entry to record the admission of Eden is as follows:
Account Titles and Explanation Debit Credit
CashSam Bart, CapitalTom Cohen, Capital Lea Eden, Capital (To record Eden’s admission and bonus)
20,0009,0006,000
35,000

WITHDRAWAL OF A PARTNERSTUDY OBJECTIVE 6
• A partner may withdraw – voluntarily selling his or her equity
– involuntarily by reaching mandatory retirement age or by dying
• Withdrawal of a partner
- payment from remainingpartners’ personal assets or
- payment from partnership assets

PROCEDURES IN PARTNERSHIP WITHDRAWAL

PAYMENT FROM PARTNERS’PERSONAL ASSETS
• The withdrawal of a partner when payment made from partners’ personal assets– is the direct opposite of admitting a new partner
who purchases a partner’s interest
– is a personal transaction between the partners
ByePartnership
Assets

LEDGER BALANCES AFTER PAYMENT FROM PARTNERS’
PERSONAL ASSETSAnne Morz, Mary Nead, and Jill Odom have capital balances of $25,000, $15,000, and $10,000, respectively, when Morz and Nead agree to buy out Odom’s interest. Each of them agrees to pay Odom $8,000 in exchange for one-half of Odom’s total interest of $10,000. The entry to record the withdrawal is:
The effect of this entry on the partnership accounts is shown below:
Net Assets Anne Morz, Capital 50,000 25,000
5,000
Bal. 30,000
Mary Nead, Capital Jill Odom, Capital
15,000 10,000 10,0005,000
Bal. 20,000 Bal. –0–
Account Titles and Explanation Debit Credit
Jill Odom, Capital Anne Morz, Capital Mary Nead, Capital (To record purchase of Odom’s Interest)
10,0005,0005,000

PAYMENT FROM PARTNERSHIP ASSETS
Using partnership assets to pay for a withdrawing partner’s interest decreases both total assets and total partnership capital.In accounting for a withdrawal by payment from partnership assets:1) asset revaluations should not be recorded and2) any difference between the amount paid and the
withdrawing partner’s capital balance should be considered a bonus to the retiring partner or a bonus to the remaining partners.
Partnership Assets
Bye

BONUS TO RETIRING PARTNER
A bonus may be paid to a retiring partner when:
1 the fair market value of partnership assets is greater than their book value,
2 there is unrecorded goodwill resulting from the partnership’s superior earnings record, or
3 the remaining partners are anxious to remove the partner from the firm.
BONUS

BONUS TO RETIRING PARTNER
The bonus is deducted from the remaining partners’ capital balances on the basis of their income ratios at the time of the withdrawal. Terk retires from the RST partnership and receives a cash payment of $25,000 from the firm. Terk has a capital balance of $20,000. The procedure for determining the bonus to the retiring partner and the allocation of the bonus to the remaining partners is: 1) Determine the amount of the bonus by subtracting the retiring partner’s capital balance from the cash paid by the partnership. The bonus in this case is $5,000 ($25,000 –$20,000). 2) Allocate the bonus to the remaining partners on the basis of their income ratios. The ratios of Roman and Sand are 3:2, so the allocation of the $5,000 bonus is: Roman $3,000 ($5,000 X 3/5) and Sand $2,000 ($5,000 X 2/5). The appropriate entry is:
Account Titles and Explanation Debit Credit
Betty Terk, CapitalFred Roman, CapitalDee Sand, Capital Cash (To record withdrawal of and bonus to Terk)
20,0003,0002,000
25,000

BONUS TO REMAINING PARTNERS
The retiring partner may pay a bonus to the remaining partners when:
1 recorded assets are overvalued
2 the partnership has a poor earnings recordor
3 the partner is anxious to leave the partnership
BONUS

BONUS TO REMAINING PARTNERS
The bonus is allocated (credited) to the capital balances of theremaining partners on the basis of their income ratios. Assume that Terk is paid only $16,000 for her $20,000 equity upon withdrawing from the RST partnership. In such a case: 1) The bonus to remaining partners is $4,000 ($20,000 – $16,000). 2) The allocation of the $4,000 bonus is: Roman $2,400 ($4,000 X 3/5) and Sand $1,600 ($4,000 X 2/5). The entry to record the withdrawal is:
Account Titles and Explanation Debit Credit
Betty Terk, Capital
Fred Roman, Capital
Dee Sand, Capital
Cash
(To record withdrawal of Terk
and bonus to remaining
partners)
20,0002,4001,600
16,000

DEATH OF A PARTNER
• The death of a partner dissolves the partnership. But provision generally is made for the surviving partners to continue operations by purchasing the deceased partner’s equity from their personal assets.
• When a partner dies it is necessary to determine the partner’s equity at the date of death. This is done by:
1) determining the net income or loss for the year to date,
2) closing the books, and
3) preparing financial statements.

DEATH OF A PARTNER
• The surviving partners will agree to either
1) purchase the deceased partner’s equity from their personal assets or
2) use partnership assets to settle with the deceased partner’s estate.
• In both instances, the entries to record the withdrawal of the partner are similar to those presented earlier.

John Wiley & Sons, Inc. © 2005
Chapter 15Chapter 15
CORPORATIONS: Dividends, Retained Earnings, and Income
Reporting
Prepared by Naomi KarolinskiPrepared by Naomi KarolinskiMonroe Community CollegeMonroe Community College
andand
Marianne BradfordMarianne BradfordBryant CollegeBryant College
Accounting Principles, 7Accounting Principles, 7thth EditionEdition
Weygandt Weygandt •• Kieso Kieso •• KimmelKimmel

CHAPTER 15 CORPORATIONS: DIVIDENDS, RETAINED
EARNINGS, AND INCOME REPORTING
After studying this chapter, you should be able to:
1 Prepare the entries for cash dividends and stock dividends.
2 Identify the items that are reported in a retained earnings statement.
3 Prepare and analyze a comprehensive stockholders’ equity section.
4 Describe the form and content of corporation income statements.
5 Compute earnings per share.

DividendsSTUDY OBJECTIVE 1
• Distribution by a corporation to its stockholders on a pro rata (proportional) basis
• May be in the form of cash, property, scrip (promissory note to pay cash), or stock
• May be expressed in one of two ways:
1. as a percentage of the par or stated value of the stock
2. as a dollar amount per share

Cash Dividends
• For a corporation to pay a cash dividend it must have:
(a) retained earnings
(b) adequate cash
(c) a declaration of dividends

Entries for Cash DividendsThree important dates in connection with dividends:
• Declaration dateBoard of Directors formally declares a cash dividend and a liability is recorded.
• Record dateMarks the time when ownership of outstanding shares is determined from the records maintained by the corporation.
• Payment dateDate dividend checks are mailed to the stockholders and the payment of the dividend is recorded.

Key Dividend Dates

Declaration Date
Assume that on December 1, 2005, the directors of Media General declare a 50 cents per share cash dividend on 100,000 shares of $10 par value common stock. The dividend is $50,000 (100,000 x 50 cents) and the entry to record the declaration is:

Record Date
The purpose of the record date is to identify the persons or entities that will receive the dividend, not to determine the dividend liability. For Media General, the record date is December 22. No entry is required on this date because the corporation’s liability recognized on the declaration date is unchanged.

Payment Date
Assuming the payment date is January 20 for Media General, the entry on that date is:
Payment of the dividend REDUCES both current assets and current liabilities but has no effect on stockholders’ equity.

Allocating Cash Dividends Between Preferred and Common Stock
• Cash dividends– Must be paid first to preferred stockholders before
any common stockholders are paid.
• Cumulative preferred stock – Any dividends in arrears and the current year
dividend must be paid to preferred stockholders before allocating any dividends to common stockholders.
• Preferred stock is not cumulative– Only the current year’s dividend must be paid to
preferred stockholders before paying any dividends to common stockholders.

Allocating Cash Dividends Between Preferred and Common Stock
Assume that IBR Inc. has 1,000 shares of 8%, $100 par valuecumulative preferred stock and 50,000 shares of $10 par valuecommon stock outstanding at December 31, 2005. If the Board of Directors declares a $6,000 cash dividend on December 31, the entire $6,000 will go to preferred stockholders because their annual dividend is $8,000,(1,000 shares x $8) .
$2,000 has goneinto arrears for
preferred stockholders

Allocating Cash Dividends Between Preferred and Common Stock
Total dividend $50,000
Allocated to preferred stock
Remainder allocated to common stock $40,000
Dividend in arrears, 2005 (1,000 x $2) $2,000
2006 dividend (1,000 x $8) 8,000 10,000
At December 31, 2005, IBR declares a $50,000 cash dividend. The allocation of the dividend to the two classes of stock is shown above.If the preferred stock was NON-cumulative, preferred stockholders would have received only $8,000 in dividends in 2006 and common stockholders would have received $42,000.

The date a cash dividend becomes a binding legal obligation to a corporation is the
a. declaration date.
b. earnings date.
c. payment date.
d. record date.
Chapter 15

The date a cash dividend becomes a binding legal obligation to a corporation is the
a. declaration date.
b. earnings date.
c. payment date.
d. record date.
Chapter 15

Stock Dividends
• Pro rata distribution to stockholders of the corporation’s own stock
– results in a decrease in retained earnings and an increasein paid-in capital
– at a minimum, the par or stated value must be assigned to the dividend shares; in most cases, however, fair market value is used
• A stock dividend does NOT decrease Total Assets or Total Stockholders’ Equity.

Stock Dividends

Disclosure
Earnings per share $2.00
Net income $211,000
Rally would present the information in the following Format.
Rally Inc.Income Statement (partial)

Earnings per Share
The formula to compute earnings per share when there is no preferred stock is as follows:
Weighted AverageCommonShares
Outstanding
Earningsper
Share
NetIncome /
Purposes and Benefits of a Stock Dividend
Corporations issue stock dividends generally for one or more of the following reasons:
1)To satisfy stockholders’ dividend expectations without spending cash
2)To increase the marketability of stock by increasing the number of shares
3)To emphasize that a portion of stockholders’equity has been permanently reinvested in the business and unavailable for cash dividends

Stock Dividends Distinguished
• SMALL stock dividend– less than 20-25% of the corporation’s issued stock
– assign fair market value to SMALL stock dividends
• assumption that a small stock dividend will have little effect on the market price of the shares previously
outstanding.
• LARGE stock dividend– greater than 20-25% of the corporation’s issued stock
– par or stated value per share is normally assigned

Assume that Medland Corporation has a balance of $300,000 in retainedearnings and declares a 10% stock dividend on its 50,000 shares of $10 par value common stock. The current fair value of its stock is $15 per share and the number of shares to be issued is 5,000 (10% of 50,000). The amount to be debited to Retained Earnings is $75,000 (5,000 x $15).
Entries for Stock Dividends
Retained Earnings is debited for the fair market value of the stock issued because this is a SMALL stock dividend. Common Stock Dividends Distributable is credited for the par value of the dividend shares (5,000 x $10), and the excess is credited to Paid-in Capital.
NOTE !

Statement Presentation of Common Stock Dividends Distributable
Paid-in capital
Common Stock
Common Stock dividends distributable
$ 500,000 50,000 $550,000
Common Stock Dividends Distributable is a stockholders’ equity account; it is not a liability because assets will NOT be used to pay the dividend. If a balance sheet is prepared before the dividend shares are issued, the distributable account is reported in paid-in capital as an addition to common stock.
When the dividend shares are issued, CommonStock Dividends Distributable is debited and Common Stock is credited.

Stock Dividend Effects
Stock dividends change the composition of stockholders’ equity because a portion of retained earnings is transferred to paid-in capital. However, total stockholders’ equity and the par or stated value per share remain the same.

Stock Splits
• The issuance of additional shares to stockholders according to their percentage ownership– number of shares increased in the same
proportion that par or stated value per share is decreased
• Has no effect on total paid-in capital, retained earnings, and total stockholders’ equity.
• Not necessary to formally journalize a stock split

Stock Split Effects
Assume instead of a 10% dividend, Medland Corporation splits its 50,000 shares of common stock on a 2-for-1 basis. This means that one share of $10 par value stock is exchanged for two shares of $5 par value stock. A stock split DOES NOT have any effect on total paid-in capital, retained earnings, and total stockholders’ equity. However, number of shares increases and book value per share decreases.

Differences Between the Effects of Stock Splits and Stock Dividends
Item Stock Split Stock Dividend
Total paid-in capital No change Increase
Total retained earnings No change Decrease
Total par value (commonstock)
No change Increase
Par value per share Decrease No change

Retained EarningsSTUDY OBJECTIVE 2
• Net income retained in the business.
• Balance in retained earnings is part of the stockholders’ claim on the total assets of the corporation.– A net loss is recorded in Retained Earnings by a
closing entry in which Retained Earnings is debitedand Income Summary is credited.

Stockholders’ Equity with Deficit
A debit balance in retained earnings is identified as
a DEFICIT. It is reported as a deduction in the
stockholders’ equity section, as shown above.

Retained Earnings Restrictions
• Portion of the balance currently unavailable for dividends.
1) Legalstates may require that corporations restrict RE for the
cost of treasury stock purchased.2) Contractual
long term debt contracts may restrict RE as a condition for a loan.
3) Voluntary the Board of Directors may voluntarily restrict RE for specific purposes such as future plant expansion.

• The balance in retained earnings is generally available for dividend declarations. Some companies state this fact.
• In the notes to its financial statements, Martin Lockheed Corporation states:
Disclosure of Unrestricted Retained Earnings

Disclosure of Restriction
Retained earnings restrictions are generally disclosed in the notes to the financial statements. For example, Tektronix had the above note in a recent financial statement.
Certain of the Company’s debt agreements require compliance with debt covenants. Management believes that the Company is in compliance with such requirements for the fiscal year ended May 26, 2001. The Company had unrestricted retained earnings of $223.8 million after meeting those requirements.
Tektronix Inc.Notes to the Financial Statements

Prior Period Adjustments
Correction of a material error in reporting net income in a previously issued financial statement.
1) made directly to Retained Earnings.
2) reported in the current year’s retained earnings statement as an adjustment of the beginning balance of Retained Earnings.

Prior Period Adjustments
Assume that General Microwave discovers in 2005 that it understated depreciation expense in 2004 by $300,000 as a result of computationalerrors. These errors overstated net income for 2004, and the current balance in retained earnings is also overstated. The entry for the prior period adjustment, assuming all tax effects are ignored, is as follows:
A DEBIT TO AN INCOME STATEMENT ACCOUNT IN 2005 WOULD BEINCORRECT BECAUSE THE ERROR PERTAINS TO A PRIOR PERIOD
NOTE !

Statement Presentation of Prior Period Adjustments
GENERAL MICROWAVERetained Earnings Statement (partial)
Balance, January 1, as reported $800,000
Balance, January 1, as adjusted $500,000
Correction for overstatement of net income in prior period (depreciation error) (300,000)
Assuming that General Microwave has a beginning balance of $800,000 in retained earnings, the prior period adjustment is reported as follows:
REPORTING THE CORRECTION IN THE CURRENT YEAR’S INCOME STATEMENT WOULD BE INCORRECT BECAUSE IT APPLIES TO A PRIOR YEAR’S INCOME STATEMENT.
NOTE !

Debits and Credits to Retained Earnings
Many corporations prepare a retained earnings statement to explain the changes in retained earnings during the year.
Retained Earnings
1.Net Loss2.Prior period adjustments for
overstatement of net income3.Cash dividends and stock
dividends4.Some disposals of treasury
stock
1. Net income2. Prior period adjustment for
understatement of net income

Comprehensive Stockholders’Equity Section
STUDY OBJECTIVE 3
• Common Stock Dividends Distributable
– shown under capital stock in paid-in-capital
• Retained Earnings restrictions
– disclosed in the notes to the financial statements

Corporation Income Statements
STUDY OBJECTIVE 4
• Includes essentially the same sections as in a proprietorship or a partnership except for the reporting of income taxes
• For tax purposes, corporations are considered to be a separate legal entity.
• Income tax expense
– Reported in a separate section of the corporation income statement before net income

Income Statement with Income Taxes

Income Tax Expense
Using the preceding Income Statement, the adjusting entry for income tax expense at December 31, 2005, would be as follows:

Earnings per ShareStudy Objective 5
• Frequently reported in the financial press
• Used by stockholders and investors to evaluate profitability
• Indicates the net income earned by each share of outstanding common stock

EPS and Preferred Stock Dividends
($211,000 - $6,000) / 102,500 = $2 EPS
When a corporation has both preferred and common stock, the current year’s dividend declared on preferred stock is subtracted from net income to arrive at income available to common stockholders. Assume that Rally Inc. reports net income of $211,000 on its 102,500 weighted average common shares. During the year it also declares a $6,000 dividend on its preferred stock.
WeightedAverage
of CommonShares
Outstanding
Earningsper
Share
Net IncomeMinus
PreferredDividends
/
Therefore, Rally has $205,000 ($211,000 - $6,000) available for common stock dividends. EPS is $2 ($205,000 / 102,500).

The income statement for Nadeen, Inc. shows income before income taxes $700,000, income tax expense $210,000, and net income $490,000. If Nadeen has 100,000 shares of common stock outstanding throughout the year, earnings per share is:
a. $7.00.
b. $4.90.
c. $2.10.
d. No correct answer is given.
Chapter 15
John Wiley & Sons, Inc. © 2005
Chapter 17Chapter 17
Investments
Prepared by Naomi KarolinskiPrepared by Naomi KarolinskiMonroe Community CollegeMonroe Community College
andand
Marianne BradfordMarianne BradfordBryant CollegeBryant College
Accounting Principles, 7Accounting Principles, 7thth EditionEdition
Weygandt Weygandt •• Kieso Kieso •• KimmelKimmel

After studying this chapter, you should be able to:
1 Discuss why corporations invest in debt and stock securities.
2 Explain the accounting for debt investments.
3 Explain the accounting for stock investments.
4 Describe the use of consolidated financial statements.
5 Indicate how debt and stock investments are valued and reported on the financial statements.
6 Distinguish between short-term and long-term investments.
CHAPTER 17
INVESTMENTS

TEMPORARY INVESTMENTS AND THE OPERATING CYCLE
STUDY OBJECTIVE 1
CashTemporary
Investments
Accounts Receivable
Inventory
Invest
Sell
• At the end of the operating cycle– temporary idle cash on hand available until the start of the next
operating cycle.
– invest the excess funds to earn a greater return.
• The relationship of temporary investments to the operating cycle is depicted below.

WHY CORPORATIONS INVEST

ACCOUNTING FOR DEBT INVESTMENTS RECORDING AQUISITION OF BONDS
STUDY OBJECTIVE 2
Debt investments are investments in government and corporation bonds. Three entries required:
1) acquisition- the cost principle applies
2) interest revenue
3) saleKuhl Corporation acquires 50 Doan Inc. 8%, 10-year, $1,000 bonds on January 1, 2005, for $54,000, including brokerage fees of $1,000.
The entry to record the investment is:
(To record purchase of 50
Doan Inc. bonds)
54,000Cash
54,000Debt InvestmentsJan. 1
CreditDebitAccount Titles and ExplanationDate

ACCOUNTING FOR DEBT INVESTMENTS RECORDING BOND INTEREST
The bonds pay $3,000 interest on July 1 and January 1 ($50,000 x 8% x ½). The July 1 entry is:
It is necessary to accrue $2,000 interest earned since July 1 at year-end. The December 31 entry is:
Date Account Titles and Explanation Debit CreditJuly 1 Cash
Interest Revenue (To record receipt of interest on Doan Inc. bonds)
2,0002,000
Date Account Titles and Explanation Debit CreditDec. 31 Interest Receivable
Interest Revenue(To accrue interest on Doan Inc. bonds)
2,0002,000

ACCOUNTING FOR DEBT INVESTMENTS RECORDING BOND INTEREST
When the interest is received on January 1, the entry is:
(To record receipt of accrued
interest)
2,000Interest Receivable
2,000CashJan. 1
CreditDebitAccount Titles and ExplanationDate

ACCOUNTING FOR DEBT INVESTMENTS
RECORDING SALE OF BONDS
Any difference between the net proceeds from the sale (sales price less brokerage fees) and the cost of the bonds is recorded as a gain or loss.
Kuhl Corporation receives net proceeds of $58,000 on the sale of theDoan Inc. bonds on January 1, 2006, after receiving the interest due. Since the securities cost $54,000, a gain of $4,000 has been realized.
Date Account Titles and Explanation Debit CreditJan. 1 Cash
Debt Investments Gain on Sale of Debt Investments (To record sale of Doan Inc. bonds)
58,00054,0004,000

Debt investments are initially recorded at:
a. cost.
b. cost plus accrued interest.
c. fair value.
d. None of the above.
Debt investments are initially recorded at:
a. cost.
b. cost plus accrued interest.
c. fair value.
d. None of the above.

ACCOUNTING GUIDELINES FOR STOCK INVESTMENTS
STUDY OBJECTIVE 3
Stock investments are investments in the capital stock of corporations.

RECORDING STOCK INVESTMENTS HOLDINGS LESS THAN 20%
Cost Method: Stock investments of less than 20%• investment recorded at cost• revenue recognized only when cash dividends are
received
On July 1, 2005, Sanchez Corporation acquires 1,000 shares (10% ownership) of Beal Corporation common stock. Sanchez pays $40 per share plus brokerage fees of $500. The entry for the purchase is:
Date Account Titles and Explanation Debit CreditJuly 1 Stock Investments
Cash (To record purchase of 1,000 shares of Beal Corporation common stock)
40,50040,500

RECORDING STOCK INVESTMENTS HOLDINGS LESS THAN 20%
Entries are required for any cash dividendsreceived during the time the stock is held. If a $2 per share dividend is received by Sanchez Corporation on December 31, the entry is:
Dividend Revenue is reported under Other Revenue and Gains in the income statement. Since dividends do not accrue, adjusting entries are not made to accrue dividends.
Date Account Titles and Explanation Debit CreditDec. 31 Cash (1,000 x $2)
Dividend Revenue (To record receipt of a cash dividend)
2,0002,000

RECORDING STOCK INVESTMENTS
HOLDINGS LESS THAN 20%
• Stock is sold
– difference between the net proceeds from the sale and the cost of the stock is recognized as a gain or loss.
• Sanchez Corporation receives net proceeds of $39,500 on the sale of its Beal Corporation common stock on February 10, 2006.
• Because the stock cost $40,500, a loss of $1,000 has been incurred. The entry to record the sale is:Date Account Titles and Explanation Debit Credit
Feb. 10 CashLoss on Sale of Stock Investments
Stock Investments(To record sale of Beal common stock)
39,5001,000
40,500

ACCOUNTING FOR STOCK INVESTMENTS
HOLDINGS BETWEEN 20% AND 50%
• Investor has significant influence over the financial and operating activities of the investee.
• Equity method
– investment in common stock is recorded at cost
– investment account adjusted annually to show the investor’s equity in the investee
• The investor
1) debits the investment account and credits revenue for
its share of the investee’s net income
2) credits dividends received to the investment account

ACCOUNTING FOR STOCK INVESTMENTS HOLDINGS BETWEEN 20% AND 50%
Milar Corporation acquires 30% of the common stock of Beck Company for $120,000 on January 1, 2005. The entry to record this transaction is:
Date Account Titles and Explanation Debit CreditJan. 1 Stock Investments
Cash (To record purchase of Beck common stock)
120,000120,000
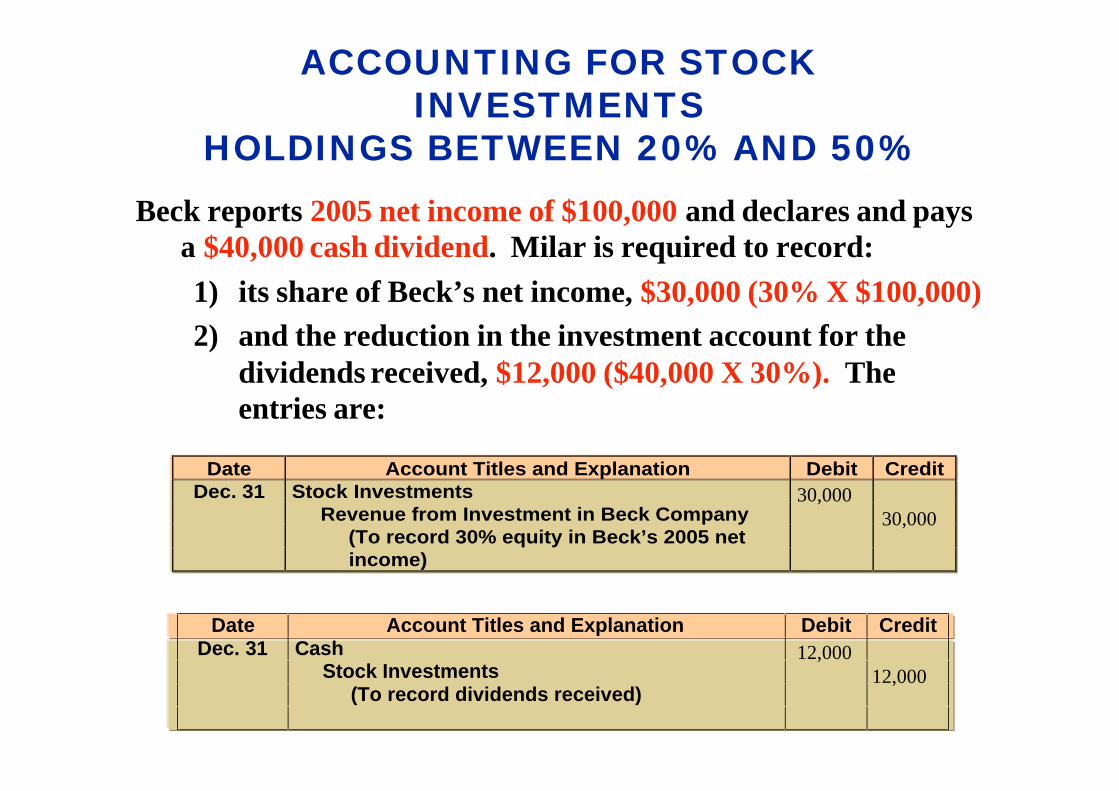
ACCOUNTING FOR STOCK INVESTMENTS
HOLDINGS BETWEEN 20% AND 50%
Beck reports 2005 net income of $100,000 and declares and pays a $40,000 cash dividend. Milar is required to record:
1) its share of Beck’s net income, $30,000 (30% X $100,000)
2) and the reduction in the investment account for the dividends received, $12,000 ($40,000 X 30%). The entries are:
Date Account Titles and Explanation Debit Credit Dec. 31 Stock Investments Revenue from Investment in Beck Company (To record 30% equity in Beck’s 2005 net income)
30,00030,000
Date Account Titles and Explanation Debit CreditDec. 31 Cash
Stock Investments (To record dividends received)
12,00012,000

INVESTMENT AND REVENUE ACCOUNTS AFTER POSTING
Stock Investments
January 1 120,000 December 31 12,000December 31 30,000
December 31 Balance 138,000
Revenue from Investment in Beck Company
December 31 30,000
Investment and revenue accounts will show the above results.
The investment account has increased by $18,000 which represents Milar’s 30% equity in the $60,000 increase in Beck’s retained earnings ($100,000 - $40,000). Milar will also report $30,000 of revenue from its investment, which is 30% of Beck’s net income of $100,000. Milar would report only $12,000 (30% X $40,000) of dividend revenue if the cost method were used.

RECORDING STOCK INVESTMENTS HOLDINGS OF MORE THAN 50%
STUDY OBJECTIVE 4
• Company owns more than 50% of the common stock of another entity – is known as a parent company
• Entity whose stock is owned by the parent company– is the subsidiary (affiliated) company
• The parent company– controlling interest in the subsidiary due to its
stock ownership
– prepares consolidated financial statements

RECORDING STOCK INVESTMENTS MANAGEMENT PERSPECTIVE
Time Warner, Inc. own 100% of the common stock of Home Box Office (HBO). The common stockholders of Time Warner elect the board of directors of the company, who, in turn, select the officers and managers of the company. The Board of Directors controls the property owned by the corporation, which includes the common stock of HBO.

VALUATION GUIDELINESSTUDY OBJECTIVE 5
Fair value is the amount for which a security could be sold in a normal market and offers the best approach at investment valuation since it represents the expected cash realizable value of the securities.

CATEGORIES OF SECURITIES
• Trading securitiesbought and held primarily for sale in the near
term to generate income on short-term price
differences
• Available-for-sale securities
may be sold in the future
• Held-to-maturity securities
debt securities that the investor has intent and ability to hold to maturity

VALUATION OF TRADING SECURITIES
• Trading securities (generally less than a month)– reported at fair value, and changes from cost are reported as part of net
income.
• Changes reported as unrealized gains or losses since the securities have not been sold
– difference between the total cost of trading securities and their total fair value.
• Pace Corporation has the following costs and fair values for itsinvestments classified as trading securities:
Trading Securities, December 31, 2005 Investments Cost Fair Value Unrealized Gain (Loss)
Yorkville Company bonds $ 50,000 $ 48,000 $ (2,000) Kodak Company stock 90,000 99,000 9,000
Total $ 140,000 $ 147,000 $ 7,000

VALUATION AND REPORTING OF INVESTMENTS — TRADING
SECURITIES
•Unrealized gain of $7,000
• total fair value ($147,000) is $7,000 greater than total cost ($140,000)
•Fair value and the unrealized gain or loss
• adjusting entry at the time financial statements are prepared
•Valuation allowance account-Market Adjustment–Trading
• records the difference between the total cost and the total fair value of the securities Date Account Titles and Explanation Debit Credit
Dec. 31 Market Adjustment — Trading Unrealized Gain — Income (To record unrealized gain on trading securities)
7,0007,000

1 Fair value– On the balance sheet
2 Unrealized gain– Income statement
3 Unrealized loss
– Income statement
VALUATION AND REPORTING OF INVESTMENTS — TRADING
SECURITIES

VALUATION OF AVAILABLE-FOR-SALE SECURITIES
• Available-for-sale securities (the intention of selling them in the near future is not for certain)– reported at fair value, and changes from cost are reported as part of
stockholders’ equity.
• Changes reported as unrealized gains or losses since the securities have not been sold.– The unrealized gain or loss is the difference between the total cost of the
securities in the category and their total fair value.
• Elbert Corporation has the following costs and fair values for its investments classified as available-for-sale securities:
Available-for-Sale Securities, December 31, 2005 Investments Cost Fair Value Unrealized Gain (Loss)
Campbell Soup Corporation 8% bonds $ 93,537 $ 103,600 $ 10,063 Hersey Corporation stock 200,000 180,400 (19,600)
Total $ 293,537 $ 284,000 $ ( 9,537)

VALUATION AND REPORTING OF
INVESTMENTS AVAILABLE-FOR-SALE SECURITIES
Elbert Corporation has an unrealized loss of $9,537, total fair value of $284,000 - total cost of $293,537.
Fair value and the unrealized gain or loss
– recorded through an adjusting entry at the time financial statements are prepared
The adjusting entry for Elbert Corporation is:
Date Account Titles and Explanation Debit CreditDec. 31 Unrealized Loss — Equity
Market Adjustment — Available-for-Sale (To record unrealized loss on available-for-sale securities)
9,5379,537

VALUATION AND REPORTING OF
INVESTMENTS AVAILABLE-FOR-SALE SECURITIES
1 Fair value of the securities
– reported on the balance sheet
2 Unrealized gain or loss
– reported as a separate component of stockholders’ equity

SHORT-TERM INVESTMENTSSTUDY OBJECTIVE 5
Securities held by a company (1) readily marketable
– can be sold easily when the need for cash arises
(2) intended to be converted into cash within the next year or operating cycle, whichever is longer
– intent to sell the investment within the next year or operating cycle, whichever is longer

PRESENTATION OF SHORT-TERM INVESTMENTS
Short-Term Investments
• listed immediately below cash in the current asset section of the balance sheet
• reported at fair value
PACE CORPORATION
Balance Sheet (partial)
Current assets Cash $ 21,000 Short-term Investments at fair value 147,000

NONOPERATING ITEMS RELATED TO INVESTMENTS
Other Revenues and Gains Other Expenses and Losses
Interest Revenue Loss on Sale of InvestmentsDividend Revenue Unrealized Loss – IncomeGain on Sale of InvestmentsUnrealized Gain – Income
• Long-term investments are reported in a separate
section of the balance sheet immediately below
current assets
• The items below are reported in the nonoperating
section of the income statement:
• Long-term investments are reported in a separate
section of the balance sheet immediately below
current assets
• The items below are reported in the nonoperating
section of the income statement:

UNREALIZED LOSS IN STOCKHOLDERS’ EQUITY
SECTION
• An unrealized gain or loss on available-for-sale securities is reported as a separate component of stockholders’ equity.
• Dawson Inc. has common stock of $3,000,000, retained earnings of $1,500,000, and an unrealized loss on available-for-sale securities
of $100,000.
• The statement presentation of the unrealized loss is shown below.
DAWSON INC.Partial Balance Sheet
Stockholders’ equity Common stock $ 3,000,000 Retained earnings 1,500,000
Total paid-in capital and retained earnings 4,500,000 Less: Unrealized loss on available-for-sale securities ( 100,000)
Total stockholders’ equity $ 4,400,000

COMPREHENSIVE BALANCE SHEET
The comprehensive balance sheet for Pace Corporation includes the following assets:
1 Short-term Investments,
2 Investments of less than 20%,
and
3 Investments of 20% - 50%.

The comprehensive balance sheet for Pace Corporation includes the following element of stockholders’equity: Unrealized Gain on Available-for-Sale Securities.
COMPREHENSIVE BALANCE SHEET

In the balance sheet, a debit balance in Unrealized Gain or Loss – Equity is reported as a:
a. contra asset account.
b. contra stockholders’ equity account.
c. loss in the income statement.
d. loss in the retained earnings statement.

In the balance sheet, a debit balance in Unrealized Gain or Loss – Equity is reported as a:
a. contra asset account.
b. contra stockholders’ equity account.
c. loss in the income statement.
d. loss in the retained earnings statement.

John Wiley & Sons, Inc. © 2005
Chapter 18Chapter 18
The Statement of
Cash Flows
Prepared by Naomi KarolinskiPrepared by Naomi KarolinskiMonroe Community CollegeMonroe Community College
andand
Marianne BradfordMarianne BradfordBryant CollegeBryant College
Accounting Principles, 7Accounting Principles, 7thth EditionEdition
Weygandt Weygandt •• Kieso Kieso •• KimmelKimmel

After studying this chapter, you should be able to:
1 Indicate the usefulness of the statement of cash flows.
2 Distinguish among operating, investing, and financing activities.
3 Prepare a statement of cash flows using the indirect method.
4 Prepare a statement of cash flows using the direct method.
5 Analyze the statement of cash flows.
CHAPTER 18
THE STATEMENT OF CASH FLOWS

THE STATEMENT OF CASH FLOWS
STUDY OBJECTIVE 1
• Provides information about an entity’s cash receipts and cash payments during a period.
1) Where did the cash come from during the period?
2) What was the cash used for during the period?
3) What was the change in the cash balance during the period?

MEANING OF CASH FLOWS
STUDY OBJECTIVE 2
Prepared using cash and cash equivalents asits basis.Cash equivalents - short-term, highly liquidinvestments that are both:
1)readily convertible to known amounts of cash
2)so near to their maturity that their market value is relatively insensitive to changes in interest rates.

Types of Cash Flows -Operating Activities
• Cash inflows:– From sale of goods or services– From return on loans (interest received) and on
equity securities (dividends received)• Cash outflows:
– To suppliers for inventory– To employees for services– To government for taxes– To lenders for interest– To others for expenses

Types of Cash Flows -Investing Activities
• Cash inflows:– From sale of property, plant, and equipment– From sale of debt or equity securities of other entities– From collection of principal on loans to other entities
• Cash outflows:– To purchase property, plant, and equipment– To purchase debt or equity securities of other entities– To make loans to other entities

Types of Cash Flows -Financing Activities
• Cash inflows:– From sale of equity securities (company's own
stock)– From issuance of debt (bonds and notes)
• Cash outflows:– To stockholders as dividends– To redeem long-term debt or reacquire capital
stock


Significant Noncash Activities...
• That do NOT affect cash are NOT reported in the body of the statement of cash flows.
• Are reported:– In a separate schedule at the bottom
of the statement of cash flows or – In a separate note or supplementary
schedule to the financial statements.

Significant Noncash Activities...
1. Issuance of common stock to purchase assets.
2. Conversion of bonds into common stock.
3. Issuance of debt to purchase assets.4. Exchanges of plant assets.

COMPANY NAME Statement of Cash Flows Period Covered Cash flows from operating activities (List of individual items) XX
Net cash provided (used) by operating activities XXX Cash flows from investing activities (List of individual inflows and outflows) XX
Net cash provided (used) by investing activities XXX Cash flows from financing activities (List of individual inflows and outflows) XX
Net cash provided (used) by financing activities XXX
Net increase (decrease) in cash XXX Cash at beginning of period XXX
Cash at end of period XXX
Noncash investing and financing activities (List of individual noncash transactions) XXX
The general format of the SCF:
Is the 3 activities previously discussed –operating, investing, and financing – plus the significant noncash investing and financing activities.
The general format of the SCF:
Is the 3 activities previously discussed –operating, investing, and financing – plus the significant noncash investing and financing activities.
FORMAT OF STATEMENT OF CASH FLOWS

USEFULNESS OF THE STATEMENT OF CASH
FLOWS
1) Ability to generate future cash flows.
2) Ability to pay dividends and meet obligations.
3) Reasons for the difference between net income and net cash provided (used) by operating activities.
4) Cash invested and financing transactions
during the period.

PREPARING THE STATEMENT OF CASH
FLOWSInformation to prepare this statement
usually comes from 3 sources:
1) Comparative balance sheet.
2) Current income statement.
3) Additional information.The SCF deals with cash receipts and
payments, so the accrual concept is
not used in the preparation of the SCF.

THREE MAJOR STEPS IN PREPARING THE STATEMENT OF
CASH FLOWS
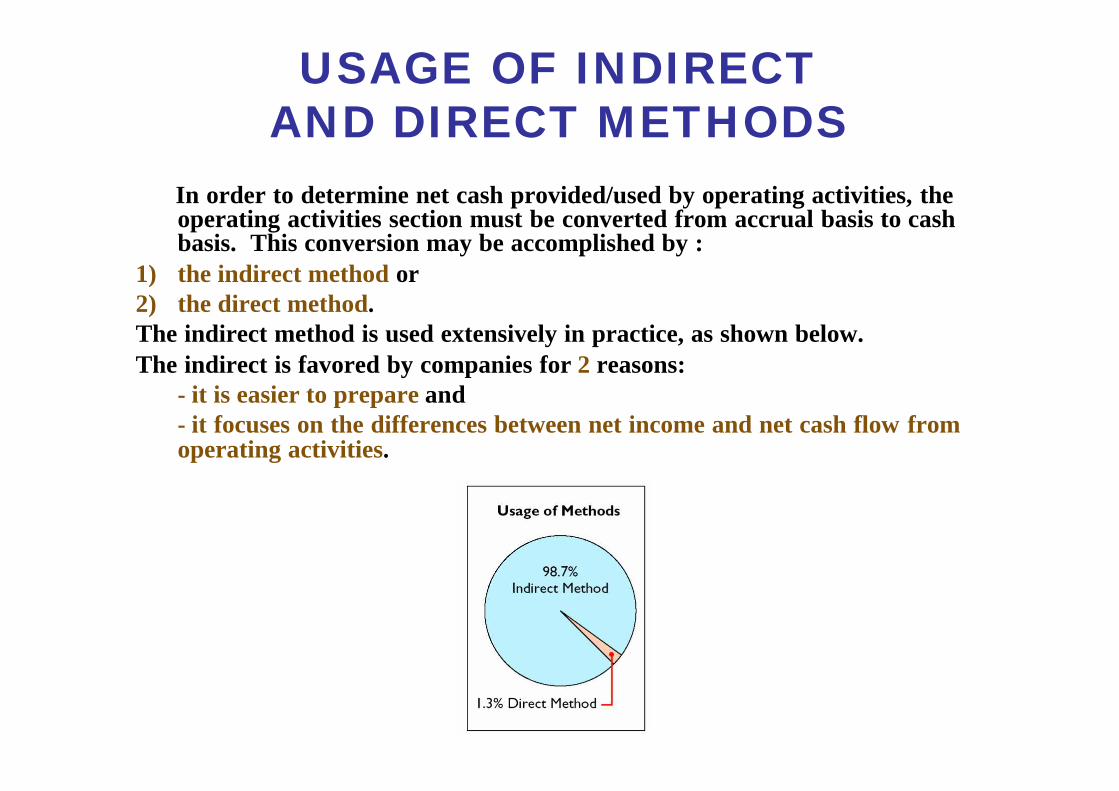
USAGE OF INDIRECT AND DIRECT METHODS
In order to determine net cash provided/used by operating activities, the operating activities section must be converted from accrual basis to cash basis. This conversion may be accomplished by :
1) the indirect method or 2) the direct method. The indirect method is used extensively in practice, as shown below. The indirect is favored by companies for 2 reasons:
- it is easier to prepare and - it focuses on the differences between net income and net cash flow from operating activities.

COMPARATIVE BALANCE SHEET, 2005, WITH INCREASES AND DECREASES
Study Objective 3
The comparative balance sheets at the beginning and end of 2005 –showing increases and decreases –are shown to the right.

INCOME STATEMENT AND ADDITIONAL INFORMATION, 2005
The income statement and additional information for 2005 for Computer Services Company are shown to the right.
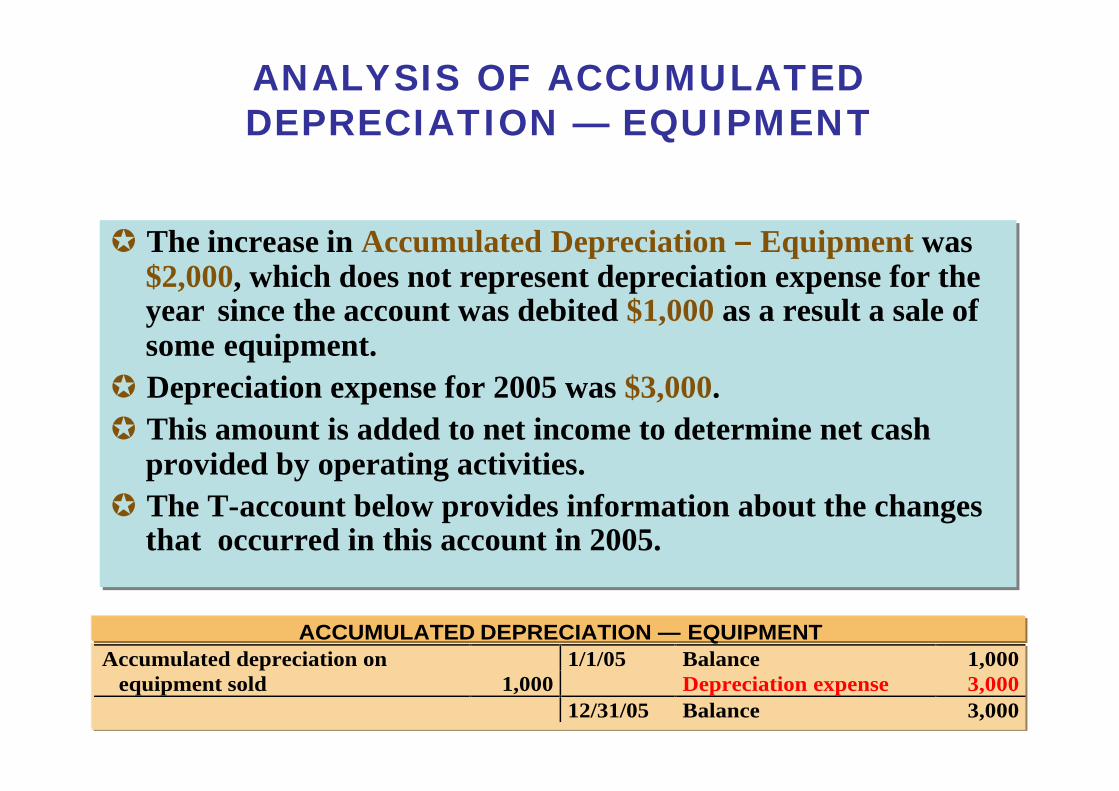
ANALYSIS OF ACCUMULATED DEPRECIATION — EQUIPMENT
ACCUMULATED DEPRECIATION — EQUIPMENT
Accumulated depreciation on 1/1/05 Balance 1,000 equipment sold 1,000 Depreciation expense 3,000
12/31/05 Balance 3,000
µ The increase in Accumulated Depreciation – Equipment was $2,000, which does not represent depreciation expense for the year since the account was debited $1,000 as a result a sale of some equipment.
µ Depreciation expense for 2005 was $3,000.
µ This amount is added to net income to determine net cash provided by operating activities.
µ The T-account below provides information about the changes that occurred in this account in 2005.

PRESENTATION OF NET CASH PROVIDED BY OPERATING ACTIVITIES, 2005 — INDIRECT
METHOD
COMPUTER SERVICES COMPANY Partial Statement of Cash Flows — Indirect Method For the Year Ended December 31, 2005
Cash flows from operating activities Net income $ 145,000 Adjustments to reconcile net income to net cash provided by operating activities: Depreciation expense 9,000 Net cash provided by operating activities $ 154,000
Net cash provided by operating activities for 2005 is $154,000 as calculated below.
Net cash provided by operating activities for 2005 is $154,000 as calculated below.

ANALYSIS OF EQUIPMENT
Equipment increased $17,000, which was a net increase that resulted from 2 transactions:
1) a purchase of equipment of $25,000 and
2) the sale of equipment costing $8,000 for $4,000.
These transactions are classified as investing activities and each should be reported separately. The purchase of equipment should therefore be reported as an outflow of cash for $25,000and the sale should be reported as an inflow of cash for $4,000. The T-account below shows the reasons for the change in this account during the year.
EQUIPMENT
1/1/05 Balance 10,000 Cost of old equipment 8,000 Purchase of equipment 25,000
12/31/05 Balance 27,000

STATEMENT OF CASH FLOWS, 2005-INDIRECT METHOD
COMPUTER SERVICES COMPANY
Statement of Cash Flows
For the Year Ended December 31, 2005
$145,000
27,000
$172,000
$ 9,000
3,000
10,000
(5,000)
(4,000)
16,000
(2,000)
Cash flows from operating activities
Net income
Adjustments to reconcile net income to net cash
provided by operating activities:
Depreciation expense
Loss on sale of equipment
Decrease in accounts receivable
Increase in merchandise inventory
Increase in prepaid expenses
Increase in accounts payable
Decrease in income tax payable
Net cash provided by operating activities

STATEMENT OF CASH FLOWS, 2005-INDIRECT METHOD
COMPUTER SERVICES COMPANY
Statement of Cash Flows
For the Year Ended December 31, 2005
$(141,000)
(9,000)
22,000
33,000
$ 55,000
$ 110,000
$(120,000)
( 25,000)
4,000
20,000
(29,000)
Cash flows from investing activities
Purchase of building
Purchase of equipment
Sale of equipment
Net cash used by investment activities
Cash flows from financing activities
Issuance of common stock
Payment of cash dividends
Net cash used by financing activities
Net increase in cash
Cash at beginning of period
Cash at end of period
Noncash investing and financial activities
Issuance of bonds payable to purchase land

SECTION 2 STATEMENT OF CASH FLOWS
DIRECT METHODStudy Objective 4
• The transactions of Juarez Company for 2005 and 2004 are used to illustrate and explain the indirect method of preparing the SCF.
• 1 Juarez Company started on January 1, 2003, when it issued 300,000 shares of $1 par value
common stock for $300,000 cash.
2 The company rented its office, sales space, and
equipment.

COMPARATIVE BALANCE SHEETS WITH INCREASES AND DECREASES
JUAREZ COMPANY Comparative Balance Sheet Change Assets 2005 2004 Increase/Decrease
Cash $ 191,000 $ 159,000 $ 32,000 Increase Accounts receivable 12,000 15,000 3,000 Decrease Inventory 170,000 160,000 10,000 Increase Prepaid expenses 6,000 8,000 2,000 Decrease Land 140,000 80,000 60,000 Increase
Equipment 160,000 0 160,000 Increase Accum. dep. –Equip. (16,000) 0 16,000 Increase Total $ 663,000 $ 422,000
Liabilities and Stockholders’ Equity
Accounts payable $ 52,000 $ 60,000 $ 8,000 Decrease Accrued exp. payable 15,000 20,000 5,000 Decrease Income taxes payable
Bonds payable Common stock
12,000 130,000 360,000 94,000
–0– –0–
300,000 42,000
12,000 Increase 130,000 Increase
60,000 Increase 52,000 Increase
Total $ 663,000 $ 422,000
The comparative balance sheets at the end of 2005and end of 2004 showing increases and decreases –are shown to the right.
The comparative balance sheets at the end of 2005and end of 2004 showing increases and decreases –are shown to the right.

INCOME STATEMENT AND ADDITIONAL INFORMATION, 2005
JUAREZ COMPANY Income Statement For the Year Ended December 31, 2005 Revenues from sales $ 975,000 Cost of goods sold $ 660,000 Operating expenses (excluding depreciation) 176,000 Depreciation expense 18,000 Loss on sale of store equipment 1,000 855,000
Income before income taxes 120,000 Income tax expense 36,000
Net income $ 84,000
Additional information: (1) In 2005, the company declared and paid a $32,000 cash dividend. (2) Bonds were issued at face value for $130,000 in cash. (3) Equipment costing $180,000 was purchased for cash. (4) Equipment costing $20,000 was sold for $17,000 cash when the book value of the Equipment was $18,000. (5) Common stock of $60,000 was issued to acquire land.
The income statement and additional information for 2005for Juarez Company are shown.
The income statement and additional information for 2005for Juarez Company are shown.

MAJOR CLASSES OF CASH RECEIPTS AND PAYMENTS

CASH RECEIPTS FROM CUSTOMERS
• The income statement for Juarez Company reported revenues from customers of $975,000.
• To determine the amount of cash receipts, the decrease in accounts receivable is added to sales
revenue.
• Conversely, an increase in accounts receivable is deducted from sales revenues.

Revenues from sales $ 975,000Add: Decrease in accounts receivable 3,000
Cash receipts from customers $ 978,000
Revenues from sales were $975,000. Cash receipts from customers were greater than sales revenues since accounts receivable decreased $3,000. Cash receipts from customers were $978,000, as calculated below.
Revenues from sales were $975,000. Cash receipts from customers were greater than sales revenues since accounts receivable decreased $3,000. Cash receipts from customers were $978,000, as calculated below.
COMPUTATION OF CASH RECEIPTS FROM
CUSTOMERS

FORMULA TO COMPUTE CASH RECEIPTS FROM CUSTOMERS —
DIRECT METHOD
The relationships among cash receipts from customers, revenues from sales, and changes in accounts receivable.
Cash receipts from
customers
Revenues from sales {
+ Decrease in accounts receivable or
– Increase in accounts receivable=

COMPUTATION OF PURCHASES
Juarez Company reported cost of goods sold on its income statement of $660,000. To determine purchases, cost of goods sold must be adjusted for the change in inventory. An increase (decrease) in inventory is added to (deducted from) cost of goods sold to arrive at purchases. In 2005, Juarez Company’s inventory increased $10,000. Purchases are calculated as follows.
Juarez Company reported cost of goods sold on its income statement of $660,000. To determine purchases, cost of goods sold must be adjusted for the change in inventory. An increase (decrease) in inventory is added to (deducted from) cost of goods sold to arrive at purchases. In 2005, Juarez Company’s inventory increased $10,000. Purchases are calculated as follows.

FORMULA TO COMPUTE CASH PAYMENTS TO SUPPLIERS — DIRECT
METHOD
Cash payments
to suppliers
=
Cost of goods sold
+ Increase in inventory or
– Decrease in inventory
+ Decrease in accounts payable or
– Increase in accounts payable
The relationship among cash payments to suppliers, cost of goods sold, changes in inventory, and changes in accounts payable is shown.
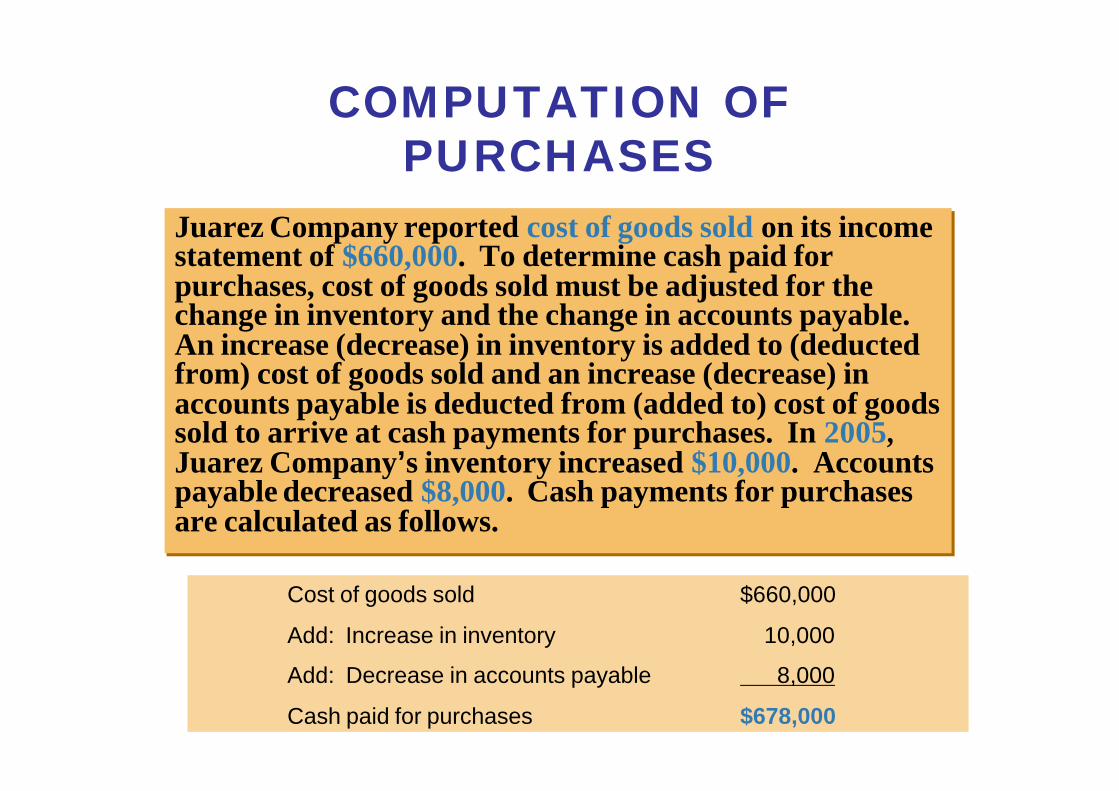
COMPUTATION OF PURCHASES
Juarez Company reported cost of goods sold on its income statement of $660,000. To determine cash paid for purchases, cost of goods sold must be adjusted for the change in inventory and the change in accounts payable. An increase (decrease) in inventory is added to (deducted from) cost of goods sold and an increase (decrease) in accounts payable is deducted from (added to) cost of goods sold to arrive at cash payments for purchases. In 2005, Juarez Company’s inventory increased $10,000. Accounts payable decreased $8,000. Cash payments for purchases are calculated as follows.
Juarez Company reported cost of goods sold on its income statement of $660,000. To determine cash paid for purchases, cost of goods sold must be adjusted for the change in inventory and the change in accounts payable. An increase (decrease) in inventory is added to (deducted from) cost of goods sold and an increase (decrease) in accounts payable is deducted from (added to) cost of goods sold to arrive at cash payments for purchases. In 2005, Juarez Company’s inventory increased $10,000. Accounts payable decreased $8,000. Cash payments for purchases are calculated as follows.
Cost of goods sold $660,000
Add: Increase in inventory 10,000
Add: Decrease in accounts payable 8,000
Cash paid for purchases $678,000

COMPUTATION OF CASH PAYMENTS FOR OPERATING
EXPENSES
Illustration 18-40Computation of Cash Payments for Operating Expenses
Operating expenses, exclusive of depreciation $ 176,000Deduct: Decrease in prepaid expenses ( 2,000)Add: Decrease in accrued expenses payable 5,000
Cash payments for operating expenses $ 179,000
Operating expenses (exclusive of depreciation expense) was $176,000 for 2005. The $2,000 decrease in prepaid expenses is deducted and the $5,000 decrease in accrued expenses payable is added in determining cash payments for operating expenses, as shown in Illustration 18-23.
Operating expenses (exclusive of depreciation expense) was $176,000 for 2005. The $2,000 decrease in prepaid expenses is deducted and the $5,000 decrease in accrued expenses payable is added in determining cash payments for operating expenses, as shown in Illustration 18-23.

FORMULA TO COMPUTE CASH PAYMENTS FOR INCOME TAXES —
DIRECT METHOD
Cash payments for
income taxes
Income tax
expense
+ Decrease in income taxes payable or
– Increase in income taxes payable
=
The relationships among cash payments for income taxes, income tax expense, and changes in income taxes payable are as follows.

COMPUTATION OF CASH PAYMENTS FOR INCOME
TAXESJuarez Company reported income tax expense of $36,000. Income taxes payable increased $12,000. Cash payments for income taxes are calculated as follows.
Juarez Company reported income tax expense of $36,000. Income taxes payable increased $12,000. Cash payments for income taxes are calculated as follows.
Income tax expense $36,000
Less: Increase in income taxes payable 12,000
Cash paid for income tax expense $24,000

OPERATING ACTIVITIES SECTION — DIRECT METHOD
µ All of the revenues and expenses in the 2005 income statement have now been adjusted to cash basis.
µ The operating activities section of the SCF is shown below.
µ All of the revenues and expenses in the 2005 income statement have now been adjusted to cash basis.
µ The operating activities section of the SCF is shown below.
JUAREZ COMPANY Partial Statement of Cash Flows — Direct Method For the Year Ended December 31, 2005
Cash flows from operating activities Cash receipts from customers $ 978,000 Cash payments: To suppliers $ 678,000 For operating expenses 179,000 For income taxes 24,000 881,000
Net cash provided by operating activities $ 97,000

STATEMENT OF CASH FLOWS 2005 — DIRECT METHOD

Free Cash Flow – Cash provided by operating activities adjusted for capital expenditures and dividends paid.
FREE CASH FLOWStudy Objective 5

Which of the following items is reported on a cash flow statement prepared by the direct method?
a. Loss on sale of building.
b. Increase in accounts receivable.
c. Depreciation expense.
d. Cash payments to suppliers.

Which of the following items is reported on a cash flow statement prepared by the direct method?
a. Loss on sale of building.
b. Increase in accounts receivable.
c. Depreciation expense.
d. Cash payments to suppliers.

John Wiley & Sons, Inc. © 2005
Chapter 19Chapter 19
Financial Statement Analysis
Accounting Principles, 7Accounting Principles, 7thth EditionEdition
Weygandt Weygandt •• Kieso Kieso •• KimmelKimmel
Prepared by Naomi KarolinskiPrepared by Naomi KarolinskiMonroe Community CollegeMonroe Community College
andand
Marianne BradfordMarianne BradfordBryant CollegeBryant College

CHAPTER 19FINANCIAL STATEMENT ANALYSIS
After studying this chapter, you should be able to:
1 Discuss the need for comparative analysis.
2 Identify the tools of financial statement analysis.
3 Explain and apply horizontal analysis.
4 Describe and apply vertical analysis.
After studying this chapter, you should be able to:
5 Identify and compute ratios and describe their purpose and use in analyzing a firm’s liquidity, profitability, and solvency.
6 Understand the concept of earning power; and indicate how material items not typical of regular operations are presented.
7 Recognize the limitations of financial statement analysis.
CHAPTER 19FINANCIAL STATEMENT ANALYSIS

•Three characteristics of a company:1) liquidity2) profitability3) solvency
• In order to obtain information as to whether theamount:
1) represents an increase over prior years or 2) is adequate in relation to the company’s need for cash, or 3) the amount of cash must be compared with other financial statement data.
BASICS OF FINANCIAL STATEMENT ANALYSIS
STUDY OBJECTIVE 1
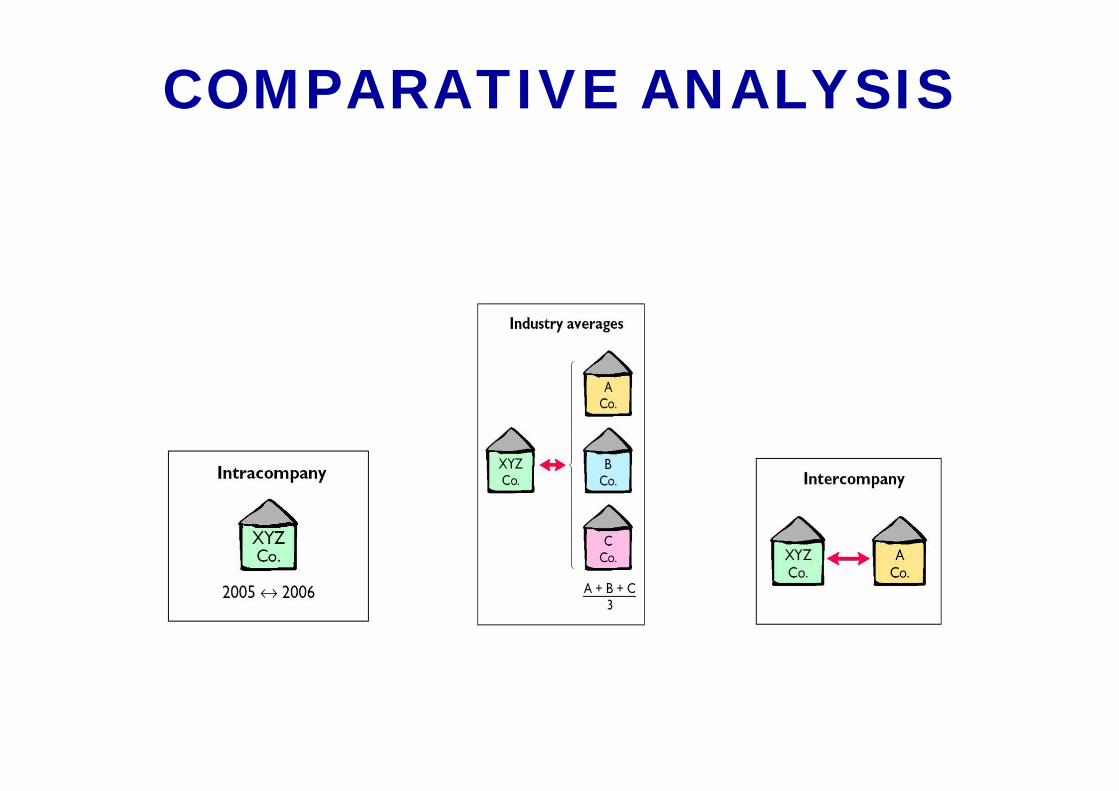
COMPARATIVE ANALYSIS

Three commonly used tools are utilized to evaluate the significance of financial statement data.
1) Horizontal analysis (trend analysis) evaluates a series of financial statement data over a period of time.
2) Vertical analysis evaluates financial statement data expressing each item in a financial statement as a percent of a base amount.
3) Ratio analysis expresses the relationship among selected items of financial statement data.
TOOLS OF FINANCIAL STATEMENT ANALYSIS
STUDY OBJECTIVE 2

SEARS, ROEBUCK’S NET SALESSTUDY OBJECTIVE 3
SEARS, ROEBUCK AND CO. (Net Sales in Millions) 2002 2001 2000 41,366 40,990 40.848
The purpose of horizontal analysis is to determine the increase or decrease that has taken place. This change may be expressed as either an amount or a percentage. The recent net sales figures of Sears, Roebuckand Co. are shown above.
The purpose of horizontal analysis is to determine the increase or decrease that has taken place. This change may be expressed as either an amount or a percentage. The recent net sales figures of Sears, Roebuckand Co. are shown above.

FORMULA FOR HORIZONTAL ANALYSIS OF CHANGES SINCE
BASE PERIOD
Given that 2000 is the base year, we can measure all percentage increases or decreases from this base period amount as shown below.
Given that 2000 is the base year, we can measure all percentage increases or decreases from this base period amount as shown below.
Current year amount — Base year amount———————————————————————
Base year amount
Change since base
period

FORMULA FOR HORIZONTAL ANALYSIS OF CURRENT YEAR
Current year amount ———————— Base year amount
Current results in relation to base period
Alternatively, we can express current year sales as a percentage of the base period. This is done by dividing the current year amount by the base year amount, as shown below.
Alternatively, we can express current year sales as a percentage of the base period. This is done by dividing the current year amount by the base year amount, as shown below.

HORIZONTAL ANALYSIS OF A BALANCE SHEET
£ The two-year condensed balance sheet of Quality Department Store Inc. for 2002 and 2001 showing dollar and percentage changes is displayed in Illustration 19-5.
£ In the asset section, plant assets (net) increased $167,500 or 26.5%.
£ In the liabilities section, current liabilities increased $41,500 or 13.7%.
£ In the stockholders’ equity section, retained earnings increased $202,600 or 38.6%.
£ It appears the company expanded its asset base during 2002 and financed the expansion by retaining income in the firm.

HORIZONTAL ANALYSIS OF INCOME STATEMENTS
The two-year comparative income statements of QualityDepartment Store Inc. for 2002 and 2001 is shown incondensed form on Illustration 19-6. Horizontal analysisof the comparative income statement shows the followingchanges:1) Net sales increased $260,000, or 14.2%
($260,000 ÷ $1,837,000).2) Cost of goods sold increased $141,000, or 12.4%
($141,000 ÷ $1,140,000).3) Total operating expenses increased $37,000, or 11.6%
($37,000 ÷ $320,000).

HORIZONTAL ANALYSIS OF RETAINED EARNINGS
STATEMENTS
QUALITY DEPARTMENT STORE INC. Retained Earnings Statement For the Years Ended December 31 Increase or (Decrease) during 1999
2002 2001 Amount Percentage
Retained earnings, January 1 $ 525,000 $ 376,500 $ 148,500 39.4% Add: Net income 263,800 208,500 55,300 26.5%
788,800 585,000 203,800 Deduct: Dividends 61,200 60,000 1,200 2.0%
Retained earnings, December 31 $ 727,600 $ 525,000 $ 202,600 38.6%
Analyzed horizontally:
1) Net income increased $55,300, or 26.5%.
2) Common dividends increased only $1,200, or 2%.
3) Ending retained earnings increased 38.6%.

In horizontal analysis, each item is expressed as a percentage of the:
a. net income amount.
b. stockholders’ equity amount.
c. total assets amount.
d. base year amount.

In horizontal analysis, each item is expressed as a percentage of the:
a. net income amount.
b. stockholders’ equity amount.
c. total assets amount.
d. base year amount.

VERTICAL ANALYSIS OF BALANCE SHEETS
STUDY OBJECTIVE 4
Presented on the next slide is the two-year comparative balance sheet of Quality Department Store Inc. for 2002 and 2001.
1 Current assets increased $75,000 from 2001 to 2002, they decreased from 59.2% to 55.6% of total assets.
2 Plant assets (net) increased from 39.7% to 43.6% of total assets, and
3 Retained earnings increased from 32.9% to 39.7% of total liabilities and stockholders’ equity.
These results reinforce earlier observations that Quality is financing its growth through retention of earnings rather than from issuing additional debt.

VERTICAL ANALYSIS OF BALANCE SHEETS
QUALITY DEPARTMENT STORE INC. Condensed Balance Sheets December 31 2002 2001
Amount Percent Amount Percent
Assets
Current assets $ 1,020,000 55.6% $ 945,000 59.2% Plant assets (net) 800,000 43.6% 632,500 39.7% Intangible assets 15,000 0.8% 17,500 1.1%
Total assets $ 1,835,000 100.0% $ 1,595,000 100.0%
Liabilities
Current liabilities $ 344,500 18.8% $ 303,000 19.0% Long-term liabilities 487,500 26.5% 497,000 31.2%
Total liabilities 832,000 45.3% 800,000 50.2%
Stockholders’ Equity
Common stock, $1 par 275,400 15.0% 270,000 16.9% Retained earnings 727,600 39.7% 525,000 32.9%
Total stockholders’ equity 1,003,000 54.7% 795,000 49.8%
Total liabilities and stockholders’ equity $ 1,835,000 100.0% $1,595,000 100.0%

VERTICAL ANALYSIS OF INCOME
STATEMENTS
Vertical analysis of the two-year comparative incomestatement of Quality Department Store Inc. for 2002 and2001 is shown on the next slide.
1) Cost of goods sold as a percentage of net sales declined 1% (62.1% versus 61.1%).
2) Total operating expenses declined 0.4% (17.4% versus 17.0%).
3) Net income as a percent of net sales therefore increased from 11.4% to 12.6%.
Quality appears to be a profitable enterprise that is becoming more successful.

VERTICAL ANALYSIS OF INCOME
STATEMENTS QUALITY DEPARTMENT STORE INC. Condensed Income Statements For the Years Ended December 31 2002 2001
Amount Percent Amount Percent
Sales $ 2,195,000 104.7% $ 1,960,000 106.7% Sales returns and allowances 98,000 4.7% 123,000 6.7%
Net sales 2,097,000 100.0% 1,837,000 100.0% Cost of goods sold 1,281,000 61.1% 1,140,000 62.1%
Gross profit 816,000 38.9% 697,000 37.9%
Selling expenses 253,000 12.0% 211,500 11.5% Administrative expenses 104,000 5.0% 108,500 5.9%
Total operating expenses 357,000 17.0% 320,000 17.4%
Income from operations 459,000 21.9% 377,000 20.5% Other revenues and gains Interest and dividends 9,000 0.4% 11,000 0.6% Other expenses and losses Interest expense 36,000 1.7% 40,500 2.2%
Income before income taxes 432,000 20.6% 347,500 18.9% Income tax expense 168,200 8.0% 139,000 7.5%
Net income $263,800 12.6% $208,500 11.4%

INTERCOMPANY INCOME STATEMENT COMPARISON
Vertical analysis enables you to compare companies of different sizes. Quantity’s major competitor is a Sears, Roebuck store in a nearby town. Using vertical analysis, the small Quality Department Store Inc. can be meaningfully compared to the much larger Sears.
1 Gross profit rates were somewhat comparable at 38.9% and 38.0%.
2 Income from operations percentages were significantly different at 21.9% and 5.0%.
3 Quality’s selling and administrative expenses percentage was much lower than Sears’ (17% to 33%.)
4 Sears’ net income as a percentage of sales was much lower than Quality’s ( 3.3% to 12.6%.)

In vertical analysis, the base amount for depreciation expense is generally:
a. net sales.
b. depreciation expense in a previous year.
c. gross profit.
d. fixed assets.

In vertical analysis, the base amount for depreciation expense is generally:
a. net sales.
b. depreciation expense in a previous year.
c. gross profit.
d. fixed assets.

RATIO ANALYSISSTUDY OBJECTIVE 5
• Ratio analysis expresses the relationship among selected items of financial statement data.
• A ratio expresses the mathematical relationship between one quantity and another.
• A single ratio by itself is not very meaningful, in the upcomingillustrations we will use:
1) Intracompany comparisons for two years for the Quality Department Store.
2) Industry average comparisons based on median ratios for department stores from Dun & Bradstreet and Robert
Morris Associates’ median ratios.
3) Intercompany comparisons based on the Sears, Roebuck and Co., as Quality Department Store’s principal competitor.

FINANCIAL RATIO CLASSIFICATIONS

CURRENT RATIO
CURRENT ASSETS CURRENT RATIO = ———————————
CURRENT LIABILITIES
•The current ratio (working capital ratio) is a widely
used measure for evaluating a company’s liquidity
and short-term debt-paying ability.
•It is computed by dividing current assets by current
liabilities and is a more dependable indicator of
liquidity than working capital.
•The current ratios for Quality Department Store and
comparative data are shown below.

CURRENT RATIO
Quality Department Store
2002 2001
$1,020,000 $945,000 ————— = 2.96:1 ———— = 3.12:1 $344,500 $303,000
Industry average Sears, Roebuck and Co. ———————— ———————————— 1.28:1 2.19:1

Quality Department Store Balance Sheet (partial)
2002 2001
Current assets Cash $ 100,000 $ 155,000 Marketable securities 20,000 70,000 Receivables (net) 230,000 180,000 Inventory 620,000 500,000 Prepaid expenses 50,000 40,000
Total current assets $ 1,020,000 $ 945,000
CURRENT ASSETS OF QUALITY DEPARTMENT
STORE

ACID-TEST RATIO
CASH + MARKETABLE SECURITIES + RECEIVABLES (NET) ACID-TEST RATIO = ————————————————————————————
CURRENT LIABILITIES
•The acid-test ratio (quick ratio) is a measure ofa company’s short-term liquidity.
•It is computed by dividing the sum of cash,marketable securities, and net receivables bycurrent liabilities.
•The acid-test ratios for Quality DepartmentStore and comparative data are on the nextslide.

ACID-TEST RATIO
Quality Department Store
2002 2001
$100,000 + $20,000 + $230,000 $155,000 + $70,000 + $180,000 —————————————— = 1.0:1 —————————————— = 1.3:1 $344,500 $303,000
Industry average Sears, Roebuck and Co. ———————— ———————————— 0.33:1 1.81:1

RECEIVABLES TURNOVER
NET CREDIT SALES RECEIVABLES TURNOVER = ———————————————
AVERAGE NET RECEIVABLES
• The receivables turnover ratio is used to assess the liquidity of the receivables.
• It measures the number of times, on average, receivables are collected during the period.
• The ratio is computed by dividing net credit salesby average net receivables.

RECEIVABLES TURNOVER
Quality Department Store
Industry average Sears, Roebuck and Co. ———————— ———————————— 10.8 times 1.4 times
[ ] [ ]
2002 2001
$2,097,000 $1,837,000 —————————— = 10.2 times —————————— = 9.7 times $180,000 + $230,000 $200,000 + $180,000 —————————— —————————— 2 2

INVENTORY TURNOVER
COST OF GOODS SOLD INVENTORY TURNOVER = ————————————
AVERAGE INVENTORY
• The inventory turnover ratio measures the number of times, on average, the inventory is sold during the period.
• Its purpose is to measure the liquidity of the inventory. It is computed by dividing cost ofgoods sold by average inventory during the year.

INVENTORY TURNOVER
Quality Department Store
[ ] [ ]
2002 2001
$1,281,000 $1,140,000 —————————— = 2.3 times —————————— = 2.4 times $500,000 + $620,000 $450,000 + $500,000 —————————— —————————— 2 2
Industry average Sears, Roebuck and Co. ———————— ———————————— 6.7 times 4.6 times

PROFIT MARGIN
NET INCOME PROFIT MARGIN ON SALES = ——————
NET SALES
• The profit margin ratio is a measure of the percentage of each dollar of sales that results in net income.
• It is computed by dividing net income by net sales.

PROFIT MARGIN RATIO
Quality Department Store
2002 2001
$263,800 $208,500 ————— = 12.6% ————— = 11.4% $2,097,000 $1,837,000
Industry average Sears, Roebuck and Co. ———————— ———————————— 3.57% 3.65%

ASSET TURNOVER
NET SALES ASSET TURNOVER = —————————
AVERAGE ASSETS
• Asset turnover measures how efficiently a company uses its assets to generate sales.
• It is determined by dividing net sales by average assets.

ASSET TURNOVER
2002 2001
$2,097,000 $1,837,000 ——————————— = 1.2 times ——————————— = 1.2 times $1,595,000 + $1,835,000 $1,446,000 + $1,595,000 ——————————— ——————————— 2 2
[ ] [ ]
Quality Department Store
Industry average Sears, Roebuck and Co. 2.37 times 0.86 times

RETURN ON ASSETS
NET INCOME RETURN ON ASSETS = —————————
AVERAGE ASSETS
An overall measure of profitability is return on assets. It is computed by dividing net income by average assets for the period.

2002 2001
$263,800 $208,500 ——————————— = 15.4% ——————————— = 13.7% $1,595,000 + $1,835,000 $1,446,000 + $1,595,000 ——————————— ——————————— 2 2
[ ] [ ]
Quality Department Store
Industry average Sears, Roebuck and Co.———————— ————————————
8.29% 3.13%
RETURN ON ASSETS

RETURN ON COMMON STOCKHOLDERS’ EQUITY
RETURN ON COMMON NET INCOME STOCKHOLDERS’ EQUITY = ———————————————————————
AVERAGE COMMON STOCKHOLDERS’ EQUITY
• A ratio that measures profitability from the viewpoint of the common stockholder is return on common stockholders’ equity.
• It is computed by dividing net income by average common stockholders’ equity.

RETURN ON COMMON STOCKHOLDERS’ EQUITY
2002 2001
$263,800 $208,500 ——————————— = 29.3% ——————————— = 28.5% $795,000 + $1,003,000 $667,000 + $795,000 ——————————— ——————————— 2 2
[ ] [ ]
Quality Department Store
Industry average Sears, Roebuck and Co. ———————— ———————————— 20.5% 22.9%

RETURN ON COMMON STOCKHOLDERS’ EQUITY WITH
PREFERRED STOCK
RATE OF RETURN ON COMMON NET INCOME – PREFERRED DIVIDENDS STOCKHOLDERS’ EQUITY = ———————————————————————
AVERAGE COMMON STOCKHOLDERS’ EQUITY
• When preferred stock is present, preferred dividend requirements are deducted from netincome to compute income available to commonstockholders.
• The par value of preferred stock (or call price – if applicable) must be deducted from totalstockholders’ equity to determine the amount of common stockholders’ equity used in this ratio. The ratio then appears as shown below.

EARNINGS PER SHARE
EARNINGS NET INCOME PER SHARE = ————————————————————————————
WEIGHTED AVERAGE COMMON SHARES OUTSTANDING
• Earnings per share (EPS) is a measure of net income earned on each share of common stock.
• It is calculated by dividing net income by the number of weighted average common shares outstanding during the year.
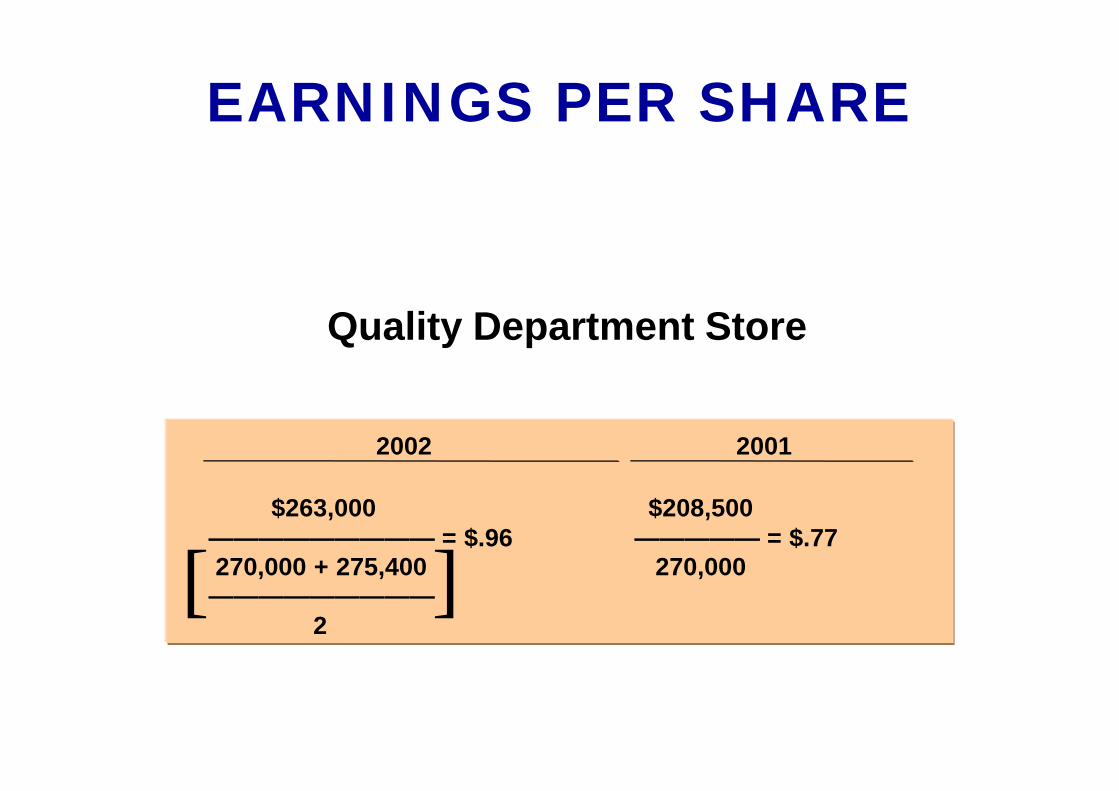
EARNINGS PER SHARE
Quality Department Store
2002 2001
$263,000 $208,500————————— = $.96 ————— = $.77270,000 + 275,400 270,000
—————————2
[ ]

PRICE-EARNINGS RATIO
• The price-earnings (PE) ratio measures the ratio of the market price of each share of common stock to the earnings per share.
• It is computed by dividing the market price per share of common stock by earnings per share.
MARKET PRICE PER SHARE OF COMMON STOCK PRICE-EARNINGS RATIO = —————————————————————————
EARNINGS PER SHARE

PRICE-EARNINGS RATIO
Quality Department Store
2002 2001
$12.00 $ 8.00——— = 12.5 times ——— = 10.4 times$ .96 $ .77
Industry average Sears, Roebuck and Co.———————— ———————————
26 times 7 times

PAYOUT RATIO
CASH DIVIDENDS PAYOUT RATIO = —————————
NET INCOME
The payout ratio measures the percentage of earnings distributed in the form of cash dividends. It is computed by dividing cash dividendsby net income.

PAYOUT RATIO
2002 2001
$61,200 $60,000 ————— = 23.2% ————— = 28.8% $263,800 $208,500
Industry average Sears, Roebuck and Co.———————— ———————————
16.0% 20%
Quality Department Store

DEBT TO TOTAL ASSETS
TOTAL DEBT DEBT TO TOTAL ASSETS = ————————
TOTAL ASSETS
• The debt to total assets ratiomeasures the percentage of total assets provided by creditors.
• It is computed by dividing total debt by total assets.
• The debt to total assets ratiomeasures the percentage of total assets provided by creditors.
• It is computed by dividing total debt by total assets.

DEBT TO TOTAL ASSETS RATIO
Industry average Sears, Roebuck and Co.———————— ————————————
40.1% 76.1%
$832,000 = 45.30% $800,000 = 50.20%
$1,835,000 $1,595,000
2002 2001
Quality Department Store

TIMES INTEREST EARNED
TIMES INTEREST INCOME BEFORE INCOME TAXES AND INTEREST EXPENSE EARNED = —————————————————————————————
INTEREST EXPENSE
Times interest earned provides an indication of the company’s ability to meet interest payments as they come due. It is computed by dividing income before income taxes and interest expense byinterest expense.
Times interest earned provides an indication of the company’s ability to meet interest payments as they come due. It is computed by dividing income before income taxes and interest expense byinterest expense.

TIMES INTEREST EARNED
Quality Department Store
2002 2001
$468,000 $388,000———— = 13 times ———— = 9.6 times$36,000 $40,500
Industry average Sears, Roebuck and Co. ———————— ———————————— 11.98 times 2.8 times

IRREGULAR OPERATIONSSTUDY OBJECTIVE 6
Three types of “Irregular” items:
1) Discontinued operations
2) Extraordinary items
3) Changes in accounting principle

DISCONTINUED OPERATIONS
• The disposal of a significant segment of the business.
– The income or (loss) form discontinued operations consists of two parts:
• The income or (loss) form operations and
• The gain or ( loss) on the disposal of the segment
• The results are shown “net of tax”.

STATEMENT PRESENTATION OF DISCONTINUED OPERATIONS

EXTRAORDINARY ITEMS
• Extraordinary items are events and transactions that meet two conditions:
– unusual in nature and
– infrequent in occurance
– The results are shown “net of tax”.

STATEMENT PRESENTATION OF EXTRAORDINARY ITEMS

EXAMPLES OF EXTRAORDINARY AND ORDINARY ITEMS

CHANGE IN ACCOUNTING PRINCIPLE
• A change in accounting principle occurs when the principle used in the current year is different form the one used the preceding year. When this occurs:
– The new principle is used to report the results of operations for the current year.
– The cumulative effect of the change on all prior year income statements should be disclosed “net of tax”.

STATEMENT PRESENTATION OF CHANGE IN ACCOUNTING
PRINCIPLE

You should be aware of some of the limitations of the three analytical tools illustrated in the chapter and of the financial statements on which they are based.
1) Estimates: Financial statements contain numerous estimates; to the extent that these estimates are
inaccurate, the financial ratios and percentages are inaccurate.
2) Cost: Traditional financial statements are based on cost and are not adjusted for price-level changes. Comparisons of unadjusted financial data from different periods may be rendered invalid by significant inflation or deflation.
LIMITATIONS OF FINANCIAL ANALYSIS
STUDY OBJECTIVE 7

3) Alternative Accounting Methods: Variations among companies in the application of GAAP may hamper comparability.
Differences in accounting methods might be detectable from reading the notes to the financial statements, adjusting the financial data to compensate for the different methods is difficult, if not impossible, in some cases.
LIMITATIONS OF FINANCIAL ANALYSIS

4) Atypical Data: Fiscal year-end data may not be typical of the financial condition during the year. Firms often establish a fiscal year-end that coincides with the low point in operating activity or in inventory levels. Thus, certain account balances may not be representative of the account balances during the year.
5) Diversification of Firms: Diversification in U.S. industries also restricts the usefulness of financial analysis. Many firms today are too diversified to be classified by industry, while others appear to be comparable when they are not.
LIMITATIONS OF FINANCIAL ANALYSIS

Which of the following is generally not considered to be a limitation of financial analysis?
a. Use of estimates.
b. Use of ratio analysis.
c. Use of cost.
d. Use of alternative accounting methods.

Which of the following is generally not considered to be a limitation of financial analysis?
a. Use of estimates.
b. Use of ratio analysis.
c. Use of cost.
d. Use of alternative accounting methods.

John Wiley & Sons, Inc. © 2005
Chapter 20Chapter 20
Managerial Accounting
Accounting PrinciplesAccounting Principles77thth EditionEdition
WeygandtWeygandt •• KiesoKieso •• KimmelKimmel
Prepared by Naomi KarolinskiPrepared by Naomi KarolinskiMonroe Community CollegeMonroe Community College
andand
Marianne BradfordMarianne BradfordBryant CollegeBryant College

CHAPTER 20MANAGERIAL ACCOUNTING
After studying this chapter, you should be able to:
1. Explain the distinguishing features of managerial accounting.
2. Identify the three broad functions of management.
3. Define the three classes of manufacturing costs.
4. Distinguish between product and period costs.
5. Explain the difference between a merchandising and a manufacturing income statement.

CHAPTER 20MANAGERIAL ACCOUNTING
After studying this chapter, you should be able to:
6. Indicate how cost of goods manufactured is determined.
7. Explain the difference between a merchandising and a manufacturing balance sheet.

MANAGERIAL ACCOUNTING BASICS
STUDY OBJECTIVE 1
Management Accounting
• A field of accounting that provides economic and financial information for managers and other internal users.

Activities include:
• Explaining manufacturing and nonmanufacturing costs and how they are reported in the financial statements
• Computing the cost of providing a service or manufacturing a product
• Determining the behavior of costs and expenses as activity levels change
• Analyzing cost-volume profit relationships within a company
MANAGERIAL ACCOUNTINGBASICS

Activities include (continued):
• Assisting management in profit planning and budgeting
• Providing a basis for controlling costs and expenses by comparing actual results with planned
objectives and standard costs• Accumulating and presenting relevant data for
management decision making
MANAGERIAL ACCOUNTINGBASICS

COMPARING MANAGERIAL AND FINANCIAL ACCOUNTING

ETHICAL STANDARDSFOR MANAGERIAL
ACCOUNTANTS
• Managerial Accountants have an ethical obligation to their companies and the public.
• The Institute of Management Accountants (IMA) developed a code of ethical standards which divides the managerial accountant’s responsibilities into 4 areas:
– Competence
– Confidentiality
– Integrity
– Objectivity

MANAGEMENT FUNCTIONSSTUDY OBJECTIVE 2
1. Planning
2. Motivating and Directing
3. Controlling

PLANNING
Planning requires management to:
• Look ahead
• Establish objectives
• Add value to the business under its control (as measured by company’s stock price or its potential selling price)
Directing and Motivating requires management to:
• Coordinate a company’s activities
• Implement planned objectives
• Select and train employees
• Prepare organization charts
DIRECTING AND MOTIVATING

CONTROLLING
Controlling requires management to:
• Keep the firm’s activities on track
• Determine whether planned goals are being met
• Decide what changes are needed if goals are not met

MANAGERIAL
COST CONCEPTSManagers need information related to costs, such as:
• What costs are involved in making the product or providing a service?
• If production volume is decreased, will costs decrease?
• What impact will automation have on total costs?
• How can costs best be controlled?

MANAGERIAL
COST CONCEPTS
• Manufacturing: Activities and processes that convert raw materials into finished goods.
• Manufacturing Costs include:– Direct materials
– Direct labor
– Manufacturing overhead

Managerial accounting:
a. is governed by generally accepted accounting principles.
b. places emphasis on special-purpose information.
c. pertains to the entity as a whole and is highly aggregated.
d. is limited to cost data.
Chapter 20

Managerial accounting:
a. is governed by generally accepted accounting principles.
b. places emphasis on special-purpose information.
c. pertains to the entity as a whole and is highly aggregated.
d. is limited to cost data.
Chapter 20

CLASSIFICATIONS OF MANUFACTURING COSTS
STUDY OBJECTIVE 3

MANUFACTURING COSTSDIRECT MATERIALS
Materials
Raw materials• The basic materials and parts that are used in the
manufacturing process
• Raw materials physically and directly associated with the finished product are called direct materials

INDIRECT MATERIALS
• Indirect Materials are raw materials which cannot be easily associated with the finished product.
• Not physically part of the finished product
• Cannot be traced because their physical association with the finished product is too small
in terms of cost
• Accounted for as part of Manufacturing Overhead

LABOR
Factory Labor
• Direct Labor: The work of factory employees which is physically and directly associated with converting raw materials into finished goods.
• Indirect Labor: Efforts which have no physical association with the finished product or it’s impractical to trace the costs.
• Indirect Labor: Classified as Manufacturing Overhead

MANUFACTURING OVERHEAD
•Consists of costs that are indirectly associated with manufacturing the finished product.
•Includes:• Indirect materials
• Indirect labor
• Depreciation on factory buildings and machines
• Insurance, taxes, maintenance on factory facilities
Manufacturing Overhead

PRODUCT COSTS VERSUS PERIOD COSTS
STUDY OBJECTIVE 4
Product costs:
• include each of the manufacturing cost elements (direct materials, direct labor, and manufacturing overhead)
• are a necessary and integral part of producing the finished product
• are recorded as inventory and not expensed to cost of goods sold until the time of sale

PRODUCT COSTS VERSUSPERIOD COSTS
Period costs:
• are identifiable with a specific time period
• are nonmanufacturing costs
• are not included in inventory
• include selling and administrative expenses
• are deducted from revenues in the period incurred

PRODUCT VERSUS PERIOD COSTS
Product Costs
Direct Materials
Direct Labor
Manufacturing Overhead
Period Costs
Selling Expenses
Administrative Expenses
{Manufacturing Costs
{NonmanufacturingCosts

Merchandising versus Manufacturing Income Statement
STUDY OBJECTIVE 5
The income statement for a manufacturer is similar to that of a merchandiser exceptthe cost of goods sold section.

COST OF GOODS SOLD SECTION OF AMERCHANDISING COMPANY
The cost of goods sold sections for merchandising company includes cost of goods purchased:
The cost of goods sold sections for merchandising company includes cost of goods purchased:
MERCHANDISE COMPANY Partial Income Statement For the Year Ended December 31, 2005 Cost of goods sold Merchandise inventory, January 1 $ 70,000 Cost of goods purchased 650,000
Cost of goods available for sale 720,000 Merchandise inventory, December 31 400,000
Cost of goods sold $ 320,000

COST OF GOODS SOLD SECTION OF AMANUFACTURING COMPANY
MANUFACTURING COMPANY Partial Income Statement For the Year Ended December 31, 2005 Cost of goods sold Finished goods inventory, January 1 $ 90,000 Cost of goods manufactured 370,000
Cost of goods available for sale 460,000 Finished goods inventory, December 31 80,000
Cost of goods sold $ 380,000
The cost of goods sold sections for manufacturing company includes cost of goods manufactured:
The cost of goods sold sections for manufacturing company includes cost of goods manufactured:

Cost of Goods Sold
Beginning Finished Goods
Inventory
Manufacturer
Merchandiser
Beginning Merchandise
Inventory
Ending Merchandise
Inventory
Ending Finished Goods
Inventory
Cost of Goods Purchased
Cost of Goods Manufactured
+
+ -
-
=
=
COST OF GOODS SOLDCOMPONENTS

COST OF GOODS MANUFACTURED
FORMULASTUDY OBJECTIVE 6
=-Total Cost of Work in Process
Ending Work in Process Inventory
Cost of Goods Manufactured
Beginning Work in Process
Inventory
+ =Total Current
Manufacturing Costs
Total Cost of Work in Process

COST OF GOODS MANUFACTURED SCHEDULE
OLSEN MANUFACTURING COMPANY Cost of Goods Manufactured Schedule For the Year Ended December 31, 2005 Work in process, January 1 $ 18,400 Direct materials Raw materials inventory, January 1 $ 16,700 Raw materials purchases 152,500
Total raw materials available for use 169,200 Less: Raw materials inventory, Dec. 31 22,800
Direct materials used $ 146,400 Direct labor 175,600 Manufacuring overhead Indirect labor 14,300 Factory repairs 12,600 Factory utilities 10,100 Factory depreciation 9,440 Factory insurance 8,360
Total manufacturing overhead 54,800
Total manufacuring costs 376,800
Total cost of work in process 395,200 Less: Work in process, December 31 25,200
Cost of goods manufactured $ 370,000
The Cost of Goods Manufactured Schedule – as shown on the right is an internal financial schedule that shows each of the cost elements.
The Cost of Goods Manufactured Schedule – as shown on the right is an internal financial schedule that shows each of the cost elements.

The sum of the direct materials costs, direct labor costs, and manufacturing overhead incurred is the:
a. cost of goods manufactured.
b. total manufacturing overhead.
c. total manufacturing costs.
d. total cost of work in process.
Chapter 20

The sum of the direct materials costs, direct labor costs, and manufacturing overhead incurred is the:
a. cost of goods manufactured.
b. total manufacturing overhead.
c. total manufacturing costs.
d. total cost of work in process.
Chapter 20

CURRENT ASSETS SECTIONS MERCHANDISING AND MANUFACTURING
BALANCE SHEETS
STUDY OBJECTIVE 7
Merchandiser§ One inventory category
Manufacturer§ Three inventory accounts:
• Finished Goods Inventory
• Work in Process Inventory
• Raw Materials Inventory

CURRENT ASSETS SECTIONS OF MERCHANDISING AND
MANUFACTURING BALANCE SHEETS
Merchandising Company Balance Sheet December 31, 2005 Current assets Cash $ 100,000 Receivables (net) 210,000 Merchandise inventory 400,000 Prepaid expenses 22,000
Total current assets $ 732,000

CURRENT ASSETS SECTIONS OF MERCHANDISING AND
MANUFACTURING BALANCE SHEETS
Manufacturing Company Balance Sheet December 31, 2005 Current assets Cash $ 180,000 Receivables (net) 210,000 Inventories: Finished goods $ 80,000 Work in process 25,200 Raw materials 22,800 128,000
Prepaid expenses 18,000
Total current assets $ 536,000

ASSIGNMENT OF COSTS TO COST
CATEGORIES
Product Costs
Direct Direct Manufacturing PeriodCost Item Materials Labor Overhead Costs
1. Material cost ($10 per door) X2. Labor costs ($8 per door) X3. Depreciation on new equipment
($25,000 per year) X4. Property taxes ($6,000 per year) X5. Advertising costs ($30,000 per year) X6. Sales commissions ($4 per door) X7. Maintenance salaries ($28,000 per
year) X8. Salary of plant manager ($70,000) X9. Cost of shipping pre-hung doors
($12 per door) X
The manufacturing and selling costs can be assigned to the various categories shown below.
The manufacturing and selling costs can be assigned to the various categories shown below.

COMPUTATION OF TOTAL MANUFACTURING COSTS
Total manufacturing costs are the sum of the product costs – direct materials, direct labor, and manufacturing overheadcosts. Northridge Company produces 10,000 pre-hung wooden doors the first year. The total manufacturing costs are:
Total manufacturing costs are the sum of the product costs – direct materials, direct labor, and manufacturing overheadcosts. Northridge Company produces 10,000 pre-hung wooden doors the first year. The total manufacturing costs are:
ManufacturingCost Number and Item Cost
1. Material cost ($10 X 10,000) $ 100,0002. Labor cost ($8 X 10,000) 80,0003. Depreciation on new equipment 25,0004. Property taxes 6,0007. Maintenance salaries 28,0008. Salary of plant manager 70,000
Total manufacturing costs $ 309,000

CONTEMPORARY DEVELOPMENTS IN MANAGERIAL ACCOUNTING
Contemporary business managers demand different and better information than they needed just a few years ago. Managerial accountants will need to address:
• Service industry trends
• Value chain management

SERVICE INDUSTRY TRENDS
Managers of service companies look to managerial accountants to answer questions such as:• Transportation: Service a new route?
• Package delivery services: What fee structure to use?
• Telecommunications: Invest in a new satellite?
• Professional services: How productive are staff members?
• Financial institutions: Build a new branch?
• Health Care: Invest in new equipment?

VALUE CHAIN MANAGEMENT
• Value chain consists of all activities associated with providing a product or service
• Each activity must add value to the product or service and include:– Research and development
– Ordering raw materials
– Manufacturing
– Marketing
– Delivery
– Customer relations
• Supply chain consists of all activities from receipt of an order to product or service delivery

VALUE CHAIN AND SUPPLY CHAIN MANAGEMENT
Managing the value chain and supply chain requires:
• Technological changes such as enterprise resource planning (ERP) to centralize and integrate information
• Just-in-time inventory methods to deliver goods just in time for use, lowering inventory costs

VALUE CHAIN AND SUPPLY CHAIN MANAGEMENT
Managing the value chain and supply chain requires (continued):
• Total Quality Management (TQM) to reduce defects in finished products
• Activity Based Costing (ABC) to focus on activities that produce costs, and to then scrutinize and control those costs

Job Order Cost SystemJob Order Cost System
Chapter 21Chapter 21
Prepared by Naomi KarolinskiPrepared by Naomi KarolinskiMonroe Community CollegeMonroe Community College
andand
Marianne BradfordMarianne BradfordBryant CollegeBryant College
Accounting PrinciplesAccounting Principles77thth EditionEdition
WeygandtWeygandt •• KiesoKieso •• KimmelKimmel
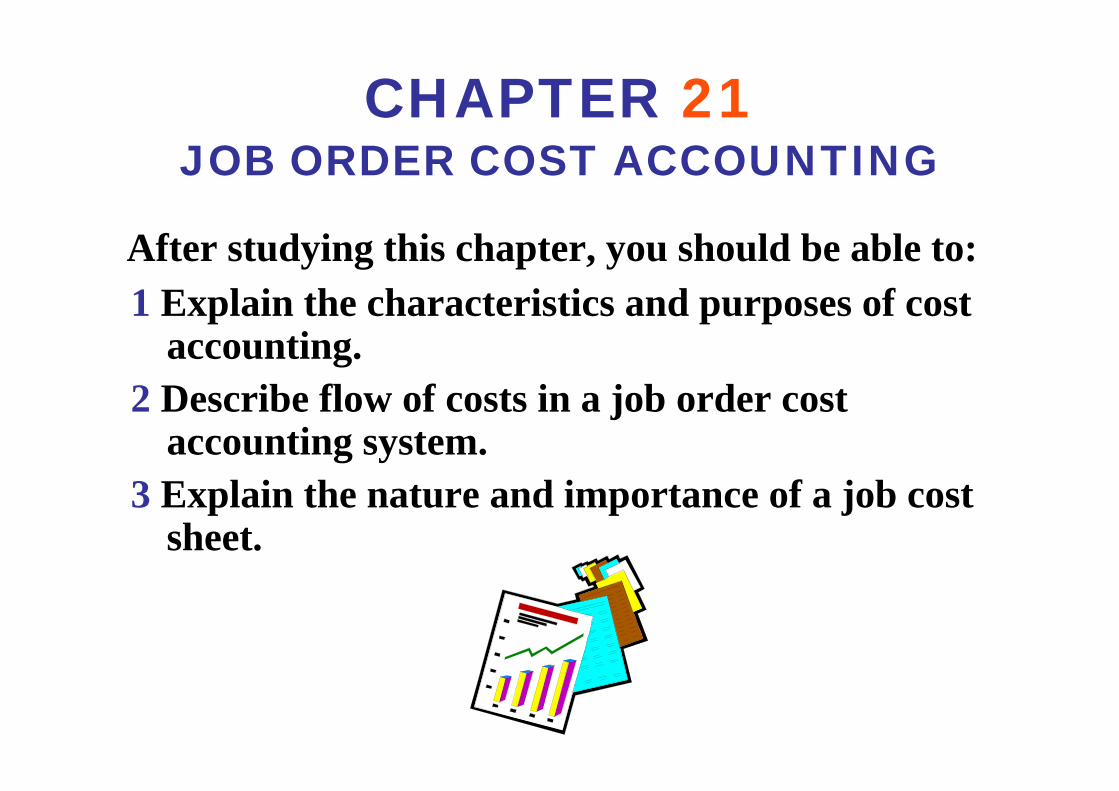
After studying this chapter, you should be able to:
1 Explain the characteristics and purposes of cost accounting.
2 Describe flow of costs in a job order cost accounting system.
3 Explain the nature and importance of a job cost sheet.
CHAPTER 21JOB ORDER COST ACCOUNTING

CHAPTER 21JOB ORDER COST ACCOUNTING
4 Indicate how the predetermined overhead rate is determined and used.
5 Prepare entries for jobs completed and sold.
6 Distinguish between under- and overapplied manufacturing overhead.
After studying this chapter, you should be able to:

• Cost accounting– The measuring, recording, and reporting of
product costs.
• Both the total cost and the unit cost of each product is determined from the accumulated data.
• A cost accounting system consists of accounts for the various manufacturing costs. These accounts are fully integrated into the general ledger of a company.
COST ACCOUNTING
SYSTEMSSTUDY OBJECTIVE 1

•An important feature of a cost accounting system is the use of a perpetual inventory system. Such a system provides immediate, up-to-date information on the cost of a product.
• There are 2 basic types of cost accounting systems:
1) a job order cost system
2) a process cost system
COST ACCOUNTING
SYSTEMS

• Under a job order cost system, costs are assigned to each job.
• An example of a job would be the manufacture of a high-speed drilling machine.
• An example of a batch would be the printing of 225 wedding invitations.
• The objective is to calculate the cost per job.
COST ACCOUNTING
SYSTEMS

Job Order Cost System

COST ACCOUNTINGSYSTEMS
• Process costing accounts for and accumulates product-related costs for a period of time.
• A process cost system is used when a series of connected manufacturing processes or departments produce a large volume of similar products.

PROCESS COST SYSTEMS

Cost accounting involves the measuring, recording, and reporting of:
a. product costs.
b. future costs.
c. manufacturing processes.
d. managerial accounting decisions.
Chapter 21

Cost accounting involves the measuring, recording, and reporting of:
a. product costs.
b. future costs.
c. manufacturing processes.
d. managerial accounting decisions.
Chapter 21

• The flow of costs in job order cost accounting parallels the physical flow of the materials as they are converted into finished goods.
• There are 2 major steps in the flow of costs:
1) accumulating the manufacturing costs incurred
2) assigning the accumulated costs to the work done
JOB ORDER COST FLOWSTUDY OBJECTIVE 2

FLOW OF COSTS IN JOB ORDER COST ACCOUNTING

JOB ORDER COST ACCOUNTING SYSTEM
Job Order Cost AccountingJob Order Cost Accounting
Accumulation Assignment1. Purchase raw materials 4. Raw materials are used2. Incur factory labor 5. Factory labor is used3. Incur manufacuring 6. Overhead is applied
overhead 7. Completed goods arerecognized
8. Cost of goods sold isrecognized
Key to EntriesKey to Entries::
Raw Materials Inventory(1) Purchases (4) Materials
used
Factory Labor (2) Factory labor (5) Factory labor incurred used
Manufacturing OverheadActual Overhead (6) Overheadincurred: applied
(3) DepreciationInsuranceRepairs
(4) Indirectmaterials used
(5) Indirectlabor used
Work in Process Inventory(4) Direct (7) Cost of
materials used completed(5) Direct jobs
labor used(6) Overhead
applied
Finished Goods Inventory(7) Cost of (8) Cost of goods
completed soldjobs
Cost of Goods Sold(8) Cost of goods
sold
4 7
5
6
8

JOB ORDER COST FLOW
l In a job order cost system, manufacturing costs are recorded in the period in which they are incurred.
l The costs of raw materials purchased are debited to Raw Materials Inventory when the materials are received.
l No effort is made at this point to associate the cost of materials with specific jobs or orders.
l On January 4, Wallace Products Inc. purchases 2,000 handles at $5 per unit ($10,000) and 800 modules at $40 per unit ($32,000) for a total cost of $42,000.
Date Account Titles and Explanation Debit Credit(1)
Jan. 4 Raw Materials Inventory Accounts Payable (Purchase of raw materials on account)
42,00042,000
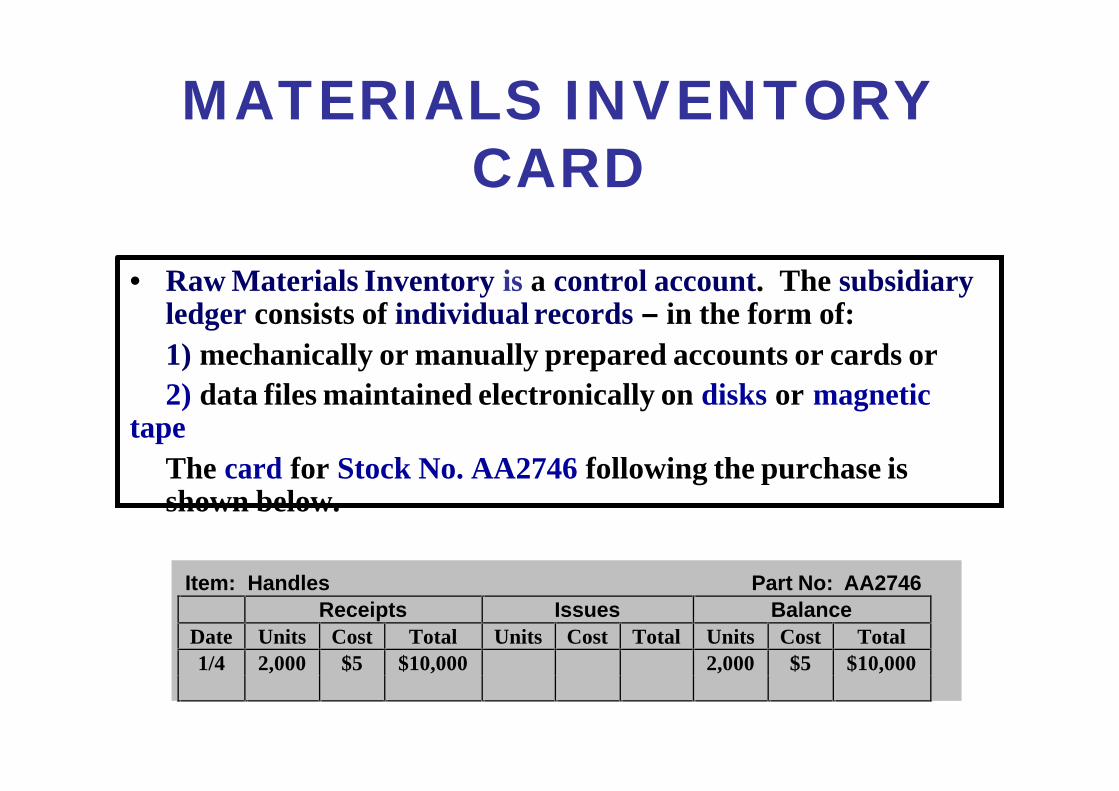
MATERIALS INVENTORY CARD
Item: Handles Part No: AA2746
Receipts Issues Balance
Date Units Cost Total Units Cost Total Units Cost Total
1/4 2,000 $5 $10,000 2,000 $5 $10,000
• Raw Materials Inventory is a control account. The subsidiaryledger consists of individual records – in the form of:
1) mechanically or manually prepared accounts or cards or
2) data files maintained electronically on disks or magnetic tape
The card for Stock No. AA2746 following the purchase is shown below.

JOB ORDER COST FLOW
• In a manufacturing company, the cost of factory labor consists of
1) gross earnings of factory workers
2) employer payroll taxes on such earnings
3) fringe benefits incurred by the employer
• Labor costs are debited to Factory Labor when they are incurred.
• Wallace Products incurs $32,000 of factory labor costs, of which $27,000 relates to wages payable and $5,000 relates to payroll taxes payable in January. The entry is:
Date Account Titles and Explanation Debit Credit(2)
Jan. 31 Factory Labor Factory Wages Payable Employer Payroll Taxes Payable (To record factory labor costs)
32,00027,0005,000

JOB ORDER COST FLOW
l Overhead costs may be recognized daily, as in the case of machinery repairs and the use of indirect materials and indirect labor.
l Overhead costs may also be recorded periodically through adjusting entries. Property taxes, depreciation, and insurance are recorded periodically.
l A summary entry for January overhead for Wallace Products Company is:
Date Account Titles and Explanation Debit Credit(3)
Jan. 31 Manufacturing Overhead Utilities Payable Prepaid Insurance Accounts Payable (for repairs) Accumulated Depreciation Property Taxes Payable (To record overhead costs)
13,8004,8002,0002,6003,0001,400

JOB COST SHEETSTUDY OBJECTIVE 3
A job cost sheet is a form used to record the costs chargeable to a specific job and to determine the total and unit cost of the completed job. Postings to job cost sheets are made daily.
Job Cost SheetJob No. _________________________________ Quantity ________________________________Item ___________________________________ Date Requested __________________________For ____________________________________ Date Completed __________________________
Direct Direct ManufacturingDate Materials Labor Overhead
Cost of completed job Direct materials $
Direct labor
Manufacturing overhead
Total cost $
Unit cost (total dollars ÷ quantity) $

MATERIALS REQUISITION SLIP
The authorization for issuing raw materials is made on a prenumbered materials requisition slip. As shown below, the requisition should indicate whether (1) the quantity and type of materials (direct or indirect) withdrawn and (2) the amount to be charged.
Wallace Manufacturing Company Materials Requisition Slip Deliver to: Assembly Department Req. No. R247
Charge to: Work in Process – Job No. 101 Date 1/6/02
Quantity Description Stock No. Cost Per Unit Total
200 Handles AA2746 $5.00 $1,000
Requested by: Received by:
Approved by: Costed by:

JOB ORDER COST FLOW
•The requisition is prepared in duplicate. A copy is retained in the storeroom as evidence of the materials released; the original is sent to accounting, where the cost per unit and total cost of the materials used are determined.
•If $24,000 of direct materials and $6,000 of indirect materials are used in Wallace Products in January, the entry is as shown below.
Date Account Titles and Explanation Debit Credit(4)
Jan. 31 Work in Process InventoryManufacturing Overhead Raw Materials Inventory (To assign materials to jobs and overhead)
24,0006,000
30,000

JOB COST SHEETS-DIRECT MATERIALS
The requisition slips show total direct materials costsof $12,000 for Job No. 101, $7,000 for Job No. 102, and $5,000 for Job No. 103. The posting of requisition slip R247 and other postings to the job cost sheets are shown in this illustration.

MATERIALS INVENTORY CARD FOLLOWING ISSUANCES
The materials inventory record for Part No. AA2746, shows the posting of requisition slip R247 and an assumed requisition slip for 760 handles costing $3,800 on January 10 for Job 102, is shown below.
Item: Handles Part No: AA2746
Receipts Issues Balance
Date Units Cost Total Units Cost Total Units Cost Total
1/4 2,000 $5 $10,000 2,000 $5 $10,0001/6 200 $5 $1,000 1,800 $5 9,000
1/10 760 $5 3,800 1,040 $5 5,200

TIME TICKET
Factory labor costs are assigned to jobs on the basis of time tickets prepared when the work is performed. The time ticket should indicatethe employee, the hours worked, the account and job to be charged, and the total labor cost. Work in Process Inventory is debited for direct labor and Manufacturing Overhead is debited for indirect labor.
Wallace Manufacturing Company Time Ticket Date: 1/6/05
Employee John Nash Employee No. 124
Charge to: Work in Process Job No. 101
Time Hourly Total
Start Stop Total Hours Rate Cost
0800 1200 4 10.00 40.00
Approved by Costed by
Bob Kadler M.Cher

JOB ORDER COST FLOW
If the $32,000 total factory labor cost incurred in January consists of $28,000of direct labor and $4,000 of indirect labor, the entry is as shown below.
Date Account Titles and Explanation Debit Credit(5)
Jan. 31 Work in Process InventoryManufacturing Overhead Factory Labor (To assign labor to jobs and overhead)
28,0004,000
32,000

JOB COST SHEETS - DIRECT LABOR
The labor costs chargeable to the three jobs are $15,000, $9,000, and $4,000. The postings to the direct labor columns of the job cost sheets should equal the posting of direct labor to Work in Process Inventory.

FORMULA FOR PREDETERMINED OVERHEAD RATE
Study Objective 4
Estimated Annual Overhead Costs
Expected Annual Operating Activity÷ = Predetermined
Overhead Rate
• Manufacturing overhead is estimated and assigned to work in process and to specific jobs on an estimated bases through a predetermined overhead rate.
• This rate is established by the beginning of the year and is based on the relationship between estimated annual overhead costs and expected annual operating activity.
• This relationship is expressed in terms of a common activity base such as direct labor costs, direct labor hours, machine hours, or any other measure that will provide an equitable basis for applying overhead costs to jobs.
• The formula for the predetermined overhead rate is shown below.

JOB ORDER COST FLOW
l At Wallace Products, direct labor cost is the activity base.
l Annual overhead costs are expected to be $280,000 and $350,000 of direct labor costs are anticipated.
l The overhead rate is 80% ($280,000 ÷ $350,000).
l Overhead applied for January is $22,400 ($28,000 X 80%) This application is recorded through the entry below.
Date Account Titles and Explanation Debit Credit(6)
Jan. 31 Work in Process Inventory Manufacturing Overhead (To assign overhead to jobs)
22,40022,400

USING PREDETERMINED OVERHEAD
RATES
XActivity
BasePredetermined Overhead Rate
is assigned
to
Work in Process
and specific
jobs
Job 1 Job 2 Job 3

JOB COST SHEETS MANUFACTURING OVERHEAD
APPLIED
The debit of $22,400 to Work in Process
Inventory equals the sum of the overhead assigned
to jobs: Job 101 $12,000Job 102 $7,200Job 103 $3,200.

PROOF OF JOB COST SHEETS TO WORK IN PROCESS INVENTORY
• At the end of each month, the balance in Work in Process Inventory should equal the sum of the costs shown on the job cost sheets of unfinished jobs.
• Assuming that all jobs are unfinished, proof of the agreement of the control and subsidiary accounts in Wallace Products is shown below.
Work in Process Inventory Job Cost Sheets
Jan. 31 24,000 No. 101 $ 39,000 Jan. 31 28,000 102 23,200 Jan. 31 22,400 103 12,200
74,400 $ 74,400

COMPLETED JOB COST SHEETSTUDY OBJECTIVE 5
When a job is completed, the costs are summarized and the lower portion of the applicable job cost sheet is completed.
If Job No. 101 is completed on January 31, the job cost sheet will show the following:
Job Cost Sheet Job No. _______________101_______________ Quantity _________________ 1,000__________ Item ___________Magnetic Sensors_________ Date Requested ________February 5________ For ____________Tanner Company_________ Date Completed ________January 31________ Direct Direct Manufacturing Date Materials Labor Overhead 1/8 $ 1,000 1/10 $ 9,000 $ 7,200 1/12 7,000 1/26 4,000 1/31 6,000 4,800 $ 12,000 $ 15,000 $ 12,000
Cost of completed job Direct materials $ 12,000
Direct labor 15,000
Manufacturing overhead 12,000
Total cost $ 39,000
Unit cost ($39,000 ÷ 1,000) $ 39.00

JOB ORDER COST FLOW
When a job is finished, an entry is made to transfer its total cost to Finished Goods Inventory. The entry for Wallace Products on January 31 is:Date Account Titles and Explanation Debit Credit
(7)Jan. 31 Finished Goods Inventory
Work in Process Inventory (To record completion of Job No. 101)
39,00039,000

FINISHED GOODS RECORD•Finished Goods Inventory is a control account. It controls individual finished goods records in a finished goods subsidiary ledger.
•Postings to the receipts columns are made directly from completed job cost sheets.
•The finished goods inventory record for Job No. 101 is shown below.
$39,000$391,000$39,000$391,0001/31
TotalCostUnitsTotalCostUnitsTotalCostUnitsDate
BalanceIssuesReceipts
Item: Magnetic Sensors Job No: 101

ASSIGNING COSTS TO COST OF GOODS SOLD
•Recognition of the cost of goods sold is made when each sale occurs.
•On January 31 Wallace Products sells Job No. 101, costing $39,000, for $50,000. The entries are:
Date Account Titles and Explanation Debit Credit (8) Jan. 31 Accounts Receivable Sales (To record sale of Job No. 101) 31 Cost of Goods Sold Finished Goods Inventory (To record cost of Job No. 101)
50,00050,000
39,00039,000

JOB ORDER COST SYSTEM FLOW OF COSTS
Flow of CostsFlow of Costs
Accumulation Assignment1. Purchase raw materials 4. Raw materials are used2. Incur factory labor 5. Factory labor is used3. Incur manufacuring 6. Overhead is applied
overhead 7. Completed goods arerecognized
8. Cost of goods sold isrecognized
Key to Entries:Key to Entries:
Factory Labor(2) 32,000 (5) 32,000
Raw Materials Inventory(1) 42,000 (4) 30,000Bal. 12,000
Manufacturing Overhead(3) 13,800 (6) 22,400(4) 6,000(5) 4,000Bal. 1,400
Finished Goods Inventory(7) 39,000 (8) 39,000
Work in Process Inventory(4) 24,000 (7) 39,000(5) 28,000(6) 22,400Bal. 35,400
Cost of Goods Sold(8) 39,000
7
5
84
6

FLOW OF DOCUMENTS IN A JOB ORDER COST SYSTEM
Flow of DocumentsFlow of Documents
Materials Requisition Slips
Labor Time Tickets
Predetermined Overhead Rate
Job Cost Sheet
Jobs Are Charged Through
Cost of Jobs is Summarized on a
The job cost sheetsummarizes the cost of jobs completed and not completed at the end of the accounting period. Jobs completed are transferred to finished goods to await sale.

COST OF GOODS MANUFACTURED SCHEDULE
WALLACE MANUFACTURING COMPANYCost of Goods Manufactured ScheduleFor the Month Ended January 31, 2005
Work in process inventory, January 1 $ –0–Direct materials used $ 24,000Direct labor 28,000Manufacturing overhead applied 22,400
Total manufacturing costs 74,400
Total cost of work in process 74,400Less: Work in process inventory, January 31 35,400
Cost of goods manufactured $ 39,000
The cost of goods manufactured schedule in job order costing is the same as in Chapter 20 with one exception: Manufacturing overhead applied, rather than actual overhead costs, is added to direct materials and direct labor to determine total manufacturing costs. The schedule is prepared directly from the Work in Process Inventory account.

PARTIAL INCOME STATEMENT
WALLACE PRODUCTS INC.Income Statement
For the Month Ended January 31, 2005
Sales $ 50,000Less: Cost of goods sold
Finished goods inventory, January 1 $ –0–Cost of goods manufactured 39,000
Cost of goods available for sale 39,000Finished goods inventory, January 31 –0–
Cost of goods sold 39,000
Gross profit $ 11,000
The cost of goods manufactured ($39,000) agrees with the amount transferred from Work in Process Inventory to Finished Goods Inventory in journal entry No. 7 in Illustration 21-18.

UNDER- OR OVERAPPLIED MANUFACTURING OVERHEAD
STUDY OBJECTIVE 6
• Underapplied overhead means that
1) manufacturing overhead has a debit balance.
2) the overhead assigned to work in process is less than the overhead incurred.
• Overapplied overhead means that
1) manufacturing overhead has a credit balance.
2) the overhead assigned to work in process is greater than the overhead incurred.

UNDER- OR OVERAPPLIED MANUFACTURING OVERHEAD
• The existence of under- or overapplied overhead at the end of a month usually does not require corrective action by management.
• Under- or overapplied overhead is on the monthly balance sheet:
1) underapplied overhead is a prepaid expense (current asset).
2) overapplied overhead is unearned revenue (current liability).

UNDER- OR OVERAPPLIED OVERHEAD

UNDER- OR OVERAPPLIED MANUFACTURING OVERHEAD
• Any year-end balance in Manufacturing Overhead is eliminated by an adjusting entry.
• Under- or overapplied overhead is usually considered to be an adjustment to cost of goods sold.
• Thus, underapplied overhead is debited to Cost of Goods Sold and overapplied overhead is credited to Cost of Goods Sold.
• Wallace Products has a $2,500 credit balance in Manufacturing Overhead at December 31. The adjusting entry for the overapplied overhead is shown below.
2,5002,500
Date Account Titles and Explanation Debit CreditDec. 31 Manufacturing Overhead
Cost of Goods Sold(To transfer overapplied overhead to costof goods sold)
2,5002,500

Work in Process Inventory is debited for all of the following except:
a. raw materials used.
b. manufacturing overhead incurred.
c. manufacturing overhead applied.
d. factory labor used.
Chapter 21

Work in Process Inventory is debited for all of the following except:
a. raw materials used.
b. manufacturing overhead incurred.
c. manufacturing overhead applied.
d. factory labor used.
Chapter 21

John Wiley & Sons, Inc. © 2005
Chapter 22Chapter 22
Process Cost Accounting
Prepared by Naomi KarolinskiPrepared by Naomi KarolinskiMonroe Community CollegeMonroe Community College
andand
Marianne BradfordMarianne BradfordBryant CollegeBryant College
Accounting Principles, 7Accounting Principles, 7thth EditionEdition
Weygandt Weygandt •• Kieso Kieso •• KimmelKimmel

CHAPTER 22 PROCESS COST ACCOUNTING
After studying this chapter, you should be able to:
11 Understand who uses process cost systems.
22 Explain the similarities and differences between job order cost and process cost systems.
3 3 Explain the flow of costs in a process cost system.
44 Make the journal entries to assign manufacturing costs in a process cost system.
55 Compute equivalent units.

CHAPTER 22PROCESS COST ACCOUNTING
After studying this chapter, you should be able to:
66 Explain the four steps necessary to prepare a production
cost report.
77 Prepare a production cost report.
88 Explain just-in-time processing.
99 Explain activity-based-costing.

Process cost systems
• used to apply costs to similar products that are mass produced in a continuous fashion.
• tracked through a series of connected
manufacturing processes or departments.
THE NATURE OF PROCESS COST SYSTEMS
STUDY OBJECTIVE 1

MANUFACTURING PROCESSES
A process cost accounting system is used for continuous process manufacturing, and it is necessary to record both the accumulation and assignment of manufacturing costs. A distinctive feature of process cost accounting is that individual Work in Process Inventory accounts are maintained for each production department or manufacturing process. In a beverage company, there would be a Work in Process Inventory account for each of the manufacturing processes, as illustrated below:

In a process cost system, costs are assigned only:
a. to one work in process account.
b. to work in process and finished goods inventory.
c. to work in process, finished goods, and cost of goods sold.
d. to work in process accounts.
Chapter 22

In a process cost system, costs are assigned only:
a. to one work in process account.
b. to work in process and finished goods inventory.
c. to work in process, finished goods, and cost of goods sold.
d. to work in process accounts.
Chapter 22

SIMILARITIES BETWEEN JOB ORDER COST AND PROCESS COST SYSTEMS
STUDY OBJECTIVE 2
Job order and process cost systems are similar in three ways:
1. Manufacturing cost elements
2. Accumulation of the costs of materials, labor, and overhead
3. Flow of costs
l methods of assigning costs differ significantly

Job order and process cost systems are different in four ways:
1. Number of work in process accounts used.
2. Documents used.
3. Point at which costs are totaled.
4. Unit cost computations.
DIFFERENCES BETWEEN JOB ORDER COST AND PROCESS
COST SYSTEMS

DIFFERENCES BETWEEN JOB ORDER COST AND PROCESS
COST SYSTEMS

JOB ORDER VERSUS PROCESS COST ACCOUNTING
• A feature of process costing is that costs charged to work in process are summarized in production cost reports.
• Unit costs are calculated by dividing total manufacturing costs for the period by the units produced during the period.
• The major differences between job order cost accounting and process cost accounting are summarized below:
Job Order Process
Feature Cost Accounting Cost Accounting
· Work in process accounts One for each job One for each process
· Summary of manufacturing costs Job cost sheets Production cost reports
· Determination of total manufacturing costs Each job Each period
· Unit cost computation Cost of each job ÷ Total manufacturing costs ÷
Units produced Units produced
for the job during the period

JOB ORDER VERSUS PROCESS COST ACCOUNTING

FLOW OF COSTS IN PROCESS COST SYSTEMS
STUDY OBJECTIVE 3

PROCESS COST FLOWACCUMULATION OF MANUFACTURING COSTS
The accumulation of materials and laborcosts is the same in process costing as in job order costing.
• All raw materials are debited to Raw Materials Inventory when the materials are purchased.
• All factory labor is debited to Factory Labor when the labor costs are incurred.

PROCESS COST FLOWASSIGNMENT OF MATERIAL COSTS
STUDY OBJECTIVE 4
Date Account Titles and Explanation Debit Credit
June 30 Work in Process – MachiningWork in Process – Assembly
Raw Materials Inventory(To record materials used)
• In a process cost system, fewer materials requisition slips are usually required than in a job order cost system, since materials are used for processes rather than for specific jobs.
• At Hershey, materials are entered at the beginning of each process.
• The entry to record the materials used during June is:
xxxxxxxx
xxxx

PROCESS COST FLOWASSIGNMENT OF FACTORY LABOR COSTS
Date Account Titles and Explanation Debit Credit
June 30 Work in Process – MachiningWork in Process – Assembly
Factory Labor(To assign factory labor to production)
• In process costing, as in job order costing, time tickets may be used to determine the cost of labor assignable to the production departments.
• The labor cost chargeable to a process can be obtained from the payroll register or departmental payroll summaries.
• The entry to assign these costs for June is:
xxxxxxxx
xxxx

PROCESS COST FLOWASSIGNMENT OF MANUFACTURING
OVERHEAD COSTS
Date Account Titles and Explanation Debit Credit
June 30 Work in Process – MachiningWork in Process – Assembly
Manufacturing Overhead(To assign overhead to processes)
• In process cost accounting, the objective in assigning overhead is to allocate the overhead costs to the production departments on an objective and equitable basis.
• That basis is the activity that “drives” or causes the costs.
• A primary driver of overhead costs in continuous manufacturing operations is machine time used, not direct labor.
• The entry to allocate overhead for June to the two processes is:
xxxxxxxx
xxxx

PROCESS COST FLOWTRANSFER TO NEXT DEPARTMENT
Date Account Titles and Explanation Debit Credit
June 30 Work in Process – AssemblyWork in Process – Machining
(To record transfer of units to the AssemblyDepartment)
• At the end of June, an entry is needed to record the cost of the goods transferred out of the Machining Department.
• The transfer is to the Assembly Department and the following entry is made:
xxxxxxxx

PROCESS COST FLOWTRANSFER TO FINISHED GOODS
Date Account Titles and Explanation Debit Credit
June 30 Finished Goods InventoryWork in Process – Assembly
(To record transfer of units to finished goods)
• The units completed in the Assembly Department during June are transferred to the finished goods warehouse.
• The entry for this transfer is as follows:
xxxxxxxx

PROCESS COST FLOWTRANSFER TO COST OF GOODS SOLD
The entry to record the cost of goods sold during June is as follows:
Date Account Titles and Explanation Debit Credit
June 30 Cost of Goods SoldFinished Goods Inventory
(To record cost of units sold)
xxxxxxxx

END-OF-PERIOD PROCEDURES MACHINING DEPARTMENT
• By the end of the period Hershey has accumulated the materials, labor, and overhead costs in each production department’s Work in Process account.
• These accumulated costs must now be assigned to
– the units transferred out of each department and
– the units in the ending Work in Process in each department.
• The procedures used in calculating and assigning the costs present the most difficult challenge to your understanding of process cost accounting.

EQUIVALENT UNITSSTUDY OBJECTIVE 5
• Equivalent units of production– the work done during the period on the physical units of output,
expressed in terms of fully completed units.
– are determined by applying the percentage of work done to the physical units of output.
• Equivalent units are the sum of the work performed to:
– Finish the units of beginning work in process inventory.
– Complete the units started into production during the period.
– Start, but only partially complete, the units in ending work in process inventory.

INFORMATION FOR FULL-TIME STUDENT EXAMPLE
• Suppose you were asked to compute the cost of instruction at your college per full-time equivalent student. You are provided with the following information.
• Part-time students take 60 percent of the classes of a full-time student during the year.
• To compute the number of full-time equivalent students per year, you would make the following computation:
Costs:
Total cost of instruction $900,000
Student population:
Full-time students 900
Part-time students 1,000

FULL-TIME EQUIVALENT UNITCOMPUTATION
+ =Full-timeStudents
Full-timeEquivalent Students
Equivalent Units of Part-time
Students
900 + (60% x 1,000) = 1,500
The cost of instruction per full-time equivalent student is thereforethe total cost of instruction ($900,000) divided by the number of full-time equivalent students (1,500), which is $600 ($900,000/1,500).

EQUIVALENT UNITSOF PRODUCTION FORMULA
+ =Units Completed and Transferred
Out
Equivalent Unitsof production
Equivalent Units of Ending Work
in Process
The formula to compute equivalent units of production is shown above. This method of computing equivalent units is referred to as the weightedaverage method. It considers the degree of completion (weighting) of the units completed and transferred out and the ending work in process. It is the method most widely used in practice.

Mixing Department
Percentage Complete
Physical Units Materials Conversion Costs
Work In process, June 1 100,000 100% 70%
Started into production 800,000
Total Units 900,000
Units transferred out 700,000
Work in process, June 30 200,000 100% 60%
Total Units 900,000
INFORMATION FOR MIXING DEPARTMENT
Assume the beginning work in process is 100% complete as to materials costand 70% complete as to conversion costs. The ending work in process is 100% complete as to materials cost and 60% complete as to conversion cost.

Equivalent Units
Materials Conversion Costs
Units transferred out 700,000 700,000
Work in progress, June 30
200,000 X 100% 200,000
200,000 X 60% 120,000
900,000 820,000
COMPUTATION OF EQUIVALENT UNITSMIXING DEPARTMENT
In computing equivalent units, the beginning work in process is not part of the equivalent units of production formula. The units transferred out to the Baking Department are fully complete as to both materials and conversion costs. The ending work in process is fully complete as to materials, but only 60% complete as to conversion costs.Two equivalent unit computations are therefore necessary.

REFINED EQUIVALENT UNITSOF PRODUCTION FORMULA
+Units Completed and
Transferred Out-Materials
Equivalent Unitsof Production-Materials
Equivalent Units of Ending Work
in Process-Materials
The earlier formula used to compute equivalent units of production canbe refined to show the computations for materials and for conversioncosts as shown above.
=
+Units Completed and
Transferred Out-Conversion Costs
Equivalent Unitsof Production-
Conversion Costs
Equivalent Units of Ending Work
in Process-Materials-Conversion Costs
=

FLOW OF COSTS IN MAKING EGGO WAFFLES

END-OF-PERIOD PROCEDURES MACHINING DEPARTMENT
For each process, it is necessary to perform the following procedures at the end of the period:
1 Calculate the physical units.
2 Calculate equivalent units of production.
3 Calculate unit costs of production.
4 Assign costs to the units transferred and in process.
5 Prepare the production cost report.

COMPREHENSIVE EXAMPLE OF PROCESS
COSTINGSTUDY OBJECTIVE 6
Data for the Mixing Department at EggoWaffles for the month of June are shown on the next slide. The data will be used to complete a production cost report for the Mixing Department.

Mixing Department
Units :
Work in process, June 1 100,000
Direct materials: 100% complete
Conversion costs: 70% complete
Units started into production in June 800,000
Units completed and transferred out to Baking Department 700,000
Work in process, June 30 200,000
Direct materials 100% complete
Conversion costs 60% complete
Costs :
Work in process, June 1
Direct materials: 100% complete $50,000
Conversion Costs: 70% complete $35,000
Cost of work in process, June 1 $85,000
Costs incurred during production in June
Direct Materials $400,000
Conversion Costs $170,000
Costs incurred in June $570,000
UNIT & COST DATAMIXING DEPARTMENT

Mixing Department
Physical Units
Units to be accounted for
Work in process, June 1 100,000
Started ( transferred) into production 800,000
Total Units 900,000
Units accounted for
Completed and transfered out 700,000
Work in process, June 30 200,000
Total Units 900,000
PHYSICAL UNIT FLOW-MIXING DEPARTMENT –STEP 1
Physical units are the actual units to be accounted for duringa period, irrespective of any work performed. To keep trackof these units, it is necessary to add the units started (or transferred) into production during the period to the units inprocess at the beginning of the period. This amount is referred to as the total units to be accounted for. In the Mixing Department, 900,000 units must be accounted for.

Equivalent Units
Materials Conversion Costs
Units transferred out 700,000 700,000
Work in process, June 30
200,000 X 100% 200,000
200,000 X 60% 120,000
Total equivalent Units 900,000 820,000
COMPUTATION OF EQUIVALENT UNITS
MIXING DEPARTMENT-STEP 2
Once the physical flow of the units is established, it is necessaryto measure the Mixing Department’s productivity in terms of equivalent units of production. The equivalent unit computationis as follows:

Work in process, June 1 $50,000
Direct materials cost
Costs added to production during June
Direct materials cost 400,000$
Total materials cost $450,000
MATERIALS COST COMPUTATION-STEP 3
Unit production costs are costs expressed in terms of equivalentunits of production. When equivalent units of production aredifferent for materials and conversion costs, three unit costs arecomputed: (1) materials, (2) conversion, and (3) total manufacturing.The computation for Eggo Waffles is as follows:

Work in process, June 1
Conversion costs $35,000
Costs added to production during June
Conversion costs 170,000$
Total conversion costs $205,000
CONVERSION COSTSCOMPUTATION
The computation of total conversion costs is as follows:

Costs to be accounted for
Work in process, June 1 $85,000
Started into production $570,000
Total costs $655,000
COSTS CHARGED TO MIXING DEPARTMENT –
STEP 4
The total costs that were charged to the Mixing Departmentin June are as follows:

Mixing Department
Production Cost Report
For the Month Ended June 30, 2005
Equivalent Units
Physical Units Materials Conversion Costs
Quantities Step 1 Step 2
Units to be accounted for
Work in process, June1 100,000
Started into production 800,000
Total Units 900,000
Units accounted for
Transferred out 700,000 700,000 700,000
Work in process, June 30 200,000 200,000 120,000 (200,000 X 60%)
Total units 900,000 900,000 820,000
PRODUCTION COST REPORTSTUDY OBJECTIVE 7

Mixing Department
Production Cost Report
For the Month Ended June 30, 2005
Equivalent Units
Costs Materials Conversion Costs Total
Unit costs Step 3
Costs in June (a) $450,000 $205,000 655,000$
Equivalent Units (b) 900,000 820,000
Unit costs [ (a) /(b)] $0.50 $0.25 $0.75
Costs to be accounted for
Work in process, June 1 85,000$
Started into production 570,000$
Total costs 655,000$
PRODUCTION COST REPORT

Mixing Department
Cost Reconciliation Schedule
Costs accounted for
Transferred out ( 700,000 X $0.75) $525,000
Work in process, June 30
Materials ( 200,000 X $0.50) $100,000
Conversion Costs ( 120,000 X $0.25) 30,000$ 130,000$
Total costs $655,000
COST RECONCILIATION SCHEDULEMIXING DEPARTMENT
The total costs charged to the Mixing Department in June aretherefore $655,000. A cost reconciliation schedule is then prepared to assign the costs to (1) units transferred out to theBaking Department and (2) ending work in process.

FLOW OF COSTS INPROCESS COST ACCOUNTING
8
Process Cost AccountingProcess Cost Accounting
Work in Process Production Department B (4) Materials (8) Cost of used completed (5) Labor work used (6) Overhead applied (7) Transferred in costs
Factory Labor(2) Factory labor (5) Factory
incurred labor used
Raw Materials Inventory(1) Purchases (4) Materials
used
Manufacturing Overhead(3) Overhead (6) Overhead
incurred applied
Work in ProcessProduction Department A
(4) Materials (7) Costsused transferred
(5) Labor outused
(6) Overheadapplied
Finished Goods Inventory(8) Cost of (9) Cost of goods
completed soldwork
Cost of Goods Sold(9) Cost of goods
sold
4
5
6
7
9
Assignment4. Materials are used5. Labor is used6. Overhead is applied7. Costs are transferred
out8. Goods are completed9. Goods are sold
Key to Entries:Key to Entries:
Accumulation1. Purchase raw materials2. Incur factory labor3. Incur manufacuring
overhead
Key to Entries:Key to Entries:

The cost reconciliation schedule shows that the total:
a. units to be accounted for equal the total units accounted
for.
b. costs accounted for equal the total costs to be accounted for.
c. units to be accounted for equal the total costs to be
accounted for.
d. costs accounted for equal the total units accounted for.
Chapter 22

CONTEMPORARY DEVELOPMENTS
JUST-IN-TIME PROCESSINGSTUDY OBJECTIVE 8
•Primary objective: – Eliminate all manufacturing inventories.
– Inventories can have an adverse effect on net income because of their high storage and maintenance costs.
•There are 3 important elements:
– Dependable suppliers
– Multi-skilled work force
– A total quality control system

CONTEMPORARY DEVELOPMENTS
JUST-IN-TIME PROCESSING
Major Benefits:
• Manufacturing inventories significantly reduced or eliminated.
• Product quality enhanced.
• Rework costs and inventory storage costs reduced or eliminated.
• Production cost savings are realized from the improved flow of goods through the processes.

JUST-IN-TIME PROCESSING

ACTIVITIES AND COST DRIVERS IN ABC
STUDY OBJECTIVE 9
Activity-based costing (ABC) focuses on the activities performed in producing a product. In ABC, the cost of a product is equal to the sum of the costs of all activities performed to manufacture it.
Activity Cost Driver
Ordering raw materials Ordering hours; number of ordersReceiving raw materials Receiving hours; number of shipmentsMaterials handling Number of requisitions; weight of materials;
handling hoursProduction scheduling Number of ordersMachine setups Setup hours; number of setupsMachining (fabricating, assembling, etc.) Machine hoursQuality control inspections Number of inspectionsFactory supervision Number of employees

CONTEMPORARY DEVELOPMENTS
ACTIVITY-BASED COSTING
Two important assumptions must be met in order to obtain accurate product costs under ABC:
• All overhead costs related to the activity must be driven by the cost driver used to assign costs to products.
• All overhead costs related to the activity should respond proportionally to changes in the activity level of the cost driver.

John Wiley & Sons, Inc. © 2005
Chapter 23Chapter 23
Cost-Volume-Profit Relationships
Accounting Principles, 7Accounting Principles, 7thth EditionEdition
Weygandt Weygandt •• Kieso Kieso •• KimmelKimmel
Prepared by Naomi KarolinskiPrepared by Naomi KarolinskiMonroe Community CollegeMonroe Community College
andand
Marianne BradfordMarianne BradfordBryant CollegeBryant College

CHAPTER 23COST-VOLUME-PROFIT RELATIONSHIPS
After studying this chapter, you should be able to:
11 Distinguish between variable and fixed costs.
22 Explain the significance of the relevant range.
33 Explain the concept of mixed costs.
44 List the five components of cost-volume-profit analysis.
55 Indicate what contribution margin is and how it may can expressed.

CHAPTER 23COST-VOLUME-PROFIT RELATIONSHIPS
After studying this chapter, you should be able to:
66 Identify the three ways to determine the break-even point.
77 Define margin of safety and give the formulas for computing it.
88 Give the formulas for determining sales required to earn target net income.
99 Describe the essential features of a cost-volume-profit income statement.

COST BEHAVIOR ANALYSIS
• Cost behavior analysis is the study of how specific costs respond to changes in the level of businessactivity.
• The starting point in cost behavior analysis ismeasuring the key business activities.
• Activity levels may be expressed in terms of1)1) sales dollars – in a retail company,2) 2) miles driven – in a trucking company,3)3) room occupancy – in a hotel, or4)4) number of customers called on – by a salesperson.
• The activity index identifies the activity that causeschanges in the behavior of costs.
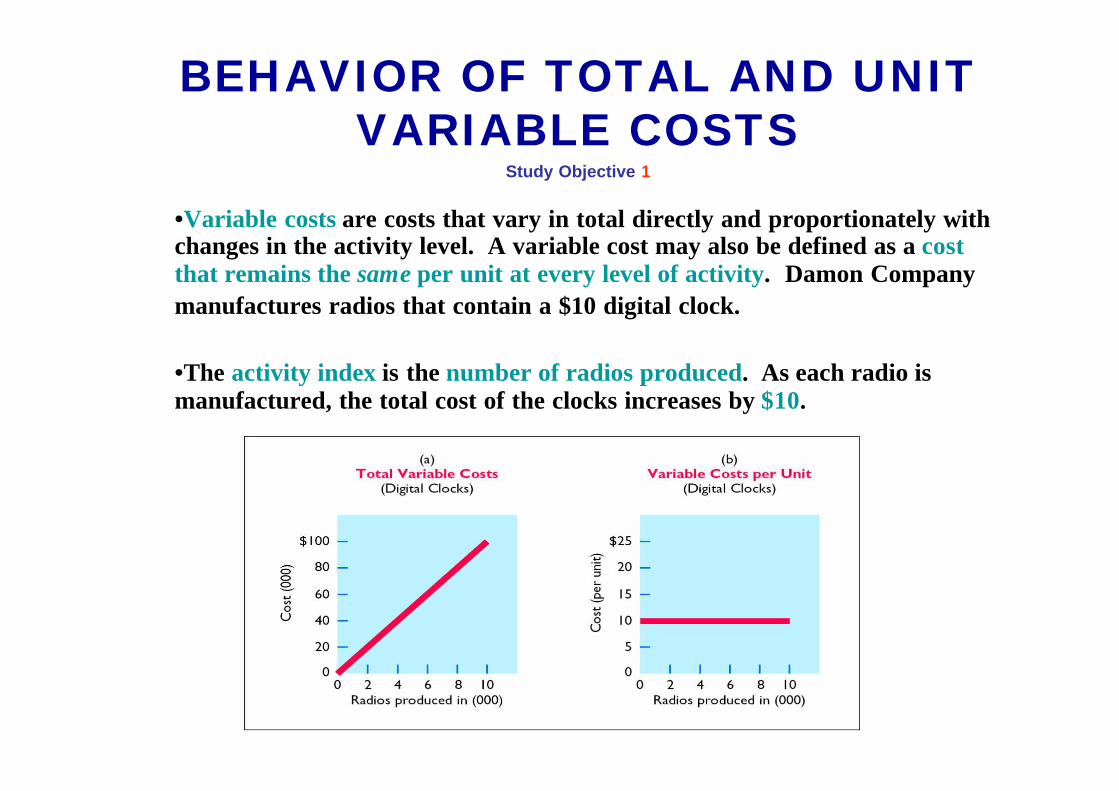
BEHAVIOR OF TOTAL AND UNIT VARIABLE COSTS
Study Objective 1
•Variable costs are costs that vary in total directly and proportionately with changes in the activity level. A variable cost may also be defined as a cost that remains the same per unit at every level of activity. Damon Company
manufactures radios that contain a $10 digital clock.
•The activity index is the number of radios produced. As each radio is manufactured, the total cost of the clocks increases by $10.

•Fixed costs are costs that remain the same in total regardless of changes in the activity level. Since fixed costs remain constant in total as activity changes, therefore fixed costs per unit vary inversely with activity.
•Damon Company leases all of its productive facilities at a cost of $10,000 per month. Total fixed costs of the facilities will remain constant at every level of activity.
BEHAVIOR OF TOTAL AND UNIT FIXED COSTS

•A straight-line relationship does not usually exist for variable costs throughout the entire range of activity.
•In the real world, the relationship between variable cost behavior and change in the activity level is often curvilinear, as shown in part a on the left. The behavior of total fixed costs through all levels of activity is shown in part b.
NONLINEAR BEHAVIOR OF VARIABLE AND FIXED COSTS
Study Objective 2

LINEAR BEHAVIOR WITHIN RELEVANT RANGE
The relevant range of the activity index is the range over which a company expects to operate during a year. Within this range, a straight-line relationship normally exists for both fixed and variable costs.

BEHAVIOR OF A MIXED COSTStudy Objective 3
Mixed costs contain both variable and fixed cost elements. Mixed (semivariable) costs change in total but not proportionately with changes in the activity level. Local rental terms for a 17-foot U-Haul truck, including insurance, are $50 per day plus $.50 per mile. The per diem charge is a fixed cost with respect to miles driven, while the mileage charge is a variable cost. The graphic presentation of the rental cost for a one-day rental is shown on the right.

FORMULA FOR VARIABLE COST PER UNIT USING HIGH-LOW METHOD
÷ =Change in Total Costs
High minus Low Activity Level
Variable Cost per Unit
• In CVP analysis, it is assumed that mixed costs must be classified into their variable and fixed components.
• Firms usually ascertain variable and fixed costs on an aggregate basis at the end of a time period, using the company’s past experience with the behavior of the mixed cost at various activity levels.
• The high-low method uses the total costs incurred at the high and low levels of activity.
• The steps in calculating fixed and variable costs under this method are as follows:
•• 1)1) Determine variable cost per unit from the following formula:

ASSUMED MAINTENANCE COSTS AND MILEAGE DATA
Miles Total Miles Total Month Driven Cost Month Driven Cost
January 20,000 $ 30,000 March 35,000 $ 49,000 February 40,000 48,000 April 50,000 63,000
Assume that Metro Transit Company has the maintenance costs and mileage data for its fleet of buses over a 4-month period as shown below. The high and low levels of activity are 50,000 miles in April and 20,000 miles in January. The maintenance costs at these 2 levels are $63,000 and $30,000, respectively. The difference in maintenance costs is $33,000 ($63,000 – $30,000) and the difference in miles is 30,000(50,000 – 20,000). Therefore, variable cost per unit for Metro Transit Company is $1.10 ($33,000 / 30,000).

HIGH-LOW METHOD COMPUTATION OF FIXED COSTS
Activity Level
High Low
Total cost $ 63,000 $ 30,000Less: Variable costs
50,000 X $1.10 55,00020,000 X $1.10 22,000
Total fixed costs $ 8,000 $ 8,000
Determine the fixed cost by subtracting the total variable cost at either the high or low activity level from the total cost at that activity level.
For Metro Transit Company, the calculations are as follows:

Variable costs are costs that:
a. vary in total directly and proportionately with changes in the activity level.
b. remain the same per unit at every activity level.
c. Neither of the above.
d. Both (a) and (b) above.
Chapter 23

Variable costs are costs that:
a. vary in total directly and proportionately with changes in the activity level.
b. remain the same per unit at every activity level.
c. Neither of the above.
d. Both (a) and (b) above.
Chapter 23

CVP ANALYSISStudy Objective 4
••CostCost--volumevolume--profit (CVP) analysis is the study of theprofit (CVP) analysis is the study of the
effects of changes of costs and volume on a companyeffects of changes of costs and volume on a company’’ss
profits.profits.
••CostCost--volumevolume--profit (CVP) analysis is important in profitprofit (CVP) analysis is important in profit
planning.planning.
••It also is a critical factor in management decisions.It also is a critical factor in management decisions.

COMPONENTS OF CVP ANALYSIS
The following assumptions underlie each CVP analysis:
1. The behavior of both costs and revenues is linear throughout the relevant range of the activity level.
2. All costs can be classified as either variable or fixed with reasonable accuracy.
3. Changes in activity are the only factors that affect costs.
4. All units produced are sold.
5. When more than one type of product is sold, the sales mix will remain constant. Sales mix complicates CVP analysis because different products will have different cost relationships.

COMPONENTS OF CVP ANALYSIS

FORMULA FOR AND COMPUTATION OF
CONTRIBUTION MARGINStudy Objective 5
– =Sales Variable CostsContribution
Margin
$500,000 – $300,000 = $200,000
• Contribution margin (CM) is one of the key relationships in CVP analysis and is the amount of revenue remaining after deducting variable costs.
• Vargo Video Company sells 1,000 VCRs in one month, sales are $500,000 (1,000 X $500) and variable costs are $300,000 (1,000 X $300).
• Thus, CM is $200,000 computed as follows:

ASSUMED SELLING PRICE AND COST DATA FOR VARGO VIDEO
• In CVP analysis applications, the term cost includes manufacturing costs plus selling and administrative expenses.
• Relevant data for the videocassette recorders (VCRs) made by Vargo Video Company are as follows:
Unit selling price $ 500Unit variable costs 300Total monthly fixed costs 200,000

– =Unit Selling Price
Unit Variable Costs
Contribution Margin per Unit
• The contribution margin is then available to cover fixed costs and to contribute income for the company.
• The formula for contribution margin per unit is shown below.
• At Vargo Video Company, the contribution margin per unit is $200 ($500 – $300).
FORMULA FOR CONTRIBUTION MARGIN PER UNIT

FORMULA FOR CONTRIBUTION MARGIN
RATIO
• Others prefer to use contribution margin ratio.
• The formula for contribution margin ratio is shown below.
• At Vargo Video Company, the contribution margin ratio is 40% ($200 ÷ $500).
÷ = Contribution Margin Ratio
Unit Selling Price
Contribution Margin per Unit

• The break-even point is the second key relationship in CVP analysis and is the level of activity at which total revenues equal total costs – both fixed and variable.
• The break-even point can be:
11 Computed from a mathematical equation.
22 Computed by using contribution margin.
33 Derived from a cost-volume-profit (CVP) graph.
• The equation for break-even sales is:
= +Break-even Sales
Variable Costs Fixed Costs
BREAK-EVEN EQUATIONStudy Objective 6

COMPUTATION OF BREAK-EVEN POINT IN DOLLARS
•The break-even point in dollars can be determined by expressing variable costs as a percentage of unit selling price.•For Vargo Video Company, the percentage is 60% ($300 ÷ $500). The calculation is:
X = .60X + $200,000.40X = $200,000X = $500,000
Where: X = sales dollars at the break-even point.60X = variable costs as a percentage of unit selling price
$200,000 = total fixed costsTherefore, sales must be $500,000 for Vargo Video Company to break even.

COMPUTATION OF BREAK-EVEN POINT IN UNITS
The break-even point in units can be calculated directly from the mathematical equation by using unit selling prices and unit variable costs. The calculation is:
$500X = $300X + $200,000$200X = $200,000X = 1,000 units
Where: $500X = unit selling price x sales volume$300X = variable cost per unit x sales volume
$200,000 = total fixed costsThus, Vargo Video Company must sell 1,000 units to break even.

BREAK-EVEN PROOF
Sales (1,000 X $500) $ 500,000 Total costs: Variable (1,000 X $300) $ 300,000 Fixed 200,000 500,000
Net income $ –0–
The accuracy of the calculations can be proved as follows:

FORMULA FOR BREAK-EVEN POINT IN UNITS USING CONTRIBUTION
MARGIN
• Since contribution margin equals total revenues less variable costs, at the break-even point, contribution margin must equal total fixed costs.
• On the basis of this relationship, we can compute the break-even point by using either the contribution margin per unit or the contribution margin ratio.
• When the contribution margin per unit is used, the formula to calculate the break-even point in units is:
÷ =Fixed CostsBreak-even
Point in UnitsContribution
Margin per Unit

FORMULA FOR BREAK-EVEN POINT IN DOLLARS USING CONTRIBUTION
MARGIN RATIO
• For Vargo Video Company, the contribution margin per unit is $200.
• Thus, the break-even point in units is calculated to be: 1,000 units ($200,000 ÷ $200).
• When the contribution margin ratio is used, the formulato calculate the break-even point in dollars is shown below.
• Since Vargo Video Company’s contribution margin ratiois 40%, the break-even point in dollars is calculated to be$500,000 ($200,000 ÷ 40%).
÷ =Fixed CostsBreak-even
Point in DollarsContribution Margin Ratio

GRAPHIC PRESENTATION
• An effective way to find the break-even point is to prepare a break-even graph.
• The graph is referred to as a cost-volume-profit (CVP) graphsince it shows costs, volume, and profits.
• The construction of the graph, using the Vargo Video Company data, is as follows:
11 Plot the total revenue line starting at the zero activity level.
2 2 Plot the total fixed cost by a horizontal line.
3 3 Plot the total cost line. This starts at the fixed cost line at zero activity.
4 4 Determine the break-even point from the intersection of the total cost line and the total revenue line.
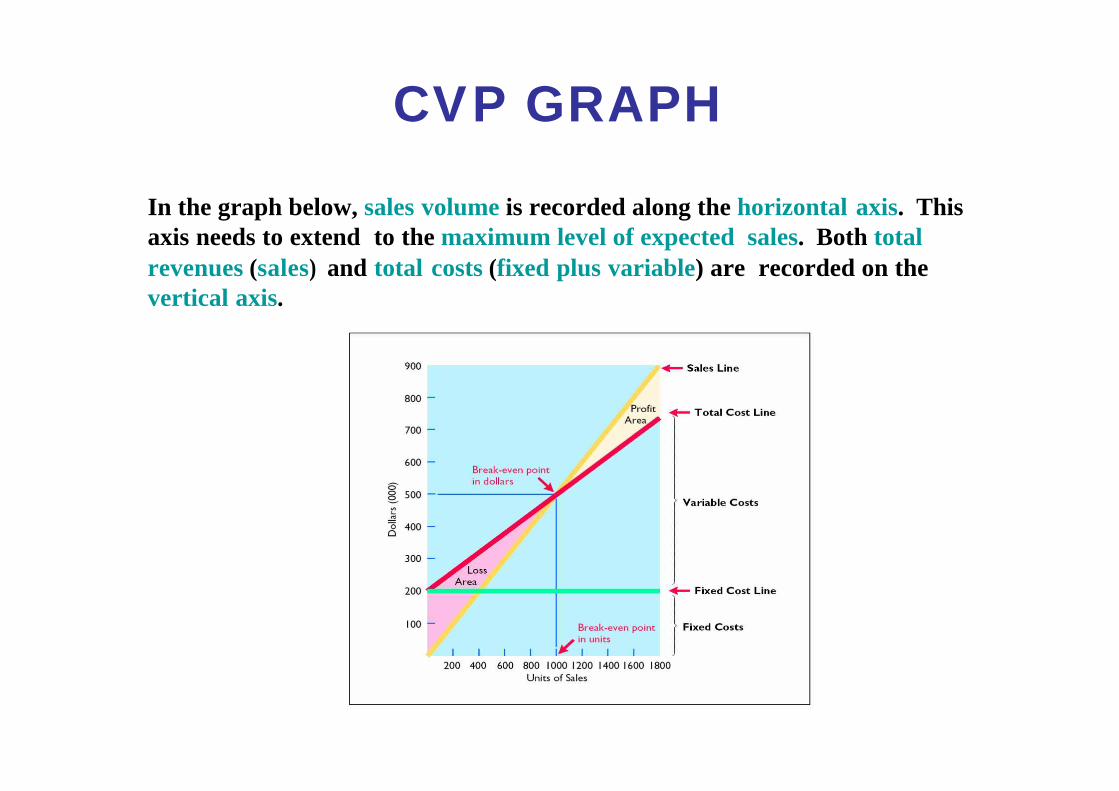
CVP GRAPH
In the graph below, sales volume is recorded along the horizontal axis. This axis needs to extend to the maximum level of expected sales. Both total revenues (sales) and total costs (fixed plus variable) are recorded on the vertical axis.

The CVP income statement classifies costs and expenses:
a. by function.
b. as selling and administrative.
c. as variable or fixed.
d. as operating or nonoperating.
Chapter 23

The CVP income statement classifies costs and expenses:
a. by function.
b. as selling and administrative.
c. as variable or fixed.
d. as operating or nonoperating.
Chapter 23

FORMULA FOR MARGIN OF SAFETY IN DOLLARS
Study Objective 7
• The margin of safety is another relationship that may be calculated in CVP analysis.
• It is the difference between actual or expected sales and sales at the break-even point.
• It may be expressed in dollars or as a ratio.
• The formula for determining the margin of safety in dollars is shown below.
• Given that Vargo Video Company’s actual (expected) sales are $750,000, the margin of safety in dollars is calculated to be $250,000 ($750,000 – $500,000).
– = Margin of Safety in Dollars
Break-even Sales
Actual (Expected) Sales

FORMULA FOR MARGIN OF SAFETY
RATIO
The formula and calculation for determining the margin of safety ratio are:
÷ = Margin of Safety Ratio
Actual (Expected) Sales
Margin of Safety in Dollars
$250,000 ÷ $750,000 = 33%

FORMULA FOR REQUIRED SALES TO MEET TARGET
NET INCOMEStudy Objective 8
Required Sales = + +Variable
CostsFixed Costs
Target Net Income
• By adding a factor for target net income to the break-even equation, we obtain the formula below for determining required sales.
• Required sales may be expressed either in sales dollars or sales units.
• Assuming that target net income is $120,000 for Vargo Video Company, the required sales dollars are
calculated to be $800,000 ([$200,000 + $120,000] ÷ .40).

• The sales required to meet target income can be calculated in either dollars or units.
• For Vargo Video Company, the required sales dollars are calculated to be: $800,000 ($320,000 ÷40%).
• The sales volume in units at the targeted income level is 1,600 units ($800,000 ÷ $500).
÷ =Required
SalesContribution Margin Ratio
Fixed Costs + Target Net Income
FORMULA FOR REQUIRED SALES IN DOLLARS USING CONTRIBUTION
MARGIN RATIO

ORIGINAL VCR SALES AND COST
DATA• Business conditions change rapidly and management must respond intelligently to these changes. CVP analysis can help.
• The original VCR sales and cost data for Vargo Video Company are shown below.
Unit selling price $ 500
Unit variable cost $ 300
Total fixed costs $200,000
Break-even sales $500,000 or 1,000 units

COMPUTATION OF BREAK-EVEN SALES IN
UNITS
Case I. A competitor is offering a 10% discount on the selling price of its VCRs. Management must decide whether or not to offer a similar discount.
Question: What effect will a 10% discount on selling price have on the break-even point for VCRs?
Answer: A 10% discount on selling price reduces the selling price per unit to $450 [$500 – ($500 X 10%)]. Variable cost per unit remains unchanged at $300. Therefore, the contribution margin per unit is $150. Assuming no change in fixed costs, break-even sales are 1,333 units, calculated as follows:
Fixed Costs ÷ Contribution Margin per Unit = Break-even Sales
$200,000 ÷ $150 = 1,333 units (rounded)

COMPUTATION OF BREAK-EVEN SALES IN UNITS
Case II. To meet the threat of foreign competition, management invests in new robotic equipment that will lower the amount of direct laborrequired to make the VCRs. It is estimated that total fixed costs will increase 30% and that variable cost per unit will decrease 30%.
Question: What effect will the new equipment have on the sales volume required to break even?
Answer: Total fixed costs become $260,000 [$200,000 + ($200,000 X 30%)], and variable cost per unit is now $210 [$300 – ($300,000 X 30%)]. The new break-even point is 897 units:
Fixed costs ÷ Contribution Margin per Unit = Break-even Sales
$260,000 ÷ ($500 - $210) = 897 units (rounded)

COMPUTATION OF REQUIRED SALES
Required Sales = Variable Costs + Fixed Costs + Target Net Income X = .65X + $182,500 + $80,000 .35X = $262,500 X = $750,000
Case III. An increase in the price of raw materials will increase the unit variable cost of VCRs by an estimated $25. Management plans a cost-cutting program that will save $17,500 in fixed costs per month. Vargo Video Company is currently realizing monthly net income of $80,000 on sales of 1,400 VCRs.
Question: What increase in sales will be needed to to maintain the same level of net income?
Answer: The variable cost per unit increases to $325 ($300 + $25), and fixed costs are reduced to $182,500 ($200,000 – $17,500). Because of the change in variable cost, the variable cost becomes 65% of sales ($325 ÷ $500). Using the equation for target net income, required sales are calculated to be $750,000, as follows:

ASSUMED COST AND EXPENSE DATA
Study Objective 9
• The CVP income statement classifies costs and expenses as variable or fixed and specifically reports contribution margin in the body of the statement.
• Assume that Vargo Video Company reaches its target net income of $120,000.
• The following information is obtained on the $680,000 of costs that were incurred in June:
Variable Fixed Total
Cost of goods sold $ 400,000 $ 120,000 $ 520,000Selling expenses 60,000 40,000 100,000Administrative expenses 20,000 40,000 60,000
$ 480,000 $ 200,000 $ 680,000

CVP INCOME STATEMENT
• Net income is $120,000 in both statements.
• The major difference is the format for the expenses.

TRADITIONAL VERSUS CVP INCOME STATEMENT
VARGO VIDEO COMPANY Income Statement For the Month Ended June 30, 2005
Traditional Format
Sales $ 800,000 Cost of goods sold 520,000
Gross profit 280,000 Operating expenses Selling expenses $ 100,000 Administrative expenses 60,000
Total operating expenses 160,000
Net income $ 120,000
CVP Format
Sales $ 800,000Variable expenses Cost of goods sold $ 400,000 Selling expenses 60,000 Administrative expenses 20,000
Total variable expenses 480,000
Contribution margin 320,000Fixed expenses Cost of goods sold 120,000 Selling expenses 40,000 Administrative expenses 40,000
Total fixed expenses 200,000
Net income $ 120,000

John Wiley & Sons, Inc. © 2005
Chapter 24Chapter 24
Budgetary Planning
Accounting Principles, 7Accounting Principles, 7thth EditionEdition
Weygandt Weygandt •• Kieso Kieso •• KimmelKimmel
Prepared by Naomi KarolinskiPrepared by Naomi KarolinskiMonroe Community CollegeMonroe Community College
andand
Marianne BradfordMarianne BradfordBryant CollegeBryant College
CHAPTER 24BUDGETARY PLANNING
After studying this chapter, you should be able to:
1 Indicate the benefits of budgeting.
2 State the essentials of effective budgeting.
3 Identify the budgets that comprise the master budget.
4 Describe the sources for preparing the budgeted income statement.
5 Explain the principal sections of a cash budget.
6 Indicate the applicability of budgeting in nonmanufacturing companies.
Budgeting Basics
• Budget– formal written statement of management’s plans for
a specified future time period, expressed in financial terms.
a) provide historical data on revenues, costs, and expenses,
b) express management’s plans in financial terms, and
c) prepare periodic budget reports.

Benefits of BudgetingSTUDY OBJECTIVE 1
a) All levels of management plan ahead.
b) Definite objectives for evaluating performance.
c) Early warning system for potential problems.
d) Coordination of activities within the business.
e) Management awareness of the entity’s overall operations.
f) Motivates personnel throughout organization to meet planned objectives.

Essentials of Effective BudgetingSTUDY OBJECTIVE 2
• Sound organizational structure – authority and responsibility for all phases
of operations are clearly defined.
• Based on research and analysis – realistic goals that will contribute to the
growth and profitability of the company.
• Directly related acceptance by all levels of management.

Length of the Budget Period
• Most common budget period – one year
– budget may be prepared for any period of time
• A continuous twelve-month budget– drops the month just ended and adds a future
month
• Annual budget– supplemented by monthly and quarterly budgets

The Budgeting Process
Budget committee• Responsible for coordinating the preparation of the
budget
• ordinarily includes
– the president, treasurer, chief accountant (controller), and management personnel from each major area of the company

Flow of Budget Data

Budgeting and Human Behavior
• Strong positive influence on a manager when:
– Each level of management is invited and encouraged to participate in developing the budget.
– Criticism of a manager’s performance is tempered with advice and assistance.
– Top management is sensitive to the behavioral implications of its actions.

Budgeting and Long-Range Plans
• Budgeting
– the achievement of specific short-term goals
• Long-range planning
– identifies and selects strategies to achieve goals and develop policies and plans to implement the strategies
• Long-range plans
– contain less detail

Compared to budgeting, long-range planning generally has the:a. same amount of detail.
b. longer time period.
c. same emphasis.
d. same time period.

Compared to budgeting, long-range planning generally has the:a. same amount of detail.
b. longer time period.
c. same emphasis.
d. same time period.

The Master BudgetSTUDY OBJECTIVE 3
• A set of interrelated budgets that constitutes a plan of action for a specified time period.
• Developed within the framework of a sales forecast.

Components of the Master Budget

Two Classes of Budgets in the Master Budget
• Operating budgets – the individual budgets that result in the
preparation of the budgeted income statement
• Financial budgets– focus on the cash resources needed to fund
expected operations and planned capital expenditures

Preparing the Operating Budgets:
Sales Budget• The first budget prepared.
• Each of the other budgets depends on the sales budget.
• It is derived from the sales forecast. It represents management’s best estimate of sales revenue for the budget period.

Sales Budget
HAYES COMPANY Sales Budget
For the Year Ending December 31, 2005
Quarter 1 2 3 4 Year Expected unit sales 3,000 3,500 4,000 4,500 15,000
Unit selling price $60 $60 $60 $60 $60 Total sales $180,000 $210,000 $240,000 $270,000 $900,000
The sales budget is prepared by multiplying the expected unit sales volume for each product by its anticipated unit selling price.
For Hayes Company, sales volume is expected to be 3,000 units in the first quarter with 500-unit increments in each succeeding year. Based on a sales price of $60 per unit, the sales budget for the year by quarters is shown below:

Production Budget
• Shows the units that must be produced to meet anticipated sales.
• It is derived from the budgeted sales units (per sales budget) plus the desired ending finished goods less the beginning finished goods units.
• The production requirement formula is:
Desired Ending
Finished Goods Units
Beginning Finished Goods Units
Budgeted Sales Units
Required Production
Units

Production Budget
HAYES COMPANY Production Budget
For the Year Ending December 31, 2005
Quarter 1 2 3 4 Year Expected unit sales 3,000 3,500 4,000 4,500
Add: Desired ending finished good units 700 800 900 1,000 Total required units 3,700 4,300 4,900 5,500
Less: Beginning finished goods units 600 700 800 900
Required production units 3,100 3,600 4,100 4,600 15,400
20% of next quarter’s sales
Expected 2006 1st Q sales5,000 units x 20%
Hayes believes it can meet future sales requirements by maintaining an ending inventory equal to 20% of the next quarter’s budgeted sales volume. The production budget is shown below.
Per sales budget

Direct Materials Budget
Desired Ending Direct
Material Units
Beginning Direct
MaterialsUnits
Direct Materials
Units Required for Production
Required Direct
Materials Purchases
Units
• Shows both the quantity and cost of direct materials to be purchased.
• It is derived from the direct materials units required for production (per production budget) plus the desired ending direct materials units less the beginning direct materials units.

Direct Materials Budget
QUARTER 1 2 3 4 Year Units to be produced 3,100 3,600 4,100 4,600
Direct materials per unit X2 X 2 X 2 X 2 Total pounds needed for production
6,200 7,200 8,200 9,200
Add: Desired ending direct materials (pounds) 720 820 920 1,020 Total materials required 6,920 8,020 9,120 10,220
Less: Beginning direct materials (pounds) 620 720 820 920 Direct materials purchases 6,300 7,300 8,300 9,300 Cost per pound X $4 X $4 X $4 X $4
Hayes has found that an ending inventory of raw materials equal to 10% of the next quarter’s production is sufficient. The manufacture of Kitchen-mate requires 2 pounds of raw materials and the expected cost per pound is $4. Assume ending direct materials for the 4th quarter are 1,020 pounds. The directmaterials budget is shown below:
Total cost of direct materials purchases $25,200 $29,200 $33,200 $37,200 $124,800
from production budget

Direct Labor Budget
HAYES COMPANYDirect Labor Budget
For the Year Ending December 31, 2005QUARTER 1 2 3 4 Year
Units to be produced(from Production Budget) 3,100 3,600 4,100 4,600Direct Labor time (hours)per unit 2 2 2 2Total required direct laborhours
6,200 7,200 8,200 9,200
Direct labor cost per hour $10 $10 $10 $10
Total direct labor cost $62,000 $72,000 $82,000 $92,000 $308,000
At Hayes Company, two hours of direct labor are required toproduce each unit of finished goods, and the anticipatedhourly wage rate is $10. The direct labor budget is shown below.

Manufacturing Overhead and Selling and Administrative
Budget
• Manufacturing overhead budget – expected manufacturing overhead costs
• Selling and administrative expense budget– projection of anticipated operating expenses
• Both distinguish between fixed and variable costs.

HAYES COMPANY Manufacturing Overhead Budget (Variable portion)
For the Year Ending December 31, 2005 Quarter
1 2 3 4 Year Variable costs
Indirect materials $6,200 $7,200 $8,200 $9,200 $30,800 Indirect labor 8,680 10,080 11,480 12,880 43,120 Utilities 2,480 2,880 3,280 3,680 12,320 Maintenance 1,240 1,440 1,640 1,840 6,160
Manufacturing Overhead Budget
Hayes Company expects variable costs to fluctuate with production volume on the basis of the following rates per direct labor hour (as calculated in the Direct Labor Budget).
Indirect materials $1.00/hr Indirect labor $1.40/hr Utilities $.40/hr Maintenance $ .20/hr
Total variable costs$18,600 $21,600 $24,600 $27,600 $ 92,400

Manufacturing Overhead Budget
HAYES COMPANY Manufacturing Overhead Budget (Fixed portion and Totals)
For the Year Ending December 31, 2005 Quarter
1 2 3 4 Year Fixed Costs
Supervisory salaries 20,000 20,000 20,000 20,000 80,000 Depreciation 3,800 3,800 3,800 3,800 15,200
Property taxes and insurance 9,000 9,000 9,000 9,000 36,000
Maintenance 5,700 5,700 5,700 5,700 22,800 Total fixed 38,500 38,500 38,500 38,500 154,000
Total manufacturing overhead $57,100 $60,100 $63,100 $66,100 $246,400
Direct labor hours 6,200 7,200 8,200 9,200 30,800
Manufacturing overhead rate per direct labor hour ($246,400 / 30,800) = $8.00
Fixed costs complete the manufacturing overhead budget and the totals are used to calculate an overhead rate, which will beapplied to production on the basis of direct labor hours.

Selling and Administrative Expense Budget
HAYES COMPANY Selling and Administrative Expense Budget
For the Year Ending December 31, 2005 Quarter
1 2 3 4 Year Variable expenses Sales Commissions $9,000 $10,500 $12,000 $13,500 $45,000 Freight-out 3,000 3,500 4,000 4,500 15,000 Total variable 12,000 14,000 16,000 18,000 60,000 Fixed expenses 30,000 30,000 30,000 30,000 120,000
Variable expenses are based on the unit sales projected in thesales budget. The rates per unit of sales are sales commissions$3.00 and freight-out $1.00. Fixed costs are based on assumed data and include $1,000 of depreciation per quarter.
Total selling and adm. ex. $42,000 $44,000 $46,000 $48,000 $180,000

Budgeted Income StatementSTUDY OBJECTIVE 4
•The important end-product of the operating budgets. – indicates the expected profitability of operations
– provides a basis for evaluating company performance
•The budget is prepared from the:– Sales budget
– Production budget
– Direct labor budget
– Direct materials purchases budget
– Manufacturing overhead budget
– Selling and administrative expense budget

Computation of Total Unit Cost
Cost of One Kitchen -mate
Cost Element Illustration Quantity Unit Cost Total Direct materials 24-7 2 pounds $4.00 $8.00
Direct labor 24-8 2 hours $10.00 20.00 Manufacturing
Overhead 24-9 2 hours $8.00 16.00
Total unit cost $44.00
To find cost of goods sold for the Budgeted Income Statement it is necessary to determine the total unit cost of a finished product using the direct materials, direct labor, and manufacturing overhead budgets.

HAYES COMPANY Budgeted Income Statement
For the Year Ending December 31, 2005 Sales $900,000 Cost of Goods Sold 660,000 Gross Profit Selling and administrative expenses
240,000 180,000
Income from operations 60,000 Interest expense Income before income taxes Income tax expense Net income
100 59,900 12,000
$ 47,900
Budgeted Income Statement
Cost of goods sold can then be determined by multiplying theunits sold by the unit cost. All data for the statement are obtainedfrom the operating budgets except: interest expense ($100) andincome taxes ($12,000).
(From sales budget)(15,000 x $44)

Preparing the Financial Budgets
STUDY OBJECTIVE 5
• Cash budget– anticipated cash flows
– often considered to be the most important output in preparing financial budgets
• The cash budget contains three sections:– Cash receipts
– Cash disbursements
– Financing

Basic Form of a Cash Budget
The cash receipts section includes expected receipts from the company’s principal source(s) of revenue such as cash sales and collections from customers on credit sales.
ANY COMPANYCash Budget
Beginning cash balance $X,xxxAdd: Cash receipts (Itemized) X,xxxTotal available cash X,xxxLess: Cash disbursements(Itemized)
X,xxx
Excess (deficiency) of availablecash over cash disbursements
X,xxx
Financing X,xxxEnding cash balance $X,xxx

Basic Form of a Cash Budget
The cash disbursements section shows expected payments for direct materials, direct labor, manufacturing overhead, and selling andadministrative expenses. This section also includes projected payments for income taxes, dividends, investments, and plant assets.
ANY COMPANYCash Budget
Beginning cash balance $X,xxxAdd: Cash receipts (Itemized) X,xxxTotal available cash X,xxxLess: Cash disbursements(Itemized)
X,xxx
Excess (deficiency) of availablecash over cash disbursements
X,xxx
Financing X,xxxEnding cash balance $X,xxx

Basic Form of a Cash Budget
The financing section shows expected borrowings and the repayment of the borrowed funds plus interest.This section is needed when there is a cash deficiency or when the cash balance is below management’s minimum required balance.
ANY COMPANYCash Budget
Beginning cash balance $X,xxxAdd: Cash receipts (Itemized) X,xxxTotal available cash X,xxxLess: Cash disbursements(Itemized)
X,xxx
Excess (deficiency) of availablecash over cash disbursements
X,xxx
Financing X,xxxEnding cash balance $X,xxx

Schedule of Expected Collections from Customers Quarter 1 2 3 4
Accounts receivable, 12/31/01 First quarter ($180,000)
Second quarter ($210,000)
Third quarter ($240,000)
Fourth quarter ($270,000)
Total collections $168,000 $198,000 $228,000 $258,000
Collections from Customers
Preparing a schedule of cash collections from customers isuseful in preparing a cash budget. Assuming that credit sales per the Sales Budget (amounts shown in parentheses below)are collected 60% in the quarter sold and 40% in the following quarter. Accounts Receivable of $60,000 at December 31, 2004 are expected to be collected in full the first quarter of 2005.
$ 60,000
108,000 $72,000
126,000 $ 84,000
144,000 $96,000
162,000

Schedule of Expected Payments for Direct Materials Quarter 1 2 3 4 Accounts Payable, 12/31/04 First quarter ($25,200) Second quarter ($29,200) Third quarter ($33,200)
Fourth quarter ($37,200)
Total payments $23,200 $27,200 $31,200 $35,200
Payments for Direct Materials
$10,600 12,600 $12,600
14,600 $14,600 16,600 $16,600
18,600
A schedule of cash payments for direct materials is also useful in preparing a cash budget. Assume that 50% of direct materials purchased are paid for in the quarter purchased, 50% are paid in the following quarter, and an accounts payable balance of $10,600 on December 31, 2004 is paid for in the first quarter of 2005. The schedule of cash payments will be as follows:
Amounts in parenthesestaken from direct materialpurchases budget

Cash Budget
HAYES COMPANY Cash Budget
For the Year Ending December 31, 2005 Quarter
1 2 3 4 Beginning cash balance $38,000 $25,500 $15,000 $19,400
Add: Receipts 168,000 198,000 228,000 258,000 Collections from
customers
Sale of securities 2,000 0 0 0 Total receipts 170,000 198,000 228,000 258,000 Total available cash 208,000 223,500 243,000 277,400
Assume that ending cash is $38,000 for 2004 and marketablesecurities are expected to be sold for $2,000 cash in the firstquarter. Collections from customers was calculated in Illustration 24-14. The receipts section of the Hayes Company cash budget is shown below:

Cash Budget
• Direct materials amounts: taken from the schedule of payments for direct materials.
• Direct labor amounts: taken from direct labor budget-100% paid in quarter incurred.
• Manufacturing overhead and selling and administrative expense amounts: all items except depreciation are paid in the quarter incurred.
• Management plans to purchase a new truck in the second quarter for $10,000.
• The company makes equal quarterly payments ($3,000) of its estimated annual income taxes.

HAYES COMPANY Cash Budget
For the Year Ending December 31, 2005 Quarter
1 2 3 4 Less: Disbursements
Direct materials $23,200 $27,200 $31,200 $35,200 Direct labor 62,000 72,000 82,000 92,000 Manufacturing overhead 53,300 56,300 59,300 62,300
Selling and adm. expenses 41,000 43,000 45,000 47,000 Purchase of a truck 0 10,000 0 0 Income tax expense 3,000 3,000 3,000 3,000 Total disbursements 182,500 211,500 220,500 239,500
Cash Budget
Disbursements will be subtracted from Receipts in order to determineExcess (deficiency) of available cash over disbursements.

HAYES COMPANY Cash Budget
For the Year Ending December 31, 2005 Quarter
1 2 3 4 Total available cash 208,000 223,500 243,000 277,400
Total disbursements 182,500 211,500 220,500 239,500
Excess (deficiency) of available cash over disbursements 25,500 12,000 22,500 37,900
Financing Borrowings 0 3,000 0 0 Repayments-plus $100
interest
0
0
3,100
0
Ending cash balance $25,500 $15,000 $19,400 $37,900
Cash BudgetAssuming that a minimum cash balance of $15,000 must be maintained,$3,000 of financing will be needed in the 2nd quarter. Loans must be paidback the next quarter (if there is sufficient cash) with interest. Assume interest is $100 on the $3,000 borrowed the second quarter.

Budgeted Balance Sheet
• A projection of financial position at the end of the budget period.
• Developed from the budgeted balance sheet for the preceding year and the budgets for the current year.
Beginning balances for 2005:Building and equipment $182,000 Accumulated depreciation $28,800 Common Stock $225,000Retained earnings $46,480

HAYES COMPANY Budgeted Balance Sheet
December 31, 2005
Assets
Cash $ 37,900
Accounts Receivable 108,000 Finished goods inventory Raw materials inventory Buildings and equipment
$192,000
44,000 4,080
Less: Accumulated depreciation Total assets
48,000 144,000 $337,980
Budgeted Balance Sheet
(Ending cash balance shown in cash budget)
(Schedule of cash collections)
(1,000 units x $44 [ production budget])(1,020 lbs x $4 [direct materials budget])
($182,000 + $10,000 [new truck])
($28,800 + $15,200 MOH budget and $4,000 S&A budget)
Sources and computations of the amounts in theAssets section of the Budgeted Balance Sheet are shown below:

HAYES COMPANY Budgeted Balance Sheet
December 31, 2005
Liabilities and Stockholders’ Equity
Accounts payable Common stock Retained earnings
$ 18,600 225,000 94,380
Total liabilities and stockholders’ equity $ 337,980
Budgeted Balance Sheet
• (50% of 4th Q purchases of $37,200 on schedule of expected payments)
• (Common Stock - Unchanged from beginning of year)
• (2004 balance of $46,480 + net income $47,900) found on Budgeted Income Statement

Budgeting in Non-Manufacturing Companies
STUDY OBJECTIVE 6
Budgets may also be used in by:
• Merchandisers
• Service enterprises
• Not-for-profit organizations

Desired Ending
Merchandise Inventory
Beginning Merchandise
Inventory
Budgeted Cost of
Goods Sold
Required Merchandise
Purchases
Merchandise Purchases Formula
The major differences between the budgets of a merchandiser and a manufacturer are that a merchandiser:
• Uses a merchandise purchases budget instead of a production budget.
• Does not use the manufacturing budgets (direct materials, direct labor, and manufacturing overhead).

Budgeted cost of goods sold (budgeted sales for July, $300,000 x 70%) $210,000
Desired ending merchandise inventory (budgeted cost of goods sold for August, ($320,000 x 70% x 30%) 67,200 Total 277,200
Less: Beginning merchandise inventory (budgeted sales for July, $300,000 x 70% x 30%) 63,000 Required merchandise purchase for July $214,000
Computation of Required Merchandise Purchases
Lima Company’s budgeted sales will be $300,000 in July and$320,000 in August. Cost of goods sold is expected to be 70% of sales, and the company’s desired ending inventory is 30% of the following month’s cost of goods sold. Required merchandise purchases for July are $214,200, computed as follows:

Service Enterprises
• Critical factor in budgeting – coordinating professional staff needs with anticipated
services.
If a firm is overstaffed:• Labor costs will be disproportionately high.• Profits will be lower because of the additional salaries.• Staff turnover will increase because of lack of challenging
work.

Service Enterprises
If an enterprise is understaffed, • Revenue may be lost because existing and
prospective client needs for service cannot be met, and
• Professional staff may seek other jobs because of excessive work loads.

Not-for-Profit Organizations
• Budgeting is just as important for not-for-profit organizations as for profit-oriented enterprises.
• In most cases, not-for-profit entities budget on the basis of cash flows (expenditures and receipts), rather than on a revenue and expense basis.
• The starting point in the budgeting process is usually expenditures, not receipts.

A sales budget is:
a. derived from the production budget.
b. management’s best estimate of sales revenue for the year.
c. not the starting point for the master budget.
d. prepared only for credit sales.

A sales budget is:
a.derived from the production budget.
b.management’s best estimate of sales revenue for the year.
c.not the starting point for the master budget.
d.prepared only for credit sales.

John Wiley & Sons, Inc. © 2005
Chapter 25Chapter 25
Budgetary Control and Responsibility Accounting
Accounting Principles, 7Accounting Principles, 7thth EditionEdition
Weygandt Weygandt •• Kieso Kieso •• KimmelKimmel
Prepared by Naomi KarolinskiPrepared by Naomi KarolinskiMonroe Community CollegeMonroe Community College
andand
Marianne BradfordMarianne BradfordBryant CollegeBryant College

CHAPTER 25Budgetary Control and
Responsibility AccountingAfter studying this chapter, you should be able to:
1 Describe the concept of budgetary control.
2 Evaluate the usefulness of static budget reports.
3 Explain the development of flexible budgets and the usefulness of flexible budget reports.
4 Describe the concept of responsibility accounting.
5 Indicate the features of responsibility reports for cost centers.
After studying this chapter, you should be able to:
6 Identify the content of responsibility reports for profit centers.
7 Explain the basis and formula used in evaluating performance in investment centers.

Budgetary ControlSTUDY OBJECTIVE 1
• Budget reports compare actual results with planned objectives.
• Provides management with feedback on operations.

Budgetary Control

Budgetary Control
A formalized reporting system should :• Identify the name of the budget report:
– such as the sales budget or the manufacturing overhead budget
• Frequency of the report
– weekly or monthly
• Purpose of the report
• Recipient(s) of the report

Name ofReport
Frequency Purpose Primary Recipient(s)
Sales Weekly Determine whether sales goals are being met
Top management and sales manager
Labor Weekly Control direct and indirectlabor costs
Vice president of productionand production department managers
Scrap Daily Determine efficient use of materials
Production manager
DepartmentOverhead costs
Monthly Control overhead costs Department manager
Selling expenses Monthly Control selling expenses Sales manager
IncomeStatement
Monthly andquarterly
Determine whether income objectives are being met
Top manager
Budgetary Control Reporting System
The schedule above illustrates a partial budgetary controlsystem for a manufacturing company. Note the frequency of reports and their emphasis on control

Static Budget ReportsSTUDY OBJECTIVE 2
• Projection of budget data at one level of activity.
• Data for different levels of activity are ignored.
• Actual results are always compared with the budget data at the activity level in the master budget.

Budget and Actual Sales Data
To illustrate the role of a static budget in budgetarycontrol, we will use selected data for Hayes Company prepared in Chapter 24. Budget and actual sales data for the Kitchen-mate product in the first and second quarters of 2005 are as follows:
Sales First Quarter Second Quarter Total
Budgeted $180,000 $210,000 $390,000
Actual 179,000 199,500 378,500Difference $1,000 $10,500 $11,500

The report shows that sales are $1,000 under budget - an unfavorable result. This difference is less that 1% of budgeted sales ($1,000/$180,000 =.0056), we will assume that top management of Hayes Company will view the difference as immaterial and take no specific action.
Sales Budget Report:First Quarter
HAYES COMPANY Sales Budget Report
For the Quarter Ended March 31, 2005 Difference Favorable F
Product Line Budget Actual Unfavorable U Kitchen-mate $180,000 $179,000
The sales budget report for Hayes Company’s 1st quarter is shown below.
$1,000 U

Sales Budget Report:Second Quarter
HAYES COMPANY Sales Budget For the Quarter Ended June 30, 2005
Second Quarter Difference Favorable F
Product Line Budget Actual Unfavorable U Kitchen-mate $210,000 $199,500
$10,500 U
The second quarter shows that sales were $10,500 below budget, which is 5% of budgeted sales ($10,500/$210,000). Top management may conclude that the difference between budgeted and actual sales in the second quarter merits investigation and will begin by asking the sales manager the cause(s).

Uses and Limitations
A static budget evaluates a manager’s effectiveness in controlling costs when:• Actual level of activity closely approximates the master
budget activity level, and/or
• Behavior of the costs in response to changes in activity is fixed.

A static budget is useful in controlling costs when cost behavior is:
a. mixed.
b. fixed.
c. variable.
d. linear.

A static budget is useful in controlling costs when cost behavior is:a. mixed.
b. fixed.
c. variable.
d. linear.
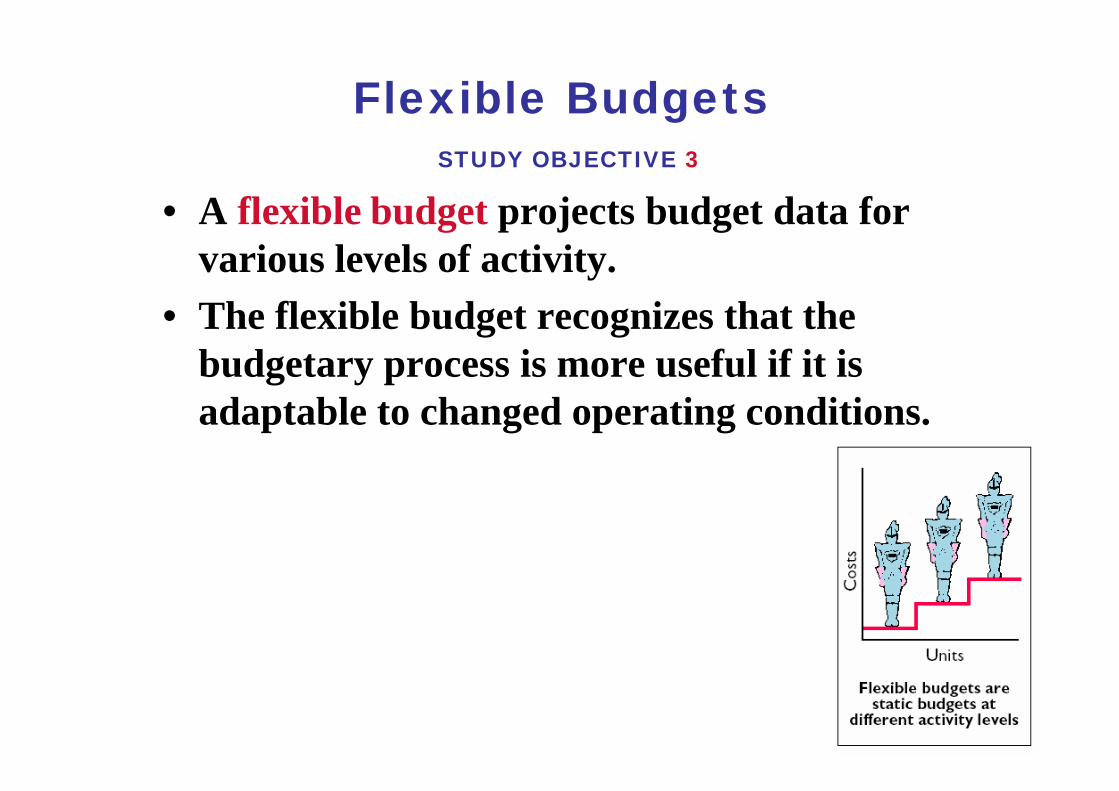
Flexible BudgetsSTUDY OBJECTIVE 3
• A flexible budget projects budget data for various levels of activity.
• The flexible budget recognizes that the budgetary process is more useful if it is adaptable to changed operating conditions.

Static Overhead Budget
BARTON STEEL Manufacturing Overhead Budget (Static)
Forging Department For the Year Ended December 31, 2005
Budgeted production in units(steel ingots) 10,000
Budget costs Indirect material $ 250,000
Indirect labor 260,000
Utilities 190,000 Depreciation 280,000 Property taxes 70,000 Supervision 50,000
$1,100,000
Barton Steel prepares the above static budget for manufacturing overheadbased on a production volume of 10,000 units of steel ingots.
(Budget based on 10,000 units of production)

If demand for steelingots has increasedand 12,000 units areproduced during theyear, rather than 10,000, the budgetreport will show very large variances.This is because thecomparison is basedon budget data basedon the original activity level (10,000 steel ingots). Variablebudget allowanceshave increased withproduction.
BARTON STEEL Manufacturing Overhead Budget Report (Static)
Forging department For the Year Ended December 31,2005
Difference
Favorable F
Budget Actual Unfavorable U
Production in units 10,000 12,000
Costs
Indirect materials $ 250,000 $ 295,000
Indirect labor 260,000 312,000
Utilities 190,000 225,000
Depreciation 280,000 280,000
Property taxes 70,000 70,000
Supervision 50,000 50,000
$1,100,000 $1,232,000
Static Overhead Budget Report
$ 45,000 U
52,000 U
35,000 U
-0-
-0-
-0-
$132,000

Item Total Cost Production Per Unit
Indirect material $250,000
Indirect labor 260,000
Utilities 190,000
$700,000
Variable Costs per Unit
/10,000 units $25
/10,000 units 26
/10,000 units 19
$70
Comparing actual variable costs with budgeted costsis meaningless (due to different levels of activity), variable per unit costs must be isolated, so the budget can be adjusted. An analysis of the budget data forthese costs at 10,000 units produces the above per unit results:

The budgeted variable costs at 12,000units, therefore, are shown above. Because FIXED costs do not change intotal as activity changes, the budgetedamounts for these costs remain the same.
Illustration 25-9Budgeted Variable Costs
(12,000 units)
Item Computation Total
Indirect material $25 X 12,000
Indirect labor 26 X 12,000
Utilities 19 X 12,000
$300,000
312,000
228,000
$840,000

BARTON STEEL –Forging Department Manufacturing Overhead Budget Report (Flexible)
For the Year Ended December 31,2005
Difference
Favorable F
Budget Actual Unfavorable U
Production in units 12,000 12,000
Variable Costs
Indirect materials $300,000 $ 295,000
Indirect labor 312,000 312,000
Utilities 228,000 225,000
Total variable 840,000 832,000
Fixed Costs
Depreciation 280,000 280,000
Property taxes 70,000 70,000
Supervision 50,000 50,000
Total fixed 400,000 400,000
Total costs $1,240,000 $1,232,000
Flexible Overhead Budget Report
This budgetreport basedon the flexiblebudget for 12,000 unitsof productionshows thatthe Forging Departmentis below budget-a favorabledifference.
$ 5,000 F-0-
3,000 F
8,000 F
-0-
-0--0-
-0-
$8,000 F

Developing the Flexible Budget
• Identify the activity index and the relevant range of activity.
• Identify the variable costs, and determine the budgeted variable cost per unit of activity for each cost.
• Identify the fixed costs, and determine the budgeted amount for each cost.
• Prepare the budget for selected increments of activity within the relevant range.

Flexible Budget -A Case StudyMaster Budget Data
Variable Costs Fixed Costs
Indirect material $180,000 Depreciation $180,000
Indirect labor 240,000 Supervision 120,000
Utilities 60,000 Property Taxes 60,000
Total $480,000 Total $360,000
Fox Company wants to use a flexible budget for monthlycomparisons of actual and budgeted manufacturingoverhead costs. The master budget for the year endedDecember 31, 2005 is prepared using 120,000 directlabor hours and the following overhead costs.
STEP 1: Identify the activity index and the relevant range of activity:The activity index is direct labor hours and management concludes that the relevant range is 8,000-12,000 direct labor hours.

Flexible Budget-A Case StudyComputation of variable costs per direct labor hour
Variable Cost perVariable Cost Computation Direct Labor Hour
Indirect material $180,000/120,000 $1.50
Indirect labor 240,000/120,000 2.00
Utilities 60,000/120,000 .50
Total $4.00
STEP 2: Identify the variable costs and determine the budgeted variable cost per unit of activity for each cost.
There are 3 variable costs and the per unit variable cost is found by dividing each total budgeted cost by the direct labor hours used in preparing the master budget (120,000 hours).

Flexible BudgetA Case Study
• Step 3: Identify the fixed costs and determine the budgeted amount for each cost.
• There are three fixed costs and since Fox desires monthly budget data, the budgeted amount is found by dividing each annual budgeted cost by 12 ($180,000/12 =$15,000).
• Step 3: Identify the fixed costs and determine the budgeted amount for each cost.
• There are three fixed costs and since Fox desires monthly budget data, the budgeted amount is found by dividing each annual budgeted cost by 12 ($180,000/12 =$15,000).
Variable Fixed
Indirect material $180,000 Depreciation $15,000
Indirect labor 240,000 Supervision 10,000
Utilities 60,000 Property Taxes 5,000
$480,000

FOX MANUFACTURING COMPANY Flexible Monthly Manufacturing Overhead Budget
Finishing Department For the Year 2005
Activity Level 8,000 9,000 10,000 11,000 12,000
Variable Costs
Indirect materials $12,000 $13,500 $15,000 $16,500 $18,000
Indirect labor 16,000 18,000 20,000 22,000 24,000
Utilities 4,000 4,500 5,000 5,500 6,000
Total variable 32,000 36,000 40,000 44,000 48,000
Fixed Costs
Depreciation 15,000 15,000 15,000 15,000 15,000
Property taxes 5,000 5,000 5,000 5,000 5,000
Supervision 10,000 10,000 10,000 10,000 10,000
Total fixed 30,000 30,000 30,000 30,000 30,000
Total costs $62,000 $66,000 $70,000 $74,000 $78,000
Flexible Budget - A Case StudyFlexible Monthly Overhead Budget
Step 4: Prepare the budget for selected increments of activity within the relevant range.

Flexible Budget - A Case StudyFormula for Total Budgeted Costs
VariableCosts
TotalBudgeted
Costs
FixedCosts +
• From the budget, the following formula may be used to determine total budgeted costs at any level of activity.
• For Fox Manufacturing, fixed costs are $30,000, and total variable costs per unit is $4.00.
• Thus, at 8,622 direct labor hours, total budgeted costs are:
EXAMPLE
$30,000 $4.00 x 8,622 $64,488

Flexible Budget Reports
Another type of internal report produced by managerial accounting. Two sections:
• Production data such as direct labor hours
• Cost data for variable and fixed costs
Flexible budgets are used to evaluate a manager’s performance in production control and cost control.

Graphic Flexible Budget Data

Flexible Overhead Budget Report
$13,500 18,000
4,50036,000
15,000 10,000 5,000
30,000
$66,000
FOX MANUFACTURING COMPANYFlexible Manufacturing O verhead Budget Report
Finishing DepartmentFor the Month Ended January 31, 2005
Direct labor hours (DLH) Difference
Expected 8,800Actual 9,000
Budget at9,000 DLH
Actual Costs9,000 DLH
Favorable FUnfavorable U
Variable costs
Indirect materials $14,000 $500 UIndirect labor 17,000 1,000 FUtilities 4,600 100 U
Total variable 35,600 400 FFixed costs
Depreciation 15,000 -0-Supervision 10,000 -0-Proper ty taxes 5,000 -0-
Total fixed 30,000 -0-
Total costs $65,600 $ 400 F
In this budget report, 8,800 DLH were expected but 9,000 hours were worked. Budget data are based on the flexible budget for 9,000 hours.

Management by Exception
Review of a budget report
• Focus on differences between actual results and planned objectives
Guidelines for identifying an exception.
• Materiality
– expressed as a percentage difference from budget
• Controllability
– more restrictive for controllable items than for items that are not controllable by the manager

The Concept of Responsibility AccountingSTUDY OBJECTIVE 4
• Responsibility accounting involves accumulating and reporting costs (and revenues, where relevant) on the basis of the manager who has the authority to make the day-to-day decisions about the items.
• A manager's performance is evaluated on the matters directly under the manager's control.

Responsibility Accounting
Used at every level of management in which the following conditions exist:
• Costs and revenues associated with the specific level of management responsibility.
• The costs and revenues are controllable at the level of responsibility with which they are associated.
• Budget data can be developed for evaluating the manager's effectiveness in controlling the costs and revenues.

Responsibility Accounting
• Valuable in a decentralized company.
• Decentralization – control of operations delegated to many managers
throughout the organization
• Segment– an identified area of responsibility in
decentralized operations

Responsibility Accounting vs. Budgetary Control
Responsibility accounting differs from budgeting in two respects:
• Distinction between controllable and noncontrollable items
• Performance reports– either emphasize or include only items controllable by the
individual manager

Controllable versus Noncontrollable Revenues
and Costs
• Controllable– manager has the power to incur it within a given
period of time.
• Noncontrollable– Costs incurred indirectly and allocated to a
responsibility level.

Responsibility Reporting System
• Involves preparation of a report for each level of responsibility in the company's organization chart.
• Permits management by exception at each level of responsibility.

Responsibility Reporting System
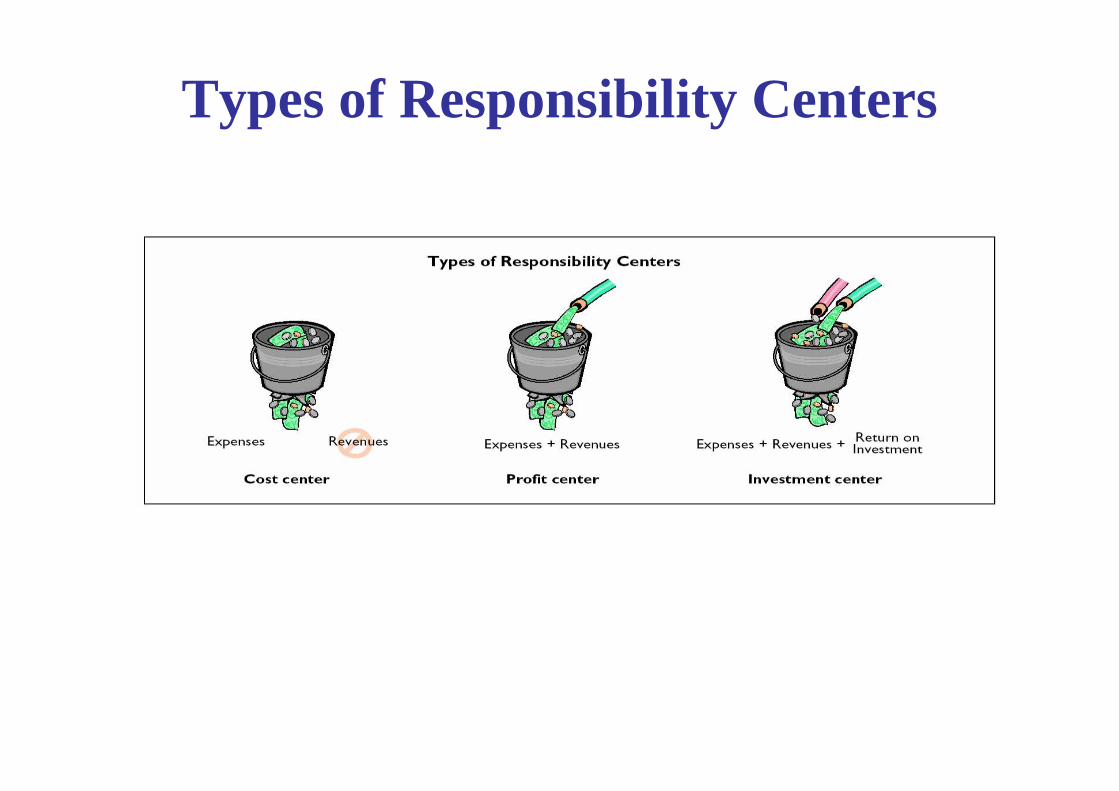
Types of Responsibility Centers

Examples of Responsibility Centers
Examples:• Cost center: usually a production center or service
department.
• Profit center: individual departments of retail stores and branch offices of banks.
• Investment center: subsidiary companies

Responsibility Accounting for Cost CentersSTUDY OBJECTIVE 5
FOX MANUFACTURING COMPANY Finishing Department Responsibility Report
For the Month Ended January 31, 2005 Controllable cost Budget Actual Variance
Indirect material $13,500 $14,000 Indirect labor 18,000 17,000 Utilities 4,500 4,600 $40,000 $39,600
The evaluation of a manager’s performance for cost centers is based on his or her ability to meet budgeted goals for controllable costs. Responsibility reports for cost centers compare actual controllable costs with flexible budget data. Assume that the Finishing Department manager is able to control the following costs only.
$ 500 U1,000 F
100 USupervision 4,000 4,000 -0-
$400 F
Topmanagementmay want anexplanation
of thesevariance.

Responsibility Accounting for Profit Centers
• Profit center– the operating revenues and variable expenses are controllable
by the manager of the profit center.
• Necessary to distinguish between direct and indirect fixed costs.
• Direct fixed costs or traceable costs – costs that relate specifically to a responsibility center and are
incurred for the sole benefit of the center.
• Indirect fixed costs – pertain to a company's overall operating activities
– incurred for the benefit of more than one profit center
– most indirect costs are not controllable by the profit center manager.

Responsibility ReportSTUDY OBJECTIVE 6
• Shows budgeted and actual controllable revenues and costs for a profit center.
• Prepared using the cost-volume-profit income statement format.
1)Controllable fixed costs
2)Controllable margin
3)Noncontrollable fixed costs are not reported.

Responsibility Report for a Profit Center
MANTLE MANUFACTURING COMPANY Marine Division
Responsibility Report For the Year Ended December 31, 2005
Difference Budget
Actual Favorable F
Unfavorable U Sales $1,200,000 $1,150,000 $50,000 U Variable Costs Costs of goods sold 500,000 490,000 10,000 F
Selling and administrative 160,000 156,000 4,000 F
Total 660,000 646,000 14,000 F Contribution margin 540,000 504,000 36,000 U Cost of goods sold 100,000 100,000 -0- Selling and administrative 80,000 80,000 -0- Total 180,000 180,000 -0-
Controllable fixed costs
Controllable margin $360,000 $324,000 $36,000 U
Note that this report does not show noncontrollablefixed costs. This manager was below budgeted expectations by approximately 10% ($36,000/ $360,000).

Responsibility Accounting for Investment Centers
STUDY OBJECTIVE 7
• Investment center – the manager can control or significantly influence the
investment funds available for use.
• Return on investment (ROI). – Basis for evaluating the performance of a manger of an
investment center
– considered superior to any other performance measurement
– shows the effectiveness of the manager in utilizing the assets at his or her disposal

ROI Formula
InvestmentCenter
ControllableMargin
(in dollars)
/Average
InvestmentCenter
OperatingAssets
Return onInvestment
(ROI)
• Operating assets
– Current assets and plant assets used in operations by the center. (Nonoperating assets such as idle plant assets and land held for future use are excluded)
• Average operating assets– usually based on the beginning and ending cost or book values of the
assets
$1,000,000 / $5,000,000 = 20%

Responsibility Report for Investment Center
MANTLE MANUFACTURING COMPANY Marine Division
Responsibility Report For the Year Ended December 31, 2002
Difference Budget
Actual Favorable F
Unfavorable U Sales $1,200,000 $1,150,000 $50,000 U Variable Costs Costs of goods sold 500,000 490,000 10,000 F Selling and administrative 160,000 156,000 4,000 F Total 660,000 646,000 14,000 F Contribution margin 540,000 504,000 36,000 U Controllable Fixed Costs Cost of goods sold 100,000 100,000 -0- Selling and administrative 80,000 80,000 -0- Total 240,000 240,000 -0-
Other fixed costs 60,000 60,000 -0-
Controllable margin $300,000 264,000 $36,000 U
Since an investmentcenter is an independententity for operatingpurposes,all fixed costs are controllable by the investment centermanager. Assumein this example that the managercan control $60,000of fixed costs thatwere not controllable whenthe division was a profit center.

Responsibility Report for Investment Center
Budget Actual VarianceControllable margin $300,000 $264,000 $36,000/Actual average operating assets $2,000,000 $2,000,000 $2,000,000
Assuming actual average operating assets are $2,000,000actual and budgeted ROI is calculated as follows:
Return on Investment 15% 13.2% 1.8%
Top management would likely want an explanation of the reasons for actual ROI being 12% below budgeted ROI (1.8% / 15%).

Assumed Data for Marine Division
Sales $ 2,000,000
Variable cost 1,100,000
Contribution margin(45%) 900,000
Controllable fixed costs 300,000
Controllable margin(a) $600,000
Average operating assets(b) $ 5,000,000
Return on investment (a)÷(b) 12%
• A manager can improve ROI by:
– Increasing controllable margin or
– Reducing average operating assets.
• Assume the following data for the Marine Division of Mantle Manufacturing:

If sales increased by 10%, or $200,000 ($2,000,000 x .10) and there was no change in the contribution margin percentage of 45%, contribution margin will increase $90,000 ($200,000 x .45). Controllable margin will increase by the same amount because controllable fixed costs will not change. Thus, controllablemargin becomes $690,000 ($600,000 +$90,000). The new ROI is 13.8%, computed as follows:
ROI computation -increase in Sales
13.8%$690,000 / $5,000,000 =
New controllable margin / Average operating assets

ROI computation -decrease in costs
14.8%$740,000 / $5,000,000 =
Controllable margin can also be increased by reducing variable andcontrollable fixed costs. If variable and fixed costs were decreased by 10%, total costs willdecrease $140,000[($1,000,000 + $300,000) x .10]. This reduction willresult in a corresponding increase in controllable margin. Thus, thismargin becomes $740,000 ($600,000 + $140,000), and the new ROI is14.8%, computed as follows:
New Controllable margin / Average operating assets

ROI Computation -decrease in operating assets
13.3%
A manager can also improve ROI by reducing average operating assets. Assume that average operating assets are reduced 10% or $500,000 ($5,000,000 x .10). Average operating assets become $4,500,000 ($5,000,000 - $500,000), Since controllable margin remainsunchanged at $600,000, the new ROI is 13.3%, computed as follows:
$600,000 / $4,500,000 =
Controllable margin / New average operating assets

Judgmental Factors in ROI
The return on investment approach includes two judgmental factors:
1)Valuation of operating assets –
Operating assets may be valued at acquisition cost, book value, appraised value, or market value.
2) Margin (income) measure –
This measure may be controllable margin, income from operations, or net income.

Principles of Performance Evaluation
Performance evaluation
• a management function that compares actual results with budget goals.
• includes both behavioral and reportingprinciples.

Responsibilities centers include:
a. cost centers.
b. profit centers.
c. investment centers.
d. all of the above.

Responsibilities centers include:
a. cost centers.
b. profit centers.
c. investment centers.
d. all of the above.

Performance Evaluation Performance Evaluation Through Standard CostsThrough Standard Costs
Chapter 26Chapter 26
Prepared by Naomi KarolinskiPrepared by Naomi KarolinskiMonroe Community CollegeMonroe Community College
andand
Marianne BradfordMarianne BradfordBryant CollegeBryant College
Accounting Principles, 7Accounting Principles, 7thth EditionEdition
Weygandt Weygandt •• Kieso Kieso •• KimmelKimmel

CHAPTER 26Performance Evaluation Through Standard Costs
After studying this chapter, you should be able to:
1 Distinguish between a standard and a budget.
2 Identify the advantages of standard costs.
3 Describe how standards are set.
4 State the formulas for determining direct materials and direct labor variances.
5 State the formulas for determining manufacturing overhead variances.
6 Discuss the reporting of variances.
7 Enumerate the features of a standard cost accounting system.

The Need for Standards
• Standards– common in business
– those imposed by government agencies are often called regulations (such as Fair Labor Standards Act)
• Standard costs– predetermined unit costs used as measures of performance

Standards and BudgetsSTUDY OBJECTIVE 1
• Both are pre-determined costs and both contribute to management planning and control.
• Standard– unit amount
• Budget– total amount
• Standard costs may be incorporated into a cost accounting system.

Why Standard Costs?STUDY OBJECTIVE 2

The advantages of standard costs include all of the following except:
a. management by exception may be used.
b. management planning is facilitated.
c. they may simplify the costing of inventories.
d. management must use a static budget.

The advantages of standard costs include all of the following except:
a. management by exception may be used.
b. management planning is facilitated.
c. they may simplify the costing of inventories.
d. management must use a static budget.

Setting Standard CostsSTUDY OBJECTIVE 3
• Input from all persons who have responsibility for costs and quantities.
• Two levels
– Ideal standards
• optimum levels of performance under perfect operating conditions
– Normal standards
• efficient levels of performance attainable under expected operating conditions

A Case Study
• To establish the standard cost of producing a product, it is necessary to establish standards for each manufacturing cost element - direct materials, direct labor, and manufacturing overhead.
• The standard for each element is derived from the standard price to be paid and the standard quantity to be used.
• To illustrate, assume that Xonic, Inc., wishes to use standard costs to measure performance in filling an order for 1,000 gallons of Weed-O, a liquid weed killer. WEED-O

Direct Materials Standard
• Cost per unit which should be incurred
– purchasing department’s best estimate of the cost of raw materials
– include amount for related costs
• receiving, storing, and handling

Item Price
Purchase price, net of discounts $2.70
Freight .20
Receiving and handling .10
Setting Direct Materials Price Standard
Standard direct materials price per pound $3.00
The materials price standard per pound of material for Xonic’s weed killer is:
WEED-O

Direct Materials Standard
• Quantity of direct materials used per unit of finished goods
• Physical measure
– pounds, barrels, or board feet, etc.
– includes allowances of unavoidable waste and normal storage.

Setting Direct Materials Quantity Standard
Item Quantity(Pounds)
Required materials $3.50
Allowance for waste .4
Allowance for spoilage .10
Standard direct materials quantity per unit 4.0
The standard quantity per unit for Xonic’sWeed-O is as follows:
WEED-O

Total Direct Materials Cost/Unit
STANDARD DIRECT
MATERIALSPRICE
x =
STANDARDDIRECT
MATERIALSQUANTITY
STANDARDDIRECT
MATERIALS COSTPER UNIT
• The standard direct materials cost per unit is calculated as follows for a gallon of Weed-O:
$3.00 x 4.0 pounds = $12.00

Direct Labor Price Standard
• Rate per hour incurred for direct labor.
– based on current wage rates adjusted for anticipated changes, such as cost of living adjustments
– includes employer payroll taxes and fringe benefits

Setting Direct Labor Price Standard
Item Price
Hourly wage rate $7.50
Cost of living adjustment .25
Payroll taxes .75
Fringe benefits 1.50
Standard direct labor rate per hour $10.00
For Xonic, Inc., the direct labor price standard is as follows:
WEED-O

Direct Labor Quantity Standard
• Time required to make one unit of the product
• Critical in labor-intensive companies.– allowances should be made for rest periods,
cleanup, machine setup and machine downtime

Setting Direct Labor Quantity Standard
Item Quantity(Hours)
Actual production time 1.5
Rest periods and cleanup .2
Setup and downtime .3
Standard direct labor hours per unit 2.0
For Xonic, Inc., the direct labor quantity standard is as follows:
WEED-O

Direct Labor
STANDARD DIRECTLABOR RATE
STANDARD DIRECTLABOR HOURS
STANDARD DIRECTLABOR COST
PER UNIT
• The standard direct labor cost per unit is calculated as follows for a gallon of Xonic’s Weed-O:
$10.00 x 2.0 hours = $20.00

Manufacturing Overhead Standard
• Based on a standard predetermined overhead rate.
• Divide budgeted overhead costs by an expected standard activity index.
• The standard manufacturing overhead rate per unit is the predetermined overhead rate times the direct labor quantity standard.

Computing PredeterminedOverhead Rates
BudgetedOverhead
Costs Amount /
StandardDirect
Labor Hours =
Overhead RatePer Direct
Labor HourVariable $79,200 26,400
Fixed 52,800 26,400
Total $132,000 26,400
$3.00
2.00
$5.00
Xonic, Inc., uses standard direct labor hours as the activity index. The company expects to produce 13,200 gallons of Weed-O during the year at normal capacity. Since it takes two direct labor hours for each gallon, total standard direct labor hours are 26,400 (13,200 x 2). At this level of activity, overhead costs are expected to be $132,000, of which $79,200 are variable and $52,800 are fixed. The standard predetermined overhead rates are computed as shown below: WEED-O

Standard Cost Per Gallon of Weed-O
X =ManufacturingCost Elements
StandardQuantity
StandardPrice
StandardCosts
Direct materials 4 pounds $3.00
Direct labor 2 hours $10.00
Manufacturing overhead 2 hours $ 5.00
$ 12.00
$ 20.00
$ 10.00
$ 42.00
The total standard cost per unit is the sum of thestandard costs of direct materials, direct labor, andmanufacturing overhead. For Xonic, Inc., the totalstandard cost per gallon of Weed-O is $42, as shown on the following standard cost card: WEED-O

Variances from StandardsVariances from Standards
• Difference between total actual costs and total standard costs.
• Unfavorable variance – too much was paid for materials and labor or
that there were inefficiencies in using materials and labor.
• Favorable variances – efficiencies in incurring costs and in using
materials and labor.

Actual Production Costs and Computation of Total Variance
Actual costs Standard costs Total variance
Direct materials $13,020
Direct labor 20,580
Variable overhead 6,500
Fixed overhead 4,400
$44,500 42,000 $2,500
UNFAVORABLE
To illustrate variances, we will assume that in producing1,000 gallons of Weed-O in the month of June, Xonic, Inc.incurred the following costs. The total standard cost ofWeed-O is $42,000 (1,000 gallons x $42). Thus, the totalvariance is $2,500, as shown below:

Analyzing variances
• Determine the cost elements that comprise the variance.
• For each manufacturing cost element, a total dollar variance is computed. Then this variance is analyzed into a price varianceand a quantity variance.

Relationships of Variances

Formula for Total Materials Variance
STUDY OBJECTIVE 4
Actual Quantityx Actual Price
(AQ) x (AP)
Standard Quantityx Standard Price
(SQ) x (SP)
Total MaterialsVariance
(TMV)=_
In completing the order for 1,000 gallons of Weed-O,Xonic used 4,200 pounds of direct materials purchasedat a cost of $3.10 per unit. The total materials varianceis computed from the following formula:
(4,200 x $3.10) - (4,000 x $3.00) = $1,020 U

Formula for Materials Price Variance
Actual Quantityx Actual Price
(AQ) x (AP)
Actual Quantityx Standard Price
(SQ) x (SP)
Materials PriceVariance
(MPV)=_
The materials price variance is computed from the following formula. For Xonic, Inc., the materials price variance is $420 calculated asfollows:
(4,200 x $3.10) - (4,200 x $3,00) = $420 U

Formula for Materials Quantity Variance
Actual Quantityx Standard Price
(AQ) x (SP)
Standard Quantityx Standard Price
(SQ) x (SP)
MaterialsQuantityVariance
(MQV)
=_
The materials quantity variance is determinedfrom the following formula. For Xonic, Inc.,the materials quantity variance is $600 calculated as follows:
(4,200 x $3.00) - (4,000 x $3.00) = $600 U

Summary of Materials Variance
Materials price variance $ 420 U
Materials quantity variance 600 U
Total materials variance $1,020 U
The total materials variance of $1,020 (U), therefore,consists of thefollowing:

Matrix for Direct Materials Variance

Causes of Materials Variances
• Internal and external factors
• Materials price variance• begins in the purchasing department• variance may be beyond the control of purchasing
• Materials quantity variance– is in the production department.– variance may be beyond the control of production

Formula for Total Labor Variance
Actual Hoursx Actual Rate(AH) x (AR)
Standard Hoursx Standard Rate
(SH) x (SR)
Total LaborVariance
(TLV)=
_
In completing the Weed-O order, Xonic, Inc., incurred 2,100 direct labor hours at an average hourly rate of $9.80. The standard hours allowed for the units produced were 2,000 hours (1,000 units x 2 hours) and the standard rate was $10 per hour. The total labor variance is obtained from the following formula:
(2,100 x $9.80) - (2,000 x $10,00) = $580 U

Formula for Labor Price Variance
Actual Hoursx Actual Rate(AH) x (AR)
Actual HoursX Standard Rate
(AH) x (SR)
Labor PriceVariance
(LPV)=
_
The formula for the labor price variance is as follows.Xonic’s labor price variance is $420 ($20,580 - $21,000)favorable as shown below:
(2,100 x $9.80) - (2,100 x $10.00) = $420 F

Formula forLabor Quantity Variance
Actual Hoursx Standard Rate
(AH) x (SR)
Standard Hoursx Standard Rate
(SH) x (SR)
LaborQuantityVariance
(LQV)
=_
The labor quantity variance is derived from thefollowing formula. For Xonic, Inc., the laborquantity variance is $1,000 ($21,000 - $20,000) unfavorable:
(2,100 x $10.00) - (2,000 x $10.00) = $1,000 U
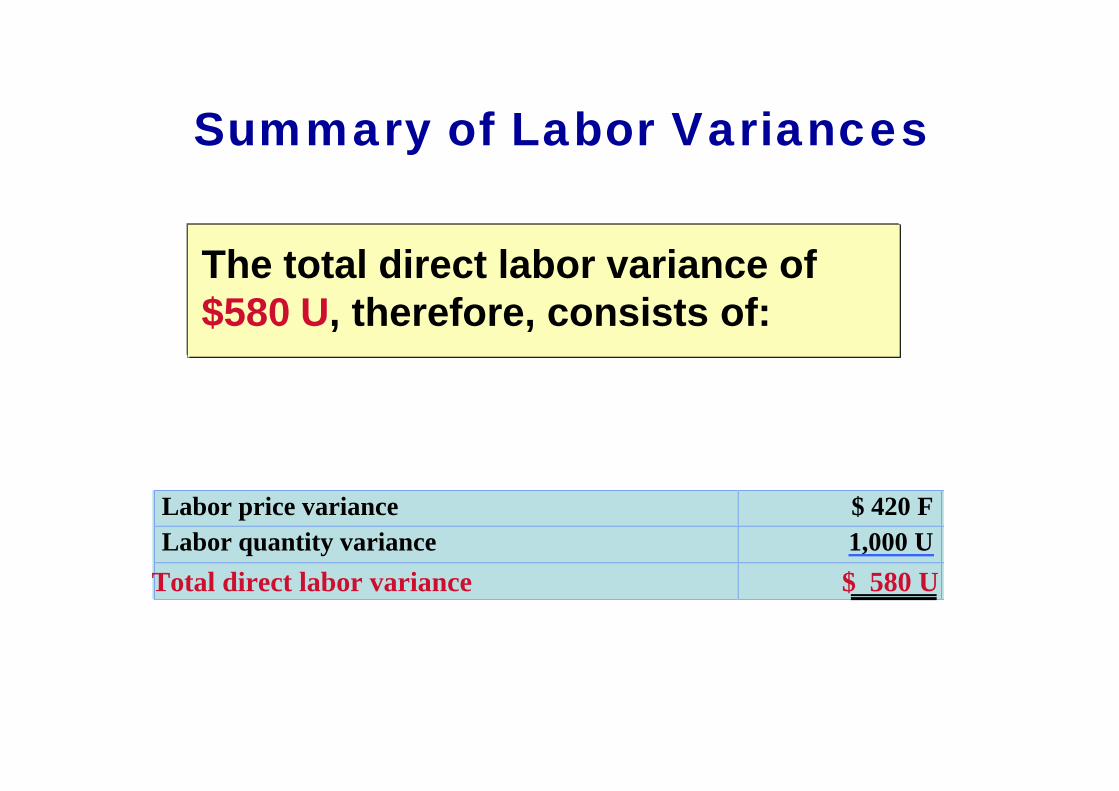
Summary of Labor Variances
Labor price variance $ 420 F
Labor quantity variance 1,000 U
Total direct labor variance $ 580 U
The total direct labor variance of $580 U, therefore, consists of:

Matrix for Direct Labor Variances

Actual Overhead CostsSTUDY OBJECTIVE 5
Variable overhead $6,500
Fixed overhead 4,400
Total actual overhead $10,900
The total overhead variance is the differencebetween actual overhead costs and overhead costs applied to work done. As indicatedearlier, manufacturing overhead costs incurredwere $10,900, as follows:

Formula for Total Overhead Variance
Actual Overhead
OverheadApplied basedon Standard
Hours Allowed
Total OverheadVariance
=_
With standard costs, manufacturing overhead costs areapplied to work in process on the basis of the standard hours allowed for the work done. Standard hours allowed are the hours that should have been worked for the units produced. For the Weed-O order, the standard hours allowed are 2,000. The predetermined overhead rate is $5 per direct labor hour. Thus, overhead applied is $10,000.The formula for the total overhead variance is:
$10,900 - $10,000 = $900 U

Formula for OverheadControllable Variance
Actual Overhead
OverheadBudgeted based
on Standard Hours Allowed
OverheadControllable
Variance
=_
The formula for the Overhead Controllable Variance is shown below. For Xonic, Inc., theoverhead controllable variance is $500unfavorable :
$10,900 - $10,400 = $500 U

For Xonic Inc., the overhead volume variance is $400 unfavorable as shown below:
$10,400 - $10,000 = $400 U
Formula for OverheadVolume Variance
OverheadBudgeted based
on StandardHours Allowed
Overhead Applied basedon Standard
Hours Allowed
Overhead Volume
Variance=
_
The Overhead Volume Variance indicates whether plant facilities were efficiently used during the period. The formula for computing the volume variance is as follows:

Flexible Budget Using Standard Direct Labor
Hours

The analysis shows that the overhead volume variance relates solely to the fixed costs (fixed costs budgeted $4,400 - fixed costs applied $4,000). Thus the volume variance measures the amount that fixed overhead costsare under- or overapplied.
Detailed Analysis of Overhead Volume Variance
Overhead budgeted
Variable costs $6,000
$10,400
Overhead applied
Variable costs (2,000 x $3) 6,000
10,000
Overhead volume variance - unfavorable $400
Fixed costs 4,400
Fixed costs (2,000 x $2) 4,000
An analysis of the volume variance shows that of the budgeted overhead of $10,400, $6,000 of that amount is variable and $4,400 is fixed. The predetermined rate of $5 (obtained in Illustration 26-6) consists of $3 variable and $2 fixed.

Alternative Formula forOverhead Volume Variance
FixedOverhead
Rate
Normal CapacityHours - StandardHours Allowed
Overhead VolumeVariance
=X
An alternative formula for computing the volume variance isshown below. In Xonic, Inc., normal capacity is 26,400 hoursfor the year or 2,200 hours for a month (26,400/12), and the fixedoverhead rate is $2 per hour. Thus, the volume variance is $400unfavorable as shown below:
$2 x (2,200 - 2,000 ) = $400 U

Summary of Overhead Variance
The total overhead variance of $900 unfavorable for Xonic, Inc.consists of the following:
Overhead controllable variance $500 U
Overhead volume variance 400 U
Total overhead variance 900 U

Matrix for Manufacturing Overhead Variance

Reporting VariancesSTUDY OBJECTIVE 6
• All variances should be reported to appropriate levels of management as soon as possible so that corrective action can be taken.
• The form, content, and frequency of variance reports vary considerably among companies.
• Variance reports facilitate the principle of “management by exception”.– In using variance reports, top management normally looks
for significant variances.

Standard Cost Accounting System
STUDY OBJECTIVE 7
• Double-entry system of accounting – standard costs in making entries and variances
– recognized in the accounts
• A standard cost, job order cost accounting system includes two important assumptions:
1) Variances from standards are recognized at the earliest opportunity
2) Work in Process account is maintained exclusively on the basis of standard costs.

Raw Material inventoryMaterials Price Variance Accounts Payable (To record purchase of materials)
Standard Cost SystemJournal Entry #1
12,600 420
13,020
Purchased raw materials on account for$13,020 when the standard cost is $12,600.
The inventory account is debited for actual quantities at standard cost. This enables the perpetual materials records to show actual quantities. The price variance, which is unfavorable, is debited to Materials Price Variance.

Factory Labor Labor Price Variance Wages Payable (To record direct labor costs)
Standard Cost SystemJournal Entry #2
21,000 420
20,580
Incur direct labor costs of $20,580 when the standard labor cost is $21,000.
Like the raw materials inventory account, Factory Labor is debited for theactual hours worked at the standard hourly rate of pay. In this case, the labor variance is favorable. Thus, Labor Price Variance is credited.

Manufacturing Overhead Accounts Payable/Cash/Acc. Depr (To record overhead incurred)
Standard Cost SystemJournal Entry #3
10,900 10,900
Incur actual manufacturing overheadcosts of $10,900.
The controllable overhead variance is not recorded at this time. Itdepends on standard hours applied to work in process.This amountis not known at the time overhead is incurred.

Work in Process InventoryMaterials Quantity Variance Raw Materials Inventory (To record issuance of raw materials)
Standard Cost SystemJournal Entry #4
12,000600
12,600
Issue raw materials for production at a cost of $12,600 when the standard costis $12,000.
Work in Process Inventory is debited for standard materials quantities used at standard prices. The variance account is debited because the variance is unfavorable. Raw Materials Inventory iscredited for actual quantities at standard prices.

Work in Process InventoryLabor Quantity Variance Factory Labor (To assign factory labor to jobs)
Standard Cost SystemJournal Entry #5
20,0001,000
21,000
Assign factory labor to production at a cost of $21,000 when standard cost is $20,000.
Work in Process Inventory is debited for standard hours at standard rates,and the unfavorable variance is debited to Labor Quantity Variance. The credit to Factory Labor produces a zero balance in this account.

Work in Process Inventory Manufacturing Overhead (To assign overhead to jobs)
Standard Cost SystemJournal Entry #6
10,00010,000
Applying manufacturing overhead toproduction, $10,000.
Work in Process Inventory is debited for standard hours allowed multiplied by the standard overhead rate.

Finished Goods Inventory Work in Process Inventory (To record transfer of completed
work to finished goods)
Standard Cost SystemJournal Entry #7
42,00042,000
Transfer completed work to finished goods, $42,000.
Both inventory accounts are at standard cost.

Cost of Goods Sold is debited at standard cost. Grossprofit, in turn, is the difference between sales and the standard cost of goods sold.
Accounts ReceivableCost of Goods Sold Sales
Finished Goods Inventory
(To record sale of finished goodsand the cost of goods sold)
Standard Cost SystemJournal Entry #8
60,000 42,000
60,000 42,000
The 1,000 gallons of Weed-O are sold for$60,000.

Prior to this entry, a debit balance of $900 existed in Manufacturing Overhead. This entry therefore produces a zero balance in the Manufacturing Overhead account.
Overhead Controllable VarianceOverhead Volume Variance Manufacturing Overhead
(To recognize overhead variances)
Standard Cost SystemJournal Entry #9
500 400
900
Recognize unfavorable overhead variances: controllable, $500; volume, $400.

Statement Presentation of Variances
• Income statements prepared for management– cost of goods sold is stated at standard cost and the
variances are separately disclosed.
• Financial statements prepared for stockholders and other external users– standard costs may be used when there are no
significant differences between actual costs and standard costs.

Variances in Income Statement for Management
XONIC, INC.Income Statement
For the Month Ended June 30, 2002Sales $60,000Cost of goods sold (at standard) 42,000Gross profit (at standard) 18,000
Gross profit (actual) 15,500Selling and administrative expenses 3,000Net Income $12,500
Variances
Materials price $ 420 Materials quantity 600 Labor Price (420) Labor quantity 1,000 Overhead controllable 500 Overhead volume 400
Total variance unfavorable 2,500
Notice thatvariancesfrom standardcosts in this examplereduced net income by $2,500.

The setting of standards is:
a. a managerial accounting decision.
b. a management decision.
c. a worker decision.
d. preferably set at the ideal level of performance.

The setting of standards is:
a. a managerial accounting decision.
b. a management decision.
c. a worker decision.
d. preferably set at the ideal level of performance.

Incremental Analysis and Incremental Analysis and Capital BudgetingCapital Budgeting
Chapter 27Chapter 27
Accounting Principles, 7Accounting Principles, 7thth EditionEdition
Weygandt Weygandt •• Kieso Kieso •• KimmelKimmel
Prepared by Naomi KarolinskiPrepared by Naomi KarolinskiMonroe Community CollegeMonroe Community College
andand
Marianne BradfordMarianne BradfordBryant CollegeBryant College

CHAPTER 27INCREMENTAL ANALYSISAND CAPITAL BUDGETING
After studying this chapter, you should be able to:
1 Identify the steps in management’s decision-making process.
2 Describe the concept of incremental analysis.
3 Identify the relevant costs in accepting an order at a special price.
4 Identify the relevant costs in a make-or-buy decision.
5 Give the decision rule for whether to sell or process materials further.
6 Identify the factors to be considered in retaining or replacing equipment.

CHAPTER 27INCREMENTAL ANALYSISAND CAPITAL BUDGETING
7 Explain the relevant factors in deciding whether to eliminate an unprofitable segment.
8 Determine which products to make and sell when a company’s resources are limited.
9 Contrast the annual rate of return and cash payback techniques in capital budgeting.
10 Distinguish between the net present value and internal rate of return methods.
After studying this chapter, you should be able to:

Management’s Decision-Making Process
Study Objective 1
Management's decision-making process frequently involves the following steps:
1) Identify the problem and assign responsibility
2) Determine and evaluate possible
courses of action
3) Make a decision
4) Review results of the decision
Incremental AnalysisStudy Objective 2
• Business decisions involve a choice among alternative courses of action.
• In making such decisions, management ordinarily considers both financial and nonfinancial information.
• The process used to identify the financial data that change under alternative courses of action is called incremental analysis.

Incremental Analysis
• Incremental analysis includes the probable effects of the decision on future earnings.
• Data for incremental analysis involves estimates and uncertainty.
• Gathering data may involve market analysts, engineers, and accountants.
• In incremental analysis, both costs and revenues may change. However, in some cases:
– (1) variable costs may not change under the alternative courses of action, and
– (2) fixed costs do change

Basic Approach in Incremental Analysis
Alternative A
Alternative B
Net IncomeIncrease (Decrease)
Revenues $125,000 $110,000
Costs 100,000 80,000
Net income $ 25,000 $ 30,000
$(15,000)
20,000
$ 5,000
The basic approach in incremental analysis isillustrated in the following example:
In this example, alternative B is being compared with alternative A.The net income column shows the differences between thealternatives. Alternative B will produce $5,000 more net incomethan alternative A.
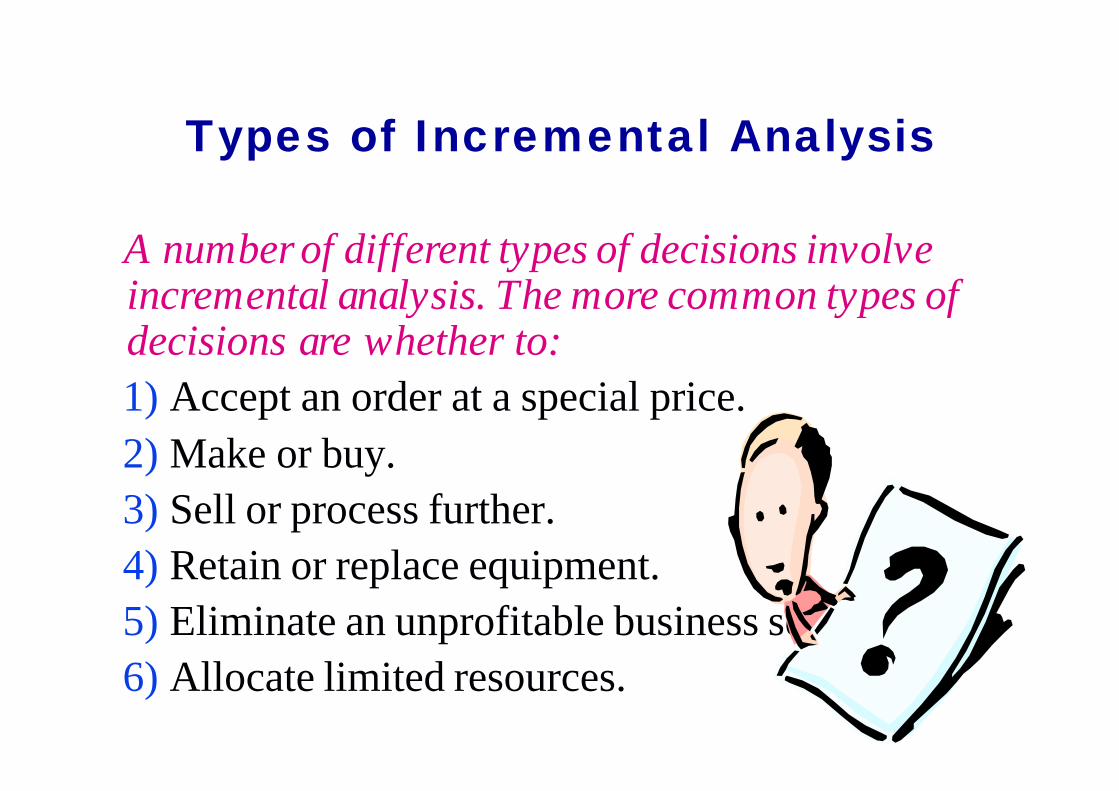
Types of Incremental Analysis
A number of different types of decisions involve incremental analysis. The more common types of decisions are whether to:
1) Accept an order at a special price.
2) Make or buy.
3) Sell or process further.
4) Retain or replace equipment.
5) Eliminate an unprofitable business segment.
6) Allocate limited resources.

Accept an Order at a Special Price
Study Objective 3
• Sometimes, a company may have an opportunity to obtain additional business if it is willing to make major price concessions to a specific customer.
• An order at a special price should be accepted when the incremental revenue from the order exceeds the incremental costs.
• It is assumed that sales in other markets will not be affected by the special order.
• If the units can be produced within existing plant capacity, generally only variable costs will be affected.

Accept an Order at aSpecial Price
To illustrate, assume that Sunbelt Companyproduces 100,000 automatic blenders per month, which is 80% of plant capacity.Variable manufacturing costs are $8 perunit, and fixed manufacturing costs are$400,000, or $4 per unit. The blenders arenormally sold to retailers at $20 each.
PROBLEM:Sunbelt has an offer from Mexico Co. to purchase an additional 2,000 blenders at $11 per unit. Acceptance of this offer would not affect normal sales of the product, and the additional units can be manufactured without increasing plant capacity.

RejectOrder
AcceptOrder
Net IncomeIncrease
(Decrease)Revenues $-0- $22,000Costs -0- 16,000
Net income $-0- $ 6,000
$22,000 (16,000)
$6,000
Incremental Analysis-Accepting an Order at a Special Price
If management makes its decision on the basis of total cost per unit of $12 ($8 + $4), the order would be rejected, because costs ($12) would exceed revenues ($11) by $1 per unit. However, since the units can be produced within existing plant capacity, the special order WILL NOT INCREASE FIXED COSTS. The relevant data for the decision, therefore, are the variable manufacturing costs per unit of $8 and the expected revenue of $11 per unit.
DECISION: Sunbelt should accept the special order because it will increase its net income by $6,000.

Make or BuyStudy Objective 4
• In a make or buy decision, management must determine the costs which are different under the two alternatives.
• If there is an opportunity to use the productive capacity for another purpose, opportunity cost should be considered.
• Opportunity cost is the potential benefit that may be obtained by following an alternative course of action. This cost is an additional cost of making the component.

Direct materials $ 50,000 Direct labor 75,000
Variable manufacturing overhead 40,000 Fixed manufacturing overhead 60,000 Total manufacturing costs $ 225,000
To illustrate the analysis, assume that Baron Co.incurs the following annual costs in producing25,000 ignition switches for motor scooters.
Annual Product Cost Data
Total cost per unit ($225,000 / 25,000) $9.00
Alternatively, Baron may purchasethe ignition switches from Ignition,Inc. at a price of $8 per unit. PROBLEM:What should management do?

Make Buy Net IncomeIncrease (Decrease)
Direct materials $50,000 $ -0-
Direct labor 75,000 -0-
Variable manufacturing costs 40,000 -0-
Fixed manufacturing costs 60,000 50,000Purchase price (25,000x $8) -0- 200,000
Total annual cost $225,000 $250,000
Incremental Analysis-Make or Buy
$50,000 75,000 40,000 10,000
(200,000)
$ (25,000)
At first glance, it appears that management should buy the switchesfor $8 instead of make for $9. However, a review of operationsindicates that if the switches are purchased all of Baron’s variablecosts but only $10,000 of its fixed manufacturing costs will beeliminated. Thus, $50,000 of fixed costs will remain. The incrementalcosts are shown below:
DECISION:This analysis shows that Baron Co. will incur $25,000 of additional cost by buying the switches. Therefore, Baron will continue to make the switches.

Assume that through buying the switches, Baron Co.can use the released productive capacity to generateadditional income of $28,000. This lost income is anadditional cost of continuing to make the switches inthe make-or-buy decision. This opportunity cost isadded to the “Make” column, for comparison.As shown, it is now advantageous to buy the switches.
Make Buy Net IncomeIncrease (Decrease)
Total annual cost $225,000 $250,000 $(25,000)
Total cost $253,000 $250,000 $ 3,000
Incremental Analysis-Make or Buy, with Opportunity Cost
28,000-0-Opportunity cost 28,000

In a make-or-buy decision, relevant costs are:
a. manufacturing costs that will be saved.
b. the purchase price of the units.
c. opportunity costs.
d. all of the above.
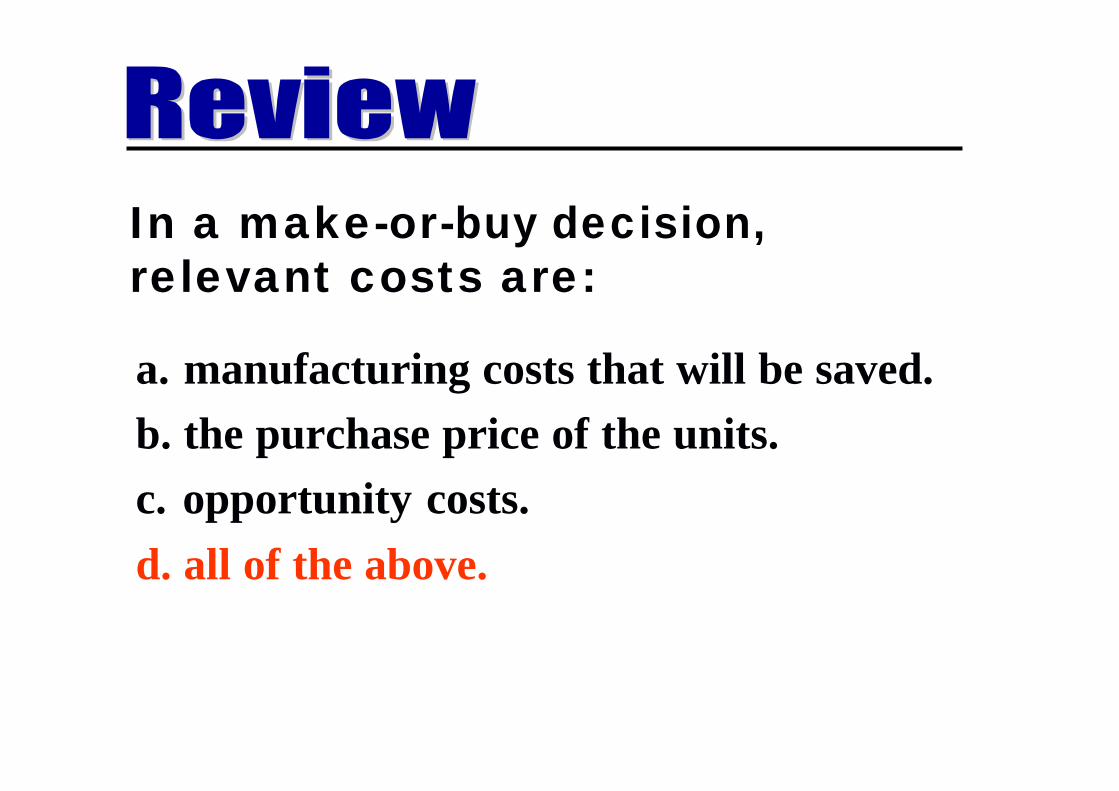
In a make-or-buy decision, relevant costs are:
a. manufacturing costs that will be saved.
b. the purchase price of the units.
c. opportunity costs.
d. all of the above.

Sell or Process FurtherStudy Objective 5
• The basic decision rule in a sell or process further decision is:
• Process further as long as the incremental revenue from such processing exceeds the incremental processing costs.
• Incremental revenue is the increase in sales which results from processing the product further.

Assume that Woodmasters Inc. makes tables. The cost to manufacture an unfinished table is $35, computed as follows:
Per Unit Cost of Unfinished Table
Direct material $15Direct labor 10Variable manufacturing overhead 6
Fixed manufacturing overhead 4
Manufacturing cost per unit $35

Incremental Analysis-Sell or Process Further
Sell ProcessFurther
Net IncomeInc.(Decrease)
Sales $50.00 $60.00 $10.00
Cost per unit
Direct materials 15.00 17.00 (2.00)
Direct labor 10.00 14.00 (4.00)
Variable MOH 6.00 8.40 (2.40)
Fixed MOH 4.00 4.00 -0-
Total $35.00 $43.40 $(8.40)
Net income/unit $15.00 $16.60 $ 1.60
The selling price per unfinished unit is $50. Woodmasters currently hasunused productive capacity that can be used to finish the tables and sell them for $60 each. For a finished table direct materials will increase $2 and direct labor costs will increase $4. Variable overhead will increase by $2.40 (60% of direct labor). There will be no increase in fixed overhead. The incremental analysis on a per unit basis is as follows:
DECISION:Woodmastersshould process the tables further because incremental revenue is higher than incremental processing costs.

Retain or Replace Equipment
Study Objective 6
• In a decision to retain or replace equipment, management compares the costs which are affected by the two alternatives. Generally, these are variable manufacturing costs and the cost of the new equipment.
• The book value of the old machine is a sunk cost which does not affect the decision. A sunk cost is a cost that cannot be changed by any present or future decision.
• Any trade-in allowance or cash disposal value of the existing asset must be considered.

Retain Equipment Replace Equipment
Net Income Increase (Decrease)
Variablemanufacturingcosts
$640,000 (4 yearsx $160,000)
$500,000 (4 years x$125,000)
New machine cost -0- 120,000
Total $640,000 $620,000
Retain or Replace Equipment
Assume that Jeffcoat Company has a factory machine with a book value of $40,000 and a remaining useful life of four years. A new machine is available that costs $120,000 and is expected to have zero salvage value at the end of its 4-year useful life. If the new machine is acquired, variablemanufacturing costs are expected to decrease from $160,000 to $125,000 annually and the old unit will be scrapped. The incremental analysis for the 4-year period is as follows:
$140,000
(120,000)$20,000

Retain or Replace Equipment
DECISION:
• In this case, it would be to the company’s advantage to REPLACE the equipment.
• The lower variable manufacturing costs due to replacement more than offset the cost of the new equipment.
• The sunk cost, the book value of the old machine does not affect the decision.

Eliminate an Unprofitable Segment
Study Objective 7
• In deciding whether to eliminate an unprofitable segment, management should choose the alternative which results in the highest net income.
• Often fixed costs allocated to the unprofitable segment must be absorbed by the other segments.
• It is possible, therefore, for net income to decrease when an unprofitable segment is eliminated.

Pro Master Champ Total
Sales $800,000 $300,000 $1,200,000
Variable expense 520,000 210,000 820,000
Contribution margin 280,000 90,000 380,000Fixed Expenses 80,000 50,000 160,000Net income $200,000 $ 40,000 $ 220,000
Assume that Martina Company manufactures tennis racquets in three models: Pro, Master, and Champ.Pro and Master are profitable lines, whereas Champoperates at a loss. Condensed income statement data are:
Segment Income Data
$ 100,000 90,000 10,000 30,000
$(20,000)

Pro Master Total
Sales $800,000 $300,000 $1,100,000Variable expense 520,000 210,000 730,000Contribution margin 280,000 90,000 370,000Fixed Expenses 160,000Net income $180,000 $ 30,000
Income Data after Eliminating Unprofitable
Product Line
100,000 60,000$210,000
Total net incomehas decreased$10,000:($220,000 -$210,000)
Although it appears that income wouldincrease if the Champ line was discontinued,it is possible for income to decrease ifChamp was discontinued. The reason is thatthe fixed expense allocated to Champ willhave to be absorbed by the other products.To illustrate, assume that the $30,000 of fixed costs are allocated 2/3 to Pro and 1/3to Master. The revised income statement is:
PROBLEM:
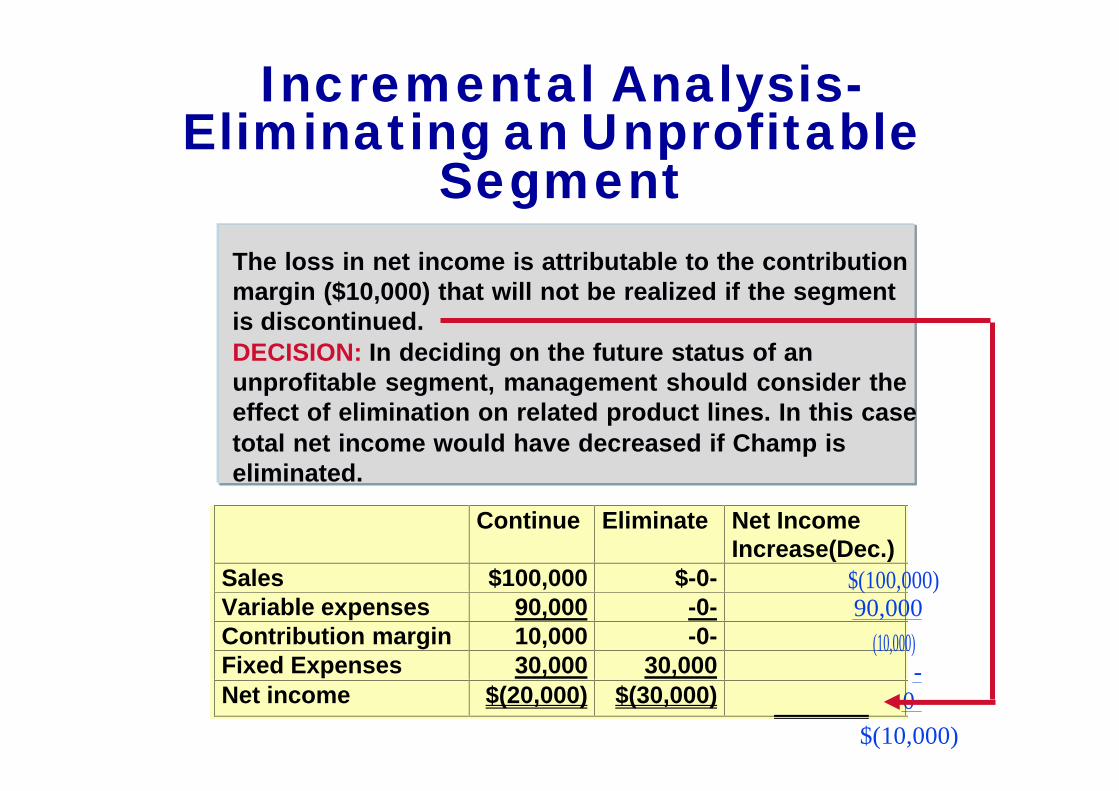
Incremental Analysis-Eliminating an Unprofitable
Segment
Continue Eliminate Net IncomeIncrease(Dec.)
Sales $100,000 $-0-Variable expenses 90,000 -0-Contribution margin 10,000 -0-Fixed Expenses 30,000 30,000Net income $(20,000) $(30,000)
$(100,000) 90,000
(10,000) --0
$(10,000)
The loss in net income is attributable to the contributionmargin ($10,000) that will not be realized if the segmentis discontinued.DECISION: In deciding on the future status of anunprofitable segment, management should consider the effect of elimination on related product lines. In this casetotal net income would have decreased if Champ iseliminated.

Allocate Limited ResourcesStudy Objective 8
• When a company has limited resources (floor space, raw materials, or machine hours), management must decide which products to make and sell.
• In an allocation of limited resources decision, it is necessary to find the contribution margin per unit of limited resource.
• This is obtained by dividing the contribution margin per unit ofeach product by the number of units of the limited resource required for each product.
• Production should be geared to the product with the highest contribution margin per unit of limited resource.

Deluxe Sets Standard Sets
Contribution margin per unit $8 $6
Machine hours required 4 2
Contribution Margin per Unit of Limited Resource
• To illustrate, assume that Collins Co. manufactures deluxe and standard pen and pencil sets.
• The limited resource is machine capacity, which is 3,600 hours per month.
• Based on the data below, it would appear that deluxe is more profitable since they have a higher contribution margin.
• However, standard sets take fewer machine hours.
• Therefore, it is necessary to find the contribution margin per unit of limited resource.

Contribution Margin per Unit of Limited Resource
Deluxe Sets Standard Sets
Contribution margin per unit (a) $8 $6
Machine hours required (b) 4 2
Contribution margin per unitOf limited resource (a)/(b) $2 $3
The computation shows that the standard sets have a higher contribution margin per unit of limited resource.

Incremental Analysis-Computation
of Total Contribution Margin• If Collins Co. can increase machine capacity from 3,600
hours to 4,200 hours, the additional 600 hours could be used to produce either the standard or deluxe pen and pencil sets.
• The total contribution margin under each alternative is found by multiplying the machine hours by the contribution margin per unit of limited resource as shown below:
ProduceDeluxe
Sets
ProduceStandard
SetsMachine hours (a) 600 600
Contribution margin per unitof limited resource (b) $2 $3
Contribution margin (a) x (b) $1,200 $1,800
DECISION:From this analysis,we can see that tomaximize net income,all of the increasedcapacity should be used to make and sellthe standard sets.

Capital Budgeting
• The process of making capital expenditure decisions is known as capital budgeting.
• The three most commonly used capital budgeting techniques are
(a) annual rate of return,
(b) cash payback, and
(c) discounted cash flow.

Sales $200,000
Less: Costs and expenses Manufacturing costs (exclusive of depreciation) Depreciation expense ($130,000 / 10) Selling and administrative expenses
$145,000 13,000 22,000 180,000
Income before income taxes 20,000
Income tax expense 7,000
Net income $ 13,000
Estimated Annual Net Income from Capital
Expenditure
Assume that Tappan Co. is considering an investment of $130,000 in new equipment. The new equipment is expected to last 10 years. It will have zero salvage value at the end of its useful life. The straight-line method of depreciation is used for accounting purposes. The expected annual revenues and costs of the new product that will be produced from the investment are:

• The annual rate of return technique is based on accounting data. It indicates the profitability of a capital expenditure. The formula is:
Annual Rate of Return Formula
Study Objective 9
The annual rate of return is compared with its requiredminimum rate of return for investments of similar risk. This minimum return is based on the company’s cost of capital,which is the rate of return that management expects to pay onall borrowed and equity funds.

Formula for Computing Average Investment
For Tappan, average investment is $65,000: [($130,000 + $0)/ 2]
Expected annual net income ($13,000) is obtained fromthe projected income statement. Average investment isderived from the following formula:

Solution to Annual Rate of Return Problem
$13,000 / $65,000 = 20%
The expected annual rate of return for Tappan Company’s investment in new equipment is therefore 20%, computedas follows:
The decision rule is: A project is acceptable if its rate of return is greater than management’s minimum rate of return. It is unacceptable when the reverse is true. When
choosing among several acceptable projects, the higher the rate of returnfor a given risk, the more attractive the investment.

Cash Payback Formula
The cash payback technique identifies the time period required to recover the cost of the capital investment fromthe annual cash inflow produced by the investment. The formula for computing the cash payback period is:

Net income $13,000
Add: Depreciation expense 13,000
Computation of Annual Cash Inflow
In the Tappan Company example, annual cash inflow is $26,000 as shown below:
Annual cash inflow $26,000
Annual (or net) cash inflow is approximated by taking net income and adding back depreciation expense. Depreciation expense is added back because depreciation on the capital expendituredoes not involve an annual outflow of cash.

Cash Payback Period
$130,000 $26,000 5 years/ =
The cash payback period in this example is therefore 5 years, computed as follows:
When the payback technique is used to decide among acceptable alternative projects, the shorter the payback period, the more attractive the investment. This is true for two reasons:1) the earlier the investment is recovered, the sooner the cash funds can be used for other purposes, and2) the risk of loss from obsolescence and changed economic conditions is less in a shorter payback period.

Discounted Cash FlowStudy Objective 10
• The discounted cash flow technique is generally recognized as the best conceptual approach to making capital budgeting decisions.
• This technique considers both the estimated total cash inflows and the time value of money.
• Two methods are used with the discounted cash flow technique:
1) net present value and
2) internal rate of return

Net Present Value Method
• Under the net present value method, cash inflows are discounted to their present value and then compared with the capital outlay required by the investment.
• The interest rate used in discounting the future cash inflows is the required minimum rate of return.
• A proposal is acceptable when NPV is zero or positive.
• The higher the positive NPV, the more attractive the investment.

Net Present Value Decision Criteria

Present Value of Annual Cash Inflows-Equal Annual
cash Flows
Present Values atDifferent Discount Rates
Discount factor for 10 periods 12% 15%
Present value of cash inflows: 5.65022 5.01877
$26,000 x 5.65022
$26,000 x 5.01877$146,906
$130,488
Tappan Company’s annual cash inflows are $26,000. If we assumethis amount is uniform over the asset’s useful life, the present valueof the annual cash inflows can be computed by using the presentvalue of an annuity of 1 for 10 periods. The computations at ratesof return of 12% and 15%, respectively are:

Computation of Net Present Values
12% 15%
Present value of future cash inflows: $146,906 $130,488
Capital investment 130,000 130,000
Positive (negative) net present value $16,906 $488
The proposed capital expenditure is acceptable at a required rate of
return of both 12% and 15% because the net present values are positive.
The analysis of the proposal by the net present value method is as follows:
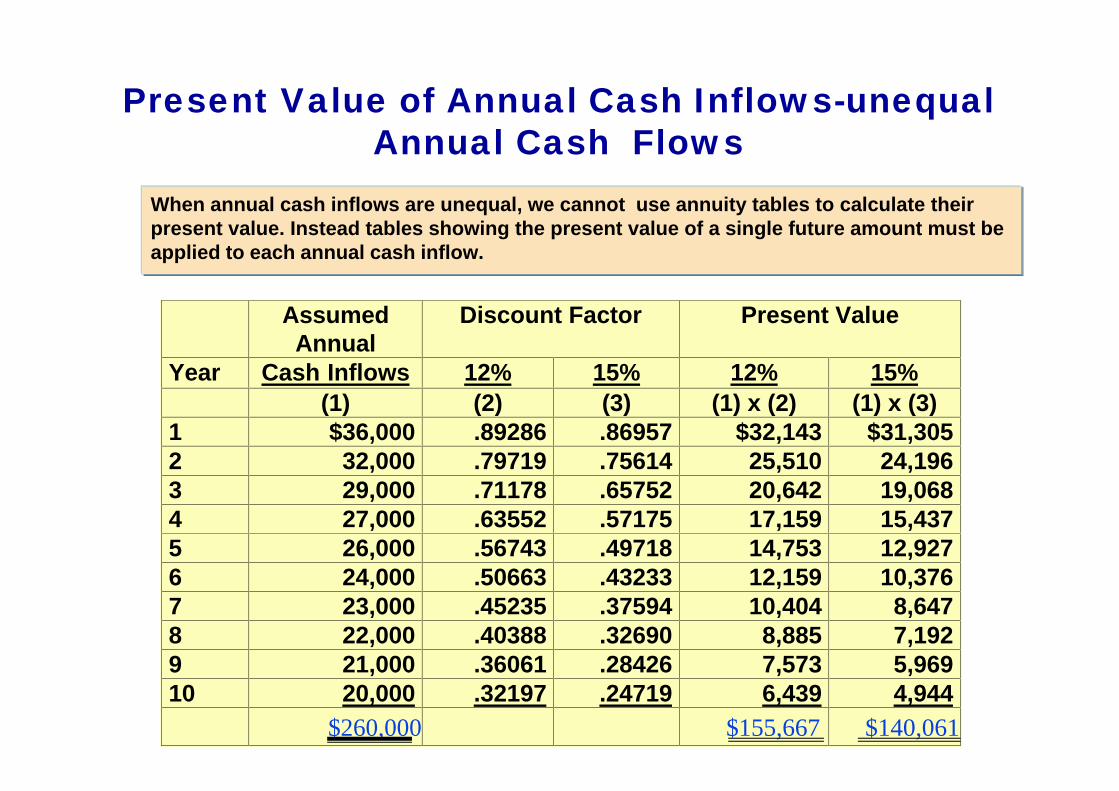
Present Value of Annual Cash Inflows-unequal Annual Cash Flows
When annual cash inflows are unequal, we cannot use annuity tables to calculate their present value. Instead tables showing the present value of a single future amount must be applied to each annual cash inflow.
AssumedAnnual
Discount Factor Present Value
Year Cash Inflows 12% 15% 12% 15%
(1) (2) (3) (1) x (2) (1) x (3)1 $36,000 .89286 .86957 $32,143 $31,3052 32,000 .79719 .75614 25,510 24,1963 29,000 .71178 .65752 20,642 19,0684 27,000 .63552 .57175 17,159 15,4375 26,000 .56743 .49718 14,753 12,9276 24,000 .50663 .43233 12,159 10,3767 23,000 .45235 .37594 10,404 8,6478 22,000 .40388 .32690 8,885 7,1929 21,000 .36061 .28426 7,573 5,96910 20,000 .32197 .24719 6,439 4,944
$260,000 $155,667 $140,061

Analysis of Proposal Using Net Present Value Method
12% 15%
Present value of future cash inflows: $155,667 $140,061
Capital investment 130,000 130,000
Positive (negative) net present value $ 25,667 $10,061
Therefore, the analysis of the proposal by the net present value method is as follows:
In this example, the present values of the cash inflowsare greater than the $130,000 capital investment. Thusthe project is acceptable at both a 12% and 15%required rate of return.

Formula for Internal Rate of Return Factor
• The internal rate of return method finds the interest yield of the potential investment.
• This is the interest rate that will cause the present value of the proposed capital expenditure to equal the present value of the expected annual cash inflows.
• Determining the true interest rate involves two steps:
STEP 1.Compute the internal rate of return factor using this formula:

Internal Rate of Return Method
$130,000 / $26,000 = 5.0
The computation for the Tappan Company,assuming equal annual cash inflows is:

Internal Rate of Return Method
STEP 2. Use the factor and the present value of an annuity of 1 table to find the internal rate of return.
• The internal rate of return is found by locating the discount factor that is closest to the internal rate of return factor for the time period covered by the annual cash flows.
• For Tappan Co., the annual cash flows are expected to continue for 10 years. In the table below, the closest discount factor to 5.0 is 5.01877, which represents an interest rate of approximately 15%.
TABLE 2PRESENT VALUE OF AN ANNUITY OF 1
(N)Periods
5% 6% 8% 9% 10% 11% 12% 15%
10 7.72173 7.36009 6.71008 6.41766 6.14457 5.88923 5.65022 5.01877

Internal Rate of Return Decision Criteria
The decision rule is: Accept the project when the internal rate of return is equal to or greater than the required rate of return. Reject the project
when the internal rate of return is less than the required rate.

Comparison of Discounted Cash Flow Methods
• In practice, the internal rate of return and cash paybackmethods are most widely used.
• A comparative summary of the two discounted cash flow methods-net present value and internal rate of return- is presented below:
Item Net Present Value Internal Rate of Return
1. Objective Compute netpresent value
Compute internal rate ofreturn
2. Decision rule If net presentvalue is zero orpositive, acceptthe proposal; ifnet present valueis negative, rejectthe proposal
If internal rate of returnis equal to ro greaterthan the minimumrequired rate of return,accept the proposal; ifinternal rate of return isless than the minimumrate, reject the proposal.

If the contribution margin per unit is $15 and it takes 3.0 machine hours to produce theunit, the contribution margin per unit of limited resource is:
a. $25.
b. $5.
c. $45.
d. No correct answer is given.

If the contribution margin per unit is $15 and it takes 3.0 machine hours to produce theunit, the contribution margin per unit of limited resource is:
a. $25.
b. $5.
c. $45.
d. No correct answer is given.

COPYRIGHT
Copyright © 2005 John Wiley & Sons, Inc. All rights reserved. Reproduction or translation of this work beyond that permitted in Section 117 of the 1976 United States Copyright Act without the express written consent of the copyright owner is unlawful. Request for further information should be addressed to the Permissions Department, John Wiley & Sons, Inc. The purchaser may make back-up copies for his/her own use only and not for distribution or resale. The Publisher assumes no responsibility for errors, omissions, or damages, caused by the use of these programs or from the use of the information contained herein.