Acclimation of isoprene emission and photosynthesis to growth temperature in hybrid aspen: resolving...
45
This article is protected by copyright. All rights reserved. 1 Acclimation of isoprene emission and photosynthesis to growth temperature in 1 hybrid aspen: resolving structural and physiological controls 1 2 3 4 Bahtijor Rasulov 1,2 , Irina Bichele 3 , Katja Hüve 2 , Vivian Vislap 2 and Ülo Niinemets 2,4,5 5 6 1 Institute of Technology, University of Tartu, Nooruse 1, Tartu 50411, Estonia 7 2 Institute of Agricultural and Environmental Sciences, Estonian University of Life Sciences, 8 Kreutzwaldi 1, 51014 Tartu, Estonia 9 3 Institute of Molecular and Cell Biology, University of Tartu, Riia 23 Tartu 51010, Estonia 10 4 Estonian Academy of Sciences, Kohtu 6, 10130 Tallinn, Estonia 11 5 Author for correspondence, e-mail: [email protected], Fax: 003727313738 12 13 Running head: Structurally dominated temperature acclimation 14 15 Summary statement: High growth temperature reduced area-based photosynthetic and isoprene 16 emission characteristics in hybrid aspen, and these effects were primarily driven by structural 17 modifications. Acclimation to high temperature also enhanced stomatal conductance, improved 18 heat resistance of photosynthetic apparatus and increased the activation energy of isoprene 19 emission resulting in a greater fraction of photosynthetic carbon emitted as isoprene at higher 20 temperatures. These results emphasize the important roles of both leaf structural and 21 physiological changes in high-temperature acclimation of photosynthesis and isoprene emission. 22 23 This article has been accepted for publication and undergone full peer review but has not been through the copyediting, typesetting, pagination and proofreading process, which may lead to differences between this version and the Version of Record. Please cite this article as doi: 10.1111/pce.12435 Accepted Article
Transcript of Acclimation of isoprene emission and photosynthesis to growth temperature in hybrid aspen: resolving...

This article is protected by copyright. All rights reserved. 1
Acclimation of isoprene emission and photosynthesis to growth temperature in 1
hybrid aspen: resolving structural and physiological controls1 2
3
4
Bahtijor Rasulov1,2
, Irina Bichele3, Katja Hüve
2, Vivian Vislap
2 and Ülo Niinemets
2,4,5 5
6
1 Institute of Technology, University of Tartu, Nooruse 1, Tartu 50411, Estonia
7
2 Institute of Agricultural and Environmental Sciences, Estonian University of Life Sciences, 8
Kreutzwaldi 1, 51014 Tartu, Estonia
9
3 Institute of Molecular and Cell Biology, University of Tartu, Riia 23 Tartu 51010, Estonia
10
4 Estonian Academy of Sciences, Kohtu 6, 10130 Tallinn, Estonia
11
5 Author for correspondence, e-mail: [email protected], Fax: 003727313738 12
13
Running head: Structurally dominated temperature acclimation 14
15
Summary statement: High growth temperature reduced area-based photosynthetic and isoprene 16
emission characteristics in hybrid aspen, and these effects were primarily driven by structural 17
modifications. Acclimation to high temperature also enhanced stomatal conductance, improved 18
heat resistance of photosynthetic apparatus and increased the activation energy of isoprene 19
emission resulting in a greater fraction of photosynthetic carbon emitted as isoprene at higher 20
temperatures. These results emphasize the important roles of both leaf structural and 21
physiological changes in high-temperature acclimation of photosynthesis and isoprene emission. 22
23
This article has been accepted for publication and undergone full peer review but has not been through the
copyediting, typesetting, pagination and proofreading process, which may lead to differences between this
version and the Version of Record. Please cite this article as doi: 10.1111/pce.12435
Acc
epte
d A
rticl
e

This article is protected by copyright. All rights reserved. 2
Abstract 24
Acclimation of foliage to growth temperature involves both structural and physiological 25
modifications, but the relative importance of these two mechanisms of acclimation is poorly 26
known, especially for isoprene emission responses. We grew hybrid aspen (Populus tremula x P. 27
tremuloides) under control (day/night temperature of 25/20 ºC) and high temperature conditions 28
(35/27 ºC) to gain insight into the structural and physiological acclimation controls. Growth at 29
high temperature resulted in larger and thinner leaves with smaller and more densely packed 30
chloroplasts and with lower leaf dry mass per area (MA). High growth temperature also led to 31
lower photosynthetic and respiration rates, isoprene emission rate and leaf pigment content and 32
isoprene substrate dimethylallyl diphosphate pool size per unit area, but to greater stomatal 33
conductance. However, the declining characteristics were similar when expressed per unit dry 34
mass, indicating that the area-based differences were primarily driven by MA. Acclimation to 35
high temperature further increased heat stability of photosynthesis, and increased activation 36
energies for isoprene emission and isoprene synthase rate constant. This study demonstrates that 37
temperature acclimation of photosynthetic and isoprene emission characteristics per unit leaf area 38
was primarily driven by structural modifications, and we argue that future studies investigating 39
acclimation to growth temperature must consider structural modifications. 40
41
Keywords: dimethylallyl diphosphate, isoprene emission, isoprene synthase, structural controls, 42
photosynthesis rate, physiological controls, temperature acclimation 43
44
45
46 Acc
epte
d A
rticl
e

This article is protected by copyright. All rights reserved. 3
Introduction 47
48
Photosynthesis and respiration are considered the primary biological components regulating the 49
biosphere-atmosphere carbon exchange (Ciais et al. 2001; Mahecha et al. 2010). However, there 50
is a large and commonly ignored flux of biogenic volatile organic compounds (BVOC) generated 51
by pathways of secondary metabolism that can significantly contribute to the carbon balance of 52
the biosphere (Arneth et al. 2008; Guenther et al. 2012; Ashworth et al. 2013). Among BVOC, a 53
central role is played by isoprene that has the greatest worldwide flux attributable to a single 54
volatile compound (Guenther et al. 1993; Li & Sharkey 2013). 55
Both the primary and the secondary plant metabolism are strongly dependent on 56
temperature, but the temperature sensitivities of different processes differ among plant species, 57
and they often vary with growth conditions (Way & Oren 2010; Centritto et al. 2011; Smith & 58
Dukes 2013; Way & Yamori 2014). In particular, acclimation to growth temperature can 59
importantly alter the shape of the temperature responses of respiration and photosynthesis (Berry 60
& Björkman 1980; Hopkins 1998), and isoprene emission (Wiberley et al. 2008). Although 61
acclimation of physiological processes to long-term temperature is a well-known phenomenon, 62
the degree of acclimation strongly varies among plant species and for different processes for 63
reasons not yet fully understood (Berry & Björkman 1980; Tjoelker et al. 1999; Bunce 2000; 64
Yamasaki et al. 2002; Loveys et al. 2003; Fares et al. 2011). Understanding such acclimation 65
responses and mechanisms of acclimation are important in predicting plant responses to seasonal 66
and year-to-year differences in temperature environments as well as the responses to future 67
climate (Smith & Dukes 2013). 68
Acclimation of photosynthesis to high temperature is characteristically associated with 69
shifts of the optimum temperature of photosynthesis to higher temperatures (Berry & Björkman 70
1980; Turnbull et al. 2002; Sage & Kubien 2007). Improved heat stability of photosynthesis is 71
Acc
epte
d A
rticl
e

This article is protected by copyright. All rights reserved. 4
typically associated with changes in the stability of thylakoid membranes as the result of 72
increases in the degree of membrane lipid saturation (Berry & Björkman 1980; Björkman et al. 73
1980; Devos et al. 1998; Sharkey et al. 2001). Given that the temperature responses of Rubisco 74
and photosynthetic electron transport have different temperature sensitivities, temperature 75
acclimation can also result from changes in the partitioning of rate-limiting photosynthetic 76
proteins among the partial determinants of photosynthesis (Hikosaka 1997; Hikosaka et al. 1999). 77
In addition, growth temperature driven changes in the overall content of rate-limiting components 78
of photosynthesis machinery can result in changes in maximum photosynthetic rates (Björkman 79
et al. 1980; Stitt & Hurry 2002; Yamori et al. 2005; Sage & Kubien 2007). 80
In isoprene-emitting species, heat-stability can be rapidly altered by isoprene emission 81
that is thought to dissolve in photosynthetic membranes and stabilize membrane lipids (Singsaas 82
& Sharkey 2000; Sharkey & Yeh 2001; Velikova et al. 2011; Velikova et al. 2012) as well as 83
serve as a lipid-soluble antioxidant detoxifying heat stress generated reactive oxygen species and 84
peroxidized membrane lipids (Vickers et al. 2009; Velikova et al. 2012; Possell & Loreto 2013). 85
Thus, isoprene is considered particularly advantageous in responding to rapid increases in leaf 86
temperature such as those occurring during lightflecks (Behnke et al. 2007; Way et al. 2011; 87
Behnke et al. 2013). 88
Isoprene emission capacity can adapt to temperature environment, typically increasing 89
after changes in leaf temperature environment (Sharkey et al. 1999; Funk et al. 2003; Wiberley et 90
al. 2008) as the result of enhanced expression of isoprene synthase gene and genes of the 91
chloroplastic 2-C-methyl-D-erythritol 4-phosphate pathway responsible for isoprenoid synthesis 92
in chloroplasts (Wiberley et al. 2008; Wiberley et al. 2009; Vickers et al. 2010). However, most 93
work on isoprene emission responses to temperature environment stems from transfer 94
experiments where plants developed at a certain temperature have been transferred to the new 95
temperature environment. The effect of plant growth at different temperature environments per 96
Acc
epte
d A
rticl
e

This article is protected by copyright. All rights reserved. 5
see has been investigated only in a few studies (Wiberley et al. 2008; Hartikainen et al. 2009; 97
Fares et al. 2011) with contrasting results showing either enhanced (Wiberley et al. 2008), similar 98
(Monson et al. 1992; Hartikainen et al. 2009; Centritto et al. 2011; Fares et al. 2011) or reduced 99
emissions (Hartikainen et al. 2009) in plants grown under the higher temperature. 100
Although most work on temperature acclimation has focused on physiological responses, 101
growth at different temperatures can also importantly modify leaf structure, whole plant leaf area 102
and whole plant sink-source relationships (Starck et al. 1993; Morcuende et al. 1996; Hartikainen 103
et al. 2009; Muhl et al. 2011; Xu et al. 2012). Structural modifications such as changes in 104
chloroplast number, cell size and cell number per unit leaf area are relevant as they can change 105
the amount of rate-limiting enzymes per unit leaf area and result in changes in the process rate 106
per unit leaf area at any given temperature without concomitant changes in physiological 107
potentials of single cells (Niinemets & Sack 2006; Niinemets et al. 2009; Poorter et al. 2009). It 108
has been demonstrated that growth temperature dependent changes in respiratory (Ow et al. 109
2008) and photosynthetic activities (Yamasaki et al. 2002; Yamori et al. 2005; Hartikainen et al. 110
2009; Ibrahim et al. 2010) were importantly affected by modifications in leaf dry mass per unit 111
area, which connects area and mass based process rates (Poorter et al. 2009). However, the role 112
of growth temperature driven structural modifications in acclimation of photosynthesis and 113
isoprene emission has not been routinely studied. 114
The effects of growth temperature on isoprene emission vs. temperature response 115
relationships also vary among the studies with responses ranging from improved thermal 116
sensitivity (Monson et al. 1992) to minor changes or even reduced thermal sensitivity (Fares et 117
al. 2011). Given that the temperature response of isoprene emission is driven by both the 118
temperature effects on isoprene synthase activity and its immediate substrate dimethylallyl 119
diphosphate pool size (Rasulov et al. 2010), gaining insight into such contrasting responses 120
requires information of growth temperature effects on both partial controls of isoprene emission. 121
Acc
epte
d A
rticl
e

This article is protected by copyright. All rights reserved. 6
As isoprene emission and photosynthetic carbon metabolism are strongly linked (Li & Sharkey 122
2013), improved heat-resistance of leaves grown at higher temperature can result in maintenance 123
of greater DMADP pools at higher temperature, thereby improving the isoprene emission at 124
higher temperatures. 125
Here we studied the effects of growth temperature on foliage photosynthetic and 126
structural characteristics and isoprene emission in hybrid aspen (Populus tremula x P. 127
tremuloides) with the specific aim to separate the structural and physiological controls on growth 128
temperature acclimation. A recently developed in vivo method for estimation of DMADP pool 129
size and determination of isoprene synthase rate constant and in vivo isoprene synthase kinetic 130
characteristics (Rasulov et al. 2009a; Rasulov et al. 2011) was used to separate the substrate and 131
enzyme level controls on isoprene emission under different conditions. Our results indicate that 132
growth temperature did modify the heat resistance of photosynthesis, and altered the temperature 133
sensitivity of photosynthesis and isoprene emission rate, but the differences in foliage 134
photosynthesis and isoprene emission rates per unit area were primarily driven by structural 135
changes. 136
137
Material and methods 138
Seedlings of hybrid aspen (Populus tremula L. x P. tremuloides Michx.) clone Н200 (Rasulov et 139
al. 2009a; Rasulov et al. 2009b; Rasulov et al. 2011) were used in the experiments. Dormant 140
seedlings kept in a cold storage were planted in 4 L plastic pots filled with a mixture of peat and 141
sand (1:1) and maintained at room temperature of 22 ºC until dormancy was broken in 2-3 days. 142
Thereafter, the seedlings were moved to Percival AR-95 HIL growth chambers (CLF 143
PlantClimatics) with contrasting temperature regimes (day/night) of 25/20 ºC (lower temperature, 144
control) and 35/27 ºC (higher temperature). The ambient CO2 concentration was between 380-145
420 mol mol-1
, the relative humidity was maintained between 60-65% (corresponding to 146
Acc
epte
d A
rticl
e

This article is protected by copyright. All rights reserved. 7
moderate differences in daytime water vapor pressure deficit of ca. 1.1 kPa for the control and 1.9 147
kPa for the high temperature treatment) and the quantum flux density of 500 mol m-2
s-1
was 148
provided for 14 h light period. The plants were watered daily to field capacity with the Hoagland 149
nutrient solution for optimum water and nutrient supply. All measurements were conducted with 150
fully-expanded 20-24 days old leaves exhibiting peak physiological activity. 151
152
Measurements of gas-exchange rates and isoprene emission 153
An ultra-fast gas-exchange system (system half-time of approximately 0.15 s) was used for the 154
measurements (Laisk et al. 2002; Rasulov et al. 2010). Briefly, the leaf is enclosed in a clip-on 155
type leaf chamber with a volume of volume 2.4 cm3 and a cross-sectional area of 8.04 cm
2. The 156
leaf chamber is thermostatted, and the upper leaf surface is glued to the chamber glass window by 157
a starch paste. Direct measurements by thin thermocouples and energy balance calculations 158
indicated that leaf temperature was maintained within 0.5оC of the leaf chamber water jacket. The 159
system has two identical gas lines where different gas concentrations can be prepared and almost 160
instantaneously, in less than 1 s, switched between the sample and the reference line. Such a 161
setup is particularly appropriate for fast measurement of transient physiological responses, 162
avoiding delays in the detection of leaf gas-exchange response signals due to stabilization of gas 163
concentrations. The enclosed leaf area was illuminated with a Schott KL 1500 light source 164
equipped with a heat-reflecting filter (Optical Coating Laboratory, CA, USA). The air was mixed 165
from pure nitrogen, oxygen, and CO2 using calibrated dynamic mixers, and the air flow rate 166
through the system was kept at 0.5 mmol s-1
(Laisk et al. 2002). A LI-6251 infrared gas analyzer 167
(LI-Cor, Inc., Lincoln, Nebraska, USA) was used to measure the CO2 concentration, a custom-168
made micropsychrometer was used for the water vapor concentration, and a proton transfer 169
reaction mass spectrometer (PTR-MS, high-sensitivity version; Ionicon Analytik GmbH, 170
Innsbruck, Austria) for the isoprene concentration. The response time of the PTR-MS was 171
Acc
epte
d A
rticl
e

This article is protected by copyright. All rights reserved. 8
approximately 0.1 s and the isoprene detection limit about 10 pmol mol-1
. The instrument was 172
calibrated with an isoprene standard mixture of 5.74 mol mol-1
isoprene in N2 (Hills Scientific, 173
Boulder, Colorado, USA). 174
The standard conditions used in these experiments were the leaf chamber CO2 175
concentration of 360 mol mol-1
, О2 concentration of 21%, leaf temperature of 30 оС, light 176
intensity (photosynthetic quantum flux density) of 650 mol m-2
s-1
, and water vapor pressure 177
deficit between the leaf and the atmosphere (VD) of 1.7 kPa. The measurements were conducted 178
with attached leaves, and the protocol for all measurements included leaf enclosure, leaf 179
stabilization under the standard conditions until the steady-state rates of CO2 and H2O vapor 180
exchange and isoprene emission were established, and then changing either CO2 (360 vs. 1200 181
mol mol-1
), O2 (21 vs. 2%), light (quantum yield measurements) or temperature (temperature 182
response curves) to measure different environmental responses. For the temperature response 183
curves, leaf temperature was changed in steps of 5 оC, and each temperature change was followed 184
by returning to the standard temperature and leaf stabilization as in Rasulov et al. (2010). 185
Chamber air water vapor concentration was adjusted at each temperature to maintain the constant 186
VD and avoid changes in stomatal conductance due to altered VD. 187
The quantum yields for CO2 exchange (CO2) and isoprene emission (I) were measured 188
over the incident light range of 20 - 75 mol m-2
s-1
where the influence of the Kok effect is 189
negligible. In addition, the initial slopes of the net assimilation vs. CO2 response curves over an 190
ambient CO2 range of 0-100 mol mol-1
at both O2 concentrations of 21% and 2% were also 191
measured at the standard light intensity of 650 mol m-2
s-1
. 192
All leaf gas-exchange characteristics were calculated according to von Caemmerer and 193
Farquhar (1981). The maximum carboxylase activity or Rubisco (Vcmax) was estimated from the 194
initial slopes of the CO2 response curve at both O2 concentrations and the capacity for 195 Acc
epte
d A
rticl
e
This article is protected by copyright. All rights reserved. 9
photosynthetic electron transport (Jmax) from the high-CO2 concentration (1200 mol mol-1
) 196
measurements according to Niinemets et al. (1999b). 197
198
Measurements of chlorophyll fluorescence 199
A PAM 101 fluorimeter (Walz GmbH, Effeltrich, Germany) was used to measure chlorophyll 200
fluorescence characteristics simultaneously with CO2 and water vapor exchange. A Schott KL 201
1500 light source provided saturated pulses of white light of 14000 mol m-2
s-1
for 2 s to 202
measure either the dark-adapted (Fm) or light-adapted (Fm’) maximum fluorescence yields, while 203
another Schott KL 1500 with a 720-nm narrow-pass interference filter (Andover Corp., Salem, 204
NH, USA) was used for far-red light to estimate the dark-adapted minimum fluorescence yield 205
(F0). The fluorimeter operation frequency was 1.6 kHz for the darkened leaves and 100 kHz for 206
the illuminated leaves and during saturated pulses. Fm and F0 were typically measured 20 min. 207
after darkening. The dark-adapted PSII quantum yield was computed as (Fm – F0)/Fm and the 208
quantum yield of illuminated leaves, ΦPSII, as (Fm’ - F)/Fm’, where F is the steady-state 209
fluorescence yield. The rate of photosynthetic electron transport from chlorophyll fluorescence 210
(JETR) was further calculated as (Schreiber et al. 1994): 211
JETR = ΦPSIIξβQ, (1) 212
where Q is the incident quantum flux density, ξ is the leaf absorptance (0.86 for the control and 213
0.81 for the high temperature grown plants) and β is the fraction of absorbed light used to drive 214
PSII electron transport (taken as 0.5 in this study). 215
216
Foliar structural measurements and determination of chlorophylls and carotenoids 217
Immediately after the gas-exchange measurements, leaf discs of 4 сm2 were taken between the 218
major leaf veins for estimation of leaf fresh and dry mass. For anatomical measurements, leaf 219 Acc
epte
d A
rticl
e

This article is protected by copyright. All rights reserved. 10
samples were taken with a razor blade between the major veins from the central part of the leaves 220
and cut into ca. 1 x 1 mm pieces for fixation. 221
The fresh mass of the leaf discs was estimated immediately, and the dry mass after oven-222
drying at 70 оC for at least 48 h. Additional leaf discs for foliar pigment analyses were frozen at -223
80 оС until the analysis. The frozen discs were pulverized in liquid N2 and the pigments were 224
extracted with 80% ice-cold acetone with some CaCO3. The absorptances of the pigment 225
solutions were measured with a dual-beam Shimadzu UV2550PC spectrophotometer at the 226
wavelengths of 663.2, 646.8 and 470 nm, and the pigment contents were calculated according to 227
the equations of Lichtenthaler and Buschmann (2001). 228
229
Anatomical measurements 230
Preparation of foliar samples for light and transmission electron microscopy (TEM) follows the 231
protocol of Copolovici et al. (2011). Briefly, the samples were fixed by infiltrating with buffered 232
(0.2 M phosphate buffer, pH = 7.2) 2% glutaric aldehyde, dehydrated in ethanol series and 233
embedded in Epoxy Embedding Medium (Sigma-Aldrich Chemie, Steinheim, Germany). Semi-234
thin (1.5–2 μm) cross- and paradermal sections and ultrathin (70–90 nm) cross-sections were cut 235
with a Leica EM UC7 ultramicrotome (Leica Mikrosysteme GmbH, Austria, Vienna) equipped 236
with a 45° diamond knife (Diatome, Hatfield, PA, USA). 237
The semi-thin sections were stained for 30 s with Toluidine Blue as described in Burns 238
(1978) and Mercer (1963), viewed at 400-1000x magnification with a Zeiss Axioplan 2 239
microscope and the digital images were taken with an AxioCam HRc (Carl Zeiss Microscopy, 240
Jena, Germany). Five cross-sections per leaf sample were measured in three locations for total 241
leaf thickness, palisade mesophyll and spongy mesophyll thickness, and chloroplasts and cells 242
were counted in these sections. On the same sections, leaf thickness, palisade mesophyll and 243
spongy mesophyll thickness were measured. In addition, chloroplast and cell numbers were also 244
Acc
epte
d A
rticl
e
This article is protected by copyright. All rights reserved. 11
estimated from 10 paradermal sections per sample, 5 cut through the palisade and 5 through the 245
spongy mesophyll. From these measurements, the chloroplast number per leaf area (nchl) was 246
calculated as: 247
nchl = nc,pnchl,p,pnchl,p,c + nc,snchl,s,pnchl,s,c, (2) 248
where nc,p is the number of cells in the palisade and nc,s that in the spongy parenchyma per unit 249
leaf area, nchl,p,p is the chloroplast number per cell in the palisade parenchyma estimated from the 250
paradermal section and nchl,p,c that estimated from the cross-section, and nchl,s,p is the chloroplast 251
number in the spongy parenchyma estimated from the paradermal section and nchl,s,c that 252
estimated from the cross-section. 253
Ultrathin sections for TEM were contrasted with uranyl acetate and lead citrate 254
(Copolovici et al. 2011 for details) and samples were viewed with a Philips Tecnai 10 TEM (FEI, 255
Eindhoven, Netherlands) with an accelerating voltage of 80 kV. Digital images were taken with 256
Olympus Veleta 2K x 2K sidemounted TEM CCD camera (Olympus Soft Imaging Solutions 257
GmbH, Germany). Magnifications of 7000–10000x were used to measure chloroplast length, 258
thickness and area (ca. 40 chloroplasts were measured in each case). All anatomical 259
characteristics were separately measured for palisade and spongy mesophyll. Digital image 260
analysis was carried out with UTHSCSA Image Tool for Windows 3.00 (UTHSCSA, Texas, 261
USA). 262
263
Determination of the dimethylallyl diphosphate (DMADP) pool size (CDMADP) 264
The postillumination method of Rasulov et al. (2009a; 2010) was used to measure the pool size of 265
the immediate precursor pool responsible for the isoprene emission in the steady state. The 266
method is based on the assumption that postillumination isoprene release continues at the expense 267
of the available precursor pool synthesized prior to leaf darkening (Rasulov et al. 2009a; Rasulov 268
et al. 2010; Li et al. 2011). Thus, the size of this pool (CDMADP) was determined by integrating the 269
Acc
epte
d A
rticl
e

This article is protected by copyright. All rights reserved. 12
fast, 200–400 s after darkening, dark decay of isoprene release (Rasulov et al. 2009a; Rasulov et 270
al. 2010). 271
In addition to DMADP, the isoprene precursor, isopentenyl diphosphate (IDP) can be 272
converted in the dark to DMADP by IDP isomerase and thus, contribute to the dark release of 273
isoprene (Li et al. 2011). Although there is a variation in chloroplastic IDP/DMADP ratios 274
among studies (Ramos-Valdivia et al. 1997; Zhou et al. 2013) likely indicating differences in the 275
activity of chloroplastic IDP isomerase (Brüggemann & Schnitzler 2002), studies are in 276
agreement that IDP/DMADP ratios are small. Nevertheless, even for relatively high 277
IDP/DMADP ratios of ca. 0.5 (Weise et al. 2013), the method of Rasulov (2009a; 2010) has 278
provided DMADP pool size estimates in excellent agreement with destructive chemical 279
estimations (Weise et al. 2013). 280
281
Estimation of the rate constant, the maximum rate (Vmax) and Michaelis-Menten constant (Km) for 282
isoprene synthase 283
The DMADP pool size (CDMADP) decreases after darkening due to DMADP conversion into 284
isoprene according to a first-order reaction kinetics under strongly substrate-limited conditions 285
(Loreto et al. 2004; Rasulov et al. 2009a; Rasulov et al. 2009b). Given further that the isoprene 286
synthase activation state does not vary during the light-dark transient (as confirmed by the rapid 287
rise of isoprene emission upon illumination of the darkened leaves), isoprene emission rate at any 288
given time t after darkening, I(t), is driven by the CDMADP pool size that has remained at this time, 289
CDMADP(t) (the integral of isoprene emission rate from a given time t until cessation of isoprene 290
emission). Thus, paired values of I(t) vs. CDMADP(t) were derived for the entire dark decay and the 291
linear parts of this relationships were used to estimate the rate constant of isoprene synthase (k, s-
292
1) as in our previous studies (Rasulov et al. 2010; Sun et al. 2012b; Rasulov et al. 2014). 293 A
ccep
ted
Arti
cle

This article is protected by copyright. All rights reserved. 13
In vivo Vmax and Km for isoprene synthase were estimated from the Hanes-Wolff plots 294
(CDMADP(t)/I(t) vs. CDMADP(t)) using the full dark decay of isoprene emission. The values of both 295
characteristics were expressed per unit leaf area and dry mass. 296
297
Data analyses 298
Considering that fixation of 6 molecules of CO2 is needed for the formation of one molecule of 299
isoprene (e.g., Niinemets et al. 1999c), the fraction of carbon lost due to isoprene emission was 300
estimated as 6I/A, where I is the isoprene emission rate and A the net assimilation rate. 301
The temperature responses of net assimilation rate, photosynthetic electron transport rate, 302
and isoprene emission characteristics (trait pi) were fitted by an Arrhenius-type temperature 303
response function with an optimum: 304
RTHTS
RTHc
e
ep
/)(
/
iid,i
ia ,i
1
, (3) 305
where ci is the scaling constant for the trait i, Ha,i (J mol–1
) is the activation energy, Hd,i (J mol–
306
1) is the deactivation energy, Si (J mol
–1 K
–1) is the entropy term, T (K) is the leaf temperature, 307
and R (8.314 J mol–1
K–1
) is the gas constant. The temperature optimum for the trait i, Topt,i, 308
(Niinemets et al. 1999a) was further calculated as: 309
1ln
=
a,i
d,i
i
d,i
opt,i
H
HRS
HT . (4) 310
Dark respiration and stomatal conductance vs. temperature response curves that did not exhibit an 311
optimum were fitted by exponential relationships in the form: 312
RTHcep
/
iia,i
. (5) 313
Note that the traditional estimate of temperature responses of chemical and biological processes, 314
Q10, the reaction rate at temperature T+10 relative to the rate at temperature T is given as. 315
Acc
epte
d A
rticl
e

This article is protected by copyright. All rights reserved. 14
R
TTH
e
)]10/(1/1[
10,i
ia,
Q
. (6) 316
The Q10 concept assumes that the rate of the exponential increase (slope) of the process rate with 317
increasing temperature is independent of temperature. Eq. 5 does not include such an assumption 318
and is thus more flexible than the traditional Q10 analysis. Nevertheless, for rapid comparisons 319
with other reported data, we also calculated the Q10 values. Treatment means for all traits (n = 4-320
32) were compared by analyses of variance (ANOVA) using Statistica 6.0 (StatSoft, Inc., Tulsa, 321
OK, USA) and the growth temperature effects were considered significant at P < 0.05. 322
323
Results 324
325
Growth temperature effects on foliage structural characteristics 326
Increases in growth temperature were associated with about 1.2-fold larger and about 1.4-fold 327
thinner leaves (Fig. 1, Table 1) with 1.6-fold lower leaf dry mass per unit area (MA, Table 1). 328
Decreases in leaf thickness primarily resulted from decreases in the thickness of palisade (1.6-329
fold) and to a smaller degree in spongy mesophyll thickness (1.3-fold, Fig. 1a, b, Table 1). The 330
ratio of palisade to spongy mesophyll thickness also decreased from an average (± SE) of 1.60 ± 331
0.08 to 1.22 ± 0.06 with increasing growth temperature (P < 0.001 for the treatment effect). 332
However, leaf density, the ratio of MA to leaf thickness was similar among the treatments (0.34 g 333
cm-3
for the control and 0.30 g cm-3
for plants grown at the higher temperature). 334
Decreased leaf thickness was also associated with reduced number of chloroplasts per unit 335
leaf area, and with reduced chloroplast size (Table 1). In addition, leaf pigment contents per unit 336
leaf area also decreased. Changes in these traits were relatively smaller than in leaf thickness and 337
MA, and the number of chloroplasts per leaf dry mass was 1.2-fold greater in the high-338
temperature-grown plants (Table 1). Ultrastructural measurements also indicated that leaf 339 Acc
epte
d A
rticl
e

This article is protected by copyright. All rights reserved. 15
chloroplasts of the high-temperature-grown plants had barely visible starch grains, while large 340
starch grains were visible in the chloroplasts in the control treatment (Table 1, Fig. 1c, d). 341
342
Effects of growth temperature on foliage photosynthetic and respiratory activities 343
In analyzing the effects of growth temperature on foliage photosynthetic characteristics, we first 344
focus on the effects at the standard measurement temperature of 30 ºC, and then consider 345
modifications in the temperature responses. At the standard temperature, acclimation to the 346
higher growth temperature resulted in reductions in net assimilation rate per unit leaf area at the 347
ambient CO2 concentration (Fig. 2a), and this reduction was associated with decreased maximum 348
carboxylase activity of Rubisco (Vcmax, Table 2), decreased photosynthetic electron transport rate 349
estimated from chlorophyll fluorescence at ambient CO2 concentration (JETR, Fig. 2c) and from 350
the CO2-saturated net assimilation rate (Jmax, Table 2) per unit area. Analogously to the net 351
assimilation rate, dark respiration rate per unit area (Fig. 2e, Table 2) and the quantum yield of 352
photosynthesis for the incident light (Table 2) were lower in the warmer treatment. The latter 353
difference reflected lower chlorophyll content per leaf area (Table 1) and leaf absorptance (data 354
not shown) in plants grown at the higher temperature. Conversely, stomatal conductance and 355
intercellular CO2 concentration were greater in plants grown at the higher temperature (Fig. 3, 356
Table 2). 357
The growth temperature dependent changes in assimilation rates and foliage biochemical 358
capacities were strongly driven by temperature effects on leaf structure. In fact, dark respiration 359
rate, Jmax and net assimilation rate per dry mass were not significantly different among the 360
treatments (Table 2, Fig. 2), while the CO2-limited photosynthetic electron transport rate per dry 361
mass (electron transport rate when photosynthesis is Rubisco-limited, Fig. 2d) was greater at 362
higher growth temperature. However, Vcmax per dry mass was still greater for the control 363
treatment (Table 2), indicating that the similarity of net assimilation rate per dry mass among the 364
Acc
epte
d A
rticl
e

This article is protected by copyright. All rights reserved. 16
treatments reflected a greater intercellular CO2 concentrations due to higher stomatal conductance 365
(Fig. 3). 366
Increased growth temperature shifted the optimum temperature of net assimilation to 367
higher temperatures (Fig. 2a, b), and an analogous response was observed for the CO2-limited 368
photosynthetic electron transport rate (Fig. 2c, d). In addition, the activation energies, HA (Eq. 369
3) were smaller in plants grown at the lower temperature (P < 0.05 for both comparisons). This, 370
together with greater optimum temperatures resulted in greater mass-based net assimilation and 371
electron transport rates at higher temperature (Fig. 2b, d). On the other hand, growth temperature 372
did not affect the shapes of the dark respiration (Fig. 2e, f) and stomatal conductance (Fig. 3) vs. 373
temperature responses (P > 0.3 for the treatment effects on HA for both traits). 374
375
Influence of growth temperature on isoprene emission characteristics at the standard 376
measurement temperature of 30 ºC 377
As with the photosynthesis data, in this section, we first analyze the differences in growth 378
treatments at the standard measurement temperature of 30 ºC, and then focus on differences in the 379
shape on temperature responses. On a leaf area basis, both the isoprene emission rate (I) and the 380
pool size of the substrate for the isoprene synthase enzyme, dimethylallyl diphosphate (DMADP, 381
CDMADP), were greater in the control than in the high temperature treatment (Fig. 4a, c, Table 2). 382
However, on a leaf dry mass basis, I and CDMADP values were similar among the growth 383
temperature treatments (Fig. 4b,d, Table 2). Furthermore, the rate constant for isoprene synthase 384
(k) was not significantly different between the growth temperature treatments (Fig. 5, Table 2). 385
The percentage of photosynthetic carbon used for isoprene emission was also not significantly 386
different among the treatments at this measurement temperature (Fig. 6). Similarly to the 387 Acc
epte
d A
rticl
e
This article is protected by copyright. All rights reserved. 17
quantum yield for photosynthesis, the quantum yield for isoprene emission for the incident light 388
was greater in the control treatment (Table 2). 389
The apparent kinetic characteristics of isoprene synthase, the maximum activity at 390
substrate-saturated conditions, Vmax per unit area (Fig. 7a) and the Michaelis-Menten constant for 391
the area-based CDMADP (Fig. 7c) were both greater in the control treatment. However, similarly to 392
I and CDMADP (Fig. 4b, d), Vmax per unit dry mass (Fig. 7b) and Km for dry-mass based CDMADP 393
(Fig. 7d) were not different among the growth temperatures. 394
395
Modification of the temperature responses of isoprene emission characteristics by growth 396
temperature 397
Growth temperature had minor effects on the optimum temperatures (Topt) of isoprene emission 398
characteristics (Figs. 4-5, 7) with only a slightly greater Topt for apparent maximum isoprene 399
synthase activity (Vmax) in the control leaves (Fig. 7a). On the other hand, for the measurement 400
temperature range of 25-35 ºС, the average activation energy (HA) for I was 77.9 ± 1.7 kJ mol-1
401
for the control treatment and 108 ± 5 kJ mol-1
for the high-temperature-grown plants (P < 0.01 402
for the differences among the treatments). These activation energies correspond to a Q10 of 2.77 ± 403
0.05 for the control and 4.14 ± 0.29 for the high-temperature treatment. The values of HA for 404
CDMAPD for the same temperature range were 63 ± 7 kJ mol-1
(Q10 = 2.31 ± 0.22) for the control 405
and 76 ± 14 kJ mol-1
(Q10 = 2.9 ± 0.6) for the high temperature treatment (P > 0.4 for the 406
difference among the treatments). Thus, the effects of measurement temperature on and growth 407
temperature sensitivity of I and k were larger than those for CDMADP. 408
The differences among treatments in activation energies for k and I were ultimately 409
associated with greater k and mass-based I values at higher temperatures (Fig. 4-5). As the result 410
of much lower temperature sensitivity of photosynthesis than isoprene emission, the percentage 411 Acc
epte
d A
rticl
e

This article is protected by copyright. All rights reserved. 18
of photosynthetic carbon lost due to isoprene emission increased with increasing temperature, and 412
this increase was greater for plants grown under the lower temperature (Fig. 6). 413
Analogously, the temperature sensitivity was greater for the isoprene synthase apparent 414
Vmax than for the apparent Km (Fig. 7). The Q10 values for Vmax were 2.65 ± 0.08 for the control 415
and 3.51 ± 0.15 for the high temperature treatment (P < 0.005 for difference among treatments), 416
while the corresponding Q10 values for Km were 2.16 ± 0.26 for the control and 2.18 ± 0.46 for 417
the high temperature treatment (P > 0.9 for the treatment effect). 418
419
Discussion 420
421
Modification of leaf structural characteristics and pigment content by growth temperature 422
Our study demonstrates that acclimation to high growth temperature led to profound changes in 423
anatomy, morphology and chemistry of hybrid aspen leaves (Fig. 1, Table 1). As an integral 424
change, high-temperature-grown leaves were thinner with lower leaf dry mass per unit area (MA). 425
In addition, high growth temperature led to less densely packed mesophyll, with fewer mesophyll 426
cells and fewer chloroplasts per unit leaf area (Fig. 1, Table 1). Despite lower number of 427
chloroplasts per unit leaf area, the chloroplasts were smaller, and chloroplast number per unit leaf 428
dry mass was greater. These results are in a broad agreement in past studies demonstrating 429
significant modifications in leaf anatomy and chloroplast characteristics (Jin et al. 2011), and 430
decreased leaf thickness (Körner et al. 1989; Hartikainen et al. 2009; Muhl et al. 2011) in plants 431
grown in warmer temperatures. 432
On the other hand, leaf expansion growth was enhanced, resulting in larger leaves (Table 433
1) and overall greater whole canopy leaf area and mass (data not shown). Such an enhancement 434
of leaf expansion growth is a characteristic response to high growth temperatures in well-watered 435
plants (Wardlaw & Bagnall 1981; Hewitt et al. 1985; Granier et al. 2000) and might reflect both 436
Acc
epte
d A
rticl
e
This article is protected by copyright. All rights reserved. 19
enhanced light interception and enhanced sink activity, i.e. enhanced consumption of 437
photoassimilates, at high temperatures. In fact, chloroplasts in high-temperature-grown leaves 438
were essentially depleted of starch (Table 1, Fig. 1c, d) in agreement with observations in other 439
studies (Buttrose & Hale 1971; Gandin et al. 2011). In addition to a reduction of starch content 440
due to enhanced sugar export from chloroplasts, there is also evidence that high temperatures 441
might inhibit gluconeogenesis and increase sucrose synthesis (Ito et al. 2009; Yamakawa & 442
Hakata 2010). Soluble sugars importantly enhance the thermotolerance of photosynthetic 443
apparatus (Hüve et al. 2006; Hüve et al. 2012; Sun et al. 2013), and thus, a possible elevation of 444
soluble sugar content can be an important mechanism improving the heat resistance of 445
photosynthesis. 446
447
Structural control of temperature acclimation of photosynthetic and respiratory characteristics 448
Our results demonstrate strong reductions in area-based foliage pigment content, biochemical 449
potentials, and net assimilation and dark respiration rates in high temperature grown plants 450
(Tables 1-2, Fig. 2). These results are analogous with previous studies demonstrating enhanced 451
photosynthetic rates and greater photosynthetic electron transport and Rubisco carboxylase 452
activity (Huner 1985; Mawson & Cummins 1989; Yamasaki et al. 2002; Yamori et al. 2005) and 453
number and size of mitochondria and respiratory activity (Jin et al. 2011) per unit leaf area in 454
plants grown at lower temperatures. However, as our study further demonstrates, the mass-based 455
photosynthetic characteristics differed much less among the treatments, indicating that the 456
photosynthetic potentials of single leaf cells were not strongly affected by changes in growth 457
temperature (Table 2, Fig. 2). An increase of MA with increasing growth light availability is well-458
known (Niinemets & Sack 2006; Niinemets 2007; Niinemets & Anten 2009; Poorter et al. 2009), 459
and this increase has been associated with increases in protein content and photosynthetic rate per 460 Acc
epte
d A
rticl
e

This article is protected by copyright. All rights reserved. 20
area (Niinemets & Sack 2006; Niinemets 2007). Our results further underscore the important role 461
of structural controls in temperature acclimation of photosynthesis. 462
In addition to the rates of photosynthesis, the quantum yield of photosynthesis for an 463
incident light also decreased with increasing irradiance (Table 2) and this reduction was 464
associated with reduced chlorophyll content per area (Table 1) and reduced leaf absorptance as 465
has also been reported in several other studies (Hikosaka et al. 1999; Yamori et al. 2005). As 466
chlorophyll content per dry mass did not vary with growth temperature (Table 1), modifications 467
in leaf structure were also responsible for the reduction of quantum yields for the incident light in 468
the high-temperature-grown plants (Table 2). Nevertheless, changes in chlorophyll content 469
typically play a much smaller role in whole plant light interception than alterations in total leaf 470
area (Niinemets 2007). 471
Differently from most of the photosynthetic characteristics, stomatal conductance was 472
strongly enhanced upon growth at high temperatures, leading to enhanced intercellular CO2 473
concentration (Fig. 3). In fact, as the maximum carboxylase activity of Rubisco per dry mass was 474
somewhat decreased, enhanced intercellular CO2 concentration was responsible for similar mass-475
based net assimilation rates in different temperature treatments. Enhanced stomatal conductance 476
at higher growth temperature can be a structural response associated with greater stomatal size 477
and/or density as reported in some studies (Ghosh et al. 1996; Pandey et al. 2007) although not 478
always (Crawford et al. 2012). Maintenance of high stomatal conductance at higher temperatures 479
clearly plays an important role in convective cooling of leaves (Crawford et al. 2012), and also 480
importantly compensates for the reduced biochemical capacity of photosynthetic machinery by 481
increasing the internal CO2 concentration. 482
The maximum electron transport rate per dry mass estimated from the net assimilation 483
rates at high CO2 concentration did not differ among temperature treatments. However, in 484
calculation of the capacity for photosynthetic electron transport rate at high CO2 concentration, 485
Acc
epte
d A
rticl
e

This article is protected by copyright. All rights reserved. 21
we did not consider the possible limitation of photosynthesis by triose phosphates that can lead to 486
underestimation of the true electron transport capacity (Sharkey 1985). Given the overall strong 487
coordination of Rubisco activity and electron transport capacity, the difference in growth 488
temperature effects on Rubisco carboxylase and electron transport capacities might reflect a 489
stronger feedback inhibition of photosynthesis at higher CO2 in plants grown at lower 490
temperature (e.g., Pammenter et al. 1993 for a discussion). Such a possible feedback limitation of 491
maximum electron transport rate is also supported by reduced use of assimilates in plant growth 492
as indicated by accumulation of starch in lower temperatures. 493
494
Effects of growth temperature on temperature responses of photosynthesis and respiration rates 495
In addition to structural modifications, growth at the higher temperature resulted in significantly 496
improved heat resistance of net assimilation rates as evident in greater activation energies and 497
optimum temperatures (Topt) of net assimilation rates and CO2-limited electron transport rates 498
(Fig. 2a-d). Such an improved heat resistance is in line with past observations as discussed in the 499
Introduction and is typically associated with increased lipid saturation in thylakoid membranes 500
(Pearcy 1978; Raison 1986; Kunst et al. 1989; Mawson & Cummins 1989; Shanklin & Cahoon 501
1998), and can also reflect increased leaf sugar contents as discussed above. In addition, increases 502
in Topt of photosynthesis can partly reflect increased stomatal conductance that reduces the rate of 503
photorespiration at any given temperature and thereby shifts the optimum temperature to higher 504
temperatures (Leegood 1995; Medlyn et al. 2002). 505
Past studies have indicated that the activation energy for the dark respiration often 506
decreases upon growth at higher temperatures (Atkin & Tjoelker 2003; Atkin et al. 2005). 507
However, there was no evidence of changes in the shape of dark respiration vs. temperature 508
response curve in our study (Fig. 2e, f) suggesting either that the mitochondrial capacity for 509
respiration was unaffected by high growth temperature or that changes in the capacity were 510
Acc
epte
d A
rticl
e

This article is protected by copyright. All rights reserved. 22
obscured by alterations in respiratory substrate availability. The latter possibility is plausible 511
given the altered sink/source relations in plants grown at different temperatures. 512
513
Isoprene emission characteristics in relation to growth temperature 514
As with the area-based photosynthetic characteristics, isoprene emission rate, DMADP pool size 515
(Table 2, Fig. 4) and apparent maximum rate and Km for isoprene synthase at 30 ºC (Table 2, Fig. 516
7) were greater in low-temperature-grown plants. However, none of these characteristics was 517
affected by growth temperature when expressed on a leaf dry mass basis (Fig. 4, 7 and Table 2), 518
indicating that differences in area-based isoprene emission characteristics were primarily driven 519
by leaf structural modifications. Furthermore, the rate constant of isoprene synthase (Fig. 5) and 520
the fraction of carbon lost due to isoprene emission (Fig. 6) also did not depend on growth 521
temperature at the measurement temperature of 30 ºC, further indicating that isoprene emission 522
scaled to DMADP pool size and net assimilation rate similarly in both temperature treatments. 523
Contrasting growth temperature effects on the area-based isoprene emission rates have been 524
observed across the studies (see Introduction), and we argue that these contrasting effects 525
primarily result from study-to-study differences in leaf morphological response to growth 526
temperature. We also emphasize that the effects of longer-term temperature on isoprene emission 527
characteristics can be different for transfer experiments where leaves developed at a given 528
temperature are transferred to another temperature. In these experiments, any acclimation to 529
changed conditions is primarily biochemical and physiological (Geron et al. 2000; Mayrhofer et 530
al. 2005; Wiberley et al. 2008; Sun et al. 2012a). 531
532
Temperature response of isoprene emission characteristics 533
As demonstrated previously (Rasulov et al. 2010; Li et al. 2011), the optimum temperature for 534
isoprene emission (Fig. 4a, b) is co-determined by the temperature effects on the DMADP pool 535
Acc
epte
d A
rticl
e

This article is protected by copyright. All rights reserved. 23
size (Fig. 4c, d) and on the isoprene synthase rate constant (Fig. 5). Thus, the key issue is how the 536
share of different controls is affected by acclimation to different growth temperatures. Our data 537
do demonstrate that the DMADP pool size starts to decrease earlier with increasing temperature 538
(Fig. 4c, d) than the isoprene synthase rate constant or Vmax of isoprene synthase (Fig. 7a, b). 539
Furthermore, our data demonstrate that Km of isoprene synthase increases with increasing 540
temperature, indicating that progressively higher DMADP pools are needed to reach a given 541
value of isoprene emission rate (Fig. 7c, d). Such a temperature-dependent increase of Km is 542
characteristic for many enzymes and indicates weaker associations in the enzyme-substrate 543
complex at higher temperature (Hajdu et al. 2009). 544
Despite the similarity of mass-based isoprene emission characteristics at 30 ºC (Table 2), 545
and similarly high optimum temperatures for isoprene emission between 40-41 ºC (Fig. 4a, b), a 546
number of important differences were observed among the growth temperature treatments in 547
responses of isoprene emission characteristics to higher temperatures (Figs. 4-7). In low-548
temperature-grown plants, the activation energies were almost identical to those observed in 549
hybrid aspen grown in similar conditions (Rasulov et al. 2010). However, in the current study, 550
the activation energy for isoprene emission was greater in leaves grown at greater temperature, 551
and this was associated with greater mass-based emission rates at higher temperatures (Fig. 4b). 552
These effects resulted from a greater activation energy for isoprene synthase rate constant (Fig. 553
5), while the activation energy for DMADP pool size did not differ among the treatments, 554
suggesting that the rate of substrate production was not affected by growth temperature. This 555
seems surprising given the improved heat tolerance of photosynthetic apparatus in high-556
temperature-grown plants (Fig. 2). In fact, plants grown at the lower temperature used a greater 557
fraction of photosynthetic carbon for isoprene emission at higher temperatures (Fig. 6). It is 558
plausible that in high-temperature-grown plants with a greater growth rate and reduced sink 559
limitation of photosynthesis, alternative pathways for DMADP consumption for higher molecular 560
Acc
epte
d A
rticl
e

This article is protected by copyright. All rights reserved. 24
mass isoprenoids (Rasulov et al. 2014 for a discussion) were also more strongly activated such 561
that the availability for DMADP for isoprene synthesis was ultimately similar for both 562
treatments. 563
As isoprene synthase activity is affected by pH and cellular ionic medium characteristics 564
(Sasaki et al. 2005; Köksal et al. 2010) possible growth temperature effects on subcellular 565
environment might also play a role in the observed patterns. Thus, differences in the isoprene 566
synthase rate constant (Fig. 5) and Vmax (Fig. 7a, b) might reflect changes in chloroplastic 567
conditions in plants grown at different temperatures. Such changes are likely given that heat 568
stress gradually leads to leakiness of chloroplastic membranes and reduced proton gradient 569
(Schrader et al. 2004; Zhang & Sharkey 2009) bringing pH in actively photosynthesizing 570
chloroplasts (ca. 7.8-8) closer to the cytosolic values (6-6.5). Given that the pH optimum for 571
isoprene is ca. 8, such a reduction of pH would importantly affect the rate of isoprene synthesis, 572
especially in low-temperature-grown plants with lower heat resistance of membranes. 573
Apart from subcellular effects, Populus has multiple isoprene synthase genes (Vickers et 574
al. 2010), and expression of a more heat-resistance isoprene synthase might provide a 575
complementary explanation for improved temperature kinetics. However, so far there is no 576
evidence of differences in heat resistance of different isoprene synthase isoforms as well as on the 577
regulation of expression of different isoforms by growth temperature. Finally, smaller 578
chloroplasts (Table 1) with almost missing starch grains might also mean reduced diffusive 579
limitations between the sites of DMADP synthesis and isoprene synthase. Overall, these results 580
are consistent with improved heat stability of isoprene synthesis in high temperature acclimated 581
leaves, but do not support the suggestion of a greater requirement of isoprene synthesis to cope 582
with sustained high temperatures. 583
584
Conclusions 585
Acc
epte
d A
rticl
e

This article is protected by copyright. All rights reserved. 25
Our study demonstrates that increases in growth temperature resulted in major changes in leaf 586
anatomy and morphology and that these structural modifications mainly drove the treatment 587
effects on foliage photosynthetic and isoprene emission characteristics expressed per unit leaf 588
area. While structural acclimation to growth light regime is well-recognized (Niinemets & Anten 589
2009; Poorter et al. 2009), temperature acclimation studies do not routinely address growth 590
temperature effects on leaf structure. As our study demonstrates, consideration of structural 591
effects clearly provides insight into the mechanisms of temperature-driven photosynthetic 592
acclimation. In fact, structural changes might explain the study-to-study differences in growth 593
temperature effects on foliage area-based physiological characteristics that have been difficult to 594
explain so far. 595
Higher growth temperature also enhanced the heat stability of photosynthetic 596
characteristics, but had surprisingly minor effects on the heat stability of isoprene emission traits. 597
As noted in the Introduction, there are important study-to-study differences in the effects of 598
growth temperature on the shape of the temperature response of isoprene emission (Monson et al. 599
1992; Fares et al. 2011). We argue that such contrasting effects most likely result from 600
differences in how growth temperature affects the isoprene precursor DMADP pool size. In our 601
study where a higher growth temperature was associated with enhanced sink activity, growth 602
temperature effects on DMADP pool size were minor. However, much stronger pathway 603
upregulation may occur when primary metabolism is curbed by limited sink activity (Harding et 604
al. 1990; Starck et al. 1993). Although our study demonstrated that growth temperature might 605
also affect the isoprene synthase characteristics, we argue that the overall pathway flux can be 606
potentially more strongly affected by DMADP pool size and isoprene synthase expression 607
(Rasulov et al. 2009b; Rasulov et al. 2010; Li et al. 2011; Li & Sharkey 2013). We conclude that 608
analyses of temperature acclimation of photosynthesis and isoprene emission should consider 609 Acc
epte
d A
rticl
e

This article is protected by copyright. All rights reserved. 26
both structural and physiological adjustments and that more experimental studies are needed to 610
gain insight into the effects of sink strength on expression of isoprenoid synthesis pathway. 611
612
Acknowledgements 613
Funding for this research was provided by the Estonian Ministry of Science and Education 614
(institutional grant IUT-8-3), the Estonian Science Foundation (grant 9253), the European 615
Commission through the European Regional Fund (the Center of Excellence in Environmental 616
Adaptation), and the European Research Council (advanced grant 322603, SIP-VOL+). 617
618
619
References 620
Arneth A., Monson R.K., Schurgers G., Niinemets Ü. & Palmer P.I. (2008) Why are estimates of 621
global isoprene emissions so similar (and why is this not so for monoterpenes)? 622
Atmospheric Chemistry and Physics 8, 4605-4620. 623
Ashworth K., Boissard C., Folberth G., Lathière J. & Schurgers G. (2013) Global modeling of 624
volatile organic compound emissions. In: Biology, controls and models of tree volatile 625
organic compound emissions (eds Ü. Niinemets & R.K. Monson), pp. 451-487. Springer, 626
Berlin. 627
Atkin O.K., Bruhn D., Hurry V.M. & Tjoelker M. (2005) The hot and the cold: unravelling the 628
variable response of plant respiration to temperature. Evans review no. 2. Functional 629
Plant Biology 32, 87-105. 630
Atkin O.K. & Tjoelker M.G. (2003) Thermal acclimation and the dynamic response of plant 631
respiration to temperature. Trends in Plant Science 8, 343-351. 632
Behnke K., Ehlting B., Teuber M., Bauerfeind M., Louis S., Hänsch R., Polle A., Bohlmann J. & 633
Schnitzler J.-P. (2007) Transgenic, non-isoprene emitting poplars don’t like it hot. The 634
Plant Journal 51, 485-499. 635
Behnke K., Ghirardo A., Janz D., Kanawati B., Esperschütz J., Zimmer I., Schmitt-Kopplin P., 636
Niinemets Ü., Polle A., Schnitzler J.-P. & Rosenkranz M. (2013) Isoprene function in two 637
contrasting poplars under salt and sunflecks. Tree Physiology 33, 562-578. 638
Berry J. & Björkman O. (1980) Photosynthetic response and adaptation to temperature in higher 639
plants. Annual Review of Plant Physiology 31, 491-543. 640
Björkman O., Badger M.R. & Armond P.A. (1980) Response and adaptation of photosynthesis to 641
high temperatures. In: Adaptation of plants to water and high temperature stress (eds 642
N.C. Turner & P.J. Kramer), pp. 233-249. John Wiley & Sons, New York - Chichester - 643
Brisbane - Toronto. 644
Brüggemann N. & Schnitzler J.-P. (2002) Relationship of isopentenyl diphosphate (IDP) 645
isomerase activity to isoprene emission of oak leaves. Tree Physiology 22, 1011-1018. 646 Acc
epte
d A
rticl
e

This article is protected by copyright. All rights reserved. 27
Bunce J.A. (2000) Acclimation of photosynthesis to temperature in eight cool and warm climate 647
herbaceous C3 species: temperature dependence of parameters of a biochemical 648
photosynthesis model. Photosynthesis Research 63, 59-67. 649
Burns W.A. (1978) Thick sections: technique and applications. In: Diagnostic electron 650
microscopy (eds B.F. Trump & R.J. Jones), pp. 146-. Wiley, New York. 651
Buttrose M.S. & Hale C.R. (1971) Effects of temperature on accumulation of starch or lipid in 652
chloroplasts of grapevine. Planta 101, 166-170. 653
Centritto M., Brilli F., Fodale R. & Loreto F. (2011) Different sensitivity of isoprene emission, 654
respiration and photosynthesis to high growth temperature coupled with drought stress in 655
black poplar (Populus nigra) saplings. Tree Physiology 31, 275-286. 656
Ciais P., Friedlingstein P., Friend A. & Schimel D.S. (2001) Integrating global models of 657
terrestrial primary productivity. In: Terrestrial global productivity (eds H.A. Mooney, B. 658
Saugier, & J. Roy), pp. 449-478. Academic Press,Inc, San Diego. 659
Copolovici L., Kännaste A., Remmel T., Vislap V. & Niinemets Ü. (2011) Volatile emissions 660
from Alnus glutinosa induced by herbivory are quantitatively related to the extent of 661
damage. Journal of Chemical Ecology 37, 18-28. 662
Crawford A.J., McLachlan D.H., Hetherington A.M. & Franklin K.A. (2012) High temperature 663
exposure increases plant cooling capacity. Current Biology 22, R396-R397. 664
Devos N., Ingouff M., Loppes R. & Matagne R.F. (1998) Rubisco adaptation to low 665
temperatures: a comparative study in psychrophlilic and mesophilic unicellular algae. 666
Journal of Phycology 34, 655-660. 667
Fares S., Mahmood T., Liu S., Loreto F. & Centritto M. (2011) Influence of growth temperature 668
and measuring temperature on isoprene emission, diffusive limitations of photosynthesis 669
and respiration in hybrid poplars. Atmospheric Environment 45, 155-161. 670
Funk J.L., Jones C.G., Baker C.J., Fuller H.M., Giardina C.P. & Lerdau M.T. (2003) Diurnal 671
variation in the basal emission rate of isoprene. Ecological Applications 13, 269-278. 672
Gandin A., Gutjahr S., Dizengremel P. & Lapointe L. (2011) Source-sink imbalance increases 673
with growth temperature in the spring geophyte Erythronium americanum. Journal of 674
Experimental Botany 62, 3467-3479. 675
Geron C., Guenther A., Sharkey T. & Arnts R.R. (2000) Temporal variability in basal isoprene 676
emission factor. Tree Physiology 20, 799-805. 677
Ghosh A.K., Ichii M., Asanuma K. & Kusutani A. (1996) Optimum and sub-optimal temperature 678
effects on stomata and photosynthesis rate of determinate soybeans. Acta Horticulturae 679
440, 81-86. 680
Granier C., Turc O. & Tardieu F. (2000) Co-ordination of cell division and tissue expansion in 681
sunflower, tobacco, and pea leaves: Dependence or independence of both processes? 682
Journal of Plant Growth Regulation 19, 45-54. 683
Guenther A.B., Jiang X., Heald C.L., Sakulyanontvittaya T., Duhl T., Emmons L.K. & Wang X. 684
(2012) The Model of Emissions of Gases and Aerosols from Nature version 2.1 685
(MEGAN2.1): an extended and updated framework for modeling biogenic emissions. 686
Geosci. Model. Dev. 5, 1471-1492. 687
Guenther A.B., Zimmerman P.R., Harley P.C., Monson R.K. & Fall R. (1993) Isoprene and 688
monoterpene emission rate variability: model evaluations and sensitivity analyses. 689
Journal of Geophysical Research 98, 12609-12617. 690
Hajdu I., Szilagyi A., Kardos J. & Zavodszky P. (2009) A link between hinge-bending domain 691
motions and the temperature dependence of catalysis in 3-isopropylmalate 692
dehydrogenase. Biophysical Journal 96, 5003-5012. 693 Acc
epte
d A
rticl
e

This article is protected by copyright. All rights reserved. 28
Harding S.A., Guikema J.A. & Paulsen G.M. (1990) Photosynthetic decline from high 694
temperature stress during maturation of wheat.II. Interaction with source and sink 695
processes. Plant Physiology 92, 654-658. 696
Hartikainen K., Nerg A.-M., Kivimäenpää M., Kontunen-Soppela S., Mäenpää M., Oksanen E., 697
Rousi M. & Holopainen T. (2009) Emissions of volatile organic compounds and leaf 698
structural characteristics of European aspen (Populus tremula) grown under elevated 699
ozone and temperature. Tree Physiology 29, 1163-1173. 700
Hewitt J.D., Casey L.L. & Zobel R.W. (1985) Effect of day length and night temperature on 701
starch accumulation and degradation in soybean. Annals of Botany 56, 513-522. 702
Hikosaka K. (1997) Modelling optimal temperature acclimation of the photosynthetic apparatus 703
in C3 plants with respect to nitrogen use. Annals of Botany 80, 721-730. 704
Hikosaka K., Murakami A. & Hirose T. (1999) Balancing carboxylation and regeneration of 705
ribulose-1,5-bisphosphate in leaf photosynthesis: temperature acclimation of an evergreen 706
tree, Quercus myrsinaefolia. Plant, Cell and Environment 22, 841-849. 707
Hopkins W.G. (1998) Introduction to plant physiology. (2nd ed.). John Wiley, New York. 708
Huner N.P.A. (1985) Acclimation of winter rye to cold hardening temperatures results in an 709
increased capacity for photosynthetic electron transport. Canadian Journal of Botany 63, 710
506-511. 711
Hüve K., Bichele I., Ivanova H., Keerberg O., Pärnik T., Rasulov B., Tobias M. & Niinemets Ü. 712
(2012) Temperature responses of dark respiration in relation to leaf sugar concentration. 713
Physiologia Plantarum 144, 320-334. 714
Hüve K., Bichele I., Tobias M. & Niinemets Ü. (2006) Heat sensitivity of photosynthetic electron 715
transport varies during the day due to changes in sugars and osmotic potential. Plant, Cell 716
and Environment 29, 212-228. 717
Ibrahim M.A., Mäenpää M., Hassinen V., Kontunen-Soppela S., Malec L., Rousi M., Pietikäinen 718
L., Tervahauta A., Kärenlampi S., Holopainen J.K. & Oksanen E.J. (2010) Elevation of 719
night-time temperature increases terpenoid emissions from Betula pendula and Populus 720
tremula. Journal of Experimental Botany 61, 1583-1595. 721
Ito S., Hara T., Kawanami Y., Watanabe T., Thiraporn K., Ohtake N., Sueyoshi K., Mitsui T., 722
Fukuyama T., Takahashi Y., Sato T., Sato A. & Ohyama T. (2009) Carbon and nitrogen 723
transport during grain filling in rice under high-temperature conditions. Journal of 724
Agronomy and Crop Science 195, 368-376. 725
Jin B., Wang L., Wang J., Jiang K.Z., Wang Y., Jiang X.X., Ni C.Y., Wang Y.L. & Teng N.J. 726
(2011) The effect of experimental warming on leaf functional traits, leaf structure and leaf 727
biochemistry in Arabidopsis thaliana. BMC Plant Biology 11, 35. 728
Köksal M., Zimmer I., Schnitzler J.-P. & Christianson D.W. (2010) Structure of isoprene 729
synthase illuminates the chemical mechanism of teragram atmospheric carbon emission. 730
Journal of Molecular Biology 402, 363-373. 731
Körner C., Neumayer M., Pelaez Menendez-Riedl S. & Smeets-Scheel A. (1989) Functional 732
morphology of mountain plants. Flora 182, 353-383. 733
Kunst L., Browse J. & Somerville C. (1989) A mutant of Arabidopsis deficient in desaturation of 734
palmitic acid in leaf lipids. Plant Physiology 90, 943-947. 735
Laisk A., Oja V., Rasulov B., Rämma H., Eichelmann H., Kasparova I., Pettai H., Padu E. & 736
Vapaavuori E. (2002) A computer-operated routine of gas exchange and optical 737
measurements to diagnose photosynthetic apparatus in leaves. Plant, Cell and 738
Environment 25, 923-943. 739
Leegood R.C. (1995) Effects of temperature on photosynthesis and photorespiration. In: 740
Environment and plant metabolism: flexibility and acclimation (ed N. Smirnoff), pp. 45-741
62. Bios Scientific Publishers Ltd., Oxford. 742
Acc
epte
d A
rticl
e

This article is protected by copyright. All rights reserved. 29
Li Z., Ratliff E.A. & Sharkey T.D. (2011) Effect of temperature on postillumination isoprene 743
emission in oak and poplar. Plant Physiology 155, 1037-1046. 744
Li Z. & Sharkey T.D. (2013) Molecular and pathway controls on biogenic volatile organic 745
compound emissions. In: Biology, controls and models of tree volatile organic compound 746
emissions (eds Ü. Niinemets & R.K. Monson), pp. 119-151. Springer, Berlin. 747
Lichtenthaler H.K. & Buschmann C. (2001) Chlorophylls and carotenoids: measurement and 748
characterisation by UV-VIS. In: Current protocols in food analytical chemistry (eds R.E. 749
Wrolstad, T.E. Acree, E.A. Decker, M.H. Penner, D.S. Reid, S.J. Schwartz, C.F. 750
Shoemaker, D.M. Smith, & P. Sporns), pp. F4.3.1-F4.3.8. John Wiley & Sons, Madison. 751
Loreto F., Pinelli P., Brancaleoni E. & Ciccioli P. (2004) 13
C labelling reveals chloroplastic and 752
extra-chloroplastic pools of dimethylallyl pyrophosphate and their contribution to 753
isoprene formation. Plant Physiology 135, 1903-1907. 754
Loveys B.R., Atkinson L.J., Sherlock D.J., Roberts R.L., Fitter A.H. & Atkin O.K. (2003) 755
Thermal acclimation of leaf and root respiration: an investigation comparing inherently 756
fast- and slow-growing plant species. Global Change Biology 9, 895-910. 757
Mahecha M.D., Reichstein M., Carvalhais N., Lasslop G., Lange H., Seneviratne S.I., Vargas R., 758
Ammann C., Arain M.A., Cescatti A., Janssens I.A., Migliavacca M., Montagnani L. & 759
Richardson A.D. (2010) Global convergence in the temperature sensitivity of respiration 760
at ecosystem level. Science 329, 838-840. 761
Mawson B.T. & Cummins W.R. (1989) Thermal acclimation of photosynthetic electron transport 762
activity by thylakoids of Saxifraga cernua. Plant Physiology 89, 325-332. 763
Mayrhofer S., Teuber M., Zimmer I., Louis S., Fischbach R.J. & Schnitzler J.-P. (2005) Diurnal 764
and seasonal variation of isoprene biosynthesis-related genes in grey poplar leaves. Plant 765
Physiology 139, 474–484. 766
Medlyn B.E., Dreyer E., Ellsworth D., Forstreuter M., Harley P.C., Kirschbaum M.U.F., Le Roux 767
X., Montpied P., Strassemeyer J., Walcroft A., Wang K. & Loustau D. (2002) 768
Temperature response of parameters of a biochemically based model of photosynthesis. 769
II. A review of experimental data. Plant, Cell and Environment 25, 1167-1179. 770
Mercer E.H. (1963) A scheme for section staining in electron microscopy. Journal of the Royal 771
Microscopical Society 81, 179-186. 772
Monson R.K., Jaeger C.H., Adams W.W., III, Driggers E.M., Silver G.M. & Fall R. (1992) 773
Relationships among isoprene emission rate, photosynthesis, and isoprene synthase 774
activity as influenced by temperature. Plant Physiology 98, 1175-1180. 775
Morcuende R., Pérez P., Martínez-Carrasco R., Martín del Molino I. & Sanchez de la Puente L. 776
(1996) Long- and short-term responses of leaf carbohydrate levels and photosynthesis to 777
decreased sink demand in soybean. Plant, Cell and Environment 19, 976-982. 778
Muhl Q.E., Du Toit E.S. & Robbertse P.J. (2011) Leaf adaptation to temperature regimes in 779
Moringa oleifera (horseradish tree). International Journal of Agriculture and Biology 13, 780
1021-1024. 781
Niinemets Ü. (2007) Photosynthesis and resource distribution through plant canopies. Plant, Cell 782
and Environment 30, 1052-1071. 783
Niinemets Ü. & Anten N.P.R. (2009) Packing the photosynthesis machinery: from leaf to canopy. 784
In: Photosynthesis in silico: understanding complexity from molecules to ecosystems (eds 785
A. Laisk, L. Nedbal, & Govindjee), pp. 363-399. Springer Verlag, Berlin. 786
Niinemets Ü., Oja V. & Kull O. (1999a) Shape of leaf photosynthetic electron transport versus 787
temperature response curve is not constant along canopy light gradients in temperate 788
deciduous trees. Plant, Cell and Environment 22, 1497-1514. 789 Acc
epte
d A
rticl
e

This article is protected by copyright. All rights reserved. 30
Niinemets Ü. & Sack L. (2006) Structural determinants of leaf light-harvesting capacity and 790
photosynthetic potentials. In: Progress in Botany (eds K. Esser, U.E. Lüttge, W. 791
Beyschlag, & J. Murata), pp. 385-419. Springer Verlag, Berlin. 792
Niinemets Ü., Tenhunen J.D., Canta N.R., Chaves M.M., Faria T., Pereira J.S. & Reynolds J.F. 793
(1999b) Interactive effects of nitrogen and phosphorus on the acclimation potential of 794
foliage photosynthetic properties of cork oak, Quercus suber, to elevated atmospheric 795
CO2 concentrations. Global Change Biology 5, 455-470. 796
Niinemets Ü., Tenhunen J.D., Harley P.C. & Steinbrecher R. (1999c) A model of isoprene 797
emission based on energetic requirements for isoprene synthesis and leaf photosynthetic 798
properties for Liquidambar and Quercus. Plant, Cell and Environment 22, 1319-1336. 799
Niinemets Ü., Wright I.J. & Evans J.R. (2009) Leaf mesophyll diffusion conductance in 35 800
Australian sclerophylls covering a broad range of foliage structural and physiological 801
variation. Journal of Experimental Botany 60, 2433-2449. 802
Ow L.F., Griffin K.L., Whitehead D., Walcroft A.S. & Turnbull M.H. (2008) Thermal 803
acclimation of leaf respiration but not photosynthesis in Populus deltoides x nigra. The 804
New Phytologist 178, 123-134. 805
Pammenter N.W., Loreto F. & Sharkey T.D. (1993) End product feedback effects on 806
photosynthetic electron transport. Photosynthesis Research 35, 5-14. 807
Pandey R., Chacko P.M., Choudhary M.L., Prasad K.V. & Pal M. (2007) Higher than optimum 808
temperature under CO2 enrichment influences stomata anatomical characters in rose 809
(Rosa hybrida). Scientia Horticulturae 113, 74-81. 810
Pearcy R.W. (1978) Effect of growth temperature on the fatty acid composition of the leaf lipids 811
in Atriplex lentiformis (Torr.) Wats. Plant Physiology 61, 484-486. 812
Poorter H., Niinemets Ü., Poorter L., Wright I.J. & Villar R. (2009) Tansley review. Causes and 813
consequences of variation in leaf mass per area (LMA): a meta-analysis. The New 814
Phytologist 182, 565-588. 815
Possell M. & Loreto F. (2013) The role of volatile organic compounds in plant resistance to 816
abiotic stresses: responses and mechanisms. In: Biology, controls and models of tree 817
volatile organic compound emissions (eds Ü. Niinemets & R.K. Monson), pp. 209-235. 818
Springer, Berlin. 819
Raison J.K. (1986) Alterations in the physical properties and thermal response of membrane 820
lipids: correlations with acclimation to chilly and high temperature. In: Frontiers of 821
membrane research in agriculture (eds J.B. St. John, E. Berlin, & P.C. Jackson), pp. 383-822
401. Rowman and Allanheld, Totoma, NJ, USA. 823
Ramos-Valdivia A.C., Heijden R. & Verpoorte R. (1997) Isopentenyl diphosphate isomerase: a 824
core enzyme in isoprenoid biosynthesis. A review of its biochemistry and function. Nat. 825
Prod. Rep. 14, 591-603. 826
Rasulov B., Bichele I., Laisk A. & Niinemets Ü. (2014) Competition between isoprene emission 827
and pigment synthesis during leaf development in aspen. Plant, Cell and Environment 37, 828
724-741. 829
Rasulov B., Copolovici L., Laisk A. & Niinemets Ü. (2009a) Postillumination isoprene emission: 830
in vivo measurements of dimethylallyldiphosphate pool size and isoprene synthase 831
kinetics in aspen leaves. Plant Physiology 149, 1609-1618. 832
Rasulov B., Hüve K., Bichele I., Laisk A. & Niinemets Ü. (2010) Temperature response of 833
isoprene emission in vivo reflects a combined effect of substrate limitations and isoprene 834
synthase activity: a kinetic analysis. Plant Physiology 154, 1558-1570. 835
Rasulov B., Hüve K., Laisk A. & Niinemets Ü. (2011) Induction of a longer-term component of 836
isoprene release in darkened aspen leaves: origin and regulation under different 837
environmental conditions. Plant Physiology 156, 816-831. 838
Acc
epte
d A
rticl
e

This article is protected by copyright. All rights reserved. 31
Rasulov B., Hüve K., Välbe M., Laisk A. & Niinemets Ü. (2009b) Evidence that light, carbon 839
dioxide and oxygen dependencies of leaf isoprene emission are driven by energy status in 840
hybrid aspen. Plant Physiology 151, 448-460. 841
Sage R.F. & Kubien D.S. (2007) The temperature response of C3 and C4 photosynthesis. Plant, 842
Cell and Environment 30, 1086-1106. 843
Sasaki K., Ohara K. & Yazaki K. (2005) Gene expression and characterization of isoprene 844
synthase from Populus alba. FEBS Letters 579, 2514-2518. 845
Schrader S.M., Wise R.R., Wacholtz W.F., Ort D.R. & Sharkey T.D. (2004) Thylakoid 846
membrane responses to moderately high leaf temperature in Pima cotton. Plant, Cell and 847
Environment 27, 725-735. 848
Schreiber U., Bilger W. & Neubauer C. (1994) Chlorophyll fluorescence as a nonintrusive 849
indicator for rapid assessment of in vivo photosynthesis. In: Ecophysiology of 850
photosynthesis (eds E.-D. Schulze & M.M. Caldwell), pp. 49-70. Springer Verlag, Berlin 851
- Heidelberg - New York - London - Paris - Tokyo - Hong Kong - Barcelona - Budapest. 852
Shanklin J. & Cahoon E.B. (1998) Desaturation and related modifications of fatty acids. Annual 853
Review of Plant Physiology and Plant Molecular Biology 49, 611-641. 854
Sharkey T.D. (1985) Photosynthesis in intact leaves of C3 plants: physics, physiology and rate 855
limitations. The Botanical Review 51, 53-105. 856
Sharkey T.D., Badger M.R., von Caemmerer S. & Andrews T.J. (2001) Increased heat sensitivity 857
of photosynthesis in tobacco plants with reduced Rubisco activase. Photosynthesis 858
Research 67, 147-156. 859
Sharkey T.D., Singsaas E.L., Lerdau M.T. & Geron C.D. (1999) Weather effects on isoprene 860
emission capacity and applications in emissions algorithms. Ecological Applications 9, 861
1132-1137. 862
Sharkey T.D. & Yeh S.S. (2001) Isoprene emission from plants. Annual Review of Plant 863
Physiology and Plant Molecular Biology 52, 407-436. 864
Singsaas E.L. & Sharkey T.D. (2000) The effects of high temperature on isoprene synthesis in 865
oak leaves. Plant, Cell and Environment 23, 751-757. 866
Smith N.G. & Dukes J.S. (2013) Plant respiration and photosynthesis in global-scale models: 867
incorporating acclimation to temperature and CO2. Global Change Biology 19, 45-63. 868
Starck Z., Wazynska Z. & Kucewicz O. (1993) Comparative effects of heat stress on 869
photosynthesis and chloroplast ultrastructure in tomato plants with source-sink modulated 870
by growth regulators. Acta Physiologiae Plantarum 15, 125-133. 871
Stitt M. & Hurry V.M. (2002) A plant for all seasons: alteration in photosynthetic carbon 872
metabolism during cold acclimation in Arabidopsis. Current Opinion in Plant Biology 5, 873
199-206. 874
Sun Z., Copolovici L. & Niinemets Ü. (2012a) Can the capacity for isoprene emissions acclimate 875
to environmental modifications during autumn senescence in temperate deciduous tree 876
species Populus tremula? Journal of Plant Research 125, 263-274. 877
Sun Z., Hüve K., Vislap V. & Niinemets Ü. (2013) Elevated [CO2] magnifies isoprene emissions 878
under heat and improves thermal resistance in hybrid aspen. Journal of Experimental 879
Botany 64, 5509-5523. 880
Sun Z., Niinemets Ü., Hüve K., Noe S.M., Rasulov B., Copolovici L. & Vislap V. (2012b) 881
Enhanced isoprene emission capacity and altered light responsiveness in aspen grown 882
under elevated atmospheric CO2 concentration. Global Change Biology 18, 3423-3440. 883
Tjoelker M.G., Oleksyn J. & Reich P.B. (1999) Acclimation of respiration to temperature and 884
CO2 in seedlings of boreal tree species in relation to plant size and relative growth rate. 885
Global Change Biology 5, 679-691. 886 Acc
epte
d A
rticl
e

This article is protected by copyright. All rights reserved. 32
Turnbull M.H., Murthy R. & Griffin K.L. (2002) The relative impacts of daytime and night-time 887
warming on photosynthetic capacity in Populus deltoides. Plant, Cell & Environment 25, 888
1729-1737. 889
Velikova V., Sharkey T.D. & Loreto F. (2012) Stabilization of thylakoid membranes in isoprene-890
emitting plants reduces formation of reactive oxygen species. Plant Signaling & Behavior 891
7, 139-141. 892
Velikova V., Várkonyi Z., Szabó M., Maslenkova L., Nogues I., Kovács L., Peeva V., Busheva 893
M., Garab G., Sharkey T.D. & Loreto F. (2011) Increased thermostability of thylakoid 894
membranes in isoprene-emitting leaves probed with three biophysical techniques. Plant 895
Physiology 157, 905-916. 896
Vickers C.E., Gershenzon J., Lerdau M.T. & Loreto F. (2009) A unified mechanism of action for 897
volatile isoprenoids in plant abiotic stress. Nature Chemical Biology 5, 283-291. 898
Vickers C.E., Possell M., Hewitt C.N. & Mullineaux P.M. (2010) Genetic structure and 899
regulation of isoprene synthase in poplar (Populus spp.). Plant Molecular Biology 73, 900
547-558. 901
von Caemmerer S. & Farquhar G.D. (1981) Some relationships between the biochemistry of 902
photosynthesis and the gas exchange of leaves. Planta 153, 376-387. 903
Wardlaw I.F. & Bagnall D. (1981) Phloem transport and the regulation of growth of Sorghum 904
bicolor (Moench) at low temperature. Plant Physiology 68, 411-414. 905
Way D.A. & Oren R. (2010) Differential responses to changes in growth temperature between 906
trees from different functional groups and biomes: a review and synthesis of data. Tree 907
Physiology 30, 669-688. 908
Way D.A., Schnitzler J.-P., Monson R.K. & Jackson R.B. (2011) Enhanced isoprene-related 909
tolerance of heat- and light-stressed photosynthesis at low, but not high, CO2 910
concentrations. Oecologia 166, 273-282. 911
Way D.A. & Yamori W. (2014) Thermal acclimation of photosynthesis: on the importance of 912
adjusting our definitions and accounting for thermal acclimation of respiration. 913
Photosynthesis Research 119, 89-100. 914
Weise S.E., Li Z., Sutter A.E., Corrion A., Banerjee A. & Sharkey T.D. (2013) Measuring 915
dimethylallyl diphosphate available for isoprene synthesis. Analytical Biochemistry 435, 916
27-34. 917
Wiberley A.E., Donohue A.R., Meier M.E., Westphal M.M. & Sharkey T.D. (2008) Regulation 918
of isoprene emission in Populus trichocarpa leaves subjected to changing growth 919
temperature. Plant, Cell and Environment 31, 258-267. 920
Wiberley A.E., Donohue A.R., Westphal M.M. & Sharkey T.D. (2009) Regulation of isoprene 921
emission from poplar leaves throughout a day. Plant Cell and Environment 32, 939-947. 922
Xu C.-Y., Salih A., Ghannoum O. & Tissue D.T. (2012) Leaf structural characteristics are less 923
important than leaf chemical properties in determining the response of leaf mass per area 924
and photosynthesis of Eucalyptus saligna to industrial-age changes in [CO2] and 925
temperature. Journal of Experimental Botany 63, 5829-5841. 926
Yamakawa H. & Hakata M. (2010) Atlas of rice grain filling-related metabolism under high 927
temperature: joint analysis of metabolome and transcriptome demonstrated inhibition of 928
starch accumulation and induction of amino acid accumulation. Plant and Cell Physiology 929
51, 795-809. 930
Yamasaki T., Yamakawa T., Yamane Y., Koike H., Satoh K. & Katoh S. (2002) Temperature 931
acclimation of photosynthesis and related changes in photosystem II electron transport in 932
Winter wheat. Plant Physiology 128, 1087-1097. 933 Acc
epte
d A
rticl
e

This article is protected by copyright. All rights reserved. 33
Yamori W., Noguchi K. & Terashima I. (2005) Temperature acclimation of photosynthesis in 934
spinach leaves: analyses of photosynthetic components and temperature dependencies of 935
photosynthetic partial reactions. Plant, Cell and Environment 28, 536-547. 936
Zhang R. & Sharkey T.D. (2009) Photosynthetic electron transport and proton flux under 937
moderate heat stress. Photosynthesis Research 100, 29-43. 938
Zhou C., Li Z., Wiberley-Bradford A.E., Weise S.E. & Sharkey T.D. (2013) Isopentenyl 939
diphosphate and dimethylallyl diphosphate ratio measured with recombinant isopentenyl 940
diphosphate isomerase and isoprene synthase. Analytical Biochemistry 440, 130-136. 941
942
943
Acc
epte
d A
rticl
e

This article is protected by copyright. All rights reserved. 34
Figure legends 944
945
Fig. 1. Representative cross-sections of hybrid aspen (Populus tremula X P. tremuloides, clone 946
H200) leaves (a, b) and chloroplasts (c, d) developed under control (day/night temperatures of 947
25/20 oC) and high temperature (35/27
oC) conditions. 948
949
Fig. 2. Temperature dependencies of light-saturated net assimilation rate (a, b), photosynthetic 950
electron transport rate estimated from chlorophyll fluorescence (Eq. 1, c, d) and dark respiration 951
rate (e, f) per unit leaf area (a, c, e) and per unit dry mass (b, d, f) in hybrid aspen grown at 952
day/night temperatures of 25/20 oC (control) and 35/27
oC (high temperature treatment). Data 953
were fitted by Eq. 3 (a-d) and Eq. 5 (e, f), and the values of the estimated optimum temperature 954
(Topt, Eq. 4) are indicated for (a) and (c) and the values of the activation energy Ha (Eq. 5) for 955
(e). The optimum temperatures in (a) and (c) are significantly different among the treatments (P < 956
0.005 for (a) and P < 0.02 for (c)). The measurements in a-d were conducted at an ambient CO2 957
concentration of 360 mol mol-1
and at an incident quantum flux density of 650 mol m-2
s-1
. 958
Data are means ± SE (n = 4). 959
960
Fig. 3. Temperature responses of stomatal conductance to water vapor and intercellular CO2 961
concentration in hybrid aspen grown at the contrasting temperature regimes, control (day/night 962
temperature 25/20 oC) and high temperature (35/27
oC). Measurement conditions, data 963
presentation and replicates as in Fig. 2. 964
965
Fig. 4. Temperature dependencies of isoprene emission rate (a, b) and the isoprene synthase 966
substrate dimethylallyl diphosphate (DMADP) pool size (c, d) per unit leaf area (a, c) and per 967 Acc
epte
d A
rticl
e

This article is protected by copyright. All rights reserved. 35
unit leaf dry mass (b, d) in hybrid aspen in dependence on growth temperature conditions, control 968
(day/night temperature 25/20 oC) vs. high temperature (35/27
oC). Measurement conditions and 969
data presentation as in Fig. 2. The optimum temperatures for isoprene emission and DMADP 970
pool size were not significantly different among the treatments (P > 0.1 for both). 971
972
Fig. 5. Temperature dependence of the rate constant of isoprene synthase (k) in hybrid aspen 973
grown under control (day/night temperature 25/20 oC) and high temperature (35/27
oC) 974
conditions. The first order reaction rate constant was estimated as the slope of the linear part of 975
dimethylallyl diphosphate pool size vs. isoprene emission rate relationship through the dark 976
decay of isoprene emission and corresponds to the environmental conditions (ambient CO2 977
concentration of 360 mol mol-1
, O2 concentration of 21% and incident quantum flux density of 978
650 mol m-2
s-1
) prior to leaf darkening. The number of replicates and data presentation as in 979
Fig. 2. The activation energies for k (Ha, kJ mol-1
, Eq. 3) are also demonstrated (P < 0.001 for 980
the difference among the treatments). 981
982
Fig. 6. Temperature-dependent changes in the percentage of photosynthetic carbon lost due to 983
isoprene emission in hybrid aspen leaves under control (day/night temperature 25/20 oC) and high 984
temperature (35/27 oC) treatments. 985
986
Fig. 7. Temperature responses of the apparent maximum capacity, Vmax, (a, b) and Michaelis-987
Menten constant Km (c, d) of isoprene synthase in hybrid aspen grown under control (day/night 988
temperature 25/20 oC) and high temperature (35/27
oC) treatments. Data fitting and presentation 989
as in Fig. 2. The optimum temperatures for Vmax were significantly different among the 990
treatments (P < 0.05), while the optimum temperatures for Km were not (P > 0.3). 991
992
Acc
epte
d A
rticl
e

This article is protected by copyright. All rights reserved. 36
Table 1. Leaf structural characteristics and pigment contents (mean ± SE) in hybrid aspen (P. 993
tremula x P. tremuloides, clone H200) grown at contrasting temperatures 994
995
Characteristic Growth temperature (day/night) 25/20
oC 35/27
oC
Leaf area (cm2) 67.5 ± 2.4a 82.3 ± 2.7b
Leaf dry mass per unit area (g m-2
) 47.6 ± 1.7a 30.5 ± 1.1b
Leaf thickness (μm) 133.9 ± 3.3a 93.5 ± 2.8b
Palisade mesophyll thickness (μm) 71.5 ± 3.1a 40.9 ± 2.6b
Spongy mesophyll thickness (μm) 44.3 ± 1.0a 34.4 ± 0.8b
Chloroplast number per cm2 leaf area (palisade) (38.8 ± 2.2)
.10
6a (29.3 ± 1.9)
.10
6a
Chloroplast number per cm2 leaf area (spongy) (7.5 ± 0.5)
.10
6a (7.1 ± 0.3)
.10
6a
Total chloroplast number per cm2 leaf area (palisade+spongy) (46.3 ± 3.7)
.10
6a (36.4 ± 2.3)
.10
6a
Chloroplast length (μm) 4.41 ± 0.17a 4.14 ± 0.18a
Chloroplast width (μm) 1.99 ± 0.09a 1.52 ± 0.11b
Chloroplast area (μm2) 7.23 ± 0.49a 4.99 ± 0.51b
Starch grain area per chloroplast (μm2) 1.05 ± 0.11a 0.047 ± 0.11b
Chlorophyll content per area (mg m-2
) 413 ± 16a 302 ± 12b
Chlorophyll content per dry mass (mg g-1
) 9.11 ± 0.27a 9.20 ± 0.29a
Chl a/b ratio 2.68 ± 0.11b 2.38 ± 0.08b
Carotenoid content (mg m-2
) 88.4 ± 2.9a 58.9 ± 2.2b
Carotenoid content per dry mass (mg g-1
) 1.80 ± 0.05a 1.90 ± 0.05a
Means with the same letter are not statistically different (P > 0.05 according to ANOVA, n = 6, 996
for leaf structural measurements and pigment contents and n = 30-42 for leaf anatomical 997
measurements) 998
999
1000
Acc
epte
d A
rticl
e

This article is protected by copyright. All rights reserved. 37
Table 2. Effects of growth temperature on average (± SE) foliage photosynthetic and isoprene 1001
emission characteristics in hybrid aspen (P. tremula x P. tremuloides, clone H200) 1002
1003
Trait Growth temperature (day/night)
25/20 oC 35/27
oC
Photosynthetic characteristics
An per area (mol m-2
s-1
) 14.73 ± 0.40a 11.18 ± 0.35b
An per dry mass (mol g-1
s-1
) 0.310 ± 0.009a 0.346 ± 0.018a
gs (mmol m-2
s-1
) 122 ± 7a 164 ± 8b
Ci (mol mol-1
) 182.3 ± 4.6a 247 ± 11b
Rd per area (mol m-2
s-1
) 2.07 ± 0.06b 1.36 ± 0.07b
Rd per dry mass (mol g-1
s-1
) 0.0436 ± 0.0016a 0.0421 ± 0.0023a
CO2 (mol mol-1
) 0.0441 ± 0.0026a 0.0338 ± 0.0025b
Vcmax per area (mol m-2
s-1
) 62.1 ± 1.6a 32.7 ± 1.4b
Vcmax per dry mass (mol g-1
s-1
) 1.309 ± 0.038a 1.010 ± 0.043b
Jmax per area (mol m-2
s-1
) 120 ± 6a 80 ± 6b
Jmax per dry mass (mol g-1
s-1
) 2.04 ± 0.06a 2.19 ± 0.15a
Isoprene emission characteristics
per area (nmol m-2
s-1
) 28.8 ± 2.8a 17.8 ± 1.0b
per dry mass (nmol g-1
s-1
) 0.60 ± 0.05a 0.547 ± 0.027a
CDMADP per area (nmol m-2
s-1
) 1110 ± 90a 650 ± 60b
CDMADP per dry mass (nmol g-1
s-1
) 23.5 ± 2.3a 20.0 ± 1.8a
k (s-1
) 0.0286 ± 0.0021a 0.0306 ± 0.0023a
Vmax per area (nmol m-2
s-1
) 79.5 ± 2.9a 48.8 ± 3.0b
Vmax per dry mass (nmol g-1
s-1
) 1.673 ± 0.037a 1.51 ± 0.11a
Km per area (nmol m-2
) 2640 ± 180a 1542 ± 30b
Km per dry mass (nmol g-1
) 55.6 ± 4.9a 47.7 ± 1.7a
I (mmol mol-1
) 0.0743 ± 0.0010a 0.0700 ± 0.0010b
The photosynthetic characteristics are: An - net assimilation rate; gs - stomatal conductance to 1004
water vapor; Ci - intercellular CO2 concentration; Rd - dark respiration rate; CO2 - quantum yield 1005
of photosynthesis for the incident light; Vcmax - apparent (Ci-based) maximum carboxylase 1006
activity of Rubisco; Jmax - apparent (Ci-based) capacity for photosynthetic electron transport. The 1007
isoprene emission characteristics are: I - isoprene emission rate; CDMADP - dimethylallyl 1008
diphosphate (DMADP) pool size; k - rate constant of isoprene synthase; Vmax - apparent 1009
maximum activity of isoprene synthase; Km - apparent Michaelis-Menten constant for isoprene 1010
synthase; I - quantum yield of isoprene emission for the incident light. 1011
1012
All measurements were conducted at 30 ºC, and saturating light intensity (Q) of 650 mol m-2
s-1
1013
was used for all measurements except for the quantum yields. The quantum yields were 1014
calculated as the linear slopes of the process rate vs. incident Q over the Q range of 20-75 mol 1015
m-2
s-1
and at the ambient [CO2] of 360 mol mol-1
and oxygen concentration of 21%. The value 1016
of Vcmax is reported as an average of Vcmax estimates determined from measurements at 21% and 1017
2% O2. Use of measurements at different O2 concentrations renders the apparent Vcmax estimates 1018
less sensitive to Rubisco kinetic characteristics employed in the calculations. 1019
Each value represents the mean ± SE of four measurements in different plants, and means 1020
with different lowercase letters are statistically different at P < 0.05 according to ANOVA. 1021
Acc
epte
d A
rticl
e

Acc
epte
d A
rticl
e

Acc
epte
d A
rticl
e
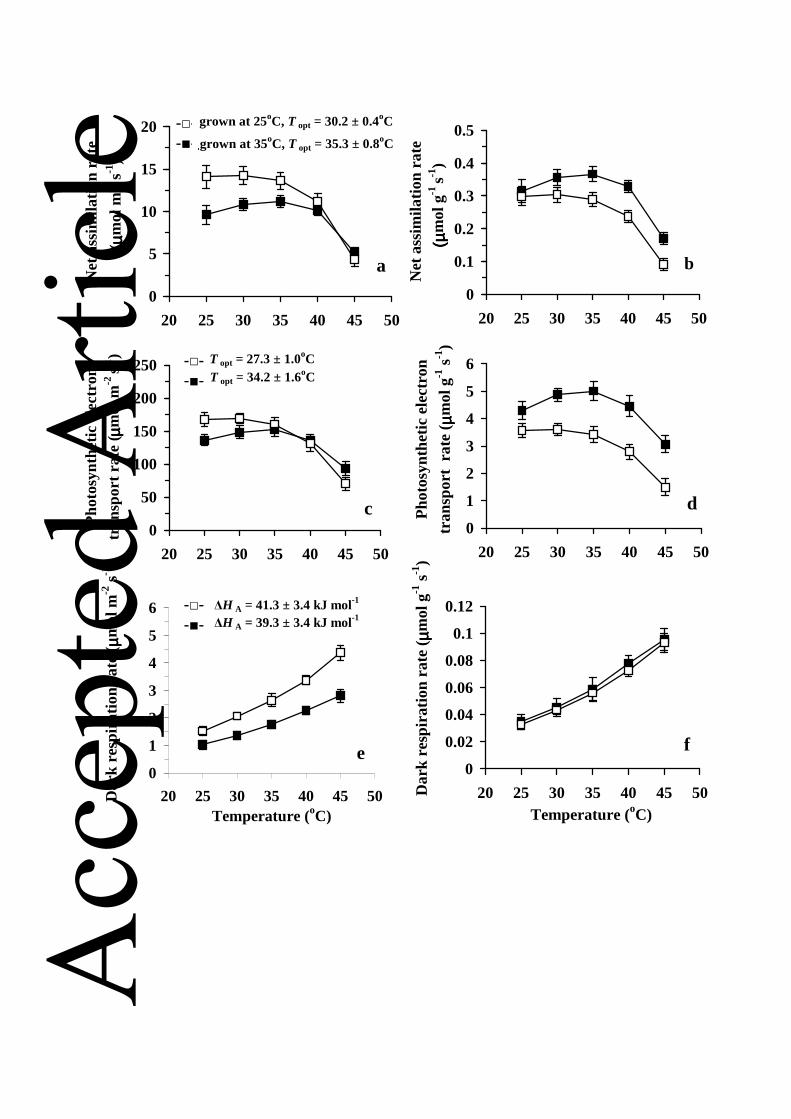
0
5
10
15
20
20 25 30 35 40 45 50
a
grown at 35oC, T opt = 35.3 ± 0.8oC
grown at 25oC, T opt = 30.2 ± 0.4oC
0
0.1
0.2
0.3
0.4
0.5
20 25 30 35 40 45 50
b
0
50
100
150
200
250
20 25 30 35 40 45 50
Pho
tosy
nthe
tic e
lect
ron
tran
spor
t rat
e ( µµ µµ
mol
m-2
s-1)
c0
1
2
3
4
5
6
20 25 30 35 40 45 50
Pho
tosy
nthe
tic e
lect
ron
tran
spor
t ra
te (
µµ µµmol
g-1
s-1
)
d
0
0.02
0.04
0.06
0.08
0.1
0.12
20 25 30 35 40 45 50Temperature (oC)
f
Net
ass
imila
tion
rate
Net
ass
imila
tion
rate
Dar
k re
spira
tion
rate
(µµ µµm
ol g
-1 s
-1)
0
1
2
3
4
5
6
20 25 30 35 40 45 50Temperature (oC)
e
∆H A = 41.3 ± 3.4 kJ mol-1
∆H A = 39.3 ± 3.4 kJ mol-1
Dar
k re
spira
tion
rate
(µµ µµm
ol m
-2 s
-1)
T opt = 27.3 ± 1.0oC T opt = 34.2 ± 1.6oC
-□--■-
-□--■-
-□--■-
( µµ µµm
ol m
-2 s
-1)
(µ(µ (µ(µm
ol g
-1 s-1
)
Acc
epte
d A
rticl
e

0
50
100
150
200
250
300
350
400
20 25 30 35 40 45 50
Temperature (oC)
0
50
100
150
200
250
300 grown at 35oC
grown at 25oC g s
C i
Stom
atal
con
duct
ance
(m
mol
m-2
s-1)
Inte
rcel
lula
r C
O2
conc
entr
atio
n ( µµ µµ
mol
mol
-1)-□-
-■-
Acc
epte
d A
rticl
e

0
20
40
60
80
20 25 30 35 40 45 50
grown at 35oC
grown at 25oC
a
T opt = 40.74 ± 0.45oC
T opt = 41.36 ± 0.23oC
0
0.5
1
1.5
2
2.5
20 25 30 35 40 45 50
Isop
rene
em
issi
on r
ate
(nm
ol g
-1 s
-1)
b
0
500
1000
1500
2000
20 25 30 35 40 45 50Temperature (oC)
c
DM
AD
P p
ool s
ize
(nm
ol m
-2)
0
10
20
30
40
50
20 25 30 35 40 45 50Temperature (oC)
DM
AD
P p
ool s
ize
(nm
ol g -
1 )
d
Isop
rene
em
issi
on r
ate
(nm
ol m-2
s-1
)
-□--■-
T opt = 38.44 ± 0.20oC
T opt = 39.4 ± 0.8oC
Acc
epte
d A
rticl
e

Acc
epte
d A
rticl
e

0
2
4
6
8
10
20 30 40 50
Temperature (°C)
Ph
oto
syn
the
tic c
arb
on
lo
st
du
eis
op
ren
e e
mis
sio
n (
%)
grown at 25 °C
grown at 35 °C
25 35 45
Acc
epte
d A
rticl
e

Acc
epte
d A
rticl
e