Can Education Be Meaningful? Answering a Fundamental Question Posed by Education Students
Upload
independentCategory
view
0download
0
ORIGINAL RESEARCH ARTICLEpublished: 01 July 2013
doi: 10.3389/fgene.2013.00122
Abundances of microRNAs in human cells can beestimated as a function of the abundances of YRHB andRHHK tetranucleotides in these microRNAs as an ill-posedinverse problem solutionMikhail P. Ponomarenko1*, Valentin V. Suslov1, Petr M. Ponomarenko1, Konstantin V. Gunbin1,Irina L. Stepanenko1, Oleg V. Vishnevsky1,2 and Nikolay A. Kolchanov1,2,3
1 Department of Systems Biology, Institute of Cytology and Genetics SB RAS, Novosibirsk, Russia2 Department of Natural Sciences, Novosibirsk State University, Novosibirsk, Russia3 Academic Council, National Research Centre “Kurchatov Institute”, Moscow, Russia
Edited by:
Peng Jin, Emory University Schoolof Medicine, USA
Reviewed by:
Peng Jin, Emory University Schoolof Medicine, USATohru Yoshihisa, University ofHyogo, Japan
*Correspondence:
Mikhail P. Ponomarenko,Department of Systems Biology,Institute of Cytology and Genetics,Siberian Branch of the RussianAcademy of Sciences, 10Lavrentyev Avenue, Novosibirsk630090, Russiae-mail: [email protected]
Mature microRNAs (miRNAs) are small endogenous non-coding RNAs 18–25 nt in length.They program the RNA Induced Silencing Complex (RISC) to make it inhibit eithermessenger RNAs or promoter DNAs. We have found that the mean abundance of miRNAsin Arabidopsis is correlated with the abundance of DRYD tetranucleotides near the 3′-endand the abundance of WRHB tetranucleotides in the center of the miRNA sequence.Based on this correlation, we have estimated miRNA abundances in seven organs ofthis plant, namely: inflorescences, stems, siliques, seedlings, roots, cauline, and rosetteleaves. We have also found that the mean affinity of miRNAs for two proteins in theArgonaute family (Ago2 and Ago3) in man is correlated with the abundance of YRHBtetranucleotides near the 3’-end and that the preference of miRNAs for Ago2 is correlatedwith the abundance of RHHK tetranucleotides in the center of the miRNA sequence. Thisallowed us to obtain statistically significant estimates of miRNA abundances in humanembryonic kidney cells, HEK293T. These findings in relation to two taxonomically distantentities (man and Arabidopsis) fit one another like pieces of a jigsaw puzzle, which allowedus to heuristically generalize them and state that the miRNA abundance in the humanbrain may be determined by the abundance of YRHB and RHHK tetranucleotides in thesemiRNAs.
Keywords: microRNA, Argonote, miRNA/Ago-affinity, miRNA abundance, quantitative sequence-activity
relationship (QSAR), ill-posed inverse problem, linear-additive approximation, “limiting stage” approximation
INTRODUCTIONMicroRNAs (miRNAs) are small endogenous non-coding RNAs(Kozomara and Griffiths-Jones, 2010). Within the canonical bio-genesis of miRNAs, their genes are transcribed by RNA poly-merase II into the primary transcripts (pri-miRNAs). SpecialMicroprocessor proteins cut away the first precursor of miRNA(pre-miRNA) and then the mature miRNA 18–25 nt in length(Kozomara and Griffiths-Jones, 2010). The miRNAs that mat-urate from other sources, including spliced-out introns (theyare the source of mirtrons) and transfer RNAs (tRNAs), arecalled “non-canonical.” They are less abundant in cells and theirmaturation time is deviant (Havens et al., 2012).
Mature miRNAs program the RISC (RNA-Induced SilencingComplex) to make it inhibit either messenger RNAs (mRNAs)or promoter DNAs (pDNAs) through the formation ofmRNA(pDNA):miRNA-RISC complexes (Song et al., 2004). Thefunction of the RISC depends upon what of the proteins in theArgonaute family is incorporated in the RISC (Gagnon and Corey,2012). In the 3D structure of the mRNA:miRNA-Ago-RISC inArchaea (Song et al., 2004), the Ago protein interacts with the3′-end of the miRNA.
Changes in mature miRNA abundance and sequence affect-ing interactions between the miRNAs and their targets wereassociated with various abnormalities, including neurodegener-ation (Barbato et al., 2009) and cancer (Winter and Diederichs,2011a). Winter and Diederichs (2011b) showed experimentallythat the miRNA abundance in Ago2-deficient cells treated by thetranscription inhibitor actinomycin D increases when the Ago2protein is introduced to them ectopically, because the affinity ofa particular miRNA for Ago2 protein influences the half-life ofthis miRNA in cells. Furthermore, Martinez and Gregory (2013)showed that Ago2 expression in mouse embryonic stem cells,originally low in Ago2 and then transfected by a vector containingAgo2, is dependent on miRNA abundance post-transcriptionally.Therefore, that miRNAs and human Ago2 stabilize each other isan experimentally established fact. How can we benefit from thisfact?
Although nobody has measured in vivo the affinity of maturemiRNAs for the different Argonaute proteins (Azuma-Mukaiet al., 2008) or the abundance of these miRNAs in cells (Axtelland Bartel, 2005) under identical experimental conditions simul-taneously, we have earlier demonstrated (Ponomarenko et al.,
www.frontiersin.org July 2013 | Volume 4 | Article 122 | 1
Ponomarenko et al. Estimation of microRNA abundances
2001) that the patterns and features found in silico in oneexperiment readily apply to the next, at least within the limitsof applicability of the theory that underlies these experiments.Consequently, we have had to work with disembodied exper-imental data on two taxonomically distant entities (man andArabidopsis) using original ACTIVITY tools (Ponomarenko et al.,1997). As a result, we have successfully found correlations whichfit each other like pieces of a puzzle created in two experiments,one by Winter and Diederichs (2011b) and another by Martinezand Gregory (2013), the mutual complementarity of which was,in fact, the starting point of our work. These correlations allowedus to generalize them into a heuristic hypothesis stating thatmiRNA abundance in the human brain depends on the abun-dance of YRHB and RHHK tetranucleotides in these miRNAs.This hypothesis was further confirmed using independent exper-imental data taken from the Sestan Brain Atlases (Kang et al.,2011).
The results obtained are discussed in terms of the “lim-iting stage” approximation, the linear-additive approximation,and an ill-posed inverse problem. This allowed us to concludethat in silico estimates like these can reach an acceptableaccuracy level for their practical consideration by cancer andneurodegeneration researches once the preference of these miR-NAs for the proteins in the Argonaute family has becomeknown, and so have yet unknown values of the affinityof any miRNA for two of the four proteins (50%), Ago1and Ago4, which is absolutely required for a more accurateapproximation.
MATERIALS AND METHODSNUCLEOTIDE SEQUENCESThe nucleotide sequences of the mature canonical ArabidopsismiRNAs {ξi} were taken from a work by Axtell and Bartel (2005),ξ ∈ {a, u, g, c}. Seventeen out of 27 miRNAs were used as thetraining dataset (Table 1). Because miRNA lengths varied from20 to 22 nt, our in silico processing was only confined to miR-NAs of a given length (in Tables 1, 2, these sequences are typed inCAPITALS).
The other 10 miRNAs (Figures 6, 7) were used as an indepen-dent experimental dataset (sequences not shown). Twenty-twoArabidopsis miRNAs taken from a work by Lu et al. (2005) wereused as independent experimental control datasets (Figure 4C;sequences not shown).
The nucleotide sequences of human mature miRNA weretaken from a work by Azuma-Mukai et al. (2008). Twelve out of28 mature canonical miRNAs were used as the training dataset(Table 2).
The other 16 canonical miRNAs were used as independentexperimental control datasets (Figure 3), and 48 miRNAs namedthe “individual variants” by Azuma-Mukai et al. (2008) becauseof their 5′- and/or 3′-terminal differences from canonical maturemiRNAs, which were associated by Azuma-Mukai et al. (2008)with (i) alternative maturation (Azuma-Mukai et al., 2008) or(ii) post-maturation processing (Azuma-Mukai et al., 2008), 96human miRNAs taken from a work by Bail et al. (2010), and 318human miRNAs taken from miRBase (Kozomara and Griffiths-Jones, 2010) according to their identifiers in the Sestan Brain
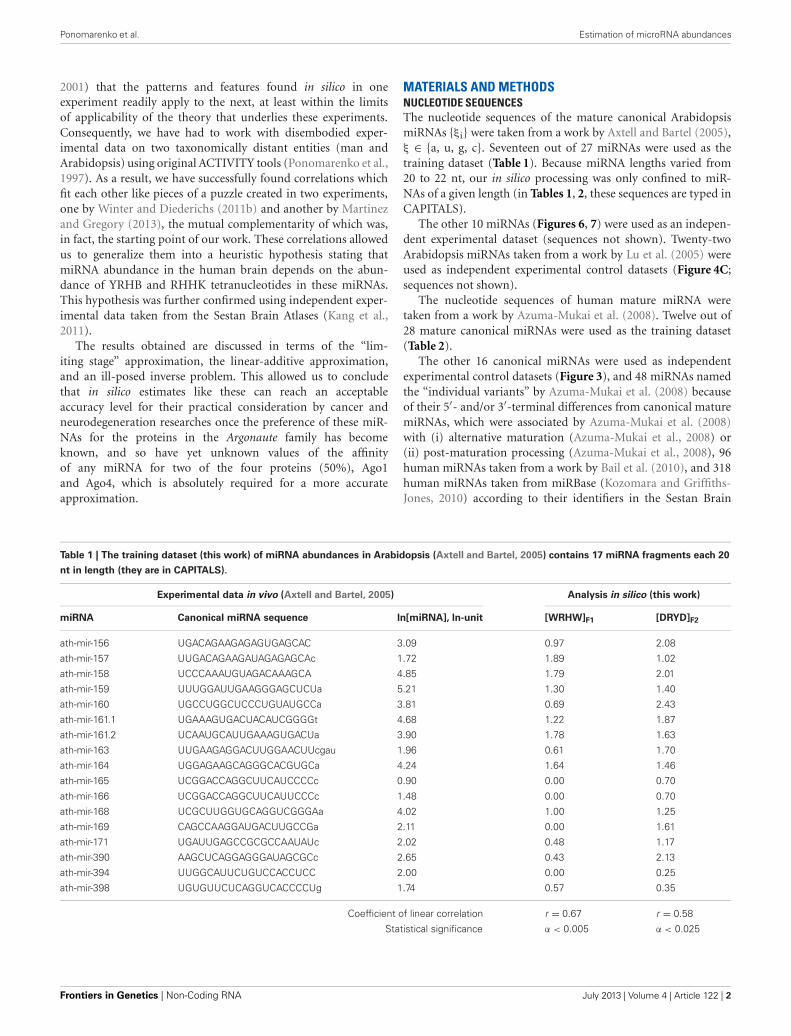
Table 1 | The training dataset (this work) of miRNA abundances in Arabidopsis (Axtell and Bartel, 2005) contains 17 miRNA fragments each 20
nt in length (they are in CAPITALS).
Experimental data in vivo (Axtell and Bartel, 2005) Analysis in silico (this work)
miRNA Canonical miRNA sequence ln[miRNA], ln-unit [WRHW]F1 [DRYD]F2
ath-mir-156 UGACAGAAGAGAGUGAGCAC 3.09 0.97 2.08
ath-mir-157 UUGACAGAAGAUAGAGAGCAc 1.72 1.89 1.02
ath-mir-158 UCCCAAAUGUAGACAAAGCA 4.85 1.79 2.01
ath-mir-159 UUUGGAUUGAAGGGAGCUCUa 5.21 1.30 1.40
ath-mir-160 UGCCUGGCUCCCUGUAUGCCa 3.81 0.69 2.43
ath-mir-161.1 UGAAAGUGACUACAUCGGGGt 4.68 1.22 1.87
ath-mir-161.2 UCAAUGCAUUGAAAGUGACUa 3.90 1.78 1.63
ath-mir-163 UUGAAGAGGACUUGGAACUUcgau 1.96 0.61 1.70
ath-mir-164 UGGAGAAGCAGGGCACGUGCa 4.24 1.64 1.46
ath-mir-165 UCGGACCAGGCUUCAUCCCCc 0.90 0.00 0.70
ath-mir-166 UCGGACCAGGCUUCAUUCCCc 1.48 0.00 0.70
ath-mir-168 UCGCUUGGUGCAGGUCGGGAa 4.02 1.00 1.25
ath-mir-169 CAGCCAAGGAUGACUUGCCGa 2.11 0.00 1.61
ath-mir-171 UGAUUGAGCCGCGCCAAUAUc 2.02 0.48 1.17
ath-mir-390 AAGCUCAGGAGGGAUAGCGCc 2.65 0.43 2.13
ath-mir-394 UUGGCAUUCUGUCCACCUCC 2.00 0.00 0.25
ath-mir-398 UGUGUUCUCAGGUCACCCCUg 1.74 0.57 0.35
Coefficient of linear correlation r = 0.67 r = 0.58
Statistical significance α < 0.005 α < 0.025
Frontiers in Genetics | Non-Coding RNA July 2013 | Volume 4 | Article 122 | 2
Ponomarenko et al. Estimation of microRNA abundances
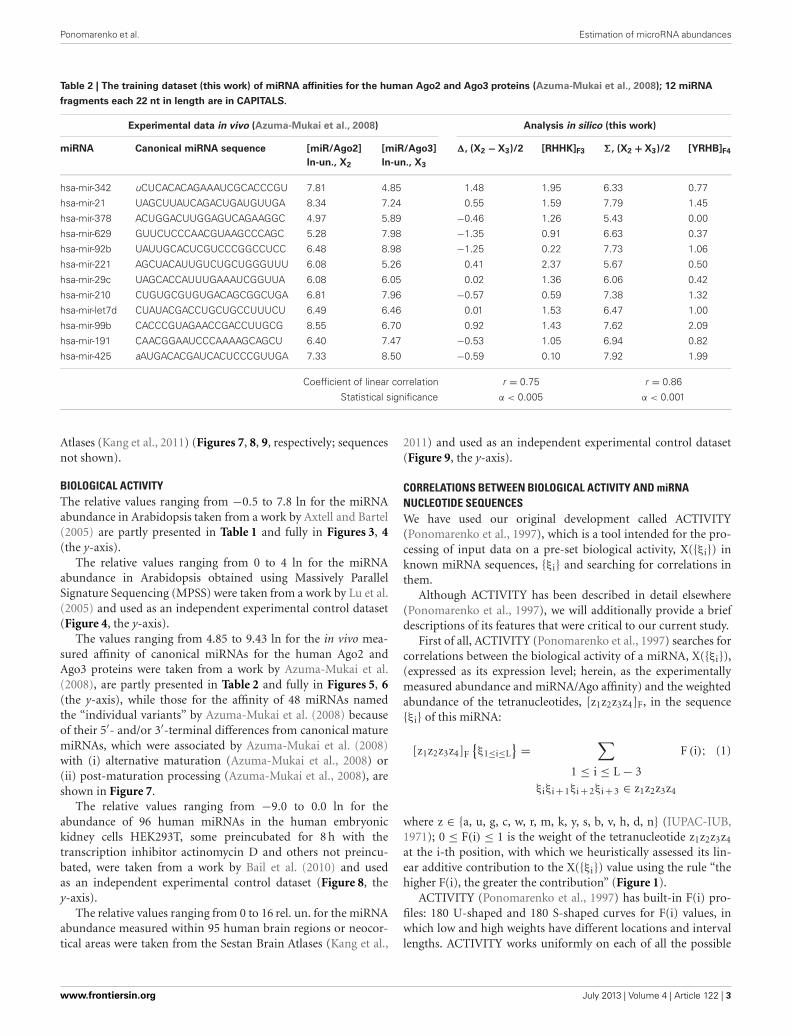
Table 2 | The training dataset (this work) of miRNA affinities for the human Ago2 and Ago3 proteins (Azuma-Mukai et al., 2008); 12 miRNA
fragments each 22 nt in length are in CAPITALS.
Experimental data in vivo (Azuma-Mukai et al., 2008) Analysis in silico (this work)
miRNA Canonical miRNA sequence [miR/Ago2]
ln-un., X2
[miR/Ago3]
ln-un., X3
�, (X2 − X3)/2 [RHHK]F3 �, (X2 + X3)/2 [YRHB]F4
hsa-mir-342 uCUCACACAGAAAUCGCACCCGU 7.81 4.85 1.48 1.95 6.33 0.77
hsa-mir-21 UAGCUUAUCAGACUGAUGUUGA 8.34 7.24 0.55 1.59 7.79 1.45
hsa-mir-378 ACUGGACUUGGAGUCAGAAGGC 4.97 5.89 −0.46 1.26 5.43 0.00
hsa-mir-629 GUUCUCCCAACGUAAGCCCAGC 5.28 7.98 −1.35 0.91 6.63 0.37
hsa-mir-92b UAUUGCACUCGUCCCGGCCUCC 6.48 8.98 −1.25 0.22 7.73 1.06
hsa-mir-221 AGCUACAUUGUCUGCUGGGUUU 6.08 5.26 0.41 2.37 5.67 0.50
hsa-mir-29c UAGCACCAUUUGAAAUCGGUUA 6.08 6.05 0.02 1.36 6.06 0.42
hsa-mir-210 CUGUGCGUGUGACAGCGGCUGA 6.81 7.96 −0.57 0.59 7.38 1.32
hsa-mir-let7d CUAUACGACCUGCUGCCUUUCU 6.49 6.46 0.01 1.53 6.47 1.00
hsa-mir-99b CACCCGUAGAACCGACCUUGCG 8.55 6.70 0.92 1.43 7.62 2.09
hsa-mir-191 CAACGGAAUCCCAAAAGCAGCU 6.40 7.47 −0.53 1.05 6.94 0.82
hsa-mir-425 aAUGACACGAUCACUCCCGUUGA 7.33 8.50 −0.59 0.10 7.92 1.99
Coefficient of linear correlation r = 0.75 r = 0.86
Statistical significance α < 0.005 α < 0.001
Atlases (Kang et al., 2011) (Figures 7, 8, 9, respectively; sequencesnot shown).
BIOLOGICAL ACTIVITYThe relative values ranging from −0.5 to 7.8 ln for the miRNAabundance in Arabidopsis taken from a work by Axtell and Bartel(2005) are partly presented in Table 1 and fully in Figures 3, 4(the y-axis).
The relative values ranging from 0 to 4 ln for the miRNAabundance in Arabidopsis obtained using Massively ParallelSignature Sequencing (MPSS) were taken from a work by Lu et al.(2005) and used as an independent experimental control dataset(Figure 4, the y-axis).
The values ranging from 4.85 to 9.43 ln for the in vivo mea-sured affinity of canonical miRNAs for the human Ago2 andAgo3 proteins were taken from a work by Azuma-Mukai et al.(2008), are partly presented in Table 2 and fully in Figures 5, 6(the y-axis), while those for the affinity of 48 miRNAs namedthe “individual variants” by Azuma-Mukai et al. (2008) becauseof their 5′- and/or 3′-terminal differences from canonical maturemiRNAs, which were associated by Azuma-Mukai et al. (2008)with (i) alternative maturation (Azuma-Mukai et al., 2008) or(ii) post-maturation processing (Azuma-Mukai et al., 2008), areshown in Figure 7.
The relative values ranging from −9.0 to 0.0 ln for theabundance of 96 human miRNAs in the human embryonickidney cells HEK293T, some preincubated for 8 h with thetranscription inhibitor actinomycin D and others not preincu-bated, were taken from a work by Bail et al. (2010) and usedas an independent experimental control dataset (Figure 8, they-axis).
The relative values ranging from 0 to 16 rel. un. for the miRNAabundance measured within 95 human brain regions or neocor-tical areas were taken from the Sestan Brain Atlases (Kang et al.,
2011) and used as an independent experimental control dataset(Figure 9, the y-axis).
CORRELATIONS BETWEEN BIOLOGICAL ACTIVITY AND miRNANUCLEOTIDE SEQUENCESWe have used our original development called ACTIVITY(Ponomarenko et al., 1997), which is a tool intended for the pro-cessing of input data on a pre-set biological activity, X({ξi}) inknown miRNA sequences, {ξi} and searching for correlations inthem.
Although ACTIVITY has been described in detail elsewhere(Ponomarenko et al., 1997), we will additionally provide a briefdescriptions of its features that were critical to our current study.
First of all, ACTIVITY (Ponomarenko et al., 1997) searches forcorrelations between the biological activity of a miRNA, X({ξi}),(expressed as its expression level; herein, as the experimentallymeasured abundance and miRNA/Ago affinity) and the weightedabundance of the tetranucleotides, [z1z2z3z4]F, in the sequence{ξi} of this miRNA:
[z1z2z3z4]F
{ξ1≤i≤L
} =∑
1 ≤ i ≤ L − 3ξiξi + 1ξi + 2ξi + 3 ∈ z1z2z3z4
F (i); (1)
where z ∈ {a, u, g, c, w, r, m, k, y, s, b, v, h, d, n} (IUPAC-IUB,1971); 0 ≤ F(i) ≤ 1 is the weight of the tetranucleotide z1z2z3z4
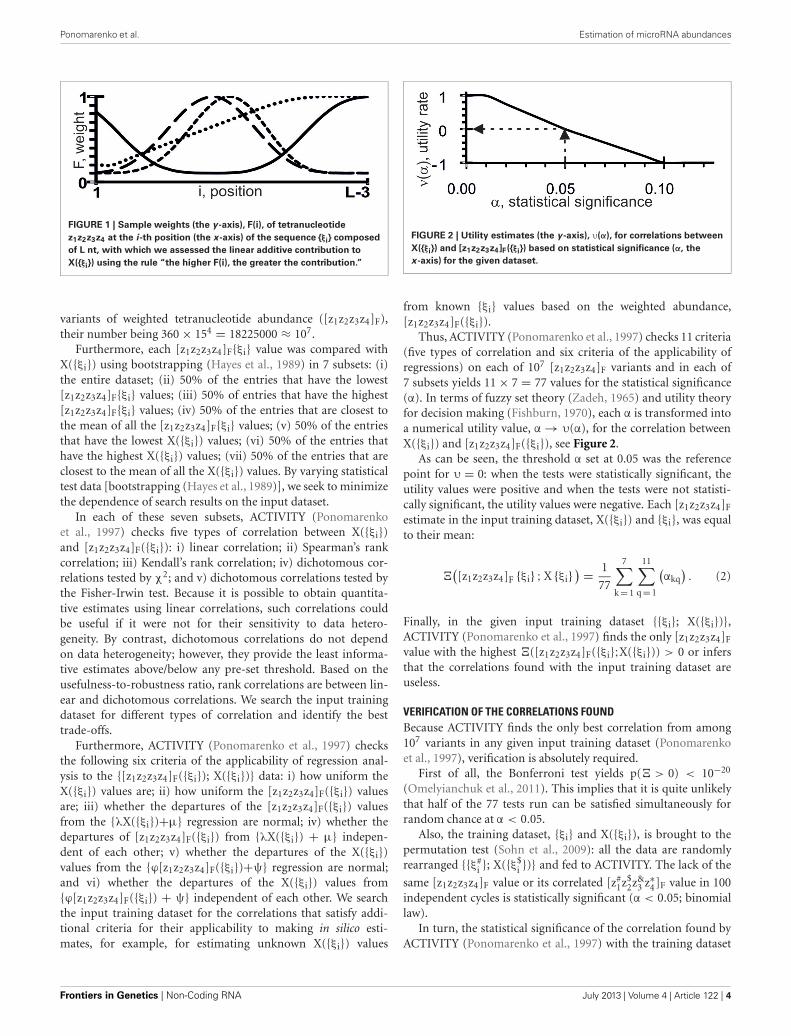
at the i-th position, with which we heuristically assessed its lin-ear additive contribution to the X({ξi}) value using the rule “thehigher F(i), the greater the contribution” (Figure 1).
ACTIVITY (Ponomarenko et al., 1997) has built-in F(i) pro-files: 180 U-shaped and 180 S-shaped curves for F(i) values, inwhich low and high weights have different locations and intervallengths. ACTIVITY works uniformly on each of all the possible
www.frontiersin.org July 2013 | Volume 4 | Article 122 | 3
Ponomarenko et al. Estimation of microRNA abundances
FIGURE 1 | Sample weights (the y -axis), F(i), of tetranucleotide
z1z2z3z4 at the i -th position (the x -axis) of the sequence {ξi} composed
of L nt, with which we assessed the linear additive contribution to
X({ξi}) using the rule “the higher F(i), the greater the contribution.”
variants of weighted tetranucleotide abundance ([z1z2z3z4]F),their number being 360 × 154 = 18225000 ≈ 107.
Furthermore, each [z1z2z3z4]F{ξi} value was compared withX({ξi}) using bootstrapping (Hayes et al., 1989) in 7 subsets: (i)the entire dataset; (ii) 50% of the entries that have the lowest[z1z2z3z4]F{ξi} values; (iii) 50% of entries that have the highest[z1z2z3z4]F{ξi} values; (iv) 50% of the entries that are closest tothe mean of all the [z1z2z3z4]F{ξi} values; (v) 50% of the entriesthat have the lowest X({ξi}) values; (vi) 50% of the entries thathave the highest X({ξi}) values; (vii) 50% of the entries that areclosest to the mean of all the X({ξi}) values. By varying statisticaltest data [bootstrapping (Hayes et al., 1989)], we seek to minimizethe dependence of search results on the input dataset.
In each of these seven subsets, ACTIVITY (Ponomarenkoet al., 1997) checks five types of correlation between X({ξi})and [z1z2z3z4]F({ξi}): i) linear correlation; ii) Spearman’s rankcorrelation; iii) Kendall’s rank correlation; iv) dichotomous cor-relations tested by χ2; and v) dichotomous correlations tested bythe Fisher-Irwin test. Because it is possible to obtain quantita-tive estimates using linear correlations, such correlations couldbe useful if it were not for their sensitivity to data hetero-geneity. By contrast, dichotomous correlations do not dependon data heterogeneity; however, they provide the least informa-tive estimates above/below any pre-set threshold. Based on theusefulness-to-robustness ratio, rank correlations are between lin-ear and dichotomous correlations. We search the input trainingdataset for different types of correlation and identify the besttrade-offs.
Furthermore, ACTIVITY (Ponomarenko et al., 1997) checksthe following six criteria of the applicability of regression anal-ysis to the {[z1z2z3z4]F({ξi}); X({ξi})} data: i) how uniform theX({ξi}) values are; ii) how uniform the [z1z2z3z4]F({ξi}) valuesare; iii) whether the departures of the [z1z2z3z4]F({ξi}) valuesfrom the {λX({ξi})+μ} regression are normal; iv) whether thedepartures of [z1z2z3z4]F({ξi}) from {λX({ξi}) + μ} indepen-dent of each other; v) whether the departures of the X({ξi})values from the {ϕ[z1z2z3z4]F({ξi})+ψ} regression are normal;and vi) whether the departures of the X({ξi}) values from{ϕ[z1z2z3z4]F({ξi}) + ψ} independent of each other. We searchthe input training dataset for the correlations that satisfy addi-tional criteria for their applicability to making in silico esti-mates, for example, for estimating unknown X({ξi}) values
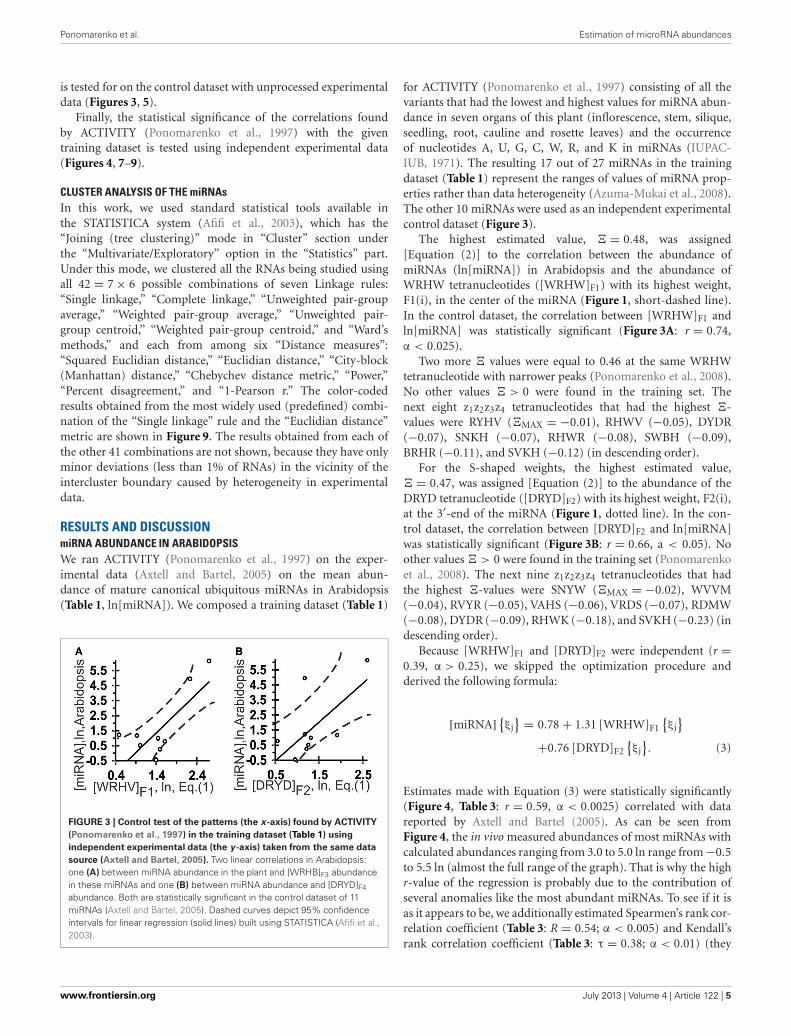
FIGURE 2 | Utility estimates (the y -axis), υ(α), for correlations between
X({ξi}) and [z1z2z3z4]F({ξi}) based on statistical significance (α, the
x -axis) for the given dataset.
from known {ξi} values based on the weighted abundance,[z1z2z3z4]F({ξi}).
Thus, ACTIVITY (Ponomarenko et al., 1997) checks 11 criteria(five types of correlation and six criteria of the applicability ofregressions) on each of 107 [z1z2z3z4]F variants and in each of7 subsets yields 11 × 7 = 77 values for the statistical significance(α). In terms of fuzzy set theory (Zadeh, 1965) and utility theoryfor decision making (Fishburn, 1970), each α is transformed intoa numerical utility value, α → υ(α), for the correlation betweenX({ξi}) and [z1z2z3z4]F({ξi}), see Figure 2.
As can be seen, the threshold α set at 0.05 was the referencepoint for υ = 0: when the tests were statistically significant, theutility values were positive and when the tests were not statisti-cally significant, the utility values were negative. Each [z1z2z3z4]F
estimate in the input training dataset, X({ξi}) and {ξi}, was equalto their mean:
�([z1z2z3z4]F {ξi} ; X {ξi}
) = 1
77
7∑
k = 1
11∑
q = 1
(αkq
). (2)
Finally, in the given input training dataset {{ξi}; X({ξi})},ACTIVITY (Ponomarenko et al., 1997) finds the only [z1z2z3z4]F
value with the highest �([z1z2z3z4]F({ξi};X({ξi})) > 0 or infersthat the correlations found with the input training dataset areuseless.
VERIFICATION OF THE CORRELATIONS FOUNDBecause ACTIVITY finds the only best correlation from among107 variants in any given input training dataset (Ponomarenkoet al., 1997), verification is absolutely required.
First of all, the Bonferroni test yields p(� > 0) < 10−20
(Omelyianchuk et al., 2011). This implies that it is quite unlikelythat half of the 77 tests run can be satisfied simultaneously forrandom chance at α < 0.05.
Also, the training dataset, {ξi} and X({ξi}), is brought to thepermutation test (Sohn et al., 2009): all the data are randomlyrearranged {{ξ#
i }; X({ξ$i })} and fed to ACTIVITY. The lack of the
same [z1z2z3z4]F value or its correlated [z#1z$
2z&3 z∗
4]F value in 100independent cycles is statistically significant (α < 0.05; binomiallaw).
In turn, the statistical significance of the correlation found byACTIVITY (Ponomarenko et al., 1997) with the training dataset
Frontiers in Genetics | Non-Coding RNA July 2013 | Volume 4 | Article 122 | 4
Ponomarenko et al. Estimation of microRNA abundances
is tested for on the control dataset with unprocessed experimentaldata (Figures 3, 5).
Finally, the statistical significance of the correlations foundby ACTIVITY (Ponomarenko et al., 1997) with the giventraining dataset is tested using independent experimental data(Figures 4, 7–9).
CLUSTER ANALYSIS OF THE miRNAsIn this work, we used standard statistical tools available inthe STATISTICA system (Afifi et al., 2003), which has the“Joining (tree clustering)” mode in “Cluster” section underthe “Multivariate/Exploratory” option in the “Statistics” part.Under this mode, we clustered all the RNAs being studied usingall 42 = 7 × 6 possible combinations of seven Linkage rules:“Single linkage,” “Complete linkage,” “Unweighted pair-groupaverage,” “Weighted pair-group average,” “Unweighted pair-group centroid,” “Weighted pair-group centroid,” and “Ward’smethods,” and each from among six “Distance measures”:“Squared Euclidian distance,” “Euclidian distance,” “City-block(Manhattan) distance,” “Chebychev distance metric,” “Power,”“Percent disagreement,” and “1-Pearson r.” The color-codedresults obtained from the most widely used (predefined) combi-nation of the “Single linkage” rule and the “Euclidian distance”metric are shown in Figure 9. The results obtained from each ofthe other 41 combinations are not shown, because they have onlyminor deviations (less than 1% of RNAs) in the vicinity of theintercluster boundary caused by heterogeneity in experimentaldata.
RESULTS AND DISCUSSIONmiRNA ABUNDANCE IN ARABIDOPSISWe ran ACTIVITY (Ponomarenko et al., 1997) on the exper-imental data (Axtell and Bartel, 2005) on the mean abun-dance of mature canonical ubiquitous miRNAs in Arabidopsis(Table 1, ln[miRNA]). We composed a training dataset (Table 1)
FIGURE 3 | Control test of the patterns (the x -axis) found by ACTIVITY
(Ponomarenko et al., 1997) in the training dataset (Table 1) using
independent experimental data (the y -axis) taken from the same data
source (Axtell and Bartel, 2005). Two linear correlations in Arabidopsis:one (A) between miRNA abundance in the plant and [WRHB]F3 abundancein these miRNAs and one (B) between miRNA abundance and [DRYD]F4
abundance. Both are statistically significant in the control dataset of 11miRNAs (Axtell and Bartel, 2005). Dashed curves depict 95% confidenceintervals for linear regression (solid lines) built using STATISTICA (Afifi et al.,2003).
for ACTIVITY (Ponomarenko et al., 1997) consisting of all thevariants that had the lowest and highest values for miRNA abun-dance in seven organs of this plant (inflorescence, stem, silique,seedling, root, cauline and rosette leaves) and the occurrenceof nucleotides A, U, G, C, W, R, and K in miRNAs (IUPAC-IUB, 1971). The resulting 17 out of 27 miRNAs in the trainingdataset (Table 1) represent the ranges of values of miRNA prop-erties rather than data heterogeneity (Azuma-Mukai et al., 2008).The other 10 miRNAs were used as an independent experimentalcontrol dataset (Figure 3).
The highest estimated value, � = 0.48, was assigned[Equation (2)] to the correlation between the abundance ofmiRNAs (ln[miRNA]) in Arabidopsis and the abundance ofWRHW tetranucleotides ([WRHW]F1) with its highest weight,F1(i), in the center of the miRNA (Figure 1, short-dashed line).In the control dataset, the correlation between [WRHW]F1 andln[miRNA] was statistically significant (Figure 3A: r = 0.74,α < 0.025).
Two more � values were equal to 0.46 at the same WRHWtetranucleotide with narrower peaks (Ponomarenko et al., 2008).No other values � > 0 were found in the training set. Thenext eight z1z2z3z4 tetranucleotides that had the highest �-values were RYHV (�MAX = −0.01), RHWV (−0.05), DYDR(−0.07), SNKH (−0.07), RHWR (−0.08), SWBH (−0.09),BRHR (−0.11), and SVKH (−0.12) (in descending order).
For the S-shaped weights, the highest estimated value,� = 0.47, was assigned [Equation (2)] to the abundance of theDRYD tetranucleotide ([DRYD]F2) with its highest weight, F2(i),at the 3′-end of the miRNA (Figure 1, dotted line). In the con-trol dataset, the correlation between [DRYD]F2 and ln[miRNA]was statistically significant (Figure 3B: r = 0.66, a < 0.05). Noother values � > 0 were found in the training set (Ponomarenkoet al., 2008). The next nine z1z2z3z4 tetranucleotides that hadthe highest �-values were SNYW (�MAX = −0.02), WVVM(−0.04), RVYR (−0.05), VAHS (−0.06), VRDS (−0.07), RDMW(−0.08), DYDR (−0.09), RHWK (−0.18), and SVKH (−0.23) (indescending order).
Because [WRHW]F1 and [DRYD]F2 were independent (r =0.39, α > 0.25), we skipped the optimization procedure andderived the following formula:
[miRNA] {ξj
} = 0.78 + 1.31 [WRHW]F1
{ξj
}
+0.76 [DRYD]F2
{ξj
}. (3)
Estimates made with Equation (3) were statistically significantly(Figure 4, Table 3: r = 0.59, α < 0.0025) correlated with datareported by Axtell and Bartel (2005). As can be seen fromFigure 4, the in vivo measured abundances of most miRNAs withcalculated abundances ranging from 3.0 to 5.0 ln range from −0.5to 5.5 ln (almost the full range of the graph). That is why the highr-value of the regression is probably due to the contribution ofseveral anomalies like the most abundant miRNAs. To see if it isas it appears to be, we additionally estimated Spearmen’s rank cor-relation coefficient (Table 3: R = 0.54; α < 0.005) and Kendall’srank correlation coefficient (Table 3: τ = 0.38; α < 0.01) (they
www.frontiersin.org July 2013 | Volume 4 | Article 122 | 5
Ponomarenko et al. Estimation of microRNA abundances
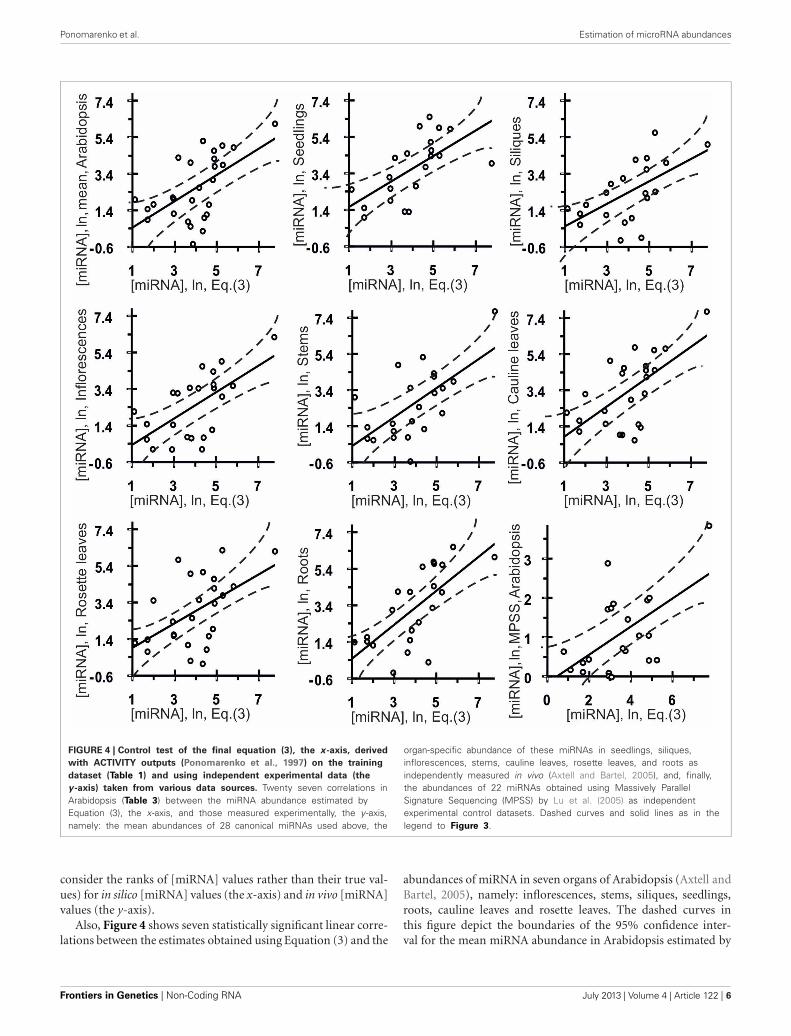
FIGURE 4 | Control test of the final equation (3), the x -axis, derived
with ACTIVITY outputs (Ponomarenko et al., 1997) on the training
dataset (Table 1) and using independent experimental data (the
y -axis) taken from various data sources. Twenty seven correlations inArabidopsis (Table 3) between the miRNA abundance estimated byEquation (3), the x-axis, and those measured experimentally, the y-axis,namely: the mean abundances of 28 canonical miRNAs used above, the
organ-specific abundance of these miRNAs in seedlings, siliques,inflorescences, stems, cauline leaves, rosette leaves, and roots asindependently measured in vivo (Axtell and Bartel, 2005), and, finally,the abundances of 22 miRNAs obtained using Massively ParallelSignature Sequencing (MPSS) by Lu et al. (2005) as independentexperimental control datasets. Dashed curves and solid lines as in thelegend to Figure 3.
consider the ranks of [miRNA] values rather than their true val-ues) for in silico [miRNA] values (the x-axis) and in vivo [miRNA]values (the y-axis).
Also, Figure 4 shows seven statistically significant linear corre-lations between the estimates obtained using Equation (3) and the
abundances of miRNA in seven organs of Arabidopsis (Axtell andBartel, 2005), namely: inflorescences, stems, siliques, seedlings,roots, cauline leaves and rosette leaves. The dashed curves inthis figure depict the boundaries of the 95% confidence inter-val for the mean miRNA abundance in Arabidopsis estimated by
Frontiers in Genetics | Non-Coding RNA July 2013 | Volume 4 | Article 122 | 6
Ponomarenko et al. Estimation of microRNA abundances
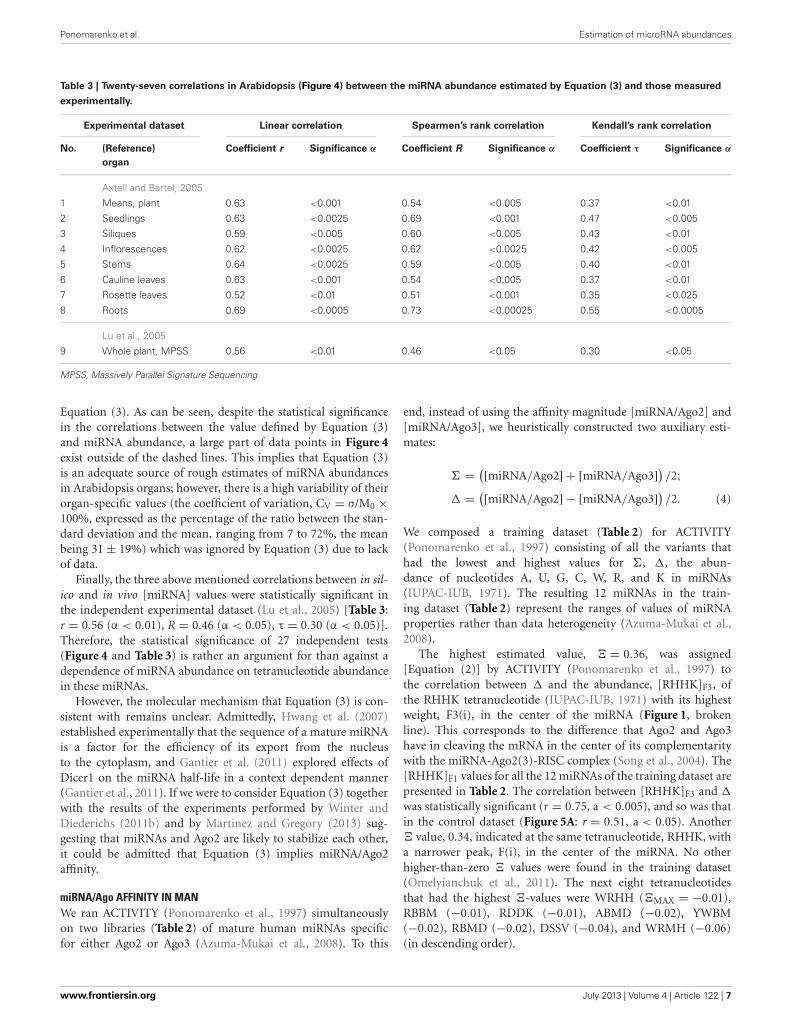
Table 3 | Twenty-seven correlations in Arabidopsis (Figure 4) between the miRNA abundance estimated by Equation (3) and those measured
experimentally.
Experimental dataset Linear correlation Spearmen’s rank correlation Kendall’s rank correlation
No. (Reference)
organ
Coefficient r Significance α Coefficient R Significance α Coefficient τ Significance α
Axtell and Bartel, 2005
1 Means, plant 0.63 <0.001 0.54 <0.005 0.37 <0.01
2 Seedlings 0.63 <0.0025 0.69 <0.001 0.47 <0.005
3 Siliques 0.59 <0.005 0.60 <0.005 0.43 <0.01
4 Inflorescences 0.62 <0.0025 0.62 <0.0025 0.42 <0.005
5 Stems 0.64 <0.0025 0.59 <0.005 0.40 <0.01
6 Cauline leaves 0.63 <0.001 0.54 <0.005 0.37 <0.01
7 Rosette leaves 0.52 <0.01 0.51 <0.001 0.35 <0.025
8 Roots 0.69 <0.0005 0.73 <0.00025 0.55 <0.0005
Lu et al., 2005
9 Whole plant, MPSS 0.56 <0.01 0.46 <0.05 0.30 <0.05
MPSS, Massively Parallel Signature Sequencing.
Equation (3). As can be seen, despite the statistical significancein the correlations between the value defined by Equation (3)and miRNA abundance, a large part of data points in Figure 4exist outside of the dashed lines. This implies that Equation (3)is an adequate source of rough estimates of miRNA abundancesin Arabidopsis organs; however, there is a high variability of theirorgan-specific values (the coefficient of variation, CV = σ/M0 ×100%, expressed as the percentage of the ratio between the stan-dard deviation and the mean, ranging from 7 to 72%, the meanbeing 31 ± 19%) which was ignored by Equation (3) due to lackof data.
Finally, the three above mentioned correlations between in sil-ico and in vivo [miRNA] values were statistically significant inthe independent experimental dataset (Lu et al., 2005) [Table 3:r = 0.56 (α < 0.01), R = 0.46 (α < 0.05), τ = 0.30 (α < 0.05)].Therefore, the statistical significance of 27 independent tests(Figure 4 and Table 3) is rather an argument for than against adependence of miRNA abundance on tetranucleotide abundancein these miRNAs.
However, the molecular mechanism that Equation (3) is con-sistent with remains unclear. Admittedly, Hwang et al. (2007)established experimentally that the sequence of a mature miRNAis a factor for the efficiency of its export from the nucleusto the cytoplasm, and Gantier et al. (2011) explored effects ofDicer1 on the miRNA half-life in a context dependent manner(Gantier et al., 2011). If we were to consider Equation (3) togetherwith the results of the experiments performed by Winter andDiederichs (2011b) and by Martinez and Gregory (2013) sug-gesting that miRNAs and Ago2 are likely to stabilize each other,it could be admitted that Equation (3) implies miRNA/Ago2affinity.
miRNA/Ago AFFINITY IN MANWe ran ACTIVITY (Ponomarenko et al., 1997) simultaneouslyon two libraries (Table 2) of mature human miRNAs specificfor either Ago2 or Ago3 (Azuma-Mukai et al., 2008). To this
end, instead of using the affinity magnitude [miRNA/Ago2] and[miRNA/Ago3], we heuristically constructed two auxiliary esti-mates:
� = ([miRNA/Ago2] + [miRNA/Ago3]) /2;� = ([miRNA/Ago2] − [miRNA/Ago3]) /2. (4)
We composed a training dataset (Table 2) for ACTIVITY(Ponomarenko et al., 1997) consisting of all the variants thathad the lowest and highest values for �, �, the abun-dance of nucleotides A, U, G, C, W, R, and K in miRNAs(IUPAC-IUB, 1971). The resulting 12 miRNAs in the train-ing dataset (Table 2) represent the ranges of values of miRNAproperties rather than data heterogeneity (Azuma-Mukai et al.,2008).
The highest estimated value, � = 0.36, was assigned[Equation (2)] by ACTIVITY (Ponomarenko et al., 1997) tothe correlation between � and the abundance, [RHHK]F3, ofthe RHHK tetranucleotide (IUPAC-IUB, 1971) with its highestweight, F3(i), in the center of the miRNA (Figure 1, brokenline). This corresponds to the difference that Ago2 and Ago3have in cleaving the mRNA in the center of its complementaritywith the miRNA-Ago2(3)-RISC complex (Song et al., 2004). The[RHHK]F1 values for all the 12 miRNAs of the training dataset arepresented in Table 2. The correlation between [RHHK]F3 and �
was statistically significant (r = 0.75, a < 0.005), and so was thatin the control dataset (Figure 5A: r = 0.51, a < 0.05). Another� value, 0.34, indicated at the same tetranucleotide, RHHK, witha narrower peak, F(i), in the center of the miRNA. No otherhigher-than-zero � values were found in the training dataset(Omelyianchuk et al., 2011). The next eight tetranucleotidesthat had the highest �-values were WRHH (�MAX = −0.01),RBBM (−0.01), RDDK (−0.01), ABMD (−0.02), YWBM(−0.02), RBMD (−0.02), DSSV (−0.04), and WRMH (−0.06)(in descending order).
www.frontiersin.org July 2013 | Volume 4 | Article 122 | 7
Ponomarenko et al. Estimation of microRNA abundances
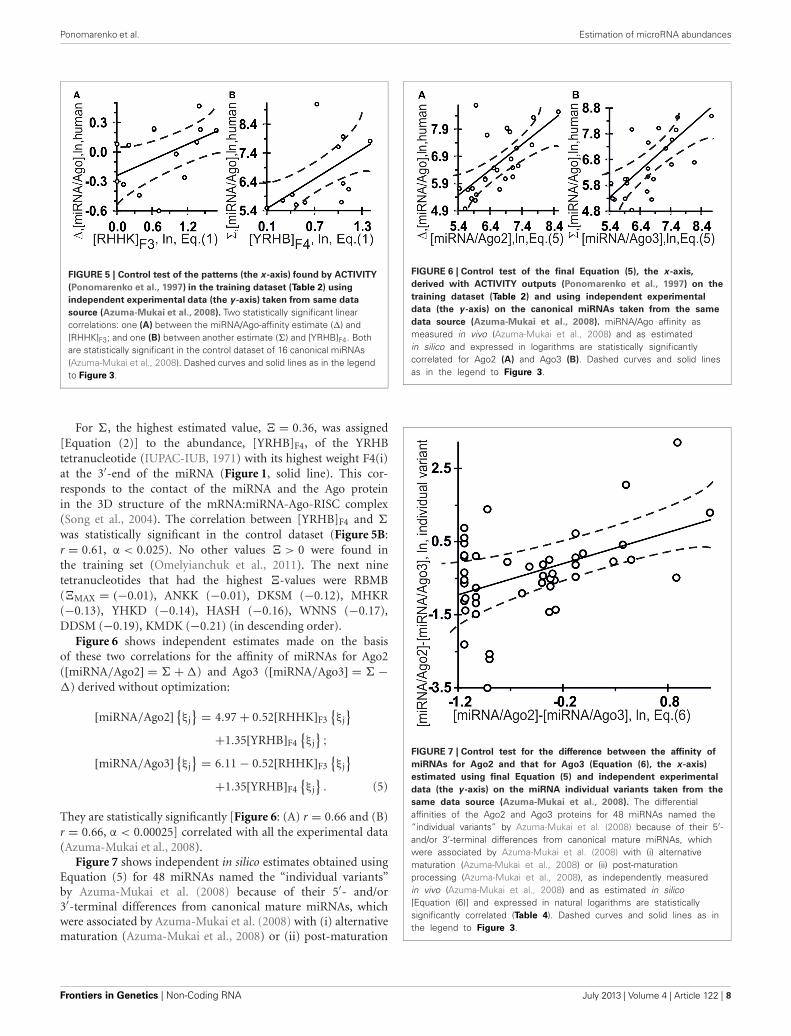
FIGURE 5 | Control test of the patterns (the x -axis) found by ACTIVITY
(Ponomarenko et al., 1997) in the training dataset (Table 2) using
independent experimental data (the y -axis) taken from same data
source (Azuma-Mukai et al., 2008). Two statistically significant linearcorrelations: one (A) between the miRNA/Ago-affinity estimate (�) and[RHHK]F3; and one (B) between another estimate (�) and [YRHB]F4. Bothare statistically significant in the control dataset of 16 canonical miRNAs(Azuma-Mukai et al., 2008). Dashed curves and solid lines as in the legendto Figure 3.
For �, the highest estimated value, � = 0.36, was assigned[Equation (2)] to the abundance, [YRHB]F4, of the YRHBtetranucleotide (IUPAC-IUB, 1971) with its highest weight F4(i)at the 3′-end of the miRNA (Figure 1, solid line). This cor-responds to the contact of the miRNA and the Ago proteinin the 3D structure of the mRNA:miRNA-Ago-RISC complex(Song et al., 2004). The correlation between [YRHB]F4 and �
was statistically significant in the control dataset (Figure 5B:r = 0.61, α < 0.025). No other values � > 0 were found inthe training set (Omelyianchuk et al., 2011). The next ninetetranucleotides that had the highest �-values were RBMB(�MAX = (−0.01), ANKK (−0.01), DKSM (−0.12), MHKR(−0.13), YHKD (−0.14), HASH (−0.16), WNNS (−0.17),DDSM (−0.19), KMDK (−0.21) (in descending order).
Figure 6 shows independent estimates made on the basisof these two correlations for the affinity of miRNAs for Ago2([miRNA/Ago2] = � + �) and Ago3 ([miRNA/Ago3] = � −�) derived without optimization:
[miRNA/Ago2] {ξj
} = 4.97 + 0.52[RHHK]F3{ξj
}
+1.35[YRHB]F4{ξj
} ;[miRNA/Ago3] {
ξj} = 6.11 − 0.52[RHHK]F3
{ξj
}
+1.35[YRHB]F4{ξj
}. (5)
They are statistically significantly [Figure 6: (A) r = 0.66 and (B)r = 0.66, α < 0.00025] correlated with all the experimental data(Azuma-Mukai et al., 2008).
Figure 7 shows independent in silico estimates obtained usingEquation (5) for 48 miRNAs named the “individual variants”by Azuma-Mukai et al. (2008) because of their 5′- and/or3′-terminal differences from canonical mature miRNAs, whichwere associated by Azuma-Mukai et al. (2008) with (i) alternativematuration (Azuma-Mukai et al., 2008) or (ii) post-maturation
FIGURE 6 | Control test of the final Equation (5), the x -axis,
derived with ACTIVITY outputs (Ponomarenko et al., 1997) on the
training dataset (Table 2) and using independent experimental
data (the y -axis) on the canonical miRNAs taken from the same
data source (Azuma-Mukai et al., 2008). miRNA/Ago affinity asmeasured in vivo (Azuma-Mukai et al., 2008) and as estimatedin silico and expressed in logarithms are statistically significantlycorrelated for Ago2 (A) and Ago3 (B). Dashed curves and solid linesas in the legend to Figure 3.
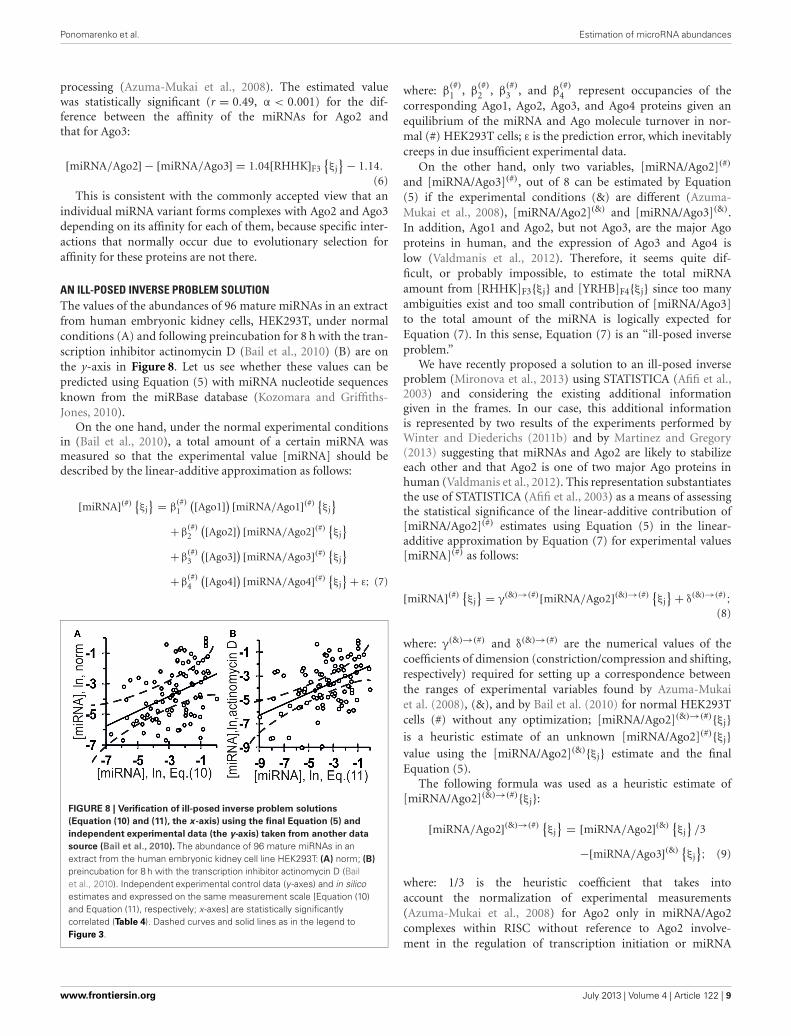
FIGURE 7 | Control test for the difference between the affinity of
miRNAs for Ago2 and that for Ago3 (Equation (6), the x -axis)
estimated using final Equation (5) and independent experimental
data (the y -axis) on the miRNA individual variants taken from the
same data source (Azuma-Mukai et al., 2008). The differentialaffinities of the Ago2 and Ago3 proteins for 48 miRNAs named the“individual variants” by Azuma-Mukai et al. (2008) because of their 5′-and/or 3′-terminal differences from canonical mature miRNAs, whichwere associated by Azuma-Mukai et al. (2008) with (i) alternativematuration (Azuma-Mukai et al., 2008) or (ii) post-maturationprocessing (Azuma-Mukai et al., 2008), as independently measuredin vivo (Azuma-Mukai et al., 2008) and as estimated in silico[Equation (6)] and expressed in natural logarithms are statisticallysignificantly correlated (Table 4). Dashed curves and solid lines as inthe legend to Figure 3.
Frontiers in Genetics | Non-Coding RNA July 2013 | Volume 4 | Article 122 | 8
Ponomarenko et al. Estimation of microRNA abundances
processing (Azuma-Mukai et al., 2008). The estimated valuewas statistically significant (r = 0.49, α < 0.001) for the dif-ference between the affinity of the miRNAs for Ago2 andthat for Ago3:
[miRNA/Ago2] − [miRNA/Ago3] = 1.04[RHHK]F3{ξj
} − 1.14.
(6)This is consistent with the commonly accepted view that an
individual miRNA variant forms complexes with Ago2 and Ago3depending on its affinity for each of them, because specific inter-actions that normally occur due to evolutionary selection foraffinity for these proteins are not there.
AN ILL-POSED INVERSE PROBLEM SOLUTIONThe values of the abundances of 96 mature miRNAs in an extractfrom human embryonic kidney cells, HEK293T, under normalconditions (A) and following preincubation for 8 h with the tran-scription inhibitor actinomycin D (Bail et al., 2010) (B) are onthe y-axis in Figure 8. Let us see whether these values can bepredicted using Equation (5) with miRNA nucleotide sequencesknown from the miRBase database (Kozomara and Griffiths-Jones, 2010).
On the one hand, under the normal experimental conditionsin (Bail et al., 2010), a total amount of a certain miRNA wasmeasured so that the experimental value [miRNA] should bedescribed by the linear-additive approximation as follows:
[miRNA](#){ξj
} = β(#)1
([Ago1]) [miRNA/Ago1](#){ξj
}
+ β(#)2
([Ago2]) [miRNA/Ago2](#){ξj
}
+ β(#)3
([Ago3]) [miRNA/Ago3](#){ξj
}
+ β(#)4
([Ago4]) [miRNA/Ago4](#){ξj
} + ε; (7)
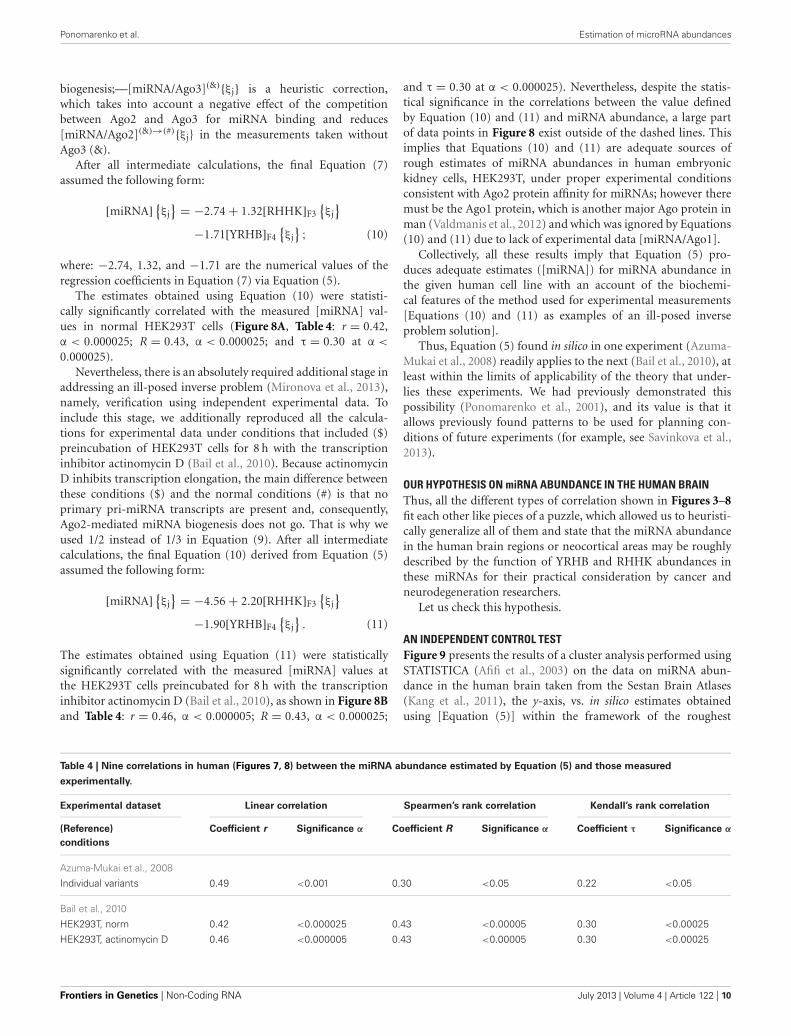
FIGURE 8 | Verification of ill-posed inverse problem solutions
(Equation (10) and (11), the x -axis) using the final Equation (5) and
independent experimental data (the y-axis) taken from another data
source (Bail et al., 2010). The abundance of 96 mature miRNAs in anextract from the human embryonic kidney cell line HEK293T: (A) norm; (B)
preincubation for 8 h with the transcription inhibitor actinomycin D (Bailet al., 2010). Independent experimental control data (y-axes) and in silicoestimates and expressed on the same measurement scale [Equation (10)and Equation (11), respectively; x-axes] are statistically significantlycorrelated (Table 4). Dashed curves and solid lines as in the legend toFigure 3.
where: β(#)1 , β
(#)2 , β
(#)3 , and β
(#)4 represent occupancies of the
corresponding Ago1, Ago2, Ago3, and Ago4 proteins given anequilibrium of the miRNA and Ago molecule turnover in nor-mal (#) HEK293T cells; ε is the prediction error, which inevitablycreeps in due insufficient experimental data.
On the other hand, only two variables, [miRNA/Ago2](#)
and [miRNA/Ago3](#), out of 8 can be estimated by Equation(5) if the experimental conditions (&) are different (Azuma-Mukai et al., 2008), [miRNA/Ago2](&) and [miRNA/Ago3](&).In addition, Ago1 and Ago2, but not Ago3, are the major Agoproteins in human, and the expression of Ago3 and Ago4 islow (Valdmanis et al., 2012). Therefore, it seems quite dif-ficult, or probably impossible, to estimate the total miRNAamount from [RHHK]F3{ξj} and [YRHB]F4{ξj} since too manyambiguities exist and too small contribution of [miRNA/Ago3]to the total amount of the miRNA is logically expected forEquation (7). In this sense, Equation (7) is an “ill-posed inverseproblem.”
We have recently proposed a solution to an ill-posed inverseproblem (Mironova et al., 2013) using STATISTICA (Afifi et al.,2003) and considering the existing additional informationgiven in the frames. In our case, this additional informationis represented by two results of the experiments performed byWinter and Diederichs (2011b) and by Martinez and Gregory(2013) suggesting that miRNAs and Ago2 are likely to stabilizeeach other and that Ago2 is one of two major Ago proteins inhuman (Valdmanis et al., 2012). This representation substantiatesthe use of STATISTICA (Afifi et al., 2003) as a means of assessingthe statistical significance of the linear-additive contribution of[miRNA/Ago2](#) estimates using Equation (5) in the linear-additive approximation by Equation (7) for experimental values[miRNA](#) as follows:
[miRNA](#){ξj
} = γ(&)→(#)[miRNA/Ago2](&)→(#){ξj
} + δ(&)→(#);(8)
where: γ(&)→(#) and δ(&)→(#) are the numerical values of thecoefficients of dimension (constriction/compression and shifting,respectively) required for setting up a correspondence betweenthe ranges of experimental variables found by Azuma-Mukaiet al. (2008), (&), and by Bail et al. (2010) for normal HEK293Tcells (#) without any optimization; [miRNA/Ago2](&)→(#){ξj}is a heuristic estimate of an unknown [miRNA/Ago2](#){ξj}value using the [miRNA/Ago2](&){ξj} estimate and the finalEquation (5).
The following formula was used as a heuristic estimate of[miRNA/Ago2](&)→(#){ξj}:
[miRNA/Ago2](&)→(#){ξj
} = [miRNA/Ago2](&){ξj
}/3
−[miRNA/Ago3](&){ξj
}; (9)
where: 1/3 is the heuristic coefficient that takes intoaccount the normalization of experimental measurements(Azuma-Mukai et al., 2008) for Ago2 only in miRNA/Ago2complexes within RISC without reference to Ago2 involve-ment in the regulation of transcription initiation or miRNA
www.frontiersin.org July 2013 | Volume 4 | Article 122 | 9
Ponomarenko et al. Estimation of microRNA abundances
biogenesis;—[miRNA/Ago3](&){ξj} is a heuristic correction,which takes into account a negative effect of the competitionbetween Ago2 and Ago3 for miRNA binding and reduces[miRNA/Ago2](&)→(#){ξj} in the measurements taken withoutAgo3 (&).
After all intermediate calculations, the final Equation (7)assumed the following form:
[miRNA] {ξj
} = −2.74 + 1.32[RHHK]F3{ξj
}
−1.71[YRHB]F4{ξj
} ; (10)
where: −2.74, 1.32, and −1.71 are the numerical values of theregression coefficients in Equation (7) via Equation (5).
The estimates obtained using Equation (10) were statisti-cally significantly correlated with the measured [miRNA] val-ues in normal HEK293T cells (Figure 8A, Table 4: r = 0.42,α < 0.000025; R = 0.43, α < 0.000025; and τ = 0.30 at α <
0.000025).Nevertheless, there is an absolutely required additional stage in
addressing an ill-posed inverse problem (Mironova et al., 2013),namely, verification using independent experimental data. Toinclude this stage, we additionally reproduced all the calcula-tions for experimental data under conditions that included ($)preincubation of HEK293T cells for 8 h with the transcriptioninhibitor actinomycin D (Bail et al., 2010). Because actinomycinD inhibits transcription elongation, the main difference betweenthese conditions ($) and the normal conditions (#) is that noprimary pri-miRNA transcripts are present and, consequently,Ago2-mediated miRNA biogenesis does not go. That is why weused 1/2 instead of 1/3 in Equation (9). After all intermediatecalculations, the final Equation (10) derived from Equation (5)assumed the following form:
[miRNA] {ξj
} = −4.56 + 2.20[RHHK]F3{ξj
}
−1.90[YRHB]F4{ξj
}. (11)
The estimates obtained using Equation (11) were statisticallysignificantly correlated with the measured [miRNA] values atthe HEK293T cells preincubated for 8 h with the transcriptioninhibitor actinomycin D (Bail et al., 2010), as shown in Figure 8Band Table 4: r = 0.46, α < 0.000005; R = 0.43, α < 0.000025;
and τ = 0.30 at α < 0.000025). Nevertheless, despite the statis-tical significance in the correlations between the value definedby Equation (10) and (11) and miRNA abundance, a large partof data points in Figure 8 exist outside of the dashed lines. Thisimplies that Equations (10) and (11) are adequate sources ofrough estimates of miRNA abundances in human embryonickidney cells, HEK293T, under proper experimental conditionsconsistent with Ago2 protein affinity for miRNAs; however theremust be the Ago1 protein, which is another major Ago protein inman (Valdmanis et al., 2012) and which was ignored by Equations(10) and (11) due to lack of experimental data [miRNA/Ago1].
Collectively, all these results imply that Equation (5) pro-duces adequate estimates ([miRNA]) for miRNA abundance inthe given human cell line with an account of the biochemi-cal features of the method used for experimental measurements[Equations (10) and (11) as examples of an ill-posed inverseproblem solution].
Thus, Equation (5) found in silico in one experiment (Azuma-Mukai et al., 2008) readily applies to the next (Bail et al., 2010), atleast within the limits of applicability of the theory that under-lies these experiments. We had previously demonstrated thispossibility (Ponomarenko et al., 2001), and its value is that itallows previously found patterns to be used for planning con-ditions of future experiments (for example, see Savinkova et al.,2013).
OUR HYPOTHESIS ON miRNA ABUNDANCE IN THE HUMAN BRAINThus, all the different types of correlation shown in Figures 3–8fit each other like pieces of a puzzle, which allowed us to heuristi-cally generalize all of them and state that the miRNA abundancein the human brain regions or neocortical areas may be roughlydescribed by the function of YRHB and RHHK abundances inthese miRNAs for their practical consideration by cancer andneurodegeneration researchers.
Let us check this hypothesis.
AN INDEPENDENT CONTROL TESTFigure 9 presents the results of a cluster analysis performed usingSTATISTICA (Afifi et al., 2003) on the data on miRNA abun-dance in the human brain taken from the Sestan Brain Atlases(Kang et al., 2011), the y-axis, vs. in silico estimates obtainedusing [Equation (5)] within the framework of the roughest
Table 4 | Nine correlations in human (Figures 7, 8) between the miRNA abundance estimated by Equation (5) and those measured
experimentally.
Experimental dataset Linear correlation Spearmen’s rank correlation Kendall’s rank correlation
(Reference)
conditions
Coefficient r Significance α Coefficient R Significance α Coefficient τ Significance α
Azuma-Mukai et al., 2008
Individual variants 0.49 <0.001 0.30 <0.05 0.22 <0.05
Bail et al., 2010
HEK293T, norm 0.42 <0.000025 0.43 <0.00005 0.30 <0.00025
HEK293T, actinomycin D 0.46 <0.000005 0.43 <0.00005 0.30 <0.00025
Frontiers in Genetics | Non-Coding RNA July 2013 | Volume 4 | Article 122 | 10
Ponomarenko et al. Estimation of microRNA abundances
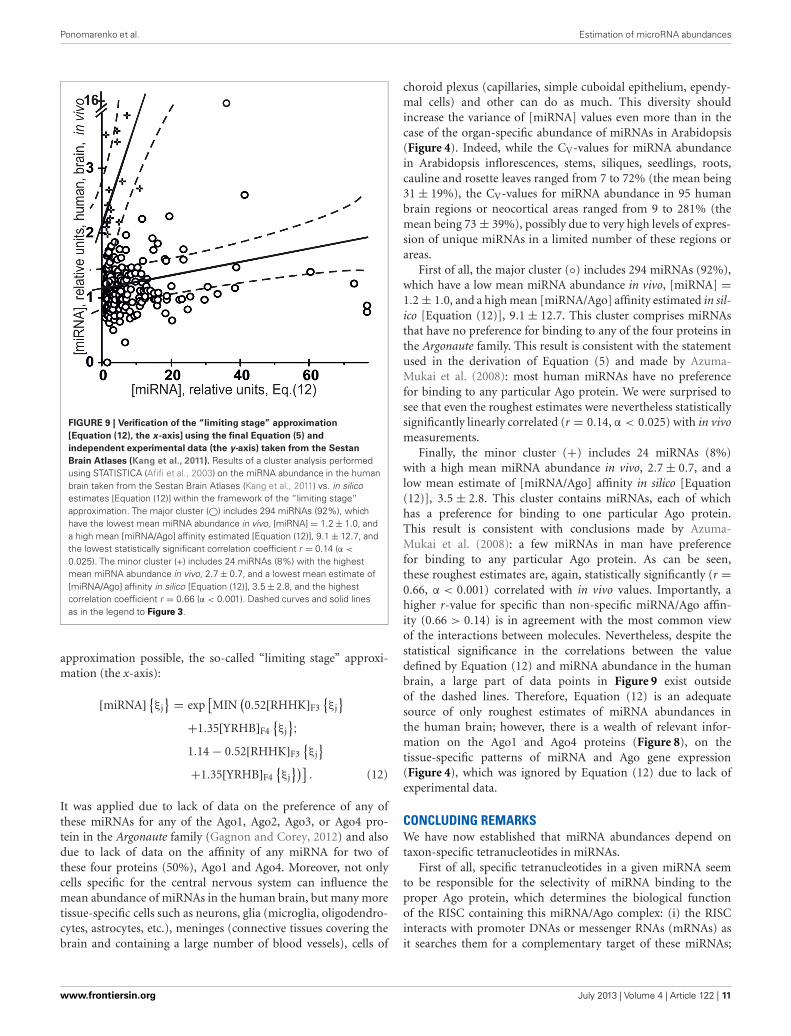
FIGURE 9 | Verification of the “limiting stage” approximation
[Equation (12), the x -axis] using the final Equation (5) and
independent experimental data (the y-axis) taken from the Sestan
Brain Atlases (Kang et al., 2011). Results of a cluster analysis performedusing STATISTICA (Afifi et al., 2003) on the miRNA abundance in the humanbrain taken from the Sestan Brain Atlases (Kang et al., 2011) vs. in silicoestimates [Equation (12)] within the framework of the “limiting stage”approximation. The major cluster (©) includes 294 miRNAs (92%), whichhave the lowest mean miRNA abundance in vivo, [miRNA] = 1.2 ± 1.0, anda high mean [miRNA/Ago] affinity estimated [Equation (12)], 9.1 ± 12.7, andthe lowest statistically significant correlation coefficient r = 0.14 (α <
0.025). The minor cluster (+) includes 24 miRNAs (8%) with the highestmean miRNA abundance in vivo, 2.7 ± 0.7, and a lowest mean estimate of[miRNA/Ago] affinity in silico [Equation (12)], 3.5 ± 2.8, and the highestcorrelation coefficient r = 0.66 (α < 0.001). Dashed curves and solid linesas in the legend to Figure 3.
approximation possible, the so-called “limiting stage” approxi-mation (the x-axis):
[miRNA] {ξj
} = exp[MIN
(0.52[RHHK]F3
{ξj
}
+1.35[YRHB]F4{ξj
};1.14 − 0.52[RHHK]F3
{ξj
}
+1.35[YRHB]F4{ξj
})]. (12)
It was applied due to lack of data on the preference of any ofthese miRNAs for any of the Ago1, Ago2, Ago3, or Ago4 pro-tein in the Argonaute family (Gagnon and Corey, 2012) and alsodue to lack of data on the affinity of any miRNA for two ofthese four proteins (50%), Ago1 and Ago4. Moreover, not onlycells specific for the central nervous system can influence themean abundance of miRNAs in the human brain, but many moretissue-specific cells such as neurons, glia (microglia, oligodendro-cytes, astrocytes, etc.), meninges (connective tissues covering thebrain and containing a large number of blood vessels), cells of
choroid plexus (capillaries, simple cuboidal epithelium, ependy-mal cells) and other can do as much. This diversity shouldincrease the variance of [miRNA] values even more than in thecase of the organ-specific abundance of miRNAs in Arabidopsis(Figure 4). Indeed, while the CV-values for miRNA abundancein Arabidopsis inflorescences, stems, siliques, seedlings, roots,cauline and rosette leaves ranged from 7 to 72% (the mean being31 ± 19%), the CV-values for miRNA abundance in 95 humanbrain regions or neocortical areas ranged from 9 to 281% (themean being 73 ± 39%), possibly due to very high levels of expres-sion of unique miRNAs in a limited number of these regions orareas.
First of all, the major cluster (◦) includes 294 miRNAs (92%),which have a low mean miRNA abundance in vivo, [miRNA] =1.2 ± 1.0, and a high mean [miRNA/Ago] affinity estimated in sil-ico [Equation (12)], 9.1 ± 12.7. This cluster comprises miRNAsthat have no preference for binding to any of the four proteins inthe Argonaute family. This result is consistent with the statementused in the derivation of Equation (5) and made by Azuma-Mukai et al. (2008): most human miRNAs have no preferencefor binding to any particular Ago protein. We were surprised tosee that even the roughest estimates were nevertheless statisticallysignificantly linearly correlated (r = 0.14, α < 0.025) with in vivomeasurements.
Finally, the minor cluster (+) includes 24 miRNAs (8%)with a high mean miRNA abundance in vivo, 2.7 ± 0.7, and alow mean estimate of [miRNA/Ago] affinity in silico [Equation(12)], 3.5 ± 2.8. This cluster contains miRNAs, each of whichhas a preference for binding to one particular Ago protein.This result is consistent with conclusions made by Azuma-Mukai et al. (2008): a few miRNAs in man have preferencefor binding to any particular Ago protein. As can be seen,these roughest estimates are, again, statistically significantly (r =0.66, α < 0.001) correlated with in vivo values. Importantly, ahigher r-value for specific than non-specific miRNA/Ago affin-ity (0.66 > 0.14) is in agreement with the most common viewof the interactions between molecules. Nevertheless, despite thestatistical significance in the correlations between the valuedefined by Equation (12) and miRNA abundance in the humanbrain, a large part of data points in Figure 9 exist outsideof the dashed lines. Therefore, Equation (12) is an adequatesource of only roughest estimates of miRNA abundances inthe human brain; however, there is a wealth of relevant infor-mation on the Ago1 and Ago4 proteins (Figure 8), on thetissue-specific patterns of miRNA and Ago gene expression(Figure 4), which was ignored by Equation (12) due to lack ofexperimental data.
CONCLUDING REMARKSWe have now established that miRNA abundances depend ontaxon-specific tetranucleotides in miRNAs.
First of all, specific tetranucleotides in a given miRNA seemto be responsible for the selectivity of miRNA binding to theproper Ago protein, which determines the biological functionof the RISC containing this miRNA/Ago complex: (i) the RISCinteracts with promoter DNAs or messenger RNAs (mRNAs) asit searches them for a complementary target of these miRNAs;
www.frontiersin.org July 2013 | Volume 4 | Article 122 | 11
Ponomarenko et al. Estimation of microRNA abundances
and (ii) the RISC binds to or cleave this target within the mRNAs(Gagnon and Corey, 2012).
Based on these facts, we have for the first time obtained quan-titative in silico estimates for miRNA abundances in the humanembryonic kidney cells HEK293T by roughly solving an ill-posedinverse problem, and, also, in the human brain regions or neocor-tical areas, which are statistically significantly correlated with datafrom independent experiments on measuring these values in vivotaken from a work by Bail et al. (2010) and from the Sestan BrainAtlases (Kang et al., 2011), respectively. These two correlationsare consistent with the results of two experiments, one performedby Winter and Diederichs (2011b) and another, by Martinezand Gregory (2013), and demonstrated that the affinity of miR-NAs for Ago proteins is an influence on the abundance of bothmiRNAs and Ago proteins due to their mutual co-stabilizationin cells.
In summary, we have found evidence that in silico estimateslike these can reach an acceptable accuracy level for their practicalconsideration by cancer and neurodegeneration researches once
the preference of these miRNAs for the proteins in the Argonautefamily has become known, and so have yet unknown values ofthe affinity of any miRNA for two of the four proteins (50%),Ago1 and Ago4, which is absolutely required for a more accu-rate approximation. In any case, because the abundance estimates[Equations (5)—(12)] for most miRNAs were more statisticallysignificant in a particular human cell line (Figure 8) than in thehuman brain as a whole (Figure 9), the more specifically a targetfor estimation is defined (the entire human organism, an organ,a part, a tissue, a cell type, or a cell line), the more suitable theseestimates are for practical use.
ACKNOWLEDGMENTSThis work was in part supported by grants 11-04-01254, 12-04-01584, and 12-04-33112 from RFBR; NSc-5278.2012.4 from thePresident of Russia, Project 8740 from the Russian Ministry ofEducation and Science, Integration Project #136 from the SB RAS,Integration Project 6.8 and 30.29 from the RAS Presidium, andProgram 28 from the RAS.
REFERENCESAfifi, A. A., Clark, V. A., and May,
S. (2003). Computer-AidedMultivariate Analysis. New York,NY: CRC Press.
Axtell, M. J., and Bartel, D. P. (2005).Antiquity of microRNAs andtheir targets in land plants.Plant Cell 17, 1658–1673. doi:10.1105/tpc.105.032185
Azuma-Mukai, A., Oguri, H.,Mituyama, T., Qian, Z. R., Asai,K., Siomi, H., et al. (2008).Characterization of endoge-nous human Argonautes andtheir miRNA partners in RNAsilencing. Proc. Natl. Acad. Sci.U.S.A. 105, 7964–7969. doi:10.1073/pnas.0800334105
Bail, S., Swerdel, M., Liu, H.,Jiao, X., Goff, L. A., Hart, R.P., et al. (2010). Differentialregulation of microRNA stabil-ity. RNA 16, 1032–1039. doi:10.1261/rna.1851510
Barbato, C., Ruberti, F., and Cogoni,C. (2009). Searching for MIND:microRNAs in neurodegenerativediseases. J. Biomed. Biotechnol.2009, 871313. doi: 10.1155/2009/871313
Fishburn, P. (1970). Utility Theory forDecision Making. New York, NY:John Wiley and Sons.
Gagnon, K. T., and Corey, D. R. (2012).Argonaute and the nuclear RNAs:new pathways for RNA-mediatedcontrol of gene expression. NucleicAcid Ther. 22, 3–16.
Gantier, M. P., McCoy, C. E., Rusinova,I., Saulep, D., Wang, D., Xu, D.,et al. (2011). Analysis of microRNAturnover in mammalian cells fol-lowing Dicer1 ablation. Nucleic
Acids Res. 39, 5692–5703. doi:10.1093/nar/gkr148
Havens, M. A., Reich, A. A., Duelli,D. M., and Hastings, M. L. (2012).Biogenesis of mammalian microR-NAs by a non-canonical process-ing pathway. Nucleic Acids Res. 40,4626–4640. doi: 10.1093/nar/gks026
Hayes, K. G., Perl, M. L., and Efron,B. (1989). Application of the boot-strap statistical method to the tau-decay-mode problem. Phys. Rev.D. Part. Fields 39, 274–279. doi:10.1103/PhysRevD.39.274
Hwang, H. W., Wentzel, E. A., andMendell, J. T. (2007). A hexanu-cleotide element directs microRNAnuclear import. Science 315, 97–100.doi: 10.1126/science.1136235
IUPAC-IUB (1971). Commissionon biochemical nomencla-ture (CBN). Abbreviations andsymbols for nucleic acids, polynu-cleotides and their constituents.J. Mol. Biol. 55, 299–310. doi:10.1016/0022-2836(71)90319-6
Kang, H. J., Kawasawa, Y. I., Cheng,F., Zhu, Y., Xu, X., Li, M., et al.(2011). Spatio-temporal tran-scriptome of the human brain.Nature. 478, 483–489. doi: 10.1038/nature10523
Kozomara, A., and Griffiths-Jones,S. (2010). MiRBase: integrat-ing microRNA annotation anddeep-seencing data. NucleicAcids Res. 39, D152–D157. doi:10.1093/nar/gkq1027
Lu, C., Tej, S. S., Luo, S., Haudenschild,C. D., Meyers, B. C., and Green, P.J. (2005). Elucidation of the smallRNA component of the transcrip-tome. Science 309, 1567–1569. doi:10.1126/science.1114112
Martinez, N. J., and Gregory, R.I. (2013). Argonaute2 expres-sion is post-transcriptionallycoupled to microRNA abun-dance. RNA 19, 605–612. doi:10.1261/rna.036434.112
Mironova, V. V., Omelyanchuk, N. A.,Savina, M. S., Ponomarenko, P. M.,Ponomarenko, M. P., Likhoshvai, V.A., et al. (2013). How multiple auxinresponsive elements may interactin plant promoters: a reverseproblem solution. J. Bioinform.Comput. Biol. 11, 1340011. doi:10.1142/S0219720013400118
Omelyianchuk, N. A., Ponomarenko, P.M., and Ponomarenko, M. P. (2011).The nucleotide sequence featuresof the mature microRNA seem tobe responsible for the affinity tohuman Ago2 AND Ago3 proteins.Mol. Biol. (Mosk). 45, 327–336. doi:10.1134/S0026893311020130.
Ponomarenko, J. V., Furman, D. P.,Frolov, A. S., Podkolodny, N. L.,Orlova, G. V., Ponomarenko, M. P.,et al. (2001). ACTIVITY: a databaseon DNA/RNA sites activity adaptedto apply sequence-activity relation-ships from one system to another.Nucleic Acids Res. 29, 284–287. doi:10.1093/nar/29.1.284
Ponomarenko, M. P., Kolchanova, A.N., and Kolchanov, N. A. (1997).Generating programs for predict-ing the activity of functional sites.J. Comput. Biol. 4, 83–90. doi:10.1089/cmb.1997.4.83
Ponomarenko, M. P., Omelyanchuk,N. A., Katokhin, A. V., Savinskaya,S. A., and Kolchanov, N. A. (2008).The abundance of microRNAin Arabidopsis thaliana cor-relates with the presence of
tetranucleotides WRHW andDRYD in their sequences. Dokl.Biochem. Biophys. 420, 150–154.doi: 10.1134/S1607672908030149
Savinkova, L., Drachkova, I.,Arshinova, T., Ponomarenko, P.,Ponomarenko, M., and Kolchanov,N. (2013). An experimental ver-ification of the predicted effectsof promoter TATA-box polymor-phisms associated with humandiseases on interactions betweenthe TATA boxes and TATA-bindingprotein. PLoS ONE 8:e54626.doi: 10.1371/journal.pone.0054626
Sohn, I., Owzar, K., George, S. L.,Kim, S., and Jung, S. H. (2009). Apermutation-based multiple testingmethod for time-course microarrayexperiments. BMC Bioinformatics10:336. doi: 10.1186/1471-2105-10-336
Song, J. J., Smith, S. K., Hannon, G. J.,and Joshua-Tor, L. (2004). Crystalstructure of Argonaute and itsimplications for RISC slicer activ-ity. Science 305, 1434–1437. doi:10.1126/science.1102514
Valdmanis, P. N., Gu, S., Schuermann,N., Sethupathy, P., Grimm, D.,and Kay, M. A. (2012). Expressiondeterminants of mammalianargonaute proteins in medi-ating gene silencing. NucleicAcids Res 40, 3704–3713. doi:10.1093/nar/gkr1274
Winter, J., and Diederichs, S. (2011a).MicroRNA biogenesis and cancer.Methods Mol. Biol. 676, 3–22. doi:10.1007/978-1-60761-863-8_1
Winter, J., and Diederichs, S.(2011b). Argonaute proteinsregulate microRNA stability:
Frontiers in Genetics | Non-Coding RNA July 2013 | Volume 4 | Article 122 | 12
Ponomarenko et al. Estimation of microRNA abundances
Increased microRNA abun-dance by Argonaute proteins isdue to microRNA stabilization.RNA Biol. 8, 1149–1157. doi:10.4161/rna.8.6.17665
Zadeh, L. (1965). Fuzzi sets.Inform. Control 8, 338–353. doi:10.1016/S0019-9958(65)90241-X
Conflict of Interest Statement: Theauthors declare that the research
was conducted in the absence of anycommercial or financial relationshipsthat could be construed as a potentialconflict of interest.
Received: 31 August 2012; accepted: 06June 2013; published online: 01 July2013.Citation: Ponomarenko MP, SuslovVV, Ponomarenko PM, Gunbin KV,
Stepanenko IL, Vishnevsky OV andKolchanov NA (2013) Abundances ofmicroRNAs in human cells can be esti-mated as a function of the abundancesof YRHB and RHHK tetranucleotides inthese microRNAs as an ill-posed inverseproblem solution. Front. Genet. 4:122.doi: 10.3389/fgene.2013.00122This article was submitted to Frontiersin Non-Coding RNA, a specialty ofFrontiers in Genetics.
Copyright © 2013 Ponomarenko,Suslov, Ponomarenko, Gunbin,Stepanenko, Vishnevsky and Kolchanov.This is an open-access article dis-tributed under the terms of the CreativeCommons Attribution License, whichpermits use, distribution and repro-duction in other forums, provided theoriginal authors and source are creditedand subject to any copyright noticesconcerning any third-party graphics etc.
www.frontiersin.org July 2013 | Volume 4 | Article 122 | 13
Copyright © 2022 FDOKUMEN