Aboriginal Population and Households Projections, State of New South Wales (NSW), Australia, 2011 to...
116
Aboriginal Housing Office Regions Family and Community Services Districts Indigenous Regions Remoteness Areas SEPTEMBER 2013 ABORIGINAL POPULATION AND HOUSEHOLDS PROJECTIONS, NEW SOUTH WALES 2011 TO 2031
-
Upload
independent -
Category
Documents
-
view
1 -
download
0
Transcript of Aboriginal Population and Households Projections, State of New South Wales (NSW), Australia, 2011 to...
Aboriginal Housing Office RegionsFamily and Community Services Districts Indigenous RegionsRemoteness Areas
SEPTEMBER 2013
ABORIGINAL POPULATION AND HOUSEHOLDS PROJECTIONS, NEW SOUTH WALES 2011 TO 2031
NSW Aboriginal Population and Households Projections, 2011–2031 Page i
© NSW Aboriginal Housing Office, 2013
ISBN 978-0-646-92011-5
National Library of Australia Cataloguing-in-Publication entry:
Author: Dr Khalidi, Noor Ahmad.
Title: Aboriginal population projections, New South Wales, 2011 to 2031 / Noor A. Khalidi.
Publisher: NSW Aboriginal Housing Office, 2013.
ISBN: 978-0-646-92011-5 (pbk.)
Subjects: Aboriginal Australians–New South Wales–Population –Statistics.
Torres Strait Islanders–New South Wales–Population-Statistics.
Population forecasting–New South Wales–Statistics.
Other Authors/Contributors:
NSW Aboriginal Housing Office, Department of Family and Community Services.
This work is copyright under the Copyright Act 1968. However, use of the projected data, reproduction or quotation of any part of this publication is allowed given in all cases NSW Aboriginal Housing Office and Author Dr Noor A. Khalidi must be acknowledged as the source.
Disclaimer: The views expressed in this publication are those of the author and do not represent the views of the NSW Aboriginal Housing Office, Department of Family and Community Services.
INQUIRIES: For further information and inquiries regarding this publication contact:
NSW Aboriginal Housing Office Department of Family and Community Services Level 6, 33 Argyle Street, Parramatta NSW 2150 Phone: 02 8836 9444 Fax: 02 9635 7695 Email: [email protected]
Produced for NSW Aboriginal Housing Office by: KRD Social Consulting Email: [email protected] Website: http://krdsocialresearch.com/
PREFACE iii
ACKNOWLEDGEMENTS iv
EXECUTIVE SUMMARY v
1. BASE DATA AND PROJECTION METHODOLOGY 9
1.1 Methodology 9 1.2 Who is an Indigenous person? 9 1.3 Base Population and Regions 9 1.4 Births 12 1.5 Deaths 15 1.6 Migration 17 1.6.1 Interstate migration 17 1.6.2 Inter-regional migration 17 1.6.3 Inter-remoteness migration 18 1.6.4 Indigenous births to non-Indigenous mothers 19 1.7 Households 19
2. PROJECTION OUTCOMES 21
2.1. Population Projections 21 2.1.1 Population size and growth 21 2.1.2 Population age composition 24 2.1.3 Population sex composition 25 2.2 Households Projection Results 28 2.2.1 Household Types 30 2.2.2 Household tenure 30 2.2.3 Age of household heads 30 2.2.4 Household weekly income 30 2.2.5 Housing loans repayments 30 2.2.6 Average persons per household 30
2.3 Detailed Population Projection Outcomes 33 2.3.1 NSW Indigenous population 33 2.3.2 NSW Aboriginal Housing Office (AHO) regions 34 2.3.3 Family and Community Services (FACS) regions 37 2.3.4 NSW Indigenous regions (IREGS) 52 2.3.5 Remoteness Areas 59
2.4 Detailed Household Projections Results 64 2.4.1 Indigenous households types 64 2.4.2 Indigenous households by tenure status 71 2.4.3 Indigenous households by tenure status by FACS regions 75 2.4.4 Indigenous households by age group of household heads by FACS regions 79 2.4.5 Indigenous households by household type by FACS regions 83 2.4.6 Indigenous households by % of household income repayment of housing loans by FACS regions 87 2.4.7 Indigenous households by equalized weekly household income by FACS regions 91
3. APPENDICES 95
4. EXPLANATORY NOTES 113 Fertility 113 Sex ratio 113 Trends 113 Projections 113
5. REFERENCES 114
TABLE OF CONTENTS
NSW Aboriginal Population and Households Projections, 2011–2031 • Page ii
NSW Aboriginal Population and Households Projections, 2011–2031 Page iii
Aboriginal1 population and household projection data for future years are required for needs analysis, policy formation, program and project planning, and service delivery.
The 2011 Census of Population and Housing data has been released by the Australian Bureau of Statistics (ABS) at various geographic and subject levels. The count of Aboriginal people in Australia increased by 20.5% between the 2006 and 2011 Censuses.
This large increase in Aboriginal population estimates presents a challenge, particularly for the delivery of housing to Aboriginal people. Housing is central to overcoming Indigenous disadvantage, including overcrowding and homelessness. Housing enables a stable and real opportunity to access services such as health, education, employment, recreational and community services, all of which are required to improve quality of life for Aboriginal people and help break the cycle of disadvantage that many Aboriginal people face. To assess future housing needs, updated population and household projections are needed.
To fulfil the urgent need for demographic data for future years, the NSW Aboriginal Housing Office (AHO) is pleased to present this report which the Department of Family and Community Services as well as other agencies, and data users may find useful.
The projections in this report were compiled by Noor A. Khalidi, a highly experienced demographer who worked on the AHO’s well received Indicative New South Wales Indigenous Population Projections 2006 to 2011. Dr Khalidi is a member of the Australian Bureau of Statistics’ Aboriginal and Torres Strait Islander Demographic Statistics Expert Advisory Group.
Mandy Young A/Chief Executive NSW Aboriginal Housing Office Department of Family and Community Services
PREFACE
NSW Aboriginal Population and Households Projections, 2011–2031 • Page iv
We would like to acknowledge the valuable assistance and timely comments provided to us by Dr Vincent Ogu and Mr John Baker of the NSW Aboriginal Housing Office, Department of Family and Community Services, during the planning and implementation of this project.
Valuable data, insights and comments were also provided to the project team by Mr Shan Shanmugamany and his staff from Housing NSW. We would like to extend our gratitude for such valuable assistance.
The project team would also like to thank members of the project steering committee for their assistance and comments.
N. Khalidi Director KRD Social Consulting
ACKNOWLEDGEMENTS
NSW Aboriginal Population and Households Projections, 2011–2031 Page v
Population and households projections were carried out by: New South Wales (NSW) total Indigenous and Aboriginal Housing Office (AHO) region, Family and Community Services (FACS) districts, Indigenous regions (IREG) and by the Accessibility/Remoteness Index of Australia (ARIA). The standard demographic cohort-component method of population projections was used based on the estimated resident Indigenous population on 30 June 2011 (2011 Census of Population and Housing).
These projections show that the total Indigenous population of NSW will increase from 208,364 persons on 30 June 2011 to 343,630 persons on 30 June 2031. Over the next 20 years, all NSW regions will experience positive Indigenous population growth.
Over the next 20 years, the NSW Indigenous population will grow, on average, 2.50% per year. Projections show that Indigenous populations of regional areas (both inner and outer regional areas) grow faster than the NSW Indigenous average. The Indigenous populations of Major Cities and Remote/Very Remote areas experience slower growth rates than the average NSW Indigenous population growth (Tables 12 and 13).
At 2.73% per annum and 2.61% per annum, the growth rate in the AHO Northern Region and Western Region respectively are estimated above the total NSW Indigenous population average growth rate. However, at 2.16% per year, the Sydney and South Eastern Region growth rate is slower than the average NSW Indigenous growth rate. Nevertheless, these regions cover very large and diverse areas with average annual growth rates obscuring many local variations. These local variations are better reflected in the estimated growth rates for FACS districts.
For the past 20 years, Indigenous fertility in NSW has been steadily rising. An increase in the Indigenous women’s fertility rate – measured as total fertility rate (TFR) – from 2.57 in 1996 to 2.61 in 2006 and 2.78 in 2011 has been observed. However, Indigenous fertility rate is higher in inner and outer regional areas (2.98) and much higher in remote and very remote areas (3.15).
Combined with very slow improvements in adult-age mortality rates, this has resulted in a young age-structure population. The indigenous fertility rate is not anticipated to decline in the immediate future. The projected median age is also anticipated to show little change over the next 20 years. This means the Indigenous population will remain a young-age structure for the next 20 years.
The results of the 2011 Census show that, while there are more Indigenous baby girls aged 0 to 4 than baby boys (sex ratio=97.2), the overall sex ratio (the proportion of males to females) of the Indigenous population is almost even (sex ratio=100.9). Projections show that the sex composition of NSW’s Indigenous population measured by sex ratio will not alter over the next 20 years.
EXECUTIVE SUMMARY

NSW Aboriginal Population and Households Projections, 2011–2031 • Page vi
Summary Table 1 presents the projected increase in the number of Indigenous people in the projected year by region. The table only shows the number of people added to the 2011 base-year population.
SUMMARY TABLE 1: PROJECTED NUMBER OF INDIGENOUS POPULATION INCREASE IN THE PROJECTED YEAR SINCE 2011 BY REGION
Regions 2016 2021 2026 2031
Total NSW Indigenous Population 26,529 58,550 94,831 135,266
AHO Northern Region 11,897 26,352 42,847 61,373
AHO Sydney/South Eastern Region 8,392 18,298 29,325 41,250
AHO Western Region 6,241 13,900 22,659 32,642
FACS Central Coast 1,556 3,388 5,447 7,718
FACS Far West 534 1,150 1,816 2,573
FACS Hunter New England 6,795 14,946 24,163 34,547
FACS Illawarra Shoalhaven 1,638 3,611 5,874 8,400
FACS Mid North Coast 1,701 3,798 6,214 8,937
FACS Murrumbidgee 1,619 3,599 5,895 8,543
FACS Nepean Blue Mountains 1,292 2,863 4,619 6,492
FACS Northern NSW 1,954 4,357 7,093 10,169
FACS Northern Sydney 413 861 1,331 1,833
FACS South Eastern Sydney 812 1,728 2,692 3,706
FACS South Western Sydney 1,514 3,449 5,756 8,264
FACS Southern NSW 937 2,065 3,355 4,823
FACS Sydney 809 1,647 2,460 3,314
FACS Western NSW 3,759 8,388 13,677 19,618
FACS Western Sydney 1,193 2,697 4,435 6,324
IREG Dubbo 2,348 5,207 8,490 12,326
IREG North Eastern NSW 3,262 7,107 11,472 16,522
IREG North Western 945 2,090 3,375 4,782
IREG NSW Central and North Coast 8,877 19,629 31,775 45,261
IREG Riverina-Orange 2,582 5,795 9,505 13,625
IREG South Eastern NSW 2,129 4,672 7,602 11,035
IREG Sydney Wollongong 6,387 14,051 22,612 31,716
NSW Inner Regional Areas 11,712 25,857 41,917 60,173
NSW Major Cities 10,215 22,181 35,396 49,665
NSW Outer Regional Areas 3,762 8,562 14,217 20,593
NSW Remote Areas 543 1,279 2,183 3,218
NSW Very Remote Areas 295 670 1,118 1,616
NSW Aboriginal Population and Households Projections, 2011–2031 Page vii
Projections show that over the next 20 years the number of Indigenous households will increase 135% compared with a 65% increase in the total Indigenous population growth in NSW. The increase is mainly due to growth in lone-person households and couple families without children (Table 19).
However, the average annual household growth rate is expected to slow from 6% during the period 2011–16 to 4.3% during the period 2026–31.
It is expected the fastest Indigenous household increase—5.3% per year—will occur in the Far West Region (Dubbo). The slowest Indigenous household increase—3.0% per year—will occur in the Sydney Region.
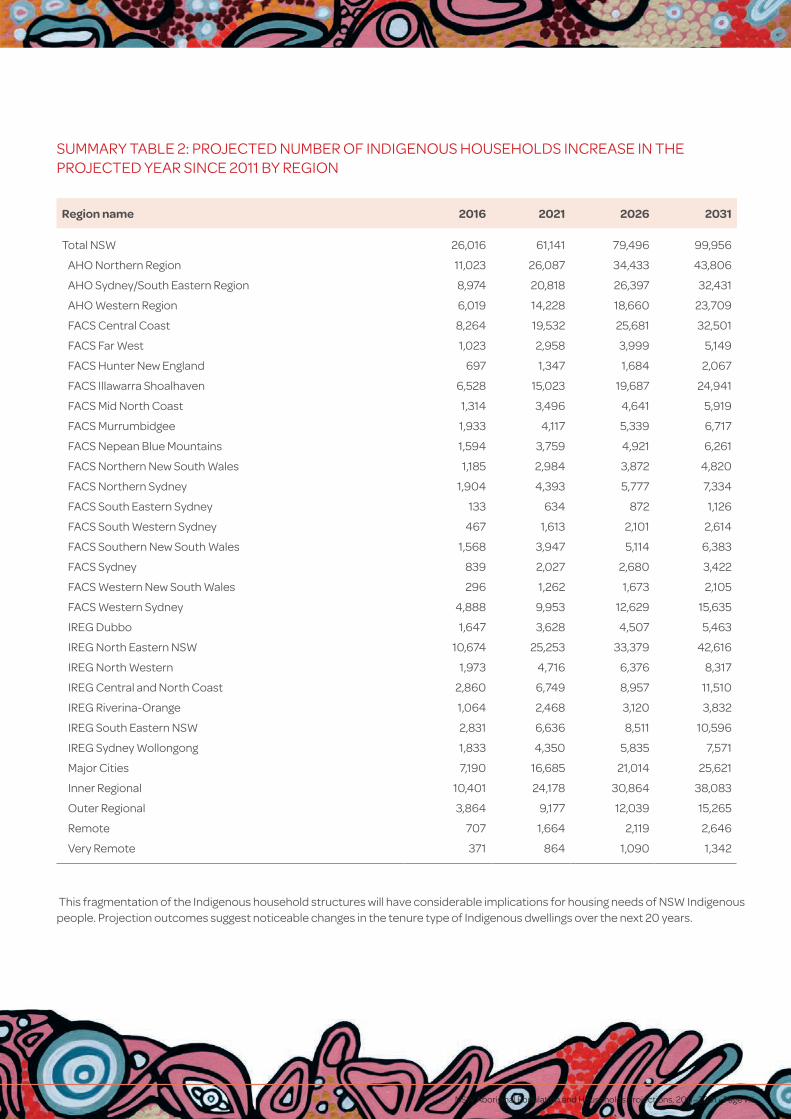
Summary Table 2, presents the projected increase in Indigenous households in the projected year by region. The table only shows the number of households added to the 2011 base-year households.
EXECUTIVE SUMMARY (con’t)
NSW Aboriginal Population and Households Projections, 2011–2031 • Page viii
SUMMARY TABLE 2: PROJECTED NUMBER OF INDIGENOUS HOUSEHOLDS INCREASE IN THE PROJECTED YEAR SINCE 2011 BY REGION
Region name 2016 2021 2026 2031
Total NSW 26,016 61,141 79,496 99,956
AHO Northern Region 11,023 26,087 34,433 43,806
AHO Sydney/South Eastern Region 8,974 20,818 26,397 32,431
AHO Western Region 6,019 14,228 18,660 23,709
FACS Central Coast 8,264 19,532 25,681 32,501
FACS Far West 1,023 2,958 3,999 5,149
FACS Hunter New England 697 1,347 1,684 2,067
FACS Illawarra Shoalhaven 6,528 15,023 19,687 24,941
FACS Mid North Coast 1,314 3,496 4,641 5,919
FACS Murrumbidgee 1,933 4,117 5,339 6,717
FACS Nepean Blue Mountains 1,594 3,759 4,921 6,261
FACS Northern New South Wales 1,185 2,984 3,872 4,820
FACS Northern Sydney 1,904 4,393 5,777 7,334
FACS South Eastern Sydney 133 634 872 1,126
FACS South Western Sydney 467 1,613 2,101 2,614
FACS Southern New South Wales 1,568 3,947 5,114 6,383
FACS Sydney 839 2,027 2,680 3,422
FACS Western New South Wales 296 1,262 1,673 2,105
FACS Western Sydney 4,888 9,953 12,629 15,635
IREG Dubbo 1,647 3,628 4,507 5,463
IREG North Eastern NSW 10,674 25,253 33,379 42,616
IREG North Western 1,973 4,716 6,376 8,317
IREG Central and North Coast 2,860 6,749 8,957 11,510
IREG Riverina-Orange 1,064 2,468 3,120 3,832
IREG South Eastern NSW 2,831 6,636 8,511 10,596
IREG Sydney Wollongong 1,833 4,350 5,835 7,571
Major Cities 7,190 16,685 21,014 25,621
Inner Regional 10,401 24,178 30,864 38,083
Outer Regional 3,864 9,177 12,039 15,265
Remote 707 1,664 2,119 2,646
Very Remote 371 864 1,090 1,342
This fragmentation of the Indigenous household structures will have considerable implications for housing needs of NSW Indigenous people. Projection outcomes suggest noticeable changes in the tenure type of Indigenous dwellings over the next 20 years.
NSW Aboriginal Population and Households Projections, 2011–2031 Page 9
1.1 METHODOLOGY
The standard demographic cohort-component method of population projection was used for this study. Projections are based on:
• initial base population by males and females populations in five-year age groups; • initial base fertility levels and assumed future changes in fertility; • initial base mortality levels and assumed future changes in mortality; and • initial base estimates of migration and assumed future changes.
1.2 WHO IS AN INDIGENOUS PERSON?
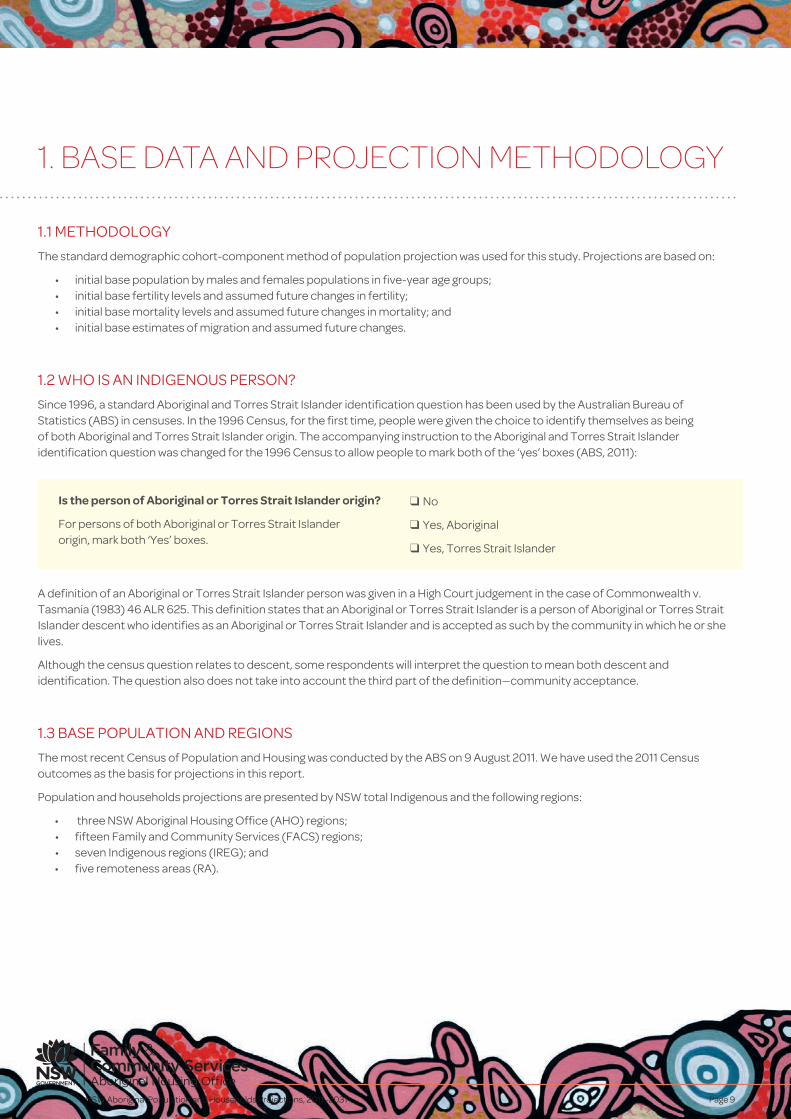
Since 1996, a standard Aboriginal and Torres Strait Islander identification question has been used by the Australian Bureau of Statistics (ABS) in censuses. In the 1996 Census, for the first time, people were given the choice to identify themselves as being of both Aboriginal and Torres Strait Islander origin. The accompanying instruction to the Aboriginal and Torres Strait Islander identification question was changed for the 1996 Census to allow people to mark both of the ‘yes’ boxes (ABS, 2011):
A definition of an Aboriginal or Torres Strait Islander person was given in a High Court judgement in the case of Commonwealth v. Tasmania (1983) 46 ALR 625. This definition states that an Aboriginal or Torres Strait Islander is a person of Aboriginal or Torres Strait Islander descent who identifies as an Aboriginal or Torres Strait Islander and is accepted as such by the community in which he or she lives.
Although the census question relates to descent, some respondents will interpret the question to mean both descent and identification. The question also does not take into account the third part of the definition—community acceptance.
1.3 BASE POPULATION AND REGIONS
The most recent Census of Population and Housing was conducted by the ABS on 9 August 2011. We have used the 2011 Census outcomes as the basis for projections in this report.
Population and households projections are presented by NSW total Indigenous and the following regions:
• three NSW Aboriginal Housing Office (AHO) regions; • fifteen Family and Community Services (FACS) regions; • seven Indigenous regions (IREG); and • five remoteness areas (RA).
1. BASE DATA AND PROJECTION METHODOLOGY
Is the person of Aboriginal or Torres Strait Islander origin?
For persons of both Aboriginal or Torres Strait Islander origin, mark both ‘Yes’ boxes.
q No
q Yes, Aboriginal
q Yes, Torres Strait Islander
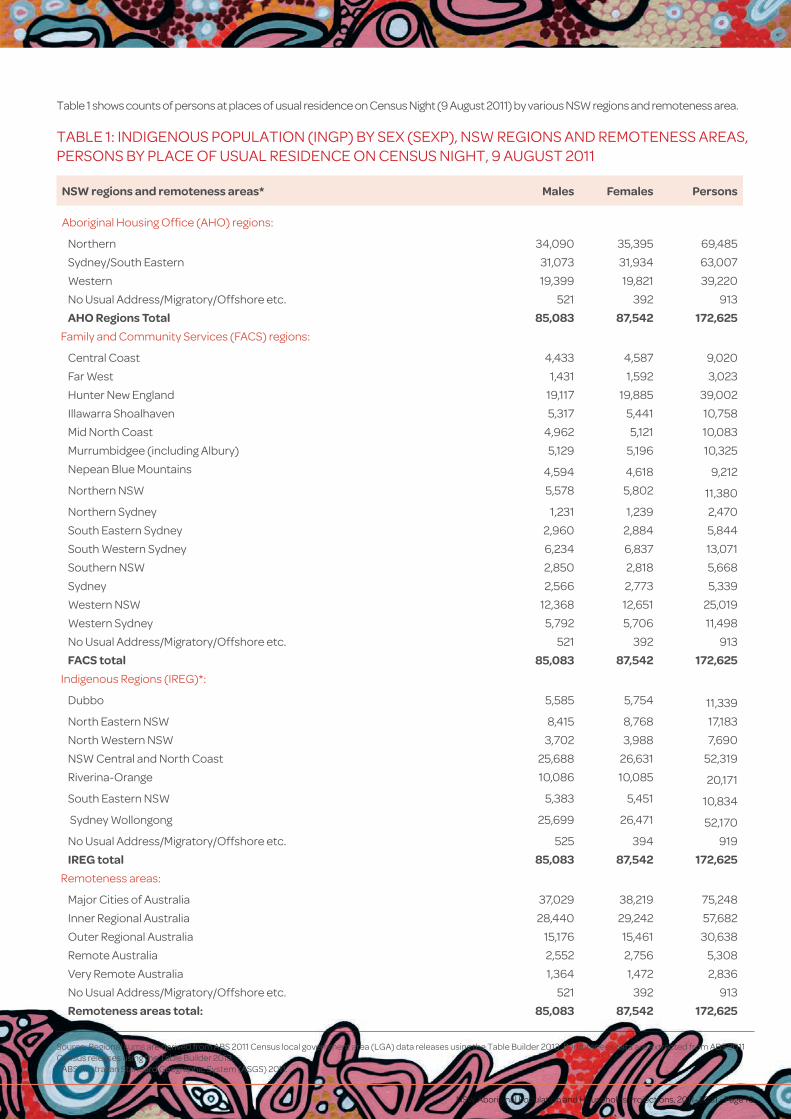
Table 1 shows counts of persons at places of usual residence on Census Night (9 August 2011) by various NSW regions and remoteness area.
TABLE 1: INDIGENOUS POPULATION (INGP) BY SEX (SEXP), NSW REGIONS AND REMOTENESS AREAS, PERSONS BY PLACE OF USUAL RESIDENCE ON CENSUS NIGHT, 9 AUGUST 2011
NSW regions and remoteness areas* Males Females Persons
Aboriginal Housing Office (AHO) regions:
Northern 34,090 35,395 69,485
Sydney/South Eastern 31,073 31,934 63,007
Western 19,399 19,821 39,220
No Usual Address/Migratory/Offshore etc. 521 392 913
AHO Regions Total 85,083 87,542 172,625
Family and Community Services (FACS) regions:
Central Coast 4,433 4,587 9,020
Far West 1,431 1,592 3,023
Hunter New England 19,117 19,885 39,002
Illawarra Shoalhaven 5,317 5,441 10,758
Mid North Coast 4,962 5,121 10,083
Murrumbidgee (including Albury) 5,129 5,196 10,325
Nepean Blue Mountains 4,594 4,618 9,212 Northern NSW 5,578 5,802 11,380 Northern Sydney 1,231 1,239 2,470
South Eastern Sydney 2,960 2,884 5,844
South Western Sydney 6,234 6,837 13,071
Southern NSW 2,850 2,818 5,668
Sydney 2,566 2,773 5,339
Western NSW 12,368 12,651 25,019
Western Sydney 5,792 5,706 11,498
No Usual Address/Migratory/Offshore etc. 521 392 913
FACS total 85,083 87,542 172,625
Indigenous Regions (IREG)*:
Dubbo 5,585 5,754 11,339 North Eastern NSW 8,415 8,768 17,183
North Western NSW 3,702 3,988 7,690
NSW Central and North Coast 25,688 26,631 52,319
Riverina-Orange 10,086 10,085 20,171 South Eastern NSW 5,383 5,451 10,834 Sydney Wollongong 25,699 26,471 52,170 No Usual Address/Migratory/Offshore etc. 525 394 919
IREG total 85,083 87,542 172,625
Remoteness areas:
Major Cities of Australia 37,029 38,219 75,248
Inner Regional Australia 28,440 29,242 57,682
Outer Regional Australia 15,176 15,461 30,638
Remote Australia 2,552 2,756 5,308
Very Remote Australia 1,364 1,472 2,836
No Usual Address/Migratory/Offshore etc. 521 392 913
Remoteness areas total: 85,083 87,542 172,625
Source: Regional sums are derived from ABS 2011 Census local government area (LGA) data releases using the Table Builder 2013. Remoteness data are extracted from ABS 2011 Census releases using the Table Builder 2013. * ABS Australian Standard Geographic System (ASGS) 2011.
NSW Aboriginal Population and Households Projections, 2011–2031 • Page 10
NSW Aboriginal Population and Households Projections, 2011–2031 Page 11
Australia’s first national census was held in 1911. Since 1961 there has been a census every five years (the frequency specified in the Census and Statistics Act 1905). The objective of the census is to count the number of people in Australia on Census Night to identify the key characteristics of the people and of the dwellings in which they live.
Following changes to the Australian Constitution as a result of the 1967 referendum, Aboriginal and Torres Strait Islander peoples were included in official estimates of the Australian population. From the 1971 Census onwards, the ABS used improved strategies to count Australia’s Indigenous population.
However, for several reasons, the reported counts of people at places of usual residence on Census Night (as presented in Table 1) cannot be used for population projections. Firstly, the base population for projections needs to be the mid-year (30 June) estimate, rather than the census night estimate—census counts should be adjusted with births, deaths and migration data from 9 August back to 30 June. Secondly, the census count needs to be adjusted for possible under-coverage/under-reporting using the post enumeration survey (PES) results. The estimates resulting from these adjustments are known as the estimated resident population (ERP) at 30 June 2011.
Base population for population and household projections are the estimated resident Indigenous population of NSW at 30 June 2011. ABS published preliminary estimates of the Aboriginal and Torres Strait Islander and non-Indigenous resident population as at 30 June 2011 in Australian Demographic Statistics (cat. no. 3101.0) on 27 September 2012. The ERPs are adjusted population census counts to 30 June 2011 taking into consideration births, deaths, PES estimates and migration estimates.
2011 Census estimates were published by five-year age groups, sex and state/territory. No further disaggregation will be available until final estimates are compiled and released. Based on the above adjustments, the estimated resident Indigenous population of NSW at 30 June 2011 was 208,364 persons (Table 2) compared to the census counts of 172,625 persons on 9 August 2011. This represents an increase of 20.7%.
1. BASE DATA AND PROJECTION METHODOLOGY (con’t)
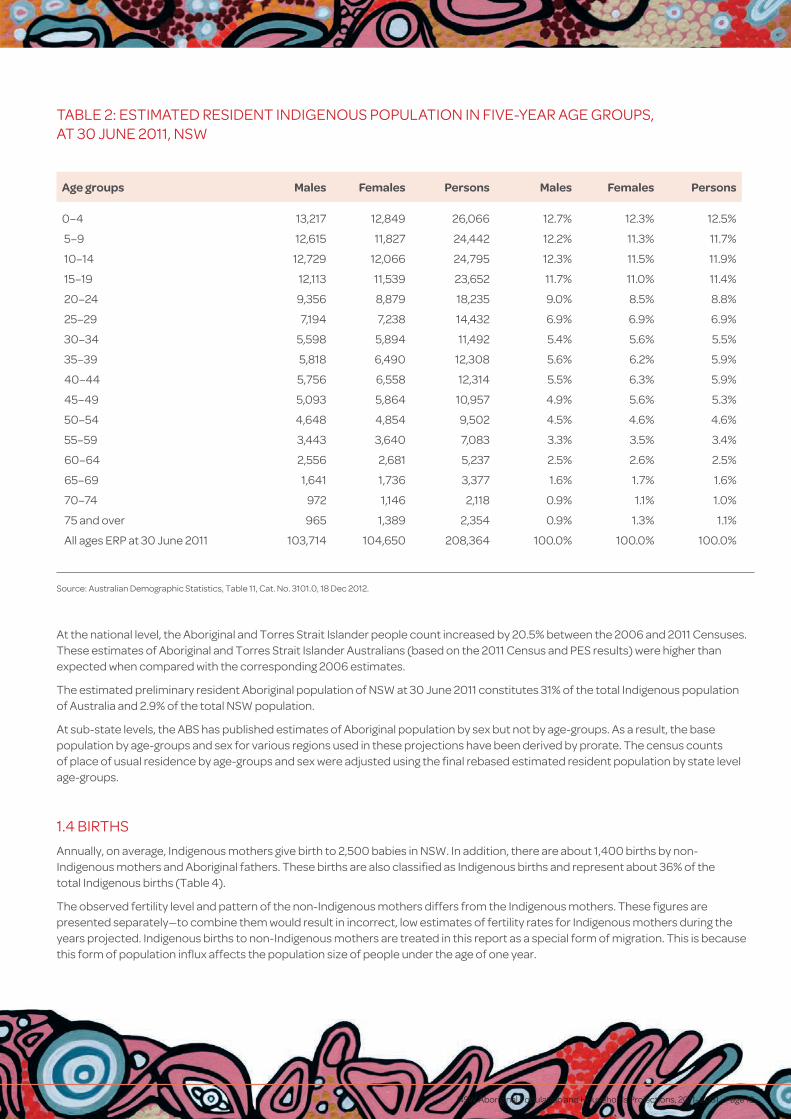
TABLE 2: ESTIMATED RESIDENT INDIGENOUS POPULATION IN FIVE-YEAR AGE GROUPS, AT 30 JUNE 2011, NSW
Age groups Males Females Persons Males Females Persons
0–4 13,217 12,849 26,066 12.7% 12.3% 12.5%
5–9 12,615 11,827 24,442 12.2% 11.3% 11.7%
10–14 12,729 12,066 24,795 12.3% 11.5% 11.9%
15–19 12,113 11,539 23,652 11.7% 11.0% 11.4%
20–24 9,356 8,879 18,235 9.0% 8.5% 8.8%
25–29 7,194 7,238 14,432 6.9% 6.9% 6.9%
30–34 5,598 5,894 11,492 5.4% 5.6% 5.5%
35–39 5,818 6,490 12,308 5.6% 6.2% 5.9%
40–44 5,756 6,558 12,314 5.5% 6.3% 5.9%
45–49 5,093 5,864 10,957 4.9% 5.6% 5.3%
50–54 4,648 4,854 9,502 4.5% 4.6% 4.6%
55–59 3,443 3,640 7,083 3.3% 3.5% 3.4%
60–64 2,556 2,681 5,237 2.5% 2.6% 2.5%
65–69 1,641 1,736 3,377 1.6% 1.7% 1.6%
70–74 972 1,146 2,118 0.9% 1.1% 1.0%
75 and over 965 1,389 2,354 0.9% 1.3% 1.1%
All ages ERP at 30 June 2011 103,714 104,650 208,364 100.0% 100.0% 100.0%
Source: Australian Demographic Statistics, Table 11, Cat. No. 3101.0, 18 Dec 2012.
At the national level, the Aboriginal and Torres Strait Islander people count increased by 20.5% between the 2006 and 2011 Censuses. These estimates of Aboriginal and Torres Strait Islander Australians (based on the 2011 Census and PES results) were higher than expected when compared with the corresponding 2006 estimates.
The estimated preliminary resident Aboriginal population of NSW at 30 June 2011 constitutes 31% of the total Indigenous population of Australia and 2.9% of the total NSW population.
At sub-state levels, the ABS has published estimates of Aboriginal population by sex but not by age-groups. As a result, the base population by age-groups and sex for various regions used in these projections have been derived by prorate. The census counts of place of usual residence by age-groups and sex were adjusted using the final rebased estimated resident population by state level age-groups.
1.4 BIRTHS
Annually, on average, Indigenous mothers give birth to 2,500 babies in NSW. In addition, there are about 1,400 births by non-Indigenous mothers and Aboriginal fathers. These births are also classified as Indigenous births and represent about 36% of the total Indigenous births (Table 4).
The observed fertility level and pattern of the non-Indigenous mothers differs from the Indigenous mothers. These figures are presented separately—to combine them would result in incorrect, low estimates of fertility rates for Indigenous mothers during the years projected. Indigenous births to non-Indigenous mothers are treated in this report as a special form of migration. This is because this form of population influx affects the population size of people under the age of one year.
NSW Aboriginal Population and Households Projections, 2011–2031 • Page 12

NSW Aboriginal Population and Households Projections, 2011–2031 Page 13
1.4 BIRTHS (CON’T)
To determine the level and age pattern of Indigenous fertility in NSW we used two different approaches. First, data on registered births to Indigenous women by age for years 2006– 2010 were used to provide estimates of the level and pattern of Indigenous fertility (direct estimation method). This method is also known as ‘period fertility’. Secondly, estimates of the level and pattern of Indigenous fertility in NSW were obtained by applying an indirect method of fertility estimation using census data on the number of women by age groups by number of children ever born (CEB). We then compared the results of these two estimation methods to find out the fertility regime of the Indigenous women in NSW.
The 2006 and 2011 Census data on CEB by age groups of mothers have been extensively used in these projections.
A comparison of the results of the two fertility estimation methods suggests that Indigenous birth registration data in NSW are still not complete enough to provide reliable fertility estimates. Therefore, the results of the indirect fertility estimates based on census outcomes appear more reliable and are used in these projections.
The outcomes of the CEB indirect fertility estimation from 1996, 2006 and 2011 Censuses show consistent patterns of fertility. They also show a marginal increase in the Indigenous women’s fertility rate from 2.57 in 1996 to 2.61 in 2006 and 2.78 in 2011.
The observed fertility rates for the 2011 base year are presented in Table 3 below by three broad remoteness areas. Due to the small number of observations in some areas, we have combined the ABS five remoteness areas (Major Cities, Inner Regional Areas, Outer Regional Areas, Remote Areas and Very Remote Areas) into three broad remoteness areas (Major Cities, Regional Areas and Remote Areas).
Table 3 shows that Indigenous fertility differs by remoteness in NSW. With a mean childbearing age of 26.8 years, the TFR of Indigenous women in Major Cities is estimated at 2.49. In Regional NSW the mean childbearing age is estimated to be slightly younger than Major Cities at 25.4 years with a TFR of 3.0. In Remote NSW the mean childbearing age is estimated to be younger than Major Cities and Regional NSW at 24.7 years with a higher TFR of 3.15.
1. BASE DATA AND PROJECTION METHODOLOGY (con’t)
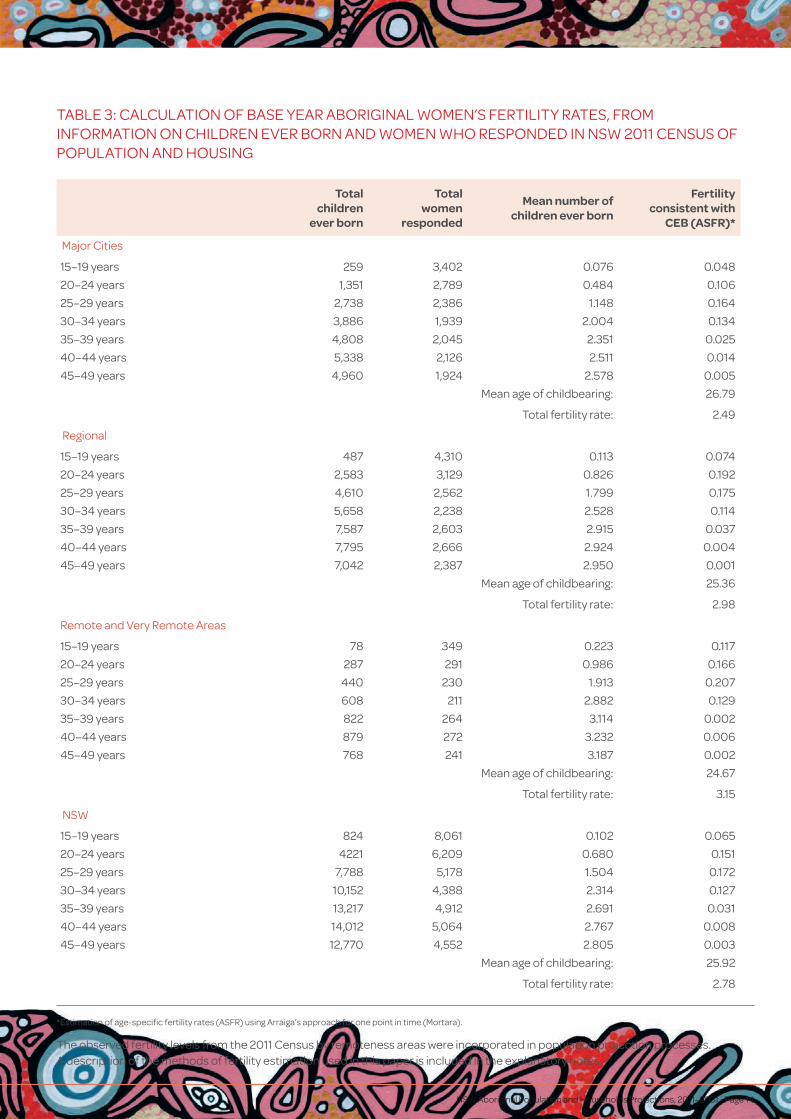
TABLE 3: CALCULATION OF BASE YEAR ABORIGINAL WOMEN’S FERTILITY RATES, FROM INFORMATION ON CHILDREN EVER BORN AND WOMEN WHO RESPONDED IN NSW 2011 CENSUS OF POPULATION AND HOUSING
Totalchildren
ever born
Totalwomen
responded
Mean number of children ever born
Fertilityconsistent with
CEB (ASFR)*
Major Cities
15–19 years 259 3,402 0.076 0.048
20–24 years 1,351 2,789 0.484 0.106
25–29 years 2,738 2,386 1.148 0.164
30–34 years 3,886 1,939 2.004 0.134
35–39 years 4,808 2,045 2.351 0.025
40–44 years 5,338 2,126 2.511 0.014
45–49 years 4,960 1,924 2.578 0.005
Mean age of childbearing: 26.79
Total fertility rate: 2.49
Regional
15–19 years 487 4,310 0.113 0.074
20–24 years 2,583 3,129 0.826 0.192
25–29 years 4,610 2,562 1.799 0.175
30–34 years 5,658 2,238 2.528 0.114
35–39 years 7,587 2,603 2.915 0.037
40–44 years 7,795 2,666 2.924 0.004
45–49 years 7,042 2,387 2.950 0.001
Mean age of childbearing: 25.36
Total fertility rate: 2.98
Remote and Very Remote Areas
15–19 years 78 349 0.223 0.117
20–24 years 287 291 0.986 0.166
25–29 years 440 230 1.913 0.207
30–34 years 608 211 2.882 0.129
35–39 years 822 264 3.114 0.002
40–44 years 879 272 3.232 0.006
45–49 years 768 241 3.187 0.002
Mean age of childbearing: 24.67
Total fertility rate: 3.15
NSW
15–19 years 824 8,061 0.102 0.065
20–24 years 4221 6,209 0.680 0.151
25–29 years 7,788 5,178 1.504 0.172
30–34 years 10,152 4,388 2.314 0.127
35–39 years 13,217 4,912 2.691 0.031
40–44 years 14,012 5,064 2.767 0.008
45–49 years 12,770 4,552 2.805 0.003
Mean age of childbearing: 25.92
Total fertility rate: 2.78
*Estimation of age-specific fertility rates (ASFR) using Arraiga’s approach for one point in time (Mortara).
The observed fertility levels from the 2011 Census by remoteness areas were incorporated in population projection processes. A description of the methods of fertility estimation used in this paper is included in the explanatory notes
NSW Aboriginal Population and Households Projections, 2011–2031 • Page 14
NSW Aboriginal Population and Households Projections, 2011–2031 Page 15
1.5 DEATHS
Mortality levels are a key component of Indigenous population projection. These are generally measured by the expectations of life at birth and age-sex pattern of mortality and are usually taken from Indigenous life tables.
The ABS publication Experimental Life Tables for Aboriginal and Torres Strait Islander Australians, 2005-2007 indicates that the NSW expectation of life at birth for Indigenous males, for the period 2005–2007, was estimated at 69.9 years and 75.0 years for Indigenous females (ABS, May 2009, p. 32).
Previously published estimates of life expectancies were 60.0 years for Indigenous males and 65.1 years for Indigenous females (ABS 2006, Deaths Australia 3302.0, p. 77).The ABS 2009 estimates, if correct, dramatically reduce Indigenous mortality levels. This will have considerable implications on the projected size of the Indigenous population in future years.
Subsequent to this ABS publication, Queensland Health published a discussion paper presenting, for the first time in Australia, estimated Indigenous life tables by remoteness (Queensland Health, 2012). This is a major advance in our understanding of Indigenous mortality levels and patterns in regional and remote areas as it is widely believed that mortality differs by remoteness. This is the case for the general as well as the Indigenous population. However, until the Queensland Health publication there was no hard data to support this belief.
Mortality differs by remoteness because of differences in the availability of health and medical services in major cities, regional and remote areas, and people’s unequal access to such services (Table 4).
1. BASE DATA AND PROJECTION METHODOLOGY (con’t)
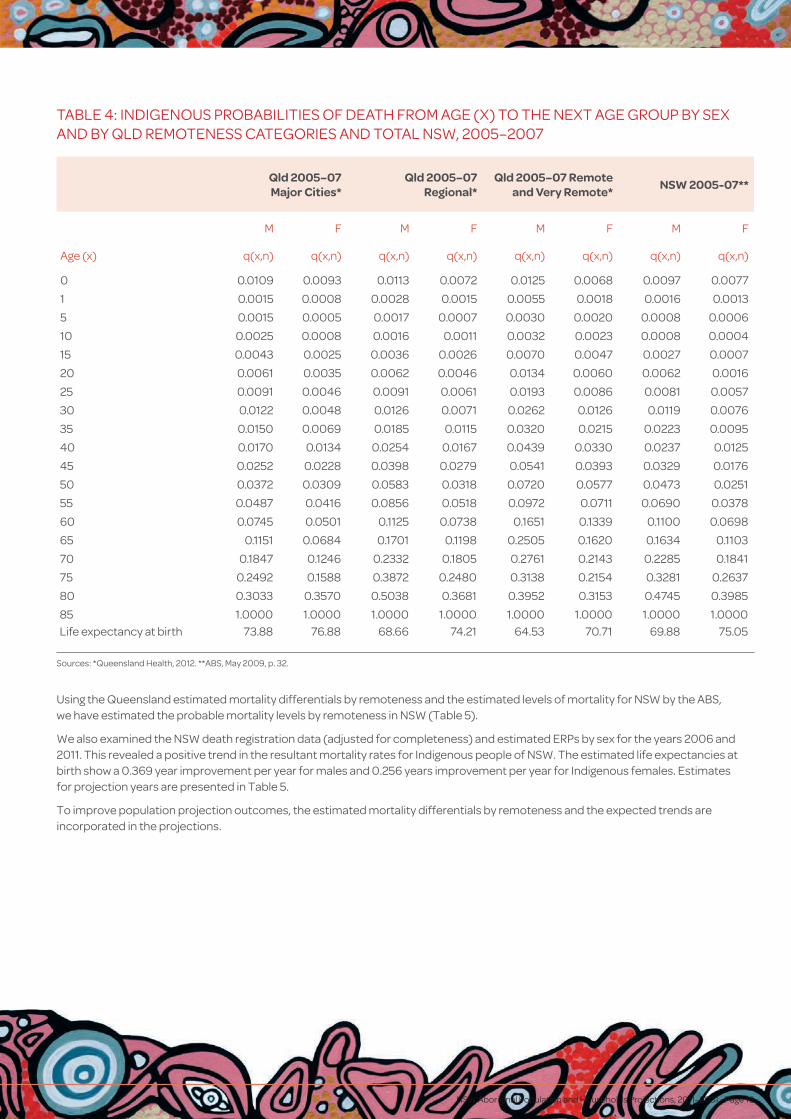
TABLE 4: INDIGENOUS PROBABILITIES OF DEATH FROM AGE (X) TO THE NEXT AGE GROUP BY SEX AND BY QLD REMOTENESS CATEGORIES AND TOTAL NSW, 2005–2007
Using the Queensland estimated mortality differentials by remoteness and the estimated levels of mortality for NSW by the ABS, we have estimated the probable mortality levels by remoteness in NSW (Table 5).
We also examined the NSW death registration data (adjusted for completeness) and estimated ERPs by sex for the years 2006 and 2011. This revealed a positive trend in the resultant mortality rates for Indigenous people of NSW. The estimated life expectancies at birth show a 0.369 year improvement per year for males and 0.256 years improvement per year for Indigenous females. Estimates for projection years are presented in Table 5.
To improve population projection outcomes, the estimated mortality differentials by remoteness and the expected trends are incorporated in the projections.
Qld 2005–07 Major Cities*
Qld 2005–07 Regional*
Qld 2005–07 Remote and Very Remote*
NSW 2005-07**
M F M F M F M F
Age (x) q(x,n) q(x,n) q(x,n) q(x,n) q(x,n) q(x,n) q(x,n) q(x,n)
0 0.0109 0.0093 0.0113 0.0072 0.0125 0.0068 0.0097 0.0077
1 0.0015 0.0008 0.0028 0.0015 0.0055 0.0018 0.0016 0.0013
5 0.0015 0.0005 0.0017 0.0007 0.0030 0.0020 0.0008 0.0006
10 0.0025 0.0008 0.0016 0.0011 0.0032 0.0023 0.0008 0.0004
15 0.0043 0.0025 0.0036 0.0026 0.0070 0.0047 0.0027 0.0007
20 0.0061 0.0035 0.0062 0.0046 0.0134 0.0060 0.0062 0.0016
25 0.0091 0.0046 0.0091 0.0061 0.0193 0.0086 0.0081 0.0057
30 0.0122 0.0048 0.0126 0.0071 0.0262 0.0126 0.0119 0.0076
35 0.0150 0.0069 0.0185 0.0115 0.0320 0.0215 0.0223 0.0095
40 0.0170 0.0134 0.0254 0.0167 0.0439 0.0330 0.0237 0.0125
45 0.0252 0.0228 0.0398 0.0279 0.0541 0.0393 0.0329 0.0176
50 0.0372 0.0309 0.0583 0.0318 0.0720 0.0577 0.0473 0.0251
55 0.0487 0.0416 0.0856 0.0518 0.0972 0.0711 0.0690 0.0378
60 0.0745 0.0501 0.1125 0.0738 0.1651 0.1339 0.1100 0.0698
65 0.1151 0.0684 0.1701 0.1198 0.2505 0.1620 0.1634 0.1103
70 0.1847 0.1246 0.2332 0.1805 0.2761 0.2143 0.2285 0.1841
75 0.2492 0.1588 0.3872 0.2480 0.3138 0.2154 0.3281 0.2637
80 0.3033 0.3570 0.5038 0.3681 0.3952 0.3153 0.4745 0.3985
85 1.0000 1.0000 1.0000 1.0000 1.0000 1.0000 1.0000 1.0000Life expectancy at birth 73.88 76.88 68.66 74.21 64.53 70.71 69.88 75.05
Sources: *Queensland Health, 2012. **ABS, May 2009, p. 32.
NSW Aboriginal Population and Households Projections, 2011–2031 • Page 16
NSW Aboriginal Population and Households Projections, 2011–2031 Page 17
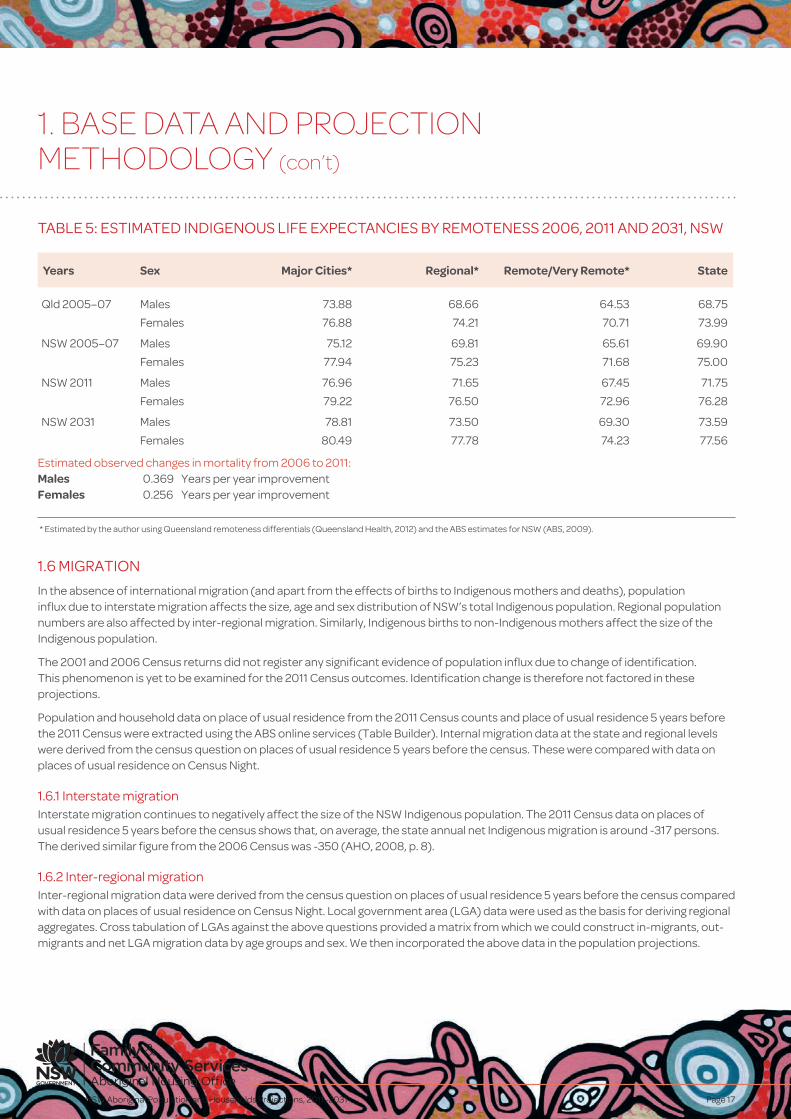
TABLE 5: ESTIMATED INDIGENOUS LIFE EXPECTANCIES BY REMOTENESS 2006, 2011 AND 2031, NSW
Estimated observed changes in mortality from 2006 to 2011:Males 0.369 Years per year improvement Females 0.256 Years per year improvement
1.6 MIGRATION
In the absence of international migration (and apart from the effects of births to Indigenous mothers and deaths), population influx due to interstate migration affects the size, age and sex distribution of NSW’s total Indigenous population. Regional population numbers are also affected by inter-regional migration. Similarly, Indigenous births to non-Indigenous mothers affect the size of the Indigenous population.
The 2001 and 2006 Census returns did not register any significant evidence of population influx due to change of identification. This phenomenon is yet to be examined for the 2011 Census outcomes. Identification change is therefore not factored in these projections.
Population and household data on place of usual residence from the 2011 Census counts and place of usual residence 5 years before the 2011 Census were extracted using the ABS online services (Table Builder). Internal migration data at the state and regional levels were derived from the census question on places of usual residence 5 years before the census. These were compared with data on places of usual residence on Census Night.
1.6.1 Interstate migrationInterstate migration continues to negatively affect the size of the NSW Indigenous population. The 2011 Census data on places of usual residence 5 years before the census shows that, on average, the state annual net Indigenous migration is around -317 persons. The derived similar figure from the 2006 Census was -350 (AHO, 2008, p. 8).
1.6.2 Inter-regional migrationInter-regional migration data were derived from the census question on places of usual residence 5 years before the census compared with data on places of usual residence on Census Night. Local government area (LGA) data were used as the basis for deriving regional aggregates. Cross tabulation of LGAs against the above questions provided a matrix from which we could construct in-migrants, out-migrants and net LGA migration data by age groups and sex. We then incorporated the above data in the population projections.
1. BASE DATA AND PROJECTION METHODOLOGY (con’t)
* Estimated by the author using Queensland remoteness differentials (Queensland Health, 2012) and the ABS estimates for NSW (ABS, 2009).
Years Sex Major Cities* Regional* Remote/Very Remote* State
Qld 2005–07 Males 73.88 68.66 64.53 68.75
Females 76.88 74.21 70.71 73.99
NSW 2005–07 Males 75.12 69.81 65.61 69.90
Females 77.94 75.23 71.68 75.00
NSW 2011 Males 76.96 71.65 67.45 71.75
Females 79.22 76.50 72.96 76.28
NSW 2031 Males 78.81 73.50 69.30 73.59
Females 80.49 77.78 74.23 77.56
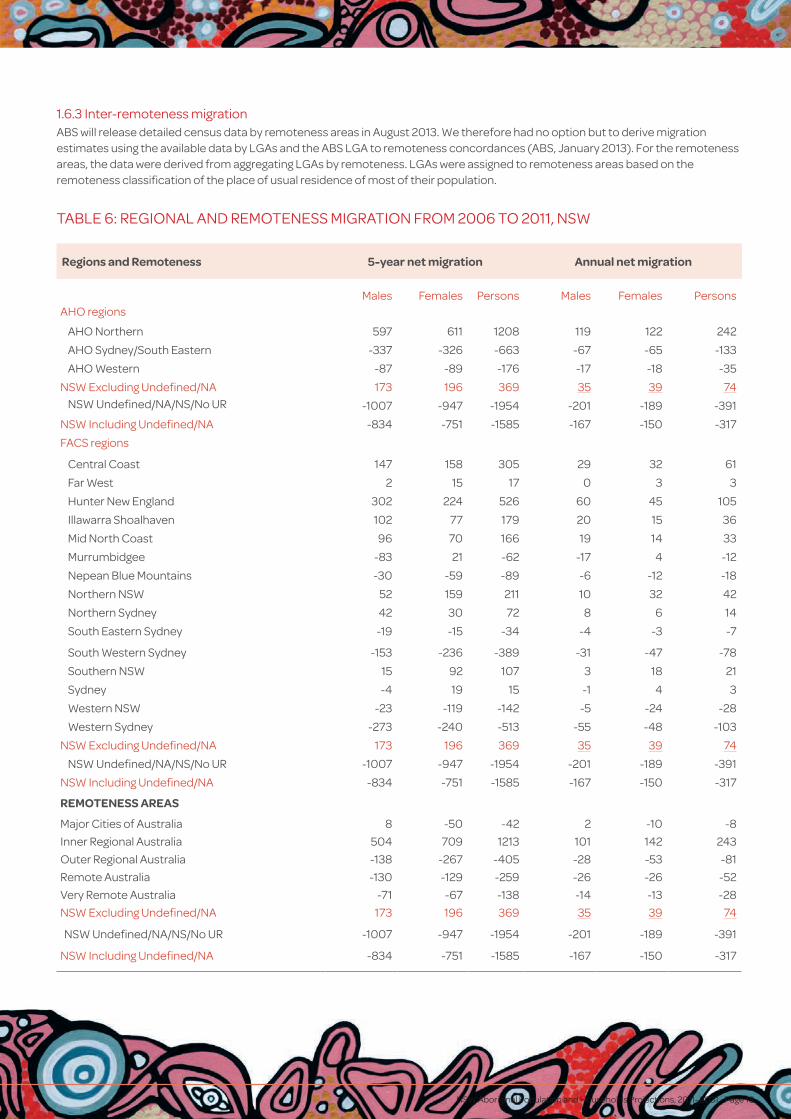
TABLE 6: REGIONAL AND REMOTENESS MIGRATION FROM 2006 TO 2011, NSW
1.6.3 Inter-remoteness migrationABS will release detailed census data by remoteness areas in August 2013. We therefore had no option but to derive migration estimates using the available data by LGAs and the ABS LGA to remoteness concordances (ABS, January 2013). For the remoteness areas, the data were derived from aggregating LGAs by remoteness. LGAs were assigned to remoteness areas based on the remoteness classification of the place of usual residence of most of their population.
Regions and Remoteness 5- year net migration Annual net migration
Males Females Persons Males Females PersonsAHO regions
AHO Northern 597 611 1208 119 122 242
AHO Sydney/South Eastern -337 -326 -663 -67 -65 -133
AHO Western -87 -89 -176 -17 -18 -35
NSW Excluding Undefined/NA 173 196 369 35 39 74NSW Undefined/NA/NS/No UR -1007 -947 -1954 -201 -189 -391
NSW Including Undefined/NA -834 -751 -1585 -167 -150 -317
FACS regions
Central Coast 147 158 305 29 32 61
Far West 2 15 17 0 3 3
Hunter New England 302 224 526 60 45 105
Illawarra Shoalhaven 102 77 179 20 15 36
Mid North Coast 96 70 166 19 14 33
Murrumbidgee -83 21 -62 -17 4 -12
Nepean Blue Mountains -30 -59 -89 -6 -12 -18
Northern NSW 52 159 211 10 32 42
Northern Sydney 42 30 72 8 6 14
South Eastern Sydney ‐-19 ‐-15 ‐-34 ‐-4 ‐-3 ‐-7
South Western Sydney ‐-153 ‐-236 ‐-389 ‐-31 ‐-47 ‐-78
Southern NSW 15 92 107 3 18 21
Sydney ‐-4 19 15 ‐-1 4 3
Western NSW ‐-23 ‐-119 ‐-142 ‐-5 ‐-24 -28
Western Sydney ‐-273 ‐-240 ‐-513 ‐-55 ‐-48 ‐-103
NSW Excluding Undefined/NA 173 196 369 35 39 74
NSW Undefined/NA/NS/No UR ‐-1007 ‐-947 ‐-1954 ‐-201 ‐-189 ‐-391
NSW Including Undefined/NA ‐-834 ‐-751 ‐-1585 ‐-167 ‐-150 ‐-317
REMOTENESS AREAS
Major Cities of Australia 8 ‐-50 ‐-42 2 ‐-10 ‐-8
Inner Regional Australia 504 709 1213 101 142 243
Outer Regional Australia ‐-138 ‐-267 ‐-405 ‐-28 ‐-53 ‐-81
Remote Australia ‐-130 ‐-129 ‐-259 ‐-26 ‐-26 -52
Very Remote Australia ‐-71 ‐-67 ‐-138 ‐-14 ‐-13 -28
NSW Excluding Undefined/NA 173 196 369 35 39 74
NSW Undefined/NA/NS/No UR ‐-1007 ‐-947 ‐-1954 ‐-201 ‐-189 ‐-391
NSW Including Undefined/NA ‐-834 ‐-751 ‐-1585 ‐-167 ‐-150 ‐-317
NSW Aboriginal Population and Households Projections, 2011–2031 • Page 18
NSW Aboriginal Population and Households Projections, 2011–2031 Page 19
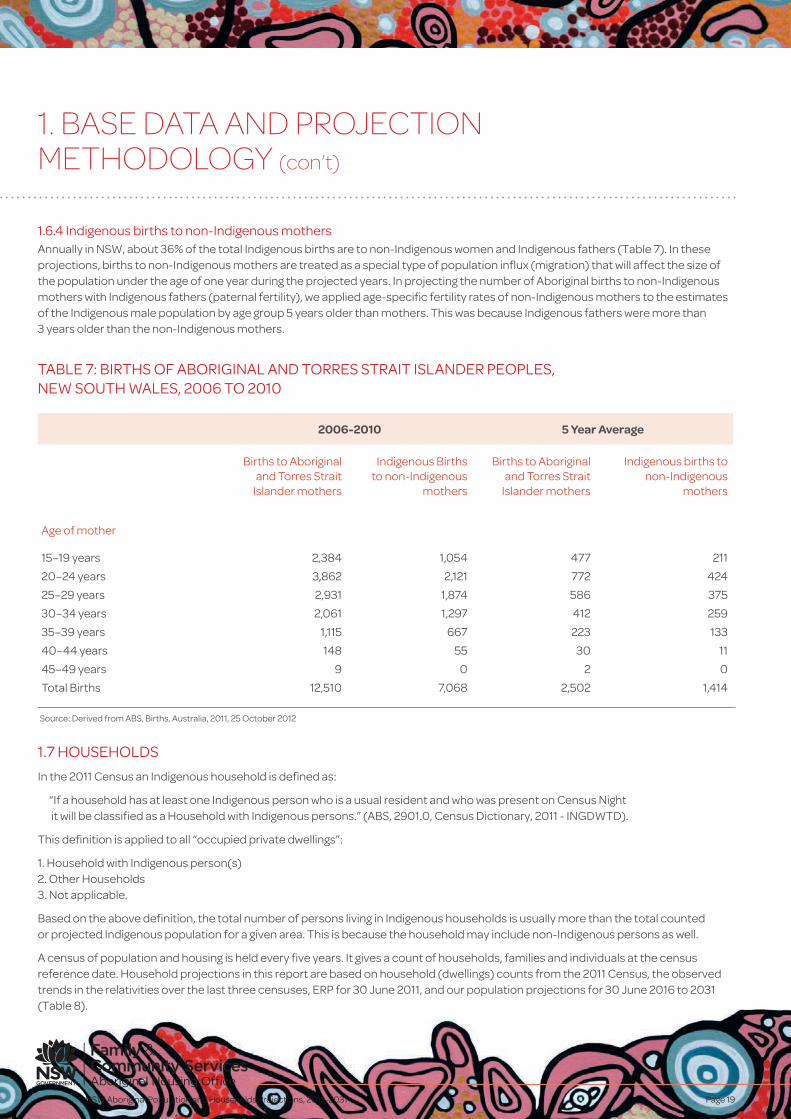
TABLE 7: BIRTHS OF ABORIGINAL AND TORRES STRAIT ISLANDER PEOPLES, NEW SOUTH WALES, 2006 TO 2010
1.6.4 Indigenous births to non-Indigenous mothersAnnually in NSW, about 36% of the total Indigenous births are to non-Indigenous women and Indigenous fathers (Table 7). In these projections, births to non-Indigenous mothers are treated as a special type of population influx (migration) that will affect the size of the population under the age of one year during the projected years. In projecting the number of Aboriginal births to non-Indigenous mothers with Indigenous fathers (paternal fertility), we applied age-specific fertility rates of non-Indigenous mothers to the estimates of the Indigenous male population by age group 5 years older than mothers. This was because Indigenous fathers were more than 3 years older than the non-Indigenous mothers.
1.7 HOUSEHOLDS
In the 2011 Census an Indigenous household is defined as:
“If a household has at least one Indigenous person who is a usual resident and who was present on Census Night it will be classified as a Household with Indigenous persons.” (ABS, 2901.0, Census Dictionary, 2011 - INGDWTD).
This definition is applied to all “occupied private dwellings”:
1. Household with Indigenous person(s) 2. Other Households 3. Not applicable.
Based on the above definition, the total number of persons living in Indigenous households is usually more than the total counted or projected Indigenous population for a given area. This is because the household may include non-Indigenous persons as well.
A census of population and housing is held every five years. It gives a count of households, families and individuals at the census reference date. Household projections in this report are based on household (dwellings) counts from the 2011 Census, the observed trends in the relativities over the last three censuses, ERP for 30 June 2011, and our population projections for 30 June 2016 to 2031 (Table 8).
1. BASE DATA AND PROJECTION METHODOLOGY (con’t)
2006-2010 5 Year Average
Births to Aboriginal and Torres Strait
Islander mothers
Indigenous Births to non-Indigenous
mothers
Births to Aboriginal and Torres Strait
Islander mothers
Indigenous births to non-Indigenous
mothers
Age of mother
15–19 years 2,384 1,054 477 211
20–24 years 3,862 2,121 772 424
25–29 years 2,931 1,874 586 375
30–34 years 2,061 1,297 412 259
35–39 years 1,115 667 223 133
40–44 years 148 55 30 11
45–49 years 9 0 2 0
Total Births 12,510 7,068 2,502 1,414
Source: Derived from ABS, Births, Australia, 2011, 25 October 2012
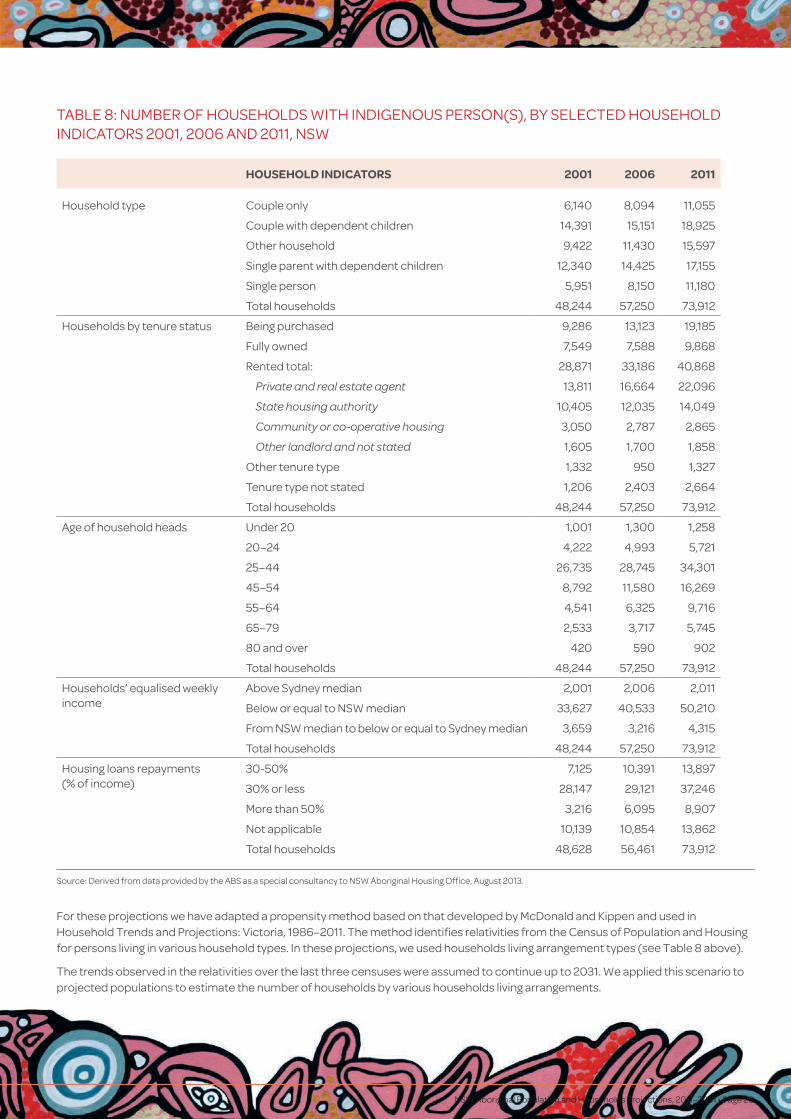
TABLE 8: NUMBER OF HOUSEHOLDS WITH INDIGENOUS PERSON(S), BY SELECTED HOUSEHOLD INDICATORS 2001, 2006 AND 2011, NSW
For these projections we have adapted a propensity method based on that developed by McDonald and Kippen and used in Household Trends and Projections: Victoria, 1986–2011. The method identifies relativities from the Census of Population and Housing for persons living in various household types. In these projections, we used households living arrangement types (see Table 8 above).
The trends observed in the relativities over the last three censuses were assumed to continue up to 2031. We applied this scenario to projected populations to estimate the number of households by various households living arrangements.
Source: Derived from data provided by the ABS as a special consultancy to NSW Aboriginal Housing Office, August 2013.
HOUSEHOLD INDICATORS 2001 2006 2011
Household type Couple only 6,140 8,094 11,055
Couple with dependent children 14,391 15,151 18,925
Other household 9,422 11,430 15,597
Single parent with dependent children 12,340 14,425 17,155
Single person 5,951 8,150 11,180
Total households 48,244 57,250 73,912
Households by tenure status Being purchased 9,286 13,123 19,185
Fully owned 7,549 7,588 9,868
Rented total: 28,871 33,186 40,868
Private and real estate agent 13,811 16,664 22,096
State housing authority 10,405 12,035 14,049
Community or co-operative housing 3,050 2,787 2,865
Other landlord and not stated 1,605 1,700 1,858
Other tenure type 1,332 950 1,327
Tenure type not stated 1,206 2,403 2,664
Total households 48,244 57,250 73,912
Age of household heads Under 20 1,001 1,300 1,258
20–24 4,222 4,993 5,721
25–44 26,735 28,745 34,301
45–54 8,792 11,580 16,269
55–64 4,541 6,325 9,716
65–79 2,533 3,717 5,745
80 and over 420 590 902
Total households 48,244 57,250 73,912
Households’ equalised weekly income
Above Sydney median 2,001 2,006 2,011
Below or equal to NSW median 33,627 40,533 50,210
From NSW median to below or equal to Sydney median 3,659 3,216 4,315
Total households 48,244 57,250 73,912
Housing loans repayments (% of income)
30-50% 7,125 10,391 13,897
30% or less 28,147 29,121 37,246
More than 50% 3,216 6,095 8,907
Not applicable 10,139 10,854 13,862
Total households 48,628 56,461 73,912
NSW Aboriginal Population and Households Projections, 2011–2031 • Page 20
NSW Aboriginal Population and Households Projections, 2011–2031 Page 21
TABLE 9: PROJECTED TOTAL INDIGENOUS POPULATION IN NSW BY REGIONS AND REMOTENESS AREAS, 2011 TO 2031
2.1. POPULATION PROJECTIONS
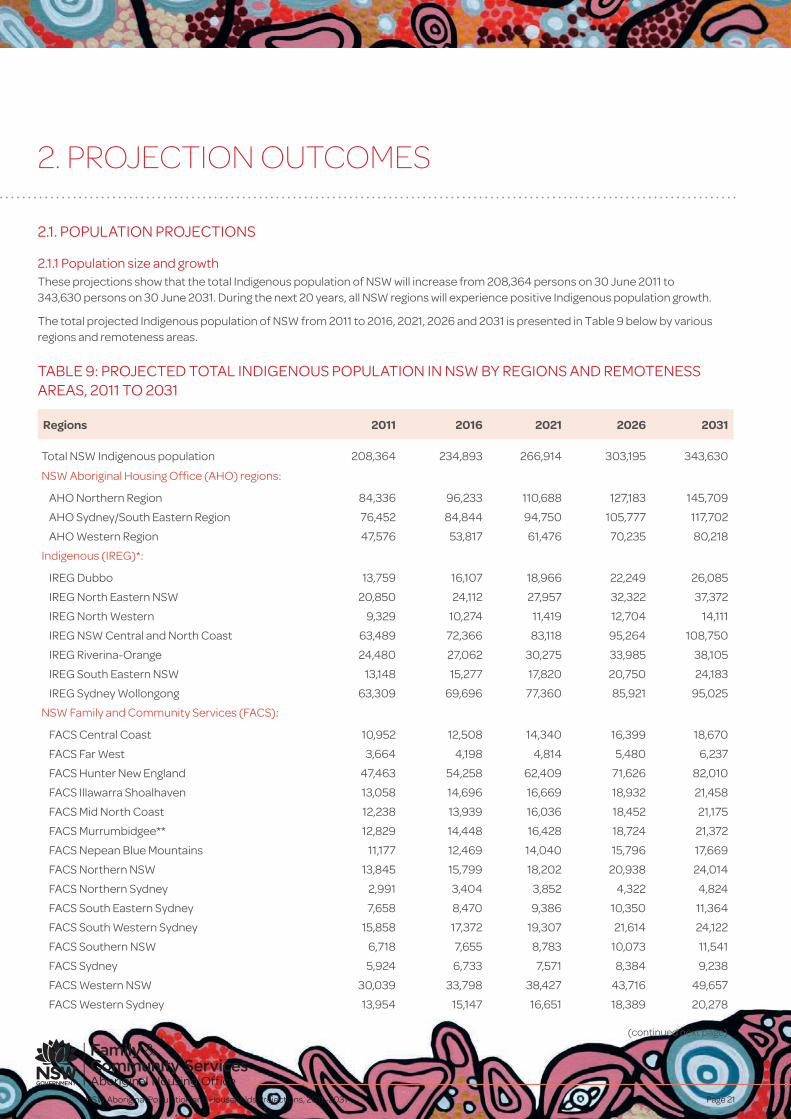
2.1.1 Population size and growthThese projections show that the total Indigenous population of NSW will increase from 208,364 persons on 30 June 2011 to 343,630 persons on 30 June 2031. During the next 20 years, all NSW regions will experience positive Indigenous population growth.
The total projected Indigenous population of NSW from 2011 to 2016, 2021, 2026 and 2031 is presented in Table 9 below by various regions and remoteness areas.
2. PROJECTION OUTCOMES
Regions 2011 2016 2021 2026 2031
Total NSW Indigenous population 208,364 234,893 266,914 303,195 343,630
NSW Aboriginal Housing Office (AHO) regions:
AHO Northern Region 84,336 96,233 110,688 127,183 145,709
AHO Sydney/South Eastern Region 76,452 84,844 94,750 105,777 117,702
AHO Western Region 47,576 53,817 61,476 70,235 80,218
Indigenous (IREG)*:
IREG Dubbo 13,759 16,107 18,966 22,249 26,085
IREG North Eastern NSW 20,850 24,112 27,957 32,322 37,372
IREG North Western 9,329 10,274 11,419 12,704 14,111
IREG NSW Central and North Coast 63,489 72,366 83,118 95,264 108,750
IREG Riverina-Orange 24,480 27,062 30,275 33,985 38,105
IREG South Eastern NSW 13,148 15,277 17,820 20,750 24,183
IREG Sydney Wollongong 63,309 69,696 77,360 85,921 95,025
NSW Family and Community Services (FACS):
FACS Central Coast 10,952 12,508 14,340 16,399 18,670
FACS Far West 3,664 4,198 4,814 5,480 6,237
FACS Hunter New England 47,463 54,258 62,409 71,626 82,010
FACS Illawarra Shoalhaven 13,058 14,696 16,669 18,932 21,458
FACS Mid North Coast 12,238 13,939 16,036 18,452 21,175
FACS Murrumbidgee** 12,829 14,448 16,428 18,724 21,372
FACS Nepean Blue Mountains 11,177 12,469 14,040 15,796 17,669
FACS Northern NSW 13,845 15,799 18,202 20,938 24,014
FACS Northern Sydney 2,991 3,404 3,852 4,322 4,824
FACS South Eastern Sydney 7,658 8,470 9,386 10,350 11,364
FACS South Western Sydney 15,858 17,372 19,307 21,614 24,122
FACS Southern NSW 6,718 7,655 8,783 10,073 11,541
FACS Sydney 5,924 6,733 7,571 8,384 9,238
FACS Western NSW 30,039 33,798 38,427 43,716 49,657
FACS Western Sydney 13,954 15,147 16,651 18,389 20,278
(continued next page)
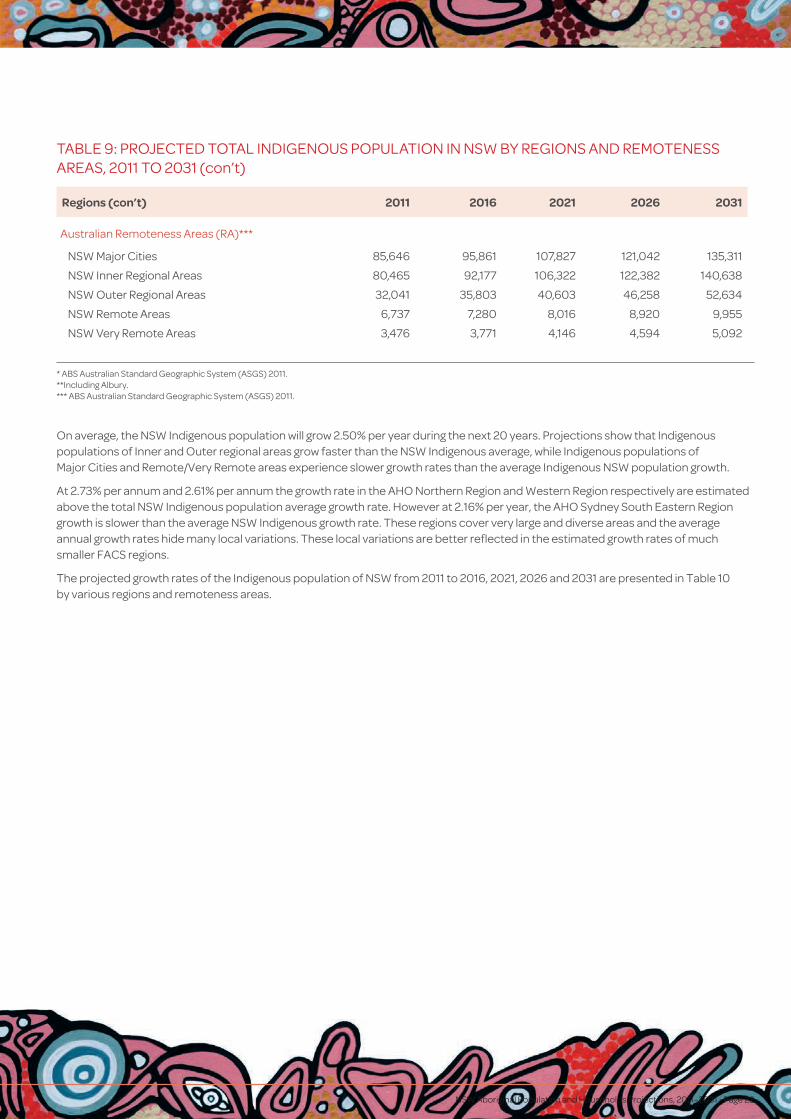
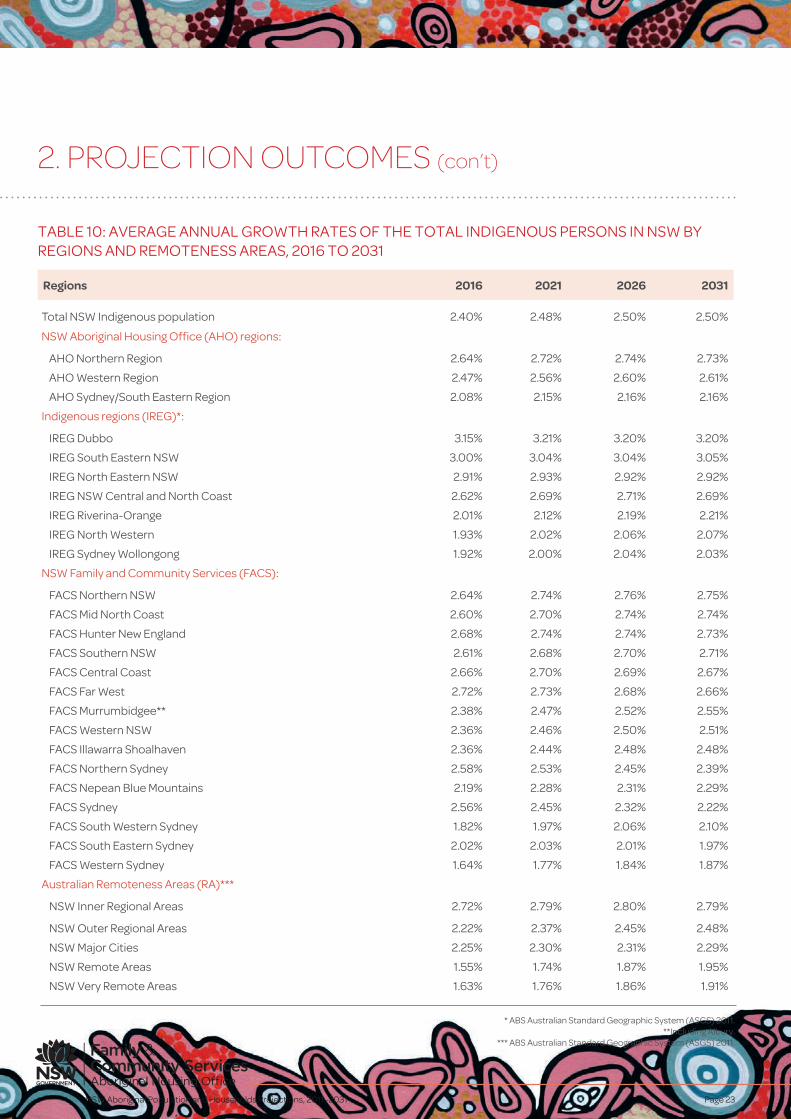
On average, the NSW Indigenous population will grow 2.50% per year during the next 20 years. Projections show that Indigenous populations of Inner and Outer regional areas grow faster than the NSW Indigenous average, while Indigenous populations of Major Cities and Remote/Very Remote areas experience slower growth rates than the average Indigenous NSW population growth.
At 2.73% per annum and 2.61% per annum the growth rate in the AHO Northern Region and Western Region respectively are estimated above the total NSW Indigenous population average growth rate. However at 2.16% per year, the AHO Sydney South Eastern Region growth is slower than the average NSW Indigenous growth rate. These regions cover very large and diverse areas and the average annual growth rates hide many local variations. These local variations are better reflected in the estimated growth rates of much smaller FACS regions.
The projected growth rates of the Indigenous population of NSW from 2011 to 2016, 2021, 2026 and 2031 are presented in Table 10 by various regions and remoteness areas.
* ABS Australian Standard Geographic System (ASGS) 2011. **Including Albury. *** ABS Australian Standard Geographic System (ASGS) 2011.
Regions (con’t) 2011 2016 2021 2026 2031
Australian Remoteness Areas (RA)***
NSW Major Cities 85,646 95,861 107,827 121,042 135,311
NSW Inner Regional Areas 80,465 92,177 106,322 122,382 140,638
NSW Outer Regional Areas 32,041 35,803 40,603 46,258 52,634
NSW Remote Areas 6,737 7,280 8,016 8,920 9,955
NSW Very Remote Areas 3,476 3,771 4,146 4,594 5,092
NSW Aboriginal Population and Households Projections, 2011–2031 • Page 22
TABLE 9: PROJECTED TOTAL INDIGENOUS POPULATION IN NSW BY REGIONS AND REMOTENESS AREAS, 2011 TO 2031 (con’t)
NSW Aboriginal Population and Households Projections, 2011–2031 Page 23
TABLE 10: AVERAGE ANNUAL GROWTH RATES OF THE TOTAL INDIGENOUS PERSONS IN NSW BY REGIONS AND REMOTENESS AREAS, 2016 TO 2031
2. PROJECTION OUTCOMES (con’t)
* ABS Australian Standard Geographic System (ASGS) 2011. **Including Albury.
*** ABS Australian Standard Geographic System (ASGS) 2011.
Regions 2016 2021 2026 2031
Total NSW Indigenous population 2.40% 2.48% 2.50% 2.50%
NSW Aboriginal Housing Office (AHO) regions:
AHO Northern Region 2.64% 2.72% 2.74% 2.73%
AHO Western Region 2.47% 2.56% 2.60% 2.61%
AHO Sydney/South Eastern Region 2.08% 2.15% 2.16% 2.16%
Indigenous regions (IREG)*:
IREG Dubbo 3.15% 3.21% 3.20% 3.20%
IREG South Eastern NSW 3.00% 3.04% 3.04% 3.05%
IREG North Eastern NSW 2.91% 2.93% 2.92% 2.92%
IREG NSW Central and North Coast 2.62% 2.69% 2.71% 2.69%
IREG Riverina-Orange 2.01% 2.12% 2.19% 2.21%
IREG North Western 1.93% 2.02% 2.06% 2.07%
IREG Sydney Wollongong 1.92% 2.00% 2.04% 2.03%
NSW Family and Community Services (FACS):
FACS Northern NSW 2.64% 2.74% 2.76% 2.75%
FACS Mid North Coast 2.60% 2.70% 2.74% 2.74%
FACS Hunter New England 2.68% 2.74% 2.74% 2.73%
FACS Southern NSW 2.61% 2.68% 2.70% 2.71%
FACS Central Coast 2.66% 2.70% 2.69% 2.67%
FACS Far West 2.72% 2.73% 2.68% 2.66%
FACS Murrumbidgee** 2.38% 2.47% 2.52% 2.55%
FACS Western NSW 2.36% 2.46% 2.50% 2.51%
FACS Illawarra Shoalhaven 2.36% 2.44% 2.48% 2.48%
FACS Northern Sydney 2.58% 2.53% 2.45% 2.39%
FACS Nepean Blue Mountains 2.19% 2.28% 2.31% 2.29%
FACS Sydney 2.56% 2.45% 2.32% 2.22%
FACS South Western Sydney 1.82% 1.97% 2.06% 2.10%
FACS South Eastern Sydney 2.02% 2.03% 2.01% 1.97%
FACS Western Sydney 1.64% 1.77% 1.84% 1.87%
Australian Remoteness Areas (RA)***
NSW Inner Regional Areas 2.72% 2.79% 2.80% 2.79%
NSW Outer Regional Areas 2.22% 2.37% 2.45% 2.48%
NSW Major Cities 2.25% 2.30% 2.31% 2.29%
NSW Remote Areas 1.55% 1.74% 1.87% 1.95%
NSW Very Remote Areas 1.63% 1.76% 1.86% 1.91%
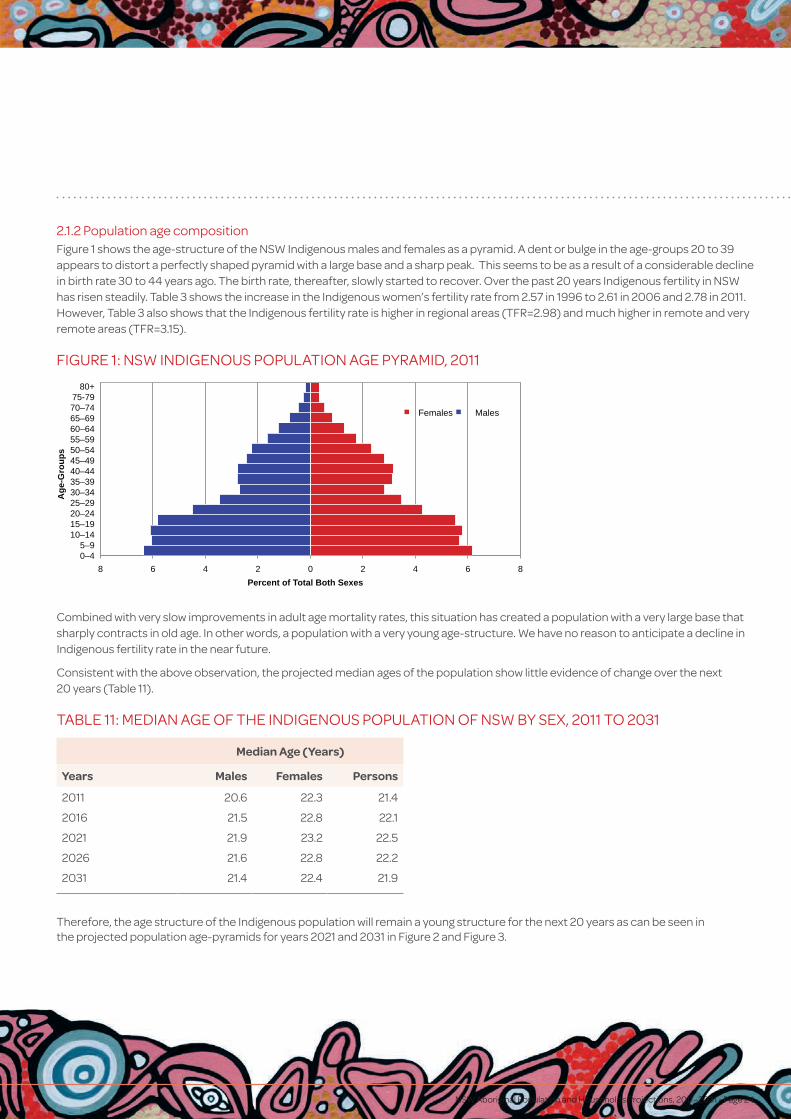
2.1.2 Population age compositionFigure 1 shows the age-structure of the NSW Indigenous males and females as a pyramid. A dent or bulge in the age-groups 20 to 39 appears to distort a perfectly shaped pyramid with a large base and a sharp peak. This seems to be as a result of a considerable decline in birth rate 30 to 44 years ago. The birth rate, thereafter, slowly started to recover. Over the past 20 years Indigenous fertility in NSW has risen steadily. Table 3 shows the increase in the Indigenous women’s fertility rate from 2.57 in 1996 to 2.61 in 2006 and 2.78 in 2011. However, Table 3 also shows that the Indigenous fertility rate is higher in regional areas (TFR=2.98) and much higher in remote and very remote areas (TFR=3.15).
FIGURE 1: NSW INDIGENOUS POPULATION AGE PYRAMID, 2011
8 6 4 2 0 2 4 6 8 0–4 5–9
10–14 15–19 20–24 25–29 30–34 35–39 40–44 45–49 50–54 55–59 60–64 65–69 70–74 75-79
80+
Percent of Total Both Sexes
Age
-Gro
ups
Females Males
Combined with very slow improvements in adult age mortality rates, this situation has created a population with a very large base that sharply contracts in old age. In other words, a population with a very young age-structure. We have no reason to anticipate a decline in Indigenous fertility rate in the near future.
Consistent with the above observation, the projected median ages of the population show little evidence of change over the next 20 years (Table 11).
TABLE 11: MEDIAN AGE OF THE INDIGENOUS POPULATION OF NSW BY SEX, 2011 TO 2031
Median Age (Years)
Years Males Females Persons
2011 20.6 22.3 21.4
2016 21.5 22.8 22.1
2021 21.9 23.2 22.5
2026 21.6 22.8 22.2
2031 21.4 22.4 21.9
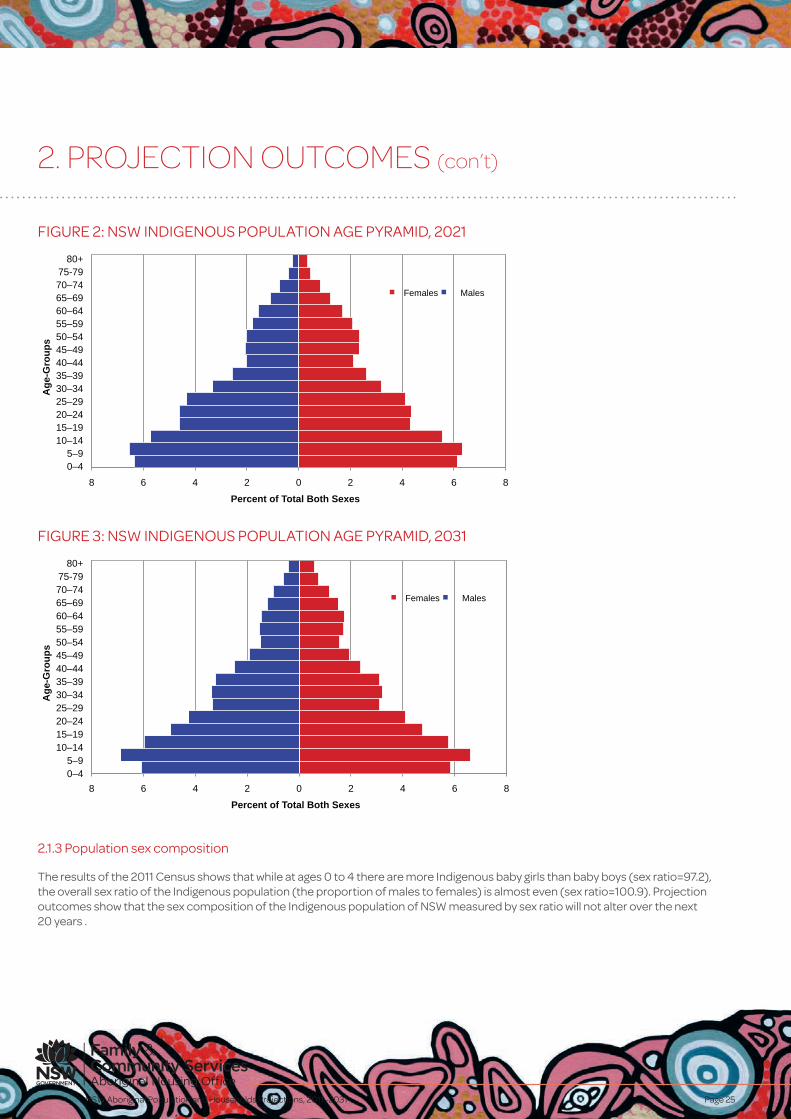
Therefore, the age structure of the Indigenous population will remain a young structure for the next 20 years as can be seen in the projected population age-pyramids for years 2021 and 2031 in Figure 2 and Figure 3.
NSW Aboriginal Population and Households Projections, 2011–2031 • Page 24
NSW Aboriginal Population and Households Projections, 2011–2031 Page 25
FIGURE 2: NSW INDIGENOUS POPULATION AGE PYRAMID, 2021
8 6 4 2 0 2 4 6 8 0–4 5–9
10–14 15–19 20–24 25–29 30–34 35–39 40–44
45–49 50–54 55–59 60–64 65–69 70–74 75-79
80+
Percent of Total Both Sexes
Age
-Gro
ups
Females Males
FIGURE 3: NSW INDIGENOUS POPULATION AGE PYRAMID, 2031
8 6 4 2 0 2 4 6 8 0–4 5–9
10–14
15–19
20–24 25–29 30–34 35–39 40–44 45–49 50–54 55–59 60–64 65–69 70–74 75-79
80+
Percent of Total Both Sexes
Age
-Gro
ups
Females Males
2.1.3 Population sex composition
The results of the 2011 Census shows that while at ages 0 to 4 there are more Indigenous baby girls than baby boys (sex ratio=97.2), the overall sex ratio of the Indigenous population (the proportion of males to females) is almost even (sex ratio=100.9). Projection outcomes show that the sex composition of the Indigenous population of NSW measured by sex ratio will not alter over the next 20 years .
2. PROJECTION OUTCOMES (con’t)
NSW Aboriginal Population and Households Projections, 2011–2031 • Page 26
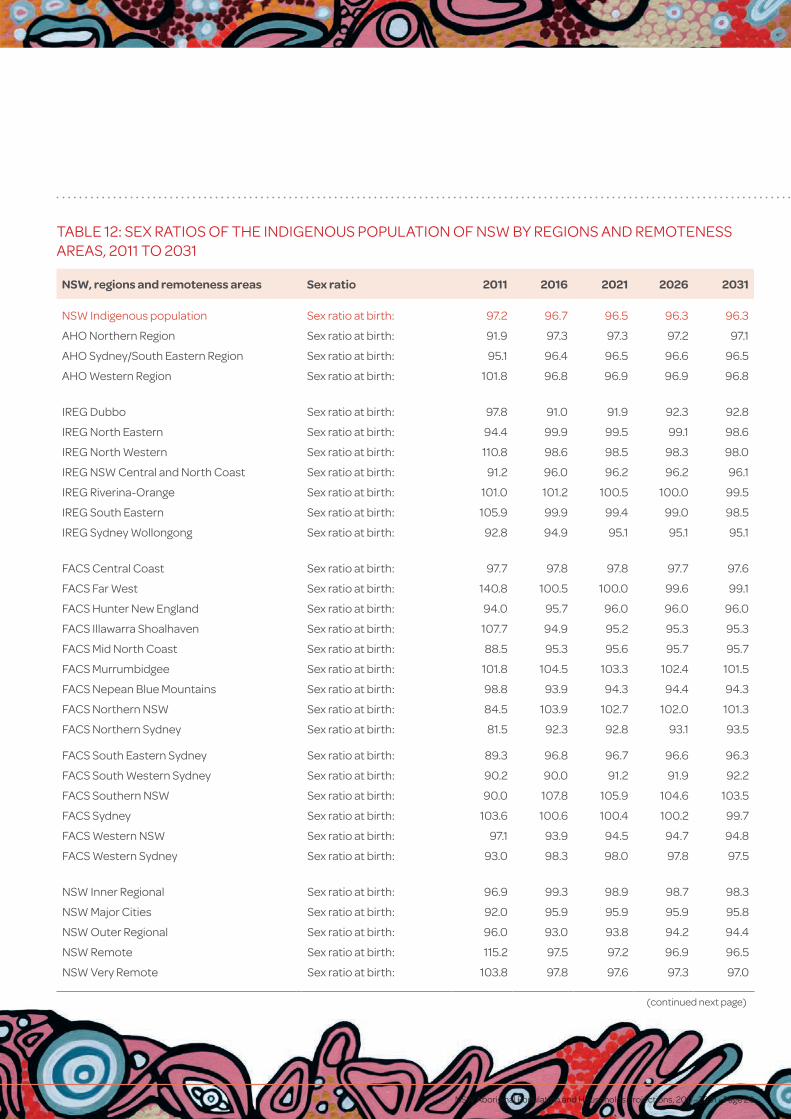
TABLE 12: SEX RATIOS OF THE INDIGENOUS POPULATION OF NSW BY REGIONS AND REMOTENESS AREAS, 2011 TO 2031
NSW, regions and remoteness areas Sex ratio 2011 2016 2021 2026 2031
NSW Indigenous population Sex ratio at birth: 97.2 96.7 96.5 96.3 96.3
AHO Northern Region Sex ratio at birth: 91.9 97.3 97.3 97.2 97.1
AHO Sydney/South Eastern Region Sex ratio at birth: 95.1 96.4 96.5 96.6 96.5
AHO Western Region Sex ratio at birth: 101.8 96.8 96.9 96.9 96.8
IREG Dubbo Sex ratio at birth: 97.8 91.0 91.9 92.3 92.8
IREG North Eastern Sex ratio at birth: 94.4 99.9 99.5 99.1 98.6
IREG North Western Sex ratio at birth: 110.8 98.6 98.5 98.3 98.0
IREG NSW Central and North Coast Sex ratio at birth: 91.2 96.0 96.2 96.2 96.1
IREG Riverina-Orange Sex ratio at birth: 101.0 101.2 100.5 100.0 99.5
IREG South Eastern Sex ratio at birth: 105.9 99.9 99.4 99.0 98.5
IREG Sydney Wollongong Sex ratio at birth: 92.8 94.9 95.1 95.1 95.1
FACS Central Coast Sex ratio at birth: 97.7 97.8 97.8 97.7 97.6
FACS Far West Sex ratio at birth: 140.8 100.5 100.0 99.6 99.1
FACS Hunter New England Sex ratio at birth: 94.0 95.7 96.0 96.0 96.0
FACS Illawarra Shoalhaven Sex ratio at birth: 107.7 94.9 95.2 95.3 95.3
FACS Mid North Coast Sex ratio at birth: 88.5 95.3 95.6 95.7 95.7
FACS Murrumbidgee Sex ratio at birth: 101.8 104.5 103.3 102.4 101.5
FACS Nepean Blue Mountains Sex ratio at birth: 98.8 93.9 94.3 94.4 94.3
FACS Northern NSW Sex ratio at birth: 84.5 103.9 102.7 102.0 101.3
FACS Northern Sydney Sex ratio at birth: 81.5 92.3 92.8 93.1 93.5
FACS South Eastern Sydney Sex ratio at birth: 89.3 96.8 96.7 96.6 96.3
FACS South Western Sydney Sex ratio at birth: 90.2 90.0 91.2 91.9 92.2
FACS Southern NSW Sex ratio at birth: 90.0 107.8 105.9 104.6 103.5
FACS Sydney Sex ratio at birth: 103.6 100.6 100.4 100.2 99.7
FACS Western NSW Sex ratio at birth: 97.1 93.9 94.5 94.7 94.8
FACS Western Sydney Sex ratio at birth: 93.0 98.3 98.0 97.8 97.5
NSW Inner Regional Sex ratio at birth: 96.9 99.3 98.9 98.7 98.3
NSW Major Cities Sex ratio at birth: 92.0 95.9 95.9 95.9 95.8
NSW Outer Regional Sex ratio at birth: 96.0 93.0 93.8 94.2 94.4
NSW Remote Sex ratio at birth: 115.2 97.5 97.2 96.9 96.5
NSW Very Remote Sex ratio at birth: 103.8 97.8 97.6 97.3 97.0
(continued next page)
NSW Aboriginal Population and Households Projections, 2011–2031 Page 27
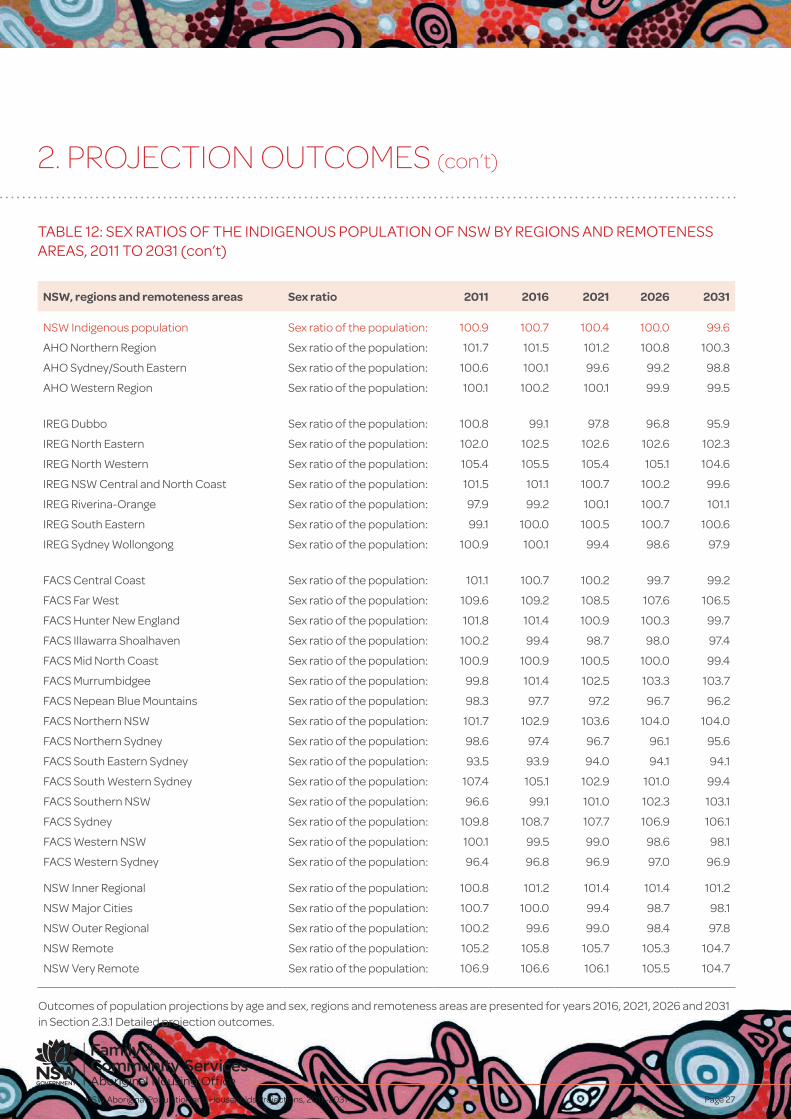
NSW, regions and remoteness areas Sex ratio 2011 2016 2021 2026 2031
NSW Indigenous population Sex ratio of the population: 100.9 100.7 100.4 100.0 99.6
AHO Northern Region Sex ratio of the population: 101.7 101.5 101.2 100.8 100.3
AHO Sydney/South Eastern Sex ratio of the population: 100.6 100.1 99.6 99.2 98.8
AHO Western Region Sex ratio of the population: 100.1 100.2 100.1 99.9 99.5
IREG Dubbo Sex ratio of the population: 100.8 99.1 97.8 96.8 95.9
IREG North Eastern Sex ratio of the population: 102.0 102.5 102.6 102.6 102.3
IREG North Western Sex ratio of the population: 105.4 105.5 105.4 105.1 104.6
IREG NSW Central and North Coast Sex ratio of the population: 101.5 101.1 100.7 100.2 99.6
IREG Riverina-Orange Sex ratio of the population: 97.9 99.2 100.1 100.7 101.1
IREG South Eastern Sex ratio of the population: 99.1 100.0 100.5 100.7 100.6
IREG Sydney Wollongong Sex ratio of the population: 100.9 100.1 99.4 98.6 97.9
FACS Central Coast Sex ratio of the population: 101.1 100.7 100.2 99.7 99.2
FACS Far West Sex ratio of the population: 109.6 109.2 108.5 107.6 106.5
FACS Hunter New England Sex ratio of the population: 101.8 101.4 100.9 100.3 99.7
FACS Illawarra Shoalhaven Sex ratio of the population: 100.2 99.4 98.7 98.0 97.4
FACS Mid North Coast Sex ratio of the population: 100.9 100.9 100.5 100.0 99.4
FACS Murrumbidgee Sex ratio of the population: 99.8 101.4 102.5 103.3 103.7
FACS Nepean Blue Mountains Sex ratio of the population: 98.3 97.7 97.2 96.7 96.2
FACS Northern NSW Sex ratio of the population: 101.7 102.9 103.6 104.0 104.0
FACS Northern Sydney Sex ratio of the population: 98.6 97.4 96.7 96.1 95.6
FACS South Eastern Sydney Sex ratio of the population: 93.5 93.9 94.0 94.1 94.1
FACS South Western Sydney Sex ratio of the population: 107.4 105.1 102.9 101.0 99.4
FACS Southern NSW Sex ratio of the population: 96.6 99.1 101.0 102.3 103.1
FACS Sydney Sex ratio of the population: 109.8 108.7 107.7 106.9 106.1
FACS Western NSW Sex ratio of the population: 100.1 99.5 99.0 98.6 98.1
FACS Western Sydney Sex ratio of the population: 96.4 96.8 96.9 97.0 96.9
NSW Inner Regional Sex ratio of the population: 100.8 101.2 101.4 101.4 101.2
NSW Major Cities Sex ratio of the population: 100.7 100.0 99.4 98.7 98.1
NSW Outer Regional Sex ratio of the population: 100.2 99.6 99.0 98.4 97.8
NSW Remote Sex ratio of the population: 105.2 105.8 105.7 105.3 104.7
NSW Very Remote Sex ratio of the population: 106.9 106.6 106.1 105.5 104.7
Outcomes of population projections by age and sex, regions and remoteness areas are presented for years 2016, 2021, 2026 and 2031 in Section 2.3.1 Detailed projection outcomes.
2. PROJECTION OUTCOMES (con’t)
TABLE 12: SEX RATIOS OF THE INDIGENOUS POPULATION OF NSW BY REGIONS AND REMOTENESS AREAS, 2011 TO 2031 (con’t)
NSW Aboriginal Population and Households Projections, 2011–2031 • Page 28
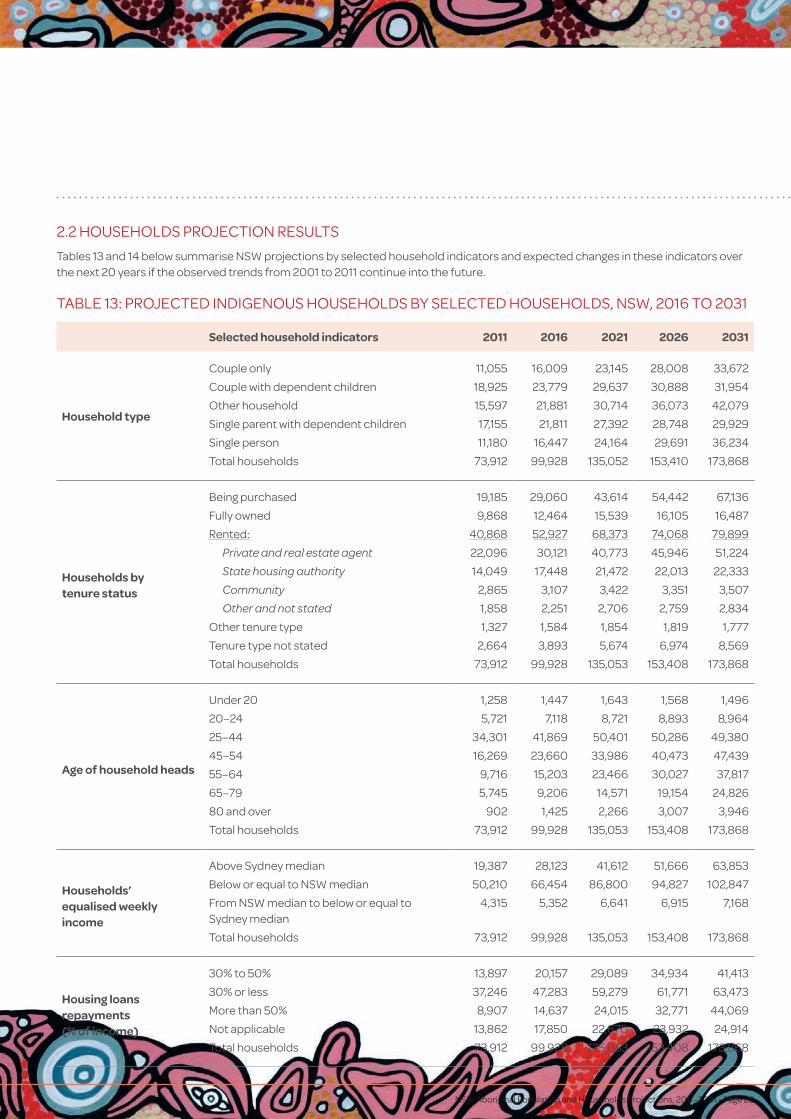
2.2 HOUSEHOLDS PROJECTION RESULTS
Tables 13 and 14 below summarise NSW projections by selected household indicators and expected changes in these indicators over the next 20 years if the observed trends from 2001 to 2011 continue into the future.
TABLE 13: PROJECTED INDIGENOUS HOUSEHOLDS BY SELECTED HOUSEHOLDS, NSW, 2016 TO 2031
Selected household indicators 2011 2016 2021 2026 2031
Household type
Couple only 11,055 16,009 23,145 28,008 33,672
Couple with dependent children 18,925 23,779 29,637 30,888 31,954
Other household 15,597 21,881 30,714 36,073 42,079
Single parent with dependent children 17,155 21,811 27,392 28,748 29,929
Single person 11,180 16,447 24,164 29,691 36,234
Total households 73,912 99,928 135,052 153,410 173,868
Households by tenure status
Being purchased 19,185 29,060 43,614 54,442 67,136
Fully owned 9,868 12,464 15,539 16,105 16,487
Rented: 40,868 52,927 68,373 74,068 79,899
Private and real estate agent 22,096 30,121 40,773 45,946 51,224
State housing authority 14,049 17,448 21,472 22,013 22,333
Community 2,865 3,107 3,422 3,351 3,507
Other and not stated 1,858 2,251 2,706 2,759 2,834
Other tenure type 1,327 1,584 1,854 1,819 1,777
Tenure type not stated 2,664 3,893 5,674 6,974 8,569
Total households 73,912 99,928 135,053 153,408 173,868
Age of household heads
Under 20 1,258 1,447 1,643 1,568 1,496
20–24 5,721 7,118 8,721 8,893 8,964
25–44 34,301 41,869 50,401 50,286 49,380
45–54 16,269 23,660 33,986 40,473 47,439
55–64 9,716 15,203 23,466 30,027 37,817
65–79 5,745 9,206 14,571 19,154 24,826
80 and over 902 1,425 2,266 3,007 3,946
Total households 73,912 99,928 135,053 153,408 173,868
Households’ equalised weekly income
Above Sydney median 19,387 28,123 41,612 51,666 63,853
Below or equal to NSW median 50,210 66,454 86,800 94,827 102,847
From NSW median to below or equal to Sydney median
4,315 5,352 6,641 6,915 7,168
Total households 73,912 99,928 135,053 153,408 173,868
Housing loans repayments (% of income)
30% to 50% 13,897 20,157 29,089 34,934 41,413
30% or less 37,246 47,283 59,279 61,771 63,473
More than 50% 8,907 14,637 24,015 32,771 44,069
Not applicable 13,862 17,850 22,670 23,932 24,914
Total households 73,912 99,928 135,053 153,408 173,868
NSW Aboriginal Population and Households Projections, 2011–2031 Page 29
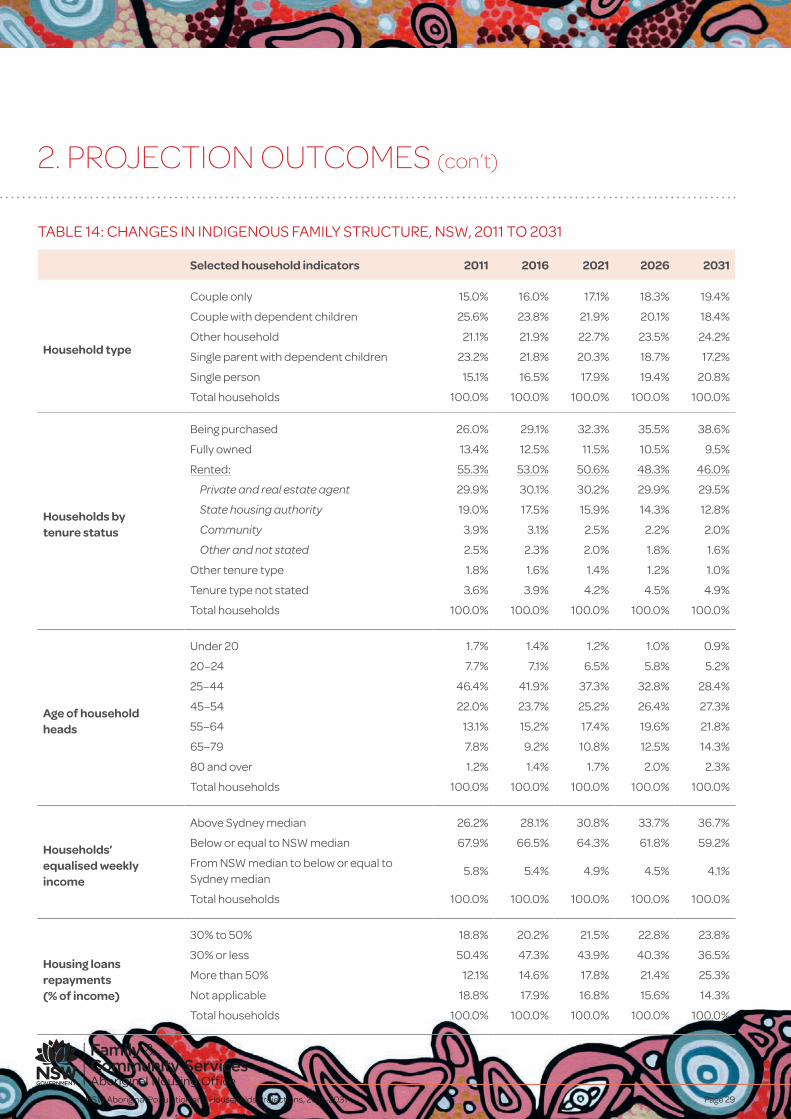
TABLE 14: CHANGES IN INDIGENOUS FAMILY STRUCTURE, NSW, 2011 TO 2031
Selected household indicators 2011 2016 2021 2026 2031
Household type
Couple only 15.0% 16.0% 17.1% 18.3% 19.4%
Couple with dependent children 25.6% 23.8% 21.9% 20.1% 18.4%
Other household 21.1% 21.9% 22.7% 23.5% 24.2%
Single parent with dependent children 23.2% 21.8% 20.3% 18.7% 17.2%
Single person 15.1% 16.5% 17.9% 19.4% 20.8%
Total households 100.0% 100.0% 100.0% 100.0% 100.0%
Households by tenure status
Being purchased 26.0% 29.1% 32.3% 35.5% 38.6%
Fully owned 13.4% 12.5% 11.5% 10.5% 9.5%
Rented: 55.3% 53.0% 50.6% 48.3% 46.0%
Private and real estate agent 29.9% 30.1% 30.2% 29.9% 29.5%
State housing authority 19.0% 17.5% 15.9% 14.3% 12.8%
Community 3.9% 3.1% 2.5% 2.2% 2.0%
Other and not stated 2.5% 2.3% 2.0% 1.8% 1.6%
Other tenure type 1.8% 1.6% 1.4% 1.2% 1.0%
Tenure type not stated 3.6% 3.9% 4.2% 4.5% 4.9%
Total households 100.0% 100.0% 100.0% 100.0% 100.0%
Age of household heads
Under 20 1.7% 1.4% 1.2% 1.0% 0.9%
20–24 7.7% 7.1% 6.5% 5.8% 5.2%
25–44 46.4% 41.9% 37.3% 32.8% 28.4%
45–54 22.0% 23.7% 25.2% 26.4% 27.3%
55–64 13.1% 15.2% 17.4% 19.6% 21.8%
65–79 7.8% 9.2% 10.8% 12.5% 14.3%
80 and over 1.2% 1.4% 1.7% 2.0% 2.3%
Total households 100.0% 100.0% 100.0% 100.0% 100.0%
Households’ equalised weekly income
Above Sydney median 26.2% 28.1% 30.8% 33.7% 36.7%
Below or equal to NSW median 67.9% 66.5% 64.3% 61.8% 59.2%
From NSW median to below or equal to Sydney median
5.8% 5.4% 4.9% 4.5% 4.1%
Total households 100.0% 100.0% 100.0% 100.0% 100.0%
Housing loans repayments (% of income)
30% to 50% 18.8% 20.2% 21.5% 22.8% 23.8%
30% or less 50.4% 47.3% 43.9% 40.3% 36.5%
More than 50% 12.1% 14.6% 17.8% 21.4% 25.3%
Not applicable 18.8% 17.9% 16.8% 15.6% 14.3%
Total households 100.0% 100.0% 100.0% 100.0% 100.0%
2. PROJECTION OUTCOMES (con’t)
NSW Aboriginal Population and Households Projections, 2011–2031 • Page 30
2.2.1 Household typesProjections show that over the next 20 years the number of Indigenous households in NSW will increase 135% compared with a 65% increase in the total Indigenous population during this period. This large increase is mainly due to the growth in lone-person households (from 15% to 21%) and couple households with no children (from 15% to 19.4%). The fragmentation of Indigenous household structures will have considerable implications for housing needs of Indigenous people in NSW.
However, the average annual household growth rate is expected to slow down from 6% during the period 2011–16 to 4.3% during the period 2026–31.
The fastest Indigenous household increase of 5.3% is expected to occur in Far West Region (Dubbo). The slowest Indigenous household increase of 3.0% per year is expected to occur in Sydney Region.
There have been substantial changes in family structure in the last 30 years (ABS, 2002). Ageing of the population and divorce are two factors that may be contributing to these changes. The trend in changing family structure is reflected in Table 14 above.
2.2.2 Household tenure Tables 13 and 14 show Indigenous households projection outcomes by tenure types in NSW. Projection outcomes suggest noticeable changes in the tenure type of the Indigenous dwellings over the next 20 years. While the proportion of fully-owned dwellings will not change considerably, the proportion of mortgaged properties will increase from 26% in 2011 to 38.6% in 2031. On the other hand, the proportion of renting households will decrease slightly, from 55.3% in 2011 to 46% in 2031.
2.2.3 Age of household heads In 2011 nearly half of household heads were aged 25 to 44 years (46.4%). In 2031 this proportion will decrease to 28.4%. The share of those aged 45 to 54 and 54 to 64 will increase to 27.3% and 21.8% respectively.
2.2.4 Household weekly incomeProjection outcomes show that NSW Indigenous household’s weekly income will improve. Those households with an equalised weekly income above the Sydney median will increase 10 percentage points.
2.2.5 Housing loans repaymentsAs a consequence of more and more Indigenous households moving into the housing market over the next 20 years, a larger proportion of household income will be spent on housing loans.
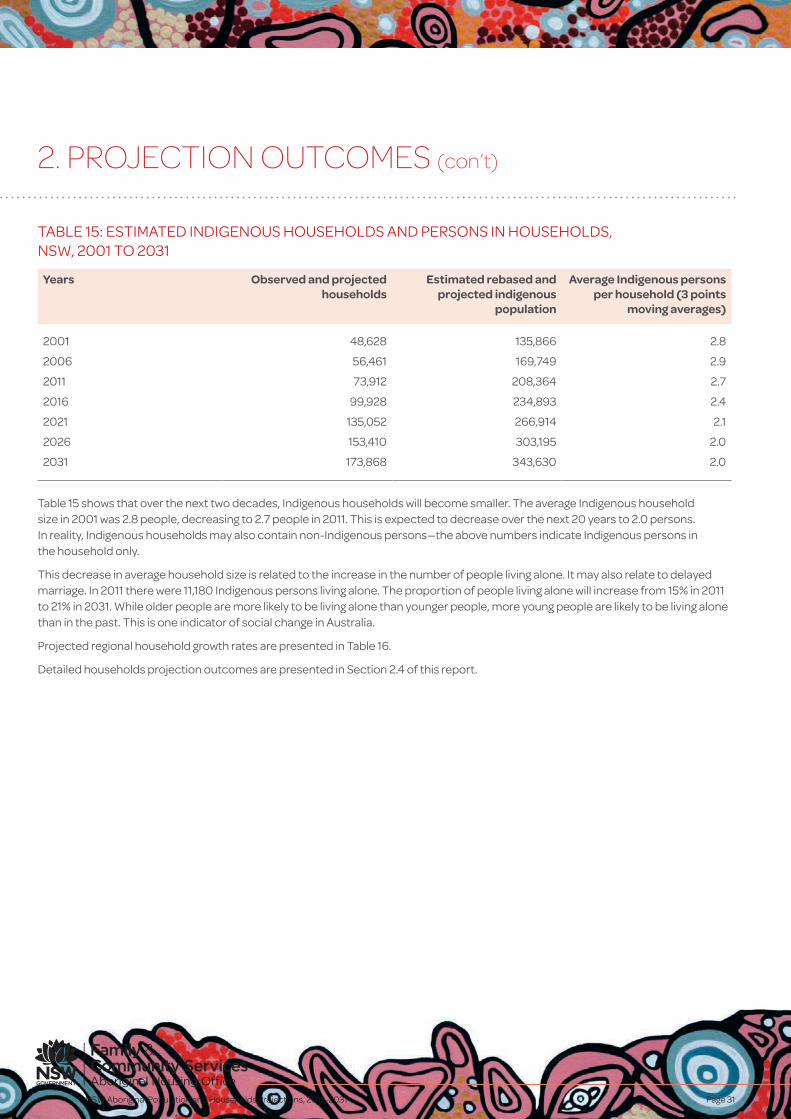
2.2.6 Average persons per householdChanges in average number of Indigenous persons in households are presented in Table 15. Taking into account the higher-than-expected Indigenous population (2011 Census), we have estimated the equivalent re-based population for 2006 and 2001. This ensures consistency of working changes in the average household size.
NSW Aboriginal Population and Households Projections, 2011–2031 Page 31
TABLE 15: ESTIMATED INDIGENOUS HOUSEHOLDS AND PERSONS IN HOUSEHOLDS, NSW, 2001 TO 2031
Years Observed and projected households
Estimated rebased and projected indigenous
population
Average Indigenous persons per household (3 points
moving averages)
2001 48,628 135,866 2.8
2006 56,461 169,749 2.9
2011 73,912 208,364 2.7
2016 99,928 234,893 2.4
2021 135,052 266,914 2.1
2026 153,410 303,195 2.0
2031 173,868 343,630 2.0
Table 15 shows that over the next two decades, Indigenous households will become smaller. The average Indigenous household size in 2001 was 2.8 people, decreasing to 2.7 people in 2011. This is expected to decrease over the next 20 years to 2.0 persons. In reality, Indigenous households may also contain non-Indigenous persons—the above numbers indicate Indigenous persons in the household only.
This decrease in average household size is related to the increase in the number of people living alone. It may also relate to delayed marriage. In 2011 there were 11,180 Indigenous persons living alone. The proportion of people living alone will increase from 15% in 2011 to 21% in 2031. While older people are more likely to be living alone than younger people, more young people are likely to be living alone than in the past. This is one indicator of social change in Australia.
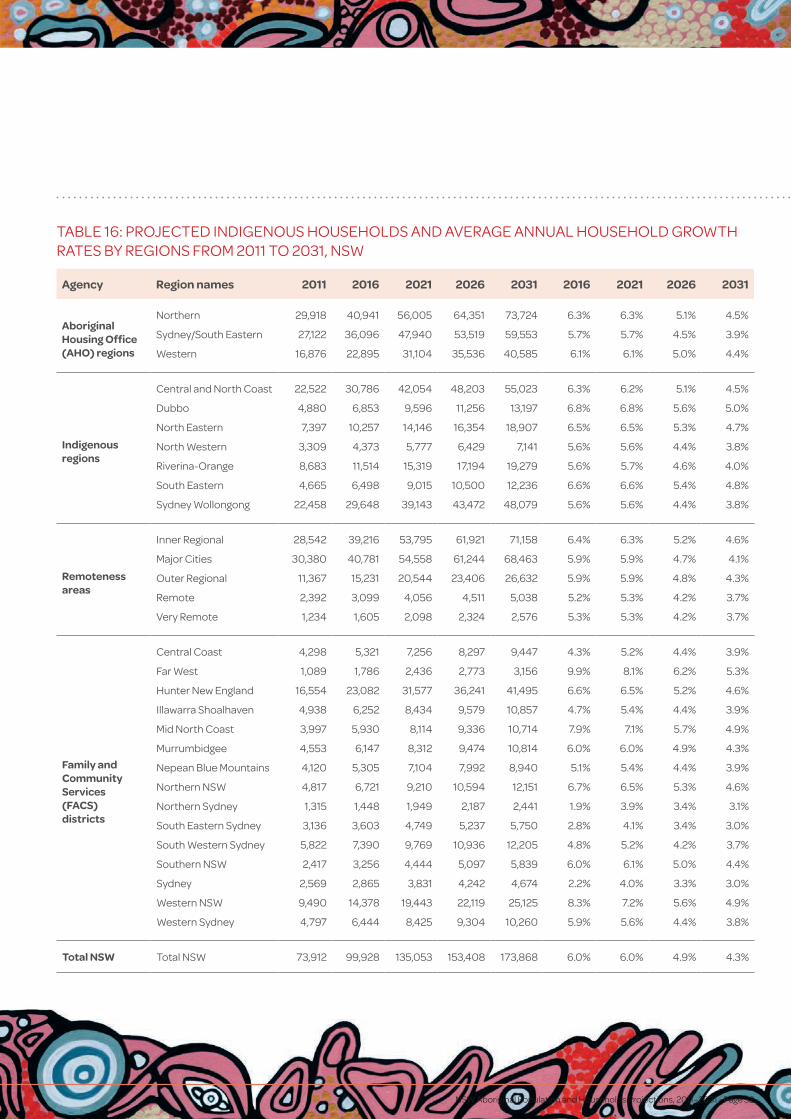
Projected regional household growth rates are presented in Table 16.
Detailed households projection outcomes are presented in Section 2.4 of this report.
2. PROJECTION OUTCOMES (con’t)
NSW Aboriginal Population and Households Projections, 2011–2031 • Page 32
TABLE 16: PROJECTED INDIGENOUS HOUSEHOLDS AND AVERAGE ANNUAL HOUSEHOLD GROWTH RATES BY REGIONS FROM 2011 TO 2031, NSW
Agency Region names 2011 2016 2021 2026 2031 2016 2021 2026 2031
Aboriginal Housing Office (AHO) regions
Northern 29,918 40,941 56,005 64,351 73,724 6.3% 6.3% 5.1% 4.5%
Sydney/South Eastern 27,122 36,096 47,940 53,519 59,553 5.7% 5.7% 4.5% 3.9%
Western 16,876 22,895 31,104 35,536 40,585 6.1% 6.1% 5.0% 4.4%
Indigenous regions
Central and North Coast 22,522 30,786 42,054 48,203 55,023 6.3% 6.2% 5.1% 4.5%
Dubbo 4,880 6,853 9,596 11,256 13,197 6.8% 6.8% 5.6% 5.0%
North Eastern 7,397 10,257 14,146 16,354 18,907 6.5% 6.5% 5.3% 4.7%
North Western 3,309 4,373 5,777 6,429 7,141 5.6% 5.6% 4.4% 3.8%
Riverina-Orange 8,683 11,514 15,319 17,194 19,279 5.6% 5.7% 4.6% 4.0%
South Eastern 4,665 6,498 9,015 10,500 12,236 6.6% 6.6% 5.4% 4.8%
Sydney Wollongong 22,458 29,648 39,143 43,472 48,079 5.6% 5.6% 4.4% 3.8%
Remoteness areas
Inner Regional 28,542 39,216 53,795 61,921 71,158 6.4% 6.3% 5.2% 4.6%
Major Cities 30,380 40,781 54,558 61,244 68,463 5.9% 5.9% 4.7% 4.1%
Outer Regional 11,367 15,231 20,544 23,406 26,632 5.9% 5.9% 4.8% 4.3%
Remote 2,392 3,099 4,056 4,511 5,038 5.2% 5.3% 4.2% 3.7%
Very Remote 1,234 1,605 2,098 2,324 2,576 5.3% 5.3% 4.2% 3.7%
Family and Community Services (FACS) districts
Central Coast 4,298 5,321 7,256 8,297 9,447 4.3% 5.2% 4.4% 3.9%
Far West 1,089 1,786 2,436 2,773 3,156 9.9% 8.1% 6.2% 5.3%
Hunter New England 16,554 23,082 31,577 36,241 41,495 6.6% 6.5% 5.2% 4.6%
Illawarra Shoalhaven 4,938 6,252 8,434 9,579 10,857 4.7% 5.4% 4.4% 3.9%
Mid North Coast 3,997 5,930 8,114 9,336 10,714 7.9% 7.1% 5.7% 4.9%
Murrumbidgee 4,553 6,147 8,312 9,474 10,814 6.0% 6.0% 4.9% 4.3%
Nepean Blue Mountains 4,120 5,305 7,104 7,992 8,940 5.1% 5.4% 4.4% 3.9%
Northern NSW 4,817 6,721 9,210 10,594 12,151 6.7% 6.5% 5.3% 4.6%
Northern Sydney 1,315 1,448 1,949 2,187 2,441 1.9% 3.9% 3.4% 3.1%
South Eastern Sydney 3,136 3,603 4,749 5,237 5,750 2.8% 4.1% 3.4% 3.0%
South Western Sydney 5,822 7,390 9,769 10,936 12,205 4.8% 5.2% 4.2% 3.7%
Southern NSW 2,417 3,256 4,444 5,097 5,839 6.0% 6.1% 5.0% 4.4%
Sydney 2,569 2,865 3,831 4,242 4,674 2.2% 4.0% 3.3% 3.0%
Western NSW 9,490 14,378 19,443 22,119 25,125 8.3% 7.2% 5.6% 4.9%
Western Sydney 4,797 6,444 8,425 9,304 10,260 5.9% 5.6% 4.4% 3.8%
Total NSW Total NSW 73,912 99,928 135,053 153,408 173,868 6.0% 6.0% 4.9% 4.3%
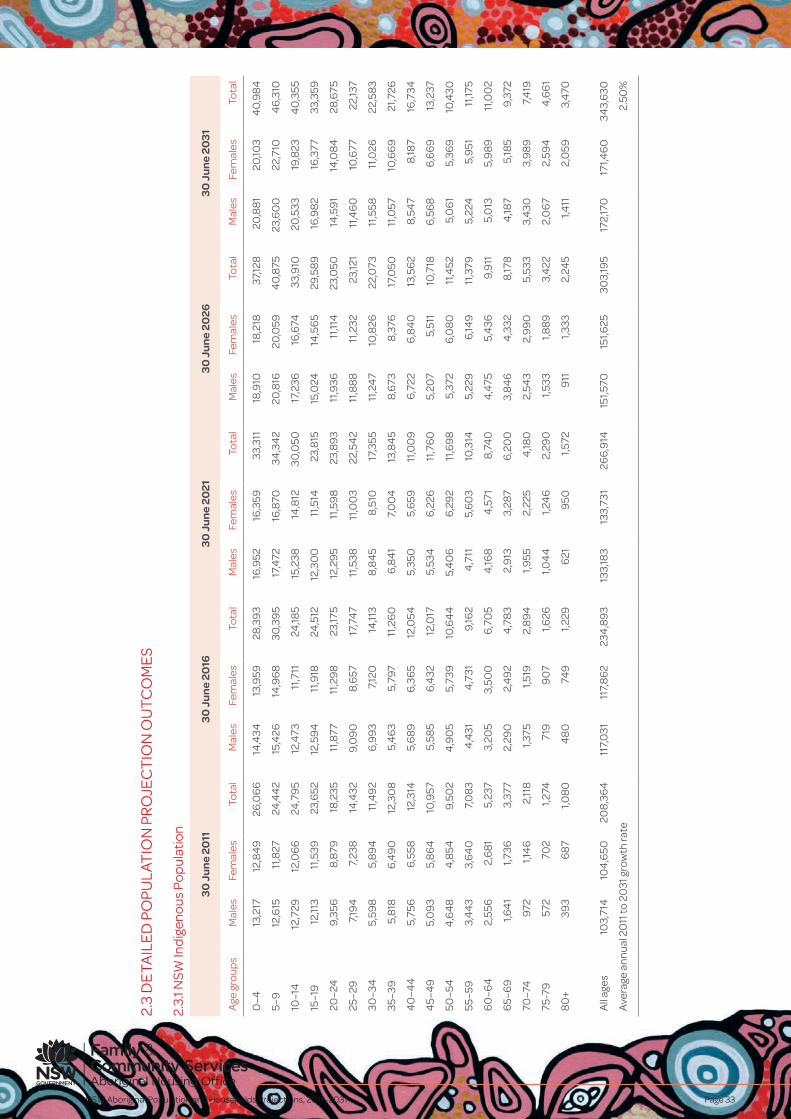
NSW Aboriginal Population and Households Projections, 2011–2031 Page 33
2.3
DE
TAIL
ED
PO
PULA
TIO
N P
RO
JEC
TIO
N O
UTC
OM
ES
2.3.
1 NSW
Ind
igen
ous
Po
pul
atio
n
30 J
un
e 20
1130
Ju
ne
2016
30 J
un
e 20
2130
Ju
ne
2026
30 J
un
e 20
31
Age
gro
ups
Mal
esFe
mal
esTo
tal
Mal
esFe
mal
esTo
tal
Mal
esFe
mal
esTo
tal
Mal
esFe
mal
esTo
tal
Mal
esFe
mal
esTo
tal
0–4
13,2
1712
,84
926
,06
614
,434
13,9
5928
,39
316
,952
16,3
5933
,311
18,9
1018
,218
37,12
820
,88
120
,103
40
,98
4
5–9
12,6
1511
,827
24,4
42
15,4
2614
,96
830
,39
517
,472
16,8
7034
,34
220
,816
20,0
594
0,8
7523
,60
022
,710
46
,310
10–1
412
,729
12,0
66
24,7
95
12,4
7311
,711
24,18
515
,238
14,8
1230
,050
17,2
3616
,674
33,9
1020
,533
19,8
234
0,3
55
15–1
912
,113
11,5
3923
,652
12,5
94
11,9
1824
,512
12,3
00
11,5
1423
,815
15,0
2414
,56
529
,58
916
,98
216
,377
33,3
59
20–2
49,
356
8,87
918
,235
11,8
7711
,29
823
,175
12,2
95
11,5
98
23,8
93
11,9
3611
,114
23,0
5014
,59
114
,08
428
,675
25–2
97,
194
7,23
814
,432
9,0
90
8,6
5717
,74
711
,538
11,0
03
22,5
42
11,8
88
11,2
3223
,121
11,4
60
10,6
7722
,137
30–3
45,
598
5,8
94
11,4
92
6,9
93
7,12
014
,113
8,8
45
8,51
017
,355
11,2
47
10,8
2622
,073
11,5
5811
,026
22,5
83
35–3
95,
818
6,4
90
12,3
08
5,4
63
5,79
711
,26
06
,84
17,
00
413
,84
58,
673
8,37
617
,050
11,0
5710
,66
921
,726
40
–44
5,75
66
,558
12,3
145,
68
96
,36
512
,054
5,35
05,
659
11,0
09
6,7
226
,84
013
,56
28,
547
8,18
716
,734
45–
49
5,0
93
5,8
64
10,9
575,
585
6,4
3212
,017
5,53
46
,226
11,7
60
5,20
75,
511
10,7
186
,56
86
,66
913
,237
50–5
44
,64
84
,854
9,50
24
,90
55,
739
10,6
44
5,4
06
6,2
92
11,6
98
5,37
26
,08
011
,452
5,0
61
5,36
910
,430
55–5
93,
44
33,
64
07,
08
34
,431
4,7
319,
162
4,7
115,
60
310
,314
5,22
96
,149
11,3
795,
224
5,9
5111
,175
60
–64
2,55
62,
68
15,
237
3,20
53,
500
6,7
05
4,16
84
,571
8,74
04
,475
5,4
369,
911
5,0
135,
98
911
,00
2
65–
69
1,64
11,7
363,
377
2,29
02,
49
24
,78
32,
913
3,28
76
,20
03,
84
64
,332
8,17
84
,187
5,18
59,
372
70–7
497
21,1
46
2,11
81,3
751,5
192,
89
41,9
552,
225
4,18
02,
543
2,9
90
5,53
33,
430
3,9
89
7,4
19
75-7
957
270
21,2
7471
99
07
1,626
1,04
41,2
46
2,29
01,5
331,8
89
3,4
222,
06
72,
594
4,6
61
80
+39
36
871,0
80
48
074
91,2
296
219
501,5
729
111,3
332,
245
1,411
2,0
593,
470
All
ages
103,
714
104
,650
208,
364
117,
031
117,
86
223
4,8
93
133,
183
133,
731
266
,914
151,5
7015
1,625
303,
195
172,
170
171,4
60
343,
630
Ave
rage
ann
ual 2
011
to 2
031
gro
wth
rate
2.50
%

NSW Aboriginal Population and Households Projections, 2011–2031 • Page 34
2.3.
2 N
SW A
bo
rigin
al H
ous
ing
Offi
ce (A
HO
) Reg
ions
A
HO
No
rthe
rn R
egio
n In
dig
eno
us P
op
ulat
ion
30 J
un
e 20
1130
Ju
ne
2016
30 J
un
e 20
2130
Ju
ne
2026
30 J
un
e 20
31
Age
gro
ups
Mal
esFe
mal
esTo
tal
Mal
esFe
mal
esTo
tal
Mal
esFe
mal
esTo
tal
Mal
esFe
mal
esTo
tal
Mal
esFe
mal
esTo
tal
0–4
5,57
75,
124
10,7
01
6,3
46
6,17
312
,520
7,50
47,
298
14,8
02
8,50
88,
270
16,7
789,
519
9,24
318
,76
2
5–9
5,29
75,
052
10,3
49
7,0
49
6,5
8713
,636
8,0
89
7,8
94
15,9
83
9,50
39,
263
18,7
67
10,7
65
10,4
7821
,24
3
10–1
45,
375
5,18
510
,56
05,
173
4,9
5410
,126
6,9
166
,48
213
,39
87,
94
07,
772
15,7
139,
339
9,12
418
,46
3
15–1
94
,98
04
,677
9,6
575,
257
5,0
63
10,3
215,
057
4,8
279,
88
46
,78
36
,335
13,11
97,
795
7,6
05
15,4
00
20–2
43,
345
3,25
16
,59
64
,80
44
,49
39,
297
5,0
714
,86
39,
935
4,8
534
,60
39,
457
6,5
566
,08
012
,636
25–2
92,
471
2,6
49
5,12
03,
165
3,0
88
6,2
524
,60
04
,310
8,9
104
,84
74
,655
9,50
34
,611
4,3
738,
98
5
30–3
42,
144
2,22
24
,36
62,
345
2,56
64
,911
3,0
263,
00
06
,026
4,4
42
4,2
06
8,6
49
4,6
784
,54
19,
219
35–3
92,
226
2,56
34
,78
92,
06
42,
160
4,2
242,
265
2,50
24
,76
72,
939
2,9
275,
86
64
,34
44
,121
8,4
65
40
–44
2,26
72,
68
04
,94
72,
159
2,4
82
4,6
41
2,0
08
2,0
83
4,0
90
2,20
82,
416
4,6
232,
878
2,8
315,
710
45–
49
2,0
42
2,4
284
,470
2,17
82,
595
4,7
742,
08
22,
40
44
,48
51,9
362,
00
63,
94
22,
136
2,33
14
,46
7
50–5
41,9
46
2,0
86
4,0
321,9
45
2,34
44
,28
82,
08
92,
515
4,6
04
2,0
02
2,32
84
,329
1,86
51,9
363,
80
2
55–5
91,4
301,5
60
2,9
90
1,834
2,0
05
3,8
40
1,851
2,26
74
,118
2,0
03
2,4
41
4,4
43
1,932
2,26
34
,195
60
–64
1,071
1,134
2,20
51,3
111,4
80
2,79
11,7
05
1,918
3,6
231,7
392,
180
3,9
181,9
04
2,35
84
,26
1
65–
69
749
758
1,50
79
42
1,039
1,98
11,1
761,3
722,
548
1,555
1,79
33,
347
1,611
2,0
533,
66
4
70–7
44
46
531
977
616
657
1,273
795
916
1,711
1,016
1,226
2,24
21,3
751,6
232,
99
8
75-7
927
430
758
132
54
2675
14
66
537
1,00
36
2276
61,3
88
822
1,04
81,8
70
80
+18
330
74
90
235
372
60
730
24
978
00
434
66
41,0
98
617
952
1,56
9
All
ages
41,8
234
2,51
48
4,3
364
7,74
94
8,4
84
96
,233
55,0
03
55,6
85
110
,68
86
3,33
26
3,8
5212
7,18
372
,74
772
,96
314
5,70
9
Ave
rage
ann
ual 2
011
to 2
031
gro
wth
rate
2.73
%

NSW Aboriginal Population and Households Projections, 2011–2031 Page 35
AH
O S
ydne
y/So
uth
East
ern
Reg
ion
Ind
igen
ous
Po
pul
atio
n
30 J
un
e 20
1130
Ju
ne
2016
30 J
un
e 20
2130
Ju
ne
2026
30 J
un
e 20
31
Age
gro
ups
Mal
esFe
mal
esTo
tal
Mal
esFe
mal
esTo
tal
Mal
esFe
mal
esTo
tal
Mal
esFe
mal
esTo
tal
Mal
esFe
mal
esTo
tal
0–4
4,6
09
4,3
82
8,9
91
4,7
01
4,5
349,
236
5,4
245,
236
10,6
60
6,0
595,
850
11,9
09
6,6
08
6,3
80
12,9
88
5–9
4,6
794
,04
88,
727
5,39
75,
143
10,5
40
5,73
65,
531
11,2
67
6,6
92
6,4
5613
,148
7,56
17,
294
14,8
54
10–1
44
,58
54
,173
8,75
84
,59
93,
98
88,
587
5,31
15,
076
10,3
875,
636
5,4
5111
,08
86
,578
6,3
61
12,9
39
15–1
94
,420
4,11
98,
539
4,5
07
4,0
99
8,6
06
4,5
203,
90
88,
428
5,21
84
,977
10,19
55,
533
5,33
510
,86
8
20–2
43,
330
3,14
76
,477
4,3
07
4,0
06
8,31
44
,38
43,
972
8,35
64
,378
3,75
88,
136
5,0
564
,79
99,
854
25–2
92,
588
2,72
05,
308
3,21
73,
04
86
,26
44
,173
3,8
878,
06
14
,229
3,8
318,
06
04
,20
43,
597
7,8
01
30–3
42,
09
22,
313
4,4
05
2,50
62,
66
55,
171
3,12
22,
98
66
,108
4,0
583,
810
7,8
68
4,10
23,
745
7,8
47
35–3
92,
258
2,4
83
4,7
41
2,0
392,
268
4,3
07
2,4
47
2,6
165,
06
33,
052
2,9
285,
98
03,
976
3,74
07,
715
40
–44
2,17
22,
518
4,6
90
2,21
02,
425
4,6
341,9
96
2,21
04
,20
62,
398
2,54
74
,94
52,
99
42,
84
95,
84
4
45–
49
1,88
32,
250
4,13
32,
113
2,4
544
,56
72,
152
2,36
24
,515
1,939
2,14
64
,08
52,
333
2,4
724
,80
5
50–5
41,7
04
1,86
83,
572
1,823
2,18
34
,00
62,
050
2,38
54
,435
2,0
872,
292
4,3
791,8
772,
077
3,9
54
55–5
91,3
361,4
722,
80
81,6
391,8
03
3,4
42
1,758
2,11
33,
871
1,98
02,
309
4,2
90
2,0
172,
219
4,2
37
60
–64
1,00
81,0
84
2,0
92
1,26
41,4
04
2,6
68
1,557
1,725
3,28
21,6
732,
025
3,6
971,8
88
2,21
54
,102
65–
69
64
56
94
1,339
930
1,00
81,9
381,1
721,3
102,
48
21,4
47
1,613
3,0
60
1,559
1,89
63,
455
70–7
439
94
46
84
557
16
201,1
91
828
90
61,7
341,0
47
1,18
12,
228
1,297
1,457
2,75
4
75-7
924
431
656
032
737
870
44
7152
91,0
00
687
776
1,46
387
41,0
151,8
89
80
+16
929
94
68
253
416
66
935
953
78
95
518
728
1,24
675
81,0
361,7
94
All
ages
38,12
138
,332
76,4
524
2,4
03
42,
44
18
4,8
44
47,
46
04
7,29
09
4,7
5053
,09
852
,679
105,
777
59,2
1558
,487
117,
702
Ave
rage
ann
ual 2
011
to 2
031
gro
wth
rate
2.16
%

NSW Aboriginal Population and Households Projections, 2011–2031 • Page 36
AH
O W
este
rn R
egio
n In
dig
eno
us P
op
ulat
ion
30 J
un
e 20
1130
Ju
ne
2016
30 J
un
e 20
2130
Ju
ne
2026
30 J
un
e 20
31
Age
gro
ups
Mal
esFe
mal
esTo
tal
Mal
esFe
mal
esTo
tal
Mal
esFe
mal
esTo
tal
Mal
esFe
mal
esTo
tal
Mal
esFe
mal
esTo
tal
0–4
3,0
65
3,12
16
,186
3,51
33,
40
06
,912
4,15
64
,025
8,18
14
,697
4,5
49
9,24
65,
308
5,13
810
,44
6
5–9
2,8
88
2,74
15,
629
3,6
303,
66
67,
296
4,2
304
,09
18,
321
5,0
174
,855
9,87
15,
703
5,51
611
,219
10–1
43,
074
2,79
65,
870
2,8
342,
700
5,53
43,
572
3,6
217,
193
4,16
24
,037
8,20
04
,94
14
,79
19,
732
15–1
92,
706
2,53
35,
239
3,0
212,
746
5,76
72,
783
2,6
47
5,4
293,
512
3,55
67,
06
84
,09
53,
96
28,
057
20–2
41,9
43
1,84
33,
786
2,6
312,
458
5,0
89
2,9
392,
66
25,
60
02,
69
12,
549
5,24
03,
40
83,
44
06
,84
8
25–2
91,5
151,4
752,
99
01,8
66
1,777
3,6
43
2,54
22,
381
4,9
232,
838
2,57
15,
40
82,
581
2,4
45
5,0
26
30–3
41,1
96
1,273
2,4
69
1,459
1,44
02,
89
91,8
04
1,739
3,54
32,
470
2,33
54
,80
42,
759
2,51
85,
276
35–3
91,2
62
1,49
42,
756
1,16
01,2
45
2,4
05
1,421
1,411
2,8
321,7
63
1,70
53,
46
72,
423
2,29
44
,717
40
–44
1,30
91,5
272,
836
1,228
1,457
2,6
85
1,132
1,211
2,34
31,3
92
1,372
2,76
41,7
321,6
593,
391
45–
49
1,234
1,30
52,
539
1,26
41,4
86
2,75
01,1
90
1,419
2,6
09
1,097
1,174
2,27
11,3
551,3
312,
687
50–5
41,0
541,0
89
2,14
31,1
81
1,26
42,
44
41,2
171,4
45
2,6
62
1,14
91,3
80
2,52
91,0
62
1,139
2,20
1
55–5
987
38
241,6
979
95
1,04
82,
04
31,1
261,2
242,
349
1,16
91,4
04
2,57
31,1
111,3
43
2,4
54
60
–64
69
36
62
1,355
80
278
11,5
83
926
1,00
21,9
281,0
60
1,176
2,23
61,1
121,3
562,
46
8
65–
69
435
44
68
81
610
60
71,2
1771
972
51,4
44
84
59
371,7
82
98
31,1
08
2,0
91
70–7
427
531
959
435
838
874
651
553
71,0
516
216
49
1,26
974
78
49
1,597
75-7
914
517
932
420
125
84
5827
132
059
14
03
451
854
502
555
1,058
80
+10
417
828
212
821
734
517
929
74
7625
539
76
5138
756
49
51
All
ages
23,7
7123
,80
54
7,57
626
,88
026
,938
53,8
1730
,721
30,7
556
1,476
35,14
035
,09
470
,235
40
,20
84
0,0
108
0,2
18
Ave
rage
ann
ual 2
011
to 2
031
gro
wth
rate
2.6
1%
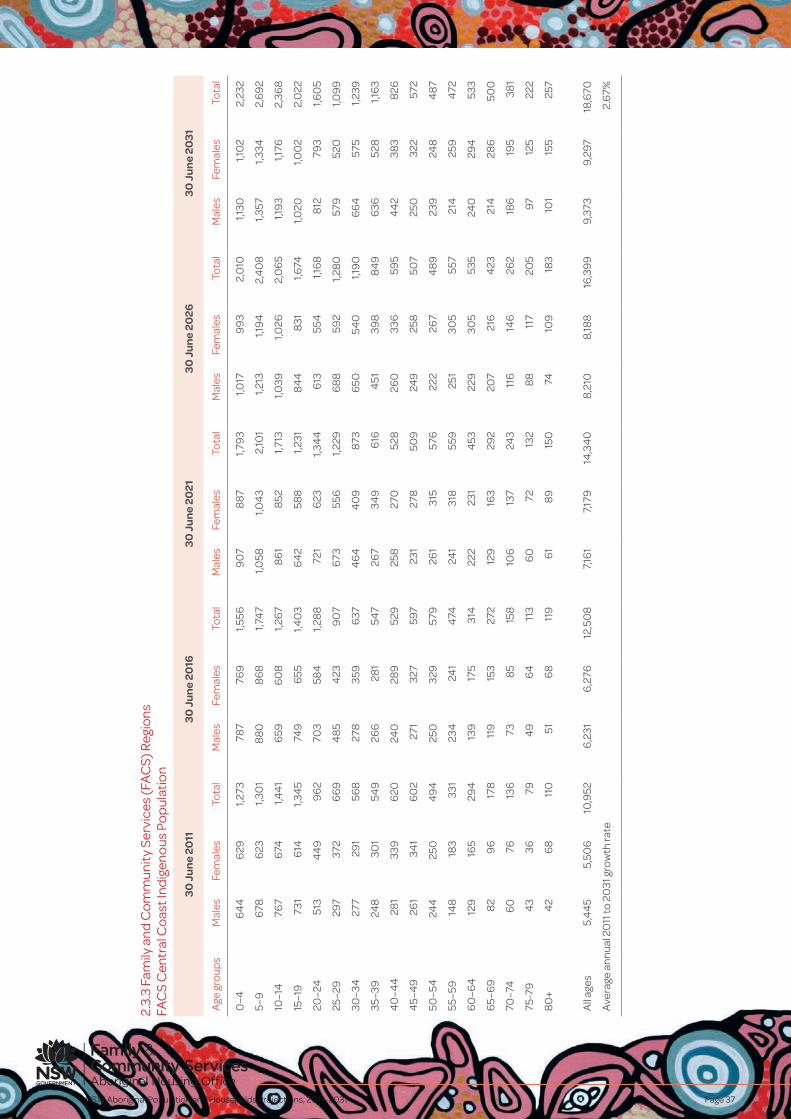
NSW Aboriginal Population and Households Projections, 2011–2031 Page 37
2.3.
3 Fa
mily
and
Co
mm
unity
Ser
vice
s (F
AC
S) R
egio
ns
FAC
S C
entr
al C
oas
t Ind
igen
ous
Po
pul
atio
n
30 J
un
e 20
1130
Ju
ne
2016
30 J
un
e 20
2130
Ju
ne
2026
30 J
un
e 20
31
Age
gro
ups
Mal
esFe
mal
esTo
tal
Mal
esFe
mal
esTo
tal
Mal
esFe
mal
esTo
tal
Mal
esFe
mal
esTo
tal
Mal
esFe
mal
esTo
tal
0–4
64
46
291,2
7378
776
91,5
569
07
887
1,79
31,0
179
93
2,0
101,1
301,1
02
2,23
2
5–9
678
623
1,30
18
80
86
81,7
47
1,058
1,04
32,
101
1,213
1,19
42,
40
81,3
571,3
342,
69
2
10–1
476
76
741,4
41
659
60
81,2
67
86
18
521,7
131,0
391,0
262,
06
51,1
93
1,176
2,36
8
15–1
973
16
141,3
45
749
655
1,40
36
42
588
1,231
84
48
311,6
741,0
201,0
02
2,0
22
20–2
451
34
49
96
270
358
41,2
88
721
623
1,34
46
1355
41,1
68
812
793
1,60
5
25–2
929
737
26
69
48
54
239
07
673
556
1,229
68
859
21,2
80
579
520
1,09
9
30–3
427
729
156
827
835
96
374
64
40
987
36
5054
01,1
90
66
457
51,2
39
35–3
924
830
154
926
628
154
726
734
96
164
5139
88
49
636
528
1,16
3
40
–44
281
339
620
240
289
529
258
270
528
260
336
595
44
238
38
26
45–
49
261
341
60
227
132
759
723
127
850
924
925
850
725
032
257
2
50–5
424
425
04
94
250
329
579
261
315
576
222
267
48
923
924
84
87
55–5
914
818
333
123
424
14
7424
131
855
925
130
555
721
425
94
72
60
–64
129
165
294
139
175
314
222
231
453
229
305
535
240
294
533
65–
69
82
96
178
119
153
272
129
163
292
207
216
423
214
286
500
70–7
46
076
136
738
515
810
613
724
311
614
626
218
619
538
1
75-7
94
336
794
96
411
36
072
132
88
117
205
9712
522
2
80
+4
26
811
051
68
119
61
89
150
7410
918
310
115
525
7
All
ages
5,4
45
5,50
610
,952
6,2
316
,276
12,5
08
7,16
17,
179
14,3
40
8,21
08,
188
16,3
99
9,37
39,
297
18,6
70
Ave
rage
ann
ual 2
011
to 2
031
gro
wth
rate
2.6
7%

NSW Aboriginal Population and Households Projections, 2011–2031 • Page 38
FAC
S Fa
r Wes
t Ind
igen
ous
Po
pul
atio
n
30 J
un
e 20
1130
Ju
ne
2016
30 J
un
e 20
2130
Ju
ne
2026
30 J
un
e 20
31
Age
gro
ups
Mal
esFe
mal
esTo
tal
Mal
esFe
mal
esTo
tal
Mal
esFe
mal
esTo
tal
Mal
esFe
mal
esTo
tal
Mal
esFe
mal
esTo
tal
0–4
174
245
419
297
299
596
336
336
673
364
363
726
416
412
828
5–9
201
198
399
222
301
523
357
366
723
40
84
158
234
47
452
89
9
10–1
422
618
64
1219
619
439
121
829
751
435
236
271
44
02
410
812
15–1
919
522
34
1822
118
14
03
192
189
381
213
291
504
347
355
702
20–2
416
917
234
118
821
54
04
215
173
388
185
180
365
205
281
48
5
25–2
914
811
826
616
216
532
718
120
838
820
616
537
117
617
134
6
30–3
48
88
817
614
211
425
715
616
131
717
420
337
719
816
035
8
35–3
912
011
423
48
58
517
013
811
124
915
115
730
816
919
836
7
40
–44
82
148
230
116
110
226
81
82
163
134
107
241
147
152
299
45–
49
102
124
226
7814
322
111
110
621
777
7815
612
810
323
1
50–5
478
95
173
96
119
215
7313
821
110
510
220
673
7414
7
55–5
954
5811
272
90
163
89
114
203
68
132
200
98
9719
5
60
–64
45
61
106
48
5410
26
58
515
08
010
718
76
112
318
5
65–
69
2335
5838
559
34
14
99
056
7613
26
99
616
5
70–7
423
254
818
304
830
46
7733
41
744
56
510
9
75-7
910
1626
1619
3513
2336
2136
5823
3255
80
+10
1020
1015
2512
2033
1226
3816
3653
All
ages
1,74
81,9
163,
66
42,
00
72,
191
4,19
82,
309
2,50
54
,814
2,6
40
2,8
40
5,4
80
3,0
213,
217
6,2
37
Ave
rage
ann
ual 2
011
to 2
031
gro
wth
rate
2.6
6%

NSW Aboriginal Population and Households Projections, 2011–2031 Page 39
FAC
S H
unte
r New
Eng
land
Ind
igen
ous
Po
pul
atio
n
30 J
un
e 20
1130
Ju
ne
2016
30 J
un
e 20
2130
Ju
ne
2026
30 J
un
e 20
31
Age
gro
ups
Mal
esFe
mal
esTo
tal
Mal
esFe
mal
esTo
tal
Mal
esFe
mal
esTo
tal
Mal
esFe
mal
esTo
tal
Mal
esFe
mal
esTo
tal
0–4
3,13
42,
94
66
,08
03,
711
3,55
27,
263
4,3
43
4,16
78,
510
4,8
86
4,6
92
9,57
85,
510
5,29
010
,80
0
5–9
2,9
90
2,8
45
5,8
353,
939
3,6
89
7,6
294
,673
4,4
45
9,11
95,
458
5,20
410
,66
26
,152
5,87
012
,022
10–1
42,
934
2,8
595,
793
2,9
202,
793
5,71
33,
870
3,6
377,
508
4,6
01
4,3
88
8,9
89
5,38
05,
139
10,5
19
15–1
92,
779
2,6
07
5,38
62,
86
92,
795
5,6
63
2,8
592,
728
5,58
83,
80
53,
565
7,37
14
,531
4,3
06
8,8
37
20–2
41,8
82
1,877
3,75
92,
68
12,
510
5,19
12,
768
2,6
91
5,4
60
2,75
12,
613
5,36
43,
68
53,
434
7,11
9
25–2
91,4
111,5
232,
934
1,78
11,7
91
3,57
22,
569
2,4
144
,98
32,
64
72,
583
5,23
12,
619
2,4
93
5,11
1
30–3
41,2
03
1,24
22,
44
51,3
40
1,478
2,8
181,7
04
1,74
43,
44
82,
48
12,
361
4,8
42
2,55
22,
524
5,0
76
35–3
91,3
171,4
44
2,76
11,1
581,2
08
2,36
61,2
94
1,44
32,
737
1,654
1,70
53,
358
2,4
222,
315
4,7
37
40
–44
1,279
1,49
32,
772
1,277
1,39
92,
676
1,124
1,16
62,
290
1,259
1,39
62,
655
1,614
1,651
3,26
6
45–
49
1,14
61,3
252,
471
1,227
1,44
52,
673
1,228
1,355
2,58
31,0
791,1
232,
201
1,211
1,34
72,
557
50–5
41,0
85
1,19
32,
278
1,08
91,2
772,
366
1,171
1,39
82,
569
1,173
1,30
82,
48
21,0
281,0
80
2,10
8
55–5
978
28
69
1,651
1,019
1,14
42,
163
1,028
1,229
2,25
71,1
09
1,34
72,
457
1,113
1,26
22,
375
60
–64
613
64
21,2
5571
38
211,5
359
371,0
86
2,0
229
48
1,170
2,11
71,0
261,2
84
2,31
0
65–
69
44
84
2787
553
658
51,1
216
2975
31,3
82
830
99
91,8
288
43
1,078
1,921
70–7
427
431
158
536
536
873
34
40
508
94
952
16
571,1
786
92
875
1,56
6
75-7
915
218
533
719
724
74
45
266
295
561
325
411
735
388
535
923
80
+87
160
247
123
209
331
167
278
44
422
934
957
829
34
69
762
All
ages
23,5
1723
,94
54
7,4
63
26,9
45
27,3
1354
,258
31,0
7131
,338
62,
40
935
,756
35,8
7171
,626
41,0
61
40
,94
98
2,0
10
Ave
rage
ann
ual 2
011
to 2
031
gro
wth
rate
2.73
%

NSW Aboriginal Population and Households Projections, 2011–2031 • Page 40
FAC
S Ill
awar
ra S
hoal
have
n In
dig
eno
us P
op
ulat
ion
30 J
un
e 20
1130
Ju
ne
2016
30 J
un
e 20
2130
Ju
ne
2026
30 J
un
e 20
31
Age
gro
ups
Mal
esFe
mal
esTo
tal
Mal
esFe
mal
esTo
tal
Mal
esFe
mal
esTo
tal
Mal
esFe
mal
esTo
tal
Mal
esFe
mal
esTo
tal
0–4
817
88
01,6
978
69
825
1,69
31,0
169
67
1,98
31,1
60
1,10
52,
265
1,30
11,2
40
2,54
1
5–9
810
714
1,524
1,050
1,09
32,
143
1,14
61,0
80
2,22
61,3
351,2
62
2,59
71,5
211,4
40
2,9
61
10–1
48
5777
91,6
3679
06
99
1,49
01,0
311,0
782,
109
1,126
1,06
42,
189
1,313
1,24
42,
557
15–1
978
372
91,5
128
3876
01,5
98
773
68
11,4
541,0
121,0
572,
06
91,1
05
1,04
02,
146
20–2
457
94
95
1,074
755
701
1,456
80
973
11,5
40
742
64
81,3
90
978
1,019
1,997
25–2
94
46
427
873
550
470
1,020
723
673
1,397
775
700
1,475
705
614
1,319
30–3
433
734
16
784
264
148
40
528
457
98
66
99
658
1,357
749
68
31,4
32
35–3
934
238
572
732
533
16
564
134
04
817
515
44
69
61
68
46
45
1,329
40
–44
331
394
725
333
373
705
317
320
637
40
439
179
550
54
319
36
45–
49
296
388
68
432
038
170
132
236
16
83
306
308
614
392
377
770
50–5
428
230
158
328
537
56
60
309
369
678
311
349
66
029
529
759
2
55–5
923
421
94
5327
029
056
027
436
36
3729
835
86
5630
133
86
39
60
–64
159
158
317
221
209
430
257
278
535
261
349
60
928
434
46
28
65–
69
98
122
220
147
147
293
205
195
40
023
926
04
99
244
327
571
70–7
46
577
142
8710
919
513
113
126
218
417
635
921
523
54
50
75-7
94
256
98
536
511
872
92
164
109
112
221
154
151
304
80
+4
570
115
528
413
66
410
016
48
413
121
512
216
528
7
All
ages
6,5
236
,534
13,0
587,
369
7,32
714
,69
68,
389
8,28
016
,66
99,
560
9,37
218
,932
10,8
69
10,5
89
21,4
58
Ave
rage
ann
ual 2
011
to 2
031
gro
wth
rate
2.4
8%

NSW Aboriginal Population and Households Projections, 2011–2031 Page 41
FAC
S M
id N
ort
h C
oas
t Ind
igen
ous
Po
pul
atio
n
30 J
un
e 20
1130
Ju
ne
2016
30 J
un
e 20
2130
Ju
ne
2026
30 J
un
e 20
31
Age
gro
ups
Mal
esFe
mal
esTo
tal
Mal
esFe
mal
esTo
tal
Mal
esFe
mal
esTo
tal
Mal
esFe
mal
esTo
tal
Mal
esFe
mal
esTo
tal
0–4
84
674
91,5
95
931
887
1,818
1,116
1,06
72,
183
1,28
01,2
252,
505
1,44
51,3
83
2,8
29
5–9
780
753
1,533
1,06
59
49
2,0
151,1
91
1,126
2,31
61,4
151,3
42
2,75
71,6
181,5
363,
154
10–1
478
077
81,5
5876
173
91,5
00
1,04
79
361,9
82
1,171
1,111
2,28
21,3
94
1,325
2,72
0
15–1
96
84
657
1,34
176
276
11,5
2374
572
21,4
67
1,029
916
1,94
61,1
531,0
89
2,24
2
20–2
44
594
43
90
26
586
311,2
89
735
733
1,46
871
66
91
1,40
79
978
82
1,879
25–2
937
035
772
74
324
208
536
286
06
1,234
703
704
1,40
76
81
66
01,3
40
30–3
429
130
759
835
134
56
96
412
40
88
206
05
592
1,197
678
68
91,3
66
35–3
931
234
96
61
279
298
577
339
336
675
399
398
797
590
580
1,170
40
–44
316
397
713
302
338
639
271
287
558
329
324
654
389
384
773
45–
49
297
363
66
030
338
46
8729
032
66
1625
927
653
531
731
26
28
50–5
429
232
26
1428
235
06
3228
937
26
60
276
315
591
247
265
512
55–5
924
325
14
94
274
309
583
266
337
60
327
335
86
3126
230
356
5
60
–64
148
167
315
222
237
459
252
293
545
245
321
566
252
341
594
65–
69
115
114
229
129
152
282
196
218
413
223
270
49
321
829
551
3
70–7
46
977
146
94
98
192
107
132
239
162
190
352
186
236
422
75-7
939
40
7950
61
111
68
7914
779
107
186
121
155
276
80
+4
924
734
34
08
34
76
211
06
187
147
7412
019
4
All
ages
6,0
90
6,14
712
,238
6,9
397,
00
013
,939
7,9
978,
039
16,0
369,
226
9,22
718
,452
10,6
2010
,555
21,17
5
Ave
rage
ann
ual 2
011
to 2
031
gro
wth
rate
2.74
%

NSW Aboriginal Population and Households Projections, 2011–2031 • Page 42
FAC
S M
urru
mb
idge
e In
dig
eno
us P
op
ulat
ion
30 J
un
e 20
1130
Ju
ne
2016
30 J
un
e 20
2130
Ju
ne
2026
30 J
un
e 20
31
Age
gro
ups
Mal
esFe
mal
esTo
tal
Mal
esFe
mal
esTo
tal
Mal
esFe
mal
esTo
tal
Mal
esFe
mal
esTo
tal
Mal
esFe
mal
esTo
tal
0–4
86
087
61,7
3687
89
171,7
95
1,04
61,0
81
2,12
71,2
111,2
40
2,4
511,4
02
1,423
2,8
26
5–9
763
810
1,573
970
1,04
72,
017
1,030
1,129
2,15
91,2
391,3
312,
570
1,44
51,5
282,
972
10–1
48
68
746
1,614
751
797
1,54
89
581,0
351,9
92
1,017
1,115
2,13
21,2
251,3
152,
539
15–1
973
56
95
1,430
855
731
1,58
674
078
21,5
219
46
1,017
1,96
21,0
04
1,09
52,
09
9
20–2
451
14
69
98
071
86
721,3
90
837
706
1,54
372
075
31,4
749
239
84
1,90
7
25–2
94
374
258
62
49
44
49
94
36
98
64
91,3
47
814
68
01,4
94
69
572
41,4
18
30–3
432
836
16
89
424
414
838
48
04
379
176
81
635
1,317
795
66
51,4
60
35–3
934
738
873
531
935
26
714
144
05
819
46
94
288
976
69
624
1,29
3
40
–44
329
364
69
333
837
771
531
234
26
534
06
393
799
46
04
1587
5
45–
49
335
380
715
318
353
670
327
366
69
330
233
06
3239
438
177
4
50–5
427
528
355
832
036
76
8730
534
16
46
314
354
66
828
931
96
08
55–5
922
220
64
2825
927
153
130
335
36
5728
932
96
1829
934
16
40
60
–64
209
146
355
203
195
398
239
258
49
628
033
66
1726
831
358
1
65–
69
102
110
212
183
133
316
179
179
357
212
237
44
925
031
056
0
70–7
451
7612
78
39
517
815
011
526
614
815
630
417
620
838
4
75-7
921
42
63
376
197
61
7613
711
19
320
411
012
723
7
80
+28
3159
234
56
832
65
96
508
613
68
811
019
8
All
ages
6,4
216
,40
712
,829
7,17
37,
275
14,4
48
8,11
18,
317
16,4
289,
211
9,51
418
,724
10,4
92
10,8
80
21,3
72
Ave
rage
ann
ual 2
011
to 2
031
gro
wth
rate
2.55
%

NSW Aboriginal Population and Households Projections, 2011–2031 Page 43
FAC
S N
epea
n B
lue
Mo
unta
ins
Ind
igen
ous
Po
pul
atio
n
30 J
un
e 20
1130
Ju
ne
2016
30 J
un
e 20
2130
Ju
ne
2026
30 J
un
e 20
31
Age
gro
ups
Mal
esFe
mal
esTo
tal
Mal
esFe
mal
esTo
tal
Mal
esFe
mal
esTo
tal
Mal
esFe
mal
esTo
tal
Mal
esFe
mal
esTo
tal
0–4
671
66
31,3
3471
46
701,3
84
839
791
1,631
936
88
31,8
191,0
06
950
1,956
5–9
716
569
1,28
579
776
71,5
64
878
810
1,68
81,0
40
96
52,
00
51,1
721,0
90
2,26
3
10–1
476
06
48
1,40
870
356
11,2
64
785
758
1,54
38
65
80
01,6
65
1,025
953
1,979
15–1
96
506
40
1,29
074
76
371,3
85
69
255
01,2
42
773
746
1,518
852
785
1,637
20–2
455
650
21,0
586
326
241,2
5672
96
201,3
49
672
530
1,20
275
072
11,4
72
25–2
937
538
175
653
84
88
1,025
613
60
71,2
2070
66
01
1,30
76
47
508
1,155
30–3
429
632
36
1936
237
373
652
34
791,0
02
597
597
1,19
46
89
589
1,278
35–3
931
837
16
89
288
317
60
535
436
772
151
34
719
85
586
588
1,174
40
–44
301
358
659
311
363
673
282
309
591
348
358
705
506
46
19
66
45–
49
258
333
591
292
349
64
130
335
46
5727
430
057
533
934
86
87
50–5
424
025
34
93
249
323
572
284
340
623
294
344
638
266
291
557
55–5
917
818
336
123
124
44
7524
131
355
427
532
96
04
285
334
619
60
–64
148
125
273
168
175
343
219
234
453
230
301
530
263
316
579
65–
69
81
92
173
137
116
253
156
163
319
205
219
424
215
282
497
70–7
452
41
93
728
215
412
210
422
614
014
728
718
419
838
2
75-7
931
2455
43
3577
5970
129
101
89
191
117
127
244
80
+6
344
024
396
24
250
91
64
83
147
105
119
224
All
ages
5,6
375,
539
11,17
76
,30
86
,161
12,4
69
7,12
16
,919
14,0
40
8,0
327,
764
15,7
96
9,0
07
8,6
61
17,6
69
Ave
rage
ann
ual 2
011
to 2
031
gro
wth
rate
2.29
%

NSW Aboriginal Population and Households Projections, 2011–2031 • Page 44
FAC
S N
ort
hern
Syd
ney
Ind
igen
ous
Po
pul
atio
n
30 J
un
e 20
1130
Ju
ne
2016
30 J
un
e 20
2130
Ju
ne
2026
30 J
un
e 20
31
Age
gro
ups
Mal
esFe
mal
esTo
tal
Mal
esFe
mal
esTo
tal
Mal
esFe
mal
esTo
tal
Mal
esFe
mal
esTo
tal
Mal
esFe
mal
esTo
tal
0–4
141
115
256
223
206
429
238
221
459
250
233
48
226
825
151
9
5–9
141
126
267
208
171
379
300
272
571
324
296
619
345
317
66
1
10–1
415
715
431
113
612
225
920
316
737
029
426
856
231
829
16
09
15–1
914
714
429
115
214
930
213
111
824
919
816
236
028
926
255
1
20–2
414
511
826
314
013
727
714
514
228
712
411
023
318
915
334
2
25–2
98
512
120
613
711
224
913
113
026
213
613
427
011
410
121
5
30–3
49
010
219
28
011
819
713
110
823
912
512
625
212
913
026
0
35–3
910
411
922
387
99
186
7711
519
212
810
623
312
212
324
5
40
–44
110
112
222
101
116
217
84
96
181
7411
218
612
510
222
7
45–
49
102
91
193
106
109
215
98
112
210
82
93
175
7210
818
0
50–5
46
578
143
98
88
186
103
105
208
95
109
204
799
016
9
55–5
98
66
214
86
275
137
95
85
180
100
102
202
92
106
198
60
–64
48
348
28
159
140
5972
131
90
82
172
95
98
193
65–
69
334
88
14
432
7675
5513
155
67
122
85
7716
1
70–7
429
2352
294
372
40
286
86
750
117
49
61
110
75-7
917
421
2419
43
2436
61
3324
5756
43
99
80
+6
344
015
2439
2430
5429
45
7539
46
86
All
ages
1,50
61,4
85
2,9
91
1,724
1,679
3,4
04
1,958
1,89
43,
852
2,20
42,
118
4,3
222,
46
62,
358
4,8
24
Ave
rage
ann
ual 2
011
to 2
031
gro
wth
rate
2.39
%
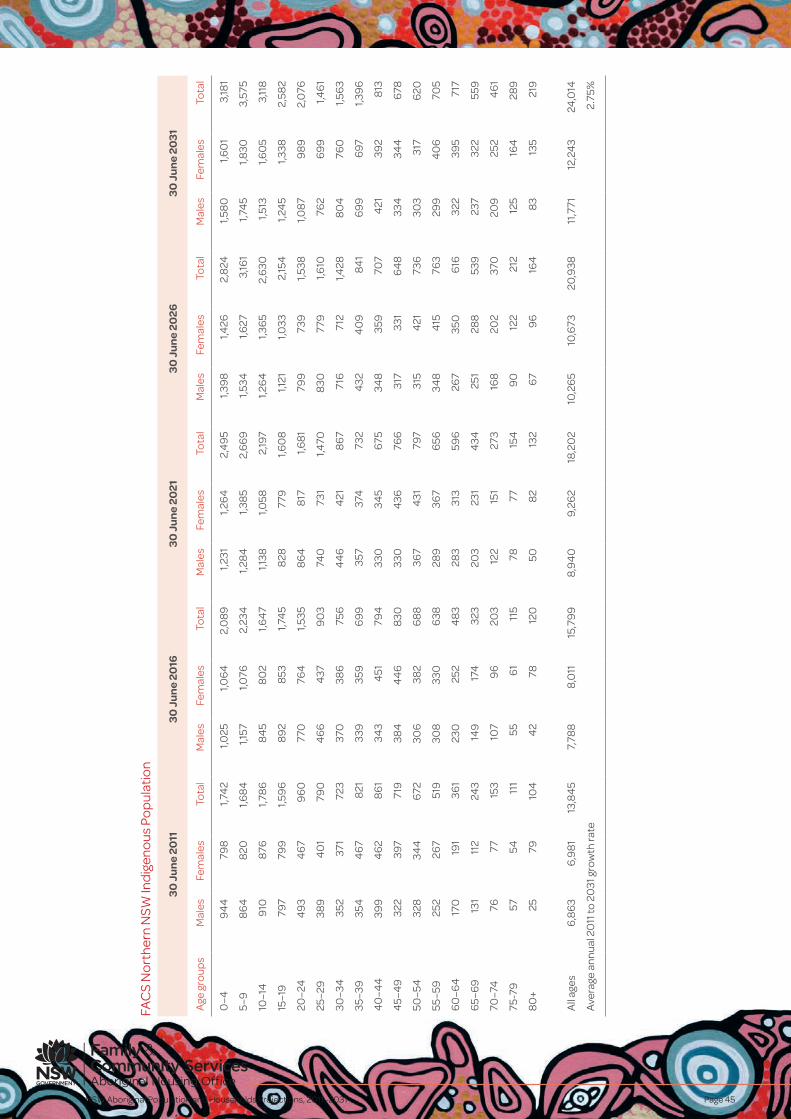
NSW Aboriginal Population and Households Projections, 2011–2031 Page 45
FAC
S N
ort
hern
NSW
Ind
igen
ous
Po
pul
atio
n
30 J
un
e 20
1130
Ju
ne
2016
30 J
un
e 20
2130
Ju
ne
2026
30 J
un
e 20
31
Age
gro
ups
Mal
esFe
mal
esTo
tal
Mal
esFe
mal
esTo
tal
Mal
esFe
mal
esTo
tal
Mal
esFe
mal
esTo
tal
Mal
esFe
mal
esTo
tal
0–4
94
479
81,7
42
1,025
1,06
42,
08
91,2
311,2
64
2,4
95
1,39
81,4
262,
824
1,58
01,6
01
3,18
1
5–9
86
48
201,6
84
1,157
1,076
2,23
41,2
84
1,38
52,
66
91,5
341,6
273,
161
1,74
51,8
303,
575
10–1
49
1087
61,7
86
84
58
02
1,64
71,1
381,0
582,
197
1,26
41,3
65
2,6
301,5
131,6
05
3,11
8
15–1
979
779
91,5
96
89
28
531,7
45
828
779
1,60
81,1
211,0
332,
154
1,24
51,3
382,
582
20–2
44
93
46
79
60
770
764
1,535
86
48
171,6
81
799
739
1,538
1,087
98
92,
076
25–2
938
94
01
790
46
64
379
03
740
731
1,470
830
779
1,610
762
69
91,4
61
30–3
435
237
172
337
038
675
64
46
421
86
771
671
21,4
288
04
760
1,56
3
35–3
935
44
67
821
339
359
69
935
737
473
24
324
09
84
16
99
697
1,39
6
40
–44
399
46
28
61
343
451
794
330
345
675
348
359
707
421
392
813
45–
49
322
397
719
384
44
68
3033
04
3676
631
733
16
48
334
344
678
50–5
432
834
46
7230
638
26
88
367
431
797
315
421
736
303
317
620
55–5
925
226
751
930
833
06
3828
936
76
5634
84
1576
329
94
06
705
60
–64
170
191
361
230
252
48
328
331
359
626
735
06
1632
239
571
7
65–
69
131
112
243
149
174
323
203
231
434
251
288
539
237
322
559
70–7
476
7715
310
79
620
312
215
127
316
820
237
020
925
24
61
75-7
957
5411
155
61
115
7877
154
90
122
212
125
164
289
80
+25
7910
44
278
120
508
213
26
79
616
48
313
521
9
All
ages
6,8
63
6,9
81
13,8
45
7,78
88,
011
15,7
99
8,9
40
9,26
218
,20
210
,26
510
,673
20,9
3811
,771
12,2
43
24,0
14
Ave
rage
ann
ual 2
011
to 2
031
gro
wth
rate
2.75
%

NSW Aboriginal Population and Households Projections, 2011–2031 • Page 46
FAC
S So
uth
East
ern
Syd
ney
Ind
igen
ous
Po
pul
atio
n
30 J
un
e 20
1130
Ju
ne
2016
30 J
un
e 20
2130
Ju
ne
2026
30 J
un
e 20
31
Age
gro
ups
Mal
esFe
mal
esTo
tal
Mal
esFe
mal
esTo
tal
Mal
esFe
mal
esTo
tal
Mal
esFe
mal
esTo
tal
Mal
esFe
mal
esTo
tal
0–4
374
334
708
46
84
539
2251
34
971,0
1054
252
41,0
66
579
558
1,137
5–9
40
633
774
34
554
148
69
573
555
1,128
64
16
201,2
61
69
26
68
1,36
0
10–1
434
534
86
93
398
331
729
44
84
08
856
564
548
1,113
632
612
1,24
3
15–1
94
06
345
751
338
341
679
391
324
715
44
039
98
3955
653
81,0
94
20–2
438
033
971
939
533
472
932
732
86
5537
930
96
88
426
383
80
9
25–2
930
928
058
936
832
86
9738
232
270
531
331
56
2836
329
56
58
30–3
425
924
350
230
027
457
435
932
26
81
372
316
68
830
230
86
10
35–3
930
525
255
725
323
84
91
294
269
564
352
317
66
936
531
06
75
40
–44
294
262
556
299
246
545
248
233
48
129
026
355
334
731
06
57
45–
49
223
231
454
287
255
542
292
240
532
243
226
46
928
325
653
9
50–5
422
218
64
08
216
224
44
027
924
852
828
523
351
823
622
04
56
55–5
912
916
929
821
417
939
320
921
74
2627
124
151
227
722
650
3
60
–64
124
136
260
122
161
283
203
172
375
199
208
40
825
923
24
91
65–
69
85
98
183
114
126
241
113
150
264
190
161
351
187
196
382
70–7
44
06
610
675
88
163
102
114
216
102
136
237
171
146
316
75-7
939
3574
3356
89
62
7513
78
59
818
28
511
720
2
80
+17
40
5734
518
54
173
114
65
102
167
94
137
231
All
ages
3,9
573,
701
7,6
584
,36
94
,101
8,4
704
,837
4,5
48
9,38
65,
332
5,0
1710
,350
5,8
555,
510
11,3
64
Ave
rage
ann
ual 2
011
to 2
031
gro
wth
rate
1.97%

NSW Aboriginal Population and Households Projections, 2011–2031 Page 47
FAC
S So
uth
Wes
tern
Syd
ney
Ind
igen
ous
Po
pul
atio
n
30 J
un
e 20
1130
Ju
ne
2016
30 J
un
e 20
2130
Ju
ne
2026
30 J
un
e 20
31
Age
gro
ups
Mal
esFe
mal
esTo
tal
Mal
esFe
mal
esTo
tal
Mal
esFe
mal
esTo
tal
Mal
esFe
mal
esTo
tal
Mal
esFe
mal
esTo
tal
0–4
1,06
19
572,
018
927
834
1,76
11,1
191,0
202,
138
1,30
71,2
01
2,50
91,4
241,3
132,
736
5–9
1,052
957
2,0
09
1,172
1,00
52,
177
1,09
29
332,
026
1,334
1,16
72,
502
1,573
1,397
2,97
0
10–1
49
89
94
51,9
341,0
389
49
1,987
1,159
99
82,
157
1,078
925
2,0
02
1,318
1,156
2,4
74
15–1
99
63
935
1,89
897
59
361,9
111,0
259
40
1,96
51,1
45
98
62,
131
1,06
39
101,9
73
20–2
46
00
616
1,216
94
49
221,8
66
955
921
1,876
1,00
29
211,9
231,1
199
62
2,0
81
25–2
94
2353
69
5958
26
06
1,18
89
229
08
1,829
930
90
31,8
3397
48
99
1,872
30–3
438
050
08
80
410
529
939
567
598
1,16
59
03
897
1,80
09
108
91
1,80
0
35–3
938
553
79
2237
14
93
86
44
02
523
924
557
590
1,14
78
90
88
61,7
76
40
–44
373
506
879
377
528
90
536
44
85
84
939
451
39
07
548
579
1,127
45–
49
347
44
579
236
34
96
859
368
518
88
635
54
758
3038
550
28
86
50–5
433
74
2075
733
64
3377
035
34
84
837
358
506
86
434
54
63
80
8
55–5
926
730
056
732
44
06
730
325
420
745
342
470
812
347
49
18
38
60
–64
216
220
436
253
286
539
309
388
697
310
40
371
332
74
5277
9
65–
69
103
121
224
199
205
40
423
526
750
228
836
46
5229
037
86
68
70–7
476
9717
39
110
920
017
818
536
321
024
24
5225
933
058
9
75-7
94
56
511
06
28
314
576
93
169
148
159
307
176
209
385
80
+29
558
44
58
212
76
711
217
98
914
022
815
120
735
9
All
ages
7,6
46
8,21
115
,858
8,4
718,
90
117
,372
9,51
49,
793
19,3
07
10,7
5110
,86
321
,614
12,0
98
12,0
2424
,122
Ave
rage
ann
ual 2
011
to 2
031
gro
wth
rate
2.10
%

NSW Aboriginal Population and Households Projections, 2011–2031 • Page 48
FAC
S So
uthe
rn N
SW In
dig
eno
us P
op
ulat
ion
30 J
un
e 20
1130
Ju
ne
2016
30 J
un
e 20
2130
Ju
ne
2026
30 J
un
e 20
31
Age
gro
ups
Mal
esFe
mal
esTo
tal
Mal
esFe
mal
esTo
tal
Mal
esFe
mal
esTo
tal
Mal
esFe
mal
esTo
tal
Mal
esFe
mal
esTo
tal
0–4
419
377
796
473
509
98
256
76
00
1,16
76
516
82
1,333
748
774
1,522
5–9
46
538
78
5251
852
41,0
42
595
678
1,272
711
789
1,49
98
178
90
1,70
8
10–1
44
264
298
554
5637
88
3350
951
51,0
2458
56
67
1,253
700
777
1,478
15–1
938
633
972
54
174
178
354
48
366
814
501
502
1,00
357
66
531,2
29
20–2
420
721
34
2037
332
16
95
40
439
88
03
433
345
779
48
54
799
64
25–2
922
721
04
3719
519
739
235
930
46
63
389
379
768
416
325
740
30–3
417
818
135
921
820
24
2018
518
937
534
729
56
42
376
369
745
35–3
921
719
54
1217
217
534
721
119
64
07
179
183
362
340
287
627
40
–44
213
205
418
211
187
398
167
168
335
206
188
394
174
175
349
45–
49
196
198
394
205
197
40
220
418
038
416
116
032
119
918
037
9
50–5
414
818
933
718
719
037
719
619
038
619
517
336
815
415
430
7
55–5
911
414
425
813
918
132
017
718
336
018
618
336
918
616
735
2
60
–64
94
98
192
104
136
240
128
172
300
163
174
337
173
174
347
65–
69
5659
115
82
89
172
92
125
216
113
158
271
145
160
306
70–7
452
389
04
651
96
68
7714
576
109
185
95
138
233
75-7
917
304
737
306
733
40
7450
62
112
578
814
5
80
+1
1011
1125
3526
3359
314
576
43
67
110
All
ages
3,4
163,
302
6,7
183,
84
43,
811
7,6
554
,36
94
,414
8,78
34
,979
5,0
95
10,0
735,
68
35,
857
11,5
41
Ave
rage
ann
ual 2
011
to 2
031
gro
wth
rate
2.71
%

NSW Aboriginal Population and Households Projections, 2011–2031 Page 49
FAC
S Sy
dne
y In
dig
eno
us P
op
ulat
ion
30 J
un
e 20
1130
Ju
ne
2016
30 J
un
e 20
2130
Ju
ne
2026
30 J
un
e 20
31
Age
gro
ups
Mal
esFe
mal
esTo
tal
Mal
esFe
mal
esTo
tal
Mal
esFe
mal
esTo
tal
Mal
esFe
mal
esTo
tal
Mal
esFe
mal
esTo
tal
0–4
275
285
560
430
433
86
24
374
3987
64
284
298
564
564
559
10
5–9
249
229
478
356
381
737
532
548
1,08
156
157
41,1
3557
358
41,1
56
10–1
422
221
44
3624
222
34
65
349
374
724
524
541
1,06
555
256
61,1
18
15–1
926
627
754
321
620
64
2223
621
54
5134
236
570
751
653
01,0
46
20–2
428
529
558
025
626
552
120
519
339
922
420
04
2432
834
86
76
25–2
924
529
754
227
428
355
724
425
24
9719
318
037
220
918
439
4
30–3
418
521
339
823
729
052
726
527
754
223
524
64
81
183
172
355
35–3
918
921
44
03
180
208
388
232
285
517
260
272
531
229
240
46
9
40
–44
209
255
46
418
520
839
317
620
237
822
727
850
625
526
452
0
45–
49
168
239
40
720
324
84
5118
020
238
217
219
636
822
227
14
93
50–5
418
217
936
116
223
239
419
724
14
3817
519
637
016
619
035
6
55–5
915
115
230
317
517
334
815
722
438
119
123
44
2516
919
035
9
60
–64
779
016
714
314
528
816
716
533
215
021
536
518
322
54
07
65–
69
60
61
121
718
415
513
313
526
815
515
531
014
020
234
2
70–7
426
40
66
5354
107
63
7513
811
912
224
113
914
028
0
75-7
920
3858
2134
554
44
69
053
64
117
100
105
205
80
+15
2237
214
16
326
5076
44
66
110
61
90
151
All
ages
2,8
243,
100
5,9
243,
226
3,50
76
,733
3,6
45
3,9
267,
571
4,0
524
,332
8,38
44
,48
34
,755
9,23
8
Ave
rage
ann
ual 2
011
to 2
031
gro
wth
rate
2.22
%

NSW Aboriginal Population and Households Projections, 2011–2031 • Page 50
FAC
S W
este
rn N
SW In
dig
eno
us P
op
ulat
ion
30 J
un
e 20
1130
Ju
ne
2016
30 J
un
e 20
2130
Ju
ne
2026
30 J
un
e 20
31
Age
gro
ups
Mal
esFe
mal
esTo
tal
Mal
esFe
mal
esTo
tal
Mal
esFe
mal
esTo
tal
Mal
esFe
mal
esTo
tal
Mal
esFe
mal
esTo
tal
0–4
1,977
1,920
3,8
972,
186
2,0
544
,24
02,
592
2,4
48
5,0
41
2,9
302,
775
5,70
53,
280
3,11
16
,39
1
5–9
1,855
1,687
3,54
22,
358
2,22
74
,58
52,
66
92,
458
5,12
73,
172
2,9
45
6,11
83,
60
73,
363
6,9
70
10–1
41,9
111,8
02
3,71
31,8
191,6
62
3,4
81
2,32
22,
202
4,5
252,
631
2,4
305,
06
13,
131
2,9
126
,04
3
15–1
91,7
201,5
83
3,30
31,8
761,7
723,
64
71,7
871,6
323,
419
2,28
82,
167
4,4
542,
593
2,38
84
,98
1
20–2
41,2
141,1
83
2,39
71,6
69
1,539
3,20
81,8
231,7
223,
546
1,729
1,575
3,30
52,
223
2,10
04
,322
25–2
99
00
90
11,8
01
1,16
21,1
44
2,30
61,6
111,4
93
3,10
41,7
581,6
69
3,4
271,6
571,5
143,
172
30–3
474
98
131,5
62
86
38
80
1,74
31,1
211,1
212,
242
1,56
31,4
66
3,0
291,7
05
1,637
3,34
3
35–3
977
09
561,7
2672
579
61,5
208
388
62
1,70
01,0
93
1,10
02,
193
1,530
1,44
12,
971
40
–44
853
1,00
21,8
5574
89
331,6
80
705
774
1,479
817
838
1,656
1,06
91,0
712,
141
45–
49
784
780
1,56
48
2297
51,7
9772
19
08
1,629
68
075
01,4
3078
98
121,6
01
50–5
46
68
676
1,34
474
875
41,5
02
787
94
61,7
336
90
88
01,5
706
5072
51,3
75
55–5
957
254
11,1
136
286
49
1,277
707
727
1,434
746
913
1,659
655
84
91,5
04
60
–64
426
432
858
523
511
1,034
578
615
1,19
36
536
91
1,34
46
91
870
1,56
1
65–
69
282
304
586
373
394
767
46
14
69
929
512
566
1,078
582
637
1,219
70–7
418
719
738
423
026
34
93
307
343
650
382
410
791
427
49
69
23
75-7
98
513
221
713
515
829
316
821
238
022
727
950
528
433
46
18
80
+59
119
178
7415
122
510
918
729
714
624
539
219
932
352
2
All
ages
15,0
1315
,026
30,0
3916
,938
16,8
60
33,7
98
19,3
06
19,12
138
,427
22,0
1721
,69
94
3,71
625
,072
24,5
85
49,
657
Ave
rage
ann
ual 2
011
to 2
031
gro
wth
rate
2.51
%
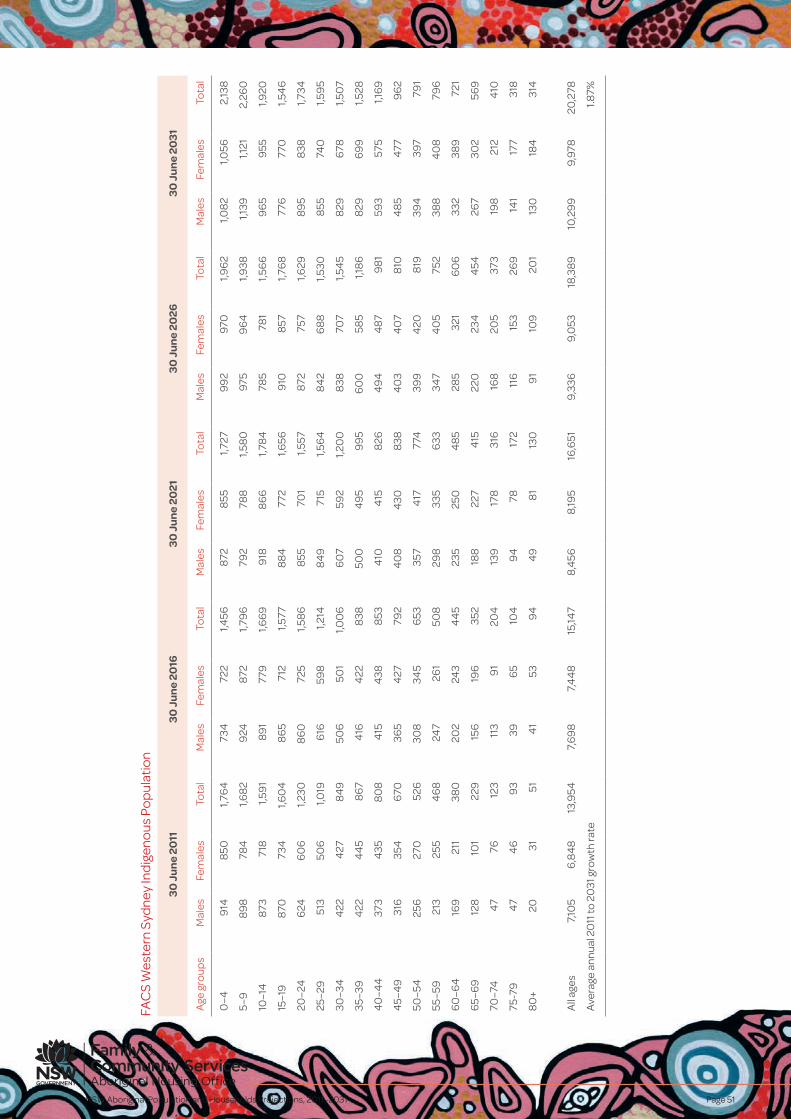
NSW Aboriginal Population and Households Projections, 2011–2031 Page 51
FAC
S W
este
rn S
ydne
y In
dig
eno
us P
op
ulat
ion
30 J
un
e 20
1130
Ju
ne
2016
30 J
un
e 20
2130
Ju
ne
2026
30 J
un
e 20
31
Age
gro
ups
Mal
esFe
mal
esTo
tal
Mal
esFe
mal
esTo
tal
Mal
esFe
mal
esTo
tal
Mal
esFe
mal
esTo
tal
Mal
esFe
mal
esTo
tal
0–4
914
850
1,76
473
472
21,4
5687
28
551,7
279
92
970
1,96
21,0
82
1,056
2,13
8
5–9
89
878
41,6
82
924
872
1,79
679
278
81,5
80
975
96
41,9
381,1
391,1
212,
260
10–1
487
371
81,5
91
89
177
91,6
69
918
86
61,7
84
785
781
1,56
69
65
955
1,920
15–1
987
073
41,6
04
86
571
21,5
778
84
772
1,656
910
857
1,76
877
677
01,5
46
20–2
46
246
06
1,230
86
072
51,5
86
855
701
1,557
872
757
1,629
89
58
381,7
34
25–2
951
350
61,0
196
1659
81,2
148
49
715
1,56
48
42
68
81,5
308
5574
01,5
95
30–3
44
224
278
49
506
501
1,00
66
07
592
1,20
08
3870
71,5
45
829
678
1,50
7
35–3
94
224
45
86
74
164
228
3850
04
95
99
56
00
585
1,18
68
296
99
1,528
40
–44
373
435
80
84
154
388
534
104
158
264
94
487
98
159
357
51,1
69
45–
49
316
354
670
365
427
792
40
84
308
384
03
40
78
104
85
477
96
2
50–5
425
627
052
630
834
56
5335
74
1777
439
94
208
1939
439
779
1
55–5
921
325
54
68
247
261
508
298
335
633
347
40
575
238
84
08
796
60
–64
169
211
380
202
243
44
523
525
04
85
285
321
60
633
238
972
1
65–
69
128
101
229
156
196
352
188
227
415
220
234
454
267
302
569
70–7
44
776
123
113
91
204
139
178
316
168
205
373
198
212
410
75-7
94
74
69
339
65
104
94
7817
211
615
326
914
117
731
8
80
+20
3151
41
539
44
98
113
09
110
920
113
018
431
4
All
ages
7,10
56
,84
813
,954
7,6
98
7,4
48
15,14
78,
456
8,19
516
,651
9,33
69,
053
18,3
89
10,2
99
9,97
820
,278
Ave
rage
ann
ual 2
011
to 2
031
gro
wth
rate
1.87%
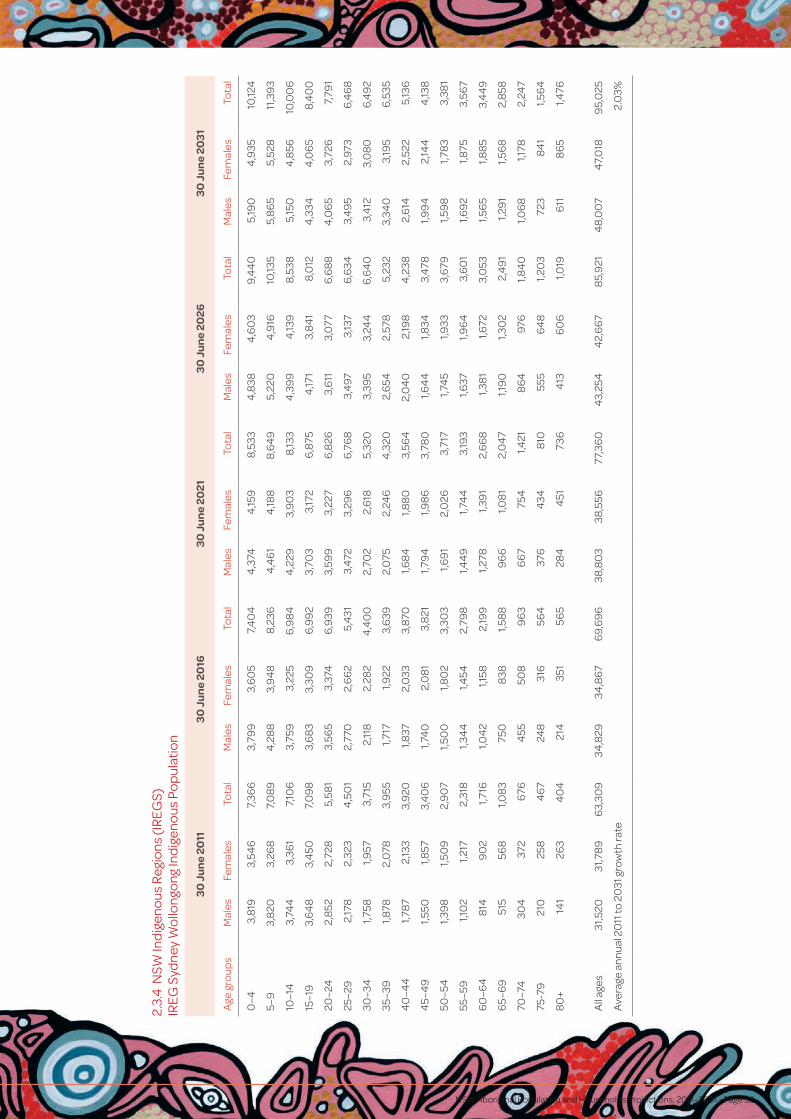
NSW Aboriginal Population and Households Projections, 2011–2031 • Page 52
2.3.
4 N
SW In
dig
eno
us R
egio
ns (I
RE
GS)
IR
EG
Syd
ney
Wo
llong
ong
Ind
igen
ous
Po
pul
atio
n
30 J
un
e 20
1130
Ju
ne
2016
30 J
un
e 20
2130
Ju
ne
2026
30 J
un
e 20
31
Age
gro
ups
Mal
esFe
mal
esTo
tal
Mal
esFe
mal
esTo
tal
Mal
esFe
mal
esTo
tal
Mal
esFe
mal
esTo
tal
Mal
esFe
mal
esTo
tal
0–4
3,8
193,
546
7,36
63,
799
3,6
05
7,4
04
4,3
744
,159
8,53
34
,838
4,6
03
9,4
40
5,19
04
,935
10,12
4
5–9
3,8
203,
268
7,0
89
4,2
88
3,9
48
8,23
64
,46
14
,188
8,6
49
5,22
04
,916
10,13
55,
86
55,
528
11,3
93
10–1
43,
744
3,36
17,
106
3,75
93,
225
6,9
84
4,2
293,
90
38,
133
4,3
99
4,13
98,
538
5,15
04
,856
10,0
06
15–1
93,
64
83,
450
7,0
98
3,6
83
3,30
96
,99
23,
703
3,17
26
,875
4,17
13,
84
18,
012
4,3
344
,06
58,
40
0
20–2
42,
852
2,72
85,
581
3,56
53,
374
6,9
393,
599
3,22
76
,826
3,6
113,
077
6,6
88
4,0
65
3,72
67,
791
25–2
92,
178
2,32
34
,50
12,
770
2,6
62
5,4
313,
472
3,29
66
,76
83,
497
3,13
76
,634
3,4
95
2,97
36
,46
8
30–3
41,7
581,9
573,
715
2,11
82,
282
4,4
00
2,70
22,
618
5,32
03,
395
3,24
46
,64
03,
412
3,0
80
6,4
92
35–3
91,8
782,
078
3,9
551,7
171,9
223,
639
2,0
752,
246
4,3
202,
654
2,57
85,
232
3,34
03,
195
6,5
35
40
–44
1,787
2,13
33,
920
1,837
2,0
333,
870
1,68
41,8
80
3,56
42,
04
02,
198
4,2
382,
614
2,52
25,
136
45–
49
1,550
1,857
3,4
06
1,74
02,
08
13,
821
1,79
41,9
86
3,78
01,6
44
1,834
3,4
781,9
94
2,14
44
,138
50–5
41,3
98
1,50
92,
90
71,5
00
1,80
23,
303
1,69
12,
026
3,71
71,7
45
1,933
3,6
791,5
98
1,78
33,
381
55–5
91,1
02
1,217
2,31
81,3
44
1,454
2,79
81,4
49
1,74
43,
193
1,637
1,96
43,
60
11,6
92
1,875
3,56
7
60
–64
814
90
21,7
161,0
42
1,158
2,19
91,2
781,3
91
2,6
68
1,38
11,6
723,
053
1,56
51,8
85
3,4
49
65–
69
515
568
1,08
375
08
381,5
88
96
61,0
81
2,0
47
1,19
01,3
02
2,4
91
1,29
11,5
68
2,8
58
70–7
430
437
26
764
5550
89
63
66
775
41,4
218
64
976
1,84
01,0
68
1,178
2,24
7
75-7
921
025
84
67
248
316
564
376
434
810
555
64
81,2
03
723
84
11,5
64
80
+14
126
34
04
214
351
565
284
451
736
413
60
61,0
196
118
65
1,476
All
ages
31,5
2031
,78
96
3,30
934
,829
34,8
67
69,
69
638
,80
338
,556
77,3
60
43,
254
42,
66
78
5,9
214
8,0
07
47,
018
95,
025
Ave
rage
ann
ual 2
011
to 2
031
gro
wth
rate
2.0
3%

NSW Aboriginal Population and Households Projections, 2011–2031 Page 53
IRE
G S
out
h Ea
ster
n N
SW In
dig
eno
us P
op
ulat
ion
30 J
un
e 20
1130
Ju
ne
2016
30 J
un
e 20
2130
Ju
ne
2026
30 J
un
e 20
31
Age
gro
ups
Mal
esFe
mal
esTo
tal
Mal
esFe
mal
esTo
tal
Mal
esFe
mal
esTo
tal
Mal
esFe
mal
esTo
tal
Mal
esFe
mal
esTo
tal
0–4
791
838
1,629
1,074
1,073
2,14
61,2
62
1,254
2,51
61,4
48
1,433
2,8
81
1,70
41,6
783,
382
5–9
86
677
51,6
41
1,125
1,19
82,
324
1,471
1,49
42,
96
51,7
231,7
353,
457
1,972
1,972
3,9
43
10–1
48
388
141,6
528
3975
11,5
90
1,09
61,1
732,
269
1,44
01,4
66
2,9
06
1,68
81,7
04
3,39
2
15–1
976
76
69
1,436
813
785
1,597
813
721
1,534
1,06
91,1
392,
208
1,40
91,4
282,
837
20–2
44
81
417
89
872
86
251,3
5477
273
61,5
08
768
66
81,4
371,0
181,0
792,
097
25–2
94
08
40
08
08
44
237
98
216
84
581
1,26
572
26
871,4
09
714
614
1,328
30–3
433
035
86
88
380
381
761
412
358
770
64
955
81,2
07
68
46
61
1,34
5
35–3
938
04
02
782
313
344
657
363
366
728
393
342
735
626
539
1,16
6
40
–44
385
388
773
366
384
750
301
326
627
350
346
69
637
932
170
0
45–
49
339
395
734
367
371
737
349
366
715
285
308
593
332
327
659
50–5
430
635
86
64
320
378
69
834
835
470
233
135
06
80
269
292
560
55–5
923
525
04
85
286
342
628
301
362
66
332
834
06
68
312
336
64
8
60
–64
195
184
379
213
236
44
926
232
558
627
634
56
2130
232
46
26
65–
69
130
126
256
170
167
338
187
216
40
323
129
852
924
531
756
2
70–7
49
374
167
106
107
214
140
144
284
155
187
342
193
259
452
75-7
935
559
06
758
125
778
516
210
311
521
811
515
126
6
80
+24
43
67
3158
89
5270
121
68
95
162
91
129
220
All
ages
6,6
03
6,5
45
13,14
87,
64
07,
637
15,2
778,
88
88,
932
17,8
2010
,338
10,4
1220
,750
12,0
5312
,130
24,18
3
Ave
rage
ann
ual 2
011
to 2
031
gro
wth
rate
3.0
5%
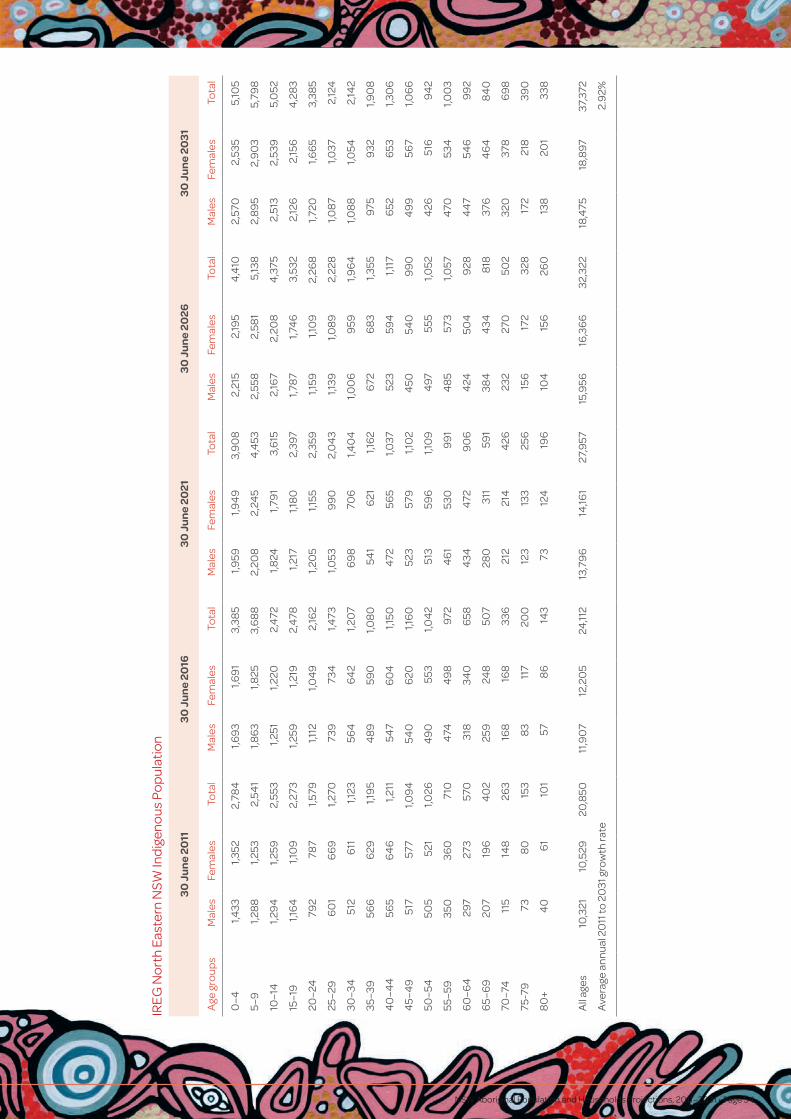
NSW Aboriginal Population and Households Projections, 2011–2031 • Page 54
IRE
G N
ort
h Ea
ster
n N
SW In
dig
eno
us P
op
ulat
ion
30 J
un
e 20
1130
Ju
ne
2016
30 J
un
e 20
2130
Ju
ne
2026
30 J
un
e 20
31
Age
gro
ups
Mal
esFe
mal
esTo
tal
Mal
esFe
mal
esTo
tal
Mal
esFe
mal
esTo
tal
Mal
esFe
mal
esTo
tal
Mal
esFe
mal
esTo
tal
0–4
1,433
1,352
2,78
41,6
93
1,69
13,
385
1,959
1,94
93,
90
82,
215
2,19
54
,410
2,57
02,
535
5,10
5
5–9
1,28
81,2
532,
541
1,86
31,8
253,
68
82,
208
2,24
54
,453
2,55
82,
581
5,13
82,
89
52,
90
35,
798
10–1
41,2
94
1,259
2,55
31,2
511,2
202,
472
1,824
1,79
13,
615
2,16
72,
208
4,3
752,
513
2,53
95,
052
15–1
91,1
64
1,10
92,
273
1,259
1,219
2,4
781,2
171,1
80
2,39
71,7
871,7
46
3,53
22,
126
2,15
64
,28
3
20–2
479
278
71,5
791,1
121,0
49
2,16
21,2
05
1,155
2,35
91,1
591,1
09
2,26
81,7
201,6
65
3,38
5
25–2
96
01
66
91,2
7073
973
41,4
731,0
539
90
2,0
43
1,139
1,08
92,
228
1,087
1,037
2,12
4
30–3
451
26
111,1
2356
46
42
1,20
76
98
706
1,40
41,0
06
959
1,96
41,0
88
1,054
2,14
2
35–3
956
66
291,1
95
48
959
01,0
80
541
621
1,16
26
726
83
1,355
975
932
1,90
8
40
–44
565
64
61,2
1154
76
04
1,150
472
565
1,037
523
594
1,117
652
653
1,30
6
45–
49
517
577
1,09
454
06
201,1
60
523
579
1,10
24
5054
09
90
49
956
71,0
66
50–5
450
552
11,0
264
90
553
1,04
251
359
61,1
09
497
555
1,052
426
516
94
2
55–5
935
036
071
04
744
98
972
46
153
09
91
48
557
31,0
574
7053
41,0
03
60
–64
297
273
570
318
340
658
434
472
90
64
2450
49
284
47
546
99
2
65–
69
207
196
40
225
924
850
728
031
159
138
44
348
1837
64
64
84
0
70–7
411
514
826
316
816
833
621
221
44
2623
227
050
232
037
86
98
75-7
973
80
153
83
117
200
123
133
256
156
172
328
172
218
390
80
+4
06
110
157
86
143
7312
419
610
415
626
013
820
133
8
All
ages
10,3
2110
,529
20,8
5011
,90
712
,20
524
,112
13,7
96
14,16
127
,957
15,9
5616
,36
632
,322
18,4
7518
,897
37,3
72
Ave
rage
ann
ual 2
011
to 2
031
gro
wth
rate
2.9
2%

NSW Aboriginal Population and Households Projections, 2011–2031 Page 55
IRE
G R
iver
ina-
Ora
nge
Ind
igen
ous
Po
pul
atio
n
30 J
un
e 20
1130
Ju
ne
2016
30 J
un
e 20
2130
Ju
ne
2026
30 J
un
e 20
31
Age
gro
ups
Mal
esFe
mal
esTo
tal
Mal
esFe
mal
esTo
tal
Mal
esFe
mal
esTo
tal
Mal
esFe
mal
esTo
tal
Mal
esFe
mal
esTo
tal
0–4
1,60
11,6
173,
218
1,554
1,572
3,12
71,8
701,8
793,
749
2,14
12,
141
4,2
82
2,38
92,
377
4,7
66
5–9
1,458
1,459
2,9
161,7
03
1,78
23,
48
51,7
02
1,78
03,
48
22,
059
2,12
44
,184
2,37
12,
423
4,7
94
10–1
41,6
541,4
69
3,12
31,4
391,4
41
2,87
91,6
86
1,76
53,
451
1,68
61,7
63
3,4
502,
04
22,
105
4,14
7
15–1
91,4
561,3
152,
770
1,633
1,44
73,
08
11,4
231,4
212,
84
51,6
711,7
44
3,4
151,6
701,7
40
3,4
11
20–2
41,0
44
924
1,96
71,4
301,2
86
2,71
61,6
09
1,418
3,0
271,4
00
1,39
02,
790
1,64
51,7
08
3,35
3
25–2
979
676
81,5
64
1,020
89
91,9
181,4
04
1,258
2,6
62
1,58
11,3
88
2,9
69
1,370
1,357
2,72
7
30–3
46
136
47
1,259
777
753
1,530
99
98
84
1,88
31,3
81
1,24
12,
621
1,556
1,36
82,
924
35–3
96
41
724
1,36
459
86
341,2
3376
274
11,5
03
98
387
11,8
541,3
61
1,224
2,58
6
40
–44
671
749
1,420
625
707
1,332
586
620
1,20
674
872
51,4
739
67
853
1,820
45–
49
637
69
21,3
286
49
729
1,379
60
76
90
1,297
570
60
41,1
7473
070
71,4
37
50–5
454
54
971,0
42
610
670
1,28
06
2470
81,3
3358
56
701,2
5555
058
61,1
36
55–5
94
1539
68
1151
44
769
90
578
64
51,2
2359
36
83
1,277
557
64
71,2
04
60
–64
352
315
66
738
037
375
34
734
519
2453
46
121,1
46
550
64
91,2
00
65–
69
215
223
437
308
287
595
334
342
676
419
415
834
475
565
1,04
0
70–7
415
516
231
717
419
336
725
225
050
227
729
957
634
936
571
4
75-7
976
7815
411
213
024
212
815
628
418
720
339
020
624
44
50
80
+4
477
121
62
94
156
91
138
229
115
180
295
161
237
397
All
ages
12,3
7112
,110
24,4
80
13,5
8713
,474
27,0
62
15,12
915
,146
30,2
7516
,930
17,0
5533
,98
518
,94
819
,156
38,10
5
Ave
rage
ann
ual 2
011
to 2
031
gro
wth
rate
2.21
%

NSW Aboriginal Population and Households Projections, 2011–2031 • Page 56
IRE
G N
SW C
entr
al a
nd N
ort
h C
oas
t Ind
igen
ous
Po
pul
atio
n
30 J
un
e 20
1130
Ju
ne
2016
30 J
un
e 20
2130
Ju
ne
2026
30 J
un
e 20
31
Age
gro
ups
Mal
esFe
mal
esTo
tal
Mal
esFe
mal
esTo
tal
Mal
esFe
mal
esTo
tal
Mal
esFe
mal
esTo
tal
Mal
esFe
mal
esTo
tal
0–4
4,13
93,
773
7,9
134
,90
64
,70
99,
616
5,79
05,
568
11,3
586
,50
46
,256
12,7
60
7,24
96
,96
914
,218
5–9
4,0
06
3,79
77,
80
35,
172
4,7
47
9,9
196
,130
5,8
63
11,9
93
7,20
06
,897
14,0
978,
09
67,
756
15,8
52
10–1
44
,08
13,
930
8,0
113,
90
93,
723
7,6
325,
076
4,6
729,
748
6,0
315,
782
11,8
137,
09
36
,80
513
,89
8
15–1
93,
816
3,56
97,
386
3,9
89
3,8
397,
828
3,8
243,
633
7,4
584
,98
64
,573
9,56
05,
934
5,6
7011
,60
4
20–2
42,
548
2,4
65
5,0
133,
68
23,
436
7,11
83,
853
3,6
98
7,55
13,
68
23,
48
07,
162
4,8
284
,40
09,
228
25–2
91,8
761,9
793,
854
2,4
142,
348
4,7
61
3,53
23,
305
6,8
373,
69
23,
554
7,24
63,
509
3,32
16
,830
30–3
41,6
391,6
02
3,24
11,7
80
1,917
3,6
98
2,31
02,
283
4,5
93
3,4
143,
231
6,6
45
3,56
63,
472
7,0
38
35–3
91,6
591,9
393,
598
1,577
1,555
3,13
21,7
181,8
69
3,58
72,
242
2,23
04
,471
3,33
33,
167
6,5
01
40
–44
1,69
62,
037
3,73
31,6
05
1,877
3,4
82
1,529
1,49
93,
028
1,670
1,80
63,
476
2,18
72,
158
4,3
46
45–
49
1,520
1,853
3,37
21,6
261,9
703,
596
1,54
21,8
153,
357
1,46
91,4
41
2,9
09
1,60
61,7
40
3,34
6
50–5
41,4
43
1,56
43,
00
61,4
43
1,78
43,
227
1,550
1,90
23,
452
1,471
1,751
3,22
21,4
00
1,38
42,
784
55–5
91,0
81
1,20
42,
284
1,354
1,497
2,8
511,3
60
1,715
3,0
761,4
66
1,832
3,29
91,3
93
1,687
3,0
80
60
–64
780
859
1,639
98
51,1
362,
121
1,24
21,4
192,
66
11,2
521,6
302,
88
21,3
551,7
43
3,0
98
65–
69
543
562
1,10
56
81
782
1,46
38
67
1,04
01,9
07
1,09
91,3
04
2,4
02
1,113
1,50
02,
613
70–7
433
738
271
94
42
48
39
2555
96
781,2
3771
89
07
1,625
915
1,14
12,
055
75-7
919
623
14
2724
230
354
532
238
770
94
1254
89
60
534
737
1,271
80
+14
623
838
417
328
04
5321
435
356
728
24
5273
436
86
189
87
All
ages
31,5
07
31,9
82
63,
48
935
,979
36,3
8772
,36
64
1,418
41,6
99
83,
118
47,
590
47,
674
95,
264
54,4
7954
,271
108,
750
Ave
rage
ann
ual 2
011
to 2
031
gro
wth
rate
2.6
9%

NSW Aboriginal Population and Households Projections, 2011–2031 Page 57
IRE
G D
ubb
o In
dig
eno
us P
op
ulat
ion
30 J
un
e 20
1130
Ju
ne
2016
30 J
un
e 20
2130
Ju
ne
2026
30 J
un
e 20
31
Age
gro
ups
Mal
esFe
mal
esTo
tal
Mal
esFe
mal
esTo
tal
Mal
esFe
mal
esTo
tal
Mal
esFe
mal
esTo
tal
Mal
esFe
mal
esTo
tal
0–4
971
950
1,921
1,239
1,128
2,36
71,4
561,3
382,
794
1,64
31,5
173,
160
1,90
71,7
703,
677
5–9
887
743
1,630
1,359
1,26
02,
618
1,723
1,531
3,25
32,
035
1,832
3,8
67
2,31
72,
101
4,4
18
10–1
48
88
852
1,74
08
5672
21,5
781,3
231,2
352,
558
1,68
41,5
02
3,18
51,9
91
1,79
83,
789
15–1
979
473
11,5
258
598
251,6
84
826
69
21,5
181,2
89
1,19
92,
48
81,6
44
1,46
03,
104
20–2
453
253
61,0
68
750
69
11,4
41
810
778
1,58
877
06
371,4
08
1,224
1,133
2,35
7
25–2
94
43
425
86
84
8750
19
88
69
66
48
1,34
474
872
71,4
7570
157
91,2
80
30–3
434
137
871
94
114
07
819
451
48
09
316
536
241,2
7770
06
99
1,39
9
35–3
934
64
3878
432
236
56
8739
039
278
34
274
63
89
06
266
03
1,229
40
–44
363
430
793
332
421
752
309
347
655
375
372
747
411
439
850
45–
49
317
330
64
734
44
1375
731
44
03
716
290
328
618
354
351
705
50–5
428
234
16
2329
831
56
1332
439
672
029
438
56
80
271
311
582
55–5
925
425
250
626
332
658
927
930
258
130
538
16
85
276
370
64
6
60
–64
192
184
376
230
238
46
824
030
954
925
628
854
328
036
36
42
65–
69
108
131
239
168
167
335
202
218
420
212
283
49
522
726
44
91
70–7
472
80
152
88
112
200
138
144
282
167
188
356
176
246
423
75-7
94
559
104
526
311
46
48
915
310
211
521
712
415
227
6
80
+15
49
64
316
59
64
376
119
5710
115
88
513
221
7
All
ages
6,8
516
,90
813
,759
8,0
89
8,0
1816
,107
9,58
89,
378
18,9
66
11,3
07
10,9
42
22,2
49
13,3
1312
,771
26,0
85
Ave
rage
ann
ual 2
011
to 2
031
gro
wth
rate
3.20
%
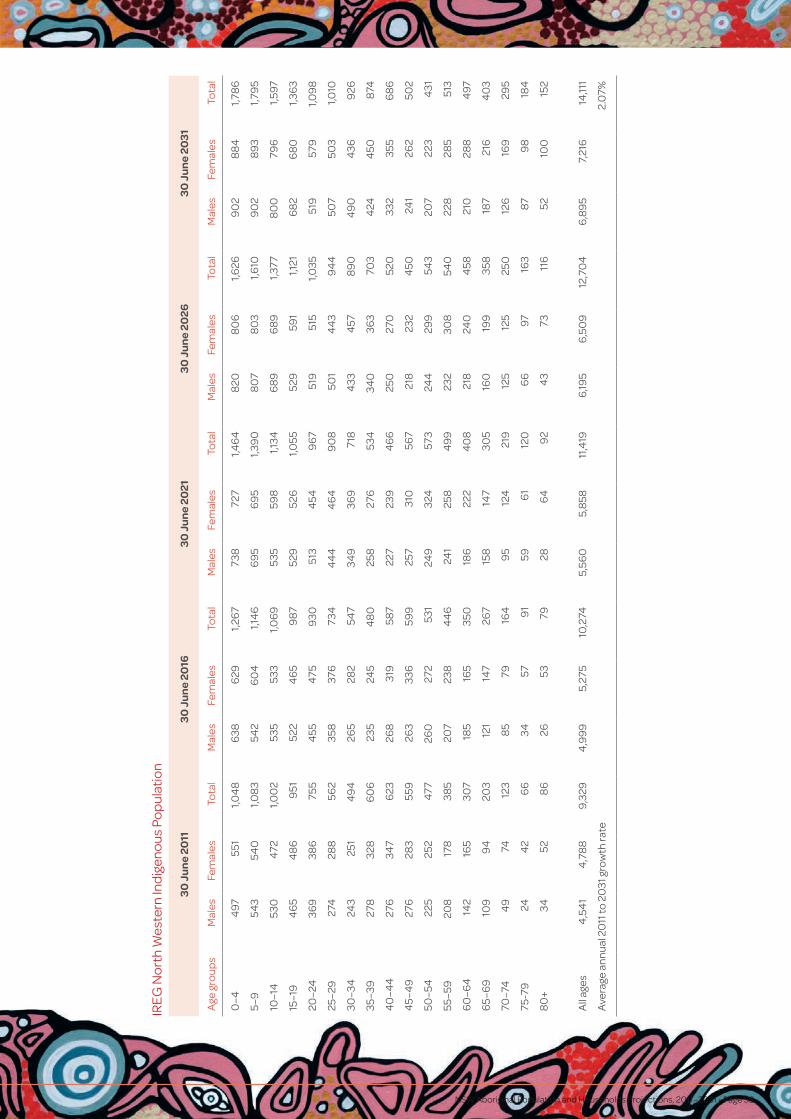
NSW Aboriginal Population and Households Projections, 2011–2031 • Page 58
IRE
G N
ort
h W
este
rn In
dig
eno
us P
op
ulat
ion
30 J
un
e 20
1130
Ju
ne
2016
30 J
un
e 20
2130
Ju
ne
2026
30 J
un
e 20
31
Age
gro
ups
Mal
esFe
mal
esTo
tal
Mal
esFe
mal
esTo
tal
Mal
esFe
mal
esTo
tal
Mal
esFe
mal
esTo
tal
Mal
esFe
mal
esTo
tal
0–4
497
551
1,04
86
386
291,2
67
738
727
1,46
48
208
06
1,626
90
28
84
1,78
6
5–9
543
540
1,08
354
26
04
1,14
66
95
69
51,3
90
80
78
03
1,610
90
28
93
1,79
5
10–1
453
04
721,0
02
535
533
1,06
953
559
81,1
346
89
68
91,3
778
00
796
1,597
15–1
94
65
48
69
5152
24
65
987
529
526
1,055
529
591
1,121
68
26
80
1,36
3
20–2
436
938
675
54
554
759
3051
34
549
67
519
515
1,035
519
579
1,09
8
25–2
927
428
856
235
837
673
44
44
46
49
08
501
44
39
44
507
503
1,010
30–3
424
325
14
94
265
282
547
349
369
718
433
457
89
04
90
436
926
35–3
927
832
86
06
235
245
48
025
827
653
434
036
370
34
244
5087
4
40
–44
276
347
623
268
319
587
227
239
46
625
027
052
033
235
56
86
45–
49
276
283
559
263
336
599
257
310
567
218
232
450
241
262
502
50–5
422
525
24
7726
027
253
124
932
457
324
429
954
320
722
34
31
55–5
920
817
838
520
723
84
46
241
258
49
923
230
854
022
828
551
3
60
–64
142
165
307
185
165
350
186
222
40
821
824
04
5821
028
84
97
65–
69
109
94
203
121
147
267
158
147
305
160
199
358
187
216
40
3
70–7
44
974
123
85
7916
49
512
421
912
512
525
012
616
929
5
75-7
924
42
66
3457
91
596
112
06
697
163
879
818
4
80
+34
528
626
5379
286
49
24
373
116
5210
015
2
All
ages
4,5
41
4,7
88
9,32
94
,99
95,
275
10,2
745,
560
5,8
5811
,419
6,19
56
,50
912
,70
46
,89
57,
216
14,11
1
Ave
rage
ann
ual 2
011
to 2
031
gro
wth
rate
2.0
7%

NSW Aboriginal Population and Households Projections, 2011–2031 Page 59
2.3.
5 R
emo
tene
ss a
reas
N
SW M
ajo
r Citi
es In
dig
eno
us P
op
ulat
ion
30 J
un
e 20
1130
Ju
ne
2016
30 J
un
e 20
2130
Ju
ne
2026
30 J
un
e 20
31
Age
gro
ups
Mal
esFe
mal
esTo
tal
Mal
esFe
mal
esTo
tal
Mal
esFe
mal
esTo
tal
Mal
esFe
mal
esTo
tal
Mal
esFe
mal
esTo
tal
0–4
5,20
94
,79
09,
99
95,
587
5,35
610
,94
46
,357
6,0
98
12,4
556
,99
36
,70
613
,69
97,
590
7,27
114
,86
1
5–9
5,18
54
,46
79,
652
6,3
315,
84
512
,177
6,9
95
6,6
80
13,6
768,
04
17,
68
215
,723
8,9
528,
547
17,4
99
10–1
45,
09
64
,617
9,71
35,
08
14
,38
99,
470
6,2
295,
765
11,9
95
6,8
876
,59
113
,479
7,9
247,
581
15,5
04
15–1
95,
058
4,6
779,
735
4,9
96
4,5
209,
516
4,9
874
,29
09,
278
6,12
95,
652
11,7
80
6,7
796
,46
213
,24
1
20–2
43,
90
43,
69
37,
597
4,9
09
4,5
299,
438
4,8
45
4,3
61
9,20
64
,822
4,11
08,
932
5,9
44
5,4
43
11,3
87
25–2
92,
86
13,
176
6,0
373,
752
3,56
17,
312
4,7
42
4,3
80
9,12
24
,66
24
,193
8,8
554
,619
3,9
208,
540
30–3
42,
352
2,58
44
,936
2,75
43,
104
5,8
583,
634
3,4
85
7,11
94
,611
4,2
93
8,9
04
4,5
204
,09
88,
618
35–3
92,
46
42,
719
5,18
32,
285
2,52
74
,812
2,6
85
3,0
45
5,73
03,
557
3,4
206
,977
4,5
254
,218
8,74
3
40
–44
2,39
42,
80
35,
197
2,4
07
2,6
47
5,0
542,
236
2,4
594
,69
42,
634
2,9
66
5,6
00
3,50
03,
331
6,8
31
45–
49
2,11
82,
541
4,6
592,
324
2,72
55,
04
92,
342
2,57
54
,917
2,17
32,
385
4,5
592,
566
2,8
82
5,4
47
50–5
41,8
742,
06
13,
935
2,0
46
2,4
62
4,5
07
2,25
32,
64
84
,90
12,
272
2,4
99
4,7
722,
107
2,31
14
,418
55–5
91,4
711,6
313,
102
1,80
01,9
873,
788
1,975
2,38
44
,358
2,18
12,
567
4,7
48
2,20
22,
424
4,6
26
60
–64
1,08
41,2
152,
299
1,39
01,5
552,
94
51,7
111,9
04
3,6
161,8
83
2,28
84
,171
2,0
84
2,4
68
4,5
52
65–
69
702
772
1,474
1,00
01,1
292,
129
1,29
11,4
532,
743
1,59
51,7
83
3,37
81,7
61
2,14
73,
90
8
70–7
44
2851
79
45
621
68
91,3
108
91
1,014
1,90
51,1
561,3
102,
46
61,4
351,6
133,
04
8
75-7
929
333
56
2835
04
3778
651
358
61,0
99
742
86
91,6
119
68
1,128
2,0
96
80
+18
736
855
529
44
7376
739
76
161,0
1357
08
211,3
91
826
1,16
61,9
92
All
ages
42,
679
42,
96
78
5,6
46
47,
927
47,
935
95,
86
154
,08
453
,74
310
7,8
276
0,9
07
60
,136
121,0
42
68,
303
67,
00
813
5,31
1
Ave
rage
ann
ual 2
011
to 2
031
gro
wth
rate
2.29
%

NSW Aboriginal Population and Households Projections, 2011–2031 • Page 60
NSW
Inne
r Reg
iona
l Ind
igen
ous
Po
pul
atio
n
30 J
un
e 20
1130
Ju
ne
2016
30 J
un
e 20
2130
Ju
ne
2026
30 J
un
e 20
31
Age
gro
ups
Mal
esFe
mal
esTo
tal
Mal
esFe
mal
esTo
tal
Mal
esFe
mal
esTo
tal
Mal
esFe
mal
esTo
tal
Mal
esFe
mal
esTo
tal
0–4
5,36
95,
202
10,5
716
,186
6,14
212
,329
7,32
37,
246
14,5
69
8,29
98,
188
16,4
879,
459
9,30
018
,759
5–9
5,0
794
,80
19,
88
06
,728
6,6
7213
,40
07,
814
7,8
66
15,6
80
9,21
09,
214
18,4
2410
,44
610
,39
920
,84
5
10–1
45,
203
5,0
1510
,218
4,9
61
4,7
02
9,6
63
6,6
126
,572
13,18
37,
69
27,
758
15,4
509,
08
19,
09
518
,176
15–1
94
,70
14
,46
29,
163
5,0
91
4,8
92
9,9
82
4,8
584
,579
9,4
376
,50
16
,435
12,9
367,
575
7,6
07
15,18
2
20–2
43,
172
3,0
61
6,2
334
,535
4,2
768,
811
4,9
204
,69
39,
614
4,6
754
,36
19,
036
6,2
99
6,19
112
,49
1
25–2
92,
44
22,
419
4,8
61
3,0
02
2,8
96
5,8
98
4,3
46
4,0
93
8,4
394
,714
4,4
90
9,20
44
,451
4,13
98,
591
30–3
42,
08
02,
09
34
,173
2,32
12,
336
4,6
572,
872
2,8
08
5,6
80
4,19
73,
99
38,
190
4,5
534
,38
18,
934
35–3
92,
120
2,4
84
4,6
04
2,0
03
2,0
304
,033
2,24
32,
272
4,5
142,
786
2,73
75,
523
4,0
99
3,9
118,
010
40
–44
2,22
72,
570
4,7
972,
054
2,4
01
4,4
551,9
44
1,952
3,8
96
2,18
32,
186
4,3
69
2,72
02,
64
25,
362
45–
49
1,94
52,
192
4,13
72,
138
2,4
83
4,6
211,9
742,
319
4,2
93
1,86
81,8
733,
741
2,10
12,
100
4,2
00
50–5
41,8
271,9
273,
754
1,84
92,
109
3,9
582,
04
12,
397
4,4
391,8
85
2,23
64
,121
1,78
21,7
973,
579
55–5
91,3
731,4
382,
811
1,717
1,84
73,
563
1,74
52,
029
3,77
41,9
342,
310
4,2
44
1,787
2,15
63,
94
3
60
–64
1,04
81,0
202,
06
81,2
531,3
592,
612
1,577
1,753
3,33
01,6
09
1,931
3,54
01,7
89
2,20
23,
99
1
65–
69
671
69
01,3
61
916
929
1,84
61,1
04
1,24
62,
350
1,397
1,612
3,0
08
1,432
1,779
3,21
1
70–7
44
41
471
912
547
592
1,139
754
80
51,5
599
151,0
86
2,0
01
1,16
51,4
102,
575
75-7
920
029
64
96
317
373
69
039
94
7487
355
66
49
1,20
56
82
88
21,5
64
80
+16
725
94
2618
633
451
926
34
286
91
349
551
90
04
84
741
1,225
All
ages
40
,06
44
0,4
01
80
,46
54
5,8
04
46
,374
92,
177
52,7
89
53,5
3210
6,3
226
0,7
716
1,611
122,
382
69,
90
670
,732
140
,638
Ave
rage
ann
ual 2
011
to 2
031
gro
wth
rate
2.79
%
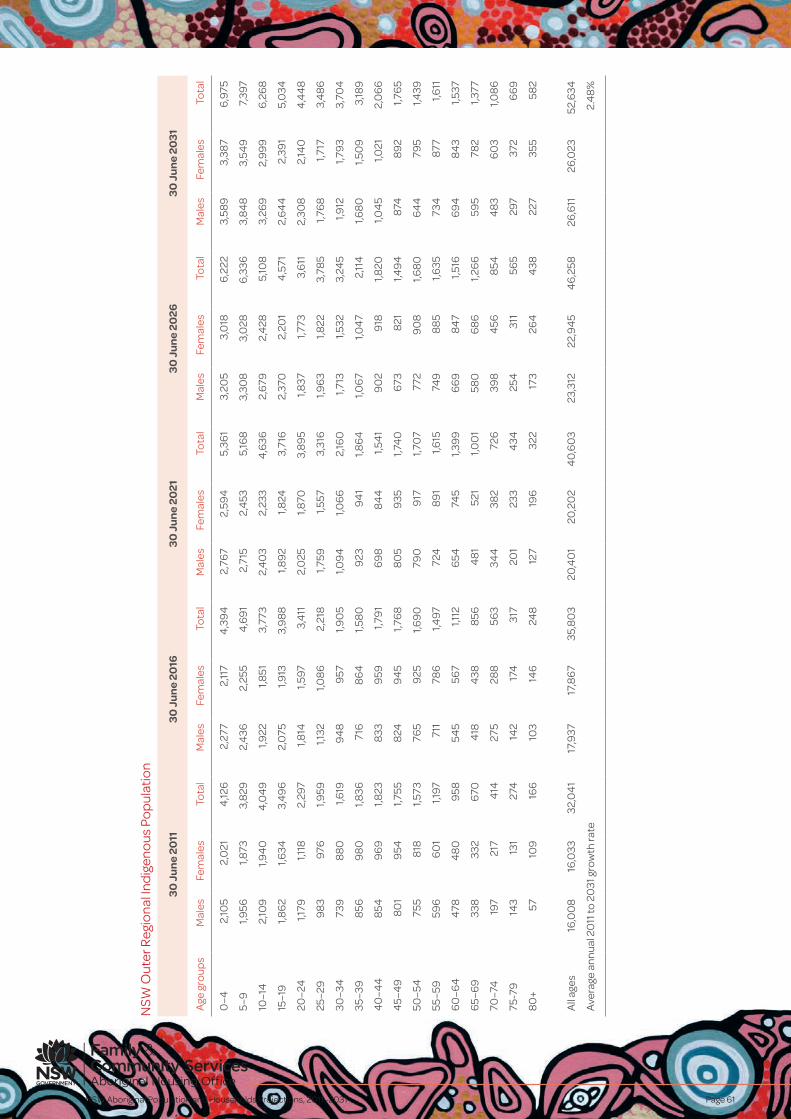
NSW Aboriginal Population and Households Projections, 2011–2031 Page 61
NSW
Out
er R
egio
nal I
ndig
eno
us P
op
ulat
ion
30 J
un
e 20
1130
Ju
ne
2016
30 J
un
e 20
2130
Ju
ne
2026
30 J
un
e 20
31
Age
gro
ups
Mal
esFe
mal
esTo
tal
Mal
esFe
mal
esTo
tal
Mal
esFe
mal
esTo
tal
Mal
esFe
mal
esTo
tal
Mal
esFe
mal
esTo
tal
0–4
2,10
52,
021
4,12
62,
277
2,11
74
,39
42,
767
2,59
45,
361
3,20
53,
018
6,2
223,
589
3,38
76
,975
5–9
1,956
1,873
3,8
292,
436
2,25
54
,69
12,
715
2,4
535,
168
3,30
83,
028
6,3
363,
84
83,
549
7,39
7
10–1
42,
109
1,94
04
,04
91,9
221,8
513,
773
2,4
03
2,23
34
,636
2,6
792,
428
5,10
83,
269
2,9
99
6,2
68
15–1
91,8
62
1,634
3,4
96
2,0
751,9
133,
98
81,8
92
1,824
3,71
62,
370
2,20
14
,571
2,6
44
2,39
15,
034
20–2
41,1
791,1
182,
297
1,814
1,597
3,4
112,
025
1,870
3,8
95
1,837
1,773
3,6
112,
308
2,14
04
,44
8
25–2
99
83
976
1,959
1,132
1,08
62,
218
1,759
1,557
3,31
61,9
63
1,822
3,78
51,7
68
1,717
3,4
86
30–3
473
98
80
1,619
94
89
571,9
05
1,09
41,0
66
2,16
01,7
131,5
323,
245
1,912
1,79
33,
704
35–3
98
569
80
1,836
716
86
41,5
80
923
94
11,8
64
1,06
71,0
47
2,11
41,6
80
1,50
93,
189
40
–44
854
96
91,8
238
339
591,7
91
69
88
44
1,54
19
02
918
1,820
1,04
51,0
212,
06
6
45–
49
80
19
541,7
558
249
45
1,76
88
05
935
1,74
06
738
211,4
94
874
89
21,7
65
50–5
475
58
181,5
7376
59
251,6
90
790
917
1,70
777
29
08
1,68
06
44
795
1,439
55–5
959
66
01
1,197
711
786
1,497
724
89
11,6
1574
98
85
1,635
734
877
1,611
60
–64
478
48
09
5854
556
71,1
126
5474
51,3
99
66
98
47
1,516
69
48
43
1,537
65–
69
338
332
670
418
438
856
48
152
11,0
01
580
68
61,2
66
595
782
1,377
70–7
419
721
74
1427
528
856
334
438
272
639
84
568
544
83
60
31,0
86
75-7
914
313
127
414
217
431
720
123
34
3425
431
156
529
737
26
69
80
+57
109
166
103
146
248
127
196
322
173
264
438
227
355
582
All
ages
16,0
08
16,0
3332
,04
117
,937
17,8
67
35,8
03
20,4
01
20,2
02
40
,60
323
,312
22,9
45
46
,258
26,6
1126
,023
52,6
34
Ave
rage
ann
ual 2
011
to 2
031
gro
wth
rate
2.4
8%

NSW Aboriginal Population and Households Projections, 2011–2031 • Page 62
NSW
Rem
ote
Ind
igen
ous
Po
pul
atio
n
30 J
un
e 20
1130
Ju
ne
2016
30 J
un
e 20
2130
Ju
ne
2026
30 J
un
e 20
31
Age
gro
ups
Mal
esFe
mal
esTo
tal
Mal
esFe
mal
esTo
tal
Mal
esFe
mal
esTo
tal
Mal
esFe
mal
esTo
tal
Mal
esFe
mal
esTo
tal
0–4
368
424
792
412
40
28
1450
24
88
99
159
057
11,1
61
659
636
1,29
4
5–9
40
34
09
812
373
429
80
24
384
278
65
550
532
1,08
26
586
331,2
92
10–1
438
536
875
339
94
06
80
637
04
2779
64
354
248
5854
552
81,0
73
15–1
933
433
36
67
381
365
746
396
40
379
936
64
2378
94
304
198
49
20–2
424
225
34
95
329
329
658
376
360
736
389
397
786
358
414
772
25–2
917
621
238
823
824
94
8732
332
46
47
368
353
721
380
388
768
30–3
417
818
536
317
220
938
123
224
64
7831
632
06
3636
034
870
8
35–3
917
523
44
09
173
182
355
168
206
374
227
242
46
930
931
56
24
40
–44
187
229
416
169
229
399
168
178
347
163
201
365
221
237
458
45–
49
201
206
40
717
922
34
02
163
224
386
162
173
335
157
196
353
50–5
416
317
233
519
019
938
917
021
638
615
521
637
115
416
732
1
55–5
915
712
528
215
116
331
417
718
936
615
920
636
414
520
635
1
60
–64
127
100
227
140
116
256
136
152
288
160
177
336
144
192
336
65–
69
8775
162
108
89
197
120
104
223
116
137
253
138
159
297
70–7
44
572
117
68
63
131
85
7516
09
58
818
39
311
620
9
75-7
926
2955
3156
86
47
49
96
5959
118
66
69
135
80
+30
2757
2533
5826
5278
3658
94
47
68
114
All
ages
3,28
43,
453
6,7
373,
538
3,74
27,
280
3,8
974
,119
8,0
164
,34
44
,575
8,9
204
,86
35,
09
29,
955
Ave
rage
ann
ual 2
011
to 2
031
gro
wth
rate
1.95%

NSW Aboriginal Population and Households Projections, 2011–2031 Page 63
NSW
Ver
y R
emo
te In
dig
eno
us P
op
ulat
ion
30 J
un
e 20
1130
Ju
ne
2016
30 J
un
e 20
2130
Ju
ne
2026
30 J
un
e 20
31
Age
gro
ups
Mal
esFe
mal
esTo
tal
Mal
esFe
mal
esTo
tal
Mal
esFe
mal
esTo
tal
Mal
esFe
mal
esTo
tal
Mal
esFe
mal
esTo
tal
0–4
185
192
377
214
209
423
253
247
500
293
285
579
325
315
64
0
5–9
179
215
394
189
197
386
229
224
454
279
272
551
331
321
651
10–1
417
016
033
017
721
439
118
719
538
322
722
34
5027
727
054
7
15–1
916
317
233
516
815
932
717
621
238
718
519
337
822
522
04
45
20–2
413
514
227
716
117
033
116
615
632
217
220
838
018
118
937
0
25–2
910
910
221
113
314
027
315
816
732
516
215
331
416
720
437
1
30–3
48
497
181
107
101
207
130
138
268
154
165
319
158
150
308
35–3
912
611
624
28
29
617
810
49
920
412
713
626
315
116
231
3
40
–44
113
136
249
122
114
236
80
94
173
102
9719
912
413
325
7
45–
49
114
111
225
109
133
241
118
111
229
779
116
89
89
419
2
50–5
49
29
919
110
810
721
510
312
923
211
210
822
073
88
161
55–5
98
275
157
85
94
180
101
103
203
96
123
220
105
103
208
60
–64
5372
125
7470
144
778
816
59
19
618
787
115
203
65–
69
40
3878
45
65
110
63
63
126
66
80
146
7987
165
70–7
417
274
432
326
436
559
150
5410
453
68
121
75-7
99
1928
1221
3322
264
825
44
69
354
278
80
+9
2332
924
3310
2636
1630
47
204
46
4
All
ages
1,68
01,7
96
3,4
761,8
261,9
45
3,77
12,
012
2,13
44
,146
2,23
62,
358
4,5
94
2,4
872,
60
55,
09
2
Ave
rage
ann
ual 2
011
to 2
031
gro
wth
rate
1.91%
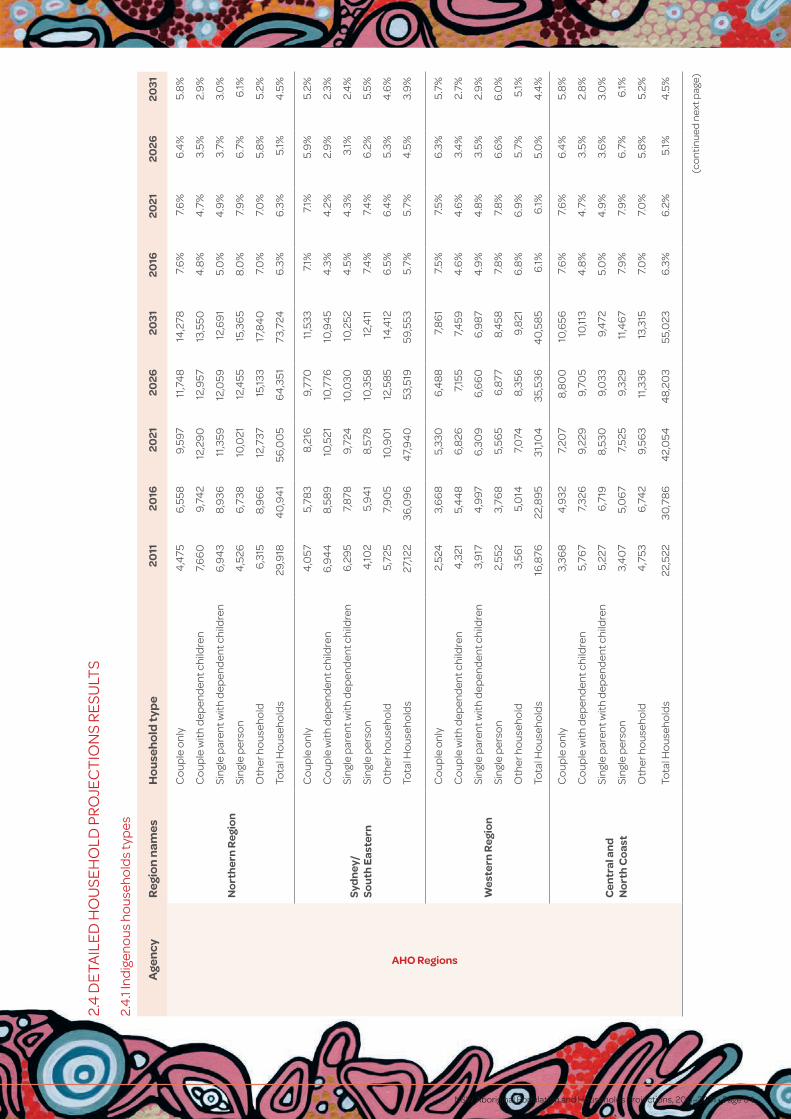
NSW Aboriginal Population and Households Projections, 2011–2031 • Page 64
2.4
DE
TAIL
ED
HO
USE
HO
LD P
RO
JEC
TIO
NS
RE
SULT
S
2.4
.1 In
dig
eno
us h
ous
eho
lds
typ
es
Age
ncy
Reg
ion
nam
esH
ou
seh
old
typ
e20
1120
1620
2120
2620
3120
1620
2120
2620
31
AHO Regions
No
rth
ern
Reg
ion
Co
uple
onl
y4
,475
6,5
589,
597
11,7
48
14,2
787.
6%
7.6
%6
.4%
5.8
%
Co
uple
with
dep
end
ent c
hild
ren
7,6
60
9,74
212
,29
012
,957
13,5
504
.8%
4.7
%3.
5%2.
9%
Sing
le p
aren
t with
dep
end
ent c
hild
ren
6,9
43
8,9
3611
,359
12,0
5912
,69
15.
0%
4.9
%3.
7%3.
0%
Sing
le p
erso
n4
,526
6,7
3810
,021
12,4
5515
,36
58.
0%
7.9
%6
.7%
6.1%
Oth
er h
ous
eho
ld6
,315
8,9
66
12,7
3715
,133
17,8
40
7.0
%7.
0%
5.8
%5.
2%
Tota
l Ho
useh
old
s29
,918
40
,94
156
,00
56
4,3
5173
,724
6.3
%6
.3%
5.1%
4.5
%
Syd
ney
/ So
uth
Eas
tern
Co
uple
onl
y4
,057
5,78
38,
216
9,77
011
,533
7.1%
7.1%
5.9
%5.
2%
Co
uple
with
dep
end
ent c
hild
ren
6,9
44
8,58
910
,521
10,7
7610
,94
54
.3%
4.2
%2.
9%
2.3%
Sing
le p
aren
t with
dep
end
ent c
hild
ren
6,2
95
7,87
89,
724
10,0
3010
,252
4.5
%4
.3%
3.1%
2.4
%
Sing
le p
erso
n4
,102
5,9
41
8,57
810
,358
12,4
117.
4%
7.4
%6
.2%
5.5%
Oth
er h
ous
eho
ld5,
725
7,9
05
10,9
01
12,5
85
14,4
126
.5%
6.4
%5.
3%4
.6%
Tota
l Ho
useh
old
s27
,122
36,0
96
47,
94
053
,519
59,5
535.
7%5.
7%4
.5%
3.9
%
Wes
tern
Reg
ion
Co
uple
onl
y2,
524
3,6
68
5,33
06
,48
87,
86
17.
5%7.
5%6
.3%
5.7%
Co
uple
with
dep
end
ent c
hild
ren
4,3
215,
44
86
,826
7,15
57,
459
4.6
%4
.6%
3.4
%2.
7%
Sing
le p
aren
t with
dep
end
ent c
hild
ren
3,9
174
,997
6,3
09
6,6
60
6,9
874
.9%
4.8
%3.
5%2.
9%
Sing
le p
erso
n2,
552
3,76
85,
565
6,8
778,
458
7.8
%7.
8%
6.6
%6
.0%
Oth
er h
ous
eho
ld3,
561
5,0
147,
074
8,35
69,
821
6.8
%6
.9%
5.7%
5.1%
Tota
l Ho
useh
old
s16
,876
22,8
95
31,10
435
,536
40
,58
56
.1%6
.1%5.
0%
4.4
%
Cen
tral
an
d
No
rth
Co
ast
Co
uple
onl
y3,
368
4,9
327,
207
8,8
00
10,6
567.
6%
7.6
%6
.4%
5.8
%
Co
uple
with
dep
end
ent c
hild
ren
5,76
77,
326
9,22
99,
705
10,11
34
.8%
4.7
%3.
5%2.
8%
Sing
le p
aren
t with
dep
end
ent c
hild
ren
5,22
76
,719
8,53
09,
033
9,4
725.
0%
4.9
%3.
6%
3.0
%
Sing
le p
erso
n3,
40
75,
06
77,
525
9,32
911
,46
77.
9%
7.9
%6
.7%
6.1%
Oth
er h
ous
eho
ld4
,753
6,7
42
9,56
311
,336
13,3
157.
0%
7.0
%5.
8%
5.2%
Tota
l Ho
useh
old
s22
,522
30,7
86
42,
054
48,
203
55,0
236
.3%
6.2
%5.
1%4
.5%
(co
ntin
ued
nex
t pag
e)
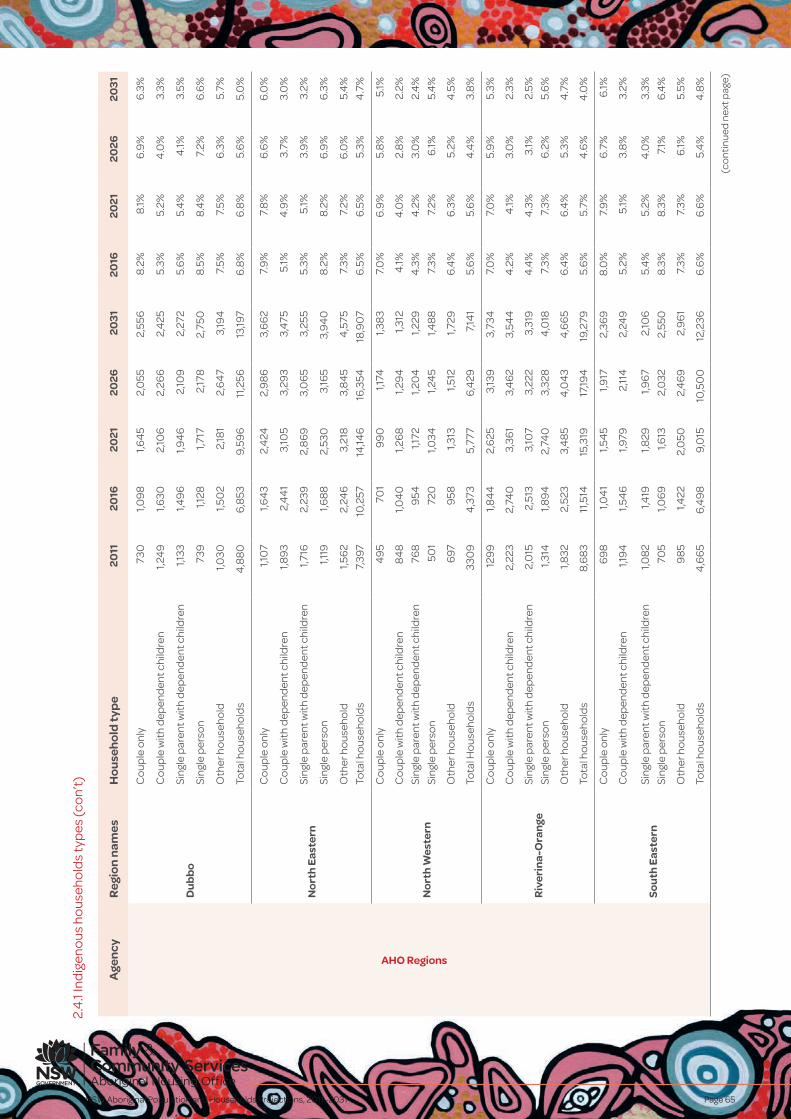
NSW Aboriginal Population and Households Projections, 2011–2031 Page 65
Age
ncy
Reg
ion
nam
esH
ou
seh
old
typ
e20
1120
1620
2120
2620
3120
1620
2120
2620
31
AHO Regions
Du
bb
o
Co
uple
onl
y73
01,0
98
1,64
52,
055
2,55
68.
2%8.
1%6
.9%
6.3
%
Co
uple
with
dep
end
ent c
hild
ren
1,24
91,6
302,
106
2,26
62,
425
5.3%
5.2%
4.0
%3.
3%
Sing
le p
aren
t with
dep
end
ent c
hild
ren
1,133
1,49
61,9
46
2,10
92,
272
5.6
%5.
4%
4.1%
3.5%
Sing
le p
erso
n73
91,1
281,7
172,
178
2,75
08.
5%8.
4%
7.2%
6.6
%
Oth
er h
ous
eho
ld1,0
301,5
02
2,18
12,
64
73,
194
7.5%
7.5%
6.3
%5.
7%
Tota
l ho
useh
old
s4
,88
06
,853
9,59
611
,256
13,19
76
.8%
6.8
%5.
6%
5.0
%
No
rth
Eas
tern
Co
uple
onl
y1,1
07
1,64
32,
424
2,9
86
3,6
62
7.9
%7.
8%
6.6
%6
.0%
Co
uple
with
dep
end
ent c
hild
ren
1,89
32,
44
13,
105
3,29
33,
475
5.1%
4.9
%3.
7%3.
0%
Sing
le p
aren
t with
dep
end
ent c
hild
ren
1,716
2,23
92,
86
93,
06
53,
255
5.3%
5.1%
3.9
%3.
2%
Sing
le p
erso
n1,1
191,6
88
2,53
03,
165
3,9
40
8.2%
8.2%
6.9
%6
.3%
Oth
er h
ous
eho
ld1,5
62
2,24
63,
218
3,8
45
4,5
757.
3%7.
2%6
.0%
5.4
%
Tota
l ho
useh
old
s7,
397
10,2
5714
,146
16,3
5418
,90
76
.5%
6.5
%5.
3%4
.7%
No
rth
Wes
tern
Co
uple
onl
y4
95
701
99
01,1
741,3
83
7.0
%6
.9%
5.8
%5.
1%
Co
uple
with
dep
end
ent c
hild
ren
84
81,0
40
1,26
81,2
94
1,312
4.1%
4.0
%2.
8%
2.2%
Sing
le p
aren
t with
dep
end
ent c
hild
ren
768
954
1,172
1,20
41,2
294
.3%
4.2
%3.
0%
2.4
%
Sing
le p
erso
n50
172
01,0
341,2
45
1,48
87.
3%7.
2%6
.1%5.
4%
Oth
er h
ous
eho
ld6
979
581,3
131,5
121,7
296
.4%
6.3
%5.
2%4
.5%
Tota
l Ho
useh
old
s33
09
4,3
735,
777
6,4
297,
141
5.6
%5.
6%
4.4
%3.
8%
Riv
erin
a-O
ran
ge
Co
uple
onl
y12
99
1,84
42,
625
3,13
93,
734
7.0
%7.
0%
5.9
%5.
3%
Co
uple
with
dep
end
ent c
hild
ren
2,22
32,
740
3,36
13,
46
23,
544
4.2
%4
.1%3.
0%
2.3%
Sing
le p
aren
t with
dep
end
ent c
hild
ren
2,0
152,
513
3,10
73,
222
3,31
94
.4%
4.3
%3.
1%2.
5%
Sing
le p
erso
n1,3
141,8
94
2,74
03,
328
4,0
187.
3%7.
3%6
.2%
5.6
%
Oth
er h
ous
eho
ld1,8
322,
523
3,4
85
4,0
43
4,6
65
6.4
%6
.4%
5.3%
4.7
%
Tota
l ho
useh
old
s8,
68
311
,514
15,3
1917
,194
19,2
795.
6%
5.7%
4.6
%4
.0%
Sou
th E
aste
rn
Co
uple
onl
y6
98
1,04
11,5
45
1,917
2,36
98.
0%
7.9
%6
.7%
6.1%
Co
uple
with
dep
end
ent c
hild
ren
1,19
41,5
46
1,979
2,11
42,
249
5.2%
5.1%
3.8
%3.
2%
Sing
le p
aren
t with
dep
end
ent c
hild
ren
1,08
21,4
191,8
291,9
67
2,10
65.
4%
5.2%
4.0
%3.
3%
Sing
le p
erso
n70
51,0
69
1,613
2,0
322,
550
8.3%
8.3%
7.1%
6.4
%
Oth
er h
ous
eho
ld9
85
1,422
2,0
502,
46
92,
96
17.
3%7.
3%6
.1%5.
5%
Tota
l ho
useh
old
s4
,66
56
,49
89,
015
10,5
00
12,2
366
.6%
6.6
%5.
4%
4.8
%
(co
ntin
ued
nex
t pag
e)
2.4
.1 In
dig
eno
us h
ous
eho
lds
typ
es (c
on’
t)
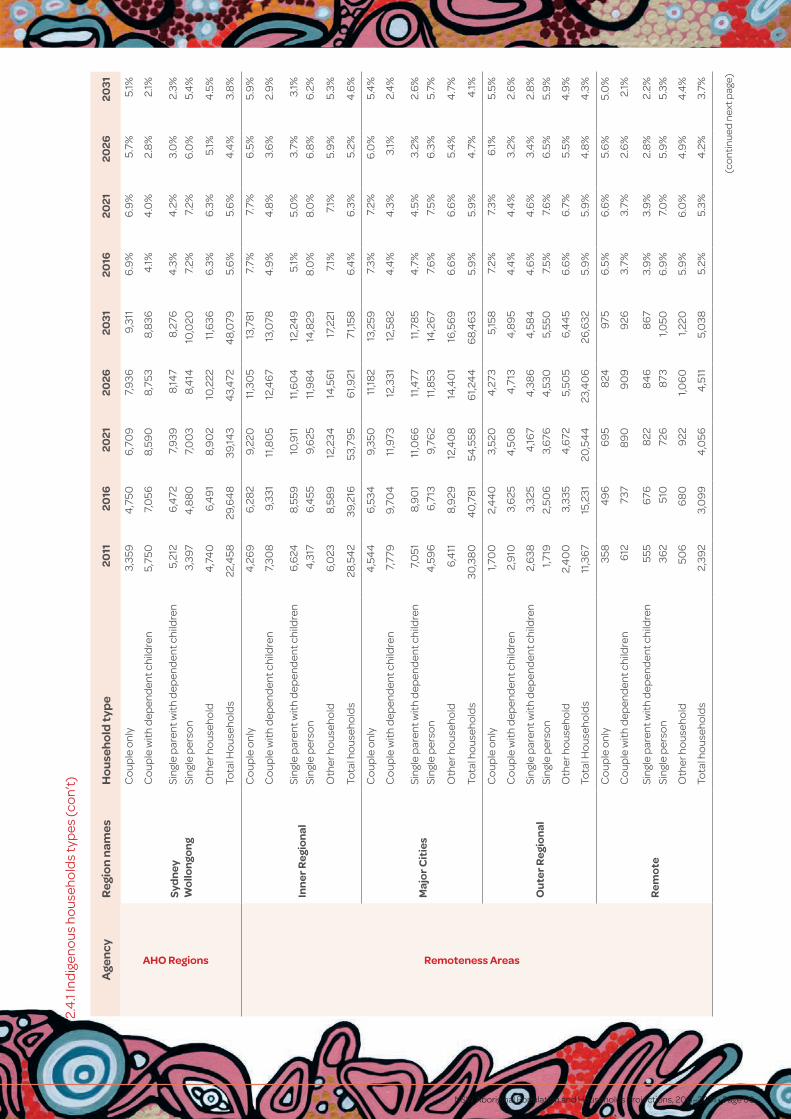
NSW Aboriginal Population and Households Projections, 2011–2031 • Page 66
Age
ncy
Reg
ion
nam
esH
ou
seh
old
typ
e20
1120
1620
2120
2620
3120
1620
2120
2620
31
AHO Regions
Du
bb
o
Co
uple
onl
y73
01,0
98
1,64
52,
055
2,55
68.
2%8.
1%6
.9%
6.3
%
Co
uple
with
dep
end
ent c
hild
ren
1,24
91,6
302,
106
2,26
62,
425
5.3%
5.2%
4.0
%3.
3%
Sing
le p
aren
t with
dep
end
ent c
hild
ren
1,133
1,49
61,9
46
2,10
92,
272
5.6
%5.
4%
4.1%
3.5%
Sing
le p
erso
n73
91,1
281,7
172,
178
2,75
08.
5%8.
4%
7.2%
6.6
%
Oth
er h
ous
eho
ld1,0
301,5
02
2,18
12,
64
73,
194
7.5%
7.5%
6.3
%5.
7%
Tota
l ho
useh
old
s4
,88
06
,853
9,59
611
,256
13,19
76
.8%
6.8
%5.
6%
5.0
%
No
rth
Eas
tern
Co
uple
onl
y1,1
07
1,64
32,
424
2,9
86
3,6
62
7.9
%7.
8%
6.6
%6
.0%
Co
uple
with
dep
end
ent c
hild
ren
1,89
32,
44
13,
105
3,29
33,
475
5.1%
4.9
%3.
7%3.
0%
Sing
le p
aren
t with
dep
end
ent c
hild
ren
1,716
2,23
92,
86
93,
06
53,
255
5.3%
5.1%
3.9
%3.
2%
Sing
le p
erso
n1,1
191,6
88
2,53
03,
165
3,9
40
8.2%
8.2%
6.9
%6
.3%
Oth
er h
ous
eho
ld1,5
62
2,24
63,
218
3,8
45
4,5
757.
3%7.
2%6
.0%
5.4
%
Tota
l ho
useh
old
s7,
397
10,2
5714
,146
16,3
5418
,90
76
.5%
6.5
%5.
3%4
.7%
No
rth
Wes
tern
Co
uple
onl
y4
95
701
99
01,1
741,3
83
7.0
%6
.9%
5.8
%5.
1%
Co
uple
with
dep
end
ent c
hild
ren
84
81,0
40
1,26
81,2
94
1,312
4.1%
4.0
%2.
8%
2.2%
Sing
le p
aren
t with
dep
end
ent c
hild
ren
768
954
1,172
1,20
41,2
294
.3%
4.2
%3.
0%
2.4
%
Sing
le p
erso
n50
172
01,0
341,2
45
1,48
87.
3%7.
2%6
.1%5.
4%
Oth
er h
ous
eho
ld6
979
581,3
131,5
121,7
296
.4%
6.3
%5.
2%4
.5%
Tota
l Ho
useh
old
s33
09
4,3
735,
777
6,4
297,
141
5.6
%5.
6%
4.4
%3.
8%
Riv
erin
a-O
ran
ge
Co
uple
onl
y12
99
1,84
42,
625
3,13
93,
734
7.0
%7.
0%
5.9
%5.
3%
Co
uple
with
dep
end
ent c
hild
ren
2,22
32,
740
3,36
13,
46
23,
544
4.2
%4
.1%3.
0%
2.3%
Sing
le p
aren
t with
dep
end
ent c
hild
ren
2,0
152,
513
3,10
73,
222
3,31
94
.4%
4.3
%3.
1%2.
5%
Sing
le p
erso
n1,3
141,8
94
2,74
03,
328
4,0
187.
3%7.
3%6
.2%
5.6
%
Oth
er h
ous
eho
ld1,8
322,
523
3,4
85
4,0
43
4,6
65
6.4
%6
.4%
5.3%
4.7
%
Tota
l ho
useh
old
s8,
68
311
,514
15,3
1917
,194
19,2
795.
6%
5.7%
4.6
%4
.0%
Sou
th E
aste
rn
Co
uple
onl
y6
98
1,04
11,5
45
1,917
2,36
98.
0%
7.9
%6
.7%
6.1%
Co
uple
with
dep
end
ent c
hild
ren
1,19
41,5
46
1,979
2,11
42,
249
5.2%
5.1%
3.8
%3.
2%
Sing
le p
aren
t with
dep
end
ent c
hild
ren
1,08
21,4
191,8
291,9
67
2,10
65.
4%
5.2%
4.0
%3.
3%
Sing
le p
erso
n70
51,0
69
1,613
2,0
322,
550
8.3%
8.3%
7.1%
6.4
%
Oth
er h
ous
eho
ld9
85
1,422
2,0
502,
46
92,
96
17.
3%7.
3%6
.1%5.
5%
Tota
l ho
useh
old
s4
,66
56
,49
89,
015
10,5
00
12,2
366
.6%
6.6
%5.
4%
4.8
%
Age
ncy
Reg
ion
nam
esH
ou
seh
old
typ
e20
1120
1620
2120
2620
3120
1620
2120
2620
31
AHO Regions
Syd
ney
W
ollo
ngo
ng
Co
uple
onl
y3,
359
4,7
506
,70
97,
936
9,31
16
.9%
6.9
%5.
7%5.
1%
Co
uple
with
dep
end
ent c
hild
ren
5,75
07,
056
8,59
08,
753
8,8
364
.1%4
.0%
2.8
%2.
1%
Sing
le p
aren
t with
dep
end
ent c
hild
ren
5,21
26
,472
7,9
398,
147
8,27
64
.3%
4.2
%3.
0%
2.3%
Sing
le p
erso
n3,
397
4,8
80
7,0
03
8,4
1410
,020
7.2%
7.2%
6.0
%5.
4%
Oth
er h
ous
eho
ld4
,74
06
,49
18,
90
210
,222
11,6
366
.3%
6.3
%5.
1%4
.5%
Tota
l Ho
useh
old
s22
,458
29,6
48
39,14
34
3,4
724
8,0
795.
6%
5.6
%4
.4%
3.8
%
Remoteness Areas
Inn
er R
egio
nal
Co
uple
onl
y4
,26
96
,28
29,
220
11,3
05
13,7
81
7.7%
7.7%
6.5
%5.
9%
Co
uple
with
dep
end
ent c
hild
ren
7,30
89,
331
11,8
05
12,4
67
13,0
784
.9%
4.8
%3.
6%
2.9
%
Sing
le p
aren
t with
dep
end
ent c
hild
ren
6,6
248,
559
10,9
1111
,60
412
,24
95.
1%5.
0%
3.7%
3.1%
Sing
le p
erso
n4
,317
6,4
559,
625
11,9
84
14,8
298.
0%
8.0
%6
.8%
6.2
%
Oth
er h
ous
eho
ld6
,023
8,58
912
,234
14,5
61
17,2
217.
1%7.
1%5.
9%
5.3%
Tota
l ho
useh
old
s28
,54
239
,216
53,7
95
61,9
2171
,158
6.4
%6
.3%
5.2%
4.6
%
Maj
or
Cit
ies
Co
uple
onl
y4
,54
46
,534
9,35
011
,182
13,2
597.
3%7.
2%6
.0%
5.4
%
Co
uple
with
dep
end
ent c
hild
ren
7,77
99,
704
11,9
7312
,331
12,5
82
4.4
%4
.3%
3.1%
2.4
%
Sing
le p
aren
t with
dep
end
ent c
hild
ren
7,0
518,
90
111
,06
611
,477
11,7
85
4.7
%4
.5%
3.2%
2.6
%
Sing
le p
erso
n4
,59
66
,713
9,76
211
,853
14,2
67
7.6
%7.
5%6
.3%
5.7%
Oth
er h
ous
eho
ld6
,411
8,9
2912
,40
814
,40
116
,56
96
.6%
6.6
%5.
4%
4.7
%
Tota
l ho
useh
old
s30
,38
04
0,7
81
54,5
586
1,24
46
8,4
63
5.9
%5.
9%
4.7
%4
.1%
Ou
ter
Reg
ion
al
Co
uple
onl
y1,7
00
2,4
40
3,52
04
,273
5,15
87.
2%7.
3%6
.1%5.
5%
Co
uple
with
dep
end
ent c
hild
ren
2,9
103,
625
4,5
08
4,7
134
,89
54
.4%
4.4
%3.
2%2.
6%
Sing
le p
aren
t with
dep
end
ent c
hild
ren
2,6
383,
325
4,16
74
,38
64
,58
44
.6%
4.6
%3.
4%
2.8
%
Sing
le p
erso
n1,7
192,
506
3,6
764
,530
5,55
07.
5%7.
6%
6.5
%5.
9%
Oth
er h
ous
eho
ld2,
40
03,
335
4,6
725,
505
6,4
45
6.6
%6
.7%
5.5%
4.9
%
Tota
l Ho
useh
old
s11
,36
715
,231
20,5
44
23,4
06
26,6
325.
9%
5.9
%4
.8%
4.3
%
Rem
ote
Co
uple
onl
y35
84
96
69
58
2497
56
.5%
6.6
%5.
6%
5.0
%
Co
uple
with
dep
end
ent c
hild
ren
612
737
89
09
09
926
3.7%
3.7%
2.6
%2.
1%
Sing
le p
aren
t with
dep
end
ent c
hild
ren
555
676
822
84
68
67
3.9
%3.
9%
2.8
%2.
2%
Sing
le p
erso
n36
251
072
687
31,0
506
.9%
7.0
%5.
9%
5.3%
Oth
er h
ous
eho
ld50
66
80
922
1,06
01,2
205.
9%
6.0
%4
.9%
4.4
%
Tota
l ho
useh
old
s2,
392
3,0
99
4,0
564
,511
5,0
385.
2%5.
3%4
.2%
3.7%
(co
ntin
ued
nex
t pag
e)
2.4
.1 In
dig
eno
us h
ous
eho
lds
typ
es (c
on’
t)
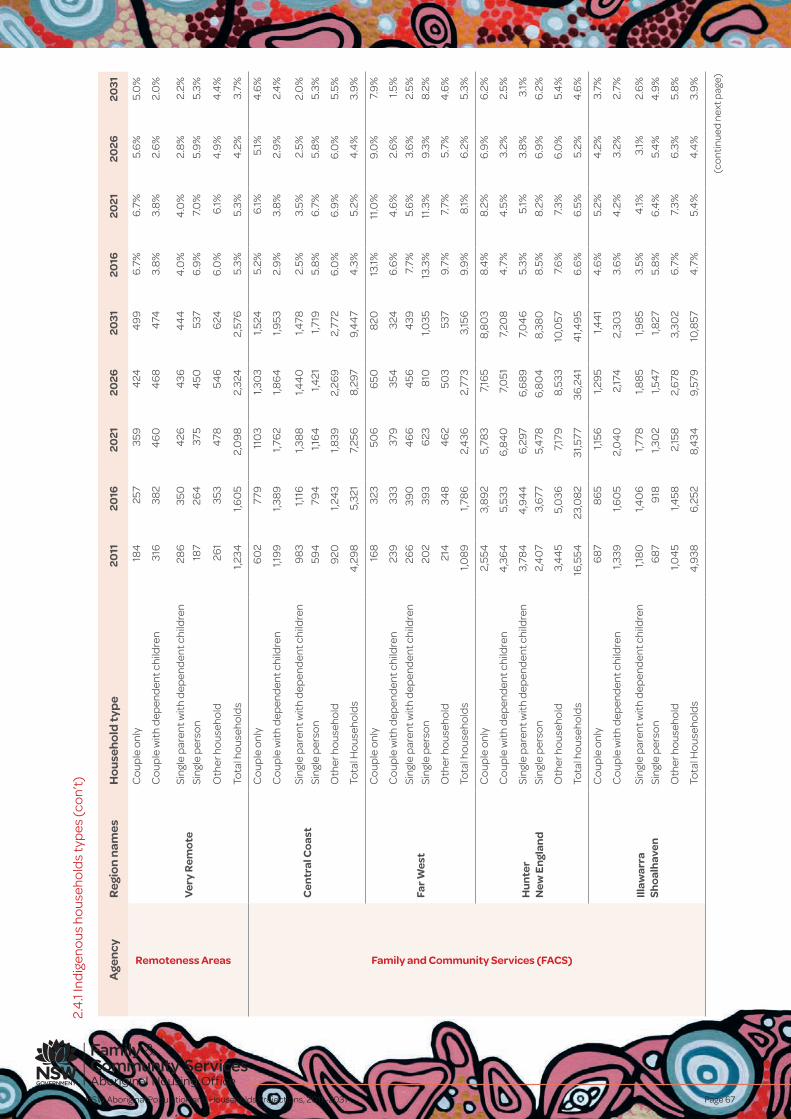
NSW Aboriginal Population and Households Projections, 2011–2031 Page 67
2.4
.1 In
dig
eno
us h
ous
eho
lds
typ
es (c
on’
t)
Age
ncy
Reg
ion
nam
esH
ou
seh
old
typ
e20
1120
1620
2120
2620
3120
1620
2120
2620
31
Remoteness Areas
Ver
y R
emot
e
Co
uple
onl
y18
425
735
94
244
99
6.7
%6
.7%
5.6
%5.
0%
Co
uple
with
dep
end
ent c
hild
ren
316
382
46
04
68
474
3.8
%3.
8%
2.6
%2.
0%
Sing
le p
aren
t with
dep
end
ent c
hild
ren
286
350
426
436
44
44
.0%
4.0
%2.
8%
2.2%
Sing
le p
erso
n18
726
437
54
5053
76
.9%
7.0
%5.
9%
5.3%
Oth
er h
ous
eho
ld26
135
34
7854
66
246
.0%
6.1%
4.9
%4
.4%
Tota
l ho
useh
old
s1,2
341,6
05
2,0
98
2,32
42,
576
5.3%
5.3%
4.2
%3.
7%
Family and Community Services (FACS)
Cen
tral
Co
ast
Co
uple
onl
y6
02
779
110
31,3
03
1,524
5.2%
6.1%
5.1%
4.6
%
Co
uple
with
dep
end
ent c
hild
ren
1,19
91,3
89
1,76
21,8
64
1,953
2.9
%3.
8%
2.9
%2.
4%
Sing
le p
aren
t with
dep
end
ent c
hild
ren
98
31,1
161,3
88
1,44
01,4
782.
5%3.
5%2.
5%2.
0%
Sing
le p
erso
n59
479
41,1
64
1,421
1,719
5.8
%6
.7%
5.8
%5.
3%
Oth
er h
ous
eho
ld9
201,2
43
1,839
2,26
92,
772
6.0
%6
.9%
6.0
%5.
5%
Tota
l Ho
useh
old
s4
,29
85,
321
7,25
68,
297
9,4
47
4.3
%5.
2%4
.4%
3.9
%
Far
Wes
t
Co
uple
onl
y16
832
350
66
508
2013
.1%11
.0%
9.0
%7.
9%
Co
uple
with
dep
end
ent c
hild
ren
239
333
379
354
324
6.6
%4
.6%
2.6
%1.5
%
Sing
le p
aren
t with
dep
end
ent c
hild
ren
266
390
46
64
564
397.
7%5.
6%
3.6
%2.
5%
Sing
le p
erso
n20
239
36
238
101,0
3513
.3%
11.3
%9.
3%8.
2%
Oth
er h
ous
eho
ld21
434
84
62
503
537
9.7%
7.7%
5.7%
4.6
%
Tota
l ho
useh
old
s1,0
89
1,78
62,
436
2,77
33,
156
9.9
%8.
1%6
.2%
5.3%
Hu
nter
N
ew E
ngl
and
Co
uple
onl
y2,
554
3,8
92
5,78
37,
165
8,8
03
8.4
%8.
2%6
.9%
6.2
%
Co
uple
with
dep
end
ent c
hild
ren
4,3
64
5,53
36
,84
07,
051
7,20
84
.7%
4.5
%3.
2%2.
5%
Sing
le p
aren
t with
dep
end
ent c
hild
ren
3,78
44
,94
46
,297
6,6
89
7,0
46
5.3%
5.1%
3.8
%3.
1%
Sing
le p
erso
n2,
40
73,
677
5,4
786
,80
48,
380
8.5%
8.2%
6.9
%6
.2%
Oth
er h
ous
eho
ld3,
44
55,
036
7,17
98,
533
10,0
577.
6%
7.3%
6.0
%5.
4%
Tota
l ho
useh
old
s16
,554
23,0
82
31,5
7736
,24
14
1,49
56
.6%
6.5
%5.
2%4
.6%
Illaw
arra
Sh
oal
hav
en
Co
uple
onl
y6
878
65
1,156
1,29
51,4
41
4.6
%5.
2%4
.2%
3.7%
Co
uple
with
dep
end
ent c
hild
ren
1,339
1,60
52,
04
02,
174
2,30
33.
6%
4.2
%3.
2%2.
7%
Sing
le p
aren
t with
dep
end
ent c
hild
ren
1,18
01,4
06
1,778
1,88
51,9
85
3.5%
4.1%
3.1%
2.6
%
Sing
le p
erso
n6
879
181,3
02
1,54
71,8
275.
8%
6.4
%5.
4%
4.9
%
Oth
er h
ous
eho
ld1,0
45
1,458
2,15
82,
678
3,30
26
.7%
7.3%
6.3
%5.
8%
Tota
l Ho
useh
old
s4
,938
6,2
528,
434
9,57
910
,857
4.7
%5.
4%
4.4
%3.
9%
(co
ntin
ued
nex
t pag
e)
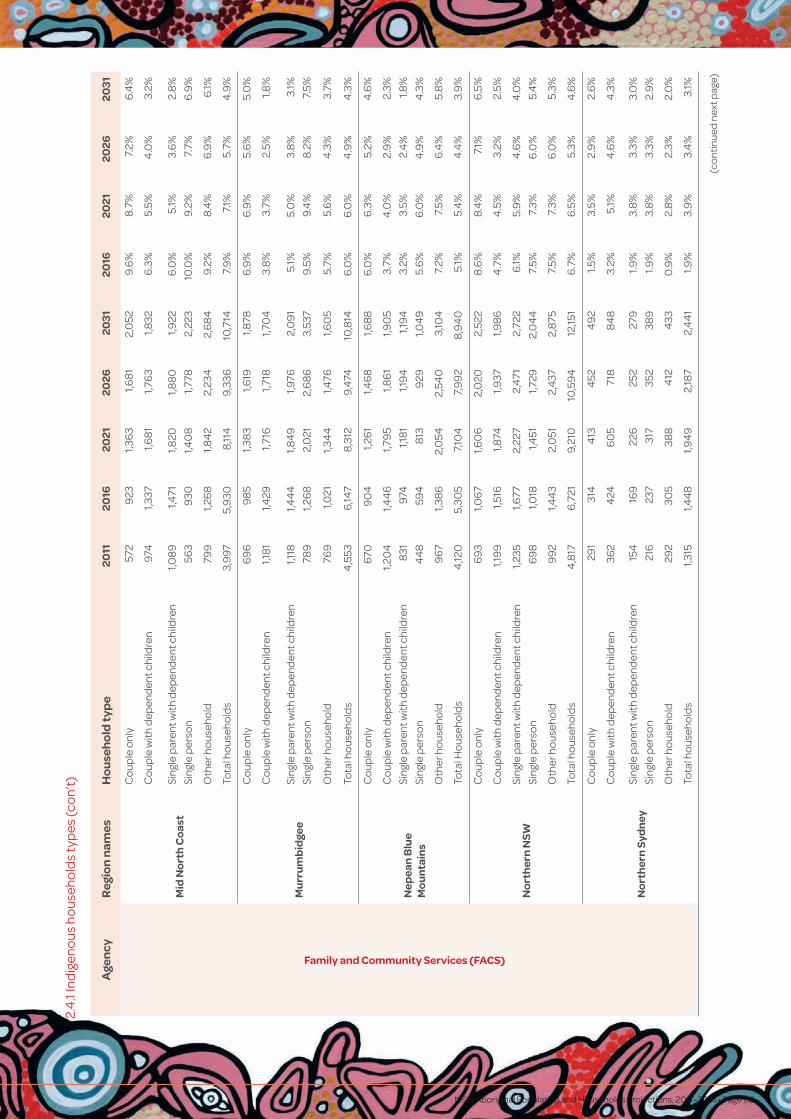
NSW Aboriginal Population and Households Projections, 2011–2031 • Page 68
(co
ntin
ued
nex
t pag
e)
Age
ncy
Reg
ion
nam
esH
ou
seh
old
typ
e20
1120
1620
2120
2620
3120
1620
2120
2620
31
Remoteness Areas
Ver
y R
emot
e
Co
uple
onl
y18
425
735
94
244
99
6.7
%6
.7%
5.6
%5.
0%
Co
uple
with
dep
end
ent c
hild
ren
316
382
46
04
68
474
3.8
%3.
8%
2.6
%2.
0%
Sing
le p
aren
t with
dep
end
ent c
hild
ren
286
350
426
436
44
44
.0%
4.0
%2.
8%
2.2%
Sing
le p
erso
n18
726
437
54
5053
76
.9%
7.0
%5.
9%
5.3%
Oth
er h
ous
eho
ld26
135
34
7854
66
246
.0%
6.1%
4.9
%4
.4%
Tota
l ho
useh
old
s1,2
341,6
05
2,0
98
2,32
42,
576
5.3%
5.3%
4.2
%3.
7%
Family and Community Services (FACS)
Cen
tral
Co
ast
Co
uple
onl
y6
02
779
110
31,3
03
1,524
5.2%
6.1%
5.1%
4.6
%
Co
uple
with
dep
end
ent c
hild
ren
1,19
91,3
89
1,76
21,8
64
1,953
2.9
%3.
8%
2.9
%2.
4%
Sing
le p
aren
t with
dep
end
ent c
hild
ren
98
31,1
161,3
88
1,44
01,4
782.
5%3.
5%2.
5%2.
0%
Sing
le p
erso
n59
479
41,1
64
1,421
1,719
5.8
%6
.7%
5.8
%5.
3%
Oth
er h
ous
eho
ld9
201,2
43
1,839
2,26
92,
772
6.0
%6
.9%
6.0
%5.
5%
Tota
l Ho
useh
old
s4
,29
85,
321
7,25
68,
297
9,4
47
4.3
%5.
2%4
.4%
3.9
%
Far
Wes
t
Co
uple
onl
y16
832
350
66
508
2013
.1%11
.0%
9.0
%7.
9%
Co
uple
with
dep
end
ent c
hild
ren
239
333
379
354
324
6.6
%4
.6%
2.6
%1.5
%
Sing
le p
aren
t with
dep
end
ent c
hild
ren
266
390
46
64
564
397.
7%5.
6%
3.6
%2.
5%
Sing
le p
erso
n20
239
36
238
101,0
3513
.3%
11.3
%9.
3%8.
2%
Oth
er h
ous
eho
ld21
434
84
62
503
537
9.7%
7.7%
5.7%
4.6
%
Tota
l ho
useh
old
s1,0
89
1,78
62,
436
2,77
33,
156
9.9
%8.
1%6
.2%
5.3%
Hu
nter
N
ew E
ngl
and
Co
uple
onl
y2,
554
3,8
92
5,78
37,
165
8,8
03
8.4
%8.
2%6
.9%
6.2
%
Co
uple
with
dep
end
ent c
hild
ren
4,3
64
5,53
36
,84
07,
051
7,20
84
.7%
4.5
%3.
2%2.
5%
Sing
le p
aren
t with
dep
end
ent c
hild
ren
3,78
44
,94
46
,297
6,6
89
7,0
46
5.3%
5.1%
3.8
%3.
1%
Sing
le p
erso
n2,
40
73,
677
5,4
786
,80
48,
380
8.5%
8.2%
6.9
%6
.2%
Oth
er h
ous
eho
ld3,
44
55,
036
7,17
98,
533
10,0
577.
6%
7.3%
6.0
%5.
4%
Tota
l ho
useh
old
s16
,554
23,0
82
31,5
7736
,24
14
1,49
56
.6%
6.5
%5.
2%4
.6%
Illaw
arra
Sh
oal
hav
en
Co
uple
onl
y6
878
65
1,156
1,29
51,4
41
4.6
%5.
2%4
.2%
3.7%
Co
uple
with
dep
end
ent c
hild
ren
1,339
1,60
52,
04
02,
174
2,30
33.
6%
4.2
%3.
2%2.
7%
Sing
le p
aren
t with
dep
end
ent c
hild
ren
1,18
01,4
06
1,778
1,88
51,9
85
3.5%
4.1%
3.1%
2.6
%
Sing
le p
erso
n6
879
181,3
02
1,54
71,8
275.
8%
6.4
%5.
4%
4.9
%
Oth
er h
ous
eho
ld1,0
45
1,458
2,15
82,
678
3,30
26
.7%
7.3%
6.3
%5.
8%
Tota
l Ho
useh
old
s4
,938
6,2
528,
434
9,57
910
,857
4.7
%5.
4%
4.4
%3.
9%
Age
ncy
Reg
ion
nam
esH
ou
seh
old
typ
e20
1120
1620
2120
2620
3120
1620
2120
2620
31
Family and Community Services (FACS)
Mid
No
rth
Co
ast
Co
uple
onl
y57
29
231,3
63
1,68
12,
052
9.6
%8.
7%7.
2%6
.4%
Co
uple
with
dep
end
ent c
hild
ren
974
1,337
1,68
11,7
63
1,832
6.3
%5.
5%4
.0%
3.2%
Sing
le p
aren
t with
dep
end
ent c
hild
ren
1,08
91,4
711,8
201,8
80
1,922
6.0
%5.
1%3.
6%
2.8
%
Sing
le p
erso
n56
39
301,4
08
1,778
2,22
310
.0%
9.2%
7.7%
6.9
%
Oth
er h
ous
eho
ld79
91,2
68
1,84
22,
234
2,6
84
9.2%
8.4
%6
.9%
6.1%
Tota
l ho
useh
old
s3,
997
5,9
308,
114
9,33
610
,714
7.9
%7.
1%5.
7%4
.9%
Mu
rru
mb
idge
e
Co
uple
onl
y6
96
98
51,3
83
1,619
1,878
6.9
%6
.9%
5.6
%5.
0%
Co
uple
with
dep
end
ent c
hild
ren
1,18
11,4
291,7
161,7
181,7
04
3.8
%3.
7%2.
5%1.8
%
Sing
le p
aren
t with
dep
end
ent c
hild
ren
1,118
1,44
41,8
49
1,976
2,0
91
5.1%
5.0
%3.
8%
3.1%
Sing
le p
erso
n78
91,2
68
2,0
212,
68
63,
537
9.5%
9.4
%8.
2%7.
5%
Oth
er h
ous
eho
ld76
91,0
211,3
44
1,476
1,60
55.
7%5.
6%
4.3
%3.
7%
Tota
l ho
useh
old
s4
,553
6,14
78,
312
9,4
7410
,814
6.0
%6
.0%
4.9
%4
.3%
Nep
ean
Blu
e M
ou
ntai
ns
Co
uple
onl
y6
709
04
1,26
11,4
68
1,68
86
.0%
6.3
%5.
2%4
.6%
Co
uple
with
dep
end
ent c
hild
ren
1,20
41,4
46
1,79
51,8
61
1,90
53.
7%4
.0%
2.9
%2.
3%
Sing
le p
aren
t with
dep
end
ent c
hild
ren
831
974
1,18
11,1
94
1,19
43.
2%3.
5%2.
4%
1.8%
Sing
le p
erso
n4
48
594
813
929
1,04
95.
6%
6.0
%4
.9%
4.3
%
Oth
er h
ous
eho
ld9
67
1,38
62,
054
2,54
03,
104
7.2%
7.5%
6.4
%5.
8%
Tota
l Ho
useh
old
s4
,120
5,30
57,
104
7,9
92
8,9
40
5.1%
5.4
%4
.4%
3.9
%
No
rth
ern
NSW
Co
uple
onl
y6
93
1,06
71,6
06
2,0
202,
522
8.6
%8.
4%
7.1%
6.5
%
Co
uple
with
dep
end
ent c
hild
ren
1,19
91,5
161,8
741,9
371,9
86
4.7
%4
.5%
3.2%
2.5%
Sing
le p
aren
t with
dep
end
ent c
hild
ren
1,235
1,677
2,22
72,
471
2,72
26
.1%5.
9%
4.6
%4
.0%
Sing
le p
erso
n6
98
1,018
1,451
1,729
2,0
44
7.5%
7.3%
6.0
%5.
4%
Oth
er h
ous
eho
ld9
92
1,44
32,
051
2,4
372,
875
7.5%
7.3%
6.0
%5.
3%
Tota
l ho
useh
old
s4
,817
6,7
219,
210
10,5
94
12,15
16
.7%
6.5
%5.
3%4
.6%
No
rth
ern
Syd
ney
Co
uple
onl
y29
131
44
134
524
92
1.5%
3.5%
2.9
%2.
6%
Co
uple
with
dep
end
ent c
hild
ren
362
424
60
571
88
48
3.2%
5.1%
4.6
%4
.3%
Sing
le p
aren
t with
dep
end
ent c
hild
ren
154
169
226
252
279
1.9%
3.8
%3.
3%3.
0%
Sing
le p
erso
n21
623
731
735
238
91.9
%3.
8%
3.3%
2.9
%
Oth
er h
ous
eho
ld29
230
538
84
124
330
.9%
2.8
%2.
3%2.
0%
Tota
l ho
useh
old
s1,3
151,4
48
1,94
92,
187
2,4
41
1.9%
3.9
%3.
4%
3.1%
2.4
.1 In
dig
eno
us h
ous
eho
lds
typ
es (c
on’
t)
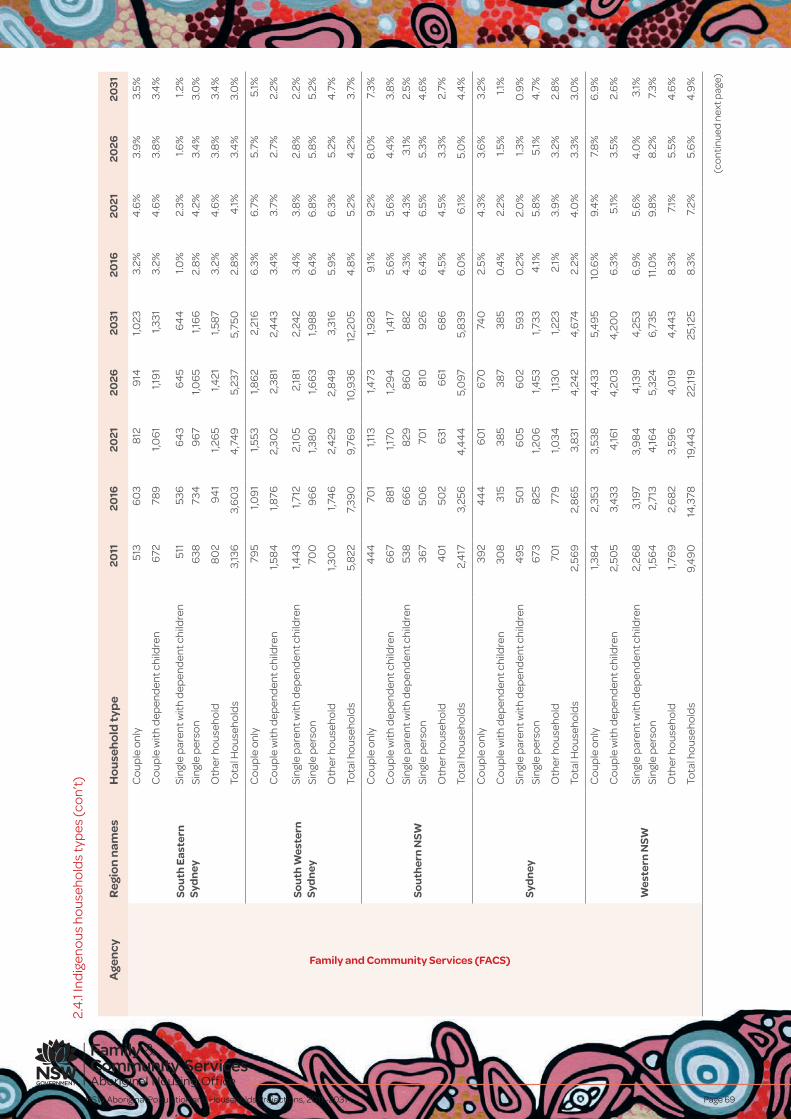
NSW Aboriginal Population and Households Projections, 2011–2031 Page 69
2.4
.1 In
dig
eno
us h
ous
eho
lds
typ
es (c
on’
t)
Age
ncy
Reg
ion
nam
esH
ou
seh
old
typ
e20
1120
1620
2120
2620
3120
1620
2120
2620
31
Family and Community Services (FACS)
Sou
th E
aste
rn
Syd
ney
Co
uple
onl
y51
36
03
812
914
1,023
3.2%
4.6
%3.
9%
3.5%
Co
uple
with
dep
end
ent c
hild
ren
672
789
1,06
11,1
91
1,331
3.2%
4.6
%3.
8%
3.4
%
Sing
le p
aren
t with
dep
end
ent c
hild
ren
511
536
64
36
45
64
41.0
%2.
3%1.6
%1.2
%
Sing
le p
erso
n6
3873
49
67
1,06
51,1
66
2.8
%4
.2%
3.4
%3.
0%
Oth
er h
ous
eho
ld8
02
94
11,2
65
1,421
1,587
3.2%
4.6
%3.
8%
3.4
%
Tota
l Ho
useh
old
s3,
136
3,6
03
4,7
49
5,23
75,
750
2.8
%4
.1%3.
4%
3.0
%
Sou
th W
este
rn
Syd
ney
Co
uple
onl
y79
51,0
91
1,553
1,86
22,
216
6.3
%6
.7%
5.7%
5.1%
Co
uple
with
dep
end
ent c
hild
ren
1,58
41,8
762,
302
2,38
12,
44
33.
4%
3.7%
2.7%
2.2%
Sing
le p
aren
t with
dep
end
ent c
hild
ren
1,44
31,7
122,
105
2,18
12,
242
3.4
%3.
8%
2.8
%2.
2%
Sing
le p
erso
n70
09
66
1,38
01,6
63
1,98
86
.4%
6.8
%5.
8%
5.2%
Oth
er h
ous
eho
ld1,3
00
1,74
62,
429
2,8
49
3,31
65.
9%
6.3
%5.
2%4
.7%
Tota
l ho
useh
old
s5,
822
7,39
09,
769
10,9
3612
,20
54
.8%
5.2%
4.2
%3.
7%
Sou
ther
n N
SW
Co
uple
onl
y4
44
701
1,113
1,473
1,928
9.1%
9.2%
8.0
%7.
3%
Co
uple
with
dep
end
ent c
hild
ren
66
78
81
1,170
1,29
41,4
175.
6%
5.6
%4
.4%
3.8
%
Sing
le p
aren
t with
dep
end
ent c
hild
ren
538
66
68
298
60
88
24
.3%
4.3
%3.
1%2.
5%
Sing
le p
erso
n36
750
670
18
109
266
.4%
6.5
%5.
3%4
.6%
Oth
er h
ous
eho
ld4
01
502
631
66
16
86
4.5
%4
.5%
3.3%
2.7%
Tota
l ho
useh
old
s2,
417
3,25
64
,44
45,
097
5,8
396
.0%
6.1%
5.0
%4
.4%
Syd
ney
Co
uple
onl
y39
24
44
60
16
7074
02.
5%4
.3%
3.6
%3.
2%
Co
uple
with
dep
end
ent c
hild
ren
308
315
385
387
385
0.4
%2.
2%1.5
%1.1
%
Sing
le p
aren
t with
dep
end
ent c
hild
ren
49
550
16
05
60
259
30
.2%
2.0
%1.3
%0
.9%
Sing
le p
erso
n6
738
251,2
06
1,453
1,733
4.1%
5.8
%5.
1%4
.7%
Oth
er h
ous
eho
ld70
177
91,0
341,1
301,2
232.
1%3.
9%
3.2%
2.8
%
Tota
l Ho
useh
old
s2,
569
2,8
65
3,8
314
,24
24
,674
2.2%
4.0
%3.
3%3.
0%
Wes
tern
NSW
Co
uple
onl
y1,3
84
2,35
33,
538
4,4
335,
49
510
.6%
9.4
%7.
8%
6.9
%
Co
uple
with
dep
end
ent c
hild
ren
2,50
53,
433
4,16
14
,20
34
,20
06
.3%
5.1%
3.5%
2.6
%
Sing
le p
aren
t with
dep
end
ent c
hild
ren
2,26
83,
197
3,9
84
4,13
94
,253
6.9
%5.
6%
4.0
%3.
1%
Sing
le p
erso
n1,5
64
2,71
34
,164
5,32
46
,735
11.0
%9.
8%
8.2%
7.3%
Oth
er h
ous
eho
ld1,7
69
2,6
82
3,59
64
,019
4,4
43
8.3%
7.1%
5.5%
4.6
%
Tota
l ho
useh
old
s9,
49
014
,378
19,4
43
22,11
925
,125
8.3%
7.2%
5.6
%4
.9%
(co
ntin
ued
nex
t pag
e)
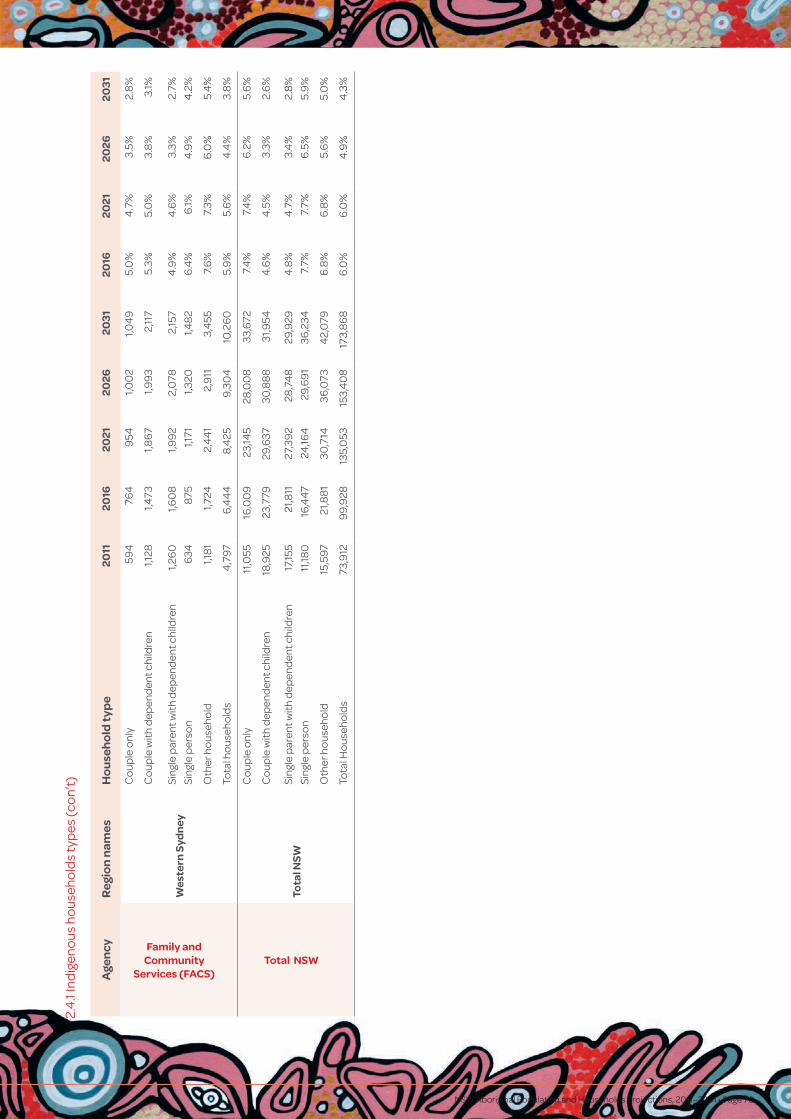
NSW Aboriginal Population and Households Projections, 2011–2031 • Page 70
Age
ncy
Reg
ion
nam
esH
ou
seh
old
typ
e20
1120
1620
2120
2620
3120
1620
2120
2620
31
Family and Community Services (FACS)
Sou
th E
aste
rn
Syd
ney
Co
uple
onl
y51
36
03
812
914
1,023
3.2%
4.6
%3.
9%
3.5%
Co
uple
with
dep
end
ent c
hild
ren
672
789
1,06
11,1
91
1,331
3.2%
4.6
%3.
8%
3.4
%
Sing
le p
aren
t with
dep
end
ent c
hild
ren
511
536
64
36
45
64
41.0
%2.
3%1.6
%1.2
%
Sing
le p
erso
n6
3873
49
67
1,06
51,1
66
2.8
%4
.2%
3.4
%3.
0%
Oth
er h
ous
eho
ld8
02
94
11,2
65
1,421
1,587
3.2%
4.6
%3.
8%
3.4
%
Tota
l Ho
useh
old
s3,
136
3,6
03
4,7
49
5,23
75,
750
2.8
%4
.1%3.
4%
3.0
%
Sou
th W
este
rn
Syd
ney
Co
uple
onl
y79
51,0
91
1,553
1,86
22,
216
6.3
%6
.7%
5.7%
5.1%
Co
uple
with
dep
end
ent c
hild
ren
1,58
41,8
762,
302
2,38
12,
44
33.
4%
3.7%
2.7%
2.2%
Sing
le p
aren
t with
dep
end
ent c
hild
ren
1,44
31,7
122,
105
2,18
12,
242
3.4
%3.
8%
2.8
%2.
2%
Sing
le p
erso
n70
09
66
1,38
01,6
63
1,98
86
.4%
6.8
%5.
8%
5.2%
Oth
er h
ous
eho
ld1,3
00
1,74
62,
429
2,8
49
3,31
65.
9%
6.3
%5.
2%4
.7%
Tota
l ho
useh
old
s5,
822
7,39
09,
769
10,9
3612
,20
54
.8%
5.2%
4.2
%3.
7%
Sou
ther
n N
SW
Co
uple
onl
y4
44
701
1,113
1,473
1,928
9.1%
9.2%
8.0
%7.
3%
Co
uple
with
dep
end
ent c
hild
ren
66
78
81
1,170
1,29
41,4
175.
6%
5.6
%4
.4%
3.8
%
Sing
le p
aren
t with
dep
end
ent c
hild
ren
538
66
68
298
60
88
24
.3%
4.3
%3.
1%2.
5%
Sing
le p
erso
n36
750
670
18
109
266
.4%
6.5
%5.
3%4
.6%
Oth
er h
ous
eho
ld4
01
502
631
66
16
86
4.5
%4
.5%
3.3%
2.7%
Tota
l ho
useh
old
s2,
417
3,25
64
,44
45,
097
5,8
396
.0%
6.1%
5.0
%4
.4%
Syd
ney
Co
uple
onl
y39
24
44
60
16
7074
02.
5%4
.3%
3.6
%3.
2%
Co
uple
with
dep
end
ent c
hild
ren
308
315
385
387
385
0.4
%2.
2%1.5
%1.1
%
Sing
le p
aren
t with
dep
end
ent c
hild
ren
49
550
16
05
60
259
30
.2%
2.0
%1.3
%0
.9%
Sing
le p
erso
n6
738
251,2
06
1,453
1,733
4.1%
5.8
%5.
1%4
.7%
Oth
er h
ous
eho
ld70
177
91,0
341,1
301,2
232.
1%3.
9%
3.2%
2.8
%
Tota
l Ho
useh
old
s2,
569
2,8
65
3,8
314
,24
24
,674
2.2%
4.0
%3.
3%3.
0%
Wes
tern
NSW
Co
uple
onl
y1,3
84
2,35
33,
538
4,4
335,
49
510
.6%
9.4
%7.
8%
6.9
%
Co
uple
with
dep
end
ent c
hild
ren
2,50
53,
433
4,16
14
,20
34
,20
06
.3%
5.1%
3.5%
2.6
%
Sing
le p
aren
t with
dep
end
ent c
hild
ren
2,26
83,
197
3,9
84
4,13
94
,253
6.9
%5.
6%
4.0
%3.
1%
Sing
le p
erso
n1,5
64
2,71
34
,164
5,32
46
,735
11.0
%9.
8%
8.2%
7.3%
Oth
er h
ous
eho
ld1,7
69
2,6
82
3,59
64
,019
4,4
43
8.3%
7.1%
5.5%
4.6
%
Tota
l ho
useh
old
s9,
49
014
,378
19,4
43
22,11
925
,125
8.3%
7.2%
5.6
%4
.9%
Age
ncy
Reg
ion
nam
esH
ou
seh
old
typ
e20
1120
1620
2120
2620
3120
1620
2120
2620
31
Family and Community
Services (FACS)
Wes
tern
Syd
ney
Co
uple
onl
y59
476
49
541,0
02
1,04
95.
0%
4.7
%3.
5%2.
8%
Co
uple
with
dep
end
ent c
hild
ren
1,128
1,473
1,86
71,9
93
2,11
75.
3%5.
0%
3.8
%3.
1%
Sing
le p
aren
t with
dep
end
ent c
hild
ren
1,26
01,6
08
1,99
22,
078
2,15
74
.9%
4.6
%3.
3%2.
7%
Sing
le p
erso
n6
3487
51,1
711,3
201,4
82
6.4
%6
.1%4
.9%
4.2
%
Oth
er h
ous
eho
ld1,1
81
1,724
2,4
41
2,9
113,
455
7.6
%7.
3%6
.0%
5.4
%
Tota
l ho
useh
old
s4
,797
6,4
44
8,4
259,
304
10,2
60
5.9
%5.
6%
4.4
%3.
8%
Total NSW
Tota
l NSW
Co
uple
onl
y11
,055
16,0
09
23,14
528
,00
833
,672
7.4
%7.
4%
6.2
%5.
6%
Co
uple
with
dep
end
ent c
hild
ren
18,9
2523
,779
29,6
3730
,88
831
,954
4.6
%4
.5%
3.3%
2.6
%
Sing
le p
aren
t with
dep
end
ent c
hild
ren
17,15
521
,811
27,3
92
28,7
48
29,9
294
.8%
4.7
%3.
4%
2.8
%
Sing
le p
erso
n11
,180
16,4
47
24,16
429
,69
136
,234
7.7%
7.7%
6.5
%5.
9%
Oth
er h
ous
eho
ld15
,597
21,8
81
30,7
1436
,073
42,
079
6.8
%6
.8%
5.6
%5.
0%
Tota
l Ho
useh
old
s73
,912
99,
928
135,
053
153,
40
817
3,8
68
6.0
%6
.0%
4.9
%4
.3%
2.4
.1 In
dig
eno
us h
ous
eho
lds
typ
es (c
on’
t)
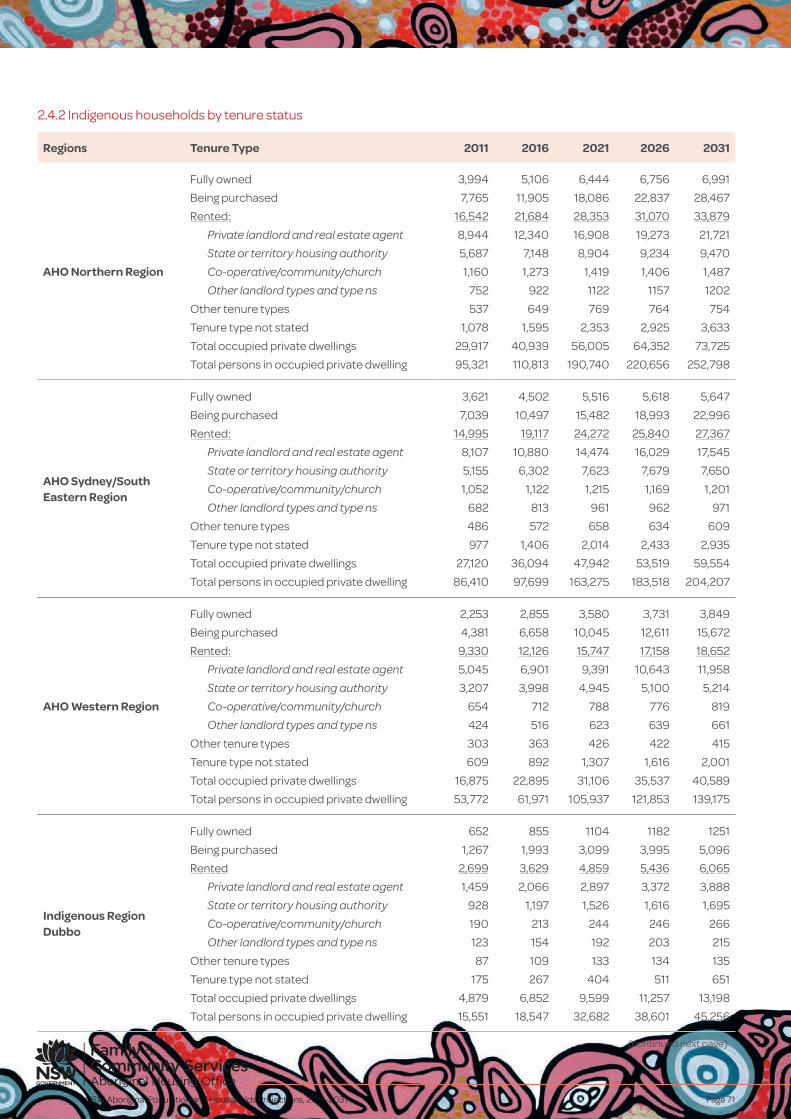
NSW Aboriginal Population and Households Projections, 2011–2031 Page 71
2.4.2 Indigenous households by tenure status
Regions Tenure Type 2011 2016 2021 2026 2031
AHO Northern Region
Fully owned 3,994 5,106 6,444 6,756 6,991
Being purchased 7,765 11,905 18,086 22,837 28,467
Rented: 16,542 21,684 28,353 31,070 33,879
Private landlord and real estate agent 8,944 12,340 16,908 19,273 21,721
State or territory housing authority 5,687 7,148 8,904 9,234 9,470
Co-operative/community/church 1,160 1,273 1,419 1,406 1,487
Other landlord types and type ns 752 922 1122 1157 1202
Other tenure types 537 649 769 764 754
Tenure type not stated 1,078 1,595 2,353 2,925 3,633
Total occupied private dwellings 29,917 40,939 56,005 64,352 73,725
Total persons in occupied private dwelling 95,321 110,813 190,740 220,656 252,798
AHO Sydney/South Eastern Region
Fully owned 3,621 4,502 5,516 5,618 5,647
Being purchased 7,039 10,497 15,482 18,993 22,996
Rented: 14,995 19,117 24,272 25,840 27,367
Private landlord and real estate agent 8,107 10,880 14,474 16,029 17,545
State or territory housing authority 5,155 6,302 7,623 7,679 7,650
Co-operative/community/church 1,052 1,122 1,215 1,169 1,201
Other landlord types and type ns 682 813 961 962 971
Other tenure types 486 572 658 634 609
Tenure type not stated 977 1,406 2,014 2,433 2,935
Total occupied private dwellings 27,120 36,094 47,942 53,519 59,554
Total persons in occupied private dwelling 86,410 97,699 163,275 183,518 204,207
AHO Western Region
Fully owned 2,253 2,855 3,580 3,731 3,849
Being purchased 4,381 6,658 10,045 12,611 15,672
Rented: 9,330 12,126 15,747 17,158 18,652
Private landlord and real estate agent 5,045 6,901 9,391 10,643 11,958
State or territory housing authority 3,207 3,998 4,945 5,100 5,214
Co-operative/community/church 654 712 788 776 819
Other landlord types and type ns 424 516 623 639 661
Other tenure types 303 363 426 422 415
Tenure type not stated 609 892 1,307 1,616 2,001
Total occupied private dwellings 16,875 22,895 31,106 35,537 40,589
Total persons in occupied private dwelling 53,772 61,971 105,937 121,853 139,175
Indigenous Region Dubbo
Fully owned 652 855 1104 1182 1251
Being purchased 1,267 1,993 3,099 3,995 5,096
Rented 2,699 3,629 4,859 5,436 6,065
Private landlord and real estate agent 1,459 2,066 2,897 3,372 3,888
State or territory housing authority 928 1,197 1,526 1,616 1,695
Co-operative/community/church 190 213 244 246 266
Other landlord types and type ns 123 154 192 203 215
Other tenure types 87 109 133 134 135
Tenure type not stated 175 267 404 511 651
Total occupied private dwellings 4,879 6,852 9,599 11,257 13,198
Total persons in occupied private dwelling 15,551 18,547 32,682 38,601 45,256
(continued next page)
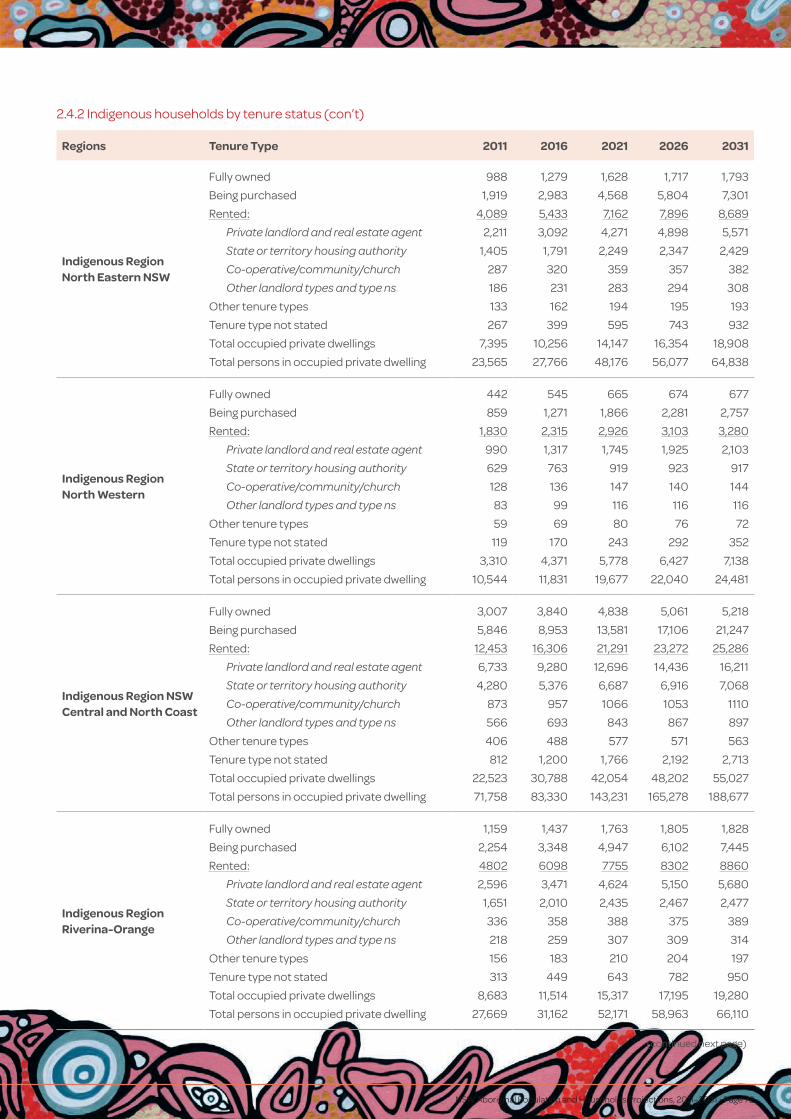
NSW Aboriginal Population and Households Projections, 2011–2031 • Page 72
Regions Tenure Type 2011 2016 2021 2026 2031
Indigenous Region North Eastern NSW
Fully owned 988 1,279 1,628 1,717 1,793
Being purchased 1,919 2,983 4,568 5,804 7,301
Rented: 4,089 5,433 7,162 7,896 8,689
Private landlord and real estate agent 2,211 3,092 4,271 4,898 5,571
State or territory housing authority 1,405 1,791 2,249 2,347 2,429
Co-operative/community/church 287 320 359 357 382
Other landlord types and type ns 186 231 283 294 308
Other tenure types 133 162 194 195 193
Tenure type not stated 267 399 595 743 932
Total occupied private dwellings 7,395 10,256 14,147 16,354 18,908
Total persons in occupied private dwelling 23,565 27,766 48,176 56,077 64,838
Indigenous Region North Western
Fully owned 442 545 665 674 677
Being purchased 859 1,271 1,866 2,281 2,757
Rented: 1,830 2,315 2,926 3,103 3,280
Private landlord and real estate agent 990 1,317 1,745 1,925 2,103
State or territory housing authority 629 763 919 923 917
Co-operative/community/church 128 136 147 140 144
Other landlord types and type ns 83 99 116 116 116
Other tenure types 59 69 80 76 72
Tenure type not stated 119 170 243 292 352
Total occupied private dwellings 3,310 4,371 5,778 6,427 7,138
Total persons in occupied private dwelling 10,544 11,831 19,677 22,040 24,481
Indigenous Region NSW Central and North Coast
Fully owned 3,007 3,840 4,838 5,061 5,218
Being purchased 5,846 8,953 13,581 17,106 21,247
Rented: 12,453 16,306 21,291 23,272 25,286
Private landlord and real estate agent 6,733 9,280 12,696 14,436 16,211
State or territory housing authority 4,280 5,376 6,687 6,916 7,068
Co-operative/community/church 873 957 1066 1053 1110
Other landlord types and type ns 566 693 843 867 897
Other tenure types 406 488 577 571 563
Tenure type not stated 812 1,200 1,766 2,192 2,713
Total occupied private dwellings 22,523 30,788 42,054 48,202 55,027
Total persons in occupied private dwelling 71,758 83,330 143,231 165,278 188,677
Indigenous Region Riverina-Orange
Fully owned 1,159 1,437 1,763 1,805 1,828
Being purchased 2,254 3,348 4,947 6,102 7,445
Rented: 4802 6098 7755 8302 8860
Private landlord and real estate agent 2,596 3,471 4,624 5,150 5,680
State or territory housing authority 1,651 2,010 2,435 2,467 2,477
Co-operative/community/church 336 358 388 375 389
Other landlord types and type ns 218 259 307 309 314
Other tenure types 156 183 210 204 197
Tenure type not stated 313 449 643 782 950
Total occupied private dwellings 8,683 11,514 15,317 17,195 19,280
Total persons in occupied private dwelling 27,669 31,162 52,171 58,963 66,110
(continued next page)
2.4.2 Indigenous households by tenure status (con’t)
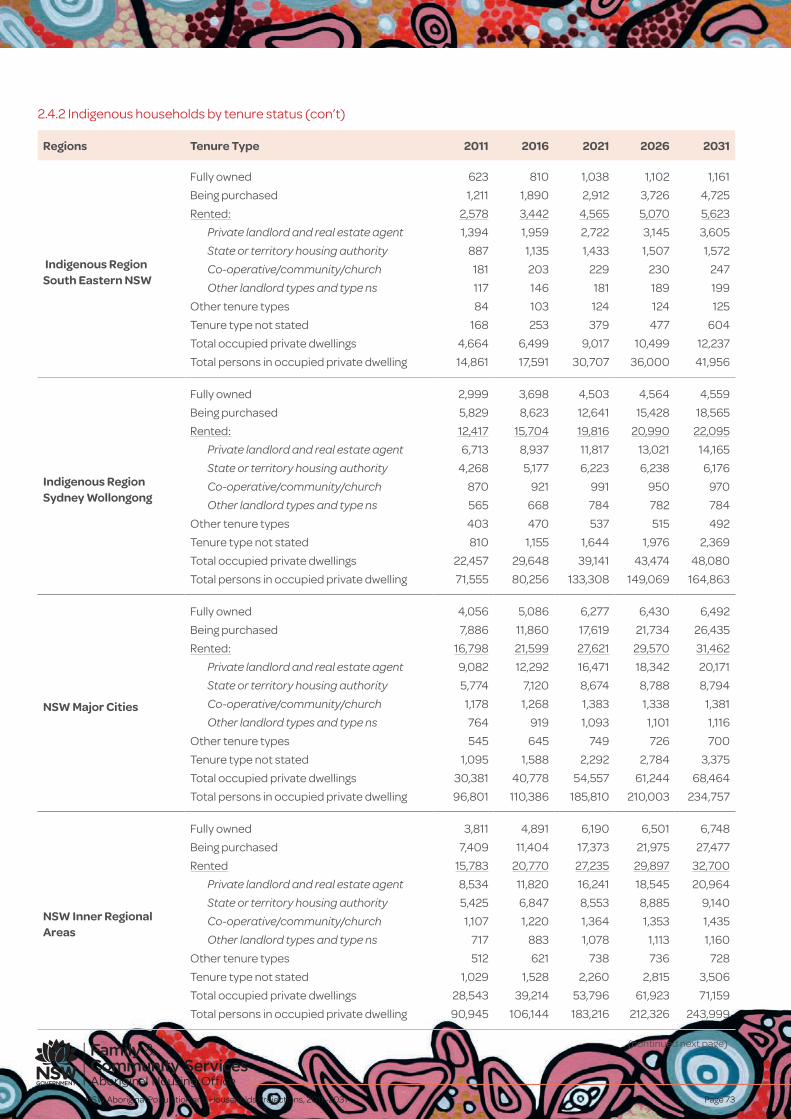
NSW Aboriginal Population and Households Projections, 2011–2031 Page 73
Regions Tenure Type 2011 2016 2021 2026 2031
Indigenous Region South Eastern NSW
Fully owned 623 810 1,038 1,102 1,161
Being purchased 1,211 1,890 2,912 3,726 4,725
Rented: 2,578 3,442 4,565 5,070 5,623
Private landlord and real estate agent 1,394 1,959 2,722 3,145 3,605
State or territory housing authority 887 1,135 1,433 1,507 1,572
Co-operative/community/church 181 203 229 230 247
Other landlord types and type ns 117 146 181 189 199
Other tenure types 84 103 124 124 125
Tenure type not stated 168 253 379 477 604
Total occupied private dwellings 4,664 6,499 9,017 10,499 12,237
Total persons in occupied private dwelling 14,861 17,591 30,707 36,000 41,956
Indigenous Region Sydney Wollongong
Fully owned 2,999 3,698 4,503 4,564 4,559
Being purchased 5,829 8,623 12,641 15,428 18,565
Rented: 12,417 15,704 19,816 20,990 22,095
Private landlord and real estate agent 6,713 8,937 11,817 13,021 14,165
State or territory housing authority 4,268 5,177 6,223 6,238 6,176
Co-operative/community/church 870 921 991 950 970
Other landlord types and type ns 565 668 784 782 784
Other tenure types 403 470 537 515 492
Tenure type not stated 810 1,155 1,644 1,976 2,369
Total occupied private dwellings 22,457 29,648 39,141 43,474 48,080
Total persons in occupied private dwelling 71,555 80,256 133,308 149,069 164,863
NSW Major Cities
Fully owned 4,056 5,086 6,277 6,430 6,492
Being purchased 7,886 11,860 17,619 21,734 26,435
Rented: 16,798 21,599 27,621 29,570 31,462
Private landlord and real estate agent 9,082 12,292 16,471 18,342 20,171
State or territory housing authority 5,774 7,120 8,674 8,788 8,794
Co-operative/community/church 1,178 1,268 1,383 1,338 1,381
Other landlord types and type ns 764 919 1,093 1,101 1,116
Other tenure types 545 645 749 726 700
Tenure type not stated 1,095 1,588 2,292 2,784 3,375
Total occupied private dwellings 30,381 40,778 54,557 61,244 68,464
Total persons in occupied private dwelling 96,801 110,386 185,810 210,003 234,757
NSW Inner Regional Areas
Fully owned 3,811 4,891 6,190 6,501 6,748
Being purchased 7,409 11,404 17,373 21,975 27,477
Rented 15,783 20,770 27,235 29,897 32,700
Private landlord and real estate agent 8,534 11,820 16,241 18,545 20,964
State or territory housing authority 5,425 6,847 8,553 8,885 9,140
Co-operative/community/church 1,107 1,220 1,364 1,353 1,435
Other landlord types and type ns 717 883 1,078 1,113 1,160
Other tenure types 512 621 738 736 728
Tenure type not stated 1,029 1,528 2,260 2,815 3,506
Total occupied private dwellings 28,543 39,214 53,796 61,923 71,159
Total persons in occupied private dwelling 90,945 106,144 183,216 212,326 243,999
2.4.2 Indigenous households by tenure status (con’t)
(continued next page)
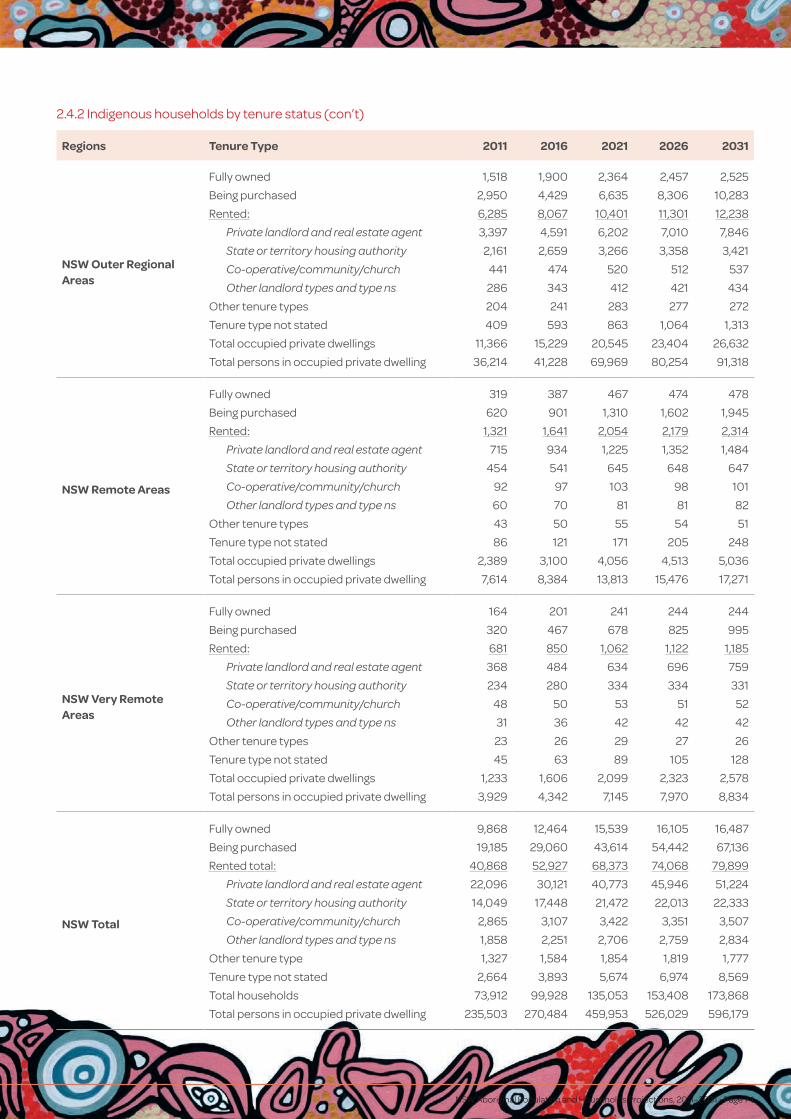
NSW Aboriginal Population and Households Projections, 2011–2031 • Page 74
Regions Tenure Type 2011 2016 2021 2026 2031
NSW Outer Regional Areas
Fully owned 1,518 1,900 2,364 2,457 2,525
Being purchased 2,950 4,429 6,635 8,306 10,283
Rented: 6,285 8,067 10,401 11,301 12,238
Private landlord and real estate agent 3,397 4,591 6,202 7,010 7,846
State or territory housing authority 2,161 2,659 3,266 3,358 3,421
Co-operative/community/church 441 474 520 512 537
Other landlord types and type ns 286 343 412 421 434
Other tenure types 204 241 283 277 272
Tenure type not stated 409 593 863 1,064 1,313
Total occupied private dwellings 11,366 15,229 20,545 23,404 26,632
Total persons in occupied private dwelling 36,214 41,228 69,969 80,254 91,318
NSW Remote Areas
Fully owned 319 387 467 474 478
Being purchased 620 901 1,310 1,602 1,945
Rented: 1,321 1,641 2,054 2,179 2,314
Private landlord and real estate agent 715 934 1,225 1,352 1,484
State or territory housing authority 454 541 645 648 647
Co-operative/community/church 92 97 103 98 101
Other landlord types and type ns 60 70 81 81 82
Other tenure types 43 50 55 54 51
Tenure type not stated 86 121 171 205 248
Total occupied private dwellings 2,389 3,100 4,056 4,513 5,036
Total persons in occupied private dwelling 7,614 8,384 13,813 15,476 17,271
NSW Very Remote Areas
Fully owned 164 201 241 244 244
Being purchased 320 467 678 825 995
Rented: 681 850 1,062 1,122 1,185
Private landlord and real estate agent 368 484 634 696 759
State or territory housing authority 234 280 334 334 331
Co-operative/community/church 48 50 53 51 52
Other landlord types and type ns 31 36 42 42 42
Other tenure types 23 26 29 27 26
Tenure type not stated 45 63 89 105 128
Total occupied private dwellings 1,233 1,606 2,099 2,323 2,578
Total persons in occupied private dwelling 3,929 4,342 7,145 7,970 8,834
NSW Total
Fully owned 9,868 12,464 15,539 16,105 16,487
Being purchased 19,185 29,060 43,614 54,442 67,136
Rented total: 40,868 52,927 68,373 74,068 79,899
Private landlord and real estate agent 22,096 30,121 40,773 45,946 51,224
State or territory housing authority 14,049 17,448 21,472 22,013 22,333
Co-operative/community/church 2,865 3,107 3,422 3,351 3,507
Other landlord types and type ns 1,858 2,251 2,706 2,759 2,834
Other tenure type 1,327 1,584 1,854 1,819 1,777
Tenure type not stated 2,664 3,893 5,674 6,974 8,569
Total households 73,912 99,928 135,053 153,408 173,868
Total persons in occupied private dwelling 235,503 270,484 459,953 526,029 596,179
2.4.2 Indigenous households by tenure status (con’t)

NSW Aboriginal Population and Households Projections, 2011–2031 Page 75
Num
ber
of H
ouse
hold
s by
Ten
ure
Stat
us
Fam
ily a
nd
Com
mun
ity S
ervi
ces
(FA
CS)
Year
Bei
ng
purc
hase
dFu
lly
owne
d
Rent
ed: C
omm
unity
or
co-
oper
ativ
e ho
usin
g
Rent
ed:
Land
lord
not
st
ated
Rent
ed: P
rivat
e La
ndlo
rd a
nd re
al
esta
te a
gent
Rent
ed: S
tate
ho
usin
g au
thor
ity
Rent
ed: O
ther
la
ndlo
rd (i
ncl.
resi
dent
ial p
ark)
Oth
er
tenu
re
type
Tenu
re ty
pe
not s
tate
dTo
tal
hous
ehol
ds
Central Coast
200
157
636
04
815
80
525
524
574
32,
183
200
68
40
40
74
715
1,136
357
45
41
84
2,97
2
2011
1,337
564
5926
1,625
417
7570
125
4,2
98
2016
1,78
86
3058
322,
00
64
47
111
7517
45,
321
2021
2,6
1677
06
24
42,
710
523
179
8726
57,
256
2026
3,18
878
456
503,
04
851
124
08
533
68,
297
2031
3,8
44
789
49
553,
393
49
332
08
24
219,
44
7
Far West
200
112
016
317
912
121
106
5830
368
25
200
615
213
116
86
138
124
66
256
787
7
2011
217
176
117
024
816
379
276
21,0
89
2016
390
262
114
04
9727
212
335
93
1,78
6
2021
565
313
89
08
01
365
154
3611
32,
436
2026
66
530
457
01,0
49
399
157
3111
12,
773
2031
767
290
360
1,34
84
2715
625
107
3,15
6
Hunter New England
200
11,9
251,5
89
709
104
2,9
171,9
5123
127
221
59,
913
200
62,
99
21,7
45
679
120
3,56
12,
369
269
206
48
112
,422
2011
4,4
81
2,26
06
95
95
4,9
83
2,8
44
310
286
60
016
,554
2016
7,0
972,
913
716
877,
023
3,6
07
376
333
929
23,0
82
2021
10,8
973,
64
171
677
9,59
64
,436
44
337
61,3
95
31,5
77
2026
13,8
85
3,77
759
457
10,8
80
4,5
264
3335
21,7
3736
,24
1
2031
17,4
733,
86
84
86
41
12,18
44
,56
14
1832
52,
138
41,4
95
Illawarra Shoalhaven
200
16
1356
017
427
80
976
751
95
62
3,15
8
200
687
452
613
518
1,022
84
64
44
012
63,
631
2011
1,278
69
213
626
1,413
1,08
36
974
167
4,9
38
2016
1,79
178
811
727
1,84
41,2
83
86
7424
16
,252
2021
2,6
49
94
710
730
2,53
91,6
05
112
7936
68,
434
2026
3,27
09
49
81
282,
917
1,675
123
704
65
9,57
9
2031
3,9
98
94
36
126
3,32
01,7
3113
36
158
410
,857
2.4
.3 In
dig
eno
us h
ous
eho
lds
by te
nure
sta
tus
by F
AC
S re
gio
ns
(co
ntin
ued
nex
t pag
e)
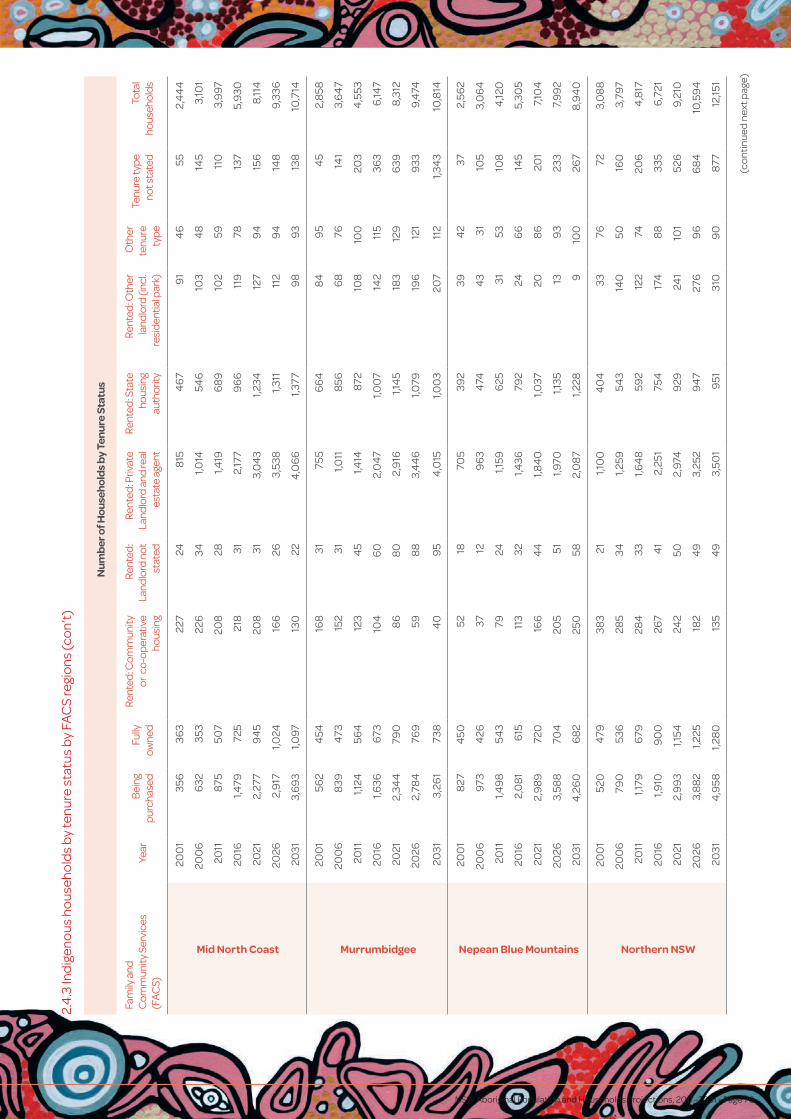
NSW Aboriginal Population and Households Projections, 2011–2031 • Page 76
Num
ber
of H
ouse
hold
s by
Ten
ure
Stat
us
Fam
ily a
nd
Com
mun
ity S
ervi
ces
(FA
CS)
Year
Bei
ng
purc
hase
dFu
lly
owne
d
Rent
ed: C
omm
unity
or
co-
oper
ativ
e ho
usin
g
Rent
ed:
Land
lord
not
st
ated
Rent
ed: P
rivat
e La
ndlo
rd a
nd re
al
esta
te a
gent
Rent
ed: S
tate
ho
usin
g au
thor
ity
Rent
ed: O
ther
la
ndlo
rd (i
ncl.
resi
dent
ial p
ark)
Oth
er
tenu
re
type
Tenu
re ty
pe
not s
tate
dTo
tal
hous
ehol
ds
Mid North Coast
200
135
636
322
724
815
46
79
14
655
2,4
44
200
66
3235
322
634
1,014
546
103
48
145
3,10
1
2011
875
507
208
281,4
196
89
102
5911
03,
997
2016
1,479
725
218
312,
177
96
611
978
137
5,9
30
2021
2,27
79
45
208
313,
04
31,2
3412
79
415
68,
114
2026
2,9
171,0
2416
626
3,53
81,3
1111
29
414
89,
336
2031
3,6
93
1,097
130
224
,06
61,3
779
89
313
810
,714
Murrumbidgee
200
156
24
5416
831
755
66
48
49
54
52,
858
200
68
394
7315
231
1,011
856
68
7614
13,
64
7
2011
1,124
564
123
45
1,414
872
108
100
203
4,5
53
2016
1,636
673
104
60
2,0
47
1,00
714
211
536
36
,147
2021
2,34
479
08
68
02,
916
1,14
518
312
96
398,
312
2026
2,78
476
959
88
3,4
46
1,079
196
121
933
9,4
74
2031
3,26
173
84
09
54
,015
1,00
320
711
21,3
43
10,8
14
Nepean Blue Mountains
200
18
274
5052
1870
539
239
42
372,
562
200
697
34
2637
129
63
474
43
3110
53,
06
4
2011
1,49
854
379
241,1
596
2531
5310
84
,120
2016
2,0
81
615
113
321,4
3679
224
66
145
5,30
5
2021
2,9
89
720
166
44
1,84
01,0
3720
86
201
7,10
4
2026
3,58
870
420
551
1,970
1,135
139
323
37,
99
2
2031
4,2
60
68
225
058
2,0
871,2
289
100
267
8,9
40
Northern NSW
200
152
04
7938
321
1,10
04
04
3376
723,
08
8
200
679
053
628
534
1,259
543
140
5016
03,
797
2011
1,179
679
284
331,6
48
592
122
7420
64
,817
2016
1,910
90
026
74
12,
251
754
174
88
335
6,7
21
2021
2,9
93
1,154
242
502,
974
929
241
101
526
9,21
0
2026
3,8
82
1,225
182
49
3,25
29
47
276
96
68
410
,59
4
2031
4,9
581,2
80
135
49
3,50
19
5131
09
087
712
,151
(co
ntin
ued
nex
t pag
e)
2.4
.3 In
dig
eno
us h
ous
eho
lds
by te
nure
sta
tus
by F
AC
S re
gio
ns (c
on’
t)
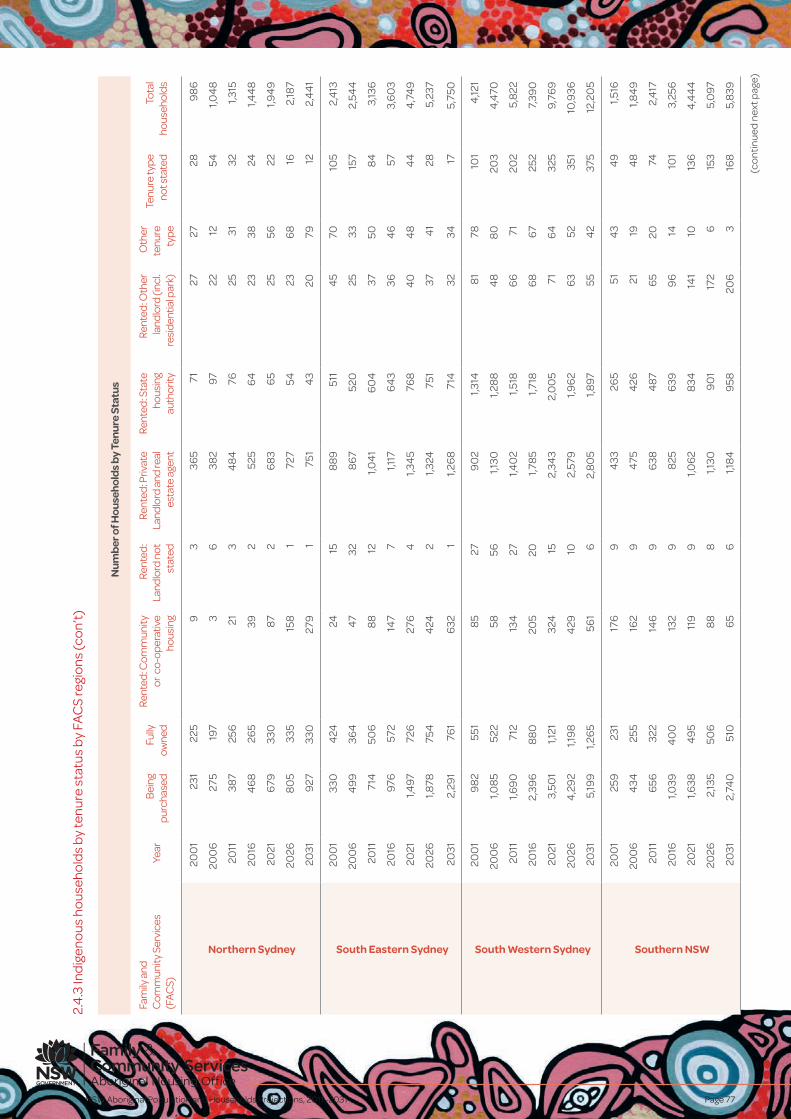
NSW Aboriginal Population and Households Projections, 2011–2031 Page 77
Num
ber
of H
ouse
hold
s by
Ten
ure
Stat
us
Fam
ily a
nd
Com
mun
ity S
ervi
ces
(FA
CS)
Year
Bei
ng
purc
hase
dFu
lly
owne
d
Rent
ed: C
omm
unity
or
co-
oper
ativ
e ho
usin
g
Rent
ed:
Land
lord
not
st
ated
Rent
ed: P
rivat
e La
ndlo
rd a
nd re
al
esta
te a
gent
Rent
ed: S
tate
ho
usin
g au
thor
ity
Rent
ed: O
ther
la
ndlo
rd (i
ncl.
resi
dent
ial p
ark)
Oth
er
tenu
re
type
Tenu
re ty
pe
not s
tate
dTo
tal
hous
ehol
ds
Northern Sydney
200
123
122
59
336
571
2727
289
86
200
627
519
73
638
297
2212
541,0
48
2011
387
256
213
48
476
2531
321,3
15
2016
46
826
539
252
56
423
3824
1,44
8
2021
679
330
872
68
36
525
5622
1,94
9
2026
80
533
515
81
727
5423
68
162,
187
2031
927
330
279
175
14
320
7912
2,4
41
South Eastern Sydney
200
133
04
2424
158
89
511
45
7010
52,
413
200
64
99
364
47
328
67
520
2533
157
2,54
4
2011
714
506
88
121,0
41
60
437
508
43,
136
2016
976
572
147
71,1
176
43
364
657
3,6
03
2021
1,497
726
276
41,3
45
768
40
48
44
4,7
49
2026
1,878
754
424
21,3
2475
137
41
285,
237
2031
2,29
176
16
321
1,26
871
432
3417
5,75
0
South Western Sydney
200
19
82
551
85
279
02
1,314
81
7810
14
,121
200
61,0
85
522
5856
1,130
1,28
84
88
020
34
,470
2011
1,69
071
213
427
1,40
21,5
186
671
202
5,8
22
2016
2,39
68
80
205
201,7
85
1,718
68
67
252
7,39
0
2021
3,50
11,1
2132
415
2,34
32,
00
571
64
325
9,76
9
2026
4,2
92
1,19
84
2910
2,57
91,9
62
63
5235
110
,936
2031
5,19
91,2
65
561
62,
80
51,8
9755
42
375
12,2
05
Southern NSW
200
125
923
117
69
433
265
514
34
91,5
16
200
64
3425
516
29
475
426
2119
48
1,84
9
2011
656
322
146
96
384
876
520
742,
417
2016
1,039
40
013
29
825
639
96
1410
13,
256
2021
1,638
49
511
99
1,06
28
3414
110
136
4,4
44
2026
2,13
550
68
88
1,130
90
117
26
153
5,0
97
2031
2,74
051
06
56
1,18
49
5820
63
168
5,8
39
2.4
.3 In
dig
eno
us h
ous
eho
lds
by te
nure
sta
tus
by F
AC
S re
gio
ns (c
on’
t)
(co
ntin
ued
nex
t pag
e)
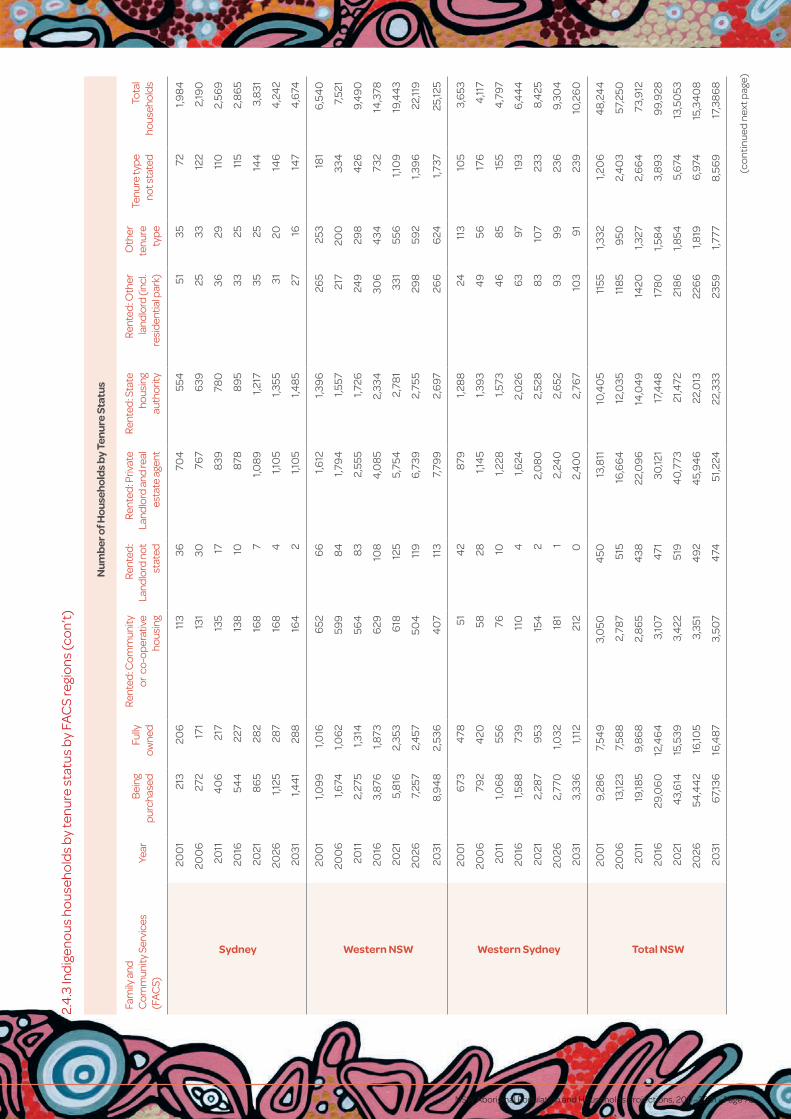
NSW Aboriginal Population and Households Projections, 2011–2031 • Page 78
Num
ber
of H
ouse
hold
s by
Ten
ure
Stat
us
Fam
ily a
nd
Com
mun
ity S
ervi
ces
(FA
CS)
Year
Bei
ng
purc
hase
dFu
lly
owne
d
Rent
ed: C
omm
unity
or
co-
oper
ativ
e ho
usin
g
Rent
ed:
Land
lord
not
st
ated
Rent
ed: P
rivat
e La
ndlo
rd a
nd re
al
esta
te a
gent
Rent
ed: S
tate
ho
usin
g au
thor
ity
Rent
ed: O
ther
la
ndlo
rd (i
ncl.
resi
dent
ial p
ark)
Oth
er
tenu
re
type
Tenu
re ty
pe
not s
tate
dTo
tal
hous
ehol
ds
Sydney
200
121
320
611
336
704
554
5135
721,9
84
200
627
217
113
130
767
639
2533
122
2,19
0
2011
40
621
713
517
839
780
3629
110
2,56
9
2016
544
227
138
1087
88
95
3325
115
2,8
65
2021
86
528
216
87
1,08
91,2
1735
2514
43,
831
2026
1,125
287
168
41,1
05
1,355
3120
146
4,2
42
2031
1,44
128
816
42
1,10
51,4
85
2716
147
4,6
74
Western NSW
200
11,0
99
1,016
652
66
1,612
1,39
626
525
318
16
,54
0
200
61,6
741,0
62
599
84
1,79
41,5
5721
720
033
47,
521
2011
2,27
51,3
1456
48
32,
555
1,726
249
298
426
9,4
90
2016
3,87
61,8
736
2910
84
,08
52,
334
306
434
732
14,3
78
2021
5,8
162,
353
618
125
5,75
42,
781
331
556
1,10
919
,44
3
2026
7,25
72,
457
504
119
6,7
392,
755
298
592
1,39
622
,119
2031
8,9
48
2,53
64
07
113
7,79
92,
697
266
624
1,737
25,12
5
Western Sydney
200
16
734
7851
42
879
1,28
824
113
105
3,6
53
200
679
24
2058
281,1
45
1,39
34
956
176
4,11
7
2011
1,06
855
676
101,2
281,5
734
68
515
54
,797
2016
1,58
873
911
04
1,624
2,0
266
397
193
6,4
44
2021
2,28
79
5315
42
2,0
80
2,52
88
310
723
38,
425
2026
2,77
01,0
3218
11
2,24
02,
652
93
99
236
9,30
4
2031
3,33
61,1
1221
20
2,4
00
2,76
710
39
123
910
,26
0
Total NSW
200
19,
286
7,54
93,
050
450
13,8
1110
,40
511
551,3
321,2
06
48,
244
200
613
,123
7,58
82,
787
515
16,6
64
12,0
3511
85
950
2,4
03
57,2
50
2011
19,18
59,
86
82,
86
54
3822
,09
614
,04
914
201,3
272,
66
473
,912
2016
29,0
60
12,4
64
3,10
74
7130
,121
17,4
48
178
01,5
84
3,8
93
99,
928
2021
43,
614
15,5
393,
422
519
40
,773
21,4
7221
86
1,854
5,6
7413
,50
53
2026
54,4
42
16,10
53,
351
49
24
5,9
46
22,0
1322
66
1,819
6,9
7415
,34
08
2031
67,
136
16,4
873,
507
474
51,2
2422
,333
2359
1,777
8,56
917
,38
68
(co
ntin
ued
nex
t pag
e)
2.4
.3 In
dig
eno
us h
ous
eho
lds
by te
nure
sta
tus
by F
AC
S re
gio
ns (c
on’
t)
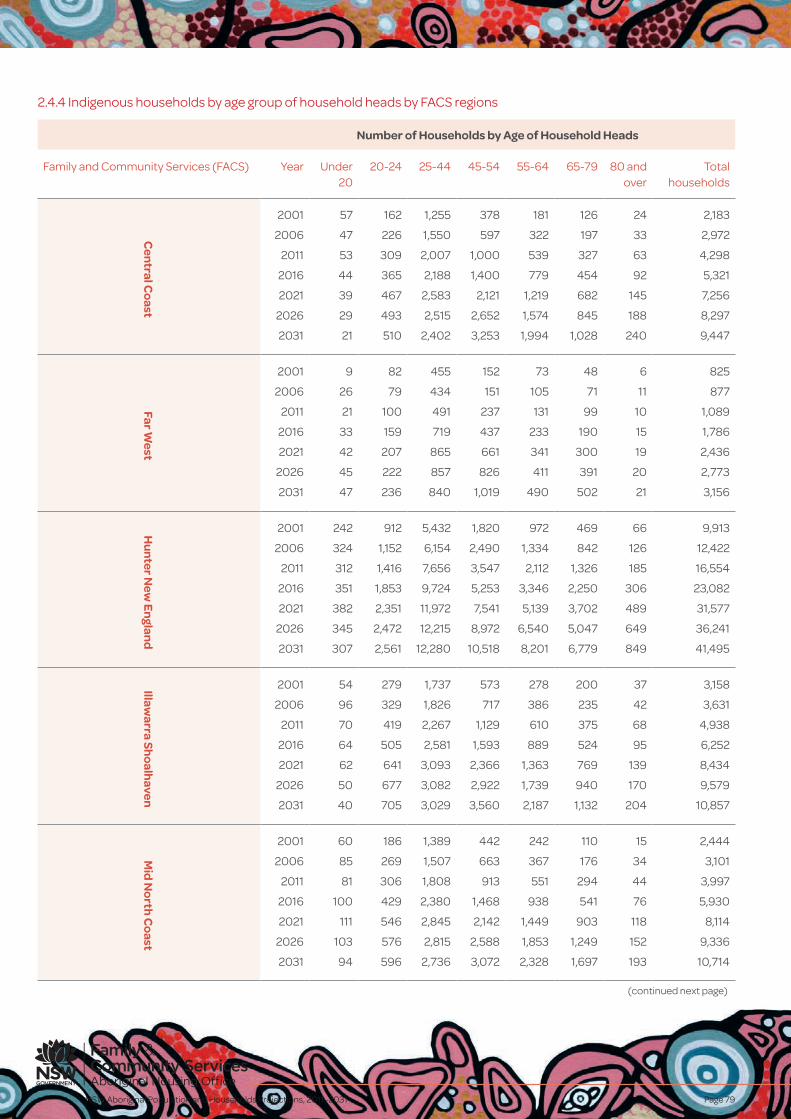
NSW Aboriginal Population and Households Projections, 2011–2031 Page 79
2.4.4 Indigenous households by age group of household heads by FACS regions
Number of Households by Age of Household Heads
Family and Community Services (FACS) Year Under 20
20-24 25-44 45-54 55-64 65-79 80 and over
Total households
Central C
oast
2001 57 162 1,255 378 181 126 24 2,183
2006 47 226 1,550 597 322 197 33 2,972
2011 53 309 2,007 1,000 539 327 63 4,298
2016 44 365 2,188 1,400 779 454 92 5,321
2021 39 467 2,583 2,121 1,219 682 145 7,256
2026 29 493 2,515 2,652 1,574 845 188 8,297
2031 21 510 2,402 3,253 1,994 1,028 240 9,447
Far West
2001 9 82 455 152 73 48 6 825
2006 26 79 434 151 105 71 11 877
2011 21 100 491 237 131 99 10 1,089
2016 33 159 719 437 233 190 15 1,786
2021 42 207 865 661 341 300 19 2,436
2026 45 222 857 826 411 391 20 2,773
2031 47 236 840 1,019 490 502 21 3,156
Hu
nter New
En
gland
2001 242 912 5,432 1,820 972 469 66 9,913
2006 324 1,152 6,154 2,490 1,334 842 126 12,422
2011 312 1,416 7,656 3,547 2,112 1,326 185 16,554
2016 351 1,853 9,724 5,253 3,346 2,250 306 23,082
2021 382 2,351 11,972 7,541 5,139 3,702 489 31,577
2026 345 2,472 12,215 8,972 6,540 5,047 649 36,241
2031 307 2,561 12,280 10,518 8,201 6,779 849 41,495Illaw
arra Sho
alhaven
2001 54 279 1,737 573 278 200 37 3,158
2006 96 329 1,826 717 386 235 42 3,631
2011 70 419 2,267 1,129 610 375 68 4,938
2016 64 505 2,581 1,593 889 524 95 6,252
2021 62 641 3,093 2,366 1,363 769 139 8,434
2026 50 677 3,082 2,922 1,739 940 170 9,579
2031 40 705 3,029 3,560 2,187 1,132 204 10,857
Mid
No
rth C
oast
2001 60 186 1,389 442 242 110 15 2,444
2006 85 269 1,507 663 367 176 34 3,101
2011 81 306 1,808 913 551 294 44 3,997
2016 100 429 2,380 1,468 938 541 76 5,930
2021 111 546 2,845 2,142 1,449 903 118 8,114
2026 103 576 2,815 2,588 1,853 1,249 152 9,336
2031 94 596 2,736 3,072 2,328 1,697 193 10,714
(continued next page)
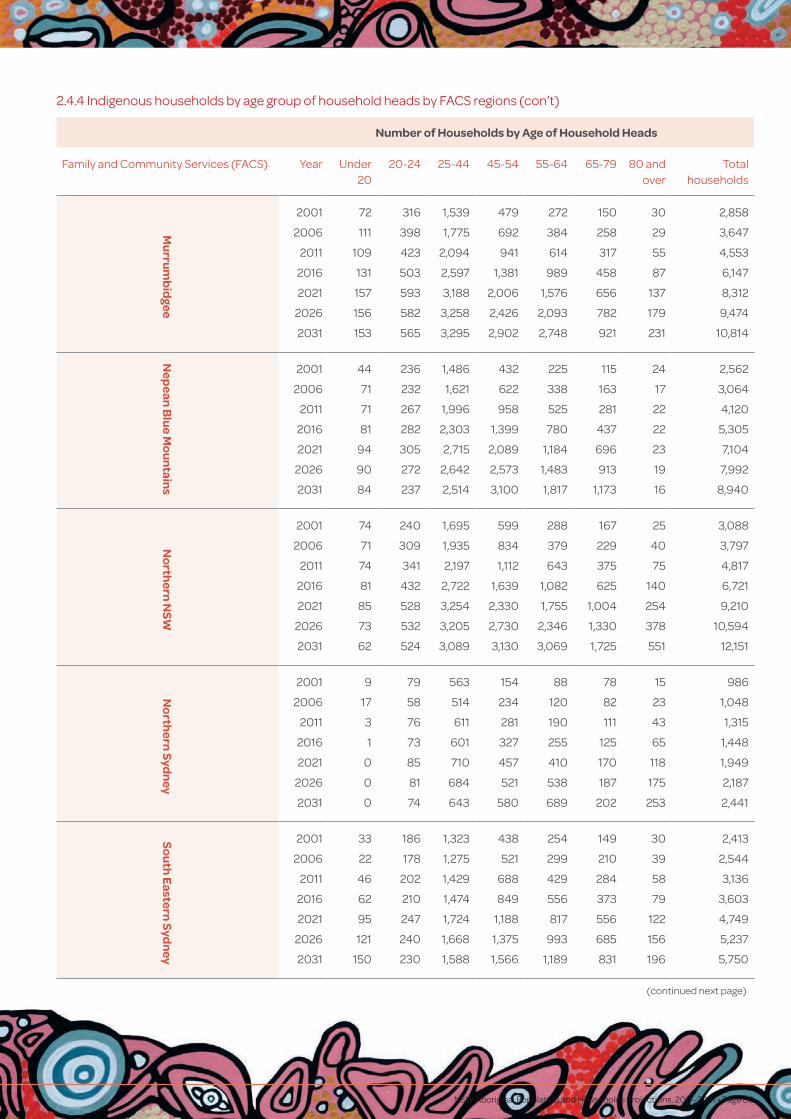
NSW Aboriginal Population and Households Projections, 2011–2031 • Page 80
Number of Households by Age of Household Heads
Family and Community Services (FACS) Year Under 20
20-24 25-44 45-54 55-64 65-79 80 and over
Total households
Mu
rrum
bid
gee
2001 72 316 1,539 479 272 150 30 2,858
2006 111 398 1,775 692 384 258 29 3,647
2011 109 423 2,094 941 614 317 55 4,553
2016 131 503 2,597 1,381 989 458 87 6,147
2021 157 593 3,188 2,006 1,576 656 137 8,312
2026 156 582 3,258 2,426 2,093 782 179 9,474
2031 153 565 3,295 2,902 2,748 921 231 10,814
Nep
ean B
lue M
ou
ntains
2001 44 236 1,486 432 225 115 24 2,562
2006 71 232 1,621 622 338 163 17 3,064
2011 71 267 1,996 958 525 281 22 4,120
2016 81 282 2,303 1,399 780 437 22 5,305
2021 94 305 2,715 2,089 1,184 696 23 7,104
2026 90 272 2,642 2,573 1,483 913 19 7,992
2031 84 237 2,514 3,100 1,817 1,173 16 8,940
No
rthern
NSW
2001 74 240 1,695 599 288 167 25 3,088
2006 71 309 1,935 834 379 229 40 3,797
2011 74 341 2,197 1,112 643 375 75 4,817
2016 81 432 2,722 1,639 1,082 625 140 6,721
2021 85 528 3,254 2,330 1,755 1,004 254 9,210
2026 73 532 3,205 2,730 2,346 1,330 378 10,594
2031 62 524 3,089 3,130 3,069 1,725 551 12,151
No
rthern
Sydn
ey
2001 9 79 563 154 88 78 15 986
2006 17 58 514 234 120 82 23 1,048
2011 3 76 611 281 190 111 43 1,315
2016 1 73 601 327 255 125 65 1,448
2021 0 85 710 457 410 170 118 1,949
2026 0 81 684 521 538 187 175 2,187
2031 0 74 643 580 689 202 253 2,441
Sou
th E
astern Syd
ney
2001 33 186 1,323 438 254 149 30 2,413
2006 22 178 1,275 521 299 210 39 2,544
2011 46 202 1,429 688 429 284 58 3,136
2016 62 210 1,474 849 556 373 79 3,603
2021 95 247 1,724 1,188 817 556 122 4,749
2026 121 240 1,668 1,375 993 685 156 5,237
2031 150 230 1,588 1,566 1,189 831 196 5,750
(continued next page)
2.4.4 Indigenous households by age group of household heads by FACS regions (con’t)
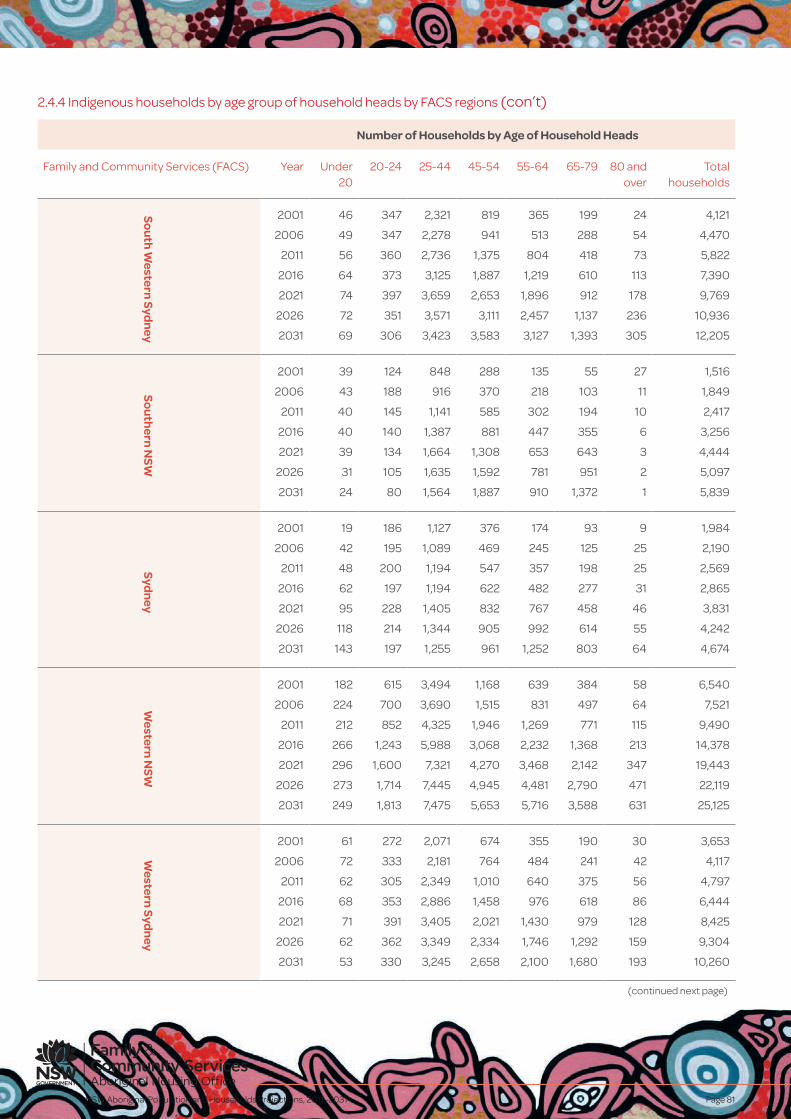
NSW Aboriginal Population and Households Projections, 2011–2031 Page 81
2.4.4 Indigenous households by age group of household heads by FACS regions (con’t)
Number of Households by Age of Household Heads
Family and Community Services (FACS) Year Under 20
20-24 25-44 45-54 55-64 65-79 80 and over
Total households
Sou
th W
estern Syd
ney
2001 46 347 2,321 819 365 199 24 4,121
2006 49 347 2,278 941 513 288 54 4,470
2011 56 360 2,736 1,375 804 418 73 5,822
2016 64 373 3,125 1,887 1,219 610 113 7,390
2021 74 397 3,659 2,653 1,896 912 178 9,769
2026 72 351 3,571 3,111 2,457 1,137 236 10,936
2031 69 306 3,423 3,583 3,127 1,393 305 12,205
Sou
thern
NSW
2001 39 124 848 288 135 55 27 1,516
2006 43 188 916 370 218 103 11 1,849
2011 40 145 1,141 585 302 194 10 2,417
2016 40 140 1,387 881 447 355 6 3,256
2021 39 134 1,664 1,308 653 643 3 4,444
2026 31 105 1,635 1,592 781 951 2 5,097
2031 24 80 1,564 1,887 910 1,372 1 5,839
Sydn
ey
2001 19 186 1,127 376 174 93 9 1,984
2006 42 195 1,089 469 245 125 25 2,190
2011 48 200 1,194 547 357 198 25 2,569
2016 62 197 1,194 622 482 277 31 2,865
2021 95 228 1,405 832 767 458 46 3,831
2026 118 214 1,344 905 992 614 55 4,242
2031 143 197 1,255 961 1,252 803 64 4,674W
estern N
SW
2001 182 615 3,494 1,168 639 384 58 6,540
2006 224 700 3,690 1,515 831 497 64 7,521
2011 212 852 4,325 1,946 1,269 771 115 9,490
2016 266 1,243 5,988 3,068 2,232 1,368 213 14,378
2021 296 1,600 7,321 4,270 3,468 2,142 347 19,443
2026 273 1,714 7,445 4,945 4,481 2,790 471 22,119
2031 249 1,813 7,475 5,653 5,716 3,588 631 25,125
Western
Sydn
ey
2001 61 272 2,071 674 355 190 30 3,653
2006 72 333 2,181 764 484 241 42 4,117
2011 62 305 2,349 1,010 640 375 56 4,797
2016 68 353 2,886 1,458 976 618 86 6,444
2021 71 391 3,405 2,021 1,430 979 128 8,425
2026 62 362 3,349 2,334 1,746 1,292 159 9,304
2031 53 330 3,245 2,658 2,100 1,680 193 10,260
(continued next page)
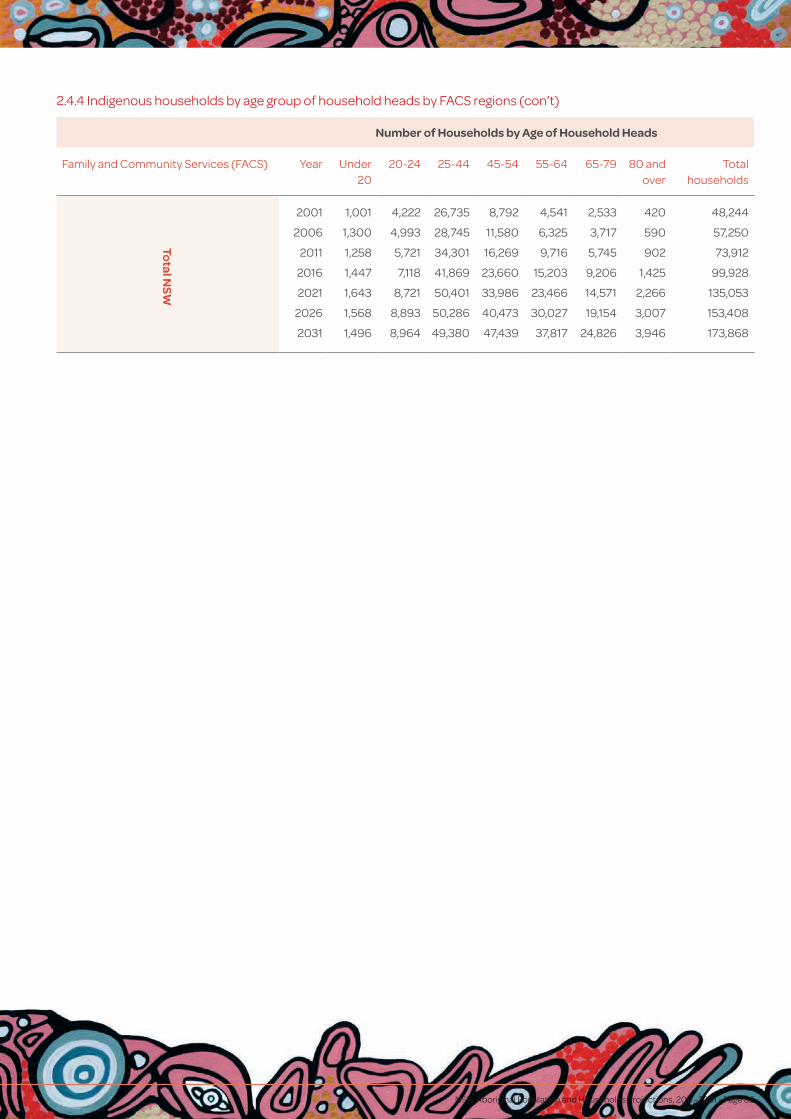
NSW Aboriginal Population and Households Projections, 2011–2031 • Page 82
Number of Households by Age of Household Heads
Family and Community Services (FACS) Year Under 20
20-24 25-44 45-54 55-64 65-79 80 and over
Total households
Total NSW
2001 1,001 4,222 26,735 8,792 4,541 2,533 420 48,244
2006 1,300 4,993 28,745 11,580 6,325 3,717 590 57,250
2011 1,258 5,721 34,301 16,269 9,716 5,745 902 73,912
2016 1,447 7,118 41,869 23,660 15,203 9,206 1,425 99,928
2021 1,643 8,721 50,401 33,986 23,466 14,571 2,266 135,053
2026 1,568 8,893 50,286 40,473 30,027 19,154 3,007 153,408
2031 1,496 8,964 49,380 47,439 37,817 24,826 3,946 173,868
2.4.4 Indigenous households by age group of household heads by FACS regions (con’t)

NSW Aboriginal Population and Households Projections, 2011–2031 Page 83
2.4.5 Indigenous households by household type by FACS regions
Households by household type by FACS regions
Family and Community Services (FACS) Year Couple only Couple with dependent
children
Other household
Single parent with dependent
children
Single person
Total households
Central C
oast
2001 272 709 379 570 253 2,183
2006 402 849 587 755 379 2,972
2011 602 1,199 920 983 594 4,298
2016 779 1,389 1,243 1,116 794 5,321
2021 1,103 1,762 1,839 1,388 1,164 7,256
2026 1,303 1,864 2,269 1,440 1,421 8,297
2031 1,524 1,953 2,772 1,478 1,719 9,447
Far West
2001 97 218 170 249 91 825
2006 102 243 159 228 145 877
2011 168 239 214 266 202 1,089
2016 323 333 348 390 393 1,786
2021 506 379 462 466 623 2,436
2026 650 354 503 456 810 2,773
2031 820 324 537 439 1,035 3,156
Hu
nter New
En
gland
2001 1,235 3,146 1,817 2,539 1,176 9,913
2006 1,764 3,520 2,489 3,014 1,635 12,422
2011 2,554 4,364 3,445 3,784 2,407 16,554
2016 3,892 5,533 5,036 4,944 3,677 23,082
2021 5,783 6,840 7,179 6,297 5,478 31,577
2026 7,165 7,051 8,533 6,689 6,804 36,241
2031 8,803 7,208 10,057 7,046 8,380 41,495
Illawarra Sh
oalh
aven
2001 449 958 561 797 393 3,158
2006 496 1,022 670 970 473 3,631
2011 687 1,339 1,045 1,180 687 4,938
2016 865 1,605 1,458 1,406 918 6,252
2021 1,156 2,040 2,158 1,778 1,302 8,434
2026 1,295 2,174 2,678 1,885 1,547 9,579
2031 1,441 2,303 3,302 1,985 1,827 10,857
Mid
No
rth C
oast
2001 288 737 390 765 264 2,444
2006 406 741 611 947 396 3,101
2011 572 974 799 1,089 563 3,997
2016 923 1,337 1,268 1,471 930 5,930
2021 1,363 1,681 1,842 1,820 1,408 8,114
2026 1,681 1,763 2,234 1,880 1,778 9,336
2031 2,052 1,832 2,684 1,922 2,223 10,714
(continued next page)
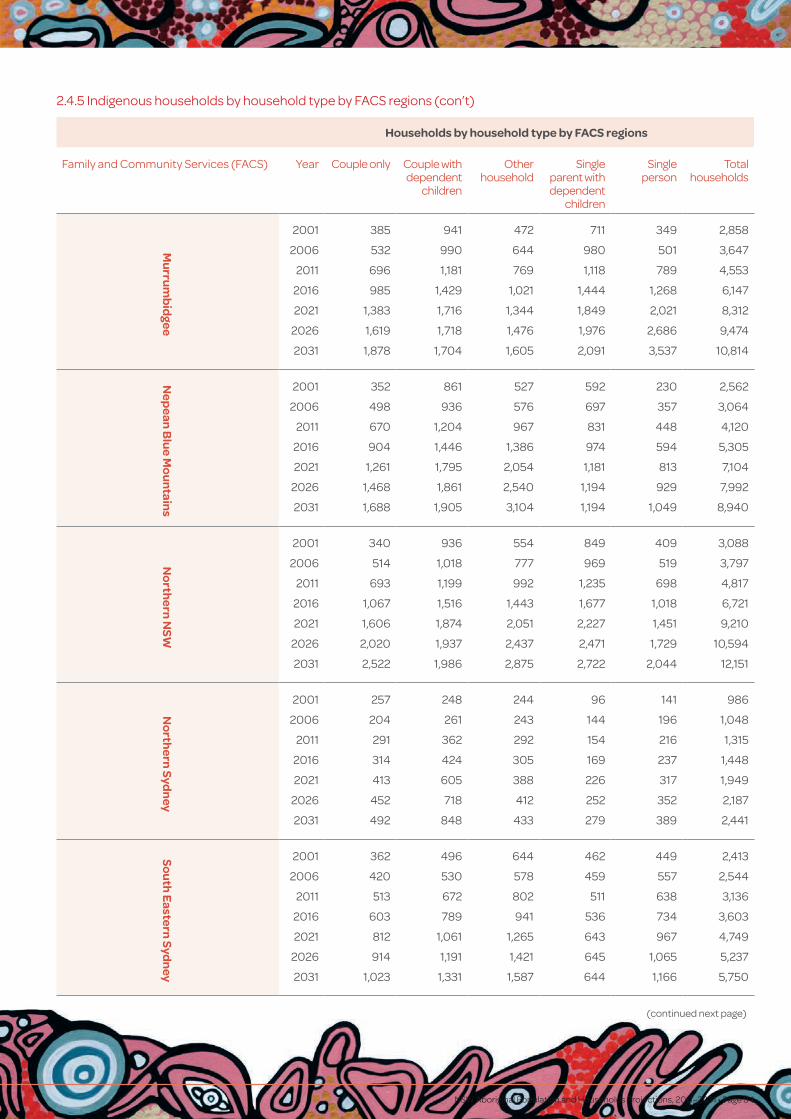
NSW Aboriginal Population and Households Projections, 2011–2031 • Page 84
Households by household type by FACS regions
Family and Community Services (FACS) Year Couple only Couple with dependent
children
Other household
Single parent with dependent
children
Single person
Total households
Mu
rrum
bid
gee
2001 385 941 472 711 349 2,858
2006 532 990 644 980 501 3,647
2011 696 1,181 769 1,118 789 4,553
2016 985 1,429 1,021 1,444 1,268 6,147
2021 1,383 1,716 1,344 1,849 2,021 8,312
2026 1,619 1,718 1,476 1,976 2,686 9,474
2031 1,878 1,704 1,605 2,091 3,537 10,814
Nep
ean B
lue M
ou
ntains
2001 352 861 527 592 230 2,562
2006 498 936 576 697 357 3,064
2011 670 1,204 967 831 448 4,120
2016 904 1,446 1,386 974 594 5,305
2021 1,261 1,795 2,054 1,181 813 7,104
2026 1,468 1,861 2,540 1,194 929 7,992
2031 1,688 1,905 3,104 1,194 1,049 8,940
No
rthern
NSW
2001 340 936 554 849 409 3,088
2006 514 1,018 777 969 519 3,797
2011 693 1,199 992 1,235 698 4,817
2016 1,067 1,516 1,443 1,677 1,018 6,721
2021 1,606 1,874 2,051 2,227 1,451 9,210
2026 2,020 1,937 2,437 2,471 1,729 10,594
2031 2,522 1,986 2,875 2,722 2,044 12,151
No
rthern
Sydn
ey
2001 257 248 244 96 141 986
2006 204 261 243 144 196 1,048
2011 291 362 292 154 216 1,315
2016 314 424 305 169 237 1,448
2021 413 605 388 226 317 1,949
2026 452 718 412 252 352 2,187
2031 492 848 433 279 389 2,441
Sou
th E
astern Syd
ney
2001 362 496 644 462 449 2,413
2006 420 530 578 459 557 2,544
2011 513 672 802 511 638 3,136
2016 603 789 941 536 734 3,603
2021 812 1,061 1,265 643 967 4,749
2026 914 1,191 1,421 645 1,065 5,237
2031 1,023 1,331 1,587 644 1,166 5,750
(continued next page)
2.4.5 Indigenous households by household type by FACS regions (con’t)
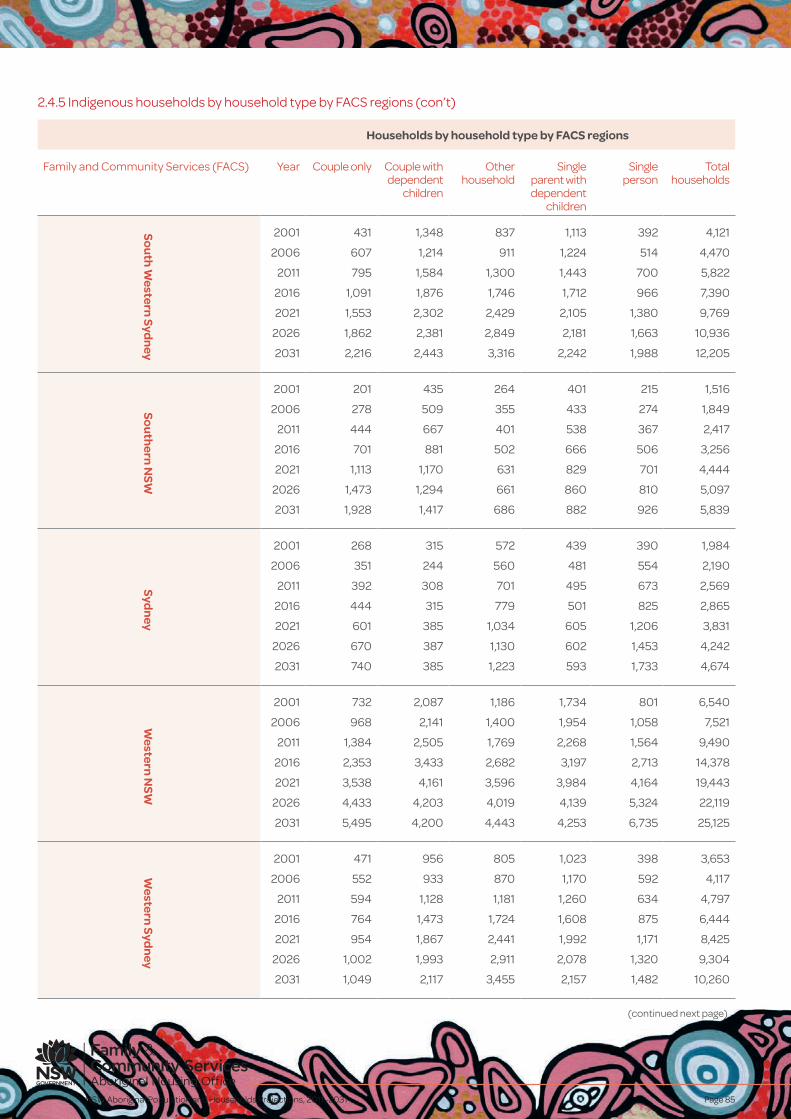
NSW Aboriginal Population and Households Projections, 2011–2031 Page 85
2.4.5 Indigenous households by household type by FACS regions (con’t)
Households by household type by FACS regions
Family and Community Services (FACS) Year Couple only Couple with dependent
children
Other household
Single parent with dependent
children
Single person
Total households
Sou
th W
estern Syd
ney
2001 431 1,348 837 1,113 392 4,121
2006 607 1,214 911 1,224 514 4,470
2011 795 1,584 1,300 1,443 700 5,822
2016 1,091 1,876 1,746 1,712 966 7,390
2021 1,553 2,302 2,429 2,105 1,380 9,769
2026 1,862 2,381 2,849 2,181 1,663 10,936
2031 2,216 2,443 3,316 2,242 1,988 12,205
Sou
thern
NSW
2001 201 435 264 401 215 1,516
2006 278 509 355 433 274 1,849
2011 444 667 401 538 367 2,417
2016 701 881 502 666 506 3,256
2021 1,113 1,170 631 829 701 4,444
2026 1,473 1,294 661 860 810 5,097
2031 1,928 1,417 686 882 926 5,839
Sydn
ey
2001 268 315 572 439 390 1,984
2006 351 244 560 481 554 2,190
2011 392 308 701 495 673 2,569
2016 444 315 779 501 825 2,865
2021 601 385 1,034 605 1,206 3,831
2026 670 387 1,130 602 1,453 4,242
2031 740 385 1,223 593 1,733 4,674
Western
NSW
2001 732 2,087 1,186 1,734 801 6,540
2006 968 2,141 1,400 1,954 1,058 7,521
2011 1,384 2,505 1,769 2,268 1,564 9,490
2016 2,353 3,433 2,682 3,197 2,713 14,378
2021 3,538 4,161 3,596 3,984 4,164 19,443
2026 4,433 4,203 4,019 4,139 5,324 22,119
2031 5,495 4,200 4,443 4,253 6,735 25,125
Western
Sydn
ey
2001 471 956 805 1,023 398 3,653
2006 552 933 870 1,170 592 4,117
2011 594 1,128 1,181 1,260 634 4,797
2016 764 1,473 1,724 1,608 875 6,444
2021 954 1,867 2,441 1,992 1,171 8,425
2026 1,002 1,993 2,911 2,078 1,320 9,304
2031 1,049 2,117 3,455 2,157 1,482 10,260
(continued next page)
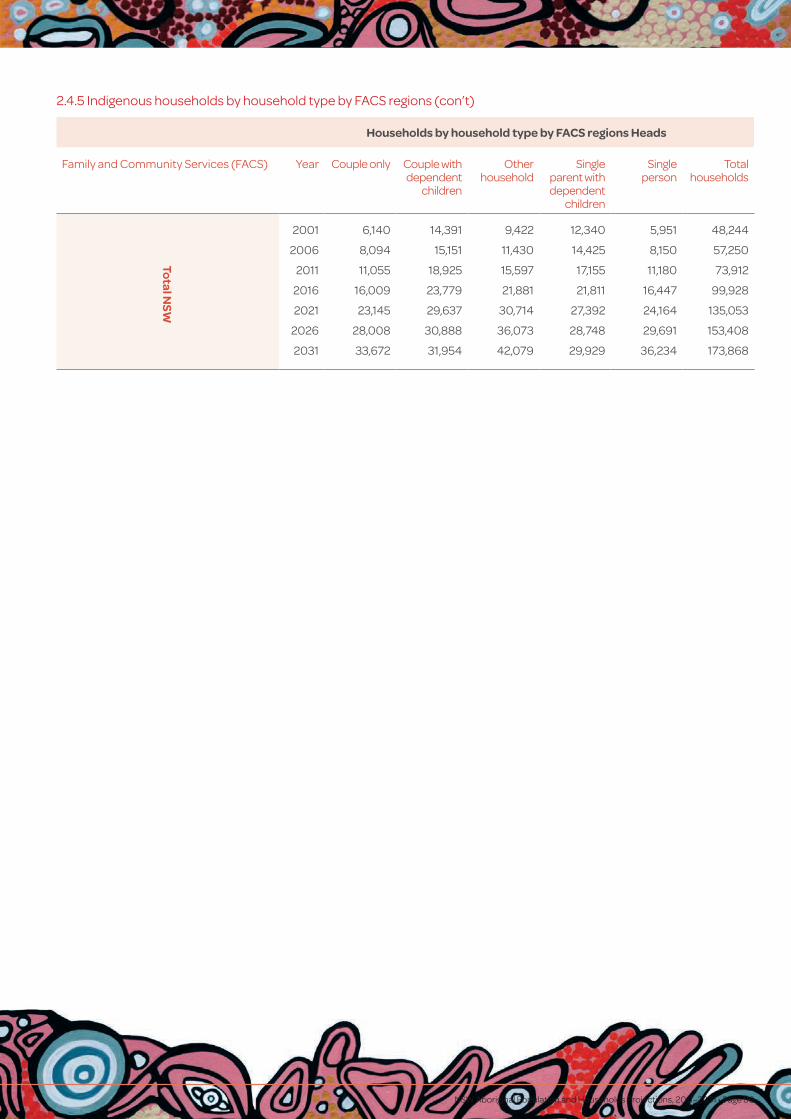
NSW Aboriginal Population and Households Projections, 2011–2031 • Page 86
Households by household type by FACS regions Heads
Family and Community Services (FACS) Year Couple only Couple with dependent
children
Other household
Single parent with dependent
children
Single person
Total households
Total NSW
2001 6,140 14,391 9,422 12,340 5,951 48,244
2006 8,094 15,151 11,430 14,425 8,150 57,250
2011 11,055 18,925 15,597 17,155 11,180 73,912
2016 16,009 23,779 21,881 21,811 16,447 99,928
2021 23,145 29,637 30,714 27,392 24,164 135,053
2026 28,008 30,888 36,073 28,748 29,691 153,408
2031 33,672 31,954 42,079 29,929 36,234 173,868
2.4.5 Indigenous households by household type by FACS regions (con’t)
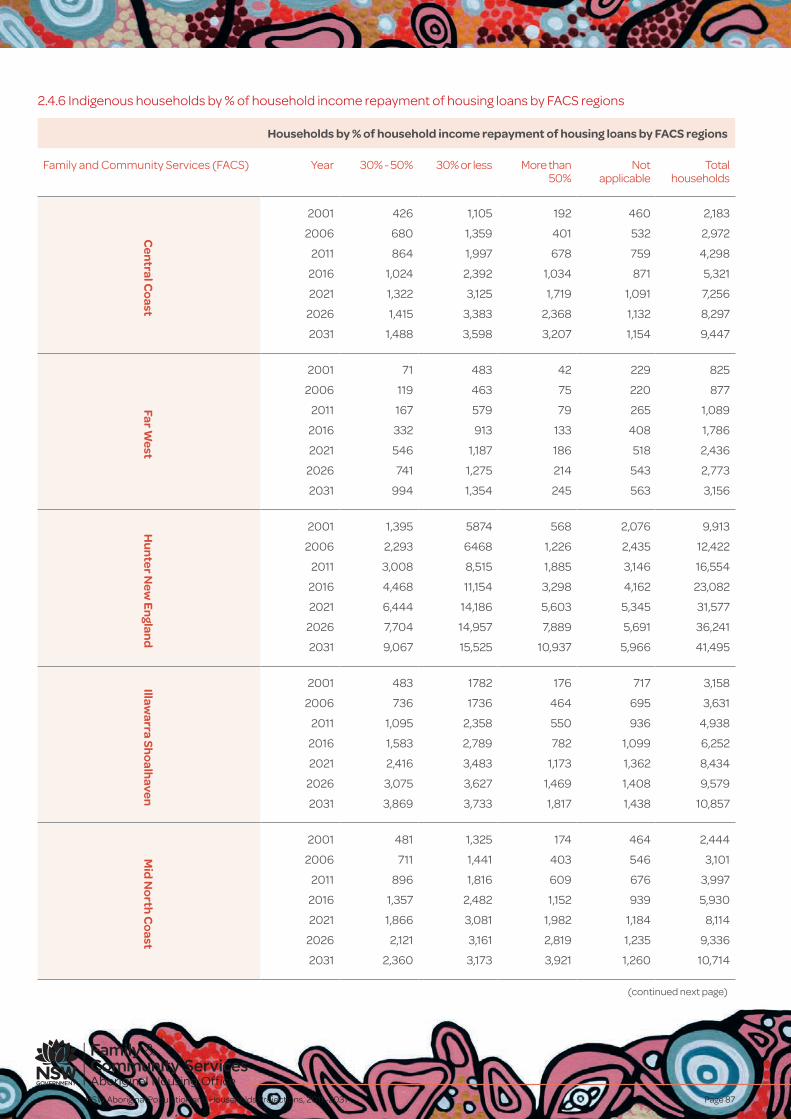
NSW Aboriginal Population and Households Projections, 2011–2031 Page 87
2.4.6 Indigenous households by % of household income repayment of housing loans by FACS regions
Households by % of household income repayment of housing loans by FACS regions
Family and Community Services (FACS) Year 30% - 50% 30% or less More than 50%
Not applicable
Total households
Central C
oast
2001 426 1,105 192 460 2,183
2006 680 1,359 401 532 2,972
2011 864 1,997 678 759 4,298
2016 1,024 2,392 1,034 871 5,321
2021 1,322 3,125 1,719 1,091 7,256
2026 1,415 3,383 2,368 1,132 8,297
2031 1,488 3,598 3,207 1,154 9,447
Far West
2001 71 483 42 229 825
2006 119 463 75 220 877
2011 167 579 79 265 1,089
2016 332 913 133 408 1,786
2021 546 1,187 186 518 2,436
2026 741 1,275 214 543 2,773
2031 994 1,354 245 563 3,156
Hu
nter New
En
gland
2001 1,395 5874 568 2,076 9,913
2006 2,293 6468 1,226 2,435 12,422
2011 3,008 8,515 1,885 3,146 16,554
2016 4,468 11,154 3,298 4,162 23,082
2021 6,444 14,186 5,603 5,345 31,577
2026 7,704 14,957 7,889 5,691 36,241
2031 9,067 15,525 10,937 5,966 41,495Illaw
arra Sho
alhaven
2001 483 1782 176 717 3,158
2006 736 1736 464 695 3,631
2011 1,095 2,358 550 936 4,938
2016 1,583 2,789 782 1,099 6,252
2021 2,416 3,483 1,173 1,362 8,434
2026 3,075 3,627 1,469 1,408 9,579
2031 3,869 3,733 1,817 1,438 10,857
Mid
No
rth C
oast
2001 481 1,325 174 464 2,444
2006 711 1,441 403 546 3,101
2011 896 1,816 609 676 3,997
2016 1,357 2,482 1,152 939 5,930
2021 1,866 3,081 1,982 1,184 8,114
2026 2,121 3,161 2,819 1,235 9,336
2031 2,360 3,173 3,921 1,260 10,714
(continued next page)
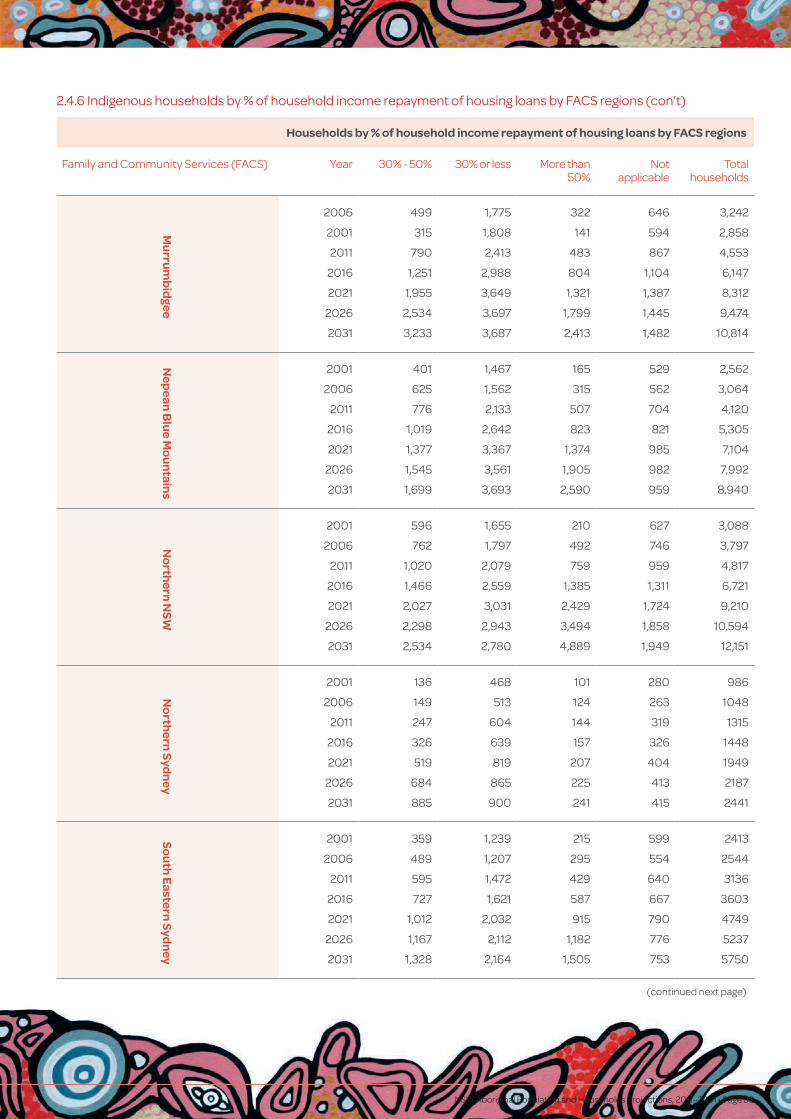
NSW Aboriginal Population and Households Projections, 2011–2031 • Page 88
Households by % of household income repayment of housing loans by FACS regions
Family and Community Services (FACS) Year 30% - 50% 30% or less More than 50%
Not applicable
Total households
Mu
rrum
bid
gee
2006 499 1,775 322 646 3,242
2001 315 1,808 141 594 2,858
2011 790 2,413 483 867 4,553
2016 1,251 2,988 804 1,104 6,147
2021 1,955 3,649 1,321 1,387 8,312
2026 2,534 3,697 1,799 1,445 9,474
2031 3,233 3,687 2,413 1,482 10,814
Nep
ean B
lue M
ou
ntains
2001 401 1,467 165 529 2,562
2006 625 1,562 315 562 3,064
2011 776 2,133 507 704 4,120
2016 1,019 2,642 823 821 5,305
2021 1,377 3,367 1,374 985 7,104
2026 1,545 3,561 1,905 982 7,992
2031 1,699 3,693 2,590 959 8,940
No
rthern
NSW
2001 596 1,655 210 627 3,088
2006 762 1,797 492 746 3,797
2011 1,020 2,079 759 959 4,817
2016 1,466 2,559 1,385 1,311 6,721
2021 2,027 3,031 2,429 1,724 9,210
2026 2,298 2,943 3,494 1,858 10,594
2031 2,534 2,780 4,889 1,949 12,151
No
rthern
Sydn
ey
2001 136 468 101 280 986
2006 149 513 124 263 1048
2011 247 604 144 319 1315
2016 326 639 157 326 1448
2021 519 819 207 404 1949
2026 684 865 225 413 2187
2031 885 900 241 415 2441
Sou
th E
astern Syd
ney
2001 359 1,239 215 599 2413
2006 489 1,207 295 554 2544
2011 595 1,472 429 640 3136
2016 727 1,621 587 667 3603
2021 1,012 2,032 915 790 4749
2026 1,167 2,112 1,182 776 5237
2031 1,328 2,164 1,505 753 5750
(continued next page)
2.4.6 Indigenous households by % of household income repayment of housing loans by FACS regions (con’t)

NSW Aboriginal Population and Households Projections, 2011–2031 Page 89
2.4.6 Indigenous households by % of household income repayment of housing loans by FACS regions (con’t)
Households by % of household income repayment of housing loans by FACS regions
Family and Community Services (FACS) Year 30% - 50% 30% or less More than 50%
Not applicable
Total households
Sou
th W
estern Syd
ney
2001 543 2,566 282 730 4121
2006 875 2,224 566 805 4470
2011 1,181 2,916 740 985 5822
2016 1,702 3,395 1,100 1193 7390
2021 2,526 4,071 1,684 1488 9769
2026 3,138 4,087 2,158 1553 10936
2031 3,841 4,041 2,725 1,598 12,205
Sou
thern
NSW
2001 218 918 56 323 1,516
2006 310 1,018 195 325 1,849
2011 428 1,270 300 419 2,417
2016 616 1,575 552 513 3,256
2021 877 1,935 1,009 622 4,444
2026 1,023 1,947 1,510 617 5,097
2031 1,157 1,898 2,190 594 5,839
Sydn
ey
2001 302 1,205 165 313 1,984
2006 436 1,158 267 329 2,190
2011 497 1,376 340 356 2,569
2016 587 1,467 444 367 2,865
2021 825 1,863 691 452 3,831
2026 955 1,946 883 457 4,242
2031 1,092 2,009 1,117 457 4,674W
estern N
SW
2001 746 4,027 317 1,450 6,540
2006 1,108 4,178 636 1,599 7,521
2011 1,398 5,253 804 2,035 9,490
2016 2,280 7,634 1,417 3,046 14,378
2021 3,308 9,862 2,220 4,053 19,443
2026 4,018 10,671 2,913 4,516 22,119
2031 4,851 11,474 3,798 5,001 25,125
Western
Sydn
ey
2001 467 2,258 232 696 3,653
2006 781 2,190 496 649 4,117
2011 936 2,465 600 796 4,797
2016 1,419 3,033 968 1,024 6,444
2021 2,069 3,588 1,502 1,266 8,425
2026 2,516 3,541 1,942 1,306 9,304
2031 3,014 3,443 2,475 1,327 10,260
(continued next page)
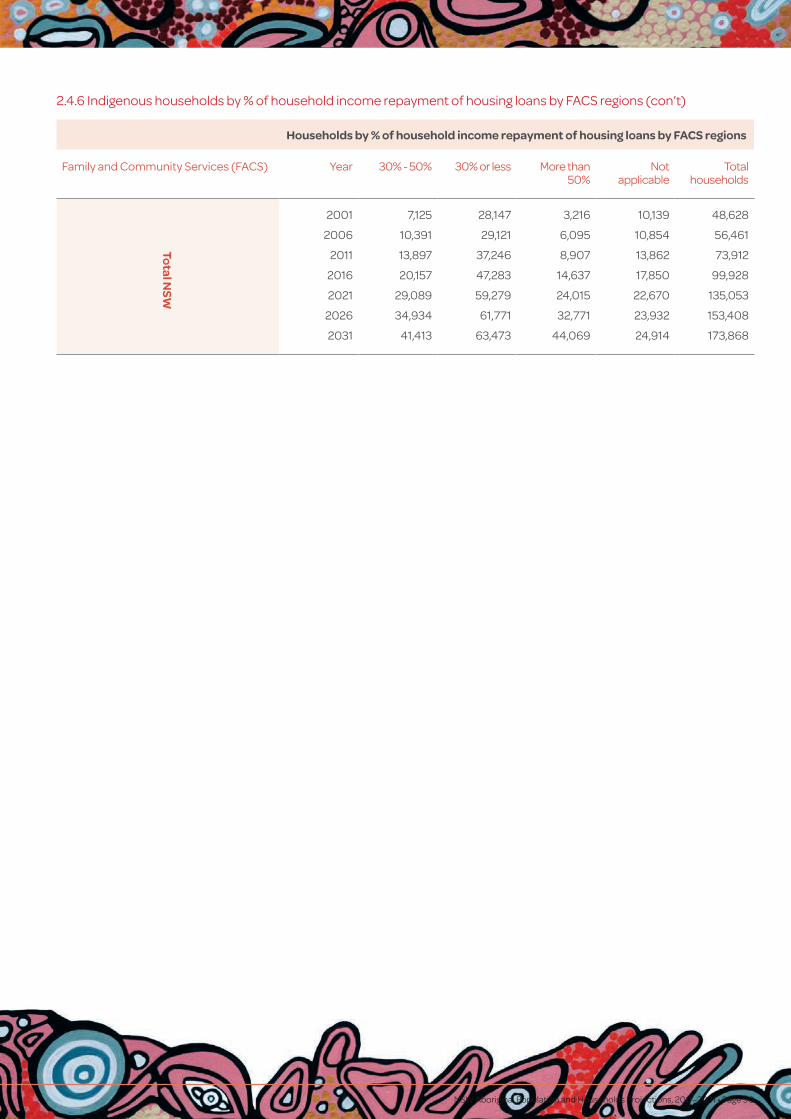
NSW Aboriginal Population and Households Projections, 2011–2031 • Page 90
Households by % of household income repayment of housing loans by FACS regions
Family and Community Services (FACS) Year 30% - 50% 30% or less More than 50%
Not applicable
Total households
Total NSW
2001 7,125 28,147 3,216 10,139 48,628
2006 10,391 29,121 6,095 10,854 56,461
2011 13,897 37,246 8,907 13,862 73,912
2016 20,157 47,283 14,637 17,850 99,928
2021 29,089 59,279 24,015 22,670 135,053
2026 34,934 61,771 32,771 23,932 153,408
2031 41,413 63,473 44,069 24,914 173,868
2.4.6 Indigenous households by % of household income repayment of housing loans by FACS regions (con’t)

NSW Aboriginal Population and Households Projections, 2011–2031 Page 91
2.4.7 Indigenous households by equalized weekly household income by FACS regions
Households by equalized weekly household income by FACS regions
Family and Community Services (FACS) Year Above Sydney median
Below or equal to NSW median
From NSW median to below or equal
to Sydney median
Total households
Central C
oast
2001 509 1,460 214 2,183
2006 733 2,049 191 2,972
2011 1,173 2,837 288 4,298
2016 1,546 3,534 241 5,321
2021 2,252 4,788 216 7,256
2026 2,739 5,440 118 8,297
2031 3,302 6,145 361 9,447
Far West
2001 104 666 55 825
2006 115 727 36 877
2011 172 871 45 1,089
2016 305 1,438 43 1,786
2021 456 1,952 27 2,436
2026 564 2,209 64 2,773
2031 685 2,471 60 3,156
Hu
nter New
En
gland
2001 1,671 7,528 713 9,913
2006 2,492 9,217 712 12,422
2011 3,960 11,622 972 16,554
2016 6,312 15,629 1,141 23,082
2021 9,750 20,475 1,352 31,577
2026 12,470 22,459 1,312 36,241
2031 15,743 24,524 1,227 41,495Illaw
arra Sho
alhaven
2001 695 2,252 212 3,158
2006 799 2,641 191 3,631
2011 1,204 3,459 275 4,938
2016 1,574 4,384 294 6,252
2021 2,225 5,861 348 8,434
2026 2,641 6,597 341 9,579
2031 3,123 7,410 324 10,857
Mid
No
rth C
oast
2001 246 2,065 134 2,444
2006 409 2,571 121 3,101
2011 584 3,209 205 3,997
2016 1,018 4,646 266 5,930
2021 1,577 6,187 349 8,114
2026 2,027 6,923 386 9,336
2031 2,570 7,719 424 10,714
(continued next page)
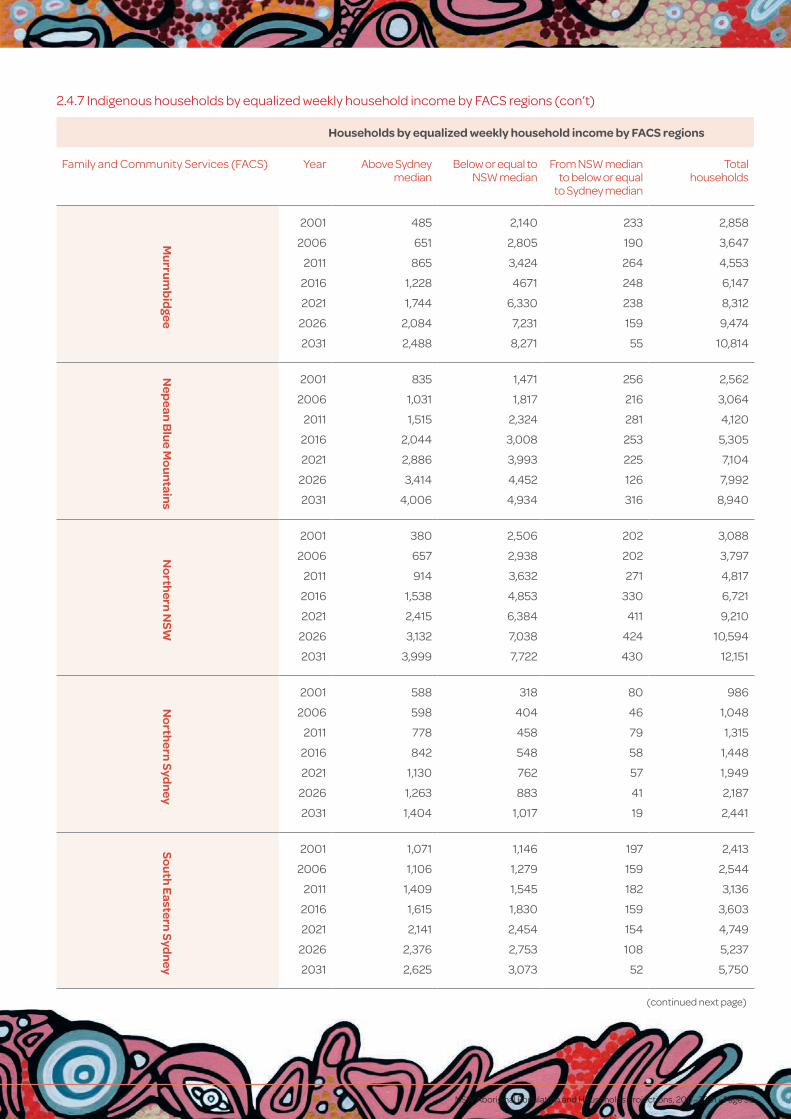
NSW Aboriginal Population and Households Projections, 2011–2031 • Page 92
Households by equalized weekly household income by FACS regions
Family and Community Services (FACS) Year Above Sydney median
Below or equal to NSW median
From NSW median to below or equal
to Sydney median
Total households
Mu
rrum
bid
gee
2001 485 2,140 233 2,858
2006 651 2,805 190 3,647
2011 865 3,424 264 4,553
2016 1,228 4671 248 6,147
2021 1,744 6,330 238 8,312
2026 2,084 7,231 159 9,474
2031 2,488 8,271 55 10,814
Nep
ean B
lue M
ou
ntains
2001 835 1,471 256 2,562
2006 1,031 1,817 216 3,064
2011 1,515 2,324 281 4,120
2016 2,044 3,008 253 5,305
2021 2,886 3,993 225 7,104
2026 3,414 4,452 126 7,992
2031 4,006 4,934 316 8,940
No
rthern
NSW
2001 380 2,506 202 3,088
2006 657 2,938 202 3,797
2011 914 3,632 271 4,817
2016 1,538 4,853 330 6,721
2021 2,415 6,384 411 9,210
2026 3,132 7,038 424 10,594
2031 3,999 7,722 430 12,151
No
rthern
Sydn
ey
2001 588 318 80 986
2006 598 404 46 1,048
2011 778 458 79 1,315
2016 842 548 58 1,448
2021 1,130 762 57 1,949
2026 1,263 883 41 2,187
2031 1,404 1,017 19 2,441
Sou
th E
astern Syd
ney
2001 1,071 1,146 197 2,413
2006 1,106 1,279 159 2,544
2011 1,409 1,545 182 3,136
2016 1,615 1,830 159 3,603
2021 2,141 2,454 154 4,749
2026 2,376 2,753 108 5,237
2031 2,625 3,073 52 5,750
(continued next page)
2.4.7 Indigenous households by equalized weekly household income by FACS regions (con’t)
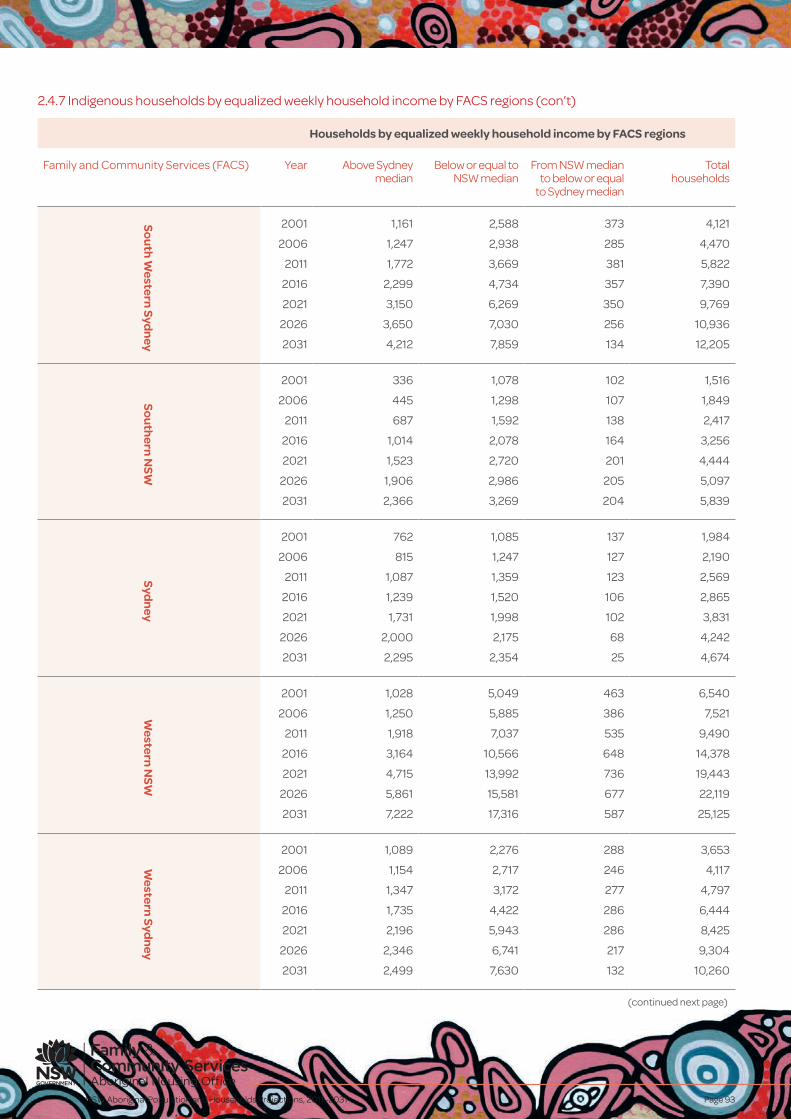
NSW Aboriginal Population and Households Projections, 2011–2031 Page 93
2.4.7 Indigenous households by equalized weekly household income by FACS regions (con’t)
Households by equalized weekly household income by FACS regions
Family and Community Services (FACS) Year Above Sydney median
Below or equal to NSW median
From NSW median to below or equal
to Sydney median
Total households
Sou
th W
estern Syd
ney
2001 1,161 2,588 373 4,121
2006 1,247 2,938 285 4,470
2011 1,772 3,669 381 5,822
2016 2,299 4,734 357 7,390
2021 3,150 6,269 350 9,769
2026 3,650 7,030 256 10,936
2031 4,212 7,859 134 12,205
Sou
thern
NSW
2001 336 1,078 102 1,516
2006 445 1,298 107 1,849
2011 687 1,592 138 2,417
2016 1,014 2,078 164 3,256
2021 1,523 2,720 201 4,444
2026 1,906 2,986 205 5,097
2031 2,366 3,269 204 5,839
Sydn
ey
2001 762 1,085 137 1,984
2006 815 1,247 127 2,190
2011 1,087 1,359 123 2,569
2016 1,239 1,520 106 2,865
2021 1,731 1,998 102 3,831
2026 2,000 2,175 68 4,242
2031 2,295 2,354 25 4,674W
estern N
SW
2001 1,028 5,049 463 6,540
2006 1,250 5,885 386 7,521
2011 1,918 7,037 535 9,490
2016 3,164 10,566 648 14,378
2021 4,715 13,992 736 19,443
2026 5,861 15,581 677 22,119
2031 7,222 17,316 587 25,125
Western
Sydn
ey
2001 1,089 2,276 288 3,653
2006 1,154 2,717 246 4,117
2011 1,347 3,172 277 4,797
2016 1,735 4,422 286 6,444
2021 2,196 5,943 286 8,425
2026 2,346 6,741 217 9,304
2031 2,499 7,630 132 10,260
(continued next page)
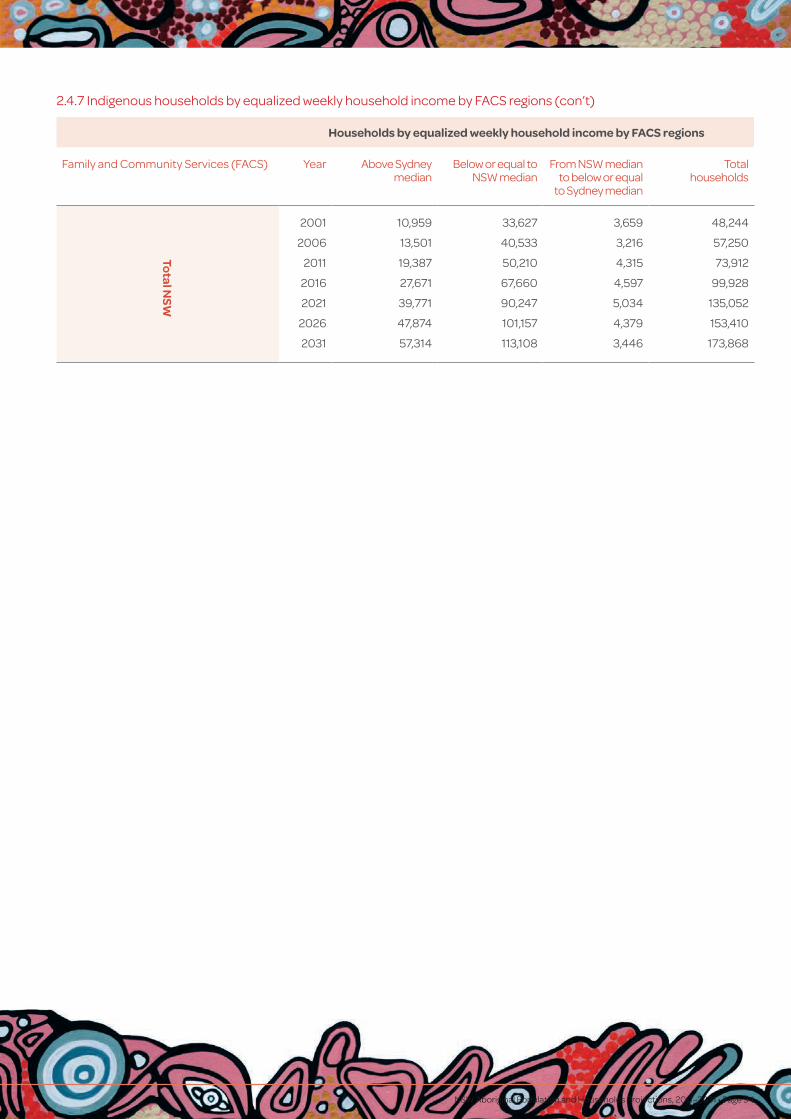
NSW Aboriginal Population and Households Projections, 2011–2031 • Page 94
Households by equalized weekly household income by FACS regions
Family and Community Services (FACS) Year Above Sydney median
Below or equal to NSW median
From NSW median to below or equal
to Sydney median
Total households
Total NSW
2001 10,959 33,627 3,659 48,244
2006 13,501 40,533 3,216 57,250
2011 19,387 50,210 4,315 73,912
2016 27,671 67,660 4,597 99,928
2021 39,771 90,247 5,034 135,052
2026 47,874 101,157 4,379 153,410
2031 57,314 113,108 3,446 173,868
2.4.7 Indigenous households by equalized weekly household income by FACS regions (con’t)
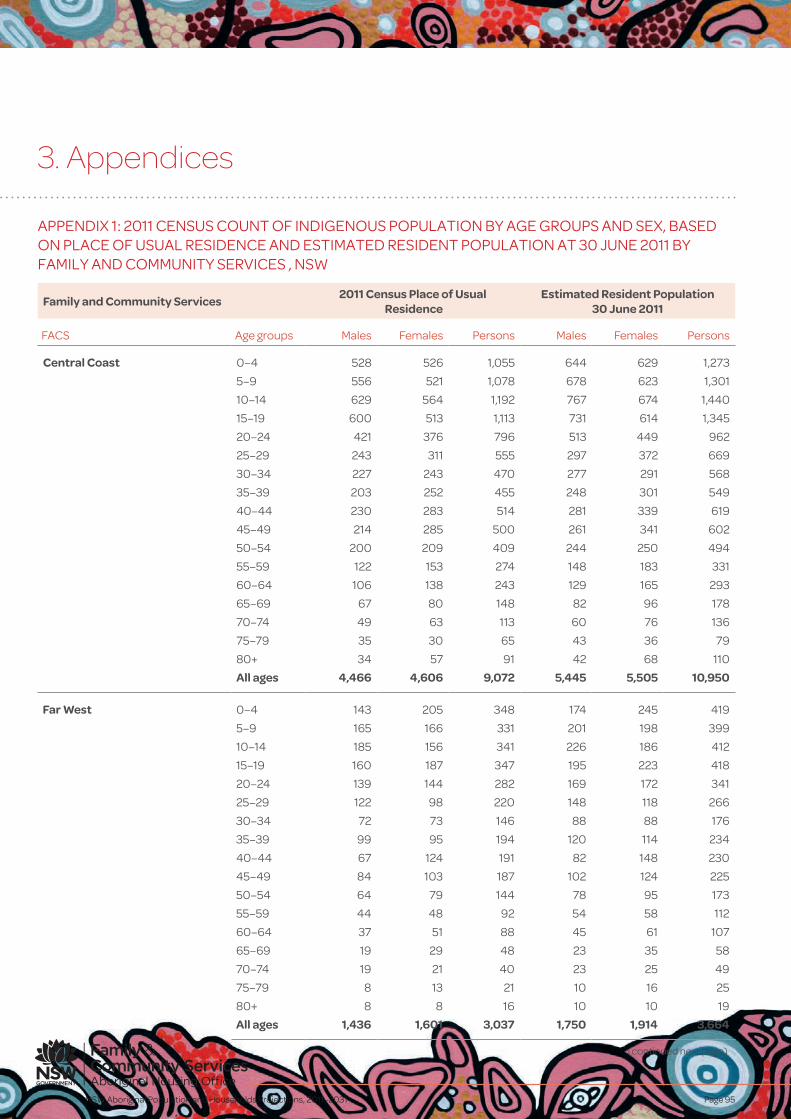
NSW Aboriginal Population and Households Projections, 2011–2031 Page 95
3. Appendices
Family and Community Services 2011 Census Place of Usual
ResidenceEstimated Resident Population
30 June 2011
FACS Age groups Males Females Persons Males Females Persons
Central Coast 0–4 528 526 1,055 644 629 1,273
5–9 556 521 1,078 678 623 1,301
10–14 629 564 1,192 767 674 1,440
15–19 600 513 1,113 731 614 1,345
20–24 421 376 796 513 449 962
25–29 243 311 555 297 372 669
30–34 227 243 470 277 291 568
35–39 203 252 455 248 301 549
40–44 230 283 514 281 339 619
45–49 214 285 500 261 341 602
50–54 200 209 409 244 250 494
55–59 122 153 274 148 183 331
60–64 106 138 243 129 165 293
65–69 67 80 148 82 96 178
70–74 49 63 113 60 76 136
75–79 35 30 65 43 36 79
80+ 34 57 91 42 68 110
All ages 4,466 4,606 9,072 5,445 5,505 10,950
Far West 0–4 143 205 348 174 245 419
5–9 165 166 331 201 198 399
10–14 185 156 341 226 186 412
15–19 160 187 347 195 223 418
20–24 139 144 282 169 172 341
25–29 122 98 220 148 118 266
30–34 72 73 146 88 88 176
35–39 99 95 194 120 114 234
40–44 67 124 191 82 148 230
45–49 84 103 187 102 124 225
50–54 64 79 144 78 95 173
55–59 44 48 92 54 58 112
60–64 37 51 88 45 61 107
65–69 19 29 48 23 35 58
70–74 19 21 40 23 25 49
75–79 8 13 21 10 16 25
80+ 8 8 16 10 10 19
All ages 1,436 1,601 3,037 1,750 1,914 3,664
APPENDIX 1: 2011 CENSUS COUNT OF INDIGENOUS POPULATION BY AGE GROUPS AND SEX, BASED ON PLACE OF USUAL RESIDENCE AND ESTIMATED RESIDENT POPULATION AT 30 JUNE 2011 BY FAMILY AND COMMUNITY SERVICES , NSW
(continued next page)
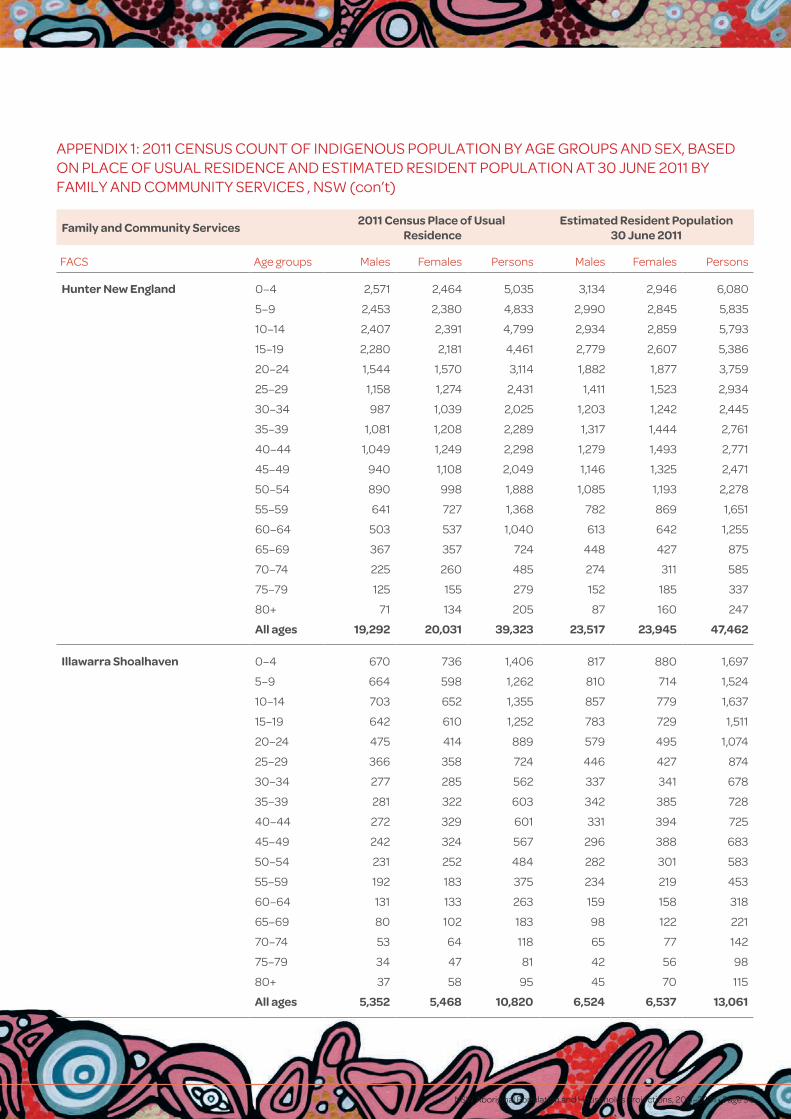
NSW Aboriginal Population and Households Projections, 2011–2031 • Page 96
Family and Community Services 2011 Census Place of Usual
ResidenceEstimated Resident Population
30 June 2011
FACS Age groups Males Females Persons Males Females Persons
Hunter New England 0–4 2,571 2,464 5,035 3,134 2,946 6,080
5–9 2,453 2,380 4,833 2,990 2,845 5,835
10–14 2,407 2,391 4,799 2,934 2,859 5,793
15–19 2,280 2,181 4,461 2,779 2,607 5,386
20–24 1,544 1,570 3,114 1,882 1,877 3,759
25–29 1,158 1,274 2,431 1,411 1,523 2,934
30–34 987 1,039 2,025 1,203 1,242 2,445
35–39 1,081 1,208 2,289 1,317 1,444 2,761
40–44 1,049 1,249 2,298 1,279 1,493 2,771
45–49 940 1,108 2,049 1,146 1,325 2,471
50–54 890 998 1,888 1,085 1,193 2,278
55–59 641 727 1,368 782 869 1,651
60–64 503 537 1,040 613 642 1,255
65–69 367 357 724 448 427 875
70–74 225 260 485 274 311 585
75–79 125 155 279 152 185 337
80+ 71 134 205 87 160 247
All ages 19,292 20,031 39,323 23,517 23,945 47,462
Illawarra Shoalhaven 0–4 670 736 1,406 817 880 1,697
5–9 664 598 1,262 810 714 1,524
10–14 703 652 1,355 857 779 1,637
15–19 642 610 1,252 783 729 1,511
20–24 475 414 889 579 495 1,074
25–29 366 358 724 446 427 874
30–34 277 285 562 337 341 678
35–39 281 322 603 342 385 728
40–44 272 329 601 331 394 725
45–49 242 324 567 296 388 683
50–54 231 252 484 282 301 583
55–59 192 183 375 234 219 453
60–64 131 133 263 159 158 318
65–69 80 102 183 98 122 221
70–74 53 64 118 65 77 142
75–79 34 47 81 42 56 98
80+ 37 58 95 45 70 115
All ages 5,352 5,468 10,820 6,524 6,537 13,061
APPENDIX 1: 2011 CENSUS COUNT OF INDIGENOUS POPULATION BY AGE GROUPS AND SEX, BASED ON PLACE OF USUAL RESIDENCE AND ESTIMATED RESIDENT POPULATION AT 30 JUNE 2011 BY FAMILY AND COMMUNITY SERVICES , NSW (con’t)
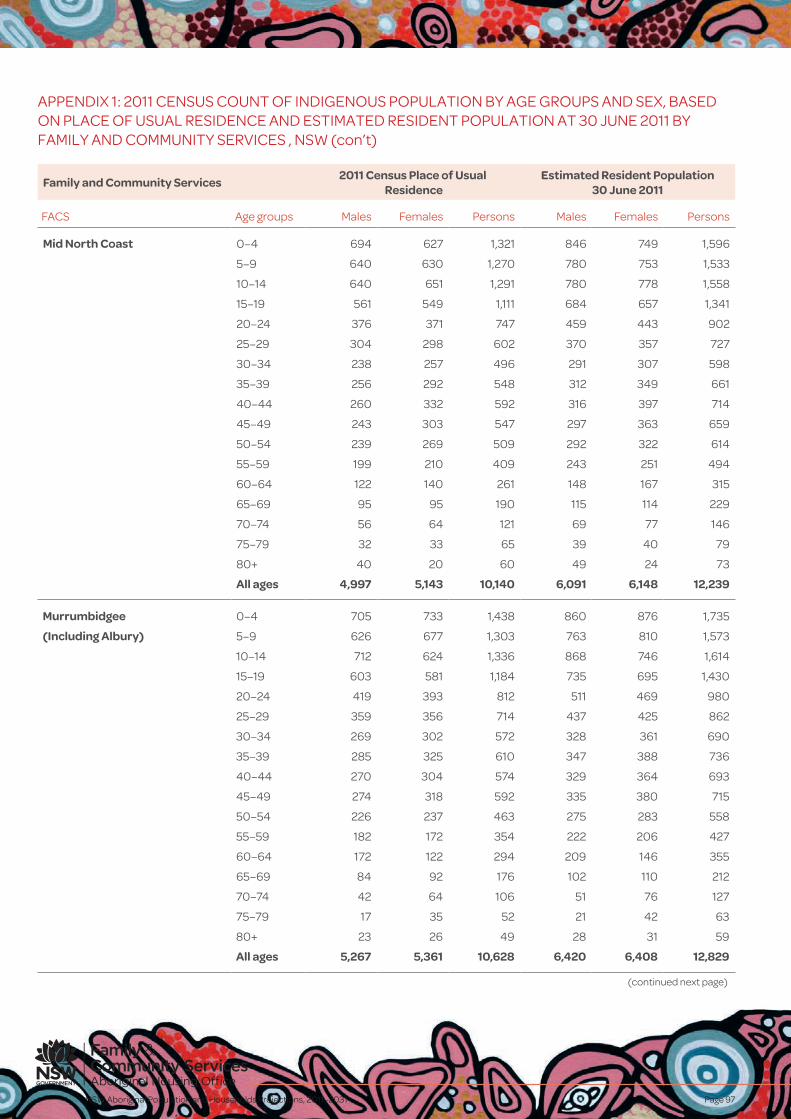
NSW Aboriginal Population and Households Projections, 2011–2031 Page 97
Family and Community Services 2011 Census Place of Usual
ResidenceEstimated Resident Population
30 June 2011
FACS Age groups Males Females Persons Males Females Persons
Mid North Coast 0–4 694 627 1,321 846 749 1,596
5–9 640 630 1,270 780 753 1,533
10–14 640 651 1,291 780 778 1,558
15–19 561 549 1,111 684 657 1,341
20–24 376 371 747 459 443 902
25–29 304 298 602 370 357 727
30–34 238 257 496 291 307 598
35–39 256 292 548 312 349 661
40–44 260 332 592 316 397 714
45–49 243 303 547 297 363 659
50–54 239 269 509 292 322 614
55–59 199 210 409 243 251 494
60–64 122 140 261 148 167 315
65–69 95 95 190 115 114 229
70–74 56 64 121 69 77 146
75–79 32 33 65 39 40 79
80+ 40 20 60 49 24 73
All ages 4,997 5,143 10,140 6,091 6,148 12,239
Murrumbidgee 0–4 705 733 1,438 860 876 1,735
(Including Albury) 5–9 626 677 1,303 763 810 1,573
10–14 712 624 1,336 868 746 1,614
15–19 603 581 1,184 735 695 1,430
20–24 419 393 812 511 469 980
25–29 359 356 714 437 425 862
30–34 269 302 572 328 361 690
35–39 285 325 610 347 388 736
40–44 270 304 574 329 364 693
45–49 274 318 592 335 380 715
50–54 226 237 463 275 283 558
55–59 182 172 354 222 206 427
60–64 172 122 294 209 146 355
65–69 84 92 176 102 110 212
70–74 42 64 106 51 76 127
75–79 17 35 52 21 42 63
80+ 23 26 49 28 31 59
All ages 5,267 5,361 10,628 6,420 6,408 12,829
(continued next page)
APPENDIX 1: 2011 CENSUS COUNT OF INDIGENOUS POPULATION BY AGE GROUPS AND SEX, BASED ON PLACE OF USUAL RESIDENCE AND ESTIMATED RESIDENT POPULATION AT 30 JUNE 2011 BY FAMILY AND COMMUNITY SERVICES , NSW (con’t)

NSW Aboriginal Population and Households Projections, 2011–2031 • Page 98
Family and Community Services 2011 Census Place of Usual
ResidenceEstimated Resident Population
30 June 2011
FACS Age groups Males Females Persons Males Females Persons
Nepean Blue Mountains 0–4 550 554 1,105 671 663 1,334
5–9 588 476 1,064 716 569 1,285
10–14 624 542 1,166 760 648 1,409
15–19 533 535 1,069 650 640 1,290
20–24 456 420 876 556 502 1,058
25–29 308 318 626 375 381 756
30–34 242 270 513 296 323 619
35–39 261 310 571 318 371 689
40–44 247 299 546 301 358 658
45–49 211 278 490 258 333 590
50–54 197 212 409 240 253 494
55–59 146 153 299 178 183 360
60–64 122 104 226 148 125 273
65–69 66 77 144 81 92 173
70–74 42 34 76 52 41 92
75–79 25 20 45 31 24 55
80+ 5 28 33 6 34 40
All ages 4,623 4,634 9,257 5,636 5,539 11,175
Northern NSW 0–4 774 668 1,442 944 798 1,742
5–9 709 686 1,394 864 820 1,683
10–14 746 733 1,479 910 876 1,785
15–19 654 669 1,323 797 799 1,597
20–24 404 391 795 493 467 959
25–29 320 335 655 389 401 790
30–34 289 310 599 352 371 723
35–39 291 390 681 354 467 821
40–44 327 387 714 399 462 861
45–49 264 332 596 322 397 719
50–54 269 288 557 328 344 672
55–59 207 223 430 252 267 519
60–64 139 160 299 170 191 361
65–69 108 94 201 131 112 243
70–74 63 64 127 76 77 153
75–79 46 45 92 57 54 111
80+ 20 66 86 25 79 104
All ages 5,630 5,841 11,472 6,864 6,983 13,846
(continued next page)
APPENDIX 1: 2011 CENSUS COUNT OF INDIGENOUS POPULATION BY AGE GROUPS AND SEX, BASED ON PLACE OF USUAL RESIDENCE AND ESTIMATED RESIDENT POPULATION AT 30 JUNE 2011 BY FAMILY AND COMMUNITY SERVICES , NSW (con’t)

NSW Aboriginal Population and Households Projections, 2011–2031 Page 99
Family and Community Services 2011 Census Place of Usual
ResidenceEstimated Resident Population
30 June 2011
FACS Age groups Males Females Persons Males Females Persons
Northern Sydney 0–4 116 96 212 141 115 256
5–9 116 105 221 141 126 267
10–14 129 129 257 157 154 311
15–19 121 121 241 147 144 291
20–24 119 98 217 145 118 262
25–29 69 101 171 85 121 206
30–34 73 85 159 90 102 192
35–39 86 99 185 104 119 223
40–44 91 93 184 110 112 222
45–49 84 76 160 102 91 193
50–54 53 65 119 65 78 143
55–59 70 52 123 86 62 148
60–64 39 28 67 48 34 81
65–69 27 40 67 33 48 81
70–74 24 19 43 29 23 52
75–79 14 3 17 17 4 21
80+ 5 28 33 6 34 40
All ages 1,236 1,242 2,477 1,506 1,484 2,990
South Eastern Sydney 0–4 307 279 586 374 334 708
5–9 333 282 615 406 337 743
10–14 283 291 574 345 348 693
15–19 333 288 621 406 345 751
20–24 312 283 595 380 339 719
25–29 254 234 488 309 280 589
30–34 212 203 415 259 243 501
35–39 251 211 461 305 252 558
40–44 241 219 460 294 262 556
45–49 183 193 376 223 231 454
50–54 182 156 338 222 186 408
55–59 106 142 247 129 169 298
60–64 102 114 215 124 136 260
65–69 69 82 152 85 98 183
70–74 33 55 88 40 66 107
75–79 32 29 61 39 35 74
80+ 14 33 47 17 40 57
All ages 3,247 3,095 6,342 3,958 3,700 7,658
(continued next page)
APPENDIX 1: 2011 CENSUS COUNT OF INDIGENOUS POPULATION BY AGE GROUPS AND SEX, BASED ON PLACE OF USUAL RESIDENCE AND ESTIMATED RESIDENT POPULATION AT 30 JUNE 2011 BY FAMILY AND COMMUNITY SERVICES , NSW (con’t)
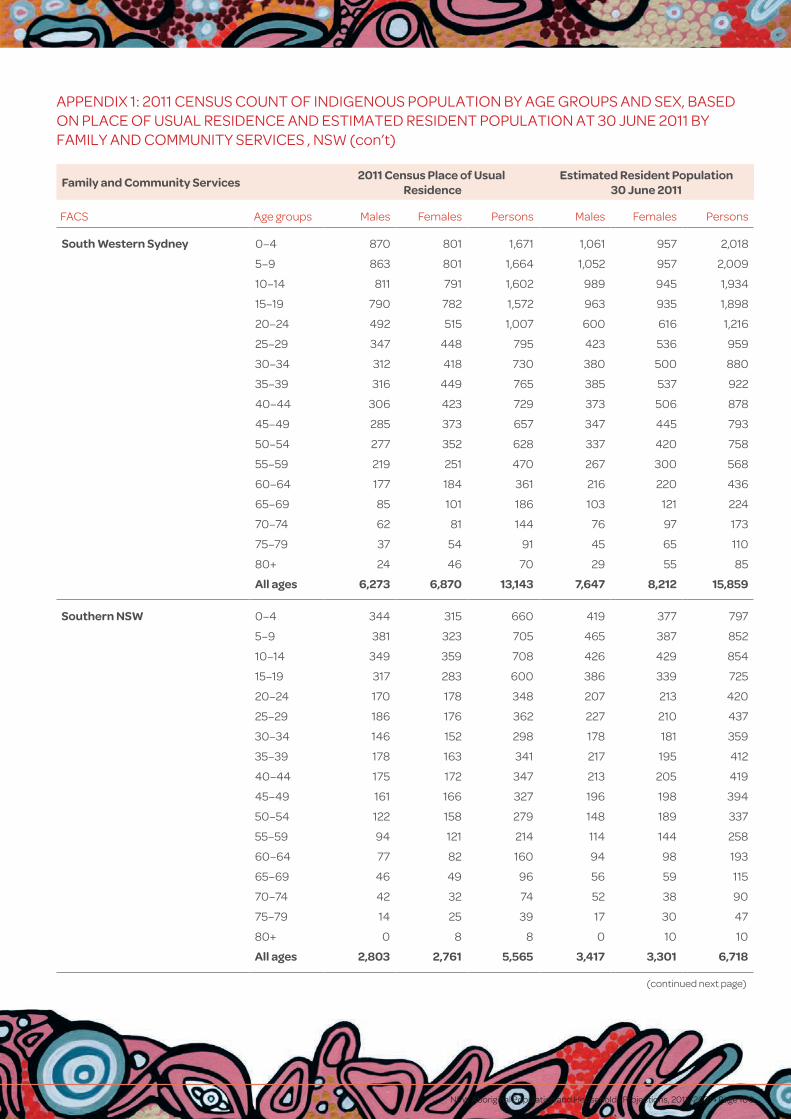
NSW Aboriginal Population and Households Projections, 2011–2031 • Page 100
Family and Community Services 2011 Census Place of Usual
ResidenceEstimated Resident Population
30 June 2011
FACS Age groups Males Females Persons Males Females Persons
South Western Sydney 0–4 870 801 1,671 1,061 957 2,018
5–9 863 801 1,664 1,052 957 2,009
10–14 811 791 1,602 989 945 1,934
15–19 790 782 1,572 963 935 1,898
20–24 492 515 1,007 600 616 1,216
25–29 347 448 795 423 536 959
30–34 312 418 730 380 500 880
35–39 316 449 765 385 537 922
40–44 306 423 729 373 506 878
45–49 285 373 657 347 445 793
50–54 277 352 628 337 420 758
55–59 219 251 470 267 300 568
60–64 177 184 361 216 220 436
65–69 85 101 186 103 121 224
70–74 62 81 144 76 97 173
75–79 37 54 91 45 65 110
80+ 24 46 70 29 55 85
All ages 6,273 6,870 13,143 7,647 8,212 15,859
Southern NSW 0–4 344 315 660 419 377 797
5–9 381 323 705 465 387 852
10–14 349 359 708 426 429 854
15–19 317 283 600 386 339 725
20–24 170 178 348 207 213 420
25–29 186 176 362 227 210 437
30–34 146 152 298 178 181 359
35–39 178 163 341 217 195 412
40–44 175 172 347 213 205 419
45–49 161 166 327 196 198 394
50–54 122 158 279 148 189 337
55–59 94 121 214 114 144 258
60–64 77 82 160 94 98 193
65–69 46 49 96 56 59 115
70–74 42 32 74 52 38 90
75–79 14 25 39 17 30 47
80+ 0 8 8 0 10 10
All ages 2,803 2,761 5,565 3,417 3,301 6,718
(continued next page)
APPENDIX 1: 2011 CENSUS COUNT OF INDIGENOUS POPULATION BY AGE GROUPS AND SEX, BASED ON PLACE OF USUAL RESIDENCE AND ESTIMATED RESIDENT POPULATION AT 30 JUNE 2011 BY FAMILY AND COMMUNITY SERVICES , NSW (con’t)
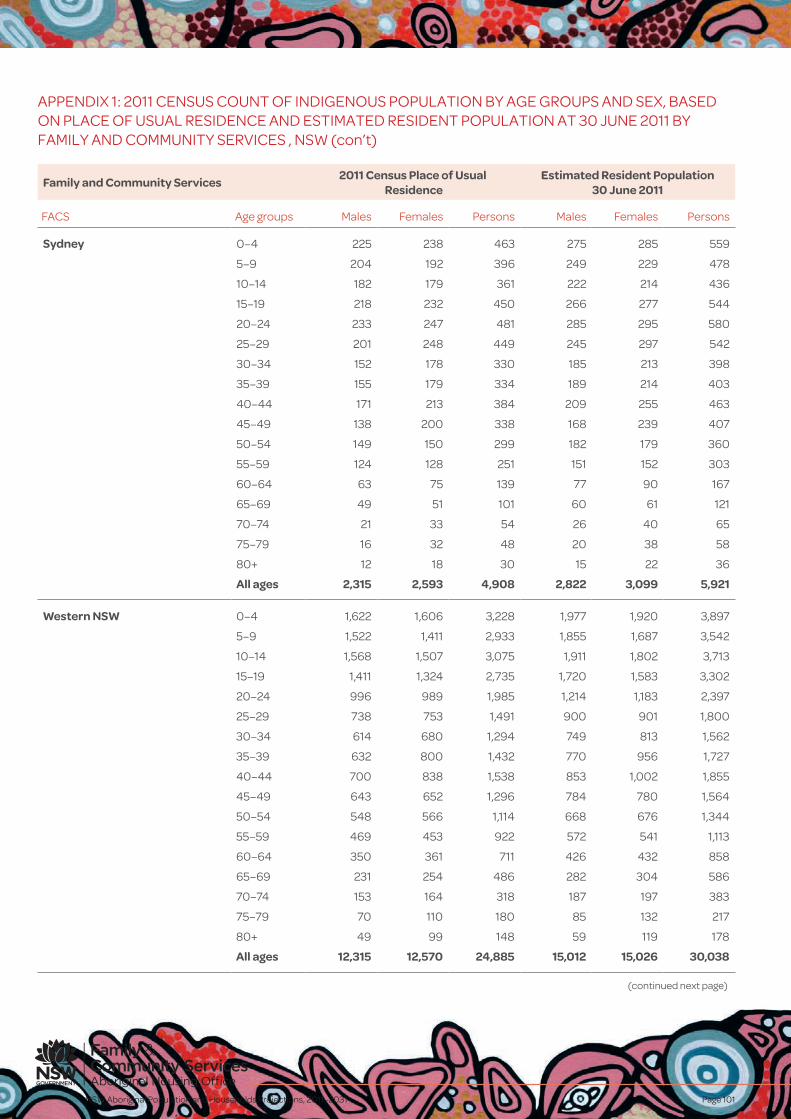
NSW Aboriginal Population and Households Projections, 2011–2031 Page 101
Family and Community Services 2011 Census Place of Usual
ResidenceEstimated Resident Population
30 June 2011
FACS Age groups Males Females Persons Males Females Persons
Sydney 0–4 225 238 463 275 285 559
5–9 204 192 396 249 229 478
10–14 182 179 361 222 214 436
15–19 218 232 450 266 277 544
20–24 233 247 481 285 295 580
25–29 201 248 449 245 297 542
30–34 152 178 330 185 213 398
35–39 155 179 334 189 214 403
40–44 171 213 384 209 255 463
45–49 138 200 338 168 239 407
50–54 149 150 299 182 179 360
55–59 124 128 251 151 152 303
60–64 63 75 139 77 90 167
65–69 49 51 101 60 61 121
70–74 21 33 54 26 40 65
75–79 16 32 48 20 38 58
80+ 12 18 30 15 22 36
All ages 2,315 2,593 4,908 2,822 3,099 5,921
Western NSW 0–4 1,622 1,606 3,228 1,977 1,920 3,897
5–9 1,522 1,411 2,933 1,855 1,687 3,542
10–14 1,568 1,507 3,075 1,911 1,802 3,713
15–19 1,411 1,324 2,735 1,720 1,583 3,302
20–24 996 989 1,985 1,214 1,183 2,397
25–29 738 753 1,491 900 901 1,800
30–34 614 680 1,294 749 813 1,562
35–39 632 800 1,432 770 956 1,727
40–44 700 838 1,538 853 1,002 1,855
45–49 643 652 1,296 784 780 1,564
50–54 548 566 1,114 668 676 1,344
55–59 469 453 922 572 541 1,113
60–64 350 361 711 426 432 858
65–69 231 254 486 282 304 586
70–74 153 164 318 187 197 383
75–79 70 110 180 85 132 217
80+ 49 99 148 59 119 178
All ages 12,315 12,570 24,885 15,012 15,026 30,038
APPENDIX 1: 2011 CENSUS COUNT OF INDIGENOUS POPULATION BY AGE GROUPS AND SEX, BASED ON PLACE OF USUAL RESIDENCE AND ESTIMATED RESIDENT POPULATION AT 30 JUNE 2011 BY FAMILY AND COMMUNITY SERVICES , NSW (con’t)
(continued next page)
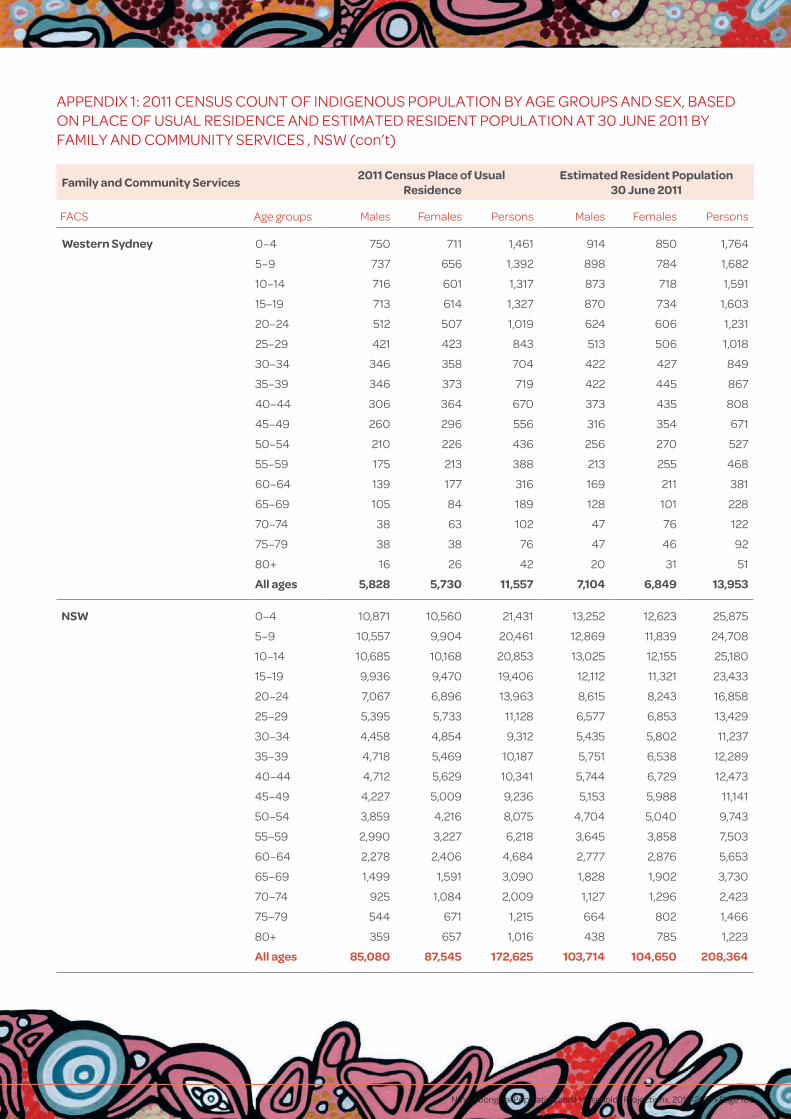
NSW Aboriginal Population and Households Projections, 2011–2031 • Page 102
Family and Community Services 2011 Census Place of Usual
ResidenceEstimated Resident Population
30 June 2011
FACS Age groups Males Females Persons Males Females Persons
Western Sydney 0–4 750 711 1,461 914 850 1,764
5–9 737 656 1,392 898 784 1,682
10–14 716 601 1,317 873 718 1,591
15–19 713 614 1,327 870 734 1,603
20–24 512 507 1,019 624 606 1,231
25–29 421 423 843 513 506 1,018
30–34 346 358 704 422 427 849
35–39 346 373 719 422 445 867
40–44 306 364 670 373 435 808
45–49 260 296 556 316 354 671
50–54 210 226 436 256 270 527
55–59 175 213 388 213 255 468
60–64 139 177 316 169 211 381
65–69 105 84 189 128 101 228
70–74 38 63 102 47 76 122
75–79 38 38 76 47 46 92
80+ 16 26 42 20 31 51
All ages 5,828 5,730 11,557 7,104 6,849 13,953
NSW 0–4 10,871 10,560 21,431 13,252 12,623 25,875
5–9 10,557 9,904 20,461 12,869 11,839 24,708
10–14 10,685 10,168 20,853 13,025 12,155 25,180
15–19 9,936 9,470 19,406 12,112 11,321 23,433
20–24 7,067 6,896 13,963 8,615 8,243 16,858
25–29 5,395 5,733 11,128 6,577 6,853 13,429
30–34 4,458 4,854 9,312 5,435 5,802 11,237
35–39 4,718 5,469 10,187 5,751 6,538 12,289
40–44 4,712 5,629 10,341 5,744 6,729 12,473
45–49 4,227 5,009 9,236 5,153 5,988 11,141
50–54 3,859 4,216 8,075 4,704 5,040 9,743
55–59 2,990 3,227 6,218 3,645 3,858 7,503
60–64 2,278 2,406 4,684 2,777 2,876 5,653
65–69 1,499 1,591 3,090 1,828 1,902 3,730
70–74 925 1,084 2,009 1,127 1,296 2,423
75–79 544 671 1,215 664 802 1,466
80+ 359 657 1,016 438 785 1,223
All ages 85,080 87,545 172,625 103,714 104,650 208,364
APPENDIX 1: 2011 CENSUS COUNT OF INDIGENOUS POPULATION BY AGE GROUPS AND SEX, BASED ON PLACE OF USUAL RESIDENCE AND ESTIMATED RESIDENT POPULATION AT 30 JUNE 2011 BY FAMILY AND COMMUNITY SERVICES , NSW (con’t)

NSW Aboriginal Population and Households Projections, 2011–2031 Page 103
2011 Census Place of Usual Residence
Estimated Resident Population 30 June 2011
AHO Regions Age groups Males Females Persons Males Females Persons
AHO Western 0–4 2,499 2,599 5,098 3,065 3,121 6,186
5–9 2,355 2,283 4,638 2,888 2,741 5,630
10–14 2,506 2,328 4,834 3,074 2,796 5,869
15–19 2,206 2,109 4,315 2,706 2,533 5,238
20–24 1,584 1,535 3,119 1,943 1,843 3,786
25–29 1,235 1,228 2,463 1,515 1,475 2,989
30–34 975 1,060 2,035 1,196 1,273 2,469
35–39 1,029 1,244 2,273 1,262 1,494 2,756
40–44 1,067 1,272 2,339 1,309 1,527 2,836
45–49 1,006 1,087 2,093 1,234 1,305 2,539
50–54 859 907 1,766 1,054 1,089 2,143
55–59 712 686 1,398 873 824 1,697
60–64 565 551 1,116 693 662 1,355
65–69 355 371 726 435 446 881
70–74 224 266 490 275 319 594
75–79 118 149 267 145 179 324
80+ 85 148 233 104 178 282
All ages 19,380 19,823 39,203 23,770 23,804 47,574
AHO Northern 0–4 4,547 4,267 8,814 5,577 5,124 10,701
5–9 4,319 4,207 8,526 5,297 5,052 10,349
10–14 4,382 4,318 8,700 5,375 5,185 10,560
15–19 4,060 3,895 7,955 4,980 4,677 9,657
20–24 2,727 2,707 5,434 3,345 3,251 6,595
25–29 2,015 2,206 4,221 2,471 2,649 5,120
30–34 1,748 1,850 3,598 2,144 2,222 4,365
35–39 1,815 2,134 3,949 2,226 2,563 4,789
40–44 1,848 2,232 4,080 2,267 2,680 4,947
45–49 1,665 2,022 3,687 2,042 2,428 4,470
50–54 1,587 1,737 3,324 1,946 2,086 4,032
55–59 1,166 1,299 2,465 1,430 1,560 2,990
60–64 873 944 1,817 1,071 1,134 2,204
65–69 611 631 1,242 749 758 1,507
70–74 364 442 806 446 531 977
75–79 223 256 479 274 307 581
80+ 149 256 405 183 307 490
All ages 34,099 35,403 69,502 41,823 42,513 84,336
APPENDIX 2: 2011 CENSUS COUNT OF INDIGENOUS POPULATION BY AGE GROUPS AND SEX, BASED ON PLACE OF USUAL RESIDENCE AND ESTIMATED RESIDENT POPULATION AT 30 JUNE 2011 BY ABORIGINAL HOUSING OFFICE (AHO) REGIONS, NSW
(continued next page)
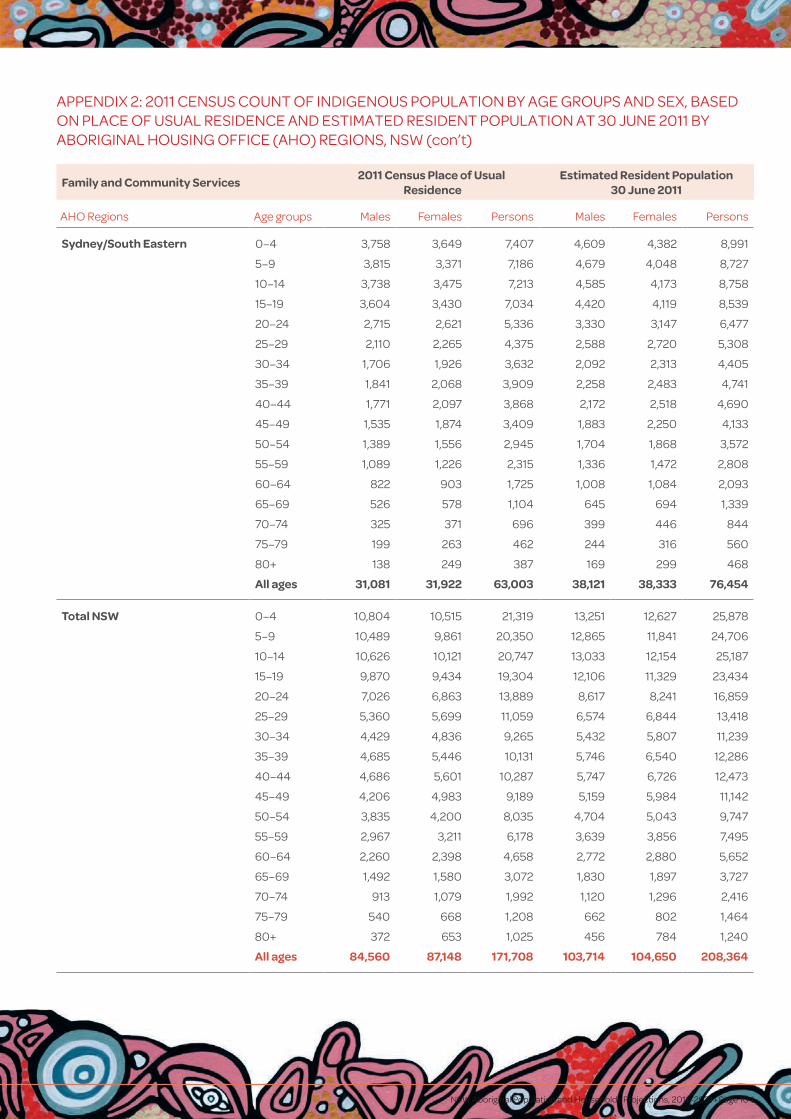
NSW Aboriginal Population and Households Projections, 2011–2031 • Page 104
Family and Community Services 2011 Census Place of Usual
ResidenceEstimated Resident Population
30 June 2011
AHO Regions Age groups Males Females Persons Males Females Persons
Sydney/South Eastern 0–4 3,758 3,649 7,407 4,609 4,382 8,991
5–9 3,815 3,371 7,186 4,679 4,048 8,727
10–14 3,738 3,475 7,213 4,585 4,173 8,758
15–19 3,604 3,430 7,034 4,420 4,119 8,539
20–24 2,715 2,621 5,336 3,330 3,147 6,477
25–29 2,110 2,265 4,375 2,588 2,720 5,308
30–34 1,706 1,926 3,632 2,092 2,313 4,405
35–39 1,841 2,068 3,909 2,258 2,483 4,741
40–44 1,771 2,097 3,868 2,172 2,518 4,690
45–49 1,535 1,874 3,409 1,883 2,250 4,133
50–54 1,389 1,556 2,945 1,704 1,868 3,572
55–59 1,089 1,226 2,315 1,336 1,472 2,808
60–64 822 903 1,725 1,008 1,084 2,093
65–69 526 578 1,104 645 694 1,339
70–74 325 371 696 399 446 844
75–79 199 263 462 244 316 560
80+ 138 249 387 169 299 468
All ages 31,081 31,922 63,003 38,121 38,333 76,454
Total NSW 0–4 10,804 10,515 21,319 13,251 12,627 25,878
5–9 10,489 9,861 20,350 12,865 11,841 24,706
10–14 10,626 10,121 20,747 13,033 12,154 25,187
15–19 9,870 9,434 19,304 12,106 11,329 23,434
20–24 7,026 6,863 13,889 8,617 8,241 16,859
25–29 5,360 5,699 11,059 6,574 6,844 13,418
30–34 4,429 4,836 9,265 5,432 5,807 11,239
35–39 4,685 5,446 10,131 5,746 6,540 12,286
40–44 4,686 5,601 10,287 5,747 6,726 12,473
45–49 4,206 4,983 9,189 5,159 5,984 11,142
50–54 3,835 4,200 8,035 4,704 5,043 9,747
55–59 2,967 3,211 6,178 3,639 3,856 7,495
60–64 2,260 2,398 4,658 2,772 2,880 5,652
65–69 1,492 1,580 3,072 1,830 1,897 3,727
70–74 913 1,079 1,992 1,120 1,296 2,416
75–79 540 668 1,208 662 802 1,464
80+ 372 653 1,025 456 784 1,240
All ages 84,560 87,148 171,708 103,714 104,650 208,364
APPENDIX 2: 2011 CENSUS COUNT OF INDIGENOUS POPULATION BY AGE GROUPS AND SEX, BASED ON PLACE OF USUAL RESIDENCE AND ESTIMATED RESIDENT POPULATION AT 30 JUNE 2011 BY ABORIGINAL HOUSING OFFICE (AHO) REGIONS, NSW (con’t)
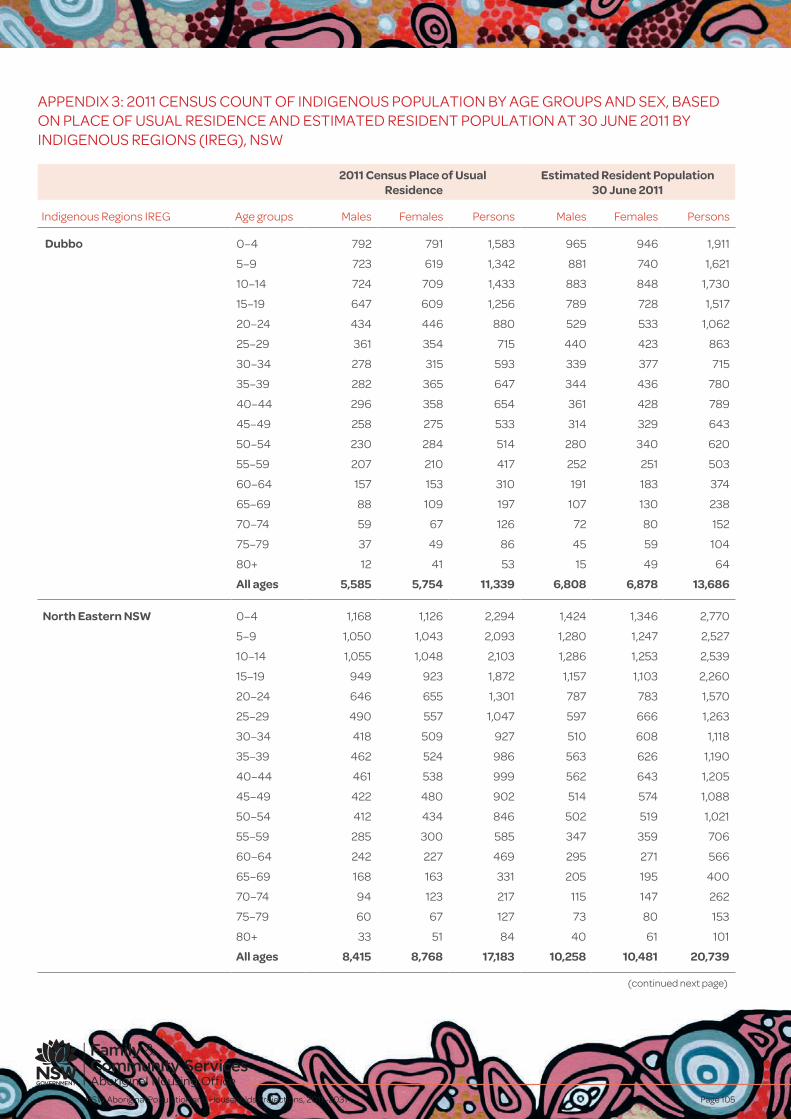
NSW Aboriginal Population and Households Projections, 2011–2031 Page 105
2011 Census Place of Usual Residence
Estimated Resident Population 30 June 2011
Indigenous Regions IREG Age groups Males Females Persons Males Females Persons
Dubbo 0–4 792 791 1,583 965 946 1,911
5–9 723 619 1,342 881 740 1,621
10–14 724 709 1,433 883 848 1,730
15–19 647 609 1,256 789 728 1,517
20–24 434 446 880 529 533 1,062
25–29 361 354 715 440 423 863
30–34 278 315 593 339 377 715
35–39 282 365 647 344 436 780
40–44 296 358 654 361 428 789
45–49 258 275 533 314 329 643
50–54 230 284 514 280 340 620
55–59 207 210 417 252 251 503
60–64 157 153 310 191 183 374
65–69 88 109 197 107 130 238
70–74 59 67 126 72 80 152
75–79 37 49 86 45 59 104
80+ 12 41 53 15 49 64
All ages 5,585 5,754 11,339 6,808 6,878 13,686
North Eastern NSW 0–4 1,168 1,126 2,294 1,424 1,346 2,770
5–9 1,050 1,043 2,093 1,280 1,247 2,527
10–14 1,055 1,048 2,103 1,286 1,253 2,539
15–19 949 923 1,872 1,157 1,103 2,260
20–24 646 655 1,301 787 783 1,570
25–29 490 557 1,047 597 666 1,263
30–34 418 509 927 510 608 1,118
35–39 462 524 986 563 626 1,190
40–44 461 538 999 562 643 1,205
45–49 422 480 902 514 574 1,088
50–54 412 434 846 502 519 1,021
55–59 285 300 585 347 359 706
60–64 242 227 469 295 271 566
65–69 168 163 331 205 195 400
70–74 94 123 217 115 147 262
75–79 60 67 127 73 80 153
80+ 33 51 84 40 61 101
All ages 8,415 8,768 17,183 10,258 10,481 20,739
APPENDIX 3: 2011 CENSUS COUNT OF INDIGENOUS POPULATION BY AGE GROUPS AND SEX, BASED ON PLACE OF USUAL RESIDENCE AND ESTIMATED RESIDENT POPULATION AT 30 JUNE 2011 BY INDIGENOUS REGIONS (IREG), NSW
(continued next page)
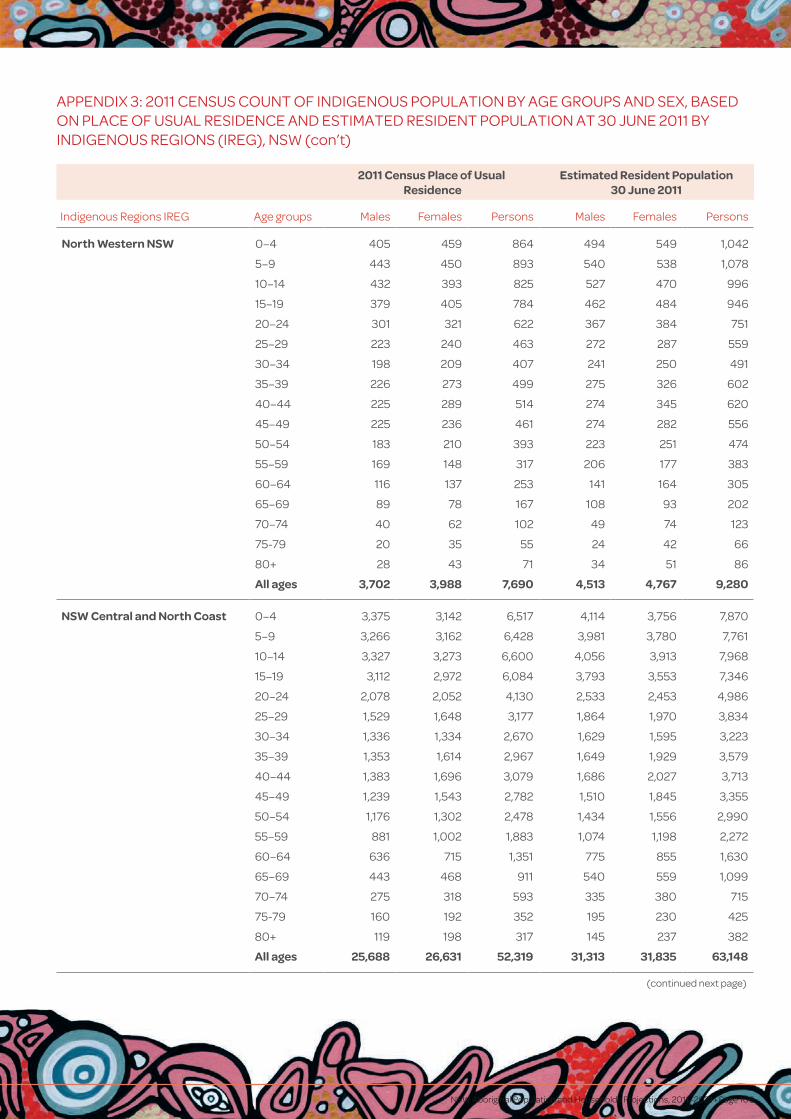
NSW Aboriginal Population and Households Projections, 2011–2031 • Page 106
2011 Census Place of Usual
ResidenceEstimated Resident Population
30 June 2011
Indigenous Regions IREG Age groups Males Females Persons Males Females Persons
North Western NSW 0–4 405 459 864 494 549 1,042
5–9 443 450 893 540 538 1,078
10–14 432 393 825 527 470 996
15–19 379 405 784 462 484 946
20–24 301 321 622 367 384 751
25–29 223 240 463 272 287 559
30–34 198 209 407 241 250 491
35–39 226 273 499 275 326 602
40–44 225 289 514 274 345 620
45–49 225 236 461 274 282 556
50–54 183 210 393 223 251 474
55–59 169 148 317 206 177 383
60–64 116 137 253 141 164 305
65–69 89 78 167 108 93 202
70–74 40 62 102 49 74 123
75-79 20 35 55 24 42 66
80+ 28 43 71 34 51 86
All ages 3,702 3,988 7,690 4,513 4,767 9,280
NSW Central and North Coast 0–4 3,375 3,142 6,517 4,114 3,756 7,870
5–9 3,266 3,162 6,428 3,981 3,780 7,761
10–14 3,327 3,273 6,600 4,056 3,913 7,968
15–19 3,112 2,972 6,084 3,793 3,553 7,346
20–24 2,078 2,052 4,130 2,533 2,453 4,986
25–29 1,529 1,648 3,177 1,864 1,970 3,834
30–34 1,336 1,334 2,670 1,629 1,595 3,223
35–39 1,353 1,614 2,967 1,649 1,929 3,579
40–44 1,383 1,696 3,079 1,686 2,027 3,713
45–49 1,239 1,543 2,782 1,510 1,845 3,355
50–54 1,176 1,302 2,478 1,434 1,556 2,990
55–59 881 1,002 1,883 1,074 1,198 2,272
60–64 636 715 1,351 775 855 1,630
65–69 443 468 911 540 559 1,099
70–74 275 318 593 335 380 715
75-79 160 192 352 195 230 425
80+ 119 198 317 145 237 382
All ages 25,688 26,631 52,319 31,313 31,835 63,148
APPENDIX 3: 2011 CENSUS COUNT OF INDIGENOUS POPULATION BY AGE GROUPS AND SEX, BASED ON PLACE OF USUAL RESIDENCE AND ESTIMATED RESIDENT POPULATION AT 30 JUNE 2011 BY INDIGENOUS REGIONS (IREG), NSW (con’t)
(continued next page)

NSW Aboriginal Population and Households Projections, 2011–2031 Page 107
2011 Census Place of Usual Residence
Estimated Resident Population 30 June 2011
Indigenous Regions IREG Age groups Males Females Persons Males Females Persons
Riverina-Orange 0–4 1,305 1,346 2,651 1,591 1,609 3,200
5–9 1,188 1,215 2,403 1,448 1,452 2,901
10–14 1,349 1,223 2,572 1,644 1,462 3,106
15–19 1,187 1,095 2,282 1,447 1,309 2,756
20–24 851 769 1,620 1,037 919 1,957
25–29 649 639 1,288 791 764 1,555
30–34 499 539 1,038 608 644 1,253
35–39 522 603 1,125 636 721 1,357
40–44 547 624 1,171 667 746 1,413
45–49 519 576 1,095 633 689 1,321
50–54 445 414 859 542 495 1,037
55–59 338 330 668 412 394 807
60–64 287 262 549 350 313 663
65–69 175 186 361 213 222 436
70–74 127 135 262 155 161 316
75-79 62 65 127 76 78 153
80+ 36 64 100 44 77 120
All ages 10,086 10,085 20,171 12,295 12,056 24,350
South Eastern NSW 0–4 645 698 1,343 786 834 1,621
5–9 706 645 1,351 861 771 1,632
10–14 683 678 1,361 833 810 1,643
15–19 625 557 1,182 762 666 1,428
20–24 392 347 739 478 415 893
25–29 333 333 666 406 398 804
30–34 269 298 567 328 356 684
35–39 310 335 645 378 400 778
40–44 314 323 637 383 386 769
45–49 276 329 605 336 393 730
50–54 249 298 547 304 356 660
55–59 191 208 399 233 249 481
60–64 159 153 312 194 183 377
65–69 106 105 211 129 126 255
70–74 76 62 138 93 74 167
75-79 29 46 75 35 55 90
80+ 20 36 56 24 43 67
All ages 5,383 5,451 10,834 6,562 6,516 13,078
APPENDIX 3: 2011 CENSUS COUNT OF INDIGENOUS POPULATION BY AGE GROUPS AND SEX, BASED ON PLACE OF USUAL RESIDENCE AND ESTIMATED RESIDENT POPULATION AT 30 JUNE 2011 BY INDIGENOUS REGIONS (IREG), NSW (con’t)
(continued next page)
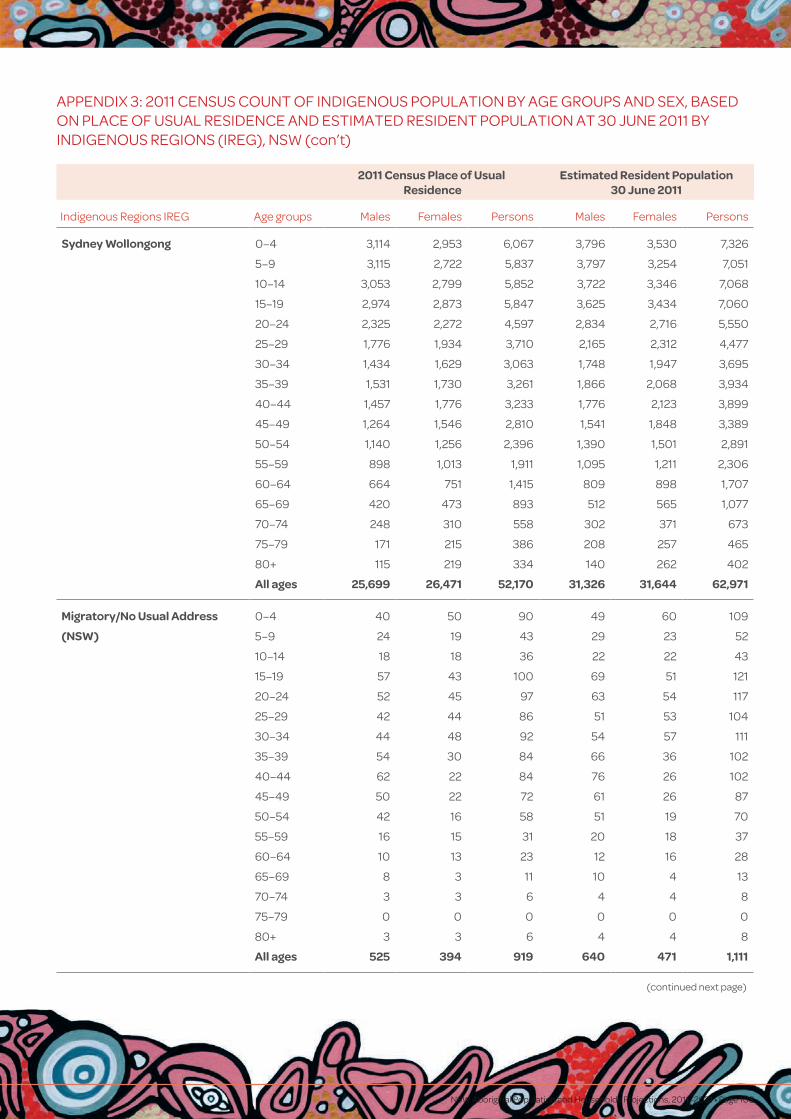
NSW Aboriginal Population and Households Projections, 2011–2031 • Page 108
2011 Census Place of Usual
ResidenceEstimated Resident Population
30 June 2011
Indigenous Regions IREG Age groups Males Females Persons Males Females Persons
Sydney Wollongong 0–4 3,114 2,953 6,067 3,796 3,530 7,326
5–9 3,115 2,722 5,837 3,797 3,254 7,051
10–14 3,053 2,799 5,852 3,722 3,346 7,068
15–19 2,974 2,873 5,847 3,625 3,434 7,060
20–24 2,325 2,272 4,597 2,834 2,716 5,550
25–29 1,776 1,934 3,710 2,165 2,312 4,477
30–34 1,434 1,629 3,063 1,748 1,947 3,695
35–39 1,531 1,730 3,261 1,866 2,068 3,934
40–44 1,457 1,776 3,233 1,776 2,123 3,899
45–49 1,264 1,546 2,810 1,541 1,848 3,389
50–54 1,140 1,256 2,396 1,390 1,501 2,891
55–59 898 1,013 1,911 1,095 1,211 2,306
60–64 664 751 1,415 809 898 1,707
65–69 420 473 893 512 565 1,077
70–74 248 310 558 302 371 673
75–79 171 215 386 208 257 465
80+ 115 219 334 140 262 402
All ages 25,699 26,471 52,170 31,326 31,644 62,971
Migratory/No Usual Address 0–4 40 50 90 49 60 109
(NSW) 5–9 24 19 43 29 23 52
10–14 18 18 36 22 22 43
15–19 57 43 100 69 51 121
20–24 52 45 97 63 54 117
25–29 42 44 86 51 53 104
30–34 44 48 92 54 57 111
35–39 54 30 84 66 36 102
40–44 62 22 84 76 26 102
45–49 50 22 72 61 26 87
50–54 42 16 58 51 19 70
55–59 16 15 31 20 18 37
60–64 10 13 23 12 16 28
65–69 8 3 11 10 4 13
70–74 3 3 6 4 4 8
75–79 0 0 0 0 0 0
80+ 3 3 6 4 4 8
All ages 525 394 919 640 471 1,111
(continued next page)
APPENDIX 3: 2011 CENSUS COUNT OF INDIGENOUS POPULATION BY AGE GROUPS AND SEX, BASED ON PLACE OF USUAL RESIDENCE AND ESTIMATED RESIDENT POPULATION AT 30 JUNE 2011 BY INDIGENOUS REGIONS (IREG), NSW (con’t)
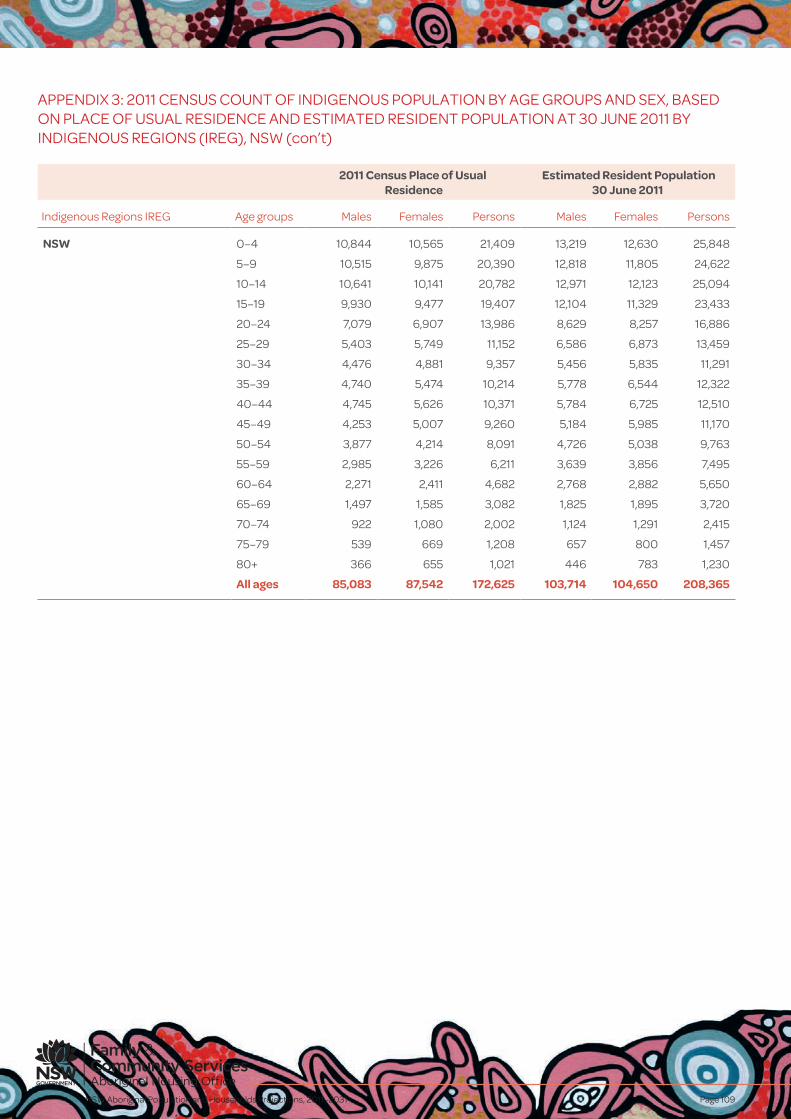
NSW Aboriginal Population and Households Projections, 2011–2031 Page 109
2011 Census Place of Usual Residence
Estimated Resident Population 30 June 2011
Indigenous Regions IREG Age groups Males Females Persons Males Females Persons
NSW 0–4 10,844 10,565 21,409 13,219 12,630 25,848
5–9 10,515 9,875 20,390 12,818 11,805 24,622
10–14 10,641 10,141 20,782 12,971 12,123 25,094
15–19 9,930 9,477 19,407 12,104 11,329 23,433
20–24 7,079 6,907 13,986 8,629 8,257 16,886
25–29 5,403 5,749 11,152 6,586 6,873 13,459
30–34 4,476 4,881 9,357 5,456 5,835 11,291
35–39 4,740 5,474 10,214 5,778 6,544 12,322
40–44 4,745 5,626 10,371 5,784 6,725 12,510
45–49 4,253 5,007 9,260 5,184 5,985 11,170
50–54 3,877 4,214 8,091 4,726 5,038 9,763
55–59 2,985 3,226 6,211 3,639 3,856 7,495
60–64 2,271 2,411 4,682 2,768 2,882 5,650
65–69 1,497 1,585 3,082 1,825 1,895 3,720
70–74 922 1,080 2,002 1,124 1,291 2,415
75–79 539 669 1,208 657 800 1,457
80+ 366 655 1,021 446 783 1,230
All ages 85,083 87,542 172,625 103,714 104,650 208,365
APPENDIX 3: 2011 CENSUS COUNT OF INDIGENOUS POPULATION BY AGE GROUPS AND SEX, BASED ON PLACE OF USUAL RESIDENCE AND ESTIMATED RESIDENT POPULATION AT 30 JUNE 2011 BY INDIGENOUS REGIONS (IREG), NSW (con’t)
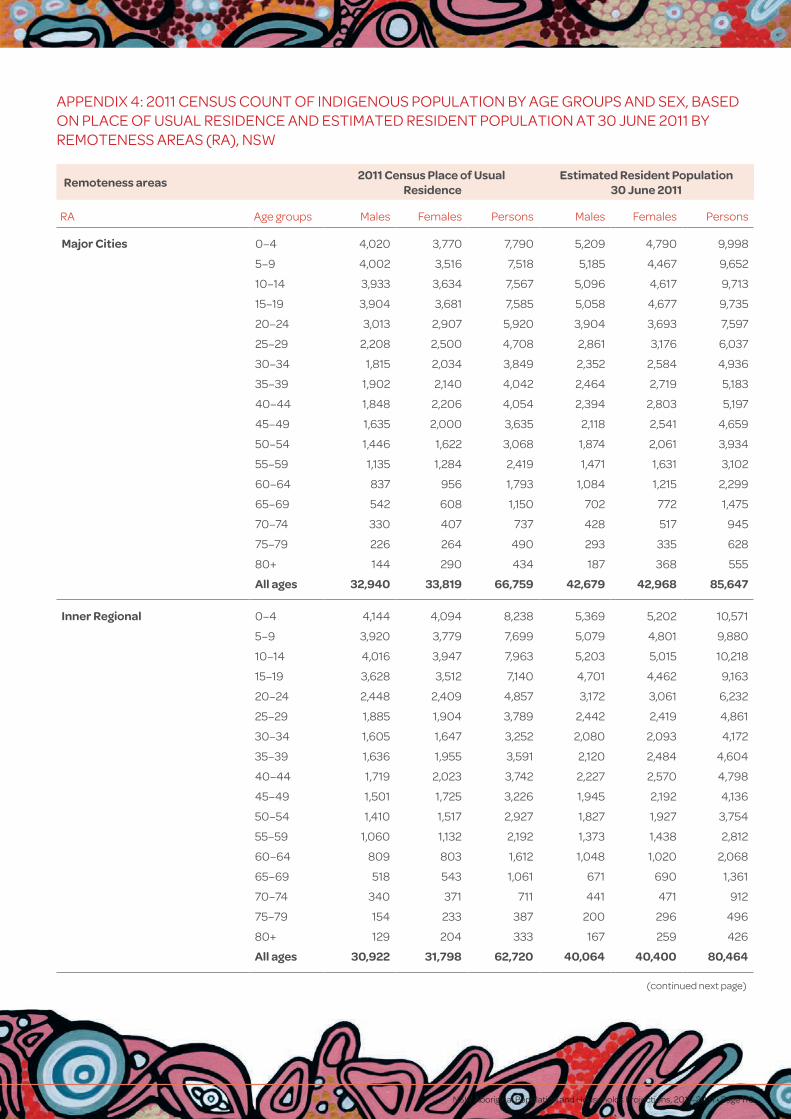
NSW Aboriginal Population and Households Projections, 2011–2031 • Page 110
Remoteness areas2011 Census Place of Usual
ResidenceEstimated Resident Population
30 June 2011
RA Age groups Males Females Persons Males Females Persons
Major Cities 0–4 4,020 3,770 7,790 5,209 4,790 9,998
5–9 4,002 3,516 7,518 5,185 4,467 9,652
10–14 3,933 3,634 7,567 5,096 4,617 9,713
15–19 3,904 3,681 7,585 5,058 4,677 9,735
20–24 3,013 2,907 5,920 3,904 3,693 7,597
25–29 2,208 2,500 4,708 2,861 3,176 6,037
30–34 1,815 2,034 3,849 2,352 2,584 4,936
35–39 1,902 2,140 4,042 2,464 2,719 5,183
40–44 1,848 2,206 4,054 2,394 2,803 5,197
45–49 1,635 2,000 3,635 2,118 2,541 4,659
50–54 1,446 1,622 3,068 1,874 2,061 3,934
55–59 1,135 1,284 2,419 1,471 1,631 3,102
60–64 837 956 1,793 1,084 1,215 2,299
65–69 542 608 1,150 702 772 1,475
70–74 330 407 737 428 517 945
75–79 226 264 490 293 335 628
80+ 144 290 434 187 368 555
All ages 32,940 33,819 66,759 42,679 42,968 85,647
Inner Regional 0–4 4,144 4,094 8,238 5,369 5,202 10,571
5–9 3,920 3,779 7,699 5,079 4,801 9,880
10–14 4,016 3,947 7,963 5,203 5,015 10,218
15–19 3,628 3,512 7,140 4,701 4,462 9,163
20–24 2,448 2,409 4,857 3,172 3,061 6,232
25–29 1,885 1,904 3,789 2,442 2,419 4,861
30–34 1,605 1,647 3,252 2,080 2,093 4,172
35–39 1,636 1,955 3,591 2,120 2,484 4,604
40–44 1,719 2,023 3,742 2,227 2,570 4,798
45–49 1,501 1,725 3,226 1,945 2,192 4,136
50–54 1,410 1,517 2,927 1,827 1,927 3,754
55–59 1,060 1,132 2,192 1,373 1,438 2,812
60–64 809 803 1,612 1,048 1,020 2,068
65–69 518 543 1,061 671 690 1,361
70–74 340 371 711 441 471 912
75–79 154 233 387 200 296 496
80+ 129 204 333 167 259 426
All ages 30,922 31,798 62,720 40,064 40,400 80,464
APPENDIX 4: 2011 CENSUS COUNT OF INDIGENOUS POPULATION BY AGE GROUPS AND SEX, BASED ON PLACE OF USUAL RESIDENCE AND ESTIMATED RESIDENT POPULATION AT 30 JUNE 2011 BY REMOTENESS AREAS (RA), NSW
(continued next page)

NSW Aboriginal Population and Households Projections, 2011–2031 Page 111
Remoteness areas2011 Census Place of Usual
ResidenceEstimated Resident Population
30 June 2011
RA Age groups Males Females Persons Males Females Persons
Outer Regional 0–4 1,625 1,591 3,216 2,105 2,021 4,127
5–9 1,510 1,474 2,984 1,956 1,873 3,829
10–14 1,628 1,527 3,155 2,109 1,940 4,049
15–19 1,437 1,286 2,723 1,862 1,634 3,496
20–24 910 880 1,790 1,179 1,118 2,297
25–29 759 768 1,527 983 976 1,959
30–34 570 693 1,263 739 880 1,619
35–39 661 771 1,432 856 980 1,836
40–44 659 763 1,422 854 969 1,823
45–49 618 751 1,369 801 954 1,755
50–54 583 644 1,227 755 818 1,574
55–59 460 473 933 596 601 1,197
60–64 369 378 747 478 480 958
65–69 261 261 522 338 332 670
70–74 152 171 323 197 217 414
75–79 110 103 213 143 131 273
80+ 44 86 130 57 109 166
All ages 12,356 12,620 24,976 16,009 16,034 32,043
Remote Areas 0–4 284 334 618 368 424 792
5–9 311 322 633 403 409 812
10–14 297 290 587 385 368 753
15–19 258 262 520 334 333 667
20–24 187 199 386 242 253 495
25–29 136 167 303 176 212 388
30–34 137 146 283 178 185 363
35–39 135 184 319 175 234 409
40–44 144 180 324 187 229 415
45–49 155 162 317 201 206 407
50–54 126 135 261 163 172 335
55–59 121 98 219 157 125 281
60–64 98 79 177 127 100 227
65–69 67 59 126 87 75 162
70–74 35 57 92 45 72 118
75–79 20 23 43 26 29 55
80+ 23 21 44 30 27 56
All ages 2,534 2,718 5,252 3,283 3,453 6,736
APPENDIX 4: 2011 CENSUS COUNT OF INDIGENOUS POPULATION BY AGE GROUPS AND SEX, BASED ON PLACE OF USUAL RESIDENCE AND ESTIMATED RESIDENT POPULATION AT 30 JUNE 2011 BY REMOTENESS AREAS (RA), NSW (con’t)
(continued next page)
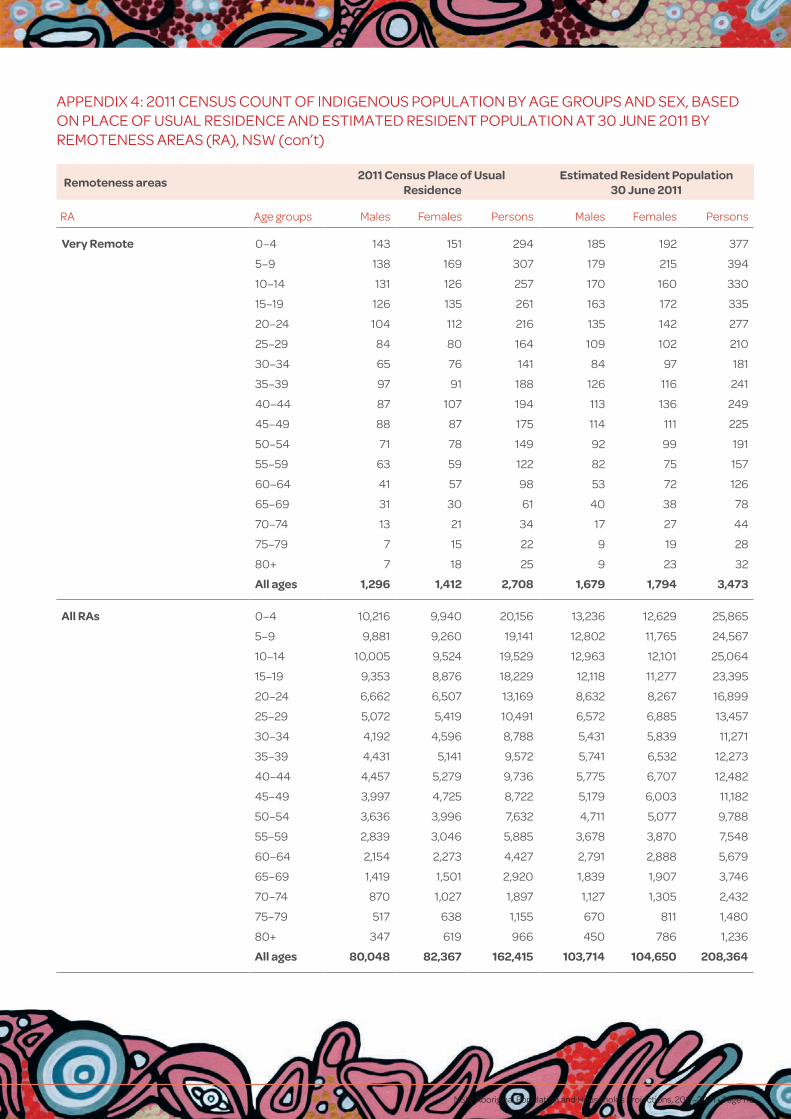
NSW Aboriginal Population and Households Projections, 2011–2031 • Page 112
Remoteness areas2011 Census Place of Usual
ResidenceEstimated Resident Population
30 June 2011
RA Age groups Males Females Persons Males Females Persons
Very Remote 0–4 143 151 294 185 192 377
5–9 138 169 307 179 215 394
10–14 131 126 257 170 160 330
15–19 126 135 261 163 172 335
20–24 104 112 216 135 142 277
25–29 84 80 164 109 102 210
30–34 65 76 141 84 97 181
35–39 97 91 188 126 116 241
40–44 87 107 194 113 136 249
45–49 88 87 175 114 111 225
50–54 71 78 149 92 99 191
55–59 63 59 122 82 75 157
60–64 41 57 98 53 72 126
65–69 31 30 61 40 38 78
70–74 13 21 34 17 27 44
75–79 7 15 22 9 19 28
80+ 7 18 25 9 23 32
All ages 1,296 1,412 2,708 1,679 1,794 3,473
All RAs 0–4 10,216 9,940 20,156 13,236 12,629 25,865
5–9 9,881 9,260 19,141 12,802 11,765 24,567
10–14 10,005 9,524 19,529 12,963 12,101 25,064
15–19 9,353 8,876 18,229 12,118 11,277 23,395
20–24 6,662 6,507 13,169 8,632 8,267 16,899
25–29 5,072 5,419 10,491 6,572 6,885 13,457
30–34 4,192 4,596 8,788 5,431 5,839 11,271
35–39 4,431 5,141 9,572 5,741 6,532 12,273
40–44 4,457 5,279 9,736 5,775 6,707 12,482
45–49 3,997 4,725 8,722 5,179 6,003 11,182
50–54 3,636 3,996 7,632 4,711 5,077 9,788
55–59 2,839 3,046 5,885 3,678 3,870 7,548
60–64 2,154 2,273 4,427 2,791 2,888 5,679
65–69 1,419 1,501 2,920 1,839 1,907 3,746
70–74 870 1,027 1,897 1,127 1,305 2,432
75–79 517 638 1,155 670 811 1,480
80+ 347 619 966 450 786 1,236
All ages 80,048 82,367 162,415 103,714 104,650 208,364
APPENDIX 4: 2011 CENSUS COUNT OF INDIGENOUS POPULATION BY AGE GROUPS AND SEX, BASED ON PLACE OF USUAL RESIDENCE AND ESTIMATED RESIDENT POPULATION AT 30 JUNE 2011 BY REMOTENESS AREAS (RA), NSW (con’t)

NSW Aboriginal Population and Households Projections, 2011–2031 Page 113
FERTILITY
Total fertility rate (TFR) is the total number of children a woman will give birth to during her entire reproductive life given that the age-specific fertility rates remain constant.
MORTPAK for Windows 2003 procedure FERTPF is used to derive fertility estimates using information on children ever born (CEB) by age of mother. The essential methodology was developed by G. Mortara (1949). The variation included here was proposed by Arriaga (1983) and has the advantage of providing estimates of fertility change over time. In the same 1983 article, Arriaga presented an extension of the P/F technique originally developed by Brass (Brass and others, 1968). The Arriaga extension, presented in FERTPF, allows the demographer to estimate fertility at two points in time under conditions of fertility change. CEB data and the pattern of age-specific fertility is necessary from two enumerations when fertility has not been constant.
SEX RATIO
The total number of males divided by the total number of females and expressed in 100. A sex ratio over 100 is referred to as a high-sex ratio while a sex ratio below 100 is referred to low-sex ratio.
TRENDS
As numbers get smaller, confidence in their accuracy is reduced. Although no formal sampling has been carried out, it becomes more obvious that there is increased potential for error. Statistical methods can be used to model trend data in various ways and incorporate appropriate assumptions about the nature of the trend in the past, present and future. Projecting rates into the future gives an estimate of future occurrence rates.
In this project, we have used average annual percent change to calculate a projected rate/relativity. This is accomplished through linear extrapolation by iteratively increasing or decreasing the number or rate according to the average annual percent change of the observed.
PROJECTIONS
Procedure PROJUCT of the United Nations’ MORTPAK version 4.0 software has been used to produce projection outputs. The procedure projects annually a population by age and sex for up to 100 years, based on the initial population (by five-year age groups and sex) and an assumption of future changes in fertility, mortality and migration. The methodology used is cohort-component (see Shryock and Siegel, 1973). The steps are (1) estimation of projected levels and age patterns of mortality, fertility and migration for each single-year projection period; (2) estimation of the male and female populations by single years of age from the data in five-year age groups given as input; (3) sequential application of these annual age-specific mortality and fertility rates and migration to the population to provide annual projected populations by age and sex and demographic indicators.
4. EXPLANATORY NOTES
NSW Aboriginal Population and Households Projections, 2011–2031 • Page 114
Australian Bureau of Statistics 2013, Local Government Area 2011 to Remoteness Area 2011, cat. no. 1270.0.55.006.C123, ABS, Canberra.
Australian Bureau of Statistics 2012, Information Paper, Aboriginal and Torres Strait Islander Demographic Statistics Work Program and Release Plans, cat. no. 3238.0.55.003), ABS, Canberra.
Australian Bureau of Statistics 2012, Australian Demographic Statistics, cat. no. 3101.0, ABS, Canberra.
Australian Bureau of Statistics 2011, Information paper, Rebasing Population Estimates, Australia, cat. no. 3101.0.55.001, ABS, Canberra.
Australian Bureau of Statistics 2011, cat. no. 2901.0 – Census Dictionary, ABS, Canberra.
Australian Bureau of Statistics, 2009, Experimental Life Tables for Aboriginal and Torres Strait Islander Australians, 2005-2007 cat. no. 3302.0.
Australian Bureau of Statistics 2012, Births Australia, cat. no. 33010.
Australian Bureau of Statistics 2008, Discussion Paper, Assessment of Methods, for Developing Life Tables, for Aboriginal and Torres, Strait Islander Australians, cat. no. 3302.0.55.002.
Australian Bureau of Statistics 2008, Experimental Estimates of Resident Australian Indigenous Population, 2006 cat. no. 32380.55.001, ABS, Canberra.
Australian Bureau of Statistics 2002, Census of Population and Housing: Selected Social and Housing Characteristics, Australia, 2001, cat. no. 2015.0, ABS, Canberra.
Australian Bureau of Statistics and Australian Institute of Health & Welfare, 2005, The Health and Welfare of Australia’s Aboriginal and Torres Strait Islander Peoples, ABS, cat. No. IHW 14, Canberra.
Aboriginal Housing Office 2008, Indicative NSW Indigenous Population Projections 2006 to 2021, NSW Aboriginal Housing Office.
Australian Institute of Health & Welfare and Australian Bureau of Statistics, 2006 Recent Developments in the collection of Aboriginal and Torres Strait Islander Health and Welfare Statistics, 2005, cat. no. IHW 15, AIHW, Canberra.
Australian Bureau of Statistics 1998, Aboriginal and Torres Strait Islander People, NSW 1996, cat. no. 2034.1. 1996, ABS, Canberra.
Arriaga, EE 1983, Estimating Fertility from Data on Children Ever Born by Age of Mother, International Research Document No. 11 U.S. Bureau of the Census, Washington D C.
McDonald, P & Kippen, R 1998, Household Trends and Projections: Victoria, 1986-2011, Victorian Department of Infrastructure, Melbourne.
Queensland Health 2012, Discussion Paper, Experimental Life Tables by Remoteness, Queensland, 2002-04 and 2005-07, Indigenous Information Strategy Team, Health Statistics Centre, Queensland Health, Queensland.
5. REFERENCES
Artwork created by Lorraine Brown and Narelle Thomas from the Coomaditchie United Aboriginal CorporationPrinted July 2014