Abnormal Brain Activity Related to Performance Monitoring and Error Detection in Children with ADHD
12
INTRODUCTION Children with Attention Deficit-Hyperactivity Disorder (ADHD) perform more poorly than controls and children with other psychiatric disorders on tasks that measure inhibitory control, such as the Continuous Performance Task (CPT) and the Stop Signal Task (Logan et al., 1984; Schachar et al., 1990; van der Meere et al., 1992; Pliszka et al., 1997). A fundamental deficit in inhibitory control mechanisms has therefore been hypothesized to be at the core of the syndrome (Barkley, 1997). Based on in vivo morphometric evidence of MRI abnormalities in right frontal cortex and caudate nuclei (Castellanos et al., 1996; Filipek et al., 1997), it has been proposed that abnormalities in a right- sided striato-frontal network may be responsible for the deficits in inhibitory control in ADHD (Castellanos, 1997; Casey et al., 1997a). Recent functional MRI (fMRI) studies in healthy adults and children have confirmed that the right middle and right inferior frontal gyri are implicated during tasks involving response inhibition (Go/NoGo, WCST, etc: Garavan et al., 1999; Casey et al., 1997b; Rubia et al., 1999). A recent lesion- correlation study has shown that patients with lesions of the pars triangularis of the right inferior frontal gyrus (Brodmann area 45) have a selective deficit in response inhibition in the Stop Signal Task (Aron et al., 2003). Consistent with the proposed model (Castellanos, 1997), an fMRI study using the Stop Signal Task in a block design found that ADHD adolescents did not show the activation of right middle and inferior frontal gyrus observed in healthy adolescents (Rubia et al., 1999). Note however that a fMRI study employing a Go/NoGo task found more activation in lateral prefrontal cortex in ADHD children off stimulant medication relative to healthy control children (Vaidya et al.,1998). Using high-density event-related potentials (ERPs), we previously (Pliszka et al., 2000) reported applying the Stop Signal Task in ADHD and healthy children and finding that a right inferior frontal N200 in response to the Stop Signal was strikingly reduced in the ADHD children, suggesting that a right prefrontal mechanism may operate very early (200 msec) to trigger inhibitory control (see Figure 1). This combined evidence points to a crucial role of the right lateral prefrontal cortex in response inhibition during tasks of cognitive control. Other evidence in the literature points to an additional involvement of midline prefrontal cortex, in particular the right dorsal anterior cingulate cortex (dACC), in components of executive function and inhibitory control. The crucial role of right dACC in tasks of response selection and conflict monitoring (such as the Stroop task), has been firmly established by PET, fMRI, ERP and lesion correlation studies (Pardo et al., 1990; Carter et al., 1995; Liotti et al., 2000; Swick and Jonanovic, 2002). Of importance here, dACC activations have recently been reported in healthy adults and adolescents during Go/NoGo tasks by event-related techniques, both with ERPs and fMRI (Liddle et al., 2001; Garavan et al., 2002). Cortex, (2005) 41, 377-388 SPECIAL ISSUE ABNORMAL BRAIN ACTIVITY RELATED TO PERFORMANCE MONITORING AND ERROR DETECTION IN CHILDREN WITH ADHD Mario Liotti 1 , Steven R. Pliszka 2 , Ricardo Perez 3 , Delia Kothmann 4 and Marty G. Woldorff 5 ( 1 Department of Psychiatry, University of Nottingham, UK; 2 Division of Child and Adolescent Psychiatry and 3 Research Imaging Center, University of Texas Health Science Center, San Antonio, TX, USA; 4 Department of Psychology, Rice University, Houston, TX, USA; 5 Department of Cognitive Neuroscience, Duke University, Durham, NC, USA) ABSTRACT Brain electrical activity associated with inhibitory control was recorded in ten ADHD and ten healthy children using high density event related potentials (ERPs) during the Stop Signal Task (SST). SST is a two-choice reaction time (RT) paradigm, in which subjects are required, on 25% of the trials, to withdraw their response upon presentation of a “Stop Signal”. In the healthy children, the ERP evoked by the Stop Signal differed for successful inhibitions (SI) compared to failed inhibitions (FI), with greater amplitude of a positive wave peaking around 320 msec over anterior medial frontal scalp (P3a). Such success-related P3a activity was significantly reduced in amplitude in the ADHD group. In addition, the error related negativity (ERN), a sharp negative wave that is present selectively on error trials in choice RT experiments, peaking 100 ms after motor onset, and distributed over anterior medial frontal scalp, was also markedly reduced in the ADHD group. The scalp distribution of the group differences in P3a and the ERN is consistent with a reduction of activity of sources in dorsal anterior cingulate cortex (dACC), suggesting a global deficit in cognitive control operations subserved by dACC in ADHD. Key words: ERPs, ADHD, response inhibition, anterior cingulate, error detection, N200, P3a, ERN, stop signal task A partial report of this study was presented at the Cognitive Neuroscience Society annual meeting, New York, March 30 th -April 1 st 2003.
-
Upload
independent -
Category
Documents
-
view
1 -
download
0
Transcript of Abnormal Brain Activity Related to Performance Monitoring and Error Detection in Children with ADHD
INTRODUCTION
Children with Attention Deficit-HyperactivityDisorder (ADHD) perform more poorly thancontrols and children with other psychiatric disorderson tasks that measure inhibitory control, such as theContinuous Performance Task (CPT) and the StopSignal Task (Logan et al., 1984; Schachar et al.,1990; van der Meere et al., 1992; Pliszka et al.,1997). A fundamental deficit in inhibitory controlmechanisms has therefore been hypothesized to beat the core of the syndrome (Barkley, 1997). Basedon in vivo morphometric evidence of MRIabnormalities in right frontal cortex and caudatenuclei (Castellanos et al., 1996; Filipek et al., 1997),it has been proposed that abnormalities in a right-sided striato-frontal network may be responsible forthe deficits in inhibitory control in ADHD(Castellanos, 1997; Casey et al., 1997a).
Recent functional MRI (fMRI) studies in healthyadults and children have confirmed that the rightmiddle and right inferior frontal gyri are implicatedduring tasks involving response inhibition(Go/NoGo, WCST, etc: Garavan et al., 1999; Caseyet al., 1997b; Rubia et al., 1999). A recent lesion-correlation study has shown that patients with lesionsof the pars triangularis of the right inferior frontalgyrus (Brodmann area 45) have a selective deficit inresponse inhibition in the Stop Signal Task (Aron etal., 2003).
Consistent with the proposed model (Castellanos,
1997), an fMRI study using the Stop Signal Task ina block design found that ADHD adolescents did notshow the activation of right middle and inferiorfrontal gyrus observed in healthy adolescents (Rubiaet al., 1999). Note however that a fMRI studyemploying a Go/NoGo task found more activation inlateral prefrontal cortex in ADHD children offstimulant medication relative to healthy controlchildren (Vaidya et al.,1998).
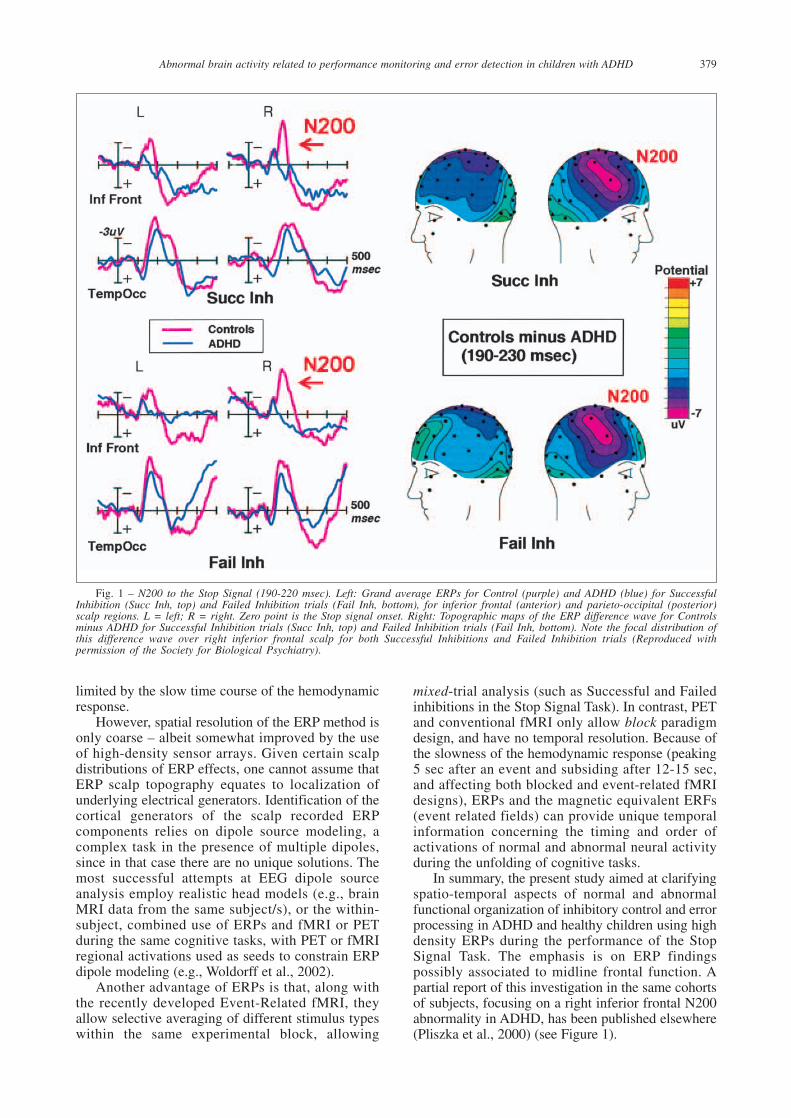
Using high-density event-related potentials(ERPs), we previously (Pliszka et al., 2000) reportedapplying the Stop Signal Task in ADHD and healthychildren and finding that a right inferior frontal N200in response to the Stop Signal was strikingly reducedin the ADHD children, suggesting that a rightprefrontal mechanism may operate very early (200msec) to trigger inhibitory control (see Figure 1).This combined evidence points to a crucial role ofthe right lateral prefrontal cortex in responseinhibition during tasks of cognitive control.
Other evidence in the literature points to anadditional involvement of midline prefrontal cortex,in particular the right dorsal anterior cingulate cortex(dACC), in components of executive function andinhibitory control. The crucial role of right dACC intasks of response selection and conflict monitoring(such as the Stroop task), has been firmly establishedby PET, fMRI, ERP and lesion correlation studies(Pardo et al., 1990; Carter et al., 1995; Liotti et al.,2000; Swick and Jonanovic, 2002). Of importancehere, dACC activations have recently been reportedin healthy adults and adolescents during Go/NoGotasks by event-related techniques, both with ERPsand fMRI (Liddle et al., 2001; Garavan et al., 2002).
Cortex, (2005) 41, 377-388
SPECIAL ISSUEABNORMAL BRAIN ACTIVITY RELATED TO PERFORMANCE MONITORING
AND ERROR DETECTION IN CHILDREN WITH ADHD
Mario Liotti1, Steven R. Pliszka2, Ricardo Perez3, Delia Kothmann4 and Marty G. Woldorff5
(1Department of Psychiatry, University of Nottingham, UK; 2Division of Child and Adolescent Psychiatry and 3ResearchImaging Center, University of Texas Health Science Center, San Antonio, TX, USA; 4Department of Psychology,
Rice University, Houston, TX, USA; 5Department of Cognitive Neuroscience, Duke University, Durham, NC, USA)
ABSTRACT
Brain electrical activity associated with inhibitory control was recorded in ten ADHD and ten healthy children usinghigh density event related potentials (ERPs) during the Stop Signal Task (SST). SST is a two-choice reaction time (RT)paradigm, in which subjects are required, on 25% of the trials, to withdraw their response upon presentation of a “StopSignal”. In the healthy children, the ERP evoked by the Stop Signal differed for successful inhibitions (SI) compared tofailed inhibitions (FI), with greater amplitude of a positive wave peaking around 320 msec over anterior medial frontalscalp (P3a). Such success-related P3a activity was significantly reduced in amplitude in the ADHD group. In addition, theerror related negativity (ERN), a sharp negative wave that is present selectively on error trials in choice RT experiments,peaking 100 ms after motor onset, and distributed over anterior medial frontal scalp, was also markedly reduced in theADHD group. The scalp distribution of the group differences in P3a and the ERN is consistent with a reduction of activityof sources in dorsal anterior cingulate cortex (dACC), suggesting a global deficit in cognitive control operations subservedby dACC in ADHD.
Key words: ERPs, ADHD, response inhibition, anterior cingulate, error detection, N200, P3a, ERN, stop signal task
A partial report of this study was presented at the Cognitive NeuroscienceSociety annual meeting, New York, March 30th-April 1st 2003.
Casey et al (1997a) found a significant correlationbetween children’s performance in a difficult visualsearch task and the volume of the right dACC (Caseyet al., 1997c).
Another rich body of evidence associates medialprefrontal cortex, particularly dACC, with errorprocessing (error detection and correction) duringaction monitoring in Go/NoGo tasks and othereffortful attention tasks (Stroop task, Eriksen flankertask) using ERPs (Gehring et al., 2001; Liotti et al.,2001; Luu et al., 2003; Bush et al., 2000). The Error-related negativity (ERN) is a sharp transient ERPdifference wave observed when the ERP to correctresponses (Hits) is subtracted from the ERP toincorrect responses (i.e., errors). The ERN is time-locked to the onset of the motor response, peaking ataround 60-80 msec after the onset of a button press,and has a scalp topography over midline anteriorfrontal scalp. Source dipole modeling and recentevent-related fMRI studies have confirmed that themain source of error-related activity is in dorsal ACC(Kiehl et al., 2000; Garavan et al., 2002). It has beenhypothesized that the ERN reflects a mechanism thatmonitors and checks a representation of the intendedresponse to a representation of the actual response(Bernstein et al., 1995). It has also been argued thatthe ERN reflects a more general error detectionmechanism rather than a mechanism involved inerror correction (Coles et al., 1998). More recently,it has been proposed that the ERN may be related tomotivation and/or the affective processing involvedin error detection and correction. The ERNamplitude is increased when task instructionsemphasize accuracy over speed (Gehring andFencsik, 1999). Importantly, ERP studies of errorprocessing through the ERN paradigm have providedsome of the best evidence for the role of dACC incognitive function, recently prompting a livelydebate about the functional role of this structure ingeneral conflict monitoring in cognitive controlversus error detection (Botvinick et al., 1999, 2001;Van Veen and Carter, 2002b).
In regard to the relevance of dACC function inADHD, an fMRI study found that adults with ADHDperforming the Counting Stroop Task failed to show the activation of dACC that is observed inadult healthy comparisons (Bush et al., 1999).Furthermore, an fMRI study using a block design inADHD adolescents showed no activation in rightdACC during response inhibition in the Stop SignalTask, while such activity was present in healthyadolescents (Rubia et al., 1999). These studiessuggest that dACC is involved both in conflictmonitoring in the Stroop Task, and in components ofinhibitory control in Go/NoGo tasks. However, todate no studies have explored error processing withthe ERN paradigm in ADHD children.
Although available research suggests a role ofmidline frontal structures in inhibitory control anderror processing in healthy subjects and abnormalactivation of such structures in inhibitory control
tasks in ADHD children, the specific processingcomponent affected and the time course of itsactivation are unknown.
The present study aimed at clarifying aspects ofnormal and abnormal functional organization ofinhibitory control and error processing in childrenwith ADHD and healthy children. A specificprediction was that the Error-Related Negativity(ERN) would be abnormally reduced in ADHDchildren relative to controls, reflecting a globaldeficit in cognitive control functions supported bythe midline frontal structures.
Previous fMRI studies in ADHD adolescents andadults had used blocked fMRI designs (Bush et al.,1999; Rubia et al., 1999), and were therefore unableto separate activity related to Successful and Failedinhibitory control, nor to separate activity related tocorrect responses and Errors to Go trials (ERNactivity). In the present study, high-density ERPswere employed in ADHD and healthy childrenduring performance of the Stop Signal Task.
Event Related Potentials are msec by msecreflections of sensory, motor, and cognitiveprocessing during the unfolding of cognitive tasks. They are extracted from the backgroundelectroencephalogram (EEG) through a process oftime-locked averaging of many trials of the sametype to the onset of a sensory stimulus or a motorresponse. ERPs consist of an ordered sequence ofwaveforms identified as P100, N100, P200, N200,P300, depending on their latency and their polarity.Early components (P100 and N100) are calledexogenous, because they require a stimulus, andreflect activity in primary or secondary sensoryareas. However, such early ERP waves can bemodulated by sustained attention and top-downcognitive control processes (Hillyard and Kutas,1983; Woldorff et al., 2002). A longer latencycomponent, the high amplitude P3 or P300, is calledendogenous, because it can be present even inresponse to an expected missing stimulus. P300 iselicited in visual or auditory oddball tasks inresponse to task-relevant, salient infrequent targets,with greater amplitude over posterior (parietal) scalp(see Hillyard and Kutas, 1983, for a review). Anotherwaveform of interest is the N200. A prominent N200with a frontal distribution is observed in response toNoGo stimuli in Go/NoGo tasks, and it is thought toreflect response inhibition processes. In contrast, Gostimuli elicit the parietally distributed P300(Falkenstein et al., 1999).
Event related potentials (ERPs) possessextremely high temporal resolution (milliseconds),and have the potential to identify the timing, order ofactivation, and dynamic orchestration of brainregions during the unfolding of cognitive tasks,including the Stop Signal task. Positron EmissionTomography (PET) and functional MagneticResonance Imaging (fMRI), in contrast, allow forprecise localization of functional activations duringcognitive tasks, but their temporal resolution is
378 Mario Liotti and Others
limited by the slow time course of the hemodynamicresponse.
However, spatial resolution of the ERP method isonly coarse – albeit somewhat improved by the useof high-density sensor arrays. Given certain scalpdistributions of ERP effects, one cannot assume thatERP scalp topography equates to localization ofunderlying electrical generators. Identification of thecortical generators of the scalp recorded ERPcomponents relies on dipole source modeling, acomplex task in the presence of multiple dipoles,since in that case there are no unique solutions. Themost successful attempts at EEG dipole sourceanalysis employ realistic head models (e.g., brainMRI data from the same subject/s), or the within-subject, combined use of ERPs and fMRI or PETduring the same cognitive tasks, with PET or fMRIregional activations used as seeds to constrain ERPdipole modeling (e.g., Woldorff et al., 2002).
Another advantage of ERPs is that, along withthe recently developed Event-Related fMRI, theyallow selective averaging of different stimulus typeswithin the same experimental block, allowing
mixed-trial analysis (such as Successful and Failedinhibitions in the Stop Signal Task). In contrast, PETand conventional fMRI only allow block paradigmdesign, and have no temporal resolution. Because ofthe slowness of the hemodynamic response (peaking5 sec after an event and subsiding after 12-15 sec,and affecting both blocked and event-related fMRIdesigns), ERPs and the magnetic equivalent ERFs(event related fields) can provide unique temporalinformation concerning the timing and order ofactivations of normal and abnormal neural activityduring the unfolding of cognitive tasks.
In summary, the present study aimed at clarifyingspatio-temporal aspects of normal and abnormalfunctional organization of inhibitory control and errorprocessing in ADHD and healthy children using highdensity ERPs during the performance of the StopSignal Task. The emphasis is on ERP findingspossibly associated to midline frontal function. Apartial report of this investigation in the same cohortsof subjects, focusing on a right inferior frontal N200abnormality in ADHD, has been published elsewhere(Pliszka et al., 2000) (see Figure 1).
Abnormal brain activity related to performance monitoring and error detection in children with ADHD 379
Fig. 1 – N200 to the Stop Signal (190-220 msec). Left: Grand average ERPs for Control (purple) and ADHD (blue) for SuccessfulInhibition (Succ Inh, top) and Failed Inhibition trials (Fail Inh, bottom), for inferior frontal (anterior) and parieto-occipital (posterior)scalp regions. L = left; R = right. Zero point is the Stop signal onset. Right: Topographic maps of the ERP difference wave for Controlsminus ADHD for Successful Inhibition trials (Succ Inh, top) and Failed Inhibition trials (Fail Inh, bottom). Note the focal distribution ofthis difference wave over right inferior frontal scalp for both Successful Inhibitions and Failed Inhibition trials (Reproduced withpermission of the Society for Biological Psychiatry).

METHODS
Subjects
Ten boys with ADHD, Combined Type, and tenage-matched control boys served as subjects in theERP study (9-11 yrs old). All subjects were righthanded according to the Edinburgh HandednessInventory (Oldfield, 1971). Diagnosis of ADHDwas established by the Diagnostic InterviewSchedule for Children-Parent Version (DISC)(Shaffer et al., 1996). ADHD, Combined Type, isdefined as having at least six of nine symptoms of inattention/distractibility and at least six of nine symptoms of hyperactivity/impulsivity asdefined by the fourth edition of the Diagnostic and Statistical Manual of American PsychiatricAssociation (DSM-IV). The ADHD subjects wereat least 1.5 standard deviations above the mean onthe Iowa Conners Teacher Rating Scale (CTRS)Inattention/Overactivity factor. ADHD subjectswere obtained from a University private practicesetting and were middle class in terms ofsocioeconomic and occupational status. Controlsubjects were children of both professional andclerical staff at the medical school. IQ andachievement testing were not obtained, but allsubjects were fully literate in English, wereattending regular schools, and did not require anyspecial education or tutoring for educationaldeficiencies. Exclusionary criteria were thepresence of any comorbid anxiety, depressive,conduct or psychotic disorder.
All of the ADHD subjects were positiveresponders to stimulant treatment and had been onstimulant treatment for at least one year, but werekept off medication for at least 24 hours prior totesting. The controls did not meet criteria for anyother psychiatric disorder on the DISC evaluationand were in regular education classes. Writteninformed consent was obtained from all parentsand all children assented to the study. Allprocedures were carried out according to theDeclaration of Helsinki (British Medical Journal,302: 1194, 1991), and approved by the InstitutionalReview Board of the University of Texas HealthScience Center in San Antonio.
Subjects in the present report are from apreviously published study that focused on a rightinferior frontal N200 abnormality in ADHD(Pliszka et al., 2000).
Task
ERP Study. Each child performed the StopSignal Task (Logan et al., 1984). As implementedhere, the letters A or B (GO stimuli) appeared atthe center of the screen for 150 msec, immediatelyabove a fixation point. Intertrial interval variedrandomly between 1.5 and 1.8 sec (mean 1.65 sec).The child pressed one button for the letter A, and a
second button for the B, using the index finger ofeach hand. On 25% of the trials, the GO stimuluswas followed by the STOP signal (the letter S),appearing for 150 msec just below fixation. Theinterval between GO and STOP signal (STOPsignal interval) varied randomly between 200 and600 msec (modified from run to run as notedbelow). The child was instructed not to press thebutton on these trials with STOP signals. When theSTOP signal occurs soon after the GO Signal, it isfairly easy for the subject to inhibit the response,and the percentage of failed inhibitions is relativelylow. In contrast, when the STOP signal occurs at alonger interval after the GO signal, the subject failsmore often to inhibit (Schachar and Logan, 1990).Probabilities of Inhibition [P(I)], slopes and StopSignal Reaction Time (SSRT) can then becalculated for each of the four 100 msec StopSignal Intervals (200-300, 300-400, etc.). SSRT(the time to inhibit a response) is calculated byidentifying the response in the ranked RTdistribution (responses to GO trials) thatcorresponds to 100 minus the Probability ofInhibition (Pliszka et al., 1997; Schachar andLogan 1990).
In the present ERP study, the level of difficultyof the inhibition process for each run was adjustedaccording to the global mean reaction time(GMRT) to the GO stimuli in the preceding run. Ifthe GMRT to the GO trials (i.e., those not followedby STOP signals) in the prior block was slowerthan 600 msec, the difference relative to 600 msecwas added to all STOP signal SOAs in thefollowing block. This prevented the child fromsystematically “beating the S” by slowing down hisRT until he was sure there was no STOP-Signal.There were a total of 10 runs, separated by shortrest periods. Each run lasted about 3 minutes andcontained 144 GO signals along with 48 STOPsignal trials (12 at each of the 4 stop signal delays.The present paper is a further analysis of ERP datapreviously collected in the same subjects during theSST. The published report focused on a rightinferior frontal N200 abnormality in ADHD(Pliszka et al., 2000).
ERP Methods
Brain electrical activity was recorded using acustomized cap with an array of 64 equally spacedelectrodes (Electrocap Inc., Eaton, OH) referencedto the right mastoid. Recording settings were:bandpass = 0.01-100 Hz, gain = 10,000, samplingrate = 400 Hz, impedances < 5k (SA amplifiers,San Diego, CA). Trials with eye movementartifacts were rejected off-line. ERPs wereselectively averaged for the following trial types:GO (A or B not followed by a STOP signal, 75%of the trials), Successful Inhibitions (SI; A or Bfollowed by a STOP signal, with response correctlywithdrawn), and Failed Inhibitions (FI; A or B
380 Mario Liotti and Others
followed by a STOP signal, incorrect button press).ERPs were averaged 4000 msec post-stimulus, witha 400 msec pre-stimulus baseline and digitallyfiltered with a non-causal, zero-phase runningaverage filter of 9 points. ERPs to the SI and FItrials were analyzed time-locked to the onset of theSTOP signal.
After artifact rejection, subject averages amonghealthy children contained an average of 154 trialsfor the Successful Inhibition trials (range 75 to255), and an average of 118 trials for the FailedInhibition trials (range 50 to 220). Subject averagesin the ADHD group contained an average of 85trials for Successful Inhibition trials (range 30 to145), and an average of 170 trials for the FailedInhibition trials (range 73 to 248). In order tocorrect for the expected different proportion ofsuccessful and failed inhibition trials in the twogroups as a function of STOP signal interval, ERPsubject averages were calculated after equallyweighting the subaverages for each of the fourSTOP signal intervals (for more detail, see Pliszkaet al., 2000). To compute the ERN, ERPs to GOtrials were selectively averaged for correctresponses (Hits) and incorrect responses (Errors),time-locked to the latency of the button press.After artifact rejection, subject averages for theIncorrect responses in the healthy control groupincluded an average of 64 trials (4.5% of the Gostimuli; range 32 to 90). In the ADHD group,subject averages included an average of 325 trials(17% of the Go stimuli; range 75 to 552).Individual subjects’ ERPs were then grand-averaged for each trial type for the ADHD andcontrol groups.
Topographic maps of the ERP scalpdistributions for the different trial types and groupdifference waves were created using the sphericalspline method (Perrin et al., 1989).
In order to examine group differences in theselected effects at specific scalp sites, includingpossible differences in scalp topography, meanvoltage amplitudes in the P3a and ERN latencywindows for each subject underwent anormalization procedure with the square root of the
mean of squares method (McCarthy and Wood,1985). Normalized mean voltage values wereentered in repeated-measures ANOVAs. P-valuewas set at .05, and degrees of freedom werecorrected for deviations from sphericity with theGreenhouse-Geisser epsilon method.
RESULTS
Behavioral Results
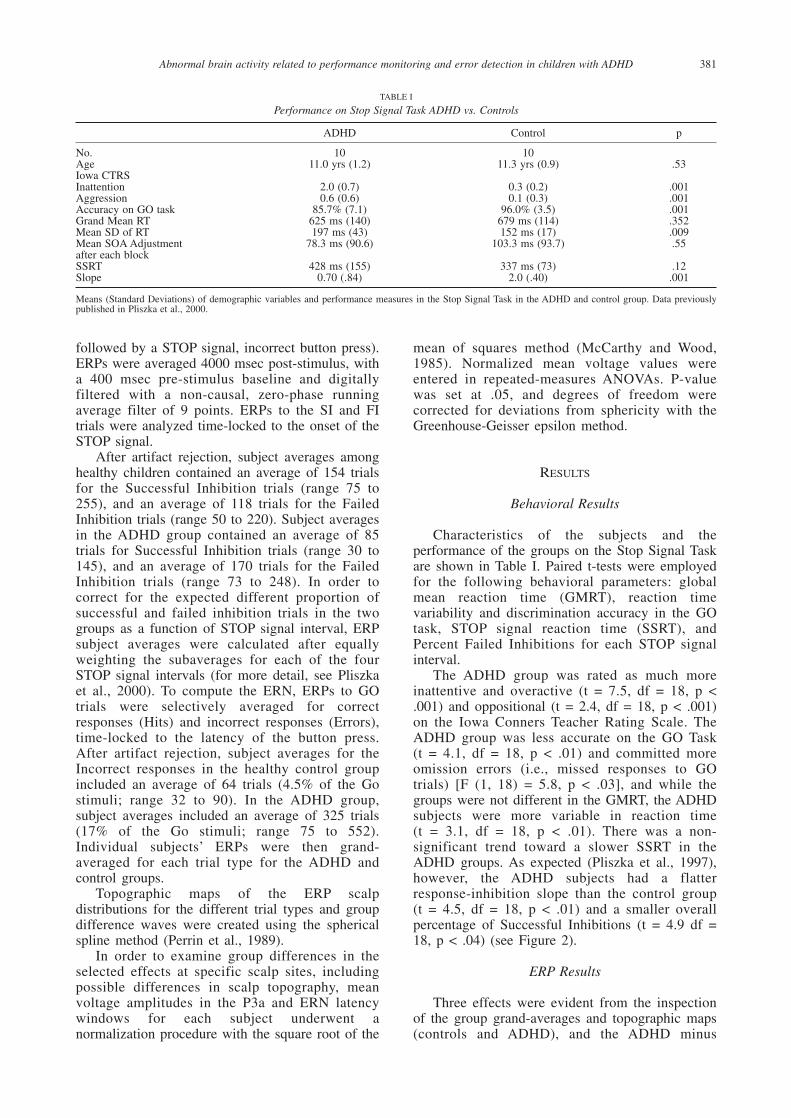
Characteristics of the subjects and theperformance of the groups on the Stop Signal Taskare shown in Table I. Paired t-tests were employedfor the following behavioral parameters: globalmean reaction time (GMRT), reaction timevariability and discrimination accuracy in the GOtask, STOP signal reaction time (SSRT), andPercent Failed Inhibitions for each STOP signalinterval.
The ADHD group was rated as much moreinattentive and overactive (t = 7.5, df = 18, p <.001) and oppositional (t = 2.4, df = 18, p < .001)on the Iowa Conners Teacher Rating Scale. TheADHD group was less accurate on the GO Task (t = 4.1, df = 18, p < .01) and committed moreomission errors (i.e., missed responses to GOtrials) [F (1, 18) = 5.8, p < .03], and while thegroups were not different in the GMRT, the ADHDsubjects were more variable in reaction time (t = 3.1, df = 18, p < .01). There was a non-significant trend toward a slower SSRT in theADHD groups. As expected (Pliszka et al., 1997),however, the ADHD subjects had a flatterresponse-inhibition slope than the control group (t = 4.5, df = 18, p < .01) and a smaller overallpercentage of Successful Inhibitions (t = 4.9 df =18, p < .04) (see Figure 2).
ERP Results
Three effects were evident from the inspectionof the group grand-averages and topographic maps(controls and ADHD), and the ADHD minus
Abnormal brain activity related to performance monitoring and error detection in children with ADHD 381
TABLE I
Performance on Stop Signal Task ADHD vs. Controls
ADHD Control p
No. 10 10Age 11.0 yrs (1.2) 11.3 yrs (0.9) .53Iowa CTRSInattention 2.0 (0.7) 0.3 (0.2) .001Aggression 0.6 (0.6) 0.1 (0.3) .001Accuracy on GO task 85.7% (7.1) 96.0% (3.5) .001Grand Mean RT 625 ms (140) 679 ms (114) .352Mean SD of RT 197 ms (43) 152 ms (17) .009Mean SOA Adjustment 78.3 ms (90.6) 103.3 ms (93.7) .55after each blockSSRT 428 ms (155) 337 ms (73) .12Slope 0.70 (.84) 2.0 (.40) .001
Means (Standard Deviations) of demographic variables and performance measures in the Stop Signal Task in the ADHD and control group. Data previouslypublished in Pliszka et al., 2000.

Control difference waves. First, the ERP to the StopSignal in control children (for both SI and FI trials)showed a sharp negative wave peaking at 200 msecover right inferior frontal scalp (N200), which wasmarkedly reduced in ADHD children (see Figure1). This finding was described in a previous report(Pliszka et al., 2000). Second, the ERP to the StopSignal in control children showed a large amplitudepositive wave peaking at 320 msec for SuccessfulInhibitions only, with a medial anterior frontaldistribution (P3a), which was also markedlyreduced in ADHD children (see Figure 3). Alatency window centered over the grand-averageP3a (280-350 msec) was chosen to study this effect.Third, in the control group the ERPs to GO Errors(FI trails, time-locked to the button press) showed asharp negative peak which was absent in the ERPto GO Hits (30-80 msec, peak at 65 msec after thebutton press), with a focal distribution over midlineanterior frontal scalp. This typical error-relatednegativity (ERN) was also markedly reduced in theADHD group (see Figure 4).
For the P3a analysis (280-350 msec), a set offour left-right anterior (site 9-10, 11-12, 19-20, and13-14) and four posterior electrode sites (site 49-50, 47-48, 57-58, 45-46), close to the scalpmidline, were chosen. (see Figure 3 bottom rightfor scalp locations). In order to assess anterior-posterior, and left-right differences in this activity,four regions of interest (ROIs) were selected (twoper hemisphere) by collapsing together meanvoltage amplitudes over these sets of four adjacentelectrode sites. These ROIs included identical leftand right medial anterior (frontal), and medial
posterior (parietal) scalp sites. A mixed-designrepeated measures ANOVA was carried out withfactors being Group (ADHD vs. Controls),Anterior-Posterior Topography (Ant vs. Post ROI),and Hemisphere (Left vs. Right). Analyses werecarried out separately for SI and FI trials.
The ERN analysis (30-80 msec) was conductedon a subset of six midline scalp sites, in anterior-posterior order (sites 2, 3, 4, 38, 37 and 36; seeFigure 4 bottom right for scalp locations), withfactors being group (ADHD vs. Controls) and TrialType (Errors vs. Hits). This was followed byindividual analyses within each group separately.
Medial Anterior P3a (280-350 msec)
Following the N200, the ERP to successfulinhibition (SI) trials in the control children showeda large amplitude positive wave peaking around320 msec post-Stop-Signal (P3a), which was muchless pronounced for failed inhibition trials (FI).This P3a to SI trials was markedly reduced in theADHD children. The group difference had a focaldistribution over medial anterior scalp, with amaximum over the right hemisphere (see Figure 3).
SI Trials. The P3a amplitude group differencein the ERPs to the Stop Signals for SuccessfulInhibitions trials observed in the waveforms andtopographical maps was corroborated by asignificant interaction involving Group andAnterior-Posterior Topography, F (1, 18) = 6.25, p = 0.02. A significant group difference wasexclusively present over the anterior medial scalpregion: P3a amplitudes were significantly smaller
382 Mario Liotti and Others
Fig. 2 – Percent Failed Inhibitions in the ADHD and Control groups as a function of GO-STOP delay interval. Note steeper slopein the Control group.
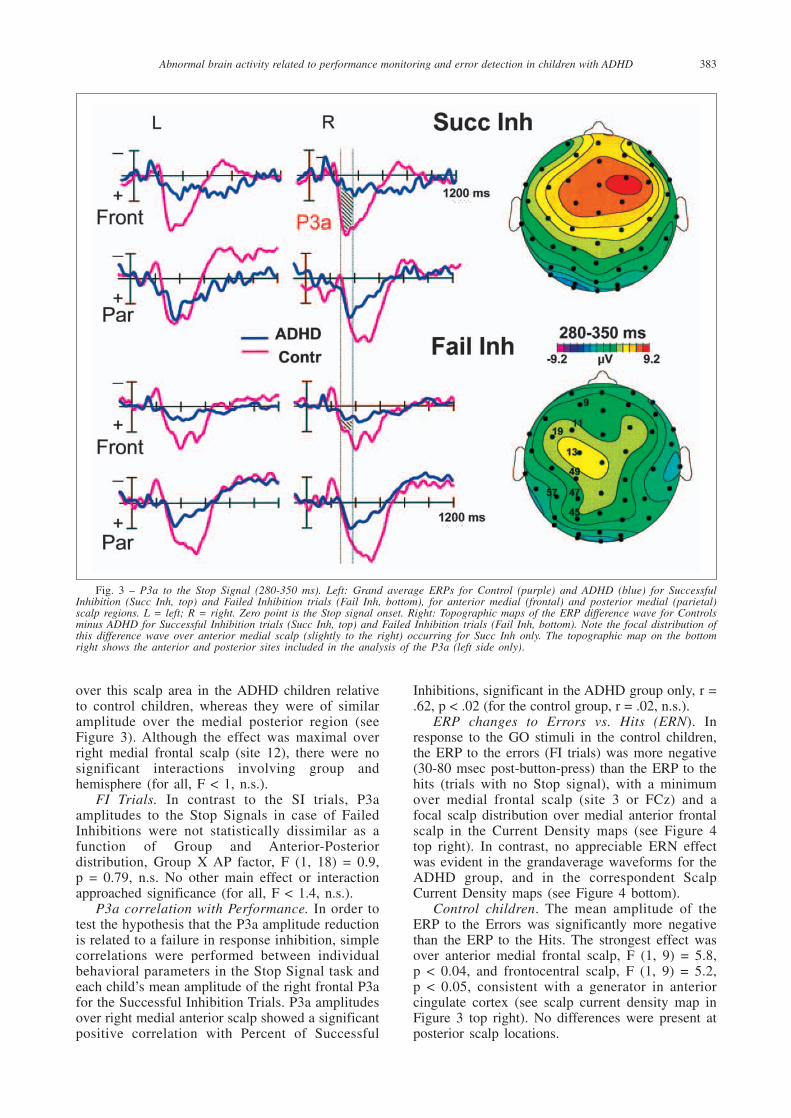
over this scalp area in the ADHD children relativeto control children, whereas they were of similaramplitude over the medial posterior region (seeFigure 3). Although the effect was maximal overright medial frontal scalp (site 12), there were nosignificant interactions involving group andhemisphere (for all, F < 1, n.s.).
FI Trials. In contrast to the SI trials, P3aamplitudes to the Stop Signals in case of FailedInhibitions were not statistically dissimilar as afunction of Group and Anterior-Posteriordistribution, Group X AP factor, F (1, 18) = 0.9, p = 0.79, n.s. No other main effect or interactionapproached significance (for all, F < 1.4, n.s.).
P3a correlation with Performance. In order totest the hypothesis that the P3a amplitude reductionis related to a failure in response inhibition, simplecorrelations were performed between individualbehavioral parameters in the Stop Signal task andeach child’s mean amplitude of the right frontal P3afor the Successful Inhibition Trials. P3a amplitudesover right medial anterior scalp showed a significantpositive correlation with Percent of Successful
Inhibitions, significant in the ADHD group only, r =.62, p < .02 (for the control group, r = .02, n.s.).
ERP changes to Errors vs. Hits (ERN). Inresponse to the GO stimuli in the control children,the ERP to the errors (FI trials) was more negative(30-80 msec post-button-press) than the ERP to thehits (trials with no Stop signal), with a minimumover medial frontal scalp (site 3 or FCz) and afocal scalp distribution over medial anterior frontalscalp in the Current Density maps (see Figure 4top right). In contrast, no appreciable ERN effectwas evident in the grandaverage waveforms for theADHD group, and in the correspondent ScalpCurrent Density maps (see Figure 4 bottom).
Control children. The mean amplitude of theERP to the Errors was significantly more negativethan the ERP to the Hits. The strongest effect wasover anterior medial frontal scalp, F (1, 9) = 5.8, p < 0.04, and frontocentral scalp, F (1, 9) = 5.2, p < 0.05, consistent with a generator in anteriorcingulate cortex (see scalp current density map inFigure 3 top right). No differences were present atposterior scalp locations.
Abnormal brain activity related to performance monitoring and error detection in children with ADHD 383
Fig. 3 – P3a to the Stop Signal (280-350 ms). Left: Grand average ERPs for Control (purple) and ADHD (blue) for SuccessfulInhibition (Succ Inh, top) and Failed Inhibition trials (Fail Inh, bottom), for anterior medial (frontal) and posterior medial (parietal)scalp regions. L = left; R = right. Zero point is the Stop signal onset. Right: Topographic maps of the ERP difference wave for Controlsminus ADHD for Successful Inhibition trials (Succ Inh, top) and Failed Inhibition trials (Fail Inh, bottom). Note the focal distribution ofthis difference wave over anterior medial scalp (slightly to the right) occurring for Succ Inh only. The topographic map on the bottomright shows the anterior and posterior sites included in the analysis of the P3a (left side only).
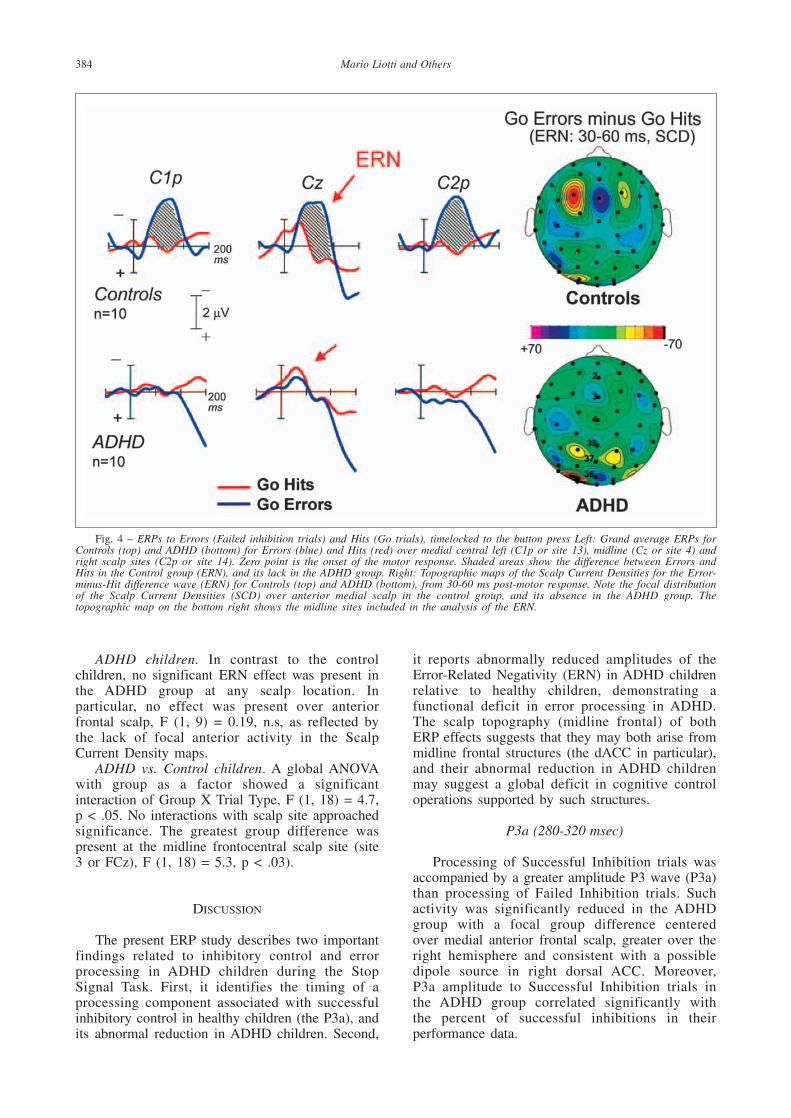
ADHD children. In contrast to the controlchildren, no significant ERN effect was present inthe ADHD group at any scalp location. Inparticular, no effect was present over anteriorfrontal scalp, F (1, 9) = 0.19, n.s, as reflected bythe lack of focal anterior activity in the ScalpCurrent Density maps.
ADHD vs. Control children. A global ANOVAwith group as a factor showed a significantinteraction of Group X Trial Type, F (1, 18) = 4.7,p < .05. No interactions with scalp site approachedsignificance. The greatest group difference waspresent at the midline frontocentral scalp site (site3 or FCz), F (1, 18) = 5.3, p < .03).
DISCUSSION
The present ERP study describes two importantfindings related to inhibitory control and errorprocessing in ADHD children during the StopSignal Task. First, it identifies the timing of aprocessing component associated with successfulinhibitory control in healthy children (the P3a), andits abnormal reduction in ADHD children. Second,
it reports abnormally reduced amplitudes of theError-Related Negativity (ERN) in ADHD childrenrelative to healthy children, demonstrating afunctional deficit in error processing in ADHD.The scalp topography (midline frontal) of bothERP effects suggests that they may both arise frommidline frontal structures (the dACC in particular),and their abnormal reduction in ADHD childrenmay suggest a global deficit in cognitive controloperations supported by such structures.
P3a (280-320 msec)
Processing of Successful Inhibition trials wasaccompanied by a greater amplitude P3 wave (P3a)than processing of Failed Inhibition trials. Suchactivity was significantly reduced in the ADHDgroup with a focal group difference centered over medial anterior frontal scalp, greater over theright hemisphere and consistent with a possibledipole source in right dorsal ACC. Moreover, P3a amplitude to Successful Inhibition trials in the ADHD group correlated significantly with the percent of successful inhibitions in theirperformance data.
384 Mario Liotti and Others
Fig. 4 – ERPs to Errors (Failed inhibition trials) and Hits (Go trials), timelocked to the button press Left: Grand average ERPs forControls (top) and ADHD (bottom) for Errors (blue) and Hits (red) over medial central left (C1p or site 13), midline (Cz or site 4) andright scalp sites (C2p or site 14). Zero point is the onset of the motor response. Shaded areas show the difference between Errors andHits in the Control group (ERN), and its lack in the ADHD group. Right: Topographic maps of the Scalp Current Densities for the Error-minus-Hit difference wave (ERN) for Controls (top) and ADHD (bottom), from 30-60 ms post-motor response. Note the focal distributionof the Scalp Current Densities (SCD) over anterior medial scalp in the control group, and its absence in the ADHD group. Thetopographic map on the bottom right shows the midline sites included in the analysis of the ERN.
The greater amplitude of the P3a wave incontrol children appears to reflect the moreefficient monitoring or successful implementationof the process of response inhibition, with themarked reduction in amplitude of ADHD childrenlikely representing a deficit in this inhibitoryprocess. This decreased brain activity is associatedwith the abnormal behavioral performance in theADHD children, as indexed by the abnormal slopefunction in the Stop signal Task, and furthersupported by the significant correlation betweenP3a amplitude and behavioral indices of responseinhibition in the ADHD group. This is consistentwith a study reporting a significant correlationbetween children’s performance in a difficult visualsearch task and the volume of the right dACC(Casey et al., 1997c). In the present study, the lackof a significant correlation between P3a amplitudeand behavioral measures in the control group maybe explained by less variability in P3a amplitudesin this group.
These combined findings, along with themidline frontal distribution of the effects, seem toimplicate midline frontal structures in responseinhibition and its impairment in ADHD children.This conclusion is supported by the findings ofabnormally reduced BOLD fMRI activity in dACCin block-design fMRI studies during the StopSignal Task and the Counting Stroop in ADHDsubjects (Rubia et al., 1999; Bush et al., 1999) aswell as the localization of fMRI activity in healthychildren and adults during Go/NoGo tasks (Caseyet al., 1997a). Dipole source analysis was notcarried out in the present study, and fMRI data inthe same subjects were not available. Therefore,the localization of the present ERP effects to dACCshould be interpreted with caution.
P3a in Earlier Studies
ERP studies of visual or auditory oddball taskshave identified two P300 subcomponents, the P3aand the P3b. The P3b is evoked by the presentationof task-relevant infrequent targets. This componentis largest over posterior (parietal) scalp. The P3a isan earlier latency component typically evoked byinfrequent distracter or novel stimuli, which has amore anterior scalp distribution, and peakamplitude over frontal and central scalp regions(Hillyard and Kutas, 1983, for a review). Themedial wall of the frontal lobe, including theanterior cingulate cortex, has been implicated ascontributing substantially to the generation of theP3a to rare distracters by studies using intracorticalrecordings in epileptic patients (Brazdil et al.,1999; Baudena et al., 1995). Ebmeir et al. (1995)measured simultaneously brain metabolism withSPECT and electrical activity with scalp EEG inhealthy subjects during auditory oddball tasks.They found that the amplitude of the P3a to noveldistracters correlated positively with tracer uptake
in anterior cingulate cortex. Finally, recent event-related fMRI studies in healthy controls duringoddball tasks with infrequent targets and noveldistracters have confirmed selective activation ofanterior cingulate cortex to novel distracters islikely to be involved in the generation of P3awaves (Clark et al., 2000; Kiehl et al., 2001;Downar et al., 2002).
No studies have investigated P3a waves to novel stimuli in ADHD children. A publishedERP auditory oddball study in healthy 9-year-oldchildren with normal IQ found that distractiblechildren compared to non-distractible children(defined by low scores on the Freedom fromDistractibility factor[FFT]; Arithmetic and DigitSpan of the Wechsler Intelligence Scale forChildren-Revised [WISC-R]) produced a frontallydistributed P3a to task-relevant targets, with notendency to habituation (Kilpeläinen et al., 1999), asif such stimuli were novel or surprising. Thisfinding of enhanced P3a activity in distractiblechildren may seem at odds with the results ofimpaired P3a activity in ADHD children in thepresent study. However, the link between FFTperformance and ADHD is very tenuous, sincebesides attention and concentration, FFT measuressymbolic reasoning and manipulation ofmathematical mental representations, and it does nottap directly into response inhibition. Furthermore,the children in Kilpeläinen et al. (1999) did not havea diagnosis of ADHD and were not tested formeasures of Inattention/Overactivity (I/O), such asthe CTRS I/O Factor).
Error Processing in ADHD
A second important and novel finding of thisstudy is that ERP activity associated with errorprocessing (the error related negativity or ERN),also known to have a significant contribution fromgenerators in dACC (Kiehl et al., 2000; Geheringet al., 2001; Bush et al., 2000; Liotti et al., 2001),was found to be markedly reduced in ADHDchildren relative to healthy children. This is, to ourknowledge, the first report of impaired ERNactivity in ADHD, suggesting that error processing(error detection and correction) in the dACC isimpaired in this developmental disorder.
Similar midline frontal scalp distributions in thepresent study in both the monitoring of successfulinhibition performance (P3a) and the monitoring oferrors (ERN) are consistent with recent accounts ofdACC function as involved both in conflictmonitoring in selective attention (such as in theStroop task) and in error processing, as indexed bythe ERN (Botvinick 2000, 2001; Van Veen andCarter, 2002; Liotti et al., 2001). In particular, ERPstudies of conflict monitoring (Stroop Task, Eriksenflanker task) have reported co-localization of theerror-related negativity and a negativity associatedwith cognitive conflict (both distributed over
Abnormal brain activity related to performance monitoring and error detection in children with ADHD 385
midline frontal scalp, and source localized to thesame dACC generators: Liotti et al., 2001; VanVeen and Carter, 2002). Such results are alsoconsistent with recent event-related fMRI evidenceshowing that dACC activity is present both inresponse to Go and to NoGo stimuli (Liddle et al.,2001; Garavan et al., 2002).
Functional Role of Right Inferior PFC and MidlineFrontal Cortex during Inhibitory Control
The use of high-density ERPs in the presentstudy provides unique clues about the timing andstage of information processing of the involvementof prefrontal regions during the unfolding of theStop Signal Task. More specifically, ERPs to theonset of the Stop Signal showed a markedreduction of an earlier and more transient ERPcomponent in the ADHD group, the N200, with afocal distribution on the right inferior frontal scalpof the group difference effect (Pliszka et al., 2000)(see Figure 1). Such localization is consistent withthe recent fMRI and lesion-correlation findings intasks of inhibitory control (Garavan et al., 1999;2002, Rubia et al., 1999, Aron et al., 2003).Importantly, N200 activity evoked by the StopSignal had similar amplitude for Successful andFailed Inhibitions in the healthy boys, and bothwere reduced by the same extent in the ADHDgroup (Pliszka et al., 2000) (Figure 2). This isconsistent with a functional interpretation of theN200 as a ‘red flag’ (Falkenstein et al., 1999)triggering the initiation of the inhibitory process,independent of its outcome. This right frontal‘braking mechanism’ would operate in a similarway to the use of brakes in a vehicle – faced witha sudden obstacle in our path, we would ‘hit thebrakes’ whether or not we can successfully stop thecar in time.
Later in the processing, the ERP to the StopSignal showed a marked reduction in the ADHDgroup of a slow positive ERP wave, the P3a, witha substantially different focal distribution over rightmedial frontal scalp. Although no source analysiswas performed in this study, and fMRI data werenot acquired, indirect support of the localization ofthis effect to dACC comes from the results ofrecent fMRI studies in ADHD during the StopSignal Task (Rubia et al., 1999) and the CountingStroop task (Bush et al., 1999). At variance withthe earlier N200 effect, the P3a effect showedselectivity for the Successful Inhibition trials,suggesting that it may index a later stage in theinhibitory process, such as monitoring of itssuccessful implementation.
The results of this study are consistent with thenotion that a distributed network, including rightmiddle lateral prefrontal cortex and right midlinefrontal structures (e.g., dACC), is involved ininhibitory control as tapped by the Stop SignalTask. Based on the timing and scalp distributions
of our ERP effects, right lateral prefrontal cortexappears to be crucial for the initiation of responseinhibition by triggering the inhibitory process,consistent with its previously reported more generalrole in other inhibitory control tasks (Go/NoGo,Wisconsin card-sorting task, etc). In contrast,dorsal ACC appears to be involved in monitoringprocesses during inhibitory control, including bothmonitoring of the successful outcome of theinhibitory process, and in monitoring errors inresponse to the Go stimuli. This view of thefunctional parcellation of lateral PFC and dACCactivity is consistent with one proposed by a recenter-fMRI study during a Go/NoGo task (Liddle etal., 2001). Once again, the localization of thepresent effects should be interpreted with caution,given the lack of fMRI data in the same subjectsand task.
Error Processing in ADHD
The ERP to Errors (Failed-inhibition trials) andto Hits (Go trials) showed a striking reduction ofthe Error Related Negativity in the ADHD group.This difference wave also possessed a very focalmedial anterior distribution in the normal subjects,consistent with previous findings indicating that itlikely originates from the dorsal Anterior Cingulate(Liddle et al., 2001). This finding is consistent withimpaired error monitoring (error detection andcorrection) in ADHD.
A functional abnormality in midline frontalstructures (dACC in particular) in ADHD childrenwould account for both impaired monitoring ofsuccessful (correct) inhibitions, and impairedmonitoring of errors, consistent with currentaccounts of the function role of dACC in cognitivecontrol and action monitoring (Botvinick et al.,1999; 2001; Gehring and Fencsik, 2001).
Caveats and Current Directions
The present study should be consideredpreliminary, given the small sample size of the twogroups and the lack of test-retest or split-halfreliability data. The proposed localizations of theERP effects should be interpreted with caution,given the lack of ERP source dipole modeling, andthe absence of converging data from fMRI in thissample of children and this version of the SST.
The effects of acute and chronic stimulanttreatment on the ERP findings were not examinedin this pilot study (see below). All the ADHDchildren were on chronic treatment (> 1 year),stimulant medication, suspended 24 hr before the study. Acute methylphenidate interruption has been found to cause a rebound of activity in motor/premotor cortical areas, possibly a direct effect of dopamine on motor inhibitionmechanisms (Bell et al., 1983). In addition, arecent SPECT study showed that acute suspension
386 Mario Liotti and Others
of methylphenidate (MPH) treatment in chronicallytreated ADHD boys (comparable to the subjects inthe present study) resulted in an increase inanterior cingulate activity during a Go/NoGo task,compared to similar ADHD boys without MPHsuspension (Langleben et al., 2002). No healthysubjects were included in that study, making thecomparison with the present findings difficult.Whereas further studies are necessary to explorethe influence of acute and chronic stimulanttreatment in ADHD, it is worth pointing out thatMPH withdrawal cannot explain our P3a and ERNgroup differences (abnormal reductions), because ifanything the possible influence of acute MPHinterruption would have resulted in an inverse signinfluence on functional indices of dACC function,i.e., reducing rather than increasing the size of theERP effects.
A potential confound of the P3a findings is thatSI trials include Successful inhibitions in responseto the STOP signal as well as omissions(unattended STOP signals due to lapses inconcentration). In this paradigm an independentmeasure of omissions was available from the GOtrials. ADHD children did in fact have significantlymore omissions on such trials than the healthycontrol group (see Table I). It is unlikely howeverthat the presence of omissions among the SI trialscan account for the P3a group difference. In a different ERP study of the SST in healthy adults (Schmajuk et al., submitted), we included aSTOP-irrelevant condition, in which STOP signalswere present but subjects were asked to not payattention to them. The comparison of the STOP-relevant and STOP irrelevant conditions isolated aposterior N200 subcomponent with parietooccipitaldistribution, likely reflecting early sustainedattention to the STOP signal (Schmajuk et al.,submitted). Figure 2 shows that the amplitude ofthe N200 to the STOP signal over posterior scalpsites in the present study was of similar amplitudeamong the two groups, while it was the N200amplitude over right inferior frontal scalp thatshowed a dramatic difference among the twogroups, likely reflecting the selective impairment ofan N200 subcomponent associated to responseinhibition (Pliszka et al., 2000; Schmajuk et al.,submitted). It is considered unlikely that adifference in omissions (due to lapses inconcentration) among SI trials would affect thefrontocentral P3a but not affect the posterior N200,more specifically linked to task relevance and earlysensory attention.
Our group is currently carrying out a largerscale replication and extension of this pilot study,involving combined use of ERPs and fast rateevent-related fMRI during the Stop Signal Task andthe Stroop Task, neuropsychological evaluation, andMRI morphometry. Preliminary analysis of thefMRI data in the Stop Signal Task (12 healthychildren, 10 ADHD) confirms robust activations of
right middle and inferior frontal gyri and rightdACC in the healthy group, and reduction sucheffects in the ADHD group (unpublished data,University of Texas Health Science Center at SanAntonio). Issues addressed by the current project,are: a) The effect of acute or chronic stimulanttreatment on the ERP abnormalities, by comparingpreviously stimulant treated to stimulant treatmentnaive ADHD children, and the effects of best doseacute methylphenidate treatment versus placebo; b)the specificity of the findings to ADHD, by testinga comparison group of children with anotherdevelopmental condition, i.e., Reading Disorder; theeffects of gender (boys or girls) and puberty(prepuberal versus postpuberal).
It is believed that a within-subjectmultimethodological approach combiningneuropsychology and morphometric analysis tobehavioral, electrophysiological, and neuroimagingmeasures of response inhibition will greatlyimprove our understanding of the brain-behaviourrelationships in ADHD.
Acknowledgements. Funding from NIMH RO1MH63986, the Morrison Trust, the George and FayeYoung Foundation. The authors wish to thank VonettaJones and Sarabeth Pridgen for assistance in the ERPsessions.
REFERENCES
BARKLEY RA. ADHD and the Nature of Self Control. New York:Guildford Press, 1997.
BAUDENA P, HALGREN E, HEIT G and CLARKE JM. Intracerebralpotentials to rare target and distractor auditory and visualstimuli. III. Frontal cortex. Electroencephalography andClinical Neurophysiology, 94: 251-264, 1995.
BELL RD, ALEXANDER GM and SCHWARTZMAN RJ. Methylphenidatedecreases local glucose metabolism in the motor cortex.Pharmacology, Biochemistry and Behavior, 18: 1-5, 1983.
BERNSTEIN PS, SCHEFFERS NK and COLES MGH. ”Where did I gowrong?”. A psychophysiological analysis of error detection.Journal of Experimental Psychology: Human Perception andPerformance, 21: 1312-1322, 1995.
BOTVINICK MM, NYSTROM LE, FISSELL K, CARTER CS and COHENJD. Conflict monitoring versus selection-for-action in anteriorcingulate cortex. Nature, 1402: 179-181, 1999.
BOTVINICK MM, BRAVER TS, BARCH DM, CARTER CS and COHENJD. Conflict monitoring and cognitive control. PsychologicalReview, 108: 624-652, 2001.
BRAZDIL M, REKTOR I, DUFEK M, DANIEL P, JURAK P and KUBA R.The role of frontal and temporal lobes in visual discriminationtask-depth ERP studies. Neurophysiologie Clinique, 29: 339-350, 1999.
BUSH G, FRAZIER JA, RAUCH SL, SEIDMAN LJ, WHALEN PJ, JENIKEMA, ROSEN BR and BIEDERMAN J. Anterior cingulate cortexdysfunction in attention-deficit/hyperactivity disorderrevealed by fMRI and the Counting Stroop. BiologicalPsychiatry, 45: 1542-1552, 1999.
BUSH G, LUU P and POSNER MI. Cognitive and emotionalinfluences in anterior cingulate cortex. Trends in CognitiveSciences, 4: 215-222, 2000.
CARTER CS, MINTUN M and COHEN JD. Interference andfacilitation effects during selective attention: An H215O PETstudy of Stroop task performance. Neuroimage, 2: 264-272,1995.
CASEY BJ, CASTELLANOS FX, GIEDD JN, MARSH WL, HAMBURGERSD, SCHUBERT AB, et al. Implication of right frontostriatalcircuitry in response inhibition and attention-deficit/hyperactivity disorder. Journal of the AmericanAcademy of Child and Adolescent Psychiatry, 36: 374-383,1997a.
Abnormal brain activity related to performance monitoring and error detection in children with ADHD 387
CASEY BJ, TRAINOR RJ, GIEDD JN, VAUSS Y, VAITUZIS CK,HAMBURGER S, KOZUK P and RAPOPORT JL. The role of theanterior cingulate in automatic and controlled processes: Adevelopmental neuroanatomical study. DevelopmentalPsychobiology, 30: 61-69, 1997c.
CASEY BJ, TRAINOR RJ, ORENDI JL, SCHUBERT AB, NYSTROM LE,GIEDD JN, et al. A developmental functional MRI study ofprefrontal activation during performance of a go-no-go task.Journal of Cognitive Neuroscience, 9: 835-847, 1997b.
CASTELLANOS FX. Toward a pathophysiology of attention-deficit/hyperactivity disorder. Clinical Pediatrics, 36: 381-393, 1997.
CASTELLANOS FX, GIEDD JN, MARSCH WL, HAMBURGER SD,VAITUZIS AC, DICKSTEIN DP et al. Quantitative brain magneticresonance imaging in attention-deficit hyperactivity disorder.Archives of General Psychiatry, 53: 607-616, 1996.
CLARK VP, FANNON S, LAI S, BENSON R and BAUER L. Responsesto rare visual target and distractor stimuli using event-relatedfMRI. Journal of Neurophysiology, 83: 3133-3139, 2000.
COLES MGH, SCHEFFERS MK and HOLROYD C. Error-related brainactivity: Historical Introduction. Paper presented at the annualmeeting of the Society for Psychophysiological Research,Denver, CO, 1998 September.
DOWNAR J, CRAWLEY AP, MIKULIS DJ and DAVIS KD. A corticalnetwork sensitive to stimulus salience in a neutral behavioralcontext across multiple sensory modalities. Journal ofNeurophysiology, 87: 615-620, 2002.
EBMEIER KP, STEELE JD, MACKENZIE DM, O’CARROLL RE, KYDDRR, GLABUS MF, et al. Electroencephalography and ClinicalNeurophysiology, 95: 434-443, 1995.
FALKENSTEIN M, HOORMANN J and HOHNSBEIN J. ERP componentsin Go/Nogo tasks and their relation to inhibition. ActaPsychologica, 101: 267-291, 1999.
FILIPEK PA, SEMRUD-CLIKEMAN M, STEINGRARD RJ, RENSHAW PF,KENNEDY DN and BIEDERMAN J. Volumetric MRI analysiscomparing subjects having attention-deficit hyperactivitydisorder with normal controls. Neurology, 48: 589-601, 1997.
GARAVAN H, ROSS TJ and STEIN EA. Right hemispheric dominanceof inhibitory control: An event-related functional MRI study.Proceedings of the National Academy of Sciences USA, 96:8301-8306, 1999.
GARAVAN H, ROSS TJ, MURPHY K, ROCHE RA and STEIN EA.Dissociable executive functions in the dynamic control ofbehavior: Inhibition, error detection, and correction.Neuroimage, 17: 1820-1829, 2002.
GEHRING WJ and FENCSIK DE. Functions of the medial frontalcortex in the processing of conflict and errors. Journal ofNeuroscience, 21: 9430-9437, 2001.
HILLYARD SA and KUTAS M. Electrophysiology of cognitiveprocessing. Annual Review of Psychology, 34: 33-61, 1983.
KIEHL KA, LAURENS KR, DUTY TL, FORSTER BB and LIDDLE PF.Neural sources involved in auditory target detection andnovelty processing: An event-related fMRI study.Psychophysiology, 38: 133-142, 2001.
KILPELAINEN R, LUOMA L, HERRGARD E, YPPARILA H, PARTANEN Jand KARHU J. Persistent frontal P300 brain potential suggestsabnormal processing of auditory information in distractiblechildren. Neuroreport, 10: 3405-3410, 1999.
LANGLEBEN DD, ACTON PD, AUSTIN G, ELMAN I, KRIKORIAN G,MONTEROSSO JR, et al. Effects of methylphenidatediscontinuation on Cerebral Blood Flow in prepubescent boyswith Attention Deficit Hyperactivity Disorder. Journal ofNuclear Medicine, 43: 1624-1629, 2002.
LIDDLE PF, KIEHL KA and SMITH AM. Event-related fMRI study ofresponse inhibition. Human Brain Mapping, 12: 100-109,2001.
LIOTTI M, KOTHMANN D, JONES V, PERES III R and WOLDORFFMG. Co-localization in ACC of Conflict Monitoring and ErrorDetection. Cognitive Neuroscience Society Abstracts, April2001.
LIOTTI M, WOLDORFF MG, PEREZ R and MAYBERG HS. An ERPstudy of the temporal course of the Stroop color-wordinterference effect. Neuropsychologia, 38: 701-711, 2000.
LOGAN GD, COWAN WB and DAVIS KA. On the ability to inhibitsimple and choice reaction time responses: A model and amethod. Journal of Experimental Psychology: HumanPerception and Performance, 10: 276-291, 1984.
LUU P, TUCKER DM, DERRYBERRY D, REED M and POULSEN C.Electrophysiological responses to errors and feedback in theprocess of action regulation. Psychological Science, 14: 47-53, 2003.
MCCARTHY G and WOOD CC. Scalp distributions of event-relatedpotentials: An ambiguity associated with analysis of variancemodels. Electroencephalography and ClinicalNeurophysiology, 62: 203-208, 1985.
OLDFIELD RC. The assessment and analysis of handedness: TheEdinburgh inventory. Neuropsychologia, 9: 97-113, 1971.
PARDO JV, PARDO PJ, JANER KW and RAICHLE ME. The anteriorcingulate cortex mediates processing selection in the Stroopattentional conflict paradigm. Proceedings of the NationalAcademy of Sciences USA, 87: 256-259, 1990.
PERRIN F, PERNIER J, BERTRAND D and ECHAILLIER JF. Sphericalsplines for scalp potential and current density mapping.Electroencephalography and Clinical Neurophysiology, 72:184-187, 1989.
PLISZKA SR, BORECHERDING SH, SPRATLEY K, LEON S and IRICK S.Measuring inhibitory control in children. Journal ofDevelopmental and Behavioral Pediatrics, 18: 254-259, 1997.
PLISZKA SR, LIOTTI M and WOLDORFF MG. Inhibitory control inchildren with attention-deficit/hyperactivity disorder: Event-related potentials identify the processing component andtiming of an impaired right-frontal response-inhibitionmechanism. Biological Psychiatry, 48: 238-246, 2000.
RUBIA K, OVERMEYER S, TAYLOR E, BRAMMER M, WILLIAMS SCR,SIMMONS A and BULLMORE ET. Hypofrontality in attentiondeficit hyperactivity disorder during higher-order motorcontrol: A study with functional MRI. American Journal ofPsychiatry, 156: 891-896, 1999.
SCHACHAR R and LOGAN G. Are hyperactive children deficient inattentional capacity? Journal of Abnormal Child Psychology,18: 493-513, 1990.
SHAFFER D, FISCHER P, DULCAN MK, DAVIES M, PIACENTINI J,SCHWAB-STONE ME, et al. The NIMH Diagnostic InterviewSchedule for Children Version 2.3 (DISC 2.3): description,acceptability, prevalence rates, and performance in the MECAstudy. Methods for the Epidemiology of Child and AdolesentMental Disorders. Journal of the American Academy of Childand Adolescent Psychiatry, 35: 865-877, 1996.
SCHMAJUK M, LIOTTI M, BUSSE L and WOLDORFF MG. ERPElectrophysiological activity underlying inhibitory controlprocesses in normal adults. Neuropsychologia, in press.
SWICK D and JOVANOVIC J. Anterior cingulate cortex and theStroop task: Neuropsychological evidence for topographicspecificity. Neuropsychologia, 40: 1240-1253, 2002.
VAN DER MEERE J, VREELING HJ and SERGEANT J. A motorpresetting study in hyperactive, learning disabled and controlchildren. Journal of Child Psychology and Psychiatry, 33:1347-1354, 1992.
VAIDYA CJ, AUSTIN G, KIRKORIAN G, RIDLEHUBER HW, DESMONDJE, GLOVER GH and GABRIELI JD. Selective effects ofmethylphenidate in attention deficit hyperactivity disorder: Afunctional magnetic resonance study. Proceedings of theNational Academy of Sciences USA, 95: 14494-14499, 1998.
VAN VEEN V and CARTER CS. The timing of action-monitoringprocesses in the anterior cingulate cortex. Journal ofCognitive Neuroscience, 14: 593-602, 2002a.
VAN VEEN V and CARTER CS. The anterior cingulate as a conflictmonitor: fMRI and ERP studies. Physiology and Behavior, 77:477-482, 2002b.
WOLDORFF MG, LIOTTI M, SEABOLT M, BUSSE L, LANCASTER JLand FOX PT. The temporal dynamics of the effects in occipitalcortex of visual-spatial selective attention. Cognitive BrainResearch, 15: 1-15, 2002.
Mario Liotti, Department of Psychology, Simon Fraser University, 888 UniversityDrive, Burnaby, British Columbia, V5A IS6, Canada. e-mail: [email protected]
388 Mario Liotti and Others