Aberrant fetal growth and early, late, and postneonatal mortality: an analysis of Milwaukee births,...
10
Aberrant fetal growth and early, late, and postneonatal mortality: an analysis of Milwaukee births, 1996 –2007 Han-Yang Chen, MS; Suneet P. Chauhan, MD; Trina C. Salm Ward, MSW; Naoyo Mori, PhD; Eric T. Gass, PhD; Ron A. Cisler, PhD OBJECTIVE: The objective of the study was to ascertain the association between fetal growth (small- [SGA], appropriate- [AGA], and large-for- gestational-age [LGA]) and early, late, and postneonatal mortality. STUDY DESIGN: Birth certificate data for nonanomalous singletons, delivered from 1996 to 2007, were obtained for Milwaukee residents. Multivariate logistic regression analyses, adjusted for 19 covariates, determined the association between fetal growth and mortality. RESULTS: Among the 123,383 live births, SGA was 57% higher than LGA (11% vs 7%). The infant mortality rate for SGA was 11.0, AGA, 5.3, and LGA 2.7/1000 live births. SGA was a significant risk factor for early (adjusted odds ratio, 2.66) and late (2.06) but not postneonatal mortal- ity. The adjusted risk of mortality for LGA was not significantly different from AGA. Over 12 years, 3 types of mortality for aberrant fetal growth did not change significantly. CONCLUSION: In the city of Milwaukee, aberrant fetal growth was vari- ably associated with early, late, and postneonatal mortality. Key words: early mortality, large for gestational age, late mortality, postneonatal mortality, small for gestational age Cite this article as: Chen H-Y, Chauhan SP, Salm Ward TC, et al. Aberrant fetal growth and early, late, and postneonatal mortality: an analysis of Milwaukee births, 1996 –2007. Am J Obstet Gynecol 2011;204:xx-xx. A berrant fetal growth encompasses small for gestational age (SGA) or large for gestational age (LGA). Whereas SGA is defined as neonatal birthweight be- low 10% for the gestational age, LGA is weight above 90%, with macrosomia (weight of at least 4000 g) being a subset of accelerated growth. 1,2 Fetal growth abnor- malities are linked with complications. SGA, for example, is associated with fetal anomalies, oligohydramnios, stillbirth, neonatal acidosis, seizure, and death. Later in life, newborns with suboptimal growth are at increased risk of learning disabilities and cardiovascular disease. 1 On the other hand, LGA may lower or increase the like- lihood of mortality. Among diabetic mothers, accelerated growth is associated with traumatic delivery and stillbirth 3 ; among women with pregnancy-induced hypertension, preterm LGA has signifi- cantly lower infant mortality. 4 The myriad complications associated with aberrant growth and the conflict- ing reports on mortality with LGA prompted us to inquire if SGA or LGA is associated with early (0-6 days after live birth), late (7-27 days), or postneonatal (28-364 days) mortality. The primary purpose of this population based study was to determine whether SGA or LGA is associated with increased risk of early, late, and postneonatal mortal- ity, and identify other risk factors; the sec- ondary purpose was to determine whether there are temporal changes in the 3 sub- types of infant mortality. MATERIALS AND METHODS This project was reviewed and deter- mined exempt by the Health Sciences In- stitutional Review Board at the Univer- sity of Wisconsin–Madison. For the years 1996-2007, we obtained vital statis- tics birth certificate data for the city of Milwaukee, WI, from the City of Mil- waukee Health Department. The birth certificate data were linked to death cer- tificate data, and mortality information was included. The study sample was re- stricted to singleton live births born to city of Milwaukee resident mothers with gestational age of 24 weeks or more. Newborns with congenital anomaly or implausible birthweight– gestational age combinations were excluded. Implausi- ble birthweight– gestational age data were identified by the algorithm that was developed by Alexander et al. 5 This method was based on expert opinion concerning some questionable birth- weight values that may be a result of in- accurate recording of gestational age. In addition, infant death cases with un- known time of death were also excluded. The outcomes of interest were early, late, and postneonatal mortalities. Early mortality was defined as newborns that died during 0-6 days of life; late mortal- ity, 7-27 days; and postneonatal mortal- ity, 28-364 days. Infant mortality rate (IMR) was the summation of early, late, and postneonatal mortality rate. Based on Alexander et al, 6 fetal growth was cat- egorized as SGA, appropriate for gesta- From the Center for Urban Population Health (Mr Chen, Ms Ward, Dr Mori, and Dr Cisler); the College of Health Sciences and School of Public Health, University of Wisconsin–Milwaukee (Drs Mori, and Cisler); the City of Milwaukee Health Department (Dr Gass), Milwaukee, the School of Medicine and Public Health (Mr Chen, Ms Ward, and Dr Cisler), University of Wisconsin–Madison, Madison, WI, and the Eastern Virginia Medical Center, Norfolk, VA (Dr Chauhan). Presented at the 77th Annual Meeting of the Central Association of Obstetricians and Gynecologists, Las Vegas, NV, Oct. 27-30, 2010. Received July 1, 2010; revised Nov. 15, 2010; accepted Nov. 29, 2010. Reprints not available from the authors. The Center for Urban Population Health is a partnership of the University of Wisconsin School of Medicine and Public Health, the University of Wisconsin-Milwaukee, and Aurora Health Care, Inc. 0002-9378/$36.00 © 2011 Mosby, Inc. All rights reserved. doi: 10.1016/j.ajog.2010.11.040 CAOG Papers www. AJOG.org MONTH 2011 American Journal of Obstetrics & Gynecology 1.e1
Transcript of Aberrant fetal growth and early, late, and postneonatal mortality: an analysis of Milwaukee births,...
bg
1
lSlw(
CAOG Papers www.AJOG.org
Aberrant fetal growth and early, late, and postneonatalmortality: an analysis of Milwaukee births, 1996–2007Han-Yang Chen, MS; Suneet P. Chauhan, MD; Trina C. Salm Ward, MSW;Naoyo Mori, PhD; Eric T. Gass, PhD; Ron A. Cisler, PhD
a
K
OBJECTIVE: The objective of the study was to ascertain the associationetween fetal growth (small- [SGA], appropriate- [AGA], and large-for-estational-age [LGA]) and early, late, and postneonatal mortality.
STUDY DESIGN: Birth certificate data for nonanomalous singletons,delivered from 1996 to 2007, were obtained for Milwaukee residents.Multivariate logistic regression analyses, adjusted for 19 covariates,determined the association between fetal growth and mortality.
RESULTS: Among the 123,383 live births, SGA was 57% higher than
LGA (11% vs 7%). The infant mortality rate for SGA was 11.0, AGA, 5.3, p996–2007. Am J Obstet Gynecol 2011;204:xx-xx.
mSaniaahlmwahc
mined exempt by the Hdoi: 10.1016/j.ajog.2010.11.040
and LGA 2.7/1000 live births. SGA was a significant risk factor for early(adjusted odds ratio, 2.66) and late (2.06) but not postneonatal mortal-ity. The adjusted risk of mortality for LGA was not significantly differentfrom AGA. Over 12 years, 3 types of mortality for aberrant fetal growthdid not change significantly.
CONCLUSION: In the city of Milwaukee, aberrant fetal growth was vari-bly associated with early, late, and postneonatal mortality.
ey words: early mortality, large for gestational age, late mortality,
ostneonatal mortality, small for gestational ageCite this article as: Chen H-Y, Chauhan SP, Salm Ward TC, et al. Aberrant fetal growth and early, late, and postneonatal mortality: an analysis of Milwaukee births,
Aberrant fetal growth encompassessmall for gestational age (SGA) or
arge for gestational age (LGA). WhereasGA is defined as neonatal birthweight be-ow 10% for the gestational age, LGA iseight above 90%, with macrosomia
weight of at least 4000 g) being a subset of
From the Center for Urban PopulationHealth (Mr Chen, Ms Ward, Dr Mori, andDr Cisler); the College of Health Sciencesand School of Public Health, University ofWisconsin–Milwaukee (Drs Mori, andCisler); the City of Milwaukee HealthDepartment (Dr Gass), Milwaukee, theSchool of Medicine and Public Health (MrChen, Ms Ward, and Dr Cisler), Universityof Wisconsin–Madison, Madison, WI, andthe Eastern Virginia Medical Center,Norfolk, VA (Dr Chauhan).
Presented at the 77th Annual Meeting of theCentral Association of Obstetricians andGynecologists, Las Vegas, NV, Oct. 27-30,2010.
Received July 1, 2010; revised Nov. 15, 2010;accepted Nov. 29, 2010.
Reprints not available from the authors.
The Center for Urban Population Health is apartnership of the University of WisconsinSchool of Medicine and Public Health, theUniversity of Wisconsin-Milwaukee, and AuroraHealth Care, Inc.
0002-9378/$36.00© 2011 Mosby, Inc. All rights reserved.
accelerated growth.1,2 Fetal growth abnor-alities are linked with complications.
GA, for example, is associated with fetalnomalies, oligohydramnios, stillbirth,eonatal acidosis, seizure, and death. Later
n life, newborns with suboptimal growthre at increased risk of learning disabilitiesnd cardiovascular disease.1 On the otherand, LGA may lower or increase the like-
ihood of mortality. Among diabeticothers, accelerated growth is associatedith traumatic delivery and stillbirth3;
mong women with pregnancy-inducedypertension, preterm LGA has signifi-antly lower infant mortality.4
The myriad complications associatedwith aberrant growth and the conflict-ing reports on mortality with LGAprompted us to inquire if SGA or LGA isassociated with early (0-6 days after livebirth), late (7-27 days), or postneonatal(28-364 days) mortality.
The primary purpose of this populationbased study was to determine whetherSGA or LGA is associated with increasedrisk of early, late, and postneonatal mortal-ity, and identify other risk factors; the sec-ondary purpose was to determine whetherthere are temporal changes in the 3 sub-types of infant mortality.
MATERIALS AND METHODSThis project was reviewed and deter-
ealth Sciences In-
MONTH 2011 Ame
stitutional Review Board at the Univer-sity of Wisconsin–Madison. For theyears 1996-2007, we obtained vital statis-tics birth certificate data for the city ofMilwaukee, WI, from the City of Mil-waukee Health Department. The birthcertificate data were linked to death cer-tificate data, and mortality informationwas included. The study sample was re-stricted to singleton live births born tocity of Milwaukee resident mothers withgestational age of 24 weeks or more.
Newborns with congenital anomaly orimplausible birthweight– gestational agecombinations were excluded. Implausi-ble birthweight– gestational age datawere identified by the algorithm that wasdeveloped by Alexander et al.5 Thismethod was based on expert opinionconcerning some questionable birth-weight values that may be a result of in-accurate recording of gestational age. Inaddition, infant death cases with un-known time of death were also excluded.
The outcomes of interest were early,late, and postneonatal mortalities. Earlymortality was defined as newborns thatdied during 0-6 days of life; late mortal-ity, 7-27 days; and postneonatal mortal-ity, 28-364 days. Infant mortality rate(IMR) was the summation of early, late,and postneonatal mortality rate. Basedon Alexander et al,6 fetal growth was cat-
egorized as SGA, appropriate for gesta-rican Journal of Obstetrics & Gynecology 1.e1
itrml
lvWphi
gmadda
pbWta
7
a
CAOG Papers www.AJOG.org
tional age (AGA; birthweight lies within10-90% for that gestational age), andLGA.
Nineteen covariates obtained from vi-tal statistics birth certificate data were in-cluded in the analyses. Maternal age wascategorized into 3 groups: 19 years orless, 20-34 years, and 35 years or older.Self-reported race/ethnicity was catego-rized into white, African American, His-panic, and other. Maternal educationalattainment was categorized into com-pleted high school, beyond high school,and less than high school.
Paternity was coded as having a fa-ther’s name listed on the birth certificate(yes/no). The father’s name on therecord meant one of the following: theparents were married at the time of birth;there was a statement of paternity; therewas a paternity adjudication by court or-der (meaning paternity was establishedby the legal system, usually after genetictesting confirms the father’s identity); orlegitimation (meaning that the child isacknowledged by parents who marry af-ter their child’s birth). We used finalizedbirth certificate data that includedamendments made by the vital recordsoffice (such as statements of paternity,adjudications, or legitimations).
Prenatal care was categorized as ade-quate vs inadequate, using Kotelchuck’sAdequacy of Prenatal Care UtilizationIndex.7 Kotelchuck’s index is based onnitiation of prenatal care (month prena-al care begins) and the number of visitseceived, and is one of the most com-only used indices of prenatal care uti-
ization in research studies. 8-10
Maternal behaviors and obstetriccomplications included reported alcoholuse during pregnancy (yes/no), reportedcigarette use during pregnancy (yes/no),pregestational diabetes (yes/no), gesta-tional diabetes (yes/no), hydramnios oroligohydramnios (yes/no), gestationalor pregestational hypertension (yes/no),uterine bleeding (yes/no), and prema-ture rupture of membranes of more than12 hours (yes/no).
Gestational age at birth was defined asthe clinician’s estimate of gestation(number of completed weeks) as re-corded on the birth certificate. We then
categorized gestational age into preterm1.e2 American Journal of Obstetrics & Gynecology
(�37 weeks), term (37-40 weeks), andpostterm (�41 weeks). The route of de-ivery was categorized as spontaneousaginal, operative vaginal, and cesarean.
e also examined whether the labor wasrecipitous (within 3 hours vs �3ours), abruptio placenta (yes/no), and
nfant sex (male/female).Neonatal condition at birth was cate-
orized as normal vs abnormal. Abnor-al conditions included birth injury, hy-
line membrane disease or respiratoryistress, meconium aspiration syn-rome, assisted ventilation, and seizurest birth.
We calculated corrected early, late,ostneonatal, and infant mortality ratey fetal growth (SGA, AGA, and LGA).e assessed 3 year moving average mor-
ality trends by fetal growth (SGA, AGA,nd LGA) category. A �2 test or Fisher’s
exact test was used to assess the mortalitytrend across years. Multivariate logisticregression analyses were performed toexamine the association between fetalgrowth and outcomes of the 3 types ofmortality and adjusting for 19 potentialconfounding variables. The results arepresented as odds ratios (ORs) and their95% confidence intervals (CIs). Signifi-cance level was defined as P � .05.
For all variables, the data were com-plete at above 99% of the study subjects.On birth certificates, for maternal medi-cal history, a box must be checked if amother has a certain medical condition.We assumed that a mother did not havethe condition if the box was not checked.For the frequency tables, missing valueswere excluded and percentages werebased on the number of nonmissing val-ues. When performing the multivariatelogistic regression analyses, listwise dele-tion was used to remove subjects if therewas a missing value on any of the vari-ables. All statistical analyses were per-formed using SAS 9.2 (SAS/STAT soft-ware, version 9.2; SAS Institute, Cary,NC).
RESULTSDuring the 12 years of the study period,there were 132,658 live births in Milwau-kee, WI. We excluded 3879 multiple ges-
tation births, 3559 deliveries of patientsMONTH 2011
who resided outside Milwaukee, 1227anomalous neonates, 540 newbornsdelivered before 24 weeks, 36 infantswith implausible birthweights, 27 infantdeaths with unknown time of death, and7 others. After these exclusions, therewere 123,383 (93%) live births remain-ing as our study population. The mediannumber of deliveries per year was 10,257(range, 9956 –10,708). Whereas 11% ofthe newborns were SGA (n � 13,601),
% were LGA (n� 8957), and the re-maining 82% were AGA (n � 100,825).The 3 year moving average for the inci-dence of SGA (range, 10.7–11.6%; P �.586), AGA (range, 81.3– 81.9%; P �.987) and for LGA (range, 6.6 –7.6%; P �.140) was not significantly differentacross the 12 years. Table 1 presents thesample characteristics.
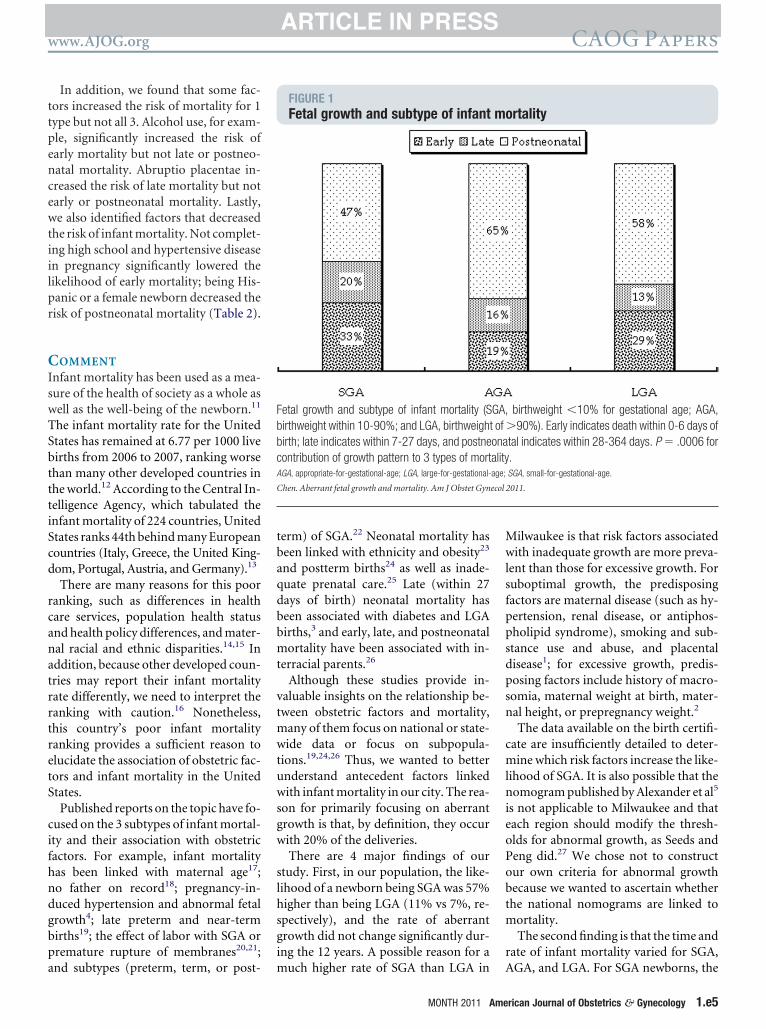
Among 123,383 newborns, there were707 deaths within the first year of birth(IMR of 5.7 per 1000 live births), with158 being within 0-6 days of birth (earlymortality rate of 1.3), 117 within 7-27days (late mortality rate of 0.9), and theremaining 432 within 28-364 days (post-neonatal mortality of 3.5). The contribu-tion of SGA, AGA, and LGA to early, late,and postneonatal mortality was signifi-cantly different (P � .0005; Figure 1).
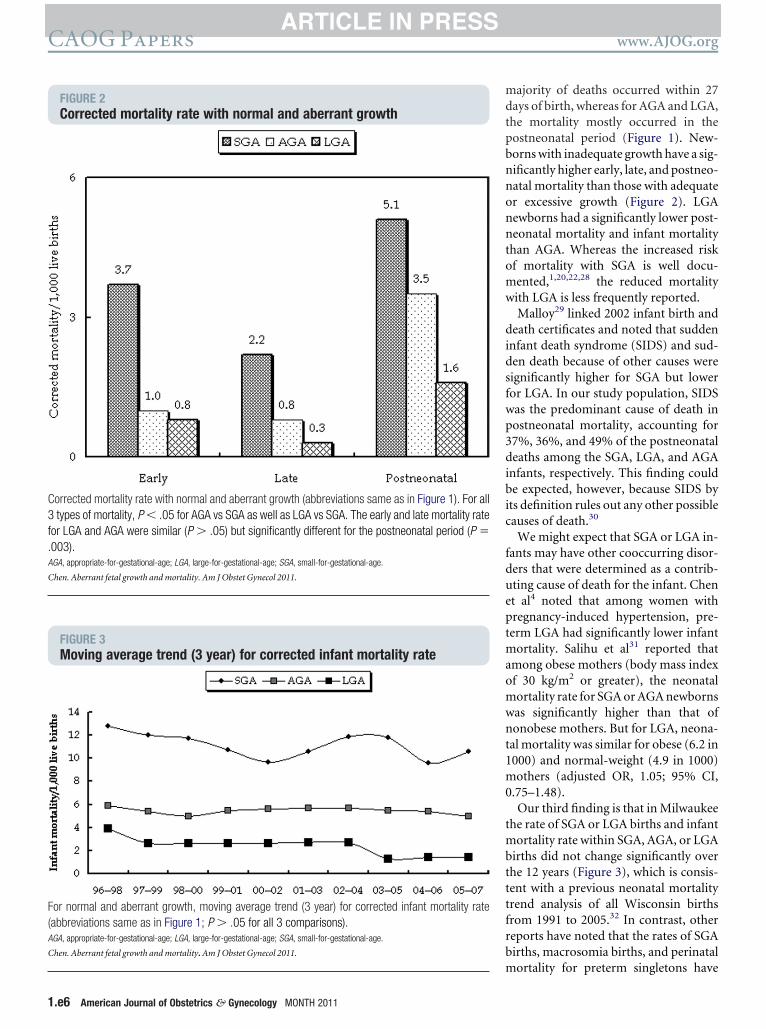
Figure 2 depicts the 3 subtypes of in-fant mortality for normal and aberrantgrowth. The infant mortality rate is thesummation of early, late, and postneo-natal mortality rate, which are 11.0, 5.3,and 2.7 for SGA, AGA, and LGA,respectively.
Compared with AGA, SGA newbornshad a significantly higher early (3.7 vs1.0; P � .001), late (2.2 vs 0.8; P � .001),nd postneonatal (5.1 vs 3.5; P � .002)
mortality. Compared with LGA, SGAalso had significantly higher early (3.7 vs0.8), late (2.2 vs 0.3), and postneonatal(5.1 vs 1.6) mortality (P � .001 for allcomparisons). The likelihood of earlyand late mortality for LGA vs AGA wassimilar (P � .524 and P � .118, respec-tively) but significantly different forpostneonatal period (P � .003). The cor-rected infant mortality for LGA andAGA (2.7 vs 5.3, respectively) was signif-icantly different (P � .001).
The infant mortality for SGA, AGA,
and LGA did not change significantly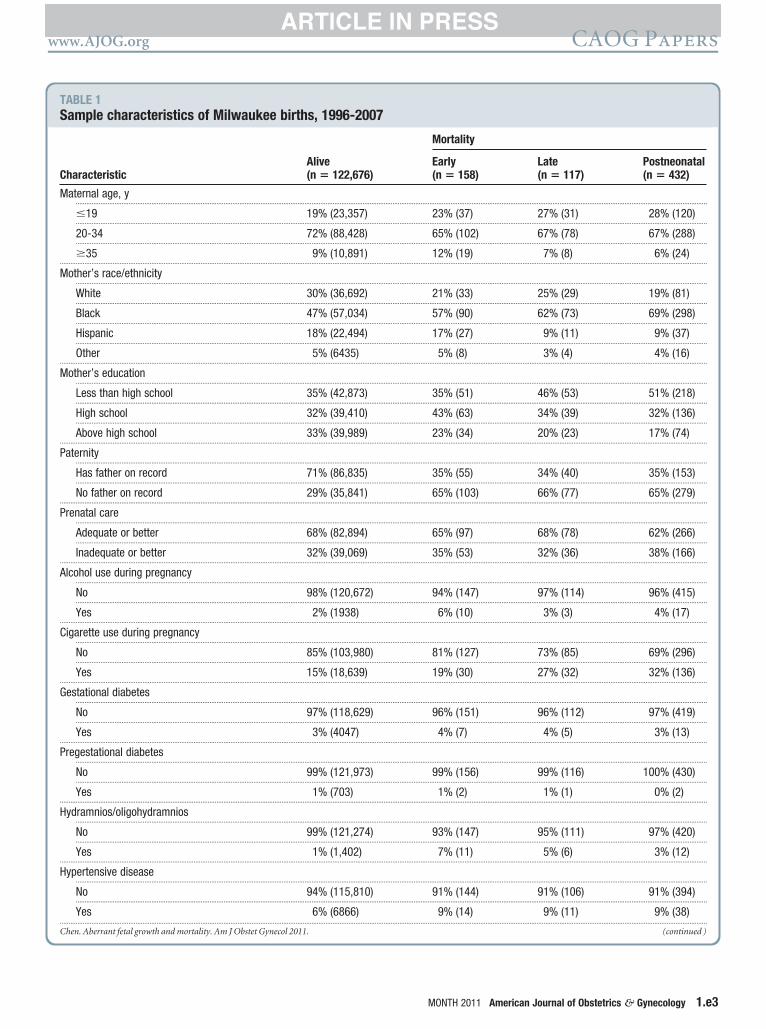
www.AJOG.org CAOG Papers
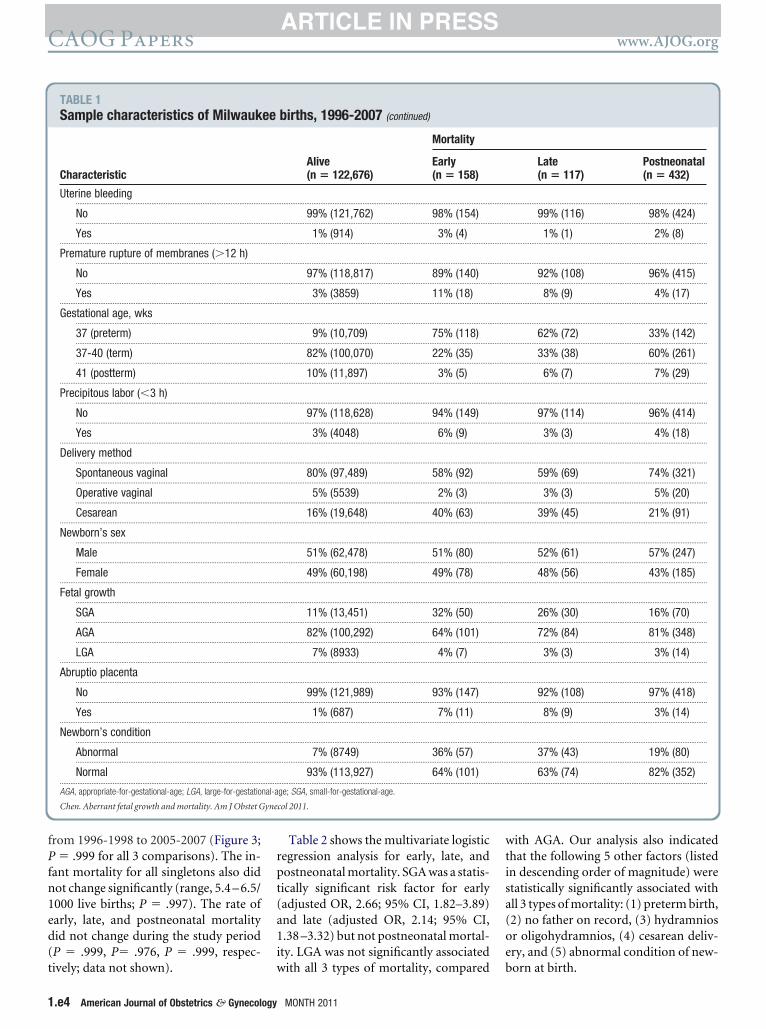
TABLE 1Sample characteristics of Milwaukee births, 1996-2007
Mortality
CharacteristicAlive(n � 122,676)
Early(n � 158)
Late(n � 117)
Postneonatal(n � 432)
Maternal age, y.......................................................................................................................................................................................................................................................................................................................................................................
�19 19% (23,357) 23% (37) 27% (31) 28% (120).......................................................................................................................................................................................................................................................................................................................................................................
20-34 72% (88,428) 65% (102) 67% (78) 67% (288).......................................................................................................................................................................................................................................................................................................................................................................
�35 9% (10,891) 12% (19) 7% (8) 6% (24)................................................................................................................................................................................................................................................................................................................................................................................
Mother’s race/ethnicity.......................................................................................................................................................................................................................................................................................................................................................................
White 30% (36,692) 21% (33) 25% (29) 19% (81).......................................................................................................................................................................................................................................................................................................................................................................
Black 47% (57,034) 57% (90) 62% (73) 69% (298).......................................................................................................................................................................................................................................................................................................................................................................
Hispanic 18% (22,494) 17% (27) 9% (11) 9% (37).......................................................................................................................................................................................................................................................................................................................................................................
Other 5% (6435) 5% (8) 3% (4) 4% (16)................................................................................................................................................................................................................................................................................................................................................................................
Mother’s education.......................................................................................................................................................................................................................................................................................................................................................................
Less than high school 35% (42,873) 35% (51) 46% (53) 51% (218).......................................................................................................................................................................................................................................................................................................................................................................
High school 32% (39,410) 43% (63) 34% (39) 32% (136).......................................................................................................................................................................................................................................................................................................................................................................
Above high school 33% (39,989) 23% (34) 20% (23) 17% (74)................................................................................................................................................................................................................................................................................................................................................................................
Paternity.......................................................................................................................................................................................................................................................................................................................................................................
Has father on record 71% (86,835) 35% (55) 34% (40) 35% (153).......................................................................................................................................................................................................................................................................................................................................................................
No father on record 29% (35,841) 65% (103) 66% (77) 65% (279)................................................................................................................................................................................................................................................................................................................................................................................
Prenatal care.......................................................................................................................................................................................................................................................................................................................................................................
Adequate or better 68% (82,894) 65% (97) 68% (78) 62% (266).......................................................................................................................................................................................................................................................................................................................................................................
Inadequate or better 32% (39,069) 35% (53) 32% (36) 38% (166)................................................................................................................................................................................................................................................................................................................................................................................
Alcohol use during pregnancy.......................................................................................................................................................................................................................................................................................................................................................................
No 98% (120,672) 94% (147) 97% (114) 96% (415).......................................................................................................................................................................................................................................................................................................................................................................
Yes 2% (1938) 6% (10) 3% (3) 4% (17)................................................................................................................................................................................................................................................................................................................................................................................
Cigarette use during pregnancy.......................................................................................................................................................................................................................................................................................................................................................................
No 85% (103,980) 81% (127) 73% (85) 69% (296).......................................................................................................................................................................................................................................................................................................................................................................
Yes 15% (18,639) 19% (30) 27% (32) 32% (136)................................................................................................................................................................................................................................................................................................................................................................................
Gestational diabetes.......................................................................................................................................................................................................................................................................................................................................................................
No 97% (118,629) 96% (151) 96% (112) 97% (419).......................................................................................................................................................................................................................................................................................................................................................................
Yes 3% (4047) 4% (7) 4% (5) 3% (13)................................................................................................................................................................................................................................................................................................................................................................................
Pregestational diabetes.......................................................................................................................................................................................................................................................................................................................................................................
No 99% (121,973) 99% (156) 99% (116) 100% (430).......................................................................................................................................................................................................................................................................................................................................................................
Yes 1% (703) 1% (2) 1% (1) 0% (2)................................................................................................................................................................................................................................................................................................................................................................................
Hydramnios/oligohydramnios.......................................................................................................................................................................................................................................................................................................................................................................
No 99% (121,274) 93% (147) 95% (111) 97% (420).......................................................................................................................................................................................................................................................................................................................................................................
Yes 1% (1,402) 7% (11) 5% (6) 3% (12)................................................................................................................................................................................................................................................................................................................................................................................
Hypertensive disease.......................................................................................................................................................................................................................................................................................................................................................................
No 94% (115,810) 91% (144) 91% (106) 91% (394).......................................................................................................................................................................................................................................................................................................................................................................
Yes 6% (6866) 9% (14) 9% (11) 9% (38)................................................................................................................................................................................................................................................................................................................................................................................
Chen. Aberrant fetal growth and mortality. Am J Obstet Gynecol 2011. (continued )
MONTH 2011 American Journal of Obstetrics & Gynecology 1.e3
Pfn1ed(t
rpt(a1i
wtisa(oe
yne
CAOG Papers www.AJOG.org
from 1996-1998 to 2005-2007 (Figure 3;� .999 for all 3 comparisons). The in-
ant mortality for all singletons also didot change significantly (range, 5.4 – 6.5/000 live births; P � .997). The rate ofarly, late, and postneonatal mortalityid not change during the study periodP � .999, P� .976, P � .999, respec-
TABLE 1Sample characteristics of Milwauk
Characteristic
Uterine bleeding..........................................................................................................
No..........................................................................................................
Yes...................................................................................................................
Premature rupture of membranes (�12 h)..........................................................................................................
No..........................................................................................................
Yes...................................................................................................................
Gestational age, wks..........................................................................................................
37 (preterm)..........................................................................................................
37-40 (term)..........................................................................................................
41 (postterm)...................................................................................................................
Precipitous labor (�3 h)..........................................................................................................
No..........................................................................................................
Yes...................................................................................................................
Delivery method..........................................................................................................
Spontaneous vaginal..........................................................................................................
Operative vaginal..........................................................................................................
Cesarean...................................................................................................................
Newborn’s sex..........................................................................................................
Male..........................................................................................................
Female...................................................................................................................
Fetal growth..........................................................................................................
SGA..........................................................................................................
AGA..........................................................................................................
LGA...................................................................................................................
Abruptio placenta..........................................................................................................
No..........................................................................................................
Yes...................................................................................................................
Newborn’s condition..........................................................................................................
Abnormal..........................................................................................................
Normal...................................................................................................................
AGA, appropriate-for-gestational-age; LGA, large-for-gestatio
Chen. Aberrant fetal growth and mortality. Am J Obstet G
ively; data not shown). w
1.e4 American Journal of Obstetrics & Gynecology
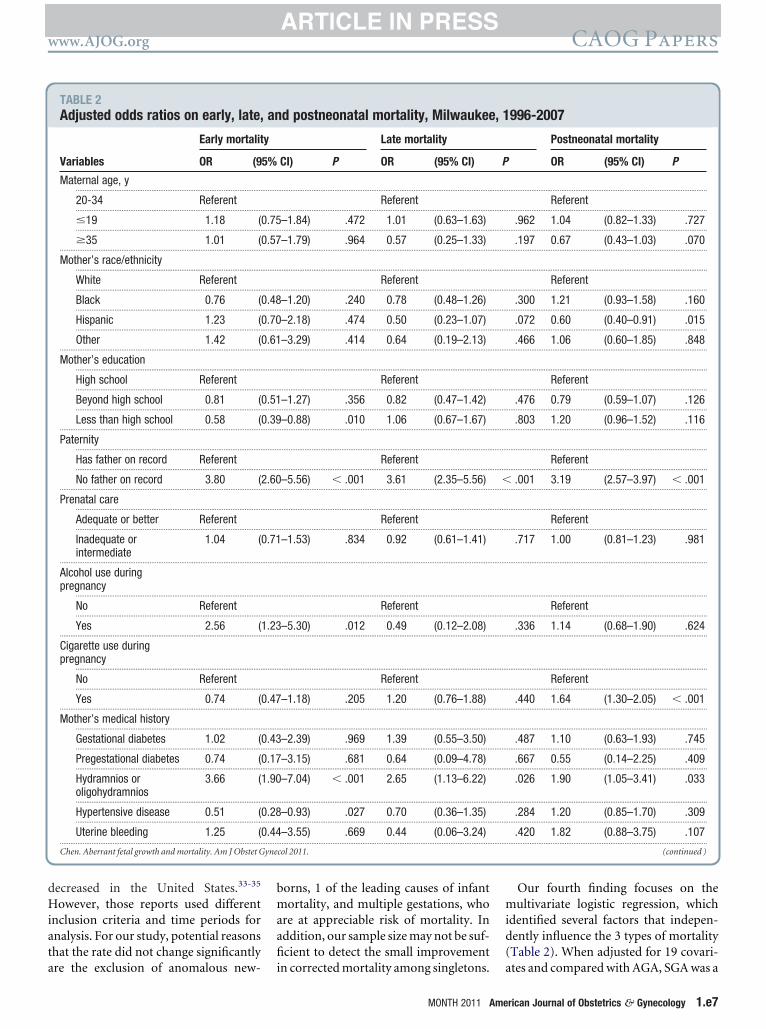
Table 2 shows the multivariate logisticegression analysis for early, late, andostneonatal mortality. SGA was a statis-ically significant risk factor for earlyadjusted OR, 2.66; 95% CI, 1.82–3.89)nd late (adjusted OR, 2.14; 95% CI,.38 –3.32) but not postneonatal mortal-ty. LGA was not significantly associated
births, 1996-2007 (continued)
Mortality
Alive(n � 122,676)
Early(n � 158)
.........................................................................................................................
99% (121,762) 98% (154).........................................................................................................................
1% (914) 3% (4).........................................................................................................................
.........................................................................................................................
97% (118,817) 89% (140).........................................................................................................................
3% (3859) 11% (18).........................................................................................................................
.........................................................................................................................
9% (10,709) 75% (118).........................................................................................................................
82% (100,070) 22% (35).........................................................................................................................
10% (11,897) 3% (5).........................................................................................................................
.........................................................................................................................
97% (118,628) 94% (149).........................................................................................................................
3% (4048) 6% (9).........................................................................................................................
.........................................................................................................................
80% (97,489) 58% (92).........................................................................................................................
5% (5539) 2% (3).........................................................................................................................
16% (19,648) 40% (63).........................................................................................................................
.........................................................................................................................
51% (62,478) 51% (80).........................................................................................................................
49% (60,198) 49% (78).........................................................................................................................
.........................................................................................................................
11% (13,451) 32% (50).........................................................................................................................
82% (100,292) 64% (101).........................................................................................................................
7% (8933) 4% (7).........................................................................................................................
.........................................................................................................................
99% (121,989) 93% (147).........................................................................................................................
1% (687) 7% (11).........................................................................................................................
.........................................................................................................................
7% (8749) 36% (57).........................................................................................................................
93% (113,927) 64% (101).........................................................................................................................
ge; SGA, small-for-gestational-age.
col 2011.
ith all 3 types of mortality, compared b
MONTH 2011
ith AGA. Our analysis also indicatedhat the following 5 other factors (listedn descending order of magnitude) weretatistically significantly associated withll 3 types of mortality: (1) preterm birth,2) no father on record, (3) hydramniosr oligohydramnios, (4) cesarean deliv-ry, and (5) abnormal condition of new-
Late(n � 117)
Postneonatal(n � 432)
..................................................................................................................
99% (116) 98% (424)..................................................................................................................
1% (1) 2% (8)..................................................................................................................
..................................................................................................................
92% (108) 96% (415)..................................................................................................................
8% (9) 4% (17)..................................................................................................................
..................................................................................................................
62% (72) 33% (142)..................................................................................................................
33% (38) 60% (261)..................................................................................................................
6% (7) 7% (29)..................................................................................................................
..................................................................................................................
97% (114) 96% (414)..................................................................................................................
3% (3) 4% (18)..................................................................................................................
..................................................................................................................
59% (69) 74% (321)..................................................................................................................
3% (3) 5% (20)..................................................................................................................
39% (45) 21% (91)..................................................................................................................
..................................................................................................................
52% (61) 57% (247)..................................................................................................................
48% (56) 43% (185)..................................................................................................................
..................................................................................................................
26% (30) 16% (70)..................................................................................................................
72% (84) 81% (348)..................................................................................................................
3% (3) 3% (14)..................................................................................................................
..................................................................................................................
92% (108) 97% (418)..................................................................................................................
8% (9) 3% (14)..................................................................................................................
..................................................................................................................
37% (43) 19% (80)..................................................................................................................
63% (74) 82% (352)..................................................................................................................
ee
......... .........
......... .........
......... .........
......... .........
......... .........
......... .........
......... .........
......... .........
......... .........
......... .........
......... .........
......... .........
......... .........
......... .........
......... .........
......... .........
......... .........
......... .........
......... .........
......... .........
......... .........
......... .........
......... .........
......... .........
......... .........
......... .........
......... .........
......... .........
......... .........
......... .........
nal-a
orn at birth.
atrr
bp
qdbb
psn
obtm
r
bbc
C
www.AJOG.org CAOG Papers
In addition, we found that some fac-tors increased the risk of mortality for 1type but not all 3. Alcohol use, for exam-ple, significantly increased the risk ofearly mortality but not late or postneo-natal mortality. Abruptio placentae in-creased the risk of late mortality but notearly or postneonatal mortality. Lastly,we also identified factors that decreasedthe risk of infant mortality. Not complet-ing high school and hypertensive diseasein pregnancy significantly lowered thelikelihood of early mortality; being His-panic or a female newborn decreased therisk of postneonatal mortality (Table 2).
COMMENTInfant mortality has been used as a mea-sure of the health of society as a whole aswell as the well-being of the newborn.11
The infant mortality rate for the UnitedStates has remained at 6.77 per 1000 livebirths from 2006 to 2007, ranking worsethan many other developed countries inthe world.12 According to the Central In-telligence Agency, which tabulated theinfant mortality of 224 countries, UnitedStates ranks 44th behind many Europeancountries (Italy, Greece, the United King-dom, Portugal, Austria, and Germany).13
There are many reasons for this poorranking, such as differences in healthcare services, population health statusand health policy differences, and mater-nal racial and ethnic disparities.14,15 Inddition, because other developed coun-ries may report their infant mortalityate differently, we need to interpret theanking with caution.16 Nonetheless,
this country’s poor infant mortalityranking provides a sufficient reason toelucidate the association of obstetric fac-tors and infant mortality in the UnitedStates.
Published reports on the topic have fo-cused on the 3 subtypes of infant mortal-ity and their association with obstetricfactors. For example, infant mortalityhas been linked with maternal age17;no father on record18; pregnancy-in-duced hypertension and abnormal fetalgrowth4; late preterm and near-term
irths19; the effect of labor with SGA orremature rupture of membranes20,21;
and subtypes (preterm, term, or post-
term) of SGA.22 Neonatal mortality hasbeen linked with ethnicity and obesity23
and postterm births24 as well as inade-uate prenatal care.25 Late (within 27ays of birth) neonatal mortality haseen associated with diabetes and LGAirths,3 and early, late, and postneonatal
mortality have been associated with in-terracial parents.26
Although these studies provide in-valuable insights on the relationship be-tween obstetric factors and mortality,many of them focus on national or state-wide data or focus on subpopula-tions.19,24,26 Thus, we wanted to betterunderstand antecedent factors linkedwith infant mortality in our city. The rea-son for primarily focusing on aberrantgrowth is that, by definition, they occurwith 20% of the deliveries.
There are 4 major findings of ourstudy. First, in our population, the like-lihood of a newborn being SGA was 57%higher than being LGA (11% vs 7%, re-spectively), and the rate of aberrantgrowth did not change significantly dur-ing the 12 years. A possible reason for a
FIGURE 1Fetal growth and subtype of infant
Fetal growth and subtype of infant mortality (Sirthweight within 10-90%; and LGA, birthweighirth; late indicates within 7-27 days, and postneontribution of growth pattern to 3 types of mort
AGA, appropriate-for-gestational-age; LGA, large-for-gestational-
hen. Aberrant fetal growth and mortality. Am J Obstet Gyn
much higher rate of SGA than LGA in A
MONTH 2011 Ame
Milwaukee is that risk factors associatedwith inadequate growth are more preva-lent than those for excessive growth. Forsuboptimal growth, the predisposingfactors are maternal disease (such as hy-pertension, renal disease, or antiphos-pholipid syndrome), smoking and sub-stance use and abuse, and placentaldisease1; for excessive growth, predis-
osing factors include history of macro-omia, maternal weight at birth, mater-al height, or prepregnancy weight.2
The data available on the birth certifi-cate are insufficiently detailed to deter-mine which risk factors increase the like-lihood of SGA. It is also possible that thenomogram published by Alexander et al5
is not applicable to Milwaukee and thateach region should modify the thresh-olds for abnormal growth, as Seeds andPeng did.27 We chose not to construct
ur own criteria for abnormal growthecause we wanted to ascertain whetherhe national nomograms are linked to
ortality.The second finding is that the time and
ate of infant mortality varied for SGA,
ortality
birthweight �10% for gestational age; AGA,�90%). Early indicates death within 0-6 days oftal indicates within 28-364 days. P � .0006 for.SGA, small-for-gestational-age.
2011.
m
GA,t ofonaalityage;
ecol
GA, and LGA. For SGA newborns, the
rican Journal of Obstetrics & Gynecology 1.e5
w
didsfwp3dibic
.
C
C
CAOG Papers www.AJOG.org
1.e6 American Journal of Obstetrics & Gynecology MONTH 2011
majority of deaths occurred within 27days of birth, whereas for AGA and LGA,the mortality mostly occurred in thepostneonatal period (Figure 1). New-borns with inadequate growth have a sig-nificantly higher early, late, and postneo-natal mortality than those with adequateor excessive growth (Figure 2). LGAnewborns had a significantly lower post-neonatal mortality and infant mortalitythan AGA. Whereas the increased riskof mortality with SGA is well docu-mented,1,20,22,28 the reduced mortality
ith LGA is less frequently reported.Malloy29 linked 2002 infant birth and
eath certificates and noted that suddennfant death syndrome (SIDS) and sud-en death because of other causes wereignificantly higher for SGA but loweror LGA. In our study population, SIDSas the predominant cause of death inostneonatal mortality, accounting for7%, 36%, and 49% of the postneonataleaths among the SGA, LGA, and AGA
nfants, respectively. This finding coulde expected, however, because SIDS by
ts definition rules out any other possibleauses of death.30
We might expect that SGA or LGA in-fants may have other cooccurring disor-ders that were determined as a contrib-uting cause of death for the infant. Chenet al4 noted that among women withpregnancy-induced hypertension, pre-term LGA had significantly lower infantmortality. Salihu et al31 reported thatamong obese mothers (body mass indexof 30 kg/m2 or greater), the neonatalmortality rate for SGA or AGA newbornswas significantly higher than that ofnonobese mothers. But for LGA, neona-tal mortality was similar for obese (6.2 in1000) and normal-weight (4.9 in 1000)mothers (adjusted OR, 1.05; 95% CI,0.75–1.48).
Our third finding is that in Milwaukeethe rate of SGA or LGA births and infantmortality rate within SGA, AGA, or LGAbirths did not change significantly overthe 12 years (Figure 3), which is consis-tent with a previous neonatal mortalitytrend analysis of all Wisconsin birthsfrom 1991 to 2005.32 In contrast, otherreports have noted that the rates of SGAbirths, macrosomia births, and perinatal
FIGURE 2Corrected mortality rate with normal and aberrant growth
Corrected mortality rate with normal and aberrant growth (abbreviations same as in Figure 1). For all3 types of mortality, P � .05 for AGA vs SGA as well as LGA vs SGA. The early and late mortality ratefor LGA and AGA were similar (P � .05) but significantly different for the postneonatal period (P �003).
AGA, appropriate-for-gestational-age; LGA, large-for-gestational-age; SGA, small-for-gestational-age.
hen. Aberrant fetal growth and mortality. Am J Obstet Gynecol 2011.
FIGURE 3Moving average trend (3 year) for corrected infant mortality rate
For normal and aberrant growth, moving average trend (3 year) for corrected infant mortality rate(abbreviations same as in Figure 1; P � .05 for all 3 comparisons).AGA, appropriate-for-gestational-age; LGA, large-for-gestational-age; SGA, small-for-gestational-age.
hen. Aberrant fetal growth and mortality. Am J Obstet Gynecol 2011.
mortality for preterm singletons have
yne
www.AJOG.org CAOG Papers
decreased in the United States.33-35
However, those reports used differentinclusion criteria and time periods foranalysis. For our study, potential reasonsthat the rate did not change significantly
TABLE 2Adjusted odds ratios on early, late,
Early mortalit
Variables OR (9
Maternal age, y..........................................................................................................
20-34 Referent..........................................................................................................
�19 1.18 (..........................................................................................................
�35 1.01 (...................................................................................................................
Mother’s race/ethnicity..........................................................................................................
White Referent..........................................................................................................
Black 0.76 (..........................................................................................................
Hispanic 1.23 (..........................................................................................................
Other 1.42 (...................................................................................................................
Mother’s education..........................................................................................................
High school Referent..........................................................................................................
Beyond high school 0.81 (..........................................................................................................
Less than high school 0.58 (...................................................................................................................
Paternity..........................................................................................................
Has father on record Referent..........................................................................................................
No father on record 3.80 (...................................................................................................................
Prenatal care..........................................................................................................
Adequate or better Referent..........................................................................................................
Inadequate orintermediate
1.04 (
...................................................................................................................
Alcohol use duringpregnancy
..........................................................................................................
No Referent..........................................................................................................
Yes 2.56 (...................................................................................................................
Cigarette use duringpregnancy
..........................................................................................................
No Referent..........................................................................................................
Yes 0.74 (...................................................................................................................
Mother’s medical history..........................................................................................................
Gestational diabetes 1.02 (..........................................................................................................
Pregestational diabetes 0.74 (..........................................................................................................
Hydramnios oroligohydramnios
3.66 (
..........................................................................................................
Hypertensive disease 0.51 (..........................................................................................................
Uterine bleeding 1.25 (...................................................................................................................
Chen. Aberrant fetal growth and mortality. Am J Obstet G
are the exclusion of anomalous new-
borns, 1 of the leading causes of infantmortality, and multiple gestations, whoare at appreciable risk of mortality. Inaddition, our sample size may not be suf-ficient to detect the small improvement
d postneonatal mortality, Milwaukee
Late mortality
CI) P OR (95% CI)
.........................................................................................................................
Referent.........................................................................................................................
–1.84) .472 1.01 (0.63–1.63).........................................................................................................................
–1.79) .964 0.57 (0.25–1.33).........................................................................................................................
.........................................................................................................................
Referent.........................................................................................................................
–1.20) .240 0.78 (0.48–1.26).........................................................................................................................
–2.18) .474 0.50 (0.23–1.07).........................................................................................................................
–3.29) .414 0.64 (0.19–2.13).........................................................................................................................
.........................................................................................................................
Referent.........................................................................................................................
–1.27) .356 0.82 (0.47–1.42).........................................................................................................................
–0.88) .010 1.06 (0.67–1.67).........................................................................................................................
.........................................................................................................................
Referent.........................................................................................................................
–5.56) � .001 3.61 (2.35–5.56).........................................................................................................................
.........................................................................................................................
Referent.........................................................................................................................
–1.53) .834 0.92 (0.61–1.41)
.........................................................................................................................
.........................................................................................................................
Referent.........................................................................................................................
–5.30) .012 0.49 (0.12–2.08).........................................................................................................................
.........................................................................................................................
Referent.........................................................................................................................
–1.18) .205 1.20 (0.76–1.88).........................................................................................................................
.........................................................................................................................
–2.39) .969 1.39 (0.55–3.50).........................................................................................................................
–3.15) .681 0.64 (0.09–4.78).........................................................................................................................
–7.04) � .001 2.65 (1.13–6.22)
.........................................................................................................................
–0.93) .027 0.70 (0.36–1.35).........................................................................................................................
–3.55) .669 0.44 (0.06–3.24).........................................................................................................................
col 2011.
in corrected mortality among singletons.
MONTH 2011 Ame
Our fourth finding focuses on themultivariate logistic regression, whichidentified several factors that indepen-dently influence the 3 types of mortality(Table 2). When adjusted for 19 covari-
996-2007
Postneonatal mortality
OR (95% CI) P
..................................................................................................................
Referent..................................................................................................................
.962 1.04 (0.82–1.33) .727..................................................................................................................
.197 0.67 (0.43–1.03) .070..................................................................................................................
..................................................................................................................
Referent..................................................................................................................
.300 1.21 (0.93–1.58) .160..................................................................................................................
.072 0.60 (0.40–0.91) .015..................................................................................................................
.466 1.06 (0.60–1.85) .848..................................................................................................................
..................................................................................................................
Referent..................................................................................................................
.476 0.79 (0.59–1.07) .126..................................................................................................................
.803 1.20 (0.96–1.52) .116..................................................................................................................
..................................................................................................................
Referent..................................................................................................................
.001 3.19 (2.57–3.97) � .001..................................................................................................................
..................................................................................................................
Referent..................................................................................................................
.717 1.00 (0.81–1.23) .981
..................................................................................................................
..................................................................................................................
Referent..................................................................................................................
.336 1.14 (0.68–1.90) .624..................................................................................................................
..................................................................................................................
Referent..................................................................................................................
.440 1.64 (1.30–2.05) � .001..................................................................................................................
..................................................................................................................
.487 1.10 (0.63–1.93) .745..................................................................................................................
.667 0.55 (0.14–2.25) .409..................................................................................................................
.026 1.90 (1.05–3.41) .033
..................................................................................................................
.284 1.20 (0.85–1.70) .309..................................................................................................................
.420 1.82 (0.88–3.75) .107..................................................................................................................
(continued )
an , 1
y
5% P
......... .........
......... .........
0.75......... .........
0.57......... .........
......... .........
......... .........
0.48......... .........
0.70......... .........
0.61......... .........
......... .........
......... .........
0.51......... .........
0.39......... .........
......... .........
......... .........
2.60 �......... .........
......... .........
......... .........
0.71
......... .........
......... .........
......... .........
1.23......... .........
......... .........
......... .........
0.47......... .........
......... .........
0.43......... .........
0.17......... .........
1.90
......... .........
0.28......... .........
0.44......... .........
ates and compared with AGA, SGA was a
rican Journal of Obstetrics & Gynecology 1.e7
4idtt
citibbsrww
icnCtmi
yne
CAOG Papers www.AJOG.org
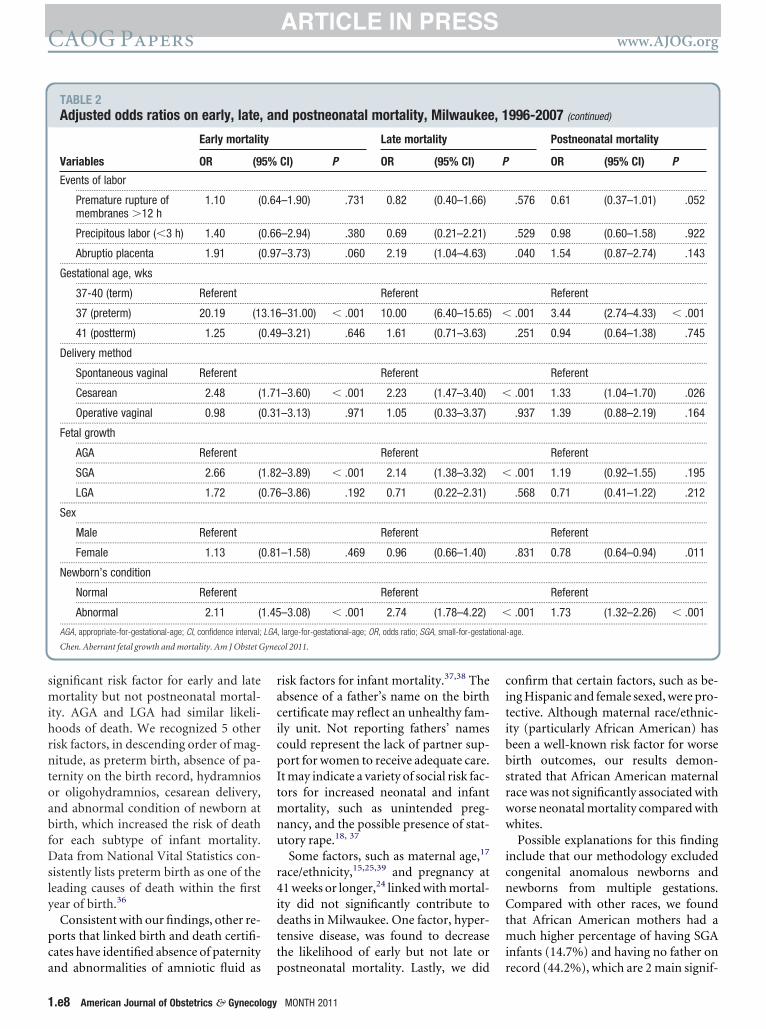
significant risk factor for early and latemortality but not postneonatal mortal-ity. AGA and LGA had similar likeli-hoods of death. We recognized 5 otherrisk factors, in descending order of mag-nitude, as preterm birth, absence of pa-ternity on the birth record, hydramniosor oligohydramnios, cesarean delivery,and abnormal condition of newborn atbirth, which increased the risk of deathfor each subtype of infant mortality.Data from National Vital Statistics con-sistently lists preterm birth as one of theleading causes of death within the firstyear of birth.36
Consistent with our findings, other re-ports that linked birth and death certifi-cates have identified absence of paternity
TABLE 2Adjusted odds ratios on early, late,
Early mortalit
Variables OR (9
Events of labor..........................................................................................................
Premature rupture ofmembranes �12 h
1.10 (
..........................................................................................................
Precipitous labor (�3 h) 1.40 (..........................................................................................................
Abruptio placenta 1.91 (...................................................................................................................
Gestational age, wks..........................................................................................................
37-40 (term) Referent..........................................................................................................
37 (preterm) 20.19 (1..........................................................................................................
41 (postterm) 1.25 (...................................................................................................................
Delivery method..........................................................................................................
Spontaneous vaginal Referent..........................................................................................................
Cesarean 2.48 (..........................................................................................................
Operative vaginal 0.98 (...................................................................................................................
Fetal growth..........................................................................................................
AGA Referent..........................................................................................................
SGA 2.66 (..........................................................................................................
LGA 1.72 (...................................................................................................................
Sex..........................................................................................................
Male Referent..........................................................................................................
Female 1.13 (...................................................................................................................
Newborn’s condition..........................................................................................................
Normal Referent..........................................................................................................
Abnormal 2.11 (...................................................................................................................
AGA, appropriate-for-gestational-age; CI, confidence interval;
Chen. Aberrant fetal growth and mortality. Am J Obstet G
and abnormalities of amniotic fluid as p
1.e8 American Journal of Obstetrics & Gynecology
risk factors for infant mortality.37,38 Theabsence of a father’s name on the birthcertificate may reflect an unhealthy fam-ily unit. Not reporting fathers’ namescould represent the lack of partner sup-port for women to receive adequate care.It may indicate a variety of social risk fac-tors for increased neonatal and infantmortality, such as unintended preg-nancy, and the possible presence of stat-utory rape.18, 37
Some factors, such as maternal age,17
race/ethnicity,15,25,39 and pregnancy at1 weeks or longer,24 linked with mortal-ty did not significantly contribute toeaths in Milwaukee. One factor, hyper-ensive disease, was found to decreasehe likelihood of early but not late or
d postneonatal mortality, Milwaukee
Late mortality
CI) P OR (95% CI)
.........................................................................................................................
–1.90) .731 0.82 (0.40–1.66)
.........................................................................................................................
–2.94) .380 0.69 (0.21–2.21).........................................................................................................................
–3.73) .060 2.19 (1.04–4.63).........................................................................................................................
.........................................................................................................................
Referent.........................................................................................................................
–31.00) � .001 10.00 (6.40–15.65).........................................................................................................................
–3.21) .646 1.61 (0.71–3.63).........................................................................................................................
.........................................................................................................................
Referent.........................................................................................................................
–3.60) � .001 2.23 (1.47–3.40).........................................................................................................................
–3.13) .971 1.05 (0.33–3.37).........................................................................................................................
.........................................................................................................................
Referent.........................................................................................................................
–3.89) � .001 2.14 (1.38–3.32).........................................................................................................................
–3.86) .192 0.71 (0.22–2.31).........................................................................................................................
.........................................................................................................................
Referent.........................................................................................................................
–1.58) .469 0.96 (0.66–1.40).........................................................................................................................
.........................................................................................................................
Referent.........................................................................................................................
–3.08) � .001 2.74 (1.78–4.22).........................................................................................................................
, large-for-gestational-age; OR, odds ratio; SGA, small-for-gestat
col 2011.
ostneonatal mortality. Lastly, we did r
MONTH 2011
onfirm that certain factors, such as be-ng Hispanic and female sexed, were pro-ective. Although maternal race/ethnic-ty (particularly African American) haseen a well-known risk factor for worseirth outcomes, our results demon-trated that African American maternalace was not significantly associated withorse neonatal mortality compared withhites.Possible explanations for this finding
nclude that our methodology excludedongenital anomalous newborns andewborns from multiple gestations.ompared with other races, we found
hat African American mothers had auch higher percentage of having SGA
nfants (14.7%) and having no father on
996-2007 (continued)
Postneonatal mortality
OR (95% CI) P
..................................................................................................................
.576 0.61 (0.37–1.01) .052
..................................................................................................................
.529 0.98 (0.60–1.58) .922..................................................................................................................
.040 1.54 (0.87–2.74) .143..................................................................................................................
..................................................................................................................
Referent..................................................................................................................
.001 3.44 (2.74–4.33) � .001..................................................................................................................
.251 0.94 (0.64–1.38) .745..................................................................................................................
..................................................................................................................
Referent..................................................................................................................
.001 1.33 (1.04–1.70) .026..................................................................................................................
.937 1.39 (0.88–2.19) .164..................................................................................................................
..................................................................................................................
Referent..................................................................................................................
.001 1.19 (0.92–1.55) .195..................................................................................................................
.568 0.71 (0.41–1.22) .212..................................................................................................................
..................................................................................................................
Referent..................................................................................................................
.831 0.78 (0.64–0.94) .011..................................................................................................................
..................................................................................................................
Referent..................................................................................................................
.001 1.73 (1.32–2.26) � .001..................................................................................................................
-age.
an , 1
y
5% P
......... .........
0.64
......... .........
0.66......... .........
0.97......... .........
......... .........
......... .........
3.16 �......... .........
0.49......... .........
......... .........
......... .........
1.71 �......... .........
0.31......... .........
......... .........
......... .........
1.82 �......... .........
0.76......... .........
......... .........
......... .........
0.81......... .........
......... .........
......... .........
1.45 �......... .........
LGA ional
ecord (44.2%), which are 2 main signif-
s
cua
woFmc
Mhtlc
www.AJOG.org CAOG Papers
icant variables associated with worseneonatal mortality. Also, there may besome other unmeasured confoundersthat we could not adjust for. All of theaforementioned factors may have con-tributed to the variation between ourfindings and published reports.
In addition, consistent with Salihu etal,40 our study found that cigarette useduring pregnancy was significantly asso-ciated with postneonatal mortality,rather than neonatal mortality. Al-though smoking has been identified as arisk factor for suboptimal fetal growth,which is a contributing factor to SGA de-liveries, our study was not able to ac-count for the contribution of passivesmoking. Also, in our study, prenatalcare was not found to be a protective fac-tor. However, the research literature hasdocumented the difficulty of quantifyingand measuring the effectiveness of pre-natal care,8,41 with recent studies arguingfor and against the effectiveness of pre-natal care in its current form.42,43
Several limitations of the study need tobe acknowledged. First, although birthcertificate data have advantages in epide-miologic research, they have knownshortcomings, including but not limitedto, missing data, accuracy, and validity ofdata.44-46 In this study, we assumed thata mother did not have a medical condi-tion if the box was not checked on thebirth certificate; thus, we may have un-derestimated the prevalence of the ma-ternal medical conditions because of un-observed missing data. Although theaccuracy of vital statistics data has beenexamined in other states,47-50 usingcombination of the terms “birth certifi-cate, neonatal, infant, mortality, andMilwaukee, Wisconsin,” we did not findany publications in the English languagethat assessed the validity of birth certifi-cates in Milwaukee or Wisconsin. Weadditionally contacted the source of ourdata and they are not aware of any studythat has determined the accuracy of thebirth certificate data.
Second, the criteria used to determinegestational age may have varied over the12 year period. It is possible that therewere random or nonrandom misclassifi-cations.46 But considering we confirmed
everal risk factors that are known to in-rease mortality suggests the data areseful in exploring trends and in gener-ting hypothesis.
Third, our analysis of the city of Mil-aukee may not be representative ofther cities, states, or the United States.or example, Milwaukee is one of theost segregated large metropolitan US
ities.51 Milwaukee has a higher propor-tion of African American births (47%)compared with the United States(16%).52 Compared with other large
idwestern cities, Milwaukee has aigher black infant mortality rate (16.0)han Indianapolis, IN (15.4), and Co-umbus, OH (14.9), but lower than Chi-ago, IL (17.0), and Detroit, MI (18.1).53
Also, the median household income inMilwaukee ($37,022) is lower than thatof the United States ($52,175).54 Thus,because of these shortcomings, observa-tional and/or interventional studies arenecessary before any recommendationsto alter obstetric or neonatal practice aremade.
In summary, our findings suggest thataberrant growth may influence early,late, and postneonatal mortality differ-ently. When the analysis adjusts for con-founding variables, SGA but not LGA islinked with increased mortality. Addi-tional studies are needed from Milwau-kee and possibly other urban settings toconfirm these findings and to determinewhether compliance with evidence-based medicine can decrease the risk ofmortality. f
REFERENCES1. American College of Obstetricians and Gyne-cologists. Intrauterine growth restriction. Wash-ington, DC: American College of Obstetriciansand Gynecologists; 2000.2. American College of Obstetricians and Gyne-cologists. Fetal macrosomia. Washington, DC:American College of Obstetricians and Gyne-cologists; 2000.3. Seeds JW, Peng CCT. Does augmentedgrowth impose an increased risk of fetal death?Am J Obstet Gynecol 2000;183:316-23.4. Chen XK, Wen SW, Smith G, Yang Q, WalkerM. Pregnancy-induced hypertension and infantmortality: roles of birthweight centiles and ges-tational age. BJOG 2007;114:24-31.5. Alexander G, Himes J, Kaufman R, Mor J,Kogan M. A United States national reference forfetal growth. Obstet Gynecol 1996;87:163-8.6. Alexander GR, Kogan MD, Himes JH. 1994-
1996 US singleton birth weight percentiles forMONTH 2011 Ame
gestational age by race, Hispanic origin, andgender. Matern Child Health J 1999;3:225-31.7. Kotelchuck M. An evaluation of the Kessneradequacy of prenatal care index and a pro-posed adequacy of prenatal care utilization in-dex. Am J Public Health 1994;84:1414-20.8. Vander-Weele, TJ, Lantos JD, Siddique J,Lauderdale DS. A comparison of four prenatalcare indices in birth outcome models: com-parable results for predicting small-for-gesta-tional-age outcome but different results for pre-term birth or infant mortality. J Clin Epidemiol2009;62:438-45.9. Alexander GR, Kotelchuck M. Quantifyingthe adequacy of prenatal care: a comparison ofindices. Public Health Rep 1996;111:408-18.10. Penrod JR, Lantz PM. Measurement errorin prenatal care utilization: evidence of attenua-tion bias in the estimation of impact on birthweight. Matern Child Health J 2000;4:39-52.11. Reidpath DD, Allotey P. Infant mortality rateas an indicator of population health. J EpidemiolCommunity Health 2003;57:344-6.12. Heron M, Sutton PD, Xu J, Ventura SJ,Strobino DM, Guyer B. Annual summary of vitalstatistics: 2007. Pediatrics 2010;125:4-15.13. Central Intelligence Agency. The Worldfactbook. Country comparison: infant mortalityrate. Available at: https://www.cia.gov/library/publications/the-world-factbook/. AccessedJune 15, 2010.14. Ananth CV, Liu S, Joseph KS, Kramer MS.Fetal and Infant Health Study Group of the Ca-nadian Perinatal Surveillance System. A com-parison of foetal and infant mortality in theUnited States and Canada. Int J Epidemiol2009;38:480-9.15. Hessol, NA, Fuentes-Afflick E. Ethnic differ-ences in neonatal and postneonatal mortality.Pediatrics 2005;115:e44-51.16. MacDorman MF, Mathews TJ. Behind in-ternational rankings of infant mortality: how theUnited States compares with Europe. NCHSData Brief. 2009. Available at: www.cdc.gov/nchs/data/databriefs/db23.htm. AccessedJune 15, 2010.17. Misra DP, Ananth CV. Infant mortalityamong singletons and twins in the UnitedStates during 2 decades: effects of maternalage. Pediatrics 2002;110:1163-8.18. Gaudino JA Jr, Jenkins B, Rocha RW. Nofathers’ names: a risk factor for infant mortalityin the State of Georgia, USA. Social Sci Med1999:48 253-65.19. Donovan EF, Besl J, Paulson J, et al. Infantdeath among Ohio resident infants born at 32 to41 weeks of gestation. Am J Obstet Gynecol2010;203:58.e1-5.20. Kinzler WL, Ananth CV, Smulian JC, Vintzi-leos AM. The effects of labor on infant mortalityamong small-for-gestational-age infants in theUSA. J Matern Fetal Neonatal Med 2002;12:201-6.21. Meirowitz NB, Ananth CV, Smulian JC,Vintzileos AM. Effect of labor on infant morbidity
and mortality with preterm premature rupture ofrican Journal of Obstetrics & Gynecology 1.e9
CAOG Papers www.AJOG.org
membranes: United States population-basedstudy. Obstet Gynecol 2001;97:494-8.22. Kristensen S, Salihu HM, Keith LG, KirbyRS, Fowler KB, Pass MA. SGA subtypes andmortality risk among singleton births. Early HumDev 2007;83:99-105.23. Salihu HM, Alio AP, Wilson RE, Sharma PP,Kirby RS, Alexander GR. Obesity and extremeobesity: new insights into the black-white dis-parity in neonatal mortality. Obstet Gynecol2008;111:1410-6.24. Bruckner TA, Cheng YW, Caughey AB. In-creased neonatal mortality among normal-weight births beyond 41 weeks of gestation inCalifornia. Am J Obstet Gynecol 2008;199:421.e1-7.25. Kitsantas P, Gaffney KF. Racial/ethnic dis-parities in infant mortality. J Perinat Med 2010;38:87-94.26. Getahun D, Ananth CV, Selvam N, Demis-sie K. Adverse perinatal outcomes among inter-racial couples in the United States. Obstet Gy-necol 2005;106:81-8.27. Seeds J, Peng T. Impaired growth and riskof fetal death: is the tenth percentile the appro-priate standard? Am J Obstet Gynecol 1998;178:658-67.28. Boulet SL, Alexander GR, Salihu HM, KirbyRS, Carlo WA. Fetal growth risk curves: defininglevels of fetal growth restriction by neonataldeath risk. Am J Obstet Gynecol 2006;195:1571-7.29. Malloy MF. Size for gestational age at birth:impact on risk for sudden infant death and othercauses of death, USA, 2002. Arch Dis ChildFetal Neonatal Ed 2007;92:F473-8.30. Willinger M, James LS, Catz C. Defining thesudden infant death syndrome (SIDS): deliber-ations of an expert panel convened by the Na-tional Institute of Child Health and Human De-velopment. Pediatr Pathol 1991;11:677-84.31. Salihu HM, Mbah AK, Alio AP, Kornosky JL,Bruder K, Belogolovkin V. Success of program-ming fetal growth phenotypes among obesewomen. Obstet Gynecol 2009;114:333-9.32. Tuan WJ, Hatfield P, Bhattacharya A, SartoGE, Kling PJ. Possible factors illuminating in-creased disparities in neonatal mortality in Wis-consin from 1991-2005. WMJ 2007;106:130-6.33. Ananth CV, Balasubramanian B, Demissie
K, Kinzler WL. Small-for-gestational-age births1.e10 American Journal of Obstetrics & Gynecolog
in the United States: an age-period-cohortanalysis. Epidemiology 2004;15:28-35.34. Chauhan SP, Grobman WA, Gherman RA,et al. Suspicion and treatment of the macro-somic fetus: a review. Am J Obstet Gynecol2005;193:332-46.35. Ananth CV, Joseph KS, Demissie K, Vintzi-leos AM. Trends in preterm birth and perinatalmortality among singletons: United States,1989 through 2000. Obstet Gynecol 2005;105:1084-91.36. Guyer B, Strobino DM, Ventura SJ. Mac-Dorman M, Martin JA. Annual summary of vitalstatistics—1995. Pediatrics 1996;98:1007-9.37. Blabey MH, Gessner BD. Three maternalrisk factors associated with elevated risk ofpostneonatal mortality among Alaska Nativepopulation. Matern Child Health J 2009;13:222-30.38. Zhang L, Cox RG, Graham J, Johnson D.Association of maternal medical conditions andunfavorable birth outcomes: findings form the1996 to 2003 Mississippi linked birth and deathdata. Matern Child Health J 2009 Sep 17 [Epubahead of print]. DOI: 10.1007/s10995-009-0516-8..39. Alexander GR, Wingate MS, Bader D,Kogan MD. The increasing racial disparity in in-fant mortality rates: composition and contribu-tors to recent US trends. Am J Obstet Gynecol2008;198:51.e1-9.40. Salihu HM, Aliyu MH, Pierre-Louis BJ, Alex-ander GR. Levels of excess infant deaths attrib-utable to maternal smoking during pregnancy inthe United States. Matern Child Health J2003;7:219-27.41. Alexander GR, Kotelchuck M. Assessingthe role and effectiveness of prenatal care: his-tory, challenges, and directions for future re-search. Public Health Rep 2001;116:306-16.42. Hueston WJ, Gilbert GE, Davis L, Sturgill V.Delayed prenatal care and the risk of low birthweight delivery. J Community Health 2003;28:199-208.43. Lu MC, Tache V, Alexander GR, KotelchuckM, Halfon N. Preventing low birth weight: is pre-natal care the answer? J Matern Fetal NeonatalMed 2003;13:362-80.44. Schoendorf KC, Branum AM. The use ofUnited States vital statistics in perinatal and ob-stetric research. Am J Obstet Gynecol 2006;
194:911-5.y MONTH 2011
45. Northam S, Knapp TR. The reliability andvalidity of birth certificates. J Obstet GynecolNeonatal Nurs 2006;35:3-12.46. Cahill AG, Macones GA. Vital consider-ations for the use of vital statistics in obstetricresearch. Am J Obstet Gynecol 2006;194:909-10.47. Roohan PJ, Josberger RE, Acar J, Dabir P,Feder HM, Gagliano PJ. Validation of birth cer-tificate data in New York State. J CommunityHealth 2003;28:335-46.48. Reichman NE, Schwartz-Soicher O. Accu-racy of birth certificate data by risk factors andoutcomes: analysis of data from New Jersey.Am J Obstet Gynecol 2007;197:32.e1-8.49. Lydon-Rochelle MT, Holt VL, Cardenas V,et al. The reporting of pre-existing maternalmedical conditions and complications of preg-nancy on birth certificates and in hospital dis-charge data. Am J Obstet Gynecol 2005;193:125-34.50. DiGiuseppe DL, Aron DC, Ranbom L,Harper DL, Rosenthal GE. Reliability of birth cer-tificate data: a multi-hospital comparison tomedical records information. Matern ChildHealth J 2002;6:169-79.51. Iceland J, Weinberg DH, Steinmetz E. Ra-cial and ethnic residential segregation in theUnited States: 1980-2000. US Census Bureau,series CENSR-3. Washington, DC: US Govern-ment Printing Office; 2002.52. Martin JA, Hamilton BE, Sutton PD, et al.Births: final data for 2007. National vital statis-tics reports; vol 58, no XX. Hyattsville, MD: Na-tional Center for Health Statistics; 2010.53. Big cities health inventory: the Health of Ur-ban America, 2007. National Association ofCounty and City Health Officials, Benbow N, ed.Washington, DC; 2007.54. US Census Bureau, 2006-2008. AmericanCommunity Survey 3-year estimates. Medianhousehold income. Milwaukee City. Washing-ton, DC: United States Census Bureau. Avail-able at: http://factfinder.census.gov/servlet/ADPTable?_bm�y&-geo_id�16000US5553000&-qr_name�ACS_2008_3YR_G00_DP3YR3&-ds_name�ACS_2008_3YR_G00_&-_lang�en&-redoLog�false&-_sse�on. Accessed Nov. 3,
2010.