A Wide‐Field Hubble Space Telescope Survey of the Cluster Cl 0024+16 at z = 0.4. III....
27
arXiv:astro-ph/0508092v1 2 Aug 2005 TO APPEAR IN APJ Preprint typeset using L A T E X style emulateapj v. 6/22/04 A WIDE-FIELD HUBBLE SPACE TELESCOPE SURVEY OF THE CLUSTER CL 0024+16 AT Z=0.4. III: SPECTROSCOPIC SIGNATURES OF ENVIRONMENTAL EVOLUTION IN EARLY TYPE GALAXIES SEAN M. MORAN 1 ,RICHARD S. ELLIS, 1 ,TOMMASO TREU 2,3,4 ,I AN SMAIL 5 ,ALAN DRESSLER 6 ,ALISON L. COIL 7 ,GRAHAM P. SMITH 1 1 California Institute of Technology, Department of Astronomy, Mail Code 105-24, Pasadena, CA 91125, USA email: [email protected], [email protected] 2 Department of Physics, University of California, Santa Barbara, CA 93106, email: [email protected] 3 University of California at Los Angeles, Department of Physics & Astronomy, Los Angeles, CA 90095 4 Hubble Fellow 5 Department of Physics, University of Durham, South Road, Durham DH1 3LE, UK. 6 The Observatories of the Carnegie Institutions of Washington, 813 Santa Barbara St., Pasadena, CA 91101 7 Department of Astronomy, University of California, Berkeley, CA 94720 To Appear in ApJ ABSTRACT We report results from a panoramic spectroscopic survey of 955 objects in the field of the rich cluster Cl 0024+1654 (z ≃ 0.4), complementing the HST imaging presented in the first paper in this series. Combining with previous work, we compile a catalog of 1394 unique redshifts in the field of this cluster, including 486 clus- ter members spread across an area 10 Mpc in diameter. Our new spectroscopic sample includes over 200 high quality spectra of cluster members. We examine the properties of a large sample of 104 cluster early–types as a function of cluster radius and local density, using them as sensitive tracers of the various physical processes that may be responsible for galaxy evolution. By constructing the Fundamental Plane of Cl 0024, we infer an evo- lution in the mean mass to light ratio of early–types with respect to z = 0 of Δ < Log(M/L V ) >= -0.14 ± 0.02. In the cluster center, we detect a significantly increased scatter in the relationship compared to that seen in local clusters. Moreover, we observe a clear radial trend in the mass to light ratios of individual early types, with the oldest galaxies located in the cluster core. Galaxies are apparently younger at larger radius, with E+S0s in the periphery having M/L V ratios that nearly match values seen in the field at a similar redshift. The strong radial trend is seen even when the sample is restricted to a narrow range in galaxy mass. Independent spectral indicators used in combination reveal an abrupt interaction with the cluster environment which occurs near the virial radius of Cl 0024, revealed by small bursts of star formation in a population of dim early-types, as well as by enhanced Balmer absorption for a set of larger E+S0s closer to the cluster core. We construct a simple infall model used to compare the timescales and strengths of the observed interactions in this cluster. We examine the possibility that bursts of star formation are triggered when galaxies suffer shocks as they encounter the intra-cluster medium, or by the onset of galaxy harassment. Subject headings: galaxies: clusters: individual (Cl 0024+1654) — galaxies: elliptical and lenticular, cD — galaxies: evolution — galaxies: formation — galaxies: fundamental parameters — galaxies: kinematics and dynamics 1. INTRODUCTION Environmental processes have clearly played a signifi- cant role in shaping the morphological evolution of galax- ies. Butcher & Oemler (1978) first noted the increased frac- tion of actively-star forming galaxies in cluster cores at red- shifts z ≃0.4 and subsequent studies clarified direct evolution in the relationship between morphological fractions and lo- cal density (Dressler et al. 1997). Recent work has extended these measures to galaxy samples in lower density environ- ments and at higher redshifts (Treu et al. 2003; Smith et al. 2005; Postman et al. 2005), delineating a picture where the fraction of early-type (hereafter elliptical and S0) galaxies to some rest-frame luminosity limit grows with time, and at a rate that seems to depend sensitively on the local density. What processes govern this apparent transformation of star- forming disk and irregular galaxies into the abundant ellipti- cal and S0 population seen in present-day clusters? Galaxy clusters provide excellent laboratories to study these environ- mental effects, particularly at intermediate redshifts (where the relevant processes were perhaps most active) and over the full range of cluster radii, from the well-mixed cluster core to the outermost regions where field galaxies are falling into the cluster for the first time. This is the third paper in a series concerned with explor- ing the origin and evolution of the morphology-density re- lation via a detailed study of hundreds of galaxies to the turn around radius in the rich cluster Cl 0024+1654 (z=0.40). The essential ingredients for this study include a large Hub- ble Space Telescope WFPC-2 image mosaic providing galaxy morphologies, and Keck spectroscopy, for membership, dy- namics and diagnostics of recent star formation activity. In the first paper in the series, Treu et al. (2003, hereafter Paper I), we analyzed the relation between morphology, local den- sity and cluster radius and pinpointed possible environmental processes which curtail star-formation within infalling galax- ies. Local density was shown to be a more reliable measure of the environmental trends than cluster radius, suggesting most infalling galaxies retain their original group properties until they reach the Virial radius where such substructure is quickly erased. In the second paper (Kneib et al. 2003), a physical model for the distribution of cluster mass and mass to light ratio was determined from strong and weak gravitational lens- ing. In this third paper, we turn now to the spectroscopic diag- nostics. Spectroscopy of cluster members at various stages of infall can provide a key to the dominant environmental pro- cesses. As introduced in Paper I, different physical mecha- nisms will produce recognizable spectral and dynamical sig- natures in the affected galaxies. While several independent
Transcript of A Wide‐Field Hubble Space Telescope Survey of the Cluster Cl 0024+16 at z = 0.4. III....

arX
iv:a
stro
-ph/
0508
092v
1 2
Aug
200
5TO APPEAR INAPJPreprint typeset using LATEX style emulateapj v. 6/22/04
A WIDE-FIELD HUBBLE SPACE TELESCOPESURVEY OF THE CLUSTER CL 0024+16 AT Z=0.4. III:SPECTROSCOPIC SIGNATURES OF ENVIRONMENTAL EVOLUTION IN EARLY TYPE GALAXIES
SEAN M. M ORAN1, RICHARD S. ELLIS ,1, TOMMASO TREU2,3,4, IAN SMAIL 5, ALAN DRESSLER6, ALISON L. COIL7, GRAHAM P.SMITH 1
1California Institute of Technology, Department of Astronomy, Mail Code 105-24, Pasadena, CA 91125, USA email: [email protected],[email protected] of Physics, University of California, Santa Barbara, CA 93106, email: [email protected] of California at LosAngeles, Department of Physics & Astronomy, Los Angeles, CA900954Hubble Fellow5Department of Physics, University of Durham, South Road, Durham
DH1 3LE, UK. 6The Observatories of the Carnegie Institutions of Washington, 813 Santa Barbara St., Pasadena, CA 911017Department of Astronomy,University of California, Berkeley, CA 94720
To Appear in ApJ
ABSTRACTWe report results from a panoramic spectroscopic survey of 955 objects in the field of the rich cluster
Cl 0024+1654 (z≃ 0.4), complementing theHSTimaging presented in the first paper in this series. Combiningwith previous work, we compile a catalog of 1394 unique redshifts in the field of this cluster, including 486 clus-ter members spread across an area 10 Mpc in diameter. Our new spectroscopic sample includes over 200 highquality spectra of cluster members. We examine the properties of a large sample of 104 cluster early–types as afunction of cluster radius and local density, using them as sensitive tracers of the various physical processes thatmay be responsible for galaxy evolution. By constructing the Fundamental Plane of Cl 0024, we infer an evo-lution in the mean mass to light ratio of early–types with respect toz= 0 of ∆ < Log(M/LV) >= −0.14±0.02.In the cluster center, we detect a significantly increased scatter in the relationship compared to that seen in localclusters. Moreover, we observe a clear radial trend in the mass to light ratios of individual early types, withthe oldest galaxies located in the cluster core. Galaxies are apparently younger at larger radius, with E+S0s inthe periphery havingM/LV ratios that nearly match values seen in the field at a similar redshift. The strongradial trend is seen even when the sample is restricted to a narrow range in galaxy mass. Independent spectralindicators used in combination reveal an abrupt interaction with the cluster environment which occurs near thevirial radius of Cl 0024, revealed by small bursts of star formation in a population of dim early-types, as well asby enhanced Balmer absorption for a set of larger E+S0s closer to the cluster core. We construct a simple infallmodel used to compare the timescales and strengths of the observed interactions in this cluster. We examinethe possibility that bursts of star formation are triggeredwhen galaxies suffer shocks as they encounter theintra-cluster medium, or by the onset of galaxy harassment.Subject headings:galaxies: clusters: individual (Cl 0024+1654) — galaxies:elliptical and lenticular, cD —
galaxies: evolution — galaxies: formation — galaxies: fundamental parameters — galaxies:kinematics and dynamics
1. INTRODUCTION
Environmental processes have clearly played a signifi-cant role in shaping the morphological evolution of galax-ies. Butcher & Oemler (1978) first noted the increased frac-tion of actively-star forming galaxies in cluster cores at red-shiftsz≃0.4 and subsequent studies clarified direct evolutionin the relationship between morphological fractions and lo-cal density (Dressler et al. 1997). Recent work has extendedthese measures to galaxy samples in lower density environ-ments and at higher redshifts (Treu et al. 2003; Smith et al.2005; Postman et al. 2005), delineating a picture where thefraction of early-type (hereafter elliptical and S0) galaxies tosome rest-frame luminosity limit grows with time, and at arate that seems to depend sensitively on the local density.
What processes govern this apparent transformation of star-forming disk and irregular galaxies into the abundant ellipti-cal and S0 population seen in present-day clusters? Galaxyclusters provide excellent laboratories to study these environ-mental effects, particularly at intermediate redshifts (wherethe relevant processes were perhaps most active) and over thefull range of cluster radii, from the well-mixed cluster core tothe outermost regions where field galaxies are falling into thecluster for the first time.
This is the third paper in a series concerned with explor-
ing the origin and evolution of the morphology-density re-lation via a detailed study of hundreds of galaxies to theturn around radius in the rich cluster Cl 0024+1654 (z=0.40).The essential ingredients for this study include a large Hub-ble Space Telescope WFPC-2 image mosaic providing galaxymorphologies, and Keck spectroscopy, for membership, dy-namics and diagnostics of recent star formation activity. Inthe first paper in the series, Treu et al. (2003, hereafter PaperI), we analyzed the relation between morphology, local den-sity and cluster radius and pinpointed possible environmentalprocesses which curtail star-formation within infalling galax-ies. Local density was shown to be a more reliable measure ofthe environmental trends than cluster radius, suggesting mostinfalling galaxies retain their original group propertiesuntilthey reach the Virial radius where such substructure is quicklyerased. In the second paper (Kneib et al. 2003), a physicalmodel for the distribution of cluster mass and mass to lightratio was determined from strong and weak gravitational lens-ing.
In this third paper, we turn now to the spectroscopic diag-nostics. Spectroscopy of cluster members at various stagesofinfall can provide a key to the dominant environmental pro-cesses. As introduced in Paper I, different physical mecha-nisms will produce recognizable spectral and dynamical sig-natures in the affected galaxies. While several independent

2
processes can operate simultaneously in the central 0.5–1Mpc, these can be separated by contrasting differences overa wider dynamic range in radius and local density.
Since our first paper was submitted, we have continued toobserve Cl 0024+1654 (hereafter Cl 0024) at the Keck ob-servatory and our goal here is twofold: First, we update andfinalize the redshift catalog of cluster members. Using theDEIMOS spectrograph onKeck II, we have now obtainedspectra for nearly 1000 galaxies to a projected distance of5 Mpc; the tally of cluster members is nearly 500 galaxies,the largest such sample at intermediate redshift.
Secondly, in addition to measuring redshifts in abundancewe have exposed on a brighter subset of known members to alimit where our morphological classifications are particularlyreliable. At this limit, our high-quality DEIMOS spectra canbe used to examine precise trends observed in various diag-nostics of recent star formation as well as resolved dynamicsof disk and early-type members. Our goal is to analyze thesetrends according to both the timescale and physical locationover which they occur in order to develop an overall pictureof the processes that affect the cluster galaxy population.
Much of course has been learned from detailed spec-troscopy of galaxies in intermediate redshift clusters(e.g. Dressler & Gunn 1983; Couch & Sharples 1987;Poggianti et al. 1999, and references therein). However,previous studies of this type have either focused on the clustercore, where morphologies are available or relied on spectraltypes or colors to trace the effects of environment out tothe cluster periphery (Abraham et al. 1996b; Kodama et al.2001). With a larger sample of morphologies and high qualityspectra over the full range of local densities in Cl 0024, weaim to provide a more complete picture of the environmentalprocesses involved and their range of application.
We focus here on cluster members classified as early-type (E+S0) in our morphological catalog (Paper I). Inthe local universe, cluster early-type galaxies are an ex-tremely homogeneous population in terms of their stellarpopulations and structural properties (e.g. Dressler et al.1987; Djorgovski & Davis 1987; Bower et al. 1992;Bender, Burstein, & Faber 1992). Nevertheless, the evo-lution of the morphology density relation indicates that asubstantial fraction was accreted or transformed at inter-mediate redshift. Several of the proposed environmentalmechanisms are thought to have transformed spirals into S0s(Dressler et al. 1997; Fasano et al. 2000; Smith et al. 2005;Postman et al. 2005).
By studying these galaxies at intermediate redshifts andcontrasting their spectral properties with those of their coun-terparts in the field and local universe we expect to be sensi-tive to signatures of past and current environmental activity.In this sense, we will explore early-type galaxies as “test par-ticles” of recent activity. Building on the conclusions herein,a future paper will address the properties of spiral galaxies inCl 0024 and discuss the galaxy population as a whole, takinginto account morphological evolution (see, e.g., the discus-sion ofprogenitor biasin van Dokkum & Franx 2001).
The signal/noise of our early-type spectra was designed tobe adequate to measure reliable stellar velocity dispersions foreach galaxy, enabling us to construct the Fundamental Planeand, in particular, its possible variation with location. Thisemerges as a powerful probe of variations in theM/LV ratiosand hence the luminosity-weighted ages of the stellar popula-tions. Precise measures of various line diagnostics permitusto independently probe the star formation histories over well-
understood timescales. In combination, both methods allowus to examine the relative importance of the environment andto constrain the physical mechanisms responsible.
A key issue is the relationship between trends found inCl 0024 at various radii and those found in the field at approx-imately the same cosmic epoch. To facilitate such a compar-ison we make use of the recent comprehensive study of 163field E+S0s undertaken by Treu et al. (2005a,b) in the north-ern GOODS field.
A plan of the paper follows. In § 2, we summarize thenew spectroscopic observations and their data reduction, andpresent the final catalog of spectroscopic redshifts. In § 3 wediscuss our measurements of the stellar velocity dispersions,the fits to the surface photometry, the various spectral linein-dices, as well as an improved estimate of the local environ-mental densities. In § 4 we present our results focusing firston the Fundamental Plane and the implications of the scatterand various trends seen as a function of luminosity and lo-cation, and correlations between the Balmer absorption andmetal line strengths with the velocity dispersion. We also an-alyze both radial trends and those seen in the residuals fromour global cluster and field relations. In § 5, we develop anintegrated picture which combines these independent meth-ods and discuss this in the light of the conclusions we drewin Paper I. For consistency, throughout this series of paperswe use the cosmology adopted in Paper I (H0 = 65.0 km s−1,Ωm = 0.3, ΩΛ = 0.7).
2. OBSERVATIONS
2.1. Imaging
High resolution imaging of Cl 0024 is crucial for the typeof spectroscopic study we wish to undertake, both for the pur-pose of selecting a sample of E+S0 galaxies, and to allow usto analyze the surface photometry of the selected galaxies.
Paper I presented the results of a wide-fieldHST imagingsurvey of Cl 0024. The survey includes a sparsely-sampledmosaic of 39 WFPC2 images taken in the F814W filter (∼ Iband), providing good coverage of the cluster field out to ra-dius> 5 Mpc (∼ 14′). Paper I reported morphological classi-fications down toI = 22.5. Classifications to a limiting magni-tude ofI = 21.1 were found to be very reliable, in that severalauthors, working independently, agreed upon the morphologyfor most objects. This included differentiation between thesub-types E, E/S0, and S0. While ellipticals and S0s weregrouped together for the purposes of Paper I, it is useful inthis paper to detect any differences between the populationsof Es and S0s: if spirals are actively transforming into S0s atz∼ 0.4, we might expect to detect differences in the stellarpopulations of the two groups.
Although face-on S0s are notoriously hard to distinguishfrom ellipticals, especially at high redshift where S0 disksmay be too dim to detect (Smail et al. 1997; Fabricant et al.2000), we can partially avoid this difficulty by focusing on thebrightest early type galaxies where all but the faintest disksshould be detectable. In this paper, therefore, we will reportdistinctions between E, E/S0, and S0 galaxies for a brightersubset of this sample, toI = 21.1. We additionally employ atechnique not discussed in Paper I, namely that based on theresidual signals found after subtraction of an axisymmetric deVaucouleurs profile (§3.3 and 4.1.1).
2.2. Spectroscopy
Designed to both identify cluster members and acquire highsignal to noise spectra of galaxies in Cl 0024, we began our

3
FIG. 1.— A typical spectrum for a galaxy near the magnitude limitof ourbrighter sample. The entire 1D spectrum is plotted at top, with a segment ofthe 2D spectrum displayed below it. We have measured equivalent widthsfor the spectral lines indicated. The pseudo-continuum andindex bandpassesused for each index are marked. Overplotted in red is the best-fit templatespectrum used in measuring the stellar velocity dispersion, for the full spec-tral range where it overlaps with our galaxy spectrum. The resulting velocitydispersion isσ = 114±10 km s−1.
spectroscopic campaign in October 2001 with LRIS onKeck I.While some observations were completed that year (see PaperI), poor weather forced us to return in October 2002 and againin October 2003, this time making use of the new DEIMOSspectrograph onKeck II (Faber et al. 2003). The survey waslargely completed in 2003, though a small number of addi-tional galaxies were observed in December 2004. In total, wehave obtained new spectra of 955 objects, including 261 con-firmed cluster members toI = 22.5.
Spectroscopic targets were selected from the CFHTI–bandmosaic of the Cl 0024 field (Czoske et al. 2002). In designingslit masks, selection priority was given to known cluster mem-bers withHSTmorphologies, followed by galaxies in theHSTsurvey without a known redshift, toI = 22.5. Galaxies with-out HST images filled the remainder of each slit mask, withpriority given to known members. All targeted galaxies werebrighter thanI = 22.5. Masks were designed so as to providegood coverage across the Cl 0024 field, while also maximiz-ing the number of known-member spiral galaxies that couldbe observed with tilted slits (for extracting rotation curvesfrom extended line emission; to be discussed in a later paper.)
We observed a total of 12 DEIMOS slit masks in 2002 and2003, covering the entire field of the HST mosaic. We em-ployed the 900 line/mm grating, with a central wavelength of6200Å. This setup provides spectral coverage from 4500 to8000 Å, with a pixel scale of approximately 0.′′12× 0.44 Å.Slitlets were milled to be 1′′ wide, providing spectral reso-lution of σ ∼ 50km s−1. For most masks, the exposure timewas 2.5 hrs (5× 1800s), though four masks were only ob-served for 2 hrs (4× 1800s). In December 2004, we ob-served a single additional mask for 3 hrs, 10 min, (5× 1200splus 3× 1800s) with the 600 line/mm grating, providing res-olution of ∼ 70km s−1. The central wavelength was again6200Å, providing similar spectral coverage. In 2002, condi-tions were fairly poor, with thin clouds frequently interrupting
observations. Seeing was approximately 0.′′7. In 2003, seeingwas good (0.′′5–0.′′6), though conditions were not photomet-ric. And in 2004, conditions were generally good, with seeingvarying between 0.′′7–1.′′1 across three nights.
We analyze data for 104 E+S0 galaxies, of which 71 haveparticularly high quality spectra (generally defined in this pa-per to be those for which reliable stellar velocity dispersionswere measured). Twelve of these E+S0s (6 high quality) comefrom the LRIS observations discussed in Paper I, with the re-mainder from DEIMOS. Broken down by specific morpho-logical type, our sample includes 34 galaxies classified as E,50 as S0, and 20 as E/S0. Of the galaxies with high qualityspectra available, 27 are E, 38 S0, and 10 E/S0.
We designed our spectroscopic campaign to yield highquality spectra for galaxies brighter thanI = 21.1, in orderto match the magnitude limit of Paper I for precise mor-phological classification. As expected, all objects where wehave obtained high quality spectra are brighter than this limit.We therefore divide our E+S0 galaxies into a sample that isbrighter thanI = 21.1 and one that includes all observed E+S0members down toI = 22.5. For the larger sample, signal/noiseis generally sufficient to measure and examine trends in spec-tral line strengths. AnM∗
V galaxy in Cl 0024 corresponds toI = 19.5 (Smail et al. 1997, Paper I), such that our two sam-ples represent galaxies brighter thanM∗
V + 1.6 andM∗V + 3.0,
respectively.
2.2.1. Data Reduction
Spectra were reduced using the DEEP2 DEIMOS datapipeline1 (Davis et al. 2003). The pipeline performs bias re-moval, flat-fielding, and cosmic-ray rejection. It then sepa-rates slitlets and performs wavelength calibration and skysub-traction. For wavelength calibration, the pipeline uses anop-tical model of the DEIMOS mask to generate an initial wave-length solution. Arc-lamp frames, consisting of 1s exposureswith Ne, Ar, Kr, and Xe lamps, are then used to refine thecalibration.
From the reduced two-dimensional spectra, the pipelineextracts one-dimensional spectra using either a variance-weighted boxcar function, or a variant of the optimal extrac-tion method described by Horne (1986). We perform our anal-ysis on spectra extracted via the boxcar method, though thedifference using the optimal extraction is minimal. Figure1presents a 1D reduced spectrum of a galaxy that is near themagnitude limit of our brighter sample, along with a portionof the reduced 2D spectrum for the same object.
For LRIS data, individual slitlets were separated and re-duced in a standard manner (see, e.g., Treu et al. 1999,2001b).
For each reduced spectrum, redshifts were determined byexamining the spectra to identify key absorption and emissionlines. We obtained initial redshift guesses via automated fit-ting of template stellar spectra to each object spectrum. Eachspectrum was then judged by eye to determine the correct red-shift. Most redshifts were identified by SMM, and checkedby TT. Table 1 lists the basic properties of the sample of 104E+S0 galaxies. In later tables, galaxies will be referred tobythe object name listed here.
2.2.2. Cl 0024 Redshift Catalog
As in Paper I, we combine our new spectroscopy withdata from previous surveys (Czoske et al. 2001; Dressler et al.
1 Software available at http://astron.berkeley.edu/∼cooper/deep/spec2d

4
0.38 0.39 0.4 0.410
20
40
60
FIG. 2.— Redshift distribution of galaxies in the field of Cl 0024in thevicinity of z∼ 0.4. From Paper I, updated to include the final tally of red-shifts in our Keck spectroscopic campaign. The empty histogram reflects allknown members, while the shaded histogram represents members present inthe HST mosaic of Paper I. The two peaks in the distribution are discussedby Czoske et al. (2002).
1999) to compile a comprehensive redshift catalog of objectsin the Cl 0024 field. In total, we have compiled a catalogwith 1394 redshifts of unique objects, of which 486 are clustermembers. Table 2 presents an excerpt from the total redshiftcatalog, which is available in its entirety online. Approxi-mately sixty unique redshifts were kindly provided by D. Koo& A. Metevier. These are omitted from Table 2 (reducingthe tally to 1334 objects) and will be published separately byMetevier et al. (2005, in preparation). A final merged catalogwill be available from the two groups’ websites. As in PaperI and Czoske et al. (2002), we define a cluster member to bea galaxy that lies in either Peak A or Peak B of the cluster,as illustrated in Figure 2. This encompasses a redshift rangefrom z= 0.374 toz= 0.402.
While Table 2 includes galaxies from across the entire fieldof Cl 0024, our sample of E+S0 galaxies is drawn from thearea imaged by WFPC2, so we are particularly concernedwith the distribution of known redshifts within the area of theHSTsurvey. To draw firm conclusions about the early typepopulation of Cl 0024, we must draw our E+S0 galaxies froma sample that is sufficiently complete and representative ofthepopulation as a whole.
We define the redshift completeness of the catalog, as afunction of magnitude or cluster radius, as the number of ob-jects with identified redshifts divided by the total number ofobjects in theHSTimaging catalog (See Paper I). Complete-ness has naturally increased from the values given in PaperI; ignoring objects brighter than the brightest cluster galaxy(I = 17.75), it is now∼ 65% for 17.75< I < 21.1 and∼ 40%for 17.75 < I < 22.5. Importantly for this work, our cov-erage of E+S0 galaxies within 3 Mpc of the cluster centeris particularly high. Within this radius, Figure 3 shows thatwe have identified redshifts for over 80% of E+S0 galaxies
TABLE 2CL 0024+1654 REDSHIFTCATALOG
α δ zbest Qualitya Sourceb 〈z〉 δz Nz(o) (o)
6.845741 17.133789 0.3940 0 2 0.3940 0.0000 16.837580 16.997200 0.3966 1 1 0.3964 0.0004 26.827622 17.378466 0.3792 0 2 0.3792 0.0000 16.821529 17.200779 0.3758 0 2 0.3758 0.0000 16.812725 17.213043 0.3813 0 2 0.3813 0.0000 16.801040 17.199699 0.3955 1 5 0.3955 0.0001 26.765210 17.191099 0.3955 1 5 0.3956 0.0002 36.759056 17.073933 0.3790 0 2 0.3790 0.0000 16.744001 17.070641 0.3940 0 2 0.3940 0.0000 16.737525 17.066620 0.1870 2 3 0.1870 0.0000 1
...
NOTE. — The complete version of this table is in the electronic edition of theJournal. The printed edition contains only a sample. Explanation of columns:zbest,Quality, and Source refer to the most reliable redshift for each object. If a redshift isavailable for an object from more than one source, then〈z〉 gives the mean redshiftfrom all sources,δz is the rms difference between them, andNz is the number ofredshifts included in the mean.
aQuality codes: 0 = Quality unspecified by source, 1 = Secure, 2= Probable, 3 =Uncertain
bSource codes: 1 = Czoske et al. (2001), 2 = Frazier Owen (private communica-tion), 3 = Hale/COSMIC, 4 = Keck/LRIS, 5 = Keck/DEIMOS
brighter thanI = 21.1. At larger radii, and for dimmer E+S0s(I < 22.5), completeness drops to∼ 50%. Spiral galaxiesshow a similar level of completeness, and so we reaffirm theconclusion of Paper I that there is no significant morpholog-ical bias in our redshift catalog (See Figure 3.) Our sampleof E+S0 galaxies should be representative of the overall pop-ulation, since the selection of galaxies for the spectroscopicsurvey was largely random, and the quality of the observedspectra depends only on random factors such as weather, in-troducing no bias with respect to spatial distribution.
3. ANALYSIS
The powerful combination ofHST imaging and high-quality DEIMOS spectroscopy enables us to combine mea-sures of the kinematic and photometric structure of clusterearly types with detailed spectral information that revealsthe underlying stellar population. Locally, early type galax-ies show several tight correlations between kinematic, pho-tometric, and spectral properties, such as the FundamentalPlane (FP) (Djorgovski & Davis 1987), the Mg–σ relation(Bender, Burstein, & Faber 1993), and the Balmer–σ relation(Kuntschner 2000; Kelson et al. 2001). Examining these re-lations atz∼ 0.4 not only gives insight into the redshift evo-lution of cluster early types, but, by examining the residualsfrom these relations as a function of cluster environment, wecan uncover subtle trends in the mass to light ratios (M/LV),metallicities, and star formation histories of these galaxies.
Of course, it is important first to clearly define meaningfulmeasures of the cluster environment of a galaxy. FollowingPaper I, we measure radius as the distance from the center ofthe cluster’s x-ray emission. Our results would be negligiblyaffected if we instead adopted the center of mass of the sys-tem determined by Kneib et al. (2003), as the two positionsare separated by less than 5′′ (< 30 kpc). In order to morereliably study variations in galaxy properties as a functionof local density, we re-calculate the local densities presentedin Paper I, now making use of our extensive spectroscopiccatalog, supplemented by the photometric redshift catalogof

5
19 20 21 22
0.2
0.4
0.6
0.8
1
0.2
0.4
0.6
0.8
0 200 400 600
0.2
0.4
0.6
0.8
1 2 3 4
FIG. 3.— Top: Number counts as a function of I magnitude for all objectsobserved by WFPC2, with the number of cluster members and nonmembersmarked (upper panel). For all objects with WFPC2 imaging, the lower paneldisplays the fraction with a measured redshift, as a function of I magnitude,and divided by morphology as indicated. Bottom: Fraction ofobjects withmeasured redshift, as in the top plot, but as a function of cluster radius, andto two separate magnitude limits,I < 21.1 (top) andI < 22.5 (bottom).
Smith et al. (2005).Stellar velocity dispersions serve as a tracer of galaxy mass,
and allow us to quantify how stellar populations vary with agalaxy’s size (and, by extension, the formation history of thegalaxy.) The redshift evolution of early type galaxies can beconstrained by comparing the tightσ correlations observedlocally to what is observed at higher redshift. We can alsouse velocity dispersions to determine if trends in stellar pop-ulations are more tightly correlated with environment or withgalaxy mass.
With the addition of surface photometry from theHSTim-ages, we can derive the parameters of the fundamental plane(FP) in Cl 0024: effective radiusRe, mean surface brightness〈µV〉, and central velocity dispersionσ0 (Djorgovski & Davis1987; Dressler et al. 1987). The residuals from the FP revealvariations in the mass to light ratios of galaxies; from this,we can trace how the luminosity-weighted ages of early typesvary across the cluster environment. We can also measure theevolution of M/LV with redshift, and examine whether theamount of this evolution depends on galaxy mass and/or clus-ter environment.
We also wish to directly examine environmental trends inspectral line strengths, as these can reveal trends in currentstar formation (via [OII], [OIII], or Hβ emission), recentlycompleted star formation (via Hγ and Hδ absorption linestrengths), or metallicity (via Mg2, Mgb or the composite in-dex [MgFe]′).
Below, we discuss the methods we follow to accuratelymeasure each of the quantities necessary for our analysis: lo-cal density, velocity dispersion, surface photometry, andspec-tral line indices.
3.1. Local Density Measurements
Local density measurements in Paper I relied on a statisti-cal field subtraction, following the methods of previous work(e.g. Whitmore et al. 1993; Dressler et al. 1997). While ad-equate, we can improve on these measurements by makinguse of our large spectroscopic catalog, supplemented by theextensive catalog of photometric redshifts from Smith et al.(2005). These catalogs allow us to eliminate most foregroundand background galaxies, and calculate local densities basedonly on the positions of confirmed or possible cluster mem-bers. A standard method of measuring local density, used inPaper I and first introduced by Dressler (1980), involves cal-culating the area enclosed by the ten nearest neighbors of agalaxy (to I = 21.1 in the case of Paper I). In order to ob-tain local density measurements for our entire sample of 104galaxies (I ≤ 22.5), we modify the method from Paper I toinclude all fainter galaxies toI = 22.5 in the tally of nearestneighbors. Our method is as follows:
Each object withI < 22.5 is given a weight between zeroand one, according to the procedure outlined below. Then, foreach object, we calculate the total area enclosed by a set ofneighboring galaxies whose cumulative weight equals about10. (Fractional weights are common, so the total weight rarelyequals exactly 10.) The local density is then calculated by di-viding the total weight by the area in Mpc2. Compared to themethod used in Paper I, this should give a value ofΣ10 that isa better reflection of the true density of galaxies in the clus-ter, minimizing errors due to chance superpositions of back-ground galaxies or groups.
As we wish to include only cluster members in the calcu-lations of local density, we assign weights to galaxies basedon how confident we are that it is a cluster member. If aspectroscopic redshift is available from the combined cata-log (§ 2.2.2), then the object’s weight equals 1 if it is a clustermember (0.374< z< 0.402), and zero otherwise.
For objects with no spectroscopic redshift, we check fora photometric redshift in the catalog of Smith et al. (2005).While the cluster is clearly evident in the redshift distributionof galaxies in the Smith et al. (2005) catalog, the limited accu-racy of photometric redshifts means that the cluster galaxiesare smeared across the redshift rangezphot = 0.39±0.09 Wegive all galaxies within this range a weight of 1, even thoughsome non-cluster members will be mistakenly included. Froman analysis of galaxies with both spectroscopic and photo-metric redshifts available, we find that approximately 85%of cluster members have photometric redshifts in the adoptedrange, and about one third of all galaxies with photometricredshifts in this range will actually lie outside of the cluster.This will lead us to slightly overestimate the total number ofcluster members, and, by extension, local densities. But theeffect is minimal given the large fraction of spectroscopicred-shifts. We also explored a more elaborate weighting schemebased on the joint probability that a given galaxy will be a

6
member according to its photometric redshift and projectedradius. The rms variation inΣ10 between the this and oursimple scheme is about 12% - less than other sources of un-certainty and therefore not worthy of adopting.
The photometric redshift catalog is J-limited atJ≤ 21.5, sothere are some objects withI < 22.5 that have neither a spec-troscopic nor photometric redshift available. For these, weassign weights according to the radial dependence of the prob-ability that a random galaxy will be a cluster member. For ex-ample, based on the combined spectroscopic redshift catalog,the probability is 81% that an unknown galaxy within 0.75Mpc of the cluster core is a cluster member; such a galaxyis assigned a weight of 0.81. We calculate and assign similarprobabilities for galaxies in several different radial bins out to5 Mpc. Since we only consider galaxies within the magnituderange 17.75≤ I < 22.5, the probabilities we have adopted donot vary strongly with magnitude, and so we do not furthersubdivide our probability estimates into different bins for dif-ferent ranges of galaxy magnitude.
In order to properly compare densities calculated with ourmethod to those used in Paper I, we also calculateΣ10 usingobjects brighter thanI = 21.1. A tight correlation is seen be-tween the two estimates which agree to within 20%; we alsoreproduce the overdensities at∼ 1 Mpc and∼ 3 Mpc given inPaper I. Similarly, we can compare the density of backgroundobjects predicted by our method to the field number countsof, e.g., Abraham et al. (1996a) and Postman et al. (1998).We calculate background count densities of log(N)/deg2 =4.45± 0.05 (to I = 22.5) and 3.90± 0.07 (to I = 21.1). Ourpredicted counts agree with both Abraham et al. (1996a) andPostman et al. (1998), within the uncertainties, for both mag-nitude limits. As an additional check on the uncertainty inΣ10measured to our deeper limit (I = 22.5), we calculated a den-sity (Σ5) for a total weight of 5. The rms variation betweenΣ5 andΣ10 is about 25%. Conservatively, we adopt this as theuncertainty inΣ10.
3.2. Stellar Velocity Dispersions
We are able to measure velocity dispersions only for ourbrighter sample of early-type members (I < 21.1), as ourspectra of fainter galaxies do not have sufficiently high sig-nal to noise. In order to determine velocity dispersions, wefit to a grid of stellar templates degraded to the instrumen-tal resolution and smoothed to various velocity dispersions(van der Marel 1994). A high quality spectrum for an objectnear our magnitude limit is plotted in Figure 1, with the best-fitting template spectrum overplotted.
To determine the signal/noise limit at which our velocitydispersion measures become unreliable, we performed a se-ries of Montecarlo simulations. We construct fake galaxyspectra from stellar templates smoothed to the resolution andpixel scale of DEIMOS (for the 900 line/mm grating), trun-cated to an identical length of∼ 2600Å, convolved with aGaussian of various widths to simulate different velocity dis-persions, and degraded to a variety of signal to noise ratios.We then attempt to recover the velocity dispersion of the fakegalaxy by running the same code as above.
We find that the approximate meanS/N where system-atic errors inσ reach∼ 10% corresponds toS/N = 7 − 8
(Å−1
, observer’s frame). Below this level, velocity disper-sion measures rapidly become inaccurate. In our high qual-ity sample, we include galaxies withS/N near this limit,though most haveS/N > 10. However, we place a somewhat
stricter limit (S/N > 8) on the spectra observed with LRISand the DEIMOS 600 lines/mm grating which have slightlyworse spectral resolution, Only 10 high quality spectra haveS/N < 10, so our results are fairly insensitive to these choices.Table 3 lists all galaxies with high quality spectra, along withtheir velocity dispersions, formal errors, and the mean sig-nal/noise of the spectrum.
The typical uncertainty in our velocity dispersion mea-surements is±10%. These errors are dominated by dif-ferences inσ that depend on the template spectrum used,though systematic errors rise to become equally importantas we approach the signal to noise limit. Of the early-typeswhere we measured velocity dispersions, there were threegalaxies in common with an earlier study of Cl 0024 byvan Dokkum & Franx (1996); the velocity dispersions quotedin van Dokkum & Franx (1996) match ours in all three cases,with < δσ/σ >= −0.02± 0.13. Treu et al. (2005b) derivedstellar velocity dispersions from DEIMOS spectra using asimilar method to our own. They pursued several tests to de-termine the accuracy of their dispersions, and found an rmsuncertainty of∼ 12%, in agreement with our own uncertaintyestimates. For more discussion of such accuracy tests, seeTreu et al. (2005b).
For each galaxy, we apply a correction to match thecentral velocity dispersion measured through a 3.4′′ aper-ture at the distance of Coma, following the prescription ofJørgensen, Franx, & Kjærgaard (1995a). This choice of aper-ture size for the correction is somewhat arbitrary, but is a com-mon choice for studies of early-type galaxies at low to inter-mediate redshift (e.g. Kelson et al. 2000b; Wuyts et al. 2004)because it facilitates comparison to local measurements ofthe Fundamental Plane (e.g. Jørgensen, Franx, & Kjærgaard1996). The magnitude of this correction depends on the phys-ical scale over which the 1D spectrum was extracted, whichvaries from object to object. The average correction appliedis 6.6%± 0.4%. Corrected velocity dispersions are denotedby σ0, and are listed in Table 3.
3.3. Surface Photometry
GALFIT (Peng et al. 2002) was used to derive effectiveradii and surface brightnesses for all galaxies with mea-sured velocity dispersions. For each galaxy, we extractpostage stamps approximately 200 pixels on a side (∼10′′). We then useGALFIT to fit against a model deVaucouleurs (r1/4) profile. Following other authors, e.g.Jørgensen, Franx, & Kjærgaard (1995b), we fit all E+S0s tothe same profile shape, even though some may be better de-scribed by a lower Sérsic index, or a de Vaucouleurs plus ex-ponential function. (See Peng et al. (2002) for a definition ofthe Sérsic function, a more general form of the de Vaucouleursfunction.)
GALFITminimizes theχ2 residuals between the galaxy im-age and a 2D galaxy model that it constructs. The free pa-rameters in this model profile include:Re, total magnitude,axis ratio, galaxy position angle, the position of the galaxycenter, and the sky level. Sky levels were set according tothe header of each WFPC2 image, but were allowed to varywithin a small range to ensure thatGALFIT converges to thecorrect fit.
Model galaxies are convolved with a PSF before fitting; weuse a star observed on the same WFPC2 chip, with approxi-mately the same exposure time. We tested with a number ofdifferent stars, and found that the specific choice of PSF stardid not significantly affect the derived photometric parame-

7
FIG. 4.— Example surface photometry fits, for galaxies classified as E,E/S0, and S0 by Paper I. Top row is the galaxy image. Middle rowshows theGALFIT model image. Bottom row shows the residuals of the image fit tomodel.
ters.When fitting a galaxy to a de Vaucouleurs profile, the best-
fit parameters are particularly sensitive to extra flux far fromthe galaxy’s center (Peng et al. 2002), since the function de-clines relatively slowly beyondRe. Neighboring or overlap-ping galaxies thus contribute light that must be either maskedor removed by fitting multiple galaxy profiles. To best re-move this extra light, we simultaneously fit a Sérsic profileto each bright neighbor within the postage stamp image. TheSérsic function is the best choice for such a fit because itsform is general enough to successfully model a wide range ofgalaxy types; according to Peng et al. (2002) this ensures thatthe galaxy’s flux is subtracted uniformly.
The magnitude of the best-fit model galaxy returned byGALFIT is measured in the observed F814W filter. Atz∼ 0.4, this is a close match to rest-frame V, but we must stillapply a smallk–color correctionto derive the mean surfacebrightness in rest frame V.〈µV〉 is defined as:
〈µV〉= I814W + 2.5log(
2πR2e
)
+ ∆mVI − AI − 10log(1+ z)= I814W + 5log(Re) + 1.29±0.04
whereAI = 1.95E(B− V) (Schlegel et al. 1998) corrects forgalactic extinction, the redshift term accounts for cosmologi-cal dimming, and∆mVI is thek–color correction. In the sec-ond line of the above equation, we insert our adopted values:∆mVI = 0.85±0.03, adopted from calculations by Treu et al.(2001a),AI = 0.11± 0.01 from Schlegel et al. (1998), andz∼ 0.395.
Since we only measure surface photometry for our brightersample of galaxies (I < 21.1), formal statistical errors in themeasured parameters are very small: less than 0.′′05 in Re,and 0.05 in magnitude. We estimate that systematic errorsare double these values, and adopt 0.′′1 and 0.1 mag as typ-ical errors inRe and magnitude, respectively. There may be
additional uncertainty inRe andµV related to the choice ofa de Vaucouleurs profile over other structural forms, but pre-vious work (Fritz et al. 2005; Kelson et al. 2000a; Saglia et al.1993) has shown that the combination ofRe andµV that entersinto the Fundamental Plane (see § 4) is largely insensitive tothe galaxy profile adopted. Figure 4 shows three example fits,for galaxies classified as E, E/S0, and S0. For each galaxy,we display the original galaxy image, the best-fit model im-age, and the residuals. As might be expected, the residuals aresmaller for the fit to the elliptical galaxy; the residuals for theS0 galaxy clearly show a disk component that is not well fitby a de Vaucouleurs profile.
We observed two clear edge-on S0s which had to be re-moved from our sample of high-quality spectra, due to theuncertainty in trying to fit a de Vaucouleurs profile to such anedge-on disk. We also removed two galaxies with bad fits,defined as where the SExtractor magnitude from theHSTim-age andGALFIT model magnitude differ by more than 0.75–the two magnitudes for most galaxies in our sample match tomuch better than 0.75 magnitudes. None of these four galax-ies are included in the previously defined sample of 71 high-quality early-types, though they are included in the largersample of 104 galaxies. The photometric parameters for thehigh-quality galaxies are listed in Table 3.
As a check on our measurements, we compared ourRe and〈µV〉 for three galaxies that also were studied in the work byvan Dokkum & Franx (1996). (This is not the same set ofthree we used to compare velocity dispersions in § 3.2: for onegalaxy where each group has measured surface photometry,we have not measuredσ. And for one galaxy where we haveboth measuredσ, we do not have anHST image for surfacephotometry.) In each case, our surface photometry matchestheirs, within the adopted errors on our measurements. Weexclude one additional galaxy that we have in common withvan Dokkum & Franx (1996), as it exhibits a disturbed mor-phology (the triple nucleus galaxy discussed in their paper.)
3.4. Line Strength Measures
We measure the strengths of several diagnostic spectrallines for the entire sample of early-type galaxies (toI < 22.5).In order to best probe the stellar population of each galaxy,we select a set of indices that are sensitive to a range of starformation histories and metallicities. Emission lines, suchas [OII], [OIII], and sometimes Hβ indicate ongoing starformation (or possibly nuclear activity). Balmer absorptionlines, such as Hγ and Hδ are sensitive to recently completedstar formation; these lines are strongest in A-stars, whichcontribute prominently to a galaxy’s integrated starlightwithin the first Gyr after a burst of star formation. We alsomeasure several metallicity indicators, such as Mg2, Mgb,Fe5270, Fe5335, and the composite index [MgFe]′, which isdefined as:
[MgFe]′ ≡√
Mgb (0.72∗Fe5270+ 0.28∗Fe5335)
In the local universe, [MgFe]′ seems to be insensitive to vari-ations inα–element abundance(Thomas et al. 2003), makingit a valuable tracer of total metallicity.
Where possible, we adopt the Lick index definitions to mea-sure the strength of each spectral line (Worthey et al. 1994).In the Lick system, the equivalent width of a line is measuredby defining a wavelength range to either side of a main indexbandpass. The mean level of each sideband is determined,

8
and a straight line is fit, defining the “pseudo-continuum”across the index bandpass. The equivalent width of the linewithin the index bandpass is then measured with respect tothe pseudo-continuum level. The Lick system does not in-clude an index for [OII], so we adopt the one defined byFisher et al. (1998). In Figure 1 we plot an example spec-trum with the wavelength ranges of several indices and theirsidebands marked. For clarity, the results in § 4 will concen-trate primarily on three representative sets of measurements:[OII], (HγA+HδA), and [MgFe]′.
Table 3 lists the strengths of several key spectral lines, forall 104 galaxies in our sample. These raw indices are suitablefor examining environmental trends within our own data set,but in order to make a proper comparison to other publisheddata or theoretical models, we must carefully correct for anysystematic differences between each set of measurements. Inparticular, index strengths are known to vary with the spectralresolution of the data. While we attempt to compare our dataonly to measurements made at high spectral resolution, to takefull advantage of the high resolution available with DEIMOS,in some cases we are forced to degrade the resolution of ourspectra to match that of the comparison data or model.
In § 4 and § 5, we will compare some of our results tothe stellar population models of Bruzual & Charlot (2003),which include full synthetic spectra at a resolution of 3Å;this is the closest match available to the intrinsic resolutionof our DEIMOS spectra (∼ 1Å). We will also examine theBalmer–σ relation in comparison to data measured at 10Åresolution (Kelson et al. 2001), the approximate resolution ofthe original Lick system (Worthey et al. 1994). Therefore, weconvolved our DEIMOS spectra with Gaussians to producedegraded spectra at both 3Å and 10Å resolutions. We thenre-measured the relevant spectral line indices. While not in-cluded in Table 3, spectral index measurements from our de-graded DEIMOS spectra are available from the authors by re-quest.
To compare our Balmer–σ relation to previous workby Kelson et al. (2001) on the redshift evolution of thiscorrelation, we apply an aperture correction to our HδA andHγA line strengths; we adopt their estimate that the quantity(HδA + HγA) varies with aperture as:
∆ (HδA + HγA) = 1.78±0.16∆ log(
Dap)
and correct to an aperture of 1.′′23 atz= 0.33. This is a verysmall correction to our data, which was measured through asimilar aperture size at slightly higher redshift.
For any fixed-width absorption line index, Doppler broad-ening of lines will cause measured equivalent widths to beunderestimated: as velocity dispersion increases, more oftheline’s flux falls outside of the index bandpass. We can correctfor this effect by modeling how each index varies withσ, withthe help of the Bruzual & Charlot (2003) population synthe-sis models. We select several of their theoretical spectra at 3Åresolution and zero velocity dispersion, and broaden them toa series of different velocity dispersions. At eachσ, we mea-sure the line indices we wish to correct: [MgFe]′, HδA, andHγA. We then fit a quadratic function inσ to the resulting setof measurements. We find that theσ correction depends onthe initial resolution of the spectrum, so we also degrade theBruzual & Charlot (2003) spectra to 10Å resolution, and re-peat the procedure to determine the proper correction for ourlow-resolution measures ofHδA andHγA.
Since we are not able to measure velocity dispersions forour full sample of 104 galaxies, corrected indices only appearin plots that are limited to the 71 bright galaxies where wehave accurate measurements ofσ. All plots that demonstratetrends in the full sample of 104 E+S0s are shown with un-corrected indices only. However, not applying aσ correctionin these cases produces only a small error: less than±0.8Åin (HδA + HγA). Emission lines like [OII] do not vary regu-larly with σ, as the source of emission is generally not spreadevenly across a galaxy.
In order to compare observed spectral line strengths tothe predictions of Bruzual & Charlot models with variousstar formation histories, we need to calibrate our observed[OII] equivalent widths to specific star formation rates(M⊙/Mgal yr−1). We make such a calibration using the deepHα imaging of Cl 0024 by Kodama et al. (2004, and privatecommunication). First, equivalent widths from the twocatalogs are cross-correlated: our [OII] widths closely trackthose in Hα, approximately reproducing the locally-observedtrend (Kennicutt 1992). For each Hα detection, Kodama alsoprovide an estimated star formation rate, which we convertto a specific star formation rate by dividing by an estimatedmass for each member. For galaxies with velocity dispersionsavailable, we calculate a galaxy’s dynamical mass accordingto M = 5σ2RE/G. To estimate a stellar mass for a galaxy withno available velocity dispersion, we first determine the typicalM/LV for a local galaxy of this luminosity from Gerhard et al.(2001), and correctM/LB to M/LV by subtracting a factorequal to log(M/LV) − log(M/LB) = −0.06, estimated from thetypical colors of nearby early type galaxies. We then correctfor redshift evolution inM/LV (based on our FundamentalPlane results below), and multiply by the observed luminosityof the galaxy:
log(M) ≃ log(M/LV)+ < ∆ log(M/LV) > + log(LV)
For galaxies with velocity dispersions, masses estimatedin this way are consistent with the calculated dynamicalmasses (∆ log(M/M⊙) = ±0.3). We then fit a straightline to measured [OII] versus specific star formation rate(M⊙/Mgal yr−1), to yield a conversion relationship betweenthe two.
In order to visualize overall trends in the spectral propertiesof cluster early types, we also produce a series of co-addedspectra for each radial zone. Each spectrum is normalized,shifted to the rest frame, and then co-added. Bad pixels andsky lines are given zero weight in the addition. This methodprovides a snapshot of what the average spectrum of each en-semble of galaxies looks like. While weighting by luminos-ity would better represent the integrated stellar population ofeach ensemble, in practice, the co-added spectrum is domi-nated by the brightest galaxy in each group. We must be care-ful, however, in interpreting differences between the coaddednormalized spectra for each radial zone: each coadded spec-trum will reflect an ensemble of galaxies with a different av-erage size and magnitude. Therefore, it is difficult to sepa-rate radial trends in the spectra from trends with magnitudeorsize. These co-added spectra will be discussed below in con-junction with the environmental trends in the spectral indicesof individual galaxies.
4. RESULTS
4.1. Cluster: Empirical Scaling Laws

9
FIG. 5.— FP of Cl 0024, compared to Coma cluster (solid line). Symbols represent different morphologies, as indicated. Dotted lines correspond to theexpected shift in FP zero point from Coma toz∼ 0.4, for SSP models withzf = 2.0,3.0,6.0.
Before we examine environmental trends in galaxy prop-erties, we present the overall Fundamental Plane, [MgFe]′–σrelation and the Balmer–σ relation for the cluster sample withhigh quality spectra, and discuss how each has evolved be-tweenz∼ 0.4 and the present epoch.
4.1.1. The Fundamental Plane
Previous studies have traced a mild shift in the interceptof the cluster FP with redshift (Fritz et al. 2005; Wuyts et al.2004; Kelson et al. 2000b). This seems to be consistent withpassive luminosity evolution of stellar populations with ahighredshift of formation (Wuyts et al. 2004), though biases dueto morphological evolution are difficult to quantify. How-ever, most earlier studies have concentrated on measuring theevolution of the FP from data taken in intermediate or highredshift cluster cores. With our broader spatial coverage,wecan uncover any significant difference in the meanM/LV ofearly types as a function of radius. Our sample also extends tofainter magnitudes than previous studies atz∼ 0.4, allowingus to probeM/LV for smaller early-types that perhaps formedlater than the most massive cluster ellipticals.
Figure 5 presents the FP of Cl 0024 compared to that ofthe Coma cluster, adopting the parameters determined locallyby Lucey et al. (1991):α = 1.23, β = 0.328, andγ = −8.71,where the fundamental plane is defined as
Log(Re) = αLog(σo) + β 〈µV〉+ γ
If we assume for the moment thatα andβ remain fixed with
redshift–i.e., that E+S0s evolve passively– then we can relatethe offset in the interceptγ between CL 0024 and Coma tothe change in the mean mass to light ratio of cluster earlytypes sincez= 0.4:
⟨
∆ log(
M/LV
)⟩
= 〈∆γ〉/ (2.5β)
We find that the average offset from the Coma FP impliesa change in theM/LV ratio betweenz = 0.4 andz = 0.02 of⟨
∆ log(
M/LV)⟩
= −0.14±0.02, excluding galaxies with ve-locity dispersions below 100 km s−1. (Including those galax-ies, the zero point shift rises to
⟨
∆ log(
M/LV)⟩
= −0.18±0.03) This is a smaller evolution than found in the fieldat z ∼ 0.3 − 0.5 by Treu et al. (2005b),
⟨
∆ log(
M/LV)⟩
=−0.23± 0.05, though it is in agreement with the offset de-termined by Kelson et al. (2000b) for a cluster atz = 0.33(⟨
∆ log(
M/LV)⟩
= −0.17± 0.03). Overplotted in Figure 5are dotted lines representing the expected evolution of theFPzero point from the Coma cluster back toz= 0.4. These arebased on the passive evolution of Single Stellar Population(SSP) galaxy models, with a redshift of formation,zf , of 2, 3,or 6 (Bruzual & Charlot 2003). The observed FP in Cl 0024is consistent withzf > 3 for most cluster early types.
Open squares in Figure 5 indicate points fromvan Dokkum & Franx (1996), who also measured theFP in Cl 0024. The two sets of data fall on the same plane,and our inferred
⟨
∆ log(
M/LV)⟩
is consistent with theirwork: they calculated
⟨
∆ log(
M/LV)⟩
= −0.12± 0.03 Ourmuch larger sample should allow for greater precision in

10
TABLE 4⟨
∆ log(
M/LV)⟩
FOR SEVERAL SUBSETS OF OUR DATA.
E E/S0 S0 All All+vDF
All σ:N: 24 10 35 69 77
⟨
∆ log(
M/LV)⟩
: −0.18±0.05 −0.23±0.08 −0.14±0.03 −0.18±0.03 −0.18±0.02±1σ: 0.23 0.26 0.20 0.20 0.19
σ > 100kms−1:N: 21 8 33 62 70
⟨
∆ log(
M/LV)⟩
: −0.14±0.03 −0.14±0.06 −0.14±0.03 −0.14±0.02 −0.14±0.02±1σ: 0.15 0.17 0.18 0.16 0.16
R < 1Mpc, σ > 100kms−1:N: 10 6 15 31 39
⟨
∆ log(
M/LV)⟩
: −0.09±0.06 −0.10±0.06 −0.06±0.06 −0.07±0.03 −0.09±0.03±1σ: 0.18 0.16 0.22 0.20 0.19
NOTE. — The first three columns present the mean evolution inM/LV broken down by morpho-logical type, both with and without galaxies ofσ < 100 km s−1, and for the whole cluster sample orjust galaxies with projected radiusR< 1 Mpc. Column four includes all our E+S0s, but excludes twodisturbed-morphology galaxies with outlying values of∆ log
(
M/LV)
. In the fifth column, we addour data to the eight galaxies from van Dokkum & Franx (1996) that do not overlap with our own.±1σ values are logarithmic, representing the scatter in∆ log
(
M/LV)
.
calculation of the FP zero point, yet the two measurementsyield similar uncertainties in
⟨
∆ log(
M/LV)⟩
. This is due tothe surprisingly high scatter that we uncover in the Cl 0024FP, which was not apparent in the earlier sample of 9 galaxiesin van Dokkum & Franx (1996).
Importantly, we find the intrinsic scatter in the FP ofCl 0024 is 40% inM/LV , significantly higher than the∼ 20%found locally (e.g. Jørgensen, Franx, & Kjærgaard 1996), andalso higher than the∼ 13% scatter in the FP of Cl 1358+62 atz = 0.33 (Kelson et al. 2000b). While we probe the FP for alarger range of galaxy masses than Kelson et al. (2000b), wesee a higher scatter even in the more massive galaxies thatare comparable to those in their study. Interestingly, thisin-creased scatter is due almost entirely to an enhanced scatter inM/LV for galaxies within the inner 1 Mpc of the cluster, a re-gion that has been well studied in other clusters in this redshiftrange (Bender et al. 1998; Kelson et al. 2000b; Ziegler et al.2001). To verify this increased scatter is a true physical ef-fect, we examined the possibility that errors in our surfacephotometry are higher in the more crowded cluster core, butfound that galaxies with nearby neighbors cannot account forthe high scatter. We also checked for errors in our velocity dis-persion measurements: when removing five early type spec-tra (σ > 100 km s−1) with S/N < 10 from our high qualitysample, we find no significant change in our FP zero point orscatter.
A similarly large scatter was found by Wuyts et al. (2004)for the cluster MS 2053-04 atz= 0.58 (∼ 42%), so this may bean effect seen only in some fraction of intermediate redshiftclusters. At even higher redshift, Holden et al. (2005) findsalarge scatter inM/LB for massive early types at< z>= 1.25.We will defer further discussion of this effect to § 4.2, wherewe discuss radial trends.
Recent results indicate that the parameters of the FPat intermediate redshift may differ from the local val-ues (e.g. Treu et al. 2005a,b, Wuyts et al. 2004;van der Wel et al. 2005). We investigated using the methodof Jørgensen, Franx, & Kjærgaard (1996) to derive an inde-
pendent fit for the parameters of the FP from our sample,including Montecarlo simulations to account for bias in ourmagnitude-limited sample, but found no conclusive evidencefor a change in FP parameters from the local values.
Nevertheless, the group of galaxies withσ < 100 km s−1
in Figure 5, located at the lower left of the plot, seem to de-viate significantly from the FP. As most calculations of theFP parameters specifically exclude galaxies withσ < 100 kms−1 (e.g. Jørgensen, Franx, & Kjærgaard 1996; Lucey et al.1991), including our own, it is not surprising that such galax-ies in our sample deviate from the FP. Yet there is also ev-idence that, in the local universe, these small ellipticalsanddwarf ellipticals may behave differently as a population thanlarger E+S0s (e.g. Burstein et al. 1984). Our data suggest thatthis population split may have existed already atz∼ 0.4. SWhen dividing our sample into three subclasses (E, S0, andE/S0), we find no evidence of significant variation betweenthe populations, either in scatter or intercept. Table 4 listsvalues of
⟨
∆ log(
M/LV)⟩
and the scatter about the mean forseveral different subsamples of our data. For galaxies withσ > 100 km s−1 in particular, there appears to be no vari-ation at all between E, E/S0, and S0 morphological types.This lack of variation is in disagreement with recent resultsby Fritz et al. (2005), who marginally detect a difference be-tween ellipticals and S0s in two clusters atz∼ 0.2, equivalentto a difference inδ
⟨
Log(
M/LV)⟩
of∼−0.16±0.11 (with S0sbeing the younger/more luminous population). On the otherhand, Kelson et al. (2001) find no such distinction between el-lipticals and S0s atz= 0.33. Our sample is larger than eitherof these other studies, and so we place stronger constraintsonthe possibleM/LV variations between Es and S0s atz∼ 0.4.As discussed in§2, we attempted to improve our E:S0 classi-fication by examining residuals from our surface photometryfits as a means of locating faint disks or bars (See Figure 4).Two of us (RSE and TT) independently examined the resid-uals and, although the revised classes agreed fairly closely,no significant FP differences between ellipticals and S0s werefound.

11
4.1.2. [MgFe]′–σ and Balmer–σ relations
While the FP helps to connect the dynamic and photo-metric structure of an early type galaxy to the overall massto light ratio of its stellar population, we can seek an im-proved picture of a galaxy’s stellar population by also ex-amining correlations between spectral line strengths andσ.Local early type galaxies exhibit a tight correlation betweentheMg2 line index andσ, for example (e.g. Kuntschner et al.2001). The narrowerMgb index is centered over the samespectral feature, and, at least locally, behaves in the samewayasMg2(Burstein et al. 1984). Similarly, correlations are ob-served betweenσ and the strengths of several Balmer lines:Hβ, Hγ and Hδ (Kelson et al. 2001; Kuntschner et al. 2001).
Our current set of high quality spectra of early types inCl 0024 provides a large sample of galaxies atz∼ 0.4 wherediagnostic spectral lines can be measured with some accuracyfor the first time. We measureMgb, Mg2 and the compos-ite index [MgFe]′ to make a broad comparison between themetallicity features of early types at intermediate redshift andthose seen locally.
We also measure Balmer line strengths, which are com-monly used to judge the age of early type galaxies(Worthey & Ottaviani 1997). However, low levels of recentstar formation can make an early-type galaxy’s stellar popu-lation appear much younger than the true average age of itsstars. For the first 1 Gyr after a starburst, the strong Balmerabsorption present in the spectra of A stars can be prominentin the integrated galaxy spectrum. The Hβ index is a particu-larly age-sensitive indicator, but is affected by contaminationfrom emission. While Hα can be used to correct Hβ for smallamounts of emission, this line falls outside of the range of ourspectra, so we choose to study the Hδ and Hγ lines instead,which are relatively unaffected by emission. Measuring Hδand Hγ in Cl 0024 can thus allow us to probe both galaxy ageand episodes of recent star formation, if the two effects canbeseparated.
Early attempts to trace the evolution of these relations withredshift has produced a variety of results. Kelson et al. (2001)reported a correlation between (Hδ+Hγ) and σ for severalclusters between redshifts of 0.08 and 0.83. The slope theymeasure for Cl 1358+62 atz = 0.33 is consistent with theirdata at all other redshifts, though they are unable to measureslope for each cluster individually. They plot the zero pointevolution of this relation, and find that the change in meanBalmer absorption strength fromz= 0.83 to the present epochis consistent with passive evolution models of early types,andconstrainzf > 2.4. Likewise, Barr et al. (2005) study a poorcluster atz= 0.28 and find that the zero point evolution of the(Hδ+Hγ)–σ relation, when compared to Kelson et al. (2001),is only marginally inconsistent with passive evolution.
Conversely, the evolution of the metallicity correlationshasproven more complicated. The question of using spectral linestrengths to uniquely determine ages, metallicities, andα-element enhancement ratios for elliptical galaxies is not yetsolved even for local galaxies, as made clear by the excellentstudy of the problem by Tantalo & Chiosi (2004). Further,our data likely fall short of theS/N needed to determine thesegalaxy properties reliably (Trager et al. 1998). It is thereforebeyond the scope of this paper to examine how the variousMg–σ, [MgFe]′–σ and Balmer–σ relations evolve with red-shift.
However, we note that correlations with velocity dispersiondo exist as far back asz∼ 0.4, regardless of the origin of
FIG. 6.— Top: [MgFe]′–σ at resolution of 3Å. The solid line is thebest least-squares fit to our data, excluding the outlier points atσ ≥ 300 kms−1. Bottom: (Hγ +Hδ)–σ at resolution of∼ 10Å, compared to Kelson et al.(2001), at same spectral resolution. Indices are correctedto match the aper-ture used by Kelson et al. The solid line represents the best-fit relation fromKelson et al. (2001). We adopt the slope of their relation, but calculate theintercept atz = 0.4 by interpolating between their data points atz= 0.33 andz = 0.58. The dashed line is the line of best fit to our data. The scatter islarge, so our best-fit relation is highly uncertain. In both panels, velocity dis-persions are aperture corrected to a 3.′′4 diameter aperture at the distance ofthe Coma cluster.
such a relation. Secondly, large deviations from these rela-tions may indicate a recent episode of star formation in thatgalaxy. It will be useful then to look later at the residualsfrom the [MgFe]′ and Balmer–σ relations, as a function ofcluster environment.
We can minimize uncertainties due to variations in abun-dance ratio by focusing on the [MgFe]′ index, which shouldprovide a reliable estimate of the total metallicity of a galaxy(Thomas et al. 2003). Figure 6 presents the correlation be-tween [MgFe]′ and σ. The bulk of galaxies measured fallalong the solid best-fit line plotted, though the scatter is high.The high scatter could be due to the large error bars on eachmeasurement. However, there are a significant number of out-liers with anomalously low [MgFe]′ that seem not to be dueto measurement errors. These outliers correlate with otherproperties of the each galaxy’s stellar population, and will bediscussed further in § 5.
Figure 6 presents (Hδ+Hγ) vs. σ for Cl 0024. The twoquantities correlate in the sense that the largest, highestσgalaxies exhibit the weakest Balmer absorption. This is asexpected if the stellar populations are oldest in the largest el-liptical galaxies. Overplotted in Figure 6 is the best-fit rela-tion from Kelson et al. (2001), where we adopt their slope andinterpolate between their points atz= 0.33 andz= 0.58 to de-termine the zero point atz= 0.39. Our data is consistent withtheir findings, though again our scatter is quite large. We alsooverplot our best fit relation as a dotted line, though the highscatter makes this relation highly uncertain.
In fact, just as we saw with the FP of Cl 0024, we see a

12
scatter that is much larger than that observed in Cl 1358+62at similar redshift. Both the FP and (Hδ+Hγ)–σ relation arereported to be much tighter for Cl 1358+62 than for Cl 0024(Kelson et al. 2001, 2000b). On the other hand, Barr et al.(2005) also find an increased scatter in the (Hδ+Hγ)–σ rela-tion atz= 0.28, though they do not measure the FP. As withthe FP and Metallicity–σ relation in Cl 0024, some of the en-hanced scatter we observe in Balmer line strengths is a directsignature of environmental evolution, and will be discussed in§ 4.2.3 below.
4.2. Radial Trends
We now turn to discuss environmental trends present in theearly type population of Cl 0024. For the brighter sample ofgalaxies with high quality spectra, we can analyze the residu-als from the empirical scaling laws presented in § 4, and lookfor variations with local density, cluster radius, or galaxy lu-minosity. For the full sample of galaxies toI = 22.5 we addi-tionally examine the environmental variations in several keyspectral lines.
Paper I in this series found that local density was the pri-mary measure of environment outside of the cluster core, sug-gesting that infalling groups are the logical unit out of whichclusters are built. Looking at the detailed spectral propertiesof early-types now, it would be useful to determine whetherspectral properties depend more closely on local density, asthe morphological mix seems to, or on radius. Because we areonly tracing a much smaller population of 104 galaxies of asingle morphological class, we are unable to make such a dis-tinction reliably. We will, however, present plots of spectralfeatures as a function of both R andΣ10. Because projectedradius R is more easily measured thanΣ10, we will focus ourdiscussion on radial trends. Anticipating the results, we notethat the observed trends with R andΣ10 are qualitatively sim-ilar.
4.2.1. Fundamental Plane
The high scatter about the FP of Cl 0024, discussed in§ 4.1 above, leads us to examine∆Log
(
M/LV)
on a galaxyby galaxy basis. For an individual early type (labeled bysubscript i), the evolution in M/LV with respect to theprediction of the local FP is related to its offset from the localinterceptγ according to:
∆γ i = logRie− α logσi − βµi
V − γ
and
∆ log
(
MLV
)i
= −∆γ i
2.5β
In Figure 7, we plot∆Log(
M/LV
)
as a function of projectedradius and local density. Both plots show a trend toward in-creased scatter near the cluster core, at small radius and highdensities.
In the radial plot, the open triangles overplotted representthe mean∆Log
(
M/LV)
for galaxies within each of the threeradial zones delimited by dotted lines: cluster core (R < 1Mpc), transition region (1≤ R < 2.4 Mpc), and periphery(R≥ 2.4 Mpc). These three zones were introduced in Pa-per I, and represent regimes where different physical mech-anisms may be effective in transforming galaxies. We seea clear trend of increasingly negative∆Log
(
M/LV)
as wemove outward, indicating that galaxies are more luminous for
FIG. 7.— Change inM/LV ratio for galaxies in Cl 0024, with respect to〈M/LV〉 for Coma. Plotted with respect to radius, top, and local density, bot-tom. Asterisks represent individual galaxies, with a typical error bar shownon a point near the lower left of each plot. For the upper plot,open trian-gles represent averages for the three radial zones indicated. Large error barsreflect the rms scatter, and small bars are the error on the mean. Filled dia-monds are points from van Dokkum & Franx (1996) and Treu et al.(2005b)for cluster core and field, respectively. Dotted lines at 1 Mpc and 2.4 Mpc de-limit the three radial zones discussed in the text; corresponding dotted lines inthe local density plot represent the mean values ofΣ10 at 1 Mpc and 2.4 Mpc,respectively.
their mass, and hence appear younger, at larger distances fromthe cluster center.
Galaxies marked with a filled triangle in Figure 7 haveσ < 100 km s−1. These, along with two disturbed-morphologygalaxies marked with filled circles, are not included in the cal-culation of the means for each radial zone. The low–σ galax-ies are likely biased toward lowM/LV , due to the selectioneffect where only the brightest of the small, compact clustermembers are within our limiting magnitude.
The solid diamond plotted within 1 Mpc on Figure 7 is themean∆Log(M/LV) found by van Dokkum & Franx (1996);

13
it is clear now why our mean value of∆Log(M/LV) isslightly larger than theirs: the additional contribution fromlower M/LV galaxies in the transition region and peripheryboost the mean luminosity evolution we calculate. It is in-teresting also to note that our new wide-field data bridgesthe gap between the mass to light ratios typical of clus-ter cores and those found in the field at this redshift. Theother solid diamond plotted in Figure 7, labeled “Field”,is from Treu et al. (2005b), who measured the FP of fieldgalaxies at intermediate redshift. Similar values for thefield are reported by Treu et al. (2001a) and van der Wel et al.(2005). While some studies of the field FP at intermedi-ate redshift have reported a slower redshift evolution (e.g.Ziegler et al. 2005; van Dokkum & Franx 2001; Rusin et al.2003), van der Wel et al. (2005) have shown that most of thediscrepancy between studies of field early types can be at-tributed to differences in analysis methods and selection crite-ria. Since the reported variations are small on the scale of Fig-ure 7 (less than±0.1 in log(M/LV)), we can be confident that〈M/LV〉 does actually vary with environment at intermediateredshift. This gradient in〈M/LV〉 across the cluster appearsto directly reflect the difference in formation history betweengalaxies in high and low density environments.
Within the cluster core, the scatter in∆Log(M/LV) is high-est, as noted above in § 4. We caution that projection effectscould contribute to the apparent scatter near the cluster cen-ter, especially if there is a strong gradient inM/LV with 3Dradius, r. However, for any sensible distribution, we wouldexpect that the number of true core members is higher thanthose at large radii projected upon the core. As we see ap-proximately equal numbers of galaxies both above and belowthe mean∆Log
(
M/LV)
in the core, we conclude that projec-tion effects cannot account for the increased scatter. Thisisconfirmed by Kolmogorov–Smirnov tests that compare vari-ous simulated distributions of galaxies to our observed distri-bution.
Similarly, we find no evidence that the high- or low-M/LV early types in the core are part of an infalling group;∆Log
(
M/LV)
appears uncorrelated with the velocities orspatial distribution. It has been hypothesized that Cl 0024iscurrently undergoing a face-on merger with a large group, asindicated by the double-peaked redshift distribution firstre-ported by Czoske et al. (2002), and replicated in the redshiftdistribution of Figure 2. However, none of the galaxies on ourFP lie in the secondary “Peak B”. While the high scatter maystill be related to the subcluster merger, whatever mechanismaffects the mass to light ratios of early-types in the cluster coreis not apparent in any other measurements.
Although the observed scatter seems at variance with thenotion that massive cluster ellipticals are uniformly old andquiescent, if we use the Bruzual & Charlot (2003) SSP mod-els to predict the passive evolution of these galaxies toz= 0,the resulting scatter will match that observed locally. Further-more, the scatter in the field FP reported by Treu et al. (2005b)in this redshift range is larger than in the core of Cl 0024, asexpected if the range in ages and star formation histories isgreater in the field than in the cluster environment.
There may be two separate populations of E+S0s in thecore, then: older galaxies that formed earliest and which haveM/LV already similar to that of local E+S0s, and galaxies witha lowerM/LV which have more recently fallen into the clus-ter core. While there is no obvious separation between thesetwo groups in Figure 7, we do notice a residual correlation
between∆Log(M/LV) andσ, in the sense that the most mas-sive, highest–σ cluster galaxies also have the highest mass tolight ratios, indicating the oldest stellar populations. This isnot a surprising correlation, but it does confirm that the highM/LV galaxies are typically the oldest and largest found inthe cluster. It is also in agreement with a more general trendidentified by Treu et al. (2005a), who found that less massivegalaxies exhibit a younger luminosity-weighted age than dothe most massive ones.
It is important to note, however, that the radial trend ob-served in∆Log
(
M/LV)
is not due solely to this “downsizing”relation between galaxy mass andM/LV . There is still a radialgradient inM/LV , even when we further restrict our sampleto a narrow range of galaxy masses2. For example, if we limitour sample to the mass range 10.9< Log(M/M⊙) ≤ 11.4, weobserve a significant difference inM/LV between the clusterperiphery and core:δ < Log(M/LV) >= 0.13± 0.07. Usingfield galaxies from the Treu et al. (2005b) sample within thissame mass range (and in the redshift range 0.3 < z< 0.5), wefind an offset between the Cl 0024 cluster core and the fieldequal toδ < Log(M/LV) >= 0.09± 0.06. The lower masslimit was chosen because galaxies aboveLog(M/M⊙) = 10.9are negligibly biased due to the luminosity limit of both sur-veys. The upper mass limit is chosen so that we include onlygalaxies that are well-represented across the entire cluster, ex-cluding the high-mass galaxies found only in the core.
It makes sense to search for morphological differences be-tween the old and young E+S0s in the cluster core. The exis-tence of the morphology–density relation in Cl 0024 (Paper I)leads us to consider whether the younger, lowM/LV galaxiesare preferentially S0s that have recently been created or trans-formed from spirals. However, when we divide our sampleinto groups that lie above and below the meanM/LV in thecluster core, we see no evidence for morphological segrega-tion.
In the second paper in this series on Cl 0024, Kneib et al.(2003, hereafter, Paper II) estimated the global mass to lightratio of the cluster as a function of radius, by combining amass map based on their gravitational lensing analysis withKS-band observations which trace the stellar mass. They con-cluded that the overallM/L of the cluster is remarkably flat,at least within 2 Mpc of the cluster core.(Their result was thesame whether they measured total light via K or rest-frameV observations.) At first glance, the radial gradient inM/LVseen in Figure 7 may appear to contradict the results of Pa-per II. However, thecluster M/L ratio measured in Paper II ismuch more strongly dominated by dark matter than theearlytype galaxy M/LV discussed here, and so variations in massto light ratios of individual galaxies can be consistent with anoverall clusterM/LV that is constant.
4.2.2. Line Strengths
In the next two sub-sections, we will consider environmen-tal trends in several different indicators of star formation andmetallicity, in both our high-quality sample of galaxies andthe full sample toI = 22.5. It is important to gauge the ef-fect of any recent star formation on the overallM/LV of thesegalaxies, to ensure that we can correctly attribute differencesin M/LV to differences in mean galaxy age, rather than theeffects of relatively recent and small star forming events.We
2 We calculate a galaxy’s dynamical mass, in solar units, according toM = 5σ2Re/G, which is equal toM = 1162σ2
0Re, with Re in pc andσ0 inkm s−1.

14
also wish to trace the star formation itself, as any significantstar formation in early-type galaxies can act as a signpost tothe different physical mechanisms that could be at work.
We focus on two key indicators of star formation, the [OII]emission line, and the combination (Hδ+Hγ), which respec-tively measure ongoing star formation, and recently com-pleted star formation, as discussed in § 3. Figure 8 plots theequivalent widths of these two diagnostic indices as a func-tion of radius and local density. Solid symbols indicate galax-ies with I ≤ 21.1; we note that some of these brighter galax-ies do not have measured velocity dispersions, and so werenot included in the high quality sample discussed in previoussections. Open symbols are galaxies in the magnitude range21.1 < I ≤ 22.5. As we saw with the FP, we note that thestrengths of these indices vary in a similar way with both lo-cal density and projected radius.
Examining individual measurements of EW([OII]), we finda population of galaxies with strong emission, which are con-centrated in a narrow range in radius, close to the Virial ra-dius at 1.7 Mpc. The spectra of these galaxies are domi-nated by emission lines, including [OIII] and several Balmerlines. (See Figure 11). These emission line galaxies are pref-erentially dim; as denoted by the un-filled pentagons in Fig-ure 8, most are in the magnitude range 21.1< I ≤ 22.5. Mostprevious studies have not been sensitive to early-type clustergalaxies at these luminosities and in this radius range, thougha recent survey of a cluster atz = 0.83 by Homeier et al.(2005) has uncovered a similar population of dim emission-line E+S0s, discussed in more detail in § 5.
What could be the nature of these emission line galaxiesclustered in radius? While we leave most of the discussionof this question to § 5, we can quickly address some of thepossibilities. Figure 9 shows postage stamp images of each ofthese active galaxies. The top row contains the three emissionline galaxies withI < 21.1; one of these may be interactingwith a neighbor, though the redshift of the neighboring galaxyis not known. None of the others seem to be undergoing ma-jor mergers, so merger-induced star formation is ruled out as acause of emission. One other bright [OII]-emitter could possi-bly be a misclassified spiral. We looked at the residuals fromsurface photometry fits for the rest of these galaxies, but foundno other indication of spiral arms. Seven of these ten galaxiesare also detected by theHα imaging survey of Kodama et al.(2004), and two of the three non-detections have redshifts thatwould likely place theHα line outside the bandwidth of thenarrow-band filter employed by Kodama et al.
Line ratio tests meant to distinguish between star formationand AGN activity are inconclusive for these galaxies. XMM-Newton observations are available which cover a field includ-ing most of these emission line early types: none are asso-ciated with an X-ray point source (Zhang et al. 2005), eventhough the XMM-Newton observations are deep enough todetect any clear-cut AGN withLX > 1042 erg s−1. There-fore, while we cannot rule out AGN activity for these galax-ies, none are definitively AGN. An interesting hypothesis thatwe will explore in § 5 is that these galaxies have suffered ha-rassment or disturbances from their interaction with the intra-cluster medium (ICM).
In addition to the emission line galaxies, we see a highermean EW([OII]) at larger radius. Figure 11 shows the coad-ded normalized spectra of all early-types binned by radialzone; top to bottom, they trace the mean early-type spectrumfrom the periphery to the core. All galaxies with EW(OII)
FIG. 8.— HδA+HγA and [OII] EWs for all E+S0 members as function ofradius (top) and local density (bottom). Negative values represent emissionin [OII], but can be considered weak absorption for the Balmer lines, due toan effect where the continuum flux in the index sidebands falls completelybelow the flux in the index bandpass. In the upper plot, dottedlines delineatethe core, transition region, and periphery. Dotted lines inthe lower plot markthe mean values of the local density at these same radii. Opensymbols:21.1 < I < 22.5. Filled symbols:I < 21.1.
< −15Å were coadded separately; see Figure 11, right. Co-added spectra of ‘normal’ E+S0 members in Figure 11 showan increase in an average galaxy’s OII emission outside of thecluster core. This trend is qualitatively similar to radialgra-dients in emission line strength seen for samples of clustergalaxies that include all morphologies, both at intermediate(e.g. Gerken et al. 2004) and low redshift (Gómez et al. 2003;Lewis et al. 2002, e.g.).
In Figure 10, we plot the fraction of all E+S0 galaxies with
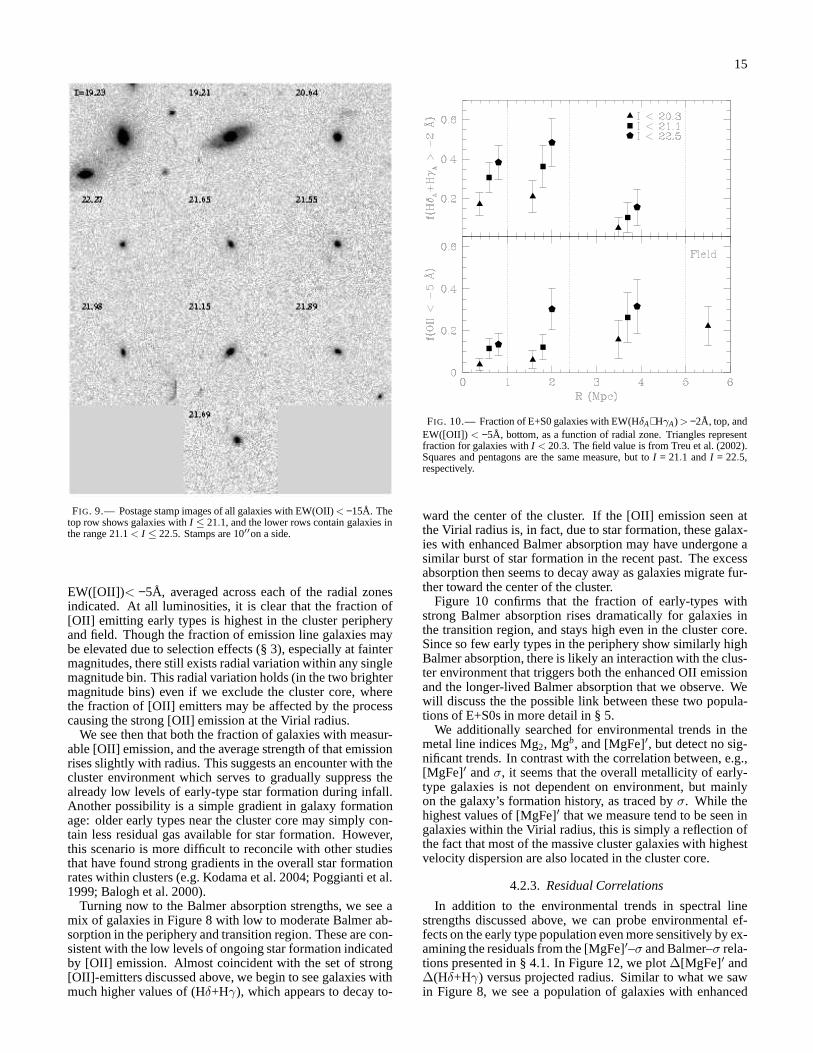
15
FIG. 9.— Postage stamp images of all galaxies with EW(OII)< −15Å. Thetop row shows galaxies withI ≤ 21.1, and the lower rows contain galaxies inthe range 21.1 < I ≤ 22.5. Stamps are 10′′on a side.
EW([OII])< −5Å, averaged across each of the radial zonesindicated. At all luminosities, it is clear that the fraction of[OII] emitting early types is highest in the cluster peripheryand field. Though the fraction of emission line galaxies maybe elevated due to selection effects (§ 3), especially at faintermagnitudes, there still exists radial variation within anysinglemagnitude bin. This radial variation holds (in the two brightermagnitude bins) even if we exclude the cluster core, wherethe fraction of [OII] emitters may be affected by the processcausing the strong [OII] emission at the Virial radius.
We see then that both the fraction of galaxies with measur-able [OII] emission, and the average strength of that emissionrises slightly with radius. This suggests an encounter withthecluster environment which serves to gradually suppress thealready low levels of early-type star formation during infall.Another possibility is a simple gradient in galaxy formationage: older early types near the cluster core may simply con-tain less residual gas available for star formation. However,this scenario is more difficult to reconcile with other studiesthat have found strong gradients in the overall star formationrates within clusters (e.g. Kodama et al. 2004; Poggianti etal.1999; Balogh et al. 2000).
Turning now to the Balmer absorption strengths, we see amix of galaxies in Figure 8 with low to moderate Balmer ab-sorption in the periphery and transition region. These are con-sistent with the low levels of ongoing star formation indicatedby [OII] emission. Almost coincident with the set of strong[OII]-emitters discussed above, we begin to see galaxies withmuch higher values of (Hδ+Hγ), which appears to decay to-
FIG. 10.— Fraction of E+S0 galaxies with EW(HδA+HγA) > −2Å, top, andEW([OII]) < −5Å, bottom, as a function of radial zone. Triangles representfraction for galaxies withI < 20.3. The field value is from Treu et al. (2002).Squares and pentagons are the same measure, but toI = 21.1 andI = 22.5,respectively.
ward the center of the cluster. If the [OII] emission seen atthe Virial radius is, in fact, due to star formation, these galax-ies with enhanced Balmer absorption may have undergone asimilar burst of star formation in the recent past. The excessabsorption then seems to decay away as galaxies migrate fur-ther toward the center of the cluster.
Figure 10 confirms that the fraction of early-types withstrong Balmer absorption rises dramatically for galaxies inthe transition region, and stays high even in the cluster core.Since so few early types in the periphery show similarly highBalmer absorption, there is likely an interaction with the clus-ter environment that triggers both the enhanced OII emissionand the longer-lived Balmer absorption that we observe. Wewill discuss the the possible link between these two popula-tions of E+S0s in more detail in § 5.
We additionally searched for environmental trends in themetal line indices Mg2, Mgb, and [MgFe]′, but detect no sig-nificant trends. In contrast with the correlation between, e.g.,[MgFe]′ andσ, it seems that the overall metallicity of early-type galaxies is not dependent on environment, but mainlyon the galaxy’s formation history, as traced byσ. While thehighest values of [MgFe]′ that we measure tend to be seen ingalaxies within the Virial radius, this is simply a reflection ofthe fact that most of the massive cluster galaxies with highestvelocity dispersion are also located in the cluster core.
4.2.3. Residual Correlations
In addition to the environmental trends in spectral linestrengths discussed above, we can probe environmental ef-fects on the early type population even more sensitively by ex-amining the residuals from the [MgFe]′–σ and Balmer–σ rela-tions presented in § 4.1. In Figure 12, we plot∆[MgFe]′ and∆(Hδ+Hγ) versus projected radius. Similar to what we sawin Figure 8, we see a population of galaxies with enhanced

16
FIG. 11.— Coadded spectra. The right panel shows coadded spectrum of E+S0 members with EW(OII)< −15Å. The full spectrum is on top, with an excerptbelow it which shows OII emission, Ca H & K, and Balmer absorption lines in more detail. The left panel shows coadded spectra for all other E+S0 members,divided by distance from cluster core. From top to bottom: periphery, transition region, and cluster core. Wavelengthsin rest frame.
Balmer absorption within the Virial radius at 1.7 Mpc. In thisplot, though, we are able to remove the effects of galaxy massby looking, in effect, at galaxies that have excess Balmer ab-sorptioncompared to other galaxies at the same velocity dis-persion. This is clear evidence, then, that the observed Balmerexcess is an environmental effect, and not simply due to a dualcorrelation between line strength–mass and mass–cluster ra-dius.
In the top panel of Figure 12, where we plot∆[MgFe]′,galaxies that also exhibit∆(Hδ+Hγ) > 2Å are marked withred squares. Virtually all of the galaxies with anomalouslylow [MgFe]′, which we made note of in Figure 6, belong tothis population of Balmer-strong galaxies. For the first 1 Gyrafter a burst of star formation, we would in fact expect that theA-stars causing the enhanced Balmer absorption would alsotend to fill the metal absorption lines with emission, as theselines are much weaker in A-stars than they are in the olderstars making up the bulk of the stellar population. In fact,Tantalo & Chiosi (2004) suggests that a young stellar popula-tion has just this effect: [MgFe]′ is very low for mean agesless than 2 Gyrs, whileHβ, and presumably the other Balmerindices are enhanced.
We find no evidence that any of Mg2, Mgb, [OII], or anyBalmer lines are correlated with the residuals from the FP,∆Log(M/LV). Nor is there evidence that the residuals fromany of the Mg–σ, or Balmer–σ relations are correlated with∆Log(M/LV). This indicates that recent perturbations to thestellar population of an early-type are somewhat decoupledfrom its overall mass to light ratio. While the FP, [MgFe]′–σ, and Balmer–σ relations establish a clear link between theformation histories of E+S0s and their current appearance,the lack of correlation between residuals indicates that envi-ronmental effects play a relatively minor role in determiningM/LV . The initial time of formation and mass-assembly his-tory seem to be the dominant factors.
4.3. Luminosity Trends
Figure 10 reveals that there is a luminosity trend in the frac-tion of E+S0 galaxies with EW([OII])< −5, as well as thefraction with enhanced Balmer absorption. For the bright-est galaxies,I < 20.3, the fraction of [OII]-emitters decreasesmonotonically, from the field measurement of Treu et al.(2002) to the cluster core. However, when we include slightlydimmer galaxies, toI = 21.1, we see an enhanced fraction
FIG. 12.— Residuals from the [MgFe]′–σ and (Hδ+Hγ)–σ relations.The interaction with the environment has spurred increasedstar formationwithin the Virial radius. Galaxies that lie above∼ 2 in the bottom panel haveBalmer absorption that is unexpectedly strong for their velocity dispersion.Similarly, galaxies with∆[MgFe]′ below -1 are showing unexpectedly weakmetal lines. In both panels, galaxies with∆(Hδ+Hγ) > 2.0 are marked withred squares.
of emitters in the cluster periphery, though [OII] emissionisstill rare within 2.4 Mpc. Now including our full sample toI = 22.5, the fraction of star-forming galaxies in both the tran-sition region and periphery are higher than expected. In thetransition region, the jump represents the addition of the dimbut strongly emitting galaxies discussed above (which haveamean magnitude ofI = 21.1). The overall trend suggests thatthe star formation observed in the outskirts of this clusterissuppressed earliest in the largest and brightest E+S0s.
A similar trend is seen in the fraction of early types with(Hδ+Hγ) > −2Å. As discussed above, we see a jump at all lu-minosities in the fraction of Balmer-strong galaxies within theVirial radius, possibly due to the same mechanism that causes

17
the enhanced [OII] emission. But within each radial zone,the fraction of galaxies with prominent Balmer absorption in-creases with increasing magnitude;the mean magnitude of allsuch Balmer-strong early types isI = 20.3. However, unlike[OII], which probes current star formation only, the Balmerlines are also sensitive to the stellar population age. Thisgra-dient in Balmer strength with luminosity could simply reflectan earlier formation time for the brightest galaxies, regardlessof local environment.
The brightest galaxies in our sample (I < 20.3) follow theFP and show few signs of star formation. Similarly, galax-ies to I = 21.1 lie on the FP (albeit with a high scatter) andexhibit star formation mainly in the periphery. Perhaps starformation is quenched early during infall of these galaxies,with mostly passive luminosity evolution from that point. Be-cause the dimmest galaxies seem to undergo the most promi-nent bursts of star formation (though AGN activity has yet tobe ruled out), it seems that the physical mechanism respon-sible affects smaller galaxies more dramatically than largergalaxies. Of course, the elevated fraction of galaxies withstrong Balmer absorption demonstrates that all early types,bright or dim, are affected to some degree. When evaluatingthe physical mechanisms that lead to the observed environ-mental evolution, we must also consider this dependence onluminosity.
5. DISCUSSION
Having presented our results in the previous section, wenow proceed to a more comprehensive discussion of our find-ings trying to put together the various pieces of informationand reconstruct the evolutionary process, its timescales andthe physical mechanisms driving it. First, in Section 5.1, wewill combine the radial trends obtained so far and discussthem jointly. Then, in Section 5.2 we will present a simpleinfall model which indicates that a common physical mech-anism may cause several of the radial trends seen in varioussubpopulations of E+S0s. In Section 5.3 we discuss the phys-ical mechanisms at work and conclude that our study of early-type galaxies has revealed the action of at least two differentenvironmental processes: starvation and/or galaxy harassmentis quenching low-level star formation over a long timescaleinearly-types beyond the cluster core, while harassment and/orinteractions with shocks in the outer parts of the ICM are pro-ducing the sudden bursts of star formation observed in smallE+S0s around the Virial radius.
5.1. Radial trends and star formation timescales
In the residuals from the Fundamental Plane, we have ob-served a gradient in the mean mass to light ratios of E+S0s,allowing us to observe the transition from the oldest, highestM/LV galaxies in the cluster core, to the galaxies in the clus-ter periphery with younger luminosity-weighted ages, nearlymatching the values ofM/LB seen in field E+S0s (Treu et al.2001a, 2005b; van der Wel et al. 2005). The scatter in the FPresiduals is unexpectedly high within the inner 1 Mpc of thecluster, but the FP appears tighter outside of this radius. Di-rect measurements of spectral line strengths (Figure 8) andthe fraction of [OII]-emitting early-types (Figure 10) both re-veal a mildly declining star formation rate within early-types,from the field toward the cluster core. This is interrupted byan interaction at the Virial radius that causes enhanced [OII]emission in a population of small, dim early types, along withenhanced Balmer absorption and depressed [MgFe]′ absorp-tion strength for a population of larger, typical cluster E+S0s.
In Figure 13, we combine the previously shown ra-dial trends in∆Log(M/LV), ∆(MgFe′), ∆(Hγ+Hδ), andEW([OII]) into a single plot. As in Figure 12, in the top threepanels we indicate every galaxy exhibiting high Balmer ab-sorption with a red mark. Likewise, all galaxies with signifi-cant [OII] emission in the bottom panel are plotted with opensymbols in each panel. While the galaxies with unexpect-edly low [MgFe]′ correlate with the Balmer-strong galaxies,as mentioned in § 4 above, there is no similar correlation with∆Log(M/LV). We see some Balmer-strong galaxies at bothlow and highM/LV , which indicates that the star formationcausing the enhanced Balmer line strengths does not drive thevariations inM/LV that we observe; the bursts of star forma-tion are perhaps too minor to affect the overallM/LV of thegalaxy, at least to levels detectable in our data.
Briefly, we recap the characteristic timescales for changesin each of the quantities plotted. [OII] emission traces thein-stantaneous rate of star formation, so that the observed strong[OII] emitters mark the location of a “hot spot" of current starformation at 1.7 Mpc radius (though we emphasize that theseobjects are not spatially clustered). Enhanced Balmer absorp-tion will persist for about 1 Gyr after a burst of star formation,and so there is a time lag of< 1 Gyr between the terminationof star formation in these galaxies and the time when we ob-serve them. Changes inM/LV should persist for a similaramount of time after a recent burst of star formation (untilthe luminous A stars begin to disappear), though we expectthatM/LV is less sensitive to low-level star formation becauseit depends more closely on the integrated stellar light of thegalaxy, which changes by a smaller amount than the strongspectral lines.
5.2. A simple infall model
We have so far presented evidence for a seemingly abruptencounter with the environment that triggers star formation inearly-types at or near the Virial radius, along with a moder-ate decline in star formation from the periphery to the core,and a trend inM/LV that suggests that the stellar populationsof early types at larger radius are younger. In this sectionwe present a simple infall model as a tool to compare thetimescales and strengths of several of the observed features inthe early-type population. Specifically, we wish to examinethe possibility that both the galaxies with strong [OII] emis-sion and those with excess Balmer absorption could be causedby a common physical process. And while we have shown in§ 5.1 that the FP residuals,∆Log(M/LV), do not correlatewith the Balmer-strong galaxies, we will also use this simpleinfall model to constrain the level of variation inM/LV thatcould be induced by the environment.
In this idealized model, we follow an early-type galaxy asit proceeds toward the cluster center evolving passively, untilit reaches the Virial radius where it undergoes a short burstofstar formation (adding 1% to the total stellar mass, 200Myrsof duration). After the burst, the galaxy continues its infallevolving passively. For this model we use the prescription ofPaper I to convert from infall time to cluster projected radius:assuming that the galaxy is on its first infall toward the cluster,it begins with a small velocity atR = 5 Mpc and acceleratesfreely toward the cluster potential.
The observable properties of this model are thencomputed using stellar population synthesis models byBruzual & Charlot (2003) to compare with observations. Al-though this is clearly a simplified model – for example it ne-glects “backsplash” (Gill et al. 2005; Ellingson 2004), i.e. the

18
FIG. 13.— Radial trends in the residuals of dynamical relations. From top to bottom,∆Log(
M/LV)
, ∆ (MgFe′), ∆ (Hδ + Hγ), and [OII ] vs. R for reference.Galaxies brighter thanI = 21.1 are marked with pentagons, and triangles represent galaxies in the range 21.1 < I ≤ 22.5. In the top three panels, we indicateevery galaxy exhibiting high Balmer absorption (∆ (Hδ + Hγ) > 2Å) with a red mark. Likewise, all galaxies with [OII]< −5Å in the bottom panel are plottedwith open symbols in each panel. Overplotted on each plot is the track of a simple early-type galaxy model, as the galaxy falls freely from the outskirts of thecluster, and has an encounter at the Virial radius which triggers a starburst of duration 200Myrs, totaling 1% of the galaxy’s mass.
fact that especially in the cluster center, and even out to twovirial radii, some galaxies might not be on their first approachtoward the cluster (see discussion in Paper I), and it is a closedboxed model, i.e. there is no provision for galaxies beingtransformed into E+S0s during the infall – we will show thatthis model reproduces the strengths and timescales of manyof the observed features and provides useful guidance to in-terpret the observations.
The predictions of the model are shown as a dashedline in Figure 13. Specifically, we plot the difference in∆Log(M/LV), ∆(MgFe′), ∆(Hγ+Hδ), and star formation
rate (SFR) between the infalling model galaxy and an iden-tical model without the starburst. Since we are interested onlyin the predicted change in line strengths due to a recent starformation event, the proper quantity to plot is this differencebetween the index strengths predicted by the passive modeland the one with a small starburst overlayed. We emphasizethat the model track for∆Log(M/LV) is meant to replicateonly the change inM/LV caused by a small starburst, anddoes not account for the radial gradient in∆ < Log(M/LV) >seen in the data.
To calibrate the star formation rates predicted by the mod-

19
els to the [OII] equivalent widths observed, we used SFRsderived by Kodama et al. (2004, and private communication)from their deep Hα images, according to the procedure out-lined in § 3.4.
The choice of a 1% starburst produces a SFR and [OII]equivalent width equal to that observed in the largest/brightestof our low-luminosity [OII] emitting galaxies, which we es-timate to have a stellar mass up to around 5×10¹⁰ M⊙ (See§ 3.4). The 200 Myr timescale approximately matches thespread in cluster radius over which we see these [OII] emit-ters. The stellar mass associated with the starburst could varywith galaxy size and need not add up to 1% of the galaxymass. For our [OII] emitters, the luminosities and equivalentwidths imply that up to a 5% burst could be involved, depend-ing on its duration. However, 1% represents a good upperlimit for the larger galaxies with enhanced Balmer absorption,as we would otherwise expect to observe “post-starburst” k+aspectra; the excess Balmer absorption is not strong enough toplace any in this category.
Examining the track of the model in Figure 13, it is remark-able how well the expected change in Balmer line strengthmatches the observations in both maximum strength and inthe time it takes this enhanced absorption to decay away. Thislends strength to our contention that the enhanced Balmer ab-sorption and the high [OII] emission are reflections of thesame physical process.
We also observe a dip in the strength of [MgFe]′ justwhere we would expect it, though the magnitude of thisdip does not seem great enough to account for the observed[MgFe]′ decrement. This may simply be a deficiency in theBruzual & Charlot (2003) models, as the observed values of[MgFe]′ span a larger range than could be predicted by themodels at any SSP age or metallicity. In contrast, the mod-els easily account for the full range of observed Balmer linestrengths. Therefore, changes in [MgFe]′ due to a smallstarburst could be under predicted by the Bruzual & Charlot(2003) models.
We note that the population of [OII] emitters observed can-not evolve directly into the population of galaxies with strongBalmer lines, though they could still be indicators of the samephysical mechanism. The Balmer-strong E+S0s are brighterand larger in effective radius, and any fading of the [OII] emit-ters would only increase the difference between these pop-ulations. Since they are near our spectroscopic magnitudelimit, we would not expect to observe faded remnants of the[OII] emitting galaxies. On the other hand, the lack of brightearly types with strong [OII] emission might arise because thetimescale for the Balmer lines to decay (1 Gyr) exceeds thestarburst timescale (200 Myrs), so that we would not expectto observe more than one of the emission line progenitors ofthese Balmer-strong galaxies. This is partly due to the overallsmaller number of bright E+S0s observed within the transi-tion region (1–2.4 Mpc), in comparison to the∼ 50 observedin the cluster core.
To further examine our hypothesis that the [OII]-emittingand Balmer-strong galaxies are caused by the same environ-mental interaction during infall, we can examine the 2D spa-tial distribution of these galaxies. In Figure 14, we plot [OII]emitters in blue and early-types with strong Balmer absorp-tion in red, on top of the overall distribution of cluster mem-bers from the combined spectroscopic and photometric red-shift catalogs. The [OII] emitters and Balmer absorbers fol-low the overall distribution of cluster members closely, lyingmostly along the major axis of the cluster (stretching from the
overdensity NW of the cluster core through to the SE side ofthe core). Though the [OII] galaxies perhaps extend in a largerarc at∼ 1.7 Mpc, their small number makes it difficult to de-termine their azimuthal distribution. The distribution supportsthe idea that they have been perturbed during infall, as thisis most likely occurring predominantly along the NW to SEpath.
Turning to the top panel in Figure 13, it seems that the smallstarbursts at the Virial radius cannot alter the overallM/LV ofearly types by a large enough amount to account for the largescatter that we see in the cluster core. It seems that there mustsimply exist a mix of older, highM/LV galaxies and morerecently arrived lowM/LV galaxies in this region. On theother hand, the triggered star formation may help prolong thelength of time that an infalling E+S0 remains at lowM/LVafter reaching the cluster core. This could possibly explainwhy the scatter inM/LV seen in this cluster is so much higherthan that observed in Cl 1358+62 atz = 0.33 (Kelson et al.2000b); the mechanism causing this star formation in Cl 0024might not be active or significant in all clusters at this redshift.
While the simple model presented here does not attempt toaccount for the observed radial gradient inM/LV , we notethat the difference inLog(M/LV) between a galaxy at 5 Mpcradius, of age 2.7 Gyr, and that same galaxy 5 Gyr later (cor-responding to the total free-fall time to the cluster center), isequal to -0.35. This is nearly identical to the observed differ-ence inLog(M/LV) between the mean value in the periphery,and theM/LV of the oldest galaxies in the core. While thegalaxies in the periphery are almost certainly not this young,the observed gradient inM/LV seems consistent with a differ-ence in formation age (or in time since the last major burst,c.f. Bower et al. 1998 and Treu et al. 2005b) of a few Gyrsbetween cluster periphery and core. A gradient in formationage, then, is a viable explanation for theM/LV gradient weobserve, though the gradual decline in star formation that weobserve could also be important in generating theM/LV gra-dient.
Having suggested that the observed spectral features of ourearly-type sample are due to a small starburst, it is naturalto ask if such a burst is realistic; in other words, do E+S0sat redshift∼ 0.4 contain enough residual gas to undergosuch episodes of star formation? According to Bettoni et al.(2003), the fraction of molecular gas detected in local “nor-mal” early type galaxies (i.e. showing no signs of currentor recent interaction or dwarf cannibalism, but otherwise se-lected across all local environments), can approach 1% ofthe total stellar mass (with typical values ranging from 0.05–0.5%). At intermediate redshifts, some field E+S0s have pe-culiar color gradients that may indicate recent star formation(e.g. Menanteau et al. 2004). Allowing for the possibility offaint, undetected interaction features in our much more dis-tant sample, as well as the expected decrease in the remnantmolecular gas in ellipticals sincez = 0.4, we expect that asmall burst of star formation of up to 1% is entirely plausiblefor early-type galaxies in Cl 0024. Additional evidence comesfrom the observation (e.g. Treu et al. 2005b; Bressan et al.1996) that the combinations of spectral line strengths ob-served in early-type galaxies are best explained if most early-types have undergone secondary episodes of star formation atsome point in their past; the Balmer-strong galaxies observedhere could possibly have undergone such secondary bursts inthe last 1 Gyr.
5.3. Physical Mechanisms

20
FIG. 14.— Spatial distribution of [OII] emitters and galaxies with excess Balmer absorption, in comparison to the overall distribution of cluster members inthe combined spectroscopic and photometric (Smith et al. 2005) redshift catalog (gray dots). Blue pentagons are strong[OII] emitters, with two open symbolsmarking the merger system and possible spiral interloper seen in Figure 9. Filled red triangles mark galaxies where the Balmer–σ residuals are∆ (Hδ + Hγ) > 2Å,and unfilled triangles represent galaxies without measuredvelocity dispersions, with EW(HδA+HγA) > −2Å. Top and right axes show projected radius from thecluster center, in Mpc.
The early-type galaxies in Cl 0024 have proven to be effec-tive signposts for identifying two possible forms of environ-mental evolution in this cluster, but can we identify the physi-cal processes responsible? We observe a slow decline in rem-nant star formation from the field/periphery to the core whichmay indicate a physical mechanism at work which slowlyquenches star formation. Seemingly overlaid on top of thismild trend is a nearly-instantaneous interaction that triggersa small burst of star formation in many of these early-typegalaxies at the virial radius.
First, we address physical mechanisms that could be re-sponsible for the gradual decline in star formation rate to-ward the cluster core, best illustrated in Figure 10. In analyz-ing the cause of the observed decline, we must also considerthe morphology–density (T–Σ) relation observed in Cl 0024.In Paper I, it was argued that the existence of the T–Σ re-lation across several orders of magnitude in projected localdensity indicates that whatever process causes the morpho-logical segregation of galaxies by environment, it acts slowly.The slow “starvation”(See Paper I) of galaxies during in-fall is consistent with the existence of the T–Σ relation, asis the action of galaxy harassment (Moore et al. 1996, 1999;Moore, Lake & Katz 1998).
Starvation encompasses several physical mechanisms thatall serve to slowly deprive a galaxy of cold gas availablefor star formation. For example, thermal evaporation of thegalaxy interstellar medium (ISM) by interaction with the hotcluster ICM (Cowie et al. 1977), or turbulent and viscousstripping of the ISM (Nulsen 1982; Toniazzo & Schindler2001) are two possible causes of starvation. Either of these
processes could be acting in Cl 0024, and are consistent withboth the observed gradient in star formation rate and the exis-tence of the T–Σ relation.
Kodama et al. (2004), however, argue that the truncation ofstar formation in cluster galaxies must be rapid, based on theirobservation that the Hα luminosity function does not varywith environment. Both our paper and theirs find a simi-lar decline in thefraction of star forming galaxies, but theydo not observe a decline in the mean strength of emission.The discrepancy may be due to the different levels of starformation probed: the low levels of remnant star formationin the early-type population discussed here may be quenchedslowly, while a separate physical process (such as harassment)could rapidly decrease the moderate star formation observedby Kodama et al. (2004), which occurs mostly in the spiralpopulation. Combined with a longer timescale for morpho-logical transformation, this could lead to the “passive spirals”they discuss.
Paper I also argued that the existence of the T–Σ relationmeans that the morphological mix is set by the pre-cluster en-vironment: the overall formation history within assemblinggroups is the dominant factor in determining the morpholog-ical mix seen in the cluster. This view is consistent with thetrend we observe in theM/LV ratios of cluster early-types. Wefind that the differences inM/LV must arise partially out ofvariations in the mass–assembly history of early-type galax-ies, though the radial trend in< log(M/LV) > may also reflectthe quenching of remnant star formation during infall.
Interrupting the slow decline in star formation are the smallbursts of star formation we observe. Rapidly acting mecha-

21
nisms that could trigger such a burst include galaxy harass-ment or some encounter with the ICM. As noted in § 4, majormergers are ruled out because the galaxies seem to be in lowdensity regions, and all but one of the galaxies involved showno visual evidence for such a disturbance.
Galaxy harassment becomes important near the Virial ra-dius as both galaxy crowding and the typical velocity of aninteraction become high enough. (See Paper I.) Further, it isa rapid interaction, and the galaxy that triggers one of our ob-served starbursts can quickly move away from the vicinity ofthe starburst galaxy. Moore et al. (1999) present simulationsof the harassment of small Sc/Sd spiral galaxies as they fallinto the cluster. Such galaxies can be quickly transformed intoobjects that appear to have an early-type morphology. Theseharassment remnants are small objects (Re = 1− 3kpc), sim-ilar to our observed [OII] emitters, and could represent theorigin of the large population of dwarf spheroidals observedin clusters today. In addition, Moore et al. (1999) predict thatharassment would drive the gas within a spiral toward thegalaxy’s center, thus providing a natural mechanism for fu-eling the starbursts (or AGN) we observe.
If these are the remnants of harassed spirals, they may notbe on their first infall into the cluster; the timescale for pas-sage from the cluster core back out to the virial radius may beshort enough (< 1 Gyr) that star formation induced by inter-actions with large ellipticals in the cluster center could still bevisible . A possible explanation, then, for finding them pref-erentially at the virial radius could be that this is near theapseof their orbit within the cluster.
Under the harassment scenario, we speculate that the pop-ulation of Balmer-strong galaxies could represent the largecluster ellipticals which cause the harassment, perhaps canni-balizing young stars from smaller harassed galaxies. Alterna-tively, they could be undergoing harassment themselves, al-beit with a much smaller gas reservoir and a correspondinglysmaller episode of star formation.
Ram-pressure stripping or triggering of star formation hasbeen thought to be effective only much closer to the clus-ter core, and should not be significant near the Virial radiuswhere the environmental interaction is taking place. How-ever, recent work on large-scale shocks and particularly theVirial shock–the shock boundary between the hot, dense ICMand the colder, diffuse infalling gas from outside the cluster–suggests that a galaxy passing through this shock boundarycould be given enough of an impulse to trigger stripping ofHI gas and the collapse of any molecular clouds (Evrard 1991;Quilis et al. 2000; Ryu et al. 2003; Furlanetto & Loeb 2004).Particularly relevant to Cl 0024 is the work by Roettiger et al.(1996). They showed that a merger between two clusters orsub-cluster clumps can cause powerful shocks to propagatethrough the ICM. As the redshift distribution of galaxies inCl 0024 is double-peaked (Czoske et al. 2002), indicating alarge infalling group or sub-cluster, such strong shocks couldbe responsible for the triggered starbursts we observe. If thisis the case, we would not expect to see such bursts in otherclusters with more regular structure.
Our sample of 104 E+S0s contains only four galaxies fromthe smaller Peak B of the redshift distribution in Cl 0024 (Fig-ure 2), so we are unable to more carefully explore possibledifferences between early type galaxies in these two peaks.But in the local universe, Poggianti et al. (2004) finds a pop-ulation of star forming dwarf galaxies that lie along contoursin the X-ray substructure of the Coma cluster. It is possiblethat the [OII] emitters in Cl 0024 lie along similar boundaries
in the cluster substructure, but the nearly face-on orientationof the merger between Peak A and Peak B makes testing thishypothesis difficult. In this scenario, the existence of Balmer-strong galaxies interior to the Virial radius would imply thatsome sort of boundary shock between Peak A and Peak B haspersisted for at least∼ 1 Gyr, the timescale for the excessBalmer absorption to decay away.
Our small population of strong [OII] emitters is a sign-post to an important physical interaction, and is not a pe-culiarity unique to this cluster. A similar population ofdim, compact, E+S0s with [OII] emission has also been re-ported by Homeier et al. (2005), for a galaxy cluster atz =0.84. While the cluster they study is not virialized, the [OII]emitters they observe seem to reside in a region outside ofthe contours of the cluster X-ray emission. And work byRuderman & Ebeling (2005) examining the radial distributionof X-ray point sources in the MACS sample of clusters hasuncovered a prominent spike in the number of cluster AGNdetected in the area around the Virial radius (∼ 2.5 Mpc in theclusters studied). These AGN may be stimulated by the clus-ter environment via the same physical mechanism causing the[OII]-strong early-types. Therefore, even though they onlyrepresent a small fraction of the total mass and star-formationin clusters, these galaxies warrant further study of their roleas indicators of environmental interaction.
While the exact physical mechanisms responsible for theenvironmental evolution are still not known, further workon this cluster, and a similar planned study of the X-raybright cluster MS 0451-03 atz = 0.54 may allow us to de-termine which processes are dominant. Analyzing the starformation rates and rotation curves of spirals in Cl 0024may help us trace the gradual decline in star formation ratehinted at here, as star formation in spirals is in generalmuch more vigorous than in the early types studied so far.Other authors have found similar declines in the star forma-tion rate in spiral populations of clusters at intermediatered-shift (Abraham et al. 1996b; Balogh et al. 1999; Balogh et al.2000). Rotation curves have also been used to study varia-tions in the kinematics and mass to light ratios of spirals, indistant clusters by, e.g., Bamford et al. (2005); Ziegler etal.(2003); Milvang-Jensen et al. (2003), and in Cl 0024 byMetevier & Koo (2004).
Likewise, the X-ray luminosity of MS 0451 is much higherthan that of Cl 0024. If shocks in the ICM really do causethe bursts of star formation observed in early types near theVirial radius, then we should see a similar or even strongereffect in MS 0451, but at a higher radius. If the strength of theICM shocks in Cl 0024 is enhanced by the sub-cluster merger,however, we might expect to see no starbursting early types atall in MS 0451. The importance of galaxy harassment shouldbe nearly the same between the two clusters, so we wouldexpect to see similarly strong starbursts in MS 0451 if theCl 0024 bursts are due to harassment.
6. SUMMARY
In this paper we have presented the results of an extensivespectroscopic survey of the cluster Cl 0024+1654, under-taken with DEIMOS onKeck II and LRIS onKeck I. Weexamine the detailed spectral and photometric propertiesof cluster early types across an area 10 Mpc in diameter.The principal goal of this wide area survey is to examinevariations in galaxy properties with local environment, inorder to identify the physical processes that may affect thestar formation properties or morphological characteristics of
22
infalling galaxies. In this paper, we have used the early-typegalaxy population as sensitive indicators of interaction withthe cluster environment. Our main observational results are:
1) Combining our new redshift survey of nearly 1000 galax-ies with previous work on this cluster, we present a com-prehensive redshift catalog for Cl 0024, consisting of 1394unique objects with redshifts, of which 486 are cluster mem-bers. From our survey, we select a sample of 104 E+S0 clus-ter members brighter thanI = 22.5, for which we can measurespectral line indices. For a subsample of 71 of these galaxies,with high quality spectra available andI ≤ 21.1, we also mea-sure reliable velocity dispersions and analyze surface photom-etry from theirHSTimages.
2) By constructing the Fundamental Plane of Cl 0024, weobserve that E+S0s atz∼ 0.4 still have old stellar popula-tions; from a comparison with the FP of the Coma cluster(z ∼ 0.02), we infer an evolution in mass to light ratio of∆(Log(M/LV)) = −0.14± 0.02. While the mean change inM/LV is in line with that expected by passive evolution of anold stellar population, the high scatter of 40% inM/LV sug-gests a more complex assembly history for this cluster. Thehigh scatter may be an effect of the cluster merger currentlyunderway (Czoske et al. 2002), though at least one other in-termediate redshift cluster (Wuyts et al. 2004) exhibits a sim-ilarly high scatter.
3) We observe radial trends in the mass to light ratios ofindividual early types, with the oldest galaxies located inthe cluster core (< ∆Log(M/LV) >R<1Mpc= −0.13± 0.04).Galaxies seem to be younger at higher radius, with E+S0sin the cluster periphery (< ∆Log(M/LV) >R>2.4Mpc= −0.24±0.02) nearly matching the values ofM/LV seen in the field atthis redshift (Treu et al. 2005b). We therefore have bridgedthe gap between the observed properties of cluster and fieldearly types at intermediate redshift. Similar trends are seenas a function of local density. Some fraction of this ra-dial gradient could be caused by the “downsizing" effectdescribed by, e.g., Treu et al. (2005b); Holden et al. (2005);van der Wel et al. (2005). But even when we select a subsam-ple of galaxies within a narrow range of galaxy mass (10.9 <Log(M/M⊙) ≤ 11.4), we observe a significant difference inage (or time since the latest burst) between galaxies in thecluster periphery and core, equivalent toδ < Log(M/LV) >=0.13±0.07. Physically, this trend could be explained by somecombination of a gradient in formation age and variations inrecent star formation, perhaps modulated by “starvation".
4) Around the virial radius, we observe a number of smallgalaxies undergoing a burst of star formation, indicated bystrong [OII] emission. Further, we observe enhanced Balmerabsorption for many galaxies interior to this radius. Thisis consistent with an infall scenario where, after a starburst,Balmer absorption from young stars decays away over thecourse of∼ 1 Gyr, as the galaxy continues toward the clus-ter core. The radial distribution of enhanced-Balmer E+S0s
is consistent with the expected infall timescale of such galax-ies. Galaxy mergers are not the source of this enhanced activ-ity; the [OII] emitters reside in relatively low density regions,and do not appear to reside in groups. The small starburstsare likely caused by a rapidly acting physical process: pos-sibilities include galaxy harassment and shocks in the ICM,perhaps generated by the sub-cluster merger in Cl 0024.
5) While the overall early type population is older inthe cluster core than in the outskirts, we see trends withluminosity that indicate that smaller early types have moreactive star formation than larger ones. This seems to confirmevidence for downsizing seen by Treu et al. (2005a), andindicates that galaxy mass is a primary indicator of starformation activity, even as environmental effects work ontop of this to produce radial variations in star formation.Both of these ultimately serve to decrease star formationtoward the highest density regions, though the precise linktomorphological transformation is still unclear because of thedifferent timescales involved.
We have uncovered environmental processes working oncluster early types, but we have also seen variations in galaxyproperties across the cluster that indicate that both galaxymass and environment of initial formation are important indetermining the overall assembly history of early type galax-ies.
By obtaining high quality spectra of cluster members acrossa large area around Cl 0024, and combining with a panoramicHSTmosaic, we have been able to uncover physical mech-anisms at work that never would have been seen if we onlylooked at the cluster core. This underscores the importanceof looking wide as well as far when attempting to understandhow galaxies evolve within the large scale structure of the uni-verse.
We thank Michael Cooper and Jeffery Newman for helpwith the DEIMOS data reduction pipeline, F. Owen, A. Mete-vier, and D. Koo for sharing redshifts, T. Kodama for allow-ing us access to Hα equivalent widths and star formation ratesfrom their survey, and J. Richard for assisting with DEIMOSobservations in 2003. We thank M. Balogh, E. Ellingson, B.Holden, B. Poggianti, A. Babul and A. van der Wel for valu-able discussions. Faint object spectroscopy at Keck Obser-vatory is made possible with LRIS and DEIMOS thanks tothe dedicated efforts of J. Cohen, P. Amico, S. Faber and G.Wirth. We acknowledge use of the Gauss-Hermite Pixel Fit-ting Software developed by R. P. van der Marel. The analy-sis pipeline used to reduce the DEIMOS data was developedat UC Berkeley with support from NSF grant AST-0071048.TT acknowledges financial support from a Hubble Fellowshipgrant HST-01.167.01. RSE acknowledges financial supportfrom NSF grant AST-0307859 and STScI grants HST-GO-08559.01-A and HST-GO-09836.01-A.
REFERENCES
Abraham, R. G., van den Bergh, S. et al. 1996, ApJS, 107, 1Abraham, R. G., Smecker-Hane, T. A. et al. 1996, ApJ, 471, 694Balogh, M. L., Morris, S. L. et al. 1999, ApJ, 527, 54Balogh, M. L. & Morris, S. L. 2000, MNRAS, 318, 703Bamford, S.P., Milvang-Jensen, B., et al., 2005, MNRAS, in pressBarr, J., Davies, R. et al., 2005, AJ, in pressBender, R., Burstein, D., Faber, S.M. 1993, ApJ, 411, 153Bender, R., Burstein, D., Faber, S.M. 1992, ApJ, 399, 462Bender, R., Saglia, R. P. et al. 1998, ApJ, 493, 529Bettoni, D., Galletta, G. & Garcia-Burillo, S. 2003, A&A, 405, 5
Bower, R., Kodama, T., & Terlevich, A. 1998, MNRAS, 299,1193Bower, R., Lucey, J.R., & Ellis, R.S. 1992, MNRAS, 254, 601Bressan, A., Chiosi, C., & Tantalo, R. 1996, A& A, 311, 425Burstein, D., Faber, S.M. 1984, ApJ, 399, 462Bruzual, G., & Charlot, S. 2003, MNRAS, 344, 1000Butcher, H., & Oemler, J., Jr., 1978, ApJ, 226, 559Couch, W. J., & Sharples, R. M. 1987, MNRAS, 229, 423Cowie, L.L., & Songaila, A. 1977, Nature, 266, 501Czoske, O., Kneib, J.-P., Soucail, G., et al. 2001, A& A, 372,391Czoske, O., Moore, B., Kneib, J.-P., & Soucail, G. 2002, A& A,386, 31

23
Davis, M. et al. 2003, SPIE, 4834, 161Djorgovski, S. & Davis, M. 1987, ApJ, 313, 59Dressler, A., 1980, ApJ, 236, 351Dressler, A., & Gunn,J.E. 1983, ApJ, 270, 7Dressler, A., Lynden-Bell, D., Burstein, D. et al. 1987, ApJ, 313, 42Dressler, A., Oemler, A., Jr., Couch, W. J. et al. 1997, ApJ, 490, 577Dressler, A., Smail, I., Poggianti, B. et al. 1999, ApJS, 122, 51Ellingson, E. 2004, in “Outskirts of Galaxy Clusters: Intense Life in the
Suburbs”, IAU Colloquium 195, p.327-333Evrard, A. E. 1991, MNRAS, 248, 8Faber, S. M., Phillips, A.C., et al. 2003, Proc. SPIE, 4841, 1657Fabricant, D., Franx, M., & van Dokkum, P. 2000, ApJ, 539, 577Fasano, G., Poggianti, B.M. et al. 2000, ApJ, 542, 673Fisher, D., Fabricant, D., Franx, M., & van Dokkum, P. 1998, ApJ, 498, 195Fritz, A., Ziegler, B. et. al. 2005, MNRAS, 358, 233Furlanetto, S. R., & Loeb, A. 2004, ApJ, 611, 642Gerhard, O., Kronawitter, A. et al. 2001, AJ, 121, 1936Gerken, B., Ziegler, B., et al. 2004, A& A, 421, 59Gill, S. P., Knebe, A. & Gibson, B., 2005, MNRAS, 356, 1327Gómez, P.L., Nichol, R. C. et al. 2003, ApJ, 584, 210Homeier, N.L., Demarco, R. et al. 2005, ApJ, 621, 651Holden, B.P., van der Wel, A. et al. 2005, ApJL, 620, L83Horne, K. 1986, PASP, 98, 609Jørgensen, I., Franx, M., & Kjærgaard, P. 1995a, MNRAS, 276,1341Jørgensen, I., Franx, M., & Kjærgaard, P. 1995b, MNRAS, 273,1097Jørgensen, I., Franx, M., & Kjærgaard, P. 1996, MNRAS, 280, 167Kelson, D. D., Illingworth, G. D., van Dokkum, P. G., & Franx,M. 2000a,
ApJ, 531, 137Kelson, D. D., Illingworth, G. D., van Dokkum, P. G., & Franx,M. 2000b,
ApJ, 531, 184Kelson, D.D., Illingworth, G.D. et al. 2001, ApJ, 552, L17Kennicut, R. C., Jr. 1992, ApJ, 388, 310Kneib, J-P., Hudelot, P. et al. 2003, ApJ, 598, 804Kodama, T., Smail, I., Nakata, F., Okamura, S., Bower, R. G. 2001, ApJ, 562,
9Kodama, T., Balogh, M. et al. 2004, MNRAS, 354, 1103Kuntschner, H. 2000, MNRAS, 315, 184Kuntschner, H., Lucey, J.R. et al. 2001, MNRAS, 323, 615Lewis, I., Balogh, M. et al., 2002, MNRAS, 334, 673Lucey, J.R., Guzmán,R., et al. 1991, MNRAS, 253, 584Menanteau, F., Ford, H.C. et al. 2004, ApJ, 612, 202Metevier, A.J. & Koo, D. C., 2004, IAUS, 220, 415Milvang-Jensen, B., Aragón-Salamanca, A., et al., 2003, MNRAS, 339, L1
Moore, B., Katz, N. et al. 1996, Nature, 379, 613Moore, B., Lake, G. et al. 1999, MNRAS, 304, 465Moore, B., Lake, G., & Katz, N. 1998, ApJ, 495, 139Nulson, P. E. J. 1982, MNRAS, 198, 1007Peng, C. Y., Ho, L. C., Impey, C. D., & Rix, H. 2002, AJ, 124, 266Poggianti, B. M., Smail, I., Dressler, A. et al. 1999, ApJ, 518, 576Poggianti, B. M., Bridges, T.J. et al. 2004, ApJ, 601, 197Postman, M., Franx, M. et al. 2005, in press (astro-ph/0501224)Postman, M., Lauer, T. R. et al. 1998, ApJ, 506, 33Quilis, V., Moore, B., & Bower, R. 2000, Science, 288, 1617Roettiger, K., Burns, J., & Loken, C. 1996, ApJ, 473, 651Ruderman, J.T. & Ebeling, H. 2005, ApJ, 623, 81Rusin, D., Kochanek, C. S. et al., 2003, ApJ, 587, 143Ryu, D., Kang, H. et al. 2003, ApJ, 593, 599Saglia, R.P., Bender, R., & Dressler, A., 1993, A&A, 279, 75Schlegel, D.J., Finkbeiner, D. P., & Davis, M. 1998, ApJ, 500, 525Smail, I., Dressler, A., Couch, W. J. et al. 1997, ApJS, 110, 213Smith, G. P., Treu, T., et al. 2005, ApJ, 620, 78Tantalo, R. & Chiosi, C. 2004, MNRAS, 353, 917Thomas, D., Maraston, C., & Bender, R. 2003, MNRAS, 339, 897Toniazzo, T. & Schindler, S. 2001, MNRAS, 325, 509Trager, S. C., Worthey, G., et al. 1998, ApJS116, 1Treu, T., Ellis, R. S., et al., 2005b, ApJ, in press (astro-ph/0503164)Treu, T, Ellis, R. S., et al., 2005a, ApJL, 622, 5Treu, T., Ellis, R. S., Kneib, J. et al. 2003, ApJ, 591, 53Treu, T., Stiavelli, M. Casertano, S., et al. 2002, ApJ, 564,L13Treu, T., Stiavelli, M., Møller, P., et al. 2001b, MNRAS, 326, 221Treu, T., Stiavelli, M., Bertin, G., et al. 2001a, MNRAS, 326, 237Treu, T., Stiavelli, Casertano, S., et al., 1999, MNRAS, 308, 1037Van der Marel, R., 1994 MNRAS, 270, 271van der Wel, A., Franx, M., et al. 2005, ApJ, in press (astro-ph/0502228)van Dokkum, P. & Franx, M. 1996, MNRAS, 281, 985van Dokkum, P. & Franx, M. 2001, ApJ, 533, 90Whitmore, B. C., Gilmore, D. M. & Jones, C. 1993, ApJ, 407, 489Worthey, G., Faber, S.M., et al. 1994, ApJS, 94, 687Worthey, G. & Ottaviani, D. 1997, ApJS, 111, 377Wuyts, S., van Dokkum, P. G., Kelson, D. D., et al. 2004, ApJ, 605, 677Zhang, Y. -Y., Bøhringer, H., et al. 2005, A& A, 429, 85Ziegler, B.L., Thomas, D. et al. 2005, A& A, 433, 519Ziegler, B.L., Bøhm, A., et al. 2003, ApJ, 598, L87Ziegler, B.L., Bower, R.G., et al. 2001, MNRAS, 325, 1571

24
TABLE 1OBSERVEDE+S0CLUSTER MEMBERS
Object α δ z F814W R Σ10 Morph(o) (o) (mag) (Mpc) (Mpc−2)
p0i102c3 6.65796 17.16050 0.3897 19.42 0.14 255 S0p0i139c3 6.66004 17.16630 0.3974 20.15 0.19 300 E/S0p0i15c3 6.64000 17.15560 0.3984 19.84 0.27 195 S0p0i170c3 6.64412 17.17120 0.3931 19.24 0.22 214 Ep0i1c3 6.65400 17.15350 0.3940 20.23 0.20 257 E/S0p0i1c4 6.66014 17.15402 0.3967 20.54 0.25 212 E
p0i206c3 6.64763 17.16280 0.3972 18.51 0.07 951 Ep0i209c3 6.64012 17.16750 0.3893 21.76 0.24 214 S0p0i217c3 6.65629 17.16270 0.3912 20.18 0.10 254 E/S0p0i24c2 6.65271 17.14714 0.3954 21.11 0.32 204 E/S0p0i38c4 6.66325 17.15350 0.3860 20.36 0.30 244 S0p0i39c3 6.64025 17.15860 0.3919 19.62 0.23 265 S0p0i3c3 6.65633 17.15240 0.3915 19.64 0.24 255 S0p0i42c3 6.65792 17.15610 0.3994 18.85 0.19 390 Ep0i45c2 6.65133 17.14800 0.3951 21.46 0.30 183 S0p0i49c2 6.64896 17.14980 0.3946 19.26 0.27 200 S0p0i4c4 6.65950 17.15350 0.3910 20.95 0.25 212 Ep0i53c4 6.67150 17.16720 0.3976 18.88 0.41 102 Ep0i55c2 6.64754 17.14220 0.3960 19.91 0.43 206 S0p0i66c3 6.65321 17.15800 0.3843 20.01 0.11 372 S0p0i72c3 6.64875 17.16200 0.3920 18.11 0.05 1024 Ep0i79c3 6.65000 17.16280 0.3883 17.75 0.02 637 Ep0i85c3 6.65663 17.15780 0.3943 19.02 0.15 339 Ep0i91c3 6.64575 17.17260 0.3887 19.57 0.23 151 Ep0i95c3 6.64313 17.17280 0.3876 18.77 0.26 274 Ep10i1c2 6.78233 17.18040 0.3967 18.66 2.59 14 S0
p11i147c4 6.72475 17.17760 0.3955 20.36 1.47 16 S0p12i160c2 6.67425 17.19140 0.3951 20.40 0.74 44 Ep12i160c3 6.64088 17.20460 0.3955 19.79 0.88 88 E/S0p12i168c4 6.65725 17.23670 0.3800 21.55 1.52 20 E/S0p12i73c4 6.66853 17.23410 0.3962 20.14 1.50 22 S0p13i130c3 6.62154 17.23410 0.3934 21.98 1.57 25 E/S0p13i133c4 6.59632 17.20980 0.3967 21.42 1.45 57 Ep13i135c4 6.59546 17.20870 0.3965 18.61 1.44 56 S0p13i1c4 6.60596 17.22300 0.3975 19.88 1.52 34 Ep13i25c2 6.58954 17.23660 0.3962 19.59 1.94 17 S0p13i78c4 6.61300 17.20720 0.3973 18.93 1.18 109 Ep13i86c4 6.60258 17.21320 0.3929 22.27 1.41 60 E/S0p14i2c2 6.55800 17.22640 0.3933 20.61 2.25 13 E
p15i144c4 6.47717 17.27400 0.3967 19.99 4.10 7 S0p17i2c4 6.75733 17.13590 0.3941 20.92 2.15 8 S0p18i43c2 6.72658 17.14080 0.3925 19.01 1.54 31 Ep18i51c2 6.72458 17.14120 0.3933 19.87 1.50 26 Ep18i66c3 6.71600 17.14440 0.3934 19.98 1.32 26 Ep19i1c3 6.58353 17.17150 0.3939 20.48 1.34 18 E/S0p19i75c4 6.60362 17.17270 0.3941 21.41 0.96 38 E/S0p19i92c2 6.57613 17.15490 0.3811 21.15 1.48 22 E/S0p20i35c4 6.53687 17.16520 0.3971 19.42 2.24 8 S0p20i48c3 6.54025 17.18710 0.3921 20.12 2.23 7 Ep24i115c3 6.61158 17.09930 0.4082 21.65 1.52 19 S0p24i1c3 6.63138 17.10100 0.3981 18.87 1.33 26 E/S0p24i42c4 6.63029 17.11800 0.4018 20.64 1.01 42 Ep24i79c4 6.64067 17.11160 0.3927 20.64 1.07 35 Ep24i87c3 6.62296 17.10520 0.3972 19.32 1.30 26 S0p25i29c3 6.57688 17.11700 0.3924 20.32 1.73 14 Ep25i93c3 6.58088 17.11730 0.3970 19.21 1.66 19 S0p27i174c3 6.46279 17.14510 0.3978 19.06 3.71 5 S0p27i9c2 6.44396 17.14130 0.3792 21.89 4.09 5 E/S0p28i87c2 6.73458 17.02130 0.3950 20.64 3.33 9 Ep35i112c2 6.51850 17.33350 0.3833 20.12 4.36 21 S0p35i143c2 6.49954 17.33630 0.3951 19.94 4.64 15 S0p35i43c3 6.52433 17.32190 0.3927 19.13 4.10 33 Ep35i6c3 6.51429 17.31730 0.3946 18.85 4.15 23 Ep35i78c2 6.51071 17.32570 0.3931 19.23 4.33 21 S0p35i82c3 6.52896 17.32850 0.3956 19.28 4.16 23 S0p36i106c3 6.61754 17.19870 0.3970 22.05 0.99 72 S0p36i146c3 6.60642 17.20250 0.3987 19.72 1.20 118 S0p36i182c2 6.62129 17.17350 0.3959 19.28 0.63 169 S0p36i182c3 6.60512 17.19650 0.3930 20.65 1.14 106 S0p36i184c2 6.61846 17.18120 0.3955 19.19 0.75 114 S0p36i187c3 6.60879 17.19940 0.3965 20.17 1.12 126 E/S0p36i1c4 6.63014 17.20229 0.3907 19.45 0.91 77 E/S0p36i2c2 6.63088 17.18210 0.3958 18.01 0.56 99 Ep36i2c3 6.61833 17.18800 0.3922 19.92 0.83 130 S0

25
TABLE 1OBSERVEDE+S0CLUSTER MEMBERS
p36i31c4 6.63221 17.20670 0.3905 18.73 0.97 123 Ep36i32c4 6.63254 17.19910 0.3916 20.14 0.83 117 S0p36i34c2 6.63088 17.17420 0.3950 20.91 0.46 124 S0p36i36c4 6.63254 17.19970 0.3949 20.96 0.84 121 Ep36i3c2 6.62933 17.18590 0.3931 20.22 0.64 105 Ep36i48c3 6.61658 17.19380 0.3934 19.74 0.93 103 S0p36i5c2 6.63542 17.17390 0.3969 19.18 0.39 186 S0p36i67c4 6.64803 17.20200 0.3951 20.87 0.81 65 E/S0p36i70c4 6.64450 17.20400 0.3975 20.38 0.86 75 Ep36i71c3 6.60769 17.20461 0.3996 21.25 1.21 105 E/S0p36i76c2 6.62469 17.16852 0.3959 20.29 0.53 151 S0p36i76c3 6.60667 17.20060 0.3932 19.95 1.17 124 S0p36i89c2 6.62292 17.17570 0.3977 19.97 0.62 154 S0p37i110c2 6.68208 17.12020 0.3954 20.86 1.06 30 S0p37i122c2 6.69346 17.10380 0.3918 21.69 1.47 16 E/S0p37i16c4 6.68229 17.13830 0.3975 18.02 0.79 81 S0p37i206c4 6.68004 17.14495 0.3965 20.44 0.67 87 Ep37i207c4 6.68607 17.14283 0.3953 21.47 0.80 146 S0p37i64c4 6.66879 17.14430 0.3977 20.18 0.51 72 E/S0p37i9c4 6.66721 17.13930 0.3999 20.81 0.57 60 S0p38i1c4 6.62454 17.14090 0.4003 20.39 0.69 55 Ep38i76c4 6.62533 17.13030 0.3976 20.88 0.84 37 S0p3i72c2 6.63067 17.32760 0.4007 20.67 3.40 7 S0p5i9c3 6.74192 17.26600 0.3904 20.69 2.76 10 E/S0
p7i128c3 6.63150 17.28690 0.3934 19.85 2.57 72 S0p7i133c3 6.63194 17.28540 0.3967 20.82 2.54 52 S0p7i136c3 6.63197 17.28490 0.3960 19.93 2.53 52 S0p7i1c2 6.60829 17.28990 0.3981 18.64 2.74 24 Ep7i67c3 6.62904 17.28590 0.3961 20.60 2.56 71 S0p9i20c3 6.83968 17.16743 0.3953 19.01 3.69 9 S0
NOTE. — Object names are abreviated from those given in Paper I, which listed objects by WFPC2 pointing, WFPC2 chip, and ID number. For example,p0i102c3 refers to object number 102 on chip 3, from pointing0. Right ascention (α) and declination (δ) are for epoch J2000. F814W magnitudes are correctedfor galactic extinction, adoptingE(B−V) = 0.057 (Schlegel et al. 1998).R andΣ10 denote, respectively, the projected radius and local density of each galaxy,calculated according to the method described in the text. Typical uncertainty inΣ10 is 25%, equal to the rms variation in the local density acrossdifferentmeasurement methods. Errors in F814W magnitudes are less than 0.05 mag rms; more information on photometric measurements is given in Paper I.

26
TABLE 3ALL MEASUREMENTS OFOBSERVEDE+S0MEMBERS
Object OII HδA HγA Mgb Fe5270 Fe5335 σ0 〈µV〉 Re S/N
(Å) (Å) (Å) (Å) (Å) (Å) (km s −1) (mag′′−2) (′′) Å−1
Observed
p0i102c3 -0.3 -0.1 -4.1 4.7 2.2 2.4 154±10 21.13 1.3 23.4p0i139c3 0.0 -0.4 -2.8 4.0 2.8 2.8 140.±7 18.85 0.3 16.7p0i15c3 0.0 -3.2 -6.3 4.7 2.2 1.3 278±26 20.30 0.7 12.3p0i170c3 0.0 -1.3 -3.2 4.8 1.5 1.9 185±13 – – 26.6p0i1c3 -0.3 3.3 -1.4 4.0 2.0 3.3 105±19 20.61 0.5 6.9p0i1c4 -0.5 0.5 -2.0 – 2.6 2.5 69±10 19.72 0.4 11.9
p0i206c3 -0.1 0.0 -5.6 1.2 0.7 1.2 491±22 19.87 1.2 19.9p0i209c3 0.0 -5.0 -6.5 2.7 2.8 0.9 – – – 1.6p0i217c3 0.0 -1.3 -5.6 4.2 2.3 1.9 144±11 19.55 0.4 14.0p0i24c2 0.0 0.0 -6.3 2.2 3.2 2.7 165±24 18.97 0.2 8.2p0i38c4 0.0 -0.6 -9.0 3.9 3.6 0.1 – – – 6.5p0i39c3 0.0 0.3 -4.7 6.7 2.4 2.6 204±22 20.20 0.8 16.3p0i3c3 0.0 -2.5 -5.6 4.2 1.8 1.8 300.±31 19.22 0.5 24.4p0i42c3 0.0 -0.4 -4.7 4.3 2.9 2.3 252±18 19.55 0.9 40.9p0i45c2 -10.1 6.4 -5.6 0.1 3.4 3.3 – – – 6.6p0i49c2 0.0 -1.6 -3.8 2.8 1.4 2.3 236±16 20.75 1.2 22.5p0i4c4 -0.8 -0.6 -1.1 3.8 3.0 2.3 128±13 20.28 0.4 9.5p0i53c4 0.0 -1.8 -2.0 3.2 1.1 0.9 403±32 20.00 1.2 17.2p0i55c2 0.0 5.9 1.1 – 2.9 0.8 – – – 5.8p0i66c3 -6.0 -0.3 -4.0 3.2 3.6 2.4 86±7 21.15 1.1 15.3p0i72c3 0.0 -1.9 -5.8 4.6 2.4 2.3 275±23 – – 42.2p0i79c3 0.0 -1.2 -5.4 5.4 2.1 2.5 283±23 21.08 3.1 28.5p0i85c3 -1.7 -0.4 -5.4 2.4 0.5 0.1 425±49 20.61 1.4 20.8p0i91c3 0.0 -2.2 -3.1 5.6 2.9 2.5 169±15 19.01 0.4 24.8p0i95c3 0.0 -1.3 -6.3 4.9 2.7 1.9 221±24 19.36 0.8 36.9p10i1c2 -0.4 -0.2 -4.6 2.3 2.5 2.8 214±13 19.52 0.8 38.4
p11i147c4 0.0 -1.0 -2.3 7.6 3.3 3.1 126±7 19.42 0.4 18.9p12i160c2 -0.7 6.0 -1.1 6.4 2.9 3.5 – – – 6.0p12i160c3 0.0 0.4 0.6 6.5 3.4 3.0 138±19 19.84 0.6 8.7p12i168c4 -28.7 1.4 2.2 2.3 2.3 4.0 – – – 4.8p12i73c4 -2.3 -0.2 -3.2 – – – 132±12 20.07 0.6 12.3p13i130c3 -38.9 1.1 – – -0.3 7.2 – – – 2.1p13i133c4 0.0 -0.3 -4.5 – – – – – – 4.0p13i135c4 -2.7 -0.6 -3.6 3.4 1.8 2.2 143±11 21.21 1.6 17.1p13i1c4 -1.4 -3.0 -5.7 8.4 – – 143±22 20.37 0.8 8.4p13i25c2 0.0 -0.3 -5.0 1.1 2.6 2.8 147±8 19.74 0.6 23.4p13i78c4 -0.2 -0.1 -1.6 – 2.5 2.0 232±21 19.72 0.8 19.6p13i86c4 -25.1 7.5 -0.7 – – – – – – 2.5p14i2c2 -7.7 2.0 -0.4 6.1 1.4 1.5 119±13 21.22 0.8 12.5
p15i144c4 -0.8 1.9 -5.0 – 0.7 2.9 130.±11 19.71 0.5 12.4p17i2c4 -3.9 -0.9 0.6 2.7 3.4 5.2 – – – 6.4p18i43c2 0.0 -0.9 -4.4 4.3 1.8 2.4 234±21 19.94 1.0 32.6p18i51c2 0.0 -0.1 0.4 – 2.1 1.5 152±10 18.93 0.3 18.9p18i66c3 0.0 -1.6 -4.9 4.2 2.3 2.0 168±14 18.62 0.3 20.8p19i1c3 -0.7 0.0 -6.0 – – – – – – 7.0p19i75c4 -1.8 2.7 -0.5 5.4 0.0 1.6 – – – 5.0p19i92c2 -49.9 3.4 -1.8 2.2 -0.6 0.4 – – – 6.8p20i35c4 -6.5 0.3 -0.7 1.6 1.8 2.0 175±11 19.41 0.5 25.1p20i48c3 0.0 -1.3 -4.0 3.9 2.5 0.5 172±11 19.23 0.4 10.0p24i115c3 -43.1 3.8 – 9.0 1.2 -0.2 – – – 4.5p24i1c3 -0.5 2.8 1.1 1.9 -0.7 0.9 144±16 20.44 1.2 12.4p24i42c4 0.0 -4.9 -1.1 1.7 2.6 -1.2 – – – 5.6p24i79c4 0.0 -0.8 3.9 2.6 1.0 1.1 – – – 4.8p24i87c3 0.0 -2.4 -6.3 3.8 1.8 0.7 153±8 19.75 0.7 11.0p25i29c3 -0.7 -0.2 -2.5 3.2 2.8 2.9 152±16 18.36 0.2 13.4p25i93c3 -30.1 -1.2 -2.3 2.8 3.0 2.2 – – – 5.5p27i174c3 0.0 0.2 -3.4 5.0 2.7 1.9 187±17 19.64 0.8 24.8p27i9c2 -29.8 -3.2 3.8 2.7 – -1.7 – – – 3.9p28i87c2 -46.5 2.4 -2.2 1.8 0.5 1.2 – – – 7.4p35i112c2 0.0 -1.4 -0.3 3.9 2.5 1.7 71±8 – – 9.6p35i143c2 0.0 -4.0 -9.6 5.4 2.8 2.7 148±9 18.99 0.4 19.8p35i43c3 -4.4 -0.9 -4.4 3.6 3.0 2.5 170.±12 20.36 1.1 18.2p35i6c3 0.0 -1.1 -5.0 4.2 2.5 2.9 220±12 19.11 0.7 27.0p35i78c2 -17.0 -1.6 -4.5 3.5 1.4 2.2 191±13 19.36 0.6 36.1p35i82c3 0.0 -0.7 -5.1 4.9 2.3 2.4 201±16 19.62 0.7 36.4p36i106c3 0.0 3.1 -3.0 – – – – – – 3.0p36i146c3 0.0 -1.2 7.1 3.4 2.2 3.0 167±12 20.15 0.7 12.5p36i182c2 0.0 -0.6 -4.4 2.6 2.2 2.4 130.±6 20.09 0.9 26.6p36i182c3 -6.6 2.4 -1.0 – 7.6 1.5 108±24 20.93 0.7 6.8p36i184c2 -0.5 -2.5 -3.4 4.9 1.6 2.7 165±10 20.00 0.9 27.2p36i187c3 -2.9 -0.2 4.9 4.4 1.3 3.1 123±10 19.80 0.5 8.8p36i1c4 -3.3 -0.6 -4.2 4.1 2.9 2.5 79±10 19.12 0.5 22.2p36i2c2 0.0 -1.7 -5.1 2.0 2.1 1.6 376±24 20.42 1.8 22.6p36i2c3 -2.6 1.3 6.5 6.8 3.0 2.5 164±10 21.76 1.5 16.2

27
TABLE 3ALL MEASUREMENTS OFOBSERVEDE+S0MEMBERS
p36i31c4 0.0 -3.1 -4.1 4.4 2.0 1.6 264±28 20.14 1.1 32.6p36i32c4 0.0 -3.1 -3.4 4.5 2.9 3.1 215±19 19.48 0.4 7.6p36i34c2 0.0 -1.1 -5.0 – 1.7 2.6 114±10 19.52 0.3 10.4p36i36c4 -5.9 0.0 -9.5 4.7 1.3 0.8 – – – 5.8p36i3c2 0.0 -0.4 -8.9 2.3 2.6 2.2 110.±9 19.64 0.5 15.3p36i48c3 -1.4 -4.1 -8.1 7.1 1.9 2.1 188±15 19.97 0.6 12.8p36i5c2 -6.8 2.1 -2.1 0.3 2.5 1.7 169±15 20.41 1.2 12.5p36i67c4 -14.3 1.0 -0.8 4.4 – – – – – 7.0p36i70c4 -8.7 2.0 -0.9 2.3 2.6 1.6 83±8 19.55 0.4 18.5p36i71c3 -4.7 1.1 -4.2 4.3 1.3 1.4 – – – 7.3p36i76c2 -4.5 0.1 0.7 4.3 2.8 2.7 261±13 20.12 0.5 13.2p36i76c3 -2.8 3.0 -2.0 5.7 0.3 0.9 87±14 20.93 1.1 9.8p36i89c2 -4.0 1.2 0.4 – 2.1 2.2 107±10 21.14 1.1 14.9p37i110c2 0.0 2.7 -3.5 7.3 3.2 3.2 114±8 19.67 0.3 10.5p37i122c2 -41.3 0.8 -3.4 2.0 1.7 1.4 – – – 4.0p37i16c4 -1.6 1.5 -2.5 3.7 2.2 1.9 233±11 19.86 1.4 55.1p37i206c4 0.0 0.5 -7.3 – 2.7 2.7 64±6 19.12 0.3 14.5p37i207c4 0.0 -0.8 12.5 7.8 2.2 1.8 – – – 1.8p37i64c4 -1.3 1.1 1.2 4.6 1.7 -2.3 254±45 18.86 0.3 7.1p37i9c4 -5.9 2.1 -1.3 0.4 3.1 1.2 – – – 10.1p38i1c4 -0.9 -2.9 -0.4 – -0.8 2.1 – – – 5.5p38i76c4 0.0 5.6 -8.5 – 0.5 1.6 – – – 6.7p3i72c2 -7.9 0.5 -6.8 0.8 6.9 5.9 – – – 2.8p5i9c3 -0.7 -0.3 -1.9 4.2 2.0 2.3 100.±10. 18.93 0.2 14.3
p7i128c3 0.0 -0.8 -5.0 3.4 2.3 2.5 204±14 – – 27.2p7i133c3 0.0 -1.3 -3.6 – 3.4 -0.6 161±21 21.12 0.7 7.7p7i136c3 0.0 0.2 -4.4 2.3 3.4 1.9 168±10 20.08 0.7 18.4p7i1c2 -6.4 -1.5 -6.9 3.6 2.2 2.5 222±14 19.75 1.0 46.8p7i67c3 0.0 1.0 -3.6 9.9 2.6 3.2 127±8 19.44 0.3 16.5p9i20c3 -6.1 0.3 -3.6 3.3 3.2 2.1 112±10 21.29 1.6 22.3
NOTE. — Line strengths are given in Å of equivalent width, with negative values denoting emission, and positive values indicating absorption. No aperture corrections have beenapplied to the indices.σ0 lists velocity dispersions, when measured, and the values are aperture-corrected to a 3.′′4 diameter aperture at the distance to the Coma cluster.< µV >indicates the mean surface brightness within the effectiveradius,Re, in rest frame V-band, and is corrected for cosmological dimming. Typical errors on line indices are less than±0.2Å on HδA and HγA, and±0.1Å on [OII], Mgb, Fe5270, and Fe5335. Errors onµV and Re are 0.1 mag and 0.′′1, respectively.