Revolution in Flexible Wearable Electronics for Temperature ...
Upload
khangminh22Category
view
0download
0
A Wearable Fiber-free Optical Sensor for ContinuousMonitoring of Cerebral Blood Flow in FreelyBehaving MiceXuhui Liu
University of Kentucky https://orcid.org/0000-0002-2537-7838Daniel Irwin
University of KentuckyChong Huang
University of KentuckyYutong Gu
University of KentuckyLi Chen
University of Kentucky College of Public HealthKevin Donohue
University of KentuckyLei Chen
https://orcid.org/0000-0002-1218-8704Guoqiang Yu ( [email protected] )
University of Kentucky
Article
Keywords:
Posted Date: March 21st, 2022
DOI: https://doi.org/10.21203/rs.3.rs-1436222/v1
License: This work is licensed under a Creative Commons Attribution 4.0 International License. Read Full License
A Wearable Fiber-free Optical Sensor for Continuous Monitoring of Cerebral
Blood Flow in Freely Behaving Mice
Xuhui Liu1, Daniel A. Irwin1, Chong Huang1, Yutong Gu1, Li Chen2, Kevin D. Donohue3, Lei Chen4,
Guoqiang Yu1
1Department of Biomedical Engineering, University of Kentucky, Lexington, KY 40506, USA
2Biostatistics and Bioinformatics Shared Resource Facility, Markey Cancer Center, University of Kentucky,
Lexington, KY 40536, USA
3Department of Electrical and Computer Engineering, University of Kentucky, Lexington, KY 40506, USA
4Department of Physiology, Spinal Cord and Brain Injury Research Center, University of Kentucky,
Lexington, KY 40506, USA
Abstract
Wearable technologies for functional brain monitoring in freely behaving subjects would advance our
understanding of cognitive processing and adaptive behavior. Existing technologies are lacking in this
capability or need procedures which are invasive and/or otherwise impede brain assessments during social
behavioral conditions, exercise, and sleep. In response we developed a complete system combining cerebral
blood flow (CBF) measurement, O2 and CO2 supplies, and behavior recording for use on conscious, freely
behaving mice. An innovative diffuse speckle contrast flowmetry (DSCF) device and associated hardware
were miniaturized and optimized for small subject applications. The installation and use of this wearable,
fiber-free, near-infrared DSCF head-stage/probe required no craniotomy, invasive probe implantation, or
restraints of awake animals. Significant correlations were found between measurements with the new DSCF
design and an optical standard. The system successfully and repeatedly detected CBF responses to CO2-
induced hypercapnia in both anesthetized and moving mice. Collecting CBF and activity information
together during natural behaviors provides realistic physiological results and opens the path to exploring
their correlations with pathophysiological conditions.

Introduction
Cerebral blood flow (CBF) is a well-established physiological measure of brain health. Adequate supply of
oxygen and metabolic substrates to the brain through CBF supports brain development, maintains normal
brain function, achieves successful aging, and navigates acute/chronic medical conditions [1, 2]. Many
clinical situations, including stroke, traumatic brain injury, and neonatal asphyxia, expose the brain to
insufficient CBF, leading to cerebral ischemic/hypoxic stresses and neurological disorders [1, 3, 4]. On the
other hand, cerebral hyperemia (excessive CBF) may raise intracranial pressure or induce hemorrhage,
compressing and damaging delicate brain tissue. Moreover, abrupt and dramatic CBF changes are
commonly seen in several neurological diseases, such as subarachnoid hemorrhage patients (vasospasm)
and premature neonates (underdeveloped cardiovascular system and cerebrovascular autoregulation),
presenting life-threatening conditions that require immediate treatment [5, 6]. Thus, it is crucial to monitor
CBF variations continuously and longitudinally for early detection and management of cerebrovascular and
neurological disorders, and a better understanding of the underlying pathological mechanisms [7-10].
However, capable technologies are lacking, especially under free subject movement, hindering realization
of abundant clinical benefits as well as impacting neurological animal studies.
Rodents comprise 95% of the animal models used in contemporary biomedical research. Despite this
ubiquitous presence, conscious rodents pose technical challenges in taking CBF measurements and are
often anesthetized or immobilized. While avoiding motion artifacts, the influence of anesthesia on CBF has
been observed [11]. Anesthesia impacts neurovascular coupling and cerebral hemodynamics profoundly
and interferes with many neurological studies such as psychological/behavioral neuroscience, cognitive
function, sleep disorders, and neurological rehabilitation [12-14]. The anesthesia effect can last for several
hours, even after the animal regains consciousness. Immobilization techniques inhibit study outcomes by
limiting an animal’s social behavior, sleep, exercise and other regular activities. Avoiding anesthesia and
immobilization and continuously and longitudinally monitoring cerebral hemodynamics in conscious,
freely behaving animals is imperative to progress. With this ability follows more realistic physiological
information on pathological conditions and opportunities for studying their correlations with
pathophysiological consequences.
Traditional CBF modalities are generally ill-suited towards applications involving moving subjects,
continuous measurements, and/or longitudinal exposure. In response, a variety of wearable technologies
have been attempted for continuously monitoring the brain of awake rodents [15-20]. Wearable
microscopes including head-mounted 2-photon microscopes, miniature endoscopes, fiber photometers,
laser speckle contrast imaging (LSCI), and calcium fluorescent probes have already made significant
contributions to neuroscience [18, 19, 21-23]. Most microscopes use wide field illumination which limits
imaging depth to less than 1 mm. Other wearable techniques include ultrasonic probes for brain imaging
and implantable microelectrodes for brain wave and oxygen tension measurements [16, 17, 24]. However,
most wearable techniques for longitudinal monitoring require invasive craniotomy and/or permanent
implantation of probes on the cortex due to limited penetration/detection depths. These procedures are
invasive, require intricate surgical skills, and may disrupt cerebrovascular network and neural circuitry
integrity, alter cerebral hemodynamics, and lead to post-surgery complications [25-27]. Moreover, some
methods require head or body restraints, impeding natural behavior [28-30].
Near-infrared (NIR) diffuse optical techniques provide a noninvasive approach to probing deep cerebral
hemodynamics (up to several centimeters), including diffuse correlation spectroscopy (DCS) for tissue
blood flow measurements [31-33]. DCS systems detect the temporal diffuse laser speckle fluctuations
resulting from red blood cell (RBC) motions and have recovered CBF in awake rodents [34, 35]. However,
their large and expensive laser sources and single photon counting avalanche photodiode (APD) detectors
cannot be directly placed on the head. Instead, rigid and fragile optical fibers couple the sources and
detectors to the tissue surface, significantly constraining subject movement. Our group recently invented
an innovative wearable diffuse speckle contrast flow oximetry (DSCFO) technique (US Patent #10842422,
2017) [36] , which provides a simple, low-cost, fiber-free, portable, and compact alternative for continuous
and simultaneous monitoring of blood flow and oxygenation variations in tissues up to ~10 mm depth [37-
39]. Herein, we focus only on blood flow aspects and refer to this simply as DSCF (diffuse speckle contrast
flowmetry). DSCF utilizes a small laser diode source and tiny complementary metal oxide semiconductor
(CMOS) camera as a 2D detector. Measured spatial diffuse speckle contrasts are then related to tissue blood
flows. Thousands of parallel pixels on the inexpensive CMOS sensor significantly improved sampling
density and reduced device cost and dimensions. DSCF has been calibrated against established methods
(DCS and laser Doppler) in standard tissue-simulating phantoms with known optical properties,
anesthetized mice, and human forearms without any motion [37]. In contrast to DCS probes, the connection
between the DSCF probe and a compact controlling device are all soft electrical cables/wires (i.e., fiber-
free). Despite these benefits, the previous design was not optimized for handling unrestrained subjects and
protracted use.
The present study addressed these remaining issues for DSCF on three fronts. First, we created a
wearable, miniaturized, fiber-free optical sensor enabling safe and repeated monitoring of CBF variations
in freely behaving mice. This leveraged and improved upon the low-cost DSCF platform. Specifically, we
combined 3D-printed probe, head-stage, and dummy block components with a wire commutator forming a
robust attachment/detachment system. Importantly, the skull remained intact and underwent full protection
during and between experiments. A newly developed miniature printed circuit board (PCB) compressed the
control device size. Flexible electrical cables connecting the head probe and controlling hardware were fed
through the low-torque commutator preventing wire twisting. A custom graphical user interface (GUI)
communicated with the new device and displayed real-time CBF variations. We next integrated the system
with a movable piezoelectric pad and video camera (US Provisional Patent Application No. 63/143,667,
2021) [40] for continuous recording of animal activities, which are vital for assessing behavioral outcomes.
To further extend the utility of the system we also integrated a test cage, CO2 sensor, and gas supply for
applying CO2 inhalation and anesthesia. The complete system was validated against a comparable DCS
system in anesthetized mice during CO2 inhalation. Full capability was then demonstrated using CO2
inhalation on mice in an anesthetized then freely behaving state and repeated after 7 days recovery.
Collectively, we produced a highly impactful combination for noninvasive, continuous, and longitudinal
use in conscious, freely behaving subjects such as rodents and human infants.
Results
Wearable, fiber-free head-stage/probe optimized for continuous CBF
monitoring on unrestrained rodents
The typical probe-tissue interface was first decoupled into a wearable head-stage (base), probe, and dummy
block elements (Fig. 1). Each item was fabricated by 3D printing allowing for customization to rodents.
The pieces were made from smooth, biodegradable polylactic acid (PLA) material, commonly used in
medical implants. The material did not introduce abrasions or tissue interactions and appeared resistant to
scratching and chewing. The head-stage could hold a DSCF probe (measurements) or dummy block
(placeholder). This allowed the head-stage to remain over long periods (up to 6 months) without skull
exposure, while ensuring animals’ natural behavior and static measurement location. A commercial wire
commutator acted as an electrical swivel, accounting for the independent nature of the assembly. This was
made possible by DSCF having only fiber-free optoelectronic parts (laser diode and camera) with electrical
wire connections.
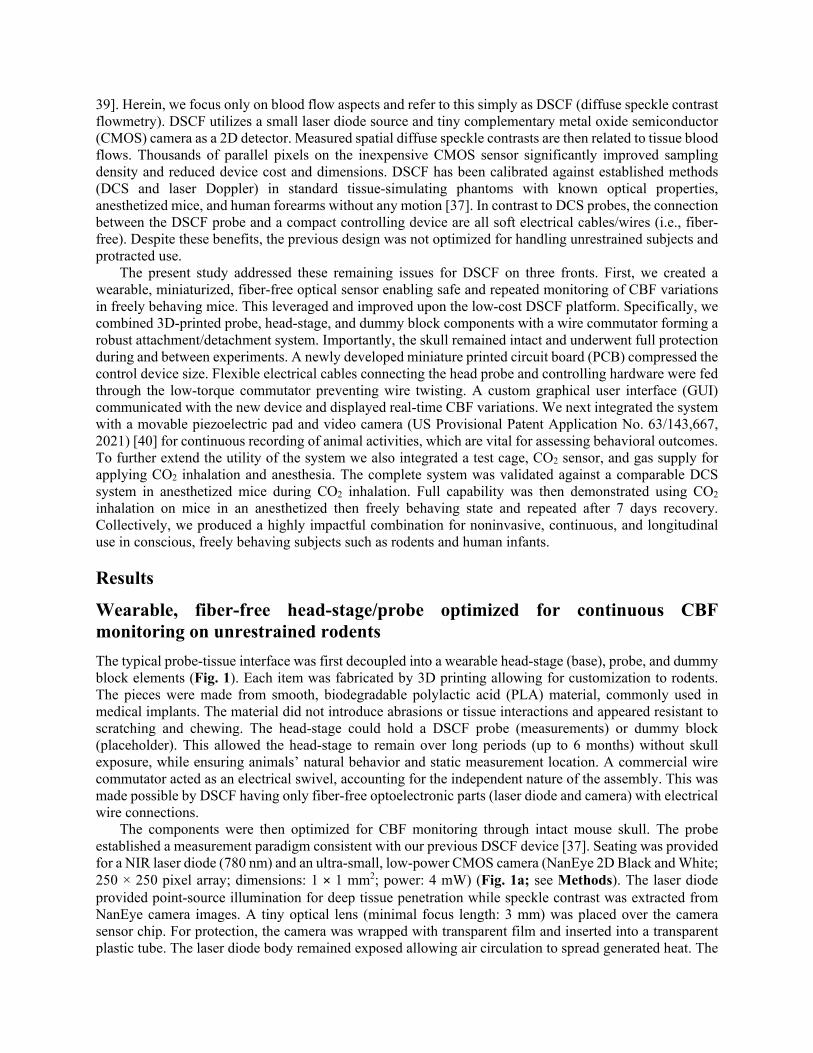
The components were then optimized for CBF monitoring through intact mouse skull. The probe
established a measurement paradigm consistent with our previous DSCF device [37]. Seating was provided
for a NIR laser diode (780 nm) and an ultra-small, low-power CMOS camera (NanEye 2D Black and White;
250 × 250 pixel array; dimensions: 1 × 1 mm2; power: 4 mW) (Fig. 1a; see Methods). The laser diode
provided point-source illumination for deep tissue penetration while speckle contrast was extracted from
NanEye camera images. A tiny optical lens (minimal focus length: 3 mm) was placed over the camera
sensor chip. For protection, the camera was wrapped with transparent film and inserted into a transparent
plastic tube. The laser diode body remained exposed allowing air circulation to spread generated heat. The
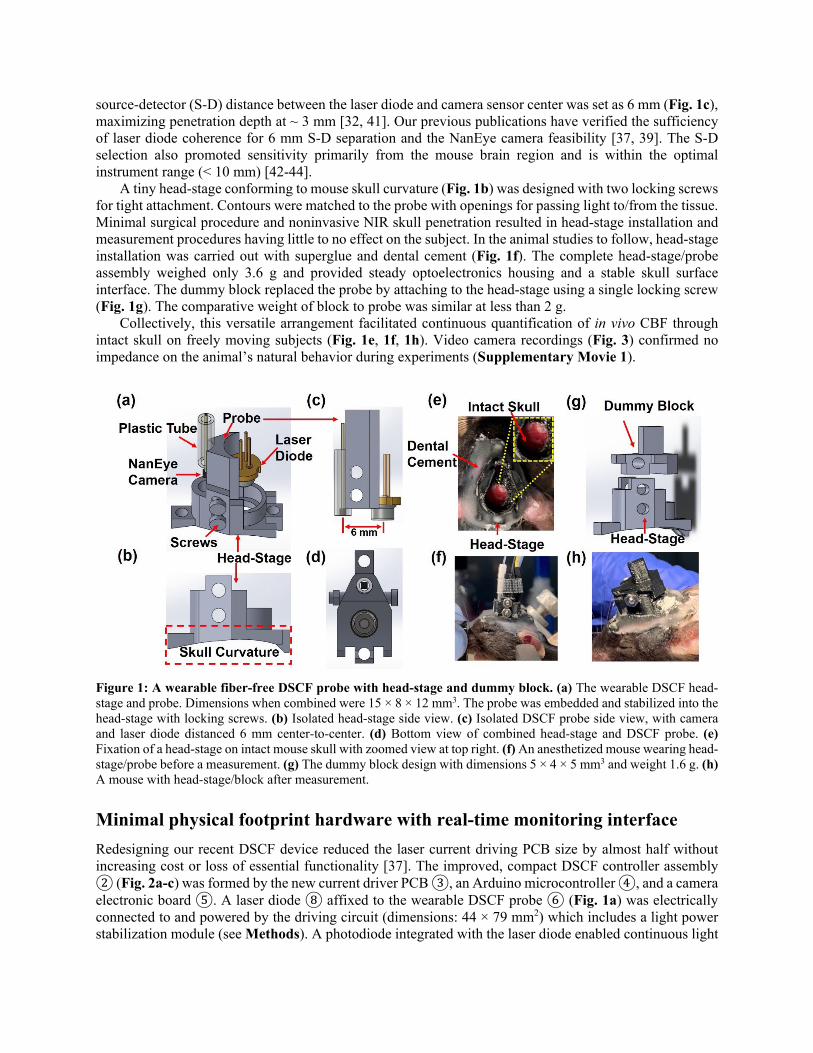
source-detector (S-D) distance between the laser diode and camera sensor center was set as 6 mm (Fig. 1c),
maximizing penetration depth at ~ 3 mm [32, 41]. Our previous publications have verified the sufficiency
of laser diode coherence for 6 mm S-D separation and the NanEye camera feasibility [37, 39]. The S-D
selection also promoted sensitivity primarily from the mouse brain region and is within the optimal
instrument range (< 10 mm) [42-44].
A tiny head-stage conforming to mouse skull curvature (Fig. 1b) was designed with two locking screws
for tight attachment. Contours were matched to the probe with openings for passing light to/from the tissue.
Minimal surgical procedure and noninvasive NIR skull penetration resulted in head-stage installation and
measurement procedures having little to no effect on the subject. In the animal studies to follow, head-stage
installation was carried out with superglue and dental cement (Fig. 1f). The complete head-stage/probe
assembly weighed only 3.6 g and provided steady optoelectronics housing and a stable skull surface
interface. The dummy block replaced the probe by attaching to the head-stage using a single locking screw
(Fig. 1g). The comparative weight of block to probe was similar at less than 2 g.
Collectively, this versatile arrangement facilitated continuous quantification of in vivo CBF through
intact skull on freely moving subjects (Fig. 1e, 1f, 1h). Video camera recordings (Fig. 3) confirmed no
impedance on the animal’s natural behavior during experiments (Supplementary Movie 1).
Figure 1: A wearable fiber-free DSCF probe with head-stage and dummy block. (a) The wearable DSCF head-
stage and probe. Dimensions when combined were 15 × 8 × 12 mm3. The probe was embedded and stabilized into the
head-stage with locking screws. (b) Isolated head-stage side view. (c) Isolated DSCF probe side view, with camera
and laser diode distanced 6 mm center-to-center. (d) Bottom view of combined head-stage and DSCF probe. (e)
Fixation of a head-stage on intact mouse skull with zoomed view at top right. (f) An anesthetized mouse wearing head-
stage/probe before a measurement. (g) The dummy block design with dimensions 5 × 4 × 5 mm3 and weight 1.6 g. (h)
A mouse with head-stage/block after measurement.
Minimal physical footprint hardware with real-time monitoring interface
Redesigning our recent DSCF device reduced the laser current driving PCB size by almost half without
increasing cost or loss of essential functionality [37]. The improved, compact DSCF controller assembly ② (Fig. 2a-c) was formed by the new current driver PCB ③, an Arduino microcontroller ④, and a camera
electronic board ⑤. A laser diode ⑧ affixed to the wearable DSCF probe ⑥ (Fig. 1a) was electrically
connected to and powered by the driving circuit (dimensions: 44 × 79 mm2) which includes a light power
stabilization module (see Methods). A photodiode integrated with the laser diode enabled continuous light
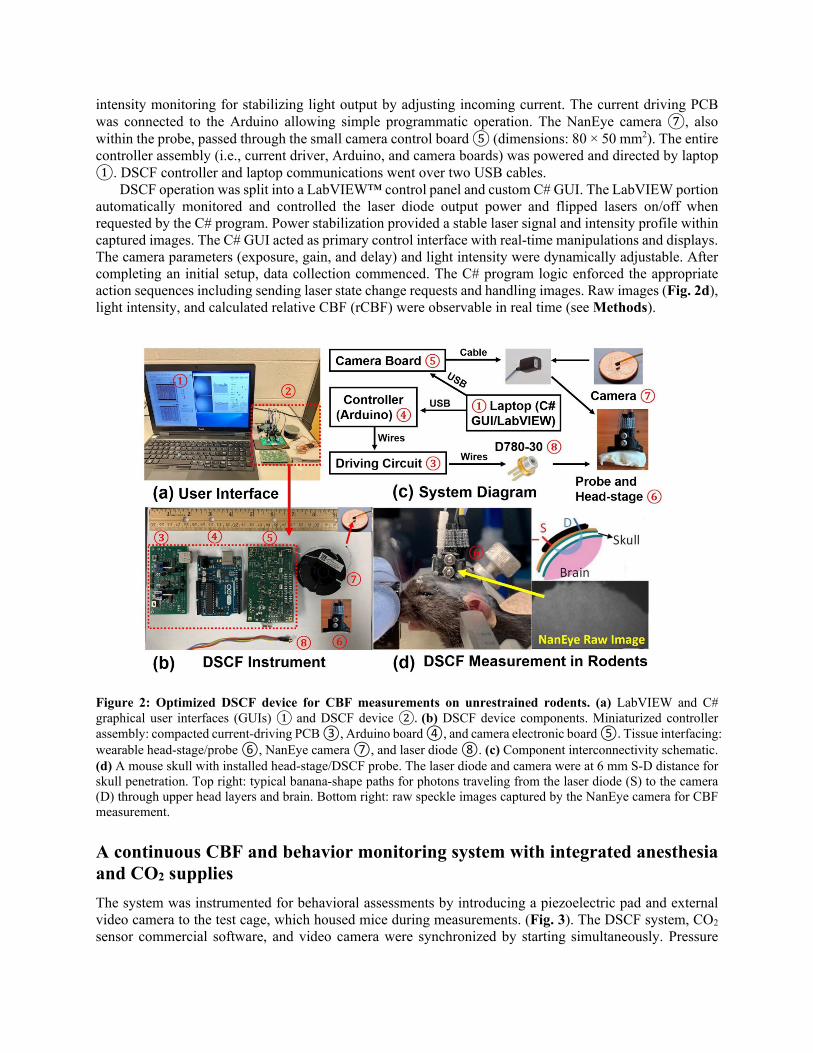
intensity monitoring for stabilizing light output by adjusting incoming current. The current driving PCB
was connected to the Arduino allowing simple programmatic operation. The NanEye camera ⑦, also
within the probe, passed through the small camera control board ⑤ (dimensions: 80 × 50 mm2). The entire
controller assembly (i.e., current driver, Arduino, and camera boards) was powered and directed by laptop ①. DSCF controller and laptop communications went over two USB cables.
DSCF operation was split into a LabVIEW™ control panel and custom C# GUI. The LabVIEW portion
automatically monitored and controlled the laser diode output power and flipped lasers on/off when
requested by the C# program. Power stabilization provided a stable laser signal and intensity profile within
captured images. The C# GUI acted as primary control interface with real-time manipulations and displays.
The camera parameters (exposure, gain, and delay) and light intensity were dynamically adjustable. After
completing an initial setup, data collection commenced. The C# program logic enforced the appropriate
action sequences including sending laser state change requests and handling images. Raw images (Fig. 2d),
light intensity, and calculated relative CBF (rCBF) were observable in real time (see Methods).
Figure 2: Optimized DSCF device for CBF measurements on unrestrained rodents. (a) LabVIEW and C#
graphical user interfaces (GUIs) ① and DSCF device ②. (b) DSCF device components. Miniaturized controller
assembly: compacted current-driving PCB ③, Arduino board ④, and camera electronic board ⑤. Tissue interfacing:
wearable head-stage/probe ⑥, NanEye camera ⑦, and laser diode ⑧. (c) Component interconnectivity schematic.
(d) A mouse skull with installed head-stage/DSCF probe. The laser diode and camera were at 6 mm S-D distance for
skull penetration. Top right: typical banana-shape paths for photons traveling from the laser diode (S) to the camera
(D) through upper head layers and brain. Bottom right: raw speckle images captured by the NanEye camera for CBF
measurement.
A continuous CBF and behavior monitoring system with integrated anesthesia
and CO2 supplies
The system was instrumented for behavioral assessments by introducing a piezoelectric pad and external
video camera to the test cage, which housed mice during measurements. (Fig. 3). The DSCF system, CO2
sensor commercial software, and video camera were synchronized by starting simultaneously. Pressure
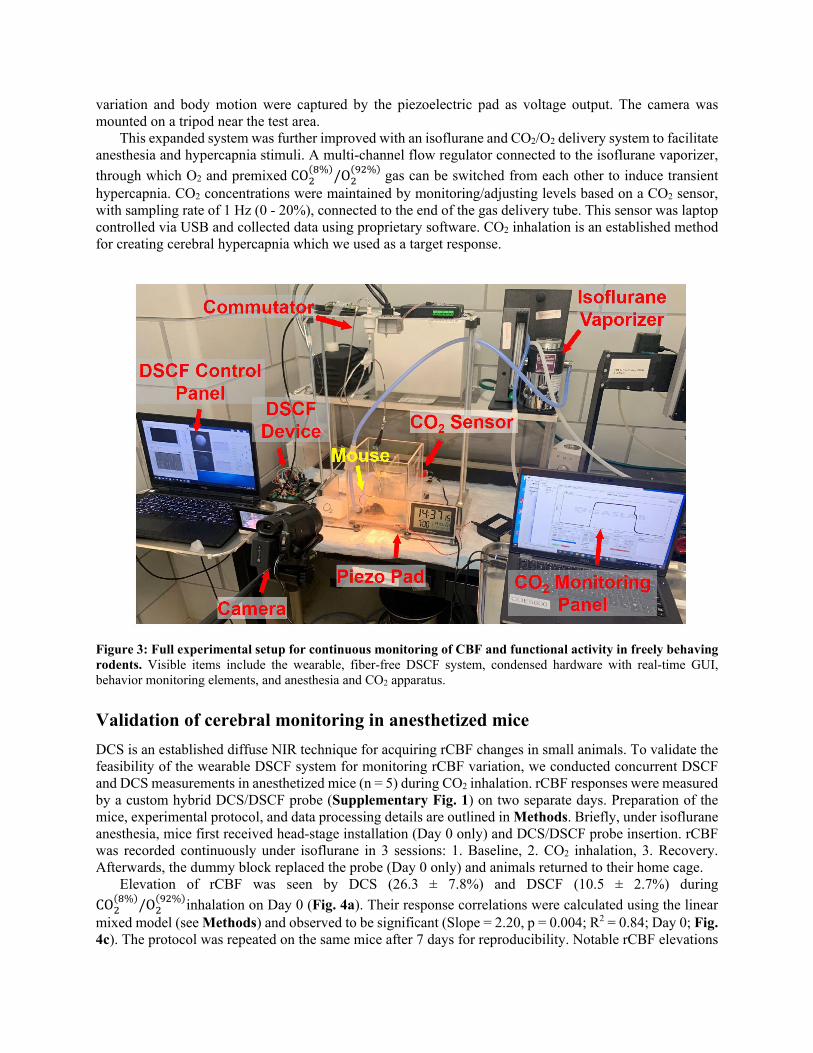
variation and body motion were captured by the piezoelectric pad as voltage output. The camera was
mounted on a tripod near the test area.
This expanded system was further improved with an isoflurane and CO2/O2 delivery system to facilitate
anesthesia and hypercapnia stimuli. A multi-channel flow regulator connected to the isoflurane vaporizer,
through which O2 and premixed CO2(8%)/O2(92%)
gas can be switched from each other to induce transient
hypercapnia. CO2 concentrations were maintained by monitoring/adjusting levels based on a CO2 sensor,
with sampling rate of 1 Hz (0 - 20%), connected to the end of the gas delivery tube. This sensor was laptop
controlled via USB and collected data using proprietary software. CO2 inhalation is an established method
for creating cerebral hypercapnia which we used as a target response.
Figure 3: Full experimental setup for continuous monitoring of CBF and functional activity in freely behaving
rodents. Visible items include the wearable, fiber-free DSCF system, condensed hardware with real-time GUI,
behavior monitoring elements, and anesthesia and CO2 apparatus.
Validation of cerebral monitoring in anesthetized mice
DCS is an established diffuse NIR technique for acquiring rCBF changes in small animals. To validate the
feasibility of the wearable DSCF system for monitoring rCBF variation, we conducted concurrent DSCF
and DCS measurements in anesthetized mice (n = 5) during CO2 inhalation. rCBF responses were measured
by a custom hybrid DCS/DSCF probe (Supplementary Fig. 1) on two separate days. Preparation of the
mice, experimental protocol, and data processing details are outlined in Methods. Briefly, under isoflurane
anesthesia, mice first received head-stage installation (Day 0 only) and DCS/DSCF probe insertion. rCBF
was recorded continuously under isoflurane in 3 sessions: 1. Baseline, 2. CO2 inhalation, 3. Recovery.
Afterwards, the dummy block replaced the probe (Day 0 only) and animals returned to their home cage.
Elevation of rCBF was seen by DCS (26.3 ± 7.8%) and DSCF (10.5 ± 2.7%) during
CO2(8%)/O2(92%)
inhalation on Day 0 (Fig. 4a). Their response correlations were calculated using the linear
mixed model (see Methods) and observed to be significant (Slope = 2.20, p = 0.004; R2 = 0.84; Day 0; Fig.
4c). The protocol was repeated on the same mice after 7 days for reproducibility. Notable rCBF elevations
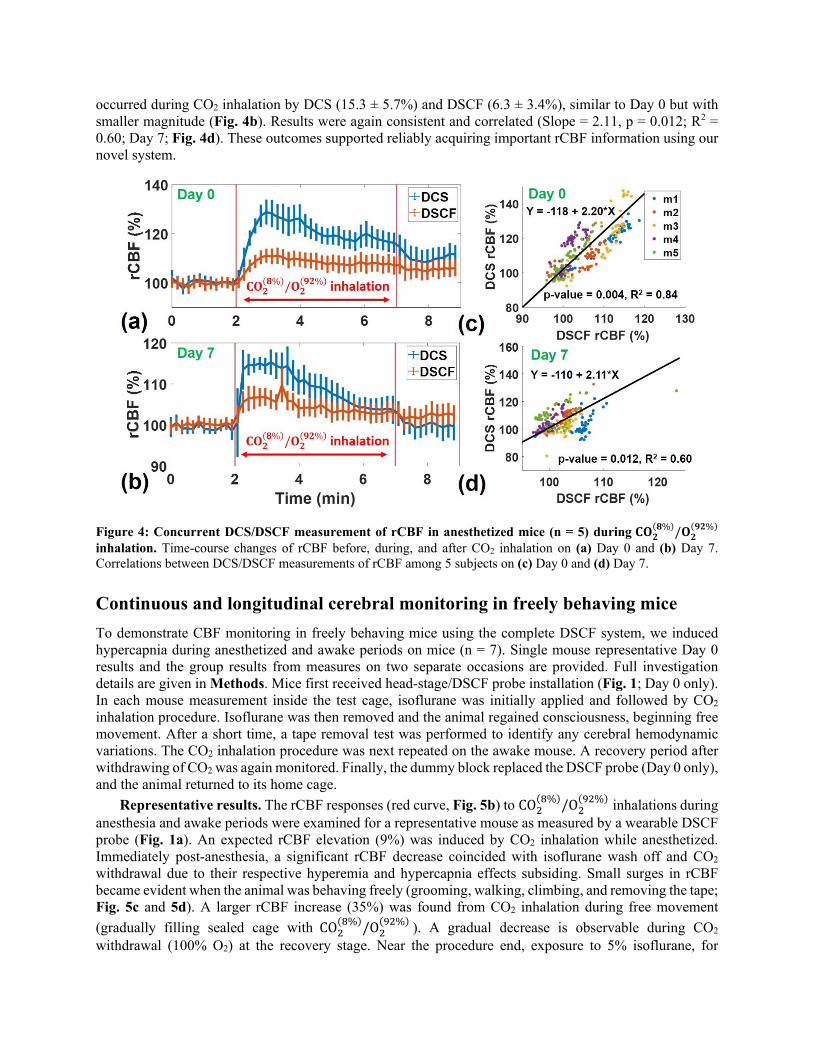
occurred during CO2 inhalation by DCS (15.3 ± 5.7%) and DSCF (6.3 ± 3.4%), similar to Day 0 but with
smaller magnitude (Fig. 4b). Results were again consistent and correlated (Slope = 2.11, p = 0.012; R2 =
0.60; Day 7; Fig. 4d). These outcomes supported reliably acquiring important rCBF information using our
novel system.
Figure 4: Concurrent DCS/DSCF measurement of rCBF in anesthetized mice (n = 5) during 𝐂𝐂𝐎𝐎𝟐𝟐(𝟖𝟖%)/𝐎𝐎𝟐𝟐(𝟗𝟗𝟐𝟐%)
inhalation. Time-course changes of rCBF before, during, and after CO2 inhalation on (a) Day 0 and (b) Day 7. Correlations between DCS/DSCF measurements of rCBF among 5 subjects on (c) Day 0 and (d) Day 7.
Continuous and longitudinal cerebral monitoring in freely behaving mice
To demonstrate CBF monitoring in freely behaving mice using the complete DSCF system, we induced
hypercapnia during anesthetized and awake periods on mice (n = 7). Single mouse representative Day 0
results and the group results from measures on two separate occasions are provided. Full investigation
details are given in Methods. Mice first received head-stage/DSCF probe installation (Fig. 1; Day 0 only).
In each mouse measurement inside the test cage, isoflurane was initially applied and followed by CO2
inhalation procedure. Isoflurane was then removed and the animal regained consciousness, beginning free
movement. After a short time, a tape removal test was performed to identify any cerebral hemodynamic
variations. The CO2 inhalation procedure was next repeated on the awake mouse. A recovery period after
withdrawing of CO2 was again monitored. Finally, the dummy block replaced the DSCF probe (Day 0 only),
and the animal returned to its home cage.
Representative results. The rCBF responses (red curve, Fig. 5b) to CO2(8%)/O2(92%)
inhalations during
anesthesia and awake periods were examined for a representative mouse as measured by a wearable DSCF
probe (Fig. 1a). An expected rCBF elevation (9%) was induced by CO2 inhalation while anesthetized.
Immediately post-anesthesia, a significant rCBF decrease coincided with isoflurane wash off and CO2
withdrawal due to their respective hyperemia and hypercapnia effects subsiding. Small surges in rCBF
became evident when the animal was behaving freely (grooming, walking, climbing, and removing the tape;
Fig. 5c and 5d). A larger rCBF increase (35%) was found from CO2 inhalation during free movement
(gradually filling sealed cage with CO2(8%)/O2(92%)
). A gradual decrease is observable during CO2
withdrawal (100% O2) at the recovery stage. Near the procedure end, exposure to 5% isoflurane, for
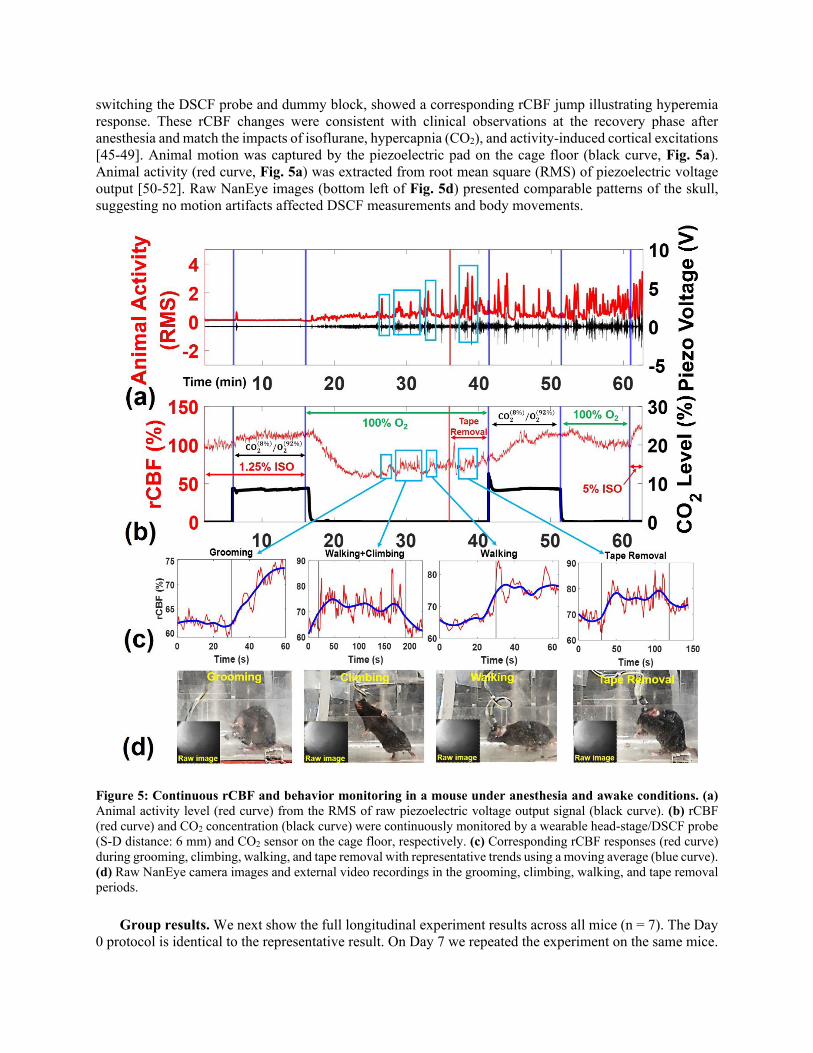
switching the DSCF probe and dummy block, showed a corresponding rCBF jump illustrating hyperemia
response. These rCBF changes were consistent with clinical observations at the recovery phase after
anesthesia and match the impacts of isoflurane, hypercapnia (CO2), and activity-induced cortical excitations
[45-49]. Animal motion was captured by the piezoelectric pad on the cage floor (black curve, Fig. 5a).
Animal activity (red curve, Fig. 5a) was extracted from root mean square (RMS) of piezoelectric voltage
output [50-52]. Raw NanEye images (bottom left of Fig. 5d) presented comparable patterns of the skull,
suggesting no motion artifacts affected DSCF measurements and body movements.
Figure 5: Continuous rCBF and behavior monitoring in a mouse under anesthesia and awake conditions. (a)
Animal activity level (red curve) from the RMS of raw piezoelectric voltage output signal (black curve). (b) rCBF
(red curve) and CO2 concentration (black curve) were continuously monitored by a wearable head-stage/DSCF probe
(S-D distance: 6 mm) and CO2 sensor on the cage floor, respectively. (c) Corresponding rCBF responses (red curve)
during grooming, climbing, walking, and tape removal with representative trends using a moving average (blue curve).
(d) Raw NanEye camera images and external video recordings in the grooming, climbing, walking, and tape removal
periods.
Group results. We next show the full longitudinal experiment results across all mice (n = 7). The Day
0 protocol is identical to the representative result. On Day 7 we repeated the experiment on the same mice.
Normalization of CBF was to the stable signal period prior to CO2 inhalation, separately for anesthesia and
awake responses, due to potential baseline shifts.
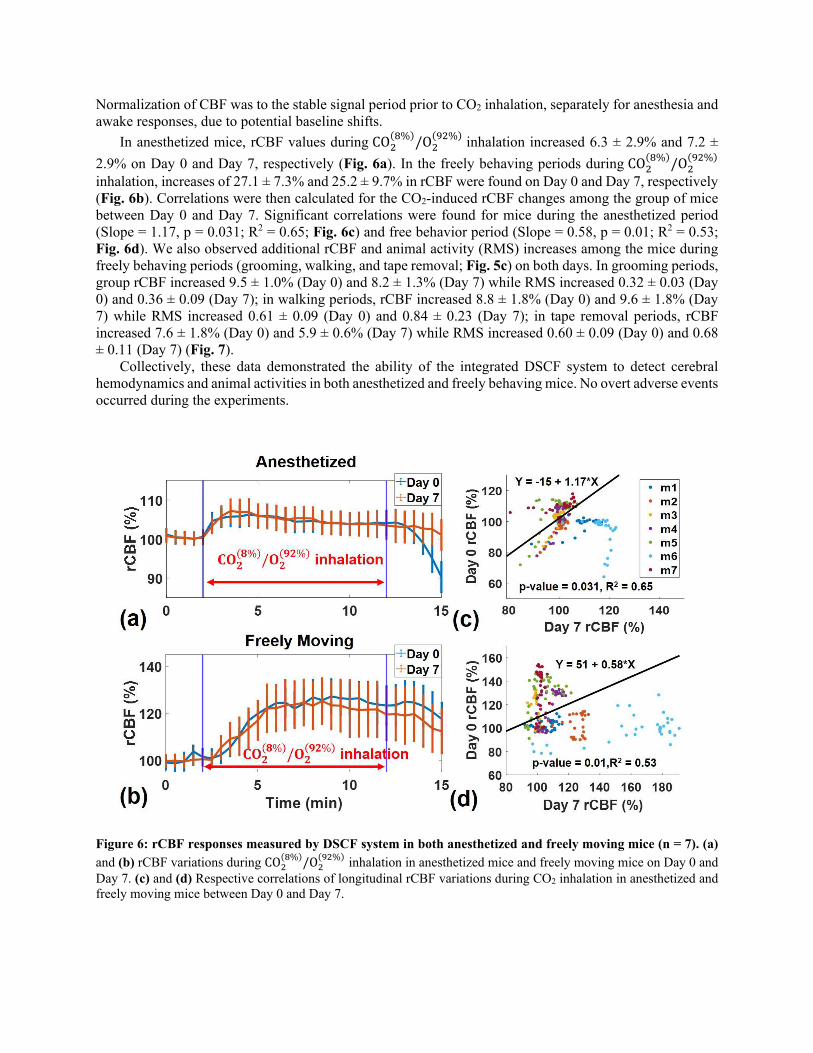
In anesthetized mice, rCBF values during CO2(8%)/O2(92%)
inhalation increased 6.3 ± 2.9% and 7.2 ±
2.9% on Day 0 and Day 7, respectively (Fig. 6a). In the freely behaving periods during CO2(8%)/O2(92%)
inhalation, increases of 27.1 ± 7.3% and 25.2 ± 9.7% in rCBF were found on Day 0 and Day 7, respectively
(Fig. 6b). Correlations were then calculated for the CO2-induced rCBF changes among the group of mice
between Day 0 and Day 7. Significant correlations were found for mice during the anesthetized period
(Slope = 1.17, p = 0.031; R2 = 0.65; Fig. 6c) and free behavior period (Slope = 0.58, p = 0.01; R2 = 0.53;
Fig. 6d). We also observed additional rCBF and animal activity (RMS) increases among the mice during
freely behaving periods (grooming, walking, and tape removal; Fig. 5c) on both days. In grooming periods,
group rCBF increased 9.5 ± 1.0% (Day 0) and 8.2 ± 1.3% (Day 7) while RMS increased 0.32 ± 0.03 (Day
0) and 0.36 ± 0.09 (Day 7); in walking periods, rCBF increased 8.8 ± 1.8% (Day 0) and 9.6 ± 1.8% (Day
7) while RMS increased 0.61 ± 0.09 (Day 0) and 0.84 ± 0.23 (Day 7); in tape removal periods, rCBF
increased 7.6 ± 1.8% (Day 0) and 5.9 ± 0.6% (Day 7) while RMS increased 0.60 ± 0.09 (Day 0) and 0.68
± 0.11 (Day 7) (Fig. 7).
Collectively, these data demonstrated the ability of the integrated DSCF system to detect cerebral
hemodynamics and animal activities in both anesthetized and freely behaving mice. No overt adverse events
occurred during the experiments.
Figure 6: rCBF responses measured by DSCF system in both anesthetized and freely moving mice (n = 7). (a)
and (b) rCBF variations during CO2(8%)/O2(92%)
inhalation in anesthetized mice and freely moving mice on Day 0 and
Day 7. (c) and (d) Respective correlations of longitudinal rCBF variations during CO2 inhalation in anesthetized and
freely moving mice between Day 0 and Day 7.
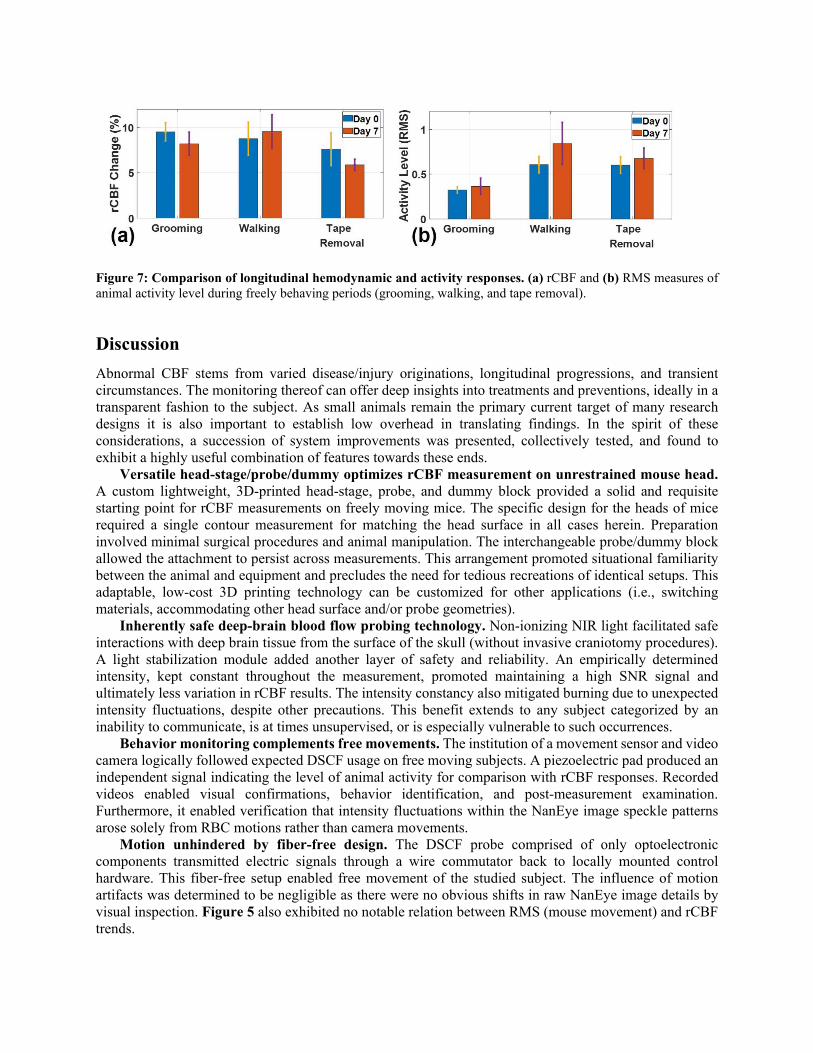
Figure 7: Comparison of longitudinal hemodynamic and activity responses. (a) rCBF and (b) RMS measures of
animal activity level during freely behaving periods (grooming, walking, and tape removal).
Discussion
Abnormal CBF stems from varied disease/injury originations, longitudinal progressions, and transient
circumstances. The monitoring thereof can offer deep insights into treatments and preventions, ideally in a
transparent fashion to the subject. As small animals remain the primary current target of many research
designs it is also important to establish low overhead in translating findings. In the spirit of these
considerations, a succession of system improvements was presented, collectively tested, and found to
exhibit a highly useful combination of features towards these ends.
Versatile head-stage/probe/dummy optimizes rCBF measurement on unrestrained mouse head.
A custom lightweight, 3D-printed head-stage, probe, and dummy block provided a solid and requisite
starting point for rCBF measurements on freely moving mice. The specific design for the heads of mice
required a single contour measurement for matching the head surface in all cases herein. Preparation
involved minimal surgical procedures and animal manipulation. The interchangeable probe/dummy block
allowed the attachment to persist across measurements. This arrangement promoted situational familiarity
between the animal and equipment and precludes the need for tedious recreations of identical setups. This
adaptable, low-cost 3D printing technology can be customized for other applications (i.e., switching
materials, accommodating other head surface and/or probe geometries).
Inherently safe deep-brain blood flow probing technology. Non-ionizing NIR light facilitated safe
interactions with deep brain tissue from the surface of the skull (without invasive craniotomy procedures).
A light stabilization module added another layer of safety and reliability. An empirically determined
intensity, kept constant throughout the measurement, promoted maintaining a high SNR signal and
ultimately less variation in rCBF results. The intensity constancy also mitigated burning due to unexpected
intensity fluctuations, despite other precautions. This benefit extends to any subject categorized by an
inability to communicate, is at times unsupervised, or is especially vulnerable to such occurrences.
Behavior monitoring complements free movements. The institution of a movement sensor and video
camera logically followed expected DSCF usage on free moving subjects. A piezoelectric pad produced an
independent signal indicating the level of animal activity for comparison with rCBF responses. Recorded
videos enabled visual confirmations, behavior identification, and post-measurement examination.
Furthermore, it enabled verification that intensity fluctuations within the NanEye image speckle patterns
arose solely from RBC motions rather than camera movements.
Motion unhindered by fiber-free design. The DSCF probe comprised of only optoelectronic
components transmitted electric signals through a wire commutator back to locally mounted control
hardware. This fiber-free setup enabled free movement of the studied subject. The influence of motion
artifacts was determined to be negligible as there were no obvious shifts in raw NanEye image details by
visual inspection. Figure 5 also exhibited no notable relation between RMS (mouse movement) and rCBF
trends.

User-friendly operation with real-time feedback. An operator friendly GUI provided an easy-to-use
interface. The ROI could be selected from within a live NanEye image which allowed fine control over the
reporting area. Real-time data was visualized through a combination of intuitive GUI graphs (laser current,
intensity fluctuations, rCBF) and dynamic numerical updates. These enabled rapid assessment and
adjustment to experimental progress and events.
Built-in support for anesthesia and hypercapnia. The utility of having anesthesia and CO2 facilities
directly accommodated highly simplifies their usage. Mice were successfully anesthetized using isoflurane
while a CO2/O2 mixture could be added when desired to achieve hypercapnia in the brain. The mixture is
adjustable, but for this study the ratio of CO2/O2 was 8%/92%. A sensor provided feedback on chamber
CO2 levels which were used to verify the proper level was reached during free movement testing.
Novel compact DSCF validated. Concurrent DSCF and DCS measurements on anesthetized mice
showed evident and repeated response to hypercapnia induced by CO2(8%)/O2(92%)
inhalation (Fig. 4a-b).
Correlation between the two systems was found to be significant (Slope = 2.20, p = 0.004, R2 = 0.84, Fig.
4c and Slope = 2.11, p = 0.012, R2 = 0.60, Fig. 4d for Day 0 and Day 7, respectively). From these results,
it is concluded that the novel DSCF system will give the same results as an equivalent DCS system.
Effectively, the sacrifice to rCBF recovery sensitivity by DSCF as compared to DCS will be offset in many
circumstances by improving cost, spatial sampling, portability, and miniaturization.
Integrated DSCF system enables analysis of rCBF and behavior correlations in moving subjects.
Investigation revealed DSCF sensitivity to hypercapnia clearly and consistently during anesthetized and
awake periods (Fig. 6a-b). The group average rCBF changes in conscious and anesthetized rodents during
CO2(8%)/O2(92%)
inhalation was consistent with previous findings using LDF, LSCI, positron emission
tomography, and magnetic resonance imaging [53-55]. Significant correlations in rCBF group responses to
CO2 between Day 0 and Day 7 measured by DSCF in both anesthetized (Slope = 1.17, p = 0.031, R2 = 0.65,
Fig. 6c) and freely moving (Slope = 0.58, p = 0.01, R2 = 0.53, Fig. 6d) periods showed measurement
repeatability.
Variations in rCBF coincided with the simultaneously measured RMS and video indicators of animal
behavior. The activities exhibited (Fig. 5c and Fig. 7) were representative of those typically encountered in
conscious mice. Furthermore, rCBF elevations induced by the animal behaviors agreed with previously
published research on freely moving rodents [56-58].
These results reflect the system’s capability to monitor rCBF without regard to mouse consciousness
and motion. Acquiring these awake state responses fills a previously lacking capability and is critical for
translatable results and clinical use. The path has been cleared to exploring correlations between behavior
and rCBF response which are crucial to understanding many pathological conditions.
Study limitations. Discrepancies in rCBF between DSCF and DCS during validation (Fig. 4) were
attributed to several details. The DCS optoelectronics included a single optical fiber connected to a high
temporal sampling, super sensitive, and expensive APD. The APD generates a full intensity decorrelation
curve for extracting flow information. By contrast, the cost-effective 2D NanEye camera spatial sampling
sensor selected a single exposure to maximize sensitivity and minimize noise [39, 59]. DSCF by design
compromises hitting this DCS benchmark to graduate other important features. Another discrepancy was
that the DCS fiber and DSCF camera were not located over the exact same region. Additionally, increasing
DSCF SNR through averaged spatial speckle contrast Ks window calculations may reduce flow sensitivity.
Discrepancies between rCBF from anesthetized mice within free movement testing (Fig. 6a) and
validation testing (Fig. 4a-b) are attributed as follows. Different groups of mice were used and few in
number (n = 5 or n = 7). Also, the NanEye camera was focused on the left hemisphere in the hybrid probe
(Supplementary Figure 1) and middle brain in the standard probe (Fig. 1). A heating pad was available
during DCS/DSCF validation, but not in free movement testing due to interfering vibrations with the piezo
signal. The animal body temperature was consequently not maintained throughout.
For the current study, behavior and hypercapnia effects on rCBF are not completely decoupled (Fig. 5-
6). Differences in CO2-induced rCBF response magnitudes between anesthetized (Day 0: 6.3 ± 2.9%; Day
7: 7.2 ± 2.9%) and free movement (Day 0: 27.1 ± 7.3%; Day 7: 25.2 ± 9.7%) states are attributable to
several influences. While anesthetized, isoflurane raises rCBF but is maintained at a constant level before
and during CO2 application. While conscious, free movements also raise rCBF during CO2 but the events
occur at random times and durations. Comparisons of rCBF to pre-baseline values in both cases shows that
CO2 still succeeded in evoking a sufficient increase for our analysis. Furthermore, both responses may
depend on subject medicinal response, activity exertion, sleep and hunger status, among others.
Future perspectives. There are several avenues for sublimation of the device and application extension.
More subjects may be recruited to instill greater confidence concerning DSCF sensitivity and constraints.
The working distance and spatial resolution are expandable, without significant modification, to extents
suitable for larger subjects. Additional laser diodes would increase S-D pairs for partial volume
(skull/surface layer) compensation [60]. Increasing working distance, ROI, and S-D pairs also facilitates
2D CBF mapping (using 2D NanEye), differential analysis, and 3D tomography.
Remaining Arduino input/output channels can support interlacing rCBF with other information such as
oxygenation information (DSCFO) enabling a more comprehensive behavior-hemodynamic picture. We
plan to apply such a system on human infants. Preliminary investigation using DSCF successfully recovered
blood flow changes through a realistic human infant skull filled with liquid phantom material. The head-
stage attachment mechanism will employ a custom 3D printed head strap instead of superglue and cement.
We are also implementing battery power and wireless connectivity features.
Herein, we developed a complete and fully integrated system for noninvasively monitoring rCBF and
behavior in freely moving mice. The system can conduct tests involving anesthesia, CO2 inhalation, and
natural movements while providing real-time feedback. We foresee utility in many neurological studies
with the proposed system such as small animals (e.g., mice) that require anesthesia and CO2 application or
continuous infant monitoring (e.g., clinic).
Methods
Fabrication of the probes, head-stage, and dummy block
The DSCF probe (Fig. 1c), head-stage (Fig. 1b), and dummy block (Fig. 1g) were designed using
SOLIDWORKS (Dassault Systemes) and fabricated by a 3D printer (X-Max, QiDi Tech) with
nontransparent, safe, and biodegradable PLA. During measurements, the probe was firmly attached to the
head-stage through two pairs of locking screws (Fig. 1a). The printable nature and material flexibility of
the stage promoted accommodating variations in the curvature of the skull (Fig. 1b). Prong structures (Fig.
1d) at the base further assisted in proper fitting as well as enlarging the contact area between the tissue
surface and head-stage, strengthening the effect of any applied adherents (e.g., superglue). A dummy block
(Fig. 1g and 1h) was implemented into the head-stage via the pair of screws for skull protection after the
measurement while the DSCF probe was not installed. The primary DSCF probe used throughout housed a
single laser diode (D780-30, Ø5.6 mm, 30 mW, 780 nm, US-Lasers) and a tiny CMOS camera (NanEye
2D Black & White; dimensions: 1 x 1 mm2, power: 4 mW, Awaiba). The NanEye camera (sensor chip
dimensions: 0.75 × 0.75 mm2; F number: 4) had a dynamic range of 58 dB with 3 × 3 µm2 pixel dimensions.
The working distance between the integrated camera lens and tissue surfaces were ~ 3 mm to ensure
appropriate optical focus and generated images of 4 × 4 mm2.
This system setup satisfied the Nyquist sampling criterion of 𝜌𝜌𝑠𝑠𝑠𝑠𝑠𝑠𝑠𝑠𝑠𝑠𝑠𝑠𝑠𝑠 > 2𝜌𝜌𝑠𝑠𝑝𝑝𝑝𝑝𝑠𝑠𝑠𝑠 where 𝜌𝜌𝑠𝑠𝑠𝑠𝑠𝑠𝑠𝑠𝑠𝑠𝑠𝑠𝑠𝑠 is the
minimum expected speckle size and 𝜌𝜌𝑠𝑠𝑝𝑝𝑝𝑝𝑠𝑠𝑠𝑠 the NanEye camera pixel size. The minimum expected speckle
size can impact spatial sampling and is related to the optics of the system and light source by [37, 38, 61]:
𝜌𝜌𝑠𝑠𝑠𝑠𝑠𝑠𝑠𝑠𝑠𝑠𝑠𝑠𝑠𝑠 = 2.44𝜆𝜆(1 + 𝑀𝑀)𝑓𝑓/#
(1)
where λ is the wavelength of light, M is the magnification, and 𝑓𝑓/# is the F number. In our design, M =
0.25 at the working distance of ~ 3 mm and 𝑓𝑓/# = 4.0. With 𝜌𝜌𝑠𝑠𝑠𝑠𝑠𝑠𝑠𝑠𝑠𝑠𝑠𝑠𝑠𝑠 = 9.5 μm and the pixel size from the NanEye specifications, 𝜌𝜌𝑠𝑠𝑝𝑝𝑝𝑝𝑠𝑠𝑠𝑠 = 3 μm, we thus determine that 9.5 μm > 6 μm.
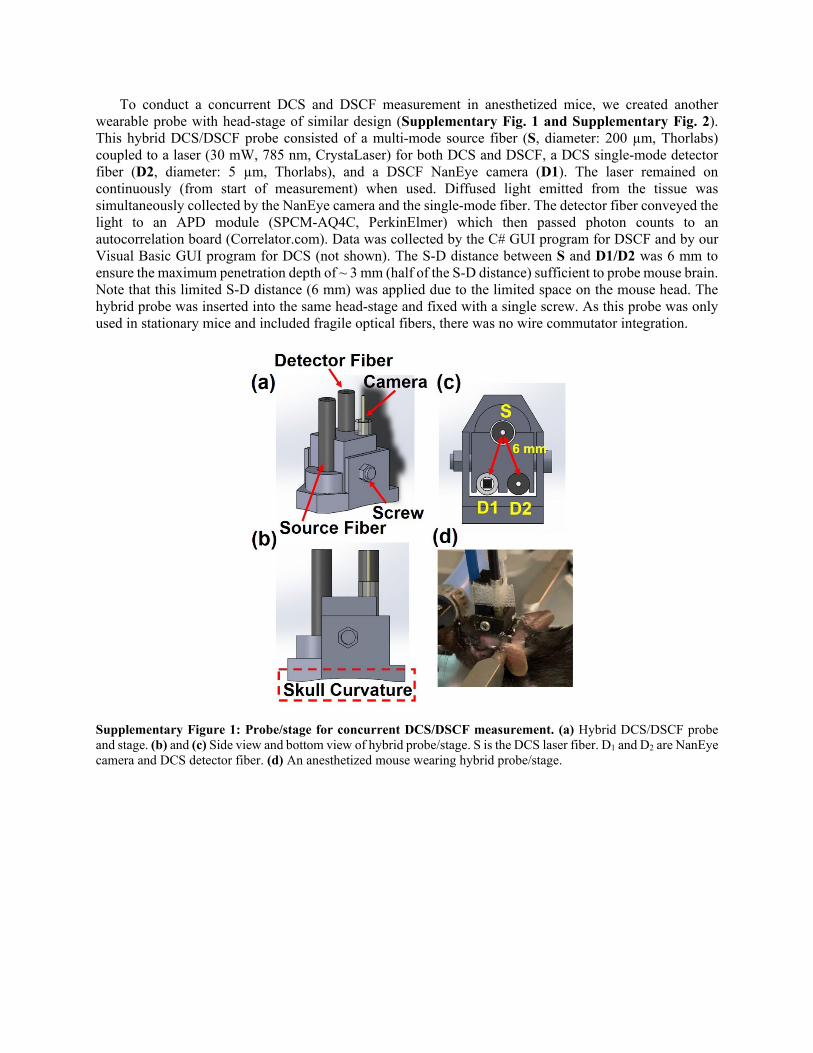
To conduct a concurrent DCS and DSCF measurement in anesthetized mice, we created another
wearable probe with head-stage of similar design (Supplementary Fig. 1 and Supplementary Fig. 2).
This hybrid DCS/DSCF probe consisted of a multi-mode source fiber (S, diameter: 200 µm, Thorlabs)
coupled to a laser (30 mW, 785 nm, CrystaLaser) for both DCS and DSCF, a DCS single-mode detector
fiber (D2, diameter: 5 µm, Thorlabs), and a DSCF NanEye camera (D1). The laser remained on
continuously (from start of measurement) when used. Diffused light emitted from the tissue was
simultaneously collected by the NanEye camera and the single-mode fiber. The detector fiber conveyed the
light to an APD module (SPCM-AQ4C, PerkinElmer) which then passed photon counts to an
autocorrelation board (Correlator.com). Data was collected by the C# GUI program for DSCF and by our
Visual Basic GUI program for DCS (not shown). The S-D distance between S and D1/D2 was 6 mm to
ensure the maximum penetration depth of ~ 3 mm (half of the S-D distance) sufficient to probe mouse brain.
Note that this limited S-D distance (6 mm) was applied due to the limited space on the mouse head. The
hybrid probe was inserted into the same head-stage and fixed with a single screw. As this probe was only
used in stationary mice and included fragile optical fibers, there was no wire commutator integration.
Supplementary Figure 1: Probe/stage for concurrent DCS/DSCF measurement. (a) Hybrid DCS/DSCF probe
and stage. (b) and (c) Side view and bottom view of hybrid probe/stage. S is the DCS laser fiber. D1 and D2 are NanEye
camera and DCS detector fiber. (d) An anesthetized mouse wearing hybrid probe/stage.
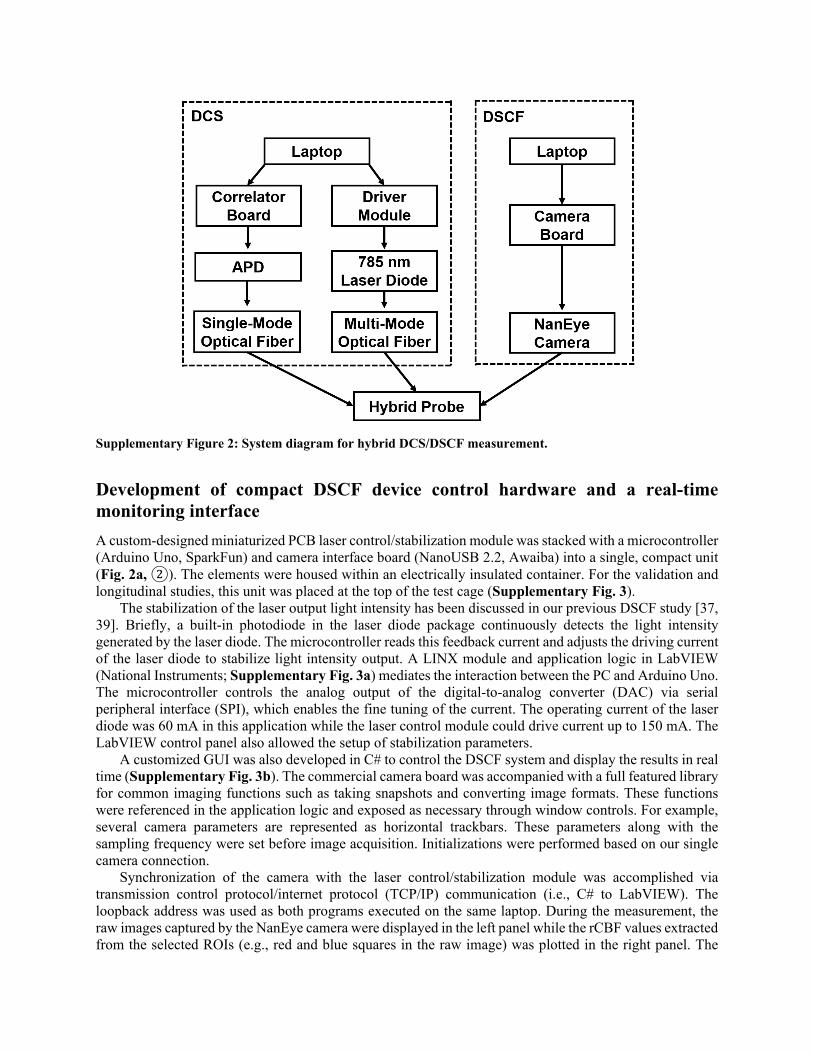
Supplementary Figure 2: System diagram for hybrid DCS/DSCF measurement.
Development of compact DSCF device control hardware and a real-time
monitoring interface
A custom-designed miniaturized PCB laser control/stabilization module was stacked with a microcontroller
(Arduino Uno, SparkFun) and camera interface board (NanoUSB 2.2, Awaiba) into a single, compact unit
(Fig. 2a, ②). The elements were housed within an electrically insulated container. For the validation and
longitudinal studies, this unit was placed at the top of the test cage (Supplementary Fig. 3).
The stabilization of the laser output light intensity has been discussed in our previous DSCF study [37,
39]. Briefly, a built-in photodiode in the laser diode package continuously detects the light intensity
generated by the laser diode. The microcontroller reads this feedback current and adjusts the driving current
of the laser diode to stabilize light intensity output. A LINX module and application logic in LabVIEW
(National Instruments; Supplementary Fig. 3a) mediates the interaction between the PC and Arduino Uno.
The microcontroller controls the analog output of the digital-to-analog converter (DAC) via serial
peripheral interface (SPI), which enables the fine tuning of the current. The operating current of the laser
diode was 60 mA in this application while the laser control module could drive current up to 150 mA. The
LabVIEW control panel also allowed the setup of stabilization parameters.
A customized GUI was also developed in C# to control the DSCF system and display the results in real
time (Supplementary Fig. 3b). The commercial camera board was accompanied with a full featured library
for common imaging functions such as taking snapshots and converting image formats. These functions
were referenced in the application logic and exposed as necessary through window controls. For example,
several camera parameters are represented as horizontal trackbars. These parameters along with the
sampling frequency were set before image acquisition. Initializations were performed based on our single
camera connection.
Synchronization of the camera with the laser control/stabilization module was accomplished via
transmission control protocol/internet protocol (TCP/IP) communication (i.e., C# to LabVIEW). The
loopback address was used as both programs executed on the same laptop. During the measurement, the
raw images captured by the NanEye camera were displayed in the left panel while the rCBF values extracted
from the selected ROIs (e.g., red and blue squares in the raw image) was plotted in the right panel. The
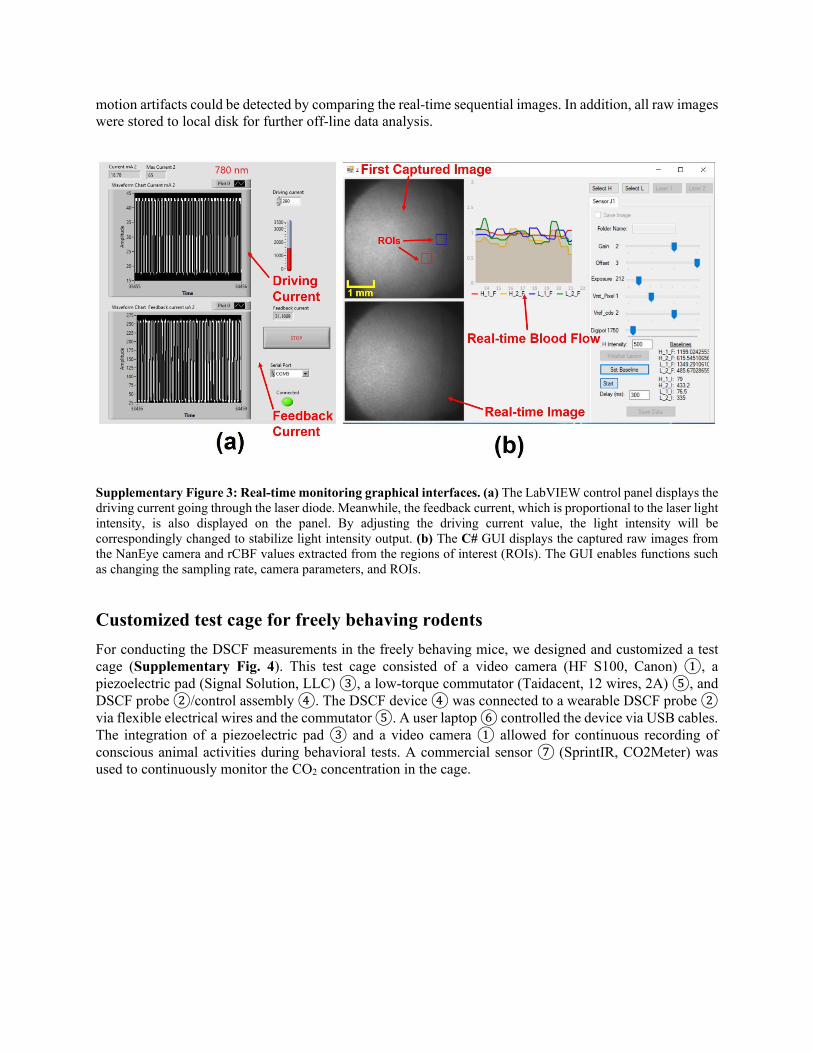
motion artifacts could be detected by comparing the real-time sequential images. In addition, all raw images
were stored to local disk for further off-line data analysis.
Supplementary Figure 3: Real-time monitoring graphical interfaces. (a) The LabVIEW control panel displays the
driving current going through the laser diode. Meanwhile, the feedback current, which is proportional to the laser light
intensity, is also displayed on the panel. By adjusting the driving current value, the light intensity will be
correspondingly changed to stabilize light intensity output. (b) The C# GUI displays the captured raw images from
the NanEye camera and rCBF values extracted from the regions of interest (ROIs). The GUI enables functions such
as changing the sampling rate, camera parameters, and ROIs.
Customized test cage for freely behaving rodents
For conducting the DSCF measurements in the freely behaving mice, we designed and customized a test
cage (Supplementary Fig. 4). This test cage consisted of a video camera (HF S100, Canon) ①, a
piezoelectric pad (Signal Solution, LLC) ③, a low-torque commutator (Taidacent, 12 wires, 2A) ⑤, and
DSCF probe ②/control assembly ④. The DSCF device ④ was connected to a wearable DSCF probe ②
via flexible electrical wires and the commutator ⑤. A user laptop ⑥ controlled the device via USB cables.
The integration of a piezoelectric pad ③ and a video camera ① allowed for continuous recording of
conscious animal activities during behavioral tests. A commercial sensor ⑦ (SprintIR, CO2Meter) was
used to continuously monitor the CO2 concentration in the cage.

Supplementary Figure 4: Customized test cage. Electrical signals transfer between the DSCF probe ② and control
assembly ④ via electrical wires and a commutator ⑤. A video camera ① and a piezoelectric pad ③ are used to
monitor animal activities. The control panel ⑥ is used to control the whole system. The CO2 concentration is
continuously monitored by a CO2 sensor ⑦ during the measurement.
Animal preparation
All animal experimental procedures and protocols on mice were approved by the University of Kentucky
Institutional Animal Care and Use Committee (IACUC). Twelve adult mice (10-12 weeks) were included
in this study (5 for concurrent DCS/DSCF measurements, 7 for DSCF freely behaving measurements).
Animal preparation procedures include the following tasks concerning experimental setup and protocols.
DSCF head-stage and probe installation. For initial head-stage installation, anesthesia was induced
with 5% isoflurane and maintained at 1.25% in O2 at a flow rate of 1 L/min. We gave the isoflurane at the
minimal level since it is known to elevate CBF [62]. The mouse head was secured on a stereotaxic (Kopf)
frame with 2 ear bars, a bite bar, and a nose cone. An ointment (Rugby) was applied topically to the eye to
protect the cornea. The head hair was removed with a clipper and cleaned with hair cream. The mouse scalp
was sterilized with Betadine followed by 70% ethanol and then a piece of scalp was surgically removed to
expose the skull with an area of approximately 8 × 12 mm2. After the cranium was cleaned thoroughly with
cotton gauze and air-dried, the fascia overlying the skull was removed, and a few drops of 100% ethanol
were applied on the surface which will absorb moisture for the bone and evaporate, to achieve a dry surface.
Then a head-stage (Fig. 1e) was permanently bonded onto the center of the intact skull with superglue
(LOCTITE) and dental acrylic cement (Stoelting). After the dental cement solidified, the DSCF probe was
inserted into the head stage cavity and secured with 2 screws for the rCBF measurement (Fig. 1f).
Concurrent DCS and DSCF measurements in anesthetized mice. A CO2 challenge (CO2(8%)/O2(92%)
gas mixture) was presented on Day 0. The CO2 levels were continuously monitored by a commercial sensor
and adjusted when necessary. At measurement conclusion, the probe set was demounted by removing the
screws. To protect the exposed skull and keep the visual field clean from dust or debris between
measurements, a small piece of thin plastic surgical tape was applied to cover the head stage bottom,
followed by the installation of a dummy block (Fig. 1g and 1h).

On the next measurement at Day 7, after removal of the dummy block and plastic surgical tape, the
exposed skull was cleaned with sterile saline and 70% ethanol. The DCS/DSCF probe (Supplementary
Fig. 1) was then secured into the pre-installed head-stage with screws. The CO2 challenge was then repeated
as on Day 0.
Continuous monitoring of rCBF in freely behaving mice. The DSCF-only probe (Fig. 1) and
repeated measurements at Day 0 and Day 7 required no unique alterations with respect to animal
preparations.
Experimental protocols
Methods to evoke CBF responses. The methods used to evoke CBF responses in the mice have been
established elsewhere. Firstly, we use low concentration CO2 (CO2(8%)/O2(92%)
in the current study), a well-
known vascular dilator, to elevate CBF increase [63, 64]. Secondly, voluntary physiological activities, such
as grooming, walking, and an adhesive tape removal test, a well-established protocol for detecting
neurological deficit [57, 65], were used to examine whether those self-orientated activities and the
coordinated front limb-paw motion can also induce CBF variation. The amplitude of CBF elevation has
been shown to indicate neurological activities and cerebral neurovascular coupling function [57, 66, 67].
Concurrent DCS and DSCF measurements in anesthetized mice (Supplementary Fig. 5a). After
the installation of the hybrid DCS/DSCF probe and head-stage under anesthesia using 1.25% isoflurane in
100% O2 via a mouse nose cone, DCS and DSCF recorded ~ 2 minutes for baseline, and then switched to
a premixed gas of CO2(8%)/O2(92%)
(from a commercial source) with 1.25% isoflurane using a Matheson
Mixer Rotameter for ~ 5 minutes to induce the rCBF increase. DCS and DSCF were then recorded for ~ 2
minutes as recovery data. We repeated the experiment following the same protocol on each mouse (n = 5)
after 7 days to validate the reproducibility of the concurrent DCS/DSCF measurements. For the DCS/DSCF
system setup, the exposure time of DSCF was set as 5 ms where previous studies found a corresponding
minimum was reached for speckle contrast noises [59, 68]. The sampling rate of both DSCF and DCS was
set as 2 Hz.
Continuous monitoring of rCBF in freely behaving mice (Supplementary Fig. 5b). The mouse was
put on the test cage floor (Fig. 3) and anesthetized using 1.25% isoflurane via a mouse nose cone. The
animal’s activities in the cage were continuously recorded with a video camera (SONY Handycam) and a
customized piezoelectric pad (Signal Solutions) located on the test cage floor (Fig. 3). After a ~ 2 minutes
baseline recording of DSCF data, the CO2(8%)/O2(92%)
gas mixture with 1-2% isoflurane was then
administered using a Matheson Mixer Rotameter for ~ 10 minutes to induce rCBF variations. After which
both CO2(8%)/O2(92%)
and isoflurane were stopped and 100% O2 flowed in. After the mouse regained
consciousness and started freely moving, its physiological behaviors were observed and evaluated for ~ 20
minutes. The animal was then subjected to the adhesive tape removal test. A piece of adhesive tape was
applied to the hairless area of a forepaw and the mouse was allowed 5 minutes to remove it by hand rubbing
or biting. After removing the tape or up to a 5-min test time, a CO2(8%)/O2(92%)
gas mixture was applied
again to fill the cage for ~ 10 minutes. After stopping the CO2 inhalation, DSCF measurement continued
for another ~ 5 minutes to record rCBF recovery. At end of the study, animals were re-anesthetized with
5% isoflurane, the probe was removed and dummy block mounted. We repeated the experiment following
the same protocol on each mouse (mouse #1 to mouse #7) after 7 days to validate the reproducibility of the
DSCF measurements. For the DSCF system setup, the exposure time of the camera was set as 5 ms and the
sampling rate was 2 Hz.
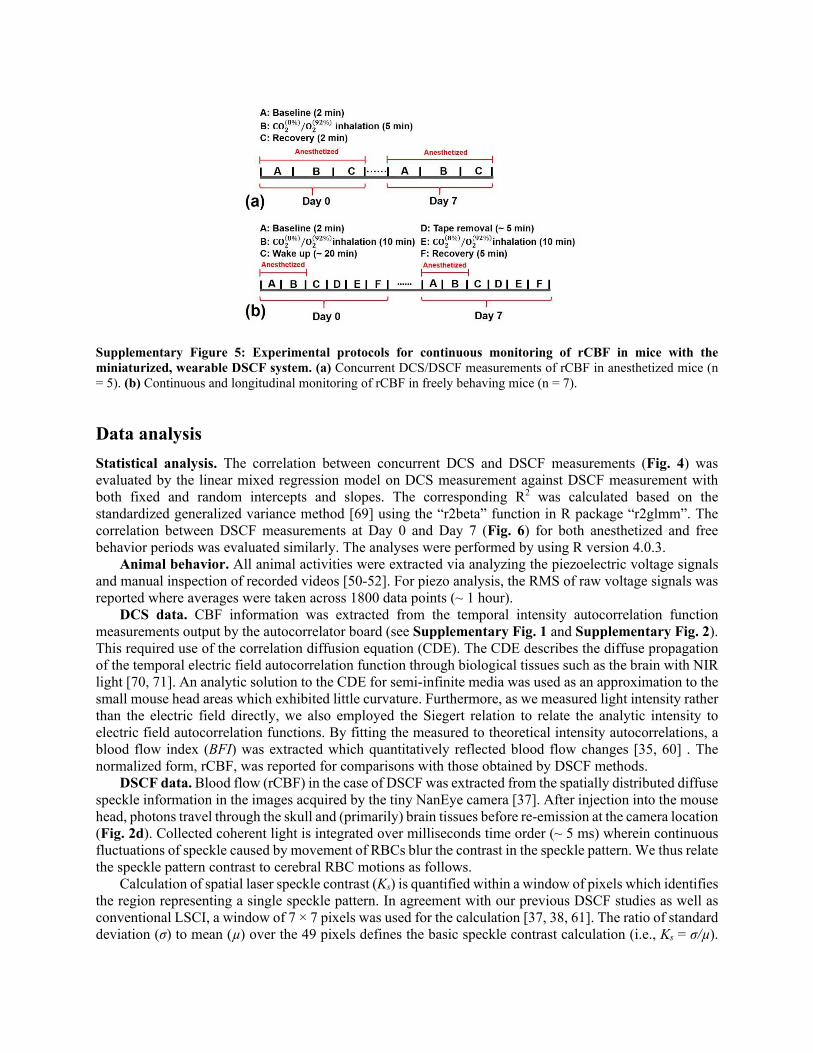
Supplementary Figure 5: Experimental protocols for continuous monitoring of rCBF in mice with the
miniaturized, wearable DSCF system. (a) Concurrent DCS/DSCF measurements of rCBF in anesthetized mice (n
= 5). (b) Continuous and longitudinal monitoring of rCBF in freely behaving mice (n = 7).
Data analysis
Statistical analysis. The correlation between concurrent DCS and DSCF measurements (Fig. 4) was
evaluated by the linear mixed regression model on DCS measurement against DSCF measurement with
both fixed and random intercepts and slopes. The corresponding R2 was calculated based on the
standardized generalized variance method [69] using the “r2beta” function in R package “r2glmm”. The
correlation between DSCF measurements at Day 0 and Day 7 (Fig. 6) for both anesthetized and free
behavior periods was evaluated similarly. The analyses were performed by using R version 4.0.3.
Animal behavior. All animal activities were extracted via analyzing the piezoelectric voltage signals
and manual inspection of recorded videos [50-52]. For piezo analysis, the RMS of raw voltage signals was
reported where averages were taken across 1800 data points (~ 1 hour).
DCS data. CBF information was extracted from the temporal intensity autocorrelation function
measurements output by the autocorrelator board (see Supplementary Fig. 1 and Supplementary Fig. 2).
This required use of the correlation diffusion equation (CDE). The CDE describes the diffuse propagation
of the temporal electric field autocorrelation function through biological tissues such as the brain with NIR
light [70, 71]. An analytic solution to the CDE for semi-infinite media was used as an approximation to the
small mouse head areas which exhibited little curvature. Furthermore, as we measured light intensity rather
than the electric field directly, we also employed the Siegert relation to relate the analytic intensity to
electric field autocorrelation functions. By fitting the measured to theoretical intensity autocorrelations, a
blood flow index (BFI) was extracted which quantitatively reflected blood flow changes [35, 60] . The
normalized form, rCBF, was reported for comparisons with those obtained by DSCF methods.
DSCF data. Blood flow (rCBF) in the case of DSCF was extracted from the spatially distributed diffuse
speckle information in the images acquired by the tiny NanEye camera [37]. After injection into the mouse
head, photons travel through the skull and (primarily) brain tissues before re-emission at the camera location
(Fig. 2d). Collected coherent light is integrated over milliseconds time order (~ 5 ms) wherein continuous
fluctuations of speckle caused by movement of RBCs blur the contrast in the speckle pattern. We thus relate
the speckle pattern contrast to cerebral RBC motions as follows.
Calculation of spatial laser speckle contrast (Ks) is quantified within a window of pixels which identifies
the region representing a single speckle pattern. In agreement with our previous DSCF studies as well as
conventional LSCI, a window of 7 × 7 pixels was used for the calculation [37, 38, 61]. The ratio of standard
deviation (σ) to mean (µ) over the 49 pixels defines the basic speckle contrast calculation (i.e., Ks = σ/µ).
Preprocessing of the raw images is described in our previous publications, but essentially consists of
correcting for shot and dark noise contributions by use of the modified calculation [37, 38, 72]:
𝐾𝐾𝑠𝑠 = �𝜎𝜎2(𝐼𝐼) − 𝜎𝜎2(𝐼𝐼𝐷𝐷)− 𝜎𝜎𝑆𝑆2(𝐼𝐼𝐶𝐶)𝜇𝜇2(𝐼𝐼𝐶𝐶)
(2)
where I is the light intensity of a single pixel and ID is the intensity of dark current. The incorporated shot
noise (IC = I – ID) follows Poisson statistics: 𝜎𝜎𝑠𝑠(𝐼𝐼𝐶𝐶) = �𝜇𝜇(𝐼𝐼𝐶𝐶).
A single detector is logically defined by combining a 3 × 3 grid of windows. The 9 values of Ks are
averaged to represent a single contrast value for the detector, thereby increasing the signal-to-noise ratio
(SNR). This effective detector has an S-D distance attributed to its center pixel location and a detection area
of ~ 0.18 mm2. A BFI was then extracted through a nonlinear relationship between Ks and BFI under semi-
infinite geometry [38, 73]. The relative change in BFI (rCBF) was calculated by normalizing BFI data to
the baseline value before physiological changes.
Data availability
All relevant data supporting the key findings of this study are available within the article and its
Supplementary Information files or from the corresponding author upon reasonable request.
References
[1] C. L. Chai, Y.-K. Tu, and S.-J. Huang, "Can cerebral hypoperfusion after sympathetic storm be
used to diagnose brain death? A retrospective survey in traumatic brain injury patients," Journal
of Trauma and Acute Care Surgery, vol. 64, no. 3, pp. 688-697, 2008.
[2] N. Brew, D. Walker, and F. Y. Wong, "Cerebral vascular regulation and brain injury in preterm
infants," American Journal of Physiology-Regulatory, Integrative and Comparative Physiology,
vol. 306, no. 11, pp. R773-R786, 2014.
[3] D. S. DeWitt and D. S. Prough, "Ameliorating cerebral hypoperfusion after traumatic brain
injury," Critical care medicine, vol. 27, no. 11, pp. 2592-2593, 1999.
[4] D. Attwell, A. M. Buchan, S. Charpak, M. Lauritzen, B. A. MacVicar, and E. A. Newman, "Glial
and neuronal control of brain blood flow," Nature, vol. 468, no. 7321, pp. 232-243, 2010.
[5] R. A. Reynolds et al., "Hyperoxemia and cerebral vasospasm in aneurysmal subarachnoid
hemorrhage," Neurocritical Care, vol. 35, no. 1, pp. 30-38, 2021.
[6] C. J. Rhee, C. S. da Costa, T. Austin, K. M. Brady, M. Czosnyka, and J. K. Lee, "Neonatal
cerebrovascular autoregulation," Pediatric research, vol. 84, no. 5, pp. 602-610, 2018.
[7] N. Roche-Labarbe et al., "Somatosensory evoked changes in cerebral oxygen consumption
measured non-invasively in premature neonates," Neuroimage, vol. 85, pp. 279-286, 2014.
[8] N. Roche‐Labarbe et al., "Noninvasive optical measures of CBV, StO2, CBF index, and
rCMRO2 in human premature neonates' brains in the first six weeks of life," Human brain
mapping, vol. 31, no. 3, pp. 341-352, 2010.
[9] R. C. Mesquita et al., "Direct measurement of tissue blood flow and metabolism with diffuse
optics," Philosophical Transactions of the Royal Society A: Mathematical, Physical and
Engineering Sciences, vol. 369, no. 1955, pp. 4390-4406, 2011.
[10] T. Durduran et al., "Optical measurement of cerebral hemodynamics and oxygen metabolism in
neonates with congenital heart defects," J Biomed Opt, vol. 15, no. 3, p. 037004, 2010.

[11] B. J. Saab et al., "Short-term memory impairment after isoflurane in mice is prevented by the α5 γ-aminobutyric acid type A receptor inverse agonist L-655,708," Anesthesiology: The Journal of
the American Society of Anesthesiologists, vol. 113, no. 5, pp. 1061-1071, 2010.
[12] F. Pizza, M. Biallas, U. Kallweit, M. Wolf, and C. L. Bassetti, "Cerebral hemodynamic changes
in stroke during sleep-disordered breathing," Stroke, vol. 43, no. 7, pp. 1951-1953, 2012.
[13] E. I. Eger, "IsofluraneA Review," Anesthesiology: The Journal of the American Society of
Anesthesiologists, vol. 55, no. 5, pp. 559-576, 1981.
[14] R. W. McPherson, J. R. Kirsch, J. R. Tobin, R. F. Ghaly, and R. J. Traystman, "Cerebral blood
flow in primates is increased by isoflurane over time and is decreased by nitric oxide synthase
inhibition," Anesthesiology: The Journal of the American Society of Anesthesiologists, vol. 80,
no. 6, pp. 1320-1327, 1994.
[15] K. Limnuson, R. K. Narayan, A. Chiluwal, E. V. Golanov, C. E. Bouton, and C. Li, "A User-
Configurable Headstage for Multimodality Neuromonitoring in Freely Moving Rats," Frontiers
in neuroscience, vol. 10, p. 382, 2016.
[16] D. Holschneider, J. I. Maarek, J. Yang, J. Harimoto, and O. Scremin, "Functional brain mapping
in freely moving rats during treadmill walking," Journal of Cerebral Blood Flow & Metabolism,
vol. 23, no. 8, pp. 925-932, 2003.
[17] R. Cao et al., "Functional and oxygen-metabolic photoacoustic microscopy of the awake mouse
brain," Neuroimage, vol. 150, pp. 77-87, 2017.
[18] W. Zong et al., "Fast high-resolution miniature two-photon microscopy for brain imaging in
freely behaving mice," Nature methods, vol. 14, no. 7, pp. 713-719, 2017.
[19] K. K. Ghosh et al., "Miniaturized integration of a fluorescence microscope," Nature methods, vol.
8, no. 10, p. 871, 2011.
[20] J. Senarathna et al., "A miniature multi-contrast microscope for functional imaging in freely
behaving animals," Nature communications, vol. 10, no. 1, pp. 1-13, 2019.
[21] F. Helmchen, M. S. Fee, D. W. Tank, and W. Denk, "A miniature head-mounted two-photon
microscope: high-resolution brain imaging in freely moving animals," Neuron, vol. 31, no. 6, pp.
903-912, 2001.
[22] Y. Hayashi, Y. Tagawa, S. Yawata, S. Nakanishi, and K. Funabiki, "Spatio‐temporal control of neural activity in vivo using fluorescence microendoscopy," European Journal of Neuroscience,
vol. 36, no. 6, pp. 2722-2732, 2012.
[23] T. Kobayashi et al., "Optical communication with brain cells by means of an implanted duplex
micro-device with optogenetics and Ca 2+ fluoroimaging," Scientific reports, vol. 6, p. 21247,
2016.
[24] D. A. Dombeck, A. N. Khabbaz, F. Collman, T. L. Adelman, and D. W. Tank, "Imaging large-
scale neural activity with cellular resolution in awake, mobile mice," Neuron, vol. 56, no. 1, pp.
43-57, 2007.
[25] H.-T. Xu, F. Pan, G. Yang, and W.-B. Gan, "Choice of cranial window type for in vivo imaging
affects dendritic spine turnover in the cortex," Nature neuroscience, vol. 10, no. 5, pp. 549-551,
2007.
[26] P. Cabrales and L. J. Carvalho, "Intravital microscopy of the mouse brain microcirculation using
a closed cranial window," JoVE (Journal of Visualized Experiments), no. 45, p. e2184, 2010.
[27] G. J. Goldey et al., "Removable cranial windows for long-term imaging in awake mice," Nature
protocols, vol. 9, no. 11, p. 2515, 2014.
[28] Z. V. Guo et al., "Procedures for behavioral experiments in head-fixed mice," PloS one, vol. 9,
no. 2, p. e88678, 2014.
[29] A. M. M. Fernández, A. Burman, A. I. M. Cáceres, C. J. Mininni, B. S. Zanutto, and S. E. Lew,
"A spherical treadmill system to train head-fixed adult rats," Journal of neuroscience methods,
vol. 297, pp. 22-30, 2018.
[30] D. A. Dombeck, M. S. Graziano, and D. W. Tank, "Functional clustering of neurons in motor
cortex determined by cellular resolution imaging in awake behaving mice," Journal of
Neuroscience, vol. 29, no. 44, pp. 13751-13760, 2009.
[31] R. Cheng, Y. Shang, D. Hayes Jr, S. P. Saha, and G. Yu, "Noninvasive optical evaluation of
spontaneous low frequency oscillations in cerebral hemodynamics," Neuroimage, vol. 62, no. 3,
pp. 1445-1454, 2012.
[32] C. Huang et al., "Noncontact diffuse optical assessment of blood flow changes in head and neck
free tissue transfer flaps," J Biomed Opt, vol. 20, no. 7, p. 075008, 2015.
[33] Y. Lin, C. Huang, D. Irwin, L. He, Y. Shang, and G. Yu, "Three-dimensional flow contrast
imaging of deep tissue using noncontact diffuse correlation tomography," Applied Physics
Letters, vol. 104, no. 12, p. 121103, 2014.
[34] D. S. Gareau et al., "Fiberoptic Probe For Hemodynamic Spectroscopy in Freely Moving Mice
Shows Cerebrovascular Dysregulation In Alzheimers and Glioma Models," bioRxiv, 2021.
[35] R. O. Brothers, N. Atlas, K. R. Cowdrick, and E. M. Buckley, "Cerebrovascular reactivity
measured in awake mice using diffuse correlation spectroscopy," Neurophotonics, vol. 8, no. 1, p.
015007, 2021.
[36] G. Yu, C. Huang, and J. T. Hastings, "Compact low-cost fiberless diffuse speckle contrast flow-
oximeter," ed: Google Patents, 2020.
[37] C. Huang et al., "A Wearable Fiberless Optical Sensor for Continuous Monitoring of Cerebral
Blood Flow in Mice," IEEE J Sel Top Quantum Electron, vol. 25, no. 1, Jan-Feb 2019, doi:
10.1109/JSTQE.2018.2854597.
[38] C. Huang et al., "Low-cost compact diffuse speckle contrast flowmeter using small laser diode
and bare charge-coupled-device," J Biomed Opt, vol. 21, no. 8, pp. 080501-080501, 2016, doi:
10.1117/1.JBO.21.8.080501.
[39] X. Liu et al., "Simultaneous measurements of tissue blood flow and oxygenation using a wearable
fiber-free optical sensor," Journal of Biomedical Optics, vol. 26, no. 1, p. 012705, 2021.
[40] G. Yu, C. Huang, L. Chen, X. Liu, K. D. Donohue, "An integrated system for continuous
monitoring of cerebral metabolism and functional activity in freely behaving animals," Patent
Appl. 63/143,667, 2021.
[41] C. Huang, Y. Lin, L. He, D. Irwin, M. M. Szabunio, and G. Yu, "Alignment of sources and
detectors on breast surface for noncontact diffuse correlation tomography of breast tumors,"
Applied optics, vol. 54, no. 29, pp. 8808-8816, 2015.
[42] Y. Tang and J. Yao, "3D Monte Carlo simulation of light distribution in mouse brain in
quantitative photoacoustic computed tomography," Quant Imaging Med Surg, vol. 11, no. 3, pp.
1046-1059, Mar 2021, doi: 10.21037/qims-20-815.
[43] F. Salehpour et al., "Penetration Profiles of Visible and Near-Infrared Lasers and Light-Emitting
Diode Light Through the Head Tissues in Animal and Human Species: A Review of Literature,"
Photobiomodul Photomed Laser Surg, vol. 37, no. 10, pp. 581-595, Oct 2019, doi:
10.1089/photob.2019.4676.
[44] V. Periyasamy and M. Pramanik, "Advances in Monte Carlo Simulation for Light Propagation in
Tissue," IEEE Rev Biomed Eng, vol. 10, pp. 122-135, 2017, doi: 10.1109/RBME.2017.2739801.
[45] L. Henriksen, "Brain luxury perfusion during cardiopulmonary bypass in humans. A study of the
cerebral blood flow response to changes in CO2, O2, and blood pressure," Journal of Cerebral
Blood Flow & Metabolism, vol. 6, no. 3, pp. 366-378, 1986.
[46] M. Lauritzen, "Long-lasting reduction of cortical blood flow of the rat brain after spreading
depression with preserved autoregulation and impaired CO2 response," Journal of Cerebral
Blood Flow & Metabolism, vol. 4, no. 4, pp. 546-554, 1984.
[47] C.-X. Li, S. Patel, D. J. Wang, and X. Zhang, "Effect of high dose isoflurane on cerebral blood
flow in macaque monkeys," Magnetic resonance imaging, vol. 32, no. 7, pp. 956-960, 2014.
[48] C. Lenz, A. Rebel, K. van Ackern, W. Kuschinsky, and K. F. Waschke, "Local cerebral blood
flow, local cerebral glucose utilization, and flow-metabolism coupling during sevoflurane versus
isoflurane anesthesia in rats," Anesthesiology: The Journal of the American Society of
Anesthesiologists, vol. 89, no. 6, pp. 1480-1488, 1998.
[49] H. Takuwa, T. Matsuura, T. Obata, H. Kawaguchi, I. Kanno, and H. Ito, "Hemodynamic changes
during somatosensory stimulation in awake and isoflurane-anesthetized mice measured by laser-
Doppler flowmetry," Brain research, vol. 1472, pp. 107-112, 2012.
[50] K. D. Donohue, D. C. Medonza, E. R. Crane, and B. F. O'Hara, "Assessment of a non-invasive
high-throughput classifier for behaviours associated with sleep and wake in mice," Biomedical
engineering online, vol. 7, no. 1, p. 14, 2008.
[51] J. L. Harrison et al., "Resolvins AT-D1 and E1 differentially impact functional outcome, post-
traumatic sleep, and microglial activation following diffuse brain injury in the mouse," Brain
Behav Immun, vol. 47, pp. 131-40, Jul 2015, doi: 10.1016/j.bbi.2015.01.001.
[52] G. M. Mang, J. Nicod, Y. Emmenegger, K. D. Donohue, B. F. O'Hara, and P. Franken,
"Evaluation of a piezoelectric system as an alternative to electroencephalogram/ electromyogram
recordings in mouse sleep studies," Sleep, vol. 37, no. 8, pp. 1383-92, Aug 1 2014, doi:
10.5665/sleep.3936.
[53] H. Takuwa et al., "Development of a simultaneous optical/PET imaging system for awake mice,"
Physics in Medicine & Biology, vol. 61, no. 17, p. 6430, 2016.
[54] K. Sicard et al., "Regional cerebral blood flow and BOLD responses in conscious and
anesthetized rats under basal and hypercapnic conditions: implications for functional MRI
studies," Journal of Cerebral Blood Flow & Metabolism, vol. 23, no. 4, pp. 472-481, 2003.
[55] A. Nishino, H. Takuwa, T. Urushihata, H. Ito, Y. Ikoma, and T. Matsuura, "Vasodilation
mechanism of cerebral microvessels induced by neural activation under high baseline cerebral
blood flow level results from hypercapnia in awake mice," Microcirculation, vol. 22, no. 8, pp.
744-752, 2015.
[56] E. Tiran et al., "Transcranial functional ultrasound imaging in freely moving awake mice and
anesthetized young rats without contrast agent," Ultrasound in medicine & biology, vol. 43, no. 8,
pp. 1679-1689, 2017.
[57] V. Bouet et al., "The adhesive removal test: a sensitive method to assess sensorimotor deficits in
mice," Nature protocols, vol. 4, no. 10, pp. 1560-1564, 2009.
[58] P. Miao et al., "Chronic wide-field imaging of brain hemodynamics in behaving animals,"
Biomedical optics express, vol. 8, no. 1, pp. 436-445, 2017.
[59] S. Yuan, A. Devor, D. A. Boas, and A. K. Dunn, "Determination of optimal exposure time for
imaging of blood flow changes with laser speckle contrast imaging," Applied optics, vol. 44, no.
10, pp. 1823-1830, 2005.
[60] C. Huang et al., "Noninvasive noncontact speckle contrast diffuse correlation tomography of
cerebral blood flow in rats," Neuroimage, vol. 198, pp. 160-169, 2019.
[61] D. A. Boas and A. K. Dunn, "Laser speckle contrast imaging in biomedical optics," J Biomed
Opt, vol. 15, no. 1, p. 011109, Jan-Feb 2010, doi: 10.1117/1.3285504.
[62] B. F. Matta, K. J. Heath, K. Tipping, and A. C. Summors, "Direct cerebral vasodilatory effects of
sevoflurane and isoflurane," The Journal of the American Society of Anesthesiologists, vol. 91,
no. 3, pp. 677-677, 1999.
[63] M. Jones, J. Berwick, and J. Mayhew, "Changes in blood flow, oxygenation, and volume
following extended stimulation of rodent barrel cortex," Neuroimage, vol. 15, no. 3, pp. 474-487,
2002.
[64] T. Dalkara, K. Irikura, Z. Huang, N. Panahian, and M. Moskowitz, "Cerebrovascular responses
under controlled and monitored physiological conditions in the anesthetized mouse," Journal of
Cerebral Blood Flow & Metabolism, vol. 15, no. 4, pp. 631-638, 1995.
[65] R. J. Komotar et al., "Neurologic assessment of somatosensory dysfunction following an
experimental rodent model of cerebral ischemia," Nature protocols, vol. 2, no. 10, pp. 2345-2347,
2007.

[66] V. Bouët, T. Freret, J. Toutain, D. Divoux, M. Boulouard, and P. Schumann-Bard, "Sensorimotor
and cognitive deficits after transient middle cerebral artery occlusion in the mouse," Experimental
neurology, vol. 203, no. 2, pp. 555-567, 2007.
[67] T. Freret et al., "Behavioral deficits after distal focal cerebral ischemia in mice: Usefulness of
adhesive removal test," Behavioral neuroscience, vol. 123, no. 1, p. 224, 2009.
[68] D. Briers et al., "Laser speckle contrast imaging: theoretical and practical limitations," J Biomed
Opt, vol. 18, no. 6, p. 066018, 2013.
[69] B. C. Jaeger, L. J. Edwards, K. Das, and P. K. Sen, "An R 2 statistic for fixed effects in the
generalized linear mixed model," Journal of Applied Statistics, vol. 44, no. 6, pp. 1086-1105,
2017.
[70] D. A. Boas and A. G. Yodh, "Spatially varying dynamical properties of turbid media probed with
diffusing temporal light correlation," J Opt Soc Am A, vol. 14, no. 1, pp. 192-215, JAN 1997.
[Online]. Available: <Go to ISI>://A1997WC08600023.
[71] Y. Shang, T. Li, and G. Yu, "Clinical applications of near-infrared diffuse correlation
spectroscopy and tomography for tissue blood flow monitoring and imaging," Physiological
measurement, vol. 38, no. 4, p. R1, 2017.
[72] C. Huang et al., "Speckle contrast diffuse correlation tomography of complex turbid medium
flow," Med Phys, vol. 42, no. 7, pp. 4000-6, Jul 2015, doi: 10.1118/1.4922206.
[73] C. Huang et al., "Noncontact 3-dimensional Speckle Contrast Diffuse Correlation Tomography of
Tissue Blood Flow Distribution," IEEE Transactions on Medical Imaging, vol. 36, no. 10, pp.
2068-2076, 2017, doi: 10.1109/TMI.2017.2708661.
Acknowledgements
This study was funded by the National Institutes of Health (NIH, Grants No. R01-EB028792, NO. R01-
HD101508, No. R56-NS117587, and No. R21-HD091118), American Heart Association (AHA Grants
#16GRNT30820006 and #14SDG20480186), and National Science Foundation (NSH Grant #1539068).
The content is solely the responsibility of the authors and does not necessarily represent the official views
of the NIH, AHA, or NSF.
Author Contributions
G.Y. and Lei C. conceived and supervised this project. X.L. wrote the initial manuscript. D.I., X.L., Lei C.,
and G.Y. revised the manuscript. X.L. and Lei C. designed the wearable probes. X.L. collected and analyzed
the data. Lei C. conducted animal surgery. Li C. performed statistical analysis on the data. K.D.D. aided
with data collection and analysis using the piezo electrical sensor. D.I., C.H., and Y.G. provided assistance
with user interface design. Y.G., C.H., and X.L. designed and optimized the circuit board.
Corresponding author
Correspondence should be addressed to Guoqiang Yu and Lei Chen.

Supplementary Files
This is a list of supplementary �les associated with this preprint. Click to download.
Supplementary392022.docx
Copyright © 2022 FDOKUMEN