A trait database of stream invertebrates for the ecological risk assessment of single and combined...
10
This article appeared in a journal published by Elsevier. The attached copy is furnished to the author for internal non-commercial research and education use, including for instruction at the authors institution and sharing with colleagues. Other uses, including reproduction and distribution, or selling or licensing copies, or posting to personal, institutional or third party websites are prohibited. In most cases authors are permitted to post their version of the article (e.g. in Word or Tex form) to their personal website or institutional repository. Authors requiring further information regarding Elsevier’s archiving and manuscript policies are encouraged to visit: http://www.elsevier.com/copyright
Transcript of A trait database of stream invertebrates for the ecological risk assessment of single and combined...
This article appeared in a journal published by Elsevier. The attached
copy is furnished to the author for internal non-commercial research
and education use, including for instruction at the authors institution
and sharing with colleagues.
Other uses, including reproduction and distribution, or selling or
licensing copies, or posting to personal, institutional or third party
websites are prohibited.
In most cases authors are permitted to post their version of the
article (e.g. in Word or Tex form) to their personal website or
institutional repository. Authors requiring further information
regarding Elsevier’s archiving and manuscript policies are
encouraged to visit:
http://www.elsevier.com/copyright

Author's personal copy
A trait database of stream invertebrates for the ecological risk assessment of singleand combined effects of salinity and pesticides in South-East Australia
Ralf B. Schäfer a,b,!, Ben J. Kefford a,c, Leon Metzeling d, Matthias Liess e, Sinje Burgert e, Richard Marchant f,Vincent Pettigrove g, Peter Goonan h, Dayanthi Nugegoda a
a Biotechnology and Environmental Biology, School of Applied Sciences, RMIT University, PO Box 71, Bundoora, Victoria 3083, Australiab Institute for Environmental Sciences, University Koblenz-Landau, Forststraße 7, 76829 Landau, Germanyc Centre for Environmental Sustainability, Department of Environmental Science, University of Technology Sydney, 15 Broadway, Ultimo, New South Wales 2007, Australiad Environment Protection Authority Victoria, Ernest Jones Drive, Macleod, Victoria 3085, Australiae UFZ-Helmholtz Centre for Environmental Research, Department System Ecotoxicology, Permoser Straße 15, 04318 Leipzig, Germanyf Department of Entomology, Museum of Victoria, PO Box 666, Victoria 3001, Australiag CAPIM, Bio21 Institute, University of Melbourne, 30 Flemington Road, Parkville Vic 3010, Australiah South Australia Environment Protection Authority, PO Box 2607, Adelaide 5001, South Australia, Australia
a b s t r a c ta r t i c l e i n f o
Article history:Received 30 July 2010Received in revised form 15 January 2011Accepted 27 January 2011Available online 4 March 2011
Keywords:DisturbanceSalinisationIndicatorsBiomonitoringMultiple stressorsField study
We compiled a database on a priori selected traits for South-East Australian freshwater macroinvertebratefamilies and used this data for the development of a biotic indicator for the detection of the effects ofsalinisation on freshwater communities (SPEARsalinity) and for the adaptation of the existing SPEARpesticides
index for South-East Australian taxa. The SPEARsalinity indicator showed a reasonably high relationship(0.38!r2!0.5) with salinity in terms of logarithmic electrical conductivity (log EC) using !eld biomonitoringdata from 835 pools and rif"e sites in Victoria and South Australia. Several other biotic indexes that werecalculated for comparison purpose exhibited a lower relationship with log EC. In addition, SPEARsalinity wasthe only indicator that did not respond to other water quality variables and was therefore most selective. Weused log EC data and modelled pesticide exposure for sites in Victoria in concert with SPEARsalinity and theexisting SPEARpesticides index to assess whether pesticides interacts with effects of salinity on invertebratecommunities and vice versa. No interaction with pesticides was found for the effect of log EC on SPEARsalinity,whereas EC interacted with the estimated pesticide exposure on the invertebrate communities. To foster thedevelopment of further trait-based ecological indicators, we suggest a conceptual model that predictsresponse traits based on the disturbance regime and disturbance mode of action of the stressor. Bioticindicators based on a priori selected traits represent a promising biomonitoring tool even for regions whereecological information is scarce.
© 2011 Elsevier B.V. All rights reserved.
1. Introduction
The sustainable management of freshwater resources relies on thecontinuous monitoring of their ecological status. Biotic indicatorsrepresent an important tool for the assessment of the ecological statusof freshwater ecosystems. Most indicators are based on taxonomicproperties of the aquatic macroinvertebrate community such asspecies richness, the fraction of Ephemeroptera, Plecoptera andTrichoptera taxa (% EPT) or the ratio of the number of observed (O)taxa to the taxa which would be expected (E) if the system was in areference state (O/E) as in RIVPACS or AUSRIVAS (Marchant et al.,1997; Wright et al., 1993). Whereas several indicators are reliable in
detecting ecological degradation (Böhmer et al., 2004), taxonomy-based indicators generally do not respond selectively to speci!cstressors and therefore they do not identify the stressor(s) respon-sible for an observed ecological impairment. This is because clearinference of causes of impairment based on the taxonomic compo-sition of communities is dif!cult given (1) the variation of ecologicalcommunities in time and space and (2) combined effects of differentstressors (Liess et al., 2008; Statzner and Beche, 2010). Bioticindicators based on biological (e.g. body size, generation time andmode of reproduction) and/or physiological traits (e.g. physiologicalsensitivity) have been advocated as a tool to identify stressor-speci!ceffects and to disentangle effects of multiple stressors (Liess et al.,2008; Statzner and Beche, 2010). For example, the trait-based speciesat risk (SPEAR) approach has been used to link pesticide (Liess andvon der Ohe, 2005; Schäfer et al., 2007) and organic toxicant (Beketovand Liess, 2008; von der Ohe et al., 2009) exposure to changes in thetrait composition of invertebrate communities in streams of Europe
Science of the Total Environment 409 (2011) 2055–2063
! Corresponding author at: Institute for Environmental Sciences, University Koblenz-Landau, Forststraße 7, 76829 Landau, Germany. Tel.: +49 6341 280 325; fax: +49 6341280 326.
E-mail address: [email protected] (R.B. Schäfer).
0048-9697/$ – see front matter © 2011 Elsevier B.V. All rights reserved.doi:10.1016/j.scitotenv.2011.01.053
Contents lists available at ScienceDirect
Science of the Total Environment
j ourna l homepage: www.e lsev ie r.com/ locate /sc i totenv

Author's personal copy
and Siberia. These and further studies demonstrated that the linkbetween the so-called SPEARpesticides and SPEARorganic indicator andthe respective stressors is selective as the indicators did not respondto other potentially confounding environmental gradients (Liess et al.,2008; von der Ohe et al., 2007).
The application of trait-based indicators in risk assessment andbiomonitoring requires the compilation of trait information for taxaoccurring in the region under consideration. Trait databases havebeen compiled formacroinvertebrates in Europe or North America e.g.(Schmidt-Kloiber et al., 2006; Vieira et al., 2006) but are not availablefor most regions of the Southern hemisphere and Asia. Compared toEurope and North America, ecological information in these regions ismuch scarcer and consequently a trait database would presumablycontain less reliable ecological information on fewer traits and on ahigher taxonomic level.
Salinisation of freshwater ecosystems is a global problem mainlyaffecting arid and semi-arid regions such as the Middle East, theIndian Subcontinent and South-East Australia. Anthropogenic driversof salinisation include the land clearing of native vegetation andirrigation for agriculture both elevating saline discharges to freshwa-ter streams and lakes (Williams, 1987). In many freshwater streamsand rivers, anthropogenic salinisation has resulted in an increase ofthe electrical conductivity (EC) from below 500 !S/cm to several mS/cm (Williams, 1987). Although some variation is now acknowledged(Radke et al., 2002), most saline waters in southern Australia haveionic proportions similar to sea water (Bayly andWilliams, 1973). Thereason for this is that the salts originate from small masses of marinesalts in rainfall, which over long time scales have concentrated in soilsand groundwater (Herczeg et al., 2001).
The present study had the objectives (1) to develop a new trait-based indicator for the impact of salinisation on South-East Australianstreams using the SPEAR approach (SPEARsalinity) and evaluate itsperformance in comparison with other biotic indicators. Sincepesticide exposure and anthropogenic salinisation of streams areboth caused by agricultural land-use and can therefore co-occur,another aim (2) was to use SPEARsalinity and SPEARpesticides to detectpotential interaction in the effects of the salinity and pesticides.Finally, we wanted (3) to evaluate to which extent the limitedavailability of information on Australian invertebrate taxa constrainsthe implementation of trait-based approaches.
2. Methods
2.1. Selection of traits and compilation of the trait database
We compiled a family-level trait database for 172 taxa found instream biomonitoring programs of the Environment ProtectionAuthority (EPA) Victoria and the EPA South Australia (see next section).The database was generated at the taxonomic level of family as traitdata is generally scarce and for most taxa only available at this level. Forthe development of the SPEARsalinity index, the traits were selectedbased on availability of trait information and a priori ecologicalhypotheses regardingwhich taxawould bemost tolerant to salinisationof streams and availability of trait information. The resulting traits (andcorresponding ecological hypotheses) were: (1) reproduction type(taxa with non-aquatic early life stages such as eggs and hatchlings aremore tolerant (Kefford et al., 2004; Kefford et al., 2007)), (2) foodsource (carnivorous taxa are more tolerant due to an energy-rich diet(Piscart et al., 2006)), (3) respiration mode (taxa that do not respire inwater reduce their permeability to ions and water and are thus lesssusceptible to increasing salinity) (4) physiological sensitivity tosalinity (taxa with lower physiological sensitivity are more tolerant).For the adaptation of the SPEARpesticides index for South-East Australiantaxa, data on the traits generation time, dispersal capacity, time ofemergence and physiological sensitivity to organic toxicants werecompiled (see Liess and von der Ohe (2005) for details).
Trait information was collected consulting 85 peer-reviewedjournal articles, books and identi!cation keys (Table S1, Supplemen-tary information). The physiological trait “sensitivity to organictoxicants” of the SPEARpesticides (Sorg) was based on laboratory dataon organic toxicants for European and North American invertebratetaxa (von der Ohe and Liess, 2004) since this data is almost absent forAustralasian taxa. For the trait “physiological sensitivity to salinity”,laboratory determined median lethal concentrations following 72 h(72-h LC50) were available for most Australian families (Dunlop et al.,2008; Kefford et al., 2003; Kefford et al., 2005a; Kefford et al., 2006).Missing values in the trait database were !lled (1) with expertknowledge from Victorian limnologists, (2) to a minor extent byconsulting another database (Hawking et al., 2010) or (3) byinterpolation from related families in the same order. The completedatabase is available as Supplementary information to this paper(Table S1).
2.2. Field data from stream biomonitoring programs in South-EastAustralia
For !eld testing of the developed and adapted trait indicators, weused biomonitoring data on macroinvertebrates from the AustralianRiver Assessment System (AUSRIVAS) program from the adjoiningstates South Australia (SA EPA, 2002) and Victoria (Tiller andMetzeling, 1998). The data set comprised 482 sites in southernVictoria sampled between 2000 and 2008 and 408 sites in SouthAustralia sampled between 1994 and 2001 (Fig. 1). Each site wassampled in spring and autumn and approximately 15% of the siteswere sampled in multiple years. The sampling was conductedaccording to a rapid bioassessment method and included taking of apool sample of representative habitats and of a kick sample whererif"es were present (Chessman, 1995). In Victoria, live sorting of thepool and rif"e samples occurred for a minimum of 30 min in the !eld(Chessman, 1995; EPA, 2003), whereas the South Australian methodrequired preservation of the sample and sorting in the laboratory of aminimum of 10% of the sample (SA EPA, 2002). This may affectef!ciency of detecting taxa (Marchant et al., 1997) and the data setswere therefore analysed separately. Indeed, the average taxa richnessper sample differed between both regions with 22 for Victoriansamples and 32 for South Australian samples, though we cannotquantify as to which extent the sampling method contributes to thisdifference in taxa richness per sample. The taxa were identi!ed in thelaboratory to family and species level for most taxa in Victoria andSouth Australia, respectively. Note that we refer to the data setcontaining the streams in Victoria with “Victoria”, though thesampling sites were spatially con!ned to selected catchments of thisstate and thus are not representative for the complete state (Fig. 1). Bycontrast, most non-sampled areas in South Australia do not containstreams or rivers with regular "ow.
For sites in Victorian streams, nine physicochemical variables wereavailable that were measured concurrently with the macroinverte-brate sampling. These variables were salinity as indicated by electricalconductivity at 25 °C (EC), water temperature, pH, turbidity, alkalin-ity, dissolved oxygen, total phosphorus, NOx (nitrate and nitrite) andtotal Kjeldahl nitrogen (Tiller and Metzeling, 1998) (see Table S2,Supplementary information for descriptive statistics). EC for the SouthAustralian streams was also measured in situ (SA EPA, 2002).
2.3. Calculation of SPEAR and other biotic indicators
The SPEAR approach is based on the calculation of the fraction ofthe abundance of sensitive individuals in a community for a speci!cstressor (%SPEAR). The !rst step for this calculation is the binaryclassi!cation of all taxa as “sensitive” or “tolerant” for each of the traitsof the respective indicator. Taxa that are classi!ed as “sensitive” for alltraits belonging to the respective indicator are de!ned as SPEAR and
2056 R.B. Schäfer et al. / Science of the Total Environment 409 (2011) 2055–2063
Author's personal copy
the fraction of SPEAR in a community (%SPEAR) of a sampling site iscalculated as:
%SPEAR ="n
ixiyi
"n
ixi
!1"
where xi is the logarithmof the abundance+1of species i, n is the totalnumber of species in the sample and y is 1 for a SPEAR taxon, else 0.
The classi!cation criteria for the SPEARsalinity and SPEARpesticides aredisplayed in Table 1 and were derived from the hypotheses outlinedearlier and taken from Liess and von der Ohe (2005), respectively.Several versions of SPEARsalinity incorporating different trait combina-tions were analysed during development of the indicator. The !nalversion of the SPEARsalinity indicator described in this paper relies onlyon physiological salinity sensitivity as this trait was suf!cient toachieve a strong linear relationship with salinity. Further details andresults for other versions of SPEARsalinity are given in the Supplemen-tary information (Text S1, Table S3).
For comparison purpose, we calculated for the Victorian data set threecommonly used biotic indicators (Species richness, Shannon–Wienerdiversity and % of Ephemeroptera, Plectoptera and Trichoptera (EPT)taxa), two Australian-wide used indicators to detect general bioticimpairment by pollution (SIGNAL (Chessman, 1995) with updatedsensitivity scores as given in (Metzeling et al., 2003) and the ratio ofobserved/expected taxa (O/E) from an AUSRIVAS model that representsthe Australian version of RIVPACs (Marchant et al., 1997)) and a speci!cindicator for the effects of salinity on macroinvertebrates called salinityindex (SI) which is described in Horrigan et al. (2005).
2.4. Estimation of ecological risk of pesticides
Since no information on pesticide exposure was available for thesampling sites we used a geographic information system (GIS)-basedrunoffmodel to estimate pesticide exposure expressed as runoff potential
and the associated ecological risk (ER) at a site (Schriever et al., 2007b).The model incorporated climatic, geographical and land-use informationand has already been applied to identify potential hotspots of pesticiderunoff in agricultural regions of North Germany (Schriever et al., 2007a)and the EuropeanUnion (Schriever and Liess, 2007). The ER depended onthe runoff potential as well as on the amount of potential recolonisationpools (forests or conservation area) in a model grid cell and wasexpressed in !ve categories “very low” to “very high”. The ER categoriesof “medium” and “high” were merged to achieve a more balancedsample size per category and the category “very high” contained nosamples. Further details on the adaptation of the GIS-based model forVictorian streams and the relationship with SPEARpesticides can be foundin (Burgert et al., 2010).
2.5. Data analysis
Pairwise correlations between trait indicators for the taxa in thedatabase were calculated using the Pearson's correlation coef!cient rand the phi correlation coef!cient for binary data.
Prior to analysis of the!elddata, 42 sites in arid regionswith less than300 mm precipitation were removed from the South Australian data setas streams in these regions are usually ephemeral. In addition, sampleswith less than 10 reported taxa were removed from both data sets toexclude samples with a heavily degraded fauna or poor samplingperformance, which lead to the exclusion of 10 sites in Victoria and 3sites in South Australia. The decadic logarithm was used to transformphysicochemical variables with a wide spread of values (maximum/minimum observation N1000) or a very left-skewed distribution(checked visually). Taxa abundances were log (x+1) transformed.
The performance of a biotic indicator for detecting effects of salinitywas evaluated based on the (1) strength of the relationshipwith log EC ina linear regression model and (2) selectivity to log EC, where idealselectivity would translate to no explanatory power of physicochemicalvariables other than log EC in a linear multiple regression model.
Goodness of !t of linear regression models was assessed with theadjusted r2 (r2 for models with only one explanatory variable).
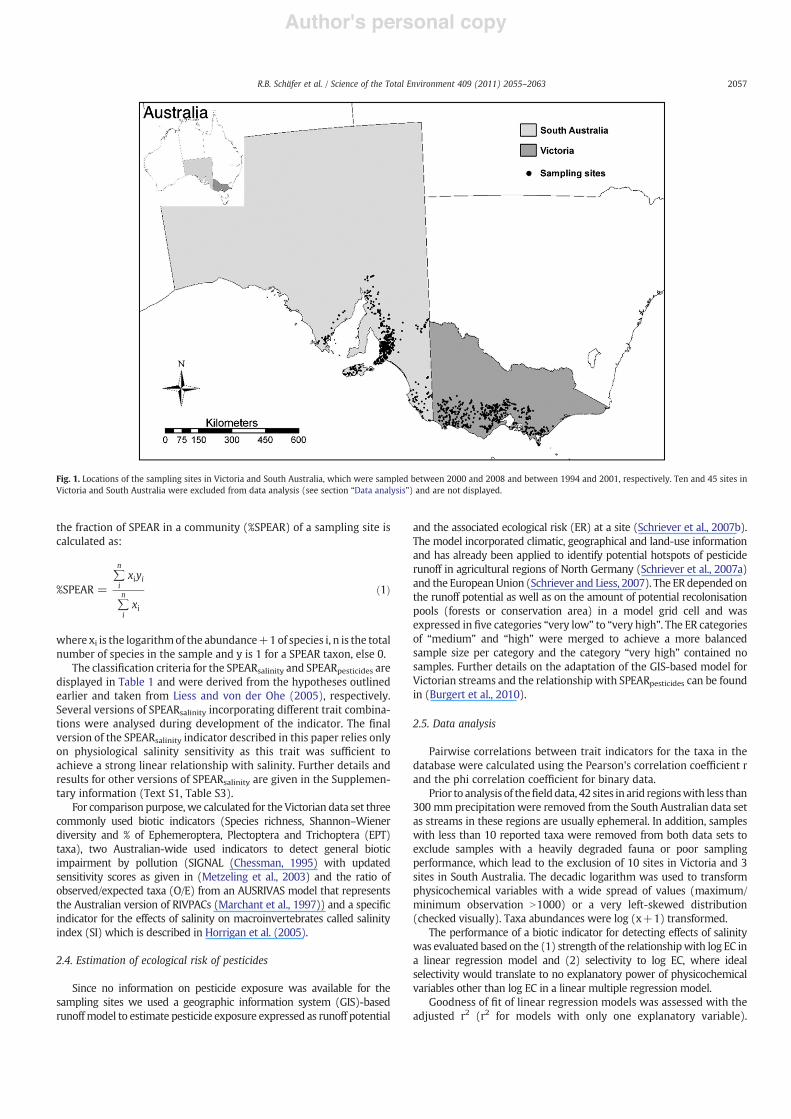
Fig. 1. Locations of the sampling sites in Victoria and South Australia, which were sampled between 2000 and 2008 and between 1994 and 2001, respectively. Ten and 45 sites inVictoria and South Australia were excluded from data analysis (see section “Data analysis”) and are not displayed.
2057R.B. Schäfer et al. / Science of the Total Environment 409 (2011) 2055–2063
Author's personal copy
Analysis of covariance (ANCOVA) with t-test was applied to check forsigni!cant differences in slope or intercept for factors in the linearmodel. We aggregated the data over sampling period and samplingyears since SPEARsalinity did not exhibit signi!cant covariation overthese factors (all pN0.05), also to avoid temporal pseudoreplication(Hurlbert, 1984). The aggregationwas done using theminimum valuefor a biotic indicator and the maximum stressful value for aphysicochemical variable of the raw samples. This aggregationmethod followed the rationale that semiannual point sampling ofphysicochemical parameters at a site is very likely to miss the higheststressful value of a pollutant (Richards and Baker, 1993), whereascorresponding biological effects may be expressed by the lowestindicator values. However, using the average for all variables asaggregation method did not change the results presented in thisstudy. The data was analysed separately for pools and rif"es sinceSPEARsalinity exhibited signi!cant covariation over this factor(pb0.001 for Victoria and South-Australia).
To evaluate the selectivity of SPEARsalinity and the other bioticindicators, we examined the explanatory power of all physicochemicalvariables in the Victorian data set for the indicators, employing automaticmodel building starting with the null model (no explanatory variableincluded). The statistical procedure was backward and forward enteringof physicochemical variables with Akaike's Information Criterion (AIC) asstepwise model selection criterion. Hierarchical partitioning was used todetermine the independent explanatory power of the physicochemicalvariables (Chevan and Sutherland, 1991).
To assess whether pesticides and salinity exhibit interactions in theireffects on the community level, we built two linear models: (1) aregression model with SPEARsalinity as response variable and log EC, thefactor ER and their interaction term as explanatory variables and (2) atwo-way analysis of variance (ANOVA) model with SPEARpesticides asresponse variable and ER, classes of EC (ECb1000, 1000bECb3000 andECN3000) and their interaction term as explanatory variables. In thesecondmodel EC was transformed into a factor to detect which levels ofsalinity would interact with pesticide exposure. The selected classboundaries corresponded to notable changes in species richness inVictoria (Kefford et al., 2006). As ER was estimated using a pesticideexposure model for the land-use situation in 2006/2007, only biomo-nitoring data of the years 2004 to 2008were included for the calculationof the SPEAR indicators. This represented a compromise between ahigher sampling size by includingmore years of biomonitoring data andmatching of the biomonitoring sampling time with the modelled
exposure time. This analysis was only conducted for pool samples asthe sample size for rif"e samples was too low. All statistical computa-tions and graphics were created with the open source software packageR (www.r-project.org) using version 2.10.0 (for Mac OS X, 10.6.4)(R Development Core Team, 2010).
3. Results
3.1. Selected characteristics of the developed database and the traits
Information on traits and physiological sensitivity could be obtainedfor the majority of families in the database with only 2.4% of entriesassigned as “unknown”. Nevertheless, 17% of entries were interpolatedfrom taxonomically related families and 12% of entries were provided byexpert knowledge (Table S1, Supplementary information). This meansthat for each trait on an average for 31% of data entries (range 17% to 48%)no published data were available despite the use of family data. For theclassi!ed taxa in the database, the physiological traits (physiologicalsensitivity to pesticides (Sorg) and salinity) were not signi!cantlycorrelated ("=0.08; p=0.28; n=172), whereas SPEARpesticides andSPEARsalinity exhibited a signi!cant but low correlation ("=0.23;p=0.002; n=172).
3.2. Relationship between SPEARsalinity and log EC
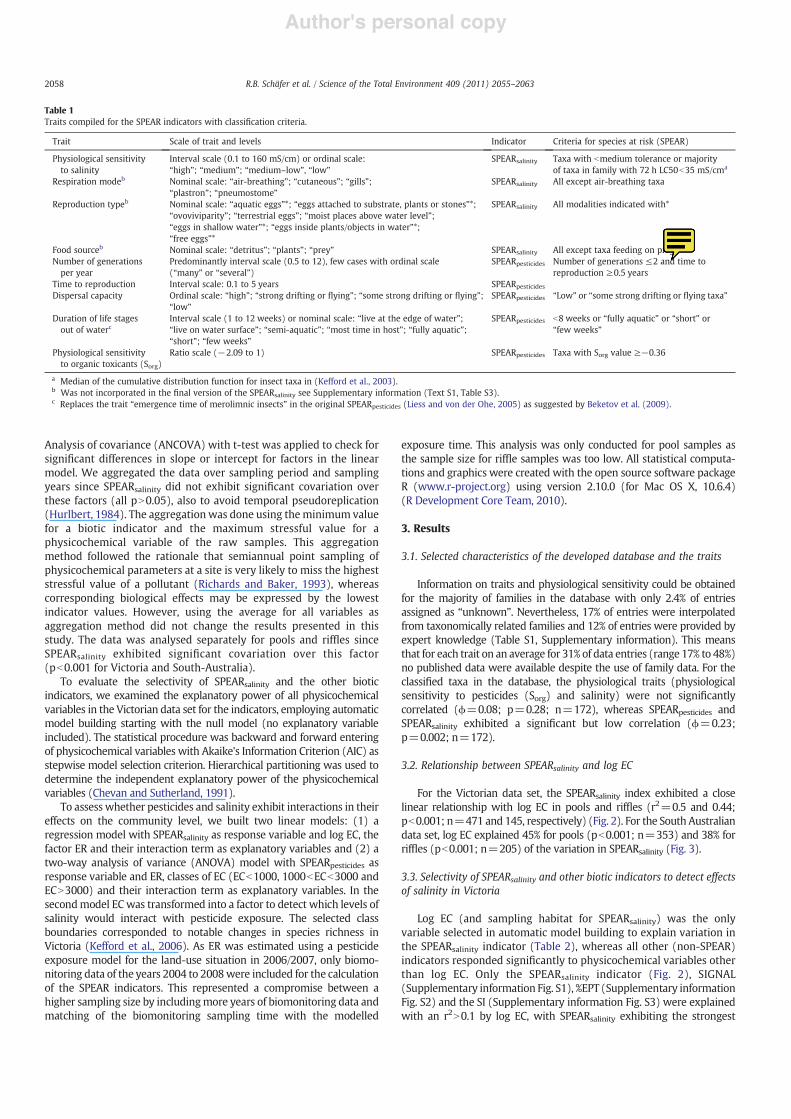
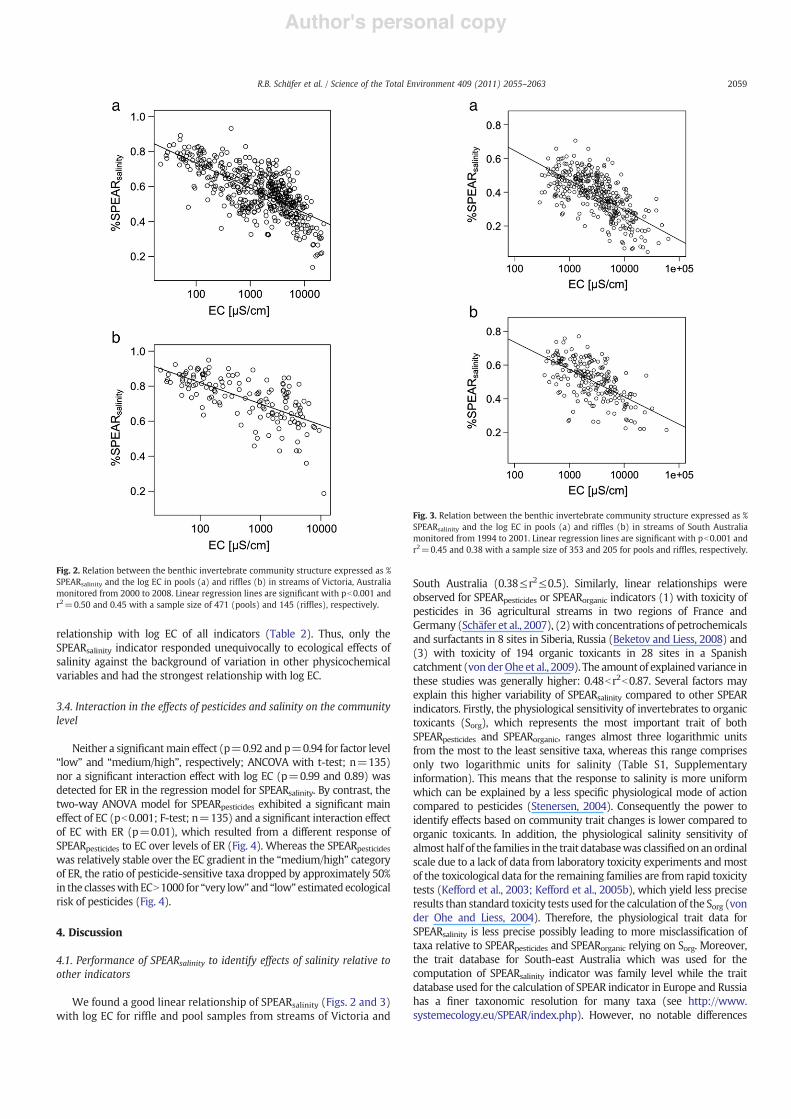
For the Victorian data set, the SPEARsalinity index exhibited a closelinear relationship with log EC in pools and rif"es (r2=0.5 and 0.44;pb0.001; n=471 and 145, respectively) (Fig. 2). For the South Australiandata set, log EC explained 45% for pools (pb0.001; n=353) and 38% forrif"es (pb0.001; n=205) of the variation in SPEARsalinity (Fig. 3).
3.3. Selectivity of SPEARsalinity and other biotic indicators to detect effectsof salinity in Victoria
Log EC (and sampling habitat for SPEARsalinity) was the onlyvariable selected in automatic model building to explain variation inthe SPEARsalinity indicator (Table 2), whereas all other (non-SPEAR)indicators responded signi!cantly to physicochemical variables otherthan log EC. Only the SPEARsalinity indicator (Fig. 2), SIGNAL(Supplementary information Fig. S1), %EPT (Supplementary informationFig. S2) and the SI (Supplementary information Fig. S3) were explainedwith an r2N0.1 by log EC, with SPEARsalinity exhibiting the strongest
Table 1Traits compiled for the SPEAR indicators with classi!cation criteria.
Trait Scale of trait and levels Indicator Criteria for species at risk (SPEAR)
Physiological sensitivityto salinity
Interval scale (0.1 to 160 mS/cm) or ordinal scale:“high”; “medium”; “medium–low”, “low”
SPEARsalinity Taxa with bmedium tolerance or majorityof taxa in family with 72 h LC50b35 mS/cma
Respiration modeb Nominal scale: “air-breathing”; “cutaneous”; “gills”;“plastron”; “pneumostome”
SPEARsalinity All except air-breathing taxa
Reproduction typeb Nominal scale: “aquatic eggs”*; “eggs attached to substrate, plants or stones”*;“ovoviviparity”; “terrestrial eggs”; “moist places above water level”;“eggs in shallow water”*; “eggs inside plants/objects in water”*;“free eggs”*
SPEARsalinity All modalities indicated with*
Food sourceb Nominal scale: “detritus”; “plants”; “prey” SPEARsalinity All except taxa feeding on preyNumber of generationsper year
Predominantly interval scale (0.5 to 12), few cases with ordinal scale(“many” or “several”)
SPEARpesticides Number of generations !2 and time toreproduction #0.5 years
Time to reproduction Interval scale: 0.1 to 5 years SPEARpesticides
Dispersal capacity Ordinal scale: “high”; “strong drifting or "ying”; “some strong drifting or "ying”;“low”
SPEARpesticides “Low” or “some strong drifting or "ying taxa”
Duration of life stagesout of waterc
Interval scale (1 to 12 weeks) or nominal scale: “live at the edge of water”;“live on water surface”; “semi-aquatic”; “most time in host”; “fully aquatic”;“short”; “few weeks”
SPEARpesticides b8 weeks or “fully aquatic” or “short” or“few weeks”
Physiological sensitivityto organic toxicants (Sorg)
Ratio scale ($2.09 to 1) SPEARpesticides Taxa with Sorg value #$0.36
a Median of the cumulative distribution function for insect taxa in (Kefford et al., 2003).b Was not incorporated in the !nal version of the SPEARsalinity see Supplementary information (Text S1, Table S3).c Replaces the trait “emergence time of merolimnic insects” in the original SPEARpesticides (Liess and von der Ohe, 2005) as suggested by Beketov et al. (2009).
2058 R.B. Schäfer et al. / Science of the Total Environment 409 (2011) 2055–2063
Ralf B. Schäfer
should be "OR"
Author's personal copy
relationship with log EC of all indicators (Table 2). Thus, only theSPEARsalinity indicator responded unequivocally to ecological effects ofsalinity against the background of variation in other physicochemicalvariables and had the strongest relationship with log EC.
3.4. Interaction in the effects of pesticides and salinity on the communitylevel
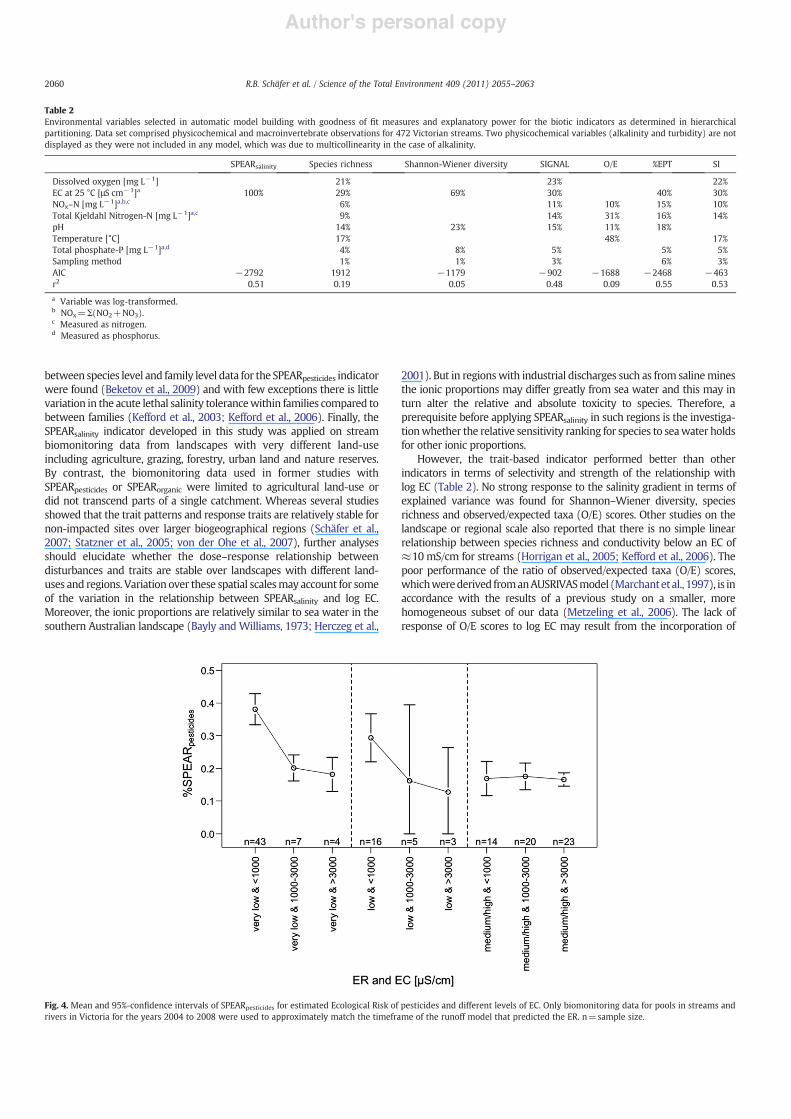
Neither a signi!cantmain effect (p=0.92 and p=0.94 for factor level“low” and “medium/high”, respectively; ANCOVA with t-test; n=135)nor a signi!cant interaction effect with log EC (p=0.99 and 0.89) wasdetected for ER in the regression model for SPEARsalinity. By contrast, thetwo-way ANOVA model for SPEARpesticides exhibited a signi!cant maineffect of EC (pb0.001; F-test; n=135) and a signi!cant interaction effectof EC with ER (p=0.01), which resulted from a different response ofSPEARpesticides to EC over levels of ER (Fig. 4). Whereas the SPEARpesticideswas relatively stable over the EC gradient in the “medium/high” categoryof ER, the ratio of pesticide-sensitive taxa dropped by approximately 50%in the classeswithECN1000 for “very low” and “low” estimated ecologicalrisk of pesticides (Fig. 4).
4. Discussion
4.1. Performance of SPEARsalinity to identify effects of salinity relative toother indicators
We found a good linear relationship of SPEARsalinity (Figs. 2 and 3)with log EC for rif"e and pool samples from streams of Victoria and
South Australia (0.38!r2!0.5). Similarly, linear relationships wereobserved for SPEARpesticides or SPEARorganic indicators (1) with toxicity ofpesticides in 36 agricultural streams in two regions of France andGermany (Schäfer et al., 2007), (2)with concentrations of petrochemicalsand surfactants in 8 sites in Siberia, Russia (Beketov and Liess, 2008) and(3) with toxicity of 194 organic toxicants in 28 sites in a Spanishcatchment (vonderOhe et al., 2009). The amount of explained variance inthese studies was generally higher: 0.48br2b0.87. Several factors mayexplain this higher variability of SPEARsalinity compared to other SPEARindicators. Firstly, the physiological sensitivity of invertebrates to organictoxicants (Sorg), which represents the most important trait of bothSPEARpesticides and SPEARorganic, ranges almost three logarithmic unitsfrom the most to the least sensitive taxa, whereas this range comprisesonly two logarithmic units for salinity (Table S1, Supplementaryinformation). This means that the response to salinity is more uniformwhich can be explained by a less speci!c physiological mode of actioncompared to pesticides (Stenersen, 2004). Consequently the power toidentify effects based on community trait changes is lower compared toorganic toxicants. In addition, the physiological salinity sensitivity ofalmost half of the families in the trait databasewas classi!ed on an ordinalscale due to a lack of data from laboratory toxicity experiments andmostof the toxicological data for the remaining families are from rapid toxicitytests (Kefford et al., 2003; Kefford et al., 2005b), which yield less preciseresults than standard toxicity tests used for the calculation of the Sorg (vonder Ohe and Liess, 2004). Therefore, the physiological trait data forSPEARsalinity is less precise possibly leading to more misclassi!cation oftaxa relative to SPEARpesticides and SPEARorganic relying on Sorg. Moreover,the trait database for South-east Australia which was used for thecomputation of SPEARsalinity indicator was family level while the traitdatabase used for the calculation of SPEAR indicator in Europe and Russiahas a !ner taxonomic resolution for many taxa (see http://www.systemecology.eu/SPEAR/index.php). However, no notable differences
Fig. 3. Relation between the benthic invertebrate community structure expressed as %SPEARsalinity and the log EC in pools (a) and rif"es (b) in streams of South Australiamonitored from 1994 to 2001. Linear regression lines are signi!cant with pb0.001 andr2=0.45 and 0.38 with a sample size of 353 and 205 for pools and rif"es, respectively.
Fig. 2. Relation between the benthic invertebrate community structure expressed as %SPEARsalinity and the log EC in pools (a) and rif"es (b) in streams of Victoria, Australiamonitored from 2000 to 2008. Linear regression lines are signi!cant with pb0.001 andr2=0.50 and 0.45 with a sample size of 471 (pools) and 145 (rif"es), respectively.
2059R.B. Schäfer et al. / Science of the Total Environment 409 (2011) 2055–2063
Author's personal copy
between species level and family level data for the SPEARpesticides indicatorwere found (Beketov et al., 2009) and with few exceptions there is littlevariation in the acute lethal salinity tolerancewithin families compared tobetween families (Kefford et al., 2003; Kefford et al., 2006). Finally, theSPEARsalinity indicator developed in this study was applied on streambiomonitoring data from landscapes with very different land-useincluding agriculture, grazing, forestry, urban land and nature reserves.By contrast, the biomonitoring data used in former studies withSPEARpesticides or SPEARorganic were limited to agricultural land-use ordid not transcend parts of a single catchment. Whereas several studiesshowed that the trait patterns and response traits are relatively stable fornon-impacted sites over larger biogeographical regions (Schäfer et al.,2007; Statzner et al., 2005; von der Ohe et al., 2007), further analysesshould elucidate whether the dose–response relationship betweendisturbances and traits are stable over landscapes with different land-uses and regions. Variation over these spatial scalesmay account for someof the variation in the relationship between SPEARsalinity and log EC.Moreover, the ionic proportions are relatively similar to sea water in thesouthern Australian landscape (Bayly and Williams, 1973; Herczeg et al.,
2001). But in regionswith industrial discharges such as from salineminesthe ionic proportions may differ greatly from sea water and this may inturn alter the relative and absolute toxicity to species. Therefore, aprerequisite before applying SPEARsalinity in such regions is the investiga-tionwhether the relative sensitivity ranking for species to seawater holdsfor other ionic proportions.
However, the trait-based indicator performed better than otherindicators in terms of selectivity and strength of the relationship withlog EC (Table 2). No strong response to the salinity gradient in terms ofexplained variance was found for Shannon–Wiener diversity, speciesrichness and observed/expected taxa (O/E) scores. Other studies on thelandscape or regional scale also reported that there is no simple linearrelationship between species richness and conductivity below an EC of%10 mS/cm for streams (Horrigan et al., 2005; Kefford et al., 2006). Thepoor performance of the ratio of observed/expected taxa (O/E) scores,whichwerederived fromanAUSRIVASmodel (Marchantetal., 1997), is inaccordance with the results of a previous study on a smaller, morehomogeneous subset of our data (Metzeling et al., 2006). The lack ofresponse of O/E scores to log EC may result from the incorporation of
Fig. 4. Mean and 95%-con!dence intervals of SPEARpesticides for estimated Ecological Risk of pesticides and different levels of EC. Only biomonitoring data for pools in streams andrivers in Victoria for the years 2004 to 2008 were used to approximately match the timeframe of the runoff model that predicted the ER. n=sample size.
Table 2Environmental variables selected in automatic model building with goodness of !t measures and explanatory power for the biotic indicators as determined in hierarchicalpartitioning. Data set comprised physicochemical and macroinvertebrate observations for 472 Victorian streams. Two physicochemical variables (alkalinity and turbidity) are notdisplayed as they were not included in any model, which was due to multicollinearity in the case of alkalinity.
SPEARsalinity Species richness Shannon-Wiener diversity SIGNAL O/E %EPT SI
Dissolved oxygen [mg L$1] 21% 23% 22%EC at 25 °C [!S cm$1]a 100% 29% 69% 30% 40% 30%NOx–N [mg L$1]a,b,c 6% 11% 10% 15% 10%Total Kjeldahl Nitrogen-N [mg L$1]a,c 9% 14% 31% 16% 14%pH 14% 23% 15% 11% 18%Temperature [°C] 17% 48% 17%Total phosphate-P [mg L$1]a,d 4% 8% 5% 5% 5%Sampling method 1% 1% 3% 6% 3%AIC $2792 1912 $1179 $902 $1688 $2468 $463r2 0.51 0.19 0.05 0.48 0.09 0.55 0.53a Variable was log-transformed.b NOx=#(NO2+NO3).c Measured as nitrogen.d Measured as phosphorus.
2060 R.B. Schäfer et al. / Science of the Total Environment 409 (2011) 2055–2063
Author's personal copy
alkalinity as predictor variable in the AUSRIVAS model. Alkalinity washighly correlated with conductivity (r=0.87; pb0.001; n=606) andelevated alkalinity is a natural feature of some streams in South-eastAustralia (Williams, 1980). This means that the expected taxa (taxa thatoccur with a probability N50%) in the AUSRIVAS model are determinedfromreference streamswitha level of EC similar to the site fromwhich thelist of observed taxa originates. Hence, anthropogenic secondary salinisa-tion of streams may be masked by streams with a naturally high level ofsalinity. By contrast, SPEARsalinity responds to an elevation of salinityirrespective of the origin. For freshwater conservation and management,the establishment of natural background levels for salinity at speci!c siteswould be necessary to evaluate whether a reduced SPEARsalinity valuerefers to anthropogenic disturbance.
The %EPT indicator, SIGNAL scores and the salinity index (SI)(Supplementary information Figs. S1–3) showed a good relationshipwith log EC, but these indicators responded also to other water qualityvariables whereas the trait-based SPEARsalinity indicator did not(Table 2). The %EPT indicator and SIGNAL scores aim at detectinggeneral ecological impairment and it is thus not surprising that theydo not respond selectively to log EC. By contrast, the SI was developedto identify effects of salinity on macroinvertebrate communities(Horrigan et al., 2005) and ideally should not respond to other waterquality variables. However, Horrigan et al. (2005) reported a potentialresponse of the SI to high levels of nutrients and turbidity. Our resultscon!rm this response and SI additionally responded to changes intemperature, pH and alkalinity, although this may be partiallyattributed to intercorrelation with EC. Finally, the arti!cial neuralnetwork incorporated in the SI was initially calibrated for macro-invertebrate data from Queensland in North-east Australia and it maybe that the !eld sensitivity of Victorian species is slightly different,though this is not supported by results from laboratory toxicityexperiments (Dunlop et al., 2008). Overall, we suggest that usingecological reasoning to establish mechanistic models on biologicaland physiological trait responses to stressors represents a morepromising approach for the identi!cation of speci!c stressors thanusing statistical or taxonomy-based approaches.
4.2. Using traits to identify interactions of ecological risk
Biological and physiological traits represent a promising approachto disentangle effects and identify interactions of multiple stressors(Statzner and Beche, 2010). The unambiguous and selective identi-!cation of a single stressor is a prerequisite for the use of traits toassess the relative effects of multiple stressors. Single biological traitsare unlikely to discriminate effects of multiple stressors since singletraits usually respond to different stressors. For example, the traitsmall body size responded to cargo-ship traf!c, heavy metal pollutionand to differences between temperate and mediterranean streams(Bonada et al., 2007; Doledec and Statzner, 2008). This may be due tophylogenetic relationships between traits (Poff et al., 2006). Untilunique biological traits for speci!c stressors have been identi!ed andrigorously tested it remains dif!cult to analyse effects of multiplestressors using only biological traits.
By contrast, physiological traits alone had high discriminativepower towards other stressors and environmental variables asdemonstrated in this study, Beketov and Liess (2008) and in severalstudies where a physiological trait was combined with biologicaltraits (SPEARpesticides) (Liess et al., 2008). In addition, the physio-logical traits salinity sensitivity and Sorg in our study exhibited onlynegligible correlation ("=0.08, p=0.28, n=172) for the taxa inthe trait database. When used for the detection of interaction effectsbetween estimated ecological risk from pesticide exposure (ER) andsalinity, SPEARsalinity did not respond to different levels of ER. Bycontrast, SPEARpesticides decreased for classes of ECN1000 in the ERcategories “very low” and “low”, but showed no response for “medium/high” ER (Fig. 4). Three hypotheses may explain this response pattern:
(1) salinity in"uences the effect of pesticides, (2) the SPEARpesticidesindicator responds to salinity or (3) the ER underestimates the exposureto pesticides. Although several laboratory experiments reported aninteraction of salinity with the effects of pesticides (Hall and Anderson,1995; Heugens et al., 2001), this interaction would also be expected forthe level of “medium/high” ER. Therefore, hypothesis (1) cannotcompletely explain the observed results. This holds also for hypothesis(2) as a response of SPEARpesticides should also occur in the “medium/high” ER class. Nevertheless, SPEARpesticides was slightly correlated withSPEARsalinity ("=0.23; p=0.002; n=172) and this may lead to analbeit minor response of SPEARpesticides to salinity. A !ner taxonomicresolution of the trait database would presumably decrease thecorrelation of SPEARpesticides and SPEARsalinity. We suggest that hypoth-esis (3) is most likely to explain the observed response pattern ofSPEARpesticides to EC. This is because anthropogenic salinisation andpesticide exposure are both related to agricultural land use in southernAustralia (Williams, 1987), therefore both stressors may co-occur. Inaddition, a !eld study on streams in three European regions found asigni!cant correlation (r=0.54; pb0.001; n=49) of pesticide toxicity interms of toxic unit and EC (Schäfer et al., 2007). Hence, the sites in the ERcategories “very low” and “low”with ECN1000may in reality have higherpesticide exposure. This explanation is also supported by the observationsthat (1) the level of SPEARpesticides in these categories (“very low” and“low”) was similar to the “medium/high” ER category, (2) the variabilitywas relatively high in the categories of lower ER (Fig. 4) and (3) theestimated pesticide exposure estimates risk for a 10 km2 grid cell andcannot consider local factors that may contribute to higher risk at speci!csites due to low resolution input data (see Burgert et al. 2010 for details).Further studies with measured pesticide concentrations and differentlevels of salinity are needed to clarifywhether interaction effects betweenpesticides and salinity are relevant in the !eld.
4.3. The relationship between disturbances and traits
The physiological trait alone was suf!cient to achieve a stronglinear relationship of SPEARsalinity with and selectivity to log EC. Theinclusion of additional biological traits did not lead to notableimprovements (Supplementary material Text S1 and Table S3).Similarly, a study on eight contaminated streams in Siberia, Russia,found that the physiological trait “sensitivity to organic toxicants”(Sorg) was suf!cient to explain variation in the continuous exposure topetrochemicals and surfactants (Beketov and Liess, 2008). Except forisolated cases of saline water disposal, the exposure to salinity in theVictorian and South-Australian streams can also be characterised ascontinuous and relatively constant on a seasonal time scale (Metzelinget al., 2006). We suggest that the response of the trait composition ofcommunities to a disturbance depends on the disturbance regime(pulse, press or rampdisturbance (Lake, 2000)) and themodeof actionof the disturbance. Note that the temporal dimension of the disturbancehas to be de!nedwith regard to the biota under scrutiny. Salinity as in ourstudy and the continuous exposure to organic toxicants represent a pressdisturbance for invertebrates i.e. a perturbation that temporallymaintainsa relatively constant level (Lake, 2000). The traits required to cope with apress disturbance are such that enable a species to tolerate a stressor,whereas biological traits linked to resistance (e.g. non-aquatic life stages)or resilience (e.g. low generation time, long-range dispersal) most likelyplay no, or only aminor role. Both salinity and organic toxicants act on thephysiological level of organisms so that toleration of these stressorsrequires a low physiological sensitivity and this explains the paramountimportance of physiological traits in our study and Beketov and Liess(2008). For the SPEARpesticides indicator a combinationof physiological andbiological traits was most successful in terms of a high relationship withtoxic exposure to pesticides (Liess et al., 2008). This can be explained bythe fact that pesticides typically occur as a pulse disturbance (Leu et al.,2004), allowing for recovery after the perturbation, which is related toresilience traits, while the acute effect is caused by action on the
2061R.B. Schäfer et al. / Science of the Total Environment 409 (2011) 2055–2063
Author's personal copy
physiological level, which is related to the physiological sensitivity trait(Liess et al., 2008). The recovery of the community was associated withtemporal changes in the trait composition in terms of SPEARpesticides (Liessand von der Ohe, 2005), whereas the press disturbance corresponded torelative stability of SPEARsalinity over the seasons (no signi!cantcovariation for years or seasons, see Methods).
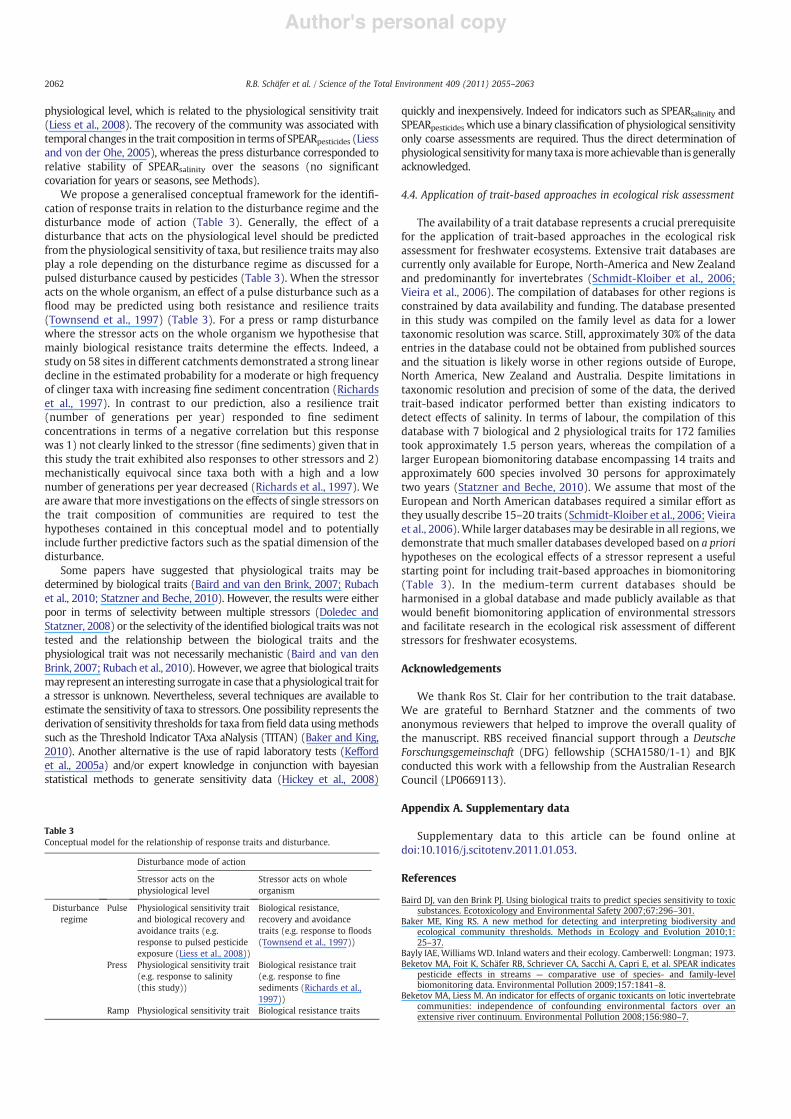
We propose a generalised conceptual framework for the identi!-cation of response traits in relation to the disturbance regime and thedisturbance mode of action (Table 3). Generally, the effect of adisturbance that acts on the physiological level should be predictedfrom the physiological sensitivity of taxa, but resilience traits may alsoplay a role depending on the disturbance regime as discussed for apulsed disturbance caused by pesticides (Table 3). When the stressoracts on the whole organism, an effect of a pulse disturbance such as a"ood may be predicted using both resistance and resilience traits(Townsend et al., 1997) (Table 3). For a press or ramp disturbancewhere the stressor acts on the whole organism we hypothesise thatmainly biological resistance traits determine the effects. Indeed, astudy on 58 sites in different catchments demonstrated a strong lineardecline in the estimated probability for a moderate or high frequencyof clinger taxa with increasing !ne sediment concentration (Richardset al., 1997). In contrast to our prediction, also a resilience trait(number of generations per year) responded to !ne sedimentconcentrations in terms of a negative correlation but this responsewas 1) not clearly linked to the stressor (!ne sediments) given that inthis study the trait exhibited also responses to other stressors and 2)mechanistically equivocal since taxa both with a high and a lownumber of generations per year decreased (Richards et al., 1997). Weare aware that more investigations on the effects of single stressors onthe trait composition of communities are required to test thehypotheses contained in this conceptual model and to potentiallyinclude further predictive factors such as the spatial dimension of thedisturbance.
Some papers have suggested that physiological traits may bedetermined by biological traits (Baird and van den Brink, 2007; Rubachet al., 2010; Statzner and Beche, 2010). However, the results were eitherpoor in terms of selectivity between multiple stressors (Doledec andStatzner, 2008) or the selectivity of the identi!ed biological traits was nottested and the relationship between the biological traits and thephysiological trait was not necessarily mechanistic (Baird and van denBrink, 2007; Rubach et al., 2010). However, we agree that biological traitsmay represent an interesting surrogate in case that a physiological trait fora stressor is unknown. Nevertheless, several techniques are available toestimate the sensitivity of taxa to stressors. One possibility represents thederivation of sensitivity thresholds for taxa from !eld data usingmethodssuch as the Threshold Indicator TAxa aNalysis (TITAN) (Baker and King,2010). Another alternative is the use of rapid laboratory tests (Keffordet al., 2005a) and/or expert knowledge in conjunction with bayesianstatistical methods to generate sensitivity data (Hickey et al., 2008)
quickly and inexpensively. Indeed for indicators such as SPEARsalinity andSPEARpesticides which use a binary classi!cation of physiological sensitivityonly coarse assessments are required. Thus the direct determination ofphysiological sensitivity formany taxa ismoreachievable than is generallyacknowledged.
4.4. Application of trait-based approaches in ecological risk assessment
The availability of a trait database represents a crucial prerequisitefor the application of trait-based approaches in the ecological riskassessment for freshwater ecosystems. Extensive trait databases arecurrently only available for Europe, North-America and New Zealandand predominantly for invertebrates (Schmidt-Kloiber et al., 2006;Vieira et al., 2006). The compilation of databases for other regions isconstrained by data availability and funding. The database presentedin this study was compiled on the family level as data for a lowertaxonomic resolution was scarce. Still, approximately 30% of the dataentries in the database could not be obtained from published sourcesand the situation is likely worse in other regions outside of Europe,North America, New Zealand and Australia. Despite limitations intaxonomic resolution and precision of some of the data, the derivedtrait-based indicator performed better than existing indicators todetect effects of salinity. In terms of labour, the compilation of thisdatabase with 7 biological and 2 physiological traits for 172 familiestook approximately 1.5 person years, whereas the compilation of alarger European biomonitoring database encompassing 14 traits andapproximately 600 species involved 30 persons for approximatelytwo years (Statzner and Beche, 2010). We assume that most of theEuropean and North American databases required a similar effort asthey usually describe 15–20 traits (Schmidt-Kloiber et al., 2006; Vieiraet al., 2006).While larger databasesmay be desirable in all regions, wedemonstrate that much smaller databases developed based on a priorihypotheses on the ecological effects of a stressor represent a usefulstarting point for including trait-based approaches in biomonitoring(Table 3). In the medium-term current databases should beharmonised in a global database and made publicly available as thatwould bene!t biomonitoring application of environmental stressorsand facilitate research in the ecological risk assessment of differentstressors for freshwater ecosystems.
Acknowledgements
We thank Ros St. Clair for her contribution to the trait database.We are grateful to Bernhard Statzner and the comments of twoanonymous reviewers that helped to improve the overall quality ofthe manuscript. RBS received !nancial support through a DeutscheForschungsgemeinschaft (DFG) fellowship (SCHA1580/1-1) and BJKconducted this work with a fellowship from the Australian ResearchCouncil (LP0669113).
Appendix A. Supplementary data
Supplementary data to this article can be found online atdoi:10.1016/j.scitotenv.2011.01.053.
References
Baird DJ, van den Brink PJ. Using biological traits to predict species sensitivity to toxicsubstances. Ecotoxicology and Environmental Safety 2007;67:296–301.
Baker ME, King RS. A new method for detecting and interpreting biodiversity andecological community thresholds. Methods in Ecology and Evolution 2010;1:25–37.
Bayly IAE, WilliamsWD. Inland waters and their ecology. Camberwell: Longman; 1973.Beketov MA, Foit K, Schäfer RB, Schriever CA, Sacchi A, Capri E, et al. SPEAR indicates
pesticide effects in streams — comparative use of species- and family-levelbiomonitoring data. Environmental Pollution 2009;157:1841–8.
Beketov MA, Liess M. An indicator for effects of organic toxicants on lotic invertebratecommunities: independence of confounding environmental factors over anextensive river continuum. Environmental Pollution 2008;156:980–7.
Table 3Conceptual model for the relationship of response traits and disturbance.
Disturbance mode of action
Stressor acts on thephysiological level
Stressor acts on wholeorganism
Disturbanceregime
Pulse Physiological sensitivity traitand biological recovery andavoidance traits (e.g.response to pulsed pesticideexposure (Liess et al., 2008))
Biological resistance,recovery and avoidancetraits (e.g. response to "oods(Townsend et al., 1997))
Press Physiological sensitivity trait(e.g. response to salinity(this study))
Biological resistance trait(e.g. response to !nesediments (Richards et al.,1997))
Ramp Physiological sensitivity trait Biological resistance traits
2062 R.B. Schäfer et al. / Science of the Total Environment 409 (2011) 2055–2063

Author's personal copy
Böhmer J, Rawer-Jost C, Zenker A, Meier C, Feld CK, Biss R, et al. Assessing streams inGermany with benthic invertebrates: development of a multimetric invertebratebased assessment system. Limnologica 2004;34:416–32.
Bonada N, Doledec S, Statzner B. Taxonomic and biological trait differences of streammacroinvertebrate communities between mediterranean and temperate regions:implications for future climatic scenarios. Global Change Biology 2007;13:1658–71.
Burgert S, Schäfer RB, Foit K, Kattwinkel M, Metzeling L, McEwan R, et al. Modellingaquatic exposure and effects of pesticides— application to South-Eastern Australia.The Science of the Total Environment 2010 accepted conditionally.
Chessman BC. Rapid assessment of rivers using macroinvertebrates — a procedurebased on habitat-speci!c sampling, family level identi!cation and a biotic index.Australian Journal of Ecology 1995;20:122–9.
Chevan A, Sutherland M. Hierarchical partitioning. American Statistician 1991;45:90–6.Doledec S, Statzner B. Invertebrate traits for the biomonitoring of large European rivers:
an assessment of speci!c types of human impact. Freshwater Biology 2008;53:617–34.
Dunlop JE, Horrigan N, McGregor G, Kefford BJ, Choy S, Prasad R. Effect of spatialvariation on salinity tolerance of macroinvertebrates in Eastern Australia andimplications for ecosystem protection trigger values. Environmental Pollution2008;151:621–30.
EPA. Rapid bioassessment methodology for rivers and streams. Guideline forenvironmental management, Victoria; 2003.
Hall LW, Anderson RD. The in"uence of salinity on the toxicity of various classes ofchemicals to aquatic biota. Critical Reviews in Toxicology 1995;25:281–346.
Hawking JH, Smith LM, Le Busque K. Identi!cation and ecology of Australian freshwaterinvertebrates; 2010 http://www.mdfrc.org.au/bugguide (accessed: 13/01/2011).
Herczeg AL, Dogramaci SS, Leaney FWJ. Origin of dissolved salts in a large, semi-aridgroundwater system: Murray Basin, Australia. Marine and Freshwater Research2001;52:41–52.
Heugens E, Hendriks A, Dekker T, Van Straalen NM, Admiraal W. A review of the effectsof multiple stressors on aquatic organisms and analysis of uncertainty factors foruse in risk assessment. Critical Reviews in Toxicology 2001;31:247–84.
Hickey GL, Kefford BJ, Dunlop JE, Craig PS. Making species salinity sensitivitydistributions re"ective of naturally occurring communities: using rapid testingand Bayesian statistics. Environmental Toxicology and Chemistry 2008;27:2403–11.
Horrigan N, Choy S, Marshall J, Recknagel F. Response of stream macroinvertebrates tochanges in salinity and the development of a salinity index. Marine and FreshwaterResearch 2005;56:825–33.
Hurlbert SH. Pseudoreplication and the design of ecological !eld experiments.Ecological Monographs 1984;54:187–211.
Kefford BJ, Dalton A, Palmer CG, Nugegoda D. The salinity tolerance of eggs andhatchlings of selected aquatic macroinvertebrates in south-east Australia andSouth Africa. Hydrobiologia 2004;517:179–92.
Kefford BJ, Nugegoda D, Metzeling L, Fields EJ. Validating species sensitivitydistributions using salinity tolerance of riverine macroinvertebrates in thesouthern Murray-Darling Basin (Victoria, Australia). Canadian Journal of Fisheriesand Aquatic Sciences 2006;63:1865–77.
Kefford BJ, Nugegoda D, Zalizniak L, Fields EJ, Hassell KL. The salinity tolerance offreshwater macroinvertebrate eggs and hatchlings in comparison to their olderlife-stages: a diversity of responses — the salinity tolerance of freshwatermacroinvertebrate eggs and hatchlings. Aquatic Ecology 2007;41:335–48.
Kefford BJ, Palmer CG, Nugegoda D. Relative salinity tolerance of freshwatermacroinvertebrates from the south-east Eastern Cape, South Africa comparedwith the Barwon Catchment, Victoria, Australia. Marine and Freshwater Research2005a;56:163–71.
Kefford BJ, Palmer CG, Warne MS, Nugegoda DT. What is meant by “95% of species”? Anargument for the inclusion of rapid tolerance testing. Human & Ecological RiskAssessment 2005b;11:1025–46.
Kefford BJ, Papas PJ, Nugegoda D. Relative salinity tolerance of macroinvertebrates fromthe Barwon River, Victoria, Australia. Marine and Freshwater Research 2003;54:755–65.
Lake PS. Disturbance, patchiness, and diversity in streams. Journal of the NorthAmerican Benthological Society 2000;19:573–92.
Leu C, Singer H, Stamm C, Muller SR, Schwarzenbach RP. Variability of herbicidelosses from 13 !elds to surface water within a small catchment after acontrolled herbicide application. Environmental Science & Technology2004;38:3835–41.
Liess M, Schäfer RB, Schriever CA. The footprint of pesticide stress in communities —species traits reveal community effects of toxicants. The Science of the TotalEnvironment 2008;406:484–90.
Liess M, von der Ohe PC. Analyzing effects of pesticides on invertebrate communities instreams. Environmental Toxicology and Chemistry 2005;24:954–65.
Marchant R, Hirst A, Norris RH, Butcher R, Metzeling L, Tiller D. Classi!cation andprediction of macroinvertebrate assemblages from running waters in Victoria,Australia. Journal of the North American Benthological Society 1997;16:664–81.
Metzeling L, Perriss S, Robinson D. Can the detection of salinity and habitatsimpli!cation gradients using rapid bioassessment of benthic invertebrates beimproved through !ner taxonomic resolution or alternative indices? Hydrobiologia2006;572:235–52.
Metzeling L, Wells F, Newall P, Tiller D, Reed J. Biological objectives for rivers andstreams — ecosystem protection. Southbank: EPA Victoria; 2003.
Piscart C, Usseglio-Polatera P, Moreteau JC, Beisel JN. The role of salinity in the selectionof biological traits of freshwater invertebrates. Archiv für Hydrobiologie 2006;166:185–98.
Poff NL, Olden JD, Vieira NKM, Finn DS, Simmons MP, Kondratieff BC. Functional traitniches of North American lotic insects: traits-based ecological applications in lightof phylogenetic relationships. Journal of the North American Benthological Society2006;25:730–55.
Radke LC, Howard KWF, Gell PA. Chemical diversity in south-eastern Australian salinelakes I: geochemical causes. Marine and Freshwater Research 2002;53:941–59.
R Development Core Team. R: a language and environment for statistical computing,reference index version 2.10.1. Vienna, Austria: R Foundation for StatisticalComputing; 2010.
Richards C, Haro RJ, Johnson LB, Host GE. Catchment and reach-scale properties asindicators of macroinvertebrate species traits. Freshwater Biology 1997;37:219–30.
Richards RP, Baker DB. Pesticide concentration patterns in agricultural drainage networks inthe Lake Erie basin. Environmental Toxicology and Chemistry 1993;12:13–26.
Rubach MN, Baird DJ, Van den Brink PJ. A new method for ranking mode-speci!csensitivity of freshwater arthropods to insecticides and its relationship to biologicaltraits. Environmental Toxicology and Chemistry 2010;29:476–87.
SA EPA. Australia-wide assessment of river health: South Australian AusRivAS samplingand processing manual. Monitoring river heath initiative technical report no 17.Commonwealth of Australia and South Australia Environment Protection Author-ity, Adelaide; 2002.
Schäfer RB, Caquet T, Siimes K, Mueller R, Lagadic L, Liess M. Effects of pesticides oncommunity structure and ecosystem functions in agricultural streams of threebiogeographical regions in Europe. The Science of the Total Environment 2007;382:272–85.
Schmidt-Kloiber A, Graf W, Lorenz A, Moog O. The AQEM/STAR taxalist — a pan-European macro-invertebrate ecological database and taxa inventory. Hydrobio-logia 2006;566:325–42.
Schriever CA, Hansler-Ball M, Holmes C, Maund S, Liess M. Agricultural intensity andlandscape structure: in"uences on the macroinvertebrate assemblages of smallstreams in northern Germany. Environmental Toxicology and Chemistry 2007a;26:346–57.
Schriever CA, Liess M. Mapping ecological risk of agricultural pesticide runoff. TheScience of the Total Environment 2007;384:264–79.
Schriever CA, von der Ohe PC, Liess M. Estimating pesticide runoff in small streams.Chemosphere 2007b;68:2161–71.
Statzner B, Bady P, Doledec S, Scholl F. Invertebrate traits for the biomonitoring of largeEuropean rivers: an initial assessment of trait patterns in least impacted riverreaches. Freshwater Biology 2005;50:2136–61.
Statzner B, Beche LA. Can biological invertebrate traits resolve effects of multiplestressors on running water ecosystems? Freshwater Biology 2010;55:80-119.
Stenersen J. Chemical pesticides: mode of action and toxicology. Boca Raton: CRC; 2004.Tiller D, Metzeling L. Australia-wide assessment of river health: Vicotorian AusRivAS
sampling and processing manual. Monitoring river health initiative technicalreport no 15. EPA Victoria, Melbourne; 1998.
Townsend CR, Doledec S, Scarsbrook MR. Species traits in relation to temporal andspatial heterogeneity in streams: a test of habitat templet theory. FreshwaterBiology 1997;37:367–87.
Vieira NKM, Poff NL, Carlisle DM, Moulton SR, Koski ML, Kondratieff BC. A database oflotic invertebrate traits for North America. U.S. Geological Survey Data Series2006;187 http://pubs.water.usgs.gov/ds187 (accessed: 13/01/2011).
von der Ohe P, Liess M. Relative sensitivity distribution (RSD) of aquatic invertebratesto organic and metal compounds. Environmental Toxicology and Chemistry2004;23:150–6.
von der Ohe PC, de Deckere E, Prüß A, Munoz I, Wolfram G, Villagrasa M, et al. Towardan integrated assessment of the ecological and chemical status of European riverbasins. Integrated Environmental Assessment and Management 2009;5:50–61.
von der Ohe PC, Prüß A, Schäfer RB, Liess M, Deckere Ed, BrackW.Water quality indicesacross Europe — a comparison of the good ecological status of !ve river basins.Journal of Environmental Monitoring 2007;9:970–8.
Williams WD. Australian freshwater life. The invertebrates of Australian inland waters.South Melbourne, Vic.: Macmillan; 1980
WilliamsWD. Salinization of rivers and streams— an important environmental-hazard.Ambio 1987;16:180–5.
Wright JF, Furse MT, Armitage PD. RIVPACS — a technique for evaluating the biologicalquality of rivers in U.K. European Water. Control 1993;3:15–25.
2063R.B. Schäfer et al. / Science of the Total Environment 409 (2011) 2055–2063