A Thyroid Hormone Based Therapy to Restore Brain ...
210
A Thyroid Hormone Based Therapy to Restore Brain Maturation Following Foetal Growth Restriction A thesis submitted in fulfilment of the requirements for the degree of Doctor of Philosophy Delphi Eleni Kondos-Devcic BSc (Hons) Monash University School of Health and Biomedical Sciences College of Science, Engineering and Health RMIT University September 2020
-
Upload
khangminh22 -
Category
Documents
-
view
3 -
download
0
Transcript of A Thyroid Hormone Based Therapy to Restore Brain ...

A Thyroid Hormone Based Therapy to
Restore Brain Maturation Following
Foetal Growth Restriction
A thesis submitted in fulfilment of the requirements for the degree of
Doctor of Philosophy
Delphi Eleni Kondos-Devcic
BSc (Hons) Monash University
School of Health and Biomedical Sciences
College of Science, Engineering and Health
RMIT University
September 2020

Declaration
I certify that except where due acknowledgement has been made, the work is that of the author alone;
the work has not been submitted previously, in whole or in part, to qualify for any other academic
award; the content of the thesis is the result of work which has been carried out since the official
commencement date of the approved research program; any editorial work, paid or unpaid, carried
out by a third party is acknowledged; and, ethics procedures and guidelines have been followed.
I acknowledge the support I have received for my research through the provision of an Australian
Government Research Training Program Scholarship.
Delphi Eleni Kondos-Devcic
05 September 2020
RMIT University

I
Dedicated to my parents
Stavroula Kondos & Dusan Devcic

II
“Above all, don’t fear difficult moments. The best comes from them.”
Rita Levi-Montalcini, Nobel Laureate.

III
Acknowledgements
My PhD has been a transformative journey and every step contained valuable lessons. The last four
years have shaped the woman I am today. This journey has been guided and supported by the
following individuals and I am eternally grateful for my experiences with them. First and foremost,
I thank my supervisors, Associate Professor Mary Tolcos, Professor David Walker and Associate
Professor Flora Wong. Without your combined expertise and encouragement I would not have
accomplished this amazing milestone in my life.
Mary, when I first met you I was an undergraduate who had never in my wildest dreams imagined I
was capable of completing a PhD. Thank you for encouraging me and believing in my abilities. It has
been one of the most difficult and at the same time fulfilling adventures of my life so far! You have
taught me to keep calm when things go wrong and that a good solution can ALWAYS be found for
any problem. Thank you for teaching me to pay attention to the details, as I am now a much better
writer and presenter because of this. I’m also very glad to have been your first RMIT student and will
carry many great memories of our time together at RMIT, including countless Vietnamese lunches
across the road!
David, thank you for shining a constant positive light during my PhD and boosting my confidence
that I was on the right track, even when I didn’t feel it myself. Your ‘big-picture’ approach has helped
me to think laterally and expand my mind, and this skill will no doubt serve me well throughout my
life. Thank you for your support of my role in the SOBR committee, where all of our events
were enhanced because you attended and were on our judging panels. Your feedback ahead of all my
presentations was very much appreciated, and I learnt many valuable presenting skills from you.
Flora, thank you for offering me your wealth of clinical expertise. You helped me to understand the
clinical implications of my research more fully. Your advice and input was very much appreciated.
Although we were at different institutions, you always made time to reply to my e-mails. I also very
much enjoyed attending the 3rd JENS conference in the Netherlands with you in 2019.
Dr. Angela Cumberland not only assisted me in setting up my animal model at RMIT, but was an
amazing support system and friend outside of the lab. Angie, thank you for teaching me to be
meticulous and resourceful in the lab, and for taking me on sanity-breaks across the road
to Lindt or Nevski café for toasties. You are the meaning of ‘girl power’!

IV
Ms Madhavi Khore Madi, thank you for all your help in setting up the lab when we first arrived at
RMIT. Your organisational skills, amazing work ethic, and helping hands with my animals made the
whole process easier for me and I am very grateful for that. Thank also for your friendship!
Dr. Azu (Aminath) Azhan Azu, thank you for being an important (sparkly/sequined) role model for
me during my PhD. I watched you complete your own PhD while also excelling in your personal life,
including being appointed president of the Rotary club of Melbourne Park. You have inspired me to
be a strong woman who makes change in the world.
Tolcos/ Walker Laboratory Group Thank you to lab members of the Tolcos/Walker group both
past and present for their support during my PhD: Courtney, James, Sebastian, Issy, Nhi, Bobbi,
Abdul, Emily, Ginevra, Ryan. It has been an absolute pleasure to be part of such a supportive and fun
team. Courtney, a special thank you for all of the runs/ gazelle sprints around Princes Park!
The RMIT Crew Simone, Alita, Bashira, Christian, Emma, Jono, Ivan, Kurt, Alec, Chris,
Paris, Hanife, Mingdi, Maurice, Sherouk, thank you for the chats, support and laughs during the last
4 years. A wonderful bunch of people who I am now lucky enough to call my friends!
The Hudson Crew Shreya, Kelsee, Lara, Nadia B. and Nadia H., A collective of strong independent
women who have left such a wonderful impression on my life and on my PhD experience. Shreya
and Kelsee, your constant support and kind words during challenging times will never be forgotten.
Panel Members Thank you to my panel members, who devoted their time and energy, and gave me
valuable advice throughout my candidature and final thesis submission: A/Prof. Samantha
Richardson and Dr.Luba Sominski, A/Prof Timothy Regnault, Dr Thomas Schmitz.
My animals I feel deep respect and gratitude to the rats who were sacrificed for this research. These
animals have allowed me to uncover valuable knowledge which will ultimately benefit our society.
It is very sad to sacrifice animals and I think about my rats often. Their essential contribution to
advances in novel therapies should never be forgotten.
Family and friends Thank you Paloma for being the best friend anyone could ask for. You celebrated
even my smallest achievements and provided constant support, while also being an ultimate stage-
mum at all of my candidature milestone presentations. Amelia, my sister from another mister, thank
you for all of the adventures and for picking me up with warmth when I had fallen down.

V
Lisa, Shalini, Liv, Audrey, Jess, Molly, Ally & Sarah, your unwavering support, kind words and zoom
sessions have helped me get through the last 4 years including this Covid-19 lockdown. To
Babybel my little companion, her constant company and cuddles got me through.
My grandparents, Pappou Nikitas and Yiayia Eleni who are no longer with us. Their foresight and
sacrifices in order to provide a better life for their family have enabled me to stand where I am
today. Pappou passed away during my candidature. He was president of my cheer-squad and
dreamed of attending my graduation with the ‘funny hat’ so that he could try it on too. He taught me
to have patience and to appreciate the educational opportunities I have been given. I hope that
wherever they are, Pappou and Yiayia are very proud that I have finished this PhD.
To my parents, Stavroula and Dusan, I dedicate this thesis to you. I cannot express how grateful I am
for your unwavering support throughout this journey. You are always there when I need you and you
knew when to step in even when I didn’t make it obvious that I needed support. Thank you for never
pressuring me to do anything, but always supporting me no matter which direction I chose to travel
– who knew we’d end up here! Thank you for your sacrifices which have given me the experiences
and opportunities I hold today. Mum, for all the times you came to stay with me, cook for me and
watch questionable reality TV with me. Dad, for always reminding me to have a work-life balance,
and a bag full of Aldi chocolates and food in the house. A massive thank you to both of you!
Lastly, I would like to thank the Australian Postgraduate Award and the Australian Government
Research Training Program Stipend Scholarship for their generous financial support with my research
scholarship.

VI
Contents Declaration ................................................................................................................... 2
Acknowledgements ..................................................................................................... III
List of Figures .............................................................................................................. X
List of Tables ............................................................................................................. XIV
Conferences & Awards ............................................................................................. XV
List of Abbreviations ................................................................................................ XVI
Summary ................................................................................................................... XIX
1 Introduction ........................................................................................................... 1
1.1 Intrauterine growth restriction (IUGR) ................................................................................... 1
1.2 Physiological impacts of IUGR ................................................................................................ 2
1.2.1 Impact of IUGR on growth and organ development ......................................................................... 2
1.2.2 Impact of IUGR on body composition .............................................................................................. 4
1.3 Impact of IUGR on the brain ................................................................................................... 5
1.4 Structure of the brain .............................................................................................................. 6
1.4.1 Structure of the cerebral hemispheres ............................................................................................... 6
1.4.2 Structure of the cerebellum ............................................................................................................. 10
1.5 Impact of IUGR on the brain .................................................................................................. 12
1.5.1 Impact of IUGR on the cerebrum .................................................................................................... 12
1.5.2 Impact of IUGR on the cerebellum ................................................................................................. 13
1.6 Animal models of IUGR used to assess brain injury............................................................... 14
1.7 Mechanisms of reduced and delayed myelination in IUGR .................................................... 15
1.8 Impact of IUGR on thyroid gland function ............................................................................ 18
1.8.1 Overview of TH signaling ............................................................................................................... 18
1.9 Role of TH in brain development ............................................................................................ 20
1.10 Use of thyroid hormone in neonatal brain injury ................................................................... 24
1.11 DITPA as a therapy in adults and children ............................................................................ 26
1.11.1 Physiological impacts of DITPA treatment. .................................................................................. 27
1.11.2 Impact of DITPA on the CNS and developing brain ..................................................................... 31
1.12 Scope of this thesis .................................................................................................................. 31
2 General Methodology ......................................................................................... 34
2.1 Introduction ............................................................................................................................ 34
2.2 Ethics clearance and animal welfare ....................................................................................... 35
2.3 Animals ................................................................................................................................... 35
2.4 Surgical procedure .................................................................................................................. 35
VII
2.4.1 Pre-operative preparation ................................................................................................................ 35
2.4.2 Surgery ............................................................................................................................................ 35
2.4.3 End of surgery and post-surgical care ............................................................................................. 37
2.5 Classification of IUGR and control, and size-matching of litters. ........................................... 37
2.6 Drug treatment ....................................................................................................................... 37
2.6.1 Handling of pups and injection........................................................................................................ 38
2.6.2 Monitoring after drug treatment ...................................................................................................... 38
2.7 Post-mortem blood and tissue collection ................................................................................. 38
2.7.1 Blood collection .............................................................................................................................. 39
2.7.2 Perfusion fixed brain tissue collection ............................................................................................ 39
2.7.3 Fresh snap frozen brain tissue collection ......................................................................................... 40
2.7.4 Processing of optic nerves ............................................................................................................... 40
2.8 Tissue histology ....................................................................................................................... 43
2.8.1 Paraffin sectioning of cerebral hemispheres and cerebellum .......................................................... 43
2.9 Histological staining & analysis .............................................................................................. 43
2.9.1 Haemotoxylin and Eosin (H&E) ..................................................................................................... 43
2.9.2 Analysis of H&E staining ................................................................................................................ 43
2.10 Immunohistochemical staining ............................................................................................... 43
3 Impact of DITPA treatment on myelination and inflammation in the
neonatal IUGR rat cerebrum ................................................................................... 46
3.1 Introduction ............................................................................................................................ 46
3.2 Methodology ........................................................................................................................... 49
3.2.1 Overview of animal work ................................................................................................................ 49
3.3 Paraffin sectioning of the cerebral hemispheres ..................................................................... 49
3.4 Immunohistochemical staining of the cerebral hemispheres .................................................. 50
3.5 Immunohistochemical analysis of the cerebral hemispheres .................................................. 50
3.5.1 Areal coverage (% AC) of MBP-, PLP- and GFAP-immunoreactivity (IR) ................................... 52
3.5.2 Projection of MBP- and PLP-IR fibres into the cerebral cortex ...................................................... 53
3.5.3 Areal density of Olig2-, APC- and Iba1-IR cells ............................................................................ 54
3.6 Statistical analysis ................................................................................................................... 55
3.7 Results ..................................................................................................................................... 57
3.7.1 Myelination and oligodendrocytes .................................................................................................. 57
3.7.2 Inflammation ................................................................................................................................... 69
3.8 Discussion ................................................................................................................................ 72
3.8.1 Overview ......................................................................................................................................... 72
3.8.2 Effects of daily DITPA administration on white matter development ............................................ 72
3.8.3 Effects of daily DITPA administration on inflammation in the cerebrum ...................................... 77

VIII
3.8.4 Limitations of the study ................................................................................................................... 77
3.8.5 Conclusion ....................................................................................................................................... 79
4 Impact of DITPA treatment on myelination and inflammation in the
neonatal IUGR rat cerebellum ................................................................................. 80
4.1 Preamble ................................................................................................................................. 80
4.2 Introduction ............................................................................................................................ 80
4.3 Methodology ........................................................................................................................... 83
4.3.1 Animals and tissue ........................................................................................................................... 83
4.3.2 Paraffin sectioning of the cerebellum .............................................................................................. 83
4.3.3 Assessment of the cerebellar structure ............................................................................................ 83
4.3.4 Immunohistochemical staining of the cerebellum ........................................................................... 84
4.3.5 Immunohistochemical analysis of the cerebellum .......................................................................... 85
4.3.6 Statistical analysis ........................................................................................................................... 88
4.4 Results ..................................................................................................................................... 91
4.4.1 Morphology of the cerebellum ........................................................................................................ 91
4.4.2 Immunohistochemical assessment of the cerebellum ...................................................................... 93
4.5 Discussion .............................................................................................................................. 101
4.5.1 Overview ....................................................................................................................................... 101
4.5.2 Effect of daily DITPA administration on cerebellar structure ...................................................... 101
4.5.3 Effect of daily DITPA administration on white matter development............................................ 102
4.5.4 Effect of DITPA administration on inflammation in the cerebellum. ........................................... 103
4.5.5 DITPA increased Purkinje cell linear density in early developing cerebellar lobules. ................. 105
4.5.6 Limitations of the study ................................................................................................................. 105
4.5.7 Conclusion ..................................................................................................................................... 106
5 Assessment of neonatal growth and wellbeing measures following DITPA
therapy in the IUGR rat. ........................................................................................ 107
5.1 Preamble ............................................................................................................................... 107
5.2 Introduction .......................................................................................................................... 107
5.3 Methodology ......................................................................................................................... 110
5.3.1 Overview of animal work .............................................................................................................. 110
5.3.2 Body and organ weights ................................................................................................................ 110
5.3.3 Analysis of body composition using dual-energy x-ray absorptiometry (DEXA) ........................ 111
5.3.4 Analysis of blood plasma .............................................................................................................. 112
5.3.5 Analysis of Dio1 in the Liver ........................................................................................................ 112
5.3.6 Statistical analysis ......................................................................................................................... 115
5.4 Results ................................................................................................................................... 116
5.4.1 Body and organ weights ................................................................................................................ 116

IX
5.4.2 Brain weights ................................................................................................................................. 119
5.4.3 Body morphometry ........................................................................................................................ 123
5.4.4 Body composition (DEXA) ........................................................................................................... 125
5.4.5 Thyroid and liver function ............................................................................................................. 129
5.5 Discussion .............................................................................................................................. 134
5.5.1 Overview ....................................................................................................................................... 134
5.5.2 Body and organ weights ................................................................................................................ 134
5.5.3 Brain weights ................................................................................................................................. 136
5.5.4 Body morphometry ........................................................................................................................ 136
5.5.5 Body composition (DEXA) ........................................................................................................... 137
5.5.6 Blood plasma analysis ................................................................................................................... 138
5.5.7 Limitations of the study ................................................................................................................. 140
5.5.8 Conclusion ..................................................................................................................................... 140
6 General Discussion ............................................................................................ 142
6.1 Overview ............................................................................................................................... 142
6.2 Does DITPA promote myelination in the cerebrum and therefore benefit the IUGR brain?
144
6.3 Is DITPA only beneficial when cerebral MCT8 is reduced? ................................................ 146
6.4 Should DITPA only be used in cases of confirmed IUGR? ................................................... 147
6.5 Future directions – clinical administration of DITPA .......................................................... 148
6.6 Conclusion ............................................................................................................................. 149
7 Reference List .................................................................................................... 150
Appendix 1 ............................................................................................................... 171
Appendix 2 ............................................................................................................... 172
Appendix 3 ............................................................................................................... 173
Appendix 4 ............................................................................................................... 175
Appendix 5 ............................................................................................................... 177
Appendix 6 ............................................................................................................... 180
Appendix 7 ............................................................................................................... 185

X
List of Figures
Figure 1.1 Diagrams showing the position of the hippocampus under the cerebral cortex, deep
within the medial temporal lobe ................................................................................................... 8
Figure 1.2 Diagram of a mid-sagittal cross-section through the human cerebellum, with the ten
lobules indicated by roman numerals (I-X). ............................................................................... 12
Figure 1.3 Timeline of oligodendrocyte development from pre-oligodendrocytes to the mature
myelinating phenotype in humans and rats. …………………………………………………...17
Figure 1.4 Thyroid hormone cellular signalling pathway. triiodothyronine, T4 = thyroxine, TR =
thyroid hormone receptor ............................................................................................................ 20
Figure 1.5 Timing of human and rat brain development in relation to thyroid hormone signalling..
..................................................................................................................................................... 22
Figure 1.6 Chemical structure of thyroid hormones and analogues .................................................. 27
Figure 2.1 Exposed rat uterus and uterine vessels during bilateral uterine artery ligation (BUVL)
surgery ......................................................................................................................................... 36
Figure 2.2 Experimental protocol timeline (A) and schematic diagram of tissue collection protocols
..................................................................................................................................................... 42
Figure 3. 1 Sequence of tissue sectioning and staining. .................................................................... 51
Figure 3.2 Coronal section of P14 rat cerebrum stained with MBP .................................................. 54
Figure 3.3 Areal coverage (% AC) of MBP-IR (A) in cortical layer VI, and proportion (%) of
cerebral cortex depth containing MBP-IR fibre projections (B) at P14 in control and IUGR
pups treated with DITPA or saline.. ............................................................................................ 58
Figure 3.4 Areal coverage (% AC) of MBP-IR in the corpus callosum (A), external capsule (B),
hippocampal CA1 region(C), hippocampal CA3 regions (D), and fimbria (E) at P14 in control
and IUGR pups treated with DITPA or saline. ........................................................................... 60
Figure 3.5 Percentage of area covered by PLP-IR (A) in the cortex (layer VI), and cortical
projection length (B) at P14 in control and IUGR pups treated with DITPA or saline. ............. 61
XI
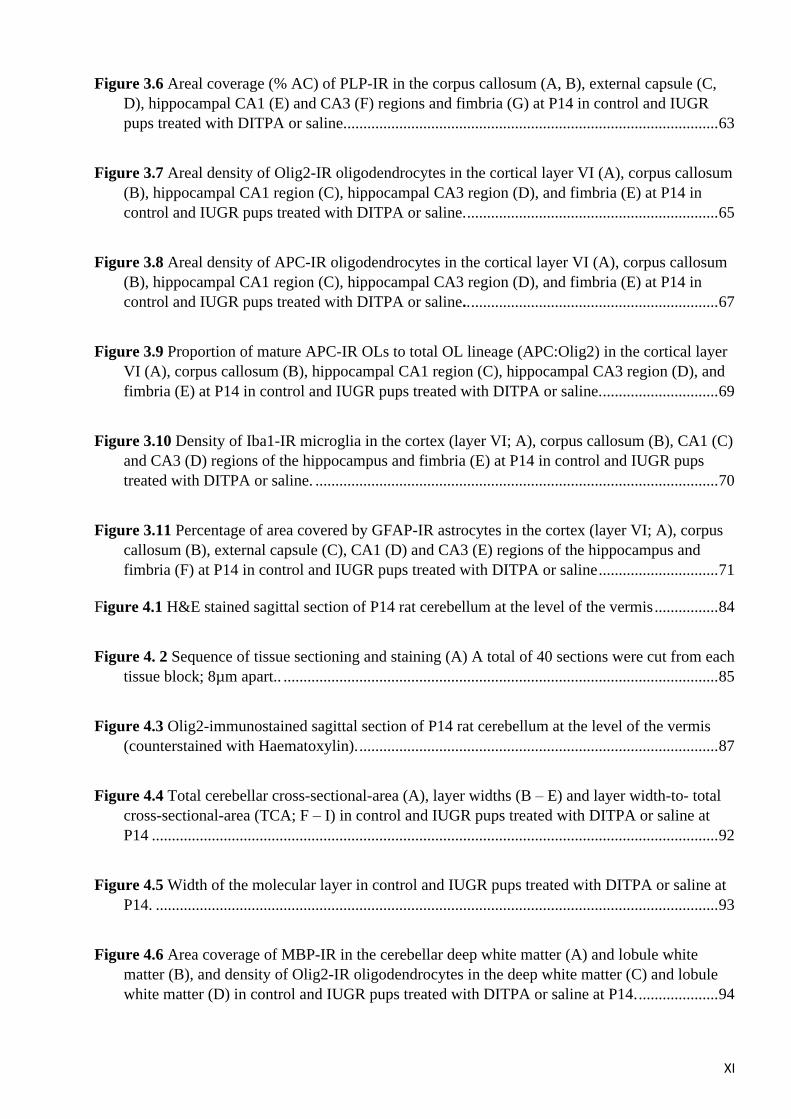
Figure 3.6 Areal coverage (% AC) of PLP-IR in the corpus callosum (A, B), external capsule (C,
D), hippocampal CA1 (E) and CA3 (F) regions and fimbria (G) at P14 in control and IUGR
pups treated with DITPA or saline. ............................................................................................. 63
Figure 3.7 Areal density of Olig2-IR oligodendrocytes in the cortical layer VI (A), corpus callosum
(B), hippocampal CA1 region (C), hippocampal CA3 region (D), and fimbria (E) at P14 in
control and IUGR pups treated with DITPA or saline. ............................................................... 65
Figure 3.8 Areal density of APC-IR oligodendrocytes in the cortical layer VI (A), corpus callosum
(B), hippocampal CA1 region (C), hippocampal CA3 region (D), and fimbria (E) at P14 in
control and IUGR pups treated with DITPA or saline.. .............................................................. 67
Figure 3.9 Proportion of mature APC-IR OLs to total OL lineage (APC:Olig2) in the cortical layer
VI (A), corpus callosum (B), hippocampal CA1 region (C), hippocampal CA3 region (D), and
fimbria (E) at P14 in control and IUGR pups treated with DITPA or saline. ............................. 69
Figure 3.10 Density of Iba1-IR microglia in the cortex (layer VI; A), corpus callosum (B), CA1 (C)
and CA3 (D) regions of the hippocampus and fimbria (E) at P14 in control and IUGR pups
treated with DITPA or saline. ..................................................................................................... 70
Figure 3.11 Percentage of area covered by GFAP-IR astrocytes in the cortex (layer VI; A), corpus
callosum (B), external capsule (C), CA1 (D) and CA3 (E) regions of the hippocampus and
fimbria (F) at P14 in control and IUGR pups treated with DITPA or saline .............................. 71
Figure 4.1 H&E stained sagittal section of P14 rat cerebellum at the level of the vermis ................ 84
Figure 4. 2 Sequence of tissue sectioning and staining (A) A total of 40 sections were cut from each
tissue block; 8µm apart.. ............................................................................................................. 85
Figure 4.3 Olig2-immunostained sagittal section of P14 rat cerebellum at the level of the vermis
(counterstained with Haematoxylin). .......................................................................................... 87
Figure 4.4 Total cerebellar cross-sectional-area (A), layer widths (B – E) and layer width-to- total
cross-sectional-area (TCA; F – I) in control and IUGR pups treated with DITPA or saline at
P14 .............................................................................................................................................. 92
Figure 4.5 Width of the molecular layer in control and IUGR pups treated with DITPA or saline at
P14. ............................................................................................................................................. 93
Figure 4.6 Area coverage of MBP-IR in the cerebellar deep white matter (A) and lobule white
matter (B), and density of Olig2-IR oligodendrocytes in the deep white matter (C) and lobule
white matter (D) in control and IUGR pups treated with DITPA or saline at P14. .................... 94

XII
Figure 4.7 Cell density of Iba1-IR microglia in the cerebellar deep white matter (A) and lobule
white matter (B, C) in control and IUGR pups treated with DITPA or saline at P14.. .............. 95
Figure 4.8 Linear density of GFAP-IR Bergmann glia (BG) in the early (A) and late (B) developing
cerebellar lobules in control and IUGR pups treated with DITPA or saline. ............................. 97
Figure 4.9 Area coverage of GFAP-IR astrocytes in the cerebellar deep white matter (A), early and
late lobule white matter combined (B), as well as early lobules (C) and late lobules (D)
separately, in control and IUGR pups treated with DITPA or saline at P14. ............................. 98
Figure 4.10 Somal area (A), areal density (B) and linear density of calbindin-IR Purkinje cells in
cerebellar lobules combined (C), and in early (D) and late lobules (E) separately, in control and
IUGR pups treated with DITPA or saline at P14 ...................................................................... 100
Figure 5. 1 Overview of animals used in Chapter 5. A total of 223 P14 rat pups were used in this
study. This included both male and female control and IUGR pups, treated with DITPA or
saline. ........................................................................................................................................ 110
Figure 5. 2 Image of P14 rat taken using dual-energy x-ray absorptiometry (DEXA).. ................. 111
Figure 5.3 Body weights (g) at postnatal day 1 (A-C), P7 (D-F), and P14 (G-I) in control and IUGR
pups treated with DITPA or saline. ........................................................................................... 117
Figure 5.4 Liver (A-C) and kidney (D-I) weights (g) at P14 in male and female control and IUGR
pups treated with DITPA or saline. ........................................................................................... 119
Figure 5.5 Total brain weight (g) (A-C) and brain-to-body weight ratio (D-F) at P14 in male and
female control and IUGR pups treated with DITPA or saline. ................................................. 121
Figure 5.6: Weight (g) of the cerebral hemispheres (A-C), cerebellum (D-F), pons (G-I) and
medulla (J-L) in male and female control and IUGR pups at P14 treated with DITPA or saline.
................................................................................................................................................... 123
Figure 5.7: Crown-to-rump length (A-C), head circumference (D-F), and hip circumference (G-I)
(mm) in male and female control and IUGR pups at P14 treated with DITPA or saline. ........ 125
Figure 5.8 Bone mineral density (A-C), bone mineral content (D-F), and total bone area (G-I) in
male and female control and IUGR pups at P14 treated with DITPA or saline. ...................... 127
Figure 5.9 Lean tissue mass (A-C), total fat mass (D-F), and percentage (%) body fat (G-I) in male
and female control and IUGR pups at P14 treated with DITPA or saline. ............................... 129

XIII
Figure 5.10 FT3 (A-C) and FT4 (D-F) plasma levels in male and female control and IUGR pups at
P14 treated with DITPA or saline. ............................................................................................ 131
Figure 5.11 Serum levels of ALT (A-C), ALP (D-F), and cholesterol (G-I), and relative levels of
Dio1 to B2M (J; male liver only) in male and female control and IUGR pups at P14 treated
with DITPA or saline. ............................................................................................................... 133
Figure 5.12 Thyroid hormone homeostatic feedback system. ......................................................... 139

XIV
List of Tables
Table 1.1 Important DITPA studies in humans and animals. ............................................................ 30
Table 3.1 Summary of the 3 cerebral hemisphere levels at which analysis was carried out ............. 52
Table 3. 2 Immunohistochemistry - optimised antigen retrieval, blocking protocol and antibody
concentrations in the cerebrum. .................................................................................................. 56
Table 4. 1 Immunohistochemistry - optimised antigen retrieval, blocking protocol and antibody
concentrations in the cerebellum. ............................................................................................... 90
Table 5.1 Dio1 gene assay ID’s……………………………………………………………………………..114
Table 5. 2 Clinical reference ranges for plasma levels of free triiodothyronine (FT3) and free thyroxine
(FT4) in infants, children and adults. Reference ranges from Monash Pathology, Clayton, Vic,
Australia. ................................................................................................................................................ 131
Table 5.3 Clinical reference ranges for plasma levels of Alanine transaminase (ALT), alkaline phosphatase
(ALP) and cholesterol in infants, children and adults. Reference ranges from Monash Pathology,
Clayton, Vic, Australia. .......................................................................................................................... 133
Appendix 3, Table 3. 1 Two-way ANOVA results of MBP-IR analysis, supplementary to Chapter
3, Section 3.7.1. ......................................................................................................................... 173
Appendix 3, Table 3. 2 Two-way ANOVA results of PLP-IR analysis, supplementary to Chapter 3,
Section 3.7.1. ............................................................................................................................. 173
Appendix 3, Table 3. 3 Two-way ANOVA results of Olig2–IR analysis, supplementary to Chapter
3, Section 3.7.1.. ........................................................................................................................ 174
Appendix 3, Table 3. 4 Two-way ANOVA results of APC–IR analysis, supplementary to Chapter
3, Section 3.7.1.. ........................................................................................................................ 174
Appendix 3, Table 3. 5 Two-way ANOVA results of APC-IR: Olig2-IR analysis, supplementary to
Chapter 3, Section 3.7.1. ........................................................................................................... 174
Appendix 4, Table 4. 1 Two-way ANOVA results of cerebellar morphology measurements using
H&E staining supplementary to Chapter 4 Section 4.4.1 ......................................................... 175
Appendix 4, Table 4. 2 Two-way ANOVA results of immunohistochemical analysis in the
cerebellum, supplementary to Chapter 4 Section 4.4.2. ........................................................... 175

XV
Conferences & Awards
International Conferences
• 3rd Congress of joint European Neonatal Societies (jENS) 2019, Maastricht, Netherlands,
Poster presentation: Kondos-Devcic, D., Wong, F., Cumberland, C., Khore, M., Walker, D.,
Tolcos, M. “Assessment of neonatal growth and wellbeing following thyroid hormone based
therapy in a rodent model of intrauterine growth restriction (IUGR)”.
• International Society for Developmental Origins of Health and Disease (DOHaD) World
Congress 2019, Melbourne, Australia, Poster presentation: Kondos-Devcic, D., Wong, F.,
Cumberland, C., Khore, M., Walker, D., Tolcos, M. “Assessment of neonatal growth and
wellbeing following thyroid hormone based therapy in a rodent model of intrauterine growth
restriction (IUGR)”.
National Conferences
• 33rd Annual Fetal and Neonatal Workshop of Australia and New Zealand 2019, as part of the
23rd Congress of the Perinatal Society of Australia and New Zealand (PSANZ) 2019, Surfers
Paradise, Queensland. Oral presentation: Kondos-Devcic, D., Wong, F., Cumberland, C.,
Khore, M., Walker, D., Tolcos, M. “Assessment of neonatal growth and wellbeing following
thyroid hormone-based therapy in a rodent model of intrauterine growth restriction (IUGR)”.
• 31st Annual Fetal and Neonatal Workshop of Australia and New Zealand 2019, Canberra,
Australian Capital Territory. As part of the 21st Congress of the Perinatal Society of Australia
and New Zealand (PSANZ) 2017, Canberra, Australian Capital Territory.
• HDR Student Symposium 2019, RMIT Bundoora Campus, Victoria. Oral presentation: “A
Thyroid hormone-based treatment to restore the brain maturation following foetal growth
restriction”.
• Students of Brain Research (SOBR) Conference 2018, St Vincent’s Hospital, Melbourne,
Victoria. Kondos-Devcic, D., Walker, D., Wong, F., Tolcos, M. Oral presentation: “A
Thyroid hormone-based treatment to restore the brain in growth restricted babies”.
Awards
1. RMIT University Bundoora Campus Joint 2nd Place, 3-Minute Thesis competition 2018.
2. RMIT HDR Beautiful Science Competition 2019 1st Prize for scientific image.
3. Australian Postgraduate Award, 2016.

XVI
List of Abbreviations
% AC
<
±
1°
2°
*
ABC
AHDS
ALP
ALT
ANOVA
APC
ATP
BG
BMC
BMD
BSA
BUVL
CA1
CA3
cm2
CNS
CRL
DAB
DEXA
dg
dH2O
DITPA
Dio1
DNA
DPX
DWM
E
EGL
F
FT3
FT4
fMRI
Percentage of areal coverage
Less than
Plus/minus
Primary
Secondary
Multiplication sign
Avidin/Biotinylated enzyme Complex
Allan-Hernon-Dudley syndrome
Alkaline phosphatase
Alanine transaminase
Analysis of variance
Adenomatous polyposis coli
Adenosine triphosphate
Bergmann glia
Bone mineral content
Bone mineral density
Bovine serum albumin
Bilateral uterine vessel ligation
Cornu ammonis region 1
Cornu ammonis region 3
Centimetres squared
Central nervous system
Crown-to-rump length
3,3’- Diaminobenzadine
Dual energy x-ray absorptiometry
Days of gestation
Distilled water
3,5-diiodothyropropionic acid
Deiodinase 1
Deoxyribonucleic acid
Dibutylphthalate polystyrene xylene
Deep white matter
Embryonic day
External granular layer
Ratio of residual variances
Free plasma 3,5,3’- triiodothyronine
Free plasma thyroxine
Functional magnetic resonance imaging

XVII
GA
GABA
GFAP
GM
H2O2
H&E
Iba1
IGL
i.p.
IR
IUGR
IU/L
IQ
KO
MBP
MCT8
ML
MRI
mRNA
NaCl
NHMRC
N
OL/s
Olig2
OPCs
P
p
PB
PBS
PCR
PFA
PLP
RNA
ROI
SD
SEM
SVZ
T3
T4
TCA
TH
TSH
Gestational age
Gamma-Aminobutyric acid
Glial fibrillary acidic protein
Grey matter
Hydrogen peroxide
Haemotoxylin and Eosin
Ionized calcium-binding adaptor molecule 1
Internal granular layer
Intraperitoneal
Immunoreactivity/ immunoreactive
Intrauterine growth restriction
International units per litre
Intelligence quotient
Knockout
Myelin basic protein
Monocarboxylate transporter-8
Molecular layer
Magnetic resonance imaging
Messenger ribonucleic acid
Sodium chloride
National Health and Medical Research Council
Sample size
Oligodendrocyte/s
Oligodendrocyte transcription factor 2
Oligodendrocyte progenitor cells
Postnatal day
p-value
Phosphate buffered
Phosphate buffered saline
Polymerase chain reaction
Paraformaldehyde
Myelin proteolipid protein
Ribonucleic acid
Region of interest
Standard deviation
Standard error of the mean
Subventricular zone
3,5,3’- triiodothyronine
3,5,3’,5’ – tetraiodothyronine or thyroxine
Total cross-sectional cerebellar area
Thyroid hormone
Thyroid-stimulating hormone

XVIII
TR
TRH
USA
WM
Thyroid hormone receptor
Thyrotropin-releasing hormone
United States of America
White matter

Summary
XIX
Summary
Intrauterine growth restriction (IUGR) is a condition in which a foetus does not reach its full genetic
growth potential, and is a leading cause of perinatal death and postnatal morbidity. IUGR often results
in permanent neurodevelopmental deficits, ranging from cognitive and behavioural impairments to
cerebral palsy. IUGR can occur due to a number of environmental or genetic factors, however the
dominant cause is a lack of oxygen and nutrients delivered the foetus as a result of placental
insufficiency. Deficits in grey matter (GM) and white matter (WM) in the foetal brain are thought to
underlie these neurodevelopmental sequelae. There is no current treatment to prevent or correct
placental insufficiency, and babies are often delivered preterm if IUGR is found to be severe or
worsening, further increasing the potential for adverse outcomes. With 27,000 IUGR babies born in
Australia in the past year alone, and 30 million born worldwide, new therapies which can be delivered
immediately after birth, are urgently required.
IUGR decreases the expression of monocarboxylate transporter-8 (MCT8) (Azhan, 2019, Chan et al.,
2014), a transporter protein necessary for the delivery of thyroid hormone (TH) into cells such as
oligodendrocytes (OLs) in the brain (Lee et al., 2017). TH is critical for the maturation of OLs during
foetal brain development, and reduced transport of TH into OLs impairs myelination (Lee et al.,
2017). In this thesis, it is proposed that the synthetic TH analogue 3,5-diiodothyropropionic acid
(DITPA) which does not require MCT8 to enter cells, can be used to overcome deficits caused by a
loss of MCT8 expression in the IUGR brain, thereby restoring myelination. Our group has previously
shown that MCT8 mRNA levels are reduced in the newborn IUGR rat at postnatal day (P) P7, and
these levels normalise by P14 (Azhan, A., PhD thesis, Monash University, 2019). Furthermore, we
have previously shown that short-term administration of DITPA (0.5mg/100g/day i.p.) to newborn
IUGR rats (from P1 to P6) corrected the myelination deficit in the external capsule by P7, and did
not affect neonatal growth parameters (Azhan, A., PhD thesis, Monash University, 2019). The present
project set out to investigate the benefits of a longer-term DITPA treatment from P1 to P13
(0.5mg/100g/day i.p.) a time in rat brain development equivalent to 23 to 40 weeks gestation in the
human (Semple et al., 2013), and reflective of what is likely to occur in the clinical setting with an
IUGR baby delivered preterm and given DITPA until term equivalent age. The same cohort of
animals contributed to all 3 experimental chapters in this thesis.
In Chapter 3, the impact of DITPA administration on the development of the cerebrum was
investigated, focusing on myelination, a neurodevelopmental process affected in IUGR, and regions

Summary
XX
with known vulnerability to the prenatal insults. Specifically, this study aimed to determine whether
DITPA administration in IUGR rat pups from P1 to P13 improved myelination, promoted OL
maturation, and did not cause injury or inflammation in the cerebrum compared to vehicle (saline)
treatment. The data presented in Chapter 3 shows that DITPA treatment in IUGR may promote
myelination in the cerebral cortex and fimbria, increase OL density in the corpus callosum, and does
not cause injury or inflammation in the cortex, corpus callosum, hippocampus or fimbria when
assessed at P14. This study indicates that an extended duration of DITPA treatment may be beneficial
to myelination in the IUGR cerebrum but is not favourable when given in controls, decreasing myelin
proteolipid protein (PLP) and OLs the cortex and fimbria. Next, it was essential to investigate
DITPA’s therapeutic potential in another brain region with known vulnerability to IUGR (De Bie et
al., 2011, Padilla et al., 2011), the cerebellum.
The study presented in Chapter 4 aimed to determine the impact of DITPA treatment (P1 to P13) on
myelination, OL development, morphology, and neuroinflammation in the cerebellum in IUGR rat
pups. DITPA did not improve myelination or promote OL maturation in the cerebellum of IUGR
pups when assessed at P14, had no negative impact on cerebellar morphology (layer widths/areas and
Bergmann glial fibre density), however increased the density of Purkinje cells, and microglia in late
developing cerebellar lobules. Overall, these data support longer-term DITPA administration in
IUGR as exhibiting more benefit in the cerebrum than the cerebellum; as in the cerebrum DITPA
may be unfavourable when given to controls. To further investigate the potential use of DITPA in
treating IUGR, potential off-target effects on neonatal growth and wellbeing were determined next.
Chapter 5 examined potential off-target effects of DITPA administration in control and IUGR
neonates, focussing on neonatal growth, and assessment of wellbeing. Body weight of all pups was
assessed at P1, P7 and P14. Liver and kidney weights, body morphometry (head and hip
circumference and crown-to-rump length), body composition (bone density and mineral content, lean
tissue mass, fat mass), thyroid and liver function, as well as cholesterol levels were measure in pups
at post-mortem (P14). DITPA administration in IUGR pups did not adversely impact neonatal growth,
brain or organ weights or body composition, despite altering FT4 levels and showing hepatic
thyromimetic activity, but alters growth, liver weight and bone mineral content when given to control
pups.
In conclusion, this thesis has, for the first time, demonstrated that longer-term administration of the
TH analogue DITPA, which enters cells independently of MCT8, to newborn IUGR rats promotes
myelination in the cerebrum, increases OL density in the corpus callosum, and does not cause injury

Summary
XXI
or inflammation to the brain, albeit for a possible inflammatory response in the late developing
cerebellar lobules. In IUGR pups there were no negative off-target effects on neonatal growth or
wellbeing, although DITPA caused unfavourable outcomes when administered to controls. The work
presented in this thesis collectively highlights the potential for DITPA to improve myelination
outcomes in the IUGR brain, without causing injury or adverse off-target physiological effects,
however further studies are required before DITPA can be considered as a therapy in IUGR.

Introduction
1
1 Introduction
1.1 Intrauterine growth restriction (IUGR)
Intrauterine growth restriction, or IUGR is characterised by foetal growth that is small for gestational
age (GA) due to environmental or genetic factors, and is a major clinical challenge (Murki, 2014). In
developed countries, up to 9% of all pregnancies are affected by IUGR; in Australia this equates to
27,000 born in the past year, and 30 million infants born worldwide (de Onis et al., 1998, Wardlaw,
2004). IUGR is second to prematurity as the leading cause of perinatal morbidity and mortality (Abu-
Saad and Fraser, 2010, Bhutta et al., 2005), with IUGR babies at an increased risk of adverse
neurodevelopmental sequelae (Geva et al., 2006b), and 10 – 30 fold increased risk of developing
cerebral palsy (McIntyre et al., 2013, MacLennan et al., 2015). Nearly a third of IUGR births are due
to genetic causes, with the rest related to the foetal environment (Murki, 2014), and largely due to
deficient oxygen and nutrient supply to the foetus caused by maternal, placental or foetal factors.
IUGR can be a consequence of damage to, or partial occlusion of the umbilical cord (Murki, 2014,
Nash and Persaud, 1988), as well as placental malfunction (Krishna and Bhalerao, 2011). The most
common cause of IUGR is placental insufficiency, characterised by compromised utero-placental
blood flow, attributed to developmental faults in the placenta or placental blood vessels, thought to
be due to altered expression of growth factors (Regnault et al., 2002). This results in the foetus
receiving less blood, and therefore less oxygen and nutrients (Gaccioli and Lager, 2016). If serious,
IUGR is detected during late pregnancy, and the baby is often delivered preterm in order to remove
it from the insufficient intrauterine environment.
IUGR foetuses and neonates are classified as having symmetric, asymmetric or mixed growth
restriction, dependent on the ratio of head to abdominal circumference (foetus) or growth percentiles
of head circumference versus weight and length (neonate). IUGR commencing early in gestation
(prior to 32 weeks of gestation) and associated with symmetrical growth restriction, is more
commonly associated with chromosomal abnormalities or congenital infections (Sharma et al.,
2016a). Later-onset IUGR on the other hand, is usually associated with asymmetrical IUGR and is
often a result of placental disorders (Rosenberg, 2008). Asymmetrical IUGR infants are characterised
by a normal head circumference, with a proportionally smaller body weight, commonly due to “brain
sparing” mechanisms that occur during IUGR (Flood et al., 2014). Lastly, mixed IUGR occurs when
pre-existing growth restriction is affected further by placental disorders (Sharma et al., 2016b). The

Introduction
2
IUGR foetus often displays an adaptive mechanism, known as the ‘foetal brain-sparing effect’,
whereby in response to placental insufficiency, there is vasodilatation of the foetal cerebral circulation
to protect the brain. However this typically occurs at the expense of body weight and of other organs
like the kidneys and liver, which remain growth restricted (Miller et al., 2016). This thesis will focus
on IUGR caused by placental insufficiency, as it is the most common clinical presentation.
1.2 Physiological impacts of IUGR
Reduced oxygen and nutrient availability to IUGR foetuses as a result of placental insufficiency result
in a number of unfavourable physiological outcomes. While the defining characteristic of IUGR
neonates is their reduced body weight, there are also many associated physiological effects including
hypoglycaemia (Cowett et al., 1984, Haymond et al., 1974), altered blood cell counts (Castle et al.,
1986, Van den Hof and Nicolaides, 1990, Snijders et al., 1993), impaired organ growth (Platz and
Newman, 2008, Man et al., 2016) and body composition measures (Namgung and Tsang, 2000,
Namgung and Tsang, 2003, Chunga Vega et al., 1996) and altered thyroid gland activity (Kilby et al.,
2000, Soothill et al., 1992, Thorpe-Beeston et al., 1991). Reduced lipid and glycogen storage is seen
in IUGR foetuses as a result of placental insufficiency, and this contributes to neonatal
hypoglycaemia, where blood sugar levels are reduced (Cowett et al., 1984, Haymond et al., 1974).
IUGR neonates also display reduced white blood cell counts (leucopenia), as well as reduced platelet
numbers (thrombocytopenia) (Castle et al., 1986), both essential for immune defence. For the
purposes of this thesis, a focus will be placed on the impact of IUGR on growth of the body and
organs such as the kidneys and liver, and body composition measures including bone mineral density
and content, lean tissue mass and fat mass, as well as thyroid function and liver activation. These
parameters are all known to be impacted by IUGR (Bernstein et al., 2000, Martorell et al., 1998, Pena
et al., 1988, Strauss and Dietz, 1998, Kilby et al., 1998, Soothill et al., 1992, Thorpe-Beeston et al.,
1991).
1.2.1 Impact of IUGR on growth and organ development
While approximately 70 to 90% of IUGR infants display some form of catch-up growth from birth to
two years of age, they often fail to catch up completely (Monset-Couchard and de Bethmann, 2000).
In IUGR-born children, reduced growth and development is seen at 12 months of age (Low et al.,
1978), and reduced height is seen at school age, with a reduction in head circumference compared to
children who were born with appropriate weight for GA (Robertson et al., 1990, Monset-Couchard
et al., 2004). Overall, IUGR neonates maintain a smaller stature in adulthood compared to adults who
were born appropriately sized (Karlberg and Albertsson-Wikland, 1995, Westwood et al., 1983). This
is also seen in animal models of IUGR, where reduced body weight and crown-to-rump length are

Introduction
3
observed in IUGR rats at P7 and P14 compared to non-IUGR born rats (McDougall et al., 2017b,
1984, Olivier et al., 2005, Wlodek et al., 2005), and in IUGR foetal guinea pigs (Herrera et al., 2016)
at 52 days of gestation (dg), 60 dg, 1 week, and 8 weeks postnatal age (Tolcos et al., 2018, Tolcos et
al., 2011). It is important to note, that experimental models of IUGR such as bilateral uterine vessel
ligation, do not produce offspring that are equally IUGR. Instead there is a spectrum of growth
restriction that is dependant on the positioning of the foetus relative to the ligation site. Of relevance
to this thesis, it has been well documented in rats that foetuses in the uterine horn which are positioned
closest to the site of ligation generally experience the highest level of growth restriction compared to
their littermates and are more likely to die in utero resulting in a smaller litter size. Foetuses further
away from the ligation site may benefit more from supplementary blood supply(Hayashi and Dorko,
1988, Wigglesworth, 1964, Wigglesworth, 1974, Catteau et al., 2011, Gallo et al., 2012) This
experimental ‘range’ of IUGR in the rat should be taken into account when discussing outcomes.
IUGR also affects organ growth, where compared to non-IUGR counterparts, IUGR infants have
significantly smaller brains, hearts, lungs, thyroid glands, livers and kidneys (Platz and Newman,
2008, Man et al., 2016). This thesis will assess the impact of IUGR on liver and kidney growth, two
organs known to be vulnerable to the effects of IUGR (Schreuder et al., 2006). The liver is essential
for detoxification, metabolism and immune function, as well as synthesising proteins, metabolites
and biochemical enzymes that are essential for digestion and metabolism in the body. Relevant to this
thesis, the liver metabolises drugs (Remmer, 1970), as well as regulating energy by storing excess
blood glucose as glycogen upon being stimulated with insulin, which is released by the pancreas, and
then converting it back to glucose when the body requires energy. In humans, IUGR is associated
with insulin resistance in childhood (Veening et al., 2002, Hofman et al., 1997, Fraser et al., 2007)
and adulthood (Flanagan et al., 2000, Jaquet et al., 2000), as well as the prevalence of metabolic
disorders, the presentation of ‘fatty liver disease’ (Alisi et al., 2011), and abnormal glucose tolerance
in adulthood (Hales et al., 1991, Lithell et al., 1996). These studies highlight that impairments in liver
function as a result of IUGR are long lasting. Animal models provide further insight, with impaired
insulin signalling, as well as reduced amino acid uptake seen in the foetal IUGR sheep liver (Thorn
et al., 2009), while reduced glycogen storage (Oh et al., 1970), and decreased liver glucose
transporters are seen in IUGR rats compared to controls (GLUT-1 & GLUT-2) (Lane et al., 2001a).
In IUGR foetal pigs, lipoprotein lipase an important protein for the metabolism of vitamins, minerals,
protein and importantly glucose is reduced (Liu et al., 2013), suggesting that IUGR hinders the liver’s
ability to extract nutrients. IUGR also markedly reduces liver weight, with reduced liver weight in
human IUGR foetuses, being indicative of functional disturbances (Latini et al., 2004, Ladinig et al.,
2014, Molina Giraldo et al., 2019). Reduced liver weight is also seen in IUGR rats (Azhan, A., PhD

Introduction
4
thesis, Monash University, 2019) and sheep (Limesand et al., 2006). It is believed that the level of
organ ‘catch-up growth’ following IUGR underpins the impaired metabolic outcomes seen (Singhal
et al., 2003). Together, these studies suggest that impaired liver function following IUGR is likely to
be correlated with decreased liver weight and level of catch-up growth. IUGR also reduces foetal
circulating cholesterol levels (Pecks et al., 2012, Pecks et al., 2016, Bon et al., 2007, Merzouk et al.,
1998, Roberts et al., 1999). Cholesterol is and is a lipid-rich substance that is essential for cellular
structure, and is synthesised by the liver, or ingested through diet, however when present in high
amounts can increase the risk of cardiac disease. IUGR is shown clinically to predispose adults to
elevated circulating cholesterol levels (Barker et al., 1993).
The kidneys (renal system) are the body’s filtration system containing nephrons which act as filtration
units to remove waste and extra fluid in urine. The kidneys are responsible for maintaining a
homeostatic balance of electrolytes, minerals and water within the body, and in IUGR foetuses as
well as during the first year of life and into childhood (Naeye, 1965, Hotoura et al., 2005, Schmidt et
al., 2005, Latini et al., 2004), kidney volume is reduced compared to controls, indicative of decreased
nephron density (Silver et al., 2003). Indeed, decreased nephron density has long been correlated with
IUGR (Brenner and Chertow, 1993), and this pathology is also associated with outcomes of renal
dysfunction and hypertension later in life and in humans (Chan et al., 2010) and rats (Battista et al.,
2002) (R. Valdez, 1994, M. do Carmo Pinho Franco, 2003, Mackenzie and Brenner, 1995). These
studies collectively highlight the negative implications of IUGR on the liver, cholesterol levels and
renal system, and suggest that IUGR predisposes individuals to negative health outcomes later in life.
1.2.2 Impact of IUGR on body composition
IUGR impacts body composition measures such as bone mineral density and content, lean tissue mass
such as muscle, as well as body fat. Clinically, IUGR foetuses have a 25 to 40 % decrease in skeletal
muscle mass compared to their non-IUGR foetuses, when assessed using ultrasound in late gestation
(Larciprete et al., 2005). Bone mineral density and content is also reduced in the IUGR foetus
(Verkauskiene et al., 2007), and at birth (Namgung and Tsang, 2000, Namgung and Tsang, 2003,
Chunga Vega et al., 1996). Lean tissue mass and muscle mass is reduced in IUGR compared to non-
IUGR counterparts (Srikanthan and Karlamangla, 2011), and this persists postnatally (Beltrand et al.,
2008, Larciprete et al., 2005), with reduced muscle mass and impaired physical strength extending
into adulthood (Brown and Hay, 2016). A lower percentage of body fat is observed in IUGR foetuses
(Larciprete et al., 2005), and infants (Verkauskiene et al., 2007) compared to those who are not growth
restricted. Animal models of IUGR (induced via placental insufficiency) display similar findings,
with reduced skeletal mass reported in foetal sheep compared to controls (Costello et al., 2008), and

Introduction
5
reduced bone mineral concentration found in IUGR rats at P7 (Azhan, A., PhD thesis, Monash
University, 2019). Muscle mass is significantly reduced in IUGR lambs compared to controls (Fahey
et al., 2005), and reduced lean tissue mass and body fat in IUGR rats at P7 (Azhan, A., PhD thesis,
Monash University, 2019) and at 5 months of age (Coupe et al., 2012). It is clear from the numerous
studies across species that IUGR negatively impacts body composition measures, however IUGR is
also known to disrupt brain development (Batalle et al., 2012, Lodygensky et al., 2008, Tolsa et al.,
2004), as discussed below.
1.3 Impact of IUGR on the brain
The brain is the most complex organ in the human body, containing approximately 15 to 33 billion
neurons, which transmit afferent and efferent information (Herculano-Houzel, 2009). Apart from
being essential for cognition, the brain orchestrates the correct functioning of organs, muscles and
endocrine activity, allowing rapid and coordinated responses to changes in environment. The brain is
comprised of three main compartments, the forebrain (cerebrum) which contains the cerebral cortex,
the midbrain and the hindbrain, which contains the cerebellum. These regions are comprised of GM,
regions that are dense in neurons, axons and neuroglia, and WM, which contain myelinated axons
and neuroglia. The focus of this thesis will be on the cerebrum, including the cerebral cortex and
subcortical structures like the corpus callosum, external capsule and hippocampus, as well as on the
cerebellum, as these regions of the brain are known to be highly vulnerable to prenatal insults like
IUGR, often resulting in long-term neurological impairment (Padilla et al., 2011, Padilla et al., 2014b,
Egana-Ugrinovic et al., 2014, Lodygensky et al., 2008). Surviving IUGR infants have a greatly
increased risk of neurodevelopmental impairment (Geva et al., 2006b), which range from learning
difficulties (Geva et al., 2006a), decreased intellectual and cognitive function (de Bie et al., 2010,
Geva et al., 2006a) to a 10 to 30 fold increased risk of developing cerebral palsy (McIntyre et al.,
2013, MacLennan et al., 2015). Reduced regional and total brain volumes have been found in
foetuses, neonates, children and adolescents who were born IUGR (Padilla et al., 2014b, Tolsa et al.,
2004, Dubois et al., 2008). This is thought to be largely due to loss of GM and microstructural changes
in the WM, suggesting reduced myelination and axonal injury (Samuelsen et al., 2007, Padilla et al.,
2011, Padilla et al., 2014b, Businelli et al., 2014, Tolsa et al., 2004, Dubois et al., 2008, Batalle et al.,
2012, Eikenes et al., 2012a, Egana-Ugrinovic et al., 2014). Post-mortem studies show disrupted
myelination in the brain of preterm IUGR infants (Chase et al., 1972), while in vivo neuroimaging
studies show that disruption to myelin integrity can persist to adulthood (Padilla et al., 2014a, Esteban
et al., 2010, Eikenes et al., 2012b). Before the impact of IUGR on the brain is discussed in further
detail, a brief summary of brain development and structure of the mature brain will be provided to
enable greater understanding of the studies within this thesis.

Introduction
6
1.4 Structure of the brain
Development of the central nervous system (CNS) and brain begins as early as 4 weeks GA, where
following gastrulation, ectodermal specification and closure of the neural tube, neuronal progenitors
begin differentiating to form three vesicles; the prosencephalon, mesencephalon and
rhombencephalon (the developing forebrain, midbrain and hindbrain brain respectively). The
prosencephalon, or forebrain subsequently differentiates into 2 separate vesicles known as the
telencephalon, which later forms the cerebral hemispheres, and the diencephalon. The
rhombencephalon or hindbrain also further divides into 2 vesicles known as the metencephalon,
which later forms the cerebellum and pons, and the myelencephalon which gives rise to the medulla.
This thesis will focus on the cerebral hemispheres (including the cerebral cortex, corpus callosum,
external capsule and hippocampus) as well as the cerebellum, with emphasis placed on cerebellar
layer morphology and myelination. Where known, the developmental time-points discussed below
(Sections 1.4.1 & 1.4.2) will refer to the rat/rodents as embryonic age (E) or postnatal day (P).
1.4.1 Structure of the cerebral hemispheres
During the 10th week of gestation, growth of the brain hemispheres gives rise to the anterior frontal
lobes, and the posterior parietal, occipital and temporal lobes of the cerebrum. Cerebral development
can be divided into the early embryonic and late foetal phases. During the early embryonic phase
which occurs during the 5th to 8th week GA (Marin-Padilla, 1983), the cerebral vesicles begin to form,
and GM that will later become the mature six-layered cerebral cortex begins to stratify and
differentiate (Marin-Padilla, 1983). The mature cerebrum consists of two hemispheres, which contain
four lobes - the frontal, parietal, occipital and temporal lobes - which are responsible for motor,
sensory, visual and auditory functioning (Shi et al., 2012). Development of the six-layered cerebral
cortex, as well as the corpus callosum, external capsule and hippocampus will be outlined in greater
detail below.
1.4.1.1 Structure of the cerebral cortex
Development of the cerebral cortex begins with the differentiation of neurons from cortical stem cells
and progenitor cells within a region known as the ventricular zone. This is followed by an extended
period of neurogenesis resulting in mature functional neurons with electrophysiological properties
and the ability to form functional excitatory synaptic networks (Shi et al., 2012). Neuronal
proliferation consists of ventricular stem cells and progenitor cells undergoing a number of highly
regulated steps as they migrate dorsally to take their position in the six-layered morphology of the
mature cerebral cortex (Noctor et al., 2004, Wonders and Anderson, 2006). The cerebral cortex is

Introduction
7
generated in an ‘inside-out’ manner, with deep layer neurons being produced first, and more
superficial layer neurons arising last. In order of formation from deepest to most superficial the layers
are: layer VI (multiform layer), V (internal pyramidal layer), IV (internal granular layer), III (external
pyramidal layer), II (external granular layer) and I (molecular layer). Layers V and VI combined are
known as the infragranular layer and connects the cortex with subcortical regions. Layer V contains
stellate cells and gives rise to efferent projections to the basal ganglia, brainstem and spinal cord,
while layer VI contains fusiform cells, primarily projecting to the thalamus. Once fully developed,
the cerebral cortex is comprised of tightly folded GM, and contains the six-layered neocortex
(Rhoton, 2002), which contains excitatory and inhibitory neurons, glial cells such as astrocytes
(Luskin et al., 1993), microglia and OLs (Harris et al., 2015), and endothelial cells which constitute
blood vessels (Garcia-Cabezas et al., 2016). Between 16 to 18 weeks GA in humans, a wave of
oligodendrocyte progenitor cells (OPCs) migrate dorsally from a region known as the medial
ganglionic eminence, and populate the developing cortex (Kessaris et al., 2006, Rakic S, 2002). This
occurs from E15.5 in the mouse brain (Miller, 2002). A final wave of OPCs arise postnatally in
humans, and at birth in mice; the timing of this is mediated by the gene EMX1 being expressed by
cells in the ventricular zone of the developing cerebral cerebrum (Gorski et al., 2002, Winkler et al.,
2018). Development of OLs continue throughout childhood, adolescence and into adulthood
(McKenzie et al., 2014, Miller, 2002, Richardson et al., 2006). Beneath the cerebral cortex lies the
subcortical WM, and structures including the corpus callosum, external capsule and hippocampus
which will be a focus of this thesis and discussed below.
1.4.1.2 Structure of the hippocampus
The hippocampus develops in the medial temporal lobule, beneath the cerebral cortex, and is
responsible for navigation and spatial memory. Neuronal development and myelination in the human
and rodent hippocampus proceeds throughout childhood and into adulthood (Arnold and
Trojanowski, 1996, Gould et al., 1999, Eriksson et al., 1998, Stanfield and Trice, 1988, Cameron et
al., 1993). By 15 to 19 weeks GA the regions of the hippocampus are distinguishable, and from 20 to
25 weeks GA it expands substantially in volume (Arnold and Trojanowski, 1996). The region of the
hippocampus which later develops into the dentate gyrus, wraps around what will later become the
cornu ammonis region 3 (CA3), consisting of densely packed immature granule neurons. From 39 to
40 weeks (term) the hippocampus is mature in structure in humans, and at ~ P22 to 24 is mature in
rodents (Charvet and Finlay, 2018). Myelination in the hippocampus first appears at ~ 39 weeks GA
in humans (Arnold and Trojanowski, 1996), and at ~ P22 to 23 in rodents (Soriano et al., 1994). OLs
are first seen in the fimbria (fimbriae plural), a bundle of afferent and efferent nerve fibres adjacent
to the hippocampus proper at 20 weeks GA in humans (Abraham et al., 2010). The structure of the

Introduction
8
hippocampus is mature at birth, consisting of an adjacent cortical structure known as the hippocampal
gyrus, and a strip of densely packed neurons positioned between the hippocampus and the
hippocampal gyrus, called the dentate gyrus. The hippocampal gyrus consists of the entorhinal cortex
and subiculum, both involved in propagating the flow of information through the hippocampus
(Duvernoy, 2005) (Figure 1.1 C). Information is received from the overlying cerebral cortex via the
entorhinal cortex, projecting to the dentate gyrus (Duvernoy, 2005). Axon fibres then leave the
dentate gyrus and project to the cornu ammonis region (CA3), a region characterised by neuronal
morphology which is not uniform compared to the other hippocampal regions, and which plays an
essential role in encoding short-term memory and spatial information (Cherubini and Miles, 2015).
The CA3 propagates information to the cornu ammonis region 1 (CA1), which contains smaller
neurons than the CA3, and is integral for encoding long-term memory and spatial recognition. The
CA1 then relays impulses to neurons in a region called the subiculum which projects back to the
enterohinal cortex, enabling the signals to extend to the rest of the brain. Impulses can also leave the
hippocampus through the fimbria, subsequently entering the fornix, a WM fibre bundle (Figure 1.1
B) which connects the hippocampus to a variety of subcortical structures like the thalamus and
hypothalamus (Duvernoy, 2005).
Figure 1.1 Diagrams showing (A) the position of the hippocampus under the cerebral cortex, deep within the
medial temporal lobe, (B) the structure of the fornix and fimbriae which connects the hippocampus to
subcortical structures and (C) the structure of mature hippocampal formation including the dentate gyrus
(pink), cornu ammonis (yellow), entorhinal cortex (green) and parahippocampal gyrus (blue).

Introduction
9
1.4.1.3 Structure of the corpus callosum
The corpus callosum is a large bundle of myelinated neuronal fibres which transverses the midline of
the brain, providing connectivity between the left and right cerebral hemispheres through intra, as
well as inter-hemispheric axonal projections (Schulte and Muller-Oehring, 2010), that connect the
cortex in the frontal, parietal, occipital and temporal lobes of the brain (Aralasmak et al., 2006). The
corpus callosum is the largest WM tract in the human brain (Fitsiori et al., 2011), and rat brain
(Olivares et al., 2001), and contains sub-regions including the genu, midbody, truncus and splenium
which connect the corpus callosum to sensory, auditory, motor and somatosensory regions within the
brain (Goldstein et al., 2020). The structure of the corpus callosum in humans and rodents is similar,
and development, including myelination continues into adulthood in both humans and rats (Nunez et
al., 2000, Sullivan et al., 2006, Bartzokis et al., 2001, Courchesne et al., 2000, Yates and Juraska,
2007). Relatively little is understood about the embryonic development of the corpus callosum,
however it is known that development begins with the body of the corpus callosum known as the
genu appearing at approximately 12 weeks GA in the human and E19 in the rat (Workman et al.,
2013), later followed by the isthmus and splenium regions (Volpe et al., 2006). The developmental
gradient of the corpus callosum is unclear with some studies suggesting that is develops cranio-
caudally, while others found it to grow bi-directionally (Rakic and Yakovlev, 1968, Barkovich, 1988,
Kier and Truwit, 1997). Following birth, the corpus callosum continues to grow rapidly during
infancy, undergoing structural changes such as fibre myelination and pruning (Tanaka-Arakawa et
al., 2015, Rakic and Yakovlev, 1968). While the corpus callosum is developmentally complete by 4
years of age, it continues to expand in size at a much slower rate throughout the first 3 decades of life
(Tanaka-Arakawa et al., 2015). From 12 to 13 weeks GA, nerve fibres begin to transverse the midline
of the left and right cerebral hemispheres, laying down tracks for what will later become the corpus
callosum (Luders et al., 2010). By 18 weeks GA all regions of the corpus callosum can be visualised
(Malinger and Zakut, 1993). Myelination in the corpus callosum largely progresses in a posterior-to-
anterior direction from the splenium region to the genu (Richards, 2002, Kinney HC, 2002, Brody et
al., 1987). In the corpus callosum, the onset of myelination occurs from 9 weeks GA in the human
and postnatally from P11 in the rat (Workman et al., 2013), with the rate of myelination in humans at
its highest in childhood and although the rate declines after this, myelination persists until
approximately the 20th year of age (Keshavan et al., 2002). In rats and mice, myelinated fibres in the
corpus callosum continue development until P30 to 40, as seen using diffusion tensor imaging
(Baloch et al., 2009, Bockhorst et al., 2008). Positioned lateral and adjacent to the corpus callosum is
the external capsule, a WM tract responsible for connecting different regions of the cortex (Bloom
and Hynd, 2005). There is limited knowledge about the development of the external capsule. As the

Introduction
10
corpus callosum has a wide window of development, and is the largest WM structure in the brain, it
is susceptible to insults which impair myelination, such as IUGR.
1.4.2 Structure of the cerebellum
The cerebellum is the component of the hindbrain responsible not only for motor coordination,
balance, equilibrium and muscle tone (Buckner, 2013), but also cognition and higher order brain
functions (O'Halloran et al., 2012). The period over which the cerebellum develops extends from
early embryonic stages until the first postnatal years. This extended period of development renders
the cerebellum vulnerable to perinatal insults, which may alter cerebellar development, leading to
neurodevelopmental impairment. The fundamental mechanisms that underlie cerebellar development
in mice and rats are the same, as well as in the human, however they occur at different relative times
due to differences in gestation length. Development of the cerebellum begins with the characterisation
of the cerebellar territory at the midbrain-hindbrain boundary at E13 in the rat (Altman and Bayer,
1978). The cerebellum develops from structures known as the rhombic lips at approximately E13 in
the rat, and 5 to 8 weeks gestation in humans (Volpe, 2009). The body of the cerebellum arises from
the anterior portion of the rhombic lip, while the posterior portion, gives rise to precursors of deep
cerebellar nuclei (olivary and pontine nuclei) (Volpe, 2009). Development continues with the
formation of two compartments of cellular proliferation, the ventricular zone and the rhombic lip.
Purkinje cells and deep cerebellar nuclei arise from the ventricular zone at E13 to16 in mice, while
granule cell precursors are formed from the rhombic lip at E13 to 16 (Biran et al., 2012). Purkinje
cells are the primary output neurons of the cerebellum and aid in coordination of sensory input as
well as motor control. The Purkinje cells migrate along radial glial cells towards the pial surface and
form a mature monocellular layer at E20 to 21 (Figure 1.2), and continue to differentiate postnatally,
from P0 to P30 in the rat. The upper rhombic lip gives rise to granular precursor cells, which migrate
tangentially to form a transient germinal epithelium called the external granular layer (EGL) at E17
to 21 (Figure 1.2). Following mitotic division, the granule cells migrate, guided by Bergmann glia
(BG) to the interior of the future cerebellum, passing through the layer of Purkinje cells which are
migrating radially in the opposite direction. Purkinje cells secrete Sonic hedgehog, a protein that
stimulates proliferation of the granule precursor cells (Donkelaar et al., 2003). Once they have passed
this layer, the granule cells settle in a layer known as the internal granular layer (IGL) or granular
layer (Figure 1.2) in the mature cerebellum during the first 2 weeks after birth in humans. When
situated in the IGL, the granule cells extend horizontal parallel fibres that contact the Purkinje cell
dendrites. They are then contacted by mossy fibres, which extend in from the pons (Figure 1.2). This
developmental pattern continues, with the most rapid period of expansion occurring between 24 and

Introduction
11
40 weeks post conception in humans, resulting in a five-fold increase in the size of the cerebellum
(Chang et al., 2000).
Once development is complete, the cerebellum consists of two hemispheres, separated by a narrow
midline zone known as the vermis, and contains 3 lobes including the anterior, posterior and
flocculonodular lobe. The cerebellar anatomy consists of a tightly folded layer of GM called the
cerebellar cortex, with an underlying layer of WM, containing deep cerebellar nuclei, with the fluid-
filled fourth ventricle ventral to this. Each ridge of the cortex is known as a folium, and a set of large
folds divides the overall cerebellar structure into 10 areas known as lobules. As development of the
cerebellum is bilateral, lobules I-V arise from the anterior lobe and lobules VI to X arise from the
posterior lobe, resulting in a ‘fan shaped’ succession of lobule development from I – V and from X
to VI in each lobe. Apart from these lobules, the cerebellum is divided into many independently
functioning areas, which consist of the same stereotyped organisation of neurons, called microzones.
The outer cortex consists of four layers - the EGL which contains rapidly proliferating granular
neurons, the ML, the Purkinje cell layer and the internal granular layer IGL (Figure 1.2). The outer
molecular layer consists of the dendritic trees of Purkinje cells, Bergmann glial (BG) fibres which act
as a scaffold along which granule cells travel from the EGL to their final resting place in the IGL,
parallel fibres of granule cells which run perpendicular to the dendrites, stellate cells, basket cells and
inhibitory GABAergic interneurons which process information within the cerebellar cortex (Figure
1.2) (Volpe, 2009). The underlying Purkinje cell layer contains Purkinje cell bodies, important for
relaying information out of the cerebellum (Figure 1.2). The IGL is the deepest layer, and is densely
packed with granule cells and Golgi interneurons which filter incoming information (Figure 1.2)
(Donkelaar et al., 2003). The underlying WM is made up of myelinated nerve fibres, as well as mossy
fibres which carry information entering the cerebellum, and climbing fibres which extend from the
inferior olivary nucleus, wrap around Purkinje cells and relay information to the cells of the ML of
the cerebellar cortex (Figure 1.2).

Introduction
12
1.5 Impact of IUGR on the brain
This thesis will focus predominantly on the impact of IUGR on the largest WM tract in the cerebrum,
the corpus callosum as well as the external capsule, layer VI of the cerebral cortex and the
hippocampus. Known impacts of IUGR on these regions will be described below.
1.5.1 Impact of IUGR on the cerebrum
The cerebral cortex is the executive and integrative centre of the mammalian CNS, making up over
three quarters of the human brain’s volume (Shi et al., 2012). Cortical neurogenesis lasts over 70 days
Figure 1.2 Diagram of a mid-sagittal cross-section through the human cerebellum, with the ten lobules
indicated by roman numerals (I-X). Diagram of a mid-sagittal cross-section through the human cerebellum,
with the ten lobules indicated by Roman numerals (I-X). The dotted lines indicate the plane of section. The
cut-away illustration of the cerebellar cortical lobule depicts the three main layers of the cortex, the molecular
layer, Purkinje cell layer and granular layer. Adapted from (Ramnani, 2006).

Introduction
13
in humans (Caviness et al., 1995), and as discussed previously myelination commences in the 3rd
trimester of pregnancy and continues through childhood and adolescence into adulthood (Zhao et al.,
2005). This extended period of development renders the cerebral cortex extremely vulnerable to
perinatal insults such as inflammation/infection, hypoxic/ischaemic injury (Talos et al., 2006, Hu et
al., 2005, Hagberg et al., 2015) and IUGR induced via placental insufficiency (Rees et al., 1998, Rees
et al., 1988, Rees and Inder, 2005, Tolcos et al., 2011, Tolcos M, 2013).
A number of clinical studies using magnetic resonance imaging (MRI) to investigate the impact of
IUGR on the brain structure of infants, have reported decreased regional connectivity that is indicative
of decreased WM volume in the cerebrum, including the corpus callosum and external capsule at 12
and 18 months of age (Padilla et al., 2014b, Esteban et al., 2010), persisting through childhood and
into adulthood (Eikenes et al., 2012a). Decreased volume of the hippocampus has been reported in
IUGR infants (Lodygensky et al., 2008), as well as reduced volume of the corpus callosum (Egana-
Ugrinovic et al., 2013), and compromised folding of the cerebral cortex at post-mortem in IUGR
newborns (Dubois et al., 2008). Similarly, animal studies have shown an overall delay in myelination
of the corticospinal tract following IUGR at 52 days of gestation in guinea pigs (Nitsos and Rees,
1990), and decreased myelination in the cerebral cortex of IUGR guinea pigs at 60 and 62 dg,
persisting until 1 week of postnatal age (Tolcos et al., 2011). In the IUGR rat, reduced myelination
in the corpus callosum and external capsule is seen at P7, persisting until P14 (Azhan, A., PhD thesis,
Monash University, 2019), as well as an overall myelination delay detected at 8 weeks of age (Reid
et al., 2012) and into adulthood (Olivier et al., 2005). These studies indicate that IUGR severely
impairs cerebral development, with reduced growth of cortical and subcortical structures as well as
impaired WM development likely underlying the adverse neurodevelopmental outcomes associated
with IUGR.
1.5.2 Impact of IUGR on the cerebellum
As mentioned previously, the cerebellum increases roughly five-fold in volume between 24 and 40
weeks of GA (Volpe, 2009), and during this protracted period of growth and development, is highly
vulnerable to insults like the hypoxic-ischaemic insults occurring during IUGR. A number of clinical
studies have used MRI to investigate the impact of IUGR on the cerebellar structure of infants (Padilla
et al., 2014, Egana-Ugrinovic et al., 2013, Batalle et al., 2012, De Bie et al., 2011). Disruptions in
regional connectivity, consistent with decreased WM volume have been found in the cerebella of
IUGR infants at 1 year of age (Batalle et al., 2012), and decreased volumes of cerebellar GM and
WM have also been reported in the brains of IUGR children at 12 months, and up to 7 years of age
(De Bie et al., 2011, Padilla et al., 2011). Post-mortem studies of the IUGR brain, specifically the
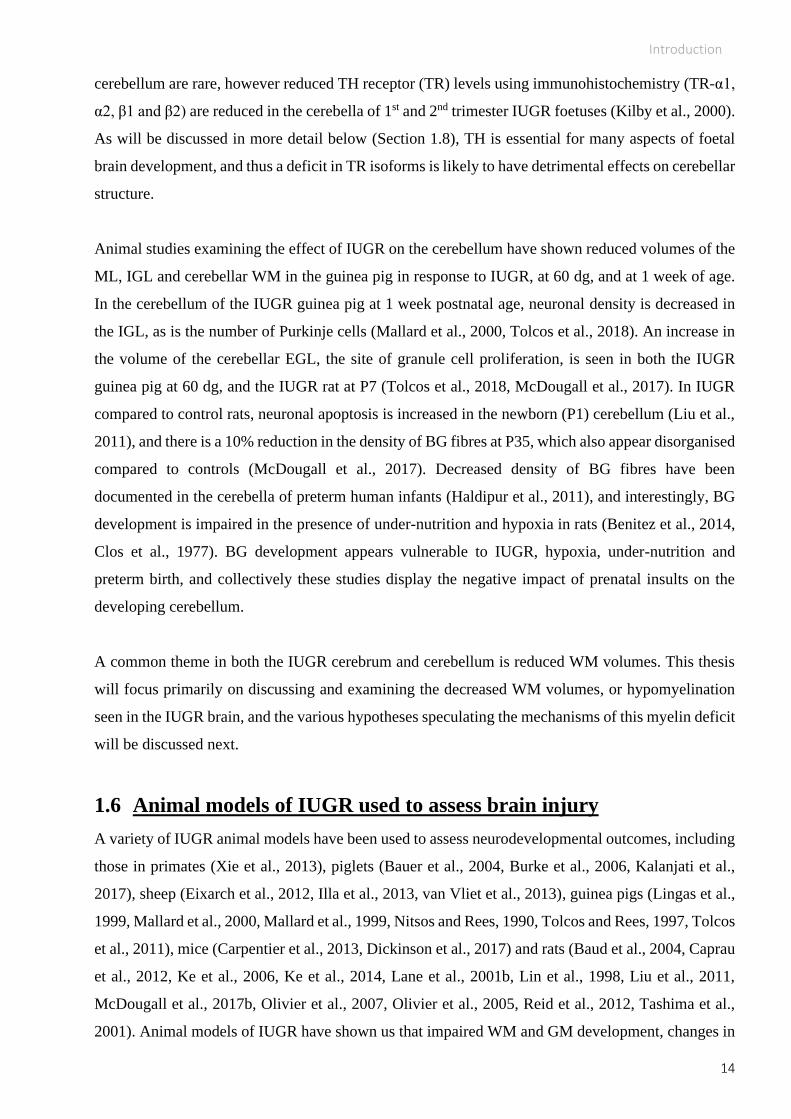
Introduction
14
cerebellum are rare, however reduced TH receptor (TR) levels using immunohistochemistry (TR-α1,
α2, β1 and β2) are reduced in the cerebella of 1st and 2nd trimester IUGR foetuses (Kilby et al., 2000).
As will be discussed in more detail below (Section 1.8), TH is essential for many aspects of foetal
brain development, and thus a deficit in TR isoforms is likely to have detrimental effects on cerebellar
structure.
Animal studies examining the effect of IUGR on the cerebellum have shown reduced volumes of the
ML, IGL and cerebellar WM in the guinea pig in response to IUGR, at 60 dg, and at 1 week of age.
In the cerebellum of the IUGR guinea pig at 1 week postnatal age, neuronal density is decreased in
the IGL, as is the number of Purkinje cells (Mallard et al., 2000, Tolcos et al., 2018). An increase in
the volume of the cerebellar EGL, the site of granule cell proliferation, is seen in both the IUGR
guinea pig at 60 dg, and the IUGR rat at P7 (Tolcos et al., 2018, McDougall et al., 2017). In IUGR
compared to control rats, neuronal apoptosis is increased in the newborn (P1) cerebellum (Liu et al.,
2011), and there is a 10% reduction in the density of BG fibres at P35, which also appear disorganised
compared to controls (McDougall et al., 2017). Decreased density of BG fibres have been
documented in the cerebella of preterm human infants (Haldipur et al., 2011), and interestingly, BG
development is impaired in the presence of under-nutrition and hypoxia in rats (Benitez et al., 2014,
Clos et al., 1977). BG development appears vulnerable to IUGR, hypoxia, under-nutrition and
preterm birth, and collectively these studies display the negative impact of prenatal insults on the
developing cerebellum.
A common theme in both the IUGR cerebrum and cerebellum is reduced WM volumes. This thesis
will focus primarily on discussing and examining the decreased WM volumes, or hypomyelination
seen in the IUGR brain, and the various hypotheses speculating the mechanisms of this myelin deficit
will be discussed next.
1.6 Animal models of IUGR used to assess brain injury
A variety of IUGR animal models have been used to assess neurodevelopmental outcomes, including
those in primates (Xie et al., 2013), piglets (Bauer et al., 2004, Burke et al., 2006, Kalanjati et al.,
2017), sheep (Eixarch et al., 2012, Illa et al., 2013, van Vliet et al., 2013), guinea pigs (Lingas et al.,
1999, Mallard et al., 2000, Mallard et al., 1999, Nitsos and Rees, 1990, Tolcos and Rees, 1997, Tolcos
et al., 2011), mice (Carpentier et al., 2013, Dickinson et al., 2017) and rats (Baud et al., 2004, Caprau
et al., 2012, Ke et al., 2006, Ke et al., 2014, Lane et al., 2001b, Lin et al., 1998, Liu et al., 2011,
McDougall et al., 2017b, Olivier et al., 2007, Olivier et al., 2005, Reid et al., 2012, Tashima et al.,
2001). Animal models of IUGR have shown us that impaired WM and GM development, changes in

Introduction
15
brain volumes and neurodevelopmental and cognitive outcomes (Tashima et al., 2001, Reid et al.,
2012, Caprau et al., 2012) associated with IUGR. These models of IUGR rely on the induction of
placental insufficiency, whereby reduced blood supply to the foetus results in reduced oxygen,
nutrients and hormones for development. Placental insufficiency is initiated via uterine artery ligation
(one or both arteries; from E17 to 19) in rats (Term = E22), rabbits (~25 days of gestation; Term =
31 days), and single umbilical artery ligation in sheep. This thesis will focus on an established rat
model of IUGR. There are a number of reasons this model of IUGR was chosen for our study.
Importantly, key time-points of brain development and in particular myelination and OL development
have been well characterised in the rat, including the Wistar strain (Craig et al., 2003). At the time of
BUVL in our model of IUGR (E18), preOLs have already begun to colonise the brain (Richardson et
al., 2006). OL maturation and myelination occurs mostly after birth in the rat from P1 to 14, and this
timeframe is equivalent to the development of myelin in the human brain at 23 to 40 weeks of GA
(Craig et al., 2003, Semple et al., 2013)(Figure 1.5). In the rat, the development of myelin in the brain
at P2 to P5 is similar to the human brain at 23 to 32 weeks GA (Segovia et al., 2008, Wu et al., 2013),
and at P7 cerebral myelination is histologically similar to WM in the human brain at 32 to 34 weeks
GA (term = 40 weeks) (Vannucci and Vannucci, 1997). This model also mimics the clinical effects
of IUGR, including reduced body (Lane et al., 2001b, Olivier et al., 2005, Price et al., 1992, Ogata et
al., 1985, Sadiq et al., 1999) and brain (Sadiq et al., 1999, Ogata et al., 1985, Tashima et al., 2001)
weight.
1.7 Mechanisms of reduced and delayed myelination in IUGR
Myelin is a lipid-rich substance containing proteins, and is essential for insulating nerve axons in the
brain, allowing for electrical impulses to be propagated rapidly and efficiently to enable correct motor
and cognitive function. In humans myelination begins in the second half of gestation and peaks during
the first year of life (Jakovcevski et al., 2009), continuing into adulthood (Richardson et al., 2011).
In the CNS, myelin is produced by OLs, which undergo a lineage progression. At least four stages of
OL maturation have been characterised and include OL progenitor cells (OPCs), pre-
oligodendrocytes (pre-OLs), pre-myelinating OLs and mature myelinating OLs (Figure 1.3).
Myelination is disrupted in the IUGR brain, and several underlying mechanisms have been proposed,
including decreased blood flow (or ischaemia) to WM regions causing a reduction in myelin
production, thought to be due to impaired protein function and plaque-like aggregates (Zhan et al.,
2015); WM regions are thought to be more vulnerable to an ischaemic insult than GM due to more
sparse capillaries (Volpe, 2001, Greisen and Borch, 2001). An alternate hypothesis is that IUGR
delays myelination through the generation of oxidative stress, whereby reactive oxygen species,
thought to be produced by mitochondria in the presence of hypoxia-ischaemia (Kirkinezos and

Introduction
16
Moraes, 2001), reduce the expression of genes that promote OL lineage maturation, and elevate those
which inhibit maturation (French et al., 2009). Supporting this hypothesis, Reid and colleagues
showed that IUGR in the rat generates reactive oxygen species postnatally, which in turn up-regulates
bone morphogenic protein 4 (Reid et al., 2012), a known inhibitor of OL differentiation. There is
substantial evidence for the susceptibility of the OL lineage to oxidative stress, however OL
progenitors as well as pre-myelinating OLs are more susceptible than mature OLs, as they containing
lower levels of antioxidants (Back et al., 2002). It has been proposed that developmental window in
which the brain contains the highest numbers of immature OLs is the time at which it is most
vulnerable to insults like those occurring as a result of IUGR. This timeframe of vulnerability
translates to < 30 weeks GA in humans (Back et al., 2001), and from P7 to P10 in rats (Craig et al.,
2003).
Additionally in the cerebral cortex of IUGR foetal guinea pigs compared to controls, an abnormal
retention of myelin basic protein (MBP) in the OL cell body, and lack of MBP-IR staining in the OL
processes, has been reported (Tolcos et al., 2011). MBP mRNA is normally translocated from the OL
soma into its distal processes, and these processes ensheath neuronal axons during the myelination
process (Pedraza, 1997), thus this result in the IUGR foetal guinea suggests a delay in the production
and/or trafficking of MBP proteins necessary for axonal myelination. While IUGR may delay the
migration of key myelin proteins, recent studies in guinea pigs and rats have explored the hypothesis
that IUGR delays the maturation of OLs, halting them at the pre-myelinating stage, therefore resulting
in delayed myelination in the brain (Reid et al., 2012, Tolcos et al., 2011, Rideau Batista Novais et
al., 2016), which persists after birth (Olivier et al., 2005). A study by our group using a rat model of
IUGR (bilateral uterine vessel ligation (BUVL) in late gestation; E18) revealed an increased
expression of genes that inhibit OL maturation in the IUGR brain including Axin2, Notch1 and 2,
Jagged1, Hes5 and BMP4, and a decrease in genes that promote OL maturation, such as Sox10 and
Myrf (Azhan, A., PhD thesis, Monash University, 2019). Impaired myelination in IUGR is likely to
occur due, in part, to all of these discussed mechanisms. Another possible mechanism, which is being
explored and is relevant to the current study, is impaired cerebral TH signalling.

Introduction
17
TH is essential for brain development, including for the maturation of the OL lineage as well as for
the process of myelination (Barres et al., 1994). TH signalling will be discussed in greater detail
below (Section 1.7.1), however it is important to note that TH enters cells via intercellular
transporters, with MCT8, alternately known as ‘solute carrier family 16, member 2’ (SLC16A2),
exclusive to transportation of TH (Friesema et al., 2003). Of interest, MCT8 levels are reduced in
IUGR. A post-mortem study found that MCT8 expression was significantly reduced in the cortical
plate of foetuses with severe IUGR compared to non-IUGR foetuses (Chan et al., 2014). Reduced
mRNA levels of MCT8 are also shown in the brain of IUGR rats at P7 (Azhan, A., PhD thesis,
Monash University, 2019). Interestingly in clinical cases of MCT8 mutation, persisting deficits in
myelination are seen in the brain. A post-mortem study examining brain tissue from a foetus, and an
11 year old male with MCT8 mutations, showed significant myelin deficits in the cerebral cortex as
well as a 50% reduction of TH (T3, 3,5,3’-triiodothyronine; and T4, thyroxine) (Lopez-Espindola et
al., 2014). In children with Allan-Hernon-Dudley syndrome (AHDS), characterised by an MCT8
mutation, significant and lasting hypomyelination is also seen in the brain (Verge et al., 2012).
Together these studies highlight the importance of MCT8 and cerebral TH signalling in the process
Figure 1.3 Timeline of oligodendrocyte development from pre-oligodendrocytes to the mature
myelinating phenotype in humans and rats. Pre-oligodendrocytes (A; pink bars) developing into immature
non-myelinating oligodendrocytes (B; blue bars) and then into a mature myelinating phenotype (C; orange
bars). This lineage maturation occurs postnatally in the rat, but commences prior to birth in the human,
continuing into adulthood. Mature oligodendrocytes lay down myelin insulating neuronal axons in the brain.
Figure adapted from Semple et al. 2013 and Jakovcevski et al. 2009.

Introduction
18
of myelination, and suggest that deficits in MCT8 seen in IUGR, along with impaired TH signalling
may underpin the mechanism behind disrupted WM and myelin development.
1.8 Impact of IUGR on thyroid gland function
TH is made by the thyroid gland, and is essential for growth and development. Before the effects of
IUGR on thyroid gland function and circulating TH levels is discussed further, a brief overview of
thyroid gland function, as well as the cellular TH signalling pathway will be provided.
1.8.1 Overview of TH signaling
Anatomically, the thyroid gland is situated between the 5th cervical and 1st thoracic vertebrae, ventral
of the trachea and below the larynx, and it consists of 2 lobes which are connected by an isthmus
(Stathatos, 2006). The thyroid gland produces and releases TH into the circulation. The brain, heart,
lungs, kidneys, liver, intestines and reproductive organs are all reliant on TH signalling for
development and proper function (Peeters et al., 2003, Warner and Mittag, 2012). The thyroid gland
uses iodine, absorbed through the gastrointestinal tract to synthesise THs, with the predominant forms
of TH including 3, 5, 3’, 5’- tetraiodo-L-thyronine, or thyroxine (T4), and triiodothyronine (T3)
(Figure 1.4). A large percentage of THs bind to TH distributor proteins (THDPs) in the plasma
(Schreiber and Richardson, 1997), with known THDPs including albumin, thyroxine-binding
globulin, transthyretin and certain lipoproteins (Prapunpoj et al., 2000, Lans et al., 1994, McLean et
al., 2017). Less than 1% of circulating THs remain unbound and are known as ‘free’ T3 and T4 (FT3,
FT4), and this small fraction is biologically active (Mendel, 1989). T3 is 5 times more biologically
active than T4, due to being bound less tightly to transporter proteins, and as a result is more readily
available for cellular binding and uptake (Schroeder and Privalsky, 2014).
THs enter cells using various transmembrane transporters (Figure 1.4), including anion transporting
polypeptides, L-type amino acid transporters and monocarboxylate transporters. Of particular
importance to this thesis, MCT8 is the only transporter to exclusively transport THs in the brain (Di
Cosmo et al., 2009). Once inside the cell, T4 undergoes a process called deiodination, catalysed by
iodothyronine deiodinases (Type-1; Dio1, Type-2; Dio2, Type-3; Dio 3) (Gereben et al., 2008) to
remove iodine atoms from the outer ring of T4 (Visser et al., 1988), producing active T3. T3 can then
enter the nucleus and bind to nuclear TRα and β (Evans, 1988) and regulate the expression of specific
genes in that cell. TH signalling in the body relies on a negative feedback mechanism to maintain
homeostasis. For example, if circulating TH levels in the blood become too low, the hypothalamus
secretes thyrotropin-releasing hormone (TRH) which stimulates the pituitary gland to secrete thyroid-

Introduction
19
stimulating hormone (TSH), signalling the thyroid gland to release more T3 and T4 into the blood
stream, thus normalising circulating TH levels. Conversely, if circulating TH levels are too high, the
hypothalamus down-regulates its secretion of TRH, ultimately leading to the thyroid gland releasing
less T3 and T4 into circulation (Maria Izabel Chiamolera, 2009). In IUGR foetuses, the literature
surrounding circulating TH levels is inconclusive, with studies finding reductions in T4 and FT4
levels yet no difference in T3 or FT3 compared to non-IUGR foetuses (Thorpe-Beeston et al., 1991,
Soothill et al., 1992). Others have found that both T3 and T4 are reduced in IUGR foetuses compared
to non-IUGR foetuses (Kilby et al., 1998), and that in IUGR infants, plasma T3 and T4 levels are
reduced at birth (Bongers-Schokking and Schopman, 1984, Jacobsen and Hummer, 1979). T3 levels
however, begin to normalise from 1 week of postnatal age until 8 months of age, and T4 begins to
normalise from 2 months of age (Jacobsen and Hummer, 1979). Animal studies examining TH levels
in offspring following IUGR are rare, however a study of growth restricted lambs (induced via
carunclectomy prior to pregnancy conception) reported decreased plasma T4, and increased T3 levels
postnatally (De Blasio et al., 2006). These conflicting results make it difficult to determine the TH
profile of IUGR infants, thus further studies examining postnatal TH levels are required, especially
considering the essential role of TH in brain development.

Introduction
20
1.9 Role of TH in brain development
In the brain, TH is essential for driving neurogenesis, synaptogenesis, and cell migration (Younes-
Rapozo et al., 2006, Barres et al., 1994, Berbel et al., 1994, Berbel et al., 2010, Skeaff, 2011, Zoeller
and Rovet, 2004), while acting as a fundamental driver of OL maturation and differentiation as well
as the expression of myelin specific genes (Reid et al., 2012). The foetus relies on maternal TH levels
until approximately 20 weeks GA, after which time the foetus’s thyroid gland begins releasing its
own hormones, causing foetal TH levels to rise during late gestation, peaking around the time of birth
(Figure 1.5 A). During this time the brain undergoes major developmental changes, including
development of the neocortex and cerebellum, glial cell proliferation, synaptogenesis, axonal and
dendrite sprouting and neuronal migration and proliferation (Figure 1.5 B). For the purposes of this
thesis, The role of TH in the development of myelin within the brain will be a focus. In rats, a lack of
TH (hypothyroidism) results in decreased myelination in the foetal brain (Calvo et al., 1990),
persisting during the 1st postnatal month (Rodriguez-Pena et al., 1993), while an excess of TH
(hyperthyroidism) results in a significant increase in myelination at P13 (Walters and Morell, 1981).
T
Thyroid gland
T4
Circulation
T4
T4
T4
T4
Lat1
MCT10
OATP1C1
MCT8
T3
Dio1 or Dio2
T2 rT3
Dio3 Dio3
T4
Target cell
TRE
RXR
Myelin RNA
Myelin Protein
T3
T3
Dio1 or Dio2
Nucleus
TR α/β
Figure 1.4 Thyroid hormone cellular signalling pathway. This schematic uses the example of thyroid
hormone (TH; T3 and T4) entering an oligodendrocyte to promote the transcription of myelin protein. Thyroid
hormone is released from the thyroid gland and circulates around the body via the blood. It contacts and enters
cells using transporters, with MCT8 being exclusive to TH transport. Once inside the target cell T4 is
deiodinated into an active T3 form by various deiodinase enzymes (Dio1 & Dio2), and enters the nucleus,
binding to TH receptors alpha and beta (TRα, TRβ) where it promotes the expression of mRNA and proteins.
Dio1 = deiodinase 1, Dio2 = deiodinase 2, Lat1 = large amino acid transporter 1 MCT10 = monocarboxylate
transporter 10, MCT8 = monocarboxylate transporter 8, OATP1C1 = Organic anion transporting polypeptide,
RNA = Ribonucleic acid, RXR = retinoid X receptor, T3 = triiodothyronine, T4 = thyroxine, TR = thyroid
hormone receptor. Original figure.

Introduction
21
Given that myelin is essential for the efficient and correct propagation of action potentials in the brain,
it is possible that the poor cognitive outcomes associated with IUGR may be due impaired
myelination caused by deficits in cerebral TH signalling. Indeed neurodevelopmental impairment
occurs in disorders of hypothyroidism, including when TH is deficient in the maternal circulation
during gestation, and in congenital hypothyroidism which typically occurs as a result of dysgenesis,
or malfunction of foetus’s thyroid gland. Neurodevelopmental impairments resulting in reduced
intelligence quotient scores (IQ) and speech delays and deficits have been implicated in both types of
hypothyroidism (Selva et al., 2005, Haddow et al., 1999). Furthermore autism (Román et al., 2013)
and attention deficit hyperactivity disorder (ADHD) (Vermiglio et al., 2004), two disorders with
known neurodevelopmental impairment, are associated with TH deprivation in utero. Disorders of
TH signalling such as congenital hypothyroidism highlight the important link between TH and correct
brain development.

Introduction
22
Several categories of hypothyroidism exist, including congenital hypothyroidism (CH) which is
characterised by being present from the time of birth (LaFranchi, 1999), autoimmune hypothyroidism
such as Hashimoto’s thyroiditis in which inflammation (lymphocytic thyroiditis) renders the thyroid
gland underactive (Lorini et al., 2003), hypothyroidism arising due to iodine deficiency (Patrick,
2008), pregnancy (Kothari and Girling, 2008), or due to medical intervention including surgery or
chemotherapy (Bettendorf et al., 1997, Beltran et al., 2006, Desai et al., 2006). This section will focus
on CH, which is characterised by deficient circulating TH levels at the time of birth, and is of
particular relevance to this thesis, as it causes neurodeficits which are similar to those seen in IUGR,
including hypomyelination.
Figure 1.5 Timing of human and rat brain development in relation to thyroid hormone signalling. (A)
Thyroid gland development and TH gradients throughout gestation and early childhood. (B) Key
developmental time points for brain development. Development of the thyroid gland occurs between 3 and
13 weeks GA in the human, and foetal TH secretion peaks at birth in the human, and postnatally in the rat.
(B) Brain development, including myelination in humans has largely commenced prior to birth and
continues into childhood and adolescence. In the rat, myelination begins after birth, as does glial cell
proliferation, synapse formation and axonal spouting. Yellow bar = time frame for term birth in rats. Blue
dotted lines indicate when process is active, and solid blue bars indicate the dominant window of time in
which the process occurs. D2 = deiodinase 2, TH = thyroid hormone, TSH = thyroid stimulating hormone,
T3 = triiodothyronine. Image adapted from Bernal et al. 2007; Lemkine et al. 2005; Remaud et al. 2017.

Introduction
23
CH is defined by partial or full loss of thyroid gland function during foetal development, and is
divided into primary, secondary and peripheral etiologies. Primary CH occurs due to either dysgenesis
of the thyroid gland (~85% of cases) (Rastogi and LaFranchi, 2010), or direct impairment in TH
biosynthesis (~10 to 15% of cases) (Rastogi and LaFranchi, 2010). Secondary, or central
hypothyroidism is associated with pituitary hormone dysfunction leading to TSH deficiency and
decreased circulating T3 and T4 levels (Rastogi and LaFranchi, 2010), while peripheral CH is
identified by impaired TH transport, metabolism or action (Misiunas et al., 1995). CH can be transient
or permanent, with permanent CH persisting throughout life and requiring ongoing treatment, while
transient CH is discovered at birth but can be alleviated with treatment in the first few years of life
(Razavi and Mohammadi, 2016).
Various clinical studies have demonstrated neurodevelopmental impairments in children in cases of
both transient and permanent CH, with these impairments including deficits in cognitive
development, language and speech (Gottschalk et al., 1994), visuospatial processing (Leneman et al.,
2001), attention (Kooistra et al., 1996), motor skills (Cooper et al., 2019, Fuggle et al., 1991), and
auditory function (Peters et al., 2018). A number of trials have reported IQ scores as a measurement
of the impact of CH on neurodevelopment, and have correlated these IQ outcomes with the timing at
which TH replacement therapy commenced (Hindmarsh, 2002, Bongers-Schokking et al., 2000,
Selva et al., 2005, Selva et al., 2002, LaFranchi, 1999, Dubuis et al., 1996, Rovet and Ehrlich, 1995,
Simoneau-Roy et al., 2004. Children with either transient or permanent CH have IQ scores that are
on average 6 points below their euthyroid counterparts (Najmi et al., 2013, Ordooei et al., 2014,
Derksen-Lubsen and Verkerk, 1996). Infants with CH are typically treated with Levothyroxine (L-
thyroxine), a synthetic form of TH which behaves identically to endemic T4. Countless studies show
early intervention to be essential in CH, with infants who commence TH replacement therapy during
the neonatal period displaying superior neurodevelopmental outcomes when assessed during
childhood compared to those treated later on (Hindmarsh, 2002, Bongers-Schokking et al., 2000,
Selva et al., 2005, Selva et al., 2002, LaFranchi, 1999, Dubuis et al., 1996, Rovet and Ehrlich, 1995,
Simoneau-Roy et al., 2004). Animal studies also show the advantage of early intervention. In
hypothyroid rat pups (induced via maternal consumption of Methimazole; 7.5µg/day in drinking
water; E16 – P25) treated with T4 replacement therapy (0.02µg/g body weight; from P1 – P21),
improvements in behavioural testing scores such as perseverance, memory and learning were reported
only following the first 8 days of treatment (from P1-P7), with no improvements beyond this time
(MacNabb et al., 2000, O'Hare et al., 2015, Reid et al., 2007).

Introduction
24
In the brain, CH impairs myelination in neonates, but this can be reversed with TH replacement (T4)
therapy (Jagannathan et al., 1998), and delayed myelination is evident at 1 year of age using MRI
(Ari Yuca 2014), while altered microstructure of WM is reported in childhood, shown by decreased
fractional anisotropy in the cerebellum, thalamus and temporal lobe using diffusion-MRI (Cooper
2019). In children (6 to 15 years of age), changes in metabolites which are indicative of myelination
arrest are observed using MRI (Gupta et al., 1995); these outcomes were also reversed using T4
replacement therapy during childhood (Gupta et al., 1995). Animal studies similarly show impaired
neurodevelopment as a result of CH, including impaired myelination. Post-mortem analysis in dogs
with CH, revealed myelin deficits in the corpus callosum and pons (Pettigrew et al., 2007), while in
rats, CH reduced myelination in the anterior commissure region of the brain (Lucia et al., 2018), and
decreased mRNA levels of MBP and PLP (Rodriguez-Pena et al., 1993). Reduced myelin deposition
is correlated with impaired axonal maturation in the brains of CH mice (Noguchi and Sugisaki, 1984)
and dogs (Pettigrew et al., 2007), suggesting that the hypomyelination seen in CH is a consequence
of impaired axonal formation. Collectively, these studies highlight the fundamental importance of TH
in brain development, the implications of abnormally decreased TH levels for myelination in the
brain, and the importance of treating these abnormal levels as early as possible.
1.10 Use of thyroid hormone in neonatal brain injury
Varied results have been reported in human and animal studies examining the use of TH, and TH
analogues in the treatment of neonatal brain injury. In a study of newborns with congenital
hypothyroidism treatment with T4 was able to normalise myelin structure within the cerebellum and
cortical WM, reversing abnormal lipid peaks when assessed using magnetic resonance spectroscopy
(Jagannathan et al., 1998). In contrast, a study examining the neurodevelopmental benefits of T4
treatment in very preterm infants (born 26 to 28 weeks GA), found no benefit for the impaired
neurodevelopmental outcomes associated with very preterm birth including reduced IQ and
developmental delay (Chowdhry et al., 1984, Lucas et al., 1996, Meijer et al., 1992, van Wassenaer
et al., 1997, Vanhole et al., 1997). Animal models show benefits of TH treatment for neonatal brain
injury, with no adverse effects. In a rabbit model of intraventricular haemorrhage, treatment with T4
(20µg/day) from 24 hours to 10 days postnatally restored myelination within the brain (Vose et al.,
2013). Similarly, in rat (Nathaniel et al., 1988) and mouse (Noguchi et al., 1985) models of
hypothyroidism, treatment with T4 (2.5µg/day commencing P14 or P20 until P42)(Nathaniel et al.,
1988) or 0.1µg T4 daily injections from birth until P20 (Noguchi et al., 1985) improved brain weight
and a reversed of cerebral hypomyelination. Improvements in the mouse model of hypothyroidism
were only seen when T4 was given within the first 20 postnatal days (Noguchi et al., 1985), with P20
in rodents equivalent to approximately 1 year of age in humans (Porterfield and Hendrich, 1993). The

Introduction
25
results of these studies indicate that TH replacement therapy may be beneficial for restoring normal
levels of myelination in the brain when given to hypothyroid subjects, with emphasis placed on
commencing treatment in the neonatal period immediately after birth. When brain injury is induced
by inflammation however, TH replacement therapy may not be effective. In a neonatal mouse model
of systemic inflammation (induced by IL-1β), treatment with T4 (20µg/kg/day from P1 to P5) was
unable to reverse the block in OL maturation within the brain caused by inflammation when assessed
at P1 and P30 (Schang et al., 2014).
TH analogues, including levothyroxine (LT3), 3,3’,5-triiodothyroacetic acid (Triac), 3,3’,5,5’-
tetraiodothyroacetic acid (Tetrac) and 3,5-diiodothyropropionic acid (DITPA) have also shown
varied potential as therapies for neonatal brain injury; the use of DITPA will be discussed in greater
detail below (Section 1.10). A multicentre clinical trial of extremely preterm infants given LT4
(8µg/kg birth weight/day; within 5 days of birth until 32 weeks corrected GA), measured the
therapeutic benefits of LT3 therapy in reducing neurodevelopmental disability associated with
hypothyroidism in preterm birth, but found no improvement in disability outcomes (Ng et al., 2014).
In animal models, treatment with TH analogues Triac and Tetrac have varied results. In mice deficient
in the exclusive TH transporter MCT8, Tetrac (400ng/g body weight; daily; first 2 postnatal weeks)
promoted TH dependent gene expression in the brain (Horn et al., 2013). Triac (400ng/g body weight;
daily injection) similarly prevented neuronal damage in the brains of newborn mice who were
hypothyroid (Kersseboom et al., 2014). In contrast, when administered directly into the brain of
MCT8 deficient mice, Triac failed to replace TH in mediating the actions of target genes within the
brain (Barez-Lopez et al., 2019).
TH analogue therapies have also been explored in the treatment of AHDS. This disorder is
characterised by an MCT8 mutation, thought to delay TH transport into cells in the brain, causing
delayed myelination with intellectual and physical disability (Schwartz and Stevenson, 2007).
Treatment of 4 children with AHDS on compassionate grounds with DITPA (1.8mg initially; 30mg/d
[2.1 – 2.4 mg/kg/day] given in three divided doses, orally 26 – 40 months), which enters cells
irrespective of MCT8, improved myelination in the brains of 2 out of 4 children when assessed using
MRI (Verge et al., 2012). Treatment with conventional TH in IUGR is likely to be ineffective, as
expression of the exclusive TH transporter MCT8 is reduced in IUGR (Azhan, 2019, Chan et al.,
2014), therefore alternate therapies including TH analogues such as DITPA, which do not rely on
MCT8 for cellular uptake, should be investigated.

Introduction
26
1.11 DITPA as a therapy in adults and children
DITPA is a synthetic TH analogue which has similar biological properties to endogenous TH. DITPA
acts as a TR agonist, binding to both and isoforms in the cell nucleus (See Figure 1.4 for TH
signalling) (Pennock et al., 1992, Raparti et al., 2013), and a similar structure to T3 but lacking one
iodine molecule and an NH2 group (Figure 1.6). As previously mentioned, DITPA has been
investigated as a therapy for the hypermetabolism and weight loss associated with elevated circulating
TH levels in AHDS (Verge et al., 2012), as it does not require MCT8 to be transported into the cell
(Di Cosmo et al., 2009). There is also evidence that DITPA can cross the blood-brain barrier, as well
as the placenta (Ferrara et al., 2015). In a case report of 4 children with AHDS, DITPA treatment
(1.8mg initially; 30mg/d [2.1 – 2.4 mg/kg/day] given in three divided doses, orally 26 – 40 months)
was well tolerated without thyrotoxic effects, and normalised thyroid function and heart rate as well
as improved weight gain (Verge et al., 2012). With human (Chan et al., 2014) and rodent (Azhan, A.,
PhD thesis, Monash University, 2019) data to indicate that MCT8 is reduced in the IUGR brain, the
study by Verge and colleagues (Verge et al., 2012) provides reason to think DITPA would be
beneficial when given in cases of IUGR also. Clinical trials in adults with cardiac failure similarly
found that DITPA treatment did not cause hypothyroidism or thyrotoxicity (Goldman et al., 2009,
Ladenson et al., 2010), although it did cause gastrointestinal upset, likely due to the large dose given
(90 to 360 mg/day). In MCT8 knockout mice, DITPA (0.3mg/100g body weight/day) ameliorated a
thyrotoxic liver state and normalised plasma T3 to control levels (Di Cosmo et al., 2009). These
studies support the safety and benefits of DITPA, however little is known of the benefits of DITPA
therapy when given to IUGR infants. Our group has previously investigated the efficacy of DITPA
treatment (0.5mg/100g i.p. daily), given to IUGR rat pups from P1 to P6, and by P7 found it was well
tolerated, did not cause adverse effects on body weight, body composition or brain weight (Azhan,
A., PhD thesis, Monash University, 2019).

Introduction
27
1.11.1 Physiological impacts of DITPA treatment.
The clinical safety profile of DITPA has been reported in children with mutations in the MCT8 gene
(Verge et al., 2012), adults with cardiovascular disease (Goldman et al., 2009), and in MCT8
knockout mice (Di Cosmo et al., 2009). The results of these important human and animal studies are
listed in Table 1.1 below, outlining DITPA’s impact on various parameters such as growth, body
weight, body composition, thyroid function, liver function and cholesterol levels. The broad
consensus from these studies is that DITPA treatment did not cause harm, except for reducing body
weight in adults with cardiac failure and increasing markers of bone turnover (Goldman et al., 2009,
Ladenson et al., 2010) when given as a very large dose (90 – 360mg/d; orally) over a relatively short
duration of time (8 or 24 weeks). In children with AHDS (x-linked MCT8 mutation; gene locus
SLC16A2) given a smaller dose (30mg/d; orally) for a longer duration of time (26 – 40 months),
DITPA improved weight gain and normalised circulating TH levels (Verge et al., 2012). In MCT8
knockout mice, DITPA once again normalised TH levels and ameliorated a thyrotoxic liver state (Di
Cosmo et al., 2009). When DITPA was administered to IUGR rat pups (0.5mg/100g/day i.p injection
Figure 1.6 Chemical structure of thyroid hormones and analogues: (A) Triiodothyronine; T3, (B)
thyroxine; T4 and (C) 3, 5-diiodothyropropionic acid (DITPA). DITPA is structurally identical to T3 and T4
albeit for the lack of an amino radical group (NH2; yellow circle shows where absent), and differs from T3 by
the absence of an iodine atom (blue circle), and from T4 by two iodine atoms (blue and green circles). I =
iodine, NH2 = amino radical. Figure adapted from Davis et al. 2009.

Introduction
28
from P1 to P6), brain-to-body-weight ratio was improved compared to pups given saline, which
indicated improved brain growth, however DITPA decreased lean tissue mass, fat mass and bone
mineral density in IUGR pups at P7 (Azhan, A., PhD thesis, Monash University, 2019), suggestive
of increased bone turnover like that seen in humans (Table 1.1).

Introduction
29
Reference Patients/animal
model
DITPA regimen –dose,
route and duration
Type of
control
Impact of DITPA
on growth & body
weight
Impact of
DITPA on body
composition
Impact of DITPA on
thyroid and liver
function
Goldman et al.
2009
86 adults with
congestive heart
failure (> 18yrs).
Twice daily, oral dose
increased in 90mg/d
increments every 2 weeks
to maximum 360mg/d for
24 weeks.
Stage II multicentre
randomised, double-
blinded trial.
Placebo
capsules. • Decreased body
weight (-11lb).
Not assessed • Decreased plasma
cholesterol (- 20 %.)
• TSH was supressed.
Di Cosmo et al.
2009
Adult male mice
with MCT8 gene
mutation (MCT8-
knockout).
03, 0.6 or 1.0mg/100g body
weight/day, i.p. injection for
4 days.
Wild type
male mice
(no
MCT8-
knockout)
• Not assessed Not assessed • Higher dose
normalised plasma
TSH.
• Ameliorated
thyrotoxic liver
state.
Ladenson et al.
2010
86 adults with
chronic heart
failure (55 to 77
yrs).
Escalating oral dose,
90mg/d to 180mg/d,
270mg/d, and 360 mg/d
over 8 weeks.
• Pilot prospective,
randomized controlled
study.
Placebo
capsules. • Decreased body
weight.
Indication of
increased bone
turnover.
• Lowered plasma
TSH levels.
• Lowered plasma T3
& T4.
• No hypothyroidism.
• No thyrotoxicosis.
• Decreased plasma
cholesterol.

Introduction
30
Table 1.1 Important DITPA studies in humans and animals. (Table continued on next page).
d = day, g = grams, i.p. = intraperitoneal, IUGR = intrauterine growth restriction, kg = kilograms, lb. = pounds, MCT8 = monocarboxylate transporter – 8, mg
= milligrams, P = postnatal day, T3 = triiodothyronine, T4 = thyroxine, TSH = thyroid stimulating hormone, yrs = years of age.
Verge et al. 2012 4 children with
MCT8 mutation,
treatment
commencing 8.5
to 25 months of
age.
1.8mg initially; 30mg/d
(2.1 – 2.4 mg/kg/day)
given in three divided
doses.
Oral for 26 to 40 months.
• DITPA given on
compassionate grounds.
None. • Improved weight
gain in 2/4
children.
Not assessed • Normalised TH
levels (normalised
elevated T3 & TSH,
increased T4).
Ferrara et al. 2015 Adult male mice
with MCT8 gene
mutation (MCT8-
knockout).
0.3 mg/100g body
weight/day, i.p. injection,
for 10 days, commencing
P7.
Wild type
male mice
(no
MCT8-
knockout)
Not assessed Not assessed • Normalised plasma
TSH and T3.
• Ameliorated
hypermetabolism.
Azhan 2019 PhD
thesis, Monash
University, 2019.
Newborn IUGR
rats (IUGR
induced by
bilateral uterine
vessel ligation in
late gestation).
0.5mg/100g/day i.p injection
from P1 to P6 (i.e. 7 days).
Saline i.p.
injection.
In IUGR pups at P7:
• Increased brain-to-
body-weight ratio.
In IUGR pups at
P7:
• Decreased lean
tissue mass.
• Decreased fat
mass.
• Decrease in
bone mineral
density
Not assessed

Introduction
31
1.11.2 Impact of DITPA on the CNS and developing brain
The effects of DITPA on the developing brain are largely unknown, as are the mechanisms by which
DITPA enters cells in the brain. It is known however, that DITPA (1mg/100g/day) readily enters
brain cells in MCT8 knockout mice, and subsequently corrects cerebral hypothyroidism (Di Cosmo
et al., 2009). A previous study by our group found that DITPA (0.5mg/100g; i.p.) administered daily
from P1 to P6 in IUGR rat pups, promoted myelin recovery, detectable by P7 in the external capsule
(Azhan, A., PhD thesis, Monash University, 2019). In cases where MCT8 transporters are deficient,
such as in IUGR, the ability of endogenous TH to enter cells such as OLs and initiate the transcription
of myelin specific genes is impaired. This contributes to the delay in OL development and
myelination seen. DITPA bypasses MCT8 and may act to replace endogenous TH, thus promoting
OL development and myelination, although the exact mechanisms by which DITPA acts on genes
associated with myelination is unknown. Although promising, this data only provides evidence of the
impact of short-term DITPA treatment on the cerebrum, and although benefits were seen in the
external capsule, a longer dosing regimen may further benefit the brain. There is currently no
treatment to prevent IUGR. If detected in utero, the only intervention is to deliver the baby preterm
to remove it from the compromised intrauterine environment dominated by the insufficient placenta;
this typically occurs any time between 24 and 40 weeks GA. Once removed from the unfavourable
intrauterine environment, DITPA therapy could be given to an IUGR baby soon after birth; however
the dose, duration and route still need to be determined. Before such clinical studies are undertaken,
it is first important to test the preclinical efficacy and safety of DITPA in a preclinical model of IUGR.
1.12 Scope of this thesis
It is proposed that the synthetic TH analogue DITPA, which does not require MCT8 to enter cells,
can be used to overcome the deficits caused by a loss of MCT8 expression in the IUGR brain and
restore TH uptake, thereby normalising myelination and OL development. Taking into account the
findings of our group’s previous study whereby MCT8 levels normalised by P14 in the IUGR rat,
this project set out to investigate the benefits of DITPA administration from P1 to P13 a time in rat
brain development equivalent to that of a human baby at 23 to 40 weeks GA (Semple et al., 2013),
and reflective of what is likely to occur in the clinical setting with an IUGR baby delivered preterm
and given DITPA until term equivalent age. If serious, IUGR is detected during late pregnancy, and
the baby is often delivered preterm in order to remove it from the insufficient intrauterine
environment. The longer-term DITPA administration used in this study (P1-P13) importantly
addresses the clinical scenario of an IUGR baby being delivered preterm, and then being administered
DITPA until term equivalent age. This model of IUGR was ideal, as OL maturation and myelination
occurs postnatally in the rat from P1 to 14, and this timeframe is equivalent to the development of

Introduction
32
myelin in the human brain at 23 to 40 weeks of GA (Craig et al., 2003, Semple et al., 2013). In the
rat, the development of myelin in the brain at P2 to P5 is similar to the human brain at 23 to 32 weeks
GA (Segovia et al., 2008, Wu et al., 2013), and at P7 cerebral myelination is histologically similar to
WM in the human brain at 32 to 34 weeks GA.
The overall aim of this thesis was to determine the potential of DITPA administration
(0.5mg/100g/day i.p. from P1 to P13) to restore myelination in the IUGR brain and promote OL
development, without causing brain injury or neuroinflammation, or any negative off-target effects
on the body. Below, the aims and objectives of each of the studies, which make up the experimental
Chapters in this thesis will be outlined.
Chapter 3: In Chapter 3, the impact of DITPA administration on the development of the cerebrum
was investigated, focusing on the cortical layer VI, corpus callosum, external capsule, hippocampus
and fimbria as these regions are known to be vulnerable to injury in IUGR (Padilla et al., 2011, Padilla
et al., 2014b, Egana-Ugrinovic et al., 2014, Lodygensky et al., 2008). Assessment of myelination has
been a focus, as this is one of the main aspects of brain development that is affected in IUGR the
human (Chase et al., 1972, Eikenes et al., 2012a, Esteban et al., 2010, Padilla et al., 2014b) and rat
(Azhan, 2019, Olivier et al., 2005, Reid et al., 2012). This study aimed to determine whether longer-
term DITPA treatment in IUGR rat pups (from P1 to 13) (i) restored myelination, (ii) promoted OL
maturation, and (ii) did not cause injury or inflammation, in the cerebrum. It was hypothesised that
DITPA would improve myelination and OL development in the cerebrum of IUGR pups, without
causing injury or inflammation. The results of this study suggest that DITPA treatment in IUGR rat
pups, promotes immunoreactivity (IR) for MBP in cortical layer VI and the fimbria, and Olig2-IR
OL density in the corpus callosum when assessed at P14, but reduces the length of MBP-IR
projections in the cortex, and may impair expression of myelin protein PLP-IR in the corpus callosum
and external capsule. DITPA does not cause injury or inflammation in any of the cerebral structures
investigated, however leads to unfavourable outcomes when given to control pups, including
decreased PLP-IR in the corpus callosum and external capsule, and decreased density of Olig2- and
APC-IR OLs in cortical layer VI and fimbria. With indication that this duration of DITPA treatment
was beneficial to myelination in the IUGR brain, and with unwanted effects of DITPA in controls, it
was essential to also investigate DITPA’s potential therapeutic potential in the cerebellum which is
another important region of the brain with known vulnerability to prenatal insults.
Chapter 4: In this Chapter the impact of the above-mentioned regimen of DITPA treatment in the
cerebellum of IUGR rat pups was explored. This study aimed to determine whether DITPA

Introduction
33
administration (i) impacted cerebellar morphology (ii) promoted OL maturation to restore
myelination, and (iii) did not cause injury or inflammation in the IUGR cerebellum when assessed at
P14. It was hypothesised that DITPA would not impact cerebellar morphology, and would improve
myelination in the cerebellum without causing injury or inflammation. The results of this study
indicate that DITPA administration does not promote myelin recovery (via increased MBP or PLP-
IR), or Olig2-IR OL density in the cerebellum of IUGR pups at P14, and has no negative impact on
cerebellar morphology in IUGR, but may affect Purkinje cell development and cause a slight
inflammatory response in the late developing lobules of the cerebellum. When given to control
animals, the data shows DITPA to reduce the density of BG in the cerebellar ML. These data
collectively support that DITPA administration in IUGR may be more beneficial to the cerebrum than
in the cerebellum. Regardless of the benefit of DITPA, it should not cause unwanted effects on the
individual. Therefore the next step was to determine whether DITPA administration resulted in any
off-target effects on neonatal growth and wellbeing.
Chapter 5: In this Chapter, the effect of DITPA administration on neonatal growth and wellbeing
in IUGR rat pups at P14 was examined. The weight of pups at P1, P7 and P14 was assessed as well
as liver and kidney weights, body morphometry (head and hip circumference, and crown-to-rump
length), body composition measures (including bone density and mineral content, lean tissue mass,
fat mass), thyroid and liver function and cholesterol levels at P14. This study found that DITPA
administration, importantly has no negative off-target effects on neonatal growth, brain or organ
weights, body composition or organ function following IUGR, despite reducing FT4 levels and
showing hepatic thyromimetic activity. However, caution should be taken when administering
DITPA to control pups, as it appears to cause adverse effects when given in a normally functioning
system.
The work presented in this thesis collectively highlights the potential for DITPA to improve
myelination in the IUGR brain, without causing brain injury or adverse off-target physiological
effects, thereby providing valuable preclinical data to inform a clinical trial. However further studies
are required before DITPA can be considered as a therapy in IUGR.

2 General Methodology
34
2 General Methodology
2.1 Introduction
All of the experiments outlined in this thesis have used a well-established rat model of IUGR. In this
model, first established by Wigglesworth (Wigglesworth, 1964, Wigglesworth, 1974), IUGR is
induced by bilateral uterine vessel ligation (BUVL), which results in placental insufficiency,
mimicking one clinical scenario of IUGR. This model has been used extensively to study brain
development (Lin et al., 1998, Morand et al., 1981, Tashima et al., 2001, Lane et al., 2001a, Baud et
al., 2004, Olivier et al., 2007, Liu et al., 2011, Caprau et al., 2012, Reid et al., 2012, Ke et al., 2014,
McDougall et al., 2017b), injury to organs, as well as long-term metabolic and cardiovascular
outcomes (Gluckman et al., 1996, Jansson and Lambert, 1999, Laker et al., 2012, Ogata et al., 1985,
Peterside et al., 2003, Thompson et al., 2011).
There are a number of reasons this model of IUGR was chosen for our study. Importantly, this model
had been used in our previous short-term DITPA study, in which DITPA was administered from P1
to P6, making it possible to compare and contrast the findings of the present study (i.e. P1 to P13
DITPA administration), with those previously determined by our group. In addition, key time-points
of brain development and in particular myelination and OL development have been well characterised
in the rat, including the Wistar strain (Craig et al., 2003). At the time of BUVL in our model of IUGR
(E18), preOLs have already begun to colonise the brain (Richardson et al., 2006). OL maturation and
myelination occurs mostly after birth in the rat from P1 to 14, and this timeframe is equivalent to the
development of myelin in the human brain at 23 to 40 weeks of GA (Craig et al., 2003, Semple et al.,
2013). In the rat, the development of myelin in the brain at P2 to P5 is similar to the human brain at
23 to 32 weeks GA (Segovia et al., 2008, Wu et al., 2013), and at P7 cerebral myelination is
histologically similar to WM in the human brain at 32 to 34 weeks GA (term = 40 weeks) (Vannucci
and Vannucci, 1997). This model also mimics the clinical effects of IUGR, including reduced body
(Lane et al., 2001b, Olivier et al., 2005, Price et al., 1992, Ogata et al., 1985, Sadiq et al., 1999) and
brain (Sadiq et al., 1999, Ogata et al., 1985, Tashima et al., 2001) weight.
In the brain, TH is essential for OL development, as well as the maturation of the OL lineage from
pre-myelinating OLs to the mature myelinating phenotype (Barres et al., 1994, Rodriguez-Pena,
1999, Billon et al., 2001). Previously our group and others have found that IUGR disturbs the

2 General Methodology
35
development of a TH transporter protein MCT8, critical for the transport of TH into OLs (Friesema
et al., 2003). In rats, hypothyroidism during brain development can be extremely detrimental to WM
development (Ibarrola and Rodriguez-Pena, 1997, Schoonover et al., 2004, Rodriguez-Pena et al.,
1993). We propose that the synthetic TH analogue, DITPA, which does not require MCT8 to enter
cells, given during a clinically relevant time-frame of WM development can be used to overcome the
myelination deficits caused by the loss of MCT8, and normalise TH transport. The rat IUGR model
allows us to administer DITPA during a relevant window of brain development (P1 to 13 rat = 23 to
40 weeks GA human) (Semple et al., 2013).
2.2 Ethics clearance and animal welfare
Experimental procedures were approved by the Animal Ethics Committee of RMIT University (AEC
project 1702; Appendix 7). All animal handling, use and care follows the National Health and Medical
Research Council of Australia (NHMRC) Code of Practice for the Care and Use of Animals for
Scientific Purposes.
2.3 Animals
48 plug-mated pregnant female Wistar rats (ArcCrl:WI, Wistar outbred) purchased from the Animal
Resource Centre (Perth, Western Australia) at E15 (term = 22) were housed in the RMIT University
Animal Facility (Bundoora) for four days prior to experimentation. This allowed adequate time for
the animals to adapt to the new environment. The pregnant rats were kept in individual cages prior to
surgery, with each rat given unlimited access to food and water. The rats were maintained at a room
temperature of 22C, with a 12-hour light/dark cycle.
2.4 Surgical procedure
2.4.1 Pre-operative preparation
Paracetamol (Children’s Panadol, 2mg/mL in 100mL drinking water; Panadol, Australia) was given
to the rats 24 hours prior to surgery. At E18, rats were randomly allocated to a sham (offspring termed
control) or uteroplacental insufficiency (offspring termed IUGR).
2.4.2 Surgery
Aseptic surgery was conducted at E18 using established techniques. The experimental groups
underwent BUVL surgery (Figure 2.1 A) (Moritz et al., 2009, O'Dowd et al., 2008, Wlodek et al.,
2005, Mazzuca et al., 2010). The control group underwent a sham surgery without the ligation. All

2 General Methodology
36
instruments, gauze, 0.9% saline and sutures (Vicryl 4-0, Ethicon, USA) were sterilized using an
autoclave. Surgery was performed under aseptic conditions. Anaesthesia was induced using 4%
isoflurane (Isoflo, Abbott, NSW, Australia) in oxygen delivered by nose cone. Sufficient depth of
anaesthesia and the level of unconsciousness were confirmed by the absence of rear foot and eye
reflexes. The dam was then placed in the supine position and administered a maintenance dose of
anaesthetic via a nose cone (2-3% isoflurane in O2) to allow adequate and regular respiration of the
rat. The rat’s lower abdomen was shaved, and thoroughly cleaned with a series of antiseptic solutions
(Chlorohexidene: 0.5% in 70% ethanol, Cenvet, Australia; Betadine: (Cenvet), 70% ethanol). A
sterile drape was placed over the rat, exposing the abdomen, and analgesia was administered
subcutaneously (meloxicam, 5mg/mL, Ilium, USA). Bupivacaine (0.125%, max dose 1-2mg/kg,
Aspen Pharmacare, Australia) was administered at the incision site prior to cutting the skin to provide
local anaesthesia (and pre-emptive analgesia) at the surgical site for 4 to 6 hours. A 2cm midline
abdominal incision was made using sharp end surgical scissors and the cervical end of the uterus
containing foetuses exposed. Sterile gauze soaked in sterile saline was placed on either side of the
incision and the exposed uterus placed carefully on top of this to keep it moist. Both the uterine artery
and veins were ligated using 4-0 braided siliconised silk (Dynek Pty Ltd, Australia) (Figure 2.1
A).The exposed uterus was moistened with sterile saline before being placed back into the body
cavity. Control animals underwent sham surgery using the same technique however without the
uterine vessel ligation. The muscle layer was then sutured using running locked sutures and the
external layer of skin sutured using horizontal mattress sutures (4-0 braided siliconised silk, Dynek
Pty Ltd, Australia). Duration of surgery was 20 to 30 mins. This surgery provides ~30% reduction in
birth weight of offspring (Wigglesworth, 1964).
Figure 2.1 Exposed rat uterus and uterine vessels during bilateral uterine artery ligation (BUVL)
surgery (A). During surgery the uterine horns are exposed, and the cervical end of the uterine vessels are
ligated (sites of ligation marked with yellow crosses), in both the left and right uterine horns. The ligation
restricts ~ 60% of blood flow to the foetuses; the remaining 40% is supplied by the undisturbed ovarian artery.
(B) Representative photograph of an IUGR pup, produced by BUVL surgery (left) compared to a control
surgery pup (right) at P1. Ruler measure is in centimetres (cm). IUGR = intrauterine growth restriction, P1 =
postnatal day 1.

2 General Methodology
37
2.4.3 End of surgery and post-surgical care
Following surgery, a lubricant (Chloropt, Ceva, Australia) was applied to the eyelids of anaesthetised
rats during recovery, to prevent eye irritation. Rats were returned to the animal room in a new, clean
individual box and placed on a heat-pad overnight to facilitate recovery. Dams fully recovered from
anaesthesia within 15 to 20 min. Once again rats were given access to rat chow and water ad libitum.
Paracetamol (2mg/mL in 100mL drinking water) was given for 2 to 3 days post-surgery. Shredded
paper was provided as nesting material. Rats were monitored closely for the remainder of the day and
then twice daily following surgery. Dams were allowed to deliver naturally; the rat pups were then
housed with their dam and littermates. Rats were checked throughout the day from E21 to 23 for
births.
2.5 Classification of IUGR and control, and size-matching of litters.
Pups were counted and sexed on P1 (to avoid maternal stress immediately after birth). The mean
weight of control pups in our study at P1 (prior to injection and litter matching) was 6.95g (n=100).
Only severe IUGR pups that weighed ≤ 5.61g (6.95g – 2SD [standard deviation]) were used for this
study as described by previous studies (Olivier et al., 2005, Delcour et al., 2012, Tashima et al., 2001).
Control pups from sham surgeries that weighed ≥ 6.27g (6.95g – 1SD) were used for this study as
described by previous studies (Olivier et al., 2007) (Figure 2.1 B). Control litters were on average
larger than IUGR litters, and were therefore size matched to IUGR litter size to ensure an equal
nutritional background across litters. Control and IUGR litters were generated, and underwent
experimental procedures at the same time to control for environmental variables. Only IUGR pups
from BUVL litters were used in these studies, and no IUGR pups from control litters were collected.
2.6 Drug treatment
To determine the effects of longer-term DITPA treatment on the brain, both IUGR and control pups
were injected (i.p) with DITPA (0.5mg/100g, Sigma, USA), or vehicle (equivalent volume of saline)
daily from P1 to P13 (Figure 2.2 A) using a Hamilton syringe (max. volume 50μL) with a disposable
30-gauge needle until P7 and 26-gauge needle from P7 until P13. See Appendix 1 for the protocol
detailing how DITPA is dissolved at this concentration. Thin adhesive film (DuDERM®, ConvaTec,
Australia) was placed onto the site of injection in order to protect the delicate skin of the rat pups
from any irritation. The minimum and maximum weight of rat pups between P1 and P7 was 3 to 12g,
therefore the volume of drug/saline injected was within the range of ~ 10μL to 30μL depending on
pups age/weight. This is well within the maximum allowable volume of 1% of the rat pups body
weight. Dose, timing and route of administration were chosen based on previous rodent studies (Di

2 General Methodology
38
Cosmo et al., 2009) and human reports (Verge et al., 2012), allowing for cross-species conversion
based on FDA guidelines.
2.6.1 Handling of pups and injection
To minimise possibility of rejection by the mother following handling, recommendations were
followed from the NHMRC Guidelines to Promote Wellbeing of Animals used for Scientific Purposes
Handbook (Part III, Administration of substances, A7). Specifically, all pups were removed from the
litter with their bedding at the same time, gloves were worn to prevent foreign smells being left on
the pups’ skin, and care was taken not to leave any trace of the drugs or blood on the pups’ skin.
Following treatment, the pups were mixed with their original soiled bedding so that they reacquired
the correct smell before being returned to the mother in one go. The injections were made into the
lower right side of the abdomen, alternating the site to avoid bruising or calluses, and the syringe was
drawn back to determine whether any major organs or blood vessels were hit. If this was the case, the
needle was repositioned.
2.6.2 Monitoring after drug treatment
All pups were monitored twice daily (before and after DITPA or saline administration), and included
assessment of body weight (also required to calculate drug dose/volume), changes in normal
behaviour and the appearance of milk spots (to ensure pups were feeding) in the afternoon following
treatment.
2.7 Post-mortem blood and tissue collection
At the completion of the experiment (P14) the dams were euthanised via carbon dioxide inhalation.
Pups were humanely euthanised with an overdose of pentobarbitone sodium (Lethobarb, >100mg/kg
i.p. Virbac, Australia). Blood was collected from each pup, and within litters, both male and female
pups were randomly allocated to one of three brain collection techniques: 1) perfusion fixed and
processed to paraffin wax for histological and immunohistochemical (IHC) analysis (performed in
this thesis), 2) perfusion fixed and frozen into optimal cutting temperature compound (OCT; Tissue
Plus OCT Compound, Scigen, USA) for future IHC analysis (Figure 2.2 E), and 3 un-fixed and snap
frozen in liquid nitrogen and stored at -80°C for future molecular analysis at a later point in time
(Figure 2.2 D). Brains were collected using these different processing techniques to ensure that a
range of analyses could be performed for this thesis and for ongoing studies in our laboratory. Optic
nerves were also carefully collected from male and female animals that were perfused for analysis
using electron microscopy, however were not used in this thesis (Figure 2.2 G).
2 General Methodology
39
2.7.1 Blood collection
Blood was collected from each pup and placed in Eppendorf tubes with heparin (2µL, 5000 IU in
5mL; Pfizer, Australia) to prevent clotting, then placed on ice. Eppendorf tubes were then centrifuged
at 22° C and 2600rpm for 10 min (Eppendorf 5819 R) to attain plasma for assays (minimum volume
required = 300µL), which was then frozen at -80° C for later analysis using hospital standard plasma
assays (Monash Pathology, Clayton, Victoria, Australia) (Figure 2.2 B) to assess thyroid function
(TSH; plasma FT3 and FT4), plasma liver enzymes alanine transaminase (ALT) and alkaline
phosphatase (ALP) and cholesterol.
2.7.2 Perfusion fixed brain tissue collection
In a fumehood, the euthanised pup was laid on its back and an incision made below the ribcage in the
shape of a ‘v’ ending at the armpits in order to expose the organs. The ribcage was clamped upwards
using haemostats and the diaphragm was cut to reveal the heart. The descending aorta was located
and clamped using a haemostat. A small incision was then made in the right atrium to allow for liquid
to flow out. The ascending circulatory system and brain was then flushed using a 20mL syringe and
a 26-gauge needle filled with 0.9% saline (pH 7.4) inserted into the apex of the heart, until the liquid
exiting the right atrium ran clear. The contents of the syringe was then changed to 4%
paraformaldehyde (PFA, Sharlau, Barcelona, Spain) in 0.1M phosphate buffer (PB; pH 7.4) and the
process repeated in order to fix the brain. Rongeurs were used to gently peel away the skull and
subcutaneous tissue to expose the brain and upper spinal cord. The spinal cord was cleanly cut leaving
at least 1cm still attached to the brain. The brain was gently removed from the skull and post-fixed
for 4 hours in a 50mL container of 4% PFA. The liver and kidneys were weighed then discarded, and
the carcass frozen for later analysis using duel-energy x-ray absorptiometry (DEXA).
2.7.2.1 Perfused brain tissue processed to paraffin wax
Following post-fixation, the olfactory bulbs were removed from the brain using a blade as they were
not relevant to this study. The whole brain (with spinal cord attached) was then weighed, and the
brainstem (pons and medulla only) with the cerebellum attached was dissected from the cerebral
hemispheres, and the hemispheres (also containing the hindbrain) weighed. The cerebellum was
detached from the brainstem at the cerebellar peduncles weighed. The pons, medulla and spinal cord
were dissected and weighed. The cerebellum was divided into left and right hemispheres via a sagittal
cut down the midline (i.e. at the vermis). The left hemisphere of the cerebellum was stored in 4%
PFA (pH 7.4) for Rapid Golgi staining, however this was not part of this thesis. The cerebral
hemispheres, right cerebellar hemisphere, pons, medulla and spinal cord were placed in cassettes and

2 General Methodology
40
stored in 70% ethanol (maximum 1 day), prior to being processed to paraffin wax at the University
of Melbourne Histology Facility.
2.7.2.2 Perfused brain tissue frozen in OCT
Brain regions were separated and weighed (as outlined in Section 2.7.2.1) and placed into 20%
sucrose in 0.1M PB overnight. The tissue was then placed cutting-face down (ventral side for the
pons, medulla and spinal cord) into peel-away moulds (Grale Scientific Ltd, Australia) which were
carefully filled with OCT, frozen on dry ice and then stored at -80°C for cryo-sectioning and future
analyses by others within our laboratory group.
2.7.3 Fresh snap frozen brain tissue collection
Following euthanasia, the pup’s scalp was opened using a scalpel blade to expose the skull. The brain
was gently removed from the skull as in Section 2.7.2, and then weighed and placed on a petri dish
containing ice to keep it cold. Using the scalpel blade, a sagittal cut was made down the midline of
the brain and spinal cord to separate the right and left hemispheres. The left hemisphere was quickly
placed cutting-face down in a peel-away mould and carefully filled with OCT; the mould was then
wrapped in aluminium foil and frozen on dry ice (until opaque). This tissue was collected for future
studies using laser capture microdissection and RNAseq to assess for differential gene expression.
Using the blade, the remaining hemisphere (right) was separated into the cerebral cortex,
hippocampus, cerebellum, pons, medulla and spinal cord, which were then weighed individually
before being placed into Eppendorf tubes and snap frozen in liquid nitrogen. An incision was made
on the ventral midline of the pup to expose the organs, and the liver, kidneys and adrenals were
removed, weighed and snap frozen in liquid nitrogen. All tissue was stored at -80°C for molecular
analysis see Chapter 5, Section 5.3.5 for assessment of Dio1 mRNA levels in the livers of pups at
P14 and the carcass frozen for later analysis using DEXA scanning (see Section 5.3.3).
2.7.4 Processing of optic nerves
Optic nerves were also collected from pups that were perfusion fixed for the ultrastructural
assessment of myelinated axons. A sharp scalpel was used to make an incision at the anterior of each
eyeball (where the optic nerve attaches), and a fine pair of forceps was then used to grasp the optic
chiasm and gently pull the nerve from the skull. The nerves were post-fixed in 2.5% glutaraldehyde
in 0.1M cacodylate buffer (pH 7.4; sodium cacodylate-trihydrate, Sigma Aldrich Pty Ltd, Australia)
for 4 hours. Following post-fixation, optic nerves were placed in 0.1M cacodylate buffer (pH 7.4) and
transported to the Peter MacCallum Cancer Center Electron Microscopy Facility where they remained

2 General Methodology
41
in the buffer for a maximum of two days until they were then processed into resin blocks, and semi-
thin sections taken for electron microscopy. Using a JEOL 1010 transmission electron microscope,
myelinated axons within the optic nerve were visualised. Unfortunately the fixation technique used
did not optimally preserve optic nerve tissue, and therefore tissue quality was too poor for parameters
such as myelin sheath thickness, and proportions of myelinated axons to be quantified accurately as
planned. For more information on how optic nerves were processed in preparation for electron
microscopy see Appendix 2.

2 General Methodology
42
Figure 2.2 Experimental protocol timeline (A) and schematic diagram of tissue collection protocols (B-
G) Pregnant Wistar rats underwent either sham or bilateral uterine vessels (BUVL) surgery at E18 to generate
either IUGR pups, or controls (A). Between P1 and P13 IUGR and control pups received DITPA
(0.5mg/100g/day) or saline treatment (equivalent volume. Rat pups underwent tissue collection at P14. Blood
was collected from all pups and plasma obtained for serum assays (B). Bodies of all pups were frozen for
DEXA scanning and analysis of body and bone composition (C). One male/female pup per litter was
designated to either ‘fresh’ snap frozen tissue collection (D), perfusion to be later processed to paraffin wax,
or frozen in OCT (E). Black stars signify the tissue analysis that was included in this thesis. Optic nerves
(ONs) were collected and processed for electron microscopy (G). BUVL = bilateral uterine vessel ligation,
DEXA = dual-energy x-ray absorptiometry, E = embryonic day, EM = electron microscopy, IF =
immunofluorescence, IHC = immunohistochemistry, LCM = laser capture microdissection, Liquid N2 = liquid
nitrogen, M = molar, OCT = optimal cutting temperature freezing compound, P = postnatal day, P14 =
postnatal day 14, PCR = polymerase chain reaction, PFA = paraformaldehyde, PM = post-mortem.

2 General Methodology
43
2.8 Tissue histology
2.8.1 Paraffin sectioning of cerebral hemispheres and cerebellum
Please refer to Chapter 3 methods (Section 3.3) for a protocol on sectioning of the cerebral
hemispheres, and Chapter 4 methods (Section 4.3.2) for a protocol on sectioning of the cerebellum.
2.9 Histological staining & analysis
The histological staining protocol below was followed in the staining of both the cerebral hemispheres
and cerebellum.
2.9.1 Haemotoxylin and Eosin (H&E)
Haemotoxylin and Eosin (H&E) staining was performed using a standard procedure. Prior to staining,
sections were dewaxed by clearing through two changes of histolene solvent (Trajan Scientific, Vic,
Australia) and rehydrated through graded solutions of decreasing ethanol concentration to distilled
H2O (dH2O). The tissue was rehydrated and immersed in Mayers Haemotoxylin (Amber Scientific,
WA Australia) for approximately 6 min, to stain the nuclei blue. The sections were then washed under
running tap water, immersed in Scott’s tap water for 1 min, and then submerged in running tap water
for 3 min. The sections were then counterstained with Eosin (1%; Amber Scientific, Australia) for 3
min, which stained the cytoplasm pink. Sections were then submerged in running tap water again for
at least 3 min, until the water ran clear. Sections were then dehydrated through graded solutions of
increasing ethanol concentration and two washes of histolene, before being cover-slipped using DPX
mounting media (DPX, Thermo Scientific Ltd., Vic, Australia).
2.9.2 Analysis of H&E staining
Sections stained with H&E were scanned using Olympus VS120 slide scanner (Olympus, Australia),
and Fiji Software (ImageJ, Version 2.0, National Institute of Health, Maryland, USA) was used to
assess the gross morphology of the cerebellum, with emphasis on the area and width of the cerebellar
layers in cross-section. The presence of haemorrhages, lesions and infarcts were also assessed
qualitatively. Analysis of H&E staining was conducted in the cerebellum only. For an analysis
protocol specific to structures within the cerebellum, please refer to Chapter 4 (Section 4.3.3).
2.10 Immunohistochemical staining
A full outline of final conditions used for each immunohistochemical stain is presented in the
respective Chapters below, in Chapter 3, Table 3.2 for the cerebrum, and in Chapter 4, Table 4.1 for

2 General Methodology
44
the cerebellum. To avoid procedural variation, and ensure uniform conditions for subsequent analysis,
sections from all four experimental groups were stained simultaneously for each antibody/procedure.
In addition positive controls (P7 rat cerebellum and cerebral cortex) and negative controls (omission
of primary antibody) were performed for each antibody.
A standard immunohistochemical procedure was performed. Following rehydration, sections were
washed in 10% phosphate buffered saline (PBS; 3 x 5 min washes), and antigen retrieval was used to
recover most antigen reactivity in the tissue without increasing background staining. The type of
antigen retrieval was dependent upon the specific protein of interest and included either proteolytic
enzyme-induced epitope retrieval via the use of proteinase K (37˚C for 30mins), or heat induced
epitope retrieval via microwaving in citric acid buffer (pH 6.0, heated to near boiling, simmer 7 mins,
allow to sit at room temperature for 45mins).
Following 3 x 5 min washes in PBS, sections were incubated in 1% hydrogen peroxide (H2O2)
(Merck, Darmstadt, Germany) diluted in PBS for 20 min, in order to block endogenous peroxidase
activity. Following another 3 x 5 min washes in PBS, the sections were incubated with either 4% or
10% bovine serum albumin (BSA, Sigma Aldrich Pty Ltd, NSW, Australia) in 0.1 M PBS (pH 7.4)
to prevent non-specific antibody binding. Sections were then incubated in the appropriate
concentration of primary antibodies diluted in primary diluent (2% BSA in 0.1M PBS + 0.3% Triton
x-100; Sigma Aldrich Pty Ltd, NSW, Australia) overnight at 4˚C.
The following day sections underwent 3 x 5 min PBS washes. The secondary antibodies were diluted
in secondary diluent (2% BSA in 0.1M PBS) and applied to sections for 60min. Sections were washed
in PBS (3 x 5min), and incubated in avidin-biotin peroxidase complex (1:1:200 in PBS; Vectastain
ABC Elite Kit; Vector Laboratories, Burlingame, USA) for 60 min. To enable visualization of the
antibody reactions, 3,3’-diaminobenzadine chromagen (DAB; Mp Biomedicals Australia Pty Ltd,
NSW, Australia; 50mg in 10mL PBS + 3µL 30% H2O2) was added to the slides for approximately 6
to 8 min. Sections were then washed in PBS and then counterstained with Haemotoxylin (Amber
Scientific, WA, Australia), except for slides stained for myelin basic protein (MBP) and glial fibrillary
acidic protein (GFAP). Slides were then dehydrated in graded alcohols, cleared in histolene and
cover-slipped with DPX as described in Section 2.9.1 above.
Immunostained sections were scanned electronically, with a constant light setting using a slide
scanner (Olympus VS120-S5 scanner, Olympus, Vic, Australia); the digital images were visualised
using Fiji (ImageJ, Version 2.0, National Institute of Health, Maryland, USA). For quantitative

2 General Methodology
45
analyses 3 to 4 sections per region per animal were analysed. Each region of the brain that was stained
immunostained was analysed differently, and was specific to the type of stain. For details on the
analysis of brain regions within the cerebral hemispheres, including the corpus callosum, external
capsule, cortical layer VI, hippocampus and fimbria, please refer to Chapter 3 (Section 3.5). For
details on the immunohistochemical analysis of the cerebellum please refer to Chapter 4 (Section
4.3.5).

Chapter 3
46
3 Impact of DITPA treatment on
myelination and inflammation
in the neonatal IUGR rat
cerebrum
3.1 Introduction
The cerebrum, situated above the cerebellum, is the largest and most anterior region of the brain. It
consists of a left and right hemisphere separated by a midline fissure and contains the cerebral cortex,
the executive functioning centre of the mammalian CNS (Shi et al., 2012). Below the cerebral cortex
are subcortical structures that include the hippocampus, responsible for memory, emotion and spatial
navigation (Wall and Messier, 2001), the fimbria which connects the hippocampus to subcortical
regions, the corpus callosum which relays information between the left and right cerebral
hemispheres, and the external capsule, responsible for connecting different regions of the cortex
(Bloom and Hynd, 2005). The cerebrum is comprised of WM and GM; the overlying cortex is a six-
layered structure, and along with the hippocampus is predominantly comprised of GM. These regions
are rich in neural cell bodies and are essential for processing and integrating information within the
brain. The corpus callosum, external capsule and hippocampal fimbriae are major WM tracts, acting
as ‘information highways’, and are densely packed with myelinated axons. Development of each of
these regions occurs largely prior to birth, and therefore they are vulnerable to prenatal insults such
as the hypoxic/ischaemic injury that often occurs in IUGR, as shown clinically (Takenouchi et al.,
2010, Sizonenko et al., 2006, Kuchna, 1994) and in animal models (Rees et al., 1988, Rees et al.,
1998).
It is known that IUGR babies at an increased risk of neurodevelopmental sequelae (Geva et al., 2006b)
and possess a 10 to 30 fold increased risk of developing cerebral palsy (McIntyre et al., 2013,
MacLennan et al., 2015). A number of clinical neuroimaging studies have found decreased regional
connectivity, which is consistent with decreased WM volume in the cerebrum, including the corpus
callosum and external capsule in IUGR infants at 12 and 18 months of age (Padilla et al., 2014b,
Esteban et al., 2010), changes that persist into childhood and adulthood (Eikenes et al., 2012a).

Chapter 3
47
Decreased volumes of the hippocampus (Lodygensky et al., 2008) and corpus callosum (Egana-
Ugrinovic et al., 2013) have been reported in IUGR infants, as well as compromised development of
the cerebral cortex at post-mortem in IUGR newborns (Dubois et al., 2008). The findings from these
human studies indicate that IUGR negatively impacts cerebral WM and structural development of the
cortex as well as subcortical structures, which may persist into childhood and adulthood.
In IUGR guinea pigs, myelination is reduced in the corticospinal tract at 52 and 62 dg (Nitsos and
Rees, 1990), and in the cerebral cortex at 60 and 62 dg, but not at 1 week of postnatal age (Tolcos et
al., 2011). In the IUGR rat, we have previously shown that myelination is reduced in the corpus
callosum and external capsule at P7 and P14 (Azhan, A., PhD thesis, Monash University, 2019), and
others have reported an overall myelination delay persists into adulthood (Olivier et al., 2005, Reid
et al., 2012). Reduced numbers of pre-OLs have been found in the brains of IUGR rat pups at P7
(Olivier et al., 2005), and reduced numbers of mature OLs in the corpus callosum at P14 (Azhan, A.,
PhD thesis, Monash University, 2019). Given that only mature OLs produce myelin, these results
suggest that the resultant hypomyelination seen in the IUGR brain is a consequence of impaired
maturation of OLs. Based on the findings of these studies, Assessment of myelination will be focused
on in the cerebral layer six (VI) of the cerebral cortex, corpus callosum, external capsule and
hippocampus which are structures vulnerable to the effects of IUGR. Assessment of myelination in
cortical layer VI was chosen, as it was not possible to assess the underlying subcortical WM, due to
the density of staining and because cortical layer VI neurons are the most densely myelinated out of
all the cortical layers (Tomassy et al., 2014). In the hippocampus, the WM in the CA1 region is
examined as this region is important for the recollection of memories (Mueller et al., 2011), and the
CA3 region, essential for encoding new spatial memories (Kesner, 2013). The fimbria, a band of WM
situated along the medial hippocampus that receives large bundles of myelinated fibres from the
hippocampus is also examined.
TH is essential for brain development, and for the maturation of OLs from progenitors to a mature
myelinating phenotype. In the cerebrum, TH is essential for cell migration in the hippocampus and
corpus callosum (Rakic, 1972, Goodman and Gilbert, 2007), as well as the cerebral cortex (Hatten,
1990), where it is required for the correct formation of the six cortical layers (Berbel et al., 2001,
Berbel et al., 1994). A fundamental cellular transporter of TH in the brain is MCT8. However MCT8
protein and mRNA expression is reduced in the IUGR human (Chan et al., 2014) and rat brain (Azhan,
A., PhD thesis, Monash University, 2019) compared to controls. Interestingly, in children with
congenital mutation of MCT8, cerebral myelination is reduced (Lopez-Espindola et al., 2014), and
this suggests that a reduction in MCT8 in the IUGR brain may be compromising cerebral TH

Chapter 3
48
signalling, resulting in reduced myelination. Given that MCT8 is reduced in the IUGR brain (Chan
et al., 2014), treatment with conventional TH may be ineffective, and so alternative TH therapies that
do not rely on MCT8 for cellular uptake need to be tested.
DITPA is a synthetic TH analogue, that readily enter brain cells in MCT8 knockout mice, and
subsequently correct cerebral hypothyroidism (Di Cosmo et al., 2009). A previous study by our group
found that DITPA (0.5mg/100g; i.p.) administered daily from P1 to P6 in IUGR rat pups, a clinical
scenario that mimics an IUGR baby born preterm receiving short-term treatment, promoted myelin
recovery, detectable by P7 in the external capsule (Azhan, A., PhD thesis, Monash University, 2019).
Although promising, this data only provides evidence of the impact of short-term DITPA treatment
on the cerebrum, and although benefits were only seen in the external capsule, perhaps a longer dosing
regimen would further benefit other cerebral and subcortical regions as well.
Therefore the aim of this Chapter was to determine whether DITPA administered to newborn
IUGR rats using a longer-term dosing regimen (daily, from P1 to P13), mimicking a clinical situation
where a preterm IUGR baby is treated with DITPA until term equivalent age (i) restores myelination,
(ii) promotes OL maturation, and (ii) does not cause injury or inflammation, in the cerebral cortex
(layer VI), corpus callosum, external capsule, hippocampus and fimbria. The hypothesis was that
DITPA administration from P1 to 13 will promote and restore OL maturation and myelination within
the cerebral hemispheres of IUGR rat pups when assessed at P14, without causing injury or
inflammation. This study will generate complementary information to our previous short-term
DITPA administration study (Azhan, A., unpublished thesis, 2019) and will inform clinical
translation.

Chapter 3
49
3.2 Methodology
The methodology in this Chapter will commence from the point of paraffin tissue sectioning, and will
focus on the cerebral hemispheres. For information regarding animal welfare, species, surgical
procedure, drug treatment, post-mortem and tissue collection, please refer to Chapter 2 (Sections 2.2
to 2.8).
3.2.1 Overview of animal work
At day 18 of pregnancy (term = 22 days), pregnant Wistar rats underwent BUVL (n= 31 litters) or
sham surgery (n= 16 litters) to generate IUGR or control pups. DITPA (0.5mg/100g; i.p.) or saline
was administered daily from P1 to P13 to IUGR pups (IUGR + DITPA: n= 14 litters, 67 pups; IUGR
+ saline: n= 17 litters, 60 pups) and control pups (control + DITPA: n= 8 litters, 49 pups; control +
saline: n= 8 litters, 47 pups). Not all litters and pups could be used in this study, as the dams ate some
smaller litters, and some BUVL surgeries did not yield IUGR litters or pups. Only males were used
in this study to maintain consistency with our previous short-term DITPA study (Azhan, A., PhD
thesis, Monash University, 2019), and because previous studies examining myelination in IUGR rat
pups did not specify sex (Reid et al., 2012, Olivier et al., 2007). One male pup was randomly selected
from each litter. Therefore the final number of pups per group used in this study is: control + saline,
n= 8; control + DITPA, n= 7; IUGR + saline, n= 8; IUGR + DITPA, n= 8.
3.3 Paraffin sectioning of the cerebral hemispheres
Paraffin embedded P14 rat cerebral hemispheres were sectioned coronally at 8µm using a rotary
microtome (Jung Biocut 2035, Geprufte Sicherhiet, Germany); sections were collected at 3 different
coronal levels - Bregma + 3.00, +1.68 and – 2.68 (Table 3.1) to ensure analysis across the rostro-
caudal extent of the cerebral hemispheres. A total of 45 consecutive sections were cut per animal
from each of the 3 coronal levels (4,185 sections in total; see Figure 3.1 for cutting and staining plan).
This sectioning protocol was applied to capture major WM tracts such as the corpus callosum and
external capsule, cortical WM projections throughout the brain as well as the hippocampus. Sections
were placed in a warm water bath (~40°C) prior to being mounted flat onto slides (Superfrost plus +,
Menzel Glaser, Germany). Three sections per animal were placed onto slides and each section was
separated by 120µm. All tissue-mounted slides were dried overnight at 30 °C prior to histological
and immunohistochemical staining.

Chapter 3
50
3.4 Immunohistochemical staining of the cerebral hemispheres
Immunohistochemistry was performed using the standard protocol outlined in Chapter 2 (Section
2.12). A number of trials were performed for each antibody to ensure optimal staining quality prior
to conducting the procedure on the actual tissue. For a full outline of final conditions used for each
immunostain performed in the cerebrum, please refer to Table 3.2 To avoid procedural variation, and
ensure uniform conditions for subsequent analysis, sections from all experimental groups were
stained simultaneously for each antibody/procedure. For each animal, 3 sections at each of the 3
coronal levels (9 sections total per animal; see Figure 3.1) were stained with Haematoxylin and Eosin
(for gross morphological assessment e.g. presences of lesions, haemorrhage or regions of pallor) or
immunostained with antibodies directed against MBP, myelin proteolipid protein (PLP),
oligodendrocyte transcription factor 2 (Olig2), adenomatous polyposis coli (APC), glial fibrillary
acidic protein (GFAP) and ionized calcium-binding adaptor molecule 1 (Iba1); sections
immunostained for Olig2, APC and Iba1 were counterstained with Haemotoxylin to visualise the
nuclei of neural cells. In addition, positive controls (P7 rat brain) and negative controls (omission of
primary antibody) were performed for each antibody.
3.5 Immunohistochemical analysis of the cerebral hemispheres
Prior to quantitative assessment, an independent researcher randomly coded sections, so as to allow
blinding to the experimental group. Analyses for each stain were conducted on 9 sections per animal
(3 sections at each of the 3 coronal hemisphere levels, i.e. 3 sections/slide, 120m apart; 31 animals:
31 x 9 sections = 279 sections total analysed for each stain) (see Figure 3.1). The immunostained
slides were digitally scanned using Olympus slide scanning software at 20x magnification, using a
constant light setting (Olympus VS120-S5 scanner, Olympus, Vic, Australia). The digital images
were then visualised and analysed using Fiji software (ImageJ, Version 2.0, National Institute of
Health, Maryland, USA (Schindelin et al., 2012)) and Photoshop software (Photoshop CC, v 19.0,
Adobe Systems Incorporated) to extract images of regions of interest.

Chapter 3
51
Figure 3. 1 Sequence of tissue sectioning and staining. (A) A total of 135 8m-thick sections were cut from
each tissue block, with 45 sections cut at each of the 3 hemisphere levels. (B) Three sections per animal,
separated by 120µm (8µm x 15), per hemisphere level were used for each stain (31 slides per hemisphere level;
93 slides total per stain; 279 slides total including all three hemisphere levels). m = micrometre, APC =
adenomatous polyposis coli, GFAP = glial fibrillary acidic protein, H&E = Haemotoxylin & Eosin, Iba1 =
ionized calcium-binding adaptor molecule 1, MBP = myelin basic protein, Olig2 = oligodendrocyte
transcription factor 2, PLP = myelin proteolipid protein.

Chapter 3
52
3.5.1 Areal coverage (% AC) of MBP-, PLP- and GFAP-immunoreactivity (IR)
MBP and PLP are fundamental proteins within myelin membranes in the CNS compromising around
30% and 50% of the myelin proteins respectively (Baron and Hoekstra, 2010, Werner et al., 2007).
MBP has a role in both myelin formation and stabilisation (Fraser et al., 1989), while PLP plays an
essential role in myelin compaction and wrapping (Klugmann et al., 1997). A reduction in either
MBP- or PLP-IR is an indication of impaired myelination in the brain. GFAP, is a 50kD intermediate
filament protein specific to astrocytes (Eng et al., 1971). Antibodies raised against GFAP are
Table 3.1 Summary of the 3 cerebral hemisphere levels at which analysis was carried out (Bregma: +
3.00, + 1.68, - 2.68), and outline of analysis type carried out at each level and for each stain. Cerebral
hemispheres stained with H&E at each level used for analysis; main structures analysed are outlined or
indicated with text: CA1 = cornu ammonis region 1, CA3 = cornu ammonis region 3,CX = cortex, CC =
Corpus callosum, EC = external capsule, Fim = fimbria, % AC = percentage of areal coverage, APC =
adenomatous polyposis coli, GFAP = glial fibrillary acidic protein, Iba1 = ionized calcium-binding adaptor
molecule 1, MBP = myelin basic protein, Olig2 = oligodendrocyte transcription factor 2.

Chapter 3
53
commonly used to identify astrocytes, with an up-regulation of GFAP indicating an increased density
of astrocytes, due to for example, neuronal injury or hypoxia (Brand and Bignami, 1969).
In layer VI of the cerebral cortex, 3 regions of interest (ROIs; 200µm x 200µm = 40,000 µm2 field
size) were captured from 3 points in the left and right hemispheres using these landmarks: 1st ROI =
above the cingulum; 2nd ROI = above the most lateral extent of the corpus callosum, just prior to the
external capsule, and 3rd ROI = the dorsal part of the external capsule (just before the MBP-IR cortical
fibres end; Figure 3.2).The percentage (%) of a ROI occupied by MBP-IR, PLP-IR and GFAP-IR
(i.e. areal coverage; % AC) was then determined using the ‘threshold analysis tool’ in Fiji software
(threshold analysis). The entire corpus callosum and external capsule (from the left and right
hemisphere) were outlined and defined as ROIs using Photoshop, and the % AC for MBP-IR, PLP-
IR and GFAP-IR were determined using threshold analysis.
In the hippocampus, 4 ROIs were captured in each of the left and right hemispheres. These ROIs
(200µm x 200µm = 40,000 µm2 field size) were positioned laterally against the dorsal edge of the
hippocampus in either the CA1 or CA3 regions, as these regions are both essential for propagation of
information from the hippocampus to the rest of the brain, and more medially, adjacent to the
overlying corpus callosum (one hemisphere: CA1 = 2 ROIs, CA3; 2 ROIs; Both hemispheres = CA1
& CA3 = 4 ROIs each) (see Figure 3.2). Two ROIs were also taken from the fimbria in each
hemisphere (4 ROIs total). For each region (cortical layer VI, corpus callosum, external capsule,
hippocampus and fimbria) the % AC of MBP-IR, PLP-IR and GFAP-IR was averaged per section,
and per animal, and the mean determined for each group.
3.5.2 Projection of MBP- and PLP-IR fibres into the cerebral cortex
The extent to which MBP-IR and PLP-IR fibres projected into the cortex (mm), and the entire cortical
depth of the cortex (mm), were measured at 3 points (1st to 3rd ROI as for % AC) in level matched
sections, using the Fiji ‘line’ and ‘measure’ tool. The percentage of MBP-IR and PLP-IR projection
length to cortex depth at each point was then determined, and this was averaged per section, and per
animal, and the mean determined for each group.

Chapter 3
54
3.5.3 Areal density of Olig2-, APC- and Iba1-IR cells
Olig2 is a nuclear pan-OL marker in the rodent brain (i.e. marks the entire OL lineage including OL
progenitor cells, pre-OLs, and pre-myelinating and myelinating OLs) (Valerio-Gomes et al., 2018),
while APC is a marker of mature myelinating OLs (Salinas Tejedor et al., 2015). Iba1 is a protein
specific to macrophages and microglia in the CNS and is up-regulated during the activation of these
cells and is therefore an indicator of inflammation or injury to neural cells including OLs (Bennett et
al., 2016).
To examine alterations in the areal density of Olig2-, APC- and Iba1-IR cells between groups,
analysis was carried out in cortical layer VI, hippocampus and fimbria using the same ROIs (200µm
x 200µm = 40,000 µm2 field size) as described for MBP-IR and PLP-IR analysis in Section 3.5.1
above. However, instead of using a threshold analysis and % AC, positively stained Olig2-, APC-
and Iba1-IR cells were counted within each ROI and the number divided by the ROI field size to
determine areal density (cells/mm2). In the corpus callosum, counts were conducted in 4 ROIs
(200µm x 200µm = 40,000 µm2 field size) spaced randomly and evenly along the corpus callosum in
each section. For each region (cortical layer VI, hippocampus, fimbria and corpus callosum) data was
averaged per section, the 3 sections were averaged to give cells/mm2 per animal, and means were
determined for each group. The percentage of mature APC-IR OLs within the entire OL population
(Olig2-IR) was calculated (APC-IR (cells/mm2)/ Olig2-IR (cells/mm2)) and averaged per animal.
Figure 3.2 Coronal section of P14 rat cerebrum stained with MBP Quantitative analyses of
immunohistochemical staining were performed with 6 fields in the cerebral cortex (layer VI; black boxes), the
entire corpus callosum (labelled CC; central), the external capsule (yellow trace),4 fields in the hippocampal
CA1 region (green boxes), and 4 fields in the CA3 region (pink boxes) and 4 in the fimbria (blue boxes) per
coronal level (level 3 pictured here). Square regions of interest (to size) = 200µm x 200µm = 40,000 µm2 field
size. CC = Corpus callosum, EC = external capsule.

Chapter 3
55
3.6 Statistical analysis
All statistical analyses were performed using the Graphpad Prism statistical software (Graphpad
Software, Version 8.0, CA, USA). Prior to analyses, outliers were removed using the Grubb’s test to
determine a significant outlier (p < 0.05). Data were checked for normal distribution, and if found to
not be normally distributed, the appropriate non-parametric test was used instead (Mann-Whitney U
test, instead of unpaired t-test; Friedman test instead of two-way ANOVA). A two-way ANOVA was
used, with a post-hoc pairwise comparison to identify between group differences, and a Bonferroni
correction was used for multiple post-hoc comparisons between experimental groups. Data were
considered significant if p < 0.05. All main effects data are presented in text as ratio of residual
variances (F) and statistical significance (p-value). All post-hoc data are presented as [mean
comparative difference (95% confidence interval); and p-value], and graphs are represented as Mean
standard error of the mean (SEM). All two-way ANOVA results are tabulated in Appendix 3 as
Mean SEM.

Chapter 3
56
Table 3. 2 Immunohistochemistry - optimised antigen retrieval, blocking protocol and antibody concentrations in the cerebrum.
Abbreviations: Ab, antibody; APC, adenomatous polyposis coli; BSA, bovine serum albumin; cat, catalogue number; DAB, diaminobenzidine; GFAP, glial fibrillary
acidic Protein; H2O2, hydrogen peroxide; Iba1, Ionized calcium-binding adaptor molecule 1; M, molar; MBP, Myelin basic protein; Olig2, oligodendrocyte
transcription factor-2; PBS, pH; Power of the hydrogen atom; phosphate buffered saline; PLP, myelin proteolipid protein.
Protein Staining for Antigen Retrieval & block 1°Ab (source); conc. 2°Ab (source); conc. Complex
binding to
secondary
and DAB
[Complex][DA
B]
MBP Myelin in the CNS Heat in 0.01M citrate buffer (pH
6.0) for 9 min, then decreasing
power to maintain simmer for 7
min; 4% BSA in PBS
Rat anti-MBP,
(Millipore cat:
MAB386); 1:250
Biotinylated rabbit anti-rat,
(Millipore); 1:200
Avidin-biotin
complex
DAB (in stable
peroxide
buffer)
50μl A + 50μl B
in 10 mL PBS;
1 DAB tablet in
10mL dH2O +
3μl H2O2
PLP Myelin in the CNS Heat in 0.01M citrate buffer (pH
6.0) for 9 min, then decreasing
power to maintain simmer for 7
min; 4% BSA in PBS
Mouse anti- PLP
(Millipore cat:
MAB388); 1:500
Biotinylated goat anti -
mouse, (Vector cat:
VEBA9200); 1:200
Olig2 Entire OL lineage Heat in 0.01M citrate buffer (pH
6.0) for 9 min, then decreasing
power to maintain simmer for 7
min;
4% BSA in PBS
Rabbit anti-Olig2,
(Millipore cat:
MABN50); 1:500
Biotinylated goat anti-
rabbit,
(Vector cat: VEBA1000);
1:200
APC Mature OLs Heat in 0.01M citrate buffer (pH
6.0) for 9 min, then decreasing
power to maintain simmer for 7
min; 10% BSA in PBS
Mouse anti- APC – CC1
(Millipore); 1:500
Biotinylated goat anti-
mouse, (Vector cat:
VEBA9200); 1:200
GFAP Bergmann glial
cells & astrocytes
1:500 Proteinase K in 37°C for 30
min; 4% BSA in PBS
Rabbit anti-GFAP,
(DAKO cat: 0334):
1:500
Biotinylated goat anti-
rabbit,
(Vector cat: VEBA1000);
1:200
Iba1 Microglia &
macrophages in
CNS
Heat in 0.01M citrate buffer (pH
6.0) for 9 min, then decreasing
power to maintain simmer for 7
min;
4% BSA in PBS
Rabbit anti-Iba-1,
(Wako cat: 019-19741);
1: 1000
Biotinylated goat anti-
rabbit,
(Vector cat: VEBA1000);
1:200

Chapter 3
57
3.7 Results
3.7.1 Myelination and oligodendrocytes
3.7.1.1 Areal coverage (% AC) of MBP-IR in cortical layer VI
Two-way ANOVA analysis showed no interaction between group and treatment on the percentage of
area covered (% AC) by MBP-IR in cortical layer VI, but there was a main effect of group and
treatment on % AC (group: F1/256 = 17.74; p < 0.0001; treatment: F1/256 62.95; p < 0.0001). Post-hoc
analysis showed that % AC of MBP-IR in cortical layer VI was not different in IUGR + saline
compared to control + saline pups (Figure 3.3 A). There was an increase in % AC of MBP-IR in
IUGR + DITPA compared to IUGR + saline pups [8.39 (3.70, 13.04); p < 0.0001; Figure 3.3 A], and
in control + DITPA compared to control + saline pups [11.48 (6.70, 16.26); p < 0.0001; Figure 3.3
A]. There was a reduction in % AC of MBP-IR in IUGR + DITPA compared to control + DITPA
pups [-6.82 (-11.49, - 2.14); p = 0.0008; Figure 3.3 A].
3.7.1.2 Percentage of cerebral cortex occupied by MBP-IR fibres
Two-way ANOVA analysis showed no interaction between group and treatment on the percentage of
cerebral cortex occupied by MBP-IR fibres, however there was a main effect of group (F1/68 = 8.68,
p = 0.004) and treatment (F1/68 = 10.57, p = 0.002). Post-hoc analysis showed a decrease in the
percentage of the cerebral cortex occupied by MBP-IR fibres in IUGR + DITPA compared to IUGR
+ saline pups [6.23 (-11.84, -0.62); p = 0.02; Figure 3.3 B], and no difference between any other
groups.

Chapter 3
58
3.7.1.3 Areal coverage (% AC) of MBP-IR in the corpus callosum and external
capsule
Two-way ANOVA analysis showed no interaction between group and treatment on % AC of MBP-
IR in the corpus callosum (Figure 3.4 A) and external capsule (Figure 3.4 B), and no main effects of
group or treatment.
Figure 3.3 Areal coverage (% AC) of MBP-IR (A) in cortical layer VI, and proportion (%) of cerebral
cortex depth containing MBP-IR fibre projections (B) at P14 in control and IUGR pups treated with
DITPA or saline. Representative photomicrographs of MBP-IR in the cerebral cortex (layer VI) of a control
+ saline (C), control + DITPA (D), IUGR + saline (E) and IUGR + DITPA (F) pup show increased % AC by
MBP-IR in IUGR + DITPA pups compared to IUGR + saline, and control + DITPA pups compared to control
+ saline. * p <0.05, *** p < 0.001, **** p < 0.0001. Data analysed using a two-way ANOVA with Bonferroni
correction. Values presented as Mean ± SEM. Pup numbers: control + saline: n= 8; control + DITPA: n= 7;
IUGR + saline: n= 8; IUGR + DITPA: n= 8. All animals are male. Scale bar = 0.05 mm.

Chapter 3
59
3.7.1.4 Areal coverage (% AC) of MBP-IR in the hippocampus and fimbria
Two-way ANOVA analysis showed no interaction between group and treatment on the % AC of
MBP-IR in the CA1 or CA3 regions of the hippocampus, or in the fimbria. There was a main effect
of group in the hippocampal CA1 (F1/58 = 55.58, p < 0.0001) and CA3 regions (F1/57 = 19.74, p <
0.0001), and an effect of treatment in the fimbria (F1/25 = 163.1, p < 0.0001). Post-hoc analysis
showed reduced % AC of MBP-IR in the CA1 and CA3 regions of the hippocampus in IUGR + saline
compared to control + saline pups [CA1: 3.78 (1.26, 6.31); p = 0.0012; CA3: 3.61 (0.21,7.01); p =
0.034; Figure 3.4 C, D], but no difference in the fimbria (Figure 3.4 E). There was an increase in %
AC of MBP-IR in the fimbria of control + DITPA compared to control + saline pups [-33.82 (-44.81,-
22.83) p < 0.0001], and IUGR + DITPA compared to IUGR + saline pups [-34.04 (-44.58, -23.51); p
< 0.0001; Figure 3.4 E]. In IUGR + DITPA compared to control + DITPA pups, % AC of MBP-IR
was reduced in the hippocampal CA1 and CA3 regions [CA1: 6.47 (3.85, 9.1); p < 0.0001; CA3: 4.67
(1.10, 8.25); p = 0.006; Figure 3.4 C, D].

Chapter 3
60
Figure 3.4 Areal coverage (% AC) of MBP-IR in the corpus callosum (A), external capsule (B),
hippocampal CA1 region(C), hippocampal CA3 regions (D), and fimbria (E) at P14 in control and
IUGR pups treated with DITPA or saline. Representative photomicrographs of MBP-IR in the fimbria of
a control + saline (F), control + DITPA (G), IUGR + saline (H) and IUGR + DITPA (I) pup show increased
% AC of MBP-IR in IUGR + DITPA pups compared to IUGR + saline, and control + DITPA pups compared
to control + saline. * p < 0.05, ** p < 0.01, **** p < 0.0001. Data analysed using a two-way ANOVA with
Bonferroni correction. Values presented as Mean ± SEM. Pup numbers: control + saline: n= 8; control +
DITPA: n= 7; IUGR + saline: n= 8; IUGR + DITPA: n= 8. All animals are male. Scale bar = 0.05 mm.

Chapter 3
61
3.7.1.5 Areal coverage of PLP-IR in cortical layer VI
Two-way ANOVA results showed no interaction between group and treatment on the % AC of PLP-
IR in cortical layer VI, however there was a main effect of group (F1/219 = 73.83, p < 0.0001), and a
main effect of treatment (F1/219 = 5.49, p = 0.02). Post-hoc analysis showed reduced % AC of PLP-
IR in IUGR + saline compared to control + saline pups [-13.05 (-17.81, -8.30); p < 0.0001], and in
IUGR + DITPA pups compared to control + DITPA pups [-9.22 (-14.22, -4.22); p < 0.0001; Figure
3.5 A].
3.7.1.6 Percentage of cerebral cortex occupied by PLP-IR fibres
Two-way ANOVA results showed no interaction between group and treatment of the percentage of
cerebral cortex occupied by PLP-IR fibres, and no main effect of group or treatment (Figure 3.5 B).
3.7.1.7 Areal coverage (% AC) of PLP-IR in the corpus callosum and external
capsule
Two-way ANOVA results showed no interaction between group and treatment on the % AC of PLP-
IR in the corpus callosum and external capsule. There was a main effect of group and treatment on
the % AC of PLP-IR in the corpus callosum (group: F1/51 = 12.09, p = 0.48; treatment: F1/51 = 34.00,
p < 0.0001), and the external capsule (group: F1/118 = 81.09, p < 0.0001; treatment: F1/118 = 10.19, p
= 0.002). Post-hoc analysis showed reduced % AC of PLP-IR in the external capsule of IUGR +
saline compared to control + saline pups [-13.12 (-18.38, - 7.87); p < 0.0001; Figure 3.6 B]. The %
AC of PLP-IR was reduced in the corpus callosum [-12.66 (-25.18, - 0.16); p = 0.04; Figure 3.6 A]
Figure 3.5 Percentage of area covered by PLP-IR (A) in the cortex (layer VI), and cortical projection
length (B) at P14 in control and IUGR pups treated with DITPA or saline. Data analysed using a two-way
ANOVA with Bonferroni correction. Values presented as Mean ± SEM. **** p < 0.0001. Pup numbers: control
+ saline: n= 8; control + DITPA: n= 7; IUGR + saline: n= 8; IUGR + DITPA: n= 8. All animals are male.

Chapter 3
62
and external capsule [-7.62 (-12.88, - 2.36); p = 0.001; Figure 3.6 B] of IUGR + DITPA when
compared to IUGR + saline pups, and in control + DITPA compared to control + saline pups in the
external capsule [-8.69 (-14.04, -3.33); p = 0.0002; Figure 3.6 B]. In IUGR + DITPA compared to
control + DITPA pups the % AC of PLP-IR was reduced in the corpus callosum [-13.59 (-25.85, -
1.32); p = 0.02; Figure 3.6 A] and in the external capsule [-12.06 (-17.41, -6.71); p < 0.0001; Figure
3.6, B].
3.7.1.8 Areal coverage (% AC) of PLP-IR in the hippocampus and fimbria
Two-way ANOVA results showed an interaction between group and treatment on the % AC of PLP-
IR in the CA1 region of the hippocampus (F1/23 = 5.65, p = 0.026). Main effects of group and
treatment were also shown in the CA1 region (group: F1/23 = 30.76, p < 0.0001; treatment: F1/23 =
7.02, p = 0.014), and an effect of group only in the CA3 region (F1/22 = 12.26, p = 0.0020) and
fimbria (F1/23 = 30.02, p < 0.0001). Post-hoc analysis found that in IUGR + saline compared to
control + saline pups the % AC of PLP-IR was reduced in the CA1 region of the hippocampus [9.70
(4.57, 14.83) p < 0.0001] and in the fimbria [11.30 (4.44, 18. 15); p = 0.0005; Figure 3.6 C, E] . There
was a reduction in % AC of PLP-IR in the CA1 region of control + DITPA compared to control +
saline pups [6.15 (0.71, 11. 60) p = 0.021; Figure 3.6 E], and in the fimbria of IUGR + DITPA
compared to control + DITPA pups [6.63, (0.14, 13.12); p = 0.04; Figure 3.6, E]. There was no
difference in the % AC of PLP-IR in the hippocampal CA3 region between groups (Figure 3.6 D).

Chapter 3
63
Figure 3.6 Areal coverage (% AC) of PLP-IR in the corpus callosum (A, B), external capsule (C, D),
hippocampal CA1 (E) and CA3 (F) regions and fimbria (G) at P14 in control and IUGR pups treated
with DITPA or saline. Representative photomicrographs of PLP-IR in the external capsule of a control + saline (F), control + DITPA (G), IUGR + saline (H) and IUGR + DITPA (I) pup show decreased % of PLP-IR AC in IUGR + DITPA pups compared to IUGR + saline, and control + DITPA pups compared to control + saline Data
analysed using a two-way ANOVA with Bonferroni correction. Values presented as Mean ± SEM. * p < 0.05, ** p < 0.01, *** p < 0.001, **** p < 0.0001. Pup numbers: control + saline: n= 8; control + DITPA: n= 7; IUGR + saline: n= 8; IUGR + DITPA: n= 8. All animals are male.

Chapter 3
64
3.7.1.9 Areal density of Olig2-IR OLs in cortical layer VI
Two-way ANOVA results showed an interaction between group and treatment on the areal density
of Olig2-IR OLs in cortical layer VI (F1/274 = 11.14, p = 0.001); there was no main effect of group or
treatment. Post-hoc analysis revealed that areal density of Olig2-IR OLs was decreased in cortical
layer VI in IUGR + saline pups compared to control + saline pups [-110 (-189, - 31); p = 0.0016],
and in control + DITPA pups compared to control + saline [-96.94 (-178.8, -15.09); p = 0.01] (Figure
3.7, A). There was also no difference in density of Olig2-IR OLs in IUGR + DITPA compared to
IUGR + saline pups (Figure 3.7 A).
3.7.1.10 Areal density of Olig2-IR oligodendrocytes in the corpus callosum
Two-way ANOVA results showed no interaction between group and treatment on the areal density
of Olig2-IR OLs in the corpus callosum, however there was a main effect of treatment (F1/58 = 10.87,
p = 0.002). Post-hoc analysis showed that the areal density of Olig2-IR OLs was increased in the
corpus callosum of IUGR + DITPA compared to IUGR + saline pups [534 (85.86, 982); p = 0.01;
Figure 3.7, B]; there was no difference between IUGR + saline and control + saline pups, or between
control + DITPA and control + saline pups (Figure 3.7 B).
3.7.1.11 Areal density of Olig2-IR oligodendrocytes in the hippocampus and fimbria
Two-way ANOVA results showed an interaction between group and treatment on the areal density
of Olig2-IR oligodendrocytes in the fimbria (F1/27 = 4.49, p = 0.04). Post-hoc analysis showed that
there was no difference in areal density of Olig2-IR OLs in the CA1 region (Figure 3.7 C), CA3
region (Figure 3.7 D) or the fimbria (Figure 3.7 E) between groups.

Chapter 3
65
3.7.1.12 Areal density of APC-IR OLs in cortical layer VI
Two-way ANOVA analysis showed an overall interaction between group and treatment on the areal
density of APC-IR OLs in layer VI of the cerebral cortex (F1/100 = 9.4, p = 0.003) and a main effect
of group on areal density of APC-IR OLs (F1/100 = 7.10, p = 0.009). Post-hoc analysis revealed a
reduction the areal density of Olig2-IR cells in IUGR + saline compared to control + saline pups [-
196 (-327.5, -65.76); p = 0.0006]. The density of Olig2-IR cells was also reduced in control + DITPA
Figure 3.7 Areal density of Olig2-IR oligodendrocytes in the cortical layer VI (A), corpus callosum (B),
hippocampal CA1 region (C), hippocampal CA3 region (D), and fimbria (E) at P14 in control and IUGR
pups treated with DITPA or saline. Representative photomicrographs of Olig2-IR in the corpus callosum of
a control + saline (F), control + DITPA (G), IUGR + saline (H) and IUGR + DITPA (I) pup show increased
Olig2-IR OL density in IUGR + DITPA pups compared to IUGR + saline. Data analysed using a two-way
ANOVA with Bonferroni correction. Values presented as Mean ± SEM. * p < 0.05, ** p < 0.01. Pup numbers:
control + saline: n= 8; control + DITPA: n= 7; IUGR + saline: n= 8; IUGR + DITPA: n= 8. All animals are
male. Scale bar = 0.05 mm.

Chapter 3
66
compared to control + saline pups [-149 (-278, -19.7); p = 0.02; Figure 3.8 A]. There was no
difference in the density of Olig2-IR OLs between IUGR + DITPA and IUGR + saline pups (Figure
3.8 A).
3.7.1.13 Areal density of APC-IR OLs in the corpus callosum
Two-way ANOVA analysis showed an interaction between group and treatment in the corpus
callosum (F1/53 = 5.34, p = 0.02), and a main effect of group on the areal density of APC-IR OLs (F1/53
= 28.75, p < 0.0001). Post-hoc analysis showed a decrease in the areal density of APC-IR OLs in the
corpus callosum of IUGR + saline compared to control + saline pups [-422.6 (-630.6 – 214.7); p <
0.0001], but there was no difference between IUGR + saline and IUGR + DITPA pups (Figure 3.8
B).
3.7.1.14 Areal density of APC-IR OLs in the hippocampus and fimbria
Two-way ANOVA results showed an interaction between group and treatment on the areal density
of APC-IR OLs in the CA1 region of the hippocampus and the fimbria (CA1: F1/25 = 5.04, p = 0.03;
Fimbria: F1/25 = 4.91, p = 0.04). There was a main effect of group on the areal density of APC–IR
cells in the CA1 and CA3 regions (CA1: F1/25 = 6.40, p = 0.02; CA3: F1/25 = 5.73, p = 0.02). Post-hoc
analysis showed a significant reduction in the areal density of APC-IR OLs in the CA1 [375.5 (74.3,
676.7); p = 0.009; Figure 3.8 C] and CA3 region [378.1 (38.19, 718.1); p = 0.02; Figure 3.8 D] of the
hippocampus, and in the fimbria [858.3 (13.09, 17.04); p = 0.045; Figure 3.8 E] of IUGR + saline
compared to control + saline pups; there was no difference in IUGR + saline compared to IUGR +
DITPA pups in any regions (Figure 3.8 A- E).

Chapter 3
67
3.7.1.15 Percentage (%) of mature APC-IR OLs in cortical layer VI
Two-way ANOVA analysis showed an interaction between group and treatment on the percentage of
mature APC-IR OLs within the overall Olig2-IR OL population in cortical layer VI (F1/284 = 31.74, p
< 0.0001). There was a main effect of group and treatment on the percentage of mature APC-IR OLs
Figure 3.8 Areal density of APC-IR oligodendrocytes in the cortical layer VI (A), corpus callosum (B),
hippocampal CA1 region (C), hippocampal CA3 region (D), and fimbria (E) at P14 in control and
IUGR pups treated with DITPA or saline. Representative photomicrographs of APC-IR in cortical layer
VI of a control + saline (F), control + DITPA (G), IUGR + saline (H) and IUGR + DITPA (I) pup show
decreased APC-IR OL density in IUGR + saline pups compared to control + saline (F vs. H) and control +
DITPA compared to control + saline (F vs. G). Data analysed using a two-way ANOVA with Bonferroni
correction. Values presented as Mean ± SEM. * p < 0.05, ** p < 0.01, *** and ****p < 0.0001. Pup numbers:
control + saline: n= 8; control + DITPA: n= 7; IUGR + saline: n= 8; IUGR + DITPA: n= 8. All animals are
male.

Chapter 3
68
(group: F1/284 = 6.27, p = 0.01; treatment: F1/248 = 11.78, p = 0.0007). Post-hoc analysis showed a
decrease in the percentage of mature APC-IR OLs in IUGR + saline compared to control + saline
pups [-27.46 (-40.13, - 14.78); p < 0.0001]. There was a lower percentage of mature OLs in control
+ DITPA pups compared to control + saline pups [-30.58 (-43.26, -17.91); p < 0.0001; Figure 3.9 A];
there was no difference in IUGR + DITPA compared to IUGR + saline pups (Figure 3.9 A).
3.7.1.16 Percentage (%) of mature APC-IR OLs in the corpus callosum
Two-way ANOVA results showed an interaction between group and treatment on the percentage of
mature APC-IR OLs within the overall Olig2-IR OL population in the corpus callosum (: F1/60 = 6.87,
p = 0.01). There were no main effects of group or treatment. Post-hoc analysis showed a decreased
percentage of mature APC-IR OLs in IUGR + saline pups compared to control + saline [-21.74 (-
43.20, -0.38); p = 0.04; Figure 3.9 B). There was no difference in the percentage of mature APC-IR
OLs in the corpus callosum between IUGR + DITPA and IUGR + saline groups (Figure 3.9 B).
3.7.1.17 Percentage (%) of mature APC-IR OLs in the hippocampus and fimbria
Two-way ANOVA analysis found no interaction between group and treatment on the percentage of
mature APC-IR OLs within the overall Olig2-IR OL population in regions CA1 and CA3 of the
hippocampus, or in the fimbria; there was a main effect of group in the hippocampal CA1 and CA3
regions (CA1: F1/28 = 7.78, p = 0.009; CA3: F1/28 = 6.14, p = 0.02). Post-hoc analysis revealed a
decrease in the percentage of mature APC-IR OLs in the fimbria of control + DITPA pups compared
to control + saline pups [-29.64 (-56.90, -2.38); p = 0.03; Figure 3.9 E], but no difference in IUGR +
DITPA pups compared to IUGR + saline, or in IUGR + saline compared to control + saline pups;
there were no difference between groups in the hippocampal CA1 and CA3 regions (Figure 3.9 C,
D).

Chapter 3
69
3.7.2 Inflammation
3.7.2.1 Areal density of Iba1-IR microglial
Two-way ANOVA analysis showed no interaction between group and treatment on the areal density
of Iba1-IR microglia (cells/mm2) in cortical layer VI, the corpus callosum, hippocampal CA1 and
CA3 regions or in the fimbria, and no main effects of group or treatment (Figure 3.10 A-E).
Figure 3.9 Proportion of mature APC-IR OLs to total OL lineage (APC:Olig2) in the cortical layer VI
(A), corpus callosum (B), hippocampal CA1 region (C), hippocampal CA3 region (D), and fimbria (E) at
P14 in control and IUGR pups treated with DITPA or saline. Data analysed using a two-way ANOVA with
Bonferroni correction. Values presented as Mean ± SEM. * p < 0.05, **** p < 0.0001. Pup numbers: control + saline: n= 8; control + DITPA: n= 7; IUGR + saline: n= 8; IUGR + DITPA: n= 8. All animals are male.

Chapter 3
70
Figure 3.10 Density of Iba1-IR microglia in the cortex (layer VI; A), corpus callosum (B), CA1 (C) and
CA3 (D) regions of the hippocampus and fimbria (E) at P14 in control and IUGR pups treated with
DITPA or saline. Representative photomicrographs of GFAP-IR in cortical layer VI of a control + saline (F),
control + DITPA (G), IUGR + saline (H) and IUGR + DITPA (I) pup show no difference in GFAP-IR astrocyte density between groups. Data analysed using a two-way ANOVA. Values presented as Mean ± SEM. Pup numbers: control + saline: n= 8; control + DITPA: n= 7; IUGR + saline: n= 8; IUGR + DITPA: n= 8. All animals are male.

Chapter 3
71
3.7.2.2 Areal coverage (% AC) of GFAP-IR
Two-way ANOVA analysis showed no interaction between group and treatment on the % AC of
GFAP-IR astrocytes in cortical layer VI, corpus callosum, external capsule, hippocampal CA1 and
CA3 regions or fimbria. There were no main effects of group or treatment in any of these regions
(Figure 3.11).
0.05mm
Figure 3.11 Percentage of area covered by GFAP-IR astrocytes in the cortex (layer VI; A), corpus
callosum (B), external capsule (C), CA1 (D) and CA3 (E) regions of the hippocampus and fimbria (F) at
P14 in control and IUGR pups treated with DITPA or saline. Representative photomicrographs of GFAP-
IR in cortical layer VI of a control + saline (G), control + DITPA (H), IUGR + saline (I) and IUGR + DITPA
(J) pup show no difference in GFAP-IR astrocyte density between groups. Data analysed using a two-way
ANOVA. Values presented as Mean ± SEM. Pup numbers: control + saline: n= 8; control + DITPA: n= 7;
IUGR + saline: n= 8; IUGR + DITPA: n= 8. All animals are male.

Chapter 3
72
3.8 Discussion
3.8.1 Overview
This is the first study to examine the structure of the neonatal cerebral hemispheres in response to
daily, longer-term DITPA administration (P1 to 13) in an IUGR rat model. As described previously,
analyses were carried out at three hemispheric levels to account for the developmental profile of the
cerebral WM and then averaged per animal. The major findings of this study are:
In IUGR + saline compared to control + saline pups there was significantly reduced (i) % AC of
MBP-IR in the hippocampus, (ii) % AC of PLP–IR in cortical layer VI, external capsule,
hippocampus and fimbria, (iii) areal density of all OLs (Olig2-IR; cells/mm2) in cortical layer VI, (iv)
areal density of APC-IR mature OLs, in cortical layer VI, corpus callosum, hippocampus and fimbria,
and (iv) percentage of APC-IR mature OLs within the entire population of OLs in cortical layer VI
and in the corpus callosum. There was (v) no difference in the areal density of microglia (Iba1) and
the % AC of astrocytes (GFAP) in any of the regions examined.
In IUGR + DITPA compared to IUGR + saline pups there was significantly (i) increased % AC of
MBP-IR in cortical layer VI and the fimbria, (ii) increased density of Olig2-IR OLs in the corpus
callosum, (iii) reduced percentage of cerebral cortex occupied by MBP-IR projections, and (iv)
reduced % AC of PLP–IR in the corpus callosum and external capsule.
In control + DITPA compared to control + saline pups there was significantly (i) increased % AC of
MBP-IR in cortical layer VI and the fimbria, (ii) reduced % AC of PLP-IR in the external capsule
and the CA1 region of the hippocampus, (iii) reduced areal density of Olig2-IR OLs and (iv) reduced
areal density of APC-IR OLs in cortical layer VI, as well as (v) reduced percentage of APC-IR mature
OLs within the entire population of OLs in cortical layer VI and fimbria.
3.8.2 Effects of daily DITPA administration on white matter development
3.8.2.1 Myelin proteins
MBP and PLP are two of the main myelin proteins in the CNS, and are integral to the structure of the
myelin sheath, with MBP and PLP making up roughly 30% and 50% of myelin proteins respectively
(Baron and Hoekstra, 2010, Werner et al., 2007). The immunohistochemical staining of these two
proteins was used to determine the overall effects of DITPA on the cerebral WM in newborn IUGR
rat pups.

Chapter 3
73
MBP-IR
This study found that % AC of MBP-IR in the corpus callosum, external capsule, and cortical layer
VI was not affected by IUGR, but there was a reduction in the hippocampus (CA1 and CA3 regions).
This finding was unexpected, as a previous study by our group using an IUGR rat model,
demonstrated that % AC of MBP-IR was significantly reduced in the corpus callosum and external
capsule at P7 and P14, and that DITPA administration (0.5mg/100kg/day i.p. from P1 to P6) corrected
the hypomyelination by P7 in the external capsule (Azhan, A., PhD thesis, Monash University, 2019).
A reduction in myelin proteins in the brain of IUGR infants has been reported at post-mortem (Chase
et al., 1972), as well as in other animal models (Reid et al., 2012, Tolcos et al., 2011, Azhan, 2019),
and therefore a more pronounced effect of IUGR on cerebral myelination was expected in this study.
The hippocampal CA1 region is essential for encoding long-term memory and spatial recognition
(Duvernoy, 2005), and the CA3 is fundamental for encoding short-term memory and spatial
information (Cherubini and Miles, 2015), therefore disruptions to MBP-IR in these regions may have
an impact on memory processing capacity in the hippocampus. The hippocampus has known
vulnerability to the effects of hypoxia and under-nutrition, both known to occur in IUGR
(Lodygensky et al., 2008, Sizonenko et al., 2006), and disruptions to hippocampal development in
IUGR is seen in guinea pigs (Mallard et al., 1999, Mallard et al., 2000). This vulnerability could
explain why a decrease in % AC of MBP-IR was seen in the hippocampus of IUGR pups in this study.
It is still not clear why a reduction in % AC of MBP-IR was not seen in several brain regions of the
IUGR pups in this study at P14, One possibility could be that the stress of daily handling and injecting
of pups (with either saline or DITPA) for an extended period of time (from P1 to 13, rather than P1
to P6 as in (Azhan, A., PhD thesis, Monash University, 2019) is having an effect on myelination in
the control pups as well. It is known that cortisol released during a stress response delays myelination
of major WM tracts in the brain and spinal cord (Bohn and Friedrich, 1982, Antonow-Schlorke et al.,
2009, Shields et al., 2012). Our pups underwent roughly 2 to 3 min of physical handling per day (e.g.
weighing, marking), as well as the physical and psychological stress of daily intraperitoneal injections
and being briefly separated from their mother during this process. Stress is likely having an effect on
both control and IUGR pups, and therefore a level of reduced myelination would theoretically be
expected in both. However, could it be possible that OLs in IUGR pups are more resilient to the
effects of cortisol than controls as they have developed under the stress of IUGR conditions? If this
were the case, myelination would more greatly affected in control pups compared to IUGR pups in
response to stress, thus lowering their MBP-IR levels to that seen in IUGR pups. Indeed, late
progenitor OLs are more likely to be killed by hypoxic-ischemic insult, like that occurring in IUGR,
and that the surviving progenitors and mature OLs are more resilient after the insult, thus

Chapter 3
74
compensating for the loss in numbers by increasing their density and accelerating maturation (Back
et al., 2001, Back et al., 2002). In our model, could resilience in the surviving OLs in the cerebrum
of IUGR pups, compared to controls, underlie the lack of difference in MBP-IR between IUGR and
control pups? Future studies should aim to study the density and re-myelinating potential of OLs in
the IUGR rat brain, with and without exposure to daily handling and compare this to OLs in the non-
IUGR rat brain in order to answer this question.
In the present study, following DITPA administration % AC of MBP-IR was increased in cortical
layer VI of both IUGR and control pups compared to saline, and there was a concurrent decrease in
the percentage of cerebral cortex occupied by MBP-IR projections in IUGR pups given DITPA
compared to those given saline. This suggests that DITPA treatment is resulting in denser MBP-IR
along fibres in layer VI of the cortex, and a reduced length of MBP-IR projections extending into
other cortical layers. MBP is translocated from the OL cell body where it is made, up through the OL
processes that extend into the cortex, wrapping and compacting to form myelinated processes
(Pedraza et al., 1997). Thus it is possible that DITPA could be slowing the transport of MBP from
the OL cell body into the OL processes, resulting in a ‘build up’ of MBP closer to the OL body in
cortical layer VI. Although there is no evidence that DITPA directly impacts MBP, DITPA (1ng/mL
or 10ng/mL), it promotes OL differentiation and myelination in human OL co-culture (Lee et al.,
2017).
In the fimbria, DITPA treatment significantly increased the % AC of MBP-IR in both IUGR and
control pups in the present study. The fimbria is situated temporally in the hippocampus, and contains
bundles of afferent and efferent fibres which travel out through the fornix into the rest of the brain.
Thus, in both control and IUGR, DITPA could be having an effect on the processing potential in the
brain of these pups. Future studies should aim to investigate the functional impact of such alterations
due to DITPA, perhaps using motor function testing via the open field test to assess locomotor speed
of rodents (Basso et al., 1995), or the rotor-rod (Deacon, 2013) to assess balance and/or motor
coordination; outcomes can then be correlated with the degree of MBP-IR staining and myelination
present in the cortex and other brain regions, as motor skill learning is correlated with WM structure
(Sampaio-Baptista et al., 2013). There is currently no functional data in humans or animals following
DITPA administration, and this testing would provide useful insight.
PLP-IR
In the present study, IUGR compared to control pups treated with saline showed reduced % AC of
PLP–IR in cortical layer VI, corpus callosum, external capsule and CA1 region of the hippocampus,

Chapter 3
75
as well as in the fimbria, but no difference in the percentage of cerebral cortex occupied by PLP-IR
projections. These results are consistent with previous studies that report reduced PLP-IR fibres in
the corpus callosum of IUGR rat pups at P14 and P21 (Reid et al., 2012), and in the cerebral cortex
of IUGR guinea pig foetuses (60 dg) compared to controls (Tolcos et al., 2011). In the present study,
in IUGR pups, DITPA compared to saline treatment, significantly decreased the % AC of PLP-IR in
the corpus callosum, and the external capsule. In controls, DITPA compared to saline treatment
decreased the % AC of PLP-IR in the external capsule and the CA1 region of the hippocampus. PLP
constitutes a large proportion of the total myelin proteins, and this decrease could affect the
processing potential of the cerebrum, and as discussed above, motor function testing could be useful
in assessing the implications of this decrease. MBP and PLP are both myelin proteins, and based on
a previous IUGR study in guinea pigs, where both MBP and PLP were reduced (Tolcos et al., 2011),
it was expected that PLP would follow the same trend as MBP in the current study. This is the first
study to examine the effect of DITPA administered to IUGR rodents on PLP levels. The results of
the present study indicate that PLP expression may be more vulnerable to the effects of IUGR than
MBP, with a reduction in the % AC of PLP-IR seen in the external capsule and hippocampus of IUGR
pups, compared to reductions in the % AC of MBP-IR in only the hippocampus.
DITPA treatment in IUGR, and control pups significantly decreased PLP-IR in regions where MBP-
IR was unaffected, or was even elevated, like in cortical layer VI, the corpus callosum, external and
hippocampus (CA1) in controls. PLP is an essential constituent of the myelin sheath, and is
fundamental for myelin compaction and wrapping, therefore decreased coverage could signify
impaired construction of the myelin sheath, or wrapping around axons in these brain regions. It would
be useful to examine myelinated axons in these areas of the brain using transmission electron
microscopy in order to better determine if DITPA is at all negatively affecting myelin compaction or
wrapping.
In the present study, both MBP- and PLP-IR were examined as they have different yet essential roles
in formation of the myelin sheath – PLP is essential for compaction and wrapping of the myelin
strand, while MBP is fundamental for adhesion of myelin layers and signalling to OLs (Boggs, 2006,
Dyer et al., 1994). Therefore assessing MBP- and PLP-IR in the brain provides a more complete
representation of myelination than simply examining MBP or PLP alone. Within the myelin
membrane, MBP is located internally, situated in the cytoplasmic interface, while PLP transverses
the myelin membrane and is exposed on the outer surface (extracellular face) (Baumann and Pham-
Dinh, 2001). PLP is highly hydrophobic and upon synthesis it is transported whole to the plasma
membrane before it reaches the myelin sheath (Baron and Hoekstra, 2010). In contrast MBP is

Chapter 3
76
hydrophilic in structure and is transported directly, and therefore more quickly, to the myelin sheath
after it is synthesised, albeit in mRNA granule form and not as a complete protein like PLP (Boggs,
2006, Baron and Hoekstra, 2010). The differing polarities and transport time of these myelin proteins,
may underlie the reason why PLP is more impacted by DITPA than MBP, however this theory
requires further investigation.
3.8.2.2 Oligodendrocytes
In the CNS, OLs make myelin and undergo a lineage progression from progenitors to a mature
myelinating phenotype. APC labels only mature myelinating OLs within the brain, while Olig2 labels
the whole OL lineage. Together, these immunostains were used to examine the impact of IUGR and
DITPA treatment on OLs in the WM and GM of the cerebrum. At P14, the areal density of the entire
OL lineage (Olig2-IR; cells/mm2) was reduced in cortical layer VI of IUGR compared to control
pups. This finding differs to our previous study in IUGR rats that found no difference in Olig2-IR
areal density within the corpus callosum at P7, P14 and P35 (Azhan, A., PhD thesis, Monash
University, 2019). It is unclear why this is the case, as the surgical protocol (induction of IUGR) and
species used were identical. However, the two studies were performed across two different institutes,
and the animals were from different breeding facilities, and this may have contributed to the
conflicting results. In the present study the areal density of mature APC-IR OLs, was reduced in
cortical layer VI, the corpus callosum, hippocampus and fimbria of IUGR + saline compared to
control + saline pups, and the percentage of APC-IR mature OLs within the entire population of OLs
was reduced in cortical layer VI and the corpus callosum; reduced density of mature APC-IR OLs in
IUGR is consistent with finding from our previous IUGR rat study (Azhan, A., PhD thesis, Monash
University, 2019). Our finding together with those of the previous study indicates that there are less
mature OLs relative to the entire population of OLs in IUGR, in line with work suggesting that IUGR
delays OL maturation at the pre-myelinating stage (Tolcos et al., 2011). Although there are currently
no clinical studies that have examined the effect of DITPA on OLs in the IUGR brain, an in vitro
study DITPA promotes differentiation and maturation of OL progenitors into mature myelinating
OLs (Lee et al., 2017). However in the present study there was no difference in the number of mature
OLs in comparison to the overall OL population in IUGR pups treated with DITPA. This is an
interesting finding, as DITPA markedly increased MBP in cortical layer VI and fimbria, however did
not appear to alter the number of OLs, indicating that DITPA may be increasing the myelinating
potential of existing mature OLs. Interestingly, when given to control pups, DITPA decreased the
density of Olig2-IR OLs in cortical later VI, as well as mature APC-IR OLs, and decreased the
percentage of mature APC-IR OLs to the overall OL population in cortical later VI and the fimbria.
These results suggest that DITPA being given to controls may be having a detrimental effect on OL

Chapter 3
77
maturation in the cortex and fimbria, possibly due to an excess of TH (in the form of DITPA) being
given in an otherwise normally functioning system, and thus caution should be taken.
3.8.3 Effects of daily DITPA administration on inflammation in the cerebrum
In the CNS, activation of microglia (microgliosis) and astrocytes (astrogliosis) is the brains response
to injury and is indicative of an inflammatory response (Mayo et al., 2014, Ramlackhansingh et al.,
2011). Both glial cell responses have previously been reported in the brains of IUGR rodents.
Specifically, a trend towards an increase in the number of GFAP-IR astrocytes (Reid et al., 2012) and
a 2.5-fold increase in the number of Iba1-IR microglia (Zanno et al., 2019), has been reported in the
corpus callosum of the postnatal IUGR rat compared to controls. In the brain of IUGR foetal guinea
pigs, a significant increase in GFAP-IR astrocytes and Iba1-IR microglia has been reported in the
cerebral WM (Tolcos et al., 2011) but not in the foetal hippocampus (Cumberland et al., 2017).
Despite these findings, in the present study there was no evidence of microgliosis or astrogliosis in
the IUGR rat brain at P14, in any of the cerebral regions examined. These results were unexpected
based on previous IUGR studies, and at present we have no definitive explanation, however we
speculate that elevated cortisol levels due to an extended injecting regimen may play a role. In cortical
microglial cultures from P1 and P2 rats cortisol blocks microglial activation which is thought to be
an indirect neuroprotective response (Drew and Chavis, 2000). However, whether this is also true for
astrocytes is unknown. In vivo studies show contradictory results. Studies demonstrate that chronic
stress halts astroglial development from precursors (Sabolek et al., 2006), and decreases GFAP
mRNA expression and density of astrocytes following chronic exposure to corticosterone (Nichols et
al., 1990, O'Callaghan et al., 1991) and exposure to early life stress in adult rats (Leventopoulos et
al., 2007). However another study shows a 30% increase in the density of GFAP-IR astrocytes
following a stressor (activity stress) (Lambert et al., 2000). An important finding from the present
study is that DITPA administered to either control or IUGR rat pups, did not lead to cerebral
astrogliosis or microgliosis. This is the first study to examine the impact of DITPA on inflammatory
responses in the postnatal brain, however this requires further investigation at multiple and later
postnatal ages before DITPA can be deemed a safe translational therapy for IUGR babies.
3.8.4 Limitations of the study
This study found that myelination, when assessed by analysing the % AC of MBP-IR, was not
different in cortical layer VI, external capsule and fimbria of IUGR compared to control pups. This
was a surprising result given previous literature (Olivier et al., 2005, Reid et al., 2012, Tolcos et al.,
2011) and it was hypothesised that a stress response to daily injections for an extended period (i.e. 13
days) may underlie the differing results. To support or refute this hypothesis additional “absolute

Chapter 3
78
control” groups – i.e. control and IUGR pups without intervention (daily handling, weighing,
injecting) –would be necessary. This would allow me to elucidate the effects of IUGR vs. control
without the potential confounding variable of stress. At the beginning of 2020 additional “absolute
control” groups were generated (control: n= 4 litters, IUGR: n= 3 litters). Pups were not handled,
apart from being removed with minimal disturbance when the cage was cleaned once a week. Males
were chosen from this new cohort to match the standard methodology (1 male per litter: n= 4 control,
n= 3 IUGR), and tissue was collected and processed as described in Chapter 2 (Section 2.7). Paraffin
sectioning of this tissue was underway in preparation for MBP-IR staining, when the University was
closed due to the COVID19 pandemic, and as such this task was unable to be completed in time to
include it in this thesis. However the MBP-IR staining of these new cohorts will be analysed and
compared to the experimental groups presented in this thesis, at a later point. Before the COVID-
related lockdown occurred preparing was underway to assess the levels of glucocorticoid receptor
(GR) and mineralocorticoid receptors (MR) in the frozen brain tissue collected, in order to confirm
the presence or absence of a stress response. This was going to be accomplished using quantitative
polymerase chain reaction (qPCR) to measure the gene expression of GR and MR in the hippocampus
of rat pups across experimental groups at P14. Unfortunately saliva was not collected for a cortisol
assay, and no plasma was left following the neonatal plasma assays. Another limitation of this study
was that the immune-staining density and not intensity of both GFAP and Iba1 was measured.
Potential hypertrophy (activation) of astroglia (GFAP-IR) and microglia (Iba1) could have been
indicated by increased intensity of these stains per cell or per area, both of which might have given
an insight into a subtle inflammatory activation. Animal models of IUGR show mixed results
regarding the presence of glial activation. Microglial hypertrophy (Iba1-IR) seen in rats at P3 & P10
(Pham et al., 2015), while an IUGR guinea pig model showed no difference in microglial morphology
at P60 (Tolcos et al., 2015).Gender differences may play a role, with (Fung et al., 2012) demonstrating
that male IUGR rats have a greater density of hippocampal astrocytes than females when compared
to non IUGR counterparts. It is important for future studies to take gender differences into
consideration when examining these glial populations. Researchers are yet to identify whether DITPA
causes any hypertrophy of astroglia and microglia, however this is an extremely important avenue
that future studies should investigate. Lastly, only males were used in this study to maintain
consistency with our previous short-term DITPA study in rats (Azhan, A., PhD thesis, Monash
University, 2019), and because previous studies examining myelination in IUGR rat pups did not
specify sex (Reid et al., 2012, Olivier et al., 2007). However, it should be acknowledged that it is
equally important to examine the effects of both IUGR and DITPA in females; the brains from
females were also collected and processed as outlined in this thesis and these will be studied at a later
point in time.

Chapter 3
79
3.8.5 Conclusion
This study showed that DITPA administered daily to IUGR rat pups from P1 to P13 may improve
myelination in the cerebrum by P14 as indicated by elevated MBP-IR in cortical layer VI and in the
fimbria, but may also delay migration of myelin proteins into cortical processes and impair expression
of the myelin protein PLP. DITPA appeared to promote the density of Olig2-IR OLs in the corpus
callosum, but there was no difference in the percentage of mature OLs to the overall OL population,
indicating that DITPA does not impact the rate of OL maturation in IUGR, but may inhibit OL
maturation in cortical layer VI and the fimbria, as well as PLP expression when administered to non-
IUGR animals. Importantly, DITPA did not cause injury or inflammation in any cerebral regions in
IUGR rats. The functional consequences of less myelination of cortical processes in response to
DITPA are yet to be determined; this may be transient, however the myelinating potential of DITPA
remains promising. DITPA administration in control animals provided unfavourable outcomes,
reducing PLP, Olig2 and APC expression. Further exploration of DITPA as a neuroprotective utility
should examine the neurodevelopmental effects across multiple species. Please see thesis Chapter 6
(Section 6.5) for further directions, including investigating an alternate route of DITPA
administration and behavioural studies.
Chapter 4
80
4 Impact of DITPA treatment on
myelination and inflammation
in the neonatal IUGR rat
cerebellum
4.1 Preamble
The overall aim of this thesis is to examine the potential therapeutic benefits of DITPA treatment on
brain development in IUGR. As described previously (Chapter 3), in the cerebrum DITPA treatment
in IUGR pups may improve myelination at P14, evident by elevated MBP-IR staining in the cerebral
cortex compared to saline treated IUGR pups. DITPA did not cause inflammation or disruption to the
cerebrum, but did result in shorter MBP-IR cortical processes, perhaps due to altered transport of
MBP into the processes. The results from Chapter 3 suggest that daily DITPA administration from
P1 to P13 is not having a detrimental effect on the cerebrum of IUGR pups, and DITPA may be
having a beneficial effect on myelination at P14. The next study in this thesis examined the effect of
DITPA administration in another important brain region with known vulnerability to IUGR, the
cerebellum.
4.2 Introduction
The cerebellum is the component of the hindbrain, responsible not only for motor coordination,
balance, equilibrium and muscle tone (Albert et al., 2007), but also cognition and higher order brain
functions (O'Halloran et al., 2012). It is comprised of WM and the highly folded GM of the cerebellar
cortex, and contains approximately half of the total number of neurons in the brain, suggesting it
possesses powerful mechanisms for processing information. The cerebellum increases roughly five-
fold in volume between 24 and 40 weeks post conception (Chang et al., 2000). During this protracted
period of growth and development the cerebellum is highly vulnerable to insults.
It is known that IUGR often results in impaired functional outcomes, with IUGR babies at an
increased risk of neurodevelopmental sequelae (Geva et al., 2006) such as cerebral palsy (McIntyre
et al., 2013). A number of clinical studies have used MRI to investigate the impact of IUGR on the

Chapter 4
81
brain structure of infants (Padilla et al., 2014, Egana-Ugrinovic et al., 2013, Batalle et al., 2012, De
Bie et al., 2011). Disruptions in regional connectivity, consistent with decreased WM volume have
been found in the cerebella of IUGR infants at 1 year of age (Batalle et al., 2012), and decreased
volumes of cerebellar GM and WM have also been reported in the brains of IUGR children at 12
months, and up to 7 years of age (De Bie et al., 2011, Padilla et al., 2011). These studies suggest that
IUGR negatively impacts the foetal cerebellum, resulting in decreased WM and GM volume. Post-
mortem studies of the human IUGR brain are rare, and there is no current post-mortem literature on
the IUGR cerebellum.
Animal studies examining the effect of IUGR on the cerebellum have shown reduced volumes of the
ML, IGL and cerebellar WM in the guinea pig in response to IUGR, at 60 dg, and at 1 week postnatal
age. Neuronal density was decreased in the IUGR cerebellum, as were the number of Purkinje cells,
the main motor output cell of the cerebellum, at 1 week postnatally (Mallard et al., 2000, Tolcos et
al., 2018). An increase in the volume of the cerebellar EGL, the site of granule cell proliferation is
seen in both the IUGR guinea pig at 60 dg, and the rat at P7 (Tolcos et al., 2018, McDougall et al.,
2017). In the rat, the newborn (P1) IUGR rat cerebellum displays increased rates of neuronal
apoptosis compared to controls (Liu et al., 2011), and there is disorganisation of BG fibres, the
migratory scaffold which granule cells use to migrate to the IGL, at P7 and P35, as well as a 10%
decrease in their linear density at P35 (McDougall et al., 2017). There is currently no treatment for
IUGR-induced cerebellar injury, however given that TH is important for brain development (Bernal,
2007, Escobar et al., 2004), including cerebellar development (Koibuchi, 2008), TH based treatments
should be explored.
In the cerebellum, TH is fundamental for the formation of synapses between cerebellar neurons,
proliferation and migration of cells and branching of Purkinje cell’s dendritic arbours (Nicholson and
Altman, 1972b, Nicholson and Altman, 1972a, Clos et al., 1980, Legrand, 1967). In the IUGR human
(Chan et al., 2014) and rat (Azhan, A., PhD thesis, Monash University, 2019) brain the exclusive TH
transporter MCT8 is reduced, and this may lead to impaired TH signalling and affected myelination
as discussed in Chapter 3. Indeed, myelination is also reduced in the cerebellum, due to disrupted
maturation of oligodendrocytes at the pre-myelinating stage (Clos et al., 1980, Tolcos et al., 2011).
Therefore with reduced MCT8 in the IUGR brain (Aarum et al., 2003, Azhan, 2019, Chan et al.,
2014), treatment with conventional TH may be ineffective. TH analogues such as DITPA could
therefore be a potential therapies to improve myelination as in the IUGR brain, as DITPA does not
require MCT8 for cellular uptake.

Chapter 4
82
DITPA readily enter brain cells in MCT8 knockout mice, and subsequently correct cerebral
hypothyroidism (Di Cosmo et al., 2009). A previous study by our group found that DITPA
(0.5mg/100g; i.p.) administered from P1 to P6 in IUGR rat pups, a timeframe equivalent the brain
development of an IUGR infant born preterm, promoted myelin recovery, detectable by day 7 in the
external capsule (Azhan, A., unpublished thesis, 2019). Although promising, this data only provides
evidence of the impact of short-term DITPA treatment, and is limited to only examining cortical WM.
It is important to determine whether DITPA can be used as a therapy for the IUGR brain overall, not
just the cerebral WM and GM. Therefore this Chapter specifically aimed to examine the impact of
DITPA treatment on the IUGR cerebellum. In contrast to our previous short-term DITPA study
(Azhan, A., unpublished thesis, 2019), my experimental protocol uses a longer-term treatment
timeframe (DITPA administered from P1 – P13), which is equivalent in human brain development in
a preterm IUGR baby receiving DITPA until term equivalent age.
Therefore this study aimed to: determine whether DITPA administered from P1 to P13 in IUGR
rats (i) impacts cerebellar growth and morphology, (ii) promotes OL maturation, and restore
myelination, and (iii) does not cause cerebellar injury or inflammation. The hypothesis was that
DITPA administration from P1 to 13 will promote and restore OL maturation and myelination within
the cerebellum of IUGR rat pups when assessed at P14, without causing injury or inflammation. This
study will generate complementary information to our previous short-term DITPA administration
study (Azhan, A., unpublished thesis, 2019) and will inform clinical translation of therapy.

Chapter 4
83
4.3 Methodology
4.3.1 Animals and tissue
The methodology in this Chapter will commence from the point of paraffin tissue sectioning, and will
focus on the cerebellum. For comprehensive methodology regarding animal welfare, species, surgical
procedure, drug treatment, post-mortem and tissue collection, please refer to Chapter 2 (Sections 2.1
to 2.8).
4.3.2 Paraffin sectioning of the cerebellum
Paraffin embedded P14 rat cerebellums were sectioned sagittally at 8µm using a rotary microtome
(Jung Biocut 2035, Geprufte Sicherhiet, Germany). A total of 40 sections were cut from each
cerebellum (n= 8 control + saline, n= 7 control + DITPA, n= 8 BUVL + saline, n= 8 BUVL + DITPA;
1,240 sections in total) and sections were placed in a warm water bath (~ 40°C) prior to being mounted
flat onto slides (Superfrost plus +, Menzel Glaser, Germany). Two sections per animal were placed
onto slides and each section was separated by 80µm (8µm x 10; Figure 4.2 A). All tissue-mounted
slides were dried overnight at 30°C prior to histological and immunohistochemical staining.
4.3.3 Assessment of the cerebellar structure
H&E staining was performed using a standard procedure (Chapter 2 section 2.9.1). H&E stained
sections (2 slides/animal = 4 sections/animal; 124 sections total) were digitally scanned using
Olympus slide scanning software at 20x magnification, and using a constant light setting (Olympus
VS120-S5 scanner, Olympus, Vic, Australia); the digital images were visualised using Fiji (ImageJ,
Version 2.0, National Institute of Health, Maryland, USA). The area (mm2) of the IGL (containing
predominantly post-mitotic granule cells), ML (containing Purkinje cell dendrites and parallel fibres
from granule cells), GM (containing nerve cell bodies, dendrites and axon terminals) and the WM
(containing myelinated and unmyelinated afferent and efferent fibres) as well as the total cerebellar
cross-sectional area was traced using the Fiji trace function (Figure 4.1). Areas of the ML, IGL, GM
and WM were expressed as a ratio of the total cerebellar cross-sectional area for each section, and
means calculated per animal and per group.

Chapter 4
84
The width of the ML was assessed at P14 using x20 magnification. The Fiji software ‘line’ tool and
‘measure’ function were used to measure the width of the ML (µm) in 20 random places in each of
the early and late developing lobules (X and VIII; 20 measurements/lobule). The average width of all
of the ML measurements was averaged per lobule, per section and per animal. Differences in
cerebellar ML width following IUGR would be indicative of disturbance in normal development and
signalling, as the ML contains the dendritic trees of Purkinje cells, as well as a large population of
interneurons.
4.3.4 Immunohistochemical staining of the cerebellum
Immunohistochemistry was performed using the standard protocol outlined in Chapter 2 (Section
2.10). A number of trials were performed for each antibody to ensure optimal staining quality prior
to conducting the procedure on the actual tissue. For a full outline of final conditions used for each
immunostain performed in the cerebellum, please refer to Table 4.1. To avoid procedural variation,
and ensure uniform conditions for subsequent analysis, sections from all experimental groups were
stained simultaneously for each antibody/procedure. Sections were counterstained with
Haematoxylin, with the exception of MBP and GFAP. In addition, positive controls (foetal sheep
cerebellum) and negative controls (omission of primary antibody) were performed for each antibody.
Figure 4. 1 H&E stained sagittal section of P14 rat cerebellum at the level of the vermis. The total cross-
sectional area of the cerebellum (yellow trace), molecular layer (ML; between yellow and green trace),
internal granular layer (between green and blue trace), white matter (blue trace) and grey matter (area of ML
+ area of internal granular layer) were traced and measured. ML width measurements were conducted in
early (I or X) and late developing lobules (VII or VIII). Scale bar = 1mm.

Chapter 4
85
4.3.5 Immunohistochemical analysis of the cerebellum
Prior to quantitative assessment, an independent researcher coded sections, to ensure that analyses
were performed blinded to experimental group. Analyses were conducted on 4 sections per animal,
using Fiji software (as for H&E analysis, Section 4.3.3). Sections were separated by 80m, and 2
slides per animal were used for each stain (see figure 4.2 for cutting and staining progression).
Measurements were made in both an early (I or X) and a late developing lobule (VII or VIII) for each
analysis. The lobules were selected to assess the full developmental range of the cerebellum.
Measurements were averaged per lobule for the section, and per animal (average of 4 sections/animal)
and unless there were differences between early and late developing lobules, data were combined and
averaged and presented as simply ‘lobules’.
Figure 4. 2 Sequence of tissue sectioning and staining (A) A total of 40 sections were cut from each tissue
block; 8µm apart. (B) 2 slides, and hence 4 sections per animal were used for each immunostain (control +
saline n= 8, IUGR + saline = 8, control + DITPA = 7, IUGR + DITPA = 8; total 31 animals; 2 slides/ animal
= 62 slides for each stain). GFAP = glial fibrillary acidic protein, H&E = Haemotoxylin & Eosin, IBA1 =
Ionised calcium binding adaptor molecule – 1, MBP = myelin basic protein, Olig2 = oligodendrocyte
transcription factor 2.

Chapter 4
86
4.3.5.1 Myelin basic protein (MBP)-immunoreactivity (IR)
Areal coverage (% AC) of MBP-IR fibres was assessed in the lobular and deep WM (DWM) of each
section. Four images were taken from the DWM (200 x 200m = 20,000m2), and three images were
taken from the lobular WM (100 x 100m = 10,000m2) at 20x magnification using Photoshop
software ‘set measurement’ square crop tool (Photoshop CC, v 19.0, Adobe Systems Incorporated).
Fiji threshold analysis (ImageJ, Version 2.0, National Institute of Health, Maryland, USA) was
carried out on each image, using a constant threshold for all tissue. Data were averaged per region
(DWM or lobule), per section, and then per animal. Threshold analysis measures differences in
staining intensity, and a threshold of 150 (reflecting dark staining) was used to determine the
proportion (%) of WM or DWM occupied by MBP-IR. If there were no differences in % AC between
early and late developing lobules, they were averaged and presented combined as ‘lobules’.
4.3.5.2 Oligodendrocyte transcription factor 2 (Olig2)–IR
Analysis of Olig2-IR cells in the DWM and lobular WM of each section was performed using the
Adobe Photoshop Software to extract regions of interest (ROIs) using the same dimensions and
protocol as described in Section 4.3.5.1 for MBP-IR; Fiji software (ImageJ, Version 2.0, National
Institute of Health, Maryland, USA) was used to count positively stained cell bodies. Olig2-IR cells
were counted in four 200 x 200 µm ROIs (field size = 20,000 µm2) positioned randomly in the DWM
of each section and three ROIs positioned in each of the early and late developing lobules (100 x 100
µm; field size = 10,000 µm2) (Figure 4.3). Olig2-IR cells were identified as having a defined cell
body with obvious dark staining. The average number of Olig2-IR cells in each ROI was counted and
divided by the ROI area to give an areal density of Olig2-IR OLs (cells/mm2). A mean density was
calculated for the DWM and lobular WM of each section and then per animal. If there were no
differences in cell density between early and late developing lobules, they were averaged and
presented combined as ‘lobules’.

Chapter 4
87
4.3.5.3 Ionized calcium-binding adaptor molecule 1 (Iba1) – IR
Areal density (cells/mm2) of Iba1-IR microglia was assessed in the cerebellar DWM and in the lobule
WM (early or late developing lobules), using the same methodology described for Olig2-IR OL
analysis (Section 4.3.5.2).
4.3.5.4 Glial fibrillary acidic protein (GFAP) - IR
Analysis of the % AC of GFAP- IR fibres was carried out in fields of view within the cerebellar
DWM and lobular WM (early or late developing lobules), in the same way as was described for MBP-
IR, with the exception of a different staining threshold (Section 4.3.5.1). Qualitative analyses of
differences in BG morphology, as well as an assessment of the linear density of BG fibres (fibres/mm)
were carried out in each of the early and late developing lobules per tissue section. Using the Fiji line
measure tool (ImageJ, Version 2.0, and USA), 10x 100µm horizontal lines were positioned randomly
in the middle of the ML of each lobule at 20x magnification, so as to intersect the BG fibres. The
number of fibres crossing each line was counted and divided by the length of the line and the average
Figure 4.3 Olig2-immunostained sagittal section of P14 rat cerebellum at the level of the vermis
(counterstained with Haematoxylin). Quantitative analysis of Olig2-IR cells (arrow in inset) was performed
in the cerebellar white matter, with four regions of interest (ROIs) randomly positioned in the deep white matter
(DWM), and three ROIs placed in the WM of an early developing lobule (Lobule I) and a late developing
lobule (Lobule VIII). Scale bar = 1mm. 20x = 20 x magnification.

Chapter 4
88
number of counts was calculated per lobule. If there were no differences in linear density of BG
between early and late developing lobules, these were averaged and presented combined as ‘lobules’.
4.3.5.5 Calbindin-IR Purkinje cells
Calbindin is a calcium-binding protein, which is specific to Purkinje cells in the cerebellum. Purkinje
cells are the main output cell of the cerebellum and therefore play an important role in cerebellar
function. To observe any alterations in Purkinje cell development, the somal area of 20 calbindin-IR
Purkinje cells were randomly selected from each of the early and late developing lobules, and the
somal area measured using the Fiji trace and measure functions (40 cells/cerebellum section; 4
sections = 160 cells/animal). Only calbindin-IR Purkinje cells with a visible and clearly defined
nucleus were selected, to allow for an accurate measurement of soma circumference. Data was
expressed as average somal area (µm2), and means taken per section and per animal.
Linear density analyses of Purkinje cells were carried out in each of the early and late developing
lobules per section. Using the Fiji line measure tool, 5 x 100µm horizontal lines were positioned in
the middle of the Purkinje cell layer of each lobule at 20x magnification, so as to intersect the cell
somas. The number of cell somas crossing each line was counted, and divided by the line length to
give the number of Purkinje cells/mm. To calculate the areal density of Purkinje cells, the diameter
was taken from each Purkinje cell which intersected the measurement line, and with this, the areal
density of Purkinje cells was calculated by dividing the number of Purkinje cells/mm by the tissue
section thickness (= mean diameter of Purkinje cell + section thickness (8µm) (McDougall et al.,
2017a).
4.3.6 Statistical analysis
All statistical analyses were performed using the Graphpad Prism statistical software (Graphpad
Software, Version 8.0, CA, USA). Prior to analyses, outliers were removed using the Grubb’s test to
determine a significant outlier (p < 0.05). Data were checked for normal distribution, and if found to
be not normally distributed, the appropriate non-parametric test used (Mann-Whitney U test, instead
of unpaired t-test; Friedman test instead of two-way ANOVA). A two-way ANOVA was used, with
a post-hoc pairwise comparison to identify between group differences, and a Bonferroni correction
was used for multiple post-hoc comparisons between experimental groups. Data were considered
significant if p < 0.05. All main effects data are presented in text as ratio of residual variances (F) and
statistical significance (p-value). All post-hoc data are presented as [mean comparative difference
(95% confidence interval); and p-value], and graphs are represented as Mean standard error of the
mean (SEM). Unless there were differences between early and late developing lobules, data will be

Chapter 4
89
presented combined as ‘lobules’. All two-way ANOVA results are tabulated in Appendix 4 as Mean
SEM.

Chapter 4
90
Table 4. 1 Immunohistochemistry - optimised antigen retrieval, blocking protocol and antibody concentrations in the cerebellum.
Abbreviations: Ab, Antibody; APC, adenomatous polyposis coli; BSA, bovine serum albumin; cat, catalogue number; DAB, diaminobenzidine; GFAP, glial fibrillary
acidic protein; H2O2, hydrogen peroxide; Iba1, ionized calcium-binding adaptor molecule 1; M, molar; MBP, myelin basic protein; Olig2, oligodendrocyte transcription
factor 2; PBS, phosphate buffered saline; PLP, myelin proteolipid protein.
Protein Staining for Antigen Retrieval & block 1°Ab (source); conc. 2°Ab (source); conc. Complex binding
to secondary and
DAB
[Complex][DAB
]
MBP Myelin in the
CNS
Heat in 0.01M citrate buffer (pH
6.0) for 9 min, then decreasing
power to maintain simmer for 7
min; 4% BSA in PBS
Rat anti-MBP,
(Millipore cat:
MAB386); 1:250
Biotinylated rabbit anti-
rat,
(Millipore); 1:200
Avidin-biotin
complex
DAB (in stable
peroxide buffer)
50μl A + 50μl B
in 10 ml PBS;
1 DAB tablet in
10ml dH2O +
3μl H2O2
Olig2 Entire OL lineage Heat in 0.01M citrate buffer (pH
6.0) for 9 min, then decreasing
power to maintain simmer for 7
min;
4% BSA in PBS
Rabbit anti-Olig2,
(Millipore cat:
MABN50); 1:500
Biotinylated goat anti-
rabbit,
(Vector cat:
VEBA1000); 1:200
GFAP BG & astrocytes 1:500 Proteinase K in 37°C for 30
min; 4% BSA in PBS
Rabbit anti-GFAP,
(DAKO cat: 0334):
1:500
Biotinylated goat anti-
rabbit,
(Vector cat:
VEBA1000); 1:200
Iba1 Microglia &
macrophages in
CNS
Heat in 0.01M citrate buffer (pH
6.0) for 9 min, then decreasing
power to maintain simmer for 7
min;
4% BSA in PBS
Rabbit anti-Iba-1,
(Wako cat: 019-19741);
1: 1000
Biotinylated goat anti-
rabbit,
(Vector cat:
VEBA1000); 1:200

Chapter 4
91
4.4 Results
4.4.1 Morphology of the cerebellum
There was no qualitative evidence of lesions, infarcts or morphological abnormalities in H&E-stained
cerebellar sections from IUGR or control pups treated with saline or DITPA.
4.4.1.1 Cerebellar layer areas
Two-way ANOVA results showed no interaction between group and treatment on total cerebellar
cross-sectional area (TCA), or area of the ML, IGL, WM or GM (all mm2) (Figure 4.4). There was a
main effect of group on TCA, and area of the ML and IGL (TCA: F1/24 = 10.34, p = 0.0037; ML: F1/21
= 10.23, p = 0.004; IGL: F1/19 = 7.91, p = 0.01), and treatment on area of GM and WM (WM: F1/20 =
7.53, p = 0.01; GM: F1/18 = 3.18, p = 0.09). Post-hoc analysis revealed that there was no difference in
the TCA (Figure 4.4 A), or thicknesses of the ML, IGL, WM or GM (Figure 4.4 B - E) in control
pups compared to IUGR pups, and when treated with DITPA or saline.
Ratios of the cerebellar layer areas to TCA were determined (cerebellar layer area/TCA = %) to adjust
for the effect of confounding variables such as difference in expansion of the tissue in the water bath
(as described in Chapter 3, Section 3.3). Two-way ANOVA results showed no interaction between
group and treatment on ML:TCA, IGL:TCA, WM:TCA or GM:TCA (Figure 4.4 F-I), and no main
effects of group or treatment. Post-hoc analysis revealed no difference in ML:TCA, IGL:TCA,
WM:TCA or GM:TCA (Figure 4.4 F - I) in control pups compared to IUGR pups, treated with DITPA
or saline.

Chapter 4
92
4.4.1.2 Cerebellar molecular layer width
Two-way ANOVA results showed no interaction between group and treatment on width of the ML
(mm) in the cerebellar lobules (F1/50 = 0.68, p = 0.41), however there was a main effect of both group
and treatment on ML width (group: F1/50 = 4.11, p = 0.05; treatment: F1/50 = 4.28, p = 0.042). Post-
hoc analysis revealed that there was no difference in ML width in the cerebellar lobules of control
pups compared to IUGR pups, and when treated with DITPA or saline (Figure 4.5).
Figure 4.4 Total cerebellar cross-sectional-area (A), layer widths (B – E) and layer width-to- total cross-
sectional-area (TCA; F – I) in control and IUGR pups treated with DITPA or saline at P14. Data analysed
using a two-way ANOVA with Bonferroni correction. Values presented as Mean ± SEM. Pup numbers: control
+ saline: n = 8; control + DITPA: n = 7; IUGR + saline: n = 8; IUGR + DITPA: n = 8. All animals are male.
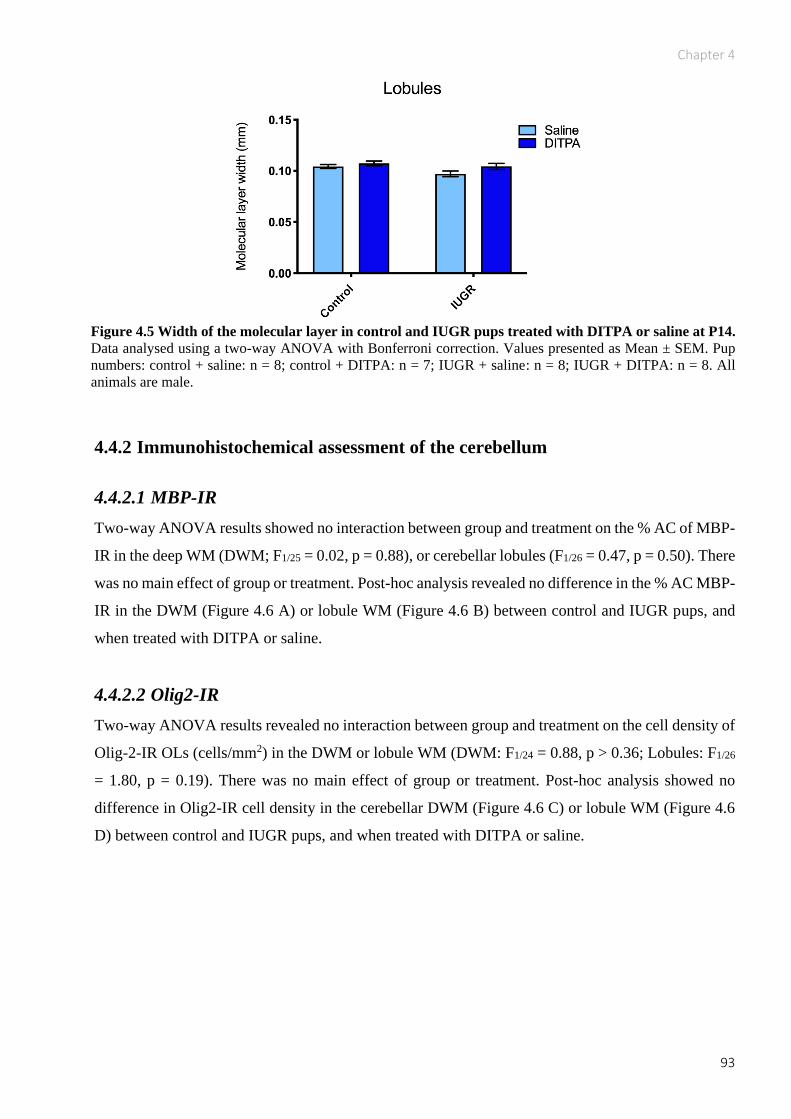
Chapter 4
93
4.4.2 Immunohistochemical assessment of the cerebellum
4.4.2.1 MBP-IR
Two-way ANOVA results showed no interaction between group and treatment on the % AC of MBP-
IR in the deep WM (DWM; F1/25 = 0.02, p = 0.88), or cerebellar lobules (F1/26 = 0.47, p = 0.50). There
was no main effect of group or treatment. Post-hoc analysis revealed no difference in the % AC MBP-
IR in the DWM (Figure 4.6 A) or lobule WM (Figure 4.6 B) between control and IUGR pups, and
when treated with DITPA or saline.
4.4.2.2 Olig2-IR
Two-way ANOVA results revealed no interaction between group and treatment on the cell density of
Olig-2-IR OLs (cells/mm2) in the DWM or lobule WM (DWM: F1/24 = 0.88, p > 0.36; Lobules: F1/26
= 1.80, p = 0.19). There was no main effect of group or treatment. Post-hoc analysis showed no
difference in Olig2-IR cell density in the cerebellar DWM (Figure 4.6 C) or lobule WM (Figure 4.6
D) between control and IUGR pups, and when treated with DITPA or saline.
Figure 4.5 Width of the molecular layer in control and IUGR pups treated with DITPA or saline at P14.
Data analysed using a two-way ANOVA with Bonferroni correction. Values presented as Mean ± SEM. Pup
numbers: control + saline: n = 8; control + DITPA: n = 7; IUGR + saline: n = 8; IUGR + DITPA: n = 8. All
animals are male.

Chapter 4
94
Figure 4.6 Area coverage of MBP-IR in the cerebellar deep white matter (A) and lobule white matter
(B), and density of Olig2-IR oligodendrocytes in the deep white matter (C) and lobule white matter (D)
in control and IUGR pups treated with DITPA or saline at P14. Representative photomicrographs of MBP-
IR in the DWM of a control + saline (E), control + DITPA (F), IUGR + saline (G) and IUGR + DITPA (H)
pup show no difference in the % AC of MBP-IR between groups. Data analysed using a two-way ANOVA
with Bonferroni correction. Values presented as Mean ± SEM. Pup numbers: control + saline: n = 8; control +
DITPA: n = 7; IUGR + saline: n = 8; IUGR + DITPA: n = 8. All animals are male.

Chapter 4
95
4.4.2.3 Iba1-IR
Two-way ANOVA results showed an interaction between group and treatment on the density of Iba1-
IR microglia (cells/mm2) in late developing lobules (F1/24 = 6.91, p = 0.01). There was a main effect
of group on Iba1-IR microglia density in late developing lobules (F1/24 = 4.39, p = 0.05), but not in
the early lobules. Post-hoc analysis showed that there was no difference in density of Iba1-IR
microglia in the DWM (Figure 4.7 A) or lobule WM (Figure 4.7 B, C) of IUGR + pups compared to
control + saline, but there was higher density of Iba1-IR microglia in the late developing lobules of
IUGR + DITPA compared to IUGR + saline pups [551.3 (86.17, 921.7); p = 0.008; Figure 4.7 C],
and in IUGR + DITPA when compared to control + DITPA pups [503.9 (86.2, 921.7); p = 0.01;
Figure 4.7 C].
Figure 4.7 Cell density of Iba1-IR microglia in the cerebellar deep white matter (A) and lobule white
matter (B, C) in control and IUGR pups treated with DITPA or saline at P14. Representative
photomicrographs of Iba1-IR microglia in the WM of a late developing lobule in a control + saline (E),
control + DITPA (F), IUGR + saline (G) and IUGR + DITPA (H) pup shows an increase in Iba1-IR microglial
density in IUGR + DITPA pup compared to IUGR + saline and control + DITPA. Data analysed using a two-
way ANOVA with Bonferroni correction. * p < 0.05, ** p < 0.01. Values presented as Mean ± SEM. Pup
numbers: control + saline: n = 8; control + DITPA: n = 7; IUGR + saline: n = 8; IUGR + DITPA: n = 8. All
animals are male.

Chapter 4
96
4.4.2.4 GFAP-IR Bergmann glia (BG)
Two-way ANOVA results showed no interaction between group and treatment on linear density of
BG cells (cells/mm) in early and late developing cerebellar lobules (Early: F1/27 = 6.6, p = 0.016; Late:
F1/27 = 12.13, p = 0.0017). There was a main effect of group on BG linear density in early and late
lobules (early: F1/27 = 27.38, p < 0.0001; late: F1/27 = 61.81, p < 0.0001). Post-hoc analysis revealed
that there was an increased density of BG fibres in IUGR + saline pups compared to control + saline
pups in the late developing lobules [20.16 (1.95, 38.36); p = 0.024; Figure 4.8 B], and there was a
decrease in the density of BG fibres in control + DITPA pups compared to control + saline [-24.08 (-
42.93, -5.24); p = 0.007; Figure 4.8 B], but no difference in early lobules (Figure 4.8 A). There was
an increased density of BG fibres in IUGR + DITPA pups compared to control + DITPA pups in both
the early and late developing lobules [early: -35 (-54.52, -17.00); p < 0.0001; late: -52.21 (-71.06, -
33.36); p < 0.0001; Figure 4.8 A, B].

Chapter 4
97
4.4.2.5 Area coverage of astrocytes
Two-way ANOVA results showed no interaction between group and treatment on the % AC of
GFAP-IR astrocytes in the DWM, or lobule WM (DWM: F1/27 = 0.12, p > 0.73; Lobules: F1/56 = 1.13,
p = 0.29). There was only a main effect of group in the lobules (F1/56 = 9.18, p = 0.04). Post-hoc
analysis showed no difference in the % AC of GFAP-IR astrocytes in the DWM or lobule WM of
IUGR + saline pups compared to control + saline, or between IUGR + DITPA and IUGR + saline
pups.
Figure 4.8 Linear density of GFAP-IR Bergmann glia (BG) in the early (A) and late (B) developing
cerebellar lobules in control and IUGR pups treated with DITPA or saline. Representative
photomicrographs of GFAP-IR BG fibres in the ML of a late developing lobule in a control + saline (C), control
+ DITPA (D), IUGR + saline (E) and IUGR + DITPA (F) pup shows an increase in BG linear density in IUGR
+ saline pups compared to control + saline, and decreased linear density in control + DITPA pup compared to
control + saline. Data analysed using a two-way ANOVA with Bonferroni correction. * p < 0.05, ** p < 0.01, **** p < 0.0001. Values presented as Mean ± SEM. Pup numbers: control + saline: n = 8; control + DITPA: n
= 7; IUGR + saline: n = 8; IUGR + DITPA: n = 8. All animals are male.

Chapter 4
98
There was an increase in % AC of GFAP-IR astrocytes in IUGR + DITPA pups compared to control
+ DITPA pups when data from the lobules were combined [-43.98 (-57.07, -30.90); p < 0.0001; Figure
4.9 B], but not when analysed separately (Figure 4.9 C, D).
4.4.2.6 Calbindin-IR
4.4.2.7 Purkinje cell somal area
Two-way ANOVA results showed no interaction between group and treatment on the somal area
(mm2) of calbindin-IR Purkinje cells, in cerebellar lobules (F1/53 = 0.13, p = 0.72), and no main effects
of group or treatment. Post-hoc results showed no difference between calbindin-IR Purkinje cell
somal size between control and IUGR pups, and when treated with DITPA or saline (Figure 4.10 A).
Figure 4.9 Area coverage of GFAP-IR astrocytes in the cerebellar deep white matter (A), early and late
lobule white matter combined (B), as well as early lobules (C) and late lobules (D) separately, in control
and IUGR pups treated with DITPA or saline at P14. Data analysed using a two-way ANOVA with
Bonferroni correction. * p < 0.05. Values presented as Mean ± SEM. Pup numbers: control + saline: n = 8;
control + DITPA: n = 7; IUGR + saline: n = 8; IUGR + DITPA: n = 8. All animals are male.

Chapter 4
99
4.4.2.8 Purkinje cell areal density
Two-way ANOVA results showed no interaction between group and treatment on Purkinje cell areal
density (cells/mm2) in the cerebellar lobules (F1, 25 = 0.041, p = 0.84). There was a main effect of
treatment on areal density of Purkinje cells in the early developing lobules (F1, 27 = 9.43, p = 0.005).
Post-hoc analysis showed that there was no difference in calbindin-IR Purkinje cell areal density
between control and IUGR pups, and when treated with DITPA or saline (Figure 4.9 B).
4.4.2.9 Purkinje cell linear density
Two-way ANOVA results showed no interaction between group and treatment on linear density of
Purkinje cells (cells/mm) in cerebellar lobules at P14 (F1/25 = 0.02, p = 0.88). There was a main effect
of treatment on linear density of Purkinje cells in the early developing lobules (F1/27 = 25.29, p <
0.001). Post-hoc analysis showed an increase in the linear density of Purkinje cells in the early
developing lobules of IUGR + DITPA pups compared to IUGR + saline [9.062 (2.13, 16.00); p =
0.006; Figure 4.10 D], and in control + DITPA pups compared to control + saline. There was no
difference between IUGR + saline pups and control + saline [8.57 (1.39, 15.75); p = 0.01; Figure 4.10
D].
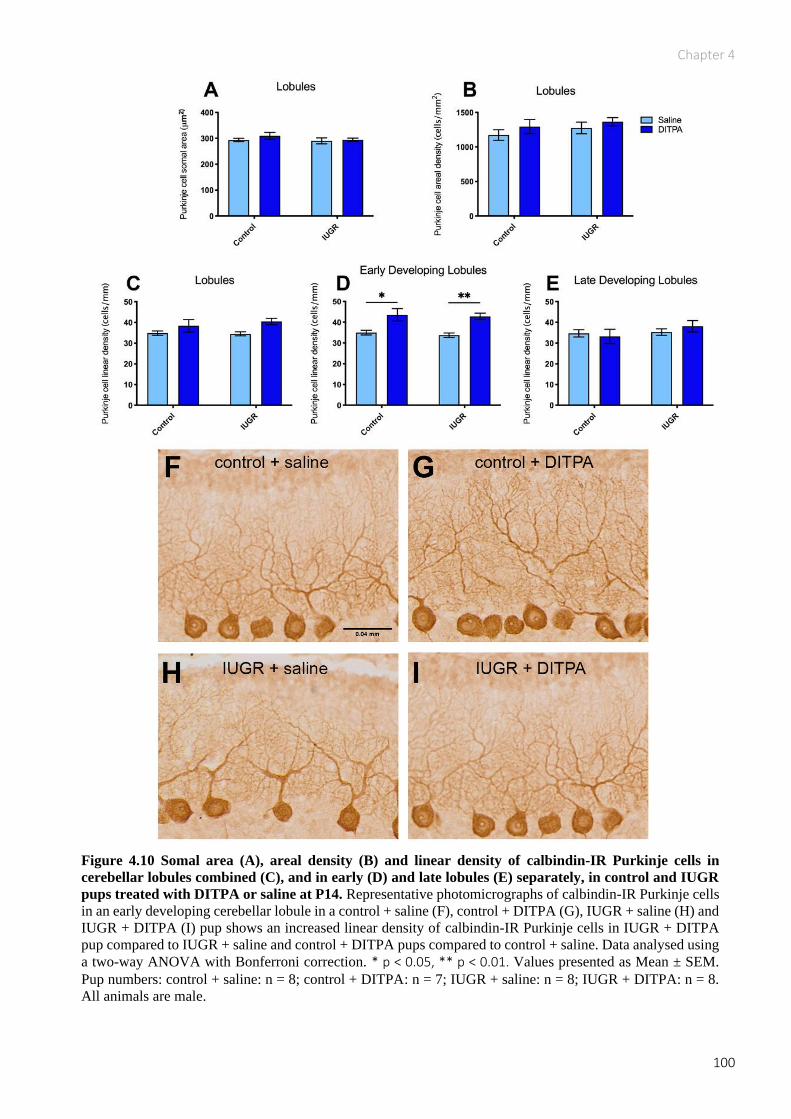
Chapter 4
100
Figure 4.10 Somal area (A), areal density (B) and linear density of calbindin-IR Purkinje cells in
cerebellar lobules combined (C), and in early (D) and late lobules (E) separately, in control and IUGR
pups treated with DITPA or saline at P14. Representative photomicrographs of calbindin-IR Purkinje cells
in an early developing cerebellar lobule in a control + saline (F), control + DITPA (G), IUGR + saline (H) and
IUGR + DITPA (I) pup shows an increased linear density of calbindin-IR Purkinje cells in IUGR + DITPA
pup compared to IUGR + saline and control + DITPA pups compared to control + saline. Data analysed using
a two-way ANOVA with Bonferroni correction. * p < 0.05, ** p < 0.01. Values presented as Mean ± SEM.
Pup numbers: control + saline: n = 8; control + DITPA: n = 7; IUGR + saline: n = 8; IUGR + DITPA: n = 8.
All animals are male.

Chapter 4
101
4.5 Discussion
4.5.1 Overview
This is the first study to examine the neurostructure of the neonatal cerebellum in response to daily,
longer-term DITPA administration (P1 to 13) in an IUGR rodent model. The key findings are:
In all experimental groups there was no difference in the presence of lesions, haemorrhages or infarcts
between IUGR or control pups given DITPA or saline when assessed qualitatively, and no alteration
to total cerebellar cross-sectional area, or cerebellar layer areas.
In IUGR + saline compared to control + saline pups there was significantly (i) increased linear density
of BG fibres (GFAP-IR) in the late developing cerebellar lobules of IUGR pups (VII or VIII;
cells/mm), and (ii) no difference in the % AC of MBP-IR, or GFAP-IR astrocytes, or in the areal
density of Iba1-IR microglia, or Olig2-IR OLs (cells/mm2) in the DWM or WM of the early or late
developing lobules. These results signified that IUGR did not injure the developing cerebellum.
In IUGR + DITPA compared to IUGR + saline pups there was a significant (i) increase in the areal
density of Iba1-IR microglia in the late developing cerebellar lobules, and (ii) linear density of
Purkinje cells (cells/mm) in the ML of early developing cerebellar lobules.
In control + DITPA compared to control + saline pups there was a significant (i) decrease in the linear
density of GFAP-IR BG fibres in the late developing cerebellar lobules, and (ii) an increase in the
linear density of Purkinje cells in the early developing lobules.
4.5.2 Effect of daily DITPA administration on cerebellar structure
The presence of IUGR did not alter cerebellar morphology, or result in overt injury (lesions,
haemorrhages or infarcts) when assessed qualitatively using H&E staining. There was also no
difference in somal area (mm2), linear density (cells/mm) or areal density (cells/mm2) of Purkinje
cells in IUGR + saline pups compared to control + saline pups. A previous study in IUGR guinea pigs
found that somal area of Purkinje cells was reduced at 60 dg (Tolcos et al., 2018), however differences
in results between this study and the current study are likely due to differences in species used and
therefore the timing of IUGR onset.
WM volumes in the cerebellum of IUGR children assessed clinically using MRI at 1 year of age
(Batalle et al., 2012, Padilla et al., 2011) and at 4 to 7 years of age (De Bie et al., 2011). Although
these findings differ to the findings in the present study it is important to note that these clinical
findings were made at much later developmental time points than the current study, and with
unknown timing of IUGR onset. In animal models, the effect of IUGR on cerebellar morphology
varies between species, and also with timing of both IUGR onset (mid- vs. late gestation), and age of

Chapter 4
102
analysis (foetal vs. postnatal). The results of the present study are consistent with those of McDougall
and colleagues (McDougall et al., 2017b) who showed no difference in area of the IGL at P7, or the
TCA and areas of the ML, IGL, WM, and ratio of these layers to TCA at P35 in the IUGR rat induced
via late gestation BUVL. The findings of present study are also consistent with those of Tolcos and
colleagues (Tolcos et al., 2018) who showed no difference to TCA or area of the IGL in IUGR
compared to control pups using a guinea pig model of IUGR (unilateral uterine vessel ligation at mid-
gestation). In contrast to the present study, there is a decrease in IGL area in IUGR guinea pigs at 60
dg, and at 1 week postnatal age, along with decreased volume of WM and the ML (Tolcos et al.,
2018); (Mallard et al., 2000).
4.5.3 Effect of daily DITPA administration on white matter development
MBP labels mature myelinated fibres within the brain, while Olig2 labels the whole OL cell lineage;
together, these stains were used to determine the overall effect of DITPA treatment on cerebellar
WM. There was no difference in area coverage of MBP-IR, or Olig2-IR OL density in the cerebella
of IUGR + saline pups compared to control + saline pups. These results are supported by the lack of
difference in total cerebellar WM area in IUGR pups compared to controls (both given saline), when
assessed using H&E (Section 4.3.3). This was a surprising finding, given it is widely reported in
rodent models that IUGR reduces both myelin and OL density in the brain (Tolcos et al., 2011, Reid
et al., 2012, Olivier et al., 2007, Olivier et al., 2005). These previous studies however, were
predominantly conducted in cortical WM, and differences between the cortex and cerebellum must
therefore be taken into account when comparing data. In the foetal guinea pig cerebellum area
coverage of MBP-IR is reduced and area density of Olig2-IR OLs is increased, however both
normalised to control levels by 1 week postnatal age (Tolcos et al., 2011). This raises the question of
whether any differences in myelination in the cerebellum were ‘corrected’ by P14 in the present study.
It is still not clear why a reduction in the % AC of MBP-IR was not seen in the cerebella of IUGR
pups in the present study at P14, however the stress of daily handling and injecting of pups (with
either saline or DITPA) for an extended period of time impacts myelination in control and IUGR pups
alike. As previously discussed (Chapter 3, Section 3.8.2), cortisol is released during a stress response
and this delays myelination of major WM tracts in the brain (Bohn and Friedrich, 1982, Antonow-
Schlorke et al., 2009, Shields et al., 2012). In the present study pups underwent daily physical
handling (e.g. weighing, marking), as well as the physical and psychological stress of intraperitoneal
injections. The surviving OLs in the cerebella of IUGR pups may be more resilient to the effects of
cortisol than controls, having developed under the stress of IUGR conditions (Back et al., 2002, Back
et al., 2001). As discussed previously in Chapter 3, if this were the case, myelination would more

Chapter 4
103
greatly impaired in control pups compared to IUGR pups in response to stress, thus lowering MBP-
IR to equal that seen in IUGR pups. Future studies should aim to investigate the density and re-
myelinating potential of OLs in the IUGR cerebellum, with and without exposure to daily handling
and compare this to OLs in the non-IUGR rat brain in order to answer this question.
DITPA treatment did not alter MBP-IR levels in the cerebellar DWM, or WM of the early (I or X) or
late (VII or VIII) developing lobules. Currently no clinical or preclinical studies to date have
examined the effects of DITPA treatment on the cerebellum, however DITPA given daily from P1 to
P6 had a restorative effect on myelin in the IUGR rat cerebrum at P7 (Azhan, A., unpublished thesis),
and therefore a similar pro-myelinating effect was expected in the cerebellum. The lack of difference
in MBP-IR coverage in the cerebellum between control and IUGR rats in the present study hinders a
valid assessment of DITPA’s effects on the cerebellar WM. The extended duration of DITPA
administration in the present study (P1 to P13) compared to our group’s previous study (P1 – P6)
appears to be less effective at promoting myelination in IUGR, perhaps due to the stress associated
with an extended injecting regimen. It is impossible to completely eliminate handling stress in pups,
however an alternate route of DITPA administration should be investigated, including oral
administration and nanoemulsions (Anton et al., 2008, Comfort et al., 2015) in order to minimise a
possible stress response to enable correct assessment of DITPA’s effects on myelination.
4.5.4 Effect of DITPA administration on inflammation in the cerebellum.
4.5.4.1 Microglia
IUGR did not affect the density of microglia (Iba1-IR) in the cerebellar DWM or lobular WM. DITPA
administration, on the other hand significantly increased the density of Iba1-IR microglia in the late
developing cerebellar lobules of IUGR pups compared to saline, but not in the early developing
lobules or DWM. Microglial activation in the CNS is typically indicative of an inflammatory response
but are also important for normal brain development (Harry, 2012). Reactive (amoeboid) microglia
are characterised by retracted processes and are classically associated with an inflammatory response
to infection or injury (Graeber et al., 2011), while ramified (resting) microglia are characterised by
long extended processes, and are crucial for neuronal health, as well as clearing dead cells, and even
pruning and remodelling neuronal processes in the foetal brain (Schafer et al., 2012, Walker et al.,
2014). In the present study the thickness of tissue sections (8µm), prevented the definitive
determination of reactive (amoeboid) versus resting (ramified) microglia, as microglial processes
extend in all directions over many microns. Without knowing the state of the microglia in the late
cerebellar lobules, there is insufficient information to comment on the nature of the increase in

Chapter 4
104
microglial density observed in response to DITPA in the present study. Future studies that observe a
microglial response to DITPA, should therefore investigate microglial morphology using thicker
tissue sections to image the full depth of the section.
There is limited literature surrounding differential vulnerability of cerebellar lobules, however one
study showed that late developing cerebellar lobules in the 10 day old rat (especially VI – VIII) appear
to be most sensitive to chemotherapy (injections of Cisplatin), as cellular differentiation is still
occurring (Pisu et al., 2003) raising the question of whether late developing cerebellar lobules are
more vulnerable to drug treatment compared to early lobules. Future studies should aim to more
closely investigate the differences in reactivity between cerebellar lobules in the presence of DITPA
treatment.
4.5.4.2 Bergmann glial fibres
The ML of the cerebellum contains BG fibres as well as dendritic arbours of Purkinje cells. BG fibres
act as a scaffold along which granule cells migrate from their outer proliferative zone in the EGL to
their final destination in the IGL. Quantitative analysis of GFAP-IR in the ML showed that the linear
density of BG was significantly increased in the late developing cerebellar lobules of IUGR + saline
pups compared to control + saline pups at P14, but not in the early developing lobules. This finding
is somewhat different to a previous study that reported a 10% decrease in linear density of BG in the
cerebellum of IUGR rats at P7 and P35 (McDougall et al., 2017b). DITPA administration had no
effect when given to IUGR pups, but did reduce BG linear density in the late developing cerebellar
lobules when given to control pups compared to saline. Given that BG fibres are a target of TH during
cerebellar maturation (Fauquier et al., 2014), this result could be the effect of DITPA (or excess TH)
being administered in an otherwise functioning system. Fewer BG fibres may indicate disruption to
neuronal migration in the cerebellum. It is not clear why this reduction was only seen in late
developing lobules of control pups and requires further investigation.
4.5.4.3 Astrocytes
Astrogliosis occurs when astrocytes increase in size (hypertrophy) and number (hyperplasia), and is
a response of the brain to injuries. In the present study IUGR alone did not affect areal coverage of
GFAP-IR astrocytes in the DWM or WM of the lobules. In foetal and neonatal rat, guinea pig and
ovine models, astrocyte hypertrophy and hyperplasia occurs in the IUGR brain, compared to controls
(Nitsos and Rees, 1990, Olivier et al., 2007, Tolcos et al., 2011, Rees et al., 1998), however these
studies did not focus on the cerebellum. DITPA treatment, compared to saline had no effect on
astrocyte areal coverage in the DWM or WM of the lobules of control or IUGR pups. However when

Chapter 4
105
data from lobules were combined there was a significant increase in the areal density of astrocytes in
IUGR + DITPA compared to control pups + DITPA pups, indicating that in the presence of DITPA,
IUGR is playing a role in elevating astrocyte numbers in the cerebellar lobules. Astrocytes treated
with TH (T3) secrete growth factors which amplify neuronal proliferation (Martinez and Gomes,
2005), therefore it would be of interest to investigate whether treatment with TH analogue DITPA in
combination with the effects of IUGR is causing a similar response. Future studies should investigate
the levels of growth factors in the cerebellum following DITPA administration, as well as
proliferation of neuronal populations, such as granule cells in the EGL.
4.5.5 DITPA increased Purkinje cell linear density in early developing cerebellar
lobules.
Purkinje cells are the primary output neuron of the cerebellum and aid in the coordination of sensory
input and motor control. In the present study Purkinje cell somal area, linear density, or areal density
was not affected in IUGR rats at P14. This was an unexpected result, as Purkinje cell numbers are
reduced in the cerebellum of foetal IUGR guinea pigs and this result persists to 1 week of age (Mallard
et al., 2000). The conflicting results between studies are likely due to the different gestation lengths
of species used, and therefore the different duration of placental insuffuceny induced via vessel
ligation. In the present study DITPA treatment significantly increased the linear density of Purkinje
cells (cells/mm) in the early developing lobules, irrespective of group (i.e. in both control and IUGR
pups). Purkinje cells undergo a period of natural cell death during normal cerebellar development
(Fan et al., 2001), an important process that regulates the final cell number (Baader et al., 1996, Vogel
and Herrup, 1993, Wetts and Herrup, 1982, Zanjani et al., 1996). Although not known in the rat, in
the mouse cerebellum, which has a similar growth trajectory, this occurs between P1 to P5 (Ghoumari
et al., 2000). Therefore it is possible that DITPA prevents natural cell death of Purkinje cells in early
developing cerebellar lobules, thus resulting in an increased density. It is unclear why this result was
only seen in the early developing lobules, or what the functional outcomes of this change would be.
Due to the design of this study, behavioural testing at P14 was not possible, however it would be
relevant for future studies to examine the effect of DITPA administration motor control and
coordination at a later time-point.
4.5.6 Limitations of the study
This study found that myelination, when assessed by analysing area of coverage of MBP-IR, was not
different in IUGR compared to control pups at P14. This was a surprising result, and it was thought
that a stress response might be at play. As discussed in Chapter 3 (Section 3.8.4) a limitation of this
study is the absence of absolute control groups, i.e. control and IUGR pups without intervention (daily

Chapter 4
106
handling, weighing, injecting) that would help elucidate the effects of IUGR vs. control without the
potential confounding variable of stress. Another limitation of this study is that only males were
assessed. This was so that the outcomes of the present study using longer-term DITPA treatment
could be compared to those of the IUGR study using short-term DITPA. However it should be
acknowledged that it is important to examine the effects of both IUGR and DITPA in both sexes; the
cerebellum of female rats from all experimental groups was also collected and these will be studied
at a later point in time.
4.5.7 Conclusion
The present study showed that DITPA administration in both IUGR and control pups did not affect
overall cerebellar morphology at P14. However DITPA administration decreased linear density of
BG fibres in the late developing cerebellar lobules of control pups, increased linear density of
Purkinje cells in early developing cerebellar lobules in both control and IUGR pups, and resulted in
microgliosis in the late developing lobules of IUGR pups. This study showed that the presence of
IUGR did not cause injury in the developing cerebellum, and importantly the rat cerebellar WM was
not affected at P14. This finding may serve for interspecies comparisons in order to elucidate
pathways of injury and resistance against IUGR. This study also showed that DITPA administration
from P1-P14 provided unfavourable effects in control animals, however it is useful to determine
whether DITPA administration causes harm to the developing cerebellum in general. The longer-term
neurological consequences of these effects are yet to be determined. Please see thesis Chapter 6
(Section 6.5) for future research directions, including investigating an alternate route of DITPA
administration and behavioural studies.

Chapter 5
107
5 Assessment of neonatal
growth and wellbeing measures
following DITPA therapy in
the IUGR rat.
5.1 Preamble
The overall aim of this thesis is to examine the potential therapeutic benefits of DITPA treatment on
brain development in IUGR. As described in Chapter 3, DITPA treatment in IUGR pups improved
cerebral myelination at P14, evident by elevated MBP-IR staining in the cortical layer VI when
compared to IUGR pups treated with saline. In IUGR pups DITPA did not cause inflammation or
injury, but did reduce area coverage of PLP-IR in some of the regions examined and reduced MBP-
IR of cortical processes, perhaps due to altered transport of MBP into the processes. In the cerebellum
(Chapter 4), DITPA administration in IUGR pups did not affect overall cerebellar development at
P14, but did increase linear density of Purkinje cells in the early developing cerebellar lobules. An
increase in the density of microglia was found in the late developing lobules in IUGR + DITPA pups
compared to IUGR + saline. Having established some of the potential impacts of longer-term DITPA
on the IUGR brain, it is essential to determine if DITPA has any negative off-target effects on the
postnatal development of these pups. In this Chapter, body weight, brain weight, body composition
(via DEXA), thyroid function (plasma FT3 and FT4), and plasma liver enzymes (ALT and ALP) as
well as cholesterol were assessed in both males and females at P14.
5.2 Introduction
The IUGR foetus possesses an adaptive mechanism, known as the ‘foetal brain-sparing effect’,
whereby in response to placental insufficiency, there is vasodilatation of the foetal cerebral circulation
to ‘protect’ the brain. However this typically occurs at the expense of other organs like the kidneys
and liver, which remain growth restricted (Miller et al., 2016). Despite this ‘brain-sparing’
phenomenon, IUGR babies still display significant neurodevelopmental sequelae including
behavioural deficits and cognitive impairment, and a relationship has been found between reduced
regional and total brain volumes of IUGR foetuses, neonates, children and adolescents (Padilla et al.,

Chapter 5
108
2014b, Tolsa et al., 2004, Dubois et al., 2008). A number of mechanisms have been attributed to the
brain injury that occurs in IUGR. Of relevance to this thesis, deficits in the cerebral TH transporter
MCT8 have been found in the brain of IUGR neonates compared to their normally grown counterparts
(Chan et al., 2014). TH is an essential regulator of neuronal (Thompson and Potter, 2000) and OL
development in the brain (Lee et al., 2017, Rodriguez-Pena, 1999). In the IUGR brain, reduced
expression of MCT8 transporters likely results in decreased TH signalling to cells, which may lead
to the impaired OL development and reduced myelination as seen clinically (Chan et al., 2014) (see
Chapter 1, Section 1.8 for role of TH in brain development). TH circulates in the blood as T4 and
T3, and an active fraction of these are called ‘free’ (FT3, FT4) and can be measured via blood plasma
assays (see Chapter 1, Section 1.7.1 for TH signalling). FT3 is 5 times more biologically active than
T4, and once inside the cell T4 undergoes a process called deiodination, whereby enzymes known as
iodothyronine deiodinases (Dio1, Dio2, Dio3) (Gereben et al., 2008) remove iodine atoms from T4
(Visser et al., 1988), producing an active T3 state. T3 can then enter the nucleus and bind to nuclear
TH receptors and regulate the expression of specific genes in that cell.
TH signalling in the body relies on a negative feedback mechanism to maintain homeostasis. For
example, if circulating TH levels in the blood become too low, the hypothalamus secretes TRH which
stimulates the pituitary gland to secrete TSH, and this signals the thyroid gland to release more T3
and T4 into the blood stream, thus normalising circulating TH levels. Conversely, if circulating TH
levels are too high, the hypothalamus down regulates TRH secretion, ultimately leading to the thyroid
gland releasing less TH into circulation. If homeostasis is disturbed, this feedback loop compensates
for the disruption (Dietrich et al., 2012). As the TH transporter MCT8 is deficient in the IUGR brain
(Chan et al., 2014), conventional TH therapy will likely be ineffective, and therefore new therapies
must be explored. One such therapy is the TH analogue DITPA, which does not require MCT8 to
enter cells in the brain (Ferrara et al., 2015).
While the clinical safety profile of DITPA has been established in children with MCT8 mutation
(Verge et al., 2012), adults with cardiovascular disease (Goldman et al., 2009, Ladenson et al., 2010),
and in MCT8 knockout mice (Ferrara et al., 2015), it has not yet been established in IUGR neonates.
A previous study by our group examined DITPA treatment from P1 to P6 as a reparative treatment
following IUGR for cerebral hypomyelination (Azhan, A., unpublished thesis, 2019). This study also
assessed off-target effects of DITPA, examining body, brain, liver and kidney weight, as well as body
composition at P7, and found that DITPA did not affect these measures. Reduced levels of MCT8
mRNA were also found in IUGR pups compared to controls at P7, however there were no differences
at P14 (Azhan, A., unpublished thesis, 2019). While DITPA did not result in off-target effects

Chapter 5
109
following short-term treatment (6 days), the impact of longer-term DITPA treatment still needs to be
examined. There is currently no clinical treatment for IUGR, with the only intervention being to
deliver the baby preterm to remove it from the intrauterine environment and the insufficient placenta;
this could occur any time between 24 and 40 weeks GA. Once removed from the unfavourable
intrauterine environment, DITPA therapy would ideally be given to the baby from the time of delivery
until MCT8 levels had normalised. This information is currently unavailable for the IUGR infant,
however in the IUGR rat, MCT8 mRNA levels normalised to control levels by P14 (Azhan, A.,
unpublished thesis, 2019) an age equivalent to brain development in a human baby at term age (~40
weeks GA) (Semple et al., 2013).
This Chapter aimed to investigate the effects of daily DITPA administration from P1 to P13 on
neonatal health and wellbeing, including body and organ weights, body morphometry, body
composition, thyroid function, liver function, and cholesterol levels in IUGR pups at P14. The
hypothesis was that DITPA administration in IUGR rat pups from P1 to P13 would not have a
negative impact on any of these measures of neonatal health and wellbeing.

Chapter 5
110
5.3 Methodology
For comprehensive methodology regarding animal welfare, species, surgical procedure, drug
treatment, post-mortem and tissue collection, please refer to Chapter 2 (Sections 2.2 to 2.8).
5.3.1 Overview of animal work
At day 18 of pregnancy (term = 22 days), rats underwent BUVL (n = 31 dams) or sham surgery (n =
16 dams) to generate IUGR or control pups. DITPA (0.5mg/100g; i.p.) or saline (equivalent volume)
was administered daily from P1 to P13 to IUGR (IUGR + DITPA: n = 14 dams, 67 pups; IUGR +
saline: n = 17 dams, 60 pups) and control (control + DITPA, n = 8 dams, 49 pups; control + saline: n
= 8 dams, 47 pups) pups. Not all BUVL/sham surgeries were successful (i.e. they did not yield IUGR
or control pups) and these were not included in the study (Figure 5.1). Body weight was measured
daily from P1 to P14, and brain weight, body composition (via DEXA), thyroid function (plasma FT3
and FT4), plasma liver enzymes (ALT and ALP) and plasma cholesterol were assessed at P14.
5.3.2 Body and organ weights
Pups were weighed and sexed on P1 to avoid the dam becoming stressed and rejecting pups
immediately after birth (see Chapter 2, Section 2.6.1). Pups were weighed daily (prior to saline or
DITPA treatment) from P1 to P13, and on P14 prior to euthanasia. At P14, pups’ head and hip
circumference as well as crown-to-rump length (dorsal distance from crown of skull to base of spine)
Figure 5. 1 Overview of animals used in Chapter 5. A total of 223 P14 rat pups were used in this study.
This included both male and female control and IUGR pups, treated with DITPA or saline. The number
of dams is shown for each surgery group (sham/BUVL). Not all BUVL/sham surgeries were successful; the
number of successful litters used in experimentation is shown. n = number of animals.

Chapter 5
111
were measured using a measuring tape (mm). All measurements were conducted following euthanasia
to minimise measuring variability caused by movement. Kidney, liver and brain weight (whole, and
dissected into hemispheres, cerebellum, pons, medulla and cervical spinal cord) were recorded for
each pup at post-mortem on P14. Livers from pups that were not perfused were collected and then
frozen in liquid nitrogen and stored at -80°C for later assessment of Dio1 mRNA (see Section 5.3.5).
5.3.3 Analysis of body composition using dual-energy x-ray absorptiometry
(DEXA)
At P14, carcasses (excluding brain, kidney and liver) of pups were frozen at -4°C and transported on
dry ice to the Monash University DEXA body composition and bone density analysis suite (Clayton,
Victoria, Australia). DEXA uses low-energy x-rays from two different sources (improves reliability)
to measure the density and composition of bone, fat and soft tissue. Pups were placed in the supine
position on the ‘tray’ of the DEXA machine and scanned to determine: total bone area, bone mineral
density and composition, lean tissue mass, fat mass and percentage of total body fat. The head of the
animal was excluded from this analysis (Figure 5.2). All readings were recorded as grams per cm2
except for % body fat which was recorded as a proportion (%).
Figure 5. 2 Image of P14 rat taken using dual-energy x-ray absorptiometry (DEXA). Following
euthanasia, bodies of pups were scanned using a DEXA machine. Body composition measures such as total
bone area, bone mineral density and composition, lean tissue mass, fat mass and percentage of total body fat
were analysed. Green circle = the skull, was not included in this analysis; blue trace = outline of the pup’s body;
yellow trace = bone (note: not all the bone is traced in yellow, however the DEXA machine does account for
all bone mass). Image not to scale.
Chapter 5
112
5.3.4 Analysis of blood plasma
At P14, blood was collected from the right ventricle of each pup immediately following euthanasia
using a 26-gauge needle and 1mL syringe, placed into Eppendorf tubes containing heparin (2μL, 5000
IU in 5mL; Pfizer, Australia) to prevent clotting, and kept on ice until they were centrifuged at 22°C
and 2600rpm for 10 minutes (Eppendorf centrifuge 5819 R, Hamburg, Germany) to separate the
blood plasma from the red blood cells and other constituents. Following centrifuging, the plasma
layer was collected using a 1ml syringe (minimum volume required = 300μL), and immediately
frozen at -80°C. These plasma samples were later used in hospital standard plasma assays (Monash
Pathology, Clayton, Victoria, Australia) to assess thyroid function (free T3 and T4), liver enzymes
(ALT and ALP) and cholesterol (protocols in Appendix 6).
5.3.5 Analysis of Dio1 in the Liver
RNA extractions
Ribonucleic Acid (RNA) was extracted from liver samples (control + saline: n= 6; control + DITPA:
n= 6; IUGR + saline: n= 7; IUGR + DITPA: n = 7). Frozen liver samples were dry crushed into a fine
powder using a pestle and mortar, pre-cooled with dry ice and liquid nitrogen. Approximately 20mg
of liver was weighed into pre-chilled 2ml Eppendorf tubes with a stainless-steel bead. RNA was
extracted at room temperature using the PureLink RNA Mini Kit (Invitrogen, MA, USA) as per
manufacturer’s instructions. Briefly, 600μL lysis buffer containing 0.01% β-mercaptoethanol was
added to each sample before homogenising at 50Hz for 2 minutes using the TissueLyser LT (Qiagen,
Hilden, DE). Samples were centrifuged at 12,000g to remove debris and supernatant was transferred
to a fresh tube. One part ethanol was added to each sample and vortexed to combine. Samples were
added to the spin columns provided in the kit and centrifuged at 12,000g for 20 seconds to elute buffer
and bind RNA to the column. The flow-through was discarded, with the process repeated until all
sample was bound. Following this, liver samples were washed with 700μL of Wash Buffer 1 and
centrifuged 12,000g for 20 seconds and flow-through discarded. Samples were then washed twice
with 500μL of Wash Buffer 2, centrifuged at 12,000g for 20 seconds and flow-through discarded;
samples were dried by centrifuging for 2 minutes at 12,000g. Spin columns were then transferred into
1.5mL collection tubes, with 100μL of MilliQ water (Merck Millipore, Darmstadt, DE) and incubated
for 1 minute at room temperature. Samples were then centrifuged at >12,000g to elute RNA. RNase
inhibitor was added to each sample the prevent degradation.

Chapter 5
113
RNA concentrations, purity and quality
RNA concentrations for liver samples were detected using the NanoDrop One spectrophotometer
(Thermo Fisher Scientific, Scoresby, Victoria, Australia). The fibre optic point was calibrated using
2µl of MillliQ water. 2 µl of each sample were then individually read and calculated by the machine.
Nucleic acid concentration (ng/µl), absorbance (260nm) and RNA purity (A260/A280 and A260/A230
ratios) were recorded. RNA was assessed to be of good quality if the RNA concentration was above
100 ng/µl, with the A260/A280 ratio 2, and A260/A230 ratio 2.2. Deviations from these expected
values indicate contamination by proteins, organic compounds or low RNA concentrations. Samples
that gave an indication of contamination via unexpected deviations in these measures were discarded
and the RNA extraction was repeated. Integrity of RNA was assessed via agarose gel electrophoresis.
Briefly, the apparatus was soaked in RNase Away (Invitrogen, MA, USA) for 30 minutes to remove
RNases. Agarose powder (0.3 g) was mixed with 30 ml 1x TAE (Tris-base, acetic acid, 0.5M EDTA
buffer), and the mixture was then heated for approximately 30 seconds (until clear) to make a 1%
agarose gel. SYBR safe (Invitrogen, MA, USA) was added to the gel at 1:10,000 for RNA detection.
The gel was poured into the mould and allowed to set for 30 to 60 minutes. Approximately 5μL of
liver sample was mixed with 1μL of 6x TrackIt Cyan/Orange Loading Buffer (Invitrogen, MA, USA),
and loaded into wells. TrackIt 1 Kb Plus DNA Ladder (Invitrogen, MA, USA) was also loaded to
track RNA banding. The gel underwent electrophoresis at 100 V for 60 minutes, or until the yellow
dye-front reached the end of the gel. The agarose gel was imaged at 530 nm (green light) using the
FluorChem Q (Alpha Innotec GmbH, Kasendorf, Germany). Quality RNA was determined by the
lack of sample smearing through the gel, and the presence of the 18S and 28S bands at a 1:2 ratio
signal intensity.
Reverse transcription of liver samples
Liver samples were reverse transcribed to complementary DNA (cDNA) using the High Capacity
cDNA Reverse Transcription Kit (Applied Biosystems, CA, USA) as per manufacturer’s instructions.
All reagents and samples were kept on ice. One tube contained the sample with reverse transcriptase
to make cDNA (labelled RT+) and one tube contained all of the same reagents, however included
MilliQ water instead of the reverse transcriptase enzyme. This tube (labelled RT-) acted as a control
for DNA contamination of the sample. Briefly, sample RNA and MilliQ was pipetted into RT+ and
RT- tubes to a total amount of 1μg RNA in 10μL. Reaction buffers were created containing 2μL 10X
RT Buffer, 0.8µl 25X dNTP mix, 2µl 10X Random Primers, 1 µl of MultiScribe Reverse
Transcriptase and 4.2µl MilliQ water per sample. The RT-mixture consisted of the same components
except MultiScribe Reverse Transcriptase which was replaced with MilliQ water. 10µl of the reaction
mixture was added to each Eppendorf tube. Samples were gently mixed then spun down before

Chapter 5
114
incubation in a heat-block (Ratek, Boronia, Victoria, Australia). Briefly, RNA strands were denatured
for 10 minutes at 25°C before cDNA synthesis of RNA strands at 37°C for 2 hours. cDNA synthesis
was terminated by incubation for 5 minutes at 85°C. Samples were quenched on ice, before being
stored at -20°C until use. The final concentration obtained for each sample was 50ng/μL.
Real-time PCR (qPCR) for Dio1 using Taqman probes
TaqMan (Applied Biosystems, CA, USA) was used to analyse PCR products for all genes examined.
All liver cDNA samples were diluted to a working concentration of 10ng/μL. Relative expression of
Dio1 was determined via the 2-ΔΔCT method with β2 microglobulin (B2M) used as the housekeeping
gene (See table 5.1 for Assay ID).
Table 5. 1 Gene assay ID’s.
Master mixes containing TaqMan Fast Advanced Master Mix (Applied Biosystems, CA, USA), 1x
TaqMan Gene Expression Assay probes (Dio1 or B2M) and MilliQ water were made for all samples.
All RT+ samples were run in duplicate, with its corresponding RT- sample also run to confirm the
removal of DNA contamination; no-template controls were also run in triplicate on the plate to assess
for contamination of the PCR plate or master mixes. Samples were pipetted into a MicroAmp Optical
384-well plate (Applied Biosystems, CA, USA) at 1μL (10ng/μL), and 9μL of TaqMan master mix
was added to each well. The plate was sealed with MicroAmp Optical Adhesive Film (Applied
Biosystems, CA, USA), gently mixed and centrifuged for 20 seconds at 200g in a Heraeus refrigerated
bench-top multifuge (Heraeus 3XR multifuge, Thermo Fisher Scientific, MA, USA) to combine all
reagents in the bottom of the wells and to remove air bubbles that could affect the reading. Real time
PCR was performed on the QuantStudio Flex Real-Time PCR Systems (Applied Biosystems, CA,
USA) and analysed using the QuantStudio Real-Time PCR Software v1.6.1 (Applied Biosystems,
CA, USA). Plates were placed in the real-time machine and selected for detection of gene of interest.
Cycle threshold (Ct) for detection was manually set for exponential phase, at 1.281 and 0.508
fluorescence for Dio1 and B2M, respectively.
2-ΔΔCT analysis of Dio1 relative expression
The Ct value for the duplicates of each liver sample was averaged. The ΔCt was calculated by
subtracting the B2M average Ct from the Dio1 average Ct. To calculate the ΔΔCt value, the ΔCt of
Gene Species Assay ID Dye
Dio1 Rat Rn00572183_m1 FAM-MGB
B2M Rat Rn07310889_g1 VIC-MGB

Chapter 5
115
the control sample group (control + saline) was subtracted from the sample ΔCt of each sample.
Finally, the relative fold change difference of samples was collected by taking the –ΔΔCt value to the
power of 2 (2-ΔΔCt).
ΔCtsample = CtDio1 – CtB2M
ΔΔCt = ΔCtsample – ΔCtcontrol group
Relative fold change = 2-ΔΔCt
5.3.6 Statistical analysis
All statistical analyses on data in this Chapter were performed using IBM SPSS® (version 25; SPSS
Inc.; IBM Corporation, Armonk, NY, USA), and graphs were created using Graphpad Prism
statistical software (version 8.0, Graphpad Software Inc., La Jolla, CA, USA). Prior to analyses,
outliers were removed using the Grubb’s test to determine a significant outlier (significance = p
<0.05). The data from all pups in every litter were included in this study (See Figure 5.1). It was
necessary to account for variation between litters, when determining the impact of IUGR and DITPA
treatment. A linear mixed model was used to examine the association between treatment (saline or
DITPA) and group (control or IUGR) outcomes, and whether this differed with sex. The main effects
plus three interaction terms (group*sex, group*treatment, group*treatment*sex) were included in the
model as fixed effects, and a random intercept for mother was included to control for correlations
between pups within a litter. Statistical significance was determined using the type III test of fixed
effects for interactions (*). Data was considered significant at p < 0.05. A Bonferroni correction was
used for multiple post-hoc comparisons within group, treatment and sex. All main effects data are
presented as the ratio of residual variances (F) and statistical significance (p-value). All post-hoc data
are presented as [mean comparative difference (95% confidence interval); p-value], and in graphs the
data is shown as Mean SEM except for body measurements and organ weight data which are
presented as Mean standard deviation (SD), as required for IUGR classification.
Supplementary data tabulated in Appendix 5 is shown as Mean SEM or SD for weights and
measurements.

Chapter 5
116
5.4 Results
5.4.1 Body and organ weights
Body weights at P1, P7 and P14
Linear mixed model analysis showed no interactions between group, treatment or sex on body weight
(g) of pups at P1, P7 or P14. There was a main effect of group and treatment on body weight of pups
at P1 (treatment: F1/206 = 4.91, p < 0.0001; group: F1/206 = 406.5, p < 0.0001), an effect of only group
on body weight of pups at P7 (F1/206 = 244.8, p < 0.001), and an effect of both group and treatment at
P14 (treatment: F1/200 = 6.43, p = 0.01; group: F1/200 = 126.3, p < 0.0001).
Post-hoc analysis showed that body weight was reduced in IUGR + saline pups compared to control
+ saline pups at P1 [1.69 (1.43, 1.94) p < 0.0001; Figure 5.3 A], P7 [5.05 (4.21, 5.89) p < 0.0001;
Figure 5.3 D] and P14 (7.03, 5.53 – 8.53, p < 0.0001; Figure 5.3 G). This was also true when males
and females were analysed separately at P1 [male: 1.85 (1.50, 2.20); p < 0.0001; female: 1.53 (1.17,
1.88) ; p < 0.0001; Figure 5.3 B, C], P7 [male: 5.48 (4.30, 6.66); p < 0.0001; female: 4.61 (3.42,
5.80); p < 0.0001; Figure 5.3 E, F] and P14 [male: 7.65 (5.56, 9.75); p < 0.0001; female: 6.37 (4.22,
8.52); p < 0.0001; Figure 5.3 H, I].
Post-hoc analysis also showed increased body weight in control + DITPA pups compared to control
+ saline at P1 in sexes combined [0.33 (0.63, 0.60); p = 0.02; Figure 5.3 A], and in females only when
sexes were analysed separately at P1 [0.57 (0.17, 0.97); p = 0.005; Figure 5.3 C]. Body weight was
reduced in control + DITPA pups compared to control + saline pups in sexes combined at P14 [-2.28
(3.89, -6.61); p = 0.006; Figure 5.3 G], and in males only when sexes were analysed separately at P14
[2.75 (0.55, 4.97); p = 0.02; Figure 5.3 H]. Body weight was reduced in IUGR + DITPA pups
compared to control + DITPA pups at P1, P7 and P14 in sexes combined [P1: -1.95 (-2.21, -1.70); p
< 0.0001; P7: -1.80 (-2.15, -1.46); p < 0.0001; P14: -2.10 (-2.48, -1.73); p < 0.0001], and when sexes
were analysed separately; this was true in both males [P1: -1.80 (-2.15, -1.46); p < 0.0001; P7: -4.09
(-5.25, -2.93), p < 0.0001; P14: -4.79 (-6.88, -2.70); p < 0.0001; Figure 5.3 B,E,H] and females [P1:
-2.10 (-2.48, -1.73); p < 0.0001; P7: -4.87 (-6.13, -3.60); p < 0.0001; P14: -5.64 (-7.89, -3.39); p <
0.0001; Figure 5.3 C,F,I]. There was no difference in body weight between IUGR + DITPA and
IUGR + saline pups at P1, P7 or P14 in sexes combined, or when males and females were analysed
separately (p > 0.05; Figure 5.3 A-I).

Chapter 5
117
See Appendix 5 for Mean ± SD of all body weight data.
Liver and kidney weights at P14
Linear mixed modelling showed no significant interactions between group, treatment, or sex on liver
and kidney (left and right) weight (g) at P14 (Type III, p > 0.053). There was a main effect of group
and treatment on liver weight (treatment: F1/186 = 7.29; group: F1/186 = 64.5, p < 0.0001 both), as well
as the weight of the left kidney (treatment: F1/190 = 5.59, p = 0.02; group: F1/190 = 78.58, p < 0.0001),
and right kidney (treatment: F1/186 = 14.32; group: F1/186 =72.30; p < 0.0001 both), and a main effect
of sex on left kidney weight only (F1/190 = 5.58, p = 0.02) at P14.
Post-hoc analysis showed that liver weight was decreased in IUGR + saline compared to control +
saline pups in sexes combined [0.27 (0.19, 0.35); p < 0.0001; Figure 5.4 A], and this was true for both
Figure 5.3 Body weights (g) at postnatal day 1 (A-C), P7 (D-F), and P14 (G-I) in control and IUGR
pups treated with DITPA or saline. Data analysed using a linear mixed model with Bonferroni correction.
Values are presented as Mean ± SD. g = grams. * p < 0.05, ** p < 0.01, ****p < 0.0001. Pup numbers: control
+ saline: n = 34 male, n = 33 female; control + DITPA: n = 33 male, n = 27 female; IUGR + saline: n = 31
male, n = 18 female; IUGR + DITPA: n = 23 male, n = 24 female.

Chapter 5
118
males and females [males: 0.023 (0.12, 0.35); p < 0.0001; females: 0.31 (0.19, 0.43); p < 0.0001;
Figure 5.4 B, C]. Liver weight was reduced in control + DITPA female pups compared to control +
saline when sexes were analysed separately [0.16 (0.03, 0.30) p = 0.02; Figure 5.4 C] but there was
no difference in males, or when sexes were combined (Figure 5.4 A, B).
Post-hoc multiple comparisons also showed that kidney weight (left and right) was reduced in IUGR
+ saline pups when compared to control + saline pups in sexes combined [left kidney: 0.05 (0.05,
0.06); p < 0.0001; right kidney: 0.04 (0.03, 0.06); p < 0.0001; Figure 5.4 D, G], and this was true for
both males and females [male left kidney: 0.04 (0.02, 0.05); p < 0.0001; female left kidney: 0.05
(0.03, 0.07); p < 0.0001; male right kidney: 0.04 (0.02, 0.05); p < 0.0001; female right kidney: 0.05
(0.03, 0.07); p < 0.0001; Figure 5.4 E, F, H, I].
Left kidney weight was increased in IUGR + DITPA compared to IUGR + saline pups, when sexes
were combined [0.02 (0.002, 0.029); p = 0.023; Figure 5.4 D]. Right kidney weight was increased in
IUGR + DITPA compared to IUGR + saline pups when sexes were combined [0.022 (0.01, 0.03); p
< 0.0001; Figure 5.4 G], and in males and females when assessed separately [male: 0.025 (0.009,
0.042); p = 0.003; female: 0.019 (0.002, 0.03); p = 0.03; Figure 5.4 H, I]. Left and right kidney weight
was reduced in IUGR + DITPA pups compared to control + DITPA pups in sexes combined [left
kidney: -0.042 (-0.06, -0.021); p < 0.0001; right kidney: -0.034 (-0.05, -0.03); p < 0.0001; Figure 5.4
D, G], and this was true for both males and females [male left kidney: -0.045 (-0.06, - 0.03); p <
0.0001; female left kidney: -0.04 (-0.06, - 0.02); p < 0.0001; male right kidney: -0.03 (-0.05, -0.02);
p = 0.001; female right kidney: -0.038 (-0.06, - 0.02); p < 0.0001; Figure 5.4 E,F,H,I].
See Appendix 5 for Mean ± SD of liver and kidney weight data.

Chapter 5
119
5.4.2 Brain weights
Linear mixed modelling showed no interactions between group, treatment or sex on total brain weight
or weight of the cerebral hemispheres, cerebellum, pons, medulla (all in grams) or brain-to-body
weight ratio at P14. There was a main effect of group on total brain weight (F1/131 = 71.23, p < 0.0001)
and weight of the cerebral hemispheres (F1/87 = 30.62, p < 0.0001), cerebellum (F1/168 = 4.23, p =0.04),
pons (F1/164 = 9.67, p = 0.002), medulla (F1/164 = 9.32, p = 0.003) and brain-to-body weight ratio (F1/99
= 42.97, p < 0.0001). There was a main effect of treatment on pons weight (F1/164 = 5.07, p = 0.03)
and brain-to-body weight ratio (F1/190 = 4.50, p = 0.04), and a main effect of sex on total brain weight
only (F1/189 = 13.95, p < 0.0001).
Figure 5.4 Liver (A-C) and kidney (D-I) weights (g) at P14 in male and female control and IUGR pups
treated with DITPA or saline. Data analysed by linear mixed modelling with Bonferroni correction. Values
presented as Mean ± SD. g = grams, * p < 0.05, ** p < 0.01, *** p < 0.001, **** p < 0.0001. Pup numbers:
control + saline: n = 34 male, n = 33 female; control + DITPA: n = 33 male, n = 27 female; IUGR + saline: n
= 31 male, n = 18 female; IUGR + DITPA: n = 23 male, n = 24 female.

Chapter 5
120
Total brain weight at P14
Post-hoc analysis showed that at P14, total brain weight (g) was reduced in IUGR + saline compared
to control + saline pups in sexes combined [0.93 (0.062, 0.124); p < 0.0001; Figure 5.5 A], and this
was true for both males and females when analysed separately [males: 0.01 (0.05, 0.14); p < 0.0001;
females: 0.09 (0.05, 0.13); p < 0.0001; Figure 5.5 B, C]. Total brain weight was reduced in IUGR +
DITPA pups compared to control + DITPA pups in sexes combined [-0.011 (-0.014, -0.07); p <
0.0001; Figure A], and when analysed separately, this was seen in both males and females [males: -
0.12 (-0.16, -0.07); p < 0.0001; females: -0.09 (-0.01, -0.05); p < 0.0001; Figure 5.5 B,C]. DITPA
treatment did not affect total brain weight in IUGR or control pups compared to saline (Figure 5.5 A-
C).
Brain-to-body weight ratio at P14
Post-hoc analysis showed that IUGR + saline pups had an increased brain-to-body weight ratio (g/g)
compared to control + saline pups at P14 [0.006 (0.004, 0.009); p < 0.0001; Figure 5.5 D], and this
was true for both males and females [males: 0.007 (0.004, 0.10); p < 0.0001; females: 0.006 (0.003,
0.008); p < 0.0001; Figure 5.5 E, F]. Brain-to-body weight ratio was increased in control + DITPA
compared to control + saline pups in sexes combined [0.003 (0.001, 0.005); p = 0.01; Figure 5.5 D],
and when analysed separately this was seen in males [0.004 (0.001, 0.007); p = 0.01; Figure 5.5E]
but not females. Brain-to-body weight ratio was increased in IUGR + DITPA pups compared to
control + DITPA pups when sexes were combined [0.0004 (0.002, 0.006); p < 0.0001; Figure 5.5 D],
and in males and females when assessed separately [males: 0.0003 (0.0, 0.006); p = 0.03; females:
0.005 (0.002, 0.008); p = 0.001; Figure 5.5 D, F]. DITPA did not affect brain-to-body weight ratio in
IUGR pups compared to saline administration (Figure 5.5 D-F).

Chapter 5
121
Cerebral hemisphere weight at P14
Post-hoc analysis showed that cerebral hemisphere weight was reduced IUGR + saline compared to
control + saline pups when sexes were combined [-0.09 (-0.14, -0.45); p < 0.0001; Figure 5.6 A] and
when sexes were analysed separately [males: -0.10 (-0.03, -0.16); p = 0.003; females: -0.09 (-0.02, -
0.15); p – 0.007; Figure 5.6 B, C]. Hemisphere weight was reduced in IUGR + DITPA pups compared
to control + DITPA pups when sexes were combined [-0.011 (-0.15, - 0.06); p < 0.0001; Figure 5.6
A], and in males and females separately [males: -0.11 (-0.17, -0.04); p = 0.002; females: -0.11 (-0.17,
- 0.04); p = 0.002; Figure 5.6 B, C]. There was no difference in cerebral hemisphere weight in IUGR
or control pups treated with DITPA compared to saline (Figure 5.6 A); this was also true when males
and females were assessed separately (Figure 5.6 B,C).
Cerebellum weight at P14
Post-hoc analysis revealed that there was no difference in cerebellar weight (g) between IUGR +
saline pups and control + saline pups in sexes combined (Figure 5.6 D), or in males and females when
analysed separately (Figure 5.6 E, F). Cerebellar weight was decreased in IUGR + DITPA pups
compared to control + DITPA pups in sexes combined [-0.02 (-0.03, -0.004); p = 0.012; Figure 5.6
D], but not in males and females when analysed separately (Figure 5.6 E, F). There was no difference
Figure 5.5 Total brain weight (g) (A-C) and brain-to-body weight ratio (D-F) at P14 in male and female
control and IUGR pups treated with DITPA or saline. Data analysed by linear mixed modelling and
Bonferroni correction. Values presented as Mean ± SD. g = grams, * p < 0.05, *** p < 0.001, **** p < 0.0001.
Pup numbers: control + saline: n = 34 male, n = 33 female; control + DITPA: n = 33 male, n = 27 female;
IUGR + saline: n = 31 male, n = 18 female; IUGR + DITPA: n = 23 male, n = 24 female.

Chapter 5
122
in cerebellar weight in IUGR or control pups treated with DITPA or saline, in sexes combined (Figure
5.6 D) or when males and females were assessed separately (Figure 5.6 E, F).
Pons weight at P14
Post-hoc multiple comparisons showed that pons weight (g) was reduced IUGR + saline pups
compared to control + saline pups when sexes were combined [-0.009 (- 0.14, - 0.004); p = 0.001;
Figure 5.6 G] and assessed separately [male: -0.010 (-0.017, -0.002); p = 0.01; female: -0.008 (0.001,
0.015); p = 0.03; Figure 5.6 H, I]. Pons weight was reduced in control + DITPA compared to control
+ saline pups in sexes combined [-0.007 (-0.013, 0.002); p = 0.008; Figure 5.6 G], and in males [0.010
(0.002, 0.01); p = 0.01; Figure 5.6 H] but not females (Figure 5.6 I) when analysed separately.
Medulla weight at P14
Post-hoc multiple comparisons showed that there was no difference in the weight (g) of the medulla
in control + saline compared to IUGR + saline pups at P14 when sexes were combined (Figure 5.6 J)
or assessed separately (Figure 5.6 K, L). The weight of the medulla weight was reduced in IUGR +
DITPA compared to control + DITPA pups when sexes were combined [- 0.006 (-0.002, - 0.011); p
= 0.006; Figure 5.6 J], and in males [-0.008 (- 0.001, -0.014); p = 0.02; Figure 5.6 K], but not females
(Figure 5.6 L) when sexes were analysed separately. There was no difference in medullar weight in
IUGR or control pups treated with DITPA compared to those treated with saline (Figure 5.6 J, K, L).
See Appendix 5 for Mean ± SD of all brain weight data.

Chapter 5
123
5.4.3 Body morphometry
Linear mixed modelling analysis showed no interactions between group, treatment or sex on crown-
to-rump length (CRL), head circumference or hip circumference (Type III, p > 0.05). There was a
main effect of group on CRL (F1/199 = 17.56, p < 0.0001), head circumference (F1/199 = 4.82, p = 0.03)
and hip circumference (F1/198 = 12.91, p < 0.0001), but no main effects of treatment or sex.
Figure 5.6: Weight (g) of the cerebral hemispheres (A-C), cerebellum (D-F), pons (G-I) and medulla (J-
L) in male and female control and IUGR pups at P14 treated with DITPA or saline. Data analysed by
linear mixed modelling and Bonferroni correction. Values presented as Mean ± SD. g = grams, * p < 0.05, **
p < 0.01, *** p < 0.001, **** p < 0.0001. Pup numbers: control + saline: n = 34 male, n = 33 female; control
+ DITPA: n = 33 male, n = 27 female; IUGR + saline: n = 31 male, n = 18 female; IUGR + DITPA: n = 23
male, n = 24 female.

Chapter 5
124
Crown-to-rump-length (CRL) at P14
Post-hoc multiple comparisons showed that at P14 CRL (mm) was decreased in IUGR + saline
compared to control + saline pups when sexes were combined [-7.38 (-11.31, 3.45); p < 0.0001;
Figure 5.7 A] and analysed separately [males: -9.45 (-14.82, - 4.09); p = 0.01; females: -5.30 (-10.58,
-0.021); p = 0.049; Figure 5.7 B, C]. CRL was decreased in IUGR + DITPA pups compared to control
+ DITPA pups in sexes combined [-5.24 (-9.13,-1.35); p= 0.009; Figure 5.7 A], and males only [-
5.29 (-10.48, -0.10); p = 0.046; Figure 5.7 B]. There was no difference in CRL between IUGR or
control pups treated with DITPA compared to those treated with saline (Figure 5.7 A, B, C).
Head circumference at P14
Post-hoc analysis showed that head circumference (mm) was reduced in IUGR + DITPA pups
compared to control + DITPA pups when sexes were combined [-3.44 (-6.02, - 0.87); p = 0.009;
Figure 5.7 D], and in males [-4.13 (-7.60, - 0.66); p = 0.02] but not females (Figure 5.7 F). There was
no difference in head circumference between control + saline and IUGR + saline pups, and this was
true for both males and females (Figure 5.7 D-F). There was no difference in head circumference in
IUGR or control pups treated with DITPA compared to those treated with saline, when sexes were
combined or assessed separately (Figure 5.7 D-F).
Hip circumference at P14
Post-hoc analysis showed that hip circumference (mm) was reduced in IUGR + saline pups compared
to control + saline pups when sexes were combined [- 4.49 (- 7.61, - 1.37); p = 0.005; Figure 5.7 G]
and in males [-7.62 (-11.92, - 3.31); p = 0.001; Figure 5.7 H] but not females (Figure 5.7 I). Hip
circumference was reduced in IUGR + DITPA pups compared to control + DITPA pups in sexes
combined [-3.59 (-6.75, - 0.44); p = 0.026; Figure 5.7 G]. There was no difference in hip
circumference in IUGR or control pups treated with DITPA compared to those treated with saline
(Figure 5.7 G, H, I).
See Appendix 5 for Mean ± SD of body morphometry data.

Chapter 5
125
5.4.4 Body composition (DEXA)
Linear mixed modelling analysis showed no interactions between group, treatment or sex on bone
mineral density (g/cm2), bone mineral content (g), total bone area (cm2), lean tissue mass (g), fat mass
(g) or percentage of total body fat (%)(Type III, p > 0.05). There was an overall effect of group on
bone mineral density (F1/149 = 27.9), mineral content (F1/82 = 42.9), total bone area (F1/156 = 48.5), lean
tissue mass (F1/156 = 62.8), fat mass (F1/156 = 48.5) (p < 0.0001 for all), but not % body fat. There was
a main effect of treatment on bone mineral density only (F1/149 = 4.1, p = 0.006).
Figure 5.7: Crown-to-rump length (A-C), head circumference (D-F), and hip circumference (G-I) (mm)
in male and female control and IUGR pups at P14 treated with DITPA or saline. Data analysed by linear
mixed modelling and Bonferroni correction. Values presented as Mean ± SD. mm = millimetres, * p < 0.05,
** p < 0.01, *** p < 0.001, **** p < 0.0001. Pup numbers: control + saline: n = 34 male, n = 33 female;
control + DITPA: n = 33 male, n = 27 female; IUGR + saline: n = 31 male, n = 18 female; IUGR + DITPA: n
= 23 male, n = 24 female.

Chapter 5
126
Bone mineral density at P14
Post-hoc multiple comparisons showed that bone mineral density (g/cm2) was reduced in IUGR +
saline compared to control + saline pups in sexes combined [-0.003 (-0.06, -0.01); p = 0.005; Figure
5.8 A], and when analysed separately, in males [-0.003 (-0.007, 0); p = 0.002; Figure 5.8 B] but not
females (Figure 5.8 C). Bone mineral density was increased in control + DITPA pups compared to
control + saline pups in sexes combined [-0.003 (-0.005, -0.00009); p = 0.01; Figure 5.8 A] and in
females [0.004 (0.00014, 0.008); p = 0.05; Figure 5.8 C], but not males (Figure 5.8 B). There was no
difference in bone mineral density between IUGR + DITPA pups compared to IUGR + saline pups
(Figure 5.8 A, B, C). Bone mineral density was increased in control + DITPA compared to IUGR +
DITPA pups in sexes combined [0.005 (0.003, 0.0008); p < 0.0001; Figure 5.8 A] and in males and
females when analysed separately [males: 0.004 (0.001, 0.007); p = 0.03; females: 0.07 (0.004,
0.011); p < 0.0001; Figure 5.8 B, C].
Bone mineral content at P14
Post-hoc multiple comparisons revealed that bone mineral content (g) was reduced in control + saline
vs IUGR + saline pups when sexes were combined [-0.10 (-0.15, - 0.06); p < 0.0001; Figure 5.8 D],
and in males and females when analysed separately [males: -0.9 (-0.15, -0.03); p = 0.002; females: -
0.11 (-0.17, -0.05); p = 0.001; Figure 5.8 E, F]. Bone mineral content was decreased in IUGR +
DITPA pups compared to control + DITPA pups in sexes combined [-0.10 (-0.15, -0.06); p < 0.0001;
Figure 5.8 D] and in males and females when analysed separately [-0.08 (-0.14, -0.03); p = 0.005;
females: -0.12 (-0.19, - 0.06); p < 0.0001; Figure 5.8 E, F]. There was no difference in bone mineral
content in IUGR or control pups treated with DITPA compared to those treated with saline (Figure
5.8 D, E, F).
Total bone area at P14
Post-hoc analysis showed that total bone area (cm2) was reduced in IUGR + saline compared to
control + saline pups when sexes were combined [-2.26 (-3.16, -1.36); p < 0.0001; Figure 5.8 G], and
in males and females when analysed separately [males: -2.05 (-3.27, -0.82); p = 0.001; females: -2.47
(-3.79, -1.16); p < 0.0001; Figure 5.8 H, I]. Total bone area was reduced in IUGR + DITPA compared
to control + DITPA pups in sexes combined [-2.26 (-3.17, -1.35); p < 0.0001; Figure 5.8 G], and
males and females when analysed separately [males: -1.69 (-2.88, -0.51); p = 0.005; females: -2.83 (-
4.21, -1.44); p < 0.0001; Figure 5.8 H, I].

Chapter 5
127
Lean tissue mass at P14
Post-hoc analysis revealed that lean tissue mass (g) was reduced in IUGR + saline compared to control
+ saline pups in sexes combined [-4.35 (-5.68, -3.02); p < 0.0001; Figure 5.9 A], and in males and
females when analysed separately [males: -4.28 (-6.11, -2.45); p < 0.0001; females: -4.42 (-6.37, -
2.47); p < 0.0001; Figure 5.9 B, C]. Lean tissue mass was reduced in IUGR + DITPA compared to
control + DITPA pups when sexes were combined [-3.31 (-4.68, -1.95); p < 0.0001; Figure 5.9 A],
and analysed separately [males: -2.63 (-4.4, -0.85); p = 0.004; females: -3.9 (-6.07, -1.93); p < 0.0001;
Figure 5.9 B, C]. Lean tissue mass was not altered in control or IUGR pups when given DITPA
compared to saline (Figure 5.9 A-C).
Figure 5.8 Bone mineral density (A-C), bone mineral content (D-F), and total bone area (G-I) in male
and female control and IUGR pups at P14 treated with DITPA or saline. Data analysed by linear mixed
modelling and Bonferroni correction. Values presented as Mean ± SEM. * p < 0.05, ** p < 0.01, *** p < 0.001,
**** p<0.0001. Pup numbers: control + saline: n = 34 male, n = 33 female; control + DITPA: n = 33 male, n
= 27 female; IUGR + saline: n = 31 male, n = 18 female; IUGR + DITPA: n = 23 male, n = 24 female.

Chapter 5
128
Fat mass and percentage body fat at P14
Post-hoc analysis showed that fat mass (g) was reduced in IUGR + saline compared to control + saline
pups in sexes combined [-2.57 (-3.41, -1.74); p < 0.0001; Figure 5.9 D], and in males and females
when analysed separately [males: -2.61 (-3.74, -1.48); p < 0.0001; females: -2.54 (-3.75, - 1.32); p <
0.0001; Figure 5.9 E, F]. Percentage body fat was also reduced in IUGR + saline compared to control
+ saline pups in sexes combined [-2.39 (-4.67, -0.11); = 0.04; Figure 5.9 G] but not in males and
females when analysed separately (Figure 5.9 H, I). Fat mass was reduced in IUGR + DITPA pups
compared to control + DITPA in sexes combined [-1.61 (-2.45, -0.76); p < 0.0001; Figure 5.9 D] and
in males and females when assessed separately [males: -1.29 (-2.39, -0.19); p = 0.022; females: -1.92
(-3.20, -0.64); p = 0.003; Figure 5.9 E, F]. Fat mass and % body fat was not altered in control or
IUGR pups given DITPA treatment compared to saline (Figure 5.9 D-I).
See Appendix 5 for Mean ± SD of body morphometry data.

Chapter 5
129
5.4.5 Thyroid and liver function
The results of linear mixed modelling analysis showed no interactions between group, treatment, or
sex on circulating FT3, FT4 (both pmol/L), or liver enzymes (ALT, ALP; both IU/L) and cholesterol
(mmol/L) (Type III, p > 0.05). There was a main effect of group on FT4 (F1/123 = 9.9, p = 0.002),
ALT (F1/179 = 12.8, p = 0.001) and ALP (F1/83 = 4.5, 0.04), and an effect of treatment on FT3 (F1/117
=79.1, p < 0.0001), FT4 (F1/123 = 984.2, p < 0.0001), ALT (F1/78 = 7.8, p = 0.007) and ALP (F1/83 =
11.4, p = 0.001). Lastly, there was a main sex effect on FT4 (F1/123 = 9.12, p = 0.003) and ALP (F1/83
= 12.3, p = 0.0001). The human reference ranges for FT3 and FT4 are shown in Table 5.1.
Figure 5.9 Lean tissue mass (A-C), total fat mass (D-F), and percentage (%) body fat (G-I) in male and
female control and IUGR pups at P14 treated with DITPA or saline. Data analysed by linear mixed
modelling and Bonferroni correction. Values presented as Mean ± SEM. * p < 0.05, **, p < 0.001, ****
p<0.0001. Pup numbers: control + saline: n = 34 male, n = 33 female; control + DITPA: n = 33 male, n = 27
female; IUGR + saline: n = 31 male, n = 18 female; IUGR + DITPA: n = 23 male, n = 24 female.

Chapter 5
130
5.4.5.1 Thyroid function
Free triiodothyronine (FT3)
Post-hoc analysis revealed that there was no difference in FT3 levels (pmol/L) between IUGR + saline
and control + saline pups in sexes combined (Figure 5.10 A), and in males and females when analysed
separately (Figure 5.10 B, C). FT3 was increased in IUGR + DITPA compared to IUGR + saline pups
in sexes combined [5.96 (4.13, 7.78); p < 0.0001; Figure 5.10 A], and in males and females analysed
separately [males: 6.36 (3.87, 8.84); p < 0.0001; females: 5.55 (2.86, 8.24); p < 0.0001; Figure 5.10
B, C]. FT3 was also increased in control + DITPA compared to control + saline pups in sexes
combined [7.56 (5.17, 9.95); p < 0.0001; Figure 5.10 A], and in males and females separately [males:
7.73 (4.45, 11.03); p < 0.0001; females: 7.38 (3.90, 10.86); p < 0.0001; Figure 5.10 B, C]. FT3 levels
were reduced in IUGR + DITPA compared to control + DITPA pups in sexes combined [-2.26 (-4.33,
-0.18); p = 0.34; Figure 5.10 A], and in females only [-3.51 (-6.60, - 0.43); p = 0.026; Figure 5.10 C].
Free thyroxine (FT4)
Post-hoc analysis showed that FT4 levels (pmol/L) were reduced in IUGR + saline compared to
control + saline pups in sexes combined [-2.85 (-4.63, -1.07); p = 0.002; Figure 5.10 D], and in
females [-5.45 (-8.05, -2.85); p < 0.0001; Figure 5.10 F] but not males (Figure 5.10 E) when analysed
separately. FT4 was reduced in IUGR + DITPA compared to IUGR + saline in sexes combined [-
18.68 (- 20.22, - 17.13); p < 0.0001; Figure 5.10 D], and in males and females when analysed
separately [males: -18.31 (-20.38, - 16.23); p < 0.0001; females: - 19.04 (-21.33, -16.76); p < 0.0001;
Figure 5.10 E, F]. FT4 was also reduced in control + DITPA compared to control + saline pups in
sexes combined [-20.46 (-22.39, -18.53); p < 0.0001; Figure 5.10 D], and in males and females when
analysed separately [males: -17.74 (-20.35, -15.12); p < 0.0001; females: -23.19 (-26.02, -20.36); p <
0.0001; Figure 5.10 E, F].

Chapter 5
131
Table 5. 2 Clinical reference ranges for plasma levels of free triiodothyronine (FT3) and free thyroxine
(FT4) in infants, children and adults. Reference ranges from Monash Pathology, Clayton, Vic, Australia.
Infant (Newborn) Child (< 18 years) Adult ( > 18 years)
FT3 (pmol/L) 5 – 9.4 4.7 – 4.9 3.2 – 6.1
FT4 (pmol/L) 15.3 – 43.6 8.8 – 17.7 8.0 - 16
pmol/L = picomoles per litre.
5.4.5.2 Liver function
Alanine transaminase (ALT) and alkaline phosphatase (ALP)
Post-hoc analysis showed that ALT (IU/L) was decreased in IUGR + saline compared to control +
saline pups when sexes were combined [-9.27 (-14.93, -3.61); p = 0.002; Figure 5.11 A], and in males
and females when analysed separately [males: - 9.18 (-16.58, - 1.79); p = 0.016; females: -9.35 (-
17.78, - 0.93); p = 0.03; Figure 5.11 B, C]. ALT was increased in IUGR + DITPA compared to IUGR
+ saline pups in sexes combined [7.54 (3.05, 12.02); p = 0.001; Figure 5.11 A], and in males and
females analysed separately [males: 8.48 (2.22, 14.73); p = 0.009; females: 6.59 (0.16, 13.02); p =
0.045; Figure 5.11 B, C]. There was no difference in ALT levels between control + DITPA compared
Figure 5.10 FT3 (A-C) and FT4 (D-F) plasma levels in male and female control and IUGR pups at P14
treated with DITPA or saline. Data analysed by linear mixed modelling and Bonferroni correction. Values
presented as Mean ± SEM. pmol/L = picomoles per litre, * p < 0.05, ** p < 0.01, *** p < 0.001, **** p<0.0001.
Pup numbers: control + saline: n = 34 male, n = 33 female; control + DITPA: n = 33 male, n = 27 female;
IUGR + saline: n = 31 male, n = 18 female; IUGR + DITPA: n = 23 male, n = 24 female.

Chapter 5
132
to control + saline pups, or IUGR + DITPA compared to control + DITPA pups (Figure 5.11 A, B,
C). The human reference ranges for ALT and ALP are shown in Table 5.3.
Post-hoc analysis showed that there was no difference in ALP levels (IU/L) between IUGR + saline
and control + saline pups when sexes were combined (Figure 5.11 D), and when analysed separately
(Figure 5.11 E, F). ALP was increased in IUGR + DITPA compared to IUGR + saline pups in sexes
combined [53.09 (14.24, 91.94); p = 0.008; Figure 5.11 D], and in males [89.81 (35.57, 114.05); p =
0.001; Figure 5.11 E], but not females (Figure 5.11 F). ALP was also increased in control + DITPA
compared to control + saline pups in sexes combined [60.02 (5.65, 114.39); p = 0.03; Figure 5.11 D],
and in males [81.41 (11.38, 151.55); p = 0.023; Figure 5.11 E] but not females (Figure 5.11 F).
Cholesterol
Post-hoc analysis showed there was no difference in cholesterol levels (mmol/L) between any of the
experimental groups when sexes were combined (Figure 5.11 G), or in males and females when
analysed separately (Figure 5.11 H, I).
Dio1:B2M
Two-way ANOVA analysis showed no interaction between group and treatment on the relative
expression of Dio1 to B2M (Dio1:B2M) in the liver. There was no main effect of group in the liver,
but there was an effect of treatment (F1/24 = 5.93, p = 0.02). Post-hoc analysis showed that there was
no difference in Dio1:B2M relative expression in the liver between groups (Figure 5.11).

Chapter 5
133
Table 5.3 Clinical reference ranges for plasma levels of Alanine transaminase (ALT), alkaline
phosphatase (ALP) and cholesterol in infants, children and adults. Reference ranges from Monash
Pathology, Clayton, Vic, Australia.
Infants (Newborn) Children (< 18 years) Adult (> 18 years)
ALT (IU/L) 5 - 45 - 7 - 56
ALP (IU/L) 80 - 550 120 - 450 30 - 110
Cholesterol
(mmol/L)
0 – 5.5
mmol/L = millimoles per litre, U/L = international units per litre.
Figure 5.11 Serum levels of ALT (A-C), ALP (D-F), and cholesterol (G-I), and relative levels of Dio1 to
B2M (J; male liver only) in male and female control and IUGR pups at P14 treated with DITPA or
saline. Data analysed by linear mixed modelling and Bonferroni correction.2-way ANOVA used to analyse
Dio1:B2M data. Values presented as Mean ± SEM. IU/L = international units per litre, mmol/L millimoles per
litre, * p < 0.05, ** p < 0.01, *** p < 0.001. Pup numbers: control + saline: n = 34 male, n = 33 female; control
+ DITPA: n = 33 male, n = 27 female; IUGR + saline: n = 31 male, n = 18 female; IUGR + DITPA: n = 23
male, n = 24 female. Dio1:B2M analysis: control + saline: n= 6; control + DITPA: n= 6; IUGR + saline: n= 7;
IUGR + DITPA: n= 8

Chapter 5
134
5.5 Discussion
5.5.1 Overview
This is the first study to examine neonatal growth and wellbeing measures in response to daily, longer-
term DITPA administration from P1 to 13 in an IUGR rat model. The key findings are:
In IUGR + saline compared to control + saline pups there was a significant reduction in (i) body
weight at P1, P7 and P14, crown-to-rump length (CRL), and at P14 a significant reduction in (ii) hip
circumference, (iii) total brain weight, (iv) cerebral hemisphere weight, (v) pons weight, (vi) liver
and kidney weight, (vii) bone mineral density and content, (viii) total bone area, (ix) lean tissue mass,
fat mass, and percentage of body fat, and (x) circulating FT4 and liver enzyme ALT.
In IUGR + DITPA compared to IUGR + saline pups at P14 there was a significant (i) increase in left
and right kidney weight, (ii) increase in plasma FT3 levels, (iii) decrease in plasma FT4 levels,
although these results were due to FT3 cross-reacting with the DITPA assay, and TH homeostatic
feedback mechanism, and (iv) increase in liver enzymes ALT and ALP, although they remained
within safe levels.
In control + DITPA compared to control + saline pups at P14 there was a significant (i) decrease in
body weight of male pups, (ii) decrease in liver weight in female pups, (iii) decrease in pons weight
in males, (iv) increase in bone mineral density in females, (v) increase in plasma FT3 levels, (vi)
decrease in plasma FT4 levels, and (vii) increase in plasma ALP levels. All plasma outcomes were
within safe levels.
Overall, DITPA administration was not harmful to neonatal growth and wellbeing in IUGR rat pups
when assessed at P14, however there is some evidence that it has negative effects on growth, the brain
and liver when administered to control pups.
5.5.2 Body and organ weights
In the present study body weight at P1, P7 and P14 was significantly reduced, as was liver and kidney
weight at P14 in IUGR compared to control pups. These results are consistent decreased body weight
in IUGR infants (persisting to 1 year of age and into adolescence) (Bernstein et al., 2000, Pena et al.,
1988, Strauss and Dietz, 1998, Martorell et al., 1998), and in the IUGR postnatal rat (Lane et al.,
2001b, Romano et al., 2009, Wlodek et al., 2005, Simmons et al., 1992, McDougall et al., 2017b). As
expected, in the present study liver and kidney weights were reduced as previously reported in IUGR
rats (Cha et al., 1987), and in IUGR infants and children (Naeye, 1965, Hotoura et al., 2005, Schmidt
et al., 2005, Latini et al., 2004, Ladinig et al., 2014).

Chapter 5
135
In the current study, there was decreased weight gain in male control + DITPA compared to control
+ saline pups at P14. This reduction in growth may be due to a thyrotoxic effect of DITPA when
given to control pups, and this effect is likely masked in the female pups by a higher baseline body
weight of the female control + DITPA pups compared to males at P1 (likely due to random bias) .
These results are consistent with previous studies in humans with euthyroid status, in which DITPA
caused weight loss in adults with congestive heart failure (DITPA administered for 8 weeks, or 6
months at 90 to 180, 270, 360 mg/day; maximum dose of 270mg/day) (Ladenson et al., 2010,
Goldman et al., 2009). Fortunately, DITPA did not affect weight gain in IUGR pups in the present
study. Clinically, DITPA administered to children (aged between 8.5 to 25 months) with congenital
MCT8 mutation (1.8mg/day initially, increased to 30mg/d for 26 to 40 months) improves weight gain
(Verge et al., 2012), however it should be noted that these children had elevated baseline circulating
T3 levels which likely contributed to their weight loss. This is not the case in IUGR foetuses, where
baseline circulating T3 levels are no different from control levels (Thorpe-Beeston et al., 1991). There
are no preclinical studies examining the effects of DITPA treatment in IUGR neonates. However, the
results of the present study are consistent with other rodent studies in MCT8 knockout mice (0.3, 0.6
or 1mg/body weight/day DITPA for 4 days; or 0.3mg/100g/day for 10 days) (Ferrara et al., 2015) (Di
Cosmo, 2009), and in IUGR pups (0.5mg/100g i.p. DITPA daily from P1 – P6) (Azhan, A.,
unpublished thesis, 2019), where body weight was not affected by DITPA administration.
Little is known about the effect of DITPA on kidney and liver growth overall. The present study
found that DITPA treatment in IUGR pups increased right and left kidney weights (left kidney only
when data from both sexes was combined). No difference in circulating plasma levels of T3 has been
reported in IUGR, but circulating T4 levels are decreased compared to controls (Thorpe-Beeston et
al., 1991, Soothill et al., 1992). Hypothyroidism is associated with reduced kidney-to-body mass ratio
in rats, while hyperthyroidism is associated with an increase in kidney-to-body mass ratio (Vargas et
al., 2006). This could explain the finding that DITPA increased kidney weight in IUGR rats if MCT8
is also reduced in the kidneys, as ‘correcting’ a possible lack of TH signalling within the kidneys
could improve their growth trajectory. However there is no evidence that MCT8 is reduced in the
IUGR rat kidney, and further studies examining kidney structure and function in response to IUGR
and DITPA administration are required.
In the present study, the right kidney was more affected by DITPA than the left (effects in left kidney
were evident when male and female data were combined). Rats have slightly heavier right kidneys,
believed to be due to differences in artery morphology (Yoldas and Dayan, 2014) thus perhaps the
ability for the right kidney to process larger amounts of DITPA than the left, contributed to a larger

Chapter 5
136
effect in the right kidney. In control pups, DITPA significantly decreased liver weight in females
only; at this stage, there is no reason for this sex-specific reduction in liver weight, but does support
the idea that DITPA should not be given to healthy individuals as a pre-emptive measure, as its full
effects on the liver growth and function have not been elucidated. These results suggest that DITPA,
administered from P1 to 13 may be having beneficial result on kidney growth in IUGR in both males
and females, but may have adverse effects in the liver when given to control rats.
5.5.3 Brain weights
This study showed that IUGR + saline compared to control + saline pups, had significantly reduced
total brain weight and weights of the cerebral hemispheres and pons as well as an increased brain-to-
body weight ratio; these findings are in line with our previous rat and guinea pig studies (Tolcos et
al., 2011, Tolcos et al., 2018). An increased brain-to-body weight ratio in IUGR is indicative of foetal
brain sparing that likely occurred in utero. In IUGR infants, the brain is smaller than that of
appropriately grown counterparts (Batalle et al., 2012, Eikenes et al., 2012a), however it may still be
proportionally large compared to body size due to brain sparing. In the present study, there was no
difference in brain weight between IUGR and control pups treated with DITPA or saline, however in
control pups, DITPA administration increased brain-to-body weight ratio and decreased pons weight.
It is currently unclear why this effect was seen only in control males, however as mentioned
previously decreased growth in male control pups could possibly be due to thyrotoxic effects of
DITPA when given to controls, with this effect masked in females as their body weight is heavier
than males at P1. There is currently no data for the effect of DITPA on human brain weight (IUGR
or otherwise), however in IUGR newborn rats treated with DITPA (0.5mg/100g from P1 – P6), brain
weight was not altered, but as in the present study, brain-to-body weight ratio was increased (Azhan,
A., unpublished thesis, 2019). These results suggest that while IUGR reduces brain growth, DITPA
treatment does not worsen these effects.
5.5.4 Body morphometry
Previous IUGR studies report decreased body morphometry measures such as CRL at P7 and P35 in
rats (Azhan, 2019, McDougall et al., 2017b), and in guinea pigs from 52 dg to 8 weeks postnatal age
(Tolcos et al., 2018, Tolcos et al., 2011). The results of the present study are consistent with this
literature, and indicate that CRL is reduced in both male and female IUGR rats (saline treated)
compared to controls at P14; hip circumference was also reduced but in males only. However head
circumference was not different between IUGR and control, saline-treated rats at P14, and may be
due to brain sparing, which results in a proportionally larger brain and head in IUGR pups. IUGR
newborns with these proportions are classified as having asymmetrical IUGR (Godfrey and Barker,

Chapter 5
137
2001). The presence of brain sparing in IUGR pups in the present study, is supported by the increased
brain-to-body weight ratio in IUGR + saline pups compared to control + saline pups. Body
morphometry measures were not different in IUGR pups treated with DITPA or saline pups in the
present study, or in a previous study using short-term DITPA treatment (0.5mg/100g i.p. daily from
P1 – P6) in IUGR newborn rats (Azhan, A., unpublished thesis, 2019). Unfortunately, previous
human studies using DITPA have focused predominantly on body weight and not body morphometry.
Overall, results of these studies combined, suggest that DITPA does not negatively affect CRL, head
or hip circumference in IUGR.
5.5.5 Body composition (DEXA)
DEXA was used to analyse body composition of pups at P14. The results of DEXA analysis in the
present study revealed that IUGR pups compared to controls had lower bone mineral density, bone
mineral content, total bone area, lean tissue mass, fat mass and percentage of fat mass when assessed
at P14. This is consistent with clinical DEXA data, showing that IUGR foetuses have reduced fat
mass and lean tissue mass (Brown and Hay, 2016, Larciprete et al., 2005). Animal studies also show
reduced DEXA measures in IUGR compared to controls, with reduced total bone area and bone
mineral content in female rats postnatally (Zhao et al., 2013), and decreased fat mass, lean tissue
mass, bone mineral density and content in male rats at P7 (Azhan, A., unpublished thesis, 2019).
DITPA administration in the present study did not alter any of the above mentioned body composition
measures in IUGR rat pups, but did increased bone mineral density in control + DITPA pups
compared to control + saline in sexes combined, and females only when sexes were analysed
separately. It is currently unclear why DITPA produced this effect in control pups, and why no
difference was seen in the males. Notably, DITPA’s thyromimetic properties may elevate bone
turnover in control pups. While TH replacement in hypothyroidism stimulates catch-up growth and
bone maturation, thyrotoxicosis results in increased bone resorption and decreased bone density
(Bassett and Williams, 2003, Harvey et al., 2002, Stevens et al., 2003). DITPA treatment in euthyroid
adults supports this explanation, with increased bone turnover reported in DITPA treated patients
(Ladenson et al., 2010). Importantly in the present study, and our previous study (Azhan, A.,
unpublished thesis, 2019) there was no reduction in the bone mineral density or content in either
control or IUGR pups treated with DITPA. Furthermore, both short- (Azhan, A., Unpublished thesis,
2019) and long-term administration studies (current study) also show that DITPA does not affect lean
tissue mass or fat mass in IUGR newborn rats.

Chapter 5
138
5.5.6 Blood plasma analysis
Thyroid function
Circulating TH levels are altered in IUGR, with decreased FT3 (Kilby et al., 1998) and FT4 (Soothill
et al., 1992, Thorpe-Beeston et al., 1991, Kush, 2004) levels in IUGR foetuses compared to their
appropriately grown counterparts. In the present study female IUGR pups had decreased FT4 levels
compared to controls (both given saline), but there was no change in males, or in FT3 levels in both
males and females. It is unclear why FT4 levels in males were not affected, as males are considered
more susceptible to the effects of IUGR (Radulescu et al., 2013). Importantly, the TH levels of IUGR
pups in the present study are still within the normal ranges (See Table 5.2).
In the present study, DITPA administration significantly increased FT3 in both IUGR and control
male and female pups, however this result was expected as the plasma assay for FT3 is known to
cross-react with DITPA (Leung et al., 2016). A study using a different assay, which does not cross-
react with DITPA, showed that DITPA (0.3mg/100g body weight/day) normalised plasma T3 to
control levels in MCT8 knockout mice (Ferrara et al., 2015). The findings of the present study
provided evidence that DITPA indeed entered the blood circulation of pups, as DITPA treatment in
both IUGR and control pups significantly decreased FT4 levels. The reason for this decrease is likely
due to homeostatic regulation of TH within the body from a negative feedback system. As previously
discussed, circulating TH levels are biologically maintained at homeostasis, so that when circulating
TH levels are low, the hypothalamus releases TRH which stimulates the pituitary gland to release
TSH, which then signals the thyroid gland to produce more TH (T3 and T4) in the blood stream.
Conversely, if circulating TH levels are high, the hypothalamus and pituitary gland reduce TRH and
TSH levels in order to decrease circulating TH levels. Although DITPA treatment has not been
trialled clinically in IUGR infants, in euthyroid adults with cardiac failure, DITPA caused low
circulating TSH levels (Goldman et al., 2009) likely due to the negative feedback system, but did not
cause signs or symptoms of hypothyroidism or thyrotoxicity. Similarly, in the present study, DITPA
would have signalled the negative feedback system to reduce the production of TSH leading to the
marked decrease in FT4 seen in our assay (see Figure 5.12).
The plasma assay used to measure TSH levels in the present study was not successful (see Section
5.3.4), and limited blood plasma samples meant that the assay could not be repeated. An alternative
approach was to examine Dio1 gene expression in the liver. The Dio1 gene encodes the dominant
enzyme in the liver for activating TH (converting T4 to T3) (Bianco et al., 2002, Kohrle, 1999) and
therefore levels of Dio1 are indicative of the demand for TH in the liver, with low levels of Dio1
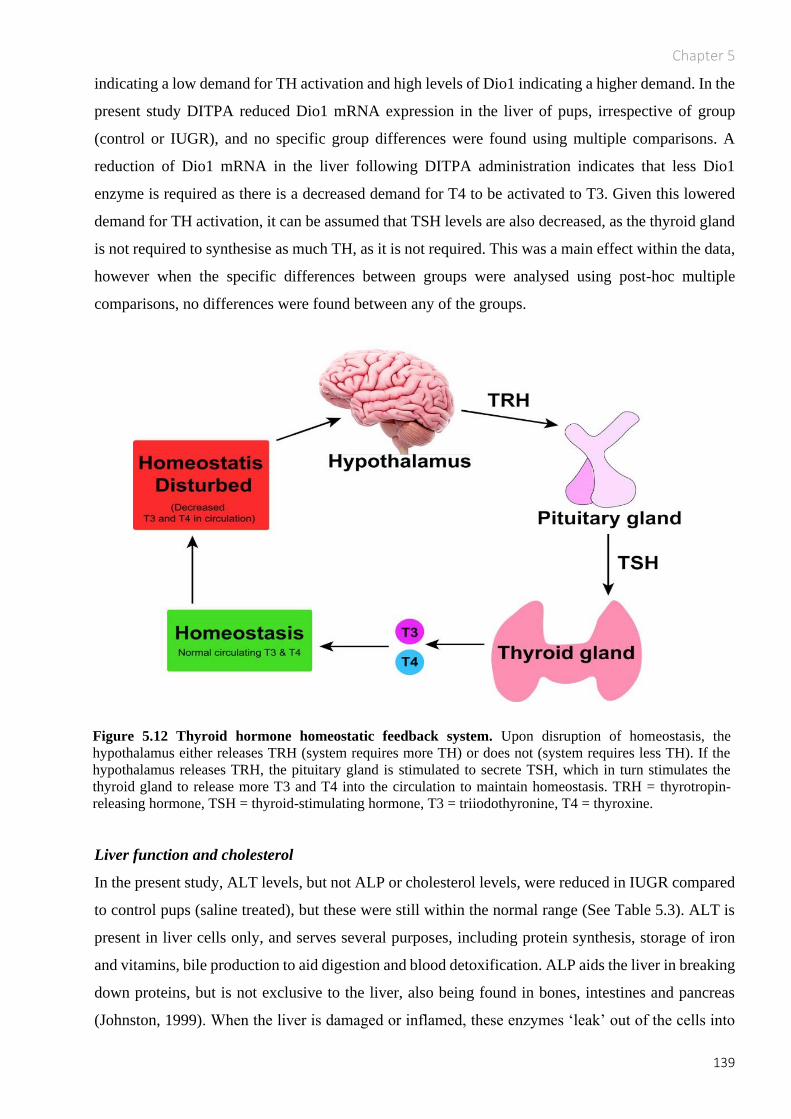
Chapter 5
139
indicating a low demand for TH activation and high levels of Dio1 indicating a higher demand. In the
present study DITPA reduced Dio1 mRNA expression in the liver of pups, irrespective of group
(control or IUGR), and no specific group differences were found using multiple comparisons. A
reduction of Dio1 mRNA in the liver following DITPA administration indicates that less Dio1
enzyme is required as there is a decreased demand for T4 to be activated to T3. Given this lowered
demand for TH activation, it can be assumed that TSH levels are also decreased, as the thyroid gland
is not required to synthesise as much TH, as it is not required. This was a main effect within the data,
however when the specific differences between groups were analysed using post-hoc multiple
comparisons, no differences were found between any of the groups.
Liver function and cholesterol
In the present study, ALT levels, but not ALP or cholesterol levels, were reduced in IUGR compared
to control pups (saline treated), but these were still within the normal range (See Table 5.3). ALT is
present in liver cells only, and serves several purposes, including protein synthesis, storage of iron
and vitamins, bile production to aid digestion and blood detoxification. ALP aids the liver in breaking
down proteins, but is not exclusive to the liver, also being found in bones, intestines and pancreas
(Johnston, 1999). When the liver is damaged or inflamed, these enzymes ‘leak’ out of the cells into
Figure 5.12 Thyroid hormone homeostatic feedback system. Upon disruption of homeostasis, the
hypothalamus either releases TRH (system requires more TH) or does not (system requires less TH). If the
hypothalamus releases TRH, the pituitary gland is stimulated to secrete TSH, which in turn stimulates the
thyroid gland to release more T3 and T4 into the circulation to maintain homeostasis. TRH = thyrotropin-
releasing hormone, TSH = thyroid-stimulating hormone, T3 = triiodothyronine, T4 = thyroxine.

Chapter 5
140
the blood stream, where they can be measured. In the present study DITPA administration compared
to saline significantly elevated both ALT and ALP (ALP only in males) in IUGR and control pups
when measured at P14, but all levels were still within the normal range. Therefore it is unlikely that
DITPA is benefitting or harming the liver when given in IUGR, and these elevations may just reflect
mild liver cell activation. The mild increase in ALP may also come from increased bone turnover as
a response to DITPA, however DEXA scanning found no evidence of effects on bone in IUGR pups
treated with DITPA compared to saline. Although DITPA corrects excess TH signalling (Di Cosmo,
2009) and a thyrotoxic state in the liver (Ferrara et al., 2015) in MCT8 knockout mice, these mice are
hyperthyroid, and therefore direct comparisons to euthyroid IUGR rats in the present study cannot be
made. Taken together these results suggest that DITPA may slightly activate the liver, but not to the
extent of causing harm. Further studies into the TH state of the liver following DITPA treatment in
IUGR are required.
In regards to cholesterol levels, there are varying results following DITPA administration; in adults
with heart failure, DITPA decreased cholesterol levels following 24 weeks of treatment (Ladenson et
al., 2010). This results differs from the present study, in which the cholesterol levels of IUGR pups
and controls was not altered by DITPA, however the conflicting findings is likely due to the difference
in species, age and dosing regimen.
5.5.7 Limitations of the study
As mentioned circulating TSH levels, an indirect measure of thyroid function, in the blood of pups
were not measured in the present study. Plasma was allocated for TSH testing, and a standard hospital
plasma assay for TSH was conducted by Monash Pathology. Unfortunately the assay was
unsuccessful, as the specific assay kit was not suitable for rat TSH, and due to limited volume of
plasma collected, there was no remaining plasma to repeat this assay. An alternative approach was to
examine Dio1 activity or gene expression in the liver. This was done using livers of only male animals
(corresponding to those analysed in Chapter 3 and 4), as time did not permit assessment of both males
and females due to University closure in response to the COVID-19 pandemic. Assessment of Dio1
mRNA expression in the liver of female pups will be performed once access to the laboratory
resumes.
5.5.8 Conclusion
In the current study DITPA (0.5mg/100g) or saline (equivalent volume) administered from P1 to 13
to IUGR and control rat pups showed that DITPA does not adversely impact neonatal growth, weights
of brain, kidneys or liver, and body composition following IUGR, despite reducing FT4 levels and

Chapter 5
141
showing hepatic thyromimetic activity. Although this is promising, before definitive conclusions can
be drawn about the safety profile of DITPA in IUGR newborn infants, the long-term effects of DITPA
on neonatal growth and wellbeing must be examined.

Chapter 6
142
6 General Discussion
6.1 Overview
IUGR is characterised by foetal growth that is small for GA due to maternal, environmental or genetic
factors, and despite much research, as summarised previously in this thesis, it remains a major clinical
challenge (Murki, 2014). Indeed, IUGR is second to prematurity as the leading cause of perinatal
morbidity and mortality (Abu-Saad and Fraser, 2010, Bhutta et al., 2005), with IUGR babies at an
increased risk of adverse neurodevelopmental sequelae (Geva et al., 2006b), and cerebral palsy
(McIntyre et al., 2013). Deficits in the development of WM (Chase et al., 1972, Eikenes et al., 2012a,
Esteban et al., 2010, Padilla et al., 2014a) and GM (Dubois et al., 2008, Lodygensky et al., 2008,
Tolsa et al., 2004, Benavides-Serralde et al., 2009) as well as delayed brain maturation are thought to
underlie neurodevelopmental impairments associated with IUGR. It is now accepted that disrupted
and delayed myelination is often present in the IUGR infant’s brain (Chase et al., 1972), and this
altered WM development can persist into adulthood (Padilla et al., 2014a, Esteban et al., 2010,
Eikenes et al., 2012b). In the CNS, OLs are essential for making myelin, and undergo a lineage
progression from progenitors to mature myelinating OLs, driven in part by TH and cerebral TH
signalling. The relationship between TH signalling and OL maturation has been the focus of this
thesis.
Previously, our group (Azhan, A., unpublished thesis, 2019), and others (Chan et al., 2014) have
found that the TH transporter MCT8, which exclusively transports TH into cells in the brain,
including into OLs themselves, is down-regulated in the brain of IUGR human foetuses and newborn
rats. This suggests that a deficit in cellular transport of TH could underlie myelination impairments
observed in IUGR. This proposal is supported by evidence of reduced myelination in children with a
congenital MCT8 mutation (Lopez-Espindola et al., 2014). Our group has previously examined the
impact of a short term dosing regimen of DITPA (P1 to P6) in IUGR and control rats, and found that
by P7, myelination was restored in the brains of IUGR rats (Azhan, A., unpublished thesis, 2019).
However to extend this research, it was necessary to study a longer dosing regimen of DITPA; i.e.,
one which was more relevant to the clinical scenario of an IUGR preterm neonate receiving DITPA
until term equivalent age. If severe or worsening IUGR is detected in utero, the baby is often delivered
preterm therefore ideally DITPA treatment would be given to these preterm IUGR babies, until the
time at which MCT8 levels normalise in their brain. Although data related to the temporal expression

Chapter 6
143
of MCT8 in the IUGR human brain is unavailable, previous findings from our group report that MCT8
levels are reduced in the IUGR rat brain at P7, and these normalise by P14. Therefore in the present
study, the effects of DITPA administration in IUGR rats were examined from P1 to P13, a time in rat
brain development considered to be equivalent to that of a human baby from 23 to 40 weeks GA
(Semple et al., 2013). Thus, the experiments summarised in Chapters 3 to 5 of this thesis are reflective
of what is likely to occur in the clinical setting where an IUGR baby is delivered preterm and then
treated with DITPA until term equivalent age. The studies were designed to examine the impact of
daily DITPA treatment over 1 to13 days after birth (P1 to P13), on myelination and OL development
in the brain. As discussed previously (Chapter 1 to Chapter 5), DITPA is a TH analogue that does not
require MCT8 to enter cells in the brain. A focus was placed on examining regions of the brain known
to be highly vulnerable to prenatal insults like IUGR, including the cerebral cortex, corpus callosum,
hippocampus, and the cerebellum (Padilla et al., 2011, Padilla et al., 2014b, Egana-Ugrinovic et al.,
2014, Lodygensky et al., 2008). The aims of the study were to determine if longer-term DITPA
treatment in IUGR rat pups would restore myelination and promote OL maturation, without causing
injury or inflammation in the brain.
The major findings are that DITPA, when administered to IUGR pups, promoted MBP-IR in the
cortical layer VI and fimbria, and increased OL cell density (Olig2) in the corpus callosum, but also
decreased myelin protein (PLP-IR) in the corpus callosum and external capsule at P14 compared to
IUGR pups administered saline. In the IUGR cerebellum, DITPA had no effect on MBP-IR and PLP-
IR coverage or Olig2-IR cell density, but did increase the linear density of Purkinje cells (cells/mm),
the main motor output cell of the cerebellum in the early developing lobules. DITPA treatment did
not cause injury or inflammation (assessed via Iba1-IR microglia and GFAP-IR astrocytes) in any
cerebral structure, or in the cerebellum, albeit for a small but significant increase in the density of
Iba1-IR microglia in late developing cerebellar lobules. Importantly, DITPA did not adversely impact
neonatal growth, brain or organ weights, or body composition in IUGR pups. The present study found
that DITPA elevated plasma FT4 levels in IUGR pups, however this was likely due to a TH feedback
mechanism; importantly FT4 levels remained within normal ranges and overall thyroid function was
normal. DITPA also elevated liver enzymes ALT and ALP, however these also remained within
normal ranges, suggesting that DITPA is unlikely to alter liver function significantly when given to
IUGR infants. Results from each study, as well as the strengths and weaknesses of each study have
been discussed in Chapters 3 to 5. The following discussion will focus on how the findings presented
in this thesis contribute to our understanding of DITPA as a therapy for brain injury following IUGR.
Future directions of this research will also be discussed.

Chapter 6
144
6.2 Does DITPA promote myelination in the cerebrum and therefore
benefit the IUGR brain?
The impact of DITPA treatment on the IUGR brain is currently not well understood, however in the
present study it was expected that DITPA would have a pro-myelinating effect in the brains of IUGR
rats, as previous research by our group has shown that daily DITPA administration from P1 to P6
restored myelination by P7 in the external capsule of the IUGR rat brain compared to saline treatment
(Azhan, A., unpublished thesis, 2019). As previously discussed in this thesis, IUGR is reported to
elevate genes which repress OL maturation (WNT, NOTCH & BMP4) and supress those which
promote OL maturation and myelination (SOX10 & Myrf; Azhan, A., PhD thesis, Monash
University, 2019). It is not yet clear what triggers these genetic changes that result in impaired
myelination, however there is proof that hypoxic-ischaemic insults in-utero, like those occurring
during IUGR may play a part through oxidative stress (French et al., 2009, Reid et al., 2012, Back et
al., 2002). Prenatal hypoxia has been shown to increase WNT signalling in the brain, with elevated
Axin2 levels (a transcriptional target of the WNT signalling pathway) found within OPCs (Fancy et
al., 2011) as well as the overexpression of NOTCH’s downstream target gene Hes5 (Wang et al.,
1998, Zhang et al., 2009). DITPA has also been shown to up-regulate MBP gene expression and to
promote human OL maturation in vitro (Lee et al., 2017). Raising the question of whether DITPA is
impacting the altered gene expression seen in IUGR. However, this thesis showed that DITPA had a
pro-myelinating effect in the cerebrum, irrespective of experimental group, with increased MBP-IR
seen in cortical layer VI and the fimbria in both IUGR and control pups treated with DITPA,
compared to treatment with saline. Of interest, the length of MBP-IR myelinated processes extending
through the cortical layers in these animals were shorter in pups treated with DITPA compared to
saline, and this was true for both IUGR and control pups. These results suggest that although DITPA
increases MBP-IR in cortical layer VI, there may be a delay in the propagation of MBP along cortical
processes, which was visible at P14. Once myelin protein is synthesised in an OL cell body, it
migrates distally into the OL processes where it wraps around neuronal axons (Pedraza, 1997). One
explanation for why MBP-IR does not extend as far along the processes, may be that DITPA is
slowing the MBP migration, meaning that overall, myelination is delayed. The rate of formation of
mature myelin throughout axonal processes is clearly something that should be investigated further.
Another possible explanation for the delayed progression of MBP along cortical processes, as well as
the increased density of MBP-IR seen in cortical layer VI, is that DITPA is causing a ‘bottleneck’
effect; i.e., blocking MBP from travelling properly from the OL body along the cortical processes.
Cortical neuronal projections are fundamental for output and integration of information within the

Chapter 6
145
brain, and myelination of these projections is essential for optimal brain function. Therefore future
studies should investigate DITPA’s effect on MBP migration along cortical axons at various time
points prior to, and after P14 to better understand if the delayed MBP migration along processes is
due to a delay migration delay or a blockage, and to importantly establish whether myelination of
these processes eventually normalises.
In the present study DITPA treatment had no effect on Olig2-IR or APC-IR cell density, or areal
coverage of MBP-IR or PLP-IR in the IUGR cerebellum. This was surprising, as in the rat the
cerebellum undergoes a rapid period of growth in the first 10 days of life (Dobbing and Sands, 1979),
and cerebellar myelination occurs from P1 – P45 (Hamano et al., 1998). Therefore it was expected
that DITPA administered during this window would impact myelination, and restore any deficits in
cerebellar growth or structure. Although other studies have determined that MCT8 is deficient in the
cortical plate of human IUGR foetuses (Chan et al., 2014), and in cerebral WM of IUGR postnatal
rats (Azhan, A., unpublished thesis, 2019), none have investigated if IUGR renders the cerebellum
deficient in MCT8 expression. It may be the case that MCT8 expression in the cerebellum is not
affected by IUGR, and therefore DITPA treatment would have no benefit, as observed in the current
study. Future studies should examine the expression of MCT8 protein or mRNA in the cerebellum of
IUGR and control pups using immunohistochemical and molecular techniques.
DITPA treatment increased the density of Iba1-IR microglia in late developing cerebellar lobules in
IUGR pups, possibly suggesting an inflammatory response. Microglia are key immune defence cells
in the CNS, however microglia also have other important roles in brain development such as
regulating the migration of neuronal precursors (Erblich et al., 2011), synaptic pruning, modulating
neuronal function (Cserep et al., 2020), and regulating OL differentiation (Aarum et al., 2003). There
is good evidence that microglia are essential for myelination by phagocytic removal of cellular debris
which would otherwise inhibit the recruitment and maturation of OLs and ensheathing of neuronal
axons (Kotter et al., 2006, Saederup et al., 2010). In the present study the thickness of tissue sections
(8µm), prevented the definitive determination of reactive (amoeboid) versus resting (ramified)
microglia, as microglial processes extend in all directions over many microns. Ramified microglia in
the CNS are characterised by long extended processes, and are crucial for neuronal health, as well as
clearing dead cells, and pruning and remodelling neuronal processes in the foetal brain (Schafer et
al., 2012, Walker et al., 2014). Reactive microglia on the other hand have retracted processes and are
classically associated with an inflammatory response to infection or injury (Graeber et al., 2011).
Without knowing the state of the microglia in the late cerebellar lobules in the present study, there is
insufficient information to comment on the nature of the increase in microglial density observed in

Chapter 6
146
response to DITPA. Future studies should therefore investigate microglial morphology in response
to DITPA treatment using thicker tissue sections to image the full depth of the section.
In this study DITPA administration increased the linear density (cells/mm) of Purkinje cells in IUGR
(and control) pups, in the early developing lobules of the cerebellum. Whether DITPA promotes
Purkinje cell proliferation, or inhibits the process of natural Purkinje cell death in the rat cerebellum
cannot be determined from the findings of the current study. It is also unclear why this result was
only seen in the early developing lobules, or what the functional outcomes of this change would be.
Due to the design of this study, behavioural testing at P14 was not possible, however it would be
relevant for future studies to examine the effect of DITPA administration on behavioural functions,
especially motor coordination, as the cerebellum and Purkinje cells are essential for this function
(Wulff et al., 2009).
6.3 Is DITPA only beneficial when cerebral MCT8 is reduced?
In human pregnancies, if IUGR is detected in utero the only current intervention is to deliver the baby
preterm to remove it from the insufficient intrauterine environment; thus, many IUGR babies are born
preterm (between 24 to 40 weeks GA). In a clinical setting, DITPA therapy would ideally be given
to an IUGR baby until a time at which MCT8 levels normalise, when DITPA would no longer be
required as TH would be able to enter cells via the MCT8 carrier. We know from a previous study in
rats, that MCT8 mRNA levels are reduced in the IUGR rat brain at P7 compared to controls but are
normalised to control values by P14 (Azhan, A., unpublished thesis, 2019), an age equivalent to brain
development in a human baby at term age (~40 weeks GA) (Semple et al., 2013); this knowledge
provided the current study with an understanding of an appropriate duration of DITPA administration
(i.e. P1 to P13). Although we know that MCT8 levels in the brains of IUGR rats normalise by P14
(Azhan, A., unpublished thesis, 2019), we do not know at exactly which point in development
between P7 and P14 this normalisation occurs, and whether an equivalent recovery also occurs in
human babies. IUGR post-mortem studies in human infants are rare, and therefore ontogeny studies
in animals would be valuable for understanding the spatial and temporal profile of MCT8 expression
following IUGR, and in determining the timing of MCT8 recovery. It is quite possible that MCT8
levels in the brains of the IUGR rat pups reported here normalised before P14, and thus after that
point DITPA would serve no purpose other than to supply excess TH-analogue to a system which,
potentially, no longer needed it. This in turn could have negative implications for brain development
after IUGR such as the increased density of microglia seen in the cerebellum as mentioned above, or
perhaps causing the decrease in PLP-IR observed in the corpus callosum and external capsule of
IUGR pups. In the present study, when DITPA was administered to control pups, there were some

Chapter 6
147
adverse effects which will be discussed in the next section, supporting the proposal that DITPA
should not be given in a system with normal TH signalling. Therefore, it is essential that we
understand precisely when MCT8 levels normalise in the IUGR human infant, so that we can avoid
using a therapy at a time when it may no longer be beneficial, and may in fact be detrimental.
6.4 Should DITPA only be used in cases of confirmed IUGR?
Clinical studies show that when DITPA is administered to euthyroid adults, there are undesirable
effects such as increased bone turnover and reduced cholesterol levels (Ladenson et al., 2010). The
current study found that when DITPA was given to control pups, it reduced PLP-IR in the
hippocampus, external capsule and the fimbria, decreased density of the overall population of OLs
(i.e. Olig2-IR OLs) in cortical layer VI, and reduced the proportion of mature APC-IR OLs in the
overall Olig2-IR OL population; this indicates that in control animals DITPA may impair maturation
of the OL lineage. Given that the density of mature OL was reduced, it was surprising to find that
DITPA increased MBP-IR in cortical layer VI of control pups, possibly suggesting that the existing
OLs accelerate the process of myelination, perhaps as a compensation for the reduced number of
mature OLs. In the cerebellum, control pups treated with DITPA had a 15% reduction in the linear
density of BG fibres in the late developing lobules, compared to pups treated with saline. BG fibres
act as scaffolds along which neurons migrate from the outer proliferative zone of the cerebellum to
the internal granular layer, and therefore fewer BG fibres may indicate disruption to neuronal
migration in the cerebellum. However this was not seen in IUGR pups treated with DITPA compared
saline in this study. The increased BG fibre density seen in control pups may be the effect of DITPA
being administered when the neonatal thyroid status is essentially normal.
At P14, DITPA administration resulted in an 8% decrease in body weight of males, a decrease in the
weight of the pons in males, and an increase in bone mineral density in females; this was not seen in
a previous study when DITPA was given for a shorter duration (P1 to P6) (Azhan, A., unpublished
thesis, 2019). The reduction in body weight observed in males may be due to a thyrotoxic effect of
DITPA when given under euthyroid circumstances, and is likely masked in females due to a higher
baseline body weight at P1. It is unclear why the pons was affected, in the absence of an effect in
other brain regions, raising the question of whether the pons is more vulnerable than the rest of the
brain to the effects of DITPA, or TH treatment in general. The pons is the site of deep cerebellar
nuclei (Brodal and Bjaalie, 1992) and the superior, mid and inferior cerebellar peduncles which are
fibre tracts responsible for connecting the cerebellum with the rest of the CNS (Glickstein and Doron,
2008). Given this connection between the cerebellum and the pons, it is entirely possible that the
responses to DITPA seen in the cerebellum in this study, including increased Purkinje cell density

Chapter 6
148
(cells/mm) in the early developing lobules, increase microglial density (cells/mm2) and increased in
BG fibres (cells/mm) in the late lobules are related to changes in the pons however this requires
further investigation.
The increased bone density observed in control female pups treated with DITPA compared to saline,
is in line with the finding of increased bone turnover measures in humans (Ladenson et al., 2010) and
should be carefully considered. It is not clear why this was not seen in males, however one possible
explanation is that the hormonal differences between the sexes may be playing a part. The results of
the current study, as well as those in euthyroid adults (Goldman et al., 2009, Ladenson et al., 2010),
suggest that DITPA should only be given to individuals who are confirmed as IUGR, and not as a
prophylactic treatment when IUGR is suspected such as when an infant is small for gestational age,
as adding DITPA to a euthyroid system may cause more harm than good.
6.5 Future directions – clinical administration of DITPA
In the current study DITPA was administrated to rat pups daily using intraperitoneal injections.
Although this is an easy and efficient route of DITPA administration to neonatal rats, it is clearly not
an appropriate delivery route for IUGR infants. Intravenous delivery of drugs is commonly used in
neonates, and is suitable for DITPA administration. Oral administration of drugs in neonates is less
common, and given that the gastrointestinal system in IUGR babies is immature (Bozzetti et al., 2012,
Nicholl et al., 2008), and may also be under physiological stress (e.g., if necrotising enterocolitis is
present (Bernstein et al., 2000)), this may not be ideal as DITPA may not be adequately and rapidly
absorbed; admittedly, there is no data to confirm or refute this proposition. Also, the pain and
discomfort associated with replacement of intravenous catheters necessary for long-term
administration of DITPA should be avoided. The most effective and non-invasive route of
administering DITPA to IUGR babies requires further investigation, with possible administration
options including direct pulmonary delivery via aerosolisation, or by using nanoemulsions.
Pulmonary drug delivery involves drugs being aerosolised via propellants or pressure and inhaled
directly into the patient’s lungs; many forms, including nebulisers, metered dose inhalers and dry
powder inhalers are already available. A nebuliser administers aerosol through a mask, and does not
require a specific inhalation technique, making it ideal for use in infants, unlike metered dose and dry
powder inhalers which do require specific inhalation techniques. Another promising avenue of
administration is via nanoemulsions, which consist of two immiscible liquids combined into droplets
of approximately 100 – 300 nm in size and stabilised by surfactants (Anton et al., 2008, Comfort et
al., 2015), to act as a carrier for the drug. Preclinical trials show that when administered intranasally,
nanoemulsions carrying drugs can bypass the blood-brain barrier and reach the brain via the olfactory

Chapter 6
149
and trigeminal nerves in the upper nasal cavity (Chapman et al., 2013, Hanson and Frey, 2008,
Bonferoni et al., 2019). This method is non-invasive, does not require patient coordination, displays
rapid drug onset and minimises systemic exposure making it an ideal candidate. Although these are
all possible routes for administering DITPA to IUGR babies, the pharmacodynamics and
pharmacokinetics of DITPA used for each of these methods would need to be considered.
6.6 Conclusion
In summary, this thesis has for the first time demonstrated that the TH analogue DITPA, which enters
cells independently of the MCT8 transporter, when administered for a clinically relevant duration in
IUGR pups (P1 to P13; 0.5mg/100g/day i.p.), promotes myelination (as indicated by increased MBP-
IR) in cortical layer VI, increases the density of OLs in the corpus callosum, does not cause injury or
inflammation to the brain except for a possible minor inflammatory response in the cerebellum, and
has no serious negative off-target effects on neonatal growth or wellbeing. The rat cerebellar WM is
not affected by IUGR at P14, and may therefore serve for interspecies comparisons in order to
elucidate pathways of injury and resistance against IUGR. DITPA treatment in individuals with
normal TH levels (or normal cerebral TH signalling) should be avoided, as this thesis reports
unfavourable results in control rats given DITPA, likely the result of excess TH being administered
into an otherwise normal system. Genes which regulate OL development and are affected in IUGR
may be impacted by DITPA administration, improving outcomes. Future studies should therefore
aim to further examine the neuroprotective potential of DITPA across species. The spatial and
temporal expression profile of MCT8 in the IUGR human and animal brain should also be explored,
as this will provide greater understanding of the point at which MCT8 levels normalise, to better tailor
treatment. This information would greatly aid in the further development and translation of therapies
like DITPA, which may compensate for MCT8 deficiency in IUGR.

Reference List
150
7 Reference List
THE NEW ENGLAND CONGENITAL HYPOTHYROIDISM COLLECTIVE. 1984. Characteristics of
infantile hypothyroidism discovered on neonatal screening. J Pediatr, 104, 539-44.
AARUM, J., SANDBERG, K., HAEBERLEIN, S. L. & PERSSON, M. A. 2003. Migration and
differentiation of neural precursor cells can be directed by microglia. Proc Natl Acad Sci U S A, 100,
15983-8.
ABRAHAM, H., VINCZE, A., JEWGENOW, I., VESZPREMI, B., KRAVJAK, A., GOMORI, E. &
SERESS, L. 2010. Myelination in the human hippocampal formation from midgestation to
adulthood. Int J Dev Neurosci, 28, 401-10.
ABU-SAAD, K. & FRASER, D. 2010. Maternal nutrition and birth outcomes. Epidemiol Rev, 32, 5-25.
ALISI, A., PANERA, N., AGOSTONI, C. & NOBILI, V. 2011. Intrauterine growth retardation and
nonalcoholic Fatty liver disease in children. Int J Endocrinol, 2011, 269853.
ALTMAN, J. & BAYER, S. A. 1978. Prenatal development of the cerebellar system in the rat. I.
Cytogenesis and histogenesis of the deep nuclei and the cortex of the cerebellum. J Comp Neurol,
179, 23-48.
ANTON, N., BENOIT, J. P. & SAULNIER, P. 2008. Design and production of nanoparticles formulated
from nano-emulsion templates-a review. J Control Release, 128, 185-99.
ANTONOW-SCHLORKE, I., HELGERT, A., GEY, C., COKSAYGAN, T., SCHUBERT, H.,
NATHANIELSZ, P. W., WITTE, O. W. & SCHWAB, M. 2009. Adverse effects of antenatal
glucocorticoids on cerebral myelination in sheep. Obstet Gynecol, 113, 142-51.
ARALASMAK, A., ULMER, J. L., KOCAK, M., SALVAN, C. V., HILLIS, A. E. & YOUSEM, D. M.
2006. Association, commissural, and projection pathways and their functional deficit reported in
literature. J Comput Assist Tomogr, 30, 695-715.
ARNOLD, S. E. & TROJANOWSKI, J. Q. 1996. Human fetal hippocampal development: I.
Cytoarchitecture, myeloarchitecture, and neuronal morphologic features. J Comp Neurol, 367, 274-
92.
AZHAN, A. 2019. Myelination deficits in fetal growth restriction: Understanding mechanisms for novel
therapiesHudson Institute of Clinical Research.
BAADER, S. L., SCHILLING, M. L., ROSENGARTEN, B., PRETSCH, W., TEUTSCH, H. F.,
OBERDICK, J. & SCHILLING, K. 1996. Purkinje cell lineage and the topographic organization of
the cerebellar cortex: a view from X inactivation mosaics. Dev Biol, 174, 393-406.
BACK, S. A., HAN, B. H., LUO, N. L., CHRICTON, C. A., XANTHOUDAKIS, S., TAM, J., ARVIN, K.
L. & HOLTZMAN, D. M. 2002. Selective vulnerability of late oligodendrocyte progenitors to
hypoxia-ischemia. J Neurosci, 22, 455-63.
BACK, S. A., LUO, N. L., BORENSTEIN, N. S., LEVINE, J. M., VOLPE, J. J. & KINNEY, H. C. 2001.
Late oligodendrocyte progenitors coincide with the developmental window of vulnerability for
human perinatal white matter injury. J Neurosci, 21, 1302-12.
BALOCH, S., VERMA, R., HUANG, H., KHURD, P., CLARK, S., YAROWSKY, P., ABEL, T., MORI, S.
& DAVATZIKOS, C. 2009. Quantification of brain maturation and growth patterns in C57BL/6J
mice via computational neuroanatomy of diffusion tensor images. Cereb Cortex, 19, 675-87.
BAREZ-LOPEZ, S., GRIJOTA-MARTINEZ, C., LIAO, X. H., REFETOFF, S. & GUADANO-FERRAZ,
A. 2019. Intracerebroventricular administration of the thyroid hormone analog TRIAC increases its
brain content in the absence of MCT8. PLoS One, 14, e0226017.
BARKER, D. J., MARTYN, C. N., OSMOND, C., HALES, C. N. & FALL, C. H. 1993. Growth in utero and
serum cholesterol concentrations in adult life. BMJ, 307, 1524-7.
BARKOVICH, A. J. 1988. Abnormal vascular drainage in anomalies of neuronal migration. AJNR Am J
Neuroradiol, 9, 939-42.
BARON, W. & HOEKSTRA, D. 2010. On the biogenesis of myelin membranes: sorting, trafficking and cell
polarity. FEBS Lett, 584, 1760-70.
BARRES, B. A., LAZAR, M. A. & RAFF, M. C. 1994. A novel role for thyroid hormone, glucocorticoids
and retinoic acid in timing oligodendrocyte development. Development, 120, 1097-108.

Reference List
151
BARTZOKIS, G., BECKSON, M., LU, P. H., NUECHTERLEIN, K. H., EDWARDS, N. & MINTZ, J.
2001. Age-related changes in frontal and temporal lobe volumes in men: a magnetic resonance
imaging study. Arch Gen Psychiatry, 58, 461-5.
BASSETT, J. H. & WILLIAMS, G. R. 2003. The molecular actions of thyroid hormone in bone. Trends
Endocrinol Metab, 14, 356-64.
BASSO, D. M., BEATTIE, M. S. & BRESNAHAN, J. C. 1995. A sensitive and reliable locomotor rating
scale for open field testing in rats. J Neurotrauma, 12, 1-21.
BATALLE, D., EIXARCH, E., FIGUERAS, F., MUNOZ-MORENO, E., BARGALLO, N., ILLA, M.,
ACOSTA-ROJAS, R., AMAT-ROLDAN, I. & GRATACOS, E. 2012. Altered small-world topology
of structural brain networks in infants with intrauterine growth restriction and its association with
later neurodevelopmental outcome. Neuroimage, 60, 1352-66.
BATTISTA, M.-C., OLIGNY, L. L., ST-LOUIS, J. & BROCHU, M. 2002. Intrauterine growth restriction in
rats is associated with hypertension and renal dysfunction in adulthood. 283, E124-E131.
BAUD, O., DAIRE, J. L., DALMAZ, Y., FONTAINE, R. H., KRUEGER, R. C., SEBAG, G., EVRARD, P.,
GRESSENS, P. & VERNEY, C. 2004. Gestational hypoxia induces white matter damage in neonatal
rats: a new model of periventricular leukomalacia. Brain Pathol, 14, 1-10.
BAUER, R., WALTER, B., VOLLANDT, R. & ZWIENER, U. 2004. Intrauterine growth restriction
ameliorates the effects of gradual hemorrhagic hypotension on regional cerebral blood flow and
brain oxygen uptake in newborn piglets. Pediatr Res, 56, 639-46.
BAUMANN, N. & PHAM-DINH, D. 2001. Biology of oligodendrocyte and myelin in the mammalian
central nervous system. Physiol Rev, 81, 871-927.
BELTRAN, S., LESCURE, F. X., EL ESPER, I., SCHMIT, J. L. & DESAILLOUD, R. 2006. Subclinical
hypothyroidism in HIV-infected patients is not an autoimmune disease. Horm Res, 66, 21-6.
BELTRAND, J., ALISON, M., NICOLESCU, R., VERKAUSKIENE, R., DEGHMOUN, S., SIBONY, O.,
SEBAG, G. & LEVY-MARCHAL, C. 2008. Bone mineral content at birth is determined both by
birth weight and fetal growth pattern. Pediatr Res, 64, 86-90.
BENAVIDES-SERRALDE, A., HERNANDEZ-ANDRADE, E., FERNANDEZ-DELGADO, J.,
PLASENCIA, W., SCHEIER, M., CRISPI, F., FIGUERAS, F., NICOLAIDES, K. H. &
GRATACOS, E. 2009. Three-dimensional sonographic calculation of the volume of intracranial
structures in growth-restricted and appropriate-for-gestational age fetuses. Ultrasound Obstet
Gynecol, 33, 530-7.
BENITEZ, S. G., CASTRO, A. E., PATTERSON, S. I., MUNOZ, E. M. & SELTZER, A. M. 2014. Hypoxic
preconditioning differentially affects GABAergic and glutamatergic neuronal cells in the injured
cerebellum of the neonatal rat. PLoS One, 9, e102056.
BENNETT, M. L., BENNETT, F. C., LIDDELOW, S. A., AJAMI, B., ZAMANIAN, J. L., FERNHOFF, N.
B., MULINYAWE, S. B., BOHLEN, C. J., ADIL, A., TUCKER, A., WEISSMAN, I. L., CHANG,
E. F., LI, G., GRANT, G. A., HAYDEN GEPHART, M. G. & BARRES, B. A. 2016. New tools for
studying microglia in the mouse and human CNS. 113, E1738-E1746.
BERBEL, P., AUSO, E., GARCIA-VELASCO, J. V., MOLINA, M. L. & CAMACHO, M. 2001. Role of
thyroid hormones in the maturation and organisation of rat barrel cortex. Neuroscience, 107, 383-94.
BERBEL, P., GUADANO-FERRAZ, A., ANGULO, A. & RAMON CEREZO, J. 1994. Role of thyroid
hormones in the maturation of interhemispheric connections in rats. Behav Brain Res, 64, 9-14.
BERBEL, P., NAVARRO, D., AUSO, E., VAREA, E., RODRIGUEZ, A. E., BALLESTA, J. J., SALINAS,
M., FLORES, E., FAURA, C. C. & DE ESCOBAR, G. M. 2010. Role of late maternal thyroid
hormones in cerebral cortex development: an experimental model for human prematurity. Cereb
Cortex, 20, 1462-75.
BERNAL, J. 2007. Thyroid hormone receptors in brain development and function. Nat Clin Pract
Endocrinol Metab, 3, 249-59.
BERNSTEIN, I. M., HORBAR, J. D., BADGER, G. J., OHLSSON, A. & GOLAN, A. 2000. Morbidity and
mortality among very-low-birth-weight neonates with intrauterine growth restriction. The Vermont
Oxford Network. Am J Obstet Gynecol, 182, 198-206.
BETTENDORF, M., SCHMIDT, K. G., TIEFENBACHER, U., GRULICH-HENN, J., HEINRICH, U. E. &
SCHONBERG, D. K. 1997. Transient secondary hypothyroidism in children after cardiac surgery.
Pediatr Res, 41, 375-9.
BHUTTA, Z. A., DARMSTADT, G. L., HASAN, B. S. & HAWS, R. A. 2005. Community-based
interventions for improving perinatal and neonatal health outcomes in developing countries: a review
of the evidence. Pediatrics, 115, 519-617.

Reference List
152
BIANCO, A. C., SALVATORE, D., GEREBEN, B., BERRY, M. J. & LARSEN, P. R. 2002. Biochemistry,
cellular and molecular biology, and physiological roles of the iodothyronine selenodeiodinases.
Endocr Rev, 23, 38-89.
BILLON, N., TOKUMOTO, Y., FORREST, D. & RAFF, M. 2001. Role of thyroid hormone receptors in
timing oligodendrocyte differentiation. Dev Biol, 235, 110-20.
BIRAN, V., VERNEY, C. & FERRIERO, D. M. 2012. Perinatal cerebellar injury in human and animal
models. Neurol Res Int, 2012, 858929.
BLOOM, J. S. & HYND, G. W. 2005. The role of the corpus callosum in interhemispheric transfer of
information: excitation or inhibition? Neuropsychol Rev, 15, 59-71.
BOCKHORST, K. H., NARAYANA, P. A., LIU, R., AHOBILA-VIJJULA, P., RAMU, J., KAMEL, M.,
WOSIK, J., BOCKHORST, T., HAHN, K., HASAN, K. M. & PEREZ-POLO, J. R. 2008. Early
postnatal development of rat brain: in vivo diffusion tensor imaging. J Neurosci Res, 86, 1520-8.
BOGGS, J. M. 2006. Myelin basic protein: a multifunctional protein. Cell Mol Life Sci, 63, 1945-61.
BOHN, M. C. & FRIEDRICH, V. L., JR. 1982. Recovery of myelination in rat optic nerve after
developmental retardation by cortisol. J Neurosci, 2, 1292-8.
BON, C., RAUDRANT, D., POLOCE, F., CHAMPION, F., GOLFIER, F., PICHOT, J. & REVOL, A. 2007.
[Biochemical profile of fetal blood sampled by cordocentesis in 35 pregnancies complicated by
growth retardation]. Pathol Biol (Paris), 55, 111-20.
BONFERONI, M. C., ROSSI, S., SANDRI, G., FERRARI, F., GAVINI, E., RASSU, G. & GIUNCHEDI, P.
2019. Nanoemulsions for "Nose-to-Brain" Drug Delivery. Pharmaceutics, 11.
BONGERS-SCHOKKING, J. J., KOOT, H. M., WIERSMA, D., VERKERK, P. H. & DE MUINCK
KEIZER-SCHRAMA, S. M. 2000. Influence of timing and dose of thyroid hormone replacement on
development in infants with congenital hypothyroidism. J Pediatr, 136, 292-7.
BONGERS-SCHOKKING, J. J. & SCHOPMAN, W. 1984. Thyroid function in healthy normal, low
birthweight and preterm infants. Eur J Pediatr, 143, 117-22.
BOZZETTI, V., PATERLINI, G., MERONI, V., DELORENZO, P., GAZZOLO, D., VAN BEL, F.,
VISSER, G. H., VALSECCHI, M. & TAGLIABUE, P. E. 2012. Evaluation of splanchnic oximetry,
Doppler flow velocimetry in the superior mesenteric artery and feeding tolerance in very low birth
weight IUGR and non-IUGR infants receiving bolus versus continuous enteral nutrition. BMC
Pediatr, 12, 106.
BRAND, M. M. & BIGNAMI, A. 1969. The effects of chronic hypoxia on the neonatal and infantile brain.
A neuropathological study of five premature infants with the respiratory distress syndrome treated by
prolonged artificial ventilation. Brain, 92, 233-54.
BRENNER, B. M. & CHERTOW, G. M. 1993. Congenital oligonephropathy: an inborn cause of adult
hypertension and progressive renal injury? Curr Opin Nephrol Hypertens, 2, 691-5.
BRODAL, P. & BJAALIE, J. G. 1992. Organization of the pontine nuclei. Neurosci Res, 13, 83-118.
BRODY, B. A., KINNEY, H. C., KLOMAN, A. S. & GILLES, F. H. 1987. Sequence of central nervous
system myelination in human infancy. I. An autopsy study of myelination. J Neuropathol Exp
Neurol, 46, 283-301.
BROWN, L. D. & HAY, W. W., JR. 2016. Impact of placental insufficiency on fetal skeletal muscle growth.
Mol Cell Endocrinol, 435, 69-77.
BUCKNER, R. L. 2013. The cerebellum and cognitive function: 25 years of insight from anatomy and
neuroimaging. Neuron, 80, 807-15.
BURKE, C., SINCLAIR, K., COWIN, G., ROSE, S., PAT, B., GOBE, G. & COLDITZ, P. 2006.
Intrauterine growth restriction due to uteroplacental vascular insufficiency leads to increased
hypoxia-induced cerebral apoptosis in newborn piglets. Brain Res, 1098, 19-25.
BUSINELLI, C., DE WIT, C., VISSER, G. H. & PISTORIUS, L. R. 2014. Ultrasound evaluation of cortical
brain development in fetuses with intrauterine growth restriction. J Matern Fetal Neonatal Med, 1-6.
CALVO, R., OBREGON, M. J., RUIZ DE ONA, C., ESCOBAR DEL REY, F. & MORREALE DE
ESCOBAR, G. 1990. Congenital hypothyroidism, as studied in rats. Crucial role of maternal
thyroxine but not of 3,5,3'-triiodothyronine in the protection of the fetal brain. J Clin Invest, 86, 889-
99.
CAMERON, H. A., WOOLLEY, C. S., MCEWEN, B. S. & GOULD, E. 1993. Differentiation of newly born
neurons and glia in the dentate gyrus of the adult rat. Neuroscience, 56, 337-44.
CAPRAU, D., SCHOBER, M. E., BASS, K., O'GRADY, S., KE, X., BLOCK, B., CALLAWAY, C. W.,
HALE, M., YU, X., MCKNIGHT, R. A., KESNER, R. P. & LANE, R. H. 2012. Altered expression

Reference List
153
and chromatin structure of the hippocampal IGF1r gene is associated with impaired hippocampal
function in the adult IUGR male rat. J Dev Orig Health Dis, 3, 83-91.
CARPENTIER, P. A., HADITSCH, U., BRAUN, A. E., CANTU, A. V., MOON, H. M., PRICE, R. O.,
ANDERSON, M. P., SARAVANAPANDIAN, V., ISMAIL, K., RIVERA, M., WEIMANN, J. M. &
PALMER, T. D. 2013. Stereotypical alterations in cortical patterning are associated with maternal
illness-induced placental dysfunction. J Neurosci, 33, 16874-88.
CASTLE, V., ANDREW, M., KELTON, J., GIRON, D., JOHNSTON, M. & CARTER, C. 1986. Frequency
and mechanism of neonatal thrombocytopenia. J Pediatr, 108, 749-55.
CATTEAU, J., GERNET, J. I., MARRET, S., LEGROS, H., GRESSENS, P., LEROUX, P. &
LAUDENBACH, V. 2011. Effects of antenatal uteroplacental hypoperfusion on neonatal
microvascularisation and excitotoxin sensitivity in mice. Pediatr Res, 70, 229-35.
CAVINESS, V. S., JR., TAKAHASHI, T. & NOWAKOWSKI, R. S. 1995. Numbers, time and neocortical
neuronogenesis: a general developmental and evolutionary model. Trends Neurosci, 18, 379-83.
CHA, C. J., GELARDI, N. L. & OH, W. 1987. Growth and cellular composition in rats with intrauterine
growth retardation: effects of postnatal nutrition. J Nutr, 117, 1463-8.
CHAN, P. Y., MORRIS, J. M., LESLIE, G. I., KELLY, P. J. & GALLERY, E. D. 2010. The long-term
effects of prematurity and intrauterine growth restriction on cardiovascular, renal, and metabolic
function. Int J Pediatr, 2010, 280402.
CHAN, S. Y., HANCOX, L. A., MARTIN-SANTOS, A., LOUBIERE, L. S., WALTER, M. N.,
GONZALEZ, A. M., COX, P. M., LOGAN, A., MCCABE, C. J., FRANKLYN, J. A. & KILBY, M.
D. 2014. MCT8 expression in human fetal cerebral cortex is reduced in severe intrauterine growth
restriction. J Endocrinol, 220, 85-95.
CHANG, C. H., CHANG, F. M., YU, C. H., KO, H. C. & CHEN, H. Y. 2000. Assessment of fetal cerebellar
volume using three-dimensional ultrasound. Ultrasound Med Biol, 26, 981-8.
CHAPMAN, C. D., FREY, W. H., 2ND, CRAFT, S., DANIELYAN, L., HALLSCHMID, M., SCHIOTH,
H. B. & BENEDICT, C. 2013. Intranasal treatment of central nervous system dysfunction in
humans. Pharm Res, 30, 2475-84.
CHARVET, C. J. & FINLAY, B. L. 2018. Comparing Adult Hippocampal Neurogenesis Across Species:
Translating Time to Predict the Tempo in Humans. Front Neurosci, 12, 706.
CHASE, H. P., WELCH, N. N., DABIERE, C. S., VASAN, N. S. & BUTTERFIELD, L. J. 1972. Alterations
in human brain biochemistry following intrauterine growth retardation. Pediatrics, 50, 403-11.
CHERUBINI, E. & MILES, R. 2015. The CA3 region of the hippocampus: how is it? What is it for? How
does it do it? Front Cell Neurosci, 9, 19.
CHOWDHRY, P., SCANLON, J. W., AUERBACH, R. & ABBASSI, V. 1984. Results of controlled double-
blind study of thyroid replacement in very low-birth-weight premature infants with
hypothyroxinemia. Pediatrics, 73, 301-5.
CHUNGA VEGA, F., GOMEZ DE TEJADA, M. J., GONZALEZ HACHERO, J., PEREZ CANO, R. &
CORONEL RODRIGUEZ, C. 1996. Low bone mineral density in small for gestational age infants:
correlation with cord blood zinc concentrations. Arch Dis Child Fetal Neonatal Ed, 75, F126-9.
CLOS, J., FAVRE, C., SELME-MATRAT, M. & LEGRAND, J. 1977. Effects of undernutrition on cell
formation in the rat brain and specially on cellular composition of the cerebellum. Brain Res, 123,
13-26.
COMFORT, C., GARRASTAZU, G., POZZOLI, M. & SONVICO, F. 2015. Opportunities and challenges
for the nasal administration of nanoemulsions. Curr Top Med Chem, 15, 356-68.
COOPER, H. E., KADEN, E., HALLIDAY, L. F., BAMIOU, D. E., MANKAD, K., PETERS, C. &
CLARK, C. A. 2019. White matter microstructural abnormalities in children with severe congenital
hypothyroidism. Neuroimage Clin, 24, 101980.
COSTELLO, P. M., ROWLERSON, A., ASTAMAN, N. A., ANTHONY, F. E., SAYER, A. A., COOPER,
C., HANSON, M. A. & GREEN, L. R. 2008. Peri-implantation and late gestation maternal
undernutrition differentially affect fetal sheep skeletal muscle development. J Physiol, 586, 2371-9.
COUPE, B., GRIT, I., HULIN, P., RANDUINEAU, G. & PARNET, P. 2012. Postnatal growth after
intrauterine growth restriction alters central leptin signal and energy homeostasis. PLoS One, 7,
e30616.
COURCHESNE, E., CHISUM, H. J., TOWNSEND, J., COWLES, A., COVINGTON, J., EGAAS, B.,
HARWOOD, M., HINDS, S. & PRESS, G. A. 2000. Normal brain development and aging:
quantitative analysis at in vivo MR imaging in healthy volunteers. Radiology, 216, 672-82.

Reference List
154
COWETT, R. M., SUSA, J. B., OH, W. & SCHWARTZ, R. 1984. Glucose kinetics in glucose-infused small
for gestational age infants. Pediatr Res, 18, 74-9.
CRAIG, A., LING LUO, N., BEARDSLEY, D. J., WINGATE-PEARSE, N., WALKER, D. W., HOHIMER,
A. R. & BACK, S. A. 2003. Quantitative analysis of perinatal rodent oligodendrocyte lineage
progression and its correlation with human. Exp Neurol, 181, 231-40.
CSEREP, C., POSFAI, B., LENART, N., FEKETE, R., LASZLO, Z. I., LELE, Z., ORSOLITS, B.,
MOLNAR, G., HEINDL, S., SCHWARCZ, A. D., UJVARI, K., KORNYEI, Z., TOTH, K.,
SZABADITS, E., SPERLAGH, B., BARANYI, M., CSIBA, L., HORTOBAGYI, T.,
MAGLOCZKY, Z., MARTINECZ, B., SZABO, G., ERDELYI, F., SZIPOCS, R., TAMKUN, M.
M., GESIERICH, B., DUERING, M., KATONA, I., LIESZ, A., TAMAS, G. & DENES, A. 2020.
Microglia monitor and protect neuronal function through specialized somatic purinergic junctions.
Science, 367, 528-537.
CUMBERLAND, A. L., PALLISER, H. K., RANI, P., WALKER, D. W. & HIRST, J. J. 2017. Effects of
combined IUGR and prenatal stress on the development of the hippocampus in a fetal guinea pig
model. J Dev Orig Health Dis, 8, 584-596.
DE BIE, H. M., OOSTROM, K. J., BOERSMA, M., VELTMAN, D. J., BARKHOF, F., DELEMARRE-
VAN DE WAAL, H. A. & VAN DEN HEUVEL, M. P. 2011. Global and regional differences in
brain anatomy of young children born small for gestational age. PLoS One, 6, e24116.
DE BIE, H. M., OOSTROM, K. J. & DELEMARRE-VAN DE WAAL, H. A. 2010. Brain development,
intelligence and cognitive outcome in children born small for gestational age. Horm Res Paediatr,
73, 6-14.
DE BLASIO, M. J., GATFORD, K. L., ROBINSON, J. S. & OWENS, J. A. 2006. Placental restriction alters
circulating thyroid hormone in the young lamb postnatally. Am J Physiol Regul Integr Comp
Physiol, 291, R1016-24.
DE ONIS, M., BLOSSNER, M. & VILLAR, J. 1998. Levels and patterns of intrauterine growth retardation
in developing countries. Eur J Clin Nutr, 52 Suppl 1, S5-15.
DEACON, R. M. 2013. Measuring motor coordination in mice. J Vis Exp, e2609.
DELCOUR, M., RUSSIER, M., AMIN, M., BAUD, O., PABAN, V., BARBE, M. F. & COQ, J. O. 2012.
Impact of prenatal ischemia on behavior, cognitive abilities and neuroanatomy in adult rats with
white matter damage. Behav Brain Res, 232, 233-44.
DERKSEN-LUBSEN, G. & VERKERK, P. H. 1996. Neuropsychologic development in early treated
congenital hypothyroidism: analysis of literature data. Pediatr Res, 39, 561-6.
DESAI, J., YASSA, L., MARQUSEE, E., GEORGE, S., FRATES, M. C., CHEN, M. H., MORGAN, J. A.,
DYCHTER, S. S., LARSEN, P. R., DEMETRI, G. D. & ALEXANDER, E. K. 2006.
Hypothyroidism after sunitinib treatment for patients with gastrointestinal stromal tumors. Ann
Intern Med, 145, 660-4.
DI COSMO, C., ET AL 2009. A thyroid hormone analog with reduced dependence on the
monocarboxylate transporter 8 for tissue transport. Endocrinology, 150, 4450-4458.
DI COSMO, C., LIAO, X. H., DUMITRESCU, A. M., WEISS, R. E. & REFETOFF, S. 2009. A thyroid
hormone analog with reduced dependence on the monocarboxylate transporter 8 for tissue transport.
Endocrinology, 150, 4450-8.
DICKINSON, H., ELLERY, S., DAVIES-TUCK, M., TOLCOS, M., NITSOS, I., WALKER, D. W. &
MILLER, S. L. 2017. Description of a method for inducing fetal growth restriction in the spiny
mouse. J Dev Orig Health Dis, 8, 550-555.
DIETRICH, J. W., LANDGRAFE, G. & FOTIADOU, E. H. 2012. TSH and Thyrotropic Agonists: Key
Actors in Thyroid Homeostasis. J Thyroid Res, 2012, 351864.
DOBBING, J. & SANDS, J. 1979. Comparative aspects of the brain growth spurt. Early Hum Dev, 3, 79-83.
DONKELAAR, H. J., LAMMENS, M., WESSELING, P., THIJSSEN, H. O. & RENIER, W. O. 2003.
Development and developmental disorders of the human cerebellum. J Neurol, 250, 1025-36.
DREW, P. D. & CHAVIS, J. A. 2000. Inhibition of microglial cell activation by cortisol. Brain Res Bull, 52,
391-6.
DUBOIS, J., BENDERS, M., BORRADORI-TOLSA, C., CACHIA, A., LAZEYRAS, F., HA-VINH
LEUCHTER, R., SIZONENKO, S. V., WARFIELD, S. K., MANGIN, J. F. & HUPPI, P. S. 2008.
Primary cortical folding in the human newborn: an early marker of later functional development.
Brain, 131, 2028-41.

Reference List
155
DUBUIS, J. M., GLORIEUX, J., RICHER, F., DEAL, C. L., DUSSAULT, J. H. & VAN VLIET, G. 1996.
Outcome of severe congenital hypothyroidism: closing the developmental gap with early high dose
levothyroxine treatment. J Clin Endocrinol Metab, 81, 222-7.
DUVERNOY, H. M. 2005. The human hippocampus: functional anatomy, vascularization and serial
sections with MRI, Springer Science & Business Media.
DYER, C. A., PHILIBOTTE, T. M., WOLF, M. K. & BILLINGS-GAGLIARDI, S. 1994. Myelin basic
protein mediates extracellular signals that regulate microtubule stability in oligodendrocyte
membrane sheets. J Neurosci Res, 39, 97-107.
EGANA-UGRINOVIC, G., SANZ-CORTES, M., COUVE-PEREZ, C., FIGUERAS, F. & GRATACOS, E.
2014. Corpus callosum differences assessed by fetal MRI in late-onset intrauterine growth restriction
and its association with neurobehavior. Prenat Diagn, 34, 843-9.
EGANA-UGRINOVIC, G., SANZ-CORTES, M., FIGUERAS, F., BARGALLO, N. & GRATACOS, E.
2013. Differences in cortical development assessed by fetal MRI in late-onset intrauterine growth
restriction. Am J Obstet Gynecol, 209, 126 e1-8.
EIKENES, L., MARTINUSSEN, M. P., LUND, L. K., LOHAUGEN, G. C., INDREDAVIK, M. S.,
JACOBSEN, G. W., SKRANES, J., BRUBAKK, A. M. & HABERG, A. K. 2012a. Being born
small for gestational age reduces white matter integrity in adulthood: a prospective cohort study.
Pediatr Res, 72, 649-54.
EIKENES, L., MARTINUSSEN, M. P., LUND, L. K., LOHAUGEN, G. C., INDREDAVIK, M. S.,
JACOBSEN, G. W., SKRANES, J., BRUBAKK, A. M. & HABERG, A. K. 2012b. Being born
small for gestational age reduces white matter integrity in adulthood: a prospective cohort study.
Pediatric research, 72, 649-54.
EIXARCH, E., BATALLE, D., ILLA, M., MUNOZ-MORENO, E., ARBAT-PLANA, A., AMAT-
ROLDAN, I., FIGUERAS, F. & GRATACOS, E. 2012. Neonatal neurobehavior and diffusion MRI
changes in brain reorganization due to intrauterine growth restriction in a rabbit model. PLoS One, 7,
e31497.
ENG, L. F., VANDERHAEGHEN, J. J., BIGNAMI, A. & GERSTL, B. 1971. An acidic protein isolated
from fibrous astrocytes. Brain Res, 28, 351-4.
ERBLICH, B., ZHU, L., ETGEN, A. M., DOBRENIS, K. & POLLARD, J. W. 2011. Absence of colony
stimulation factor-1 receptor results in loss of microglia, disrupted brain development and olfactory
deficits. PLoS One, 6, e26317.
ERIKSSON, P. S., PERFILIEVA, E., BJORK-ERIKSSON, T., ALBORN, A. M., NORDBORG, C.,
PETERSON, D. A. & GAGE, F. H. 1998. Neurogenesis in the adult human hippocampus. Nat Med,
4, 1313-7.
ESCOBAR, G. M. D., OBREGON, M. & REY, F. E. D. 2004. Role of thyroid hormone during early brain
development %J European Journal of Endocrinology Eur J Endocrinol. 151, U25.
ESTEBAN, F. J., PADILLA, N., SANZ-CORTES, M., DE MIRAS, J. R., BARGALLO, N.,
VILLOSLADA, P. & GRATACOS, E. 2010. Fractal-dimension analysis detects cerebral changes in
preterm infants with and without intrauterine growth restriction. Neuroimage, 53, 1225-32.
EVANS, R. M. 1988. The steroid and thyroid hormone receptor superfamily. Science, 240, 889-95.
FAHEY, A. J., BRAMELD, J. M., PARR, T. & BUTTERY, P. J. 2005. The effect of maternal undernutrition
before muscle differentiation on the muscle fiber development of the newborn lamb. J Anim Sci, 83,
2564-71.
FAN, H., FAVERO, M. & VOGEL, M. W. 2001. Elimination of Bax expression in mice increases cerebellar
purkinje cell numbers but not the number of granule cells. J Comp Neurol, 436, 82-91.
FANCY, S. P., HARRINGTON, E. P., YUEN, T. J., SILBEREIS, J. C., ZHAO, C., BARANZINI, S. E.,
BRUCE, C. C., OTERO, J. J., HUANG, E. J., NUSSE, R., FRANKLIN, R. J. & ROWITCH, D. H.
2011. Axin2 as regulatory and therapeutic target in newborn brain injury and remyelination. Nat
Neurosci, 14, 1009-16.
FAUQUIER, T., CHATONNET, F., PICOU, F., RICHARD, S., FOSSAT, N., AGUILERA, N.,
LAMONERIE, T. & FLAMANT, F. 2014. Purkinje cells and Bergmann glia are primary targets of
the TRalpha1 thyroid hormone receptor during mouse cerebellum postnatal development.
Development, 141, 166-75.
FERRARA, A. M., LIAO, X. H., YE, H., WEISS, R. E., DUMITRESCU, A. M. & REFETOFF, S. 2015.
The Thyroid Hormone Analog DITPA Ameliorates Metabolic Parameters of Male Mice With Mct8
Deficiency. Endocrinology, 156, 3889-94.

Reference List
156
FITSIORI, A., NGUYEN, D., KARENTZOS, A., DELAVELLE, J. & VARGAS, M. I. 2011. The corpus
callosum: white matter or terra incognita. Br J Radiol, 84, 5-18.
FLANAGAN, D. E., MOORE, V. M., GODSLAND, I. F., COCKINGTON, R. A., ROBINSON, J. S. &
PHILLIPS, D. I. 2000. Fetal growth and the physiological control of glucose tolerance in adults: a
minimal model analysis. Am J Physiol Endocrinol Metab, 278, E700-6.
FLOOD, K., UNTERSCHEIDER, J., DALY, S., GEARY, M. P., KENNELLY, M. M., MCAULIFFE, F.
M., O'DONOGHUE, K., HUNTER, A., MORRISON, J. J., BURKE, G., DICKER, P., TULLY, E.
C. & MALONE, F. D. 2014. The role of brain sparing in the prediction of adverse outcomes in
intrauterine growth restriction: results of the multicenter PORTO Study. Am J Obstet Gynecol, 211,
288 e1-5.
FRASER, A., EBRAHIM, S., BEN-SHLOMO, Y., DAVEY SMITH, G. & LAWLOR, D. A. 2007.
Intrauterine growth retardation, insulin resistance, and nonalcoholic fatty liver disease in children:
response to Nobili et al. Diabetes Care, 30, e124; author reply e125.
FRASER, P. E., RAND, R. P. & DEBER, C. M. 1989. Bilayer-stabilizing properties of myelin basic protein
in dioleoylphosphatidylethanolamine systems. Biochim Biophys Acta, 983, 23-9.
FRENCH, H. M., REID, M., MAMONTOV, P., SIMMONS, R. A. & GRINSPAN, J. B. 2009. Oxidative
stress disrupts oligodendrocyte maturation. J Neurosci Res, 87, 3076-87.
FRIESEMA, E. C., GANGULY, S., ABDALLA, A., MANNING FOX, J. E., HALESTRAP, A. P. &
VISSER, T. J. 2003. Identification of monocarboxylate transporter 8 as a specific thyroid hormone
transporter. J Biol Chem, 278, 40128-35.
FUGGLE, P. W., GRANT, D. B., SMITH, I. & MURPHY, G. 1991. Intelligence, motor skills and behaviour
at 5 years in early-treated congenital hypothyroidism. Eur J Pediatr, 150, 570-4.
FUNG, C., KE, X., BROWN, A. S., YU, X., MCKNIGHT, R. A. & LANE, R. H. 2012. Uteroplacental
insufficiency alters rat hippocampal cellular phenotype in conjunction with ErbB receptor
expression. Pediatr Res, 72, 2-9.
GACCIOLI, F. & LAGER, S. 2016. Placental Nutrient Transport and Intrauterine Growth Restriction. Front
Physiol, 7, 40.
GALLO, L. A., TRAN, M., MORITZ, K. M., MAZZUCA, M. Q., PARRY, L. J., WESTCOTT, K. T.,
JEFFERIES, A. J., CULLEN-MCEWEN, L. A. & WLODEK, M. E. 2012. Cardio-renal and
metabolic adaptations during pregnancy in female rats born small: implications for maternal health
and second generation fetal growth. J Physiol, 590, 617-30.
GARCIA-CABEZAS, M. A., JOHN, Y. J., BARBAS, H. & ZIKOPOULOS, B. 2016. Distinction of
Neurons, Glia and Endothelial Cells in the Cerebral Cortex: An Algorithm Based on Cytological
Features. Front Neuroanat, 10, 107.
GEREBEN, B., ZAVACKI, A. M., RIBICH, S., KIM, B. W., HUANG, S. A., SIMONIDES, W. S., ZEOLD,
A. & BIANCO, A. C. 2008. Cellular and molecular basis of deiodinase-regulated thyroid hormone
signaling. Endocr Rev, 29, 898-938.
GEVA, R., ESHEL, R., LEITNER, Y., FATTAL-VALEVSKI, A. & HAREL, S. 2006a. Memory functions
of children born with asymmetric intrauterine growth restriction. Brain Res, 1117, 186-94.
GEVA, R., ESHEL, R., LEITNER, Y., VALEVSKI, A. F. & HAREL, S. 2006b. Neuropsychological
outcome of children with intrauterine growth restriction: a 9-year prospective study. Pediatrics, 118,
91-100.
GHOUMARI, A. M., WEHRLE, R., BERNARD, O., SOTELO, C. & DUSART, I. 2000. Implication of Bcl-
2 and Caspase-3 in age-related Purkinje cell death in murine organotypic culture: an in vitro model
to study apoptosis. Eur J Neurosci, 12, 2935-49.
GLICKSTEIN, M. & DORON, K. 2008. Cerebellum: connections and functions. Cerebellum, 7, 589-94.
GLUCKMAN, P. D., CUTFIELD, W., HARDING, J. E., MILNER, D., JENSEN, E., WOODHALL, S.,
GALLAHER, B., BAUER, M. & BREIER, B. H. 1996. Metabolic consequences of intrauterine
growth retardation. Acta Paediatr Suppl, 417, 3-6; discussion 7.
GODFREY, K. M. & BARKER, D. J. 2001. Fetal programming and adult health. Public Health Nutr, 4,
611-24.
GOLDMAN, S., MCCARREN, M., MORKIN, E., LADENSON, P. W., EDSON, R., WARREN, S., OHM,
J., THAI, H., CHURBY, L., BARNHILL, J., O'BRIEN, T., ANAND, I., WARNER, A., HATTLER,
B., DUNLAP, M., ERIKSON, J., SHIH, M. C. & LAVORI, P. 2009. DITPA (3,5-
Diiodothyropropionic Acid), a thyroid hormone analog to treat heart failure: phase II trial veterans
affairs cooperative study. Circulation, 119, 3093-100.

Reference List
157
GOLDSTEIN, A., COVINGTON, B. P., MAHABADI, N. & MESFIN, F. B. 2020. Neuroanatomy, Corpus
Callosum. StatPearls. Treasure Island (FL).
GOODMAN, J. H. & GILBERT, M. E. 2007. Modest thyroid hormone insufficiency during development
induces a cellular malformation in the corpus callosum: a model of cortical dysplasia.
Endocrinology, 148, 2593-7.
GORSKI, J. A., TALLEY, T., QIU, M., PUELLES, L., RUBENSTEIN, J. L. & JONES, K. R. 2002. Cortical
excitatory neurons and glia, but not GABAergic neurons, are produced in the Emx1-expressing
lineage. J Neurosci, 22, 6309-14.
GOTTSCHALK, B., RICHMAN, R. A. & LEWANDOWSKI, L. 1994. Subtle speech and motor deficits of
children with congenital hypothyroid treated early. Dev Med Child Neurol, 36, 216-20.
GOULD, E., TANAPAT, P., HASTINGS, N. B. & SHORS, T. J. 1999. Neurogenesis in adulthood: a
possible role in learning. Trends Cogn Sci, 3, 186-192.
GRAEBER, M. B., LI, W. & RODRIGUEZ, M. L. 2011. Role of microglia in CNS inflammation. FEBS
Lett, 585, 3798-805.
GREISEN, G. & BORCH, K. 2001. White matter injury in the preterm neonate: the role of perfusion. Dev
Neurosci, 23, 209-12.
GUPTA, R. K., BHATIA, V., POPTANI, H. & GUJRAL, R. B. 1995. Brain metabolite changes on in vivo
proton magnetic resonance spectroscopy in children with congenital hypothyroidism. J Pediatr, 126,
389-92.
HADDOW, J. E., PALOMAKI, G. E., ALLAN, W. C., WILLIAMS, J. R., KNIGHT, G. J., GAGNON, J.,
O'HEIR, C. E., MITCHELL, M. L., HERMOS, R. J., WAISBREN, S. E., FAIX, J. D. & KLEIN, R.
Z. 1999. Maternal thyroid deficiency during pregnancy and subsequent neuropsychological
development of the child. N Engl J Med, 341, 549-55.
HAGBERG, H., MALLARD, C., FERRIERO, D. M., VANNUCCI, S. J., LEVISON, S. W., VEXLER, Z. S.
& GRESSENS, P. 2015. The role of inflammation in perinatal brain injury. Nat Rev Neurol, 11, 192-
208.
HALDIPUR, P., BHARTI, U., ALBERTI, C., SARKAR, C., GULATI, G., IYENGAR, S., GRESSENS, P.
& MANI, S. 2011. Preterm delivery disrupts the developmental program of the cerebellum. PLoS
One, 6, e23449.
HALES, C. N., BARKER, D. J., CLARK, P. M., COX, L. J., FALL, C., OSMOND, C. & WINTER, P. D.
1991. Fetal and infant growth and impaired glucose tolerance at age 64. BMJ, 303, 1019-22.
HAMANO, K., TAKEYA, T., IWASAKI, N., NAKAYAMA, J., OHTO, T. & OKADA, Y. 1998. A
quantitative study of the progress of myelination in the rat central nervous system, using the
immunohistochemical method for proteolipid protein. Brain Res Dev Brain Res, 108, 287-93.
HANSON, L. R. & FREY, W. H., 2ND 2008. Intranasal delivery bypasses the blood-brain barrier to target
therapeutic agents to the central nervous system and treat neurodegenerative disease. BMC Neurosci,
9 Suppl 3, S5.
HARRIS, J., TOMASSY, G. S. & ARLOTTA, P. 2015. Building blocks of the cerebral cortex: from
development to the dish. Wiley Interdiscip Rev Dev Biol, 4, 529-44.
HARRY, G. J. 2012. Neuroinflammation: a need to understand microglia as resident cells of the developing
brain. Neurotoxicology, 33, 558-9.
HARVEY, C. B., O'SHEA, P. J., SCOTT, A. J., ROBSON, H., SIEBLER, T., SHALET, S. M., SAMARUT,
J., CHASSANDE, O. & WILLIAMS, G. R. 2002. Molecular mechanisms of thyroid hormone effects
on bone growth and function. Mol Genet Metab, 75, 17-30.
HATTEN, M. E. 1990. Riding the glial monorail: a common mechanism for glial-guided neuronal migration
in different regions of the developing mammalian brain. Trends Neurosci, 13, 179-84.
HAYASHI, T. T. & DORKO, M. E. 1988. A rat model for the study of intrauterine growth retardation. Am J
Obstet Gynecol, 158, 1203-7.
HAYMOND, M. W., KARL, I. E. & PAGLIARA, A. S. 1974. Increased gluconeogenic substrates in the
small-for-gestational-age infant. N Engl J Med, 291, 322-8.
HERCULANO-HOUZEL, S. 2009. The human brain in numbers: a linearly scaled-up primate brain. Front
Hum Neurosci, 3, 31.
HERRERA, E. A., ALEGRIA, R., FARIAS, M., DIAZ-LOPEZ, F., HERNANDEZ, C., UAUY, R.,
REGNAULT, T. R., CASANELLO, P. & KRAUSE, B. J. 2016. Assessment of in vivo fetal growth
and placental vascular function in a novel intrauterine growth restriction model of progressive
uterine artery occlusion in guinea pigs. J Physiol, 594, 1553-61.

Reference List
158
HINDMARSH, P. C. 2002. Optimisation of thyroxine dose in congenital hypothyroidism. Arch Dis Child,
86, 73-5.
HOFMAN, P. L., CUTFIELD, W. S., ROBINSON, E. M., BERGMAN, R. N., MENON, R. K., SPERLING,
M. A. & GLUCKMAN, P. D. 1997. Insulin resistance in short children with intrauterine growth
retardation. J Clin Endocrinol Metab, 82, 402-6.
HORN, S., KERSSEBOOM, S., MAYERL, S., MULLER, J., GROBA, C., TRAJKOVIC-ARSIC, M.,
ACKERMANN, T., VISSER, T. J. & HEUER, H. 2013. Tetrac can replace thyroid hormone during
brain development in mouse mutants deficient in the thyroid hormone transporter mct8.
Endocrinology, 154, 968-79.
HOTOURA, E., ARGYROPOULOU, M., PAPADOPOULOU, F., GIAPROS, V., DROUGIA, A.,
NIKOLOPOULOS, P. & ANDRONIKOU, S. 2005. Kidney development in the first year of life in
small-for-gestational-age preterm infants. Pediatr Radiol, 35, 991-4.
HU, X., NESIC-TAYLOR, O., QIU, J., REA, H. C., FABIAN, R., RASSIN, D. K. & PEREZ-POLO, J. R.
2005. Activation of nuclear factor-kappaB signaling pathway by interleukin-1 after
hypoxia/ischemia in neonatal rat hippocampus and cortex. J Neurochem, 93, 26-37.
IBARROLA, N. & RODRIGUEZ-PENA, A. 1997. Hypothyroidism coordinately and transiently affects
myelin protein gene expression in most rat brain regions during postnatal development. Brain Res,
752, 285-93.
ILLA, M., EIXARCH, E., BATALLE, D., ARBAT-PLANA, A., MUNOZ-MORENO, E., FIGUERAS, F. &
GRATACOS, E. 2013. Long-term functional outcomes and correlation with regional brain
connectivity by MRI diffusion tractography metrics in a near-term rabbit model of intrauterine
growth restriction. PLoS One, 8, e76453.
JACOBSEN, B. B. & HUMMER, L. 1979. Changes in serum concentrations of thyroid hormones and
thyroid hormone-binding proteins during early infancy. Studies in healthy fullterm, small-for-
gestational age and preterm infants aged 7 to 240 days. Acta Paediatr Scand, 68, 411-8.
JAGANNATHAN, N. R., TANDON, N., RAGHUNATHAN, P. & KOCHUPILLAI, N. 1998. Reversal of
abnormalities of myelination by thyroxine therapy in congenital hypothyroidism: localized in vivo
proton magnetic resonance spectroscopy (MRS) study. Brain Res Dev Brain Res, 109, 179-86.
JAKOVCEVSKI, I., FILIPOVIC, R., MO, Z., RAKIC, S. & ZECEVIC, N. 2009. Oligodendrocyte
development and the onset of myelination in the human fetal brain. Front Neuroanat, 3, 5.
JANSSON, T. & LAMBERT, G. W. 1999. Effect of intrauterine growth restriction on blood pressure,
glucose tolerance and sympathetic nervous system activity in the rat at 3-4 months of age. J
Hypertens, 17, 1239-48.
JAQUET, D., GABORIAU, A., CZERNICHOW, P. & LEVY-MARCHAL, C. 2000. Insulin resistance early
in adulthood in subjects born with intrauterine growth retardation. J Clin Endocrinol Metab, 85,
1401-6.
JOHNSTON, D. E. 1999. Special considerations in interpreting liver function tests. Am Fam Physician, 59,
2223-30.
KALANJATI, V. P., WIXEY, J. A., MILLER, S. M., COLDITZ, P. B. & BJORKMAN, S. T. 2017.
GABAA receptor expression and white matter disruption in intrauterine growth restricted piglets. Int
J Dev Neurosci, 59, 1-9.
KARLBERG, J. & ALBERTSSON-WIKLAND, K. 1995. Growth in full-term small-for-gestational-age
infants: from birth to final height. Pediatr Res, 38, 733-9.
KE, X., LEI, Q., JAMES, S. J., KELLEHER, S. L., MELNYK, S., JERNIGAN, S., YU, X., WANG, L.,
CALLAWAY, C. W., GILL, G., CHAN, G. M., ALBERTINE, K. H., MCKNIGHT, R. A. & LANE,
R. H. 2006. Uteroplacental insufficiency affects epigenetic determinants of chromatin structure in
brains of neonatal and juvenile IUGR rats. Physiol Genomics, 25, 16-28.
KE, X., XING, B., YU, B., YU, X., MAJNIK, A., COHEN, S., LANE, R. & JOSS-MOORE, L. 2014. IUGR
disrupts the PPARgamma-Setd8-H4K20me(1) and Wnt signaling pathways in the juvenile rat
hippocampus. Int J Dev Neurosci, 38, 59-67.
KERSSEBOOM, S., HORN, S., VISSER, W. E., CHEN, J., FRIESEMA, E. C., VAURS-BARRIERE, C.,
PEETERS, R. P., HEUER, H. & VISSER, T. J. 2014. In vitro and mouse studies supporting
therapeutic utility of triiodothyroacetic acid in MCT8 deficiency. Mol Endocrinol, 28, 1961-70.
KESHAVAN, M. S., DIWADKAR, V. A., DEBELLIS, M., DICK, E., KOTWAL, R., ROSENBERG, D. R.,
SWEENEY, J. A., MINSHEW, N. & PETTEGREW, J. W. 2002. Development of the corpus
callosum in childhood, adolescence and early adulthood. Life Sci, 70, 1909-22.

Reference List
159
KESNER, R. P. 2013. A process analysis of the CA3 subregion of the hippocampus. Front Cell Neurosci, 7,
78.
KESSARIS, N., FOGARTY, M., IANNARELLI, P., GRIST, M., WEGNER, M. & RICHARDSON, W. D.
2006. Competing waves of oligodendrocytes in the forebrain and postnatal elimination of an
embryonic lineage. Nat Neurosci, 9, 173-9.
KIER, E. L. & TRUWIT, C. L. 1997. The lamina rostralis: modification of concepts concerning the
anatomy, embryology, and MR appearance of the rostrum of the corpus callosum. AJNR Am J
Neuroradiol, 18, 715-22.
KILBY, M. D., GITTOES, N., MCCABE, C., VERHAEG, J. & FRANKLYN, J. A. 2000. Expression of
thyroid receptor isoforms in the human fetal central nervous system and the effects of intrauterine
growth restriction. Clin Endocrinol (Oxf), 53, 469-77.
KILBY, M. D., VERHAEG, J., GITTOES, N., SOMERSET, D. A., CLARK, P. M. & FRANKLYN, J. A.
1998. Circulating thyroid hormone concentrations and placental thyroid hormone receptor
expression in normal human pregnancy and pregnancy complicated by intrauterine growth restriction
(IUGR). J Clin Endocrinol Metab, 83, 2964-71.
KINNEY HC, A. D. 2002. Perinatal neuropathology. Greenfield’s Neuropathology, Graham DI, Lantos PE,
eds., 557–59.
KIRKINEZOS, I. G. & MORAES, C. T. 2001. Reactive oxygen species and mitochondrial diseases. Semin
Cell Dev Biol, 12, 449-57.
KLUGMANN, M., SCHWAB, M. H., PUHLHOFER, A., SCHNEIDER, A., ZIMMERMANN, F.,
GRIFFITHS, I. R. & NAVE, K. A. 1997. Assembly of CNS myelin in the absence of proteolipid
protein. Neuron, 18, 59-70.
KOHRLE, J. 1999. Local activation and inactivation of thyroid hormones: the deiodinase family. Mol Cell
Endocrinol, 151, 103-19.
KOIBUCHI, N. 2008. The role of thyroid hormone on cerebellar development. Cerebellum, 7, 530-3.
KOOISTRA, L., VAN DER MEERE, J. J., VULSMA, T. & KALVERBOER, A. F. 1996. Sustained
attention problems in children with early treated congenital hypothyroidism. Acta Paediatr, 85, 425-
9.
KOTHARI, A. & GIRLING, J. 2008. Hypothyroidism in pregnancy: pre-pregnancy thyroid status influences
gestational thyroxine requirements. BJOG, 115, 1704-8.
KOTTER, M. R., LI, W. W., ZHAO, C. & FRANKLIN, R. J. 2006. Myelin impairs CNS remyelination by
inhibiting oligodendrocyte precursor cell differentiation. J Neurosci, 26, 328-32.
KRISHNA, U. & BHALERAO, S. 2011. Placental insufficiency and fetal growth restriction. J Obstet
Gynaecol India, 61, 505-11.
KUCHNA, I. 1994. Quantitative studies of human newborns' hippocampal pyramidal cells after perinatal
hypoxia. Folia Neuropathol, 32, 9-16.
KUSH, M., HARMAN, C., BASCHAT, A., 2004. Intrauterine growth restriction (IUGR) and neonatal
hypothyroidism. American Journal of Obstetrics & Gynecology, 191.
LADENSON, P. W., MCCARREN, M., MORKIN, E., EDSON, R. G., SHIH, M. C., WARREN, S. R.,
BARNHILL, J. G., CHURBY, L., THAI, H., O'BRIEN, T., ANAND, I., WARNER, A., HATTLER,
B., DUNLAP, M., ERIKSON, J. & GOLDMAN, S. 2010. Effects of the thyromimetic agent
diiodothyropropionic acid on body weight, body mass index, and serum lipoproteins: a pilot
prospective, randomized, controlled study. J Clin Endocrinol Metab, 95, 1349-54.
LADINIG, A., FOXCROFT, G., ASHLEY, C., LUNNEY, J. K., PLASTOW, G. & HARDING, J. C. 2014.
Birth weight, intrauterine growth retardation and fetal susceptibility to porcine reproductive and
respiratory syndrome virus. PLoS One, 9, e109541.
LAFRANCHI, S. 1999. Congenital hypothyroidism: etiologies, diagnosis, and management. Thyroid, 9, 735-
40.
LAKER, R. C., WLODEK, M. E., WADLEY, G. D., GALLO, L. A., MEIKLE, P. J. & MCCONELL, G. K.
2012. Exercise early in life in rats born small does not normalize reductions in skeletal muscle PGC-
1alpha in adulthood. Am J Physiol Endocrinol Metab, 302, E1221-30.
LAMBERT, K. G., GERECKE, K. M., QUADROS, P. S., DOUDERA, E., JASNOW, A. M. & KINSLEY,
C. H. 2000. Activity-stress increases density of GFAP-immunoreactive astrocytes in the rat
hippocampus. Stress, 3, 275-84.
LANE, R. H., KELLEY, D. E., GRUETZMACHER, E. M. & DEVASKAR, S. U. 2001a. Uteroplacental
insufficiency alters hepatic fatty acid-metabolizing enzymes in juvenile and adult rats. Am J Physiol
Regul Integr Comp Physiol, 280, R183-90.

Reference List
160
LANE, R. H., RAMIREZ, R. J., TSIRKA, A. E., KLOESZ, J. L., MCLAUGHLIN, M. K.,
GRUETZMACHER, E. M. & DEVASKAR, S. U. 2001b. Uteroplacental insufficiency lowers the
threshold towards hypoxia-induced cerebral apoptosis in growth-retarded fetal rats. Brain Res, 895,
186-93.
LANS, M. C., SPIERTZ, C., BROUWER, A. & KOEMAN, J. H. 1994. Different competition of thyroxine
binding to transthyretin and thyroxine-binding globulin by hydroxy-PCBs, PCDDs and PCDFs. Eur
J Pharmacol, 270, 129-36.
LARCIPRETE, G., VALENSISE, H., DI PIERRO, G., VASAPOLLO, B., CASALINO, B., ARDUINI, D.,
JARVIS, S. & CIRESE, E. 2005. Intrauterine growth restriction and fetal body composition.
Ultrasound Obstet Gynecol, 26, 258-62.
LATINI, G., DE MITRI, B., DEL VECCHIO, A., CHITANO, G., DE FELICE, C. & ZETTERSTROM, R.
2004. Foetal growth of kidneys, liver and spleen in intrauterine growth restriction: "programming"
causing "metabolic syndrome" in adult age. Acta Paediatr, 93, 1635-9.
LEE, J. Y., KIM, M. J., DELIYANTI, D., AZARI, M. F., ROSSELLO, F., COSTIN, A., RAMM, G.,
STANLEY, E. G., ELEFANTY, A. G., WILKINSON-BERKA, J. L. & PETRATOS, S. 2017.
Overcoming Monocarboxylate Transporter 8 (MCT8)-Deficiency to Promote Human
Oligodendrocyte Differentiation and Myelination. EBioMedicine, 25, 122-135.
LENEMAN, M., BUCHANAN, L. & ROVET, J. 2001. Where and what visuospatial processing in
adolescents with congenital hypothyroidism. J Int Neuropsychol Soc, 7, 556-62.
LEUNG, E. K., YI, X., REFETOFF, S. & YEO, K. T. 2016. Diiodothyropropionic acid (DITPA) cross-
reacts with thyroid function assays on different immunoassay platforms. Clin Chim Acta, 453, 203-4.
LEVENTOPOULOS, M., RUEDI-BETTSCHEN, D., KNUESEL, I., FELDON, J., PRYCE, C. R. &
OPACKA-JUFFRY, J. 2007. Long-term effects of early life deprivation on brain glia in Fischer rats.
Brain Res, 1142, 119-26.
LIMESAND, S. W., ROZANCE, P. J., ZERBE, G. O., HUTTON, J. C. & HAY, W. W., JR. 2006.
Attenuated insulin release and storage in fetal sheep pancreatic islets with intrauterine growth
restriction. Endocrinology, 147, 1488-97.
LIN, C. H., GELARDI, N. L., CHA, C. J. & OH, W. 1998. Cerebral metabolic response to hypoglycemia in
severe intrauterine growth-retarded rat pups. Early Hum Dev, 52, 1-11.
LINGAS, R., DEAN, F. & MATTHEWS, S. G. 1999. Maternal nutrient restriction (48 h) modifies brain
corticosteroid receptor expression and endocrine function in the fetal guinea pig. Brain Res, 846,
236-42.
LITHELL, H. O., MCKEIGUE, P. M., BERGLUND, L., MOHSEN, R., LITHELL, U. B. & LEON, D. A.
1996. Relation of size at birth to non-insulin dependent diabetes and insulin concentrations in men
aged 50-60 years. BMJ, 312, 406-10.
LIU, C., LIN, G., WANG, X., WANG, T., WU, G., LI, D. & WANG, J. 2013. Intrauterine growth restriction
alters the hepatic proteome in fetal pigs. J Nutr Biochem, 24, 954-9.
LIU, J., LIU, L. & CHEN, H. 2011. Antenatal taurine supplementation for improving brain ultrastructure in
fetal rats with intrauterine growth restriction. Neuroscience, 181, 265-70.
LODYGENSKY, G. A., SEGHIER, M. L., WARFIELD, S. K., TOLSA, C. B., SIZONENKO, S.,
LAZEYRAS, F. & HUPPI, P. S. 2008. Intrauterine growth restriction affects the preterm infant's
hippocampus. Pediatr Res, 63, 438-43.
LOPEZ-ESPINDOLA, D., MORALES-BASTOS, C., GRIJOTA-MARTINEZ, C., LIAO, X. H., LEV, D.,
SUGO, E., VERGE, C. F., REFETOFF, S., BERNAL, J. & GUADANO-FERRAZ, A. 2014.
Mutations of the thyroid hormone transporter MCT8 cause prenatal brain damage and persistent
hypomyelination. J Clin Endocrinol Metab, 99, E2799-804.
LORINI, R., GASTALDI, R., TRAGGIAI, C. & PERUCCHIN, P. P. 2003. Hashimoto's Thyroiditis. Pediatr
Endocrinol Rev, 1 Suppl 2, 205-11; discussion 211.
LOW, J. A., GALBRAITH, R. S., MUIR, D., KILLEN, H., KARCHMAR, J. & CAMPBELL, D. 1978.
Intrauterine growth retardation: a preliminary report of long-term morbidity. Am J Obstet Gynecol,
130, 534-45.
LUCAS, A., MORLEY, R. & FEWTRELL, M. S. 1996. Low triiodothyronine concentration in preterm
infants and subsequent intelligence quotient (IQ) at 8 year follow up. BMJ, 312, 1132-3; discussion
1133-4.
LUCIA, F. S., PACHECO-TORRES, J., GONZALEZ-GRANERO, S., CANALS, S., OBREGON, M. J.,
GARCIA-VERDUGO, J. M. & BERBEL, P. 2018. Transient Hypothyroidism During Lactation

Reference List
161
Arrests Myelination in the Anterior Commissure of Rats. A Magnetic Resonance Image and Electron
Microscope Study. Front Neuroanat, 12, 31.
LUDERS, E., THOMPSON, P. M. & TOGA, A. W. 2010. The development of the corpus callosum in the
healthy human brain. J Neurosci, 30, 10985-90.
LUSKIN, M. B., PARNAVELAS, J. G. & BARFIELD, J. A. 1993. Neurons, astrocytes, and
oligodendrocytes of the rat cerebral cortex originate from separate progenitor cells: an ultrastructural
analysis of clonally related cells. J Neurosci, 13, 1730-50.
M. DO CARMO PINHO FRANCO, D. N., Z.B. FORTES, R.C. TOSTES, M.H. CARVALHO, S.R.
LUCAS, ET AL. 2003. Intrauterine undernutrition—renal and vascular origin of hypertension
Cardiovasc Res 60, 228-234
MACKENZIE, H. S. & BRENNER, B. M. 1995. Fewer nephrons at birth: a missing link in the etiology of
essential hypertension? Am J Kidney Dis, 26, 91-8.
MACLENNAN, A. H., THOMPSON, S. C. & GECZ, J. 2015. Cerebral palsy: causes, pathways, and the role
of genetic variants. Am J Obstet Gynecol, 213, 779-88.
MACNABB, C., O'HARE, E., CLEARY, J. & GEORGOPOULOS, A. P. 2000. Varied duration of
congenital hypothyroidism potentiates perseveration in a response alternation discrimination task.
Neurosci Res, 36, 121-7.
MALINGER, G. & ZAKUT, H. 1993. The corpus callosum: normal fetal development as shown by
transvaginal sonography. AJR Am J Roentgenol, 161, 1041-3.
MALLARD, C., LOELIGER, M., COPOLOV, D. & REES, S. 2000. Reduced number of neurons in the
hippocampus and the cerebellum in the postnatal guinea-pig following intrauterine growth-
restriction. Neuroscience, 100, 327-33.
MALLARD, E. C., REHN, A., REES, S., TOLCOS, M. & COPOLOV, D. 1999. Ventriculomegaly and
reduced hippocampal volume following intrauterine growth-restriction: implications for the
aetiology of schizophrenia. Schizophr Res, 40, 11-21.
MAN, J., HUTCHINSON, J. C., ASHWORTH, M., JEFFREY, I., HEAZELL, A. E. & SEBIRE, N. J. 2016.
Organ weights and ratios for postmortem identification of fetal growth restriction: utility and
confounding factors. Ultrasound Obstet Gynecol, 48, 585-590.
MARIA IZABEL CHIAMOLERA, F. E. W. 2009. Thyrotropin-Releasing Hormone and the Thyroid
Hormone Feedback Mechanism Endocrinology, 150, Pages 1091–1096,
https://doi.org/10.1210/en.2008-1795.
MARIN-PADILLA, M. 1983. Structural organization of the human cerebral cortex prior to the appearance of
the cortical plate. Anat Embryol (Berl), 168, 21-40.
MARTINEZ, R. & GOMES, F. C. A. 2005. Proliferation of cerebellar neurons induced by astrocytes treated
with thyroid hormone is mediated by a cooperation between cell contact and soluble factors and
involves the epidermal growth factor-protein kinase a pathway. 80, 341-349.
MARTORELL, R., RAMAKRISHNAN, U., SCHROEDER, D. G., MELGAR, P. & NEUFELD, L. 1998.
Intrauterine growth retardation, body size, body composition and physical performance in
adolescence. Eur J Clin Nutr, 52 Suppl 1, S43-52; discussion S52-3.
MAYO, L., TRAUGER, S. A., BLAIN, M., NADEAU, M., PATEL, B., ALVAREZ, J. I.,
MASCANFRONI, I. D., YESTE, A., KIVISAKK, P., KALLAS, K., ELLEZAM, B., BAKSHI, R.,
PRAT, A., ANTEL, J. P., WEINER, H. L. & QUINTANA, F. J. 2014. Regulation of astrocyte
activation by glycolipids drives chronic CNS inflammation. Nat Med, 20, 1147-56.
MAZZUCA, M. Q., WLODEK, M. E., DRAGOMIR, N. M., PARKINGTON, H. C. & TARE, M. 2010.
Uteroplacental insufficiency programs regional vascular dysfunction and alters arterial stiffness in
female offspring. J Physiol, 588, 1997-2010.
MCDOUGALL, A. R. A., HALE, N., REES, S., HARDING, R., DE MATTEO, R., HOOPER, S. B. &
TOLCOS, M. 2017a. Erythropoietin Protects Against Lipopolysaccharide-Induced Microgliosis and
Abnormal Granule Cell Development in the Ovine Fetal Cerebellum. Front Cell Neurosci, 11, 224.
MCDOUGALL, A. R. A., WIRADJAJA, V., AZHAN, A., LI, A., HALE, N., WLODEK, M. E., HOOPER,
S. B., WALLACE, M. J. & TOLCOS, M. 2017b. Intrauterine Growth Restriction Alters the
Postnatal Development of the Rat Cerebellum. Dev Neurosci, 39, 215-227.
MCINTYRE, S., BLAIR, E., BADAWI, N., KEOGH, J. & NELSON, K. B. 2013. Antecedents of cerebral
palsy and perinatal death in term and late preterm singletons. Obstet Gynecol, 122, 869-77.

Reference List
162
MCKENZIE, I. A., OHAYON, D., LI, H., DE FARIA, J. P., EMERY, B., TOHYAMA, K. &
RICHARDSON, W. D. 2014. Motor skill learning requires active central myelination. Science, 346,
318-22.
MCLEAN, T. R., RANK, M. M., SMOOKER, P. M. & RICHARDSON, S. J. 2017. Evolution of thyroid
hormone distributor proteins. Mol Cell Endocrinol, 459, 43-52.
MEIJER, W. J., VERLOOVE-VANHORICK, S. P., BRAND, R. & VAN DEN BRANDE, J. L. 1992.
Transient hypothyroxinaemia associated with developmental delay in very preterm infants. Arch Dis
Child, 67, 944-7.
MERZOUK, H., MEGHELLI-BOUCHENAK, M., EL-KORSO, N., BELLEVILLE, J. & PROST, J. 1998.
Low birth weight at term impairs cord serum lipoprotein compositions and concentrations. Eur J
Pediatr, 157, 321-6.
MILLER, R. H. 2002. Regulation of oligodendrocyte development in the vertebrate CNS. Prog Neurobiol,
67, 451-67.
MILLER, S. L., HUPPI, P. S. & MALLARD, C. 2016. The consequences of fetal growth restriction on brain
structure and neurodevelopmental outcome. J Physiol, 594, 807-23.
MISIUNAS, A., NIEPOMNISZCZE, H., RAVERA, B., FARAJ, G. & FAURE, E. 1995. Peripheral
neuropathy in subclinical hypothyroidism. Thyroid, 5, 283-6.
MOLINA GIRALDO, S., ALFONSO AYALA, D. A., ARREAZA GRATEROL, M., PEREZ OLIVO, J. L.
& SOLANO MONTERO, A. F. 2019. Three-dimensional Doppler ultrasonography for the
assessment of fetal liver vascularization in fetuses with intrauterine growth restriction. Int J
Gynaecol Obstet, 144, 260-264.
MONSET-COUCHARD, M. & DE BETHMANN, O. 2000. Catch-up growth in 166 small-for- gestational
age premature infants weighing less than 1,000 g at birth. Biol Neonate, 78, 161-7.
MONSET-COUCHARD, M., DE BETHMANN, O. & RELIER, J. P. 2004. Long term outcome of small
versus appropriate size for gestational age co-twins/triplets. Arch Dis Child Fetal Neonatal Ed, 89,
F310-4.
MORAND, O., CHANEZ, C., MASSON, M., DUMONT, O., FLEXOR, M. A., BAUMANN, N. &
BOURRE, J. M. 1981. Intrauterine growth retardation (malnutrition by vascular ligation) induces
modifications in fatty acid composition of neurons and oligodendrocytes. J Neurochem, 37, 1057-60.
MORITZ, K. M., MAZZUCA, M. Q., SIEBEL, A. L., MIBUS, A., ARENA, D., TARE, M., OWENS, J. A.
& WLODEK, M. E. 2009. Uteroplacental insufficiency causes a nephron deficit, modest renal
insufficiency but no hypertension with ageing in female rats. J Physiol, 587, 2635-46.
MUELLER, S. G., CHAO, L. L., BERMAN, B. & WEINER, M. W. 2011. Evidence for functional
specialization of hippocampal subfields detected by MR subfield volumetry on high resolution
images at 4 T. Neuroimage, 56, 851-7.
MURKI, S. 2014. Intrauterine Growth Retardation - A Review Article. Journal of Neonatal Biology, 03.
NAEYE, R. L. 1965. Malnutrition: Probable Cause of Fetal Growth Retardation. Arch Pathol, 79, 284-91.
NAJMI, S. B., HASHEMIPOUR, M., MARACY, M. R., HOVSEPIAN, S. & GHASEMI, M. 2013.
Intelligence quotient in children with congenital hypothyroidism: The effect of diagnostic and
treatment variables. J Res Med Sci, 18, 395-9.
NAMGUNG, R. & TSANG, R. C. 2000. Factors affecting newborn bone mineral content: in utero effects on
newborn bone mineralization. Proc Nutr Soc, 59, 55-63.
NAMGUNG, R. & TSANG, R. C. 2003. Bone in the pregnant mother and newborn at birth. Clin Chim Acta,
333, 1-11.
NASH, J. E. & PERSAUD, T. V. 1988. Embryopathic risks of cigarette smoking. Exp Pathol, 33, 65-73.
NATHANIEL, E. J., NATHANIEL, D. R., NATHANIEL, L. M., BURT, S. & PANFILI, F. 1988. Effect of
thyroxine replacement therapy on the growth patterns of body, brain, and cerebellum in the neonatal
hypothyroid rat. Exp Neurol, 101, 1-16.
NG, S. M., TURNER, M. A., GAMBLE, C., DIDI, M., VICTOR, S., ATKINSON, J., SLUMING, V.,
PARKES, L. M., TIETZE, A., ABERNETHY, L. J. & WEINDLING, A. M. 2014. Effect of
thyroxine on brain microstructure in extremely premature babies: magnetic resonance imaging
findings in the TIPIT study. Pediatric Radiology, 44, 987-996.
NICHOLL, R. M., DEENMAMODE, J. M. & GAMSU, H. R. 2008. Intrauterine growth restriction, visceral
blood flow velocity and exocrine pancreatic function. BMC Res Notes, 1, 115.
NICHOLS, N. R., OSTERBURG, H. H., MASTERS, J. N., MILLAR, S. L. & FINCH, C. E. 1990.
Messenger RNA for glial fibrillary acidic protein is decreased in rat brain following acute and
chronic corticosterone treatment. Brain Res Mol Brain Res, 7, 1-7.

Reference List
163
NITSOS, I. & REES, S. 1990. The effects of intrauterine growth retardation on the development of neuroglia
in fetal guinea pigs. An immunohistochemical and an ultrastructural study. Int J Dev Neurosci, 8,
233-44.
NOCTOR, S. C., MARTINEZ-CERDENO, V., IVIC, L. & KRIEGSTEIN, A. R. 2004. Cortical neurons
arise in symmetric and asymmetric division zones and migrate through specific phases. Nat
Neurosci, 7, 136-44.
NOGUCHI, T. & SUGISAKI, T. 1984. Hypomyelination in the cerebrum of the congenitally hypothyroid
mouse (hyt). J Neurochem, 42, 891-3.
NOGUCHI, T., SUGISAKI, T., SATOH, I. & KUDO, M. 1985. Partial restoration of cerebral myelination of
the congenitally hypothyroid mouse by parenteral or breast milk administration of thyroxine. J
Neurochem, 45, 1419-26.
NUNEZ, J. L., NELSON, J., PYCH, J. C., KIM, J. H. & JURASKA, J. M. 2000. Myelination in the
splenium of the corpus callosum in adult male and female rats. Brain Res Dev Brain Res, 120, 87-90.
O'CALLAGHAN, J. P., BRINTON, R. E. & MCEWEN, B. S. 1991. Glucocorticoids regulate the synthesis
of glial fibrillary acidic protein in intact and adrenalectomized rats but do not affect its expression
following brain injury. J Neurochem, 57, 860-9.
O'DOWD, R., KENT, J. C., MOSELEY, J. M. & WLODEK, M. E. 2008. Effects of uteroplacental
insufficiency and reducing litter size on maternal mammary function and postnatal offspring growth.
Am J Physiol Regul Integr Comp Physiol, 294, R539-48.
O'HALLORAN, C. J., KINSELLA, G. J. & STOREY, E. 2012. The cerebellum and neuropsychological
functioning: a critical review. J Clin Exp Neuropsychol, 34, 35-56.
O'HARE, E., KIM, E. M., PAGE, D. & REID, R. 2015. Effects of thyroxine treatment on histology and
behavior using the methimazole model of congenital hypothyroidism in the rat. Neuroscience, 285,
128-38.
OGATA, E. S., BUSSEY, M. E., LABARBERA, A. & FINLEY, S. 1985. Altered growth, hypoglycemia,
hypoalaninemia, and ketonemia in the young rat: postnatal consequences of intrauterine growth
retardation. Pediatr Res, 19, 32-7.
OH, W., D'AMODIO, M. D., YAP, L. L. & HOHENAUER, L. 1970. Carbohydrate metabolism in
experimental intrauterine growth retardation in rats. Am J Obstet Gynecol, 108, 415-21.
OLIVARES, R., MONTIEL, J. & ABOITIZ, F. 2001. Species differences and similarities in the fine
structure of the mammalian corpus callosum. Brain Behav Evol, 57, 98-105.
OLIVIER, P., BAUD, O., BOUSLAMA, M., EVRARD, P., GRESSENS, P. & VERNEY, C. 2007.
Moderate growth restriction: deleterious and protective effects on white matter damage. Neurobiol
Dis, 26, 253-63.
OLIVIER, P., BAUD, O., EVRARD, P., GRESSENS, P. & VERNEY, C. 2005. Prenatal ischemia and white
matter damage in rats. J Neuropathol Exp Neurol, 64, 998-1006.
ORDOOEI, M., MOTTAGHIPISHEH, H., FALLAH, R. & RABIEE, A. 2014. Cognitive outcomes for
congenital hypothyroid and healthy children: a comparative study. Iran J Child Neurol, 8, 28-32.
PADILLA, N., FALCON, C., SANZ-CORTES, M., FIGUERAS, F., BARGALLO, N., CRISPI, F.,
EIXARCH, E., ARRANZ, A., BOTET, F. & GRATACOS, E. 2011. Differential effects of
intrauterine growth restriction on brain structure and development in preterm infants: a magnetic
resonance imaging study. Brain Res, 1382, 98-108.
PADILLA, N., JUNQUE, C., FIGUERAS, F., SANZ-CORTES, M., BARGALLO, N., ARRANZ, A.,
DONAIRE, A., FIGUERAS, J. & GRATACOS, E. 2014a. Differential vulnerability of gray matter
and white matter to intrauterine growth restriction in preterm infants at 12 months corrected age.
Brain research, 1545, 1-11.
PADILLA, N., JUNQUE, C., FIGUERAS, F., SANZ-CORTES, M., BARGALLO, N., ARRANZ, A.,
DONAIRE, A., FIGUERAS, J. & GRATACOS, E. 2014b. Differential vulnerability of gray matter
and white matter to intrauterine growth restriction in preterm infants at 12 months corrected age.
Brain Res, 1545, 1-11.
PATRICK, L. 2008. Iodine: deficiency and therapeutic considerations. Altern Med Rev, 13, 116-27.
PECKS, U., BRIEGER, M., SCHIESSL, B., BAUERSCHLAG, D. O., PIROTH, D., BRUNO, B.,
FITZNER, C., ORLIKOWSKY, T., MAASS, N. & RATH, W. 2012. Maternal and fetal cord blood
lipids in intrauterine growth restriction. J Perinat Med, 40, 287-96.
PECKS, U., RATH, W., MAASS, N., BERGER, B., LUEG, I., FARROKH, A., FARROKH, S. &
ECKMANN-SCHOLZ, C. 2016. Fetal gender and gestational age differentially affect PCSK9 levels
in intrauterine growth restriction. Lipids Health Dis, 15, 193.

Reference List
164
PEDRAZA, L. 1997. Nuclear transport of myelin basic protein. J Neurosci Res, 50, 258-64.
PEDRAZA, L., FIDLER, L., STAUGAITIS, S. M. & COLMAN, D. R. 1997. The active transport of myelin
basic protein into the nucleus suggests a regulatory role in myelination. Neuron, 18, 579-89.
PENA, I. C., TEBERG, A. J. & FINELLO, K. M. 1988. The premature small-for-gestational-age infant
during the first year of life: comparison by birth weight and gestational age. J Pediatr, 113, 1066-73.
PENNOCK, G. D., RAYA, T. E., BAHL, J. J., GOLDMAN, S. & MORKIN, E. 1992. Cardiac effects of 3,5-
diiodothyropropionic acid, a thyroid hormone analog with inotropic selectivity. J Pharmacol Exp
Ther, 263, 163-9.
PETERS, C., VAN TROTSENBURG, A. S. P. & SCHOENMAKERS, N. 2018. DIAGNOSIS OF
ENDOCRINE DISEASE: Congenital hypothyroidism: update and perspectives. Eur J Endocrinol,
179, R297-R317.
PETERSIDE, I. E., SELAK, M. A. & SIMMONS, R. A. 2003. Impaired oxidative phosphorylation in
hepatic mitochondria in growth-retarded rats. Am J Physiol Endocrinol Metab, 285, E1258-66.
PETTIGREW, R., FYFE, J. C., GREGORY, B. L., LIPSITZ, D., DELAHUNTA, A., SUMMERS, B. A. &
SHELTON, G. D. 2007. CNS hypomyelination in Rat Terrier dogs with congenital goiter and a
mutation in the thyroid peroxidase gene. Vet Pathol, 44, 50-6.
PHAM, H., DUY, A. P., PANSIOT, J., BOLLEN, B., GALLEGO, J., CHARRIAUT-MARLANGUE, C. &
BAUD, O. 2015. Impact of inhaled nitric oxide on white matter damage in growth-restricted
neonatal rats. Pediatr Res, 77, 563-9.
PISU, M. B., GUIOLI, S., CONFORTI, E. & BERNOCCHI, G. 2003. Signal molecules and receptors in the
differential development of cerebellum lobules. Acute effects of cisplatin on nitric oxide and
glutamate systems in Purkinje cell population. Brain Res Dev Brain Res, 145, 229-40.
PLATZ, E. & NEWMAN, R. 2008. Diagnosis of IUGR: traditional biometry. Semin Perinatol, 32, 140-7.
PORTERFIELD, S. P. & HENDRICH, C. E. 1993. The role of thyroid hormones in prenatal and neonatal
neurological development--current perspectives. Endocr Rev, 14, 94-106.
PRAPUNPOJ, P., RICHARDSON, S. J., FUMAGALLI, L. & SCHREIBER, G. 2000. The evolution of the
thyroid hormone distributor protein transthyretin in the order insectivora, class mammalia. Mol Biol
Evol, 17, 1199-209.
PRICE, W. A., RONG, L., STILES, A. D. & D'ERCOLE, A. J. 1992. Changes in IGF-I and -II, IGF binding
protein, and IGF receptor transcript abundance after uterine artery ligation. Pediatr Res, 32, 291-5.
R. VALDEZ, M. A. A., G.H. THOMPSON, B.S. BRADSHAW, M.P. STERN 1994. Birth weight and adult
health outcomes in a biethnic population in the USA. Diabetologia, 37, 624-631.
RADULESCU, L., FERECHIDE, D. & POPA, F. 2013. The importance of fetal gender in intrauterine
growth restriction. J Med Life, 6, 38-9.
RAKIC, P. 1972. Mode of cell migration to the superficial layers of fetal monkey neocortex. J Comp Neurol,
145, 61-83.
RAKIC, P. & YAKOVLEV, P. I. 1968. Development of the corpus callosum and cavum septi in man. J
Comp Neurol, 132, 45-72.
RAKIC S, Z. N. 2002. Early oligodendrocyte progenitor cells in the human fetal
telencephalon. . 41, 117–27.
RAMLACKHANSINGH, A. F., BROOKS, D. J., GREENWOOD, R. J., BOSE, S. K., TURKHEIMER, F.
E., KINNUNEN, K. M., GENTLEMAN, S., HECKEMANN, R. A., GUNANAYAGAM, K.,
GELOSA, G. & SHARP, D. J. 2011. Inflammation after trauma: microglial activation and traumatic
brain injury. Ann Neurol, 70, 374-83.
RAMNANI, N. 2006. The primate cortico-cerebellar system: anatomy and function. Nat Rev Neurosci, 7,
511-22.
RAPARTI, G., JAIN, S., RAMTEKE, K., MURTHY, M., GHANGHAS, R., RAMANAND, S. &
RAMANAND, J. 2013. Selective thyroid hormone receptor modulators. Indian J Endocrinol Metab,
17, 211-8.
RASTOGI, M. V. & LAFRANCHI, S. H. 2010. Congenital hypothyroidism. Orphanet J Rare Dis, 5, 17.
RAZAVI, Z. & MOHAMMADI, L. 2016. Permanent and Transient Congenital Hypothyroidism in Hamadan
West Province of Iran. Int J Endocrinol Metab, 14, e38256.
REES, S., BOCKING, A. D. & HARDING, R. 1988. Structure of the fetal sheep brain in experimental
growth retardation. J Dev Physiol, 10, 211-25.
REES, S. & INDER, T. 2005. Fetal and neonatal origins of altered brain development. Early Hum Dev, 81,
753-61.

Reference List
165
REES, S., MALLARD, C., BREEN, S., STRINGER, M., COCK, M. & HARDING, R. 1998. Fetal brain
injury following prolonged hypoxemia and placental insufficiency: a review. Comp Biochem Physiol
A Mol Integr Physiol, 119, 653-60.
REGNAULT, T. R., ORBUS, R. J., DE VRIJER, B., DAVIDSEN, M. L., GALAN, H. L., WILKENING, R.
B. & ANTHONY, R. V. 2002. Placental expression of VEGF, PlGF and their receptors in a model of
placental insufficiency-intrauterine growth restriction (PI-IUGR). Placenta, 23, 132-44.
REID, M. V., MURRAY, K. A., MARSH, E. D., GOLDEN, J. A., SIMMONS, R. A. & GRINSPAN, J. B.
2012. Delayed myelination in an intrauterine growth retardation model is mediated by oxidative
stress upregulating bone morphogenetic protein 4. J Neuropathol Exp Neurol, 71, 640-53.
REID, R. E., KIM, E. M., PAGE, D., O'MARA, S. M. & O'HARE, E. 2007. Thyroxine replacement in an
animal model of congenital hypothyroidism. Physiol Behav, 91, 299-303.
REMMER, H. 1970. The role of theliver in drug metabolism. Am J Med, 49, 617-29.
RHOTON, A. L., JR. 2002. The cerebrum. Neurosurgery, 51, S1-51.
RICHARDS, L. J. 2002. Axonal pathfinding mechanisms at the cortical midline and in the development of
the corpus callosum. Braz J Med Biol Res, 35, 1431-9.
RICHARDSON, W. D., KESSARIS, N. & PRINGLE, N. 2006. Oligodendrocyte wars. Nat Rev Neurosci, 7,
11-8.
RICHARDSON, W. D., YOUNG, K. M., TRIPATHI, R. B. & MCKENZIE, I. 2011. NG2-glia as
multipotent neural stem cells: fact or fantasy? Neuron, 70, 661-73.
RIDEAU BATISTA NOVAIS, A., PHAM, H., VAN DE LOOIJ, Y., BERNAL, M., MAIRESSE, J., ZANA-
TAIEB, E., COLELLA, M., JARREAU, P. H., PANSIOT, J., DUMONT, F., SIZONENKO, S.,
GRESSENS, P., CHARRIAUT-MARLANGUE, C., TANTER, M., DEMENE, C., VAIMAN, D. &
BAUD, O. 2016. Transcriptomic regulations in oligodendroglial and microglial cells related to brain
damage following fetal growth restriction. Glia, 64, 2306-2320.
ROBERTS, A., NAVA, S., BOCCONI, L., SALMONA, S. & NICOLINI, U. 1999. Liver function tests and
glucose and lipid metabolism in growth-restricted fetuses. Obstet Gynecol, 94, 290-4.
ROBERTSON, C. M., ETCHES, P. C. & KYLE, J. M. 1990. Eight-year school performance and growth of
preterm, small for gestational age infants: a comparative study with subjects matched for birth
weight or for gestational age. J Pediatr, 116, 19-26.
RODRIGUEZ-PENA, A. 1999. Oligodendrocyte development and thyroid hormone. J Neurobiol, 40, 497-
512.
RODRIGUEZ-PENA, A., IBARROLA, N., INIGUEZ, M. A., MUNOZ, A. & BERNAL, J. 1993. Neonatal
hypothyroidism affects the timely expression of myelin-associated glycoprotein in the rat brain. J
Clin Invest, 91, 812-8.
ROMÁN, G. C., GHASSABIAN, A., BONGERS-SCHOKKING, J. J., JADDOE, V. W., HOFMAN, A., DE
RIJKE, Y. B., VERHULST, F. C. & TIEMEIER, H. 2013. Association of gestational maternal
hypothyroxinemia and increased autism risk. Ann Neurol, 74, 733-42.
ROMANO, T., WARK, J. D., OWENS, J. A. & WLODEK, M. E. 2009. Prenatal growth restriction and
postnatal growth restriction followed by accelerated growth independently program reduced bone
growth and strength. Bone, 45, 132-41.
ROSENBERG, A. 2008. The IUGR newborn. Semin Perinatol, 32, 219-24.
ROVET, J. F. & EHRLICH, R. M. 1995. Long-term effects of L-thyroxine therapy for congenital
hypothyroidism. J Pediatr, 126, 380-6.
SABOLEK, M., HERBORG, A., SCHWARZ, J. & STORCH, A. 2006. Dexamethasone blocks astroglial
differentiation from neural precursor cells. Neuroreport, 17, 1719-23.
SADIQ, H. F., DAS, U. G., TRACY, T. F. & DEVASKAR, S. U. 1999. Intra-uterine growth restriction
differentially regulates perinatal brain and skeletal muscle glucose transporters. Brain Res, 823, 96-
103.
SAEDERUP, N., CARDONA, A. E., CROFT, K., MIZUTANI, M., COTLEUR, A. C., TSOU, C. L.,
RANSOHOFF, R. M. & CHARO, I. F. 2010. Selective chemokine receptor usage by central nervous
system myeloid cells in CCR2-red fluorescent protein knock-in mice. PLoS One, 5, e13693.
SALINAS TEJEDOR, L., GUDI, V., KUCMAN, V., PUL, R., GINGELE, S., SÜHS, K.-W., STANGEL, M.
& SKRIPULETZ, T. 2015. Oligodendroglial markers in the cuprizone model of CNS de- and
remyelination. Histology and histopathology, 30, 1455-1464.
SAMPAIO-BAPTISTA, C., KHRAPITCHEV, A. A., FOXLEY, S., SCHLAGHECK, T., SCHOLZ, J.,
JBABDI, S., DELUCA, G. C., MILLER, K. L., TAYLOR, A., THOMAS, N., KLEIM, J., SIBSON,

Reference List
166
N. R., BANNERMAN, D. & JOHANSEN-BERG, H. 2013. Motor skill learning induces changes in
white matter microstructure and myelination. J Neurosci, 33, 19499-503.
SAMUELSEN, G. B., PAKKENBERG, B., BOGDANOVIC, N., GUNDERSEN, H. J., LARSEN, J. F.,
GRAEM, N. & LAURSEN, H. 2007. Severe cell reduction in the future brain cortex in human
growth-restricted fetuses and infants. Am J Obstet Gynecol, 197, 56 e1-7.
SCHAFER, D. P., LEHRMAN, E. K., KAUTZMAN, A. G., KOYAMA, R., MARDINLY, A. R.,
YAMASAKI, R., RANSOHOFF, R. M., GREENBERG, M. E., BARRES, B. A. & STEVENS, B.
2012. Microglia sculpt postnatal neural circuits in an activity and complement-dependent manner.
Neuron, 74, 691-705.
SCHANG, A. L., VAN STEENWINCKEL, J., CHEVENNE, D., ALKMARK, M., HAGBERG, H.,
GRESSENS, P. & FLEISS, B. 2014. Failure of thyroid hormone treatment to prevent inflammation-
induced white matter injury in the immature brain. Brain Behav Immun, 37, 95-102.
SCHINDELIN, J., ARGANDA-CARRERAS, I., FRISE, E., KAYNIG, V., LONGAIR, M., PIETZSCH, T.,
PREIBISCH, S., RUEDEN, C., SAALFELD, S., SCHMID, B., TINEVEZ, J. Y., WHITE, D. J.,
HARTENSTEIN, V., ELICEIRI, K., TOMANCAK, P. & CARDONA, A. 2012. Fiji: an open-source
platform for biological-image analysis. Nat Methods, 9, 676-82.
SCHMIDT, I. M., CHELLAKOOTY, M., BOISEN, K. A., DAMGAARD, I. N., MAU KAI, C.,
OLGAARD, K. & MAIN, K. M. 2005. Impaired kidney growth in low-birth-weight children:
distinct effects of maturity and weight for gestational age. Kidney Int, 68, 731-40.
SCHOONOVER, C. M., SEIBEL, M. M., JOLSON, D. M., STACK, M. J., RAHMAN, R. J., JONES, S. A.,
MARIASH, C. N. & ANDERSON, G. W. 2004. Thyroid hormone regulates oligodendrocyte
accumulation in developing rat brain white matter tracts. Endocrinology, 145, 5013-20.
SCHREIBER, G. & RICHARDSON, S. J. 1997. The evolution of gene expression, structure and function of
transthyretin. Comp Biochem Physiol B Biochem Mol Biol, 116, 137-60.
SCHREUDER, M., DELEMARRE-VAN DE WAAL, H. & VAN WIJK, A. 2006. Consequences of
intrauterine growth restriction for the kidney. Kidney Blood Press Res, 29, 108-25.
SCHROEDER, A. C. & PRIVALSKY, M. L. 2014. Thyroid hormones, t3 and t4, in the brain. Front
Endocrinol (Lausanne), 5, 40.
SCHULTE, T. & MULLER-OEHRING, E. M. 2010. Contribution of callosal connections to the
interhemispheric integration of visuomotor and cognitive processes. Neuropsychol Rev, 20, 174-90.
SCHWARTZ, C. E. & STEVENSON, R. E. 2007. The MCT8 thyroid hormone transporter and Allan-
Herndon-Dudley syndrome. Best Pract Res Clin Endocrinol Metab, 21, 307-21.
SEGOVIA, K. N., MCCLURE, M., MORAVEC, M., LUO, N. L., WAN, Y., GONG, X., RIDDLE, A.,
CRAIG, A., STRUVE, J., SHERMAN, L. S. & BACK, S. A. 2008. Arrested oligodendrocyte
lineage maturation in chronic perinatal white matter injury. Ann Neurol, 63, 520-30.
SELVA, K. A., HARPER, A., DOWNS, A., BLASCO, P. A. & LAFRANCHI, S. H. 2005.
Neurodevelopmental outcomes in congenital hypothyroidism: comparison of initial T4 dose and time
to reach target T4 and TSH. J Pediatr, 147, 775-80.
SELVA, K. A., MANDEL, S. H., RIEN, L., SESSER, D., MIYAHIRA, R., SKEELS, M., NELSON, J. C. &
LAFRANCHI, S. H. 2002. Initial treatment dose of L-thyroxine in congenital hypothyroidism. J
Pediatr, 141, 786-92.
SEMPLE, B. D., BLOMGREN, K., GIMLIN, K., FERRIERO, D. M. & NOBLE-HAEUSSLEIN, L. J. 2013.
Brain development in rodents and humans: Identifying benchmarks of maturation and vulnerability
to injury across species. Prog Neurobiol, 106-107, 1-16.
SHARMA, D., SHASTRI, S., FARAHBAKHSH, N. & SHARMA, P. 2016a. Intrauterine growth restriction
- part 1. J Matern Fetal Neonatal Med, 29, 3977-87.
SHARMA, D., SHASTRI, S. & SHARMA, P. 2016b. Intrauterine Growth Restriction: Antenatal and
Postnatal Aspects. Clin Med Insights Pediatr, 10, 67-83.
SHI, Y., KIRWAN, P., SMITH, J., ROBINSON, H. P. & LIVESEY, F. J. 2012. Human cerebral cortex
development from pluripotent stem cells to functional excitatory synapses. Nat Neurosci, 15, 477-86,
S1.
SHIELDS, A., THOMSON, M., WINTER, V., COALSON, J. & REES, S. 2012. Repeated courses of
antenatal corticosteroids have adverse effects on aspects of brain development in naturally delivered
baboon infants. Pediatr Res, 71, 661-7.
SILVER, L. E., DECAMPS, P. J., KORST, L. M., PLATT, L. D. & CASTRO, L. 2003. Intrauterine growth
restriction is accompanied by decreased renal volume in the human fetus. Am J Obstet Gynecol, 188,
1320-5.

Reference List
167
SIMMONS, R. A., GOUNIS, A. S., BANGALORE, S. A. & OGATA, E. S. 1992. Intrauterine growth
retardation: fetal glucose transport is diminished in lung but spared in brain. Pediatr Res, 31, 59-63.
SIMONEAU-ROY, J., MARTI, S., DEAL, C., HUOT, C., ROBAEY, P. & VAN VLIET, G. 2004.
Cognition and behavior at school entry in children with congenital hypothyroidism treated early with
high-dose levothyroxine. J Pediatr, 144, 747-52.
SINGHAL, A., FEWTRELL, M., COLE, T. J. & LUCAS, A. 2003. Low nutrient intake and early growth for
later insulin resistance in adolescents born preterm. Lancet, 361, 1089-97.
SIZONENKO, S. V., BORRADORI-TOLSA, C., BAUTHAY, D. M., LODYGENSKY, G., LAZEYRAS, F.
& HUPPI, P. 2006. Impact of intrauterine growth restriction and glucocorticoids on brain
development: insights using advanced magnetic resonance imaging. Mol Cell Endocrinol, 254-255,
163-71.
SKEAFF, S. A. 2011. Iodine deficiency in pregnancy: the effect on neurodevelopment in the child.
Nutrients, 3, 265-73.
SNIJDERS, R. J., ABBAS, A., MELBY, O., IRELAND, R. M. & NICOLAIDES, K. H. 1993. Fetal plasma
erythropoietin concentration in severe growth retardation. Am J Obstet Gynecol, 168, 615-9.
SOOTHILL, P. W., AJAYI, R. A. & NICOLAIDES, K. N. 1992. Fetal biochemistry in growth retardation.
Early Hum Dev, 29, 91-7.
SORIANO, E., DEL RIO, J. A., MARTINEZ, A. & SUPER, H. 1994. Organization of the embryonic and
early postnatal murine hippocampus. I. Immunocytochemical characterization of neuronal
populations in the subplate and marginal zone. J Comp Neurol, 342, 571-95.
SRIKANTHAN, P. & KARLAMANGLA, A. S. 2011. Relative muscle mass is inversely associated with
insulin resistance and prediabetes. Findings from the third National Health and Nutrition
Examination Survey. J Clin Endocrinol Metab, 96, 2898-903.
STANFIELD, B. B. & TRICE, J. E. 1988. Evidence that granule cells generated in the dentate gyrus of adult
rats extend axonal projections. Exp Brain Res, 72, 399-406.
STATHATOS, N. 2006. Anatomy and Physiology of the Thyroid Gland. NJ: Humana, Second Ed., 2-7.
STEVENS, D. A., HARVEY, C. B., SCOTT, A. J., O'SHEA, P. J., BARNARD, J. C., WILLIAMS, A. J.,
BRADY, G., SAMARUT, J., CHASSANDE, O. & WILLIAMS, G. R. 2003. Thyroid hormone
activates fibroblast growth factor receptor-1 in bone. Mol Endocrinol, 17, 1751-66.
STRAUSS, R. S. & DIETZ, W. H. 1998. Growth and development of term children born with low birth
weight: effects of genetic and environmental factors. J Pediatr, 133, 67-72.
SULLIVAN, E. V., ADALSTEINSSON, E., SOOD, R., MAYER, D., BELL, R., MCBRIDE, W., LI, T. K.
& PFEFFERBAUM, A. 2006. Longitudinal brain magnetic resonance imaging study of the alcohol-
preferring rat. Part I: adult brain growth. Alcohol Clin Exp Res, 30, 1234-47.
TAKENOUCHI, T., HEIER, L. A., ENGEL, M. & PERLMAN, J. M. 2010. Restricted diffusion in the
corpus callosum in hypoxic-ischemic encephalopathy. Pediatr Neurol, 43, 190-6.
TALOS, D. M., FOLLETT, P. L., FOLKERTH, R. D., FISHMAN, R. E., TRACHTENBERG, F. L.,
VOLPE, J. J. & JENSEN, F. E. 2006. Developmental regulation of alpha-amino-3-hydroxy-5-
methyl-4-isoxazole-propionic acid receptor subunit expression in forebrain and relationship to
regional susceptibility to hypoxic/ischemic injury. II. Human cerebral white matter and cortex. J
Comp Neurol, 497, 61-77.
TANAKA-ARAKAWA, M. M., MATSUI, M., TANAKA, C., UEMATSU, A., UDA, S., MIURA, K.,
SAKAI, T. & NOGUCHI, K. 2015. Developmental changes in the corpus callosum from infancy to
early adulthood: a structural magnetic resonance imaging study. PLoS One, 10, e0118760.
TASHIMA, L., NAKATA, M., ANNO, K., SUGINO, N. & KATO, H. 2001. Prenatal influence of ischemia-
hypoxia-induced intrauterine growth retardation on brain development and behavioral activity in
rats. Biol Neonate, 80, 81-7.
THOMPSON, C. C. & POTTER, G. B. 2000. Thyroid Hormone Action in Neural Development. Cerebral
Cortex, 10, 939-945.
THOMPSON, J. A., RICHARDSON, B. S., GAGNON, R. & REGNAULT, T. R. 2011. Chronic intrauterine
hypoxia interferes with aortic development in the late gestation ovine fetus. J Physiol, 589, 3319-32.
THORN, S. R., REGNAULT, T. R., BROWN, L. D., ROZANCE, P. J., KENG, J., ROPER, M.,
WILKENING, R. B., HAY, W. W., JR. & FRIEDMAN, J. E. 2009. Intrauterine growth restriction
increases fetal hepatic gluconeogenic capacity and reduces messenger ribonucleic acid translation
initiation and nutrient sensing in fetal liver and skeletal muscle. Endocrinology, 150, 3021-30.
THORPE-BEESTON, J. G., NICOLAIDES, K. H., SNIJDERS, R. J., FELTON, C. V. & MCGREGOR, A.
M. 1991. Thyroid function in small for gestational age fetuses. Obstet Gynecol, 77, 701-6.

Reference List
168
TOLCOS, M., BATEMAN, E., O'DOWD, R., MARKWICK, R., VRIJSEN, K., REHN, A. & REES, S.
2011. Intrauterine growth restriction affects the maturation of myelin. Exp Neurol, 232, 53-65.
TOLCOS, M., MARKWICK, R., O'DOWD, R., MARTIN, V., TURNLEY, A. & REES, S. 2015.
Intrauterine Growth Restriction: Effects on Neural Precursor Cell Proliferation and Angiogenesis in
the Foetal Subventricular Zone. Dev Neurosci, 37, 453-63.
TOLCOS, M., MCDOUGALL, A., SHIELDS, A., CHUNG, Y., O'DOWD, R., TURNLEY, A., WALLACE,
M. & REES, S. 2018. Intrauterine Growth Restriction Affects Cerebellar Granule Cells in the
Developing Guinea Pig Brain. Dev Neurosci, 40, 162-174.
TOLCOS, M. & REES, S. 1997. Chronic placental insufficiency in the fetal guinea pig affects
neurochemical and neuroglial development but not neuronal numbers in the brainstem: a new
method for combined stereology and immunohistochemistry. J Comp Neurol, 379, 99-112.
TOLCOS M, S., O'DOWD R, CHUNG YY, TURNLEY A, REES S 2013. Delayed maturation of the
cerebellum following intrauterine growth restriction. Journal of Paediatrics and Child Health, 49,
31.
TOLSA, C. B., ZIMINE, S., WARFIELD, S. K., FRESCHI, M., SANCHO ROSSIGNOL, A., LAZEYRAS,
F., HANQUINET, S., PFIZENMAIER, M. & HUPPI, P. S. 2004. Early alteration of structural and
functional brain development in premature infants born with intrauterine growth restriction. Pediatr
Res, 56, 132-8.
TOMASSY, G. S., BERGER, D. R., CHEN, H. H., KASTHURI, N., HAYWORTH, K. J., VERCELLI, A.,
SEUNG, H. S., LICHTMAN, J. W. & ARLOTTA, P. 2014. Distinct profiles of myelin distribution
along single axons of pyramidal neurons in the neocortex. Science, 344, 319-24.
VALERIO-GOMES, B., GUIMARAES, D. M., SZCZUPAK, D. & LENT, R. 2018. The Absolute Number
of Oligodendrocytes in the Adult Mouse Brain. Front Neuroanat, 12, 90.
VAN DEN HOF, M. C. & NICOLAIDES, K. H. 1990. Platelet count in normal, small, and anemic fetuses.
Am J Obstet Gynecol, 162, 735-9.
VAN VLIET, E., EIXARCH, E., ILLA, M., ARBAT-PLANA, A., GONZALEZ-TENDERO, A.,
HOGBERG, H. T., ZHAO, L., HARTUNG, T. & GRATACOS, E. 2013. Metabolomics reveals
metabolic alterations by intrauterine growth restriction in the fetal rabbit brain. PLoS One, 8,
e64545.
VAN WASSENAER, A. G., KOK, J. H., DE VIJLDER, J. J. M., BRIËT, J. M., SMIT, B. J., TAMMINGA,
P., VAN BAAR, A., DEKKER, F. W. & VULSMA, T. 1997. Effects of Thyroxine Supplementation
on Neurologic Development in Infants Born at Less Than 30 Weeks' Gestation. N Engl J Med, 336,
21-26.
VANHOLE, C., AERSSENS, P., NAULAERS, G., CASNEUF, A., DEVLIEGER, H., VAN DEN
BERGHE, G. & DE ZEGHER, F. 1997. L-thyroxine treatment of preterm newborns: clinical and
endocrine effects. Pediatr Res, 42, 87-92.
VANNUCCI, R. C. & VANNUCCI, S. J. 1997. A model of perinatal hypoxic-ischemic brain damage. Ann N
Y Acad Sci, 835, 234-49.
VARGAS, F., MORENO, J. M., RODRIGUEZ-GOMEZ, I., WANGENSTEEN, R., OSUNA, A.,
ALVAREZ-GUERRA, M. & GARCIA-ESTAN, J. 2006. Vascular and renal function in
experimental thyroid disorders. Eur J Endocrinol, 154, 197-212.
VEENING, M. A., VAN WEISSENBRUCH, M. M. & DELEMARRE-VAN DE WAAL, H. A. 2002.
Glucose tolerance, insulin sensitivity, and insulin secretion in children born small for gestational age.
J Clin Endocrinol Metab, 87, 4657-61.
VERGE, C. F., KONRAD, D., COHEN, M., DI COSMO, C., DUMITRESCU, A. M., MARCINKOWSKI,
T., HAMEED, S., HAMILTON, J., WEISS, R. E. & REFETOFF, S. 2012. Diiodothyropropionic
acid (DITPA) in the treatment of MCT8 deficiency. J Clin Endocrinol Metab, 97, 4515-23.
VERKAUSKIENE, R., BELTRAND, J., CLARIS, O., CHEVENNE, D., DEGHMOUN, S., DORGERET,
S., ALISON, M., GAUCHERAND, P., SIBONY, O. & LEVY-MARCHAL, C. 2007. Impact of fetal
growth restriction on body composition and hormonal status at birth in infants of small and
appropriate weight for gestational age. Eur J Endocrinol, 157, 605-12.
VERMIGLIO, F., LO PRESTI, V. P., MOLETI, M., SIDOTI, M., TORTORELLA, G., SCAFFIDI, G.,
CASTAGNA, M. G., MATTINA, F., VIOLI, M. A., CRISA, A., ARTEMISIA, A. & TRIMARCHI,
F. 2004. Attention deficit and hyperactivity disorders in the offspring of mothers exposed to mild-
moderate iodine deficiency: a possible novel iodine deficiency disorder in developed countries. J
Clin Endocrinol Metab, 89, 6054-60.

Reference List
169
VISSER, T. J., KAPTEIN, E., TERPSTRA, O. T. & KRENNING, E. P. 1988. Deiodination of thyroid
hormone by human liver. J Clin Endocrinol Metab, 67, 17-24.
VOGEL, M. W. & HERRUP, K. 1993. A theoretical and experimental examination of cell lineage
relationships among cerebellar Purkinje cells in the mouse. Dev Biol, 156, 49-68.
VOLPE, J. J. 2001. Neurobiology of periventricular leukomalacia in the premature infant. Pediatr Res, 50,
553-62.
VOLPE, J. J. 2009. Cerebellum of the premature infant: rapidly developing, vulnerable, clinically important.
J Child Neurol, 24, 1085-104.
VOLPE, P., PALADINI, D., RESTA, M., STANZIANO, A., SALVATORE, M., QUARANTELLI, M., DE
ROBERTIS, V., BUONADONNA, A. L., CARUSO, G. & GENTILE, M. 2006. Characteristics,
associations and outcome of partial agenesis of the corpus callosum in the fetus. Ultrasound Obstet
Gynecol, 27, 509-16.
VOSE, L. R., VINUKONDA, G., JO, S., MIRY, O., DIAMOND, D., KORUMILLI, R., ARSHAD, A., ZIA,
M. T., HU, F., KAYTON, R. J., LA GAMMA, E. F., BANSAL, R., BIANCO, A. C. & BALLABH,
P. 2013. Treatment with thyroxine restores myelination and clinical recovery after intraventricular
hemorrhage. J Neurosci, 33, 17232-46.
WALKER, F. R., BEYNON, S. B., JONES, K. A., ZHAO, Z., KONGSUI, R., CAIRNS, M. & NILSSON,
M. 2014. Dynamic structural remodelling of microglia in health and disease: a review of the models,
the signals and the mechanisms. Brain Behav Immun, 37, 1-14.
WALL, P. M. & MESSIER, C. 2001. The hippocampal formation--orbitomedial prefrontal cortex circuit in
the attentional control of active memory. Behav Brain Res, 127, 99-117.
WALTERS, S. N. & MORELL, P. 1981. Effects of altered thyroid states on myelinogenesis. J Neurochem,
36, 1792-801.
WANG, S., SDRULLA, A. D., DISIBIO, G., BUSH, G., NOFZIGER, D., HICKS, C., WEINMASTER, G.
& BARRES, B. A. 1998. Notch receptor activation inhibits oligodendrocyte differentiation. Neuron,
21, 63-75.
WARDLAW, T. 2004. UNICEF United Nations Childrens Fund and World Health Organization. 7.
WERNER, H. B., KUHLMANN, K., SHEN, S., UECKER, M., SCHARDT, A., DIMOVA, K.,
ORFANIOTOU, F., DHAUNCHAK, A., BRINKMANN, B. G., MOBIUS, W., GUARENTE, L.,
CASACCIA-BONNEFIL, P., JAHN, O. & NAVE, K. A. 2007. Proteolipid protein is required for
transport of sirtuin 2 into CNS myelin. J Neurosci, 27, 7717-30.
WESTWOOD, M., KRAMER, M. S., MUNZ, D., LOVETT, J. M. & WATTERS, G. V. 1983. Growth and
development of full-term nonasphyxiated small-for-gestational-age newborns: follow-up through
adolescence. Pediatrics, 71, 376-82.
WETTS, R. & HERRUP, K. 1982. Cerebellar Purkinje cells are descended from a small number of
progenitors committed during early development: quantitative analysis of lurcher chimeric mice. J
Neurosci, 2, 1494-8.
WIGGLESWORTH, J. S. 1964. Experimental Growth Retardation in the Foetal Rat. J Pathol Bacteriol, 88,
1-13.
WIGGLESWORTH, J. S. 1974. Fetal growth retardation. Animal model: uterine vessel ligation in the
pregnant rat. Am J Pathol, 77, 347-50.
WINKLER, C. C., YABUT, O. R., FREGOSO, S. P., GOMEZ, H. G., DWYER, B. E., PLEASURE, S. J. &
FRANCO, S. J. 2018. The Dorsal Wave of Neocortical Oligodendrogenesis Begins Embryonically
and Requires Multiple Sources of Sonic Hedgehog. J Neurosci, 38, 5237-5250.
WLODEK, M. E., WESTCOTT, K. T., O'DOWD, R., SERRUTO, A., WASSEF, L., MORITZ, K. M. &
MOSELEY, J. M. 2005. Uteroplacental restriction in the rat impairs fetal growth in association with
alterations in placental growth factors including PTHrP. Am J Physiol Regul Integr Comp Physiol,
288, R1620-7.
WONDERS, C. P. & ANDERSON, S. A. 2006. The origin and specification of cortical interneurons. Nat
Rev Neurosci, 7, 687-96.
WORKMAN, A. D., CHARVET, C. J., CLANCY, B., DARLINGTON, R. B. & FINLAY, B. L. 2013.
Modeling transformations of neurodevelopmental sequences across mammalian species. J Neurosci,
33, 7368-83.
WU, H., WANG, G., WANG, D., MU, X. & LI, C. 2013. Temporal and spatial changes in oligodendrocytes
in different brain regions following intrauterine ischemia in neonatal Wistar rats. Neurosciences
(Riyadh), 18, 79-82.

Reference List
170
WULFF, P., SCHONEWILLE, M., RENZI, M., VILTONO, L., SASSOE-POGNETTO, M., BADURA, A.,
GAO, Z., HOEBEEK, F. E., VAN DORP, S., WISDEN, W., FARRANT, M. & DE ZEEUW, C. I.
2009. Synaptic inhibition of Purkinje cells mediates consolidation of vestibulo-cerebellar motor
learning. Nat Neurosci, 12, 1042-9.
XIE, L., ANTONOW-SCHLORKE, I., SCHWAB, M., MCDONALD, T. J., NATHANIELSZ, P. W. & LI,
C. 2013. The frontal cortex IGF system is down regulated in the term, intrauterine growth restricted
fetal baboon. Growth Horm IGF Res, 23, 187-92.
YATES, M. A. & JURASKA, J. M. 2007. Increases in size and myelination of the rat corpus callosum
during adulthood are maintained into old age. Brain Res, 1142, 13-8.
YOLDAS, A. & DAYAN, M. O. 2014. Morphological characteristics of renal artery and kidney in rats.
ScientificWorldJournal, 2014, 468982.
YOUNES-RAPOZO, V., BERENDONK, J., SAVIGNON, T., MANHAES, A. C. & BARRADAS, P. C.
2006. Thyroid hormone deficiency changes the distribution of oligodendrocyte/myelin markers
during oligodendroglial differentiation in vitro. Int J Dev Neurosci, 24, 445-53.
ZANJANI, H. S., VOGEL, M. W., DELHAYE-BOUCHAUD, N., MARTINOU, J. C. & MARIANI, J.
1996. Increased cerebellar Purkinje cell numbers in mice overexpressing a human bcl-2 transgene. J
Comp Neurol, 374, 332-41.
ZANNO, A. E., ROMER, M. A., FOX, L., GOLDEN, T., JAECKLE-SANTOS, L., SIMMONS, R. A. &
GRINSPAN, J. B. 2019. Reducing Th2 inflammation through neutralizing IL-4 antibody rescues
myelination in IUGR rat brain. J Neurodev Disord, 11, 34.
ZHAN, X., COX, C., ANDER, B. P., LIU, D., STAMOVA, B., JIN, L. W., JICKLING, G. C. & SHARP, F.
R. 2015. Inflammation Combined with Ischemia Produces Myelin Injury and Plaque-Like
Aggregates of Myelin, Amyloid-beta and AbetaPP in Adult Rat Brain. J Alzheimers Dis, 46, 507-23.
ZHANG, Y., ARGAW, A. T., GURFEIN, B. T., ZAMEER, A., SNYDER, B. J., GE, C., LU, Q. R.,
ROWITCH, D. H., RAINE, C. S., BROSNAN, C. F. & JOHN, G. R. 2009. Notch1 signaling plays a
role in regulating precursor differentiation during CNS remyelination. Proc Natl Acad Sci U S A,
106, 19162-7.
ZHAO, C., FANCY, S. P., KOTTER, M. R., LI, W. W. & FRANKLIN, R. J. 2005. Mechanisms of CNS
remyelination--the key to therapeutic advances. J Neurol Sci, 233, 87-91.
ZHAO, M., CHEN, Y. H., DONG, X. T., ZHOU, J., CHEN, X., WANG, H., WU, S. X., XIA, M. Z.,
ZHANG, C. & XU, D. X. 2013. Folic acid protects against lipopolysaccharide-induced preterm
delivery and intrauterine growth restriction through its anti-inflammatory effect in mice. PLoS One,
8, e82713.
ZOELLER, R. T. & ROVET, J. 2004. Timing of thyroid hormone action in the developing brain: clinical
observations and experimental findings. J Neuroendocrinol, 16, 809-18.

Appendix 1
DITPA preparation for P1 to P13 rat injections
1. Make up 0.1M NaOH:
a. Dissolve 2g of NaOH in 500mL of H2O
b. Autoclave solution
c. Place into 1.5mL/2mL Eppendorf when ready to use
d. Use a syringe attached to a 40μm filter (Trajan Scientific, Vic, Australia) then draw up 0.1M
NaOH and transfer into Eppendorf
e. Label tubes 0.1M NaOH
2. 0.9% sterile Saline (FreeFelx, Code K690521)
a. Transfer the saline into multiple PCR tubes (placed in Eppendorf tube) using a syringe
b. Label 0.9% saline
3. To make 25mg/6000μL of DITPA
a. Measure 25mg of DITPA into Falcon tube or large 5mL Eppendorf
b. Slowly add 1mL of 0.1M NaOH, vortex each time
c. Add 4mL of 0.1M NaOH to 2mL of 0.9% Saline
4. Once solution has dissolved
a. Transfer the solution into multiple PCR tubes (placed in Eppendorf tube) using a syringe
b. Label 25mg/6000μL DITPA
The author acknowledges the scientific and technical assistance of Ms Aminath Azhan, Monash University.
Product: 3-[4-(4-hydroxyphenoxy)-3, 5-diiodophenyl] propionic acid (DITPA)
Company: Ryan Scientific Inc.,
Catalogue Number: ALBB-014981
https://www.ryansci.com/products/7671341/view

Appendix 2
Optic nerve processing for Transmission Electron Microscopy
Protocol provided by Sarah Ellis, Head of Centre.
1. Following primary fixation at RMIT (Section 2.7.4 above), optic nerves were rinsed in 0.1M
sodium cacodylate buffer.
2. Following this, optic nerves were post-fixed in 1% osmium tetroxide, 1.5% potassium ferrocyanide
in 0.1M sodium cacodylate buffer.
3. Optic nerves were subsequently rinsed in distilled water then dehydrated through a graded series
of alcohols before embedding in Spurrs Resin (Spurr 1969) according to standard electron microscopy
protocol.
References:
Spurr, A.R. 1969. A low-viscosity epoxy resin embedding medium for electron microscopy. J.
Ultrastructure. Res. 26: 31

Appendix 3
Appendix 3, Table 3. 1 Two-way ANOVA results of MBP-IR analysis, supplementary to Chapter 3,
Section 3.7.1. The effect of group (control or IUGR) and treatment (saline or DITPA) on MBP-IR in brain
regions within the cerebral hemispheres is shown. Data are presented as M ± SEM, and values represent
percentage of area covered by MBP-IR (% AC), except for cortical projection, which is presented as a length
ratio (projection length (mm)/cortex width (mm)).
Control IUGR
MBP-IR Saline n= 8 DITPA n= 7 Saline n= 8 DITPA n= 8
Cortical layer VI
31.67 ± 0.87 43.15 ± 1.56 27.94 ± 0.95 36.33 ± 1.45
Cortical projections 60.03 ± 0.97 56.19 ± 2.13 56.67 ± 1.17 50.44 ± 2.20
Corpus callosum 55.16 ± 2.37 58.71 ± 5.04 53.64 ± 3.43 46.47 ± 4.06
External capsule 70.03 ± 1.88 76.73 ± 2.35 74.03 ± 2.31 73.89 ± 1.88
Hippocampus CA1 13.81 ± 0.82 14.48 ± 0.84 10.03 ± 0.57 8.00 ± 0.50
Hippocampus CA3 17.00 ± 0.90 18.47 ± 0.77 13.39 ± 0.86 13.80 ± 1.14
Fimbria 41.73 ± 0.92 75.55 ± 3.33 40.02 ± 1.18 74.07 ± 3.83
Appendix 3, Table 3. 2 Two-way ANOVA results of PLP-IR analysis, supplementary to Chapter 3,
Section 3.7.1. The effect of group (control or IUGR) and treatment (saline or DITPA) on PLP-IR in brain
regions within the cerebral hemispheres is shown. Data are presented as M ± SEM, and values represent
percentage of area covered by PLP-IR (% AC), except for cortical projection, which is presented as a length
ratio (projection length (mm)/cortex width (mm)).
Control IUGR
PLP-IR Saline n= 8 DITPA n= 7 Saline n= 8 DITPA n= 8
Cortical layer VI
20.96 ± 1.63 16.01 ± 1.78 7.91 ± 0.85 6.79 ± 1.02
Cortical
projections
37.42 ± 6.22 28.46 ± 5.52 32.38 ± 5.69 26.96 ± 5.33
Corpus Callosum
28.76 ± 4.37 20.68 ± 3.40 19.55 ± 3.72 7.09 ± 0.83
External capsule
43.56 ± 1.36 34.87 ± 1.41 30.44 ± 1.36 22.82 ± 1.44
Hippocampus
CA1
11.78 ± 2.75 5.63 ± 1.36 2.08 ± 0.37 1.75 ± 0.41
Hippocampus
CA3
13.43 ± 1.19 13.97 ± 3.08 5.74 ± 1.06 7.88 ± 1.62
Fimbria 18.28 ± 2.18 14.04 ± 2.43 6.99 ± 1.12 7.41 ± 1.01

Appendix 3, Table 3. 3 Two-way ANOVA results of Olig2–IR analysis, supplementary to Chapter 3,
Section 3.7.1. The effect of group (control or IUGR) and treatment (saline or DITPA) on Olig2-IR cell density
in brain regions within the cerebral hemispheres is shown. Data are presented as M ± SEM, and values
represent cell density (cells/mm2).
Control IUGR
Olig2-IR cell
density
Saline n= 8 DITPA n= 7 Saline n= 8 DITPA n= 8
Cortical layer VI 901.97 ± 21.22 805.03 ± 21.58 791.90 ± 22.18 838.15 ± 20.54
Corpus callosum 2006.60 ± 29.02 2251.19 ± 134.83 1718.06 ± 113.59 2252.08 ± 125.45
Hippocampus
CA1
1346.35 ± 115.35 1331.55 ± 59.58 1243.75 ± 70.86 1325.00 ± 56.45
Hippocampus
CA3
1444.27 ± 90.12 1338.69 ± 52.84 1332.29 ± 54.80 1454.69 ± 69.04
Fimbria 3186. 46 ± 168.71 2942.86 ± 163.14 2432.29 ± 183.12 3030.21 ± 255.03
Appendix 3, Table 3. 4 Two-way ANOVA results of APC–IR analysis, supplementary to Chapter 3,
Section 3.7.1. The effect of group (control or IUGR) and treatment (saline or DITPA) on APC-IR cell density
in brain regions within the cerebral hemispheres is shown. Data are presented as M ± SEM, and values
represent cell density (cells/mm2).
Control IUGR
APC-IR cell
density
Saline n= 8 DITPA n= 7 Saline n= 8 DITPA n= 8
Cortical layer VI 621.26 ± 31.06 472.22 ± 41.75 424.64 ± 33.17 486.01 ± 31.07
Corpus callosum 958.33 ± 44.86 857.69 ± 90.42 535.71 ± 32.82 689.68 ± 42.16
Hippocampus
CA1
663.02 ± 58.63 419.44 ± 148.56 287.50 ± 51.07 397.02 ± 49.93
Hippocampus
CA3
715.63 ± 44.65 518.06 ± 173.80 337.50 ± 67.53 471.43 ± 58.63
Fimbria 1833.33 ± 125.40 1152.08 ± 380.16 975.00 ± 185.67 1272.02 ± 192.60
Appendix 3, Table 3. 5 Two-way ANOVA results of APC-IR: Olig2-IR analysis, supplementary to
Chapter 3, Section 3.7.1. The effect of group (control or IUGR) and treatment (saline or DITPA) on the
percentage of mature APC-IR OLs within the overall Olig2-IR OL population, in brain regions within the
cerebral hemispheres is shown. Data are presented as M ± SEM, and values represent percentage of mature
APC-IR OLs within the overall Olig2-IR OL population (%).
Control IUGR
APC-IR: Olig2-
IR (%)
Saline n= 8 DITPA n= 7 Saline n= 8 DITPA n= 8
Cortical layer VI 0.75 ± 0.03 0.58 ± 0.04 0.54 ± 0.03 0.60 ± 0.03
Corpus callosum 0.53 ± 0.03 0.52 ± 0.05 0.38 ± 0.03 0.53 ± 0.07
Hippocampus
CA1
51.05 ± 5.68 41.65 ± 12.32 24.06 ± 4.57 26.33 ± 5.06
Hippocampus
CA3
50.25 ± 3.18 36.28 ± 11.53 24.78 ± 4.61 27.70 ± 4.93
Fimbria 57.72 ± 2.94 28.08 ± 10.55 28.21 ± 5.38 35.91 ± 5.96

Appendix 4
Appendix 4, Table 4. 1 Two-way ANOVA results of cerebellar morphology measurements using H&E
staining supplementary to Chapter 4 Section 4.4.1: Areas are in mm2, width is in mm, ratios are % of the
total cross sectional area. Data are presented as M ± SEM.
Control IUGR
Saline n = 8 DITPA n = 7 Saline n = 8 DITPA n = 8
TCA 12.05 ± 0.27 11.47 ± 0.55 10.64 ± 0.41 10.41 ± 0.27
ML area 5.77 ± 0.20 5.44 ± 0.26 4.88 ± 0.13 4.86 ± 0.16
IGL area 5.58 ± 0.40 5.05 ± 0.33 4.22 ± 0.29 4.45 ± 0.22
WM area 1.38 ± 0.06 1.16 ± 0.05 1.21 ± 0.12 1.04 ± 0.07
GM area 7.00 ± 0.45 6.64 ± 0.28 6.64 ± 1.08 5.10 ± 0.64
ML : TCA 47.84 ± 1.04 47.44 ± 0.87 47.30 ± 1.49 46.71 ± 0.82
IGL : TCA 46.38 ± 3.45 34.99 ± 1.78 40.62 ± 0.67 43.25 ± 2.24
WM : TCA 11.50 ± 0.51 10.29 ± 0.70 11.63 ± 0.75 10.13 ± 0.69
GM : TCA 58.33 ± 4.19 58.12 ± 1.77 64.46 ± 10.64 49.67 ± 6.60
ML width 0.10 ± 0.002 0.11 ± 0.002 0.10 ± 0.003 0.10 ± 0.003
GM = grey matter, IGL = internal granular layer, ML = molecular layer, TCA = total cerebellar cross-sectional-
area, WM = white matter
Appendix 4, Table 4. 2 Two-way ANOVA results of immunohistochemical analysis in the cerebellum,
supplementary to Chapter 4 Section 4.4.2. Data are presented as M ± SEM. Values represent percentage of
area covered by MBP-IR (% AC), cell density (cells/mm2), and linear cell density (cells/mm).
Control IUGR
Saline n = 8 DITPA n = 7 Saline n = 8 DITPA n = 8
MBP-IR
DWM
Lobules
74.30 ± 4.82
53.19 ± 5.22
74.32 ± 3.39
49.36 ± 5.49
73.88 ± 2.68
42.79 ± 6.01
72.64 ± 4.64
52.72 ± 3.31
Olig2-IR
DWM
Lobules
2730.40 ± 322.19
2349.08 ± 110.27
3671.52 ± 503.99
2734. 84 ± 250.68
3656.66 ± 511.57
2896.50 ± 198.93
3777.29 ± 400.30
3004.68 ± 341.14
Iba1-IR
DWM
Early lobules
Late lobules
471.43 ± 47.38
515.65 ± 62.80
463.08 ± 72.87
417.86 ± 62.13
301.00 ± 87.45
453.61 ± 98.87
346.43 ± 48.00
588.73 ± 104.30
406.22 ± 98.50
434.38 ± 33.05
530.00 ± 106.51
957.55 ± 131.47
GFAP-IR BG
Early lobules
Late lobules
165.16 ± 4.53
156.41 ± 2.41
147.68 ± 5.46
132.32 ± 4.10
177.34 ± 4.09
176.56 ± 5.52
183.44 ± 4.32
184.53 ± 5.50
GFAP-IR astrocytes
DWM
Lobules combined
Early lobules
Late lobules
18.76 ± 1.58
42.27 ± 1.72
43.13 ± 4.73
41.42 ± 8.69
23.27 ± 4.69
36.26 ± 1.69
36.83 ± 2.62
35.69 ± 5.80
25.66 ± 3.66
47.27 ± 3.16
46.12 ± 3.69
48.41 ± 15.19
27.86 ± 3.06
46.66 ± 2.78
47.22 ± 3.60
46.10 ± 12.70
Calbindin
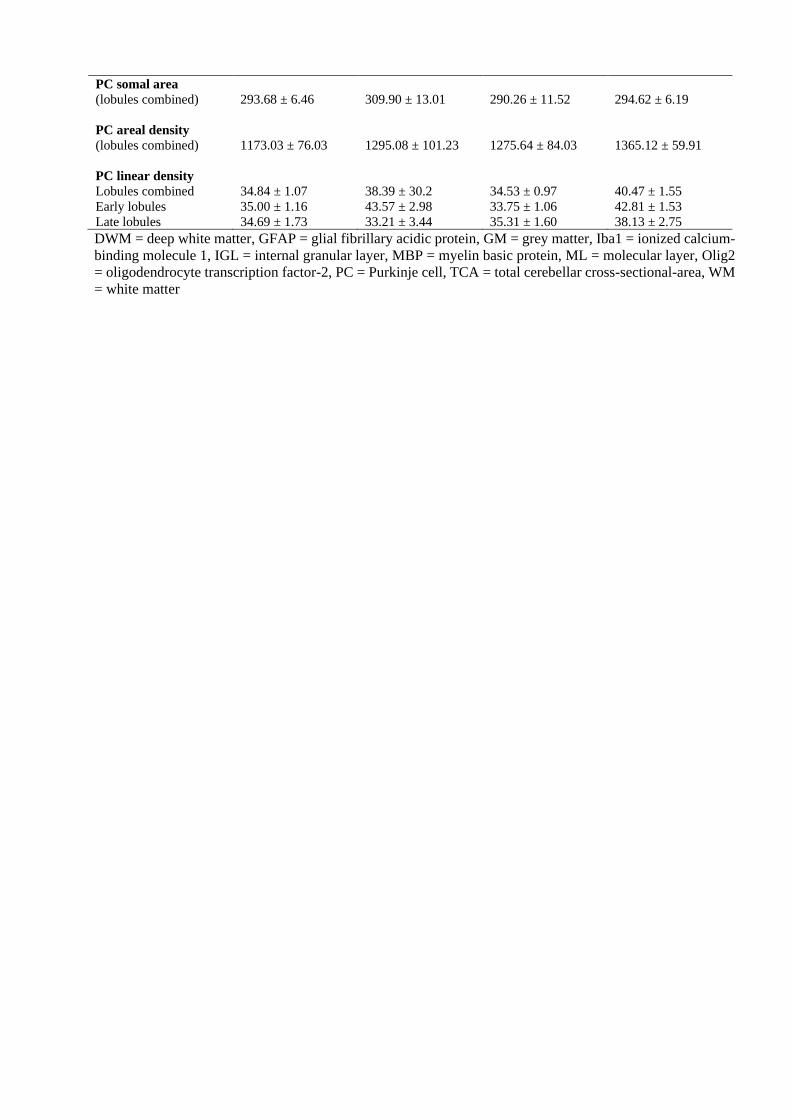
PC somal area
(lobules combined)
PC areal density
(lobules combined)
PC linear density
Lobules combined
Early lobules
Late lobules
293.68 ± 6.46
1173.03 ± 76.03
34.84 ± 1.07
35.00 ± 1.16
34.69 ± 1.73
309.90 ± 13.01
1295.08 ± 101.23
38.39 ± 30.2
43.57 ± 2.98
33.21 ± 3.44
290.26 ± 11.52
1275.64 ± 84.03
34.53 ± 0.97
33.75 ± 1.06
35.31 ± 1.60
294.62 ± 6.19
1365.12 ± 59.91
40.47 ± 1.55
42.81 ± 1.53
38.13 ± 2.75
DWM = deep white matter, GFAP = glial fibrillary acidic protein, GM = grey matter, Iba1 = ionized calcium-
binding molecule 1, IGL = internal granular layer, MBP = myelin basic protein, ML = molecular layer, Olig2
= oligodendrocyte transcription factor-2, PC = Purkinje cell, TCA = total cerebellar cross-sectional-area, WM
= white matter

Appendix 5
Control IUGR
Sex
Saline n = 23 males
n = 24 females
DITPA n = 31 males
n = 18 females
Saline n = 33 males
n = 27 females
DITPA n = 34 males
n = 33 females
P1 (g) M 6.68 ± 0.61 6.78 ± 0.66 4.84 ± 0.71 4.98 ± 0.57
F 6.31 ± 0.55 6.88 ± 0.75 4.79 ± 0.73 4.78 ± 0.62
P7 (g) M 17.06 ± 1.42 16.38 ± 2.24 11.59 ± 2.28 12.29 ± 2.42
F 16.58 ± 1.43 16.83 ± 2.58 11.97 ± 2.56 11.96 ± 2.19
P14 (g) M 35.45 ± 1.85 32.69 ± 3.53 27.79 ± 4.28 27.90 ± 3.48
F 34.86 ± 2.23 33.06 ± 4.71 28.48 ± 4.66 27.41 ± 4.85
CRL (mm) M 80.96 ± 8.26 81.29 ± 6.86 76.48 ± 8.77 79.79 ± 8.74
F 80.43 ± 9.96 79.50 ± 9.10 78.47 ± 16.37 77.31 ± 6.98
Head Circ. (mm) M 62.96 ± 5.24 64.38 ± 4.12 61.00 ± 5.37 60.25 ± 6.22
F 60.49 ± 13.34 63.00 ± 4.96 61.35 ± 3.70 60.24 ± 4.06
Hip Circ. (mm) M 76.48 ± 6.81 73.04 ± 6.26 68.86 ± 5.17 68.82 ± 6.07
F 71.28 ± 16.87 73.44 ± 8.43 69.92 ± 5.26 70.48 ± 4.58
Liver (g) M 0.91 ± 0.21 0.86 ± 0.28 0.68 ± 0.19 0.61 ± 0.12
F 1.01 ± 0.22 0.85 ± 0.30 0.70 ± 0.20 0.66 ± 0.17
L Kidney (g) M 0.20 ± 0.03 0.20 ± 0.02 0.14 ± 0.03 0.16 ± 0.04
F 0.20 ± 0.03 0.22 ± 0.05 0.16 ± 0.04 0.18 ± 0.03
R Kidney (g) M 0.19 ± 0.03 0.20 ± 0.02 0.15 ± 0.04 0.17 ± 0.04
F 0.20 ± 0.03 0.21 ± 0.03 0.15 ± 0.03 0.17 ± 0.03
Circ. = circumference, CRL = crown-to-rump length, g = grams, mm = millimetre, n = sample number, L =
left, R = right, P = postnatal day.
Appendix 5, Table 5. 1 Body weight, morphometry and organ weights at P14. Supplementary to Chapter 5
Section 5.4.1. Data of male and female pups are presented as Mean ± SD, and are analysed using a two-way
ANOVA with significance set at p < 0.05.

Appendix 5 (cont.)
Appendix 5, Table 5. 3 DEXA scan body composition measures at P14. Supplementary to Chapter 5,
Section 5.4.4. Data of male and female pups are presented as Mean ± SEM, and are analysed using a two-way
ANOVA with significance set at p < 0.05.
Control IUGR
Sex Saline n = 23 males
n = 24 females
DITPA n = 31 males
n = 18 females
Saline n = 33 males
n = 27 females
DITPA n = 34 males
n = 33 females
BMD (g/cm2) M 0.04 ± 0.001 0.04 ± 0.001 0.03 ± 0.001 0.04 ± 0.001
F 0.04 ± 0.001 0.04 ± 0.001 0.04 ± 0.001 0.04 ± 0.001
BMC (g) M 0.27 ± 0.023 0.27 ± 0.022 0.18 ± 0.019 0.19 ± 0.019
F 0.28 ± 0.024 0.31 ± 0.027 0.17 ± 0.022 0.19 ± 0.020
Bone Area (cm2) M 6.91 ± 0.48 6.73 ± 0.46 4.86 ± 0.40 5.03 ± 0.40
F 7.16 ± 0.49 2.82 ± 0.57 4.68 ± 0.46 4.99 ± 0.41
Lean tissue (g) M 22.57 ± 0.71 21.76 ± 0.68 18.29 ± 0.59 19.13 ± 0.59
F 22.16 ± 0.73 22.23 ± 0.85 17.74 ± 0.66 18.23 ± 0.61
Fat (g) M 9.56 ± 0.44 8.34 ± 0.42 6.94 ± 0.37 7.08 ± 0.37
F 9.79 ± 0.45 9.30 ± 0.53 7.26 ± 0.42 7.38 ± 0.38
% Fat M 29.87 ± 1.21 27.53 ± 1.15 27.39 ± 1.00 26.89 ± 1.00
F 30.74 ± 1.24 29.44 ± 1.45 28.44 ± 1.15 28.60 ± 1.04
BMD = bone mineral density, BMC = bone mineral content, g = grams, cm2 = centimetres squared, % =
percentage, n = sample number.
Control IUGR
Sex Saline n = 23 males
n = 24 females
DITPA n = 31 males
n = 18 females
Saline n = 33 males
n = 27 females
DITPA n = 34 males
n = 33 females
Total brain (g) M 1.23 ± 0.07 1.24 ± 0.09 1.11 ± 0.08 1.11 ± 0.06
F 1.20 ± 0.06 1.18 ± 0.08 1.20 ± 0.07 1.09 ± 0.07
Brain: Body
(g/g)
M 0.03 ± 0.002 0.04 ± 0.005 0.04 ± 0.005 0.04 ± 0.004
F 0.03 ± 0.003 0.04 ± 0.005 0.04 ± 0.005 0.04 ± 0.008
Hemispheres M 0.91 ± 0.04 0.91 ± 0.06 0.80 ± 0.13 0.79 ± 0.16
F 0.89 ± 0.04 0.90 ± 0.06 0.79 ± 0.13 0.78 ± 0.08
Cerebellum M 0.16 ± 0.03 0.16 ± 0.03 0.14 ± 0.03 0.14 ± 0.02
F 0.15 ± 0.03 0.16 ± 0.03 0.14 ± 0.03 0.14 ± 0.03
Pons M 0.06 ± 0.01 0.06 ± 0.009 0.06 ± 0.01 0.05 ± 0.01
F 0.06 ± 0.008 0.06 ± 0.01 0.05 ± 0.01 0.05 ± 0.01
Medulla M 0.04 ± 0.002 0.04 ± 0.002 0.03 ± 0.002 0.03 ± 0.002
F 0.03 ± 0.002 0.04 ± 0.002 0.03 ± 0.002 0.03 ± 0.002
Appendix 5, Table 5. 2 Brain weights and brain-to-body weight ratio at P14. Supplementary to Chapter
5 Section 5.4.1 – 2.Data of male and female pups are presented as Mean ± SD, and are analysed using a two-
way ANOVA with significance set at p < 0.05.

Appendix 5 (cont.)
Appendix 5, Table 5. 4 Blood plasma assay results P14. Supplementary to Chapter 5, Section 5.5.6. Data
of male and female pups are presented as Mean ± SEM, and are analysed using a two-way ANOVA with
significance set at p < 0.05.
ALP = alkaline phosphatase, ALT = alanine transaminase, FT3 = plasma free triiodothyronine, FT4 = plasma
free thyroxine, n = sample number.
Control IUGR
Sex Saline n = 23 males
n = 24 females
DITPA n = 31 males
n = 18 females
Saline n = 33 males
n = 27 females
DITPA n = 34 males
n = 33 females
FT3 M 1.95 ± 1.35 9.69 ± 1.20 2.41 ± 1.30 0.72 ± 1.21
F 2.41 ± 1.30 9.79 ± 1.51 0.72 ± 1.21 6.27 ± 1.21
FT4 M 25.18 ± 0.97 7.44 ± 0.90 24.92 ± 0.75 6.62 ± 0.73
F 31.21 ± 1.01 8.02 ± 1.01 25.76 ± 0.84 6.71 ± 0.79
ALT M 24.99 ± 3.30 30.01 ± 2.76 15.81 ± 3.02 24.29 ± 3.20
F 25.29 ± 3.85 26.24 ± 3.64 15.94 ± 2.97 22.53 ± 3.00
ALP M 344.56 ± 29.63 425.97 ± 24.80 386.02 ± 26.70 475.83 ± 27.74
F 315.75 ± 34.57 354.38 ± 32.57 354.80 ± 26.00 371.17 ± 26.24
Cholesterol M 4.39 ± 0.19 3.90 ± 0.16 4.05 ± 0.13 3.81 ± 0.15
F 4.24 ± 0.23 4.16 ± 0.23 4.05 ± 0.15 4.14 ± 0.14

Appendix 6
Monash Pathology Australia
FREE TRIIODOTHYRONINE (FT3) - Plasma Assay Protocol
The Access / DXI FreeT3 assay is a paramagnetic particle, chemiluminescent immunoassay for the quantitative
determination of free triiodothyronine levels in human plasma and plasma using the Beckman Coulter Unicel
DXI 800.
REAGENTS
Access Free T3 Reagent Pack Cat. No. A13422:
Access / DxI 800 Free T3 Calibrators Cat. No. A13430
ANALYTICAL RANGE
1.4 – 46 pmol/L
REFERENCE INTERVAL Plasma: 3.8 – 6.0 pmol/L
Source of Reference Interval
Beckman Coulter FT3 package insert
ANALYTICAL PERFORMANCE
BIORAD Immunoassay Plus levels 1, 2 and 3 (lyophilized) 4 x 5 mL of each level (Cat.No. 370)
MEAN SD CV % N
LEVEL 1 pmol/L 3.38 0.27 8.0 86
LEVEL 2 pmol/L 9.25 0.98 10.6 81
LEVEL 3 pmol/L 14.73 1.42 9.6 33
CLINICAL SIGNIFICANCE Triiodothyronine (3, 5, 3’-L- triiodothyronine, T3) is a hormone synthesized
and excreted from the thyroid gland, and formed by peripheral deiodination of thyroxine (T4). T3 and T4 are
secreted into the circulation in response to thyroid stimulating hormone (TSH) and play an important role in
regulating metabolism. The T3 and T4 secretion are regulated by a negative feedback mechanism involving
the thyroid gland, pituitary gland and hypothalamus. In the circulation 99.7% of T3 is reversibly bound to
transport proteins, primarily thyroxine binding globulin (TBG) and to a lesser extent albumin and prealbumin.
The remaining T3 does not bind to transport proteins but is free in circulation. This unbound fraction is
metabolically active. FT3 levels correlate with T3 secretion and metabolism. In hypothyroidism and
hyperthyroidism, FT3 levels parallel changes in total T3 levels. Measuring a FT3 level is useful when altered
levels of total T3 occur due to changes in T3 binding proteins especially TBG. TBG levels remain relatively
constant in healthy individuals but normal pregnancy and steroid therapy can alter these levels. In these
conditions the FT3 level is unchanged while the total T3 level parallels the changes in TBG.
REFERENCES i. Access Assay Manual (disc) Ref.387302 Version 3.0 ©2005 Beckman Coulter, Inc. Access Immunoassay Systems
FreeT3 Reagent Kit. REF. A13893B) package insert. Dated: 2005.
Monash Pathology Australia

FREE THYROXINE (FT4) - Plasma Assay Protocol
PRINCIPLE / INTRODUCTION
The Access / DXI Free T4 assay is a two-step enzyme immunoassay carried out on a Beckman Coulter Unicel
DXI800. Monoclonal anti-thyroxine (T4) antibody coupled to biotin, sample, buffered protein solution, and
streptavidin-coated solid phase are added to the reaction vessel. During this first incubation the anti-T4
antibody coupled to biotin binds to the solid phase and the free T4 in the sample. After incubation in a reaction
vessel, separation in a magnetic field and washing removes any material not bound to the solid phase. Next,
buffered protein solution and triiodothyronine (T3)-alkaline phosphatase conjugate are added to the reaction
vessel. The T3-alkaline phosphatase conjugate binds to the vacant anti-T4 antibody binding sites. After
incubation in a reaction vessel, separation in a magnetic field and washing remove materials not bound to the
solid phase. A chemiluminescent substrate, Lumi-Phos* 530, is added to the reaction vessel and light generated
by the reaction is measured with a luminometer. The light production is inversely proportional to the
concentration of free T4 in the sample. The amount of analyte in the sample is determined from a stored, multi-
point calibration curve.
REAGENTS
• Access / DXI Free T4 Reagent Pack Cat. No. 33880
• Access / DXI Free T4 Calibrators Cat. No. 33885
ANALYTICAL RANGE
1.9 – 77.2 mol /L
Conversion factor: ng/dL x 12.9 = pmol/L
REFERENCE INTERVAL
0 – 4 days old 25 – 70 pmol/L
4 days - 6 months 12 – 30 pmol/L
>6 months 7.5 – 21.0 pmol/L
Source of Reference Interval
> 6 months; Beckman Coulter Kit Insert 386902B Dated 2005
ANALYTICAL PERFORMANCE
The coefficient of Variation as assessed from routine quality control sera at three
Levels (Bio-Rad Ligand 1, 2, 3) is as follows:
MEAN SD CV % N
LEVEL 1 pmol/L 10.58 0.81 7.6 190
LEVEL 2 pmol/L 30.03 1.82 6.1 116
LEVEL 3 pmol/L 61.30 3.60 5.9 109
CLINICAL SIGNIFICANCE
Thyroxine (3, 5, 3’, 5’ tetraiodothyronine, T4) is a hormone synthesized and excreted from the thyroid gland.
T3 and T4 are secreted into the circulation in response to thyroid stimulating hormone (TSH) and play an
important role in regulating metabolism. The T3 and T4 secretion are regulated by a negative feedback
mechanism involving the thyroid gland, pituitary gland and hypothalamus. In the circulation 99.7% of T4 is
reversibly bound to transport proteins, primarily thyroxine binding globulin (TBG) and to a lesser extent
albumin and prealbumin. The remaining T4 does not bind to transport proteins but is free in circulation. This
unbound fraction is metabolically active. FT4 levels correlate with T4 secretion and metabolism. In
hypothyroidism and hyperthyroidism, FT4 levels parallel changes in total T4 levels. Measuring FT4 levels are
useful when altered levels of total T4 occur due to changes in T4 binding proteins especially TBG. TBG levels
remain relatively constant in healthy individuals but normal pregnancy and steroid therapy can alter these
levels. In these conditions FT4 levels are unchanged while total T4 levels parallel the changes in TBG.
REFERENCES

Access Assay Manual (disc) Ref.387302 Version 3.0 ©2005
Beckman Coulter Insert 386902B Access Free T4 Dated 2005
Monash Pathology Australia
ALKALINE PHOSPHATASE (ALP) - Plasma Assay Protocol
PRINCIPLE / INTRODUCTION
The ALP method is an automated colorimetric method carried out on a Beckman Coulter SYNCHRON
LX20PRO System(s) with reagents and calibrators supplied by Beckman/Coulter. (Sydney, Australia) Cat
No 442670.
ALP reagent is used to measure alkaline phosphatase activity by a kinetic rate method using a 2-amino-2-
methyl-1-propanol (AMP) buffer. In the reaction, alkaline phosphatase catalyses the hydrolysis of the
colourless organic phosphate ester substrate, p-nitrophenylphosphate, to the yellow colored product, p-
nitrophenol, and phosphate. This reaction occurs at an alkaline pH of 10.3.
The SYNCHRON LX System(s) automatically proportions the appropriate sample and reagent volumes into
the cuvette. The ratio used is one part sample to 50 parts reagent. The system monitors the change in absorbance
at 410 nm. This change in absorbance is directly proportional to the activity of ALP in the sample and is used
by the System to calculate and express ALP activity.
ANALYTICAL PERFORMANCE
The coefficient of variation as assessed from routine quality control sera at two levels.
BIORAD Liquichek Unassayed Chemistry Control (Human) Levels 1 and 2.
Cat. No 691 & 692.
MEAN SD CV% N
LEVEL 1 U/L 75.9 2.8 3.7 260
LEVEL 2 U/L 339.7 5.5 1.6 260
ANALYTICAL RANGE
5 - 1650 U/L
REFERENCE RANGES
30 - 120 U/L
CLINICAL SIGNIFICANCE
Catalyses hydrolysis of orthophosphoric monoesters at pH 10. Has several isoenzymes: liver, bone and
placental. Increased in obstructive liver disease, osteoblastic or clastic bone disorders e.g. Metastatic,
hyperparathyroidism (primary or secondary). Decreased in hypophosphatasia.
REFERENCES
Beckman Coulter Chemistry Information Sheet 389874AA 4A ALP January 2021
Bowers, C.N. Jr. and McComb, R.B. Clin. Chem. 21: 1990 (1975).
N.W. Tietz, A.D. Rinker, L.M. Shaw: I.F.C.C. Method for Measurement of Catalytic Concentration of
Enzymes. Part 5. IFCC Method for Alkaline Phosphatase. J. Clin. Chem. Clin. Biochem. 21, no. 11 (1983).

Monash Pathology Australia
ALANINE TRANSAMINASE (ALT) - Plasma Assay Protocol
Automated colorimetric method carried out on a Beckman Coulter SYNCHRON LX20PRO System(s)
with reagents and calibrators supplied by Beckman/Coulter. (Sydney, Australia) Cat No. 467840
The ALT- reagent is used to measure alanine transaminase in plasma or plasma by an enzymatic rate method.
In the assay reaction, the ALT catalyses the reversible transamination of L-alanine and alpha-ketoglutarate to
pyruvate and L-glutamine. The pyruvate is then reduced to lactate in the presence of lactate dehydrogenase
(LDH) with the concurrent oxidation of -Nicotinamide Adenine Dinucleotide (reduced form) (NADH) to -
Nicotinamide Adenine Dinucleotide (NAD).
The ALT- assay is based on the IFCC standard for enzyme determination. Pyridoxal-5'-phosphate is a cofactor
that is required for transaminase activity by binding to the enzyme using Schiff-base linkage.
The SYNCHRON LX System(s) automatically proportions the appropriate sample and reagent volumes into
a cuvette. The ratio used is one part sample to 11 parts reagent. The system monitors the rate of change in
absorbance at 340 nanometers over a fixed-time interval. This rate of change in absorbance is directly
proportional to the activity of ALT- in the sample and is used by the System to calculate and express the ALT-
activity.
One unit of enzyme activity is defined as the quantity of enzyme that catalyzes the reaction of 1 mol of
substrate per minute at +37C.
ANALYTICAL PERFORMANCE The coefficient of variation as assessed from routine quality control sera
at two levels.BIORAD Liquichek Unassayed Chemistry Control (Human) Levels 1 and 2.
Cat. No 691 & 692.
MEAN SD CV% N
LEVEL 1 U/L 24.63 2.14 8.69 144
LEVEL 2 U/L 86.69 2.73 3.14 155
ANALYTICAL RANGE
5 - 400 U/L
350 – 2600 U/L (ORDAC)
REFERENCE RANGE
< 3 years 5 - 45 U/L
Adult 7 - 56 U/L
CLINICAL SIGNIFICANCE
ALT is a hepatic cytosolic enzyme which is more specific for this tissue than is AST. In liver disease associated
with hepatic necrosis e.g. viral hepatitis ALT is elevated before clinical signs and symptoms of disease e.g.
jaundice appear. Enzyme levels may reach 100 times the upper reference limit, but increases of 20 to 50 times
are more usual. Peak values are seen between 7 - 12 days, and levels return to normal by the third to fifth week
if recovery is uneventful. In toxic or viral hepatitis the ALT/AST ratio, which is normally less than 1,
approaches or becomes greater than 1. Moderate elevations of ALT are seen in extrahepatic cholestasis. Levels
of 5 to 10 times may be seen in primary or metastatic carcinoma of the liver. ALT may be slightly increased
after ingestion of alcohol, during delirium tremens, and after administration of drugs such as opiates,
salicylates, or ampicillin. Plasma elevations of ALT are rarely seen in conditions other than parenchymal liver
disease (although they may be occasionally increased in progressive muscular dystrophy and
dermatomyositis).
REFERENCES
Beckman Coulter Chemistry Information Sheet 389877AA 7A ALT-January 2021

Monash Pathology Australia
CHOLESTEROL (CHOL) - Plasma Assay Protocol
The cholesterol was measured by a standard commercial enzymatic assay using a Beckman Coulter LX20PRO
Analyser, with reagents and calibrators supplied by Beckman Coulter Diagnostics Australia.
CHOL reagent is used to measure cholesterol concentration by a timed-endpoint method. In the reaction,
cholesterol esterase (CE) hydrolyses cholesterol esters to free cholesterol and fatty acids. Free cholesterol is
oxidized to cholestene-3-one and hydrogen peroxide by cholesterol oxidase (CO). Peroxidase catalyses the
reaction of hydrogen peroxide with 4-aminoantipyrine (4-AAP) and phenol to produce a colored quinoneimine
product.
The SYNCHRON LX System(s) automatically proportions the appropriate sample and reagent volumes into
the cuvette. The ratio used is one part sample to 100 parts reagent. The system monitors the change in
absorbance at 520 nanometers. This change in absorbance is directly proportional to the concentration of
CHOL in the sample and is used by the System to calculate and express CHOL concentration.
Cat No. 467825 Beckman Coulter Cholesterol Kit
CALIBRATOR: SYNCHRON Systems Lipid Calibrator
QUAILTY CONTROL: BIORAD Liquichek Unassayed Chemistry Control
(Human) Level 1 and Level Cat. No. 691 & 692
IMPRECISION: CV 1.9% @ 3.4 mmol/L
CV 1.3% @ 7.0 mmol/L
ANALYTICAL RANGE: 0.13 - 19.43 mmol/L
15.54 – 29.9 mmol/L (ORDAC)
REFERENCE RANGE: 0 - 5.5 mmol/L (NHF recommendation)
REFERENCES: Beckman Coulter Chemistry Information Sheet 38an Coulter Chemistry
Information Sheet 389895AA 5A CHOL January 2021\

Appendix 7
22 March 2017
Dr Mary Tolcos School of Health and Biomedical Sciences RMIT University
Dear Mary, Research &
Innovation
GPO Box 2476V Melbourne VIC
3001 Australia
AEC 1702: Using thyroid hormone-based therapies to repair and protect the brain in the intrauterine growth restricted rat.
I am pleased to advise that this project has been approved by the RMIT University Animal Ethics Committee (AEC) for the period from 22 March 2017 until 22 March 2020. An approved version of the application is
attached.
Animals
Your application has been approved to use up to n=60 rats (female Wistar rat dams) and up to n=480 rats
(Wistar rat offspring) over the duration of the project.
The use of animals in scientific procedures is strictly regulated by the Australian code for the care and use of
animals for scientific purposes. The above project is conducted under a Scientific Procedures and Premises
License.
Responsibilities of investigators
1. Dr Mary Tolocs
2. Miss Delphi E. Kondos-Devcic
3. Miss Aminath Azhan
4. Dr Tania Romano
5. Mrs Madhavi Khore
6. Ms Courtney Gilchrist Responsibilities of investigators are described in the Australian code for the care and use of animals for scientific
purposes (section 2.4). Investigators have a ‘personal responsibility for all matters that relate to the wellbeing of
animals that they use, including their housing, husbandry and care. This responsibility extends throughout the
period of use approved by the AEC until provisions are made for the animal at the conclusion of their use’ (s.2.4.1).
Amendments and extensions
If you find reason to amend your research method you should advise the AEC and prepare a request for minor
amendment form. Please note that the AEC may only deal with ‘minor’ amendment requests. Major amendments to
projects normally require a new project application.
Adverse events or unexpected outcomes
As the primary investigator you have a significant responsibility to monitor the research and to take prompt steps to
deal with any unexpected outcomes. You must notify the AEC immediately of any serious or unexpected adverse
effects on animals, or unforeseen events, which may affect the ethical acceptability of your project.
Unwell animals must be immediately reported via the care forms available at the RMIT Animal Facility. In the case
of any emergency, the Animal Welfare Officer, may be contacted on 0409 521 234 at any time. In case of any
unexpected animal death, the researcher has a responsibility to organise an autopsy so as to determine the cause
of death.
Investigator guidelines for record keeping
Investigators are required to adhere to the strict guidelines regarding record keeping for their project. Note that
records associated with a project ‘should be available for audit by the institution and authorised external reviewers’.
Failure to maintain proper records may result in a compliance breach of the Code and place at risk the researcher’s
capacity to carry out research with animals.
Conditions of approval
The AEC may apply conditions of approval beyond the submission of annual/final reports. There are no specific
conditions attached to this project, except that described elsewhere in this letter.
Reports
Approval to continue a project is conditional on the submission of annual and final reports. Annual reports are
requested in December each year, and must be submitted whether or not the project has commenced or is inactive.
Report forms are available at www1.rmit.edu.au/staff/research/researchintegrity-and-governance/animal-ethics.
Failure to submit reports will mean that a project is no longer approved, and/or that approval will be withheld from
future projects.
All reports or communication regarding this project are to be forwarded to the research ethics coordinator at
On behalf of the AEC I wish you well with your research.
Dr Brad Hayward Research Ethics Coordinator On behalf of RMIT Animal Ethics Committee