A taxonomy of performance metrics in executive incentives ...
124
What to reward executives for? A taxonomy of performance metrics in executive incentives supplemented by an overview of business practice Authors Baeten, Xavier; Van Hove, Marthe Download date 27/01/2022 09:01:49 Link to Item http://hdl.handle.net/20.500.12127/6655
-
Upload
khangminh22 -
Category
Documents
-
view
3 -
download
0
Transcript of A taxonomy of performance metrics in executive incentives ...
What to reward executives for? A taxonomy ofperformance metrics in executive incentives
supplemented by an overview of business practice
Authors Baeten, Xavier; Van Hove, Marthe
Download date 27/01/2022 09:01:49
Link to Item http://hdl.handle.net/20.500.12127/6655
Marthe Van Hove
Prof. Xavier Baeten
Executive Remuneration Research Centre
A taxonomy of performance metrics
in executive incentives supplemented by an overview of business practice.
Prime Foundation Partner:

2
CONTENTS Introduction 3
How to read this paper? 5
KPI categorisation 6
Framework 6 Taking stock: use of performance metrics 9 Number of key performance indicators 11
Taxonomy 12
Financial key performance indicators 12
Share-based 13
Sales 13
Gross profit 14
EBITDA 14
EBIT 14
Profit before taxes 14
Net profit 15
Cash flow 15
Relative return 15
Cost 16
Debt 16
Economic profit 16
Non-financial key performance indicators 17
Strategy 18
Innovation 18
Legal and compliance 18
Risk management and internal control 19
Quality and efficiency 19
Sustainability index 19
Environment 20
Customer 20
Employee 21
Top management team 21
Supplier 22
Examples 23
Examples financial key performance indicators 23
Examples non-financial key performance indicators 59
References 116
References annual/remuneration reports 117
Hungry for more? Contact us! 122
3
Executive target-setting and linking it to
incentive systems proves to be a complex
process. Moreover, boards are under
increasing pressure to use a balanced set
of (strategic) performance metrics and to
look beyond financial indicators1. Key
performance indicators (KPIs) are defined
as critical indicators demonstrating a
company’s progress towards its key
business objectives2. The challenge many
boards and companies are facing is two-
fold.
On the one hand, there is an increased
focus on the use of non-financial
performance metrics to be included as a
driver in executive incentive systems. This
is caused by the following:
• An increased focus on
sustainability, which implies a
broader view than just accounting
measures. Today, more and more
companies feel the challenge and
responsibility to clarify which of the
United Nations’ Sustainable
Development Goals are key for
them and on which they have the
biggest impact. Also, from a risk
perspective, investors are more
and more looking at the extent to
which companies take this into
account, including in their reward
systems.
• From a regulatory perspective, the
European Commission’s
Shareholder Rights Directive asks
firms to include both financial and
non-financial performance criteria3.
• The fact that, in addition to lagging
indicators (such as accounting
measures), it can also be beneficial
to include leading indicators that
are more forward-looking and
concretely aligned with the
company’s strategy.
1 Gopalan, R., Horn, J., & Milbourn, T. (2017). Comp targets
that work. Harvard Business Review, 95(5), 102-107. 2 PricewaterhouseCoopers. (2007). Guide to key
performance indicators: Communicating the measures that
matter. Retrieved January 4, 2020, from 1316_UK KPI
2007_030907.indd (pwc.com)
On the other hand, companies are also
having difficulties finding the right set of
financial KPIs. They often tend to use
easy-to-measure data, while the real
challenge is to find the more critical KPIs,
taking into account shareholder
structures, business cycles, level in
organisational hierarchy, while also being
aware of the drawbacks caused by at least
some financial KPIs4.
Vlerick Business School’s Executive
Remuneration Research Centre has
developed this paper in order to inspire
practitioners looking for the ‘right’
financial and non-financial KPIs,
underlying both short-term incentives and
long-term incentives. This paper provides
a taxonomy of different indicators that can
be used. On top of this, the reader will be
inspired by the inclusion of a large set of
real-life examples (more than 100!) found
in the remuneration reports of STOXX
Europe 600 companies5 and grouped by
type of KPI.
The objective of our paper is not to
prescribe by providing the ultimate set of
KPIs – which would be ‘mission
impossible’, as this is highly dependent on
each firm’s specific situation. Rather, the
objective is to take a broad and non-
prescribing perspective by providing an
encompassing overview and inventory of
performance metrics used in executive
remuneration. As such, the paper offers a
guide to improving the choice of key
performance indicators by summarising
examples and inspiring practices. Of
course, KPIs need to be deduced from the
firm’s strategy and the objectives the firm
wants to achieve.
3 See art. 9a, 6 of the Directive (EU) 2017/828 of the
European Commission 4 Marr, B. (2012). Key Performance Indicators (KPI): The 75
measures every manager needs to know. Pearson UK.
5 For an overview of the companies currently included in the
STOXX Europe 600, see: https://www.stoxx.com/index-
details?symbol=SXXP
Introduction
4
COPYRIGHT © 2021 VLERICK BUSINESS SCHOOL, BELGIUM
No part of this publication may be copied, stored, transmitted, reproduced or distributed in any form or medium whatsoever without the permission of the copyright owner.
What to reward executives for? A taxonomy of performance metrics in executive
incentives supplemented by an overview of
business practice.

5
The paper is organised as follows:
• It starts with categorising KPIs into
the main performance dimensions
involved, which is a unique
categorisation developed by Vlerick
Business School’s Executive
Remuneration Research Centre, based
on both research and business
practice.
• Next, it provides an overview of the
use of each of these performance
dimensions in incentive systems, as
well as the number of KPIs
determining CEO incentives.
• Last but not least, numerous
examples of concrete performance
metrics used for each of the
performance categories are provided.
It is important to note that we do not
take into account sector-specific
metrics6.
Concretely, the paper consists of three
parts:
• KPI categorisation. In the first part
of the paper, the overall typology of
performance metrics used in executive
incentive contracts is presented and
explained. Moreover, we ‘take stock’
by providing an overview of the use of
performance metrics in incentive
contracts (both short- and long-term
incentives), from both the perspective
of the types of KPIs and the number of
KPIs used.
• Taxonomy. The core part of this
paper includes the taxonomy of
performance metrics. Here, the
remuneration reports of STOXX Europe
600 companies served as the source of
inspiration. In this part, an overview is
provided of the concrete KPIs used,
grouped into the different categories
(e.g., EBITDA, cash flow, environment,
etc.). Next to the concrete KPIs,
reference is made to examples
6 E.g., solvency ratio for banks, occupancy rate for real
estate, innovation milestone in pharmaceutical industry, etc.
included for some of the underlying
metrics (e.g., highlighted below):
• Examples. The third part of the paper
contains the examples mentioned
under the taxonomy, which provide
more specific information about the
underlying metric (e.g., Example 1
share-based: TSR compared to peer
group).
To conclude: the optimal way to read this
paper is to first go through the lists of
underlying metrics and then select the
examples you want to have more
information about. The reader can easily
navigate through the paper by clicking on
the examples in the taxonomy (e.g., by
clicking on Example 1, you will
automatically go to the example of
Schroders). You can go back to the
taxonomy by clicking on the KPI category
mentioned above the example (e.g.,
Share-based: STI).
How to read this paper?
6
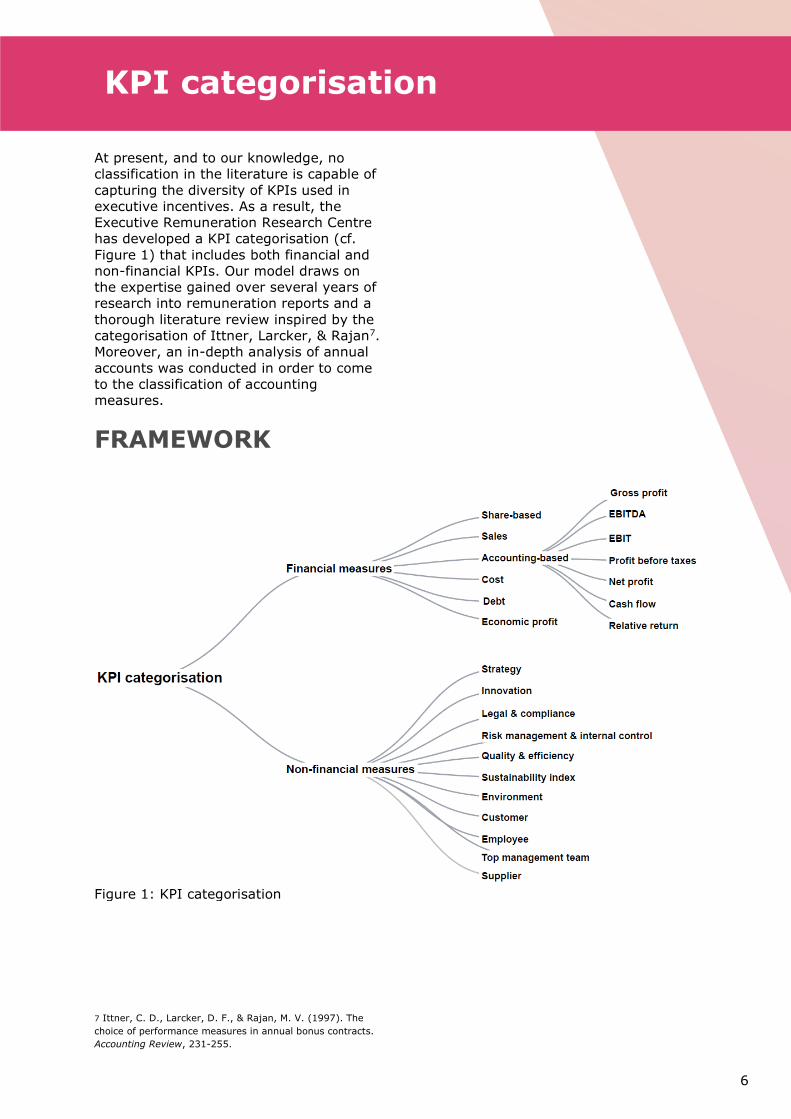
At present, and to our knowledge, no
classification in the literature is capable of
capturing the diversity of KPIs used in
executive incentives. As a result, the
Executive Remuneration Research Centre
has developed a KPI categorisation (cf.
Figure 1) that includes both financial and
non-financial KPIs. Our model draws on
the expertise gained over several years of
research into remuneration reports and a
thorough literature review inspired by the
categorisation of Ittner, Larcker, & Rajan7.
Moreover, an in-depth analysis of annual
accounts was conducted in order to come
to the classification of accounting
measures.
FRAMEWORK
7 Ittner, C. D., Larcker, D. F., & Rajan, M. V. (1997). The
choice of performance measures in annual bonus contracts.
Accounting Review, 231-255.
KPI categorisation
Figure 1: KPI categorisation
7
As mentioned in the Introduction, key
performance indicators (KPIs) are defined
as critical indicators demonstrating a
company’s progress towards its key
business objectives. Our model of KPIs
consists of 3 layers (cf. Figure 1).
The first layer distinguishes between
financial (lagging) and non-financial
(leading) performance metrics. Financial
KPIs are measures that indicate a
company's financial performance in order
to achieve financial objectives.
Conversely, non-financial KPIs are
measures defining what actions are
necessary to successfully meet overall
business objectives.
The second layer provides the different
dimensions underlying financial and non-
financial KPIs8.
The dimensions underlying financial
KPIs include:
• Share-based: based on the
company’s stock price.
• Sales: based on the company’s
revenues/sales.
• Accounting-based: based on the
company’s profit & loss statement.
• Cost: criteria measuring cost-
reduction, -management, and -
effectiveness.
• Debt: criteria to determine the
proportion of a company's assets
that is financed through debt.
• Economic profit: criteria designed
to measure value creation at the
most basic level of a corporation’s
operations9.
8 Each of these dimensions will be further explained in this
paper by the means of concrete examples. 9 Economic Value Added. Stern Value Management.
https://sternvaluemanagement.com/economic-value-added-
eva 10 Sustainability Accounting Standards Board. (2020). Bases
for conclusions & invitation to comment on exposure drafts.
https://www.sasb.org/wp-
The dimensions underlying
non-financial KPIs include:
• Strategy: metrics that define
strategic success.
• Innovation: criteria measuring new
developments/products and market
success in a company.
• Legal & compliance: metrics
defining the performance of a
company’s compliance efforts and
legal requirements.
• Risk management & internal
control: criteria measuring internal
control and risks that the business
is exposed to.
• Quality & efficiency: measures
used to monitor a company’s
quality and efficiency performance
by means of pre-established
standards.
• Environment: measures related to
the firm’s environmental impact as
a consequence of its activities10.
• Customer: criteria tracking the
progress on specific business
objectives regarding customer
service.
• Employee: metrics related to the
company’s workforce, addressing
issues such as health and safety,
labour practices, employee
satisfaction and engagement, and
diversity and inclusion11.
• Top management team: criteria
designed to measure top
management abilities and
competences.
• Supplier: metrics tracking supply
chain performance and monitoring
supplier relationships.
content/uploads/2020/08/Invitation-to-Comment-SASB-CF-
RoP.pdf 11 Sustainability Accounting Standards Board. (2020). Bases
for conclusions & invitation to comment on exposure drafts.
https://www.sasb.org/wp-
content/uploads/2020/08/Invitation-to-Comment-SASB-CF-
RoP.pdf
8
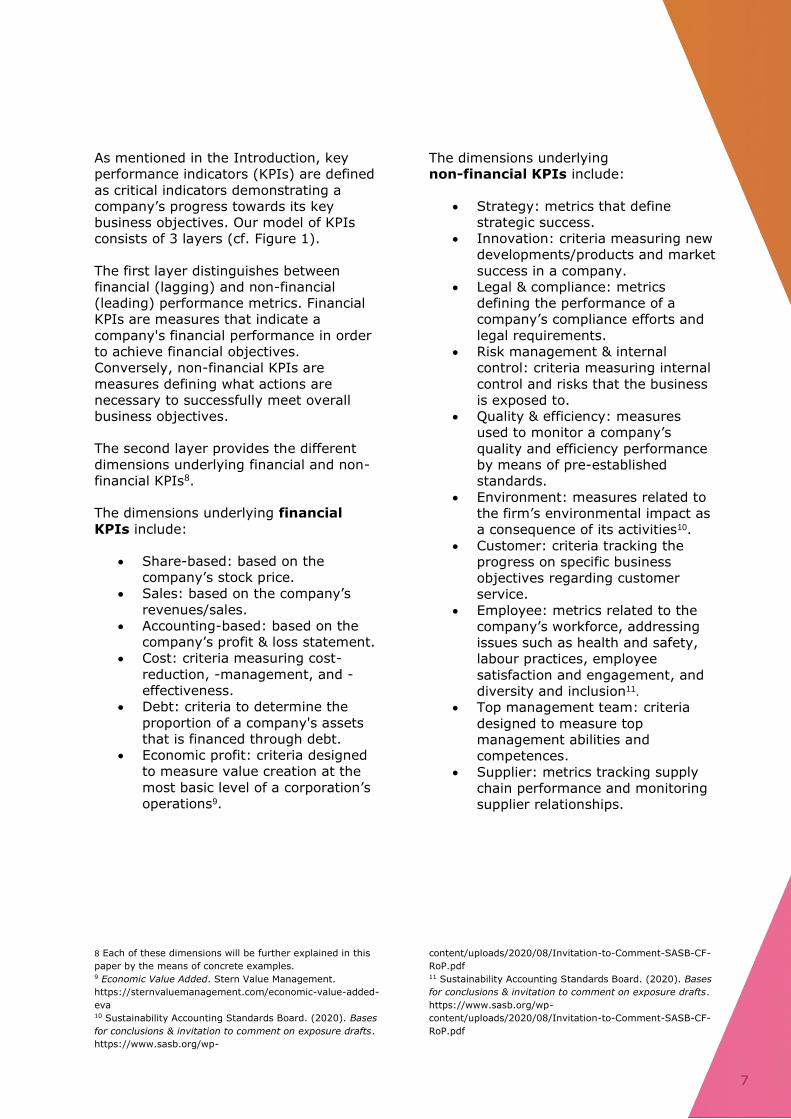
The third layer is the most detailed level,
including a further subdivision of
accounting-based measures. The
calculation of the accounting-based
measures can be found in Figure 2 and
follows the flow of the profit and loss
account.
In the next section of this paper, we will
first elaborate on the use of each of these
financial and non-financial KPI categories.
Sales
- Cost of goods sold
Gross profit
- Operating expenses
EBITDA
- Depreciation - amortization
EBIT
- Interest expenses
Profit before taxes
- Taxes
Net profit
+ Depreciation + amortization - change in working capital - CAPEX
Cash flow
Figure 2: Calculation of the accounting-based measures
9
TAKING STOCK: USE OF PERFORMANCE
METRICS
After the categorisation of financial and
non-financial performance metrics, an
interesting question pops up: To what
extent do firms make use of the different
performance criteria in their executive
incentive systems?
Following the taxonomy which was just
presented, it is interesting to focus on the
evolution in financial and non-financial
KPIs from an executive incentive
perspective (layer 1 in our KPI model).
The percentages below are based on the
STOXX Europe 600 companies that make
use of performance criteria to determine
their STI or LTI plan.
• Financial year 2014: 99% make
use of financial KPIs in STI and
99% in LTI compared to 71% (STI)
and 17% (LTI) for non-financial
KPIs.
• Financial year 2019: 98% make
use of financial KPIs in STI and
98% in LTI compared to 83% (STI)
and 30% (LTI) for non-financial
KPIs.
It can be concluded that non-financial
KPIs are most prevalent in short-term
incentive schemes and that their use has
grown over time.
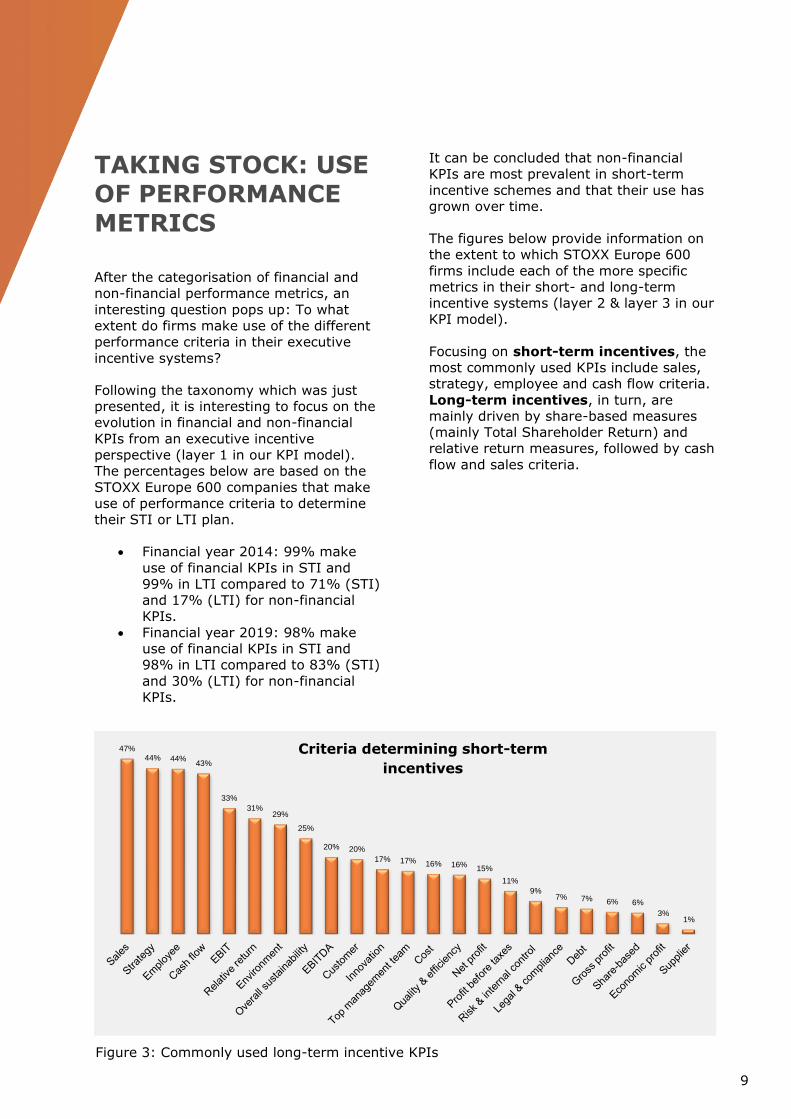
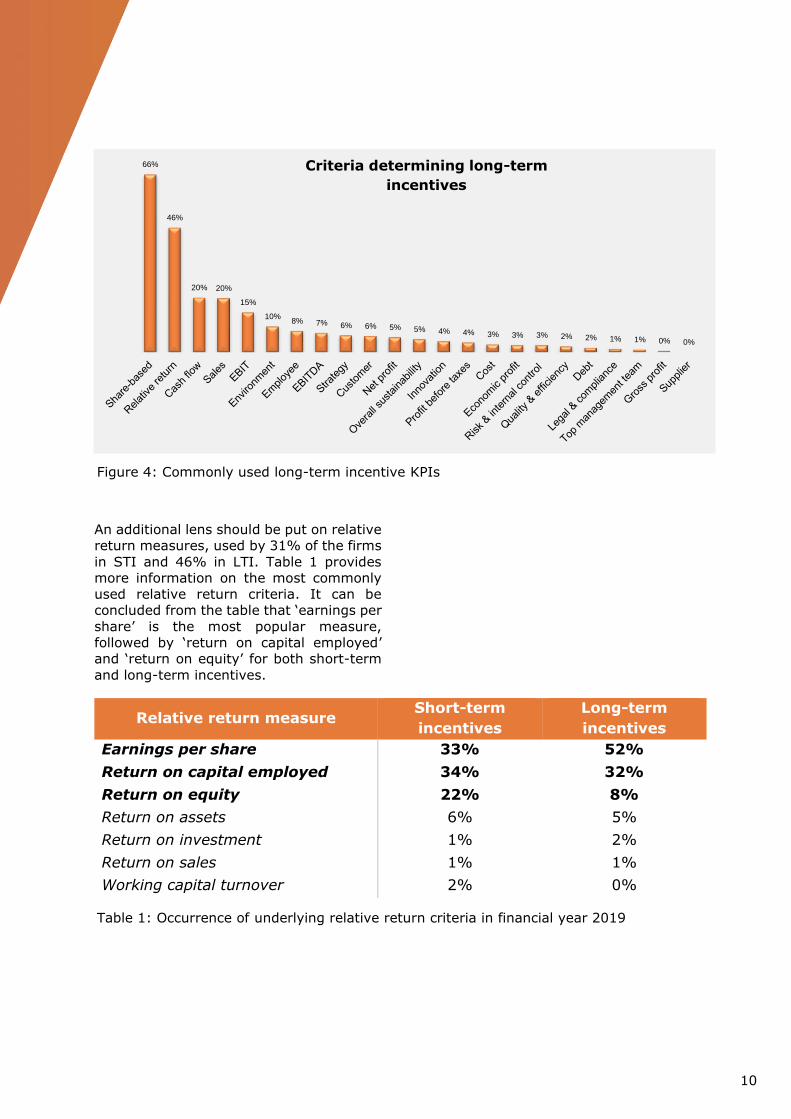
The figures below provide information on
the extent to which STOXX Europe 600
firms include each of the more specific
metrics in their short- and long-term
incentive systems (layer 2 & layer 3 in our
KPI model).
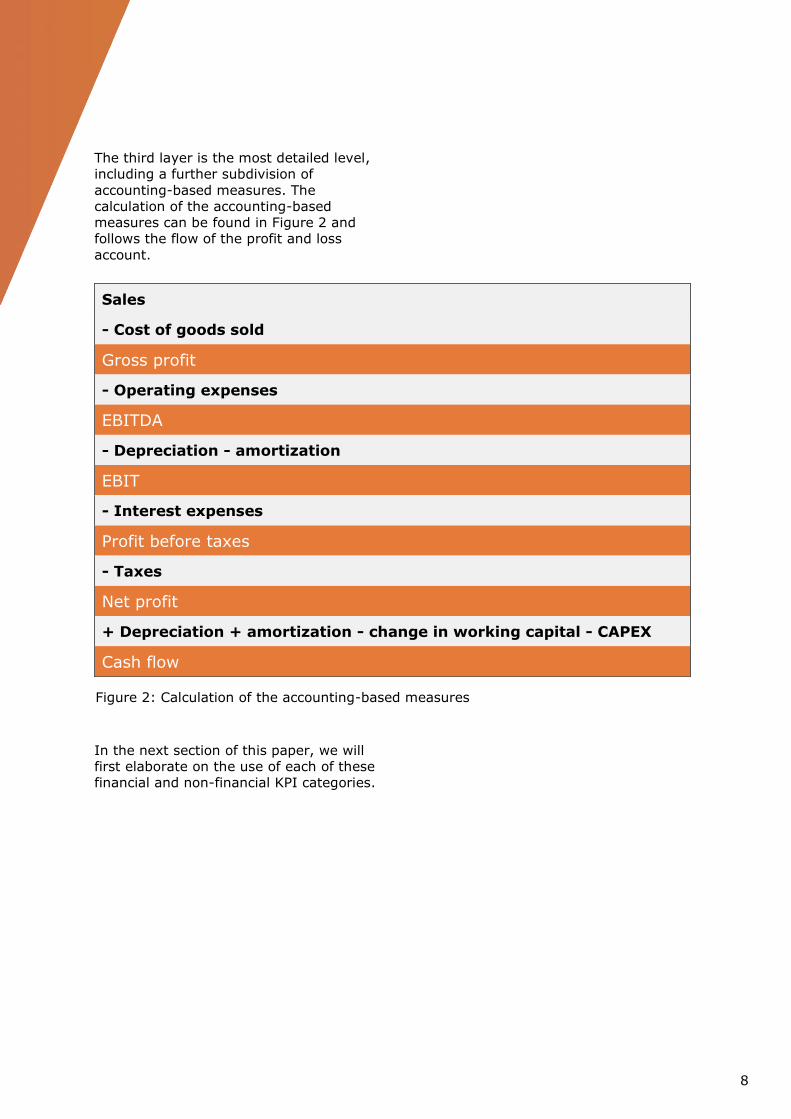
Focusing on short-term incentives, the
most commonly used KPIs include sales,
strategy, employee and cash flow criteria.
Long-term incentives, in turn, are
mainly driven by share-based measures
(mainly Total Shareholder Return) and
relative return measures, followed by cash
flow and sales criteria.
47%44% 44%
43%
33%
31%29%
25%
20% 20%
17% 17% 16% 16%15%
11%
9%7% 7% 6% 6%
3%1%
Criteria determining short-term
incentives
Figure 3: Commonly used long-term incentive KPIs
10
An additional lens should be put on relative
return measures, used by 31% of the firms
in STI and 46% in LTI. Table 1 provides
more information on the most commonly
used relative return criteria. It can be
concluded from the table that ‘earnings per
share’ is the most popular measure,
followed by ‘return on capital employed’
and ‘return on equity’ for both short-term
and long-term incentives.
Relative return measure Short-term
incentives
Long-term
incentives
Earnings per share 33% 52%
Return on capital employed 34% 32%
Return on equity 22% 8%
Return on assets 6% 5%
Return on investment 1% 2%
Return on sales 1% 1%
Working capital turnover 2% 0%
Figure 4: Commonly used long-term incentive KPIs
66%
46%
20% 20%
15%
10%8% 7% 6% 6% 5% 5% 4% 4% 3% 3% 3% 2% 2% 1% 1% 0% 0%
Criteria determining long-term
incentives
Table 1: Occurrence of underlying relative return criteria in financial year 2019
11
NUMBER OF KEY PERFORMANCE
INDICATORS
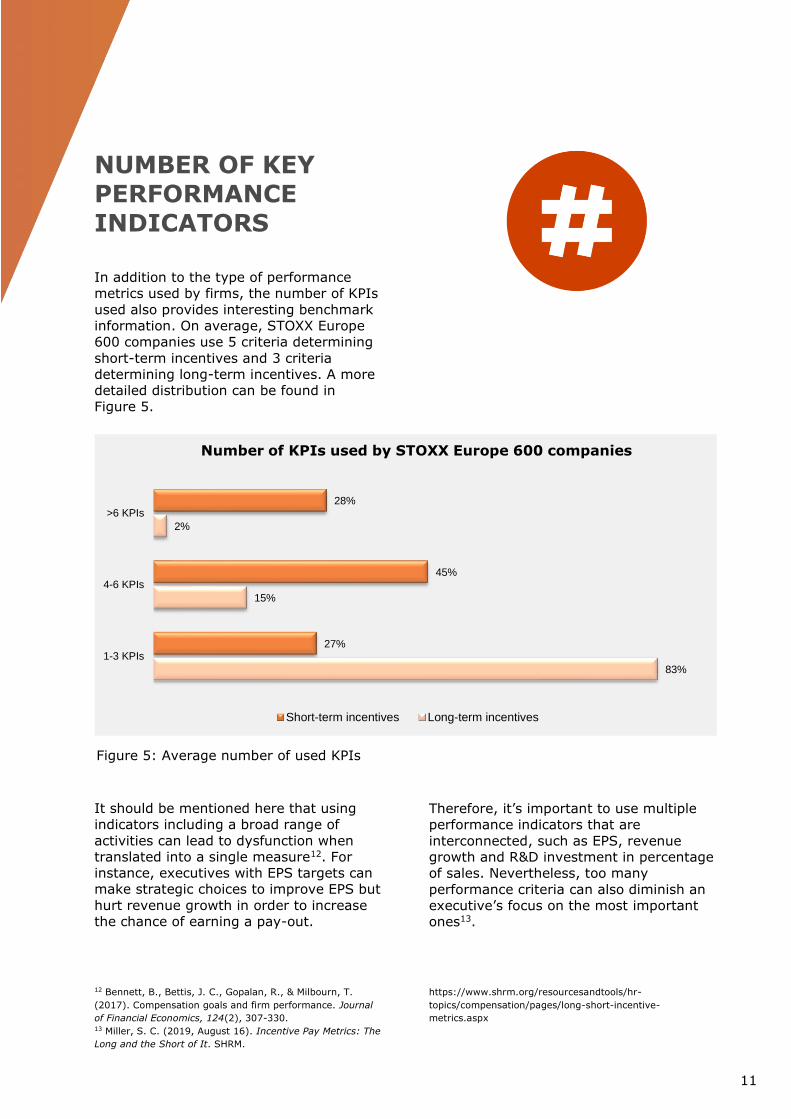
In addition to the type of performance
metrics used by firms, the number of KPIs
used also provides interesting benchmark
information. On average, STOXX Europe
600 companies use 5 criteria determining
short-term incentives and 3 criteria
determining long-term incentives. A more
detailed distribution can be found in
Figure 5.
It should be mentioned here that using
indicators including a broad range of
activities can lead to dysfunction when
translated into a single measure12. For
instance, executives with EPS targets can
make strategic choices to improve EPS but
hurt revenue growth in order to increase
the chance of earning a pay-out.
12 Bennett, B., Bettis, J. C., Gopalan, R., & Milbourn, T.
(2017). Compensation goals and firm performance. Journal
of Financial Economics, 124(2), 307-330. 13 Miller, S. C. (2019, August 16). Incentive Pay Metrics: The
Long and the Short of It. SHRM.
Therefore, it’s important to use multiple
performance indicators that are
interconnected, such as EPS, revenue
growth and R&D investment in percentage
of sales. Nevertheless, too many
performance criteria can also diminish an
executive’s focus on the most important
ones13.
https://www.shrm.org/resourcesandtools/hr-
topics/compensation/pages/long-short-incentive-
metrics.aspx
83%
15%
2%
27%
45%
28%
1-3 KPIs
4-6 KPIs
>6 KPIs
Short-term incentives Long-term incentives
Number of KPIs used by STOXX Europe 600 companies
Figure 5: Average number of used KPIs
12
As mentioned, the core part of this paper
consists in providing the reader with
concrete information on the exact
meaning of each of the KPI categories, as
well as examples for each of the
performance metrics outlined above. For
each of the KPI categories, metrics will be
presented.
The order follows the structure of KPIs
outlined above. As far as the order of
examples is concerned, examples of the
use of the metrics in short-term incentives
will be provided first, followed by
examples of use in long-term incentives.
FINANCIAL KEY PERFORMANCE INDICATORS
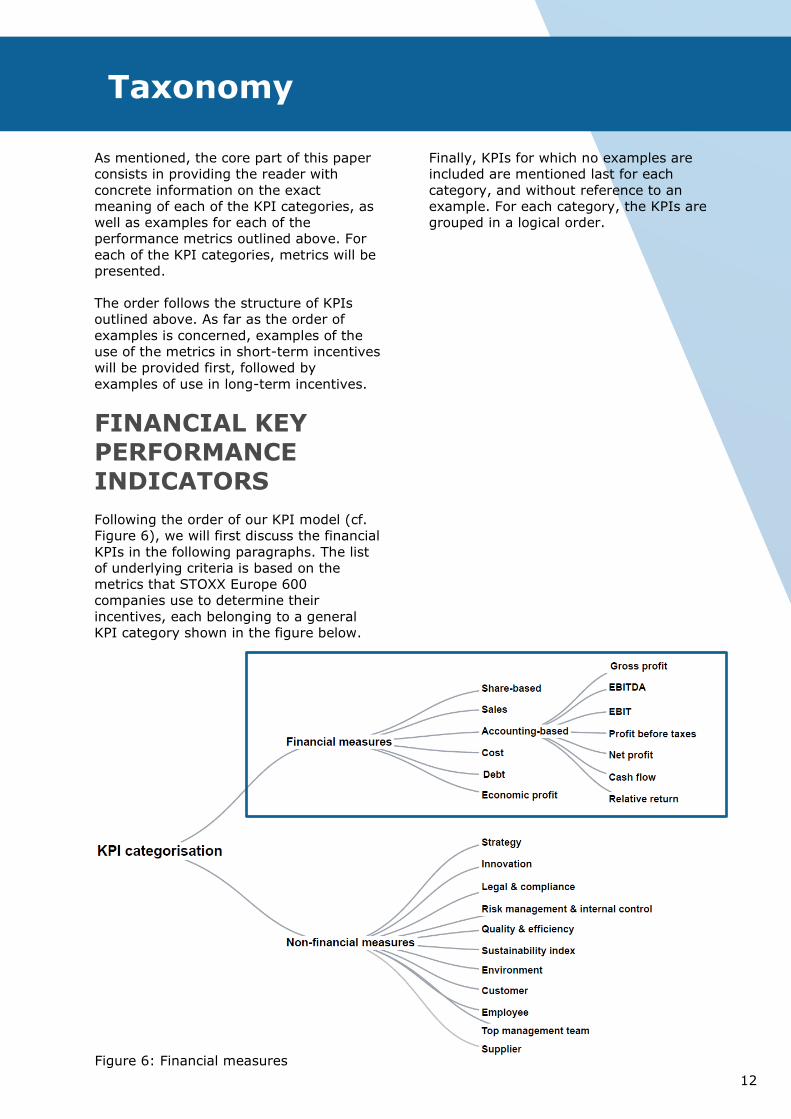
Following the order of our KPI model (cf.
Figure 6), we will first discuss the financial
KPIs in the following paragraphs. The list
of underlying criteria is based on the
metrics that STOXX Europe 600
companies use to determine their
incentives, each belonging to a general
KPI category shown in the figure below.
Finally, KPIs for which no examples are
included are mentioned last for each
category, and without reference to an
example. For each category, the KPIs are
grouped in a logical order.
Figure 6: Financial measures
Taxonomy
13
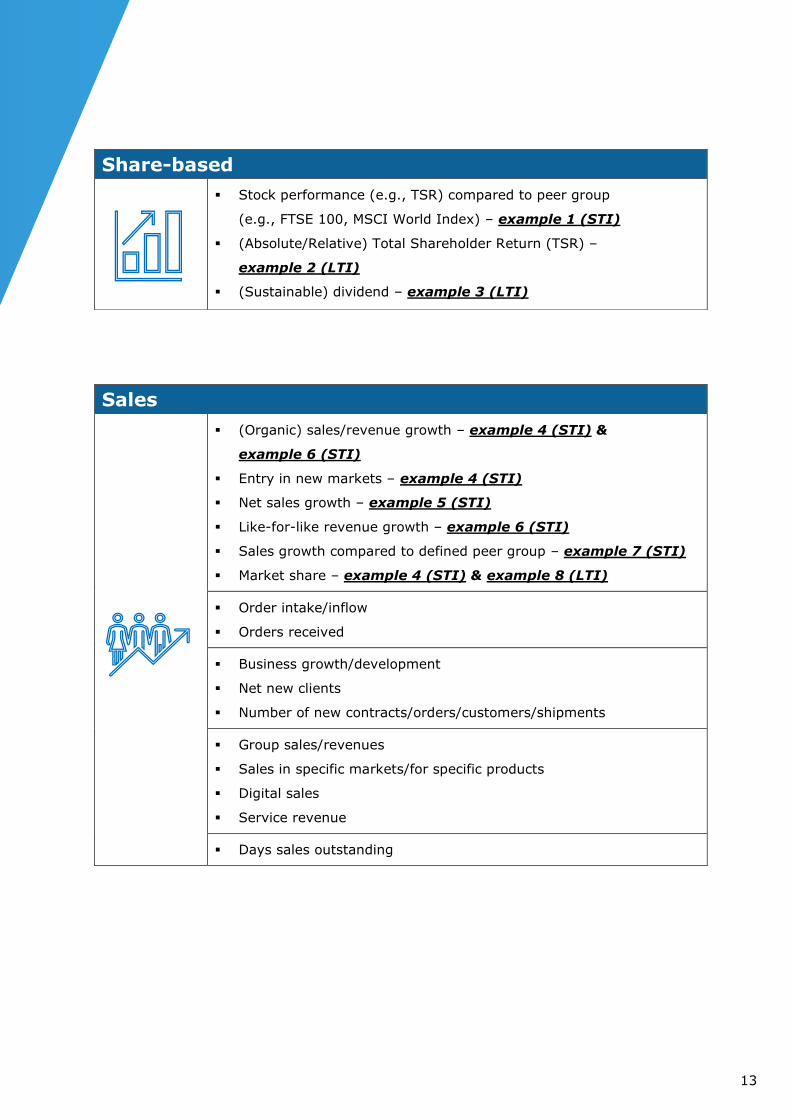
Share-based
▪ Stock performance (e.g., TSR) compared to peer group
(e.g., FTSE 100, MSCI World Index) – example 1 (STI)
▪ (Absolute/Relative) Total Shareholder Return (TSR) –
example 2 (LTI)
▪ (Sustainable) dividend – example 3 (LTI)
Sales
▪ (Organic) sales/revenue growth – example 4 (STI) &
example 6 (STI)
▪ Entry in new markets – example 4 (STI)
▪ Net sales growth – example 5 (STI)
▪ Like-for-like revenue growth – example 6 (STI)
▪ Sales growth compared to defined peer group – example 7 (STI)
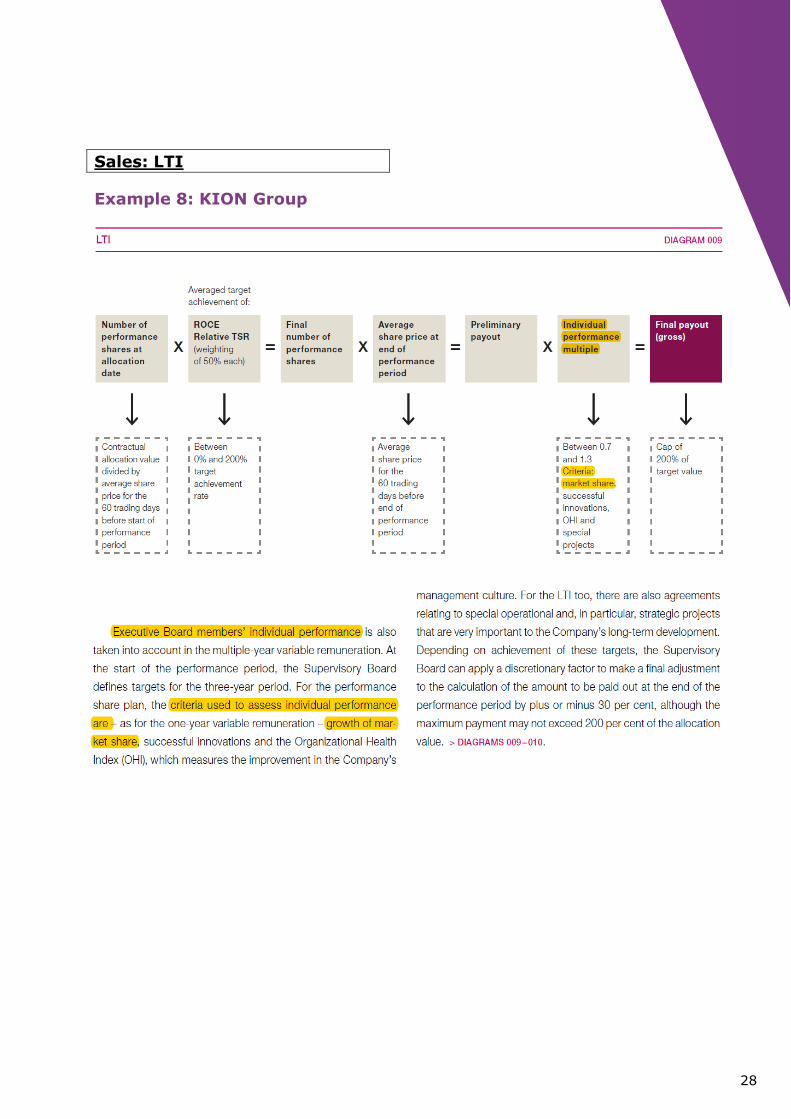
▪ Market share – example 4 (STI) & example 8 (LTI)
▪ Order intake/inflow
▪ Orders received
▪ Business growth/development
▪ Net new clients
▪ Number of new contracts/orders/customers/shipments
▪ Group sales/revenues
▪ Sales in specific markets/for specific products
▪ Digital sales
▪ Service revenue
▪ Days sales outstanding
14
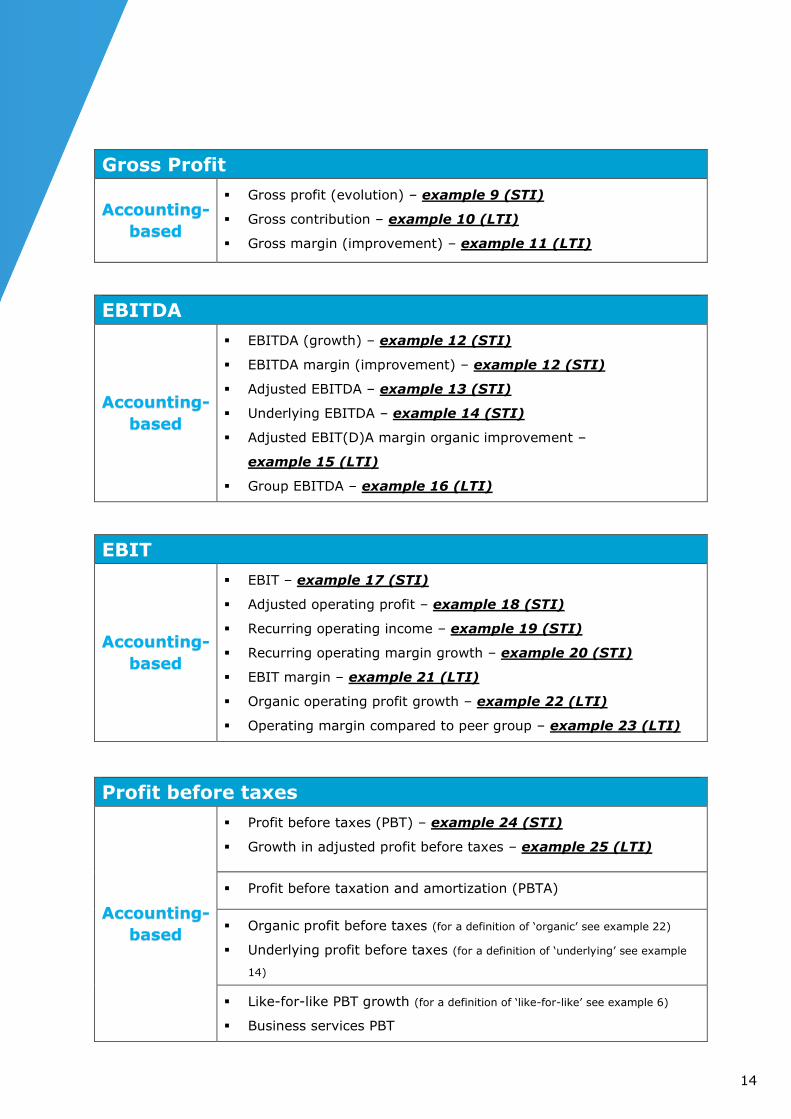
Gross Profit
Accounting-
based
▪ Gross profit (evolution) – example 9 (STI)
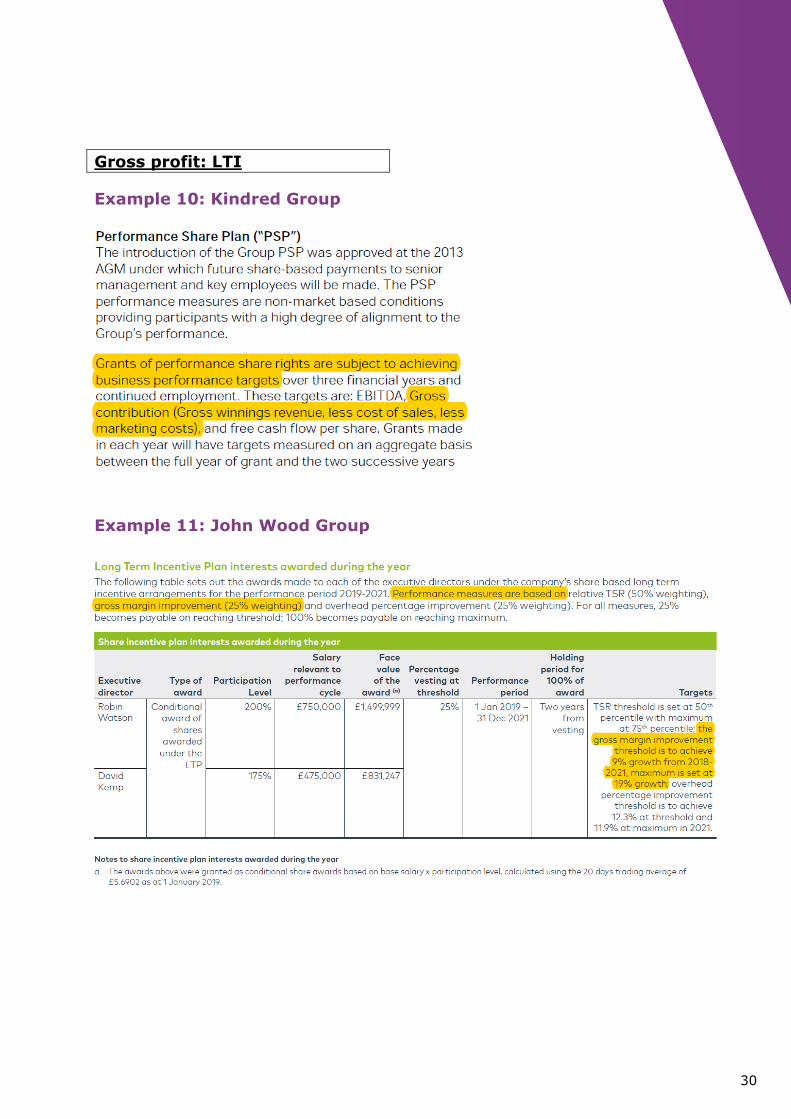
▪ Gross contribution – example 10 (LTI)
▪ Gross margin (improvement) – example 11 (LTI)
EBITDA
Accounting-
based
▪ EBITDA (growth) – example 12 (STI)
▪ EBITDA margin (improvement) – example 12 (STI)
▪ Adjusted EBITDA – example 13 (STI)
▪ Underlying EBITDA – example 14 (STI)
▪ Adjusted EBIT(D)A margin organic improvement –
example 15 (LTI)
▪ Group EBITDA – example 16 (LTI)
EBIT
Accounting-
based
▪ EBIT – example 17 (STI)
▪ Adjusted operating profit – example 18 (STI)
▪ Recurring operating income – example 19 (STI)
▪ Recurring operating margin growth – example 20 (STI)
▪ EBIT margin – example 21 (LTI)
▪ Organic operating profit growth – example 22 (LTI)
▪ Operating margin compared to peer group – example 23 (LTI)
Profit before taxes
Accounting-
based
▪ Profit before taxes (PBT) – example 24 (STI)
▪ Growth in adjusted profit before taxes – example 25 (LTI)
▪ Profit before taxation and amortization (PBTA)
▪ Organic profit before taxes (for a definition of ‘organic’ see example 22)
▪ Underlying profit before taxes (for a definition of ‘underlying’ see example
14)
▪ Like-for-like PBT growth (for a definition of ‘like-for-like’ see example 6)
▪ Business services PBT
15
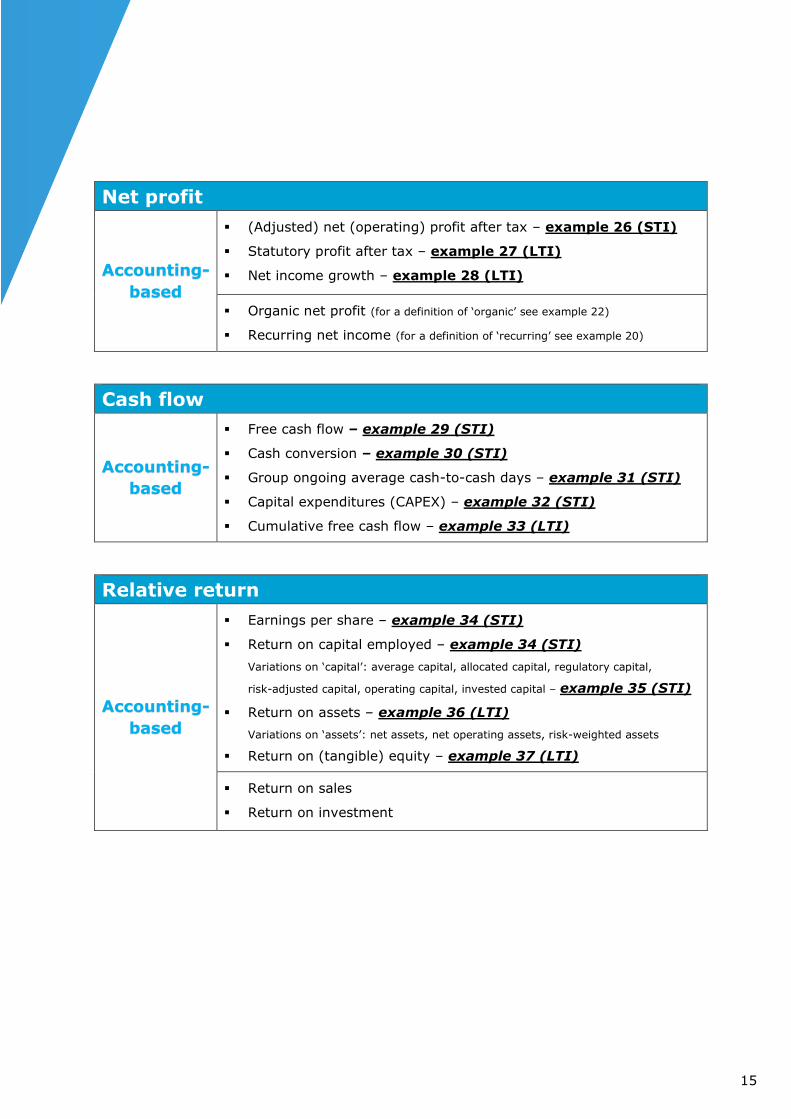
Net profit
Accounting-
based
▪ (Adjusted) net (operating) profit after tax – example 26 (STI)
▪ Statutory profit after tax – example 27 (LTI)
▪ Net income growth – example 28 (LTI)
▪ Organic net profit (for a definition of ‘organic’ see example 22)
▪ Recurring net income (for a definition of ‘recurring’ see example 20)
Cash flow
Accounting-
based
▪ Free cash flow – example 29 (STI)
▪ Cash conversion – example 30 (STI)
▪ Group ongoing average cash-to-cash days – example 31 (STI)
▪ Capital expenditures (CAPEX) – example 32 (STI)
▪ Cumulative free cash flow – example 33 (LTI)
Relative return
Accounting-
based
▪ Earnings per share – example 34 (STI)
▪ Return on capital employed – example 34 (STI)
Variations on ‘capital’: average capital, allocated capital, regulatory capital,
risk-adjusted capital, operating capital, invested capital – example 35 (STI)
▪ Return on assets – example 36 (LTI)
Variations on ‘assets’: net assets, net operating assets, risk-weighted assets
▪ Return on (tangible) equity – example 37 (LTI)
▪ Return on sales
▪ Return on investment
16
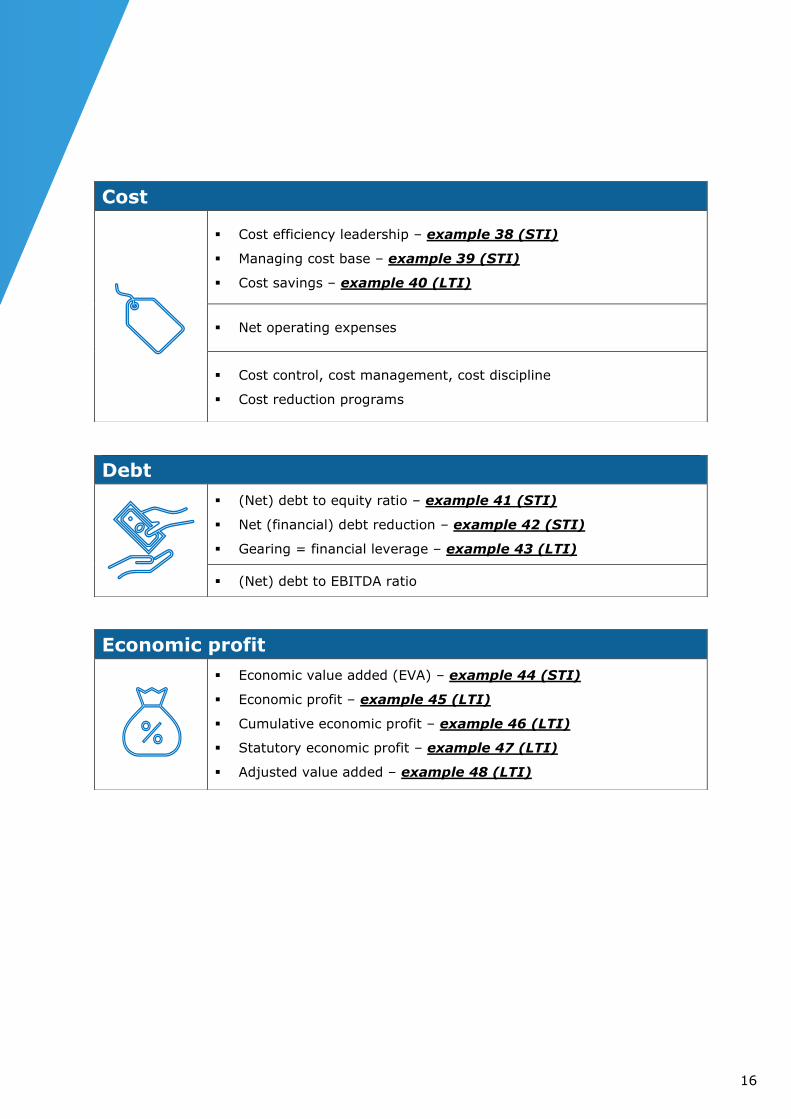
Cost
▪ Cost efficiency leadership – example 38 (STI)
▪ Managing cost base – example 39 (STI)
▪ Cost savings – example 40 (LTI)
▪ Net operating expenses
▪ Cost control, cost management, cost discipline
▪ Cost reduction programs
Debt
▪ (Net) debt to equity ratio – example 41 (STI)
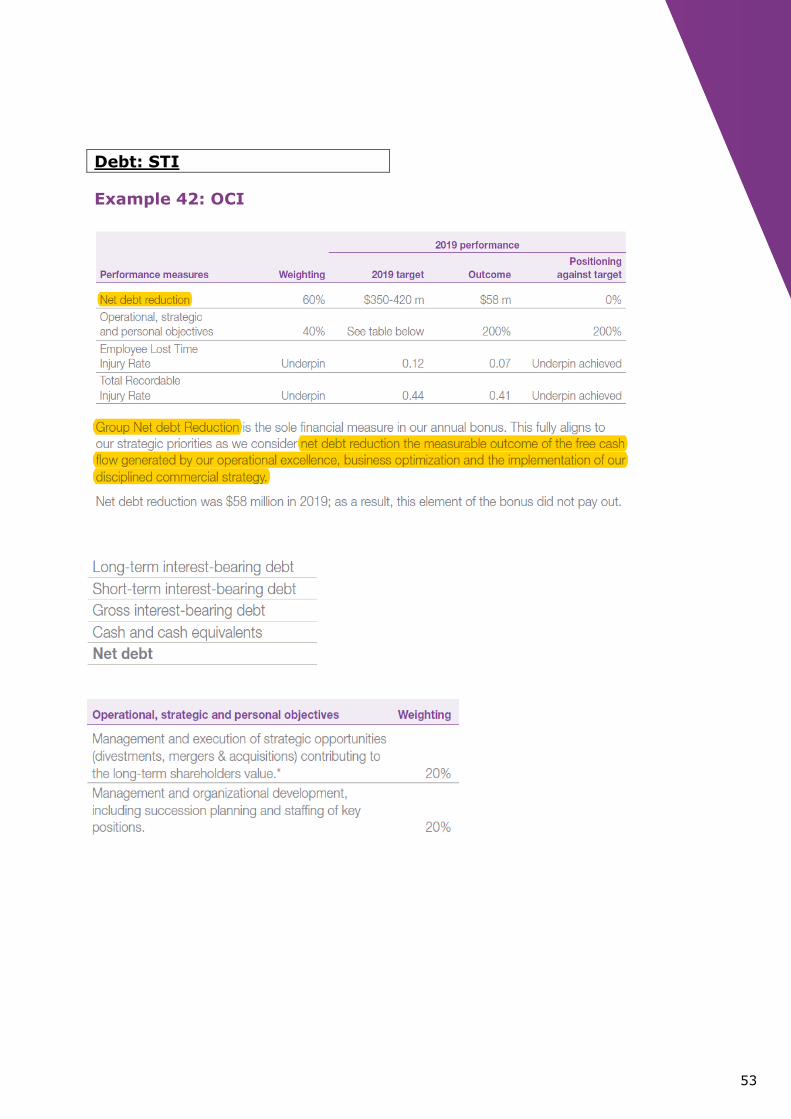
▪ Net (financial) debt reduction – example 42 (STI)
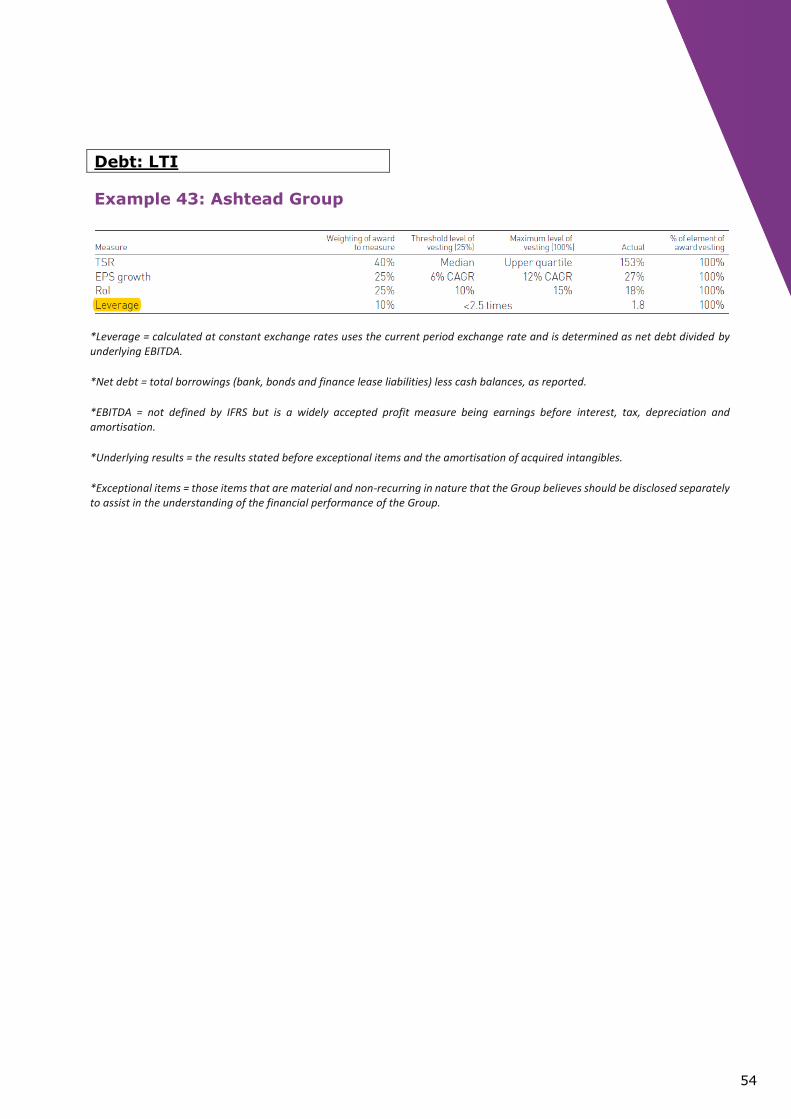
▪ Gearing = financial leverage – example 43 (LTI)
▪ (Net) debt to EBITDA ratio
Economic profit
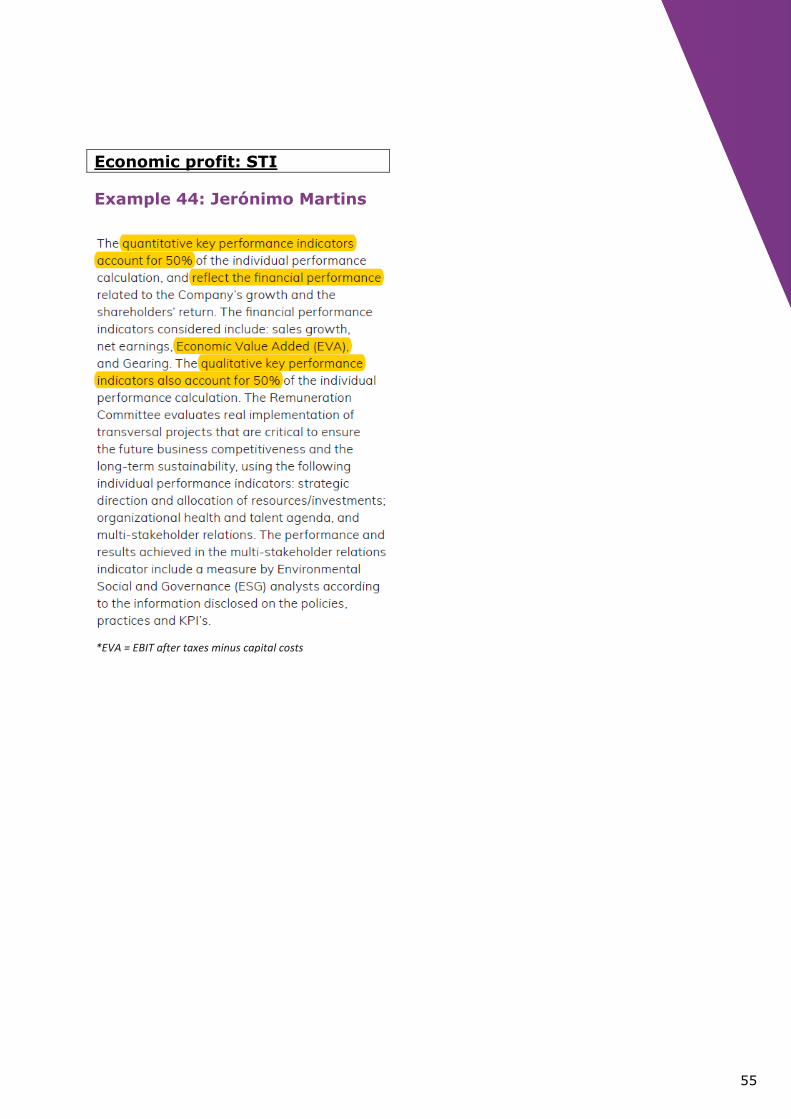
▪ Economic value added (EVA) – example 44 (STI)
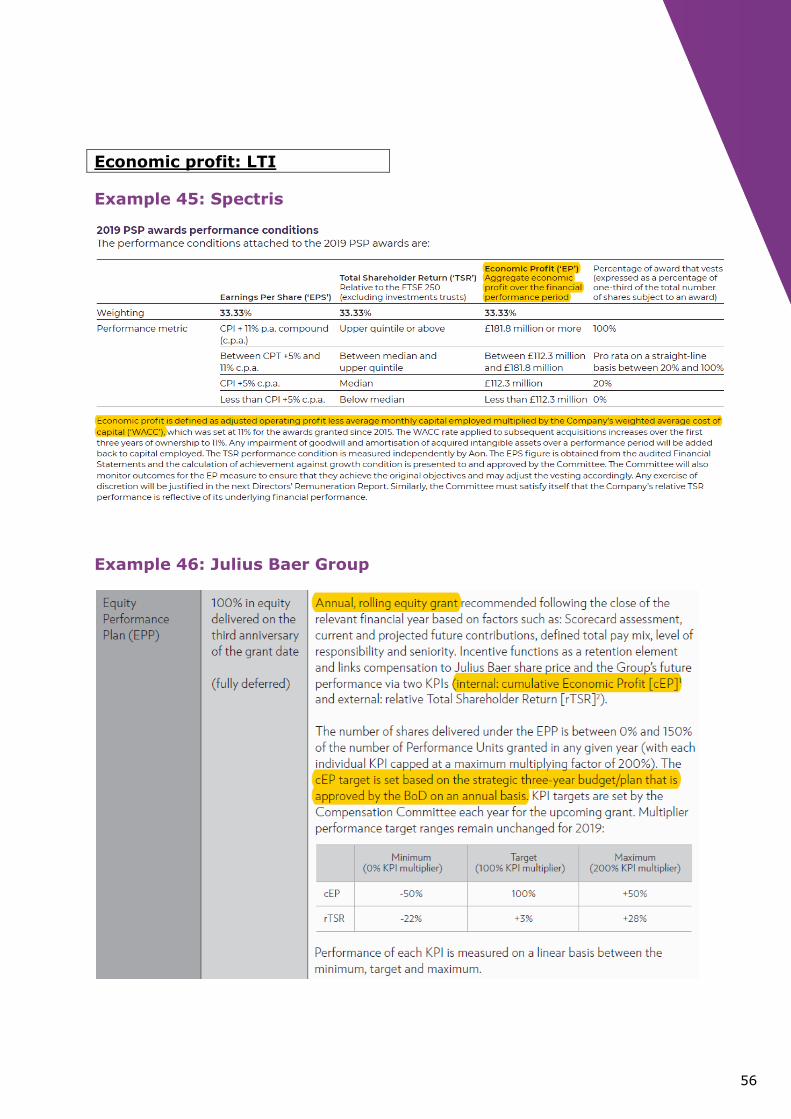
▪ Economic profit – example 45 (LTI)
▪ Cumulative economic profit – example 46 (LTI)
▪ Statutory economic profit – example 47 (LTI)
▪ Adjusted value added – example 48 (LTI)
17
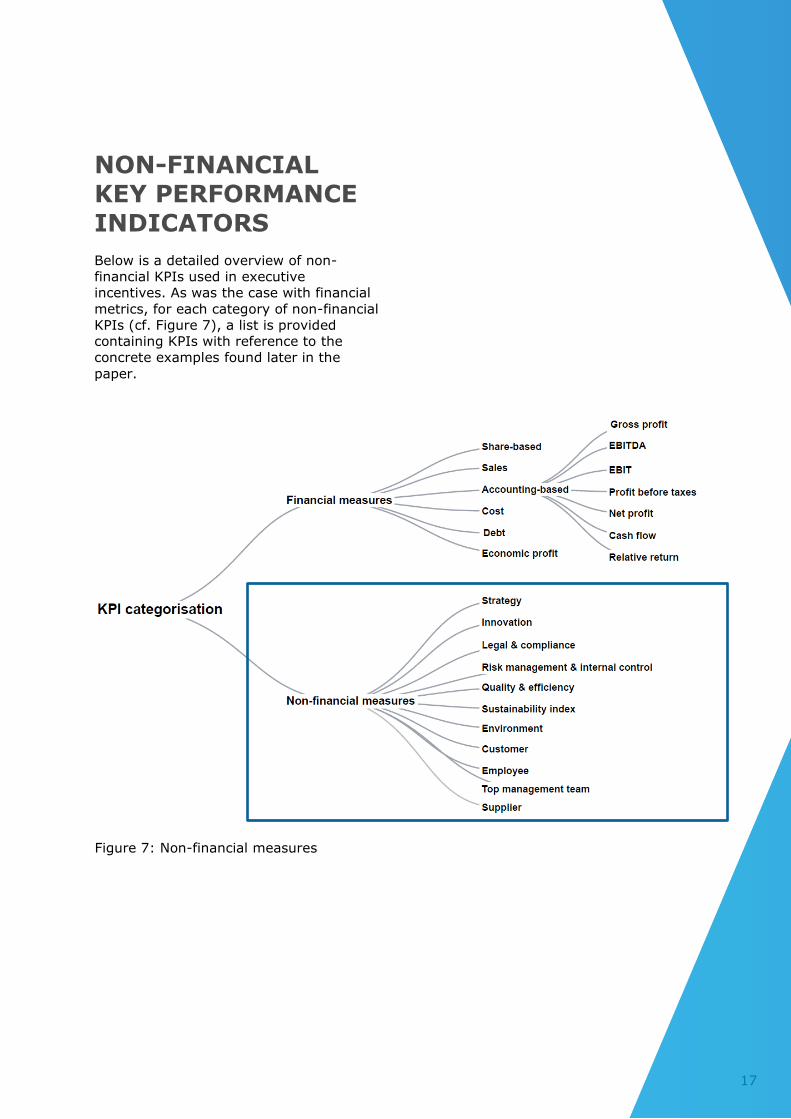
NON-FINANCIAL KEY PERFORMANCE
INDICATORS
Below is a detailed overview of non-
financial KPIs used in executive
incentives. As was the case with financial
metrics, for each category of non-financial
KPIs (cf. Figure 7), a list is provided
containing KPIs with reference to the
concrete examples found later in the
paper.
Figure 7: Non-financial measures
18
Strategy
▪ Roll-out and delivery of strategic plans – example 49 (STI)
▪ Strategy execution (capability) – example 50 (STI)
▪ Acquisition/Licensing objectives – example 51 (STI)
▪ Partnership development – example 52 (STI)
▪ Strategic objectives – example 53 (LTI)
▪ Strategy implementation – example 54 (LTI)
Innovation
▪ New product development / R&D – example 55 (STI)
▪ Digital transformation and disruption – example 56 (STI)
▪ Development of new trends and innovative technologies – example
57 (STI)
▪ Implementation of a new innovation strategy – example 58 (STI)
▪ Technology Leadership Index – example 59 (LTI)
▪ Successful innovations – example 60 (LTI)
Legal and compliance
▪ Measures to reinforce the compliance policy – example 61 (STI)
▪ GDPR compliance – example 62 (STI)
▪ Maintaining strong effective relationships with regulators –
example 63 (LTI)
▪ Further developing expertise relating to new legal requirements
19
Risk management and internal control
▪ Risk & control objectives – example 64 (STI)
▪ Risk mitigation – example 65 (STI)
▪ Risk management framework – example 66 (STI)
▪ Risk management – example 67 (STI)
▪ Environmental and community incidents – example 67 (STI)
▪ The control of risks relating to environmental performance –
example 68 (STI)
▪ Risk scorecard – example 69 (LTI)
▪ Cyber security (trainings)
▪ Training provided to employees by the Compliance Department
Regular Risk Committee
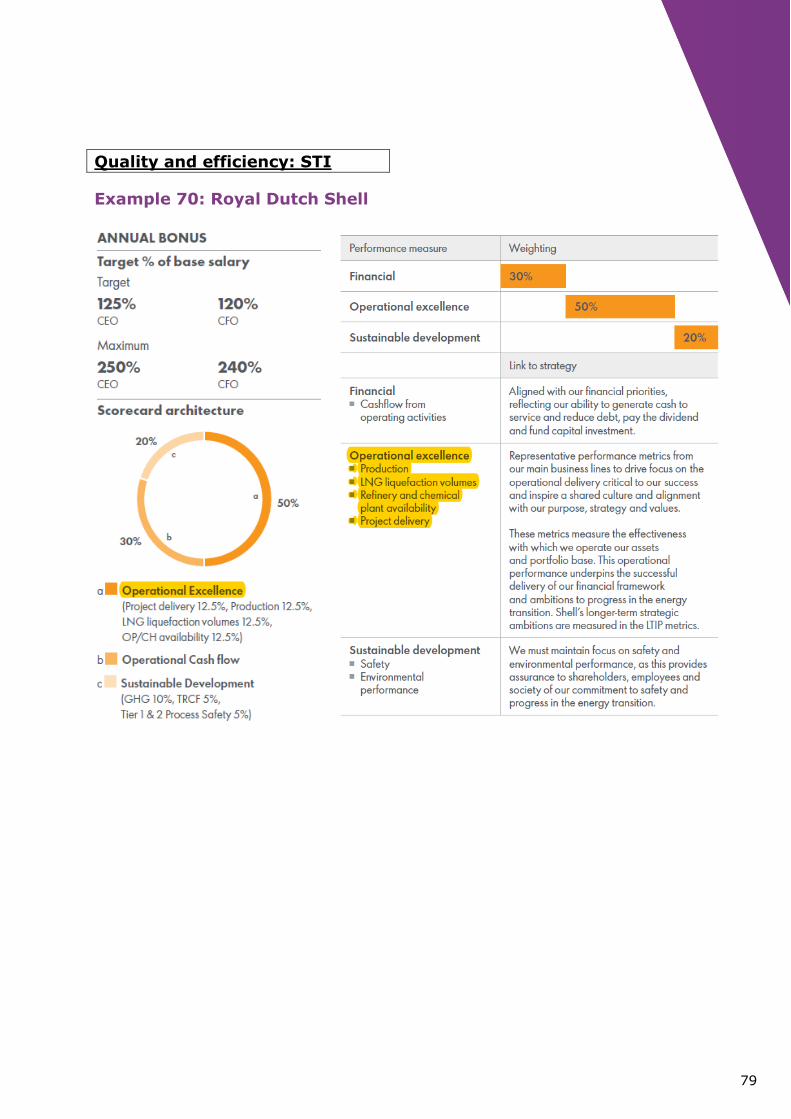
Quality and efficiency
▪ Operational excellence – example 70 (STI) & example 71
(STI)
▪ Process digitisation – example 71 (STI)
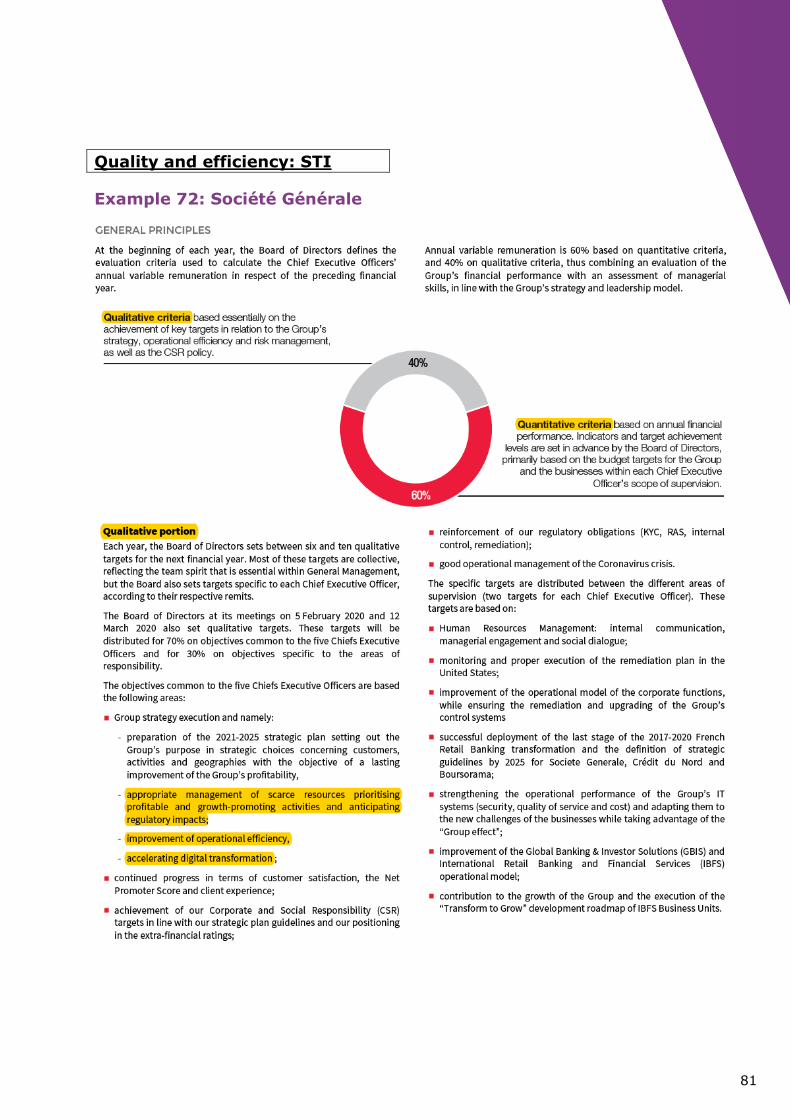
▪ Resource management – example 72 (STI)
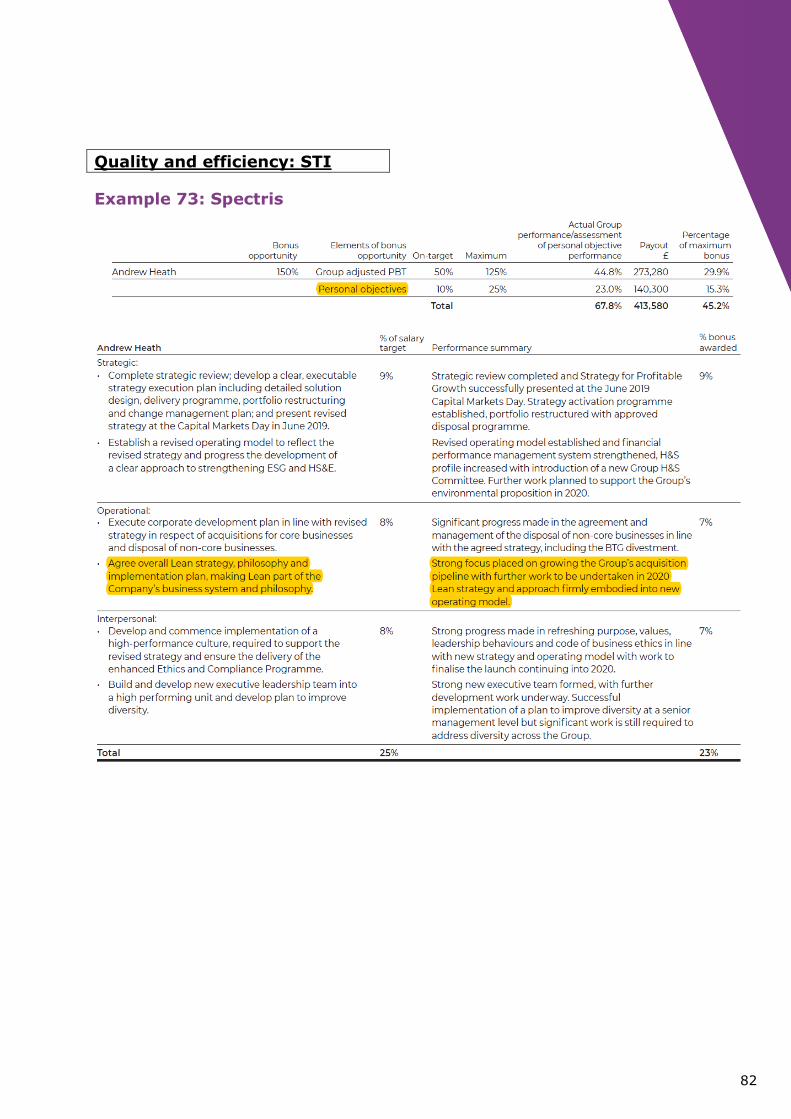
▪ Lean strategy – example 73 (STI)
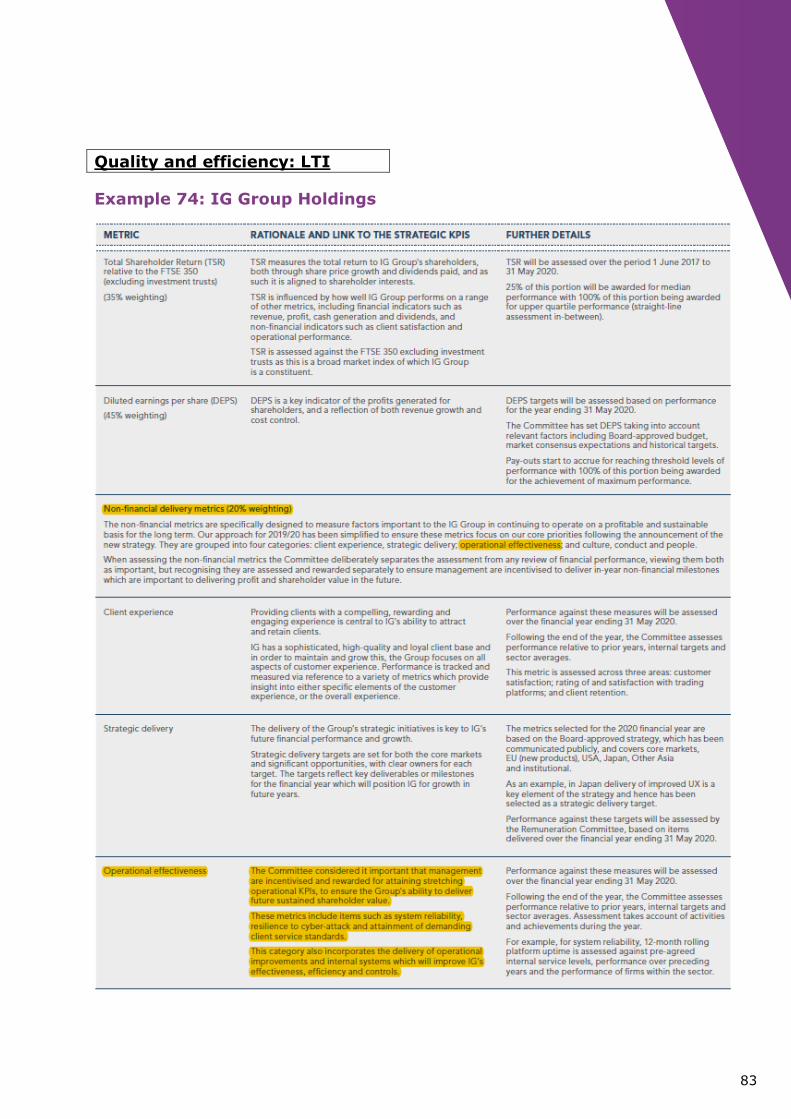
▪ Operational effectiveness – example 74 (LTI)
▪ On-time performance
▪ Inventory turnover
▪ Product quality
▪ Product and service delivery and improvement
▪ Synergies
Sustainability index
▪ Sustainability scorecard/impact – example 75 (STI)
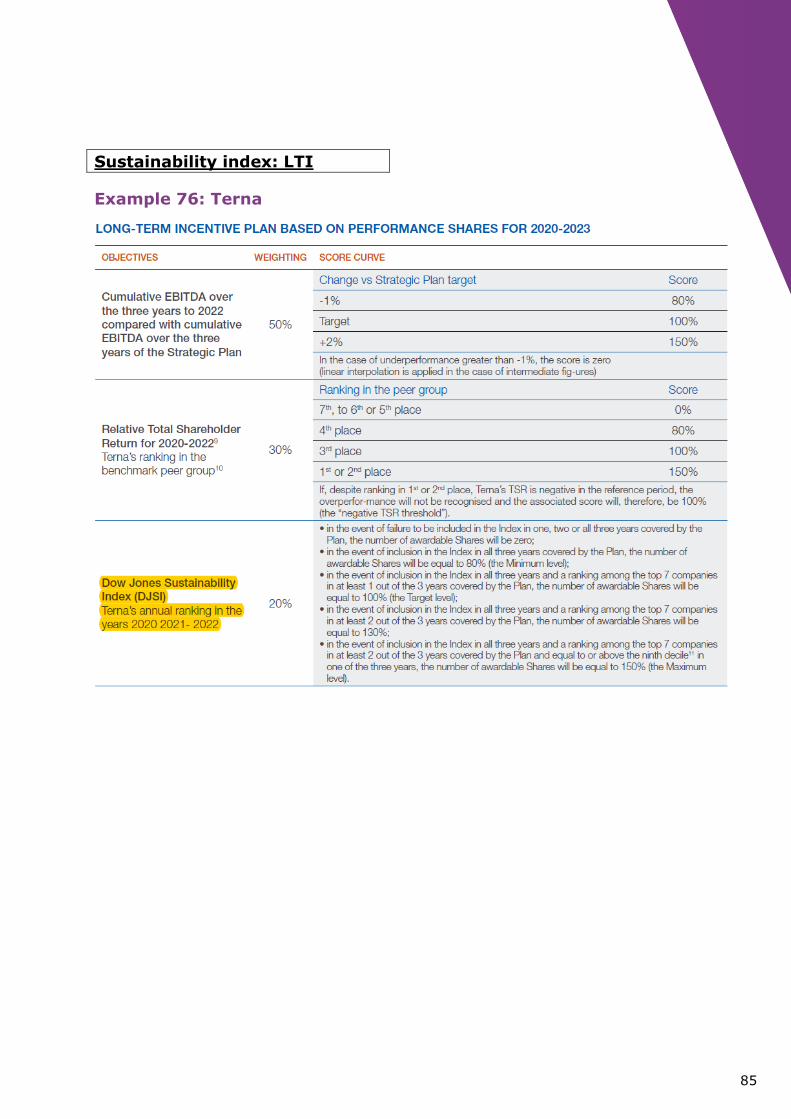
▪ Dow Jones Sustainability Index – example 76 (LTI)
20
Environment
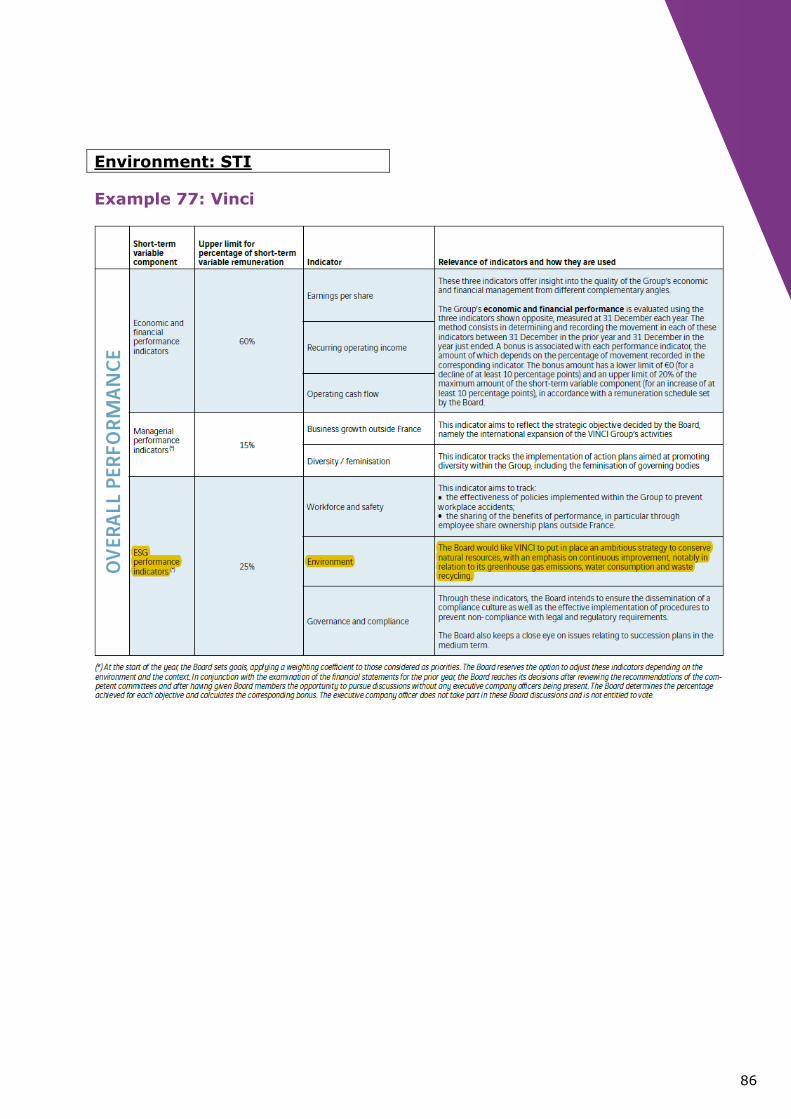
▪ Ambitious environmental strategy – example 77 (STI)
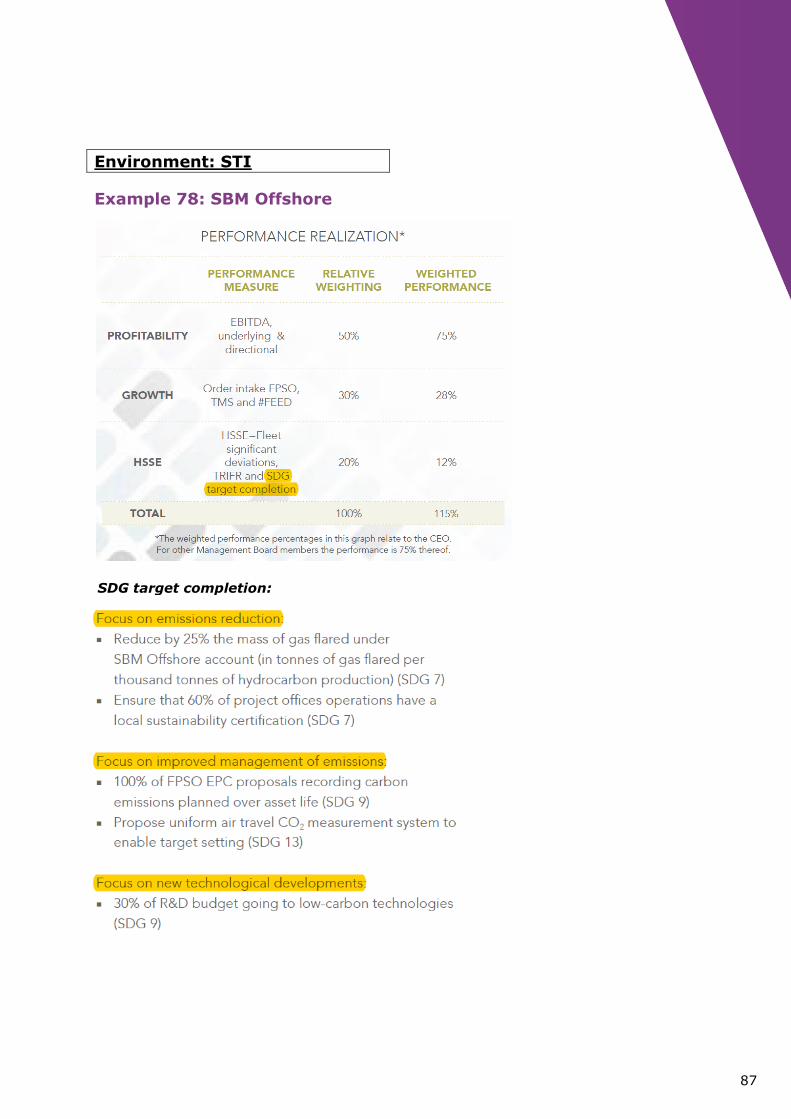
▪ Emissions – example 78 (STI)
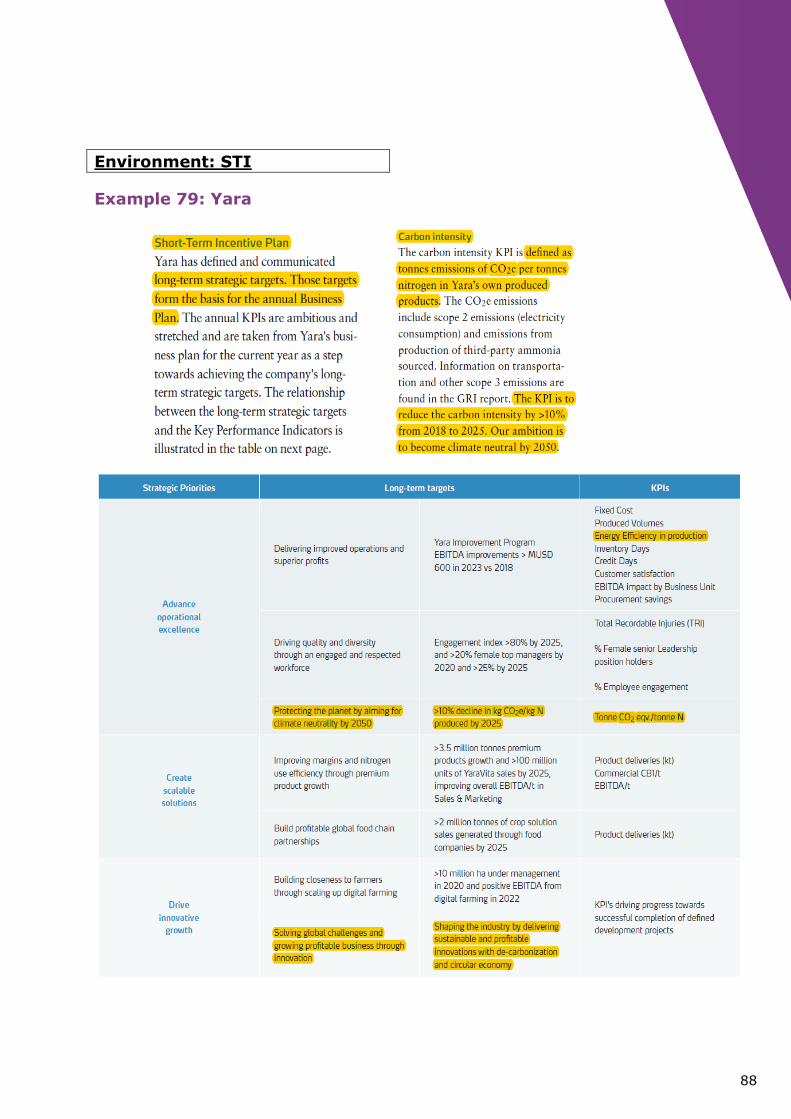
▪ Climate neutrality by 2050 – example 79 (STI)
▪ Energy efficiency in production – example 79 (STI)
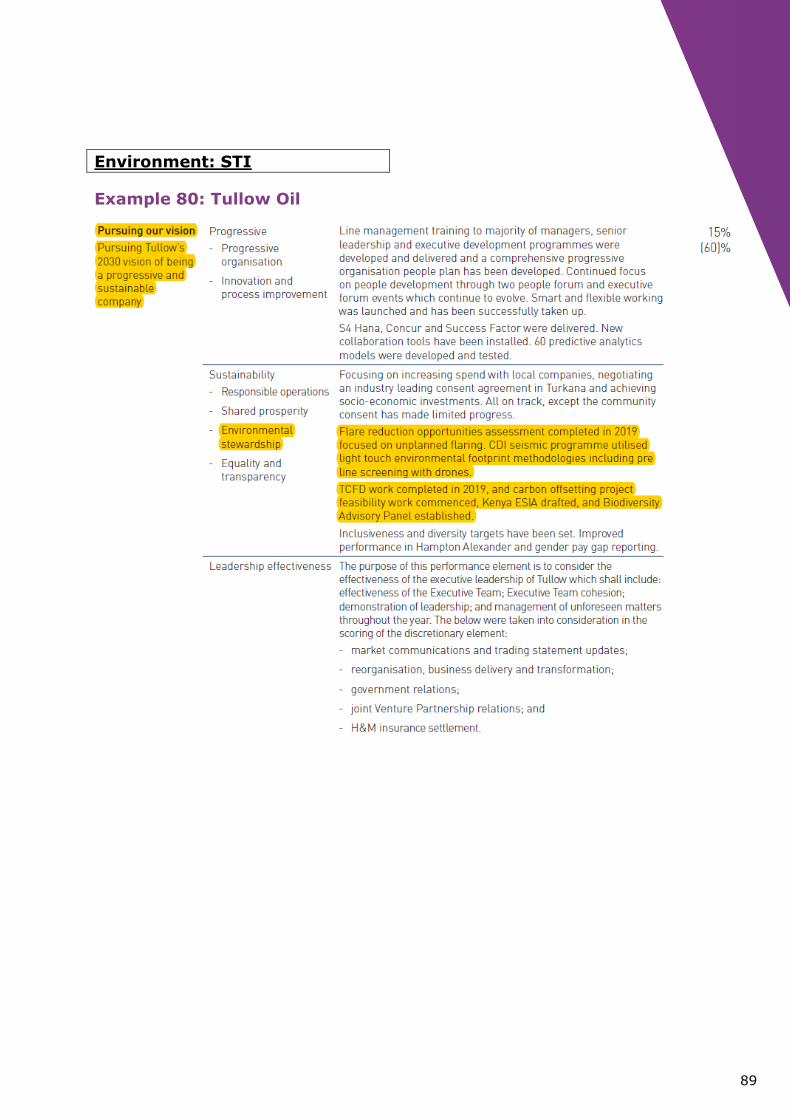
▪ Environmental stewardship – example 80 (STI)
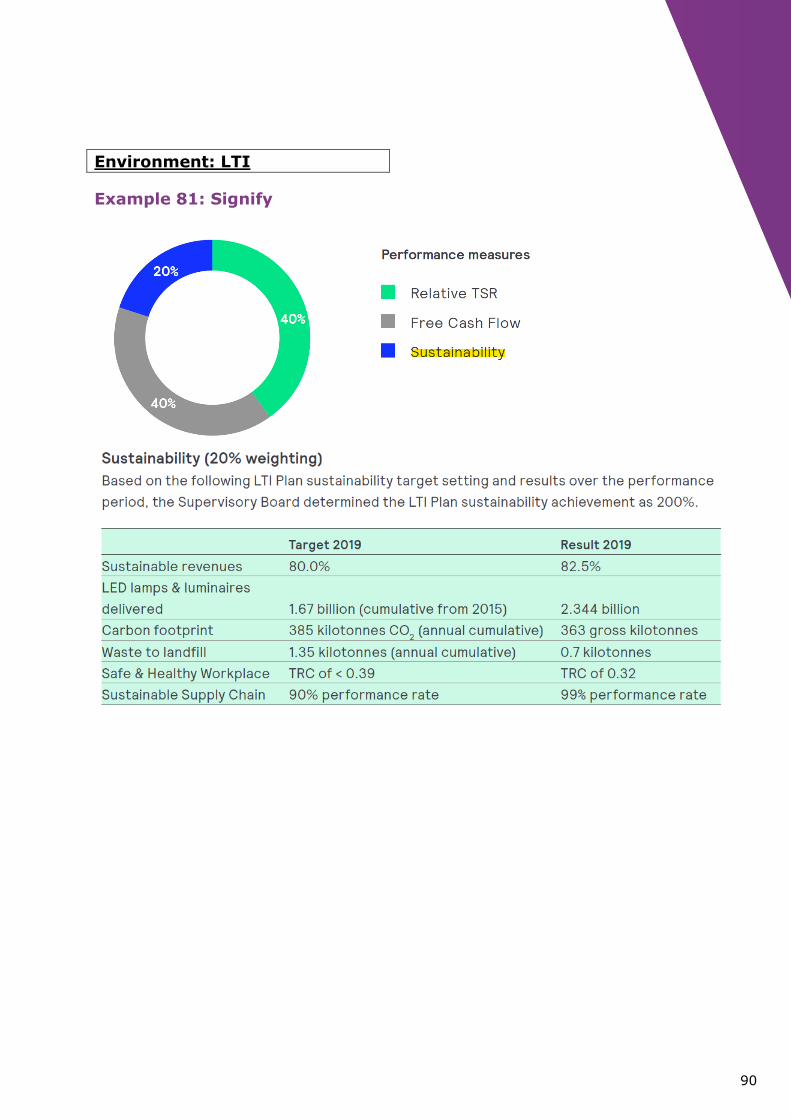
▪ Carbon/environmental footprint – example 81 (LTI)
▪ Renewable raw materials and energy funding
▪ Reduction in emissions per employee
▪ Renewable electricity as % of global consumption
▪ Undertaking a strategic review of the recycling businesses in light of
the Government’s waste strategy
▪ Promote and use the Environmental Profit & Loss account (EP&L)
▪ EcoVadis rating: obtaining gold level
▪ LEED/BREEAM certification
▪ Climate Change score received from Carbon Disclosure Project
(CDP) Worldwide
Customer
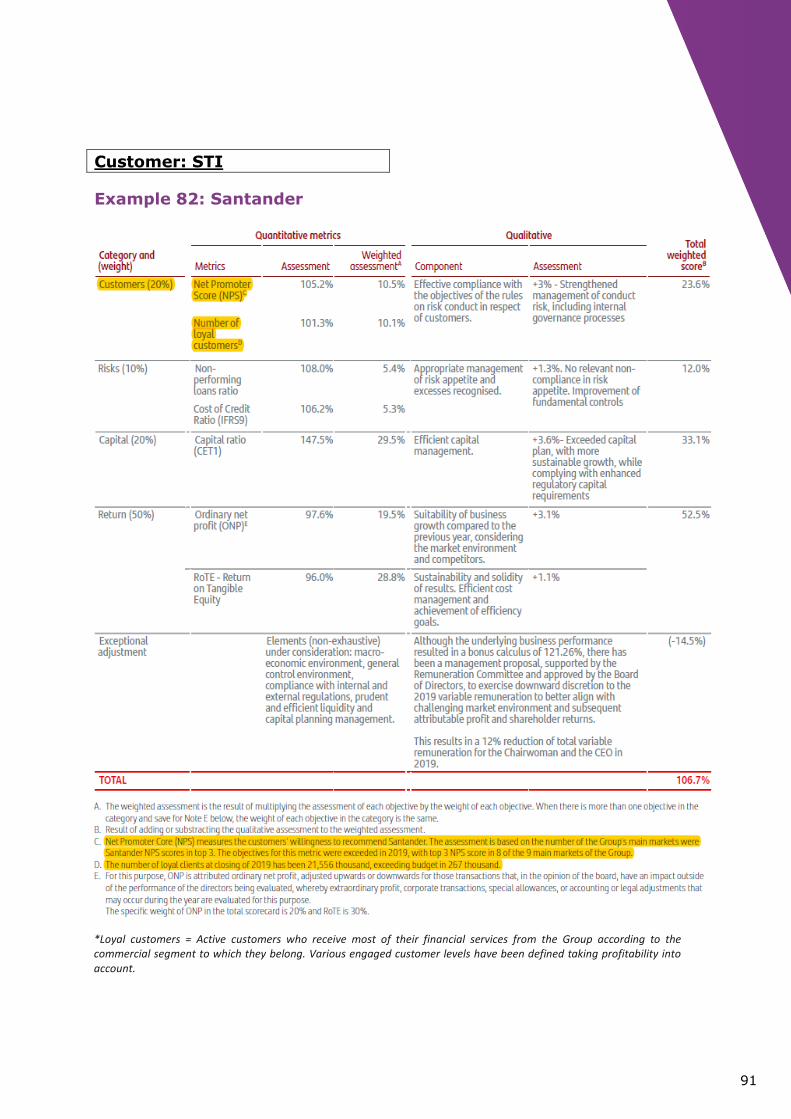
▪ Net promoter score – example 82 (STI)
▪ Number of loyal customers – example 82 (STI)
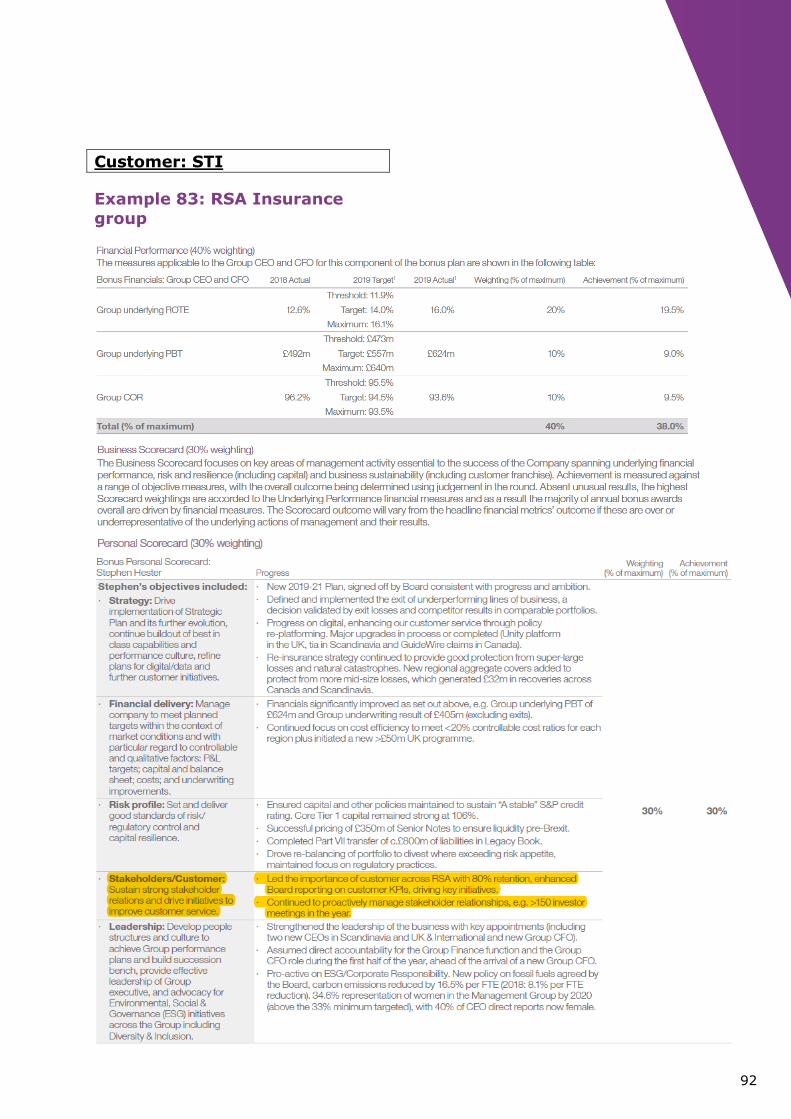
▪ Drive initiatives to improve customer service – example 83 (STI)
▪ Embedding a truly customer-centric culture – example 84 (STI)
▪ Improvements in performance for customers – example 85 (STI)
▪ Improving customer engagement – example 86 (STI)
▪ Total customer heartbeat – example 87 (STI)
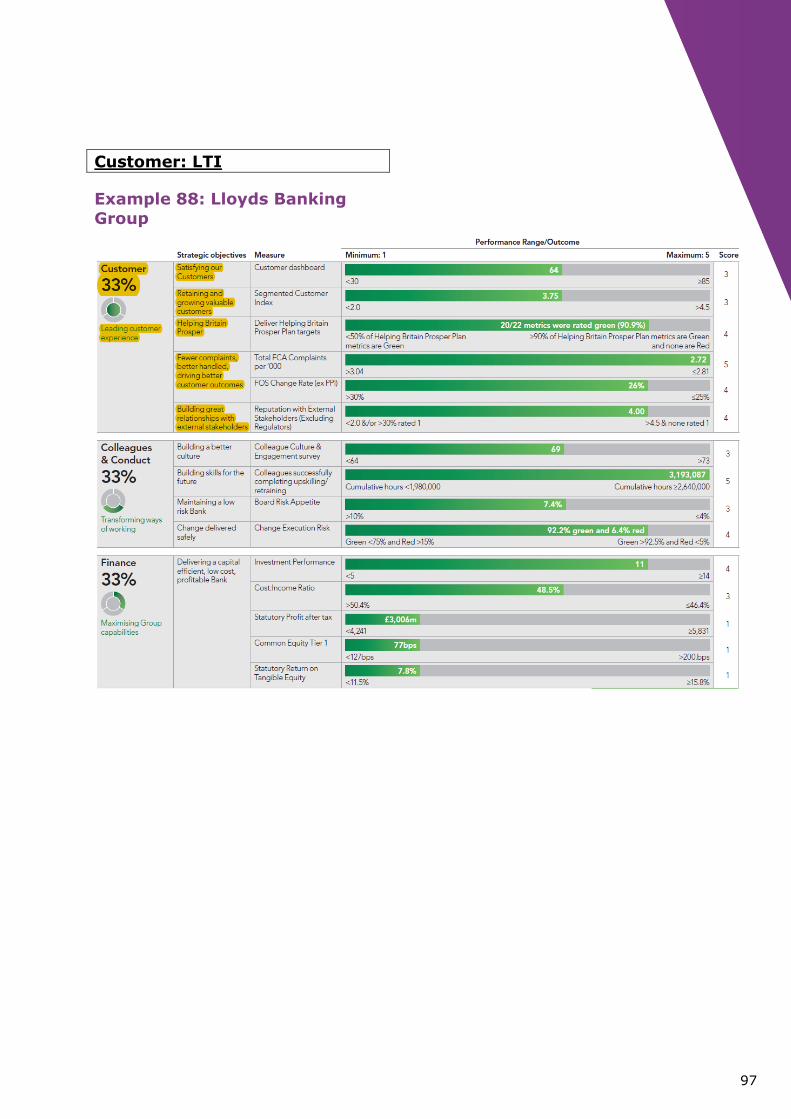
▪ Leading customer experience – example 88 (LTI)
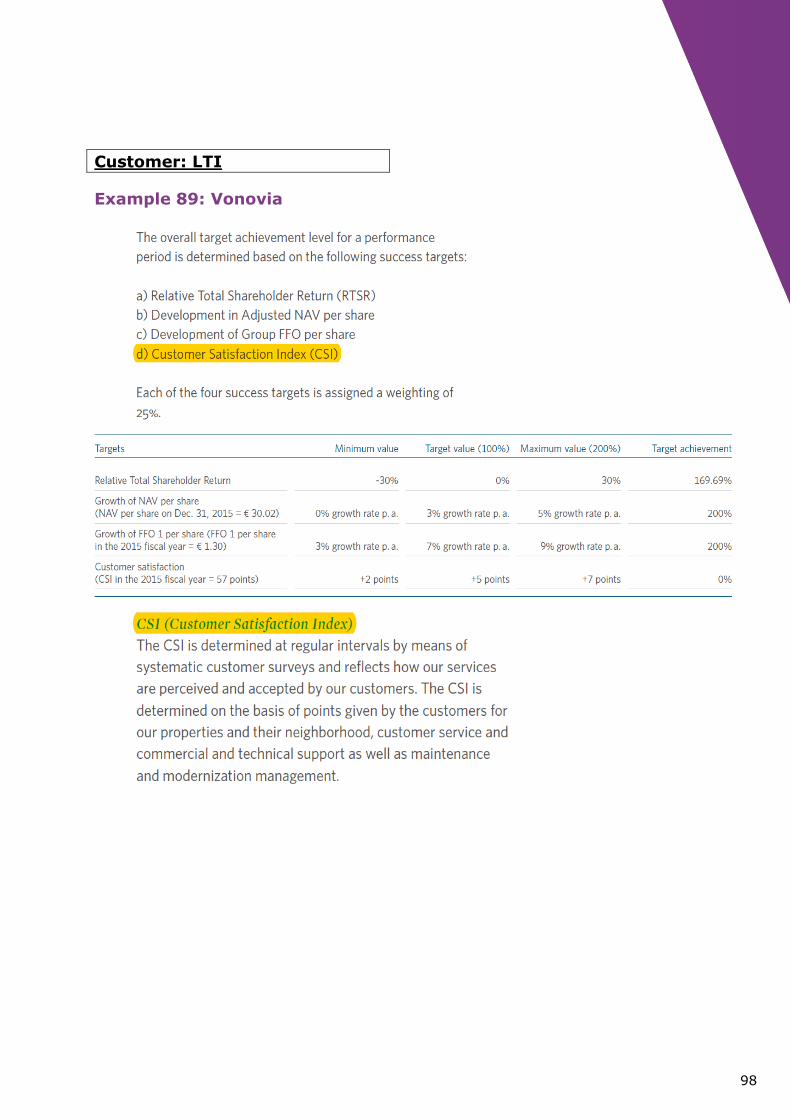
▪ Customer Satisfaction Index (CSI) – example 89 (LTI)
▪ Net new clients
▪ Customer churn rate
▪ Enhance Voice of Customer (VoC) (launch and roll-out of CRM
surveys)
21
Employee
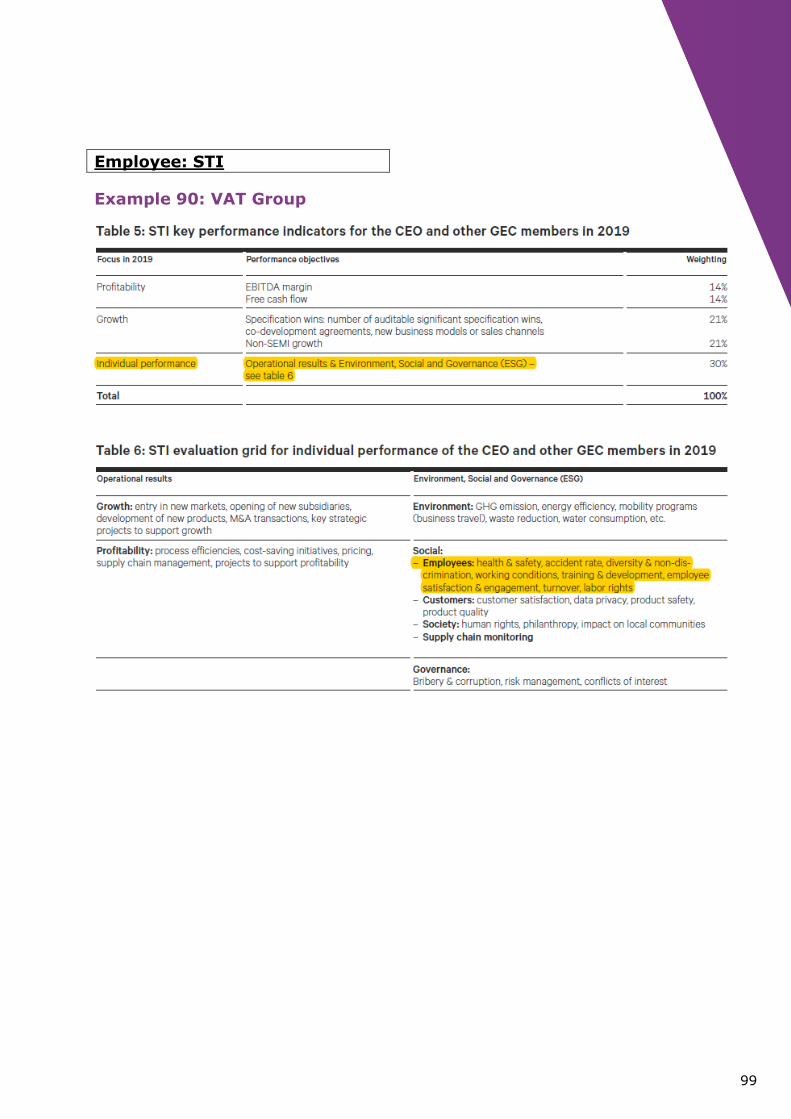
▪ Social – employee aspects – example 90 (STI)
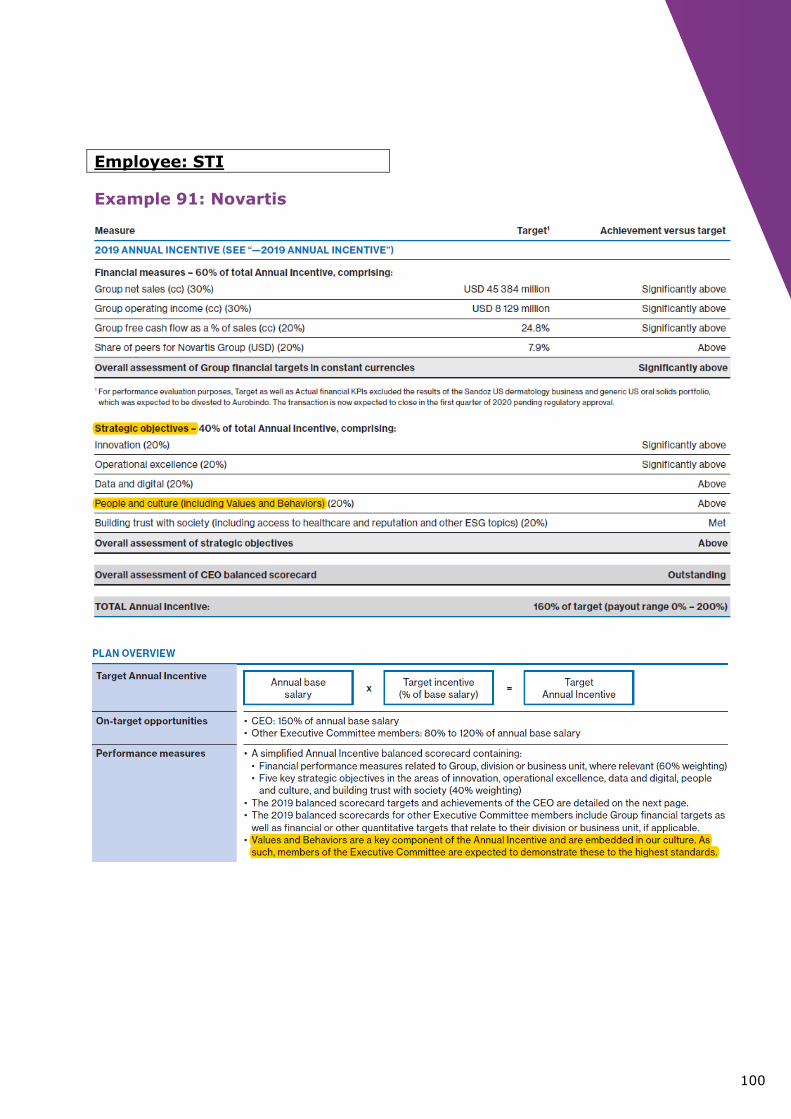
▪ People and culture – example 91 (STI)
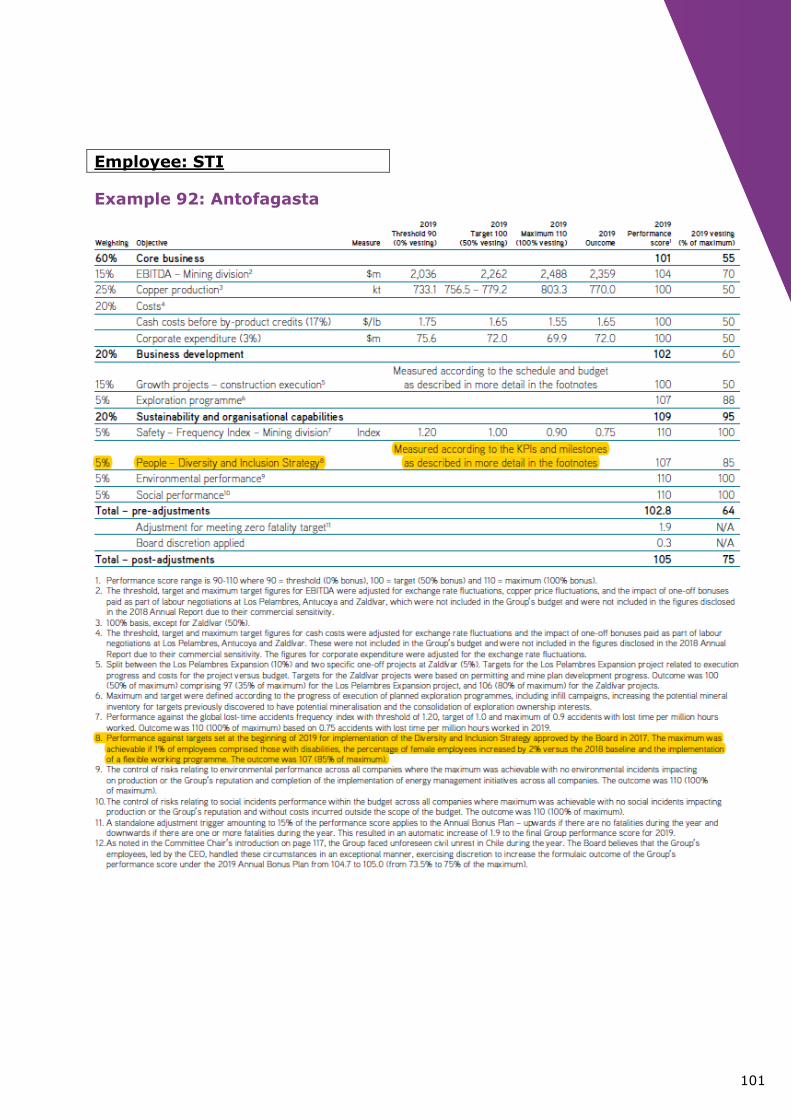
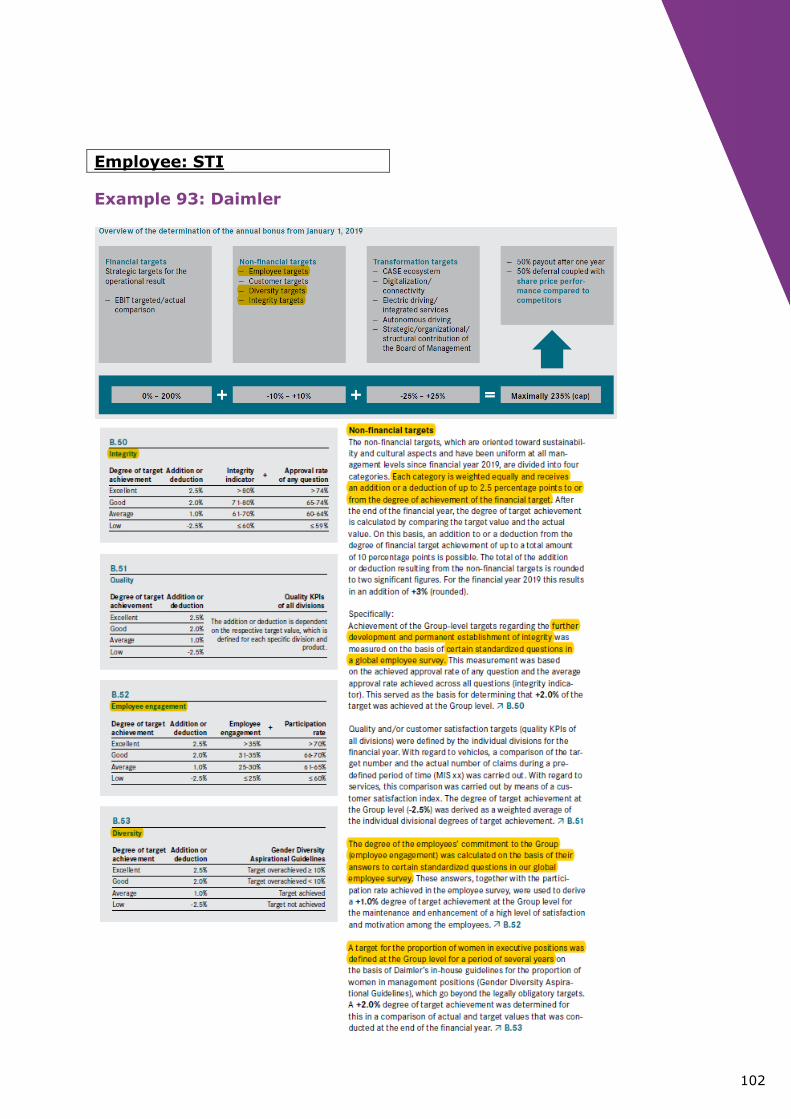
▪ Diversity, inclusion and gender balance – example 92 (STI),
example 93 (STI) & example 96 (LTI)
▪ Employee engagement – example 93 (STI)
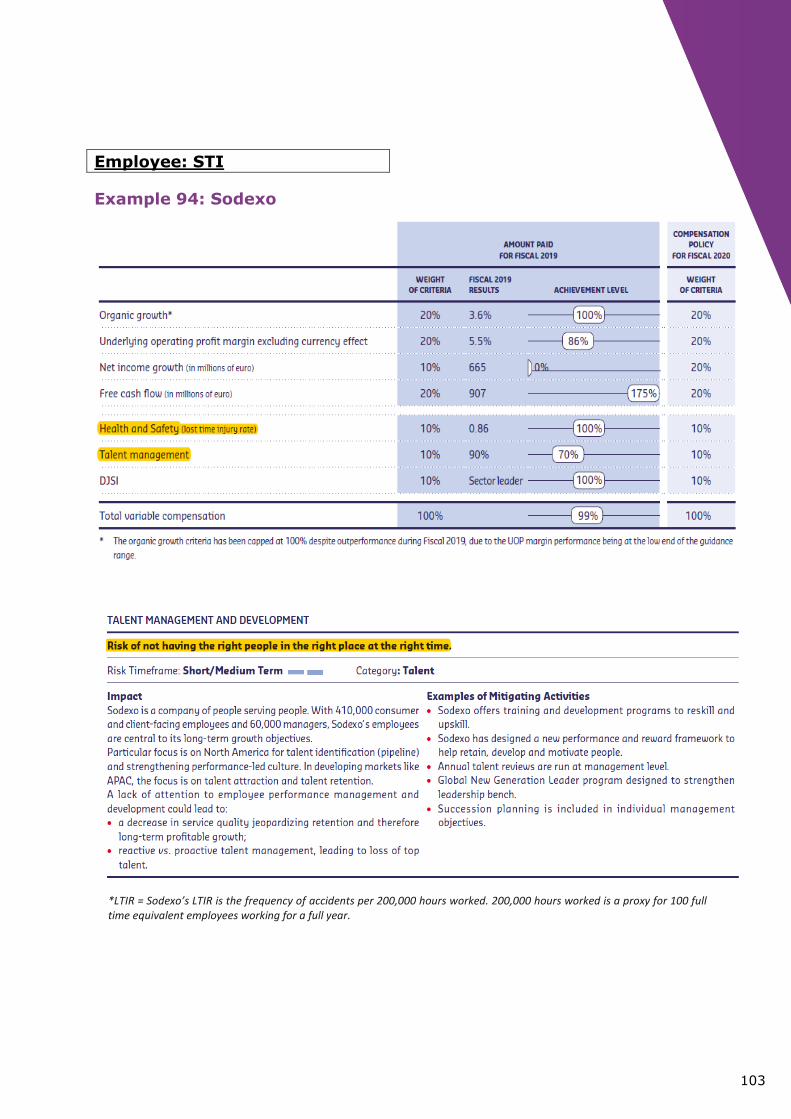
▪ Talent management/development – example 94 (STI)
▪ Lost Time Injury Rate (LTIR) – example 94 (STI)
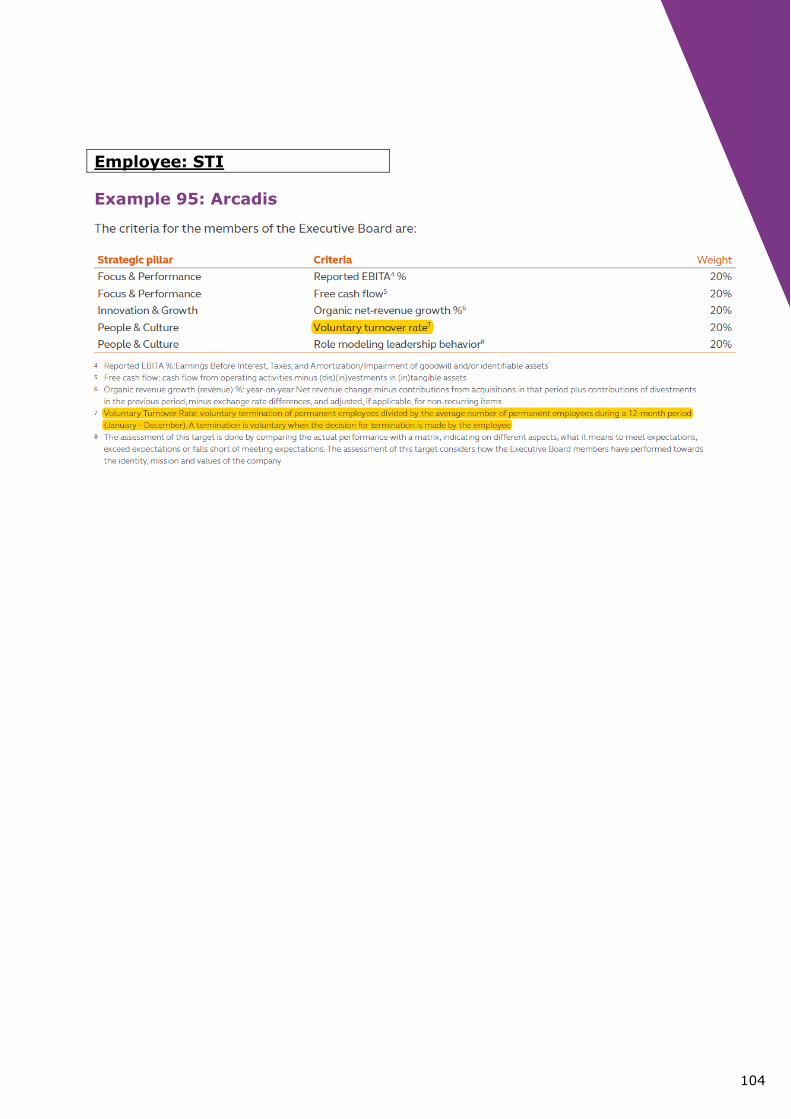
▪ Voluntary Turnover Rate – example 95 (STI)
▪ Employee promotor score – example 96 (LTI)
▪ Training hours per employee
▪ Absenteeism
▪ Total Recordable Case Frequency (TRCF)
▪ Accident Frequency Rate (AFR)
Top management team
▪ Succession planning and leadership development –
example 97 (STI)
▪ Leadership effectiveness – example 98 (STI)
▪ Organisational leadership – example 99 (STI)
▪ Roll-out of strategic leadership course – example 100 (STI)
▪ Cooperation with supervisory board – example 101 (STI)
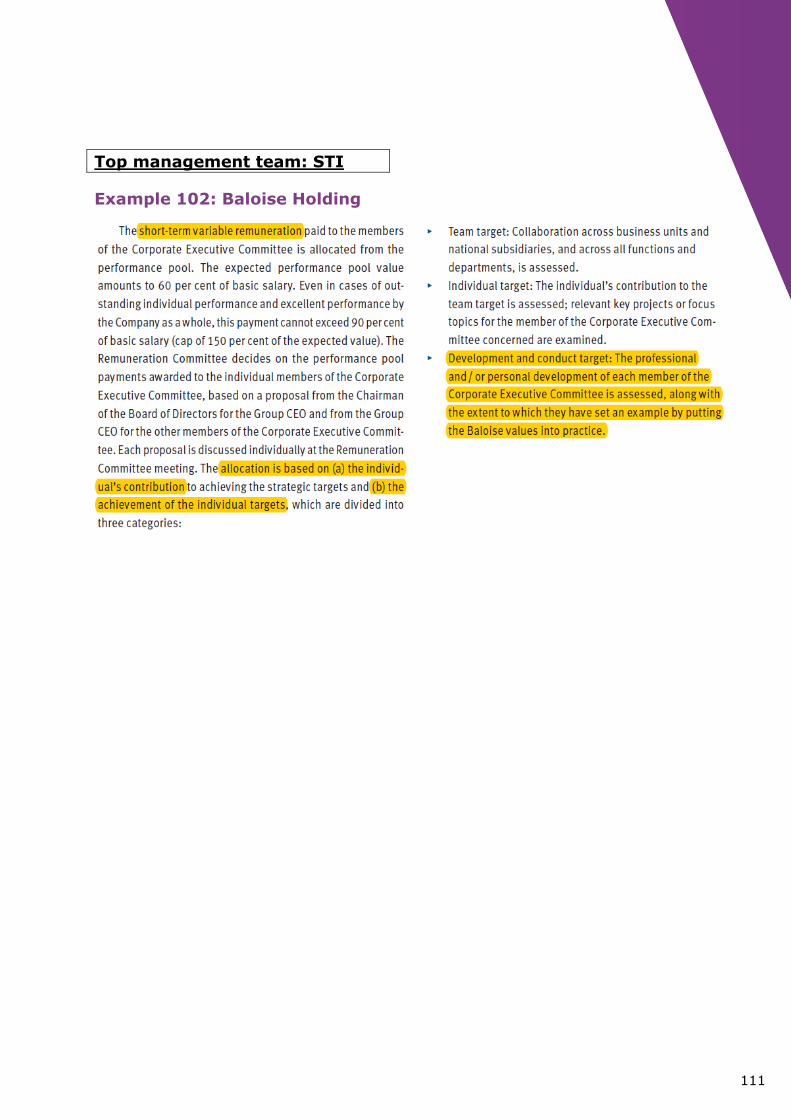
▪ Professional and personal development of each Corporate
Executive Committee's member – example 102 (STI)
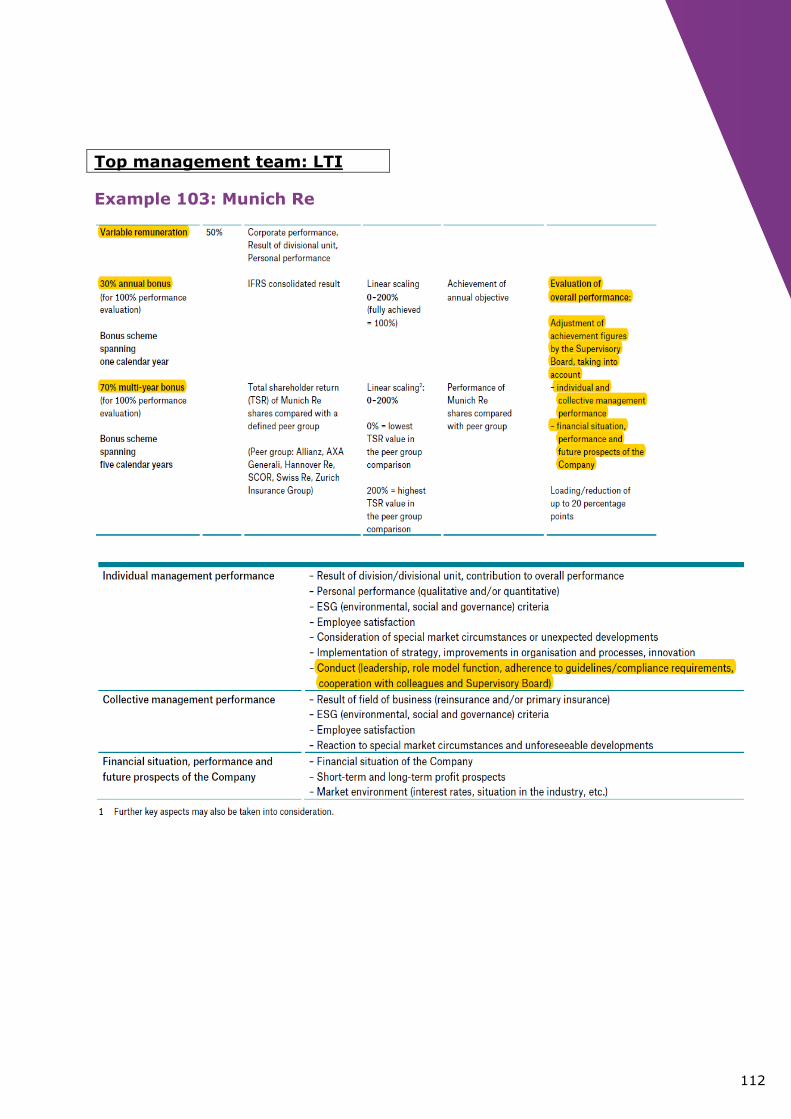
▪ Conduct – example 103 (LTI)
▪ Reporting and communication
▪ Board effectiveness in discussion and decision making
▪ Teamwork and team leadership effectiveness
▪ Clear management structure
▪ Building a trustful relation with the Board and its Committees
▪ Smooth running of the new Executive Committee
22
e
Supplier
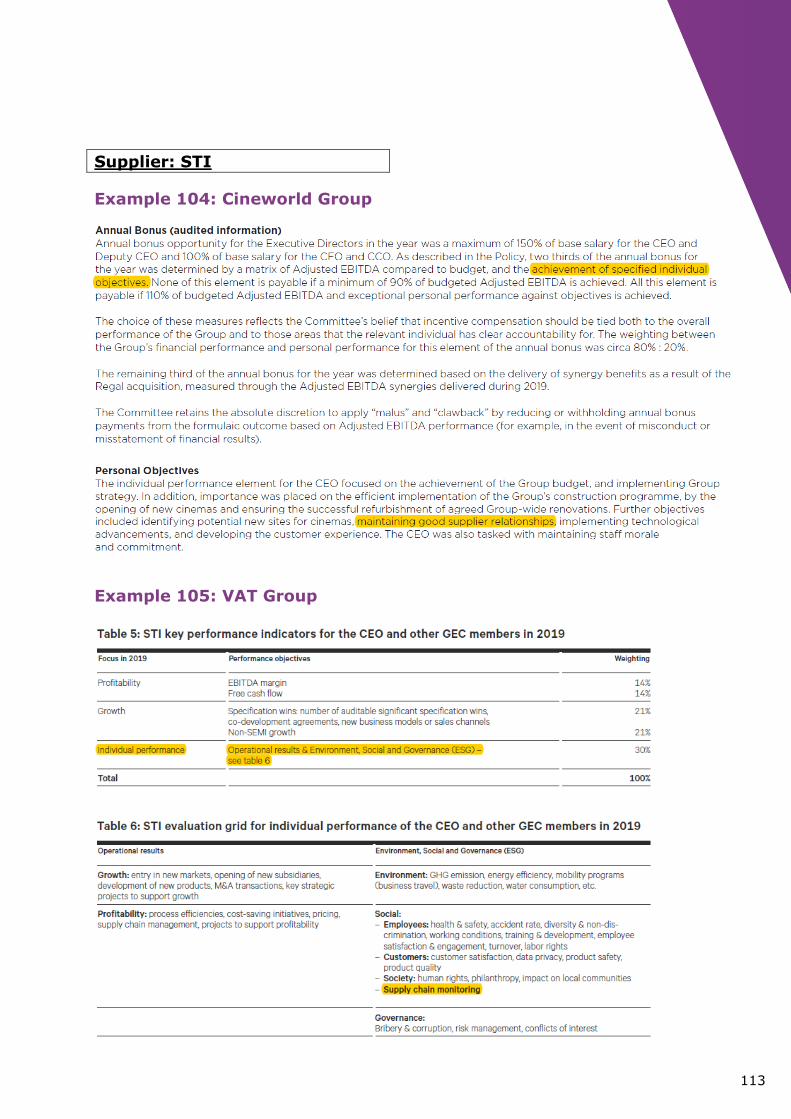
▪ Maintaining good supplier relationships – example 104 (STI)
▪ Supply chain monitoring – example 105 (STI)
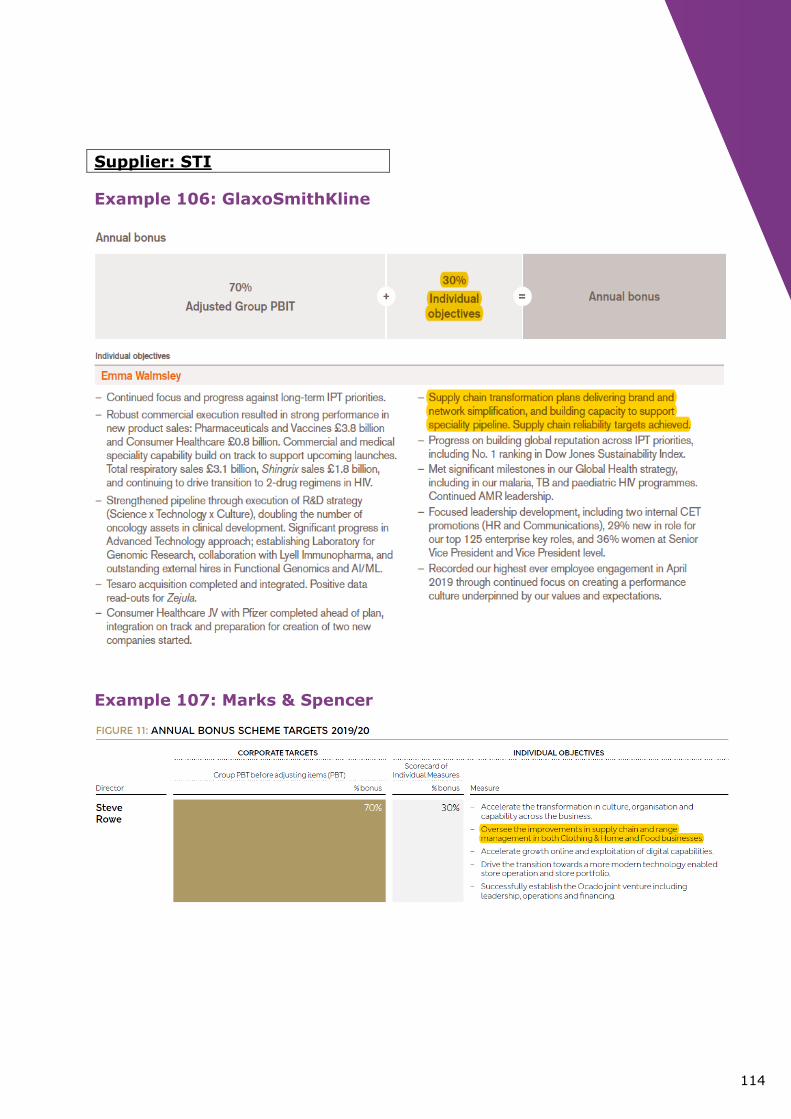
▪ Supply chain transformation plans – example 106 (STI)
▪ Supply chain improvement – example 107 (STI)
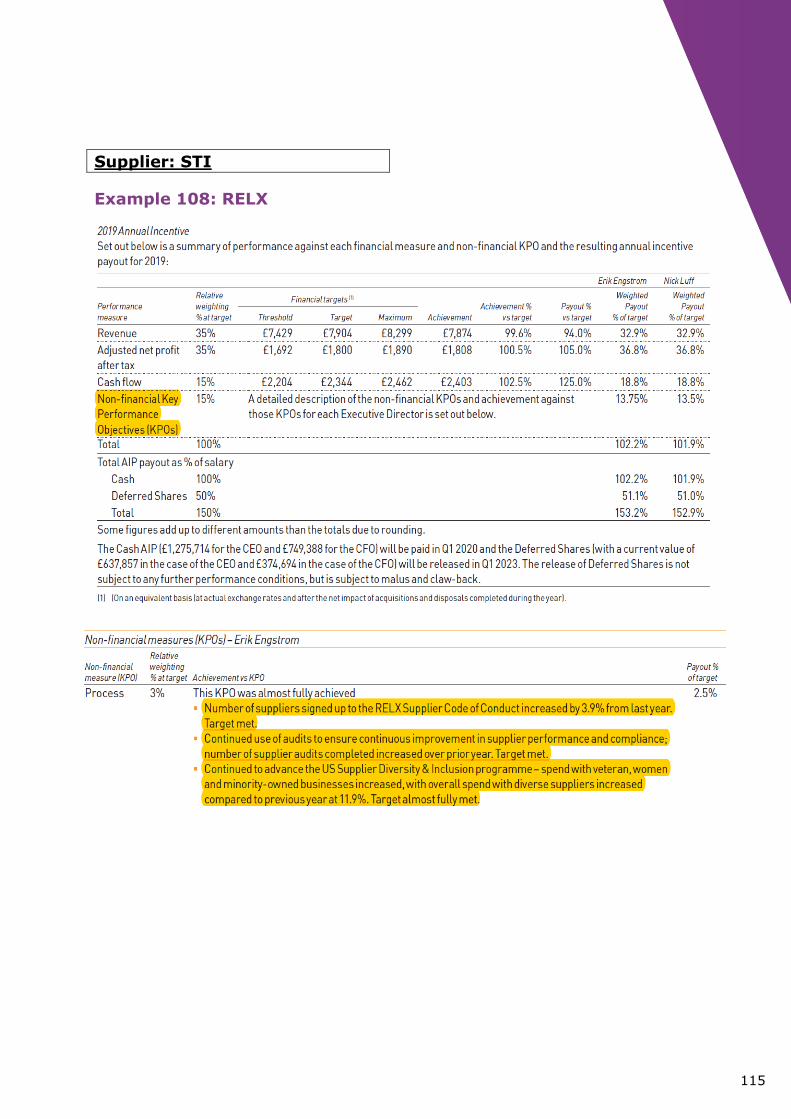
▪ Supplier code of conduct – example 108 (STI)
▪ Audits to ensure supplier performance and compliance – example
108 (STI)
▪ Supplier diversity and inclusion program – example 108 (STI)
23
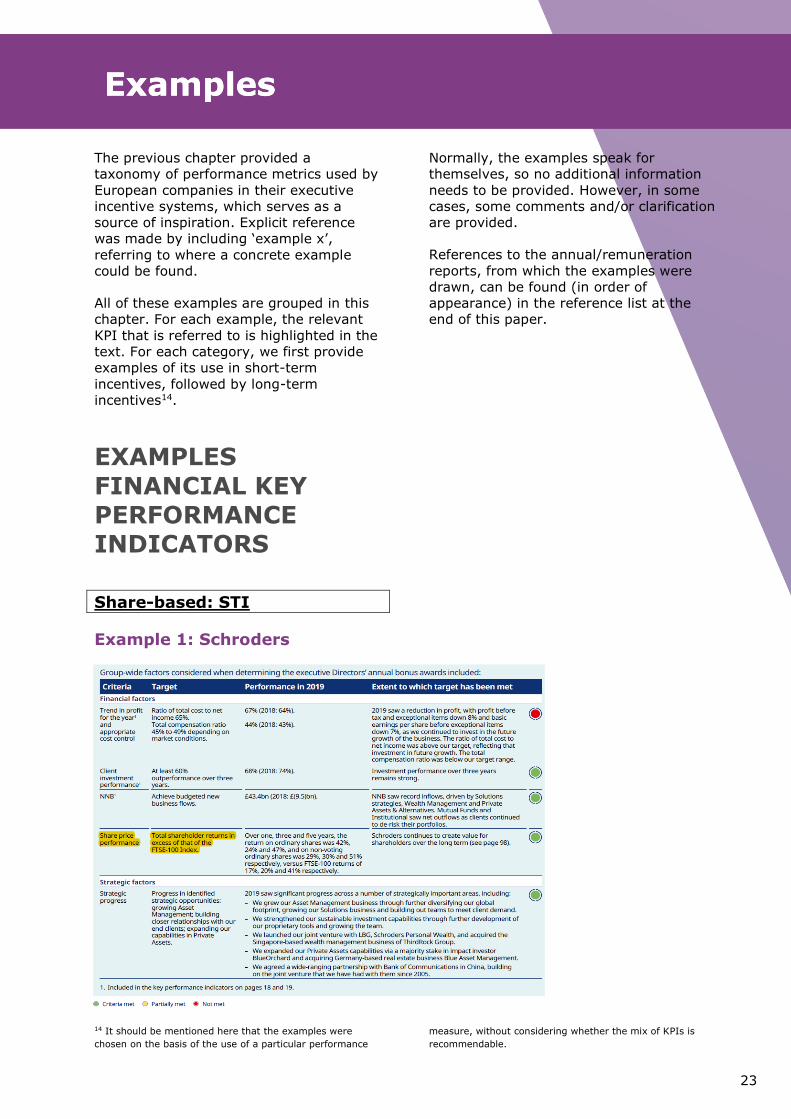
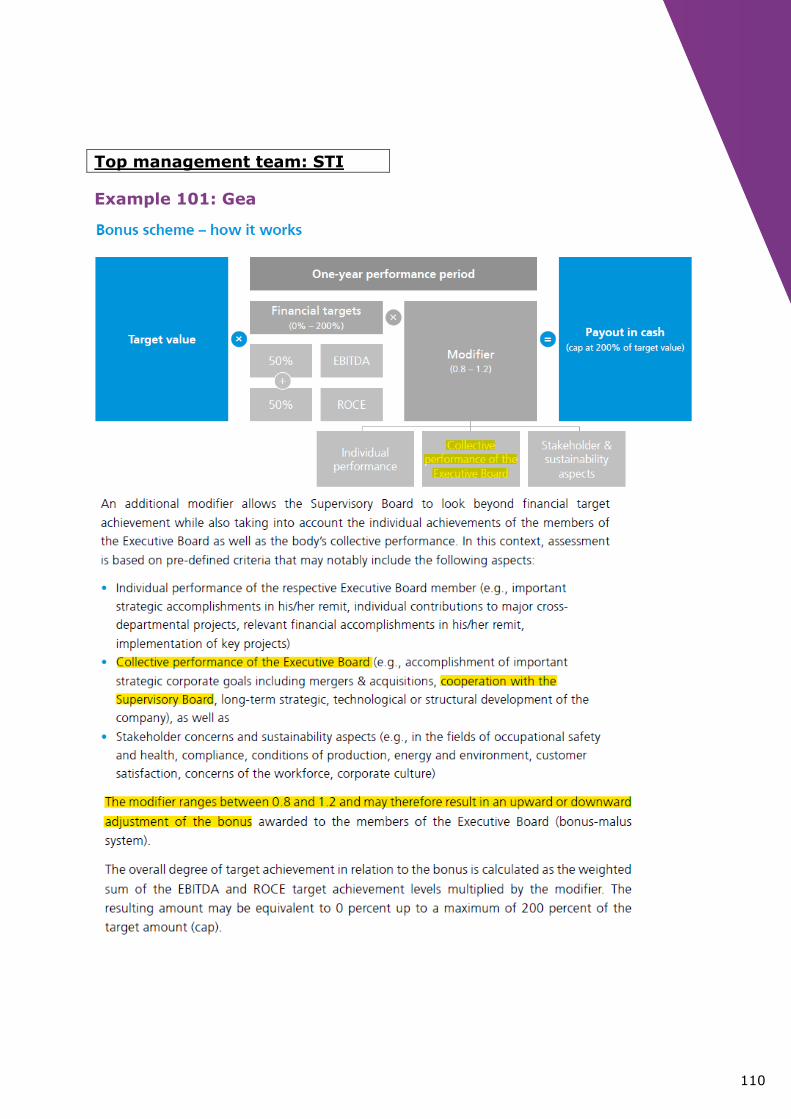
The previous chapter provided a
taxonomy of performance metrics used by
European companies in their executive
incentive systems, which serves as a
source of inspiration. Explicit reference
was made by including ‘example x’,
referring to where a concrete example
could be found.
All of these examples are grouped in this
chapter. For each example, the relevant
KPI that is referred to is highlighted in the
text. For each category, we first provide
examples of its use in short-term
incentives, followed by long-term
incentives14.
EXAMPLES
FINANCIAL KEY PERFORMANCE INDICATORS
Share-based: STI
Example 1: Schroders
14 It should be mentioned here that the examples were
chosen on the basis of the use of a particular performance
Normally, the examples speak for
themselves, so no additional information
needs to be provided. However, in some
cases, some comments and/or clarification
are provided.
References to the annual/remuneration
reports, from which the examples were
drawn, can be found (in order of
appearance) in the reference list at the
end of this paper.
measure, without considering whether the mix of KPIs is
recommendable.
Examples Examples
24
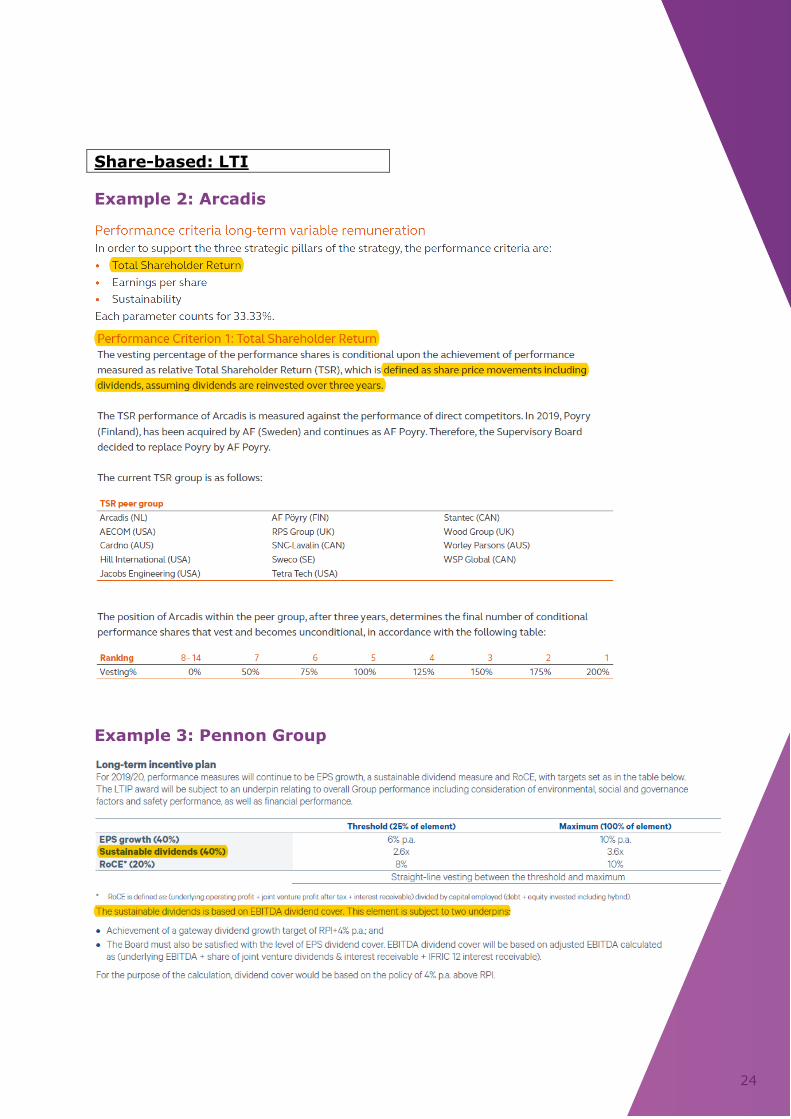
Share-based: LTI
Example 2: Arcadis
Example 3: Pennon Group

25
Sales: STI
Example 4: Legrand
Quantitative Qualitative
26
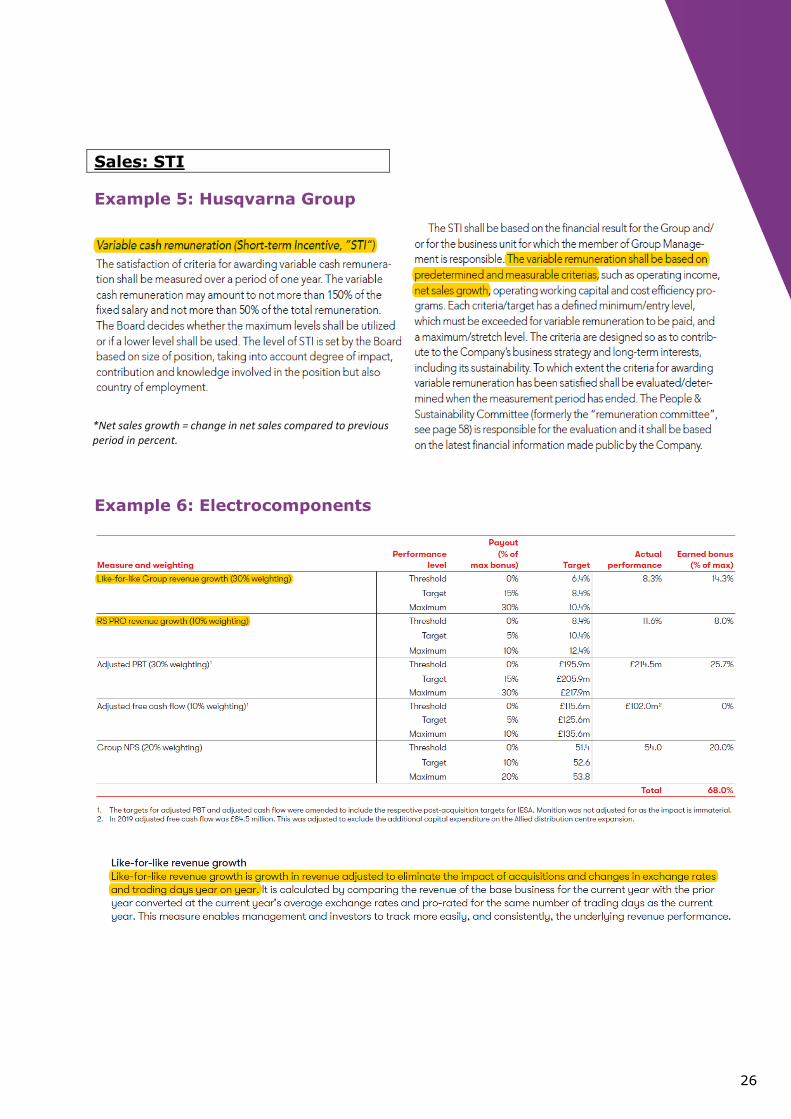
Sales: STI
Example 5: Husqvarna Group
Example 6: Electrocomponents
*Net sales growth = change in net sales compared to previous period in percent.

27
Sales: STI
Example 7: Sika
28
Sales: LTI
Example 8: KION Group

29
Gross profit: STI
Example 9: Sunrise
30
Gross profit: LTI
Example 10: Kindred Group
Example 11: John Wood Group
31
EBITDA: STI
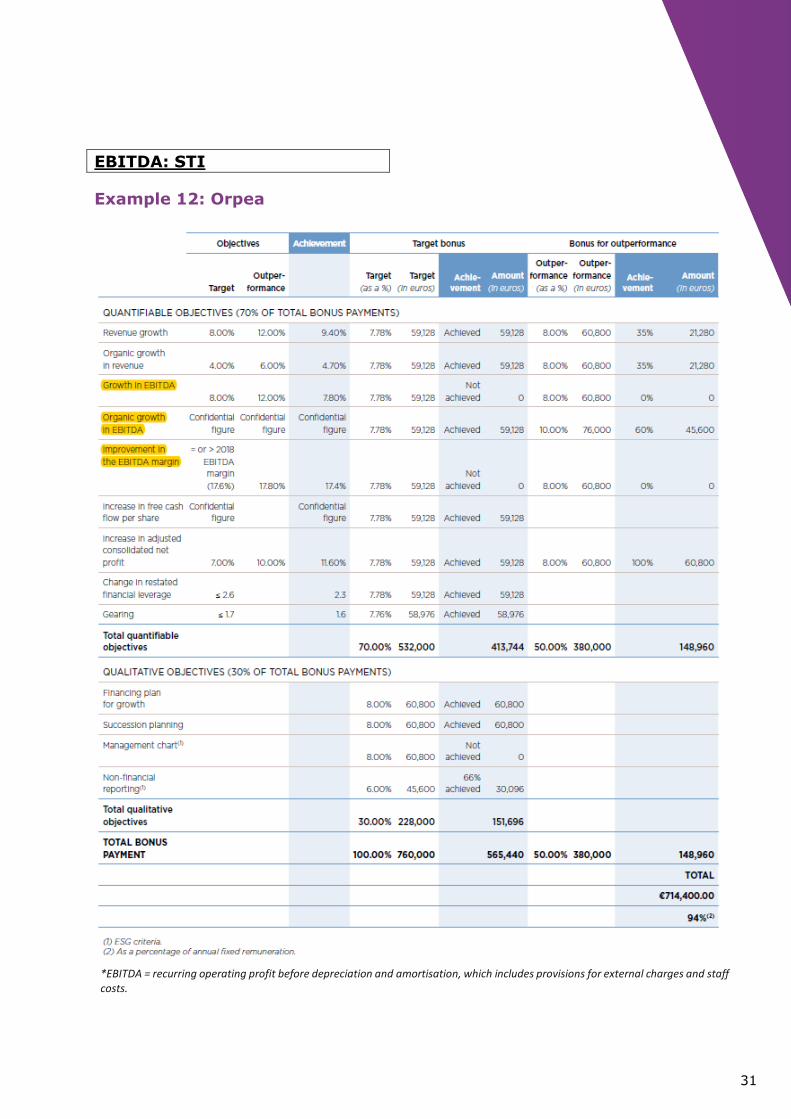
Example 12: Orpea
*EBITDA = recurring operating profit before depreciation and amortisation, which includes provisions for external charges and staff costs.
32
EBITDA: STI
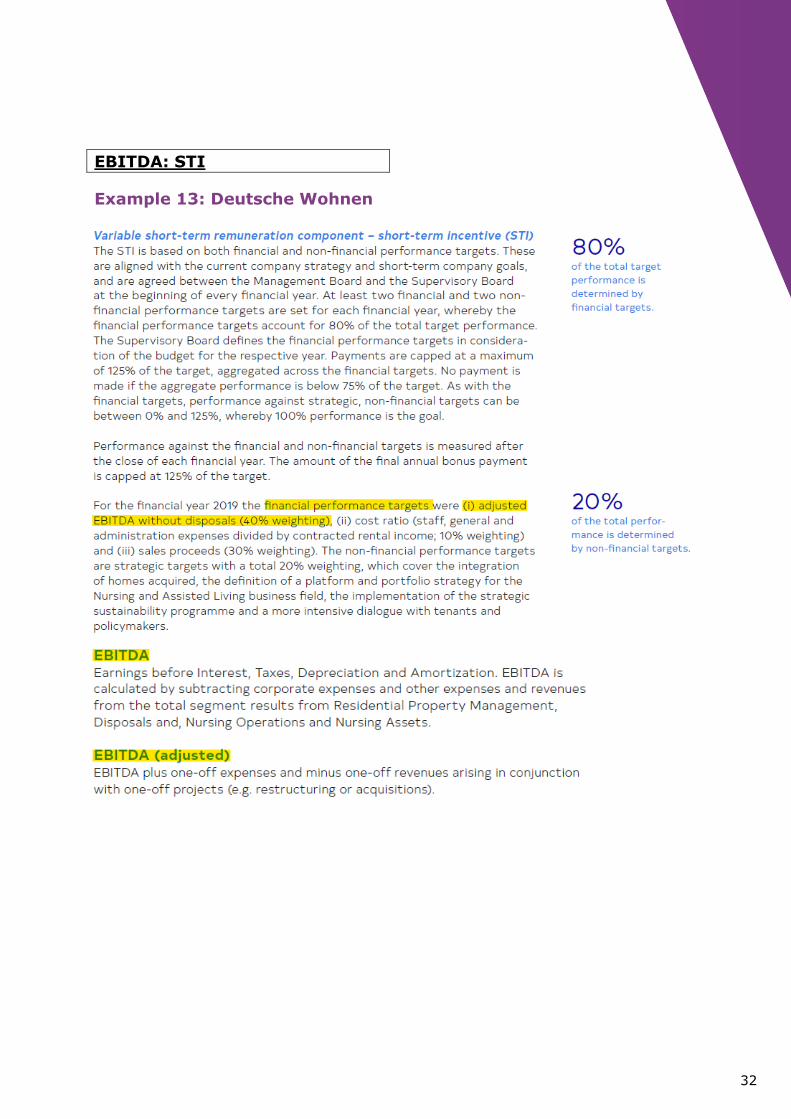
Example 13: Deutsche Wohnen

33
EBITDA: STI
Example 14: Mondi
*Underlying EBITDA = operating profit before special items, depreciation, amortisation and impairments not recorded as special items. Underlying EBITDA provides a measure of the cash generating ability of the business that is comparable from year to year.
34
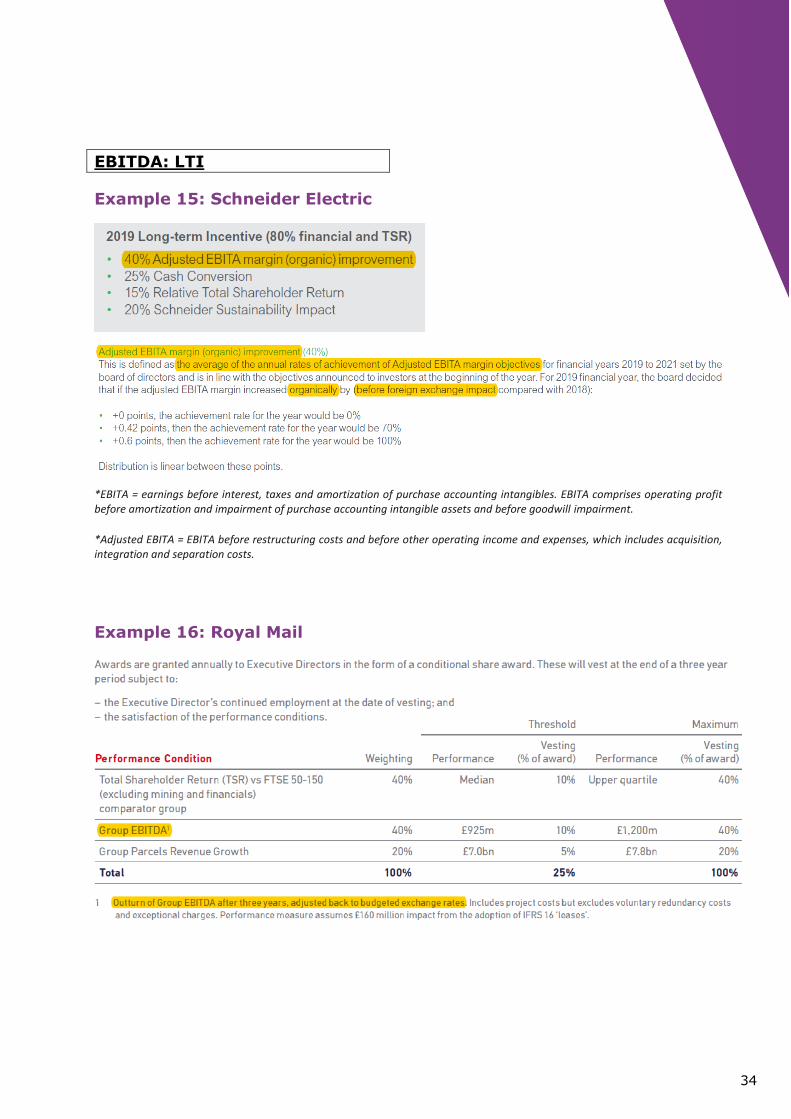
EBITDA: LTI
Example 15: Schneider Electric
Example 16: Royal Mail
*EBITA = earnings before interest, taxes and amortization of purchase accounting intangibles. EBITA comprises operating profit before amortization and impairment of purchase accounting intangible assets and before goodwill impairment.
*Adjusted EBITA = EBITA before restructuring costs and before other operating income and expenses, which includes acquisition, integration and separation costs.
35
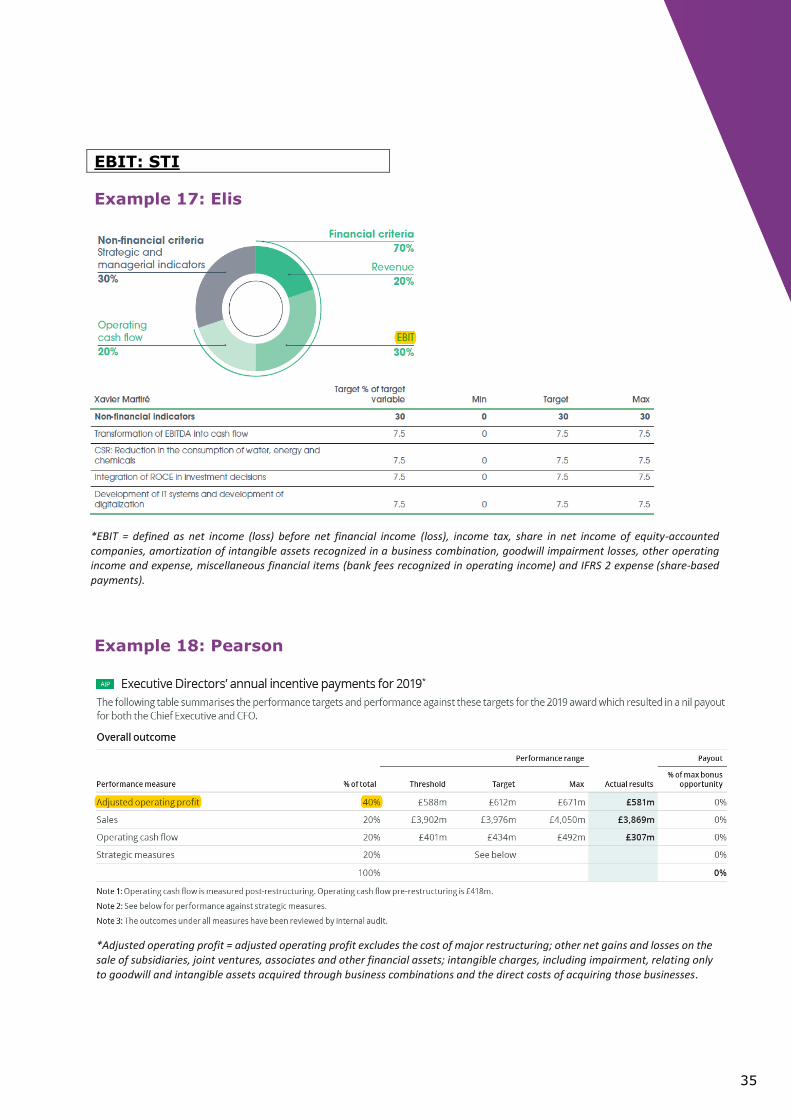
EBIT: STI
Example 17: Elis
Example 18: Pearson
*EBIT = defined as net income (loss) before net financial income (loss), income tax, share in net income of equity-accounted companies, amortization of intangible assets recognized in a business combination, goodwill impairment losses, other operating income and expense, miscellaneous financial items (bank fees recognized in operating income) and IFRS 2 expense (share-based payments).
*Adjusted operating profit = adjusted operating profit excludes the cost of major restructuring; other net gains and losses on the sale of subsidiaries, joint ventures, associates and other financial assets; intangible charges, including impairment, relating only to goodwill and intangible assets acquired through business combinations and the direct costs of acquiring those businesses.
36
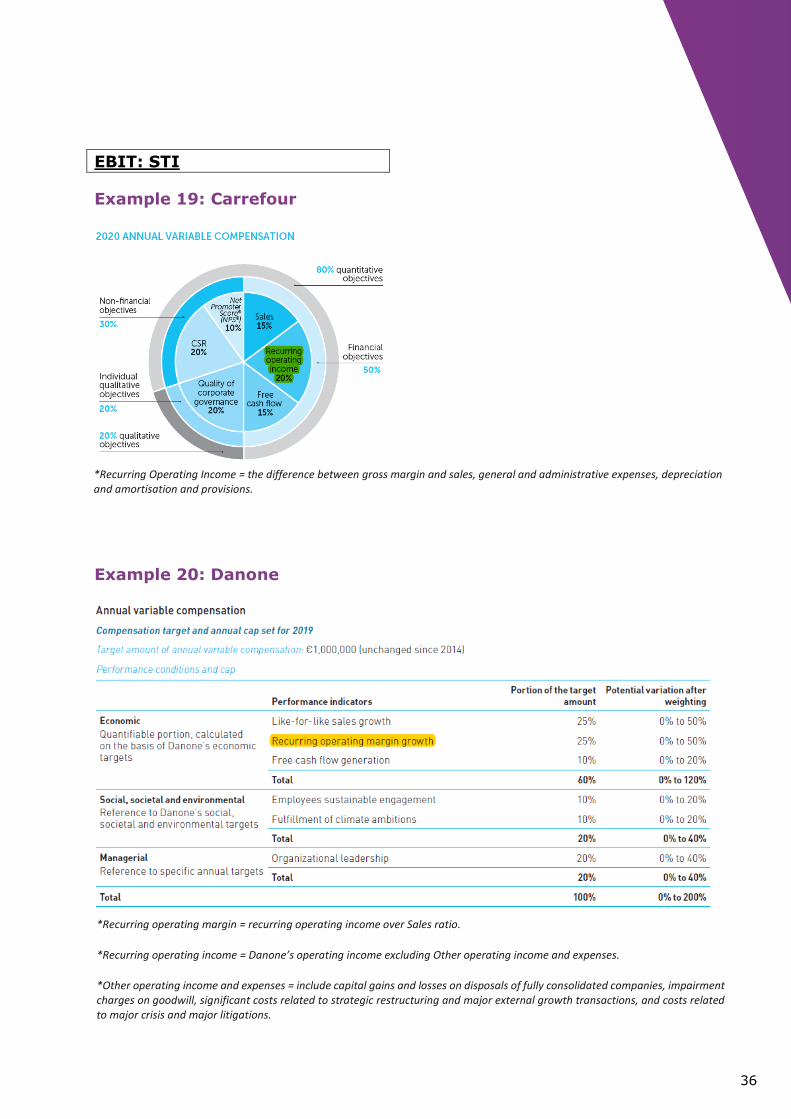
EBIT: STI
Example 19: Carrefour
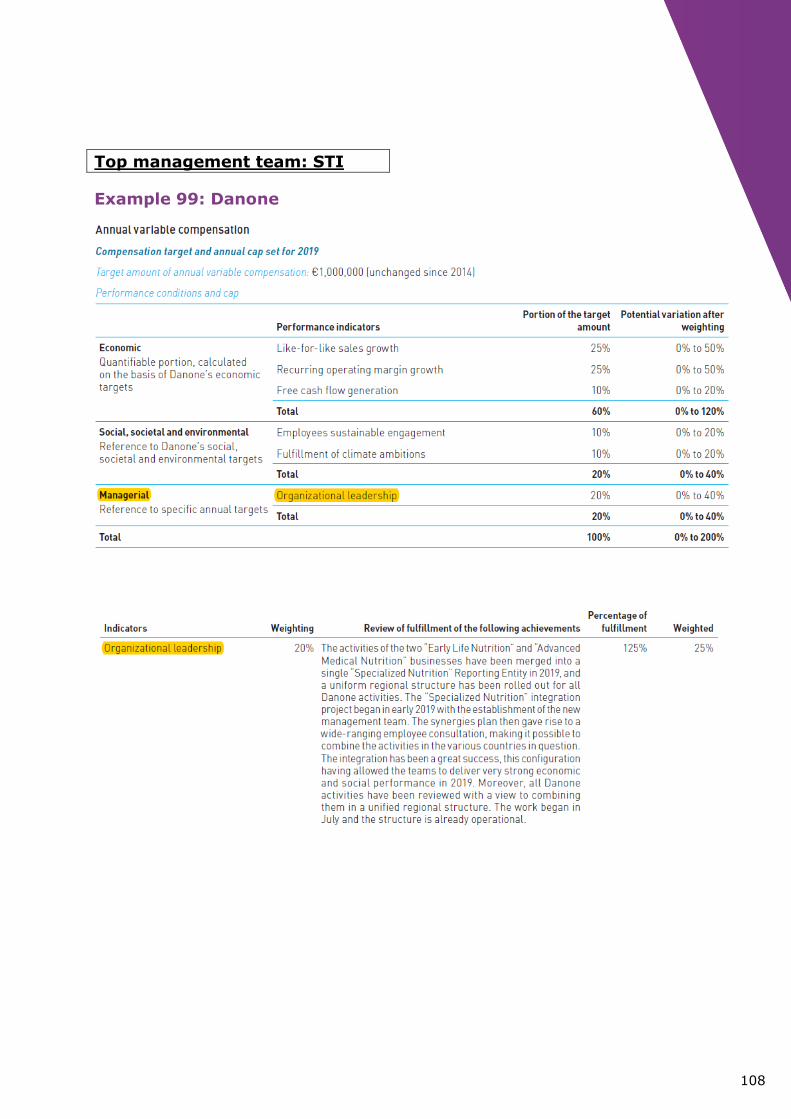
Example 20: Danone
*Recurring Operating Income = the difference between gross margin and sales, general and administrative expenses, depreciation and amortisation and provisions.
*Recurring operating margin = recurring operating income over Sales ratio.
*Recurring operating income = Danone’s operating income excluding Other operating income and expenses.
*Other operating income and expenses = include capital gains and losses on disposals of fully consolidated companies, impairment charges on goodwill, significant costs related to strategic restructuring and major external growth transactions, and costs related to major crisis and major litigations.
37
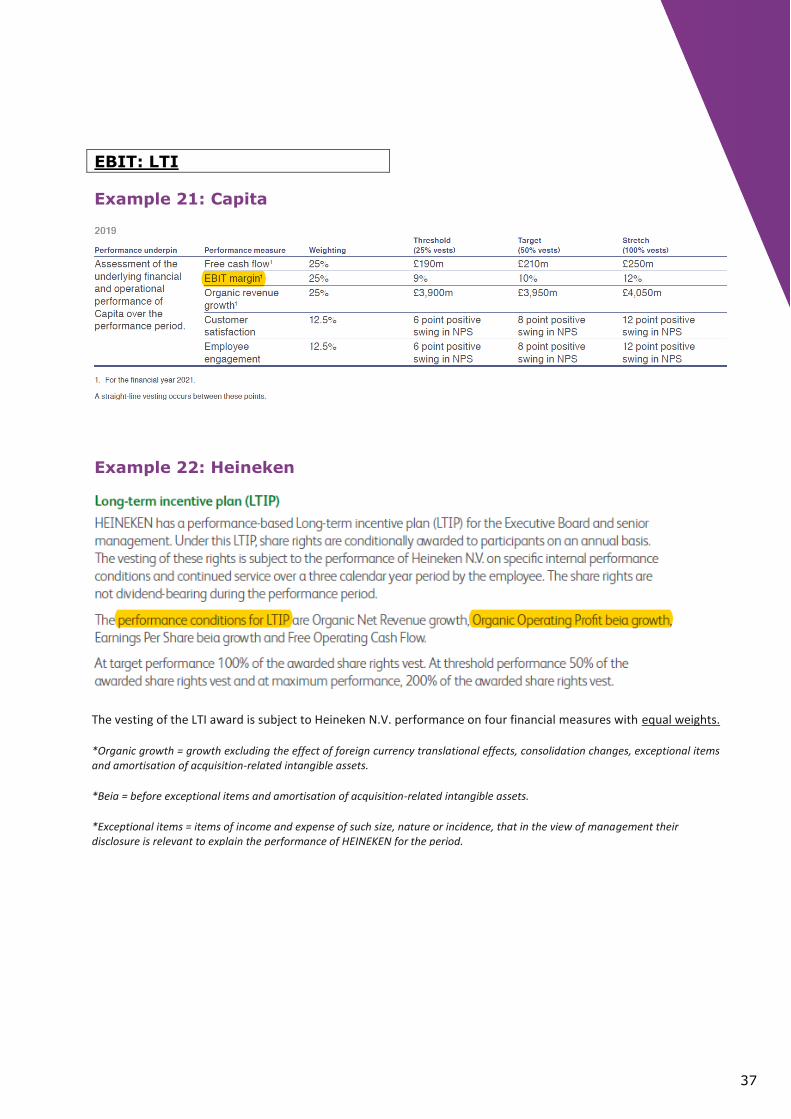
EBIT: LTI
Example 21: Capita
Example 22: Heineken
The vesting of the LTI award is subject to Heineken N.V. performance on four financial measures with equal weights.
*Organic growth = growth excluding the effect of foreign currency translational effects, consolidation changes, exceptional items and amortisation of acquisition-related intangible assets.
*Beia = before exceptional items and amortisation of acquisition-related intangible assets.
*Exceptional items = items of income and expense of such size, nature or incidence, that in the view of management their disclosure is relevant to explain the performance of HEINEKEN for the period.
38
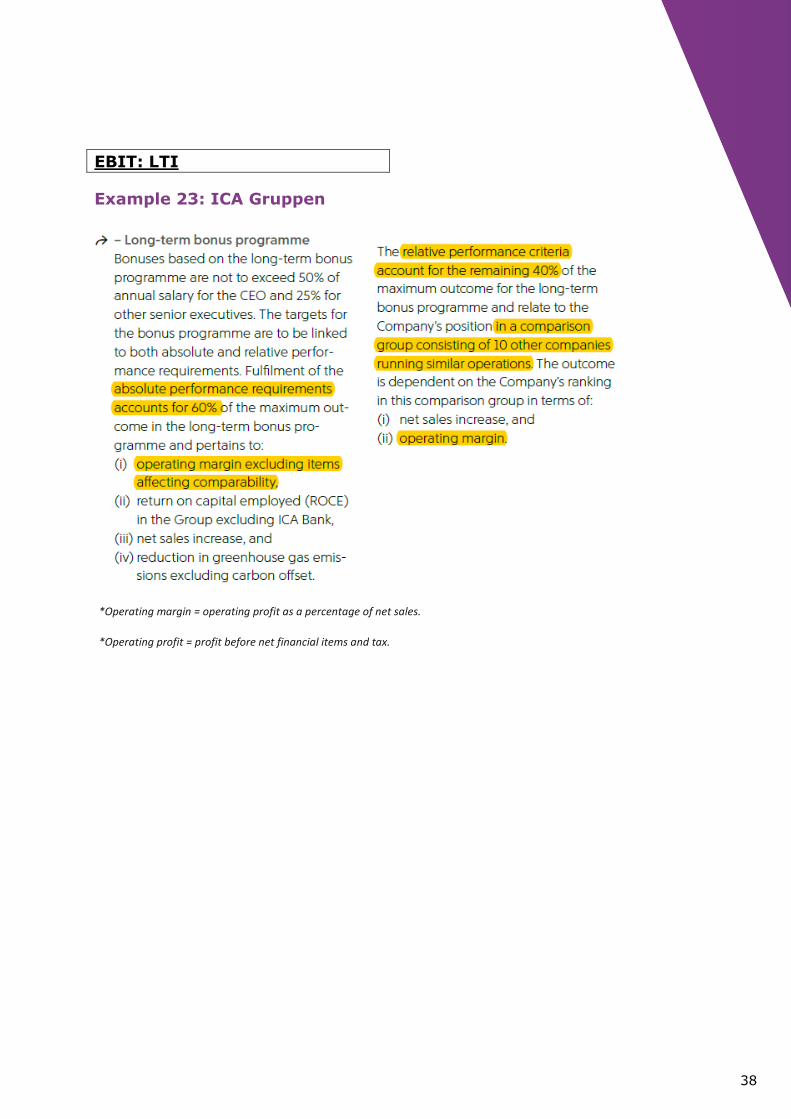
EBIT: LTI
Example 23: ICA Gruppen
*Operating margin = operating profit as a percentage of net sales.
*Operating profit = profit before net financial items and tax.
39
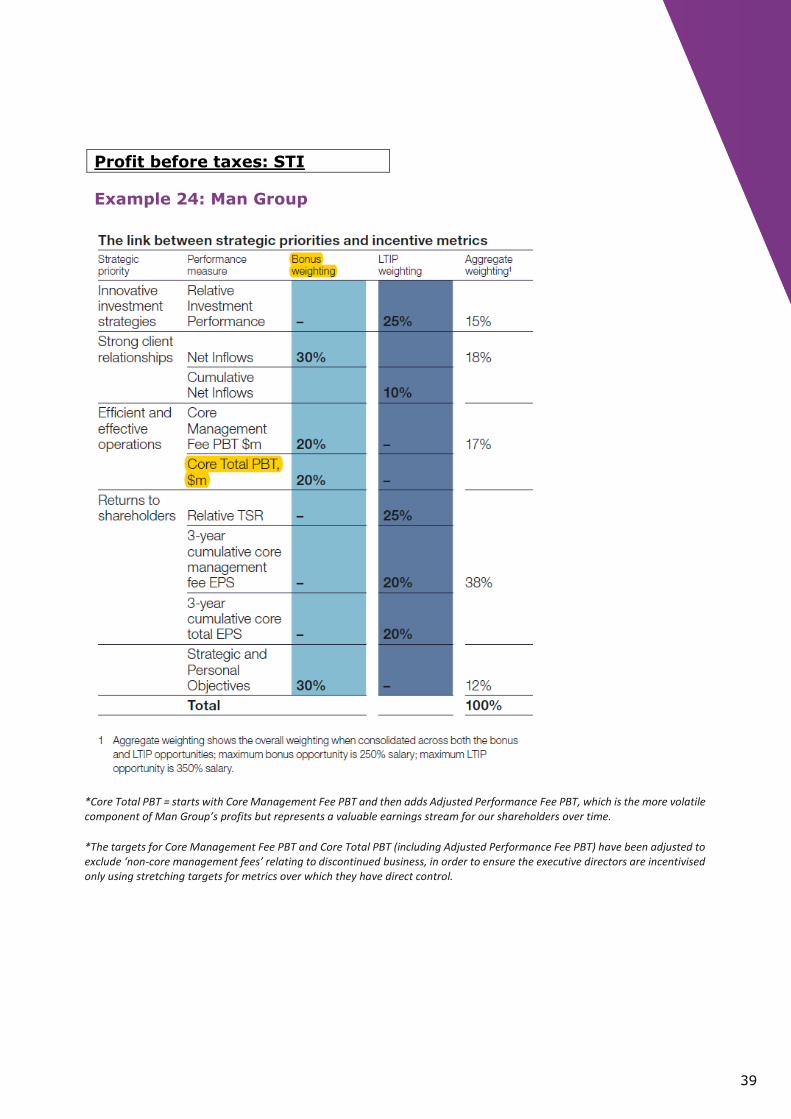
Profit before taxes: STI
Example 24: Man Group
*Core Total PBT = starts with Core Management Fee PBT and then adds Adjusted Performance Fee PBT, which is the more volatile component of Man Group’s profits but represents a valuable earnings stream for our shareholders over time.
*The targets for Core Management Fee PBT and Core Total PBT (including Adjusted Performance Fee PBT) have been adjusted to exclude ‘non-core management fees’ relating to discontinued business, in order to ensure the executive directors are incentivised only using stretching targets for metrics over which they have direct control.
40
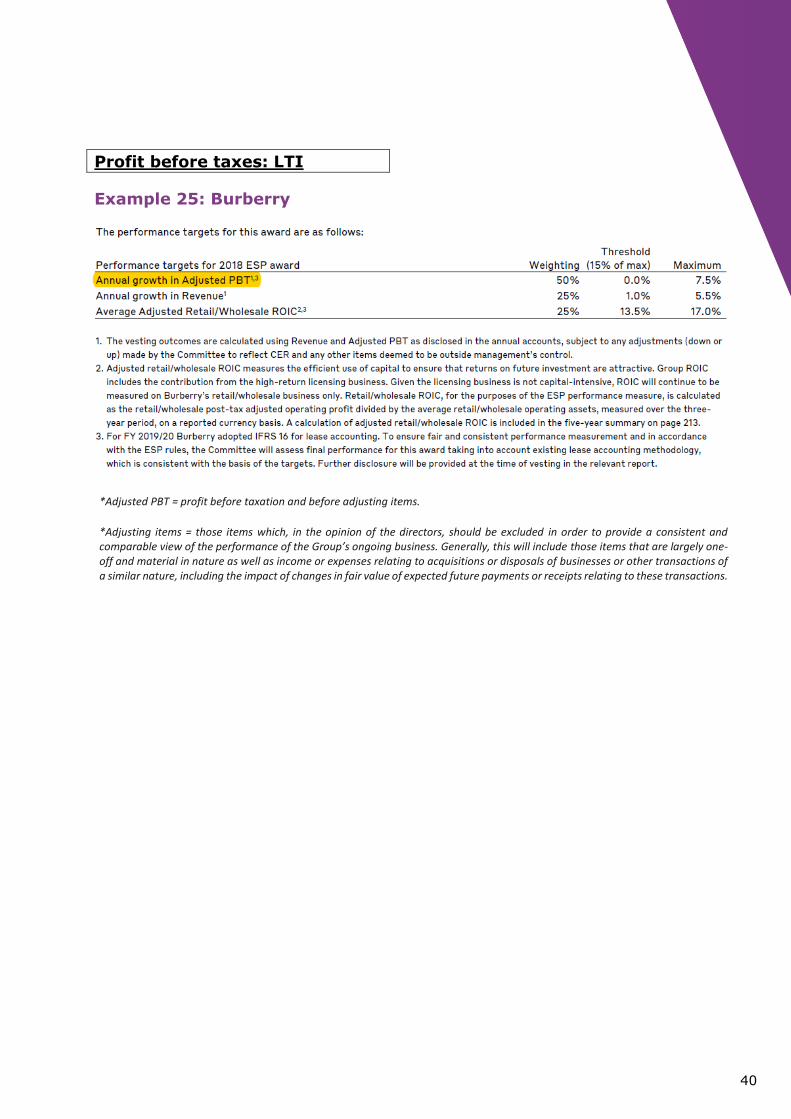
Profit before taxes: LTI
Example 25: Burberry
*Adjusted PBT = profit before taxation and before adjusting items.
*Adjusting items = those items which, in the opinion of the directors, should be excluded in order to provide a consistent and comparable view of the performance of the Group’s ongoing business. Generally, this will include those items that are largely one-off and material in nature as well as income or expenses relating to acquisitions or disposals of businesses or other transactions of a similar nature, including the impact of changes in fair value of expected future payments or receipts relating to these transactions.
41
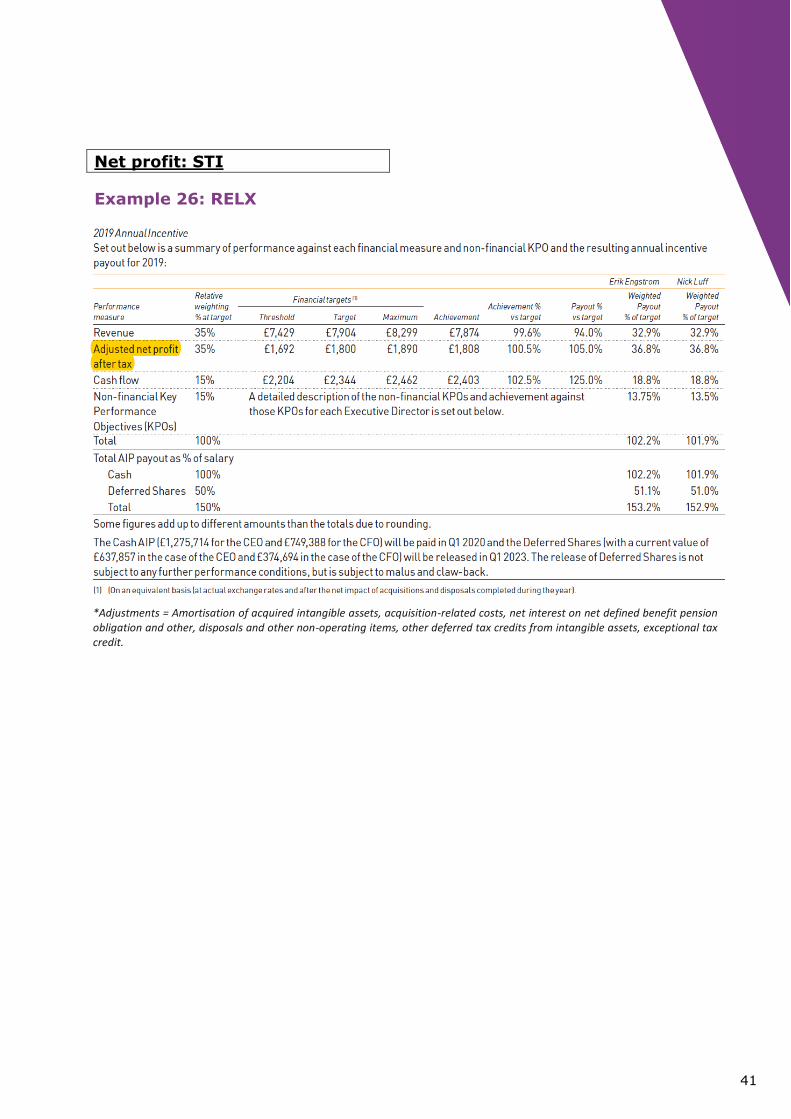
Net profit: STI
Example 26: RELX
*Adjustments = Amortisation of acquired intangible assets, acquisition-related costs, net interest on net defined benefit pension obligation and other, disposals and other non-operating items, other deferred tax credits from intangible assets, exceptional tax credit.
42
Net profit: LTI
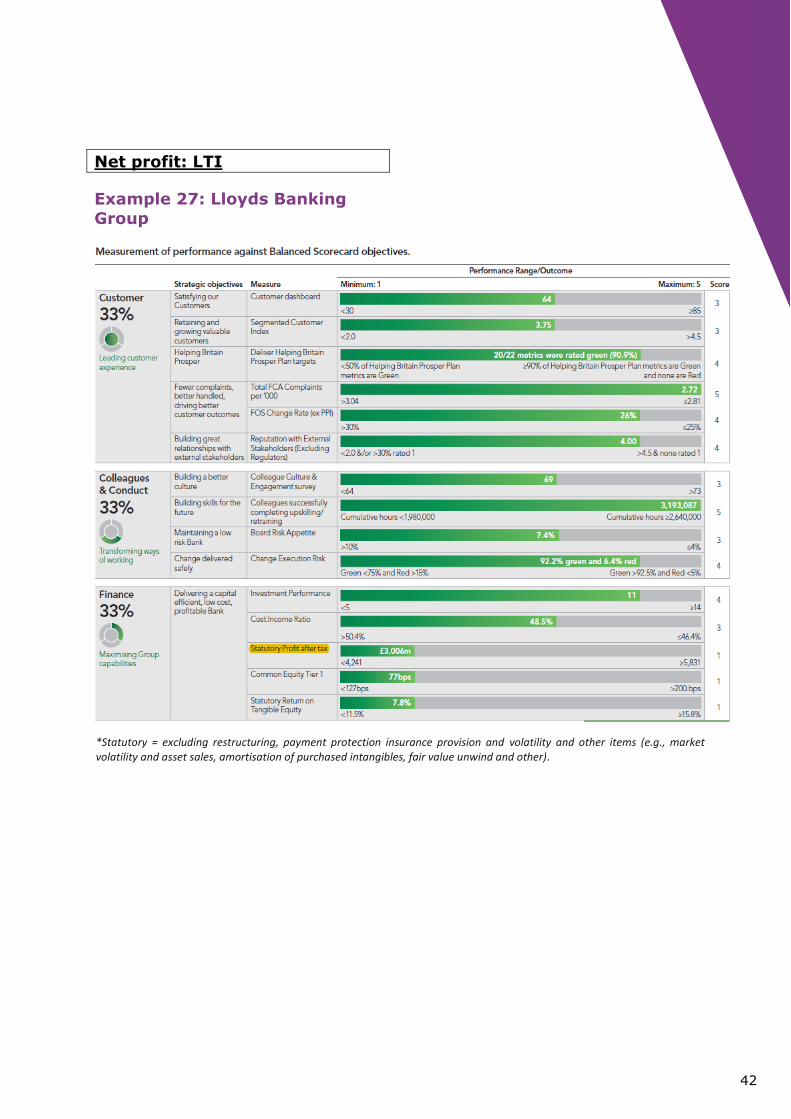
Example 27: Lloyds Banking
Group
*Statutory = excluding restructuring, payment protection insurance provision and volatility and other items (e.g., market volatility and asset sales, amortisation of purchased intangibles, fair value unwind and other).
43
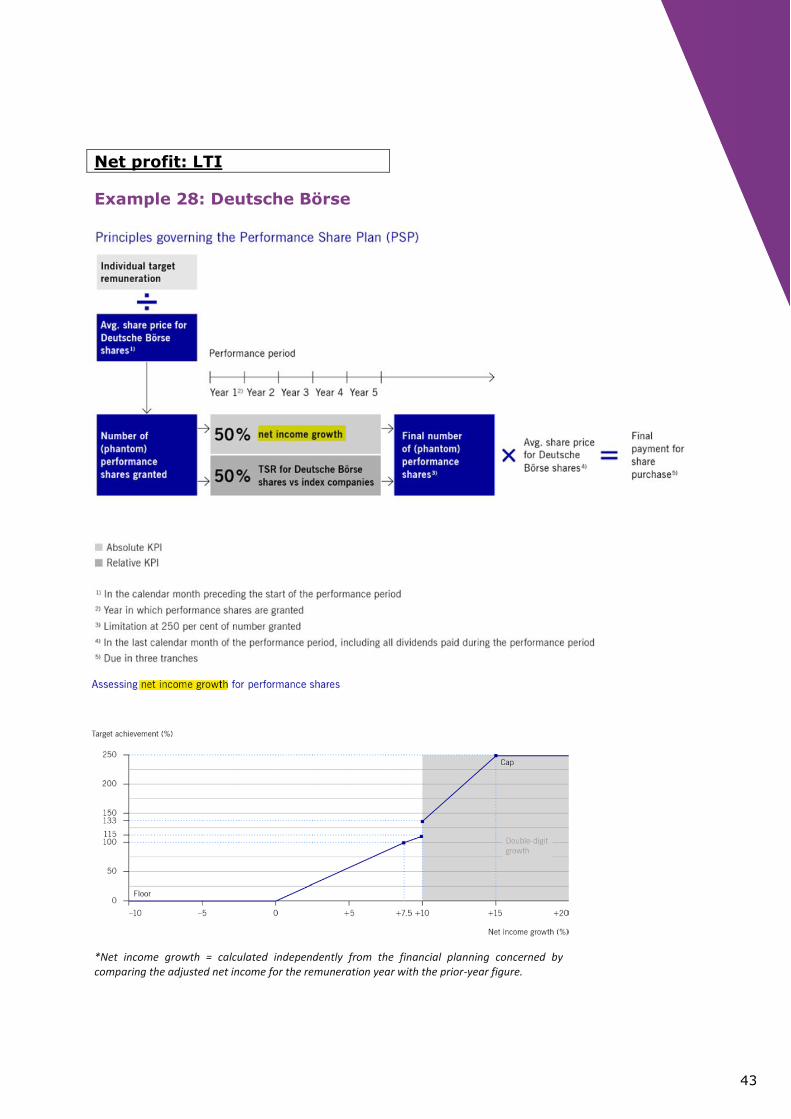
Net profit: LTI
Example 28: Deutsche Börse
*Net income growth = calculated independently from the financial planning concerned by comparing the adjusted net income for the remuneration year with the prior-year figure.
44
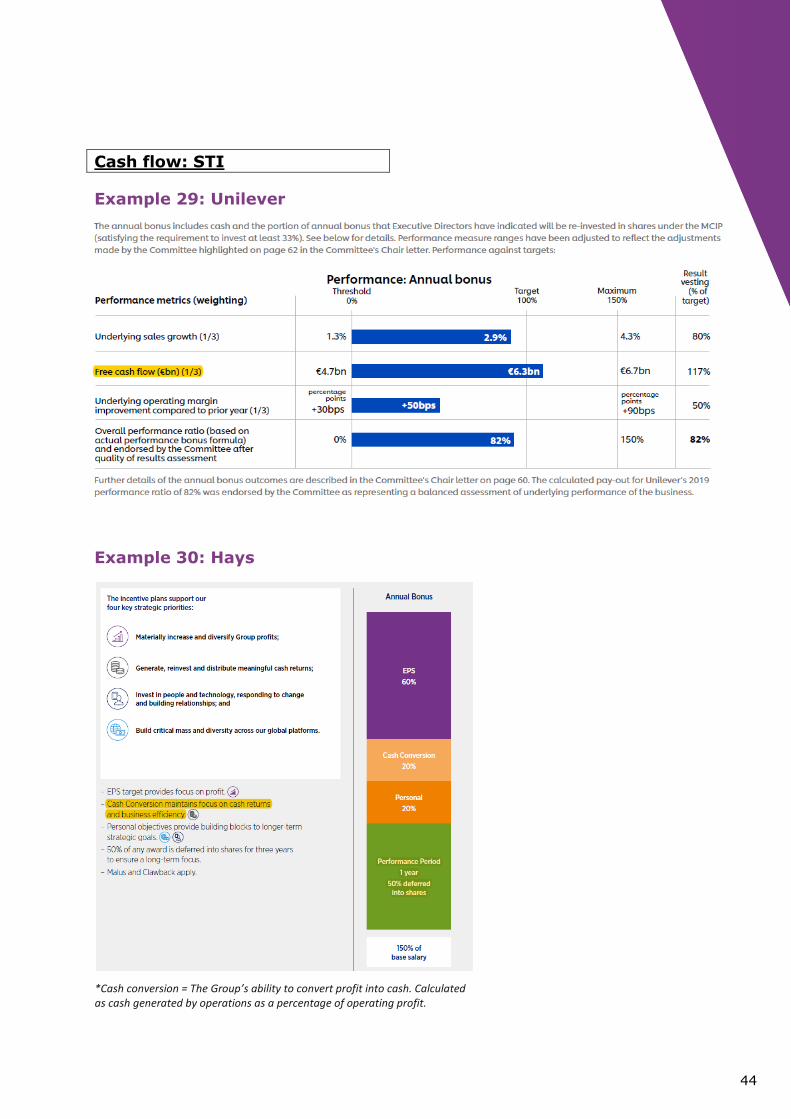
Cash flow: STI
Example 29: Unilever
Example 30: Hays
*Cash conversion = The Group’s ability to convert profit into cash. Calculated as cash generated by operations as a percentage of operating profit.
45
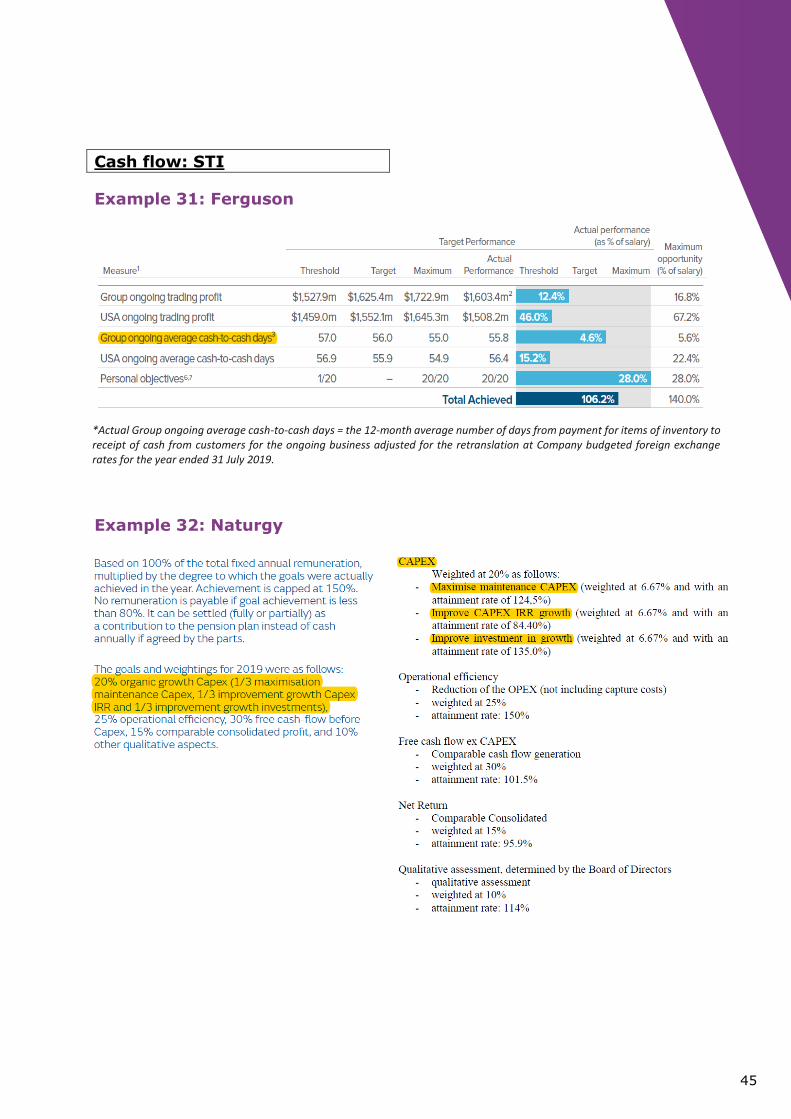
Cash flow: STI
Example 31: Ferguson
Example 32: Naturgy
*Actual Group ongoing average cash-to-cash days = the 12-month average number of days from payment for items of inventory to receipt of cash from customers for the ongoing business adjusted for the retranslation at Company budgeted foreign exchange rates for the year ended 31 July 2019.
46
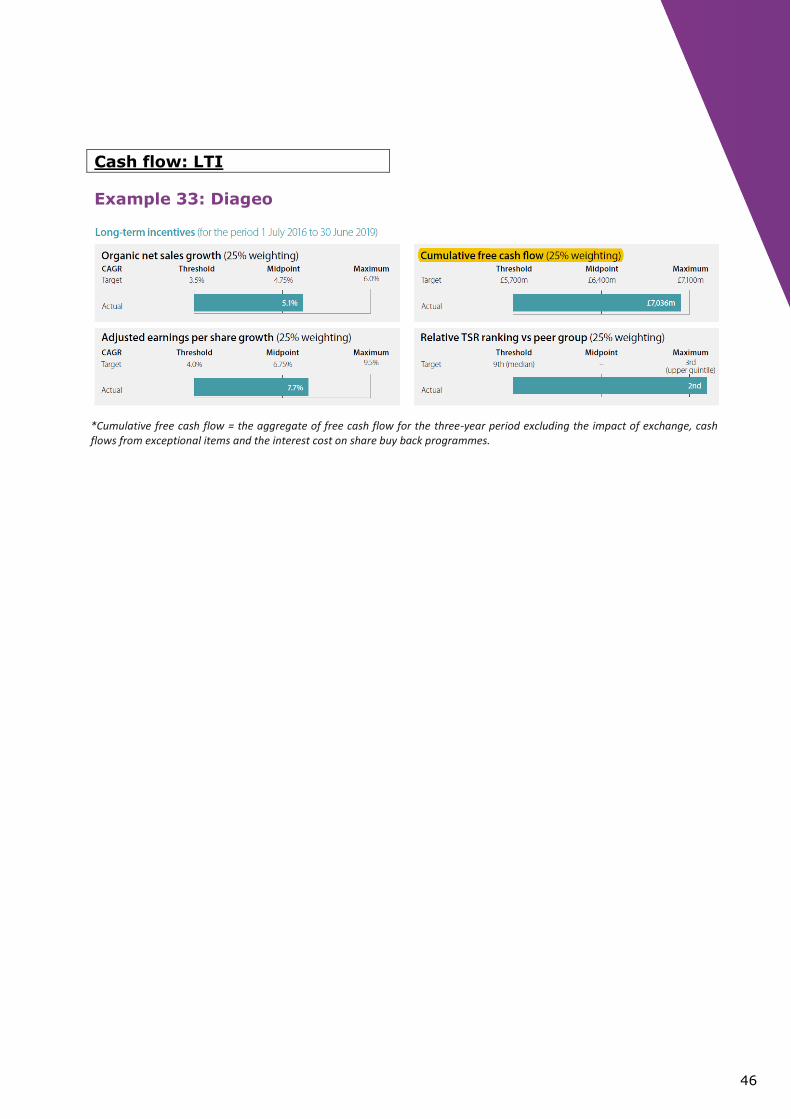
Cash flow: LTI
Example 33: Diageo
*Cumulative free cash flow = the aggregate of free cash flow for the three-year period excluding the impact of exchange, cash flows from exceptional items and the interest cost on share buy back programmes.
47
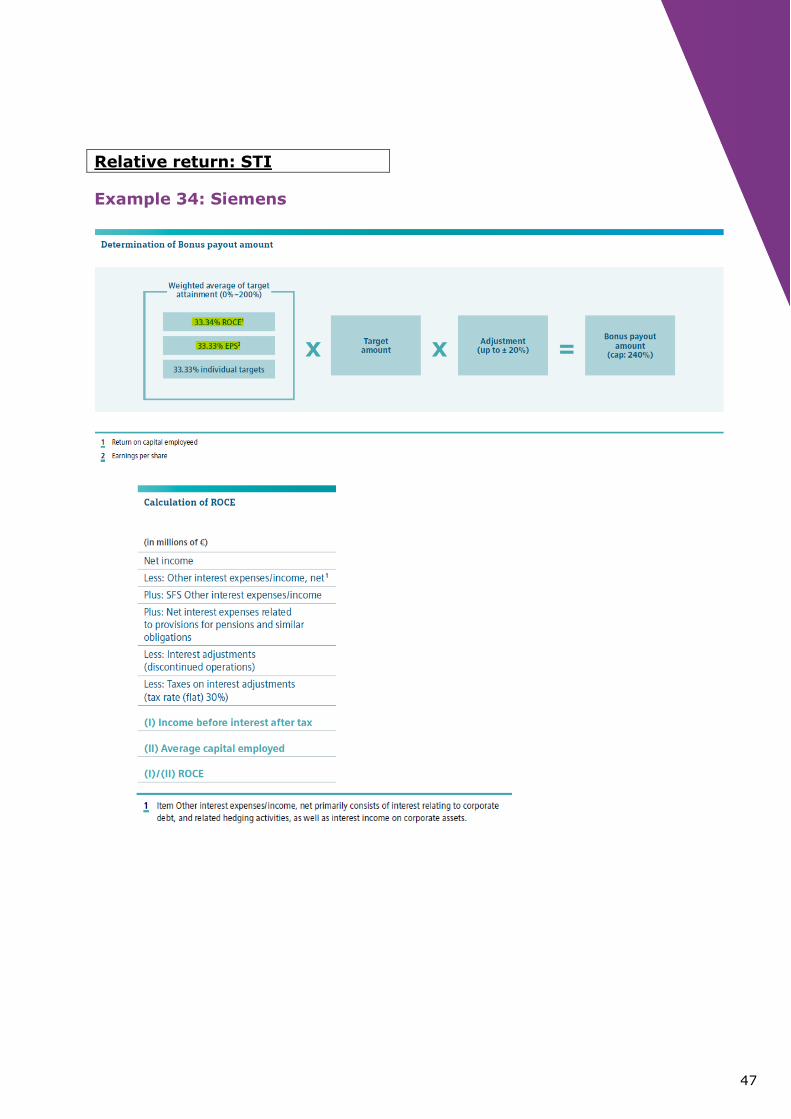
Relative return: STI
Example 34: Siemens

48
Relative return: STI
Example 35: Intertek
*ROIC = Adjusted profit after tax divided by invested capital.
*Invested capital = Net assets excluding tax balances, net financial debt and net pension liabilities.
*Adjusted = Before Separately Disclosed Items (‘SDIs’) = include amortisation of acquisition intangibles; impairment of goodwill and other assets; the profit or loss on disposals of businesses or other significant fixed assets; costs related to acquisition activity; the cost of any fundamental restructuring of a business; material claims and settlements; significant recycling of amounts from equity to the income statement; unrealised market or fair value gains or losses on financial assets or liabilities, including contingent consideration; and significant legislative changes.

49
Relative return: LTI
Example 36: Valeo
Example 37: Scor
50
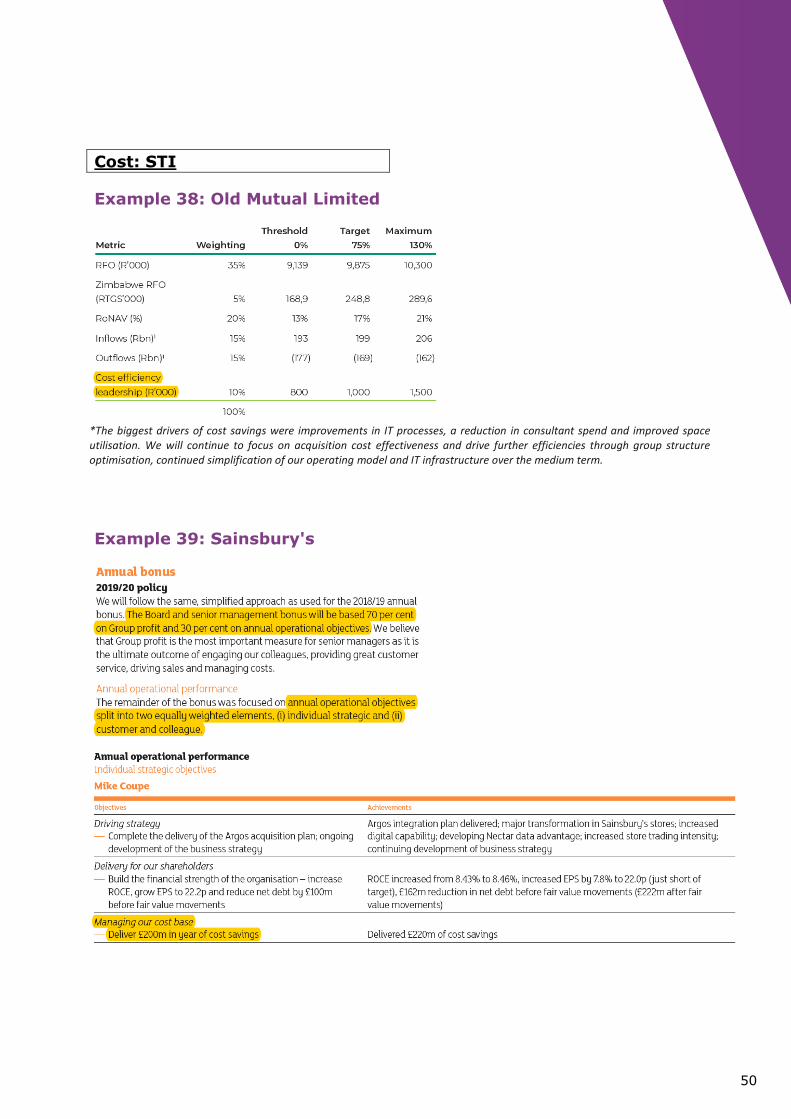
Cost: STI
Example 38: Old Mutual Limited
Example 39: Sainsbury's
*The biggest drivers of cost savings were improvements in IT processes, a reduction in consultant spend and improved space utilisation. We will continue to focus on acquisition cost effectiveness and drive further efficiencies through group structure optimisation, continued simplification of our operating model and IT infrastructure over the medium term.
51
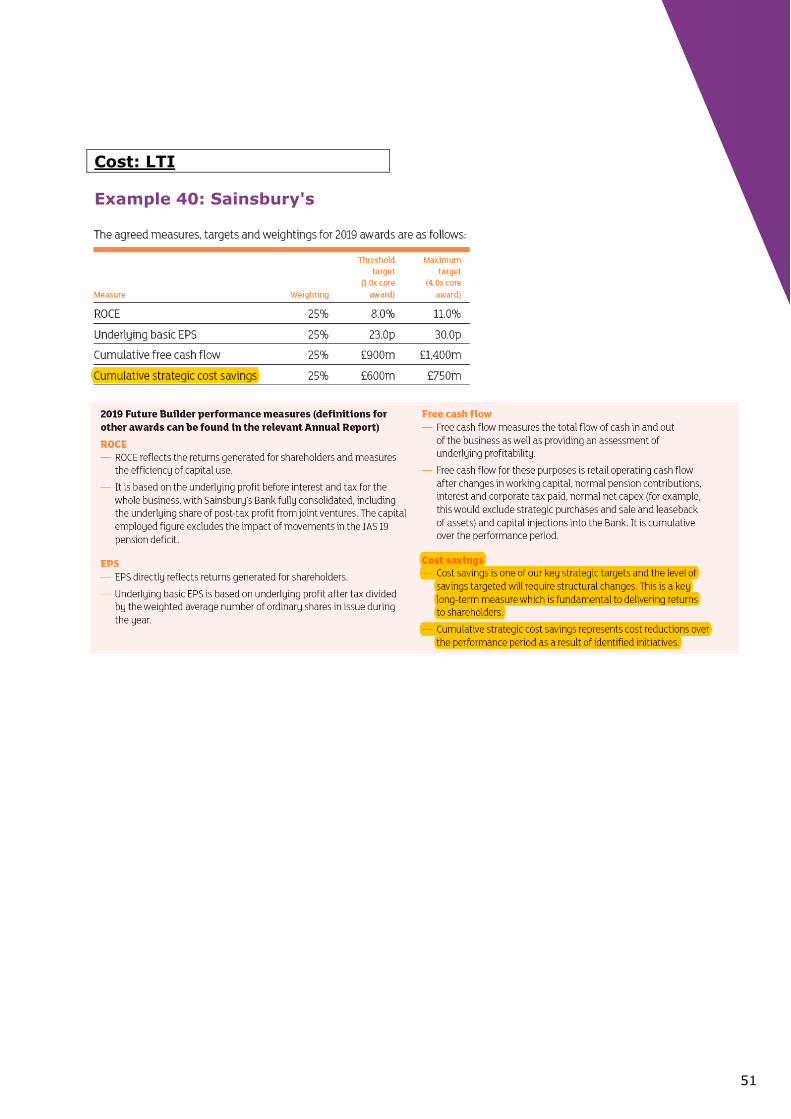
Cost: LTI
Example 40: Sainsbury's

52
Debt: STI
Example 41: Total S.A.
*Net-debt-to-equity ratio = Net debt/Equity
*Net financial debts = see figure below
53
Debt: STI
Example 42: OCI
54
Debt: LTI
Example 43: Ashtead Group
*Leverage = calculated at constant exchange rates uses the current period exchange rate and is determined as net debt divided by underlying EBITDA.
*Net debt = total borrowings (bank, bonds and finance lease liabilities) less cash balances, as reported.
*EBITDA = not defined by IFRS but is a widely accepted profit measure being earnings before interest, tax, depreciation and amortisation.
*Underlying results = the results stated before exceptional items and the amortisation of acquired intangibles.
*Exceptional items = those items that are material and non-recurring in nature that the Group believes should be disclosed separately to assist in the understanding of the financial performance of the Group.
55
Economic profit: STI
Example 44: Jerónimo Martins
*EVA = EBIT after taxes minus capital costs
56
Economic profit: LTI
Example 45: Spectris
Example 46: Julius Baer Group
57
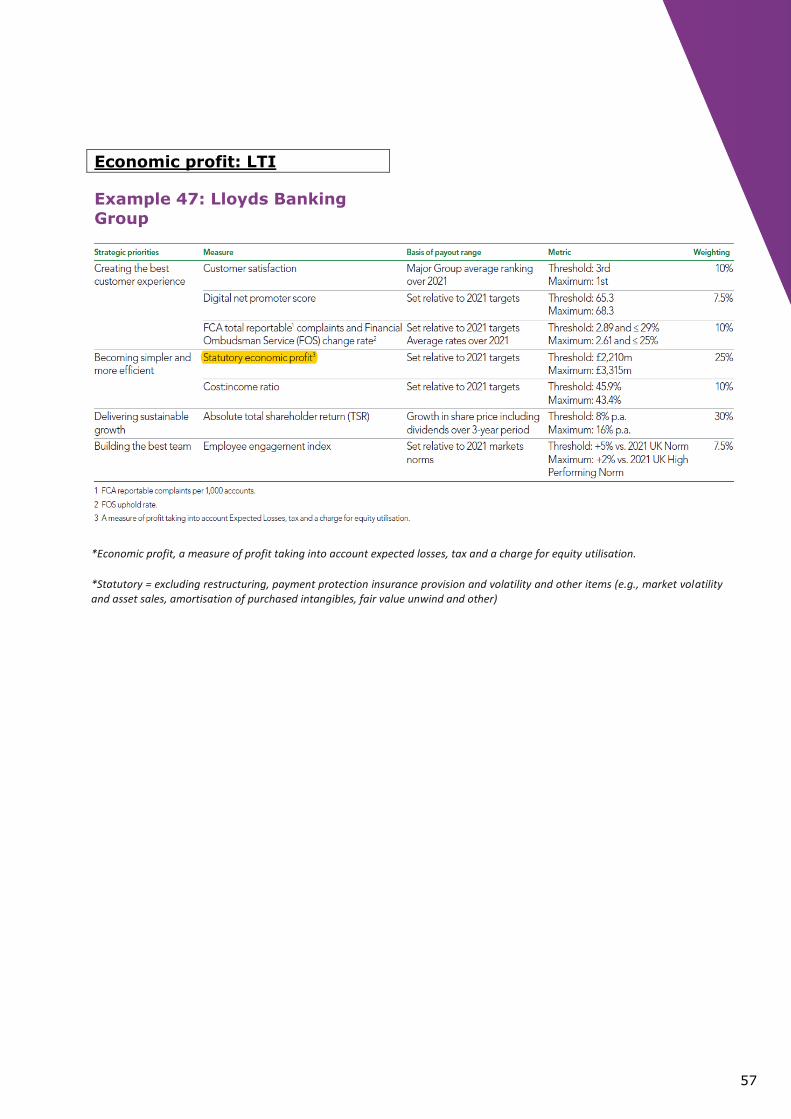
Economic profit: LTI
Example 47: Lloyds Banking
Group
*Economic profit, a measure of profit taking into account expected losses, tax and a charge for equity utilisation.
*Statutory = excluding restructuring, payment protection insurance provision and volatility and other items (e.g., market volatility and asset sales, amortisation of purchased intangibles, fair value unwind and other)
58
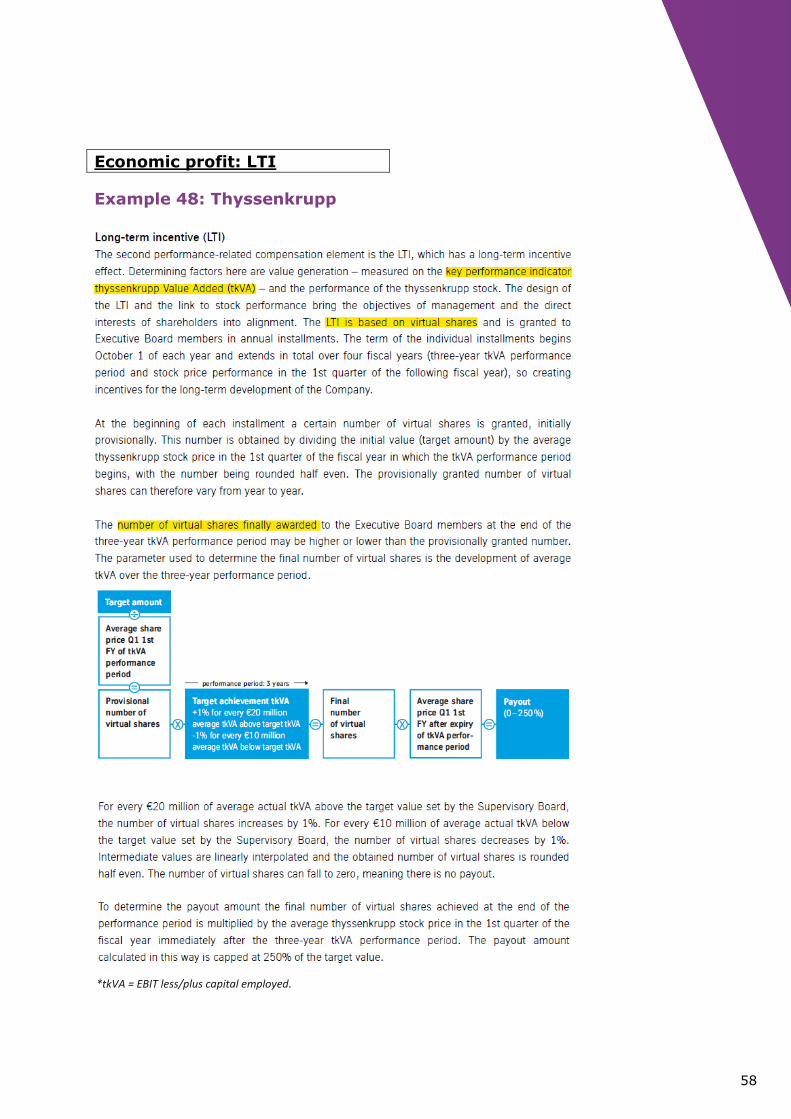
Economic profit: LTI
Example 48: Thyssenkrupp
*tkVA = EBIT less/plus capital employed.
59
EXAMPLES NON-FINANCIAL KEY
PERFORMANCE INDICATORS
Strategy: STI
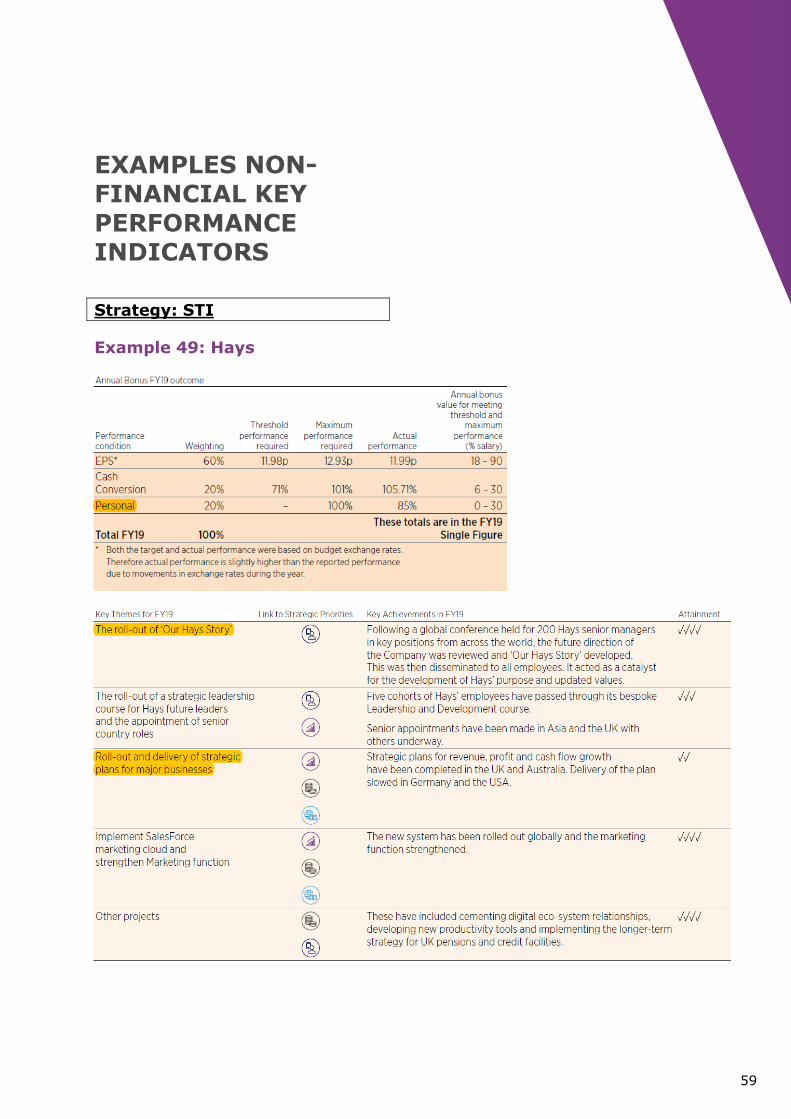
Example 49: Hays
60
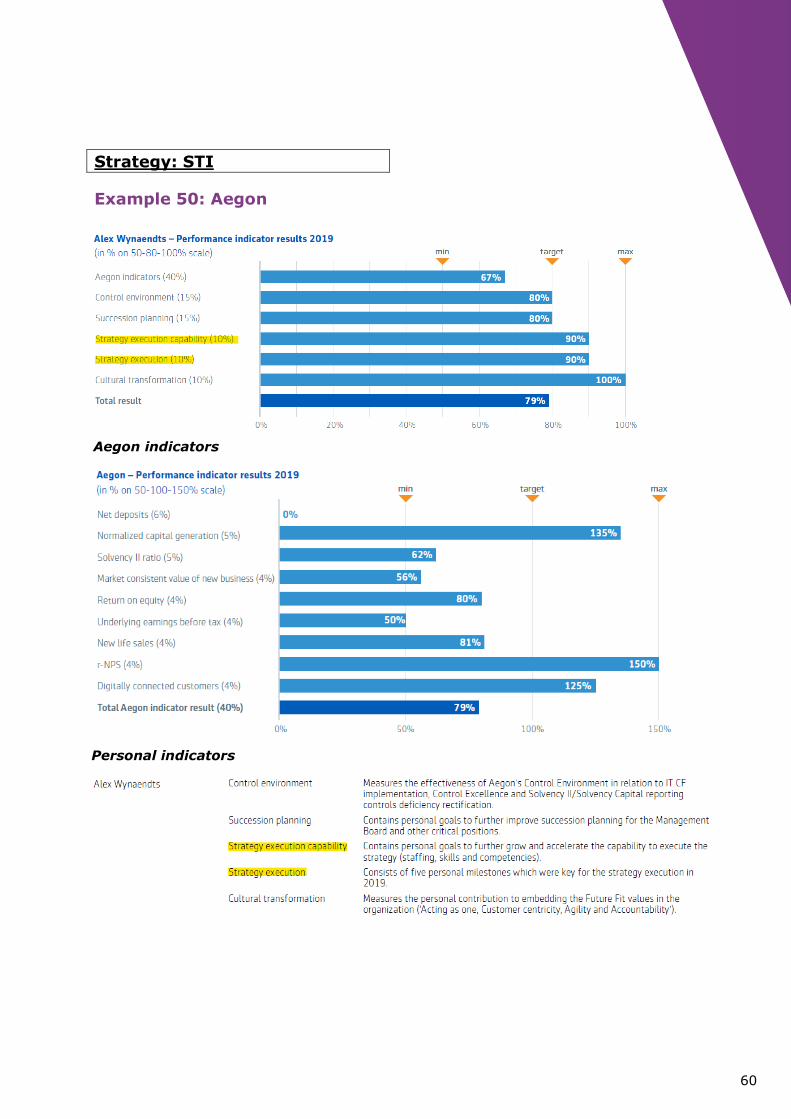
Strategy: STI
Example 50: Aegon
Aegon indicators
Personal indicators
61
Strategy: STI
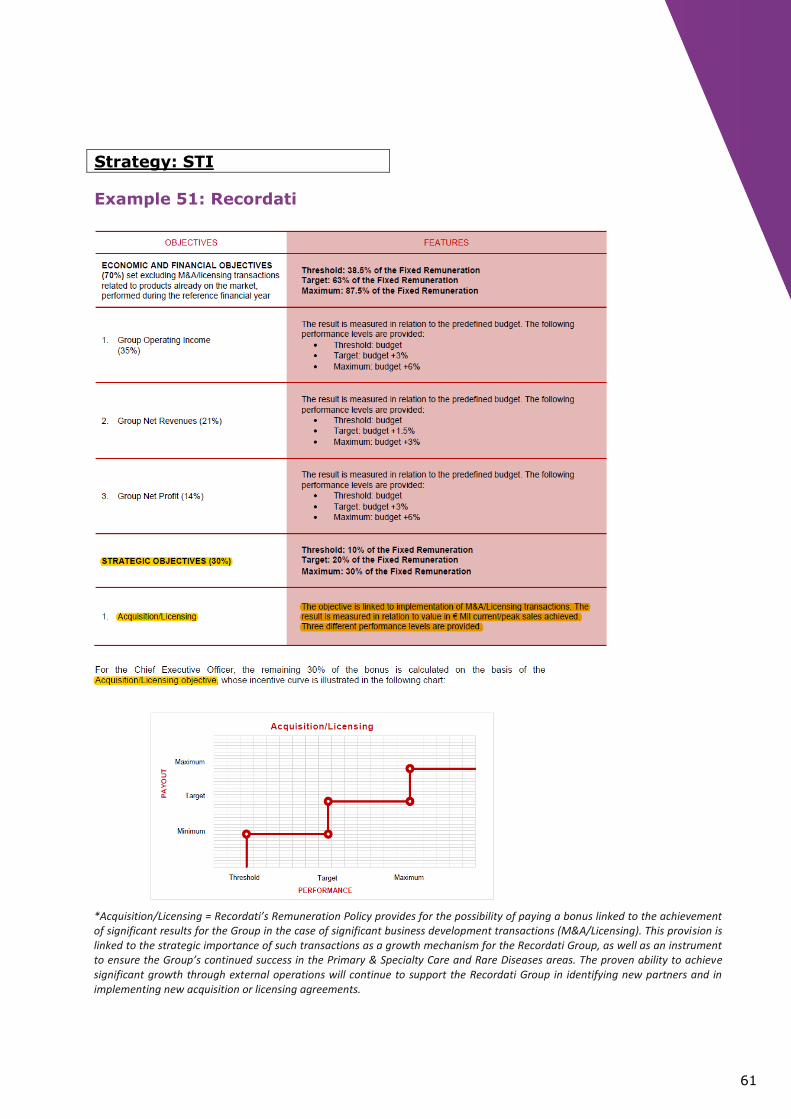
Example 51: Recordati
*Acquisition/Licensing = Recordati’s Remuneration Policy provides for the possibility of paying a bonus linked to the achievement of significant results for the Group in the case of significant business development transactions (M&A/Licensing). This provision is linked to the strategic importance of such transactions as a growth mechanism for the Recordati Group, as well as an instrument to ensure the Group’s continued success in the Primary & Specialty Care and Rare Diseases areas. The proven ability to achieve significant growth through external operations will continue to support the Recordati Group in identifying new partners and in implementing new acquisition or licensing agreements.
62
Strategy: STI
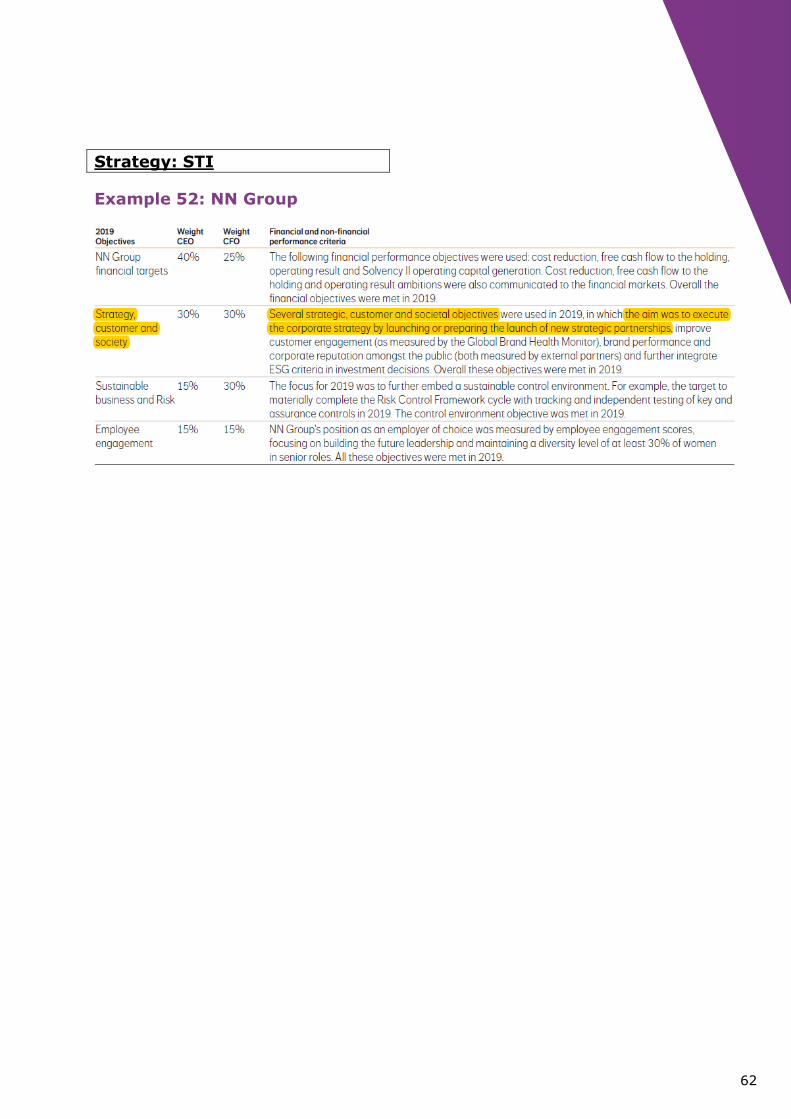
Example 52: NN Group
63
Strategy: LTI
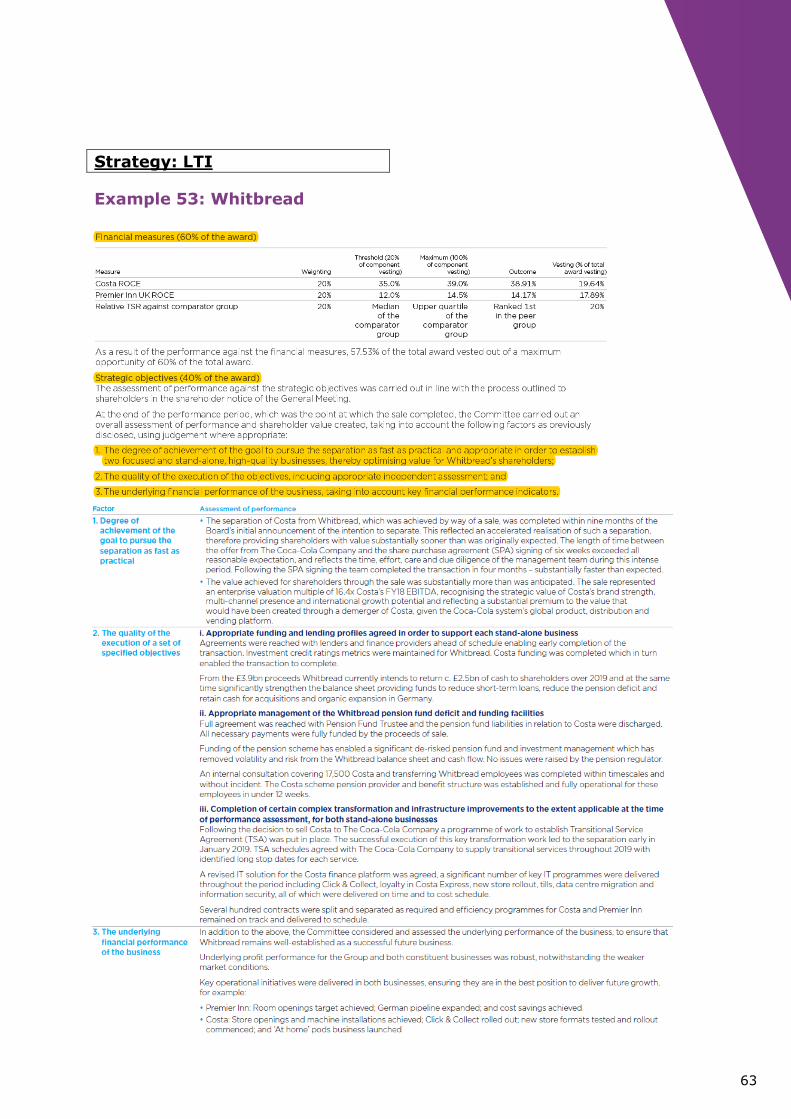
Example 53: Whitbread
64
Strategy: LTI
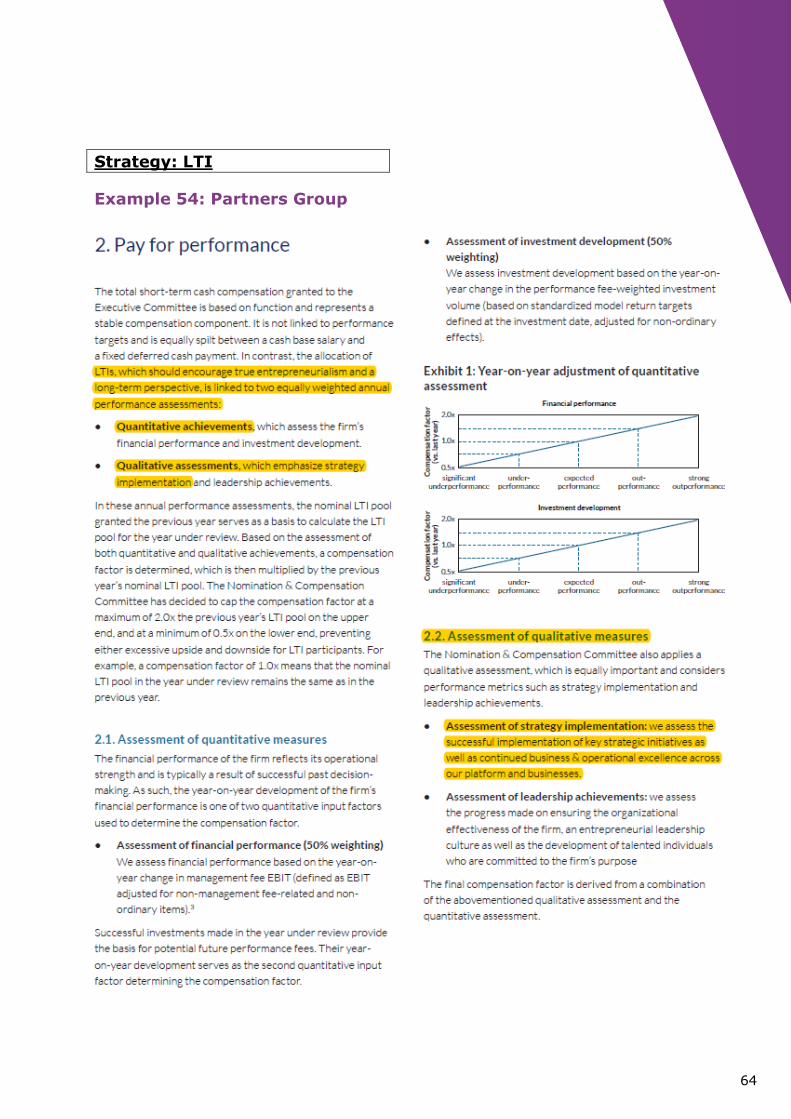
Example 54: Partners Group
65
Innovation: STI
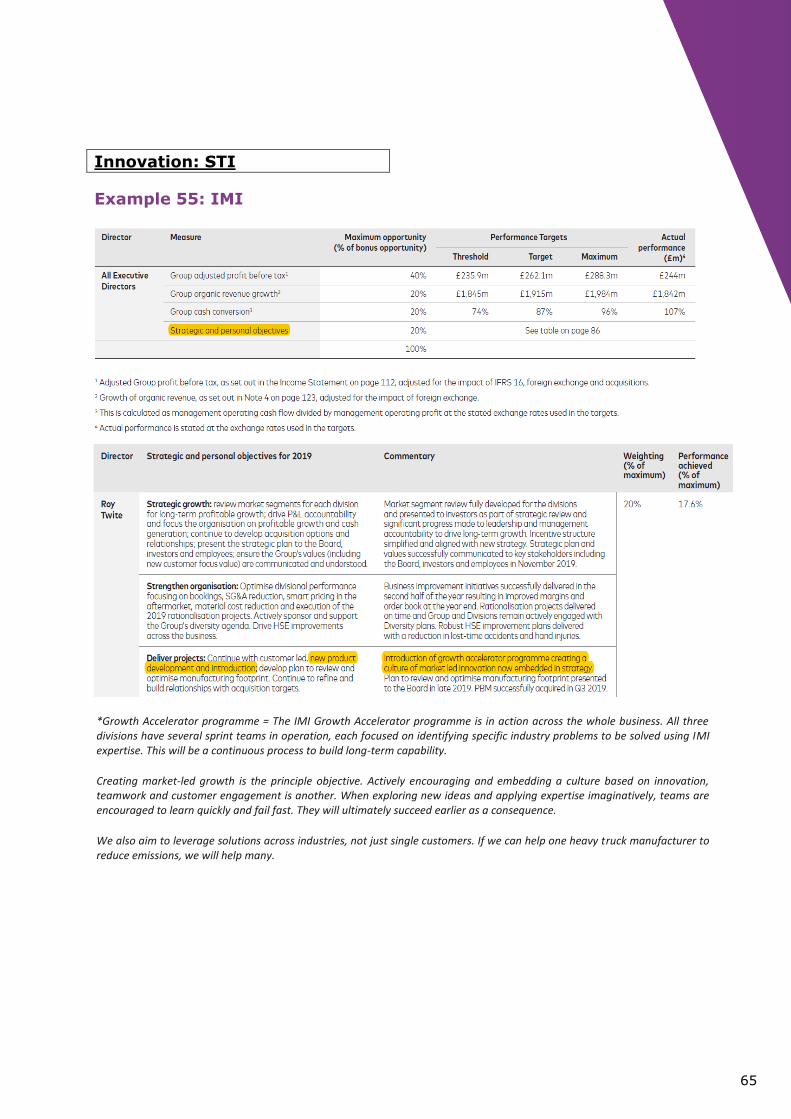
Example 55: IMI
*Growth Accelerator programme = The IMI Growth Accelerator programme is in action across the whole business. All three divisions have several sprint teams in operation, each focused on identifying specific industry problems to be solved using IMI expertise. This will be a continuous process to build long-term capability.
Creating market-led growth is the principle objective. Actively encouraging and embedding a culture based on innovation, teamwork and customer engagement is another. When exploring new ideas and applying expertise imaginatively, teams are encouraged to learn quickly and fail fast. They will ultimately succeed earlier as a consequence.
We also aim to leverage solutions across industries, not just single customers. If we can help one heavy truck manufacturer to reduce emissions, we will help many.

66
Innovation: STI
Example 56: Standard
Chartered
67
Innovation: STI
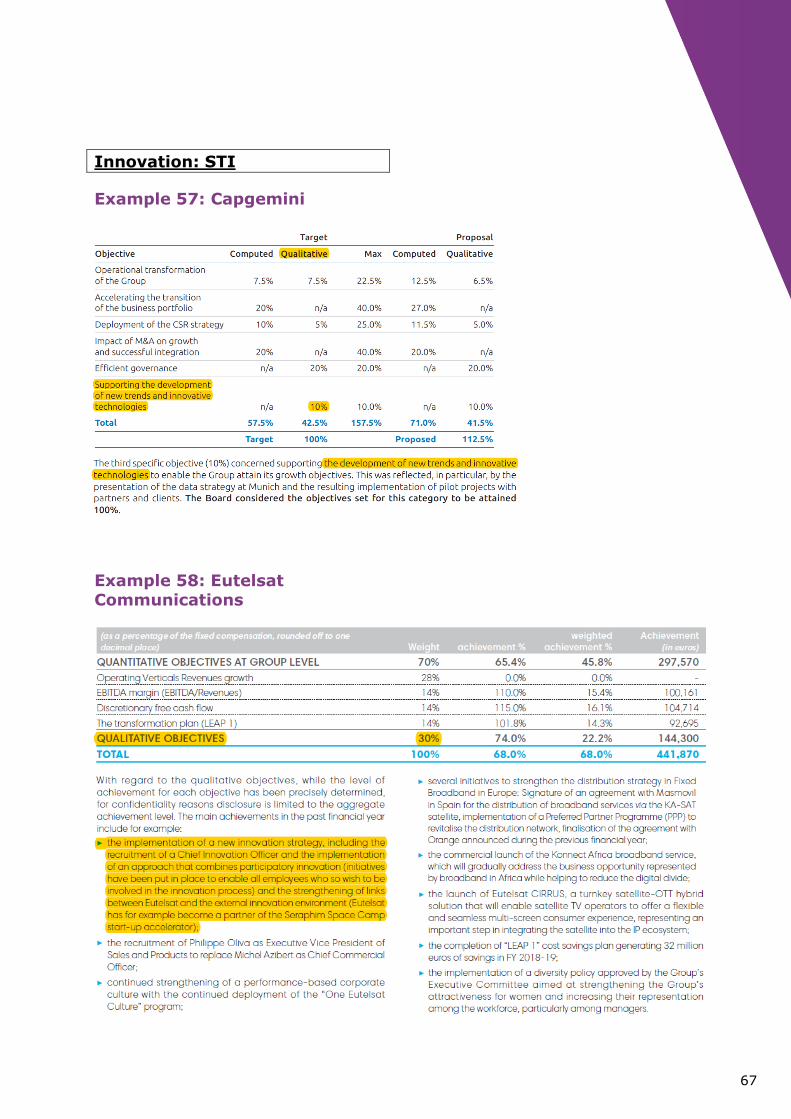
Example 57: Capgemini
Example 58: Eutelsat Communications
68
Innovation: LTI
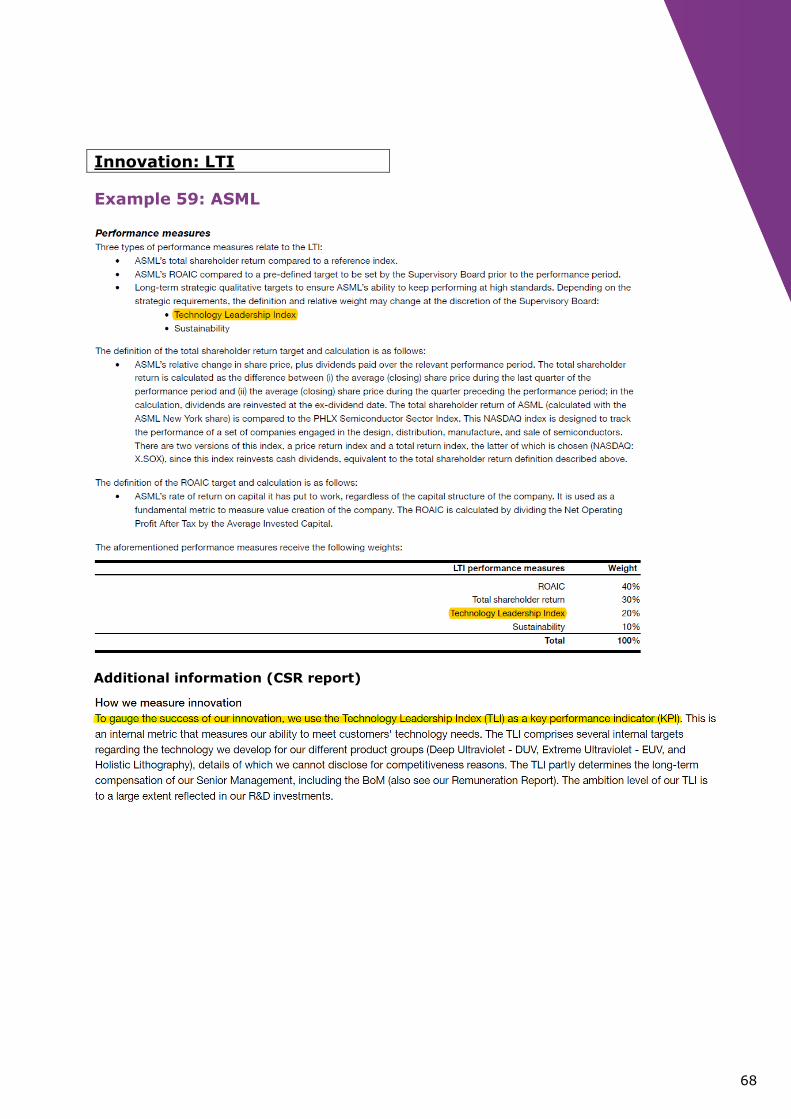
Example 59: ASML
Additional information (CSR report)

69
Innovation: LTI
Example 60: Kion Group
70
Legal and compliance: STI
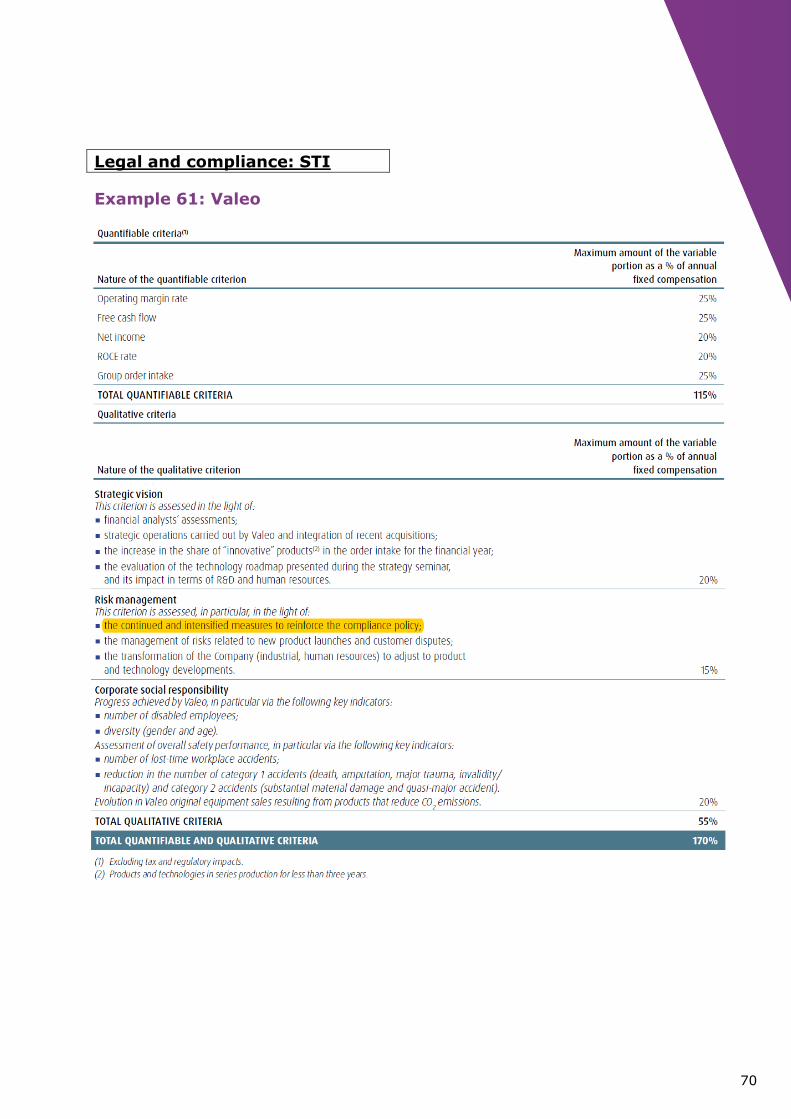
Example 61: Valeo
71
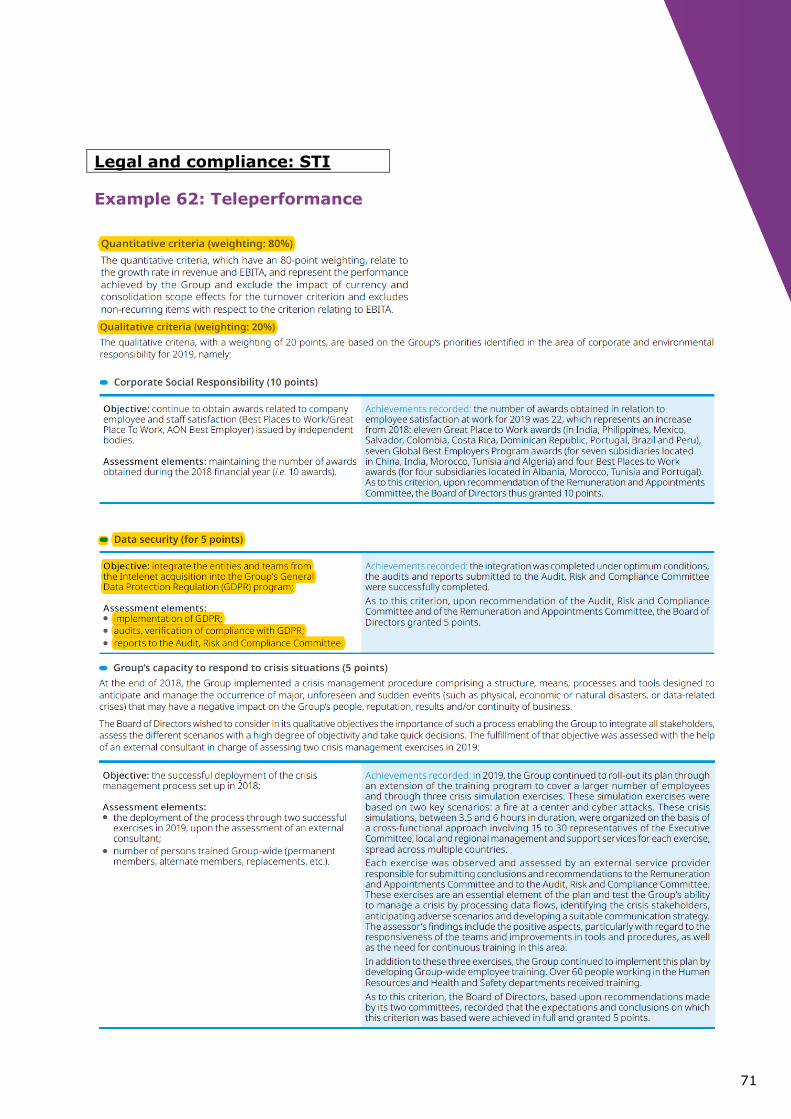
Legal and compliance: STI
Example 62: Teleperformance
72
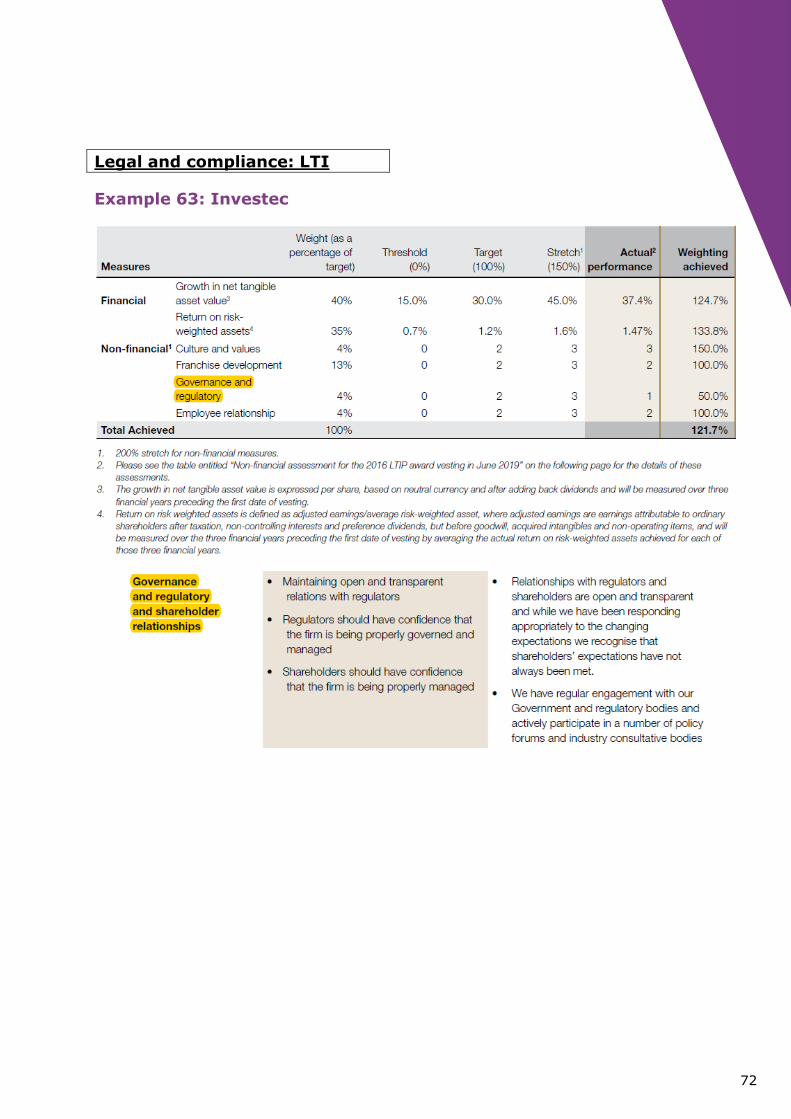
Legal and compliance: LTI
Example 63: Investec
73
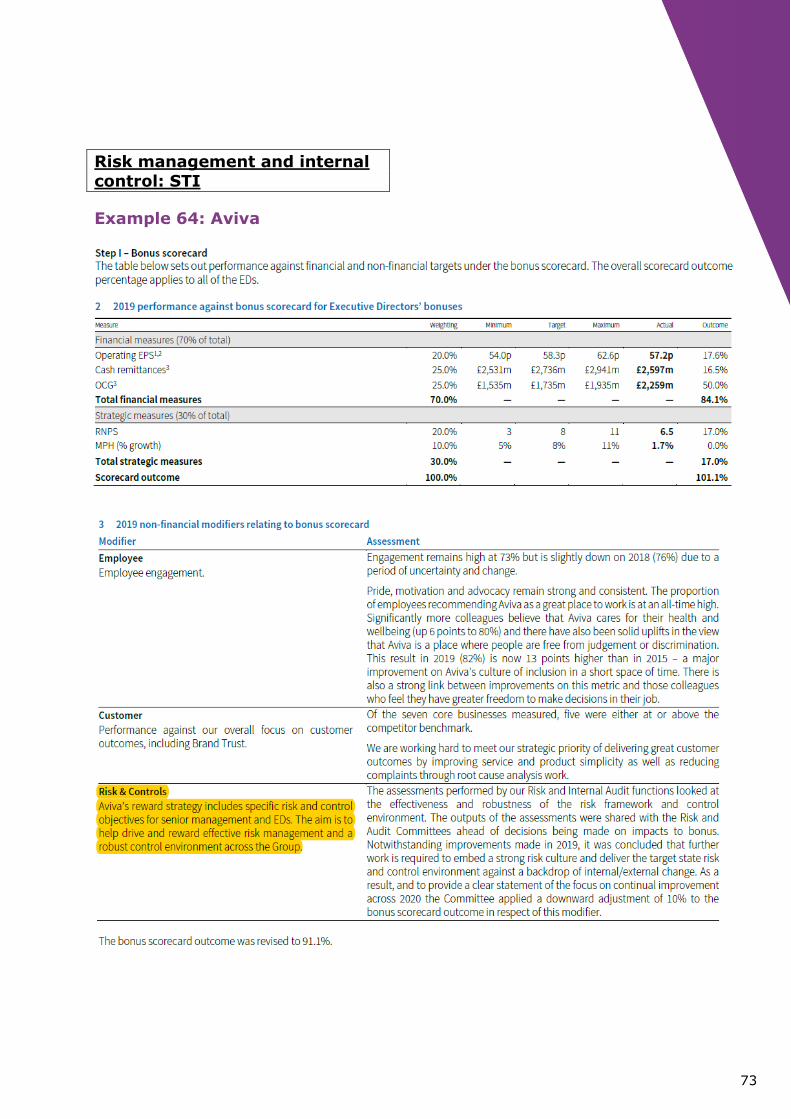
Risk management and internal
control: STI
Example 64: Aviva
74
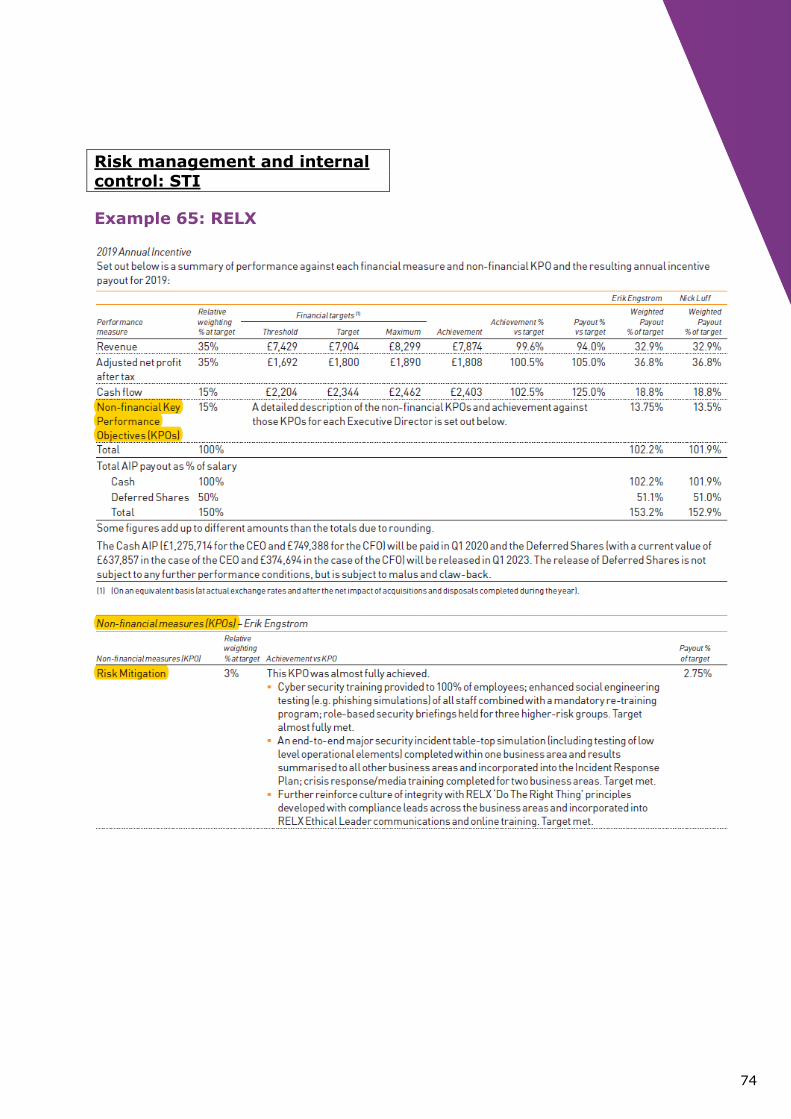
Risk management and internal
control: STI
Example 65: RELX
75
Risk management and internal
control: STI
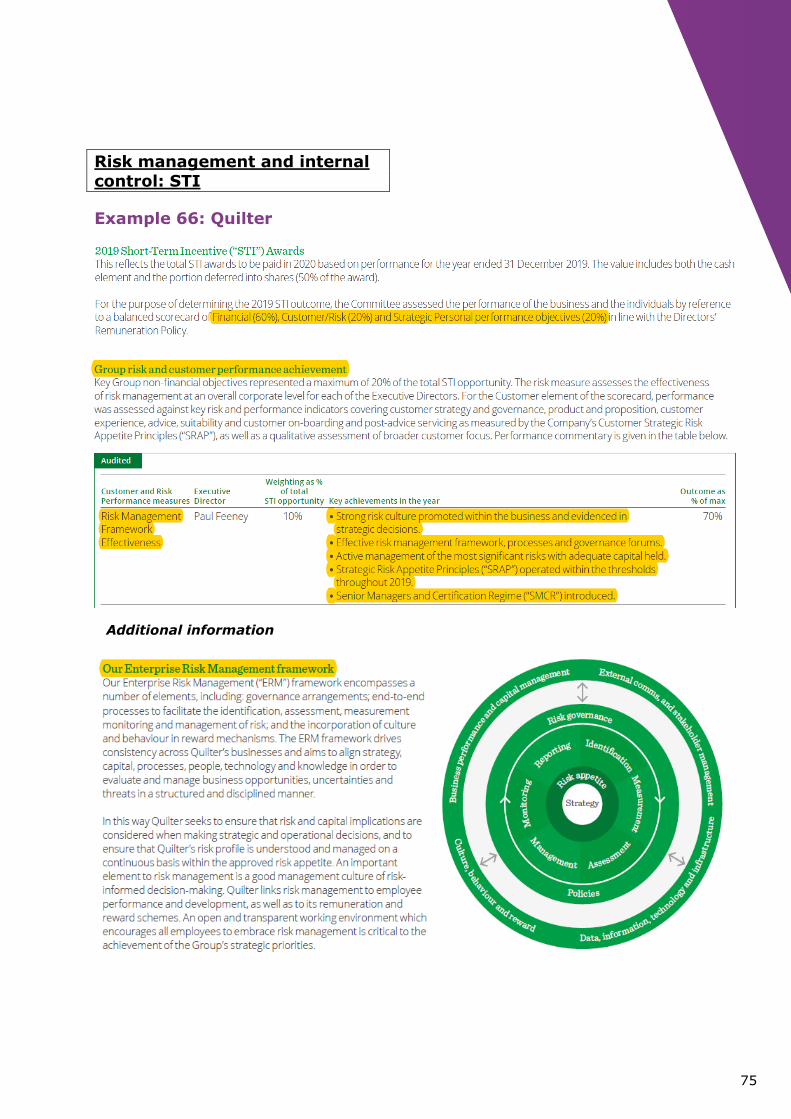
Example 66: Quilter
Additional information
76
Risk management and internal
control: STI
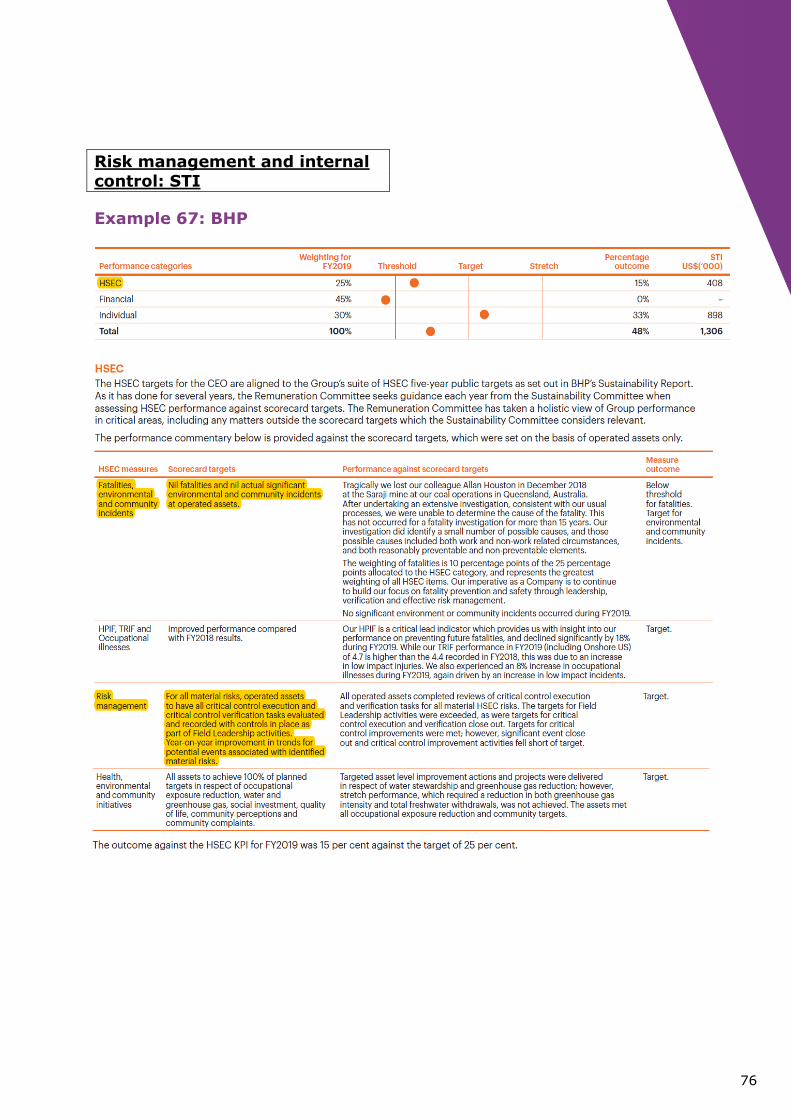
Example 67: BHP
77
Risk management and internal
control: STI
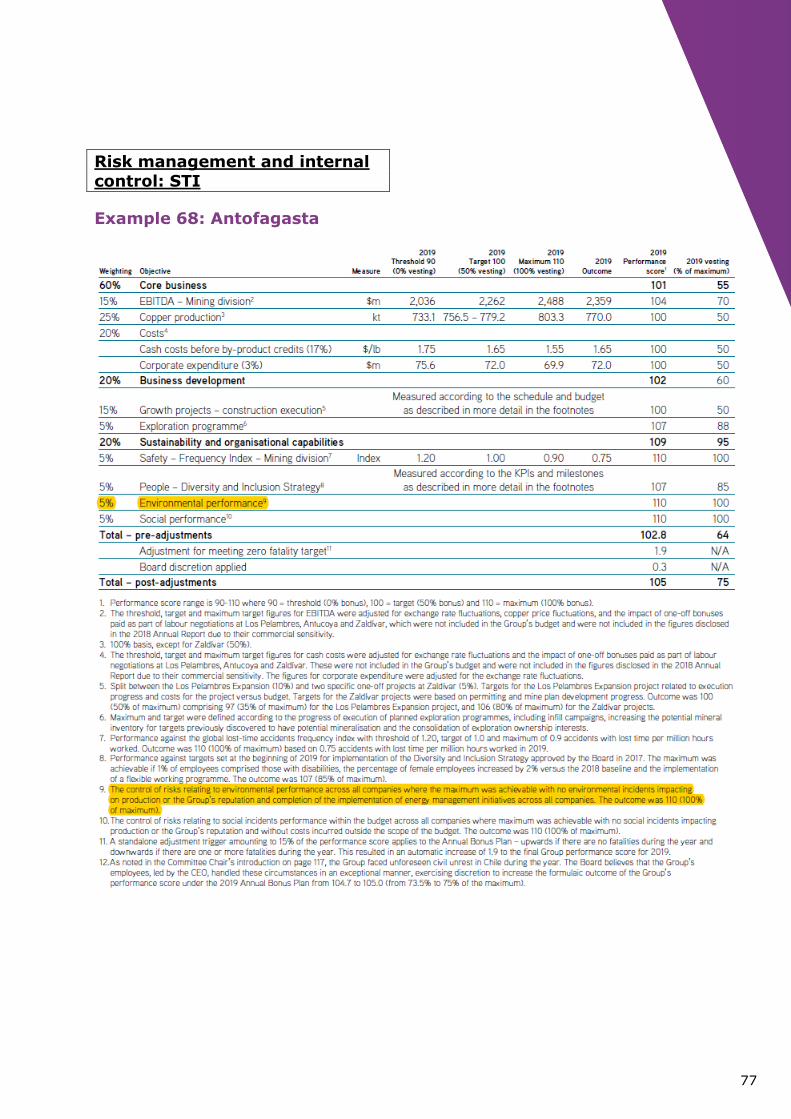
Example 68: Antofagasta
78
Risk management and internal
control: LTI
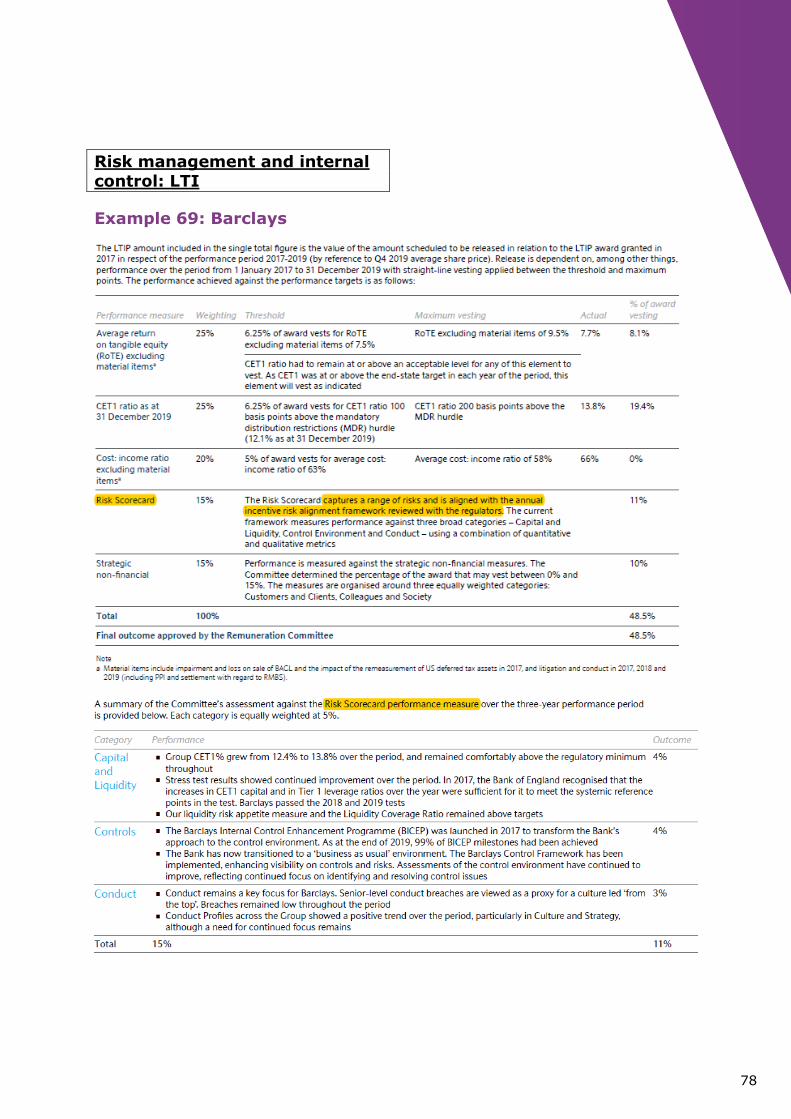
Example 69: Barclays
79
Quality and efficiency: STI
Example 70: Royal Dutch Shell

80
Quality and efficiency: STI
Example 71: CNP Assurances
81
Quality and efficiency: STI
Example 72: Société Générale
82
Quality and efficiency: STI
Example 73: Spectris
83
Quality and efficiency: LTI
Example 74: IG Group Holdings

84
Sustainability index: STI
Example 75: Schneider Electric
85
Sustainability index: LTI
Example 76: Terna
86
Environment: STI
Example 77: Vinci
87
Environment: STI
Example 78: SBM Offshore
SDG target completion:
88
Environment: STI
Example 79: Yara
89
Environment: STI
Example 80: Tullow Oil
90
Environment: LTI
Example 81: Signify
91
Customer: STI
Example 82: Santander
*Loyal customers = Active customers who receive most of their financial services from the Group according to the commercial segment to which they belong. Various engaged customer levels have been defined taking profitability into account.
92
Customer: STI
Example 83: RSA Insurance
group
93
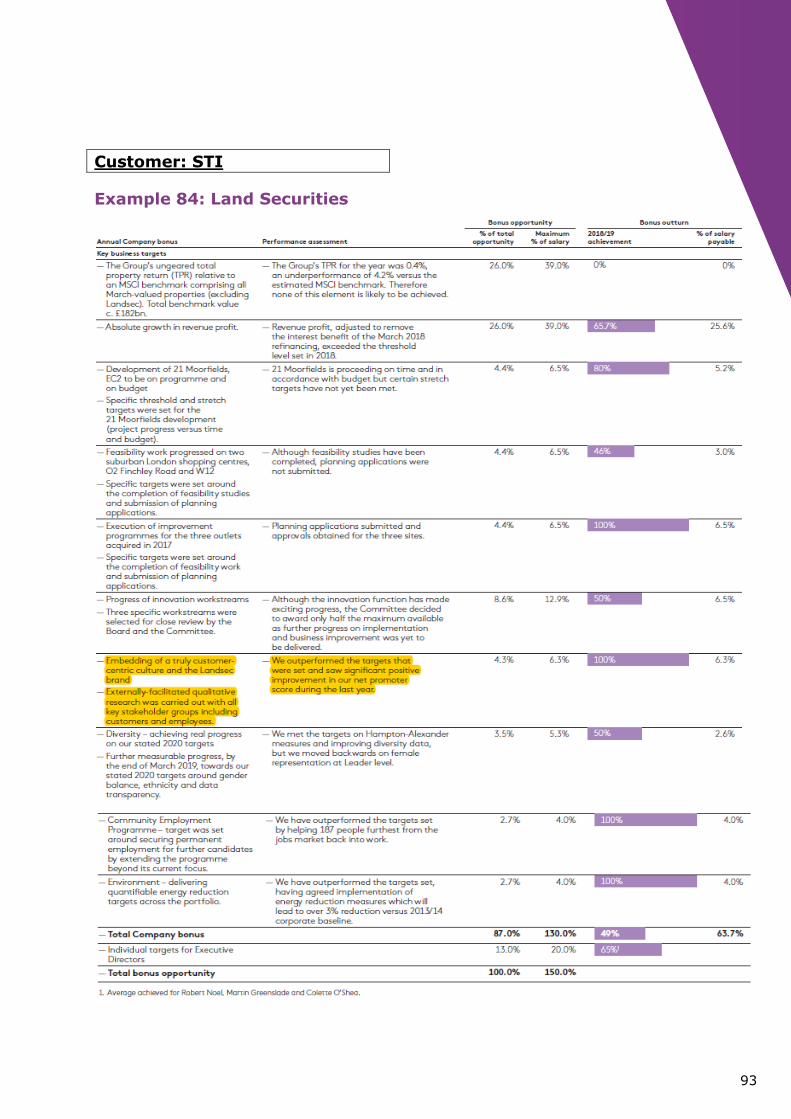
Customer: STI
Example 84: Land Securities
94
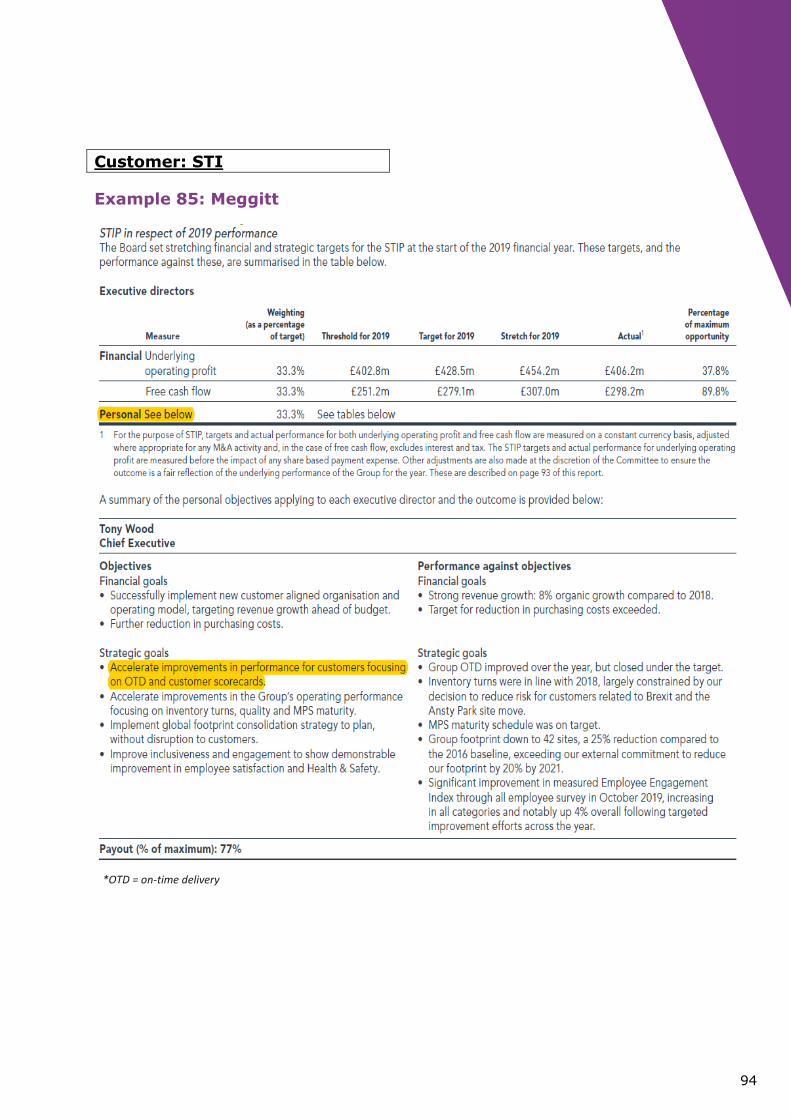
Customer: STI
Example 85: Meggitt
*OTD = on-time delivery
95
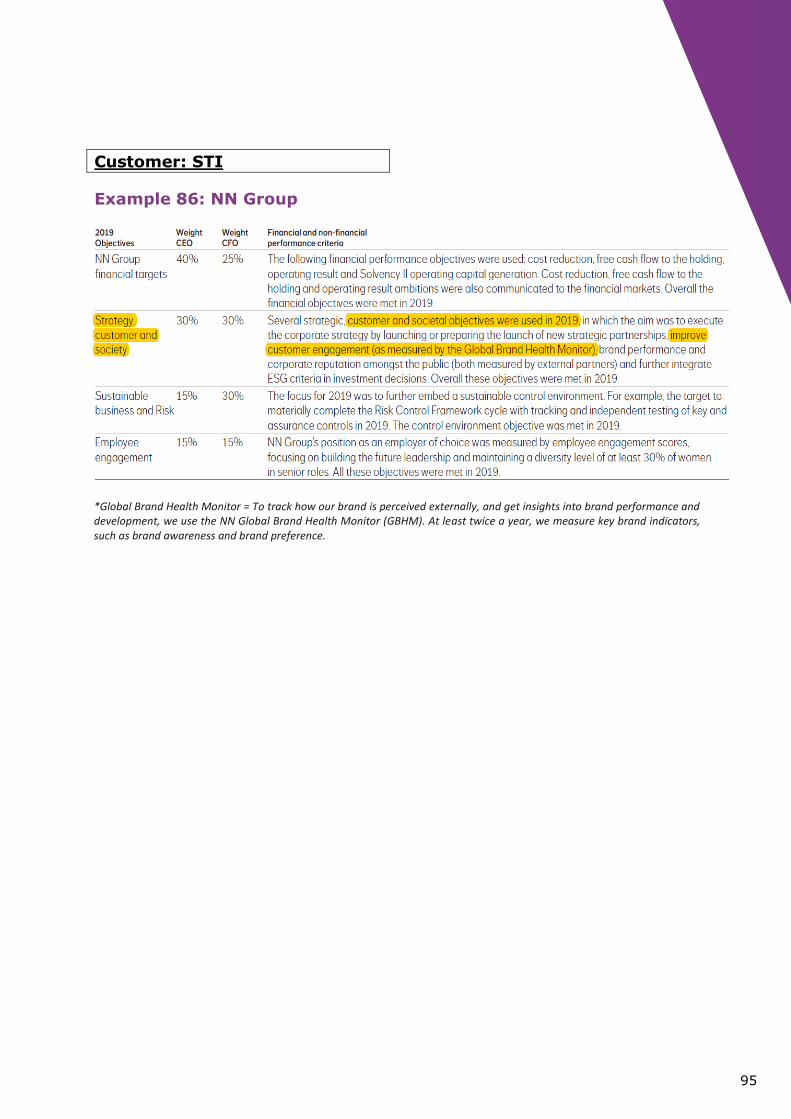
Customer: STI
Example 86: NN Group
*Global Brand Health Monitor = To track how our brand is perceived externally, and get insights into brand performance and development, we use the NN Global Brand Health Monitor (GBHM). At least twice a year, we measure key brand indicators, such as brand awareness and brand preference.
96
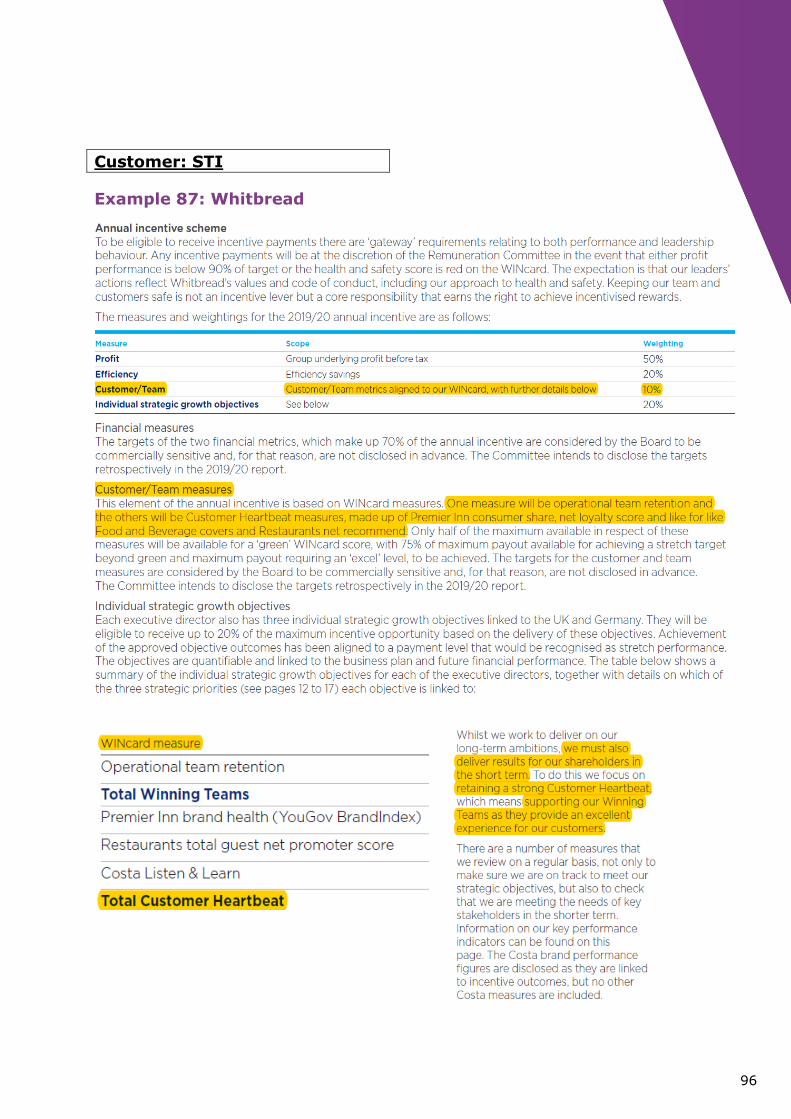
Customer: STI
Example 87: Whitbread
97
Customer: LTI
Example 88: Lloyds Banking
Group
98
Customer: LTI
Example 89: Vonovia
99
Employee: STI
Example 90: VAT Group
100
Employee: STI
Example 91: Novartis
101
Employee: STI
Example 92: Antofagasta
102
Employee: STI
Example 93: Daimler
103
Employee: STI
Example 94: Sodexo
*LTIR = Sodexo’s LTIR is the frequency of accidents per 200,000 hours worked. 200,000 hours worked is a proxy for 100 full time equivalent employees working for a full year.
104
Employee: STI
Example 95: Arcadis
105
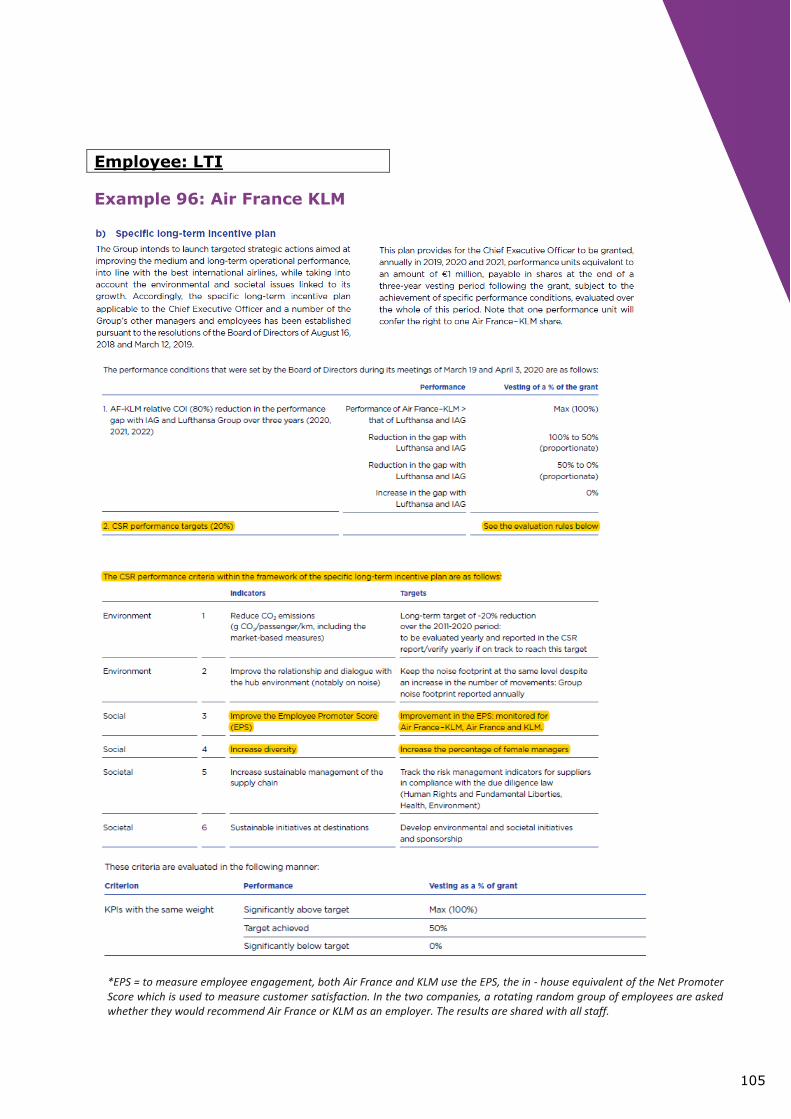
Employee: LTI
Example 96: Air France KLM
*EPS = to measure employee engagement, both Air France and KLM use the EPS, the in - house equivalent of the Net Promoter Score which is used to measure customer satisfaction. In the two companies, a rotating random group of employees are asked whether they would recommend Air France or KLM as an employer. The results are shared with all staff.
106
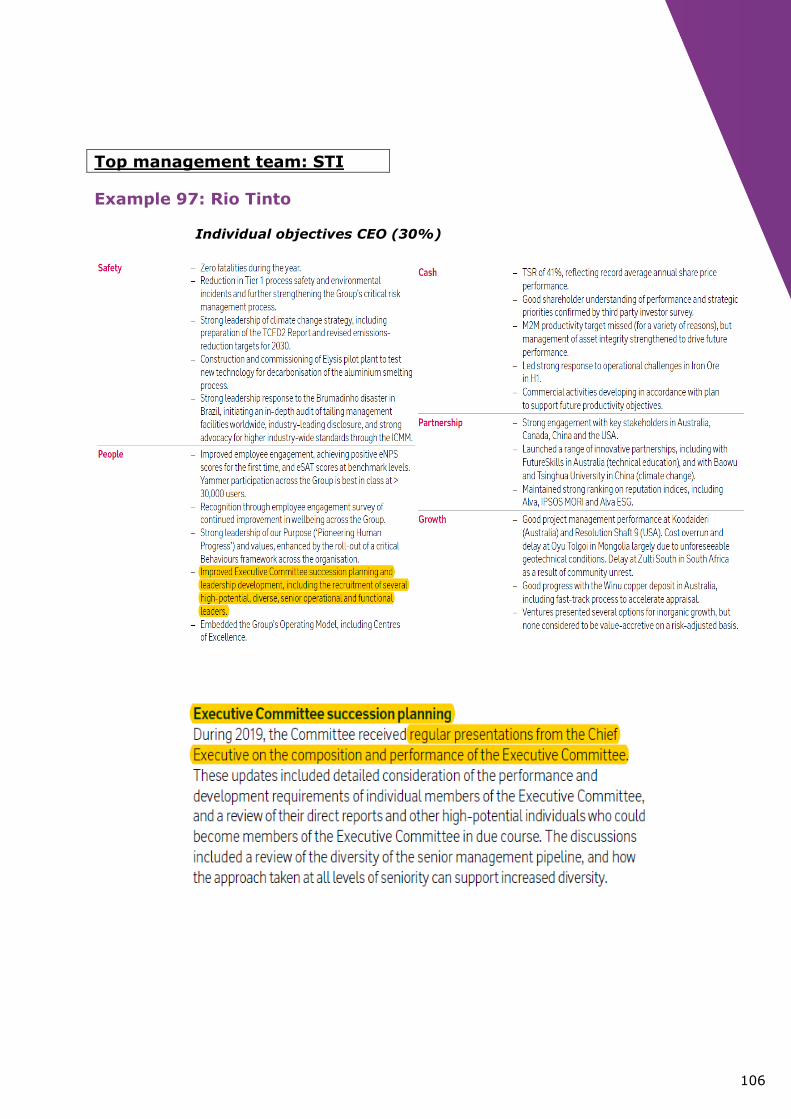
Top management team: STI
Example 97: Rio Tinto
Individual objectives CEO (30%)

107
Top management team: STI
Example 98: Tullow Oil
108
Top management team: STI
Example 99: Danone
109
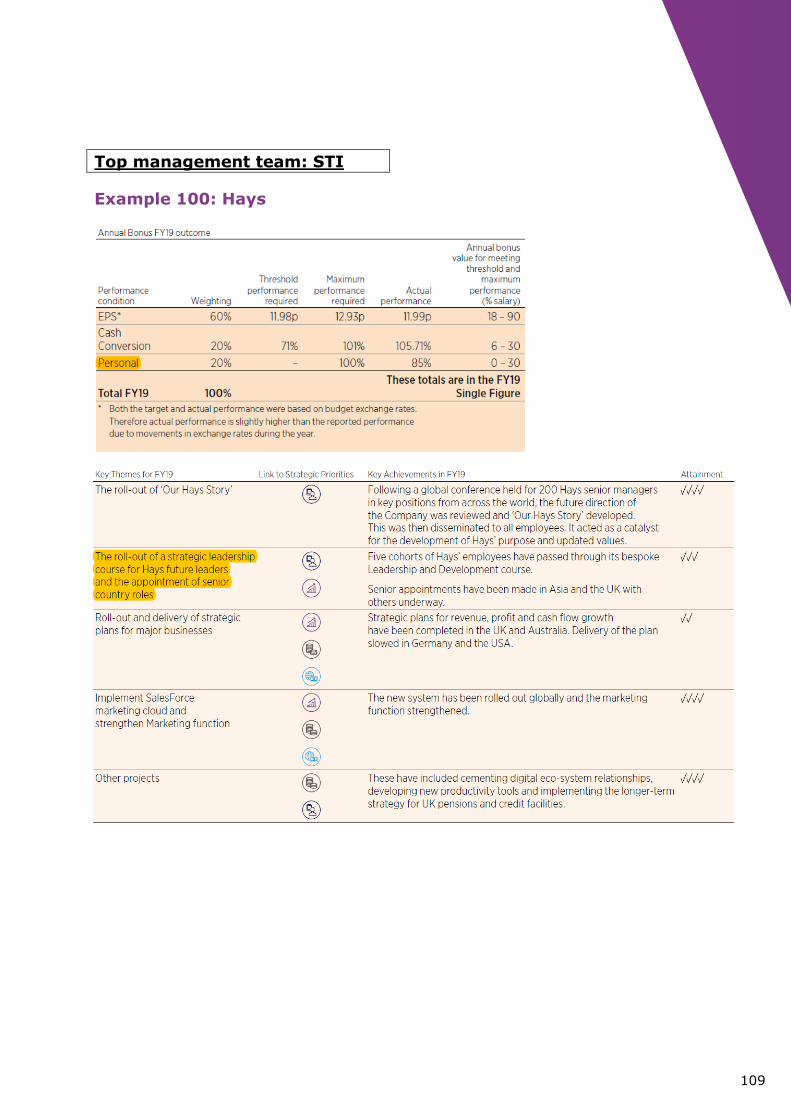
Top management team: STI
Example 100: Hays
110
Top management team: STI
Example 101: Gea
111
Top management team: STI
Example 102: Baloise Holding
112
Top management team: LTI
Example 103: Munich Re
113
Supplier: STI
Example 104: Cineworld Group
Example 105: VAT Group
114
Supplier: STI
Example 106: GlaxoSmithKline
Example 107: Marks & Spencer
115
Supplier: STI
Example 108: RELX
116
• Bennett, B., Bettis, J. C., Gopalan, R., & Milbourn, T. (2017). Compensation goals
and firm performance. Journal of Financial Economics, 124(2), 307-330.
• Economic Value Added. Stern Value Management.
https://sternvaluemanagement.com/economic-value-added-eva
• European Commission. (2019, July). Guidelines on the standardised presentation of
the remuneration report under Directive 2007/36/EC, as amended by Directive (EU)
2017/828, as regards the encouragement of long-term shareholder engagement.
• Gopalan, R., Horn, J., & Milbourn, T. (2017). Comp targets that work. Harvard
Business Review, 95(5), 102-107.
• Ittner, C. D., Larcker, D. F., & Rajan, M. V. (1997). The choice of performance
measures in annual bonus contracts. Accounting Review, 231-255.
• Marr, B. (2012). Key Performance Indicators (KPI): The 75 measures every manager
needs to know. Pearson UK.
• Miller, S. C. (2019, August 16). Incentive Pay Metrics: The Long and the Short of It.
SHRM. https://www.shrm.org/resourcesandtools/hr-
topics/compensation/pages/long-short-incentive-metrics.aspx
• PricewaterhouseCoopers. (2007). Guide to key performance indicators:
Communicating the measures that matter. Retrieved January 4, 2020, from
1316_UK KPI 2007_030907.indd (pwc.com)
• Qontigo. STOXX Europe 600. STOXX. https://www.stoxx.com/index-
details?symbol=SXXP
• Sustainability Accounting Standards Board. (2020). Bases for conclusions & invitation
to comment on exposure drafts. https://www.sasb.org/wp-
content/uploads/2020/08/Invitation-to-Comment-SASB-CF-RoP.pdf
• Vlerick Executive Remuneration Research Centre dataset (STOXX Europe 600)
References
How to cite this paper: Baeten, X., & Van Hove, M. (2021). What to Reward Executives for?
A Taxonomy of Performance Metrics in Executive Incentives Supplemented by an Overview of
Business Practice. Vlerick Business School. http://hdl.handle.net/20.500.12127/6655
License: What to Reward Executives for? A Taxonomy of Performance Metrics in Executive Incentives
Supplemented by an Overview of Business Practice by Xavier, B., & Van Hove, M. is licensed under CC BY-NC-ND
4.0
117
We hereby provide the weblinks to the annual/remuneration reports where the examples
were drawn from (in order of appearance).
Share-based
• Example 1: https://www.schroders.com/en/investor-relations/results-and-reports/annual-report-and-accounts-2019/
• Example 2: https://www.arcadis.com/en/global/investors/publications-presentationsdownload-center/
• Example 3: https://annualreport.pennon-group.co.uk/2019/index.html
Sales
• Example 4: https://www.legrandgroup.com/sites/default/files/Documents_PDF_Legrand/Finance/2020/autres/Legrand-URD_2019_1589441384.pdf
• Example 5: https://www.husqvarnagroup.com/en/report/husqvarna-groups-annual-report-2019 • Example 6: https://www.electrocomponents.com/investors/annual-report-2019
• Example 7: https://www.sika.com/en/annual-report/annual-report-2019.html • Example 8: https://reports.kiongroup.com/2019/ar/
Gross profit
• Example 9: https://www.sunrise.ch/content/dam/sunrise/corporate/documents/ir-reports-presentations/2020/Sunrise_Annual%20Report%202019.pdf
• Example 10: https://www.kindredgroup.com/globalassets/documents/investor-relations-related-
documents/financial-reports/kindred-annual-report-2019-eng.pdf • Example 11: https://www.woodplc.com/annual-report-2019
EBITDA
• Example 12: https://www.orpea-corp.com/images/orpeafinance/pdf/Documentation/EN/2020/ORPEA_URD_2019_UK.pdf
• Example 13: https://ir.deutsche-wohnen.com/download/companies/dewohnen/Annual%20Reports/DW_Annual_Report_2019.pdf
• Example 14: https://www.mondigroup.com/en/investors/results-and-reports/ • Example 15: https://www.se.com/ww/en/about-us/investor-relations/regulatory-
information/annual-reports.jsp • Example 16: https://www.royalmailgroup.com/en/investors/annual-reports/
EBIT
• Example 17: https://fr.elis.com/sites/fr.elis.com/files/2020/04/14/Elis%20-%202019%20Universal%20Registration%20Document.pdf
• Example 18: https://www.pearson.com/content/dam/one-dot-com/one-dot-com/global/standalone/ar2019/2019-ar.pdf
• Example 19: https://www.carrefour.com/sites/default/files/2020-07/Carrefour%20-%20Universal%20Registration%20Document%202019.pdf
• Example 20: https://www.danone.com/content/dam/danone-corp/danone-com/investors/en-all-publications/2019/registrationdocuments/URD_2019_ENG_VA.pdf
• Example 21: https://www.capita.com/sites/g/files/nginej291/files/2020-03/capita-annual-report-2019_0.pdf
• Example 22: https://www.theheinekencompany.com/sites/theheinekencompany/files/Investors/financial-information/results-reports-presentations/heineken-nv-2019-annual-report.pdf
• Example 23: https://www.icagruppen.se/globalassets/3.-investerare/5.-rapporter/arkiv---finansiellt/engelska/2020/02.-annual-report-2019/icagruppen-annual-report-2019.pdf/
References annual/remuneration
reports
https://www.schroders.com/en/investor-relations/results-and-reports/annual-report-and-accounts-2019/

118
Profit before taxes
• Example 24: https://www.man.com/document-archive?name=Corporate+Annual+Report+-+For+the+year+ended+31+December+2019
• Example 25: https://www.burberryplc.com/en/investors/annual-report-19-20.html
Net profit
• Example 26: https://www.relx.com/~/media/Files/R/RELX-Group/documents/reports/annual-reports/2019-annual-report.pdf
• Example 27: https://www.lloydsbankinggroup.com/assets/pdfs/investors/annual-report/2019-download-links/2019_lbg_annual_report.pdf
• Example 28: https://deutsche-boerse.com/dbg-en/investor-relations/financial-reports/annual-
reports/annual-report-2019
Cash flow
• Example 29: https://www.unilever.com/Images/unilever-annual-report-and-accounts-2019_tcm244-547893_en.pdf
• Example 30: https://www.haysplc.com/investors/annual-report-2019
• Example 31: https://www.fergusonplc.com/content/dam/ferguson/corporate/investors_and_media/anual-report/ferguson_plc_annual_report_2019.pdf
• Example 32: https://annualreport2019.naturgy.com/en/?_ga=2.169138470.643344134.1614698550-72736002.1614698550
• Example 33: https://www.diageo.com/en/investors/financial-results-and-presentations/annual-
report-2019/
Relative return
• Example 34: https://assets.new.siemens.com/siemens/assets/api/uuid:0389873c-aed9-444d-9780-4b14b1b7ce57/2019-annual-report.pdf
• Example 35: https://investors.intertek.com/assets/pdf/Intertek-AR-2019-full-WEB.pdf • Example 36: https://www.valeo.com/wp-content/uploads/2020/06/2019-Integrated-Report.pdf
• Example 37: https://www.scor.com/sites/default/files/scor_universal_registration_document_2019.pdf
Cost
• Example 38: https://www.oldmutual.com/investor-relations/2019-annual-results • Example 39 + 40:
https://www.about.sainsburys.co.uk/~/media/Files/S/Sainsburys/documents/reports-and-
presentations/annual-reports/sainsburys-ar2019.pdf
Debt
• Example 41: https://www.total.com/sites/g/files/nytnzq111/files/atoms/files/2019_total_universal_registration_document.pdf
• Example 42: https://www.oci.nl/media/1779/oci-annual-report-2019.pdf • Example 43: https://www.ashtead-group.com/files/downloads/reports/ashtead-ara-2019.pdf
Economic profit
• Example 44: https://www.jeronimomartins.com/wp-content/uploads/01-DOCUMENTS/Investor/Reports/AnnualReportJeronimoMartins2019.pdf
• Example 45: https://www.spectris.com/sites/spectris-corp/files/report/2019/annual-report-
2019.pdf
119
• Example 46: https://www.juliusbaer.com/fileadmin/about/Julius_Baer_Foundation_Annual_Report_2019_Web.pdf
• Example 47: https://www.lloydsbankinggroup.com/assets/pdfs/investors/annual-report/2019-
download-links/2019_lbg_annual_report.pdf • Example 48:
https://ucpcdn.thyssenkrupp.com/_legacy/UCPthyssenkruppAG/assets.files/media/investoren/berichterstattung-publikationen/update-21.11.2019/en/thyssenkrupp-gb-2018-2019-en-web_neu.pdf
Strategy
• Example 49: https://www.haysplc.com/investors/annual-report-2019
• Example 50: https://www.aegon.com/about/integrated-annual-report-2019/
• Example 51: https://www.recordati.com/resources/Pubblicazione/___eb9a60f3bad5457a9b3ebf9813dc19e1_/annual-report-2019.pdf
• Example 52: https://www.nn-group.com/nn-group/file?uuid=55caeb72-5699-4d50-b540-d191328f5880&owner=84c25534-c28a-4a64-9c78-5cc1388e4766&contentid=10852
• Example 53: https://www.whitbread.co.uk/~/media/Files/W/Whitbread/report-and%20presentations/2019/Whitbread_18-19%20Full%20Report_Final_Final.pdf
• Example 54: https://report.partnersgroup.com/2019/app/uploads/Annual_Report_2019_Web.pdf
Innovation
• Example 55: https://www.imiplc.com/sites/imi-corp/files/2020/annualreport-2019.pdf • Example 56: https://av.sc.com/corp-en/content/docs/standard-chartered-plc-full-year-2019-
report.pdf • Example 57: https://investors.capgemini.com/en/publication/2019-universal-registration-
document/ • Example 58: https://www.eutelsat.com/files/PDF/fr/investisseurs/ETL%20COM_URD%202018-
19_UK_web.pdf • Example 59: https://www.asml.com/en/investors/annual-report/2019 • Example 60: https://reports.kiongroup.com/2019/ar/
Legal and compliance
• Example 61: https://www.valeo.com/wp-content/uploads/2020/06/2019-Integrated-Report.pdf • Example 62:
https://www.teleperformanceinvestorrelations.com/media/5470402/Teleperformance-2019-Universal-registration-document.pdf
• Example 63: https://www.investec.com/content/dam/investor-relations/financial-information/group-financial-results/2019/investec-dlc-vol-1-annual-report-2019.pdf
Risk management and internal control
• Example 64: https://www.aviva.com/investors/annual-report-2019/
• Example 65: https://www.relx.com/~/media/Files/R/RELX-Group/documents/reports/annual-reports/2019-annual-report.pdf
• Example 66: https://www.quilter.com/siteassets/quilter/investor-relations/reporting-centre/reports/quilter_ar_2019.pdf
• Example 67: https://www.bhp.com/investor-centre/annual-report-2019/ • Example 68: https://www.antofagasta.co.uk/investors/annual-report-2019/ • Example 69: https://home.barclays/investor-relations/reports-and-events/annual-reports/annual-
report-2019/
Quality and efficiency
• Example 70: https://reports.shell.com/annual-report/2019/
120
• Example 71: https://www.cnp.fr/cnp/content/download/8837/file/CNP%20Assurances%20URD%202019%20English%20Version.pdf?inLanguage=eng-GB
• Example 72: https://www.societegenerale.com/sites/default/files/documents/2020-
10/sg_urd_eng_2020.pdf • Example 73: https://www.spectris.com/sites/spectris-corp/files/report/2019/annual-report-
2019.pdf • Example 74: https://www.iggroup.com/sites/ig-group/files/fy19-ig-annual-report.pdf
Sustainability index
• Example 75: https://www.se.com/ww/en/about-us/investor-relations/regulatory-
information/annual-reports.jsp
• Example 76: https://download.terna.it/terna/TERNA_INTEGRATO_2019_ENG_8d7e862fd8fb0a9.pdf
Environment
• Example 77: https://www.vinci.com/publi/vinci/2019-vinci-annual-report.pdf
• Example 78: https://www.sbmoffshore.com/wp-content/uploads/2020/02/SBM-Offshore_Annual-Report-2019.pdf
• Example 79: https://www.yara.com/siteassets/investors/057-reports-and-presentations/annual-reports/2019/yara-annual-report-2019-web.pdf/
• Example 80: https://www.tullowoil.com/application/files/5815/8636/0065/2019_Annual_Report_and_Accounts.pdf
• Example 81: https://www.signify.com/static/2019/signify-annual-report-2019.pdf
Customer
• Example 82: https://www.santander.com/en/shareholders-and-investors/financial-and-economic-information/annual-report/2019-online-report#santander-bank-s-2019
• Example 83: https://www.rsagroup.com/investors/reports/annual-report-2019/ • Example 84: https://landsec.com/annual-report-2019
• Example 85: https://www.meggitt.com/wp-content/uploads/2020/03/Meggitt_Annual_Report_and_Accounts_2019.pdf
• Example 86: https://www.nn-group.com/nn-group/file?uuid=55caeb72-5699-4d50-b540-d191328f5880&owner=84c25534-c28a-4a64-9c78-5cc1388e4766&contentid=10852
• Example 87: https://www.whitbread.co.uk/~/media/Files/W/Whitbread/report-and%20presentations/2019/Whitbread_18-19%20Full%20Report_Final_Final.pdf
• Example 88: https://www.lloydsbankinggroup.com/assets/pdfs/investors/annual-report/2019-download-links/2019_lbg_annual_report.pdf
• Example 89: https://reports.vonovia.de/2019/annual-report/
Employee
• Example 90: https://ir.vatvalve.com/ar2019/home.html • Example 91: https://www.novartis.com/sites/www.novartis.com/files/novartis-annual-report-
2019.pdf • Example 92: https://www.antofagasta.co.uk/investors/annual-report-2019/ • Example 93: https://www.daimler.com/documents/investors/reports/annual-
report/daimler/daimler-ir-annual-report-2019-incl-combined-management-report-daimler-ag.pdf • Example 94: https://www.sodexo.com/files/live/sites/sdxcom-
global/files/PDF/Finance/20191121_Sodexo-Fiscal-2019-Universal-Registration-Document_EN.pdf • Example 95: https://www.arcadis.com/en/global/investors/publications-presentationsdownload-
center/ • Example 96: https://www.airfranceklm.com/en/publications/universal-registration-document-
2019
121
Top management team
• Example 97: https://www.riotinto.com/-/media/Content/Documents/Invest/Reports/Annual-reports/RT-Annual-report-financial-statements-2019.pdf
• Example 98:
https://www.tullowoil.com/application/files/5815/8636/0065/2019_Annual_Report_and_Accounts.pdf
• Example 99: https://www.danone.com/content/dam/danone-corp/danone-com/investors/en-all-publications/2019/registrationdocuments/URD_2019_ENG_VA.pdf
• Example 100: https://www.haysplc.com/investors/annual-report-2019 • Example 101: https://www.gea.com/nl/binaries/gea-annual-report-2019_tcm26-66349.pdf • Example 102: https://www.baloise.com/dam/baloise-
com/documents/de/publikationen/jahresabschluss/2019/annual-report-baloise-group-2019.pdf • Example 103: https://www.munichre.com/content/dam/munichre/mrwebsiteslaunches/2019-
annual-report/MunichRe-Group-Annual-Report-2019-en.pdf/_jcr_content/renditions/original./MunichRe-Group-Annual-Report-2019-en.pdf
Supplier
• Example 104: https://www.cineworldplc.com/sites/cineworld-plc/files/2020-03/cineworld-ar2019.pdf
• Example 105: https://ir.vatvalve.com/ar2019/home.html • Example 106: https://www.gsk.com/media/5894/annual-report.pdf • Example 107: https://corporate.marksandspencer.com/documents/msar-2019/full-annual-
report.pdf • Example 108: https://www.relx.com/~/media/Files/R/RELX-Group/documents/reports/annual-
reports/2019-annual-report.pdf
122
Hungry for more? Contact us!
The Executive Remuneration Research Centre (ERRC) is a knowledge-driven network
in the field of executive reward management. The centre’s main topics of interest
include:
• Strategic alignment of executive rewards
• Sustainable executive rewards
• Transparency & disclosure on executive reward
• Stakeholder engagement on executive reward
• Behavioural outcomes of executive reward
The centre is grateful to Deloitte, its Prime Foundation Partner, and its research
members.
For more information, please contact:
XAVIER BAETEN
Professor in Reward & Sustainability
T: + 32 9 210 98 97
ANGIE VAN STEERTHEM
Senior Researcher & Coordinator Vlerick Reward Centre
T: + 32 9 210 97 38
WWW.VLERICK.COM/ERRC

123