A systematic comparison reveals substantial differences in ...
17
A systematic comparison reveals substantial differences in chromosomal versus episomal encoding of enhancer activity Fumitaka Inoue, 1,7 Martin Kircher, 2,7 Beth Martin, 2 Gregory M. Cooper, 3 Daniela M. Witten, 4 Michael T. McManus, 5 Nadav Ahituv, 1 and Jay Shendure 2,6 1 Department of Bioengineering and Therapeutic Sciences, Institute for Human Genetics, University of California San Francisco, San Francisco, California 94158, USA; 2 Department of Genome Sciences, University of Washington, Seattle, Washington 98195, USA; 3 HudsonAlpha Institute for Biotechnology, Huntsville, Alabama 35806, USA; 4 Departments of Statistics and Biostatistics, University of Washington, Seattle, Washington 98195, USA; 5 Department of Microbiology and Immunology, UCSF Diabetes Center, Keck Center for Noncoding RNA, University of California, San Francisco, San Francisco, California 94143, USA; 6 Howard Hughes Medical Institute, Seattle, Washington 98195, USA Candidate enhancers can be identified on the basis of chromatin modifications, the binding of chromatin modifiers and transcription factors and cofactors, or chromatin accessibility. However, validating such candidates as bona fide enhanc- ers requires functional characterization, typically achieved through reporter assays that test whether a sequence can increase expression of a transcriptional reporter via a minimal promoter. A longstanding concern is that reporter as- says are mainly implemented on episomes, which are thought to lack physiological chromatin. However, the magnitude and determinants of differences in cis-regulation for regulatory sequences residing in episomes versus chromosomes remain almost completely unknown. To address this systematically, we developed and applied a novel lentivirus-based massively parallel reporter assay (lentiMPRA) to directly compare the functional activities of 2236 candidate liver en- hancers in an episomal versus a chromosomally integrated context. We find that the activities of chromosomally inte- grated sequences are substantially different from the activities of the identical sequences assayed on episomes, and furthermore are correlated with different subsets of ENCODE annotations. The results of chromosomally based report- er assays are also more reproducible and more strongly predictable by both ENCODE annotations and sequence-based models. With a linear model that combines chromatin annotations and sequence information, we achieve a Pearson’s R 2 of 0.362 for predicting the results of chromosomally integrated reporter assays. This level of prediction is better than with either chromatin annotations or sequence information alone and also outperforms predictive models of epi- somal assays. Our results have broad implications for how cis-regulatory elements are identified, prioritized and func- tionally validated. [Supplemental material is available for this article.] An enhancer is defined as a short region of DNA that can increase the expression of a gene, independent of its orientation and flexi- ble with respect to its position relative to the transcriptional start site (Banerji et al. 1981; Moreau et al. 1981). Enhancers are thought to be modular, in the sense that they are active in heterologous se- quence contexts and in that multiple enhancers may additively dictate the overall expression pattern of a gene (Shlyueva et al. 2014). They act through the binding of transcription factors, which recruit histone modifying factors, such as histone acetyl- transferase (HAT) or histone methyltransferase (HMT). Enhancers are also associated with chromatin remodeling factors (e.g., SWI/ SNF) and the cohesin complex, which are involved in regulating chromatin structure and accessibility (Schmidt et al. 2010; Euskirchen et al. 2011; Faure et al. 2012). Antibodies against specific transcription factors (TFs), histone modifications or transcriptional coactivators are commonly used for chromatin immunoprecipitation followed by massively parallel sequencing (ChIP-seq) to identify candidate enhancers in a genome-wide manner. For example, the ENCODE Project Consor- tium and other efforts have identified thousands of candidate en- hancers in mammalian genomes on the basis of such marks or their correlates (e.g., EP300 ChIP-seq, H3K27ac ChIP-seq, and DNase I hypersensitivity) in diverse cell lines and tissues (Visel et al. 2009; The ENCODE Project Consortium 2012). However, a ma- jor limitation of such assays is that they reflect biochemical marks that are correlated with enhancer activity, rather than directly showing that any particular sequence actually functions as an en- hancer. In other words, although such assays yield genome-wide catalogs of potential enhancers, they do not definitively predict bona fide enhancers nor precisely define their boundaries. For decades, the primary means of functionally validat- ing enhancers has been the episomal reporter assay. The standard 7 These authors contributed equally to this work. Corresponding authors: [email protected], [email protected] Article published online before print. Article, supplemental material, and publi- cation date are at http://www.genome.org/cgi/doi/10.1101/gr.212092.116. © 2017 Inoue et al. This article is distributed exclusively by Cold Spring Harbor Laboratory Press for the first six months after the full-issue publication date (see http://genome.cshlp.org/site/misc/terms.xhtml). After six months, it is avail- able under a Creative Commons License (Attribution-NonCommercial 4.0 Inter- national), as described at http://creativecommons.org/licenses/by-nc/4.0/. Research 27:1–15 Published by Cold Spring Harbor Laboratory Press; ISSN 1088-9051/17; www.genome.org Genome Research 1 www.genome.org Cold Spring Harbor Laboratory Press on April 19, 2022 - Published by genome.cshlp.org Downloaded from Cold Spring Harbor Laboratory Press on April 19, 2022 - Published by genome.cshlp.org Downloaded from Cold Spring Harbor Laboratory Press on April 19, 2022 - Published by genome.cshlp.org Downloaded from
-
Upload
khangminh22 -
Category
Documents
-
view
2 -
download
0
Transcript of A systematic comparison reveals substantial differences in ...
A systematic comparison reveals substantialdifferences in chromosomal versus episomal encodingof enhancer activity
Fumitaka Inoue,1,7 Martin Kircher,2,7 Beth Martin,2 Gregory M. Cooper,3
Daniela M. Witten,4 Michael T. McManus,5 Nadav Ahituv,1 and Jay Shendure2,61Department of Bioengineering and Therapeutic Sciences, Institute for Human Genetics, University of California San Francisco,San Francisco, California 94158, USA; 2Department of Genome Sciences, University of Washington, Seattle, Washington 98195,USA; 3HudsonAlpha Institute for Biotechnology, Huntsville, Alabama 35806, USA; 4Departments of Statistics and Biostatistics,University of Washington, Seattle, Washington 98195, USA; 5Department of Microbiology and Immunology, UCSF Diabetes Center,Keck Center for Noncoding RNA, University of California, San Francisco, San Francisco, California 94143, USA; 6Howard HughesMedical Institute, Seattle, Washington 98195, USA
Candidate enhancers can be identified on the basis of chromatin modifications, the binding of chromatin modifiers and
transcription factors and cofactors, or chromatin accessibility. However, validating such candidates as bona fide enhanc-
ers requires functional characterization, typically achieved through reporter assays that test whether a sequence can
increase expression of a transcriptional reporter via a minimal promoter. A longstanding concern is that reporter as-
says are mainly implemented on episomes, which are thought to lack physiological chromatin. However, the magnitude
and determinants of differences in cis-regulation for regulatory sequences residing in episomes versus chromosomes
remain almost completely unknown. To address this systematically, we developed and applied a novel lentivirus-based
massively parallel reporter assay (lentiMPRA) to directly compare the functional activities of 2236 candidate liver en-
hancers in an episomal versus a chromosomally integrated context. We find that the activities of chromosomally inte-
grated sequences are substantially different from the activities of the identical sequences assayed on episomes, and
furthermore are correlated with different subsets of ENCODE annotations. The results of chromosomally based report-
er assays are also more reproducible and more strongly predictable by both ENCODE annotations and sequence-based
models. With a linear model that combines chromatin annotations and sequence information, we achieve a Pearson’s
R2 of 0.362 for predicting the results of chromosomally integrated reporter assays. This level of prediction is better
than with either chromatin annotations or sequence information alone and also outperforms predictive models of epi-
somal assays. Our results have broad implications for how cis-regulatory elements are identified, prioritized and func-
tionally validated.
[Supplemental material is available for this article.]
An enhancer is defined as a short region of DNA that can increasethe expression of a gene, independent of its orientation and flexi-ble with respect to its position relative to the transcriptional startsite (Banerji et al. 1981;Moreau et al. 1981). Enhancers are thoughtto be modular, in the sense that they are active in heterologous se-quence contexts and in that multiple enhancers may additivelydictate the overall expression pattern of a gene (Shlyueva et al.2014). They act through the binding of transcription factors,which recruit histone modifying factors, such as histone acetyl-transferase (HAT) or histone methyltransferase (HMT). Enhancersare also associated with chromatin remodeling factors (e.g., SWI/SNF) and the cohesin complex, which are involved in regulatingchromatin structure and accessibility (Schmidt et al. 2010;Euskirchen et al. 2011; Faure et al. 2012).
Antibodies against specific transcription factors (TFs), histonemodifications or transcriptional coactivators are commonly used
for chromatin immunoprecipitation followedbymassively parallelsequencing (ChIP-seq) to identify candidate enhancers in agenome-wide manner. For example, the ENCODE Project Consor-tium and other efforts have identified thousands of candidate en-hancers in mammalian genomes on the basis of such marks ortheir correlates (e.g., EP300 ChIP-seq, H3K27ac ChIP-seq, andDNase I hypersensitivity) in diverse cell lines and tissues (Viseletal.2009;TheENCODEProjectConsortium2012).However,ama-jor limitation of such assays is that they reflect biochemical marksthat are correlated with enhancer activity, rather than directlyshowing that any particular sequence actually functions as an en-hancer. In other words, although such assays yield genome-widecatalogs of potential enhancers, they do not definitively predictbona fide enhancers nor precisely define their boundaries.
For decades, the primary means of functionally validat-ing enhancers has been the episomal reporter assay. The standard
7These authors contributed equally to this work.Corresponding authors: [email protected], [email protected] published online before print. Article, supplemental material, and publi-cation date are at http://www.genome.org/cgi/doi/10.1101/gr.212092.116.
© 2017 Inoue et al. This article is distributed exclusively by Cold Spring HarborLaboratory Press for the first six months after the full-issue publication date (seehttp://genome.cshlp.org/site/misc/terms.xhtml). After six months, it is avail-able under a Creative Commons License (Attribution-NonCommercial 4.0 Inter-national), as described at http://creativecommons.org/licenses/by-nc/4.0/.
Research
27:1–15 Published by Cold Spring Harbor Laboratory Press; ISSN 1088-9051/17; www.genome.org Genome Research 1www.genome.org
Cold Spring Harbor Laboratory Press on April 19, 2022 - Published by genome.cshlp.orgDownloaded from Cold Spring Harbor Laboratory Press on April 19, 2022 - Published by genome.cshlp.orgDownloaded from Cold Spring Harbor Laboratory Press on April 19, 2022 - Published by genome.cshlp.orgDownloaded from
approach is to relocate the candidate enhancer sequence to anepisomal vector, adjacent to a minimal promoter driving expres-sion of a reporter gene, e.g., luciferase or others. More recently,massively parallel reporter assays (MPRAs) have enabled the func-tional characterization of cis-regulatory elements, including en-hancers, in a high-throughput manner. MPRAs use sequencing-based quantification of reporter barcodes to enable multiplexingof the reporter assay (Patwardhan et al. 2009). MPRAs have beenused primarily in an episomal manner for the saturation muta-genesis of promoters and enhancers (Patwardhan et al. 2009,2012; Kinney et al. 2010; Melnikov et al. 2012), for exploringthe grammatical rules of promoters and enhancers (Smith et al.2013; Sharon et al. 2014), and for testing thousands of enhancercandidates in different cells or tissues (Kwasnieski et al. 2012;Arnold et al. 2013, 2014; Kheradpour et al. 2013; Shlyuevaet al. 2014; Savic et al. 2015; White 2015). Adeno-associatedvirus (AAV) MPRAs have also been developed, allowing these as-says to be carried out in vivo and to perform reporter assays with-in target cells and tissues that are difficult to transduce, such asthe brain (Shen et al. 2016), although these do not involve geno-mic integration.
Despite their widespread use to validate enhancers and othercis-regulatory elements, a longstanding concern about reporterassays is that they are almost always carried out via transient trans-fection of nonintegrating episomes. It is unknown whether tran-siently transfected sequences are chromatinized in a way thatmakes them appropriate models for endogenous gene expressionfrom chromosomes (Smith and Hager 1997), but to the extentthat this question has been explored, there are differences. For ex-ample, work from Archer, Hager, and colleagues, using the mousemammary tumor virus (MMTV) promoter as a model, shows dif-ferences in histone H1 stoichiometry and nucleosome positioningresulting in an inability of episomal assays to reliably assay cooper-ative TF binding (Archer et al. 1992; Smith andHager 1997;Hebbarand Archer 2007, 2008). In other work, the chromatin structure oftransiently transfected nonreplicating plasmid DNA was observedto be differently fragmented than endogenous chromatin by mi-crococcal nuclease and, along with other data, supports a modelin which atypical chromatin might be induced by association ofepisomes with nuclear structures (Jeong and Stein 1994).However, the extent to which these factors operate to confoundthe results of reporter assays performed for enhancer validation,whether categorical (i.e., is a particular sequence an enhancer?),qualitative (i.e., in what tissues is an element an enhancer?), orquantitative (i.e., what level of activation does a particular se-quence confer?), has yet to be systematically investigated.
To address these questions, we developed lentiviral MPRA(lentiMPRA), a technology that uses lentivirus to integrate enhanc-er MPRA libraries into the genome. To overcome the substantialposition-effect variegation observed by others in attempting touse lentiviral infection for MPRA (Murtha et al. 2014), we used aflanking antirepressor element (#40) and a scaffold-attached region(SAR) (Klehr et al. 1991; Kwaks et al. 2003) on either side of ourconstruct. In addition, we relied on as many as 100 independentreporter barcode sequences per assayed candidate enhancer se-quence, integrated at diverse sites. The resulting system allowsfor high-throughput, highly reproducible, and quantitative mea-surement of the regulatory potential of candidate enhancers in achromosomally integrated context. Furthermore, the cell-typerange of lentivirus transduction is much broader than transfec-tion, e.g., permitting MPRAs to be conducted in neurons, primarycells, or organoids.
Results
Construction and validation of the lentiMPRA vector
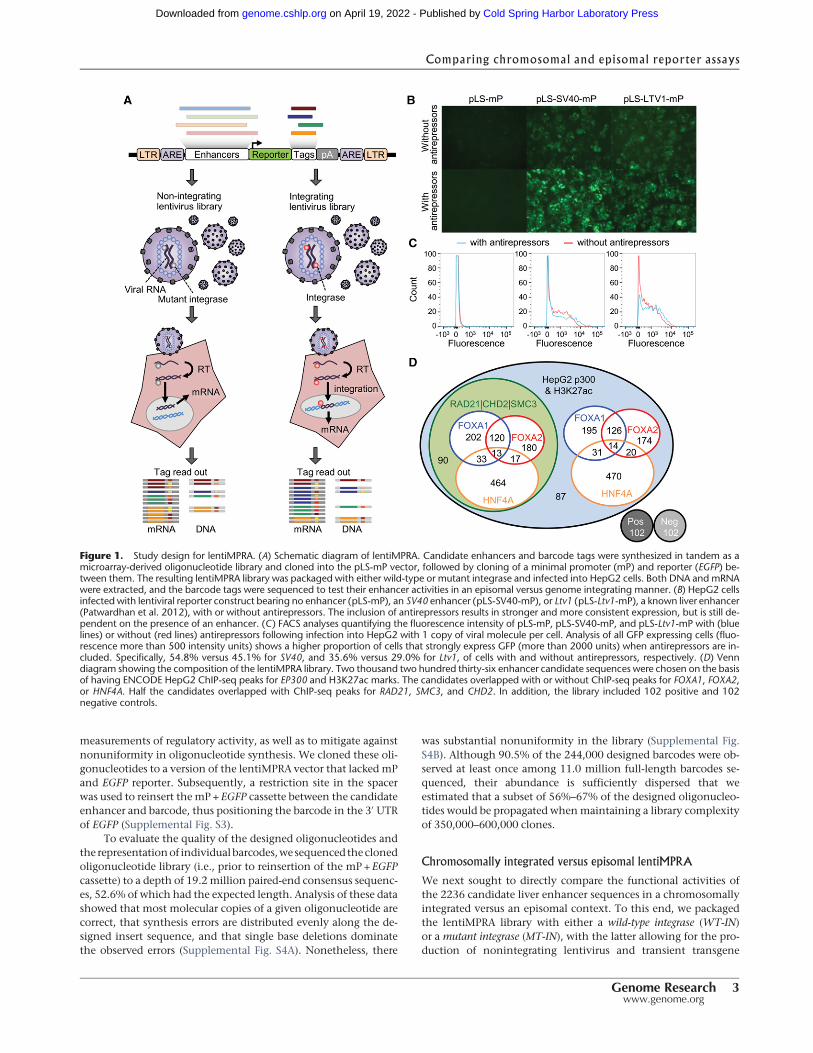
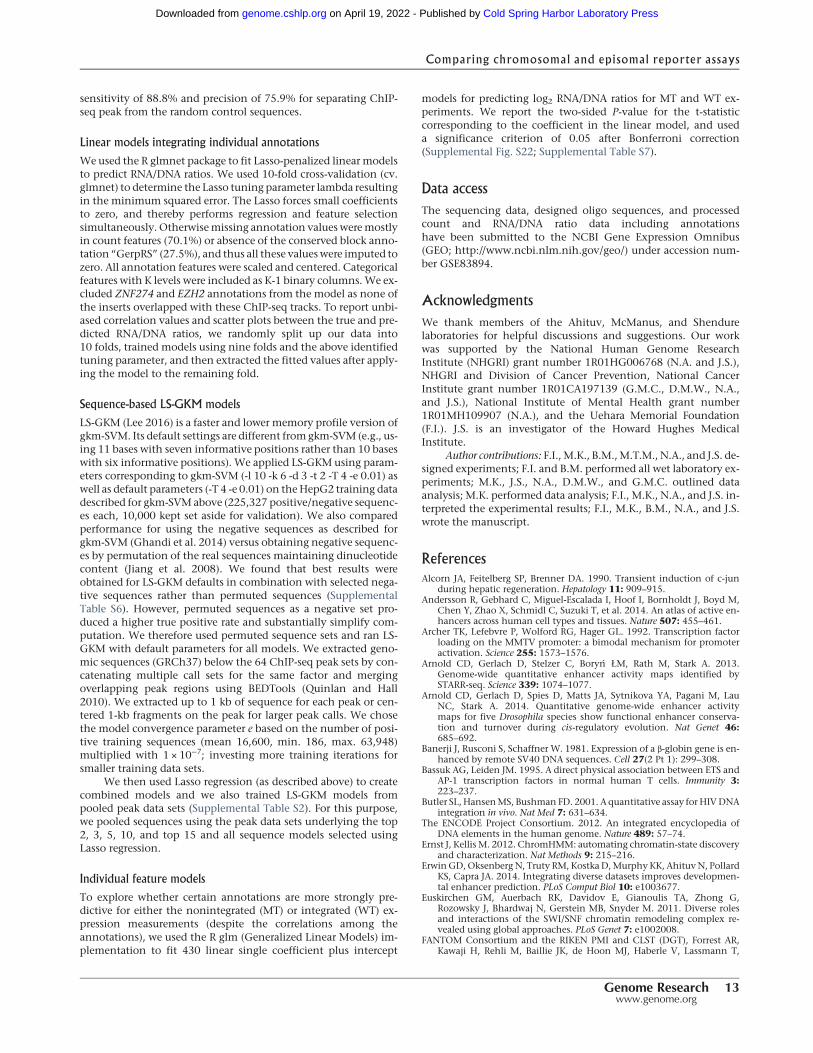
The potential for confounding of lentiviral assays by site-of-inte-gration effects was demonstrated by a recent MPRA study thatused lentiviral infection and found that 26% of positive controlsdid not show activatedGFP expression, whereas othermeasures es-timated a false positive rate of 22% (Murtha et al. 2014). We there-fore constructed a lentiviral vector (pLS-mP) that contains aminimal promoter (mP) and the enhanced green fluorescent pro-tein (EGFP) gene flanked on one side by the antirepressor element#40 and the other by a SAR (Fig. 1A; Supplemental File 1; Klehret al. 1991; Kwaks et al. 2003; Kissler et al. 2006). In experimentsinvolving chromosomal integration of this enhancer reporter,we confirmed that EGFP is not expressed in the absence of anenhancer, although abundantly expressed under the controlSV40 enhancer across a panel of cell lines representing diverse tis-sues-of-origin. These include K562 (lymphoblasts), H1-ESC (em-bryonic stem cells), HeLa-S3 (cervix), HepG2 (hepatocytes), T-47D (epithelial), and Sk-n-sh retinoic acid treated (neuronal) cells(Supplemental Fig. S1). Furthermore, when SV40 and the Ltv1 liverenhancer (Patwardhan et al. 2012) are tested without the flankingantirepressor sequences, we observed much lower levels of EGFPexpression in HepG2 cells (Fig. 1B). FACS analysis showed thatthe inclusion of antirepressors increased the proportion of the cellsthat strongly express GFP (Fig. 1C). This result was consistent withour expectation that the antirepressors facilitate robust enhancer-mediated expression from the integrated reporter.
Design and construction of a library of candidate liver enhancers
To evaluate lentiMPRA, we designed a liver enhancer library thatcomprises 2236 candidate sequences and 204 control sequences(Fig. 1D; Supplemental File 2), each 171 bp in length. All enhancercandidate sequences were chosen on the basis of having ENCODEHepG2 ChIP-seq peaks for EP300 and H3K27ac, which aregenerally indicative of enhancer function (Heintzman et al.2007; Visel et al. 2009). A subset of candidates (“type 1”) were cen-tered at ChIP-seq peaks for forkhead box A1 (FOXA1) or FOXA2,known liver pioneer transcription factors (Lupien et al. 2008) or he-patocyte nuclear factor 4 alpha (HNF4A), a nuclear receptor involvedin lipid metabolism and gluconeogenesis (Watt et al. 2003), whilealso overlapping with ENCODE-derived ChIP-seq peaks for thecohesin complex (RAD21 and SMC3) or chromodomain helicaseDNA binding protein 2 (CHD2), a chromatin remodeler that is partof the SWI/SNF complex. Other subsets of candidates were re-quired to overlap only a liver transcription factor peak (“type2”), only a chromatin remodeler peak (“type 3”), or neither(“type 4”). The 204 control sequences comprised 200 syntheticallydesigned controls from a previous study (synthetic regulatory ele-ment sequences [SRESs]; 100 positive and 100 negative) (Smithet al. 2013) and an additional two positive (pos1 and pos2) andtwonegative endogenous controls (neg1 andneg2).We confirmedby standard luciferase reporter assay that pos1 and pos2 showedweak and strong enhancer activity, respectively, whereas neg1and neg2 showed no activity (Supplemental Fig. S2).
Each of the 2440 enhancer candidates or controls was synthe-sized in ciswith 100 unique reporter barcodes on a 244,000-featuremicroarray (Agilent OLS; 15 bp primer + 171 bp enhancer candi-date or control + 14 bp spacer + 15 bp barcode + 15 bp primer =230mers). The purpose of encoding a large number of barcodes perassayed sequence was to facilitate reproducible and quantitative
Inoue et al.
2 Genome Researchwww.genome.org
Cold Spring Harbor Laboratory Press on April 19, 2022 - Published by genome.cshlp.orgDownloaded from
measurements of regulatory activity, as well as to mitigate againstnonuniformity in oligonucleotide synthesis. We cloned these oli-gonucleotides to a version of the lentiMPRA vector that lacked mPand EGFP reporter. Subsequently, a restriction site in the spacerwas used to reinsert the mP + EGFP cassette between the candidateenhancer and barcode, thus positioning the barcode in the 3′ UTRof EGFP (Supplemental Fig. S3).
To evaluate the quality of the designed oligonucleotides andthe representationof individualbarcodes,wesequencedtheclonedoligonucleotide library (i.e., prior to reinsertion of the mP + EGFPcassette) to a depth of 19.2 million paired-end consensus sequenc-es, 52.6% of which had the expected length. Analysis of these datashowed that most molecular copies of a given oligonucleotide arecorrect, that synthesis errors are distributed evenly along the de-signed insert sequence, and that single base deletions dominatethe observed errors (Supplemental Fig. S4A). Nonetheless, there
was substantial nonuniformity in the library (Supplemental Fig.S4B). Although 90.5% of the 244,000 designed barcodes were ob-served at least once among 11.0 million full-length barcodes se-quenced, their abundance is sufficiently dispersed that weestimated that a subset of 56%–67% of the designed oligonucleo-tides would be propagated whenmaintaining a library complexityof 350,000–600,000 clones.
Chromosomally integrated versus episomal lentiMPRA
We next sought to directly compare the functional activities ofthe 2236 candidate liver enhancer sequences in a chromosomallyintegrated versus an episomal context. To this end, we packagedthe lentiMPRA library with either a wild-type integrase (WT-IN)or a mutant integrase (MT-IN), with the latter allowing for the pro-duction of nonintegrating lentivirus and transient transgene
Figure 1. Study design for lentiMPRA. (A) Schematic diagram of lentiMPRA. Candidate enhancers and barcode tags were synthesized in tandem as amicroarray-derived oligonucleotide library and cloned into the pLS-mP vector, followed by cloning of a minimal promoter (mP) and reporter (EGFP) be-tween them. The resulting lentiMPRA library was packaged with either wild-type or mutant integrase and infected into HepG2 cells. Both DNA and mRNAwere extracted, and the barcode tags were sequenced to test their enhancer activities in an episomal versus genome integrating manner. (B) HepG2 cellsinfected with lentiviral reporter construct bearing no enhancer (pLS-mP), an SV40 enhancer (pLS-SV40-mP), or Ltv1 (pLS-Ltv1-mP), a known liver enhancer(Patwardhan et al. 2012), with or without antirepressors. The inclusion of antirepressors results in stronger and more consistent expression, but is still de-pendent on the presence of an enhancer. (C) FACS analyses quantifying the fluorescence intensity of pLS-mP, pLS-SV40-mP, and pLS-Ltv1-mP with (bluelines) or without (red lines) antirepressors following infection into HepG2 with 1 copy of viral molecule per cell. Analysis of all GFP expressing cells (fluo-rescence more than 500 intensity units) shows a higher proportion of cells that strongly express GFP (more than 2000 units) when antirepressors are in-cluded. Specifically, 54.8% versus 45.1% for SV40, and 35.6% versus 29.0% for Ltv1, of cells with and without antirepressors, respectively. (D) Venndiagram showing the composition of the lentiMPRA library. Two thousand two hundred thirty-six enhancer candidate sequences were chosen on the basisof having ENCODE HepG2 ChIP-seq peaks for EP300 and H3K27ac marks. The candidates overlapped with or without ChIP-seq peaks for FOXA1, FOXA2,or HNF4A. Half the candidates overlapped with ChIP-seq peaks for RAD21, SMC3, and CHD2. In addition, the library included 102 positive and 102negative controls.
Comparing chromosomal and episomal reporter assays
Genome Research 3www.genome.org
Cold Spring Harbor Laboratory Press on April 19, 2022 - Published by genome.cshlp.orgDownloaded from
expression from nonintegrated DNA (Fig. 1A; Leavitt et al. 1996;Nightingale et al. 2006). Because the integrase is not encoded bythe lentiMPRA library, this experimental design allows us to testthe same exact library in both integrated and nonintegratedcontexts.
To reduce background of unintegrated lentivirus in the inte-grating lentivirus prep, we obtained DNA/RNA from the cellswith the WT-IN liver enhancer library at day 4 when they havean estimated 50 viral particles/cell and the MT-IN library at day 3when they had an estimated 100 viral particles/cell (SupplementalFig. S5A; for details, see Methods). The total copy number of viralDNA in the cells infected with the liver enhancer libraries was val-idated by qPCR (Supplemental Fig. S5B). During human immuno-deficiency virus (HIV) infection, nonintegrating virus represents amajor portion of the virus at early infection time points and in-cludes linear DNA that is rapidly degraded along with circularDNA containing terminal repeats (1-LTRc and 2-LTRc) (Muniret al. 2013). We further confirmed the copy number of noninte-grated virus at our assayed time points by carrying out a qPCRon 2-LTRc, observing the expected low and high amounts of non-integrated virus withWT-IN andMT-IN, respectively (Supplemen-tal Fig. S5B).
lentiMPRA on 2236 candidate liver enhancer sequences
We recovered RNA and DNA from both WT-IN and MT-IN infec-tions (three replicates each consisting of independent infectionswith the same library), amplified barcodes, and performed se-quencing (Illumina NextSeq). We used both the forward and re-verse reads to sequence the 15-bp reporter barcodes and obtainconsensus sequences. We obtained an average of approximately4.1 million raw barcode counts for DNA and an average of approx-imately 26 million raw barcode counts for RNA. Across replicatesand sample types, ∼97% of barcodes were the correct length of15 bp.
We matched the observed barcodes against the designed bar-codes and normalized RNA and DNA for different sequencingdepths in each sample by dividing counts by the sum of all ob-served counts and reporting them as counts per million. Onlybarcodes observed at least once in both RNA and DNA of thesame sample were considered. Subsequently, RNA/DNA ratioswere calculated. The average Spearman’s rho for DNA counts ofthe three integrase mutant (MT) experiments was 0.907, and forRNA counts of the MT experiments was 0.982. The averageSpearman’s rho values for the wild-type integrase (WT) experi-ments were 0.864 and 0.979 for DNA and RNA, respectively.These correlations were determined for barcodes observed in pairsof replicates. Scatter plots for the MT and WT experiments areshown in Supplemental Figures S6 and S7, respectively.
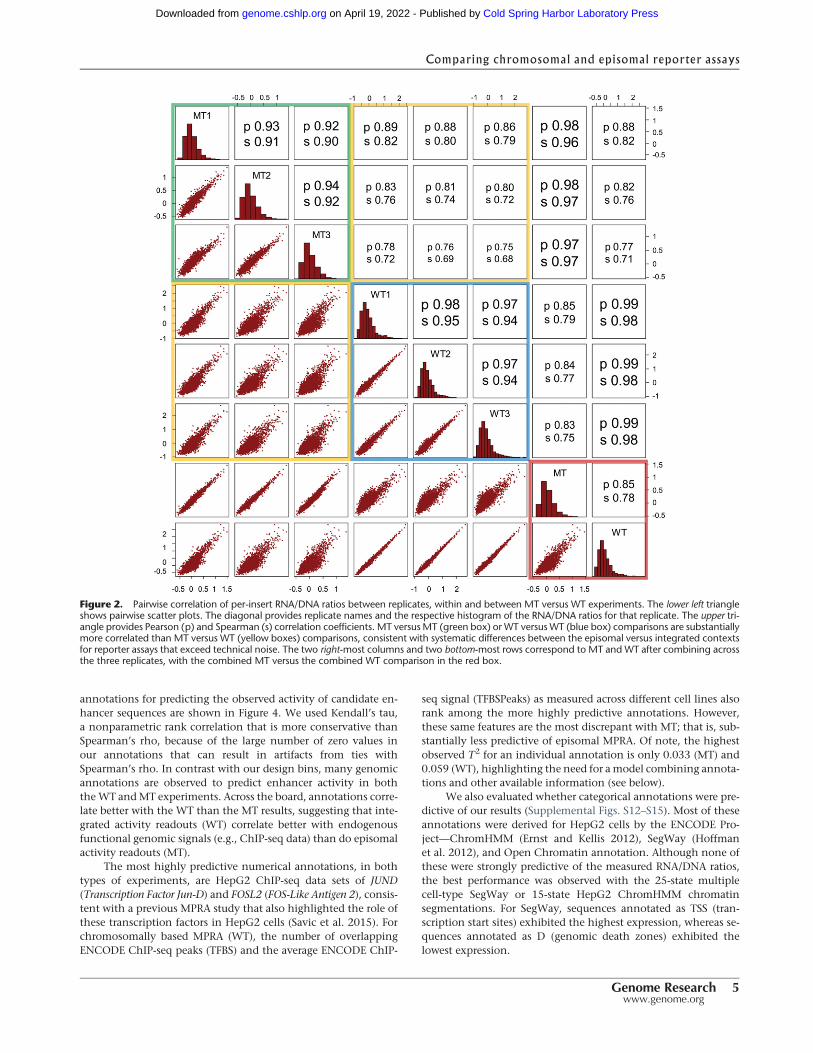
Although the DNA and RNA counts for individual barcodesare highly correlated between experiments, the noise of eachmea-sure results in a poor correlation of RNA/DNA ratios(Supplemental Figs. S6, S7). However, there are on average 59–62barcodes per candidate enhancer sequence (insert) in each repli-cate (out of 100 barcodes programmed on the array, with ∼40%lost during cloning as discussed above) (Supplemental Fig. S8).To reduce noise, we summed up the RNA or DNA counts acrossall associated barcodes for each insert observed in a given experi-ment and recalculated RNA/DNA ratios (Supplemental Fig. S9).After this step, pairwise correlations of DNA and RNA counts ofreplicates are very high (average Spearman’s rho MT-RNA 0.996,MT-DNA 0.994, WT-RNA 0.997, and WT-DNA 0.991). Figure 2
shows scatter plots and correlation values for per-insert RNA/DNA ratios for the MT and WT experiments. RNA/DNA ratiosshow markedly improved reproducibility after summing acrossbarcodes, with an average Spearman’s rho of 0.908 (MT) and0.944 (WT). In all pairwise comparisons of replicates, the integrat-ed (WT) MPRA experiments exhibit a broader dynamic range andgreater reproducibility than the episomal (MT) MPRA experi-ments. We also explored how stable the correlation of RNA/DNAratios is between replicates by down-sampling the number of bar-codes per insert or specifying an exact number of barcodes per in-sert (Supplemental Fig. S10). Again, the WT experiments showgreater reproducibility, especially for inserts represented by fewerindependent barcodes.
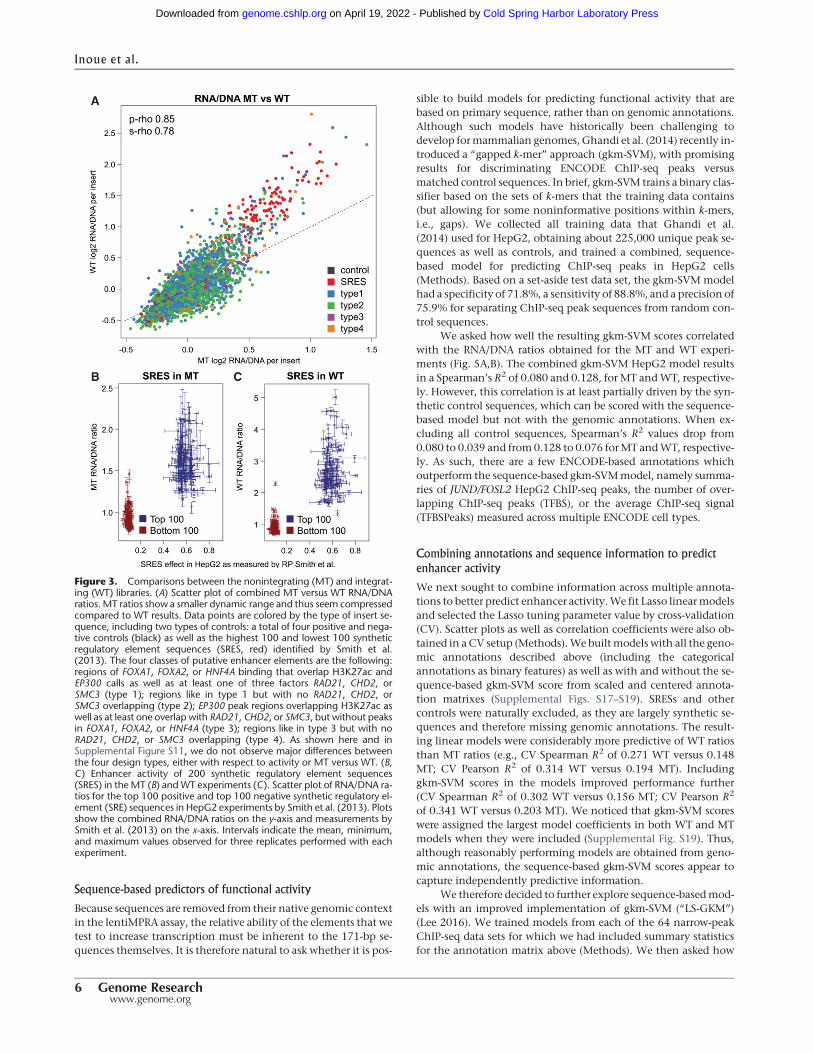
To combine replicates, we normalized the RNA/DNA ratiosfor inserts observed in each replicate by dividing by their medianand then averaged this normalized RNA/DNA ratio for each insertacross replicates (Figs. 2, 3A, red boxes). Figure 3A shows scatterplots of the resulting MT and WT RNA/DNA ratios colored bythe type of insert and/or transcription factors considered in the de-sign (Supplemental Fig. S11 shows RNA/DNA ratio ranges by typeof insert). As noted above, we observe a broader dynamic range inthe WT experiment. Furthermore, the Spearman correlation be-tween MT and WT is 0.785, which is considerably lower thanthe correlation observed when correlating replicates of the sameexperimental type (Spearman correlation of 0.908 [MT] and0.944 [WT]). This is also the case in pairwise comparisons of MTversusWT replicates (i.e., prior to combining replicates) (Fig. 2, yel-low boxes). Overall, these results show that there are substantialdifferences in regulatory activity between identical sequences as-sayed in an integrated versus episomal context.
Importantly, we can see clear separation of positive andnegative controls. Figure 3, B and C, display RNA/DNA ratios ob-tained for the highest and lowest SRESs in the MT and WT exper-iments compared to their previously measured effects in HepG2.Although the highest and lowest SRESs are well separated inboth experiments (Kolmogorov-Smirnov and Wilcoxon rank-sum P-values below 2.2 × 10⁻¹⁶), the WT experiment separatesthe highest and lowest SRE controls slightly better than theMT ex-periment (Kolmogorov-Smirnov test D 0.97 vs 0.95, Wilcoxonrank-sum test W 9951 vs 9937).
Wenext sought to assesswhether anyof our design categories(i.e., types 1–4 defined above, reflecting subsets of candidate en-hancers with coincident liver TF and/or chromatin remodeler/cohesin complex ChIP-seq peaks)might underlie the observed dif-ferences (Fig. 3A; Supplemental Fig. S11). We did not observe dif-ferences in expression range between type 1 and type 2 designs,which differ with respect to whether they overlap with ChIP-seqpeaks for chromatin remodeling factors ormembers of the cohesincomplex (Supplemental Table S1; Supplemental Fig. S16).Unexpectedly, type 3 and 4 designs, which unlike type 1 and 2 de-signs lack liver TF ChIP-seq peaks for FOXA1/2 and HNF4A, weremore active. To attempt to explain overall differences in activityboth for the different category types and in general, we next ex-plored a broader set of genomic annotations and whether thoseare predictive of enhancer activity in the lentiMPRA assay.
ENCODE and other genomic annotations that predict
enhancer activity
We evaluated whether genomic annotations, some numerical andother categorical (Supplemental File 3), were predictive of our re-sults in HepG2 cells. The performance of individual numerical
Inoue et al.
4 Genome Researchwww.genome.org
Cold Spring Harbor Laboratory Press on April 19, 2022 - Published by genome.cshlp.orgDownloaded from
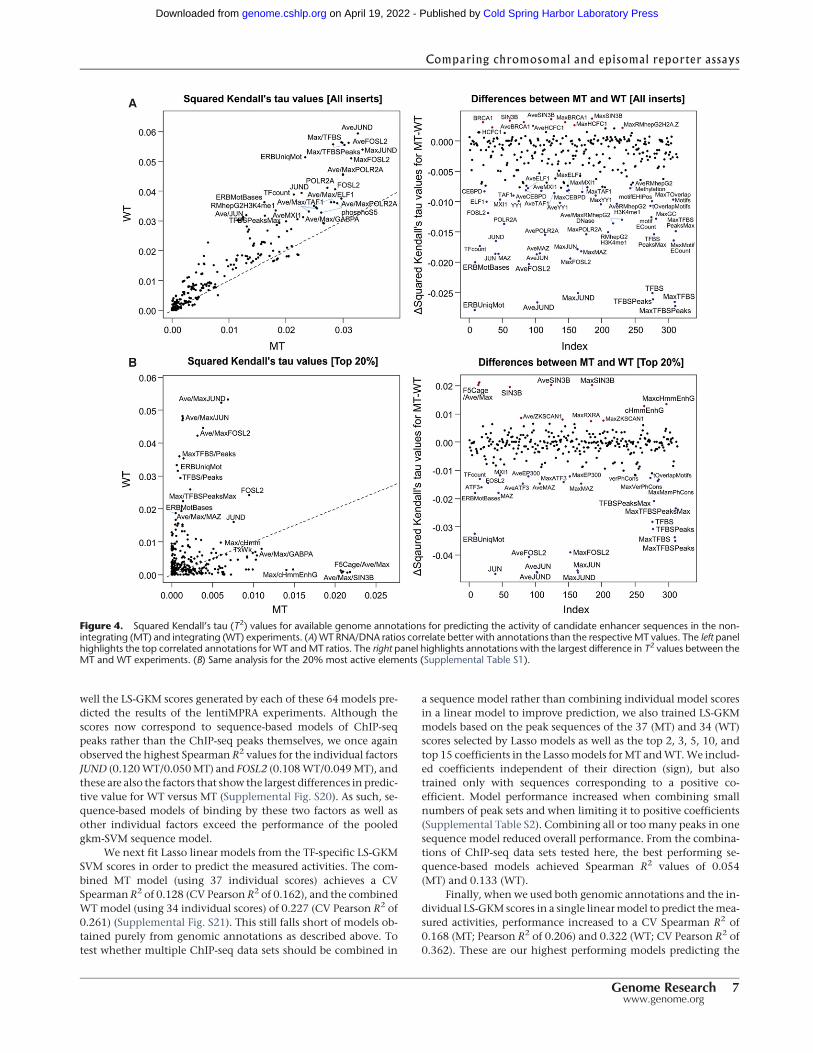
annotations for predicting the observed activity of candidate en-hancer sequences are shown in Figure 4. We used Kendall’s tau,a nonparametric rank correlation that is more conservative thanSpearman’s rho, because of the large number of zero values inour annotations that can result in artifacts from ties withSpearman’s rho. In contrast with our design bins, many genomicannotations are observed to predict enhancer activity in boththeWT andMT experiments. Across the board, annotations corre-late better with the WT than the MT results, suggesting that inte-grated activity readouts (WT) correlate better with endogenousfunctional genomic signals (e.g., ChIP-seq data) than do episomalactivity readouts (MT).
The most highly predictive numerical annotations, in bothtypes of experiments, are HepG2 ChIP-seq data sets of JUND(Transcription Factor Jun-D) and FOSL2 (FOS-Like Antigen 2), consis-tent with a previous MPRA study that also highlighted the role ofthese transcription factors in HepG2 cells (Savic et al. 2015). Forchromosomally based MPRA (WT), the number of overlappingENCODE ChIP-seq peaks (TFBS) and the average ENCODE ChIP-
seq signal (TFBSPeaks) as measured across different cell lines alsorank among the more highly predictive annotations. However,these same features are the most discrepant with MT; that is, sub-stantially less predictive of episomal MPRA. Of note, the highestobserved T2 for an individual annotation is only 0.033 (MT) and0.059 (WT), highlighting the need for amodel combining annota-tions and other available information (see below).
We also evaluated whether categorical annotations were pre-dictive of our results (Supplemental Figs. S12–S15). Most of theseannotations were derived for HepG2 cells by the ENCODE Pro-ject—ChromHMM (Ernst and Kellis 2012), SegWay (Hoffmanet al. 2012), and Open Chromatin annotation. Although none ofthese were strongly predictive of the measured RNA/DNA ratios,the best performance was observed with the 25-state multiplecell-type SegWay or 15-state HepG2 ChromHMM chromatinsegmentations. For SegWay, sequences annotated as TSS (tran-scription start sites) exhibited the highest expression, whereas se-quences annotated as D (genomic death zones) exhibited thelowest expression.
Figure 2. Pairwise correlation of per-insert RNA/DNA ratios between replicates, within and between MT versus WT experiments. The lower left triangleshows pairwise scatter plots. The diagonal provides replicate names and the respective histogram of the RNA/DNA ratios for that replicate. The upper tri-angle provides Pearson (p) and Spearman (s) correlation coefficients. MT versus MT (green box) or WT versus WT (blue box) comparisons are substantiallymore correlated than MT versus WT (yellow boxes) comparisons, consistent with systematic differences between the episomal versus integrated contextsfor reporter assays that exceed technical noise. The two right-most columns and two bottom-most rows correspond to MT and WT after combining acrossthe three replicates, with the combined MT versus the combined WT comparison in the red box.
Comparing chromosomal and episomal reporter assays
Genome Research 5www.genome.org
Cold Spring Harbor Laboratory Press on April 19, 2022 - Published by genome.cshlp.orgDownloaded from
Sequence-based predictors of functional activity
Because sequences are removed from their native genomic contextin the lentiMPRA assay, the relative ability of the elements that wetest to increase transcription must be inherent to the 171-bp se-quences themselves. It is therefore natural to ask whether it is pos-
sible to build models for predicting functional activity that arebased on primary sequence, rather than on genomic annotations.Although such models have historically been challenging todevelop formammalian genomes, Ghandi et al. (2014) recently in-troduced a “gapped k-mer” approach (gkm-SVM), with promisingresults for discriminating ENCODE ChIP-seq peaks versusmatched control sequences. In brief, gkm-SVM trains a binary clas-sifier based on the sets of k-mers that the training data contains(but allowing for some noninformative positions within k-mers,i.e., gaps). We collected all training data that Ghandi et al.(2014) used for HepG2, obtaining about 225,000 unique peak se-quences as well as controls, and trained a combined, sequence-based model for predicting ChIP-seq peaks in HepG2 cells(Methods). Based on a set-aside test data set, the gkm-SVM modelhad a specificity of 71.8%, a sensitivity of 88.8%, and a precision of75.9% for separating ChIP-seq peak sequences from random con-trol sequences.
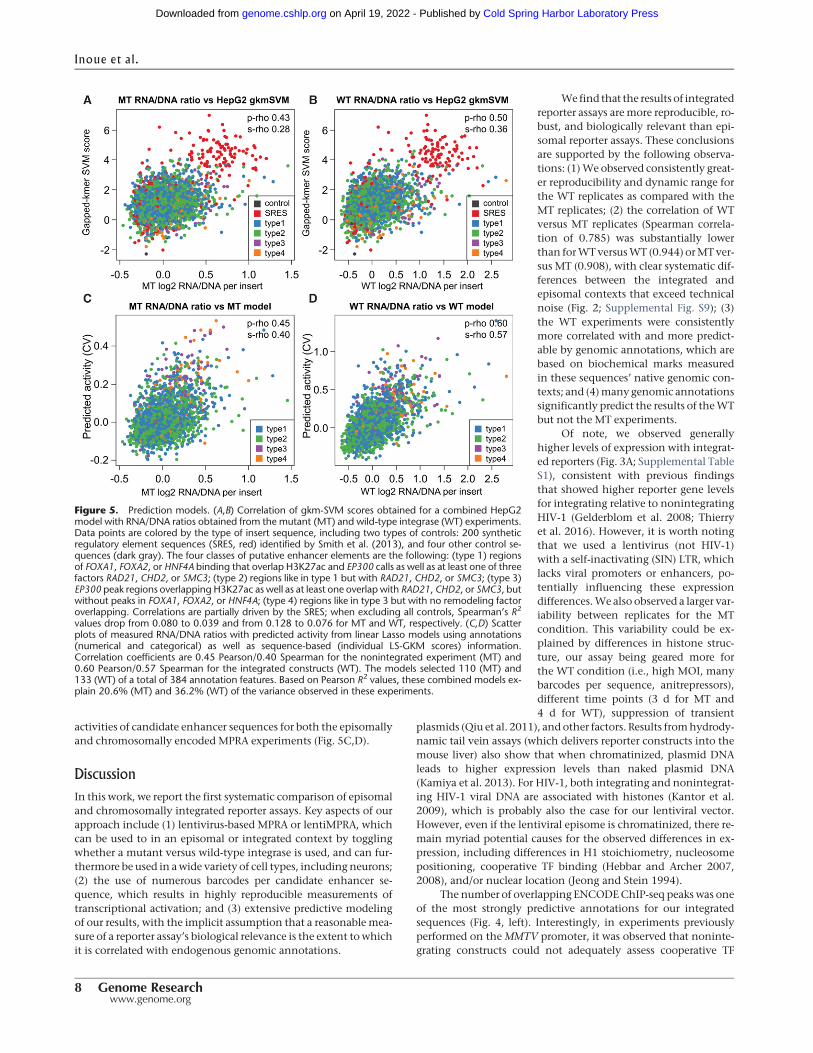
We asked how well the resulting gkm-SVM scores correlatedwith the RNA/DNA ratios obtained for the MT and WT experi-ments (Fig. 5A,B). The combined gkm-SVM HepG2 model resultsin a Spearman’s R2 of 0.080 and 0.128, for MT andWT, respective-ly. However, this correlation is at least partially driven by the syn-thetic control sequences, which can be scored with the sequence-based model but not with the genomic annotations. When ex-cluding all control sequences, Spearman’s R2 values drop from0.080 to 0.039 and from0.128 to 0.076 forMT andWT, respective-ly. As such, there are a few ENCODE-based annotations whichoutperform the sequence-based gkm-SVMmodel, namely summa-ries of JUND/FOSL2 HepG2 ChIP-seq peaks, the number of over-lapping ChIP-seq peaks (TFBS), or the average ChIP-seq signal(TFBSPeaks) measured across multiple ENCODE cell types.
Combining annotations and sequence information to predict
enhancer activity
We next sought to combine information across multiple annota-tions to better predict enhancer activity.We fit Lasso linearmodelsand selected the Lasso tuning parameter value by cross-validation(CV). Scatter plots as well as correlation coefficients were also ob-tained in aCV setup (Methods).We builtmodels with all the geno-mic annotations described above (including the categoricalannotations as binary features) as well as with and without the se-quence-based gkm-SVM score from scaled and centered annota-tion matrixes (Supplemental Figs. S17–S19). SRESs and othercontrols were naturally excluded, as they are largely synthetic se-quences and therefore missing genomic annotations. The result-ing linear models were considerably more predictive of WT ratiosthan MT ratios (e.g., CV Spearman R2 of 0.271 WT versus 0.148MT; CV Pearson R2 of 0.314 WT versus 0.194 MT). Includinggkm-SVM scores in the models improved performance further(CV Spearman R2 of 0.302 WT versus 0.156 MT; CV Pearson R2
of 0.341 WT versus 0.203 MT). We noticed that gkm-SVM scoreswere assigned the largest model coefficients in both WT and MTmodels when they were included (Supplemental Fig. S19). Thus,although reasonably performing models are obtained from geno-mic annotations, the sequence-based gkm-SVM scores appear tocapture independently predictive information.
We therefore decided to further explore sequence-basedmod-els with an improved implementation of gkm-SVM (“LS-GKM”)(Lee 2016). We trained models from each of the 64 narrow-peakChIP-seq data sets for which we had included summary statisticsfor the annotation matrix above (Methods). We then asked how
Figure 3. Comparisons between the nonintegrating (MT) and integrat-ing (WT) libraries. (A) Scatter plot of combined MT versus WT RNA/DNAratios. MT ratios show a smaller dynamic range and thus seem compressedcompared to WT results. Data points are colored by the type of insert se-quence, including two types of controls: a total of four positive and nega-tive controls (black) as well as the highest 100 and lowest 100 syntheticregulatory element sequences (SRES, red) identified by Smith et al.(2013). The four classes of putative enhancer elements are the following:regions of FOXA1, FOXA2, or HNF4A binding that overlap H3K27ac andEP300 calls as well as at least one of three factors RAD21, CHD2, orSMC3 (type 1); regions like in type 1 but with no RAD21, CHD2, orSMC3 overlapping (type 2); EP300 peak regions overlapping H3K27ac aswell as at least one overlap with RAD21, CHD2, or SMC3, but without peaksin FOXA1, FOXA2, or HNF4A (type 3); regions like in type 3 but with noRAD21, CHD2, or SMC3 overlapping (type 4). As shown here and inSupplemental Figure S11, we do not observe major differences betweenthe four design types, either with respect to activity or MT versus WT. (B,C) Enhancer activity of 200 synthetic regulatory element sequences(SRES) in the MT (B) and WT experiments (C). Scatter plot of RNA/DNA ra-tios for the top 100 positive and top 100 negative synthetic regulatory el-ement (SRE) sequences in HepG2 experiments by Smith et al. (2013). Plotsshow the combined RNA/DNA ratios on the y-axis and measurements bySmith et al. (2013) on the x-axis. Intervals indicate the mean, minimum,and maximum values observed for three replicates performed with eachexperiment.
Inoue et al.
6 Genome Researchwww.genome.org
Cold Spring Harbor Laboratory Press on April 19, 2022 - Published by genome.cshlp.orgDownloaded from
well the LS-GKM scores generated by each of these 64 models pre-dicted the results of the lentiMPRA experiments. Although thescores now correspond to sequence-based models of ChIP-seqpeaks rather than the ChIP-seq peaks themselves, we once againobserved the highest Spearman R2 values for the individual factorsJUND (0.120WT/0.050MT) and FOSL2 (0.108WT/0.049MT), andthese are also the factors that show the largest differences in predic-tive value for WT versus MT (Supplemental Fig. S20). As such, se-quence-based models of binding by these two factors as well asother individual factors exceed the performance of the pooledgkm-SVM sequence model.
We next fit Lasso linear models from the TF-specific LS-GKMSVM scores in order to predict the measured activities. The com-bined MT model (using 37 individual scores) achieves a CVSpearman R2 of 0.128 (CV Pearson R2 of 0.162), and the combinedWTmodel (using 34 individual scores) of 0.227 (CV Pearson R2 of0.261) (Supplemental Fig. S21). This still falls short of models ob-tained purely from genomic annotations as described above. Totest whether multiple ChIP-seq data sets should be combined in
a sequence model rather than combining individual model scoresin a linear model to improve prediction, we also trained LS-GKMmodels based on the peak sequences of the 37 (MT) and 34 (WT)scores selected by Lasso models as well as the top 2, 3, 5, 10, andtop 15 coefficients in the Lassomodels forMT andWT.We includ-ed coefficients independent of their direction (sign), but alsotrained only with sequences corresponding to a positive co-efficient. Model performance increased when combining smallnumbers of peak sets and when limiting it to positive coefficients(Supplemental Table S2). Combining all or too many peaks in onesequence model reduced overall performance. From the combina-tions of ChIP-seq data sets tested here, the best performing se-quence-based models achieved Spearman R2 values of 0.054(MT) and 0.133 (WT).
Finally, when we used both genomic annotations and the in-dividual LS-GKM scores in a single linearmodel to predict themea-sured activities, performance increased to a CV Spearman R2 of0.168 (MT; Pearson R2 of 0.206) and 0.322 (WT; CV Pearson R2 of0.362). These are our highest performing models predicting the
Figure 4. Squared Kendall’s tau (T2) values for available genome annotations for predicting the activity of candidate enhancer sequences in the non-integrating (MT) and integrating (WT) experiments. (A) WT RNA/DNA ratios correlate better with annotations than the respectiveMT values. The left panelhighlights the top correlated annotations for WT andMT ratios. The right panel highlights annotations with the largest difference in T2 values between theMT and WT experiments. (B) Same analysis for the 20% most active elements (Supplemental Table S1).
Comparing chromosomal and episomal reporter assays
Genome Research 7www.genome.org
Cold Spring Harbor Laboratory Press on April 19, 2022 - Published by genome.cshlp.orgDownloaded from
activities of candidate enhancer sequences for both the episomallyand chromosomally encoded MPRA experiments (Fig. 5C,D).
Discussion
In this work, we report the first systematic comparison of episomaland chromosomally integrated reporter assays. Key aspects of ourapproach include (1) lentivirus-based MPRA or lentiMPRA, whichcan be used to in an episomal or integrated context by togglingwhether a mutant versus wild-type integrase is used, and can fur-thermore be used in awide variety of cell types, including neurons;(2) the use of numerous barcodes per candidate enhancer se-quence, which results in highly reproducible measurements oftranscriptional activation; and (3) extensive predictive modelingof our results, with the implicit assumption that a reasonable mea-sure of a reporter assay’s biological relevance is the extent to whichit is correlated with endogenous genomic annotations.
We find that the results of integratedreporter assays aremore reproducible, ro-bust, and biologically relevant than epi-somal reporter assays. These conclusionsare supported by the following observa-tions: (1)We observed consistently great-er reproducibility and dynamic range forthe WT replicates as compared with theMT replicates; (2) the correlation of WTversus MT replicates (Spearman correla-tion of 0.785) was substantially lowerthan forWTversusWT (0.944) orMTver-sus MT (0.908), with clear systematic dif-ferences between the integrated andepisomal contexts that exceed technicalnoise (Fig. 2; Supplemental Fig. S9); (3)the WT experiments were consistentlymore correlated with and more predict-able by genomic annotations, which arebased on biochemical marks measuredin these sequences’ native genomic con-texts; and (4)many genomic annotationssignificantly predict the results of theWTbut not the MT experiments.
Of note, we observed generallyhigher levels of expression with integrat-ed reporters (Fig. 3A; Supplemental TableS1), consistent with previous findingsthat showed higher reporter gene levelsfor integrating relative to nonintegratingHIV-1 (Gelderblom et al. 2008; Thierryet al. 2016). However, it is worth notingthat we used a lentivirus (not HIV-1)with a self-inactivating (SIN) LTR, whichlacks viral promoters or enhancers, po-tentially influencing these expressiondifferences.We also observed a larger var-iability between replicates for the MTcondition. This variability could be ex-plained by differences in histone struc-ture, our assay being geared more forthe WT condition (i.e., high MOI, manybarcodes per sequence, anitrepressors),different time points (3 d for MT and4 d for WT), suppression of transient
plasmids (Qiu et al. 2011), and other factors. Results fromhydrody-namic tail vein assays (which delivers reporter constructs into themouse liver) also show that when chromatinized, plasmid DNAleads to higher expression levels than naked plasmid DNA(Kamiya et al. 2013). For HIV-1, both integrating and nonintegrat-ing HIV-1 viral DNA are associated with histones (Kantor et al.2009), which is probably also the case for our lentiviral vector.However, even if the lentiviral episome is chromatinized, there re-main myriad potential causes for the observed differences in ex-pression, including differences in H1 stoichiometry, nucleosomepositioning, cooperative TF binding (Hebbar and Archer 2007,2008), and/or nuclear location (Jeong and Stein 1994).
The number of overlapping ENCODEChIP-seq peaks was oneof the most strongly predictive annotations for our integratedsequences (Fig. 4, left). Interestingly, in experiments previouslyperformed on the MMTV promoter, it was observed that noninte-grating constructs could not adequately assess cooperative TF
Figure 5. Prediction models. (A,B) Correlation of gkm-SVM scores obtained for a combined HepG2model with RNA/DNA ratios obtained from the mutant (MT) and wild-type integrase (WT) experiments.Data points are colored by the type of insert sequence, including two types of controls: 200 syntheticregulatory element sequences (SRES, red) identified by Smith et al. (2013), and four other control se-quences (dark gray). The four classes of putative enhancer elements are the following: (type 1) regionsof FOXA1, FOXA2, or HNF4A binding that overlap H3K27ac and EP300 calls as well as at least one of threefactors RAD21, CHD2, or SMC3; (type 2) regions like in type 1 but with RAD21, CHD2, or SMC3; (type 3)EP300 peak regions overlapping H3K27ac as well as at least one overlap with RAD21, CHD2, or SMC3, butwithout peaks in FOXA1, FOXA2, or HNF4A; (type 4) regions like in type 3 but with no remodeling factoroverlapping. Correlations are partially driven by the SRES; when excluding all controls, Spearman’s R2
values drop from 0.080 to 0.039 and from 0.128 to 0.076 for MT and WT, respectively. (C,D) Scatterplots of measured RNA/DNA ratios with predicted activity from linear Lasso models using annotations(numerical and categorical) as well as sequence-based (individual LS-GKM scores) information.Correlation coefficients are 0.45 Pearson/0.40 Spearman for the nonintegrated experiment (MT) and0.60 Pearson/0.57 Spearman for the integrated constructs (WT). The models selected 110 (MT) and133 (WT) of a total of 384 annotation features. Based on Pearson R2 values, these combined models ex-plain 20.6% (MT) and 36.2% (WT) of the variance observed in these experiments.
Inoue et al.
8 Genome Researchwww.genome.org
Cold Spring Harbor Laboratory Press on April 19, 2022 - Published by genome.cshlp.orgDownloaded from
binding due to differences in H1 stoichiometry and nucleosomepositioning (Hebbar and Archer 2007), which may relate to thefact that this multiple TF binding was also one of the most differ-entiating annotations between the WT versus MT experiments(Fig. 4, right). Specific TF ChIP-seq-based sequence models thatare similarly differentiating (Supplemental Fig. S19) includeJUND, FOSL2, ATF3, and ELF1, which are known to interact andform complexes. Jun and Fos family members form the heterodi-meric protein complex AP-1, which regulates gene expression inresponse to various stimuli including stress (Hess et al. 2004),and in the liver has known roles in hepatogenesis (Hilberg et al.1993) and hepatocyte proliferation (Alcorn et al. 1990). AP-1 isknown to form complexes with several additional protein partners(Hess et al. 2004), including ATF proteins such as ATF3 (Hai andCurran 1991) and ELF1, an ETS transcription factor (Bassuk andLeiden 1995). Of note, although lentivirus infection can inducestress potentially leading to increased expression of AP-1 and relat-ed factors, these same TFs were less predictive in MT-infected se-quences; furthermore, the ChIP-seq data sets were generated oncells in normal physiological conditions. Combined, these find-ings suggest that differences in cooperative TF binding, possibly in-volving TFs including JUND, FOSL2, ELF1, and ATF3, might drivedifferences in the results of integrated versus episomal reporter as-says. Interestingly, we observed a few histone related predictive an-notations for the MT high expressing signals, including the SIN3transcriptional regulator family member B (SIN3B), a scaffold proteinthat recruits chromatin modifying proteins (Kadamb et al. 2013)and histone variant H2A.Z, which has been shown to have impor-tant transcriptional activation roles (Subramanian et al. 2015).Although these annotations are based on the corresponding geno-mic DNA regions (e.g., ChIP-seq results) and only H1 stoichiomet-ric differences were previously observed for the transient versusintegrated MMTV promoter (Hebbar and Archer 2008), it wouldbe interesting to test whether other histone differences exist fornonintegrating constructs on a larger scale.
Using single-feature models, we also systematically evaluatedmore than 400 genomic annotations and sequence models to ex-plore which are significantly predictive of expression in the inte-grated and/or episomal lentiMPRA experiments (SupplementalFig. S22). Consistent with our other analyses, there are manymore annotations that are significantly predictive of the integrated(WT) assay but not the episomal (MT) assay. These include severalannotations related to histone acetylation (HDAC2, EP300, andZBTB7A) as well as a factor (CEBPB) with increased liver expressionandwhich is associatedwith adipogenesis, gluconeogenic, and he-matopoiesis (Tsukada et al. 2011). Interestingly, there are also anumber of annotations that are only significantly predictive ofthe episomal assay, including BRCA1 and SIN3B binding motifs.
A limitation of this study and most contemporary MPRA ex-periments is that the length of the sequences tested are less than200 bases. This may be addressable in the future through improve-ments to array-based oligonucleotide synthesis,multiplexDNA as-sembly protocols (Klein et al. 2016), or multiplex DNA captureprotocols (Vockley et al. 2015). Furthermore, it remains uncertainwhat the true length distribution of enhancers is, although the sizedistribution of distal DNase I hypersensitive sites seems to providea reasonable proxy of 300 bp (Natarajan et al. 2012).
A contemporary challenge for our field is how to best identify,prioritize, and functionally validate cis-regulatory elements, espe-cially enhancers. To address this, we envision a virtuous cycle, inwhich annotation and/or sequence-basedmodels are used to nom-inate candidate enhancer sequences for validation, these candi-
dates are tested in massively parallel reporter assays, and thenthe results are used to improve the models, which in turn resultsin higher quality nominations. Eventually, this will lead to notonly a catalog of validated enhancers but also a deepermechanisticunderstanding of the relationship between primary sequence,transcription factor binding, and quantitative enhancer activity.In this study, our best performing model achieves a Pearson’s R2
of 0.362 in predicting the results of the integrated lentiMPRA,with both genomic annotations and sequence-based models pro-viding independent information. The result is encouraging, butthe majority of variation remains unexplained. Of note, theseare quantitative predictions of activity, a more challenging taskthan categorizing enhancers versus nonenhancers. Nonetheless,all the information underlying the differences is contained withinthe short sequences that we are testing and, in principle, should belearnable. Possible avenues for improving our predictive modelsinclude increasing the size of the regions tested so as to better alignwith the genomic annotations that we are using for prediction, ad-ditional annotations or alternative ways of summarizing availableannotations, alternative sequence representations to gapped k-mers, allowing for interaction terms between model features, andmarkedly expanding the amount of training data. Indeed, withsufficient training data, wehope itwill eventually be possible to ac-curately predict MPRA results from sequence-based models alone.
As our field scales MPRAs to characterize very large numbersof candidate enhancers, it is obviously critical that the reporter as-says are as reflective as possible of endogenous biology. Our resultsdirectly test a longstanding concern about episomal reporter assaysand suggest there are substantial differences between the integrat-ed and episomal contexts. Furthermore, based on the fact thattheir output ismore correlatedwith genomic annotations, we inferthat integrated reporter assays are more reflective of endogenousenhancer activity. This fits with our expectation, as both the inte-grated reporter and endogenous enhancers reside within chromo-somes as opposed to episomes.
Of course, an equally valid perspective on our observations isthat reporter assays in the integrated versus episomal contexts arereasonably well correlated; therefore, the results of episomal assaysremain informative of what activity would be in the integratedcontext (e.g., sequences observed to be strongly active in an epi-somal assay are likely to also be strongly active in an integrated as-say). Whether the differences we observe here, with respect toactivity, reproducibility, and correlation with genomic features,impact the interpretation of an episomal assay depends on the par-ticulars of what was done and why (e.g., these differences may bemore relevant for enhancer prediction and for quantitativemodel-ing than for the binary classification of individual elements as ac-tivating versus inert). Furthermore, it is important to acknowledgethat even integrated reporter assays are limited in important ways(e.g., by removing each tested element from its native sequenceand epigenetic context).We therefore urge caution in the interpre-tation of the results of all reporter assays, but also that integratedreporter assays such as lentiMPRA be used where possible as an al-ternative to episomal reporter assays.
Methods
Lentivirus enhancer construct generation
To generate the lentivirus vector (pLS-mP), aminimal promoter se-quence, which originates from pGL4.23 (Promega), including anSbfI site was obtained by annealing of oligonucleotides (Sense:
Comparing chromosomal and episomal reporter assays
Genome Research 9www.genome.org
Cold Spring Harbor Laboratory Press on April 19, 2022 - Published by genome.cshlp.orgDownloaded from
5′-CTAGACCTGCAGGCACTAGAGGGTATATAATGGAAGCTCGACTTCCAGCTTGGCAATCCGGTACTGTA-3′; Antisense: 5′-CCGGTACAGTACCGGATTGCCAAGCTGGAAGTCGAGCTTCCATTATATACCCTCTAGTGCCTGCAGGT-3′; SbfI site is underlined) andsubcloned into XbaI and AgeI sites in the pLB vector (Addgene11619) (Kissler et al. 2006), replacing the U6 promoter and CMVenhancer/promoter sequence in the vector. To generatepLS-mP-SV40, the SV40 enhancer sequence was amplified frompGL4.13 (Promega) using primers (Forward: 5′-CAGGGCCCGCTCTAGAGCGCAGCACCATGGCCTGAA-3′; Reverse: 5′-TGCCTGCAGGTCTAGACAGCCATGGGGCGGAGAATG-3′) and insertedinto XbaI site in the vector using In-Fusion (Clontech). pos1,pos2, neg1, and neg2 sequences were amplified from human(pos1, neg2, pos2) or mouse (neg1) genome and inserted intoEcoRV and HindIII site in pGL4.23 (Promega). Primers used areshown in Supplemental Table S3, and the annotated plasmid se-quence file is available as Supplemental File 1.
Library sequence design
We picked 171-bp candidate enhancer sequences based on ChIP-seq peaks calls for HepG2. We used narrow-peak calls for DNAbinding proteins/transcription factors (FOXA1, FOXA2, HNF4A,RAD21, CHD2, SMC3, and EP300) and wide peak calls for histonemarks (H3K27ac). We downloaded the call sets from the ENCODEportal (Sloan et al. 2016) (https://www.encodeproject.org/)with the following identifiers: ENCFF001SWK, ENCFF002CKI,ENCFF002CKJ, ENCFF002CKK, ENCFF002CKN, ENCFF002CKY,ENCFF002CUS, ENCFF002CTX, ENCFF002CUU, ENCFF002CKV,and ENCFF002CUN. We defined four types of sites: (1) regionscentered over peak calls of ≤171 bp for FOXA1, FOXA2, orHNF4A that overlap H3K27ac and EP300 calls as well as at leastone of three factors: components of the cohesin complex(RAD21, SMC3) or chromatin remodeling factor CHD2; (2) regionslike in type 1, but with no CHD2, RAD21, or SMC3 overlap; (3) re-gions of 171 bp centered in an EP300 peak overlappingH3K27ac aswell as at least one of three factors RAD21, CHD2, or SMC3, butwithout peaks in FOXA1, FOXA2, or HNF4A; and (4) regions likein type 3 but with no CHD2, RAD21, or SMC3 overlap. Sites oftype 1 and 2 involving HNF4 were the most abundant sites andwe used those to fill up our design after exhausting other targetsequences.
Potential 171-bp target sequences were inserted into a 230-bpoligo backbone with a 5′ flanking sequence (15 bp, AGGACCGGATCAACT), 14-bp spacer sequence (CCTGCAGGGAATTC),15-bp designed tag sequences (see below), and a 3′ flanking se-quence (15 bp, CATTGCGTGAACCGA) (Supplemental Fig. S3).Sequences were checked for SbfI and EcoRI restriction sites afterjoining the target sequence with the 5′ flanking sequence andthe spacer sequence. Such potential target sequences werediscarded.
In our final array design, we included 2440 different targetsequences, each with 100 different barcodes (i.e., a total of244,000 oligos). These included the highest 100 and lowest 100synthetic regulatory element (SRE) sequences identified by Smithet al. (2013), four control sequences (neg1 MGSCv37 Chr 19:35,531,983–35,532,154; neg2 GRCh37 Chr 5: 172,177,151–172,177,323; pos1 GRCh37 Chr 3: 197,439,136–197,439,306;pos2 GRCh37 Chr 19: 35,531,984–35,532,154), which we testedusing luciferase assays in the HepG2 cell line (Supplemental Fig.S2), 1029 type 1 inserts (202 FOXA1, 180 FOXA2, 464 HNF4A,120 FOXA1&FOXA2, 33 FOXA1&HNF4A, 17 FOXA2&HNF4A, 13FOXA1&FOXA2&HNF4A), 1030 type 2 inserts (195 FOXA1, 174FOXA2, 470 HNF4A, 126 FOXA1&FOXA2, 31 FOXA1&HNF4A, 20
FOXA2&HNF4A, 14 FOXA1&FOXA2&HNF4A), 90 type 3 inserts,and 87 type 4 inserts.
Tag sequences of 15-bp length were designed to have at leasttwo substitutions and one 1-bp insertion distance to each other.Homopolymers of length 3 bp and longer were excluded in the de-sign of these sequences, and so were ACA/CAC and GTG/TGT tri-nucleotides (bases excited with the same laser during Illuminasequencing). More than 556,000 such barcodes were designed us-ing a greedy approach. The barcodes were then checked for the cre-ation of SbfI and EcoRI restriction sites when adding the spacer and3′ flanking sequences. From the remaining sequences, a randomsubset of 244,000 barcodes was chosen for the design. The final de-signed oligo sequences are available in Supplemental File 2.
Generation of MPRA libraries
The lentiviral vector pLS-mPwas cut with SbfI and EcoRI to tempo-rarily liberate the minimal promoter and EGFP reporter gene.Array-synthesized 230-bp oligos (Agilent Technologies) contain-ing an enhancer, spacer, and barcode (Supplemental Fig. S3)were amplified with adaptor primers (pLSmP-AG-f and pLSmP-AG-r) that have overhangs complementary to the cut vector back-bone (Supplemental Table S3), and the products were cloned usingNEBuilder HiFi DNA Assembly mix (E2621). The adaptors werechosen to disrupt the original SbfI and EcoRI sites in the vector.The cloning reaction was transformed into electrocompetent cells(NEB C3020). Multiple transformations were pooled and midi-prepped (Chargeswitch Pro Filter Plasmid Midi Kit, InvitrogenCS31104). This library of cloned enhancers and barcodes wasthen cut using SbfI and EcoRI sites contained within the spacer,and the minimal promoter and EGFP that were removed earlierwere reintroduced via a sticky end ligation (T4 DNA Ligase, NEBM0202) between the enhancer and its barcode. These finished vec-tors were transformed andmidi-prepped as previously mentioned.
Quality control of designed array oligos
Before inserting the minimal promoter and EGFP reporter gene,the plasmid library was sampled by high-throughput sequenc-ing on an Illumina MiSeq (206/200 + 6 cycles) to check for thequality of the designed oligos and the representation of individualbarcodes (sequencing primers are pLSmP-AG-seqR1, pLSmP-AG-seqIndx, and pLSmP-AG-seqR2) (Supplemental Table S3). Wesequenced the target, spacer, and tag sequences from both readends and called a consensus sequence from the two reads. We ob-tained 19.2 million paired-end consensus sequences from this se-quencing experiment, 52.6% of which had the expected length,26.1% of sequences were 1 bp short, and 8.9% were 2 bp short(summing up to 87.6%). Only 1.6% of sequences showed an inser-tion of 1 bp. These results are in line with expected dominance ofsmall deletion errors in oligo synthesis. We aligned all consensussequences back to all designed sequences using BWA MEM(Li and Durbin 2009) with parameters penalizing soft-clipping ofalignment ends (-L 80). We consensus called reads aligning withthe same outer alignment coordinates and SAM-format CIGARstring to reduce the effects of sequencing errors. We analyzed allthose consensus sequences based on at least three sequenceswith a mapping quality above 0. We note that substitutions are re-moved in the consensus calling process if the correct sequence isthe most abundant sequence. Among these 992,513 consensus se-quences, we observe instances of 91% designed oligos and 78% ofoligos with one instance matching the designed oligo perfectly.Across all consensus sequences, the proportion of perfect oligosis only 19%; however, the proportion vastly increases with thenumber of observations (69% at 20 counts, 99% at 40 counts)
Inoue et al.
10 Genome Researchwww.genome.org
Cold Spring Harbor Laboratory Press on April 19, 2022 - Published by genome.cshlp.orgDownloaded from
(Supplemental Table S4). These observations are in agreementwith most molecular copies of an oligo being correct, in com-bination with high representation differences in the library.Supplemental Figure S4A shows the distribution of alignment dif-ferences (as a proxy for synthesis errors) along the designed oligosequences. Errors are distributed evenly along the designed insertsequence, with deletions dominating the observed differences.We observe that at some positions the deletion rate is reduced,whereas the insertion rate is increased. We speculate that thismight be due to certain sequence contexts.
Limited coverage of designed oligos in MPRA libraries
From the analysis of oligo quality and oligo abundance above, wesaw a first indication of the existence of awide range of oligo abun-dance, and more frequent sequences tend to match the designedsequences perfectly (Supplemental Table S4). We characterizedthe abundance of oligos further and looked at the consequencesthat this has for generating libraries of lentivirus constructs withlimited complexity (due to the transformation of a limited numberof bacteria). Rather than looking at full-length oligos, we focusedonly on the tag sequences. Tag sequences were identified fromthe respective alignment positions of the alignments createdabove. To match the RNA/DNA count data analysis (see below),we only considered barcodes of 15-bp length (10.96 million/57.0%, similar to the proportion of correct length sequencesabove). Of those 10.96 million barcodes, 345,247 different se-quences are observed. We clustered (dnaclust) (Ghodsi et al.2011) the remaining sequences allowing for one substitutionand selecting the designed or most abundant sequence (reducingto 238,206 different sequences). The clustered sequences werematched against the designed barcodes (217,176 sequences,99.2% of counts). The distribution of the abundance of these barc-odes is available in Supplemental Figure S4B.We used those countsto simulate sampling from this overdispersed pool of sequences, asdone when taking a sample of plasmids infusing the reporter geneand minimal promoter and again transforming the resulting plas-mids. We sampled 10 times and averaged the number of uniquedesigned barcodes: 150,000 clones – 87,944 unique barcodes,250,000 clones – 116,297 unique barcodes, 350,000 clones –
135,222 unique barcodes, 500,000 clones – 154,090 unique barco-des, 600,000 clones – 163,831 unique barcodes, 750,000 clones –172,770 unique barcodes, and 1 million clones – 183,685 uniquebarcodes. Thus, even for high sampling depth, only a subset ofbarcodes will be captured in the final library. We observe on aver-age 145,876 different barcodes which is concordant with morethan 430,000 clones going into the lenti construction.
Cell culture and GFP/luciferase assays
HepG2 cells were cultured as previously described (Smith et al.2013). K562, H1-ESC, HeLa-S3, T-47D, and Sk-n-sh cells were cul-tured as previously described (The ENCODE Project Consortium2012). Sk-n-sh cells were treated with 24 µM all trans-retinoicacid (Sigma) to induce neuronal differentiation. K562, H1-ESC,HeLa-S3, T-47D, and Sk-n-sh infected with pLS-mP or pLS-SV40-mP lentivirus along with 8 µg/mL polybrene and incubated for 2d, when they have an estimated 30, 60, 90, 90, and 90 viral parti-cles/cell, respectively. The number of viral particles/cell was mea-sured as described below. For the luciferase assay of the fourcontrol sequences (two negatives and two positives), we amplifiedthe controls from the designed oligo pool (for primer sequences,see Supplemental Table S5) and inserted those into the pGL4.23(Promega) reporter plasmid. 2 × 10⁴ HepG2 cells/well were seededin a 96-well plate; 24 h later, the cells were transfected with 90 ng
of reporter plasmids (pGL4.23-neg1, pGL4.23-neg2, pGL4.23-pos1, and pGL4.23-pos2) and 10 ng of pGL4.74 (Promega), whichconstitutively expresses Renilla luciferase, using X-tremeGENE HP(Roche) according to the manufacturer’s protocol. The X-tremeGENE:DNA ratio was 2:1. Three independent replicate cul-tures were transfected. Firefly and Renilla luciferase activitieswere measured as previously described (Smith et al. 2013).
Lentivirus packaging, titration, and infection
To optimize conditions and reduce background of unintegratedlentivirus in the integrating lentivirus prep, we utilized our posi-tive control virus (pLS-SV40-mP) that was packaged with WT-INandMT-IN, and we examined the viral titer by qPCR for three dif-ferent volumes (1, 5, and 25 µL per well of a 24-well plate) at fourdifferent time points (2–5 d post infection). For the lower volumes(1 and 5 µL), we observed a substantial reduction in total virusamounts at day 4 for both MT-IN and WT-IN that stabilized inthe WT-IN only (Supplemental Fig. S5A). This suggests that thenonintegrated virus declines at this time point, similar to whatwas previously reported (Butler et al. 2001). For the high volume(25 µL), we did not observe a substantial reduction or stabilizationfor MT-IN andWT-IN, respectively, until day 5 (Supplemental Fig.S5A), suggesting that high amounts of viruswouldmake it difficultto distinguish between integrated and nonintegrated virus.
Twelve million HEK293T cells were plated in a 15-cm dishand cultured for 24 h. The cells were cotransfected with 8 µg ofthe liver enhancer library and 4 µg of packaging vectors usingjetPRIME (Polyplus-transfections). psPAX2 that encodes wild-type pol was used to generate integrating lentivirus, whereaspLV-HELP (InvivoGen) that encodes amutant pol was used to gen-erate nonintegrating lentivirus. pMD2.G was used for both. Thetransfected cells were cultured for 3 d, and lentiviruses were har-vested and concentrated as previously described (Wang andMcManus 2009).
To measure DNA titer for the integrating and nonintegratinglentivirus library, HepG2 cells were plated at 2 × 10⁵ cells/well in12-well plates and incubated for 24 h. Serial volume (0, 1, 5,25 µL) of the lentivirus was added with 8 µg/mL polybrene, to in-crease infection efficiency. The infected cells were cultured for2–5 d and then washed with PBS three times. Genomic DNA wasextracted using the Wizard SV genomic DNA purification kit(Promega). Copy number of viral particle per cell was measuredas the relative amount of viral DNA (WPRE region) over that of ge-nomic DNA (intronic region of LIPC gene) by qPCR using SsoFastEvaGreen Supermix (Bio-Rad), according to manufacturer’s proto-col. PCR primer sequences are shown in Supplemental Table S3.For the lentiMPRA, 2.4 million HepG2 cells were plated on a 10-cm dish and cultured for 24 h. The cells were infected with inte-grating or nonintegrating lentivirus libraries along with 8 µg/mLpolybrene and incubated for 4 and 3 d, when they have an estimat-ed 50 and 100 viral particles/cell, respectively. Three independentreplicate cultures were infected. The cells were washed with PBSthree times, and genomic DNA and total RNA was extracted usingan AllPrep DNA/RNAmini kit (Qiagen). Copy number of viral par-ticle per cell was confirmed by qPCR and shown in SupplementalFigure S5B. Messenger RNA (mRNA) was purified from the totalRNA using Oligotex mRNA mini kit (Qiagen) and treated withTurbo DNase to remove contaminating DNA.
RT-PCR, amplification, and sequencing of RNA/DNA
For each replicate, 3 × 500 ng was reverse transcribed withSuperScript II (Invitrogen 18064-014) using a primer downstreamfrom the barcode (pLSmP-ass-R-i#) (Supplemental Table S3),
Comparing chromosomal and episomal reporter assays
Genome Research 11www.genome.org
Cold Spring Harbor Laboratory Press on April 19, 2022 - Published by genome.cshlp.orgDownloaded from
which contained a sample index and a P7 Illumina adaptor se-quence. The resulting cDNAwas pooled and split into 24 reactions,amplified with Kapa Robust polymerase for three cycles using thissame reverse primer paired with a forward primer complementaryto the 3′ end of EGFP with a P5 adaptor sequence (BARCODE_lentiF_v4.1) (Supplemental Table S3). The implemented two-round PCR setup is supposed to reduce PCR jack-potting effectsand allows for incorporating unique molecular identifiers(UMIs), which could be used to correct for other PCR biases in fu-ture experiments. PCR products are then cleaned up with AMPureXP beads (Beckman Coulter) to remove the primers and concen-trate the products. These products underwent a second round ofamplification in eight reactions per replicate for 15 cycles, with areverse primer containing only P7. All reactions were pooled atthis point, run on an agarose gel for size-selection, and submittedfor sequencing. For the DNA, 16 × 500 ng of each replicate was am-plified for three cycles just as the RNA. First-round products werecleaned upwith AMPure XP beads and amplified for another 16 re-actions, each for 20 cycles. Reactionswere pooled, gel purified, andsequenced. Sequencing primers are BARCODE-SEQ-R1-V4,pLSmP-AG-seqIndx, and BARCODE-SEQ-R2-V4 for both RNAand DNA barcodes (Supplemental Table S3).
RNA and DNA for each of three replicates were sequenced onan Illumina NextSeq instrument (2 × 26 + 10 bp index). The for-ward and reverse reads on this run each sequenced the designed15-bp barcodes as well as an adjacent sequence to correctly trimand consensus call barcodes. We obtained a minimum of 2.9 mil-lion and a maximum of 5.9 million raw counts for DNA (average4.1 million) and a minimum of 20.0 million and a maximum of32.3million raw counts for RNA (average 25.6million). Across rep-licates and sample type, 97%of barcodes were of the correct lengthof 15 bp.
The number of unique sequences was on average 446,000 forDNA and 1.2 million for RNA. When clustering sequences withone substitution (dnaclust) (Ghodsi et al. 2011), the average num-ber of unique sequences reduced to 280,000 for DNA and 697,000for RNA. We speculate that our RNA readouts are impacted by se-quence errors to a greater extent due to the reverse transcriptase(RT) step. When overlapping the observed with the designed se-quences, clustering keeps more counts but reduces the total num-ber of observed barcodes (93.1% versus 90.3%, 145,000 versus151,000). We believe this is due to too many errors in barcodesthat are sufficiently similar to cause clusters to merge across differ-ent designed tag sequences. We therefore dismissed the clustereddata and only matched against the designed barcodes. This is fur-ther supported by counts being more highly correlated betweenreplicates when using the nonclustered data (Spearman’s rhowith-out clustering: DNA replicates 88.6%, RNA replicates 98.0%; withclustering: DNA replicates 85.0%, RNA replicates 94.3%).
Replicates, normalization, and RNA/DNA ratios
To normalize RNA and DNA for different sequencing depths ineach sample, we divided reads by the sum of observed countsand reported them as counts per million. Only barcodes observedin RNA and DNA of the same sample were considered.Subsequently, RNA/DNA ratios were calculated. We observe thatthe dynamic range observed in the WT experiments is larger andthat the average Spearman’s rho is also higher for the WT experi-ments (44.3% versus 39.0%). To determine the RNA/DNA ratiosper insert, we summed up the counts of all barcodes contributingand determined the ratio of the average normalized counts.We ex-plored how stable the correlation of RNA/DNA ratios is betweenreplicates when limiting the number of barcodes per insert(Supplemental Fig S10). We limited the maximum number of bar-
codes considered by (1) randomly down-sampling and (2) requir-ing an exact number of barcodes per insert (i.e., down-samplingthose with more and excluding those inserts with less barcodes).
Alhough normalized individually, the three replicates of eachexperiment do not seem to be on the exact same scale (Fig. 2;Supplemental Fig. S9). We therefore chose to divide the RNA/DNA ratios by the median across the technical replicate value be-fore averaging them.
Predictors of sequence effects
To correlate available annotations with the observed sequenceactivity in HepG2 cells, we downloaded additional narrow-peakcalls for DNA binding proteins/transcription factors in HepG2from ENCODE data. We obtained call sets for the following 64 fac-tors: ARID3A, ATF3, BHLHE40, BRCA1, CBX1, CEBPB, CEBPD,CHD2, CTCF, ELF1, EP300, EZH2, FOSL2, FOXA1, FOXA2,FOXK2, GABPA, GATA4, HCFC1, HDAC2, HNF4A, HNF4G, IRF3,JUN, JUND, MAFF, MAFK, MAX, MAZ, MBD4, MXI1, MYBL2,MYC, NFIC, NR2C2, NRF1, POLR2A, POLR2AphosphoS2,POLR2AphosphoS5, RAD21, RCOR1, REST, RFX5, RXRA, SIN3A,SIN3B, SMC3, SP1, SP2, SRF, TAF1, TBP, TCF12, TCF7L2, TEAD4,TFAP4, USF1, USF2, YY1, ZBTB33, ZBTB7A, ZHX2, ZKSCAN1,and ZNF274. Additionally, we downloaded ChromHMM segmen-tations for HepG2, Open Chromatin State, SegWay, and DHScall sets from the ENCODE portal (Sloan et al. 2016). Fromthe NIH Roadmap Epigenomics Consortium, we obtained RNA-seq, DNA methylation, DNase I, CAGE, H2A.Z, H3K4me1,H3K4me2, H3K4me3, H3K9ac, H3K9me3, H3K27ac, H3K27me3,H3K36me3, H3K79me2, H4K20me1, and ChromHMM segmenta-tions tracks (Roadmap Epigenomics Consortium et al. 2015). Wealso downloaded the FANTOM5 Robust Enhancer annotations(Andersson et al. 2014), FANTOM5 CAGE data for HepG2(FANTOM Consortium and the RIKEN PMI and CLST (DGT)et al. 2014), GenoSTAN Enhancer and promoter predictions(http://i12g-gagneurweb.in.tum.de/public/paper/GenoSTAN/),enhancerFinder predictions (Erwin et al. 2014), as well as motifscan results and annotated regulatory features from the EnsemblRegulatory Build (Zerbino et al. 2015). For further genome-wideand organismal metrics, we turned to the CADD v1.3 annotationfile (Kircher et al. 2014) and extracted local GC and CpG content,SegWay, ChromHMM state across the NIH RoadMap cell types,priPhCons, mamPhCons, verPhCons, priPhyloP, mamPhyloP,verPhyloP, GerpN, GerpS, GerpRS, bStatistic, tOverlapMotifs,motifECount, motifEHIPos, TFBS, TFBSPeaks, TFBSPeaksMax, dis-tance to TSS, and the actual CADD score column.We included thenumber of bases covered by peak calls as well as the average andmaximum values across the designed sequences for those metrics.Supplemental File 3 outlines all annotations used.
Gapped-k-mer SVM (gkm-SVM) model of HepG2 activity
We collected training data of individual ChIP-seq binding factorsdescribed by Ghandi et al. (2014) for HepG2 (5000 specific ChIP-seq peak regions and the same number of random controls; http://www.beerlab.org/gkmsvm/) and removed duplicate sequences,obtaining 225,000peak sequences aswell asmatched randomcon-trols. Attempting to train a classificationmodel with the gkm-SVMsoftware based on all peak sequences exceeded reasonablememoryrequirements (>1TB). Therefore,we iteratively reduced the numberof training examples and ended up sampling each 50,000 peak and50,000 control sequences for a combined HepG2 sequencemodel.Based on a test data set (2000 sampled from the unused trainingdata set), the obtained model has a specificity of 71.8%, a
Inoue et al.
12 Genome Researchwww.genome.org
Cold Spring Harbor Laboratory Press on April 19, 2022 - Published by genome.cshlp.orgDownloaded from
sensitivity of 88.8% and precision of 75.9% for separating ChIP-seq peak from the random control sequences.
Linear models integrating individual annotations
We used the R glmnet package to fit Lasso-penalized linear modelsto predict RNA/DNA ratios. We used 10-fold cross-validation (cv.glmnet) to determine the Lasso tuning parameter lambda resultingin the minimum squared error. The Lasso forces small coefficientsto zero, and thereby performs regression and feature selectionsimultaneously. Otherwisemissing annotation values weremostlyin count features (70.1%) or absence of the conserved block anno-tation “GerpRS” (27.5%), and thus all these valueswere imputed tozero. All annotation features were scaled and centered. Categoricalfeatures with K levels were included as K-1 binary columns.We ex-cluded ZNF274 and EZH2 annotations from the model as none ofthe inserts overlapped with these ChIP-seq tracks. To report unbi-ased correlation values and scatter plots between the true and pre-dicted RNA/DNA ratios, we randomly split up our data into10 folds, trained models using nine folds and the above identifiedtuning parameter, and then extracted the fitted values after apply-ing the model to the remaining fold.
Sequence-based LS-GKM models
LS-GKM (Lee 2016) is a faster and lower memory profile version ofgkm-SVM. Its default settings are different fromgkm-SVM (e.g., us-ing 11 bases with seven informative positions rather than 10 baseswith six informative positions). We applied LS-GKM using param-eters corresponding to gkm-SVM (-l 10 -k 6 -d 3 -t 2 -T 4 -e 0.01) aswell as default parameters (-T 4 -e 0.01) on theHepG2 training datadescribed for gkm-SVMabove (225,327 positive/negative sequenc-es each, 10,000 kept set aside for validation). We also comparedperformance for using the negative sequences as described forgkm-SVM (Ghandi et al. 2014) versus obtaining negative sequenc-es by permutation of the real sequences maintaining dinucleotidecontent (Jiang et al. 2008). We found that best results wereobtained for LS-GKM defaults in combination with selected nega-tive sequences rather than permuted sequences (SupplementalTable S6). However, permuted sequences as a negative set pro-duced a higher true positive rate and substantially simplify com-putation. We therefore used permuted sequence sets and ran LS-GKM with default parameters for all models. We extracted geno-mic sequences (GRCh37) below the 64 ChIP-seq peak sets by con-catenating multiple call sets for the same factor and mergingoverlapping peak regions using BEDTools (Quinlan and Hall2010). We extracted up to 1 kb of sequence for each peak or cen-tered 1-kb fragments on the peak for larger peak calls. We chosethe model convergence parameter e based on the number of posi-tive training sequences (mean 16,600, min. 186, max. 63,948)multiplied with 1 × 10⁻⁷; investing more training iterations forsmaller training data sets.
We then used Lasso regression (as described above) to createcombined models and we also trained LS-GKM models frompooled peak data sets (Supplemental Table S2). For this purpose,we pooled sequences using the peak data sets underlying the top2, 3, 5, 10, and top 15 and all sequence models selected usingLasso regression.
Individual feature models
To explore whether certain annotations are more strongly pre-dictive for either the nonintegrated (MT) or integrated (WT) ex-pression measurements (despite the correlations among theannotations), we used the R glm (Generalized Linear Models) im-plementation to fit 430 linear single coefficient plus intercept
models for predicting log2 RNA/DNA ratios for MT and WT ex-periments. We report the two-sided P-value for the t-statisticcorresponding to the coefficient in the linear model, and useda significance criterion of 0.05 after Bonferroni correction(Supplemental Fig. S22; Supplemental Table S7).
Data access
The sequencing data, designed oligo sequences, and processedcount and RNA/DNA ratio data including annotationshave been submitted to the NCBI Gene Expression Omnibus(GEO; http://www.ncbi.nlm.nih.gov/geo/) under accession num-ber GSE83894.
Acknowledgments
We thank members of the Ahituv, McManus, and Shendurelaboratories for helpful discussions and suggestions. Our workwas supported by the National Human Genome ResearchInstitute (NHGRI) grant number 1R01HG006768 (N.A. and J.S.),NHGRI and Division of Cancer Prevention, National CancerInstitute grant number 1R01CA197139 (G.M.C., D.M.W., N.A.,and J.S.), National Institute of Mental Health grant number1R01MH109907 (N.A.), and the Uehara Memorial Foundation(F.I.). J.S. is an investigator of the Howard Hughes MedicalInstitute.
Author contributions: F.I., M.K., B.M.,M.T.M., N.A., and J.S. de-signed experiments; F.I. and B.M. performed all wet laboratory ex-periments; M.K., J.S., N.A., D.M.W., and G.M.C. outlined dataanalysis; M.K. performed data analysis; F.I., M.K., N.A., and J.S. in-terpreted the experimental results; F.I., M.K., B.M., N.A., and J.S.wrote the manuscript.
References
Alcorn JA, Feitelberg SP, Brenner DA. 1990. Transient induction of c-junduring hepatic regeneration. Hepatology 11: 909–915.
Andersson R, Gebhard C, Miguel-Escalada I, Hoof I, Bornholdt J, Boyd M,Chen Y, Zhao X, Schmidl C, Suzuki T, et al. 2014. An atlas of active en-hancers across human cell types and tissues. Nature 507: 455–461.
Archer TK, Lefebvre P, Wolford RG, Hager GL. 1992. Transcription factorloading on the MMTV promoter: a bimodal mechanism for promoteractivation. Science 255: 1573–1576.
Arnold CD, Gerlach D, Stelzer C, Boryn ŁM, Rath M, Stark A. 2013.Genome-wide quantitative enhancer activity maps identified bySTARR-seq. Science 339: 1074–1077.
Arnold CD, Gerlach D, Spies D, Matts JA, Sytnikova YA, Pagani M, LauNC, Stark A. 2014. Quantitative genome-wide enhancer activitymaps for five Drosophila species show functional enhancer conserva-tion and turnover during cis-regulatory evolution. Nat Genet 46:685–692.
Banerji J, Rusconi S, Schaffner W. 1981. Expression of a β-globin gene is en-hanced by remote SV40 DNA sequences. Cell 27(2 Pt 1): 299–308.
Bassuk AG, Leiden JM. 1995. A direct physical association between ETS andAP-1 transcription factors in normal human T cells. Immunity 3:223–237.
Butler SL, HansenMS, Bushman FD. 2001. A quantitative assay for HIVDNAintegration in vivo. Nat Med 7: 631–634.
The ENCODE Project Consortium. 2012. An integrated encyclopedia ofDNA elements in the human genome. Nature 489: 57–74.
Ernst J, Kellis M. 2012. ChromHMM: automating chromatin-state discoveryand characterization. Nat Methods 9: 215–216.
ErwinGD,Oksenberg N, Truty RM, KostkaD,MurphyKK, AhituvN, PollardKS, Capra JA. 2014. Integrating diverse datasets improves developmen-tal enhancer prediction. PLoS Comput Biol 10: e1003677.
Euskirchen GM, Auerbach RK, Davidov E, Gianoulis TA, Zhong G,Rozowsky J, Bhardwaj N, Gerstein MB, Snyder M. 2011. Diverse rolesand interactions of the SWI/SNF chromatin remodeling complex re-vealed using global approaches. PLoS Genet 7: e1002008.
FANTOM Consortium and the RIKEN PMI and CLST (DGT), Forrest AR,Kawaji H, Rehli M, Baillie JK, de Hoon MJ, Haberle V, Lassmann T,
Comparing chromosomal and episomal reporter assays
Genome Research 13www.genome.org
Cold Spring Harbor Laboratory Press on April 19, 2022 - Published by genome.cshlp.orgDownloaded from
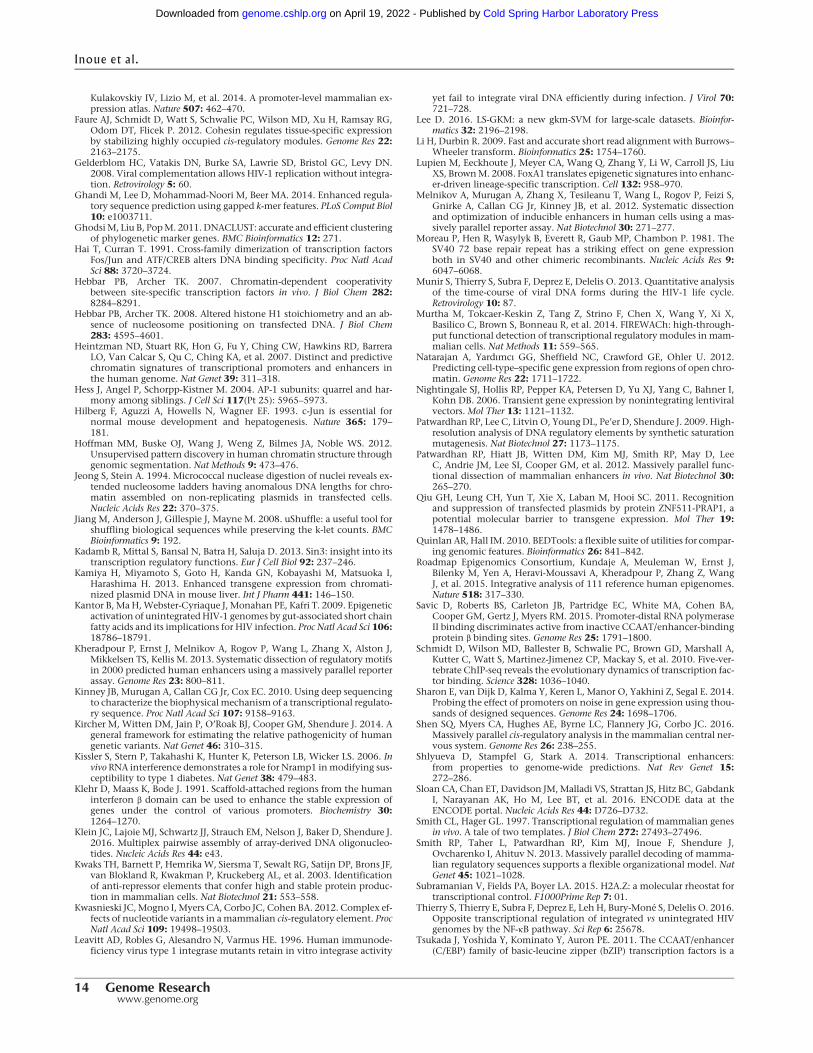
Kulakovskiy IV, Lizio M, et al. 2014. A promoter-level mammalian ex-pression atlas. Nature 507: 462–470.
Faure AJ, Schmidt D, Watt S, Schwalie PC, Wilson MD, Xu H, Ramsay RG,Odom DT, Flicek P. 2012. Cohesin regulates tissue-specific expressionby stabilizing highly occupied cis-regulatory modules. Genome Res 22:2163–2175.
Gelderblom HC, Vatakis DN, Burke SA, Lawrie SD, Bristol GC, Levy DN.2008. Viral complementation allows HIV-1 replication without integra-tion. Retrovirology 5: 60.
Ghandi M, Lee D, Mohammad-Noori M, Beer MA. 2014. Enhanced regula-tory sequence prediction using gapped k-mer features. PLoS Comput Biol10: e1003711.
GhodsiM, Liu B, PopM. 2011. DNACLUST: accurate and efficient clusteringof phylogenetic marker genes. BMC Bioinformatics 12: 271.
Hai T, Curran T. 1991. Cross-family dimerization of transcription factorsFos/Jun and ATF/CREB alters DNA binding specificity. Proc Natl AcadSci 88: 3720–3724.
Hebbar PB, Archer TK. 2007. Chromatin-dependent cooperativitybetween site-specific transcription factors in vivo. J Biol Chem 282:8284–8291.
Hebbar PB, Archer TK. 2008. Altered histone H1 stoichiometry and an ab-sence of nucleosome positioning on transfected DNA. J Biol Chem283: 4595–4601.
Heintzman ND, Stuart RK, Hon G, Fu Y, Ching CW, Hawkins RD, BarreraLO, Van Calcar S, Qu C, Ching KA, et al. 2007. Distinct and predictivechromatin signatures of transcriptional promoters and enhancers inthe human genome. Nat Genet 39: 311–318.
Hess J, Angel P, Schorpp-Kistner M. 2004. AP-1 subunits: quarrel and har-mony among siblings. J Cell Sci 117(Pt 25): 5965–5973.
Hilberg F, Aguzzi A, Howells N, Wagner EF. 1993. c-Jun is essential fornormal mouse development and hepatogenesis. Nature 365: 179–181.
Hoffman MM, Buske OJ, Wang J, Weng Z, Bilmes JA, Noble WS. 2012.Unsupervised pattern discovery in human chromatin structure throughgenomic segmentation. Nat Methods 9: 473–476.
Jeong S, Stein A. 1994. Micrococcal nuclease digestion of nuclei reveals ex-tended nucleosome ladders having anomalous DNA lengths for chro-matin assembled on non-replicating plasmids in transfected cells.Nucleic Acids Res 22: 370–375.
Jiang M, Anderson J, Gillespie J, Mayne M. 2008. uShuffle: a useful tool forshuffling biological sequences while preserving the k-let counts. BMCBioinformatics 9: 192.
Kadamb R, Mittal S, Bansal N, Batra H, Saluja D. 2013. Sin3: insight into itstranscription regulatory functions. Eur J Cell Biol 92: 237–246.
Kamiya H, Miyamoto S, Goto H, Kanda GN, Kobayashi M, Matsuoka I,Harashima H. 2013. Enhanced transgene expression from chromati-nized plasmid DNA in mouse liver. Int J Pharm 441: 146–150.
Kantor B, Ma H,Webster-Cyriaque J, Monahan PE, Kafri T. 2009. Epigeneticactivation of unintegrated HIV-1 genomes by gut-associated short chainfatty acids and its implications for HIV infection. Proc Natl Acad Sci 106:18786–18791.
Kheradpour P, Ernst J, Melnikov A, Rogov P, Wang L, Zhang X, Alston J,Mikkelsen TS, Kellis M. 2013. Systematic dissection of regulatory motifsin 2000 predicted human enhancers using a massively parallel reporterassay. Genome Res 23: 800–811.
Kinney JB, Murugan A, Callan CG Jr, Cox EC. 2010. Using deep sequencingto characterize the biophysicalmechanism of a transcriptional regulato-ry sequence. Proc Natl Acad Sci 107: 9158–9163.
Kircher M, Witten DM, Jain P, O’Roak BJ, Cooper GM, Shendure J. 2014. Ageneral framework for estimating the relative pathogenicity of humangenetic variants. Nat Genet 46: 310–315.
Kissler S, Stern P, Takahashi K, Hunter K, Peterson LB, Wicker LS. 2006. Invivo RNA interference demonstrates a role for Nramp1 inmodifying sus-ceptibility to type 1 diabetes. Nat Genet 38: 479–483.
Klehr D, Maass K, Bode J. 1991. Scaffold-attached regions from the humaninterferon β domain can be used to enhance the stable expression ofgenes under the control of various promoters. Biochemistry 30:1264–1270.
Klein JC, Lajoie MJ, Schwartz JJ, Strauch EM, Nelson J, Baker D, Shendure J.2016. Multiplex pairwise assembly of array-derived DNA oligonucleo-tides. Nucleic Acids Res 44: e43.
Kwaks TH, Barnett P, Hemrika W, Siersma T, Sewalt RG, Satijn DP, Brons JF,van Blokland R, Kwakman P, Kruckeberg AL, et al. 2003. Identificationof anti-repressor elements that confer high and stable protein produc-tion in mammalian cells. Nat Biotechnol 21: 553–558.
Kwasnieski JC,Mogno I, Myers CA, Corbo JC, Cohen BA. 2012. Complex ef-fects of nucleotide variants in amammalian cis-regulatory element. ProcNatl Acad Sci 109: 19498–19503.
Leavitt AD, Robles G, Alesandro N, Varmus HE. 1996. Human immunode-ficiency virus type 1 integrase mutants retain in vitro integrase activity
yet fail to integrate viral DNA efficiently during infection. J Virol 70:721–728.
Lee D. 2016. LS-GKM: a new gkm-SVM for large-scale datasets. Bioinfor-matics 32: 2196–2198.
Li H, Durbin R. 2009. Fast and accurate short read alignment with Burrows–Wheeler transform. Bioinformatics 25: 1754–1760.
Lupien M, Eeckhoute J, Meyer CA, Wang Q, Zhang Y, Li W, Carroll JS, LiuXS, BrownM. 2008. FoxA1 translates epigenetic signatures into enhanc-er-driven lineage-specific transcription. Cell 132: 958–970.
Melnikov A, Murugan A, Zhang X, Tesileanu T, Wang L, Rogov P, Feizi S,Gnirke A, Callan CG Jr, Kinney JB, et al. 2012. Systematic dissectionand optimization of inducible enhancers in human cells using a mas-sively parallel reporter assay. Nat Biotechnol 30: 271–277.
Moreau P, Hen R, Wasylyk B, Everett R, Gaub MP, Chambon P. 1981. TheSV40 72 base repair repeat has a striking effect on gene expressionboth in SV40 and other chimeric recombinants. Nucleic Acids Res 9:6047–6068.
Munir S, Thierry S, Subra F, Deprez E, Delelis O. 2013. Quantitative analysisof the time-course of viral DNA forms during the HIV-1 life cycle.Retrovirology 10: 87.
Murtha M, Tokcaer-Keskin Z, Tang Z, Strino F, Chen X, Wang Y, Xi X,Basilico C, Brown S, Bonneau R, et al. 2014. FIREWACh: high-through-put functional detection of transcriptional regulatory modules in mam-malian cells. Nat Methods 11: 559–565.
Natarajan A, Yardımcı GG, Sheffield NC, Crawford GE, Ohler U. 2012.Predicting cell-type–specific gene expression from regions of open chro-matin. Genome Res 22: 1711–1722.
Nightingale SJ, Hollis RP, Pepper KA, Petersen D, Yu XJ, Yang C, Bahner I,Kohn DB. 2006. Transient gene expression by nonintegrating lentiviralvectors. Mol Ther 13: 1121–1132.
Patwardhan RP, Lee C, Litvin O, YoungDL, Pe’er D, Shendure J. 2009. High-resolution analysis of DNA regulatory elements by synthetic saturationmutagenesis. Nat Biotechnol 27: 1173–1175.
Patwardhan RP, Hiatt JB, Witten DM, Kim MJ, Smith RP, May D, LeeC, Andrie JM, Lee SI, Cooper GM, et al. 2012. Massively parallel func-tional dissection of mammalian enhancers in vivo. Nat Biotechnol 30:265–270.
Qiu GH, Leung CH, Yun T, Xie X, Laban M, Hooi SC. 2011. Recognitionand suppression of transfected plasmids by protein ZNF511-PRAP1, apotential molecular barrier to transgene expression. Mol Ther 19:1478–1486.
Quinlan AR, Hall IM. 2010. BEDTools: a flexible suite of utilities for compar-ing genomic features. Bioinformatics 26: 841–842.
Roadmap Epigenomics Consortium, Kundaje A, Meuleman W, Ernst J,Bilenky M, Yen A, Heravi-Moussavi A, Kheradpour P, Zhang Z, WangJ, et al. 2015. Integrative analysis of 111 reference human epigenomes.Nature 518: 317–330.
Savic D, Roberts BS, Carleton JB, Partridge EC, White MA, Cohen BA,Cooper GM, Gertz J, Myers RM. 2015. Promoter-distal RNA polymeraseII binding discriminates active from inactive CCAAT/enhancer-bindingprotein β binding sites. Genome Res 25: 1791–1800.
Schmidt D, Wilson MD, Ballester B, Schwalie PC, Brown GD, Marshall A,Kutter C, Watt S, Martinez-Jimenez CP, Mackay S, et al. 2010. Five-ver-tebrate ChIP-seq reveals the evolutionary dynamics of transcription fac-tor binding. Science 328: 1036–1040.
Sharon E, van Dijk D, Kalma Y, Keren L, Manor O, Yakhini Z, Segal E. 2014.Probing the effect of promoters on noise in gene expression using thou-sands of designed sequences. Genome Res 24: 1698–1706.
Shen SQ, Myers CA, Hughes AE, Byrne LC, Flannery JG, Corbo JC. 2016.Massively parallel cis-regulatory analysis in the mammalian central ner-vous system. Genome Res 26: 238–255.
Shlyueva D, Stampfel G, Stark A. 2014. Transcriptional enhancers:from properties to genome-wide predictions. Nat Rev Genet 15:272–286.
Sloan CA, Chan ET, Davidson JM,Malladi VS, Strattan JS, Hitz BC, GabdankI, Narayanan AK, Ho M, Lee BT, et al. 2016. ENCODE data at theENCODE portal. Nucleic Acids Res 44: D726–D732.
Smith CL, Hager GL. 1997. Transcriptional regulation of mammalian genesin vivo. A tale of two templates. J Biol Chem 272: 27493–27496.
Smith RP, Taher L, Patwardhan RP, Kim MJ, Inoue F, Shendure J,Ovcharenko I, Ahituv N. 2013. Massively parallel decoding of mamma-lian regulatory sequences supports a flexible organizational model. NatGenet 45: 1021–1028.
Subramanian V, Fields PA, Boyer LA. 2015. H2A.Z: a molecular rheostat fortranscriptional control. F1000Prime Rep 7: 01.
Thierry S, Thierry E, Subra F, Deprez E, Leh H, Bury-Moné S, Delelis O. 2016.Opposite transcriptional regulation of integrated vs unintegrated HIVgenomes by the NF-κB pathway. Sci Rep 6: 25678.
Tsukada J, Yoshida Y, Kominato Y, Auron PE. 2011. The CCAAT/enhancer(C/EBP) family of basic-leucine zipper (bZIP) transcription factors is a
Inoue et al.
14 Genome Researchwww.genome.org
Cold Spring Harbor Laboratory Press on April 19, 2022 - Published by genome.cshlp.orgDownloaded from
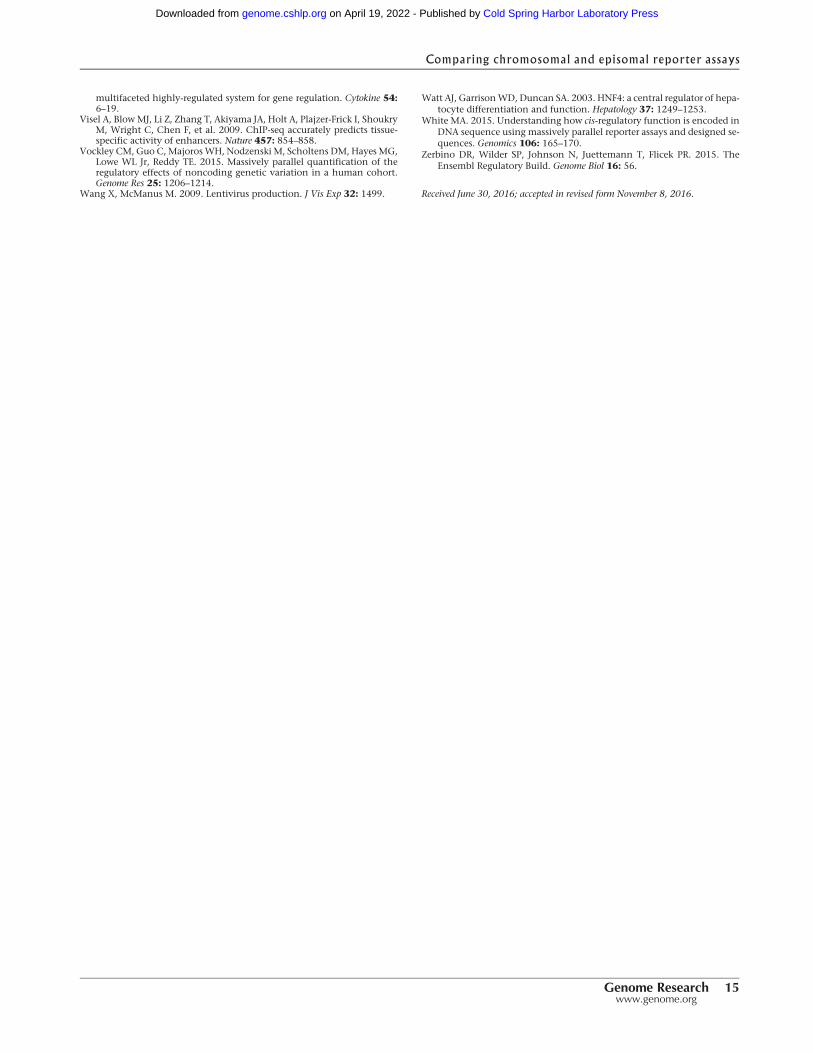
multifaceted highly-regulated system for gene regulation. Cytokine 54:6–19.
Visel A, BlowMJ, Li Z, Zhang T, Akiyama JA, Holt A, Plajzer-Frick I, ShoukryM, Wright C, Chen F, et al. 2009. ChIP-seq accurately predicts tissue-specific activity of enhancers. Nature 457: 854–858.
Vockley CM, Guo C, MajorosWH, Nodzenski M, Scholtens DM, Hayes MG,Lowe WL Jr, Reddy TE. 2015. Massively parallel quantification of theregulatory effects of noncoding genetic variation in a human cohort.Genome Res 25: 1206–1214.
Wang X, McManus M. 2009. Lentivirus production. J Vis Exp 32: 1499.
Watt AJ, GarrisonWD, Duncan SA. 2003. HNF4: a central regulator of hepa-tocyte differentiation and function. Hepatology 37: 1249–1253.
White MA. 2015. Understanding how cis-regulatory function is encoded inDNA sequence using massively parallel reporter assays and designed se-quences. Genomics 106: 165–170.
Zerbino DR, Wilder SP, Johnson N, Juettemann T, Flicek PR. 2015. TheEnsembl Regulatory Build. Genome Biol 16: 56.
Received June 30, 2016; accepted in revised form November 8, 2016.
Comparing chromosomal and episomal reporter assays
Genome Research 15www.genome.org
Cold Spring Harbor Laboratory Press on April 19, 2022 - Published by genome.cshlp.orgDownloaded from
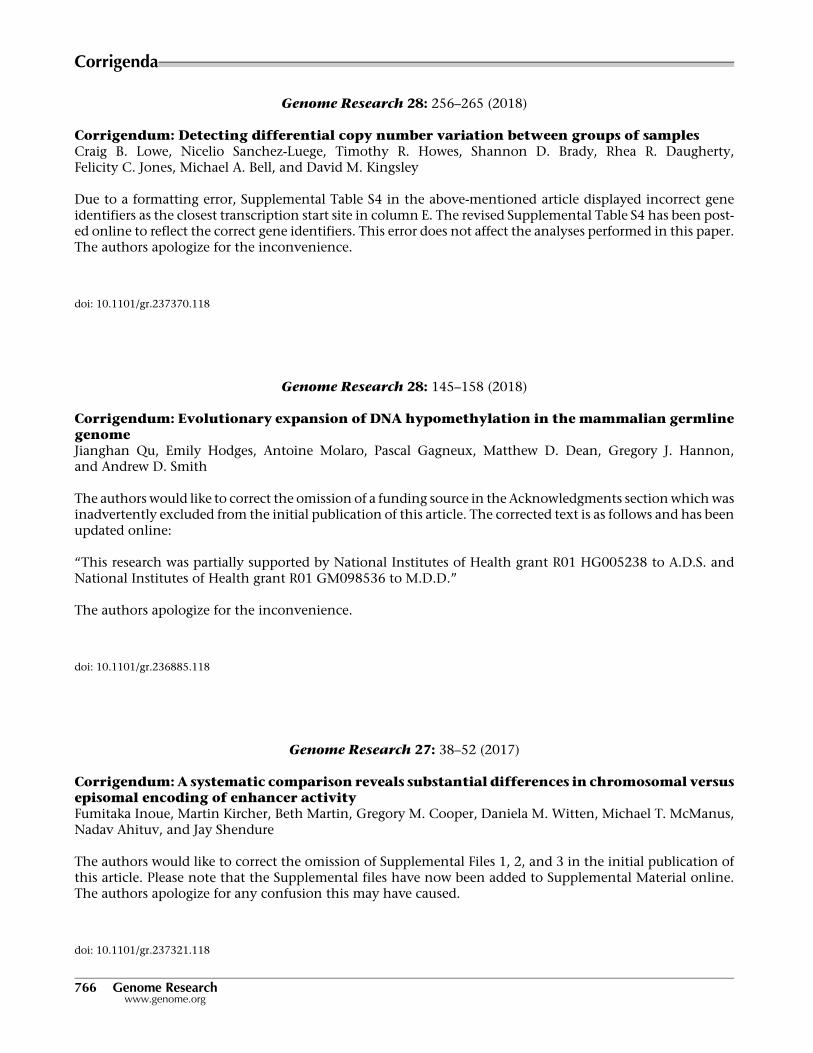
Genome Research 28: 256–265 (2018)
Corrigendum: Detecting differential copy number variation between groups of samplesCraig B. Lowe, Nicelio Sanchez-Luege, Timothy R. Howes, Shannon D. Brady, Rhea R. Daugherty,Felicity C. Jones, Michael A. Bell, and David M. Kingsley
Due to a formatting error, Supplemental Table S4 in the above-mentioned article displayed incorrect geneidentifiers as the closest transcription start site in column E. The revised Supplemental Table S4 has been post-ed online to reflect the correct gene identifiers. This error does not affect the analyses performed in this paper.The authors apologize for the inconvenience.
doi: 10.1101/gr.237370.118
Genome Research 28: 145–158 (2018)
Corrigendum: Evolutionary expansion of DNA hypomethylation in themammalian germlinegenomeJianghan Qu, Emily Hodges, Antoine Molaro, Pascal Gagneux, Matthew D. Dean, Gregory J. Hannon,and Andrew D. Smith
The authors would like to correct the omission of a funding source in the Acknowledgments sectionwhichwasinadvertently excluded from the initial publication of this article. The corrected text is as follows and has beenupdated online:
“This research was partially supported by National Institutes of Health grant R01 HG005238 to A.D.S. andNational Institutes of Health grant R01 GM098536 to M.D.D.”
The authors apologize for the inconvenience.
doi: 10.1101/gr.236885.118
Genome Research 27: 38–52 (2017)
Corrigendum:A systematic comparison reveals substantial differences in chromosomal versusepisomal encoding of enhancer activityFumitaka Inoue, Martin Kircher, Beth Martin, Gregory M. Cooper, Daniela M. Witten, Michael T. McManus,Nadav Ahituv, and Jay Shendure
The authors would like to correct the omission of Supplemental Files 1, 2, and 3 in the initial publication ofthis article. Please note that the Supplemental files have now been added to Supplemental Material online.The authors apologize for any confusion this may have caused.
doi: 10.1101/gr.237321.118
Corrigenda
766 Genome Researchwww.genome.org
10.1101/gr.212092.116Access the most recent version at doi: published online November 9, 2016Genome Res.
Fumitaka Inoue, Martin Kircher, Beth Martin, et al. chromosomal versus episomal encoding of enhancer activityA systematic comparison reveals substantial differences in
Material
Supplemental
http://genome.cshlp.org/content/suppl/2016/12/19/gr.212092.116.DC1
Related Content
Genome Res. May , 2018 28: 766.3
Fumitaka Inoue, Martin Kircher, Beth Martin, et al.chromosomal versus episomal encoding of enhancer activityCorrigendum: A systematic comparison reveals substantial differences in
P<P
Published online November 9, 2016 in advance of the print journal.
License
Commons Creative
.http://creativecommons.org/licenses/by-nc/4.0/described at a Creative Commons License (Attribution-NonCommercial 4.0 International), as
). After six months, it is available underhttp://genome.cshlp.org/site/misc/terms.xhtmlfirst six months after the full-issue publication date (see This article is distributed exclusively by Cold Spring Harbor Laboratory Press for the
ServiceEmail Alerting
click here.top right corner of the article or
Receive free email alerts when new articles cite this article - sign up in the box at the
https://genome.cshlp.org/subscriptionsgo to: Genome Research To subscribe to
© 2017 Inoue et al.; Published by Cold Spring Harbor Laboratory Press
Cold Spring Harbor Laboratory Press on April 19, 2022 - Published by genome.cshlp.orgDownloaded from