A Systematic Approach to Find the Optimum Tilt Angle for Meeting the Maximum Energy Demand of an...
6
A Systematic Approach to Find the Optimum Tilt Angle for Meeting the Maximum Energy Demand of an Isolated Area Alimul Haque Khan Electrical & Electronic Engineering Bangladesh University of Engineering & Technology Dhaka, Bangladesh Email: [email protected] Maidul Islam Electrical & Electronic Engineering Bangladesh University of Engineering & Technology Dhaka, Bangladesh Email: [email protected] Asif Islam Information Technology & Electrical Engineering The University of Queensland Brisbane, Australia Email: [email protected] Mohammad Saifur Rahman Electrical & Electronic Engineering Bangladesh University of Engineering & Technology Dhaka, Bangladesh Email: [email protected] Abstract— The aim of this paper is to find the optimum tilt angle of solar PV panel at which the yearly demand would be met maximum. Solar PV is one of the most widely used renewable energy resources. The output of a panel is highest when the incident ray is perpendicular to the panel plane. Due to variations in the locus of the sun over the year, the alignment of the panel should be changed according to the sun position for maximum generation. However, changing the tilt angle needs single axis tracker or double axes tracker which is costly and also needs maintenance; thus may not be suitable. Therefore, the panel is kept at the average tilt of year at which the ray is perpendicular for the maximum time. This may be termed as the default tilt angle. The generation of solar panel varies over the year providing maximum generation at the default tilt angle. Similarly, the consumption of an area is also varies over the year. The amount of generation may not proportional as the demand, thus it results surplus or shortage. For an isolated area, it is hardly possible to use surplus energy considering certain demand profile. Even, it is not possible to store the surplus energy of a season to any device for long time to use it for another season. However, the surplus energy of a season may be shifted to the shortage season by changing the tilt angle. Different tilt angle will provide different pattern of generation over the year. The generation at optimum tilt angle will not maximize the generation of energy over the year rather it will maximize the demand met by shifting the energy to shortage season from surplus season. A new concept to maximize the energy usage from solar PV by changing the tilt angle and thus minimize the shortage to meet the demand of an isolated power system is also introduced here. Keywords— load management; micro-grid; optimization; penetration; renewable energy; tilt angle. I. INTRODUCTION The sun is the source of all energy of the world. Wind, hydro, fuel, tidal and many other sources of energy directly or indirectly receive energy from sunlight. Sunlight is the light and heat energy that comes from the sun. When this energy reaches the surface of the earth, it is called solar insolation. What we experience as sunlight is actually solar radiation. It is the radiation and heat from the Sun in the form of electromagnetic waves. Sunlight is a portion of the electromagnetic radiation given off by the sun, in particular infrared, visible, and ultraviolet light. On earth, sunlight is filtered through the atmosphere of the earth, and is obvious as daylight when the Sun is above the horizon. When the direct solar radiation is not blocked by clouds, it is experienced as sunshine, a combination of bright light and radiant heat. When it is blocked by the clouds or reflects off other objects, it is experienced as the diffused light. Both light and heat of radiation can be used for our daily life. There are many ways to utilize the solar radiation such as direct heating of water, drying clothes, drying grains, generation of electricity etc. Generation of electricity may be accomplished by directly converting the light into electricity or using the heat energy as a source to boil the steam for a steam turbine. Solar power may be classified two categories, namely, solar thermal and solar photovoltaic (PV). However, only solar PV part will be discussed in this paper for generating solar power. The light energy of solar radiation can be converted into direct current of electricity by using a solar cell, which acts as the fundamental power conversion unit. It is made from semi- conductor similar structure like diode. The solar cells are being made from different materials and different structure in the quest of maximum power with minimum cost. However, the efficiency of commercial cells is less than half of the value tested at laboratories. Among the several types of solar cell, poly-crystalline and mono-crystalline solar cells are mostly available. Besides these, amorphous and thin film solar cells are also available in the market. Solar cells are arrangements of semiconductors to convert sunlight directly into electricity by exploiting photovoltaic effect. The incident energy of light creates mobile charged particles in the semiconductor, which are then separated by the device structure and used to produce electrical current. A means of predicting the solar radiation in a frequently overcast climate is describes and proposes a method for choosing the optimum tilt angle in such a climate. The effect of different load profiles on the optimum tilt angle is also investigated [1]. Using daily optimal tilt angle can increase
-
Upload
bangladeshuniversity -
Category
Documents
-
view
7 -
download
0
Transcript of A Systematic Approach to Find the Optimum Tilt Angle for Meeting the Maximum Energy Demand of an...
A Systematic Approach to Find the Optimum Tilt Angle for Meeting the Maximum Energy Demand of
an Isolated Area Alimul Haque Khan
Electrical & Electronic Engineering Bangladesh University of Engineering & Technology
Dhaka, Bangladesh Email: [email protected]
Maidul Islam Electrical & Electronic Engineering
Bangladesh University of Engineering & Technology Dhaka, Bangladesh
Email: [email protected]
Asif Islam Information Technology & Electrical Engineering
The University of Queensland Brisbane, Australia
Email: [email protected]
Mohammad Saifur Rahman Electrical & Electronic Engineering
Bangladesh University of Engineering & Technology Dhaka, Bangladesh
Email: [email protected]
Abstract— The aim of this paper is to find the optimum tilt
angle of solar PV panel at which the yearly demand would be met maximum. Solar PV is one of the most widely used renewable energy resources. The output of a panel is highest when the incident ray is perpendicular to the panel plane. Due to variations in the locus of the sun over the year, the alignment of the panel should be changed according to the sun position for maximum generation. However, changing the tilt angle needs single axis tracker or double axes tracker which is costly and also needs maintenance; thus may not be suitable. Therefore, the panel is kept at the average tilt of year at which the ray is perpendicular for the maximum time. This may be termed as the default tilt angle. The generation of solar panel varies over the year providing maximum generation at the default tilt angle. Similarly, the consumption of an area is also varies over the year. The amount of generation may not proportional as the demand, thus it results surplus or shortage. For an isolated area, it is hardly possible to use surplus energy considering certain demand profile. Even, it is not possible to store the surplus energy of a season to any device for long time to use it for another season. However, the surplus energy of a season may be shifted to the shortage season by changing the tilt angle. Different tilt angle will provide different pattern of generation over the year. The generation at optimum tilt angle will not maximize the generation of energy over the year rather it will maximize the demand met by shifting the energy to shortage season from surplus season. A new concept to maximize the energy usage from solar PV by changing the tilt angle and thus minimize the shortage to meet the demand of an isolated power system is also introduced here.
Keywords— load management; micro-grid; optimization; penetration; renewable energy; tilt angle.
I. INTRODUCTION
The sun is the source of all energy of the world. Wind, hydro, fuel, tidal and many other sources of energy directly or indirectly receive energy from sunlight. Sunlight is the light and heat energy that comes from the sun. When this energy reaches the surface of the earth, it is called solar insolation. What we experience as sunlight is actually solar radiation. It is the radiation and heat from the Sun in the form of electromagnetic waves. Sunlight is a portion of the electromagnetic radiation given off by the sun, in particular
infrared, visible, and ultraviolet light. On earth, sunlight is filtered through the atmosphere of the earth, and is obvious as daylight when the Sun is above the horizon. When the direct solar radiation is not blocked by clouds, it is experienced as sunshine, a combination of bright light and radiant heat. When it is blocked by the clouds or reflects off other objects, it is experienced as the diffused light.
Both light and heat of radiation can be used for our daily life. There are many ways to utilize the solar radiation such as direct heating of water, drying clothes, drying grains, generation of electricity etc. Generation of electricity may be accomplished by directly converting the light into electricity or using the heat energy as a source to boil the steam for a steam turbine. Solar power may be classified two categories, namely, solar thermal and solar photovoltaic (PV). However, only solar PV part will be discussed in this paper for generating solar power.
The light energy of solar radiation can be converted into direct current of electricity by using a solar cell, which acts as the fundamental power conversion unit. It is made from semi-conductor similar structure like diode. The solar cells are being made from different materials and different structure in the quest of maximum power with minimum cost. However, the efficiency of commercial cells is less than half of the value tested at laboratories. Among the several types of solar cell, poly-crystalline and mono-crystalline solar cells are mostly available. Besides these, amorphous and thin film solar cells are also available in the market.
Solar cells are arrangements of semiconductors to convert sunlight directly into electricity by exploiting photovoltaic effect. The incident energy of light creates mobile charged particles in the semiconductor, which are then separated by the device structure and used to produce electrical current.
A means of predicting the solar radiation in a frequently overcast climate is describes and proposes a method for choosing the optimum tilt angle in such a climate. The effect of different load profiles on the optimum tilt angle is also investigated [1]. Using daily optimal tilt angle can increase
the energy received than using optimal monthly tilt angle. However, trade-off needs to be made since changing the panel angle daily costs more effort. The solar energy prediction is based on a typical daily distribution. Two methods of solar radiation prediction were proposed and compared to give average daily radiation distribution prediction [2]. The optimization method was based on the Liu and Jordan model for solar energy incident on a tilt surface [3]. A method in determining the tilt angle for photovoltaic (PV) modules combined an artificial neural network and a genetic algorithm (ANNGA) [4]. In this analysis, it is found that, the maximum demand for an isolated grid is not met at the default tilt angle of solar panel; rather, it depends on the demand pattern as well as the generation pattern. The idea about the best matching pattern of generation at different tilt angles with the demand profile could be best comprehended from their correlation coefficients.
II. EFFECTS OF TEMPERATURE AND IRRADIANCE
Temperature has a negative co-efficient for voltage normally around -23mVK-1 for PV cells and positive co-efficient for current, which is very small and negligible [5]. The generated power of a solar cell decreases with increase of temperature. The maximum power points for various temperatures also move towards the origin when temperature is increased. Short circuit current is directly proportional to the flux of photon with the band gap energy. The irradiance has negligible effect on voltage. As a result, power is directly proportional to the irradiance of the radiation.
III. EFFECTS OF ANGLE OF INCIDENCE
Angle of incidence is an important factor. The number of incident photon is maximum when the incident ray is perpendicular to the plane of the solar panel. This can be described by the following equation.
I=Iocos(α) (1) Where, α is the tilt angle, the angle between the incident ray and
the area vector of the panel plane, Io= received irradiance when α=0o and I= received irradiance when α=other than 0o
As the sun seems to move from east to west, the angle of incident also varies with position of the sun. On the other hand, the position of the locus of the sun is also changed with the year round. Therefore, this is another reason for the change of the incident angle of the ray.
To have maximum power output, a maximum power point tracker is being used worldwide. Single axis sun tracker has been developed for better daily performance and dual axis sun tracker has been developed for better yearly performance. However, the cost associated with the sun tracker and the necessity of additional space have nullified the better performance of the sun tracker.
IV. THE PROPOSED APPROACH FOR FINDING THE OPTIMUM TILT ANGLE FOR MEETING THE MAXIMUM DEMAND.
The panel is ideally kept at a tilt angle equal to its latitude, which is about 23.50 for Bangladesh. This gives an overall higher output for electricity generation. However, considering the load profile over the year, the best performance may not be found at the default latitude angle.
This is an important analysis for maximizing the utilization of the output. For smaller and isolated system, the surplus energy is not utilized normally. On the other hand, shortages are to be met by an alternate approach. By changing the tilt angle, it is possible, to some extent, to shift the surplus energy for the season when there is shortage. The following analysis is targeted to have the minimum shortage for the isolated systems.
It is assumed that the area is isolated from the grid. The demand profile is assumed as that of naitonal grid and the generation profile is assumed as that of Dhaka. Though most of the area of Dhaka is electrified, it will have no effect on the results. As the system is assumed to be isolated, there is no scope of utilizing the surplus, and the shortage must be met by an alternative source. The surplus energy can not be stored for long time for seasonal use. The analysed figure shows that during November to April of a year has a surplus and June to July has a remarkable shortage. However, it is technically and economically not feasible to store surplus of one season to use it for another season. It has been found that, by changing the tilt angle, it is possible to shift the curve to a suitable position, where the met energy demand will be maximum.
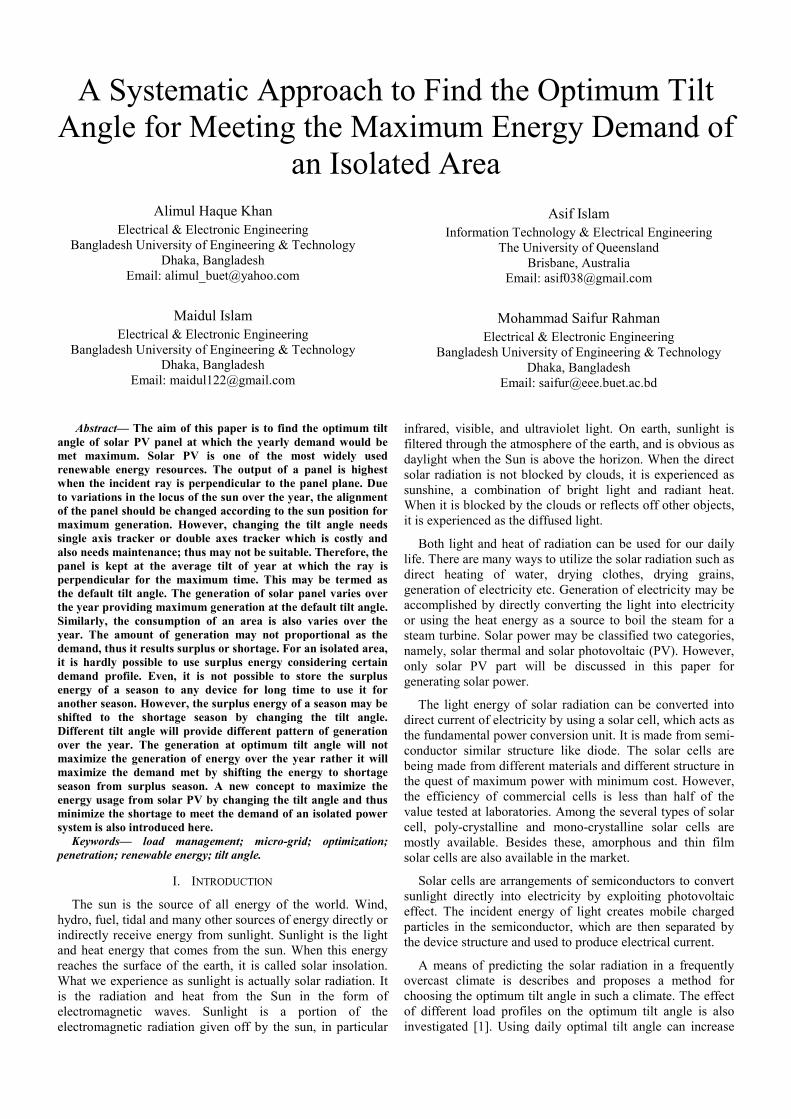
It has been noticed that the generation is lower at June to september and higher for October to May. By changinng the tilt angle it is possible to have higher generation during June to september, where the demand is higher, thus the shortage can be minimized. However, the surplus will also become less, but it is not a factor for an isolated system at all. The choice of a suitable tilt angle for erecting the solar panel is discussed here. To understand the effect of changing the tilt angle, the sun path daigram is described here with the help of Fig. 1.
Fig. 1 Sun path diagram for Bangladesh
The sun path diagram shows the locus of sun over the year. This is generated for a latitude of 240 and the longitude of 900. The elevation of the sun varies from 430 to 890 for the variation of winter season to summer season. The winter has a shorter range of azimuth and the summer has a longer range of azimuth. As a result, the winter has a shorter day than night and the summer, a longer day. For this reason the winter should have the lower generation and summer should have the higher generation. The maximum power at the winter (December 21) will be generated at the tilt angle of (900-430) = 470 and for the summer season (June 210) it will be at (900-890) = 10degee. For the rest of the year, the tilt angle where the maximum power occurs, varies from 10 to 470. For maximum energy generation over the year the tilt
angle is taken averagae of the both the extremeties (10 and 470 ), which is 240 for this example.
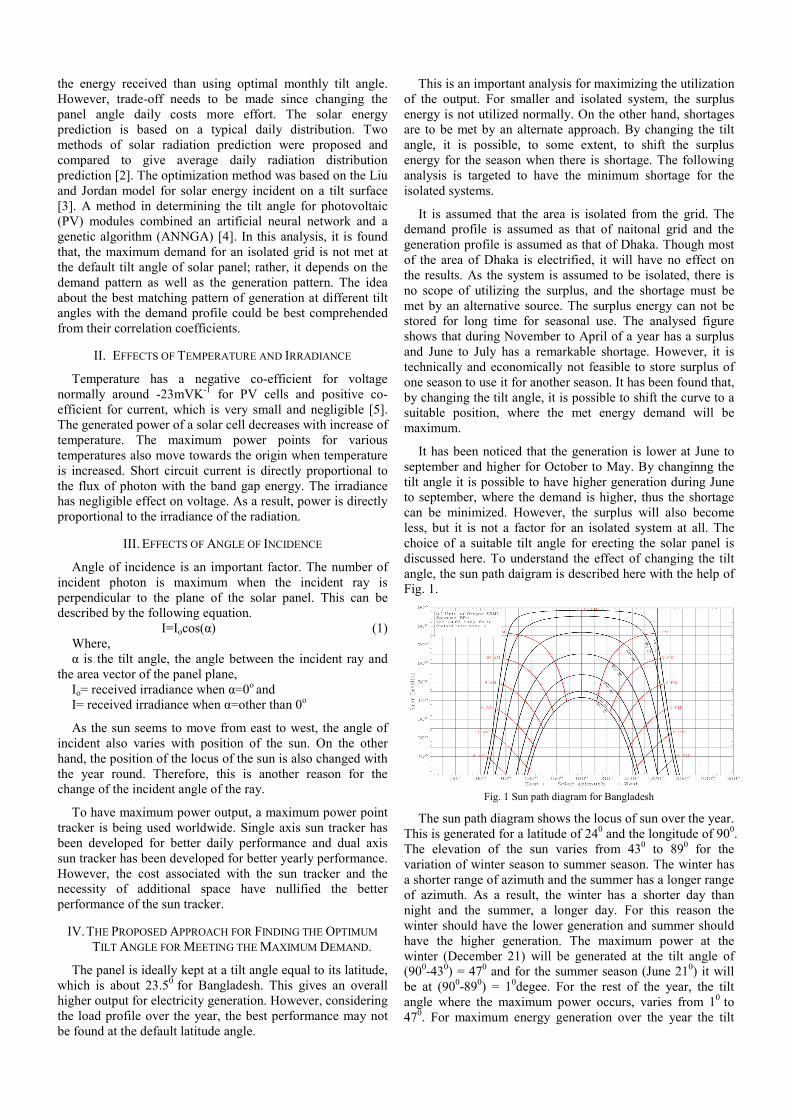
Considering the temperature, change of irradiance due to cloud, fog, rain the output is not proportional to the duration of the day, rather it depends on the total solar insolation (total energy per square meter within a fixed duration) of the day. The total output for a solar PV panel could be found by using the “PVwatt” database, which is an online software provided by the National Renewable Energy Lab (NREL), Canada in reference [6]. NREL has 08 observation points for Bangladesh- Bogra, Chittagong, Cox’s Bazar, Dhaka, Ishwardi, Jessore, Rangpur and Sylhet. The outputs of a 1kWp solar PV panel at different locations of Bangldesh at its default tilt angle (latitude of 23.50) is shown in Fig. 2. The corresponding irradiance is shown at Fig. 3.
Fig. 2 The outputs of a 1kWp solar PV panel at different location of Bangldesh at its default tilt angle (latitude) .
Fig. 3: The availabe irradiance at different location of Bangldesh
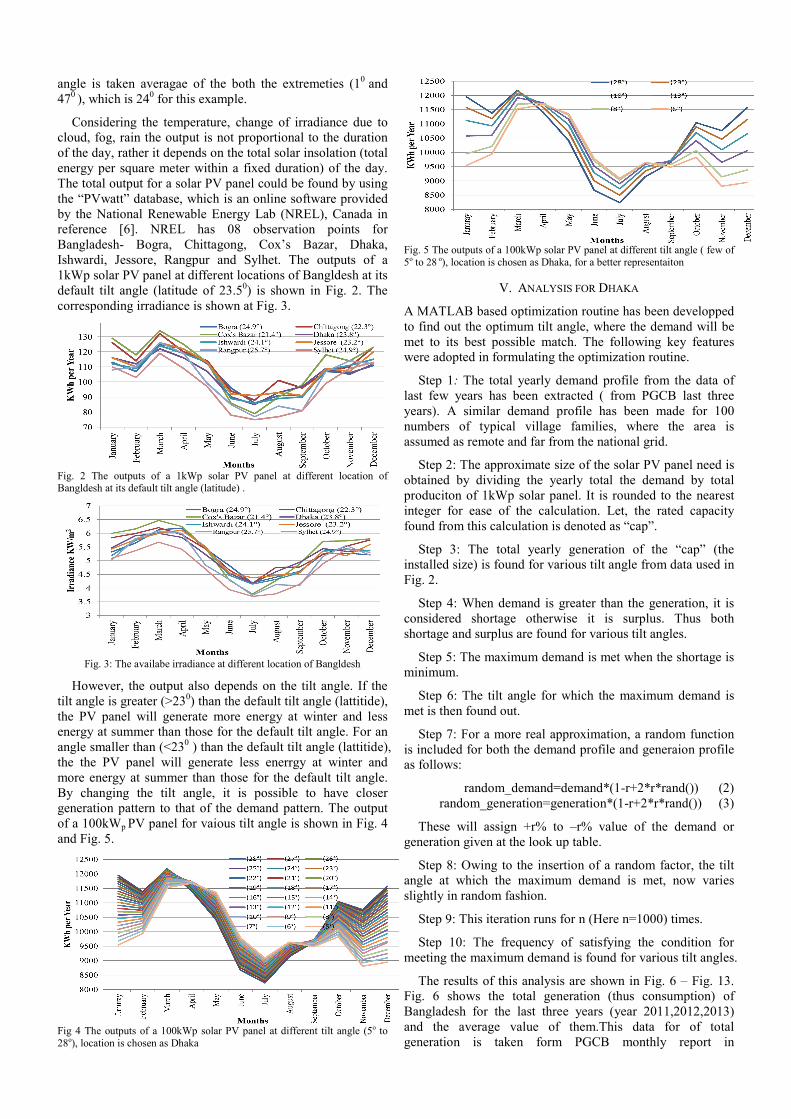
However, the output also depends on the tilt angle. If the tilt angle is greater (>230) than the default tilt angle (lattitide), the PV panel will generate more energy at winter and less energy at summer than those for the default tilt angle. For an angle smaller than (<230 ) than the default tilt angle (lattitide), the the PV panel will generate less enerrgy at winter and more energy at summer than those for the default tilt angle. By changing the tilt angle, it is possible to have closer generation pattern to that of the demand pattern. The output of a 100kWp PV panel for vaious tilt angle is shown in Fig. 4 and Fig. 5.
Fig 4 The outputs of a 100kWp solar PV panel at different tilt angle (5o to 28o), location is chosen as Dhaka
Fig. 5 The outputs of a 100kWp solar PV panel at different tilt angle ( few of 5o to 28 o), location is chosen as Dhaka, for a better representaiton
V. ANALYSIS FOR DHAKA
A MATLAB based optimization routine has been developped to find out the optimum tilt angle, where the demand will be met to its best possible match. The following key features were adopted in formulating the optimization routine.
Step 1: The total yearly demand profile from the data of last few years has been extracted ( from PGCB last three years). A similar demand profile has been made for 100 numbers of typical village families, where the area is assumed as remote and far from the national grid.
Step 2: The approximate size of the solar PV panel need is obtained by dividing the yearly total the demand by total produciton of 1kWp solar panel. It is rounded to the nearest integer for ease of the calculation. Let, the rated capacity found from this calculation is denoted as “cap”.
Step 3: The total yearly generation of the “cap” (the installed size) is found for various tilt angle from data used in Fig. 2.
Step 4: When demand is greater than the generation, it is considered shortage otherwise it is surplus. Thus both shortage and surplus are found for various tilt angles.
Step 5: The maximum demand is met when the shortage is minimum.
Step 6: The tilt angle for which the maximum demand is met is then found out.
Step 7: For a more real approximation, a random function is included for both the demand profile and generaion profile as follows:
random_demand=demand*(1-r+2*r*rand()) (2) random_generation=generation*(1-r+2*r*rand()) (3)
These will assign +r% to –r% value of the demand or generation given at the look up table.
Step 8: Owing to the insertion of a random factor, the tilt angle at which the maximum demand is met, now varies slightly in random fashion.
Step 9: This iteration runs for n (Here n=1000) times.
Step 10: The frequency of satisfying the condition for meeting the maximum demand is found for various tilt angles.
The results of this analysis are shown in Fig. 6 – Fig. 13. Fig. 6 shows the total generation (thus consumption) of Bangladesh for the last three years (year 2011,2012,2013) and the average value of them.This data for of total generation is taken form PGCB monthly report in
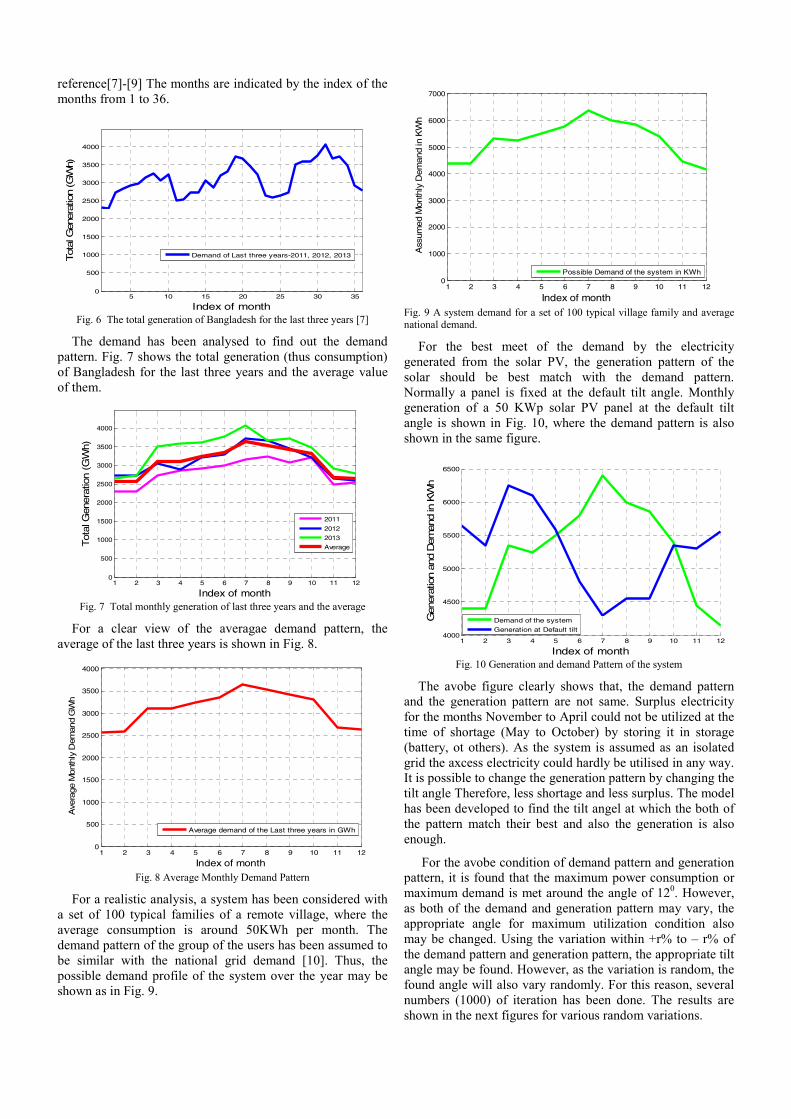
reference[7]-[9] The months are indicated by the index of the months from 1 to 36.
5 10 15 20 25 30 350
500
1000
1500
2000
2500
3000
3500
4000
Index of month
Tot
al G
ener
atio
n (G
Wh)
Demand of Last three years-2011, 2012, 2013
Fig. 6 The total generation of Bangladesh for the last three years [7]
The demand has been analysed to find out the demand pattern. Fig. 7 shows the total generation (thus consumption) of Bangladesh for the last three years and the average value of them.
1 2 3 4 5 6 7 8 9 10 11 120
500
1000
1500
2000
2500
3000
3500
4000
Index of month
Tot
al G
ener
atio
n (G
Wh)
2011
2012
2013
Average
Fig. 7 Total monthly generation of last three years and the average
For a clear view of the averagae demand pattern, the average of the last three years is shown in Fig. 8.
1 2 3 4 5 6 7 8 9 10 11 120
500
1000
1500
2000
2500
3000
3500
4000
Index of month
Ave
rage
Mon
thly
Dem
and
GW
h
Average demand of the Last three years in GWh
Fig. 8 Average Monthly Demand Pattern
For a realistic analysis, a system has been considered with a set of 100 typical families of a remote village, where the average consumption is around 50KWh per month. The demand pattern of the group of the users has been assumed to be similar with the national grid demand [10]. Thus, the possible demand profile of the system over the year may be shown as in Fig. 9.
1 2 3 4 5 6 7 8 9 10 11 120
1000
2000
3000
4000
5000
6000
7000
Index of month
Ass
umed
Mon
thly
Dem
and
in K
Wh
Possible Demand of the system in KWh
Fig. 9 A system demand for a set of 100 typical village family and average national demand.
For the best meet of the demand by the electricity generated from the solar PV, the generation pattern of the solar should be best match with the demand pattern. Normally a panel is fixed at the default tilt angle. Monthly generation of a 50 KWp solar PV panel at the default tilt angle is shown in Fig. 10, where the demand pattern is also shown in the same figure.
1 2 3 4 5 6 7 8 9 10 11 124000
4500
5000
5500
6000
6500
Index of month
Gen
erat
ion
and
Dem
and
in K
Wh
Demand of the system
Generation at Default tilt
Fig. 10 Generation and demand Pattern of the system
The avobe figure clearly shows that, the demand pattern and the generation pattern are not same. Surplus electricity for the months November to April could not be utilized at the time of shortage (May to October) by storing it in storage (battery, ot others). As the system is assumed as an isolated grid the axcess electricity could hardly be utilised in any way. It is possible to change the generation pattern by changing the tilt angle Therefore, less shortage and less surplus. The model has been developed to find the tilt angel at which the both of the pattern match their best and also the generation is also enough.
For the avobe condition of demand pattern and generation pattern, it is found that the maximum power consumption or maximum demand is met around the angle of 120. However, as both of the demand and generation pattern may vary, the appropriate angle for maximum utilization condition also may be changed. Using the variation within +r% to – r% of the demand pattern and generation pattern, the appropriate tilt angle may be found. However, as the variation is random, the found angle will also vary randomly. For this reason, several numbers (1000) of iteration has been done. The results are shown in the next figures for various random variations.
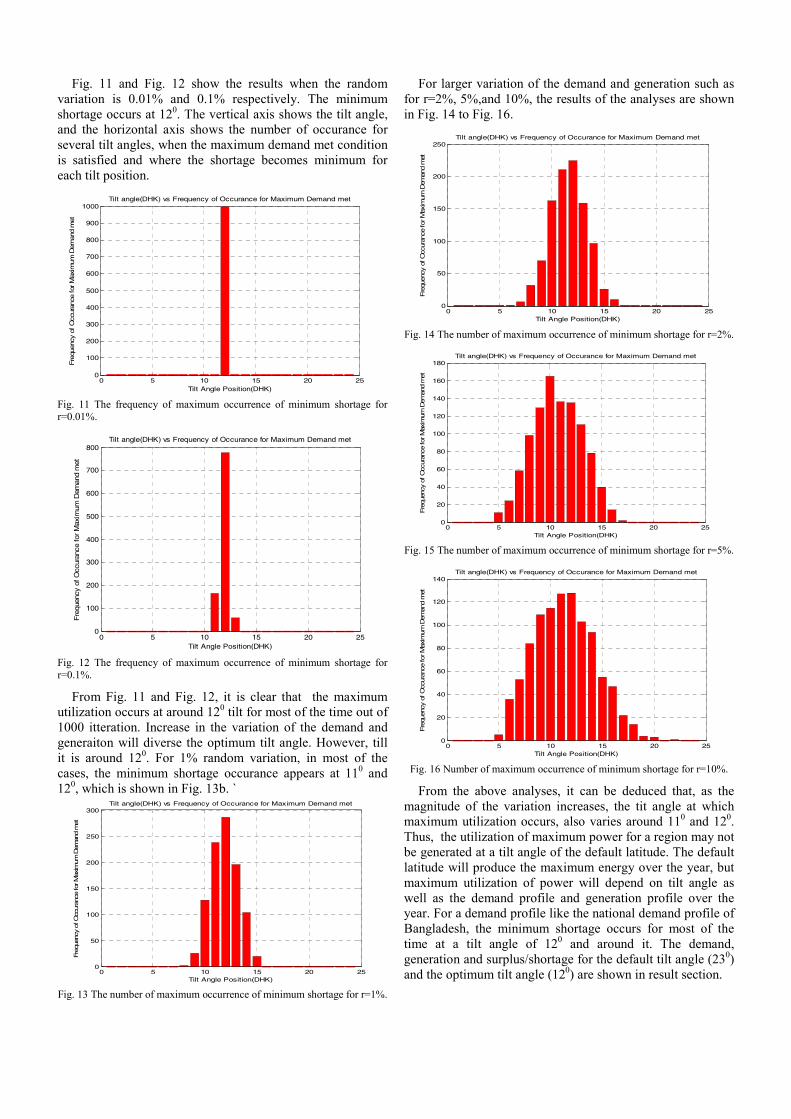
Fig. 11 and Fig. 12 show the results when the random variation is 0.01% and 0.1% respectively. The minimum shortage occurs at 120. The vertical axis shows the tilt angle, and the horizontal axis shows the number of occurance for several tilt angles, when the maximum demand met condition is satisfied and where the shortage becomes minimum for each tilt position.
0 5 10 15 20 250
100
200
300
400
500
600
700
800
900
1000
Tilt Angle Position(DHK)
Fre
quen
cy o
f O
ccur
ance
for
Max
imum
Dem
and
met
Tilt angle(DHK) vs Frequency of Occurance for Maximum Demand met
Fig. 11 The frequency of maximum occurrence of minimum shortage for r=0.01%.
0 5 10 15 20 250
100
200
300
400
500
600
700
800
Tilt Angle Position(DHK)
Fre
quen
cy o
f O
ccur
ance
for
Max
imum
Dem
and
met
Tilt angle(DHK) vs Frequency of Occurance for Maximum Demand met
Fig. 12 The frequency of maximum occurrence of minimum shortage for r=0.1%.
From Fig. 11 and Fig. 12, it is clear that the maximum utilization occurs at around 120 tilt for most of the time out of 1000 itteration. Increase in the variation of the demand and generaiton will diverse the optimum tilt angle. However, till it is around 120. For 1% random variation, in most of the cases, the minimum shortage occurance appears at 110 and 120, which is shown in Fig. 13b. `
0 5 10 15 20 250
50
100
150
200
250
300
Tilt Angle Position(DHK)
Fre
quen
cy o
f O
ccur
ance
for
Max
imum
Dem
and
met
Tilt angle(DHK) vs Frequency of Occurance for Maximum Demand met
Fig. 13 The number of maximum occurrence of minimum shortage for r=1%.
For larger variation of the demand and generation such as for r=2%, 5%,and 10%, the results of the analyses are shown in Fig. 14 to Fig. 16.
0 5 10 15 20 250
50
100
150
200
250
Tilt Angle Position(DHK)
Fre
quen
cy o
f O
ccur
ance
for
Max
imum
Dem
and
met
Tilt angle(DHK) vs Frequency of Occurance for Maximum Demand met
Fig. 14 The number of maximum occurrence of minimum shortage for r=2%.
0 5 10 15 20 250
20
40
60
80
100
120
140
160
180
Tilt Angle Position(DHK)
Fre
quen
cy o
f O
ccur
ance
for
Max
imum
Dem
and
met
Tilt angle(DHK) vs Frequency of Occurance for Maximum Demand met
Fig. 15 The number of maximum occurrence of minimum shortage for r=5%.
0 5 10 15 20 250
20
40
60
80
100
120
140
Tilt Angle Position(DHK)
Fre
quen
cy o
f O
ccur
ance
for
Max
imum
Dem
and
met
Tilt angle(DHK) vs Frequency of Occurance for Maximum Demand met
Fig. 16 Number of maximum occurrence of minimum shortage for r=10%.
From the above analyses, it can be deduced that, as the magnitude of the variation increases, the tit angle at which maximum utilization occurs, also varies around 110 and 120. Thus, the utilization of maximum power for a region may not be generated at a tilt angle of the default latitude. The default latitude will produce the maximum energy over the year, but maximum utilization of power will depend on tilt angle as well as the demand profile and generation profile over the year. For a demand profile like the national demand profile of Bangladesh, the minimum shortage occurs for most of the time at a tilt angle of 120 and around it. The demand, generation and surplus/shortage for the default tilt angle (230) and the optimum tilt angle (120) are shown in result section.
VI. RESULTS
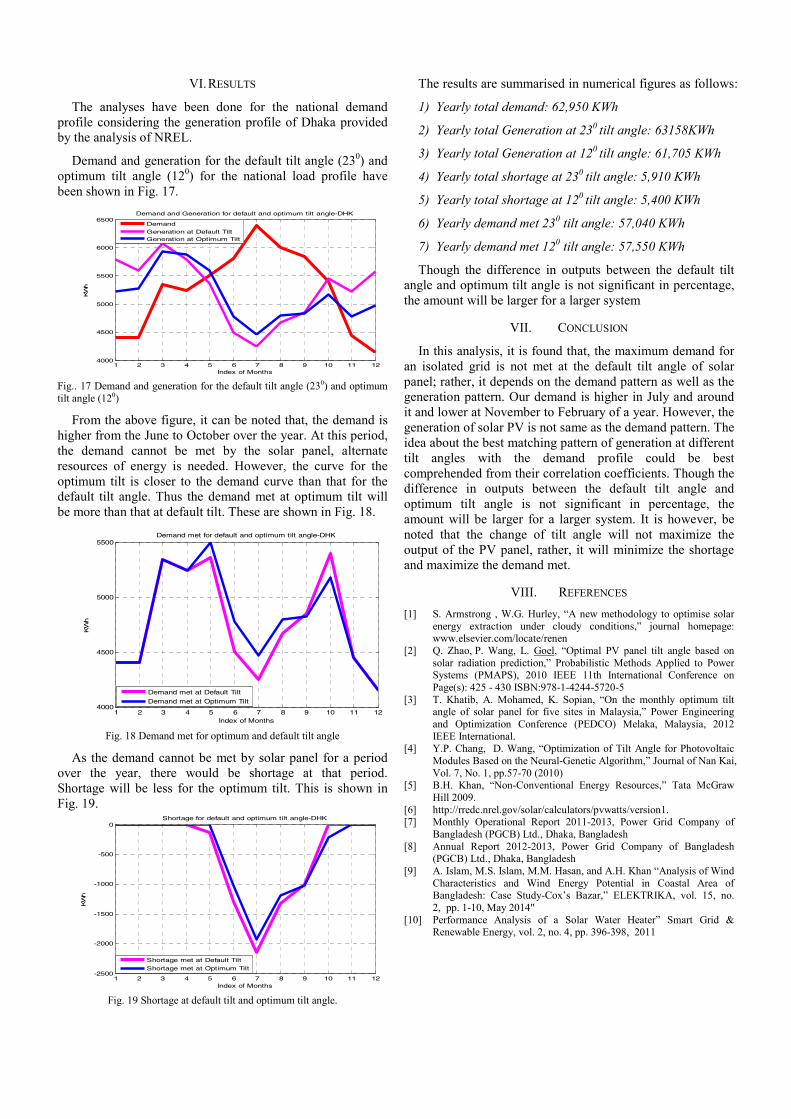
The analyses have been done for the national demand profile considering the generation profile of Dhaka provided by the analysis of NREL.
Demand and generation for the default tilt angle (230) and optimum tilt angle (120) for the national load profile have been shown in Fig. 17.
1 2 3 4 5 6 7 8 9 10 11 124000
4500
5000
5500
6000
6500
Index of Months
KW
h
Demand and Generation for default and optimum tilt angle-DHK
Demand
Generation at Default TiltGeneration at Optimum Tilt
Fig.. 17 Demand and generation for the default tilt angle (230) and optimum tilt angle (120)
From the above figure, it can be noted that, the demand is higher from the June to October over the year. At this period, the demand cannot be met by the solar panel, alternate resources of energy is needed. However, the curve for the optimum tilt is closer to the demand curve than that for the default tilt angle. Thus the demand met at optimum tilt will be more than that at default tilt. These are shown in Fig. 18.
1 2 3 4 5 6 7 8 9 10 11 124000
4500
5000
5500
Index of Months
KW
h
Demand met for default and optimum tilt angle-DHK
Demand met at Default Tilt
Demand met at Optimum Tilt
Fig. 18 Demand met for optimum and default tilt angle
As the demand cannot be met by solar panel for a period over the year, there would be shortage at that period. Shortage will be less for the optimum tilt. This is shown in Fig. 19.
1 2 3 4 5 6 7 8 9 10 11 12-2500
-2000
-1500
-1000
-500
0
Index of Months
KW
h
Shortage for default and optimum tilt angle-DHK
Shortage met at Default Tilt
Shortage met at Optimum Tilt
Fig. 19 Shortage at default tilt and optimum tilt angle.
The results are summarised in numerical figures as follows:
1) Yearly total demand: 62,950 KWh
2) Yearly total Generation at 230 tilt angle: 63158KWh
3) Yearly total Generation at 120 tilt angle: 61,705 KWh
4) Yearly total shortage at 230 tilt angle: 5,910 KWh
5) Yearly total shortage at 120 tilt angle: 5,400 KWh
6) Yearly demand met 230 tilt angle: 57,040 KWh
7) Yearly demand met 120 tilt angle: 57,550 KWh
Though the difference in outputs between the default tilt angle and optimum tilt angle is not significant in percentage, the amount will be larger for a larger system
VII. CONCLUSION
In this analysis, it is found that, the maximum demand for an isolated grid is not met at the default tilt angle of solar panel; rather, it depends on the demand pattern as well as the generation pattern. Our demand is higher in July and around it and lower at November to February of a year. However, the generation of solar PV is not same as the demand pattern. The idea about the best matching pattern of generation at different tilt angles with the demand profile could be best comprehended from their correlation coefficients. Though the difference in outputs between the default tilt angle and optimum tilt angle is not significant in percentage, the amount will be larger for a larger system. It is however, be noted that the change of tilt angle will not maximize the output of the PV panel, rather, it will minimize the shortage and maximize the demand met.
VIII. REFERENCES [1] S. Armstrong , W.G. Hurley, “A new methodology to optimise solar
energy extraction under cloudy conditions,” journal homepage: www.elsevier.com/locate/renen
[2] Q. Zhao, P. Wang, L. Goel, “Optimal PV panel tilt angle based on solar radiation prediction,” Probabilistic Methods Applied to Power Systems (PMAPS), 2010 IEEE 11th International Conference on Page(s): 425 - 430 ISBN:978-1-4244-5720-5
[3] T. Khatib, A. Mohamed, K. Sopian, “On the monthly optimum tilt angle of solar panel for five sites in Malaysia,” Power Engineering and Optimization Conference (PEDCO) Melaka, Malaysia, 2012 IEEE International.
[4] Y.P. Chang, D. Wang, “Optimization of Tilt Angle for Photovoltaic Modules Based on the Neural-Genetic Algorithm,” Journal of Nan Kai, Vol. 7, No. 1, pp.57-70 (2010)
[5] B.H. Khan, “Non-Conventional Energy Resources,” Tata McGraw Hill 2009.
[6] http://rredc.nrel.gov/solar/calculators/pvwatts/version1. [7] Monthly Operational Report 2011-2013, Power Grid Company of
Bangladesh (PGCB) Ltd., Dhaka, Bangladesh [8] Annual Report 2012-2013, Power Grid Company of Bangladesh
(PGCB) Ltd., Dhaka, Bangladesh [9] A. Islam, M.S. Islam, M.M. Hasan, and A.H. Khan “Analysis of Wind
Characteristics and Wind Energy Potential in Coastal Area of Bangladesh: Case Study-Cox’s Bazar,” ELEKTRIKA, vol. 15, no. 2, pp. 1-10, May 2014"
[10] Performance Analysis of a Solar Water Heater” Smart Grid & Renewable Energy, vol. 2, no. 4, pp. 396-398, 2011