A SYSTEM LEVEL STUDY OF NEW WAKE TURBULENCE ...
178
A SYSTEM LEVEL STUDY OF NEW WAKE TURBULENCE SEPARATION CONCEPTS AND THEIR IMPACT ON AIRPORT CAPACITY Tamas Kolos-Lakatos and R. John Hansman This report is based on the Doctoral Dissertation of Tamas Kolos-Lakatos submitted to the Department of Aeronautics and Astronautics in partial fulfillment of the requirements for the degree of Doctor of Philosophy at the Massachusetts Institute of Technology. The work presented in this report was also conducted in collaboration with the members of the Doctoral Committee: Prof. R. John Hansman (Chair) Prof. Amedeo Odoni Associate Prof. Hamsa Balakrishnan Prof. Antonio A. Trani Report No. ICAT-2017-03 April 2017 MIT International Center for Air Transportation (ICAT) Department of Aeronautics & Astronautics Massachusetts Institute of Technology Cambridge, MA 02139 USA
-
Upload
khangminh22 -
Category
Documents
-
view
0 -
download
0
Transcript of A SYSTEM LEVEL STUDY OF NEW WAKE TURBULENCE ...

A SYSTEM LEVEL STUDY OF NEW WAKE TURBULENCE SEPARATION CONCEPTS AND THEIR IMPACT ON
AIRPORT CAPACITY
Tamas Kolos-Lakatos and R. John Hansman
This report is based on the Doctoral Dissertation of Tamas Kolos-Lakatos submitted to the Department of Aeronautics and Astronautics in partial fulfillment of the requirements for the
degree of Doctor of Philosophy at the Massachusetts Institute of Technology.
The work presented in this report was also conducted
in collaboration with the members of the Doctoral Committee:
Prof. R. John Hansman (Chair) Prof. Amedeo Odoni
Associate Prof. Hamsa Balakrishnan Prof. Antonio A. Trani
Report No. ICAT-2017-03 April 2017
MIT International Center for Air Transportation (ICAT)
Department of Aeronautics & Astronautics Massachusetts Institute of Technology
Cambridge, MA 02139 USA

2

3
A System Level Study of New Wake Turbulence Separation Concepts and Their Impact on Airport Capacity
By
Tamas Kolos-Lakatos and Prof. R. John Hansman
Abstract
The air transportation industry continues to grow worldwide, but demand is often limited by available airspace and airport capacity. This thesis focuses on evaluating new air traffic procedures: specifically, new and emerging wake turbulence separation rules that could potentially increase runway capacity based on today’s knowledge of wake vortex turbulence and technological capabilities. While legacy wake separation rules establish aircraft-classes based on weight of aircraft, these new separation rules can define separation standards by considering other aircraft parameters and dynamic wind conditions.
A fast-time runway system model is developed for studying these wake separation rules, using Monte-Carlo simulations, to provide accurate and realistic runway capacity estimates based on the randomness of arrival and departure operations. A total of nine new proposed wake separation rules are analyzed in detail, which include both distance-based and time-based methods, as well as static and dynamic concepts. Seven of the busiest and most delayed U.S. airports are selected as case studies for the illustration of runway capacity benefits enabled by these new wake separation rules: Boston (BOS), New York J.F. Kennedy (JFK), New York LaGuardia (LGA), Newark (EWR), San Francisco (SFO), Los Angeles (LAX), and Chicago O’Hare (ORD). For a detailed capacity analysis, the new wake separation rules are tested under the most constraining runway configurations at each of these airports.
The results indicate that increasing the number of aircraft wake categories can increase runway capacity, but the added benefits become smaller with each new category added. A five-or six-category wake separation system can capture most of the runway capacity that can be achieved with a static pair-wise system. Additionally, shifting wake category boundaries between airports as a function of local fleet mix can provide additional runway capacity benefits, meaning that airport specific wake separation rules can increase capacity over a universal separation rule system. Among the new wake separation rules, the results indicate that reducing wake separations further from current minimum separations (separation values of 2NM or less) can shift the operational bottleneck from the approach path to the runway, as runway occupancy time becomes the limiting factor for inter-arrival separations. The findings from the time-based separation rule demonstrate that switching from distance-based separations to time-based separations in strong headwind conditions can recover significant lost capacity. Time-based separation rules can be of great value

4
to increase operational reliability and capacity predictability at airports in all weather conditions. Moreover, the results also indicate that a reduction in minimum separations enabled by dynamic wind and aircraft information can offer marginal runway capacity benefits over the capacity enabled by static pair-wise wake separations, as more and more aircraft pairs become limited by runway occupancy time. Therefore, a joint effort is needed for reducing both wake separations and runway occupancy in order to accommodate future air traffic demand.

5
Acknowledgements
This project was funded under the FAA NEXTOR II Center of Excellence. The author would like to
thank Ed Johnson, Tom Proeschel, Paul Strande, and Jeff Tittsworth for their help and assistance with
this research.

6
Contents 1 Introduction ............................................................................................................ 17
1.1 Motivation ...................................................................................................... 18
1.2 Airport Capacity .............................................................................................. 21
1.3 Wake Turbulence ............................................................................................. 23
1.4 Research Objectives ......................................................................................... 24
1.5 Literature Review ............................................................................................ 25
1.5.1 Airport Capacity Models ........................................................................... 26
1.5.2 Congestion Management ........................................................................... 30
1.5.3 Wake Turbulence ..................................................................................... 32
1.5.4 Literature Summary .................................................................................. 34
1.6 Thesis Contributions ........................................................................................ 35
1.7 Organization of the Thesis ................................................................................ 37
2 Monte-Carlo Simulation Model of Runway Operations .............................................. 39
2.1 Modeling Approach ......................................................................................... 39
2.2 Model Formulation and Input Parameters ........................................................... 42
2.2.1 Airfield and Airspace Characteristics .......................................................... 42
2.2.2 Fleet Mix and Aircraft Characteristics ........................................................ 44
2.2.3 Air Traffic Control Rules and Procedures ................................................... 52
2.2.4 External Factors ....................................................................................... 57
2.3 Simulation Logic and Sequencing ..................................................................... 59
2.4 Comparison with Other Simulation Models ........................................................ 64
2.5 Summary of Modeling Assumptions and Limitations .......................................... 68
2.5.1 Modeling Limitations ................................................................................ 68

7
2.5.2 Assumptions in the Simulation Model ........................................................ 69
3 Study of Runway Capacity Components ................................................................... 71
3.1 Runway Capacity Study Objectives ................................................................... 71
3.2 Runway Capacity Study Assumptions ................................................................ 73
3.3 Analysis of Runway Capacity Results ................................................................ 74
3.3.1 Number of Runways ................................................................................. 74
3.3.2 Geometry of Intersecting Runways ............................................................. 82
3.3.3 Final Approach Length .............................................................................. 89
3.3.4 Fleet Mix ................................................................................................. 91
3.3.5 Separation Buffer ..................................................................................... 95
3.3.6 Wind and Wind Shear ............................................................................... 96
3.4 Conclusion ...................................................................................................... 99
4 Impact of New Wake Turbulence Separation Rules .................................................. 101
4.1 Wake Turbulence Study Objectives ................................................................. 101
4.2 Study Method ................................................................................................ 102
4.3 New Wake Turbulence Separation Rules and Procedures .................................. 103
4.3.1 Re-Categorization of Aircraft .................................................................. 104
4.3.2 Reduced Separation Between Large-Large Pairs ........................................ 109
4.3.3 Dual-Glideslope Approaches ................................................................... 110
4.3.4 Time-Based Separation ........................................................................... 112
4.3.5 Closely Spaced Parallel Runway Operations ............................................. 114
4.3.6 Implications of New Wake Separation Rules for Simulation Modeling ........ 115
4.4 Runway Configurations and Fleet Mixes for Case Studies ................................. 116
4.4.1 Runway Configurations ........................................................................... 116

8
4.4.2 Fleet Mixes at Selected Airports .............................................................. 121
4.5 Results .......................................................................................................... 122
4.5.1 Capacity Impacts of Increasing Number of Wake Categories ...................... 122
4.5.2 Airport Capacity Benefits from Re-Categorization Phase 1 ......................... 133
4.5.3 Airport Capacity Benefits from Re-Categorization Phase 2 ......................... 138
4.5.4 Airport Capacity Benefits from Static Pair-Wise Separation ....................... 139
4.5.5 Airport Capacity Benefits from Reduced Pair-Wise Separation (EU) ........... 143
4.5.6 Runway Capacity Benefits from Reduced Large-Large 2NM Separation ..... 147
4.5.7 Runway Capacity Benefits from Dual-Glideslope Operations ..................... 150
4.5.8 Runway Capacity Benefits from Time-Based Separation ............................ 152
4.5.9 Runway Capacity Benefits from new CSPR Separation Rules .................... 155
4.6 Summary and Conclusions .............................................................................. 157
5 Conclusion ........................................................................................................... 165
5.1 Research Summary ........................................................................................ 165
5.2 Practical Implications ..................................................................................... 166
5.3 Future Work .................................................................................................. 170

9
List of Figures Figure 1-1. U.S. and foreign-flagged air carrier operations at the top 35 busiest U.S. airports
from 1990 to 2016. Data source: Federal Aviation Administration – Operations Network
(OPSNET). ........................................................................................................................ 18
Figure 1-2. Delays caused by a thunderstorm at New York LaGuardia (LGA) airport. ........ 19
Figure 1-3. Revenue Passenger Miles and Available Seat Miles in the U.S. [BTS]. ............. 21
Figure 1-4. Analyzing runway capacity at a system-level in the context of three major research
areas. ................................................................................................................................ 26
Figure 2-1. The three-step modeling approach: experiment design, simulation modeling, and
result generation. ............................................................................................................... 40
Figure 2-2. Airport operational configurations included in the simulation model: single runway,
intersecting runways, and closely spaced parallels. ................................................................ 43
Figure 2-3. Geometrical specifications for a pair of intersecting runways. .......................... 44
Figure 2-4. Top 35 U.S. airports that account for 70 percent of passenger traffic. ............... 45
Figure 2-5. Aircraft fleet mix distribution at the top 35 U.S. airports, sorted by aircraft type.......................................................................................................................................... 46
Figure 2-6. Fleet mix variability and arrival throughput (passenger and cargo flights) in a 24-
hour period at Memphis International Airport (MEM). .......................................................... 47
Figure 2-7. Runway occupancy time analysis from ASDE-X surveillance data. Shown airport
specific values indicate expected runway occupancy times for Large class aircraft. .................. 48
Figure 2-8. A320 approach speed profiles on the last 10NM of the approach, based on FDR
data from a European airline. Red line indicates mean approach speed. ................................... 49
Figure 2-9. Approach speed profiles for aircraft of different size, based on ASDE-X data. Red
line represents mean ground speed; yellow line represents median. ......................................... 50
Figure 2-10. Modeled final approach speed profiles are based on mean approach speeds and
they are capped at 180 knots. .............................................................................................. 51
Figure 2-11. Impact of stochastic vs. deterministic final approach speeds on single arrivals-
only runway throughput. ..................................................................................................... 52
Figure 2-12. Closely spaced parallel runways dependent approach. ................................... 55
Figure 2-13. Closely spaced parallel runways in mixed mode configuration. ...................... 55

10
Figure 2-14. Intersecting runways in mixed mode configuration. ....................................... 56
Figure 2-15. Arrival separation buffer based on normally distributed position error of the
trailing aircraft. .................................................................................................................. 57
Figure 2-16. A four-stage simulation workflow: fleet mix sampling for generation of flights
(A), assignment of flight variables (B), movement sequencing (C), and flight time computing (D).......................................................................................................................................... 59
Figure 2-17. Comparison of runway capacity for two arrival-departure sequencing strategies:
largest arrival gap filled first, and alternating arrivals-departures. ........................................... 63
Figure 2-18. Runway capacity profiles generated by the simulation model and published by the
FAA for San Diego. ........................................................................................................... 66
Figure 2-19. Runway capacity profiles generated by the simulation model and published by the
FAA for LaGuardia. ........................................................................................................... 67
Figure 3-1. Arrivals-only runway configurations: single runway (A) and closely spaced parallel
runways (B). ...................................................................................................................... 75
Figure 3-2. Single runway and CSPR arrival capacity for U.S. representative fleet mix. ...... 76
Figure 3-3. Single runway (A), intersecting runways (B), and CSPR (C) in mixed-mode
configurations. ................................................................................................................... 77
Figure 3-4. Capacity envelopes for a single runway (left), two intersecting runways (middle),
and a set of closely spaced parallels (right). .......................................................................... 78
Figure 3-5. Single runway capacity variability at the alternating arrivals and departures point.......................................................................................................................................... 79
Figure 3-6. CSPR capacity variability at the alternating arrivals and departures point. ......... 80
Figure 3-7. Comparison of fitted normal distributions for single runway and CSPR
configurations. ................................................................................................................... 80
Figure 3-8. Sequence of alternating arrivals and departures on a single runway and on CSPR.......................................................................................................................................... 81
Figure 3-9. Intersecting runways in the lowest runway capacity configuration. ................... 82
Figure 3-10. Intersecting runways meeting in the middle of the runway (same case as in Section
3.2). .................................................................................................................................. 83
Figure 3-11. Intersecting runways meeting at the short end of the arrival runway. ............... 83

11
Figure 3-12. Intersecting runway configuration providing the highest capacity. .................. 84
Figure 3-13. Two of the most common intersecting runway configurations at LaGuardia. ... 86
Figure 3-14. Impact of runway geometry and separation buffer on capacity at LGA. ........... 86
Figure 3-15. Alternating arrivals and departures capacity with 0.25NM separation buffer. ... 87
Figure 3-16. Alternating arrivals and departures capacity with 1.0NM separation buffer. .... 88
Figure 3-17. Alternating arrivals and departures capacity with 0.25NM and departure-arrival
separation requirement relaxed. ........................................................................................... 89
Figure 3-18. Single runway arrival capacity as a function of final approach length. ............. 90
Figure 3-19. Runway capacity sensitivity (means and standard deviations) to final approach
length and fleet mix. ........................................................................................................... 91
Figure 3-20. Impact of homogeneous fleet mix on single runway capacity. ........................ 92
Figure 3-21. Single runway vs. intersecting runway capacity for different fleet mixes. ........ 93
Figure 3-22. Single runway arrival capacity variability due to changes in fleet mix at Memphis.......................................................................................................................................... 94
Figure 3-23. Impact of separation buffer on single runway capacity. .................................. 95
Figure 3-24. Reduced groundspeed due to headwind leads to longer flight times. ............... 96
Figure 3-25. Single runway capacity as a function of headwind. ........................................ 97
Figure 3-26. Impact of wind shear on arrival runway capacity. .......................................... 98
Figure 4-1. Legacy and RECAT wake categories based on wingspan and MTOW. ........... 105
Figure 4-2. Dual-glideslope concept illustration. ............................................................ 111
Figure 4-3. Time-based separation illustration of concept [67]. ....................................... 112
Figure 4-4. Closely spaced parallel approaches with safe zone added. ............................. 115
Figure 4-5. Runway layouts at the selected airports. ....................................................... 117
Figure 4-6. Percentage of IMC weather at the selected airports for 2015 [ASPM]. ............ 118
Figure 4-7. Runway configurations in IMC conditions in 2015 [ASPM]. ......................... 119
Figure 4-8. Fleet mixes based on FAA legacy weight classification. ................................ 121
Figure 4-9. Representative aircraft types for FAA legacy weight classes and newly generated
five-category system. ....................................................................................................... 125
Figure 4-10. Runway capacity vs. number of wake categories. ........................................ 126

12
Figure 4-11. Arrival runway capacity under the FAA legacy separation rule and the pair-wise
matrix-based FAA weight class five-category system. ......................................................... 128
Figure 4-12. Arrival runway capacity under the pair-wise FAA-weight-class five-category
(FAA), the U.S. fleet mix optimized five-category (US), and the local fleet mix optimized five-
category separation rules (Loc). ......................................................................................... 129
Figure 4-13. Comparison of airport capacity envelopes at LGA and EWR for FAA legacy and
RECAT Phase 1 separation rules. ...................................................................................... 133
Figure 4-14. Comparison of airport capacity envelopes at BOS and at LAX for FAA legacy
and RECAT Phase 1 separation rules. ................................................................................ 134
Figure 4-15. Cumulative distribution plots for single runway arrival capacity at JFK and ORD
for FAA legacy and RECAT 1 separation rules. .................................................................. 134
Figure 4-16. Cumulative distribution plot for CSPR arrivals-only runway capacity at SFO for
FAA legacy and RECAT 1 separation rules. ....................................................................... 135
Figure 4-17. LAX airport capacity envelope for FAA legacy and RECAT 2 separation rules........................................................................................................................................ 138
Figure 4-18. Comparison of airport capacity envelopes at LGA, EWR, BOS, and LAX for FAA
legacy and pair-wise EU wake separation rules. .................................................................. 140
Figure 4-19. Cumulative density functions for arrival runway capacity at JFK, ORD, and SFO
under FAA legacy and pair-wise EU wake separation rules. ................................................. 141
Figure 4-20. Comparison of airport capacity envelopes at LGA, EWR, BOS, and LAX for pair-
wise and reduced pair-wise wake separation rules. .............................................................. 144
Figure 4-21. Cumulative density functions for arrival runway capacity at JFK, ORD, and SFO
under pair-wise and reduced pair-wise wake separation rules. .............................................. 145
Figure 4-22. Comparison of airport capacity envelopes at LGA, EWR, BOS, and LAX for FAA
legacy and Large-Large 2NM wake separation rules. .......................................................... 147
Figure 4-23. Cumulative density functions for arrival runway capacity at JFK, ORD, and SFO
under FAA legacy and Large-Large 2NM wake separation rules. ......................................... 148
Figure 4-24. Comparison of airport capacity profiles at EWR, JFK, SFO and ORD for standard
and dual-glideslope operations. ......................................................................................... 150

13
Figure 4-25. Comparison of airport capacity profiles at BOS and LAX for standard and dual-
glideslope operations. ....................................................................................................... 151
Figure 4-26. The impact of headwind on airport capacity at LGA, EWR, BOS, and LAX for
FAA legacy wake separation rules. .................................................................................... 153
Figure 4-27. The impact of headwind on arrival runway capacity at JFK, ORD, and SFO for
FAA legacy wake separation rules. .................................................................................... 154
Figure 4-28. Cumulative density functions for arrival CSPR capacity at SFO under FAA Order
7110.308, WTMA-P, and IM-PA wake separation rules (IM-PA has been evaluated with 0.2NM
and 0.5NM minimum front gate separations). ..................................................................... 156
Figure 4-29. Runway occupancy as the limiting factor for increasing airport capacity under the
current FAA legacy separation rule and the preliminary pair-wise E.U. separation rule. [D.
Sherwood, 2017] .............................................................................................................. 161
Figure 4-30. Arrival capacity benefit from reducing runway occupancy time under the current
FAA legacy separation rule and the preliminary pair-wise E.U. separation rule. [D. Sherwood,
2017] .............................................................................................................................. 161
Figure 5-1. Summary of arrival capacity benefits from studied and proposed wake separation
rules. [Benefits shown over legacy FAA Order 7110.65W rule.] .......................................... 167

14
List of Tables Table 2-1. Legacy aircraft wake categories in the U.S. ..................................................... 53
Table 2-2. Final approach separation minimums based on FAA 7110.65W (IFR). .............. 53
Table 2-3. Departure separation minimums based on FAA 7110.65W for wake constrained
pairs. ................................................................................................................................. 54
Table 2-4. San Diego and LaGuardia fleet mixed used in the FAA capacity study. ............. 64
Table 2-5. Final approach separation minimums based on FAA 7110.65T (IFR). ............... 65
Table 2-6. Departure separation minimums based on FAA Order 7110.65T for wake
constrained pairs. ............................................................................................................... 65
Table 3-1. Baseline modeling assumptions for aircraft fleet mix and flight characteristics. .. 73
Table 3-2. Single runway and CSPR mean arrival throughput. .......................................... 76
Table 3-3. Airport capacity in mixed mode operations for U.S. representative fleet mix. ..... 78
Table 3-4. Arrival and departure capacity at the 50%-50% point under different intersecting
runway geometries, for U.S. representative fleet mix. ............................................................ 85
Table 3-5. Assumed fleet mix for La Guardia airport. ...................................................... 85
Table 4-1. RECAT wake categories in the U.S., based on wingspan and MTOW. ............. 105
Table 4-2. RECAT required minimum separation on approach. ....................................... 106
Table 4-3. RECAT departure separations on single runway and on CSPR. Empty cells indicate
that no wake separation is necessary and standard departure separations can be applied (distance
based). ............................................................................................................................ 106
Table 4-4. RECAT Phase 2 approach separation for Southern California TRACON. ......... 107
Table 4-5. RECAT Phase 2 time-based separation for Southern California TRACON. ...... 108
Table 4-6. Updated final approach separation matrix with Large-Large 2NM separation. MRS
remains 2.5NM/3.0NM, depending on average reported runway occupancy times. ................ 110
Table 4-7. IFR separation minimums between aircraft leading on lower-glideslope and aircraft
trailing on upper-glideslope. Super, Heavy, and B757 aircraft are not permitted to fly upper-
glideslope approach. ......................................................................................................... 111
Table 4-8. Minimum inter-arrival times during time-based separation mode (as implemented
in the simulation model). .................................................................................................. 113
Table 4-9. Ranking of major airport on-time arrival performance for 2015 [60] [70]. ........ 116

15
Table 4-10. Selected runway configurations and wake separation rules for the case studies........................................................................................................................................ 120
Table 4-11. A one-category wake separation system. The most restrictive value (7NM) defines
the separation between all pairs of aircraft. ......................................................................... 123
Table 4-12. Example for a two-category wake separation system. ................................... 123
Table 4-13. Example for a three-category wake separation system. ................................. 124
Table 4-14. FAA legacy separation matrix vs. FAA five-category separation matrix based on
pair-wise matrix-based values. .......................................................................................... 127
Table 4-15. FAA five-category separation matrix based on pair-wise matrix values and FAA
legacy weight classes (FAA 5-Cat. PWS) vs. U.S. fleet mix optimized five-category separation
matrix based on pair-wise matrix values (New 5-Cat. PWS). ............................................... 129
Table 4-16. Comparison of arrivals-only, single runway capacities for U.S. fleet mix and local
fleet mix optimized wake separation rules. ......................................................................... 132
Table 4-17. Arrival runway capacity benefits from RECAT Phase 1 wake separation rule. 136
Table 4-18. Departure runway capacity benefits from RECAT Phase 1 wake separation rule........................................................................................................................................ 137
Table 4-19. Arrival runway capacity benefits from RECAT Phase 2 wake separation rule. 139
Table 4-20. Departure runway capacity benefits from RECAT Phase 2 wake separation rule........................................................................................................................................ 139
Table 4-21. Arrival runway capacity benefits from the pair-wise wake separation rule. ..... 142
Table 4-22. Arrival runway capacity benefits from dynamic wake separation rules. .......... 146
Table 4-23. Arrival runway capacity benefits from the Large-Large 2NM wake separation rule........................................................................................................................................ 149
Table 4-24. Arrival runway capacity benefits from dual-glideslope approaches. ............... 152
Table 4-25. CSPR arrival runway capacity benefits from WTMA-P wake separation rule over
FAA Order 7110.308 rule. ................................................................................................ 156
Table 4-26. CSPR arrival runway capacity benefits from IM-PA wake separation rule over
FAA Order 7110.308 rule. ................................................................................................ 157
Table 4-27. Summary of arrival capacity benefits from new wake turbulence separation rules
compared to legacy FAA separation rules (FAA Order 7110.65). ......................................... 158

16

17
Chapter 1
1 Introduction
The air transportation industry continues to grow worldwide. Airlines are placing record orders for
new aircraft to replace their aging fleets and grow their networks. This growth is supported by
construction of new runways and terminal buildings at airports and by the modernization of Air
Traffic Management (ATM) systems. The Next Generation Air Transportation System (NextGen)
initiative in the United States and the Single European Sky ATM Research (SESAR) in Europe
are two examples of such modernization programs. They both aim to introduce new air traffic
control technologies and procedures to support industry growth.
Demand is often limited by available airspace or airport capacity, which can lead to increased
congestion and delays. There are a number of ways to increase capacity: investment in
infrastructure, or implementation of new rules and procedures in the ATM system are two
examples. This thesis focuses on new separation rules and procedures. The thesis begins with a
detailed examination of various factors that influence runway capacity and an analysis of the
interactions and multi-dimensional interplay between these factors. The results help to establish a
baseline scenario for the main part of the thesis that investigates some of the new and emerging
wake vortex separation concepts and procedures in the U.S. and in Europe that could potentially
increase runway capacity, based on today’s knowledge of wake vortex turbulence and
technological capabilities. Seven of the busiest U.S. airports have been selected as case studies for
the illustration of runway capacity benefits enabled by these new wake separation procedures.
In this chapter, the problem of air transportation demand and capacity imbalance is initially
discussed as the motivation for this research. Section 1.2 presents some of the delay mitigation
strategies applied today. Section 1.3 summarizes the research objectives and presents the main

18
research problems investigated in this work. A review of the existing literature is provided in
Section 1.4. The review focuses on three major research areas: 1) studies on airport capacity,
capacity analysis methodologies, and individual factors impacting runway capacity, 2) various
congestion mitigation strategies, and 3) innovative operational concepts for reducing wake
turbulence separation. Section 1.5 explains the contributions of this thesis, and section 1.6
concludes this chapter with an outline for the remainder of the thesis.
1.1 Motivation
The motivation behind this research is the air traffic demand and airport capacity imbalance that
can lead to increased congestion, longer passenger delays, and excessive greenhouse gas emissions
at major airports, worldwide. Figure 1-1 shows air carrier operations (aircraft with seating capacity
of more than 60 seats) at the busiest 35 U.S. airports for domestic and international airlines [1].
Figure 1-1. U.S. and foreign-flagged air carrier operations at the top 35 busiest U.S. airports from 1990 to
2016. Data source: Federal Aviation Administration – Operations Network (OPSNET).
19
A steady increase in the number of operations can be seen during the 1990s, with a sharp decline
starting in 2001. Then traffic starts to climb again with the exceptions of 2008 and 2009. Overall,
the number of air carrier operations at the busiest 35 airports have been increasing with slight
fluctuations due to external events that influenced the aviation industry. This demand growth can
encourage airlines to schedule more flights than what an airport can handle, especially during
weather disruptions.
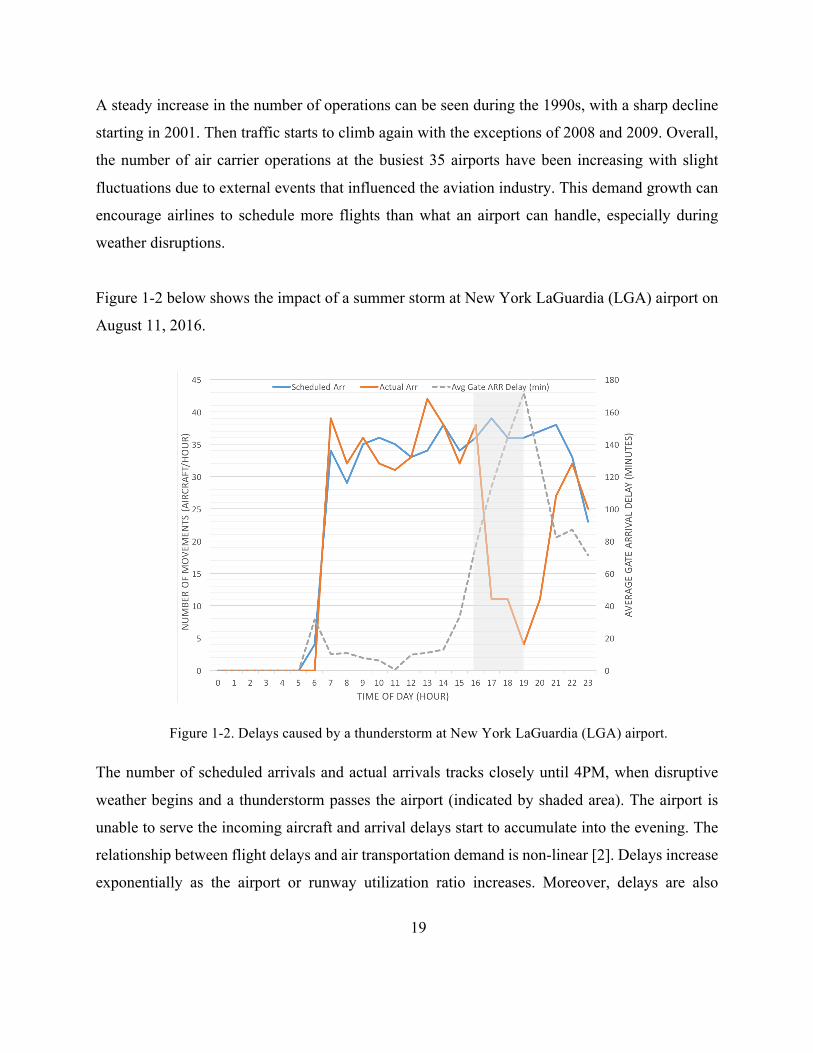
Figure 1-2 below shows the impact of a summer storm at New York LaGuardia (LGA) airport on
August 11, 2016.
Figure 1-2. Delays caused by a thunderstorm at New York LaGuardia (LGA) airport.
The number of scheduled arrivals and actual arrivals tracks closely until 4PM, when disruptive
weather begins and a thunderstorm passes the airport (indicated by shaded area). The airport is
unable to serve the incoming aircraft and arrival delays start to accumulate into the evening. The
relationship between flight delays and air transportation demand is non-linear [2]. Delays increase
exponentially as the airport or runway utilization ratio increases. Moreover, delays are also

20
sensitive to variability in the system, which implies that runway systems should not be operated
close to their capacity for long durations of time during peak hours of the day.
Delays can be mitigated quickly if there is sufficient runway capacity available, which remains
one of the bottlenecks for future industry growth. One way to match capacity to demand is to invest
in new infrastructure at airports. While there are a few terminal building and runway expansions
taking place in the U.S., most of the large-scale infrastructure projects are taking place outside the
United States. New runway construction is often limited by the close proximity of airports to cities,
which impose additional constraints, such as increased noise mitigation requirements and land area
limitations. For example, Boston Logan International Airport (BOS) is built on reclaimed islands,
surrounded by several communities in the close proximity of it with very little available space for
future expansion. Airports with limited real-estate growth can gain from new operational
procedures (such as reduced wake turbulence separation) to maximize the runway capacity
benefits into the future.
Continuous air travel demand not only increases the number of flight operations, but it also changes
the type and size of aircraft that airlines operate. This trend can be seen from Revenue Passenger
Miles (RPM) and Available Seat Miles (ASM), both of which have been growing in the United
States (with the exception of some major global events, e.g. economic downturn in 2008 that had
significant impacts on passenger demand for air travel) as shown in Figure 1-3. Relatively slow
growth of number of air carrier operations and a fast growth of passengers at the same time can be
the results of two changes in the airline industry. First, airlines are adding more seats to existing
aircraft in their fleets. Second, airlines are flying larger aircraft with more seats than before. For
example, larger variants of the Boeing 737 family (B737-800/900) and the Airbus A320 family
(A321) have been gaining popularity, and new aircraft types have been entering service (A380,
B787, A350, etc.). These larger aircraft also require longer arrival and departure spacing than
smaller aircraft due to the stronger wake turbulence they generate, hence limiting runway capacity.

21
Figure 1-3. Revenue Passenger Miles and Available Seat Miles in the U.S. [BTS].
The combination of the above-mentioned trends in the airline industry (Figure 1-1 and Figure 1-3)
motivates this research, which focuses on increasing airport capacity to match industry growth
with consideration of recent changes in aircraft size and aircraft fleet mix.
1.2 Airport Capacity
Airport capacity is defined as the expected number of movements (arrivals and departures) per
unit time (usually an hour or fifteen minutes) that can take place under continuous demand (there
is always an arrival or departure ready for landing or takeoff), while maintaining all separation
requirements [2]. Airport capacity is subject to great variability due to the stochastic nature of the
air transportation system.
Stochasticity is driven by the interaction of several factors that influence airport capacity. These
factors include ground infrastructure characteristics (number of runways, their layout and
configuration), aircraft related parameters (types of aircraft operating at an airport, their approach

22
speeds and their runway occupancy times), and other externalities (direction and magnitude of
wind) for example. These drivers are introduced and explained in detail in Chapter 2.
Airport capacity can be increased in two primary ways: 1) increasing capacity by adding new
infrastructure, 2) introducing new air traffic control and air traffic flow management policies and
procedures. The most straightforward but also very costly solution to increasing capacity is to
expand infrastructure. This usually involves the development of new terminal buildings, taxiways,
and possibly new runways. These projects can take many years to materialize, and therefore require
long-term planning. The geographical setting of the airport (proximity to neighborhoods, tall
buildings, mountains, no fly zones, etc.) limits how far the airport can expand and what runway
configurations are plausible. The more independent the operations are on two runways the more
runway capacity benefit is provided by an additional runway. For example, Chicago O’Hare
(ORD) is currently (as of 2016) undergoing a major runway reconfiguration plan. The elimination
of the intersecting runway configuration is providing space for new parallel runways, which can
increase capacity at the airport. Internationally, some of the world’s largest hub airports have
reached their maximum capacity, and therefore they must relocate entirely to increase capacity.
Dubai, Doha, and Istanbul are examples of new airport construction. On the other hand, airports
with restricted space for expansion, like London Heathrow (LHR), are taking advantage of next-
generation aviation technologies. (The Davies Airport Commission also recommended an
additional runway at LHR to maintain the airport’s status as a global aviation hub [3].) Time-based
wake separations and continuous descent approaches are part of the SESAR ATM infrastructure
investments, of which LHR can take advantage. These new ATM capabilities can recover or
increase capacity for existing infrastructure, but they may not be sufficient to match future demand.
Additional air traffic control strategies also need to considered.
New air traffic control procedures and flow management strategies can also fuel capacity increase,
especially when an airport infrastructure is given and no additional runways can be built. The role
of air traffic control is to maximize throughput while maintaining safe separations in the sky and
on the ground. Air traffic control techniques include new precision based navigation (PBN)
approaches, higher delivery accuracy from new ATC technologies, and new wake separation rules

23
for departures and arrivals. By taking advantage of modern LIght Detection And Ranging
(LIDAR) measurements of wake vortices, along with new computational capabilities, several new
wake separation concepts are emerging. These new concepts also integrate live weather, especially
wind, and modern aircraft flight characteristics into predicting wake vortex behavior. This
capability introduces dynamic wake separation predictions, which can translate to increased
runway capacity.
1.3 Wake Turbulence
Wake turbulence is an aerodynamic side product of lift that aircraft dissipate from their wings.
This counter-rotating swirl of air can stretch several miles behind the aircraft and can last for
several minutes. The strength of these vortices is a function of the weight of the aircraft and its
speed. The larger the aircraft is, the stronger its wake vortex. This can become a potential safety
hazard, especially when a trailing small aircraft encounters the wake of a leading larger aircraft.
The wake can cause an upset and potential loss of control of the aircraft. In order to minimize the
risk of wake encounters, minimum separation standards are applied for arrival and departure
spacing of aircraft. Local and international aviation organizations, such as the Federal Aviation
Administration (FAA) and the International Civil Aviation Organization (ICAO) establish
separation minimums for air traffic control to enforce. In the U.S., the responsibility of maintaining
sufficient separation is transferred to the pilot when Visual Meteorological Conditions (VMC) are
present. When visibility is poor, Instrument Meteorological Conditions (IMC) prevail, and air
traffic control enforces these separation rules. IMC separation rules tend to be more conservative
than VMC separation, due to a variety of reasons. In low visibility, the pilots’ ability to maintain
visual separation is diminished. Additionally, when low visibility is coupled with snow or icing,
runway occupancy times may become longer, which translate to longer airborne separations.
Lastly, in IMC conditions, pilots use the Instrument Landing System (ILS) for landing, which
requires increased spacing in order to maintain signal integrity. All of the above-mentioned reasons
can lead to longer and longer separations and therefore, reduced runway capacity. A common
practice at European airports is to keep capacity at a constant level during the day, and arrival and
departure slots are allocated to airlines through a slot coordination process [4]. The number of

24
available slots is usually based on IMC separation rules and the corresponding capacity, which
means that airport capacity might be underutilized at times of the day when VMC weather
conditions prevail.
In recent years, not only the composition of the aircraft fleet mix has changed, but wake vortex
measurement and wind forecasting capabilities have also advanced, along with new air traffic
control tools. The combination of these developments motivated several new wake turbulence
separation concepts to surface. A set of these new rules focuses on increasing the granularity of
the legacy wake separation system by introducing six, seven, or even larger number of aircraft
wake categories. Another set focuses on implementing live wind information to adjust spacing
between arrivals and departures accordingly. The nature of these rules is highly variable depending
on what parameters they include, what runway configurations they are applicable to, etc., but they
all meant to decrease the required minimum spacing between aircraft, and hence to increase airport
capacity. A selection of these new wake separation rules is explained in detail in Chapter 4.
1.4 Research Objectives
The main objective of this research is to systematically analyze the various factors that influence
runway capacity with a focus on new wake turbulence separation concepts as congestion
mitigation strategies.
First, airport capacity influencing factors need to be evaluated to support a realistic and detailed
study of new wake separation concepts. Airport capacity is a function of many variables, including
the number of runways at an airport, their geometry, the interdependencies between runways, the
airplanes that fly to the airport, the weather conditions, and air traffic control strategies. These
variables all influence one another. One of the objectives of this work is to provide a detailed
analysis on the interdependencies and interactions between these variables, and to look at which
of these factors have stronger impact on capacity than others. The results of this study will provide
a baseline modeling framework for the study of wake turbulence separation.

25
There are several new and emerging wake separation concepts that can increase runway capacity
at airports. Some of these new rules are applicable to certain runway configurations only, while
others can be implemented for multiple configurations. The rules also come in both static and
dynamic forms, which means the exclusions or inclusion of live weather and aircraft flight data.
This wide variability in the nature and applicability of separation rules is considered in this study.
Solutions that can be applied to a unique airport have less potential for benefit for the global system
than solutions that can be implemented at several airports or those that are applicable in general.
The objective of this wake separation rule research is to understand the impact of these new wake
separation rules on capacity, and to examine how much additional capacity they can provide
beyond what can be achieved with today’s technology.
Previous research has mostly focused on studies of individual factors that impact runway capacity
or on isolated wake separation rules, as explained in the next section. The goal of this study is to
look at these components at a holistic level, covering the implications over a range of operational
and weather scenarios, fleet mixes, and runway layouts, in order to provide airports, authorities,
and researchers with a better understanding of the impacts of new wake turbulence related
operational procedures on runway capacity. Another important aspect of this system-level study is
to identify when and which other constraints in the system become active as wake separation rules
are modified, therefore identifying the limiting factors under these new conditions.
1.5 Literature Review
The context of this thesis covers three major research areas that include airport capacity,
congestion mitigation, and wake vortex turbulence, as shown in Figure 1-4. The arrows indicate
the flow of information as input parameters from one research area to the other. This thesis builds
on earlier runway capacity studies and modeling techniques, as well as on the evolution of wake
turbulence research that has introduced new wake separation capabilities. The proposed system-
level study of runway capacity components and new wake separation rules introduce new
congestion mitigation strategies and provide important input for air traffic flow management,
runway configuration selection, and demand management strategies.

26
Figure 1-4. Analyzing runway capacity at a system-level in the context of three major research areas.
The following literature review provides a detailed analysis and critique of previous theories and
methodologies in each of these three areas (congestion, wake turbulence, capacity), and
demonstrates how a system-level study of runway capacity can contribute to existing research.
1.5.1 Airport Capacity Models
Modeling airport capacity has been the focus of many prior research studies. Blumstein was one
of the first to develop a mathematical formulation of the landing capacity of a single arrivals-only
runway [5]. In his model, aircraft fly a common approach path with a minimum space separation
between arrivals. During instrument flight rule operations, the capacity of the runway is reduced
due to longer separations and the differences in arrival speeds of aircraft. Harris also examined
mathematical formulations for single runway capacity and provided a formulation for separation
buffers [6]. These simple runway capacity models (Blumstein and Harris) were extended by Odoni

27
to include the calculation of departure capacity and the overall runway capacity when arrivals and
departures are both present on the same runway [7]. Analytical models of airport capacity use a
limited set of parameters to estimate the impact of changes in air traffic procedures and technology.
Lee et al. implemented a single runway capacity model to estimate the effects of new procedures
in the terminal area [8]. Stamatopoulos et al. integrated a set of macroscopic models, which
included even aprons and aircraft stands, to evaluate both capacity and delays [9].
Airport and runway capacity presentation today is still based on capacity curves, developed by
Gilbo, who implemented an empirical model to estimate the convex capacity curve from historical
data on the number of arrivals and departures [10]. His method is based on the assumption that
observed peak arrival and departure counts reflect the airport at or near capacity level. The
robustness of the capacity estimate is increased by rejecting extreme observations (due to rare
occurrence of such events, or faulty data observations). Accordingly, the rejection criteria reflect
various confidence levels of the resulting capacity estimates. Gilbo’s rejection criteria is based on
the frequency of occurrences of these extreme observations, which are achievable only under
certain circumstances, such as favorable weather and fleet mix, sequencing of flights, etc.
Simaiakis pointed out that Gilbo’s capacity estimation technique provides upper bounds rather
than expected number of arrival and departure movements [11]. Upper bound estimates do not
consider variability in the system, such as changes in capacity caused by weather, fleet mix,
airspace restrictions or other factors. Therefore, calculating capacity based on expected values can
provide more realistic estimates for decision makers. Traffic managers can get detailed insight into
airport operational limits under various runway configurations and for a range of weather
conditions. Hence, accurately estimating and forecasting capacity is reliant on the assumptions and
input parameters that go into it, such as wake separation and runway occupancy.
Among many other variables, runway capacity is strongly influenced by separation rules between
arrival and departure movements and the time aircraft spend occupying the runway. These two
important runway components were initially studied by visually observing and measuring
operations. For example, Weiss and Barrer collected runway occupancy times and inter-arrival
times by taking stopwatch measurements at LGA, EWR, and BOS airports [12]. Their
28
measurements were broken down by aircraft type, runway, and weather conditions. Although their
studies provided valuable inputs to airport capacity estimation models, visual data collection was
impacted by large uncertainties in the measurements.
This challenge was overcome when new airport surveillance technologies and data collection
methods came in place, such as multilateration or the Airport Surface Detection Equipment Model
X (ASDE-X). Levy et al. analyzed over 100,000 approaches at Memphis International Airport
(MEM) from multilateration data to illustrate that landing speeds and inter-arrival distances were
not uniformly distributed, which could help to improve accuracy of modeling assumptions for
future studies [13]. Jeddi et al. also used multilateration data to obtain probability distributions for
landing time intervals, inter-arrival distances, and runway occupancy times at Detroit Metropolitan
Wayne County Airport (DTW) [14].
ASDE-X collects information from surface radars, Automatic Dependent Surveillance-Broadcast
(ADS-B) sensors, terminal area radars, and transponders onboard aircraft to calculate position of
aircraft both in the air and on the surface within close proximity of the terminal area. Data collected
from ASDE-X is of high accuracy, and hence it can provide a more realistic picture of today’s
runway occupancy times and separations than data collected by means of visual observations.
ASDE-X data was used by Kumar et al and Kolos-Lakatos to extract runway occupancy times at
major U.S. airports [15], [16]. Runway occupancy is an important factor to consider for reduced
wake separation studies, especially for aircraft pairs, where wake separation is not the limiting
factor. Zelinski characterized arrival spacing at 15 U.S. airports to illustrate that a reduction of
observed spacing buffers can equate to a 10 to 20% increase in arrival runway capacity [17]. In a
similar fashion to the evolution of aircraft surveillance capabilities, capacity models have also
evolved from basic single runway spreadsheet calculations to complex airfield and airspace
models.
Simulation of the runway and airport infrastructure is widely used in the aviation industry to obtain
realistic and accurate capacity predictions. Despite published flight schedules, the air transport
system remains largely stochastic, and there are a large number of capacity influencing variables

29
whose stochastic nature should be captured by simulation models. Odoni et al. provided a
comprehensive review and assessment of fast-time ATM models and support tools with regard to
their capability to evaluate and validate emerging operational concepts and procedures [18]. The
study considered two future operational scenarios (free flight and surface operation automation)
to highlight capabilities, advantages, and drawbacks of various models. These models ranged from
quasi-analytical capacity and delays models (e.g. FAA Airfield Capacity Model) to high-level
detailed simulation models (e.g. Total Airspace and Airport Modeler – TAAM, and SIMMOD).
TAAM and SIMMOD are two popular terminal area simulation models with high degree of
sophistication [19]. They are both high fidelity models, considering all operations in the air and on
the ground, second by second. These two models are highly realistic reflections of airport
operations, as they both consider flight schedules, runway infrastructure, taxiway locations, and
gate allocations to calculate capacity and delays. Bazargan and Choroba chose TAAM to look at
airport capacity benefits from new operational concepts at Philadelphia (PHL) and at Paris Charles
de Gaulle (CDG), respectively [19], [20]. This high level of realism that these models provide,
however, comes at a price. It takes a very long time for the user to prepare an airport and airspace
simulation run, and the computational time can be very long. Detailed simulation of the ground
infrastructure can be unnecessary since the scope of this research work is limited to the capacity
of only the runway system, assuming that taxiways and gates have little impact on runway
capacity. Other simulation models, such as MITRE’s runwaySimulator might provide the required
simulation detail, but it is unclear how they handle hypothetical runway configurations or dynamic
wake separation rules for instance [21].
The Transportation Research Board published a more recent overview of available methods to
evaluate existing and future airfield capacity, as part of the Airport Cooperative Research Program
(ACRP) [22]. This report also provides guidance on selecting an appropriate capacity analysis
method for future studies, ranging from macroscopic models used for policy analysis or cost-
benefit studies to microscopic models used for detailed airport analysis and preliminary design.
Runway and airport capacity estimates from these models are must have inputs for many
congestion mitigation policies, for traffic flow management solutions, and for delay modeling
purposes.

30
1.5.2 Congestion Management
Knowledge of runway capacity is needed to predict future runway configurations for example.
Ramanujam and Balakrishnan statistically characterized the runway configuration selection
process from empirical observations [23]. They developed a discrete choice model with utility
functions (weather, demand, noise, coordination with other airports in the vicinity, etc.) to predict
runway configuration three hours ahead, given the operating conditions, wind, visibility, and
demand forecast for that time period. The model also included resistance to configuration change
in the decision-making process to predict future outcomes. Avery and Balakrishnan extended the
above-mentioned approach by obtaining allowable tailwind and crosswind conditions from actual
data rather than from FAA operating manuals [24]. The forecast window accuracy decreased with
the prediction time, providing the most accuracy for the next 15-minute window, gradually
decreasing up to the next 3-hour period. Bertsimas et al. develop a mixed integer program to
simultaneously select an airport’s sequence of runway configurations and to determine the optimal
balance of arrivals and departures while minimizing the total cost of in-flight and on-ground delays
[25]. The optimization of both parameters required prior knowledge of the airport capacity
envelope under certain meteorological conditions and runway configurations. Selecting a runway
configuration meant choosing a capacity envelope that corresponded to that configuration, while
balancing arrivals and departures meant choosing a point on or within the capacity envelope.
Jacquillat et al. extended the joint optimization of runway configuration selection and arrival-
departure balancing problem under stochastic queue dynamics and operating conditions [26]. They
developed a dynamic decision-making framework that can provide additional benefits in the event
of uncertainty. Runway capacity is not only the function of runway configuration, but also the
weather conditions that occur at the airport. When bad weather hits the major East Coast airports,
delays can propagate across the country, all the way to the West Coast. Since airborne delays can
be costly to airlines, various air traffic flow management techniques have been implemented to
scope with congestion.
Odoni proposed a flow management system to alleviate network-wide congestion problems in the
airspace [27]. He pointed out that the bottlenecks of the system were airports, and a flow

31
management system was needed to use the information from the congested destination airport to
take various actions: delay departure times of aircraft (gate holds or ground holds) at origins, meter
traffic flows in the air, re-route airborne flights, implement speed control en-route, or create
holding patterns in the air. The motivation behind holding an aircraft at the departure airport is
based on the idea that holding and aircraft on the ground is less costly than holding an aircraft in
the air, once the aircraft is en-route. Richetta and Odoni extended the ground holing policy
problem first to a single airport, then later provided a dynamic solution to the ground hold for
groups of aircraft classes [28], [29]. In their work, the expected cost of ground delay plus air delays
was minimized by deciding if a flight should stay on the ground or depart in each decision period
(with new updated capacity forecast). Vranas et al. were the first to expand the ground holding
problem to a multi-airport scenario by using an integer programming model [30]. Single airport
cases in the past neglected down-the-road effects due to transmission of delays between successive
flights performed by the same aircraft. Their study included multiple airports and thousands of
flights to include propagation of delays in the system, but it was computationally expensive and
hence limited for system-wide operational scenario planning. Bertsimas and Stock-Patterson
enhanced computational efficiency of the ground holding problem [31]. They assigned a
predetermined set of en route sectors for each aircraft in the system and let the model determine
on the departure time and sector occupancy time of each aircraft. The LP relaxation of the integer
problem increased computational efficiency and permitted solving large-scale, realistic scenarios
with several thousand flights. Bertsimas et al. continued the advancement of the large-scale flow
management problem by including a set of options to resolve congestion (rerouting, speed control,
and airborne holding) [32]. Their model formulation requires both departure airport capacity and
arrival capacity as key input parameters.
Besides air traffic flow management strategies, changes in scheduling can also increase runway
throughput and reduce delays. Dear proposed runway scheduling from an operational and fairness
point of view [33]. The traditional first come, first served (FCFS) sequence is inefficient, and
throughput can be increased by implementing constrained position shifting (CPS). Modifying
arrival and departure sequences can provide additional capacity benefits and delay reductions at
low implementation cost. Aircraft sequencing with large changes from the original sequence was

32
rather difficult to implement due to controllers’ limited computer availability, at the time, to
accommodate such changes and due to airlines’ competitive flight scheduling practices. Dear’s
work has inspired many studies on CPS implementation. For example, Balakrishnan and Chandran
developed CPS further by including other operational constraints in the framework and
implementing mixed arrival-departure flows, as well as multiple departure queues in their model
[34]. Solveling et al. introduces uncertainties (stochastic push-back delay, taxi time, airborne
delays) in their model [35]. Their model includes a two-step runway planning process: first, a
sequence of aircraft is generated that maximizes throughput (sequence optimizer, based on runway
schedule and stochastic characteristics), then individual aircraft are assigned to the sequence
(assignment optimizer). This two-step method results in higher throughput than FCFS planning
policies.
Airport performance can also be improved through demand management and scheduling
interventions. Vaze and Barnhart showed that small scheduling changes can have a big impact on
mitigating congestion [36]. They estimated the minimum possible level of delays that can be
achieved using demand management strategies from an integer linear programming model and
found that U.S. competitive airline scheduling decisions result in large inefficiencies in the use of
airport infrastructure. Slot control and congestion pricing can also help to mitigate congestion, and
they can improve airline profitability. Jacquillat and Odoni developed an approach to jointly
optimize airport capacity utilization and scheduling interventions for capacity allocation [37]. The
results showed that an integrated approach to congestion mitigation performed better than a
sequential approach where scheduling and capacity allocation were handled separately.
1.5.3 Wake Turbulence
There are also efforts to increase capacity and reduce congestion, resulting from reduced wake
turbulence separations, thanks to the advancements in wake vortex research. Studies of wake
behavior cover a wide range of atmospheric conditions: in-ground effects on landing [38] or
atmospheric turbulence impacts on wake circulation [39] [40]. These studies provide more
accurate wake behavior predictions than earlier models, and they contribute to establishing new

33
wake separation standards. Current separation standards are established by aviation authorities,
including the FAA, ICAO or Eurocontrol [41]. Traditionally, the separation standards considered
only the maximum takeoff weight (MTOW) of aircraft to divide aircraft into wake generating
categories. Recent studies, however, such as Re-Categorization of aircraft (RECAT), introduced
new categories that take both MTOW and wingspan into account [42]. Cheng and Tittsworth
provide a detailed overview of the development of wake turbulence RECAT initiatives in the
United States that include a move towards increasing the number of categories even further to
seven or transitioning to a pairwise separation matrix [43].
The above-mentioned concepts are static separation rules, as the required minimum separation
value does not vary dynamically with weather conditions or with live aircraft characteristics
(weight, speed, flap and gear configuration, etc.). There are, however, several initiatives to take
advantage of live wind and aircraft information in the calculation of minimum separations. For
instance, crosswind can enable reduced separation because it can carry the wake out of the path of
the following aircraft. Headwind can also influence dissipation of wake vortices, but more
importantly, it reduces ground speed of aircraft, and hence leads to loss of runway throughput.
National Air Traffic Services (NATS), the main air navigation service provider in the United
Kingdom, has introduced a time-based wake separation concept when strong headwinds are
present [44]. Aircraft on a common approach path are separated by time intervals, as opposed to
distance based intervals. This helps to maintain the desired arrival rate. Morris et al. also argues
that converting to a time-based separation system can help to recover loss of runway throughput
in strong headwind conditions [45].
Most of the leading wake separation research is specific to certain concepts and techniques. There
are very few comprehensive studies that cover a wide range of wake turbulence research areas.
Choroba provided a summary of recent wake efforts in Europe [20], and the Deutsches Zentrum
für Luft- und Raumfahrt (DLR) prepared a public report to provide an overview of the current
state-of-the-art wake vortex technologies and concepts [46]. This report also identified future
research needs to reduce wake turbulence encounter risk and to safely increase runway capacity at
constrained airports. A similar comprehensive study was concluded in the U.S. by the National

34
Academy of Sciences [47]. This study suggests that system-level studies are needed to assess the
relative benefits of wake turbulence mitigation strategies and to help with setting research priorities
and using resources efficiently and effectively.
Once congestion mitigation strategies are in place, their impact can be measured in terms of
runway throughput and capacity and in terms of delays. Although delays are not studied directly
in this thesis, they can be part of future continuation of this work.
1.5.4 Literature Summary
The comprehensive literature review identified several areas for further research. First, the
modeling and mathematical formulation of runway capacity that is presented in several studies
was developed under a different set of operating conditions from the one applied today.
Operational procedures, aircraft types, and ATC technologies have changed since then, therefore
it is possible that runway capacity can be predicted more accurately by modifying or adjusting
certain parameters in the calculation in order to match today’s operational environment.
Additionally, new wake separation rules introduce new aircraft categories, dynamic separation
rules, and other new operational procedures that a runway capacity simulation model needs to
accommodate. These new concepts require great flexibility for the user to change input parameters,
and to modify the modeling logic if needed. New separation rules and hypothetical scenarios
cannot be implemented in earlier airport capacity models if the airspace and airfield logic was not
designed with such procedures in mind. Since the objectives of this study are to systematically
analyze runway capacity components and new wake separation rules, a simulation tool is needed
that is not only capable of simulating future operations, but one that can also carry out a large
number of simulations in a short period of time. For all the above-mentioned reasons, developing
a tool from scratch with the required flexibility in mind and at the right fidelity can provide the
detailed results needed for this study.
Second, there have been many studies on individual runway capacity components, such as runway
occupancy times or separation buffer, but very limited work has been done on systematically
analyzing these components and investigating the relationships between them. The study of wake

35
vortex separation rules led to a similar conclusion. Most studies focused on analyzing one wake
separation rules at a time, or analyzing operations at a specific airport in details. Little work has
been done on systematically evaluating the capacity impacts of new wake separation rules for a
wide range of scenarios. One possible reason for this is that most of the new and emerging wake
separation rules are relatively recent and they are subject to constant updates and reviews.
Moreover, many of these new wake separation rules are applicable to specific airports or
operational conditions, which makes a comprehensive system-level study challenging. Last, but
not least, it was also observed that recent congestion mitigation strategies rely on historical runway
capacity estimates for future decision making. Providing runway capacity estimates from a multi-
attribute study and from a wake separation rule study could be an important contribution to
predicting future runway configurations, implementing ground delay programs, or allocating
capacity among airlines.
1.6 Thesis Contributions
The airspace and airport infrastructure is a complex system with multiple factors affecting system
capacity. These factors need to be studied and assessed together to realize potential benefits of
changes in the ATM system, such as the introduction of new wake separation rules and procedures.
The main contribution of this doctorate research work is a system-level study of runway capacity
influencing factors and new wake separation standards. This means that airspace, airport, and
aircraft components are studied together and their interactions with each other are investigated for
a wide range of scenarios. System-level studies are of key importance to accurately assess the
benefits of new airport infrastructure, approach procedure changes, and wake turbulence
mitigation strategies. The results of this study can help achieve NextGen and SESAR goals for
authorities by providing system-level information about potential runway capacity increases. To
address the challenges in dealing with the complexity of air transport system, this study requires
both qualitative and quantitative research and detailed simulation modeling. System-wide
simulation models are necessary to factor in various components of operations, as well as
uncertainties that come with them. The major contributions of this system study can be
summarized the following way:

36
I. This study gained new insights into reduced wake turbulence separation concepts. First,
results show that increasing the number of aircraft wake categories can increase runway
capacity, but the benefits become marginal with each new category added. A five or six-
category wake separation system can capture most of the runway capacity that can be
achieved with a pair-wise system. Additionally, creating airport specific aircraft wake
categories can increase capacity over a universal, one-rule fits all system. Second, wake
separation concepts that target the most common aircraft type or most common aircraft
wake category can achieve high airport capacity gains with relatively minor changes in the
separation rules. Third, dynamic pair-wise wake separation rules provide little benefit over
a static pair-wise wake separation rule as the separation constraint shifts from airborne
wake turbulence to runway occupancy on the ground. Last, a time-based separation rule
can recover lost capacity due to headwinds. Since most runways are oriented based on
common wind directions, the impact of lost capacity due to headwind can be significant.
II. The detailed study of new wake turbulence separation concepts identified an additional
limiting factor for increasing airport capacity. As airborne wake separations are reduced,
the capacity bottleneck shifts from the air to the ground, and runway occupancy becomes
the limiting factor for many aircraft pairs.
III. As part of this work, a detailed, fast-time runway system simulation model was developed
with the capability of implementing and evaluating a wide range of new wake turbulence
separation rules in the airport terminal area. This Monte-Carlo simulation-based model is
programmed in MATLAB, and it includes stochastic effect with respect to the way aircraft
are sequenced, spaced, and operated. The model takes a variety of inputs, including runway
configuration, fleet mix, aircraft dynamics (acceleration, deceleration, flown approach
speed profile), and runway occupancy to generate IFR airport capacity envelopes with
respect to new wake separation rules and procedures. The simulation model developed here
is capable of evaluating any number of aircraft wake categories under both distance and
time-based separation rules. Additionally, the simulation model estimates the capacity
envelope for a given runway configuration from 100 unique points along the envelope

37
(every combination of arrival-departure ratio) as opposed to the three to five points used in
other models.
The overall results from these efforts provide a detailed overview of expected capacity benefits
from new separation procedures. As identified before in the literature study, the predictions of
future airport capacity curves provide valuable inputs to airport planners and airport authorities.
The expected benefits of runway extensions and geometries can be quickly evaluated for cost-
benefit studies. This can also provide air traffic controllers with more accurate predictions of
runway capacity under various configurations and conditions. Authorities can identify wake
separation rules that are key to achieve NextGen goals both in the short-term and in the long-term.
Flow management strategies, and expected delays can be evaluated from new airport capacity
profiles. Last, but not least, the aviation research community can take advantage of a new fast-
time runway capacity simulation model for ongoing and future work.
1.7 Organization of the Thesis
This thesis contains a total of five chapters. Chapter 2 discusses the modeling framework,
presenting a roadmap for the rest of the thesis. This chapter explains the chosen research method,
including the programming of the fast-time simulation model, the application of the model in
current settings, and the evaluation of new scenarios. It explains the separation rules applied with
the underlying assumptions, the sequencing and spacing techniques, as well as the input parameters
and limitations of the model. Chapter 3 presents the study of airport capacity under different
infrastructure settings and operational rules. The focus of this chapter is a system-wide study of
runway capacity components, their interactions, and the tradeoffs between them to provide a bases
for evaluating new separation rules. Chapter 4 follows with the application of the model to wake
vortex separation requirements. A detailed assessment of new wake separation rules and their
expected capacity benefits are presented here. Seven major U.S. airports selected to illustrate wake
separation procedures and their impacts are discussed. In conclusion, Chapter 5 provides a
summary of the findings of this thesis, their implications for implementation, and provides a path
for future work.

38

39
Chapter 2
2 Monte-Carlo Simulation Model of Runway Operations
This chapter introduces the reader to the simulation modeling framework and it presents an
overview of the input parameters, the formulation of the runway capacity problem, and the results.
Details of the Monte-Carlo runway capacity simulation model are also presented. First, the reasons
for developing a new simulation model from scratch as opposed to choosing an off-the shelf
product are justified. Thereafter, the required model inputs and the simulation logic is explained
in detail. This is followed by a brief comparison of simulation results with results obtained from
other simulation tools. A discussion of limitations and the underlying assumptions of the fast-time
runway capacity model concludes the chapter.
2.1 Modeling Approach
The first part of the research framework, synthesis and analysis, involves the review of runway
capacity components and wake vortex separation rules. Runway capacity components include
factors related to the airfield, the aircraft operating at the airfield, the air traffic control rules and
procedures that dictate how aircraft operate, and other external factors. Airfield or airport related
factors include the number of runways, the configuration of runways, the location of runway
intersections and runway exits, and the length of common final approach path. Aircraft related
properties usually refer to the fleet mix, meaning the size and speed of aircraft, their approach
speeds, their runway occupancy times, and takeoff or landing performance. Air traffic control rules
deal not only with the wake separation rules, but also with the interaction between aircraft on
different runways and interactions between aircraft on the same runway. Additional safety
margins, called buffers, are also considered as part of ATC. Lastly, external factors discussed in
this study include time delays (communication delays between pilot and ATC, or time delay
between communication and action), and weather-related events. Figure 2-1 provides a visual

40
illustration of the modeling framework with the input parameters shown on the left side. For each
simulation run the independent variables are the number of runways, their configuration and
geometry, the final approach length, the fleet mix, the wake separation rule, and wind. Other input
parameters, such as the length of final approach, the approach speed of aircraft, runway occupancy
times, landing and takeoff performance, non-wake separation, separation buffers, and time delays
are kept fixed (defined as constants or specified by probability distributions). Depending on the
nature of these variables, they are either studied from literature or are analyzed by means of data
collection and evaluation.
Figure 2-1. The three-step modeling approach: experiment design, simulation modeling, and result
generation.
Building a new simulation model, as opposed to selecting an existing product, provides great
flexibility in terms of modeling new operational procedures and wake vortex separation concepts.
Older simulation models were designed with legacy separation rules in mind. They might be able
to accommodate large pair-wise separation matrices or dynamically adjustable wake separation
concepts, but setting up and running a single simulation can be very time consuming. The scope
of a new simulation model can also be narrowed down to parts the airport that are being
investigated, hence, requiring less computational time compared to other, more sophisticated
models. The simulation model is constructed based on detailed study of existing and proposed
future ATC protocols, and consultation with industry professionals and air traffic controllers [48].
The simulation model uses the Monte-Carlo technique, which is a popular tool for sampling from
probability distributions until a steady-state is reached. The model requires a prior knowledge of

41
distributions of key variables, which are listed in the middle box in Figure 2-1. The following
variables are considered stochastic variables in the simulation model: fleet mix sampling
(generating 100 flights based on the specified fleet mix distribution), sequencing of movements
(assigning arrivals and departures), separation buffer, runway occupancy time, and aircraft
acceleration/deceleration. (The impact of stochastic approach speeds in evaluated separately.)
These values are uncertain in practice and therefore Monte-Carlo simulation is needed due to the
randomness in arrival and departures operations at an airport. As the number of simulation runs
increase, the resulting runway capacity estimate will echo the underlying distributions. The
simulation model and input parameters are calibrated and validated against another existing
simulation model as well as published data by the FAA.
Outputs of the model take the form of Pareto or capacity envelopes, as show in the right side of
Figure 2-1. The expected value of number of arrivals and departures is generated, along with the
corresponding throughput and inter-arrival and inter-departure statistical distributions. The
sensitivity of results to the input parameters is checked by varying one parameter at a time and
keeping other input parameters constant. First, current operation procedures and real airport
configurations are evaluated, then new scenarios are generated for the evaluation of future wake
separation concepts. Seven of the most delayed U.S. airports have been selected for a series of case
studies, where one of the most limiting runway configurations is evaluated at each of these airports
under a number of new wake rules. Not all wake separation rules are applicable to all runway
configurations, therefore, certain airports have multiple configurations evaluated (if such
configuration is plausible to operate).
Once the results are generated, they are evaluated both quantitatively and qualitatively. The
runway capacity results presented here can provide valuable inputs to airport delay models and air
traffic flow management studies, and they can provide guidance regarding which wake concepts
authorities and researchers should focus on to maximize capacity benefits.

42
2.2 Model Formulation and Input Parameters
The runway capacity model simulates arriving and departing aircraft at an airport using Monte-
Carlo simulation-based techniques. Flights are generated and separations are evaluated based on a
set of input parameters, incorporating airfield and airspace specifications, aircraft characteristics,
air traffic control rules and procedures, and other external factors.
2.2.1 Airfield and Airspace Characteristics
The simulation model is runway capacity focused and the only part of the airspace that is
considered in this study is the part that all arriving aircraft share: the common final approach path.
All aircraft start their approach at the beginning of the common approach path defined as the
distance from the landing runway threshold to the common final approach fix in nautical miles.
Upon departure, aircraft are assumed to take free departure paths (they can turn in any direction).
A technique, called fanning, is practiced by a number of airports. Fanning permits departing
aircraft to turn immediately after takeoff, hence minimizing the flight time in the wake zone of the
preceding departure. Fanning can be modeled in the simulation by reducing the inter-departure
separation times when no wake separation is required between consecutive departures.
The number of runways, their orientation, and geometry have a strong influence on capacity and
therefore they are critical input parameter to the simulation model. The scope of the simulation
model is limited to the capacity evaluation of two runways at a time, assuming that most airports
operate under such configuration during IMC weather conditions. The layout of two runways can
be intersecting, converging or diverging, or parallel. Parallel runways can be closely-spaced (less
than 2,500ft between centerlines), medium-spaced (centerline spacing between 2,500ft and
4,300ft), or far-spaced (centerline spacing of 4,300ft or more). For evaluating the capacity impacts
of new wake turbulence separation rules, only intersecting and closely-spaced parallel two-runway
layouts are implemented in the simulation model. The user can select from five major operational
configurations as shown in Figure 2-2. Single runway operations can be arrivals-only, departure-
only or mixed arrival-departure operations. Intersecting runway configuration is such that arrivals

43
land on one runway, and departures takeoff on the intersecting runway. Closely Spaced Parallel
Runway (CSPR) operations include a one-arrival one-departure runway configuration and a two-
arrival runway configuration.
Figure 2-2. Airport operational configurations included in the simulation model: single runway,
intersecting runways, and closely spaced parallels.
Independent parallel runway configurations operate as two single runways. The capacity profiles
of each of the runways can be summed together to generate total system capacity. In terms of
geometrical specifications, the single runway configuration does not require further specifications.
The closely spaced parallel runway configuration requires the user to enter the distance between
the runway centerlines. The intersecting runway configuration requires multiple inputs from the
user, as the location of the intersection can significantly influence runway capacity.

44
Figure 2-3. Geometrical specifications for a pair of intersecting runways.
These input requirements for intersecting runways are the distance from the departure end of the
runway to the intersection of the runway centerlines, and the distance from the arrival threshold to
the point of centerline intersection. These two input parameters for the intersecting runways
configuration are indicated by the arrows in Figure 2-3 above.
2.2.2 Fleet Mix and Aircraft Characteristics
Aircraft fleet mix refers to the size and composition of aircraft that operate at an airport. Aircraft
of different size (MTOW, wingspan, engine power) fly at different speeds, and therefore generate
wake vortices of various strength. This heterogeneity in the fleet requires careful wake vortex
separations and sequencing of aircraft, both of which are core parameters that affect runway
capacity.
For this study, fleet mix data is collected and evaluated from the Operational Evolution Partnership
(OEP) 35 commercial U.S. airports, shown in Figure 2-4.

45
Figure 2-4. Top 35 U.S. airports that account for 70 percent of passenger traffic.
These airports serve major metropolitan areas and many of them are key hub airports to airlines.
More than 70 percent of passengers fly through these 35 airports according to the FAA [49]. Three
peak travel days (Monday, Friday, Sunday) of a summer schedule are selected at each of these
airports and all arrival flights are collected by type of operating aircraft. The resulting fleet mix
distribution is shown in Figure 2-5. Single-aisle aircraft (shown with blue bars) dominate the fleet
mix, most of which are members of the Boeing 737 and Airbus A320 families, followed by
regional jets. The trailing end of the distribution is occupied by older aircraft that are close to
retirement (for example: MD80s, DC10s, A340s, B737 Classics) and new aircraft that are just
entering service (for example: A350, B787-9). Wide-body aircraft (shown with orange bars) make
up 6.9% of the fleet mix, which include both passenger and cargo operators. The most common
wide-body aircraft types are the Boeing B767, A330, and B777 for passenger operators and the
Airbus A300/A310 and Boeing DC10/MD11 for cargo. 0.2% of the total traffic are Airbus A380
flights, which operate only at the busiest hub airports (e.g. New York - JFK, Los Angeles – LAX,
Atlanta – ATL, etc.). Wide-body aircraft are important to consider as they generate strong wake
vortices and hence require longer arrival and departure separations when they operate at airports
where other small aircraft are also present. Only eight aircraft types account for 50 percent of the
fleet mix at these 35 airports. A total of 30 aircraft types account for 90 percent of the fleet mix,
and 63 types account for 95 percent.

46
Figure 2-5. Aircraft fleet mix distribution at the top 35 U.S. airports, sorted by aircraft type.
The purpose of this fleet mix study is to provide a representative sample of aircraft flying in the
U.S. airspace, which is calculated as the sum of aircraft type specific operations at the 35 airports
for the selected three days. The information obtained here serves as the baseline fleet mix input
for Chapter 3. It is also important to note that fleet mix not only varies from airport to airport, but
it also changes within an airport throughout the day. Hence, runway capacity can change just by
the change in fleet mix composition at an airport. A good illustration of fleet mix variability is
shown in Figure 2-6 for Memphis International Airport (MEM), one of the OEP 35 airports. This
airport is the hub airport for FedEx, a major cargo carrier. Cargo operations peak during the middle
of the night and a morning peak can also be observed, although that is of smaller magnitude.
During the morning rush, from 7 AM to noon, Heavy cargo aircraft make up about 60 percent of
the fleet mix. In the afternoon, however, single aisle passenger jets (in the Large category)
dominate. The resulting runway capacity in the morning can look very different from the capacity
in the afternoon.

47
Figure 2-6. Fleet mix variability and arrival throughput (passenger and cargo flights) in a 24-hour
period at Memphis International Airport (MEM).
Aircraft of different size have different performance characteristics as well. This yields to
variability in acceleration, deceleration, runway occupancy time, and approach speed profile.
Typical aircraft departure acceleration, and landing deceleration profiles are based on manufacture
published reports for the purpose of this study. During everyday operations, however, these values
can be different when considering weight, fuel usage, runway length requirement, runway exit
location, wear and tear, and passenger comfort. Acceleration and deceleration values are needed
to evaluate how soon a departing or arriving aircraft reaches the intersection in an intersecting
runway configuration scenario. The simulation model assumes that arrival aircraft can exit the
runway at any given location as specified by their runway occupancy times.
Runway occupancy time is defined in the simulation model as the time interval between the arrival
aircraft overflying the runway threshold at the arrival end, and the aircraft fully exiting the runway
(aircraft crosses runway exit hold line) so the next arrival or departure can be cleared. The runway
occupancy time values are obtained from ASDE-X data at four major airports for this study: New
York LaGuardia (LGA), Boston Logan, Newark (EWR), and Philadelphia (PHL) [16].

48
Figure 2-7. Runway occupancy time analysis from ASDE-X surveillance data. Shown airport specific
values indicate expected runway occupancy times for Large class aircraft.
The corresponding distributions are shown in Figure 2-7. Analysis of ASDE-X data provides
runway occupancy mean values and variances for small, large, B757, and for heavy category
aircraft. Runway occupancy times for Airbus A380 are obtained from a literature study
considering A380 operations at London Heathrow [50]. The runway capacity model assumes
normal distributions for runway occupancy times for every aircraft wake category in the simulation
model. These values and distributions are specific to aircraft types. Similarly, to runway occupancy
times, approach speed profiles are also analyzed from observed data.
Approach speed profiles are analyzed from two different data sources to assist with the formulation
and calibration of the runway capacity simulation model. The first analysis considers digital flight
data recorder (FDR) information for the Airbus A320 aircraft from a European airline. Ground
speed profiles of 70 approaches at multiple European airports are plotted for the last ten nautical
miles of the flights (measured from arrival runway threshold) in Figure 2-8. The red line indicates
the mean ground speed, calculated as the average speed of all flights at a given distance from the
runway threshold.

49
Figure 2-8. A320 approach speed profiles on the last 10NM of the approach, based on FDR data from
a European airline. Red line indicates mean approach speed.
The simulation model assumes that ground speeds and air speeds are the same at low altitudes
when there is no wind. The data shows that aircraft fly the last three miles of the approach at a
constant speed. This is possibly due to the stable approach criteria, which states that the approach
is stabilized when the aircraft is on the correct flight path, the airspeed is not more than VREF +
20 knots, the aircraft is fully configured for landing (gears and flaps in position), sink rate is no
greater than 1000ft per minute, power setting is appropriate, and checklists have been conducted
[51]. This stabilized approach criterion needs to be met by 1000 feet above airport elevation in
IMC conditions, otherwise a go-around maneuver is required [51]. The 1000 feet above airport
altitude translates to about three miles on a three-degree glide slope, which aligns with what the
FDR data indicates. Aircraft of different size fly different approach profiles as illustrated from
ASDE-X data study. Figure 2-9 shows the ground speed and altitude profiles for small propeller
aircraft, small jets, large passenger jets, Boeing 757, and wide-body, heavy aircraft at Boston
Logan airport. [Some data points can be subject of ASDE-X reporting interval errors]. These
aircraft categories are based on the current FAA wake categories, explained later in this chapter.

50
Figure 2-9. Approach speed profiles for aircraft of different size, based on ASDE-X data. Red line
represents mean ground speed; yellow line represents median.
The ASDE-X approach profiles indicate that larger aircraft fly longer on the three-degree
glideslope than smaller aircraft. They also follow the stabilized approach criterion more closely on
the last three miles of the approach. It is also interesting to note that small propeller aircraft
maintain a high approach speed longer on the approach and slow down more rapidly at the end of
it, close to the runway. Keeping approach speeds high is partially due to sharing the approach with
large and heavy aircraft that cannot fly any slower and therefore small propeller aircraft would
delay them otherwise.
The analysis of final approach speed profiles indicates over-the-threshold-speeds (the moment an
arrival aircraft overflies the arrival end of the landing runway) ranging from approximately 60
knots (small propeller aircraft) to approximately 160 knots (Heavy weight class aircraft) with
standard deviations of 15 knots and 9 knots, respectively. The results also show that the variability
in approach speeds decreases with increasing aircraft size. In this study, the final approach speeds

51
in the airport capacity simulation model are based on mean approach speeds. Arrival aircraft fly at
their final approach speed for the last three miles of the approach. The approach speed increases
an average five knots per mile up to 180 knots as presented in Figure 2-10. (These approach speeds
are ground speeds and they are adjusted for wind conditions in the simulation model.)
Figure 2-10. Modeled final approach speed profiles are based on mean approach speeds and they are
capped at 180 knots.
Although the approach speeds seen in Figure 2-8 and Figure 2-9 show stochastic behavior, the
approach speed profiles in the airport capacity simulation model are based on deterministic values.
The impact of selecting deterministic approach speeds over stochastic approach speeds (based on
Gaussian distribution) has been evaluated on a single arrivals-only runway, keeping all other
variables constant and only changing the approach speed profiles. Figure 2-11 shows the
cumulative distribution functions for arrival runway throughput under deterministic approach
speeds (as shown in Figure 2-10) and stochastic approach speeds. Stochastic approach speeds
assume a Gaussian distribution with the same mean speeds as in the deterministic case, and
standard deviation calculated for the last three miles of the approach is based on the standard
deviation measured at the runway threshold, while the standard deviation for the deceleration
phase is based on the standard deviation calculated at six miles from the threshold.

52
Figure 2-11. Impact of stochastic vs. deterministic final approach speeds on single arrivals-only
runway throughput.
The use of stochastic approach speed profiles increases the arrival throughput range by both
decreasing the lowest throughput and increasing the highest throughput. The mean arrival
throughput remains the same, however, the computation time of the simulation run increase. Since
capacity has been defined as the expected number of arrivals and departures in this study, approach
speeds have been chosen as deterministic variables in the simulation model.
2.2.3 Air Traffic Control Rules and Procedures
Air traffic control’s role is to maintain safe and efficient operations in the airspace and at airports.
Most separation rules are based on aircraft wake categories within the terminal area. The
interactions between arrivals and departures can be regulated once these categories are established.
Separation rules are specified between consecutive arrivals and departures and for mixed mode
operations. Additional rules can be implemented for more complex runway configurations when
dependencies between runways are critical. The air traffic control rules and procedures modeled

53
in this runway capacity simulation tool are based on FAA air traffic control guidance as specified
in order 7110.65 [48].
In order to minimize the risk of wake turbulence encounters, the FAA establishes minimum
separation requirements for all phases of flight. According to the legacy rule, aircraft are put into
wake categories (Small, Large, B757, Heavy, and Super) based on their MTOW. The Boeing 757
has its own wake category due to its unique size and wake generating characteristics. The legacy
wake category criteria are shown in Table 2-1.
Table 2-1. Legacy aircraft wake categories in the U.S.
Small Large B757 Heavy Super
MTOW MTOW
£41,000 lb
41,000 lb <
MTOW
< 300,000 lb
B757 MTOW
³300,000 lb
A380,
AN225
Minimum separations between pairs of aircraft are specified based on the wake category of the
leading aircraft and the wake category of the following aircraft. Each of lead-follow pairs is
assigned a required minimum separation distance for arrivals or a required minimum time
separation for departures.
Table 2-2. Final approach separation minimums based on FAA 7110.65W (IFR).
Arrival Separations
(nautical miles) 7110.65W
Follower
Super Heavy B757 Large Small
Leader
Super MRS 6 7 7 8
Heavy MRS 4 5 5 6
B757 MRS MRS MRS MRS 4
Large MRS MRS MRS MRS 4
Small MRS MRS MRS MRS MRS
*MRS – Minimum Radar Separation

54
The legacy final approach separation values shown in Table 2-2 serve as the baseline separation
rule for the purpose of this research study. The table shows the leader aircraft wake category on
the left column, and the follower aircraft category on the top row. The values specified by
Minimum Radar Separation (MRS) indicate the authorized separation on the final approach course
within the last ten miles for the approach. MRS is three miles when radar capabilities permit. This
can be reduced to two and half miles when the average runway occupancy time on the runway is
no more than 50 seconds, the braking action is reported good, and the runway turnoff points are
visible from the control tower [48]. Similarly to arrivals separations, same runway departure
separations are also specified based on wake categories, as shown in Table 2-3.
Table 2-3. Departure separation minimums based on FAA 7110.65W for wake constrained pairs.
Departure Separations
(seconds) 7110.65W
Follower
Super Heavy B757 Large Small
Leader
Super 180 180 180 180
Heavy 120 120 120 120
B757 120
Large
Small
No additional wake separation is necessary for aircraft pairs with no separation value assigned in
the table and standard departure separation can be applied for these pairs. This means that a
departing aircraft can be cleared for departure when the preceding aircraft has departed and crossed
runway end or turned to avert any conflict, as specified in FAA Order 7110.65W [48]. When both
departures are IFR departures, the standard minimum radar separation is ensured between aircraft.
Separation requirements become more complex when arrivals and departures are mixed on the
same runway or when multiple runways are considered. On single mixed-mode runways for
example, no aircraft can depart from the same runway if an arrival is within 2NM of the runway
threshold. In the case of intersecting runways, additional wake separation requirements may

55
become active when a Boeing 757 or Heavy weight class aircraft is airborne at the intersection
[48].
Closely spaced parallel runways are modeled in two operational configurations: when both
runways are used for arrivals, and when one runway is used for arrivals, while the other is used for
departures. For the arrivals only configuration, the separation rules are specified in the FAA order
7110.308A, often referred to as the “.308 rule” [52]. This rule permits simultaneous dependent
approaches, with a 1.5-nautical mile diagonal separation between pairs when the lead aircraft is in
the Small or Large wake category. The lead aircraft of the dependent pair is restricted to fly the
lower approach, whereas the trailing aircraft is cleared for the higher approach. This approach
procedure, illustrated in Figure 2-12, is permitted at BOS, EWR, and at San Francisco (SFO)
among other airports.
Figure 2-12. Closely spaced parallel runways dependent approach.
When the CSPR are used in mixed mode (Figure 2-13), a departing aircraft can be released as long
as the arriving aircraft is no closer than two miles from the runway at the time the departure
commences takeoff [48].
Figure 2-13. Closely spaced parallel runways in mixed mode configuration.

56
Under the intersecting runway configuration (Figure 2-14), one runway is assigned to arrivals and
the other one is assigned to departures. The runway capacity model ensures that arriving aircraft
do not cross the landing threshold until the preceding aircraft departs and passes the intersection
or is airborne [48]. Additionally, a two-minute separation rule applies when landing aircraft fly
through the airborne path of a Heavy or B757 departure on crossing runways.
Figure 2-14. Intersecting runways in mixed mode configuration.
The above-mentioned wake separation rules for single runway and two-runway operations are
implemented and enforced by the runway capacity simulation model. These rules serve to establish
a baseline scenario for the following chapters, reflecting today’s operational environment and
airport capacity estimates.
The last air traffic control component in the simulation model is the separation buffer. The
separation buffer is additional separation in excess of the required minimum separation that can
mitigate loss of separation and hence, operational error. For departures, buffers come in the form
of extra time added before departure clearance. For arrivals, buffers are added as extra time or in
the form of extra distance. The magnitude of the buffer typically depends on the experience level
of the air traffic controllers, and the tools and technologies available to them. Automated Terminal
Proximity Alert (ATPA) can display to controllers the exact separation between arrivals and it can
provide multiple levels of alerts and warnings if loss of separation is predicted [53]. With such

57
tools, controllers can reduce excessive separations, and hence increase runway throughput. For the
purpose of this research study, separation buffers are specified by the user as additional distances
(in nautical miles) or additional time (in seconds). The model assumes a normally distributed
delivery error (normally distributed error in the inter-arrival times at the final approach fix and at
the runway threshold) with a five percent probability of separation violation, based on the work of
Harris, as shown in Figure 2-15 [6]. The buffer time is a function of the probability that the required
minimum separation will be violated (aircraft are separated by less than the minimum separation).
Figure 2-15. Arrival separation buffer based on normally distributed position error of the trailing
aircraft.
2.2.4 External Factors
There are a number of external factors that also influence runway capacity. These factors include
weather conditions (visibility, precipitation, cloud ceiling, and wind) and communication delays
between pilots and air traffic control. The simulation model accounts for wind (and communication
delay as deterministic variables. Precipitation and cloud ceiling are accounted for by applying IFR
separation rules.
Prevailing weather conditions determine whether VFR or IFR separation rules are applied at an
airport. These two flight rules are linked to the visual meteorological or instrument meteorological
conditions. IMC conditions are present when visibility falls below three miles and the cloud ceiling
is below 1,000 feet above surface level. Typically, airport delays grow when IMC conditions are

58
present, due to longer separations between aircraft. For the purpose of this study, the runway
capacity simulation model assumes IMC weather conditions and IFR wake separation rules.
Furthermore, wind has a significant impact on runway capacity. First, strong headwind can reduce
ground speed of aircraft, and hence it can lead to loss of runway throughput. Accordingly, ground
speeds of aircraft are adjusted in the simulation model based on the user defined headwind
specifications. Second, different wind speeds at different altitudes introduce wind shear, which can
disturb arrival flow of aircraft, and can lead to various compression effects. Air traffic controllers
usually account for compression on final approach by adding a margin over the required minimum
separations.
Weather is not the only external factor that can influence runway throughput. Communication
delays can also occur between pilots and controllers. There can be a slight delay between an
arriving aircraft clearing a runway and a departing aircraft receiving takeoff clearance for instance.
Communication delay also accounts for the time gap between the issuance of a departure clearance
and the start of actual takeoff roll. The runway capacity simulation model also takes these delays
into consideration.

59
2.3 Simulation Logic and Sequencing
The runway capacity simulation model runs through four data processing and calculation stages
with the user specified input parameters. These stages are illustrated below in Figure 2-16.
Figure 2-16. A four-stage simulation workflow: fleet mix sampling for generation of flights (A),
assignment of flight variables (B), movement sequencing (C), and flight time computing (D).

60
The first step (Figure 2-16A) is generating a sequence of arrival and departure flights based on the
specified fleet mix and arrival-departure ratio. The model generates a total of 100 flights based on
the aircraft type distribution, of which a predefined percentage are arrivals and the rest are
departures. The arrival-departure ratio goes from no arrivals to 100 percent arrivals with a one
percent step-size by default, for every simulation run. The step size can be altered if necessary,
and departures only, or arrivals only scenarios can be evaluated quickly by specifying this ratio as
needed. Since there can be a large number of different aircraft types in the mix, the sample flight
sequence changes from simulation run to simulation run, as part of the Monte-Carlo framework.
The minimum number of simulation runs per arrival-departure ratio is set to 2,000 (resulting in a
minimum of 2,000 simulation runs with 100 aircraft per simulation run) and the model is set to
run until the mean capacity of the last simulation is within the 95-percentile of the overall sample
capacity, or until the number of simulation runs per arrival-departure ratio reaches the maximum
limit of 6,000. This number is sufficiently large to ensure the accuracy of results and to speed up
computation time. In most cases, the number of simulation runs falls between 2,000 and 4,000.
Occasionally, very diverse fleet mixes in mixed arrival-departure sequences require simulation
runs reaching 6,000 (approximately three to five minutes of computational time).
Once all departure and arrival flight are generated, the arrival flights are assigned specific flight
properties (Figure 2-16B) that are unique to aircraft types or aircraft wake categories: approach
speeds, runway occupancy times, arrival decelerations, and departure accelerations. The latter
three of these values are generated based on Gaussian distributions.
The third step in the simulation process (Figure 2-16C) is sequencing and inserting departures in
the arrival flow. The model takes the initial arrival flight sequence and evaluates the inter-arrival
times between pairs of aircraft. Arrival-arrival separations consider both the wake separation rule
and runway occupancy of preceding aircraft. The mathematical formulation of the problem is a
modified version of the model suggested by Blumstein, and also described in de Neufville and
Odoni that accounts for the approach speed profiles presented earlier in this chapter (constant
approach speed on last three miles of approach, deceleration before from 180 knots) [4], [5]. Two
arrival-arrival cases are considered, based on the approach speed differences between consecutive

61
arrivals. The closing case considers situations in which the trailing aircraft flies faster, and hence
catches up with the leading aircraft. The minimum separation between them is expected to occur
when the leading aircraft overflies the runway threshold. The inter-arrival time can be calculated
from Equations 1 and 2.
𝑣"#$$% ≤ 𝑣'#$$% “𝐶𝑙𝑜𝑠𝑖𝑛𝑔 𝐶𝑎𝑠𝑒”
𝐼𝑓 𝑠"' ≤ 3𝑁𝑀
𝑇"' = 𝑚𝑎𝑥 =>?@ABCDDE?FGGH
+ 𝑡KLMM, 𝑅𝑂𝑇" (1)
𝐼𝑓 𝑠"' > 3𝑁𝑀
𝑇"' = 𝑚𝑎𝑥 =>?RS@ABCDDE?FTU
+ SE?FGGH
+𝑡KLMM, 𝑅𝑂𝑇" (2)
𝑤ℎ𝑒𝑟𝑒 𝑣'#EY = 𝑣'#$$% + 5× 𝑠"' − 3 𝑖𝑓 𝑣'#EY ≤ 180 (3)
𝑜𝑡ℎ𝑒𝑟𝑤𝑖𝑠𝑒 𝑣'#EY =𝑠"' − 3
180 − 𝑣'#$$%5×(180 + 𝑣'#$$%)
+𝑠"' − 3 −
180 − 𝑣'#$$%10
180
Where viappr, vjappr are the final approach speeds of the lead and follow aircraft respectively, viavg,
and vjavg are the average approach speeds during the deceleration stage, sij is the required minimum
wake separation between them, dbuff and tbuff are separation buffers (defined by the user as a fixed
distance added on top of the minimum separation or an added extra time distribution with a five-
percent probability of violating the minimum separation), and ROT is the runway occupancy time.
The opening case is formulated slightly differently from the closing case. In this case the leading
aircraft flies faster than the trailing aircraft, and therefore the spacing increases between them as
they fly the approach. The minimum required separation occurs when the lead aircraft is at the
beginning of the common final approach path, indicated with rFAF, as the distance from the
arrival runway threshold to the final approach fix. The inter-arrival time can be calculated from
Equation 4.

62
𝑣"#$$% > 𝑣'#$$% “𝑂𝑝𝑒𝑛𝑖𝑛𝑔 𝐶𝑎𝑠𝑒”
𝑇"' = 𝑚𝑎𝑥 𝑇' − 𝑇" + 𝑡KLMM, 𝑅𝑂𝑇" (4)
𝑇" =𝑟��� − 3𝑣"#EY
+3
𝑣"FGGH
𝑇' =𝑟��� − 3 + 𝑠"' + 𝑑KLMM
𝑣'#EY+
3𝑣'FGGH
𝑤ℎ𝑒𝑟𝑒 𝑣'#EY 𝑖𝑠 𝑡ℎ𝑒 𝑠𝑎𝑚𝑒 𝑎𝑠 4 𝑎𝑛𝑑 𝑣"#EY = 𝑣"#$$% + 5× 𝑟��� − 3 𝑖𝑓 𝑣"#EY ≤ 180
𝑜𝑡ℎ𝑒𝑟𝑤𝑖𝑠𝑒 𝑣"#EY =𝑟��� − 3
180 − 𝑣"#$$%5×(180 + 𝑣"#$$%)
+𝑟��� − 3 −
180 − 𝑣"#$$%10
180
After the inter-arrival time calculations, the arrival gaps are ranked from longest to shortest. This
is needed to check if flights from the departure sequence can be inserted into the arrival flow
without increasing arrival gaps (free departures). The model fills the largest arrival gap first with
departures, then moves down the ranking until all the free departure slots have been filled. For the
remaining departures, the model assumes an alternating sequence of arrivals and departures until
all departures have been assigned a slot in the sequence. The remaining flights are all arrivals.
When the departure ratio is higher than the arrival ratio, a similar strategy is used, but in that case
the remaining flights are all departure movements. This sequencing strategy has been compared to
an alternating arrivals and departures sequencing strategy where one departure is inserted between
every two arrivals in order of original departure sequence (the first departure in the departure queue
takes the first inter-arrival slot, the second departure in the departure queue takes the second inter-
arrival slot, etc. A comparison between these two strategies is shown in Figure 2-17 for a single
runway. The fleet mix, the wake separation rules, and all other parameters have been kept constant.
Only the sequencing strategy for arrivals and departures has been changed. The capacity curves
match when the number of departures is more than the number of arrivals (below the black dashed
line). Between the 50-50% arrival-departure point and the arrivals-only point, the alternating
sequencing produces slightly lower estimates than the largest gap filled first method.

63
Figure 2-17. Comparison of runway capacity for two arrival-departure sequencing strategies: largest
arrival gap filled first, and alternating arrivals-departures.
Once the sequence of arrivals and departures is finalized, the model enters flights to the runway
system one by one (Figure 2-16D). The simulation run times begins when the first aircraft in the
sequence crosses the landing threshold if it is an arrival, or when it is cleared for takeoff, if it is a
departure. The model checks for the type of movement of the preceding aircraft, then the type of
movement of the next aircraft, and determines the appropriate set of required separation rules. The
separation rules check for both wake separation requirements and for runway occupancy. Arrival-
arrival and departure-departure movements are relatively quick to compute from given separation
matrices. Arrival-departure and departure-arrival movements require the simulation model to
check for earlier flights, and find the latest departure or latest arrival movement, respectively.
Hence the computation time is longer between these pairs. For example, in Figure 2-16D, when
the B738 aircraft (second arrival, fourth aircraft in sequence) enters the airspace, the simulation
model identifies that the previous movement was a departure by an B737 (second departure, third
aircraft in the sequence) and checks for the departure-arrival separation requirement. Then, it also
looks up the latest arrival in the system, the B763 landing (first arrival, first in sequence), and

64
checks for the arrival-arrival requirement between the B763 and the B738. The limiting of the two
(departure-arrival, arrival-arrival) separations determine when the B738 can land after the B737
departure.
At the end of each simulation run, the model outputs the runway throughput from every simulation
run for every arrival-departure ratio. The runway capacity envelope is generated based on 101 data
points (for each arrival-departure ratio from 0% arrivals to 100% arrivals with 1% steps), which
represent the expected number of movements that can be performed per hour, under continuous
demand, while enforcing all IFR separation requirements.
2.4 Comparison with Other Simulation Models
The runway capacity simulation model produces capacity envelopes for one or two runway
configuration systems. Before the model can be used for evaluation of current or future scenarios,
it is desired to compare results to capacity estimations generated by other models. Fortunately, the
FAA publishes airport capacity profiles to assess capacity needs in the National Airspace System
(NAS) [54]. Capacity is represented as the range of values between facility reported called rates
and a model-estimated data using runwaySimulator. Two airport capacity profiles are selected for
comparison that use single or two-runway configurations: San Diego, and New York La Guardia.
San Diego operates in a mixed arrival-departure mode on a single runway, whereas La Guardia
has an intersecting runway configuration with arrivals landing on one of the runways, and
departures taking off on the other runway. Average annual fleet mix is assumed at La Guardia, and
marginal/instrument weather fleet mix assumed at San Diego, as summarized in Table 2-4 below.
Table 2-4. San Diego and LaGuardia fleet mixed used in the FAA capacity study.
Percentage Small Large B757 Heavy Super
SAN 10.8 79.2 7.1 2.9 0.0
LGA 1.2 92.5 6.2 0.1 0.0

65
At both airports, the separation rules defined in 7110.65T are assumed to apply during instrument
weather conditions. At the time of publication of the FAA capacity report, this older version of
wake separation rules was in effect [41]. This version requires a four-mile separation for Heavy,
B757, and Large category aircraft behind B757 on approach, and a five-mile separation for Small
category aircraft behind B757, as shown in Table 2-5.
Table 2-5. Final approach separation minimums based on FAA 7110.65T (IFR).
Arrival Separations
(nautical miles) 7110.65T
Follower
Super Heavy B757 Large Small
Leader
Super MRS 6 7 7 8
Heavy MRS 4 5 5 6
B757 MRS 4 4 4 5
Large MRS MRS MRS MRS 4
Small MRS MRS MRS MRS MRS
The corresponding departure rules are presented in Table 2-6. Departures behind a B757 departure
require two minutes, instead of standard departure separations shown in Table 2-3.
Table 2-6. Departure separation minimums based on FAA Order 7110.65T for wake constrained
pairs.
Departure Separations
(seconds) 7110.65W
Follower
Super Heavy B757 Large Small
Leader
Super 180 180 180 180
Heavy 120 120 120 120
B757 120 120 120 120
Large
Small

66
Arrival-departure, and departure-arrival separations remain the same as previously discussed.
Departures can be cleared for takeoff if the preceding arrival has turned off the runway and the
next arrival is at least 2NM from the runway threshold.
The FAA published capacity envelope for San Diego is shown on the right in Figure 2-12. The
capacity range shows around 32 arrivals per hour in arrivals-only mode, approximately 46
departures in departures-only mode, and 24-24 arrivals and departures in mixed mode.
Figure 2-18. Runway capacity profiles generated by the simulation model and published by the FAA
for San Diego.
The capacity envelope generated from the fast-time Monte-Carlo simulation model is shown on
the left, applying the FAA published fleet mix and separation rules. The capacity curve closely
matches the one from the FAA report. The model estimates 34 arrivals per hour for arrivals-only
mode, 46 departures for departures-only mode, and 26-26 arrivals and departures for the mixed
mode operations.
The capacity envelope for LaGuardia airport is shown in Figure 2-19. The capacity envelope is
more flat than at San Diego, due to the different runway configuration (arrivals on runway 22,

67
departures on runway 13). Both the FAA published profile and the simulation model estimates
arrival capacity at 37 movements per hour, departures-only capacity around 46 movements per
hour, and mixed-mode middle points at 37-37 movements per hour. The FAA model, however,
seems to be using a different logic beyond the 50-50 percent point to estimate the capacity
envelope.
Figure 2-19. Runway capacity profiles generated by the simulation model and published by the FAA
for LaGuardia.
Both the San Diego and the LaGuardia capacity estimates generated by the simulation model
match closely the FAA published capacity estimates. Although slight dissimilarities do exist
between the profiles, these can be attributed to the differences in some of the underlying
assumptions between the two models. The comparison of these results indicate that the runway
capacity simulation model developed in this research study tends to reflect air traffic control rules
and procedures realistically to real world operations (as required by FAA Order 7110.65), and the
sequencing and computational algorithms function as desired.

68
2.5 Summary of Modeling Assumptions and Limitations
The fast-time runway capacity simulation model developed for this research study is an accurate
and detailed simulation of real operations at airports and it provides a computationally efficient
way to evaluate a large number of scenarios. This model, however, just like other simulation
models, has its own limitations. These limitations and modeling assumptions are discussed below.
2.5.1 Modeling Limitations
As mentioned before, this fast time Monte-Carlo runway capacity simulation tool is only capable
of evaluating four runway configurations: single runways, closely spaced parallel runways,
intersecting runways, and independent parallel runways. (Independent parallel runways function
as two single runways and their capacity can be summed together.) For complex airfields, the
runway configurations would need to be divided into smaller subsets of configurations, and the
results would need to be superimposed with consideration to the various interactions between the
subsets. Additionally, the model does not consider runway restrictions to aircraft of certain size.
All aircraft in the simulation are eligible to land and depart on any of the runways, although, as
seen later, some restrictions are implemented for dual glideslope approaches and for dependent
approaches on closely spaced parallel runways.
Furthermore, the model does not consider impacts of neighboring airports. LaGuardia airport for
instance, makes runway configuration decisions jointly with John F. Kennedy International Airport
(JFK), and Newark (EWR). The flow of traffic is coordinated between the airports, and hence
runway capacity can be impacted. Additionally, the simulation model does not consider flight
schedules when sequencing flights. Flights are randomly generated, and arrival and departure
movements are alternated such that runway throughput is maximized. Flight schedules would
provide limitations on how much the sequence can vary, which is beyond the scope of this study.
Additionally, flight schedules would permit estimation of delays besides capacity.

69
2.5.2 Assumptions in the Simulation Model
One of the first assumptions of this model is that many airports operate with two runways in
various configurations during marginal and instrument weather conditions. Large hub airports can
operate with many more runways, but usually the runways are independent, or the airport is
operated as two separate airports, one handling traffic flow on one side, while the other handling
traffic flow on the other side (Los Angeles International Airport – LAX is an example of such).
Taxiways and gates are not modeled in this study, if they have little impact on runway capacity.
Runway exits are not modeled either, the simulation assumes that aircraft can exit the runway
anywhere as a function of their runway occupancy time. The busiest airports have runways with
multiple standard and high-speed exits that permit a landing aircraft to vacate the runway at its
earliest convenience.
All aircraft fly the same final approach path before landing (except for dependent parallel arrivals),
and all aircraft within the same wake category fly the same approach speed profile, as introduced
earlier in this chapter. Approach speeds are equival to ground speeds when wind speed is zero.
Approach speeds within the last three miles of the approach are constant, and they increase an
average of five knots per mile beyond three miles until 180 knots.
Sequencing of aircraft is done at random as part of the Monte-Carlo framework (based on the
assumption that traffic appears in random fashion at an airport), and arrival and departures
movements are alternated such that it maximizes throughput: free departures are allocated first,
before alternating the remainder of flights. Arrivals are assigned runway occupancy times and
flight performance properties based on normally distributed variables. Additionally, based on the
work of Harris, there is a five percent probability of violation of separation requirements when
determining inter-movement spacing [6]. This is determined by the normal distribution of the
separation buffer that is added on top of the required minimum separations. Last, but not least, the
model assumes continuous demand at the airport. There is always an arrival or a departure waiting
for service.

70

71
Chapter 3
3 Study of Runway Capacity Components
A detailed study of the component that determine runway capacity is presented in this chapter.
Runway capacity is a function of many airport, airspace, aircraft, and air traffic control related
variables. The impacts of these variables on runway capacity and the various interactions between
the variables are discussed in detail. The objectives of this study and the major research questions
this study aims to answer are presented first, then the proposed research method for analyzing
capacity follows. The simulation results related to runway configurations, airport infrastructure,
and operational procedures are examined after.
3.1 Runway Capacity Study Objectives
Providing an accurate estimate of the number of departures and arrivals that can be served at an
airport is important both for strategic airport planning and for tactical air traffic flow management.
The capacity of a runway system varies across time as a result of many different factors. These
factors are often coupled, as a change in one can lead to a change in another. The goal of this study
is to investigate the impact of these variables alone, and together, on runway capacity at a system-
level. The work completed in this chapter helps to establish a baseline scenario for the simulation
framework and it helps to formulate a test matrix for evaluating future wake separation rules by
identifying the components that have the strongest impact on runway capacity. Specifically, this
study will be looking at runway geometries and configurations, aircraft feet mix, and air traffic
control strategies.
The influence of various runway configurations and runway geometries on capacity is investigated
first. The magnitude of benefits from an additional runway or a change in configuration depends
on the interactions between the traffic on one runway and the traffic on the additional runway. This
section of the thesis aims to answer the following questions:

72
• What is the benefit of an additional runway in terms of added capacity?
• What are the non-quantitative benefits from an additional runway?
• Does the geometry of an intersecting runway influence capacity? If so, is there an ideal
intersecting configuration?
Runway configuration and runway geometry are often integrated into air traffic control separation
rules and procedures. These rules are specified not only in terms of runway inter-dependencies but
also in terms of aircraft types and categories. Hence, the mix of arrival and departure movements,
the number and type of aircraft operating on the runways, and the flight characteristics of these
aircraft are all important runway capacity factors to consider in a system-level study. For instance:
• What is the impact of changing fleet mix on runway capacity?
• Are there certain runway configurations and runway geometries that are less or more
sensitive to changes in the fleet mix?
• What are the interactions between runway configuration, fleet mix, and air traffic control
separation rules?
Air traffic control strategies also include adding extra separation in terms of time or distance
between aircraft to prevent loss of safety. The magnitude of separation buffer can be a function of
controller experience and weather conditions, such as wind. Headwind that is present throughout
the approach slows all aircraft down while different wind speeds at different altitudes can lead to
compression (change in separation due to differences in approach speeds) on approach that
controllers need to account for by inserting additional separation. Questions related to air traffic
controller strategies and wind conditions are also discussed as part of this work:
• What is the magnitude of runway capacity loss due to separation buffers?
• How much runway capacity is lost when headwinds are present?
• What is the impact of wind shear on runway capacity?

73
The above-mentioned research questions are answered by means of the fast-time runway system
simulation model. The corresponding baseline assumptions and simulation framework used in the
model are explained next.
3.2 Runway Capacity Study Assumptions
A set of baseline input parameters is assumed for the baseline runway capacity study: fleet mix
and corresponding aircraft characteristics, wake separation buffer, common final approach length,
current wake separation rules, and weather conditions. These parameters and the underlying
assumptions provide the bases for this and the following chapters.
The baseline fleet mix is assumed to be equal to the average aircraft mix from the the busiest 35
airports (OEP35) during a busy, three-day summer period. Aircraft wake categories are based on
the legacy FAA weight classes: Small, Large, B757, Heavy, and Super. The corresponding runway
occupancy statistics and approach speeds are presented below in Table 3-1. Arrival touchdown
distance, deceleration, and departure acceleration values are assumed only when evaluating
intersecting runway configuration to assess intersection crossing times precisely. For all other
runway configurations, runway exits (which are not modeled in the simulation) are specified as a
function of runway occupancy times.
Table 3-1. Baseline modeling assumptions for aircraft fleet mix and flight characteristics.
Fleet Mix (%)
Runway Occupancy VApproach (kt) Mean (sec) Std. Dev.
(sec)
Small 5.3 48 8 110
Large 84.3 48 6 130
B757 3.5 55 7 140
Heavy 6.7 65 7 145
Super 0.2 75 10 140
74
For the separation buffer, a 16-second standard deviation of the delivery error is assumed. This
number is based on both literature review and operational data analysis from ASDE-X at U.S.
airports [55],[56],[16]. The length of common final approach is assumed to be 6.0 NM, and
weather conditions are assumed to be IMC with no wind. The U.S. legacy wake separation rules
are applied as required by FAA Order 7110.65 and by Order 7110.308A (in the case of
simultaneous dependent approaches to closely spaced parallel runways) [48], [57]. These key input
parameters are assumed for all simulation runs in this chapter, unless otherwise noted. Additional
assumptions for specific runway configurations and for specific operation procedures are
explained when necessary.
3.3 Analysis of Runway Capacity Results
3.3.1 Number of Runways
One of the most straightforward ways to increase runway capacity is to invest in new infrastructure
and to build new runways. The available space and geographical location of the airport often limits
where, and in what configuration a new runway can be constructed. Usually, the more independent
a runway is from the other runway (aircraft movements on one runway can be performed with no
or very little consideration to aircraft movements on the other runway) , the more extra capacity it
can provide. However, more independent operations require larger capital investments due to
larger land acquisitions, hence alternative configurations also need to be evaluated.
First, the capacity benefits from an additional runway is considered for arrivals operations only.
Two runway configurations are evaluated: a single runway and a set of closely spaced parallel
runways with dependent approaches as illustrated in Figure 3-1. The baseline assumptions
mentioned in Section 3.2 are applied in the runway capacity simulation.

75
Figure 3-1. Arrivals-only runway configurations: single runway (A) and closely spaced parallel
runways (B).
The standard single runway separation rules are applied for the single runway, while two
separation rules are evaluated for the CSPR configuration. First, the FAA Order 7110.308 rule
establishes a reduced 1.5 NM diagonal separation between an aircraft on the primary runway (top
runway in Figure 3-1B) and an aircraft on the secondary runway (bottom runway in Figure 3-1B),
if the lead aircraft is in the Small or Large weight class. Separation between the secondary runway
arrival and a subsequent arrival on the primary runway is based on single runway separation rules,
per FAA Order 7110.65. The second CSPR separation rule is called Wake Turbulence Mitigation
for Arrivals – Procedure (WTMA-P). This is an extension of the 7110.308 rule such that any
aircraft category (with the exception of Super – A380) can lead in the diagonal pair [58]. The
results of the single runway versus CSPR arrivals-only capacity are presented in Figure 3-2 in the
form of cumulative distribution functions.
The 7110.308 rule is evaluated in two different modes. The first implies a randomly generated
sequence of arrival aircraft on the parallel runways. The second mode adjusts the sequence by
swapping aircraft pairs in the sequence to maximize the number of pairs that qualify for diagonal
separation. The WTMA-P rule enables any aircraft type to lead, and hence no sequence
adjustments are tested.

76
Figure 3-2. Single runway and CSPR arrival capacity for U.S. representative fleet mix.
The results suggest that the mean arrival runway throughput can be increased by 13.9% with an
additional CSPR runway under 7110.308 separation rules. An additional 2.4% can be gained if
swaps in the arrival sequence are permitted. Under WTMA-P rules, the pair of runways can
increase mean arrival throughput by 17.4% over a single runway, or by 3.1% over the 7110.308
rule. An independent second parallel runway can double the capacity of a single runway if the
same fleet mix and separation rules apply, since no additional separation rules would be required.
The mean arrival throughput values are summarized in Table 3-2.
Table 3-2. Single runway and CSPR mean arrival throughput.
Single
Runway
CSPR
7110.308 –
Random
Sequence
CSPR
7110.308
Adjusted
Sequence
CSPR
WTMA-P
Two
Independent
Parallel
Runways
Throughput
[Arrivals/Hour] 36.7 41.8 42.8 43.1 73.4

77
Many airports operate in mixed-mode configurations, where arrivals and departures share the same
runway. Three runway configurations are evaluated here in mixed-mode operations: single
runways, intersecting runways, and closely spaced parallels. Both the intersecting runways and
closely spaced parallels operate with one designated arrival runway and one designated departure
runway as shown in Figure 3-3.
Figure 3-3. Single runway (A), intersecting runways (B), and CSPR (C) in mixed-mode
configurations.
The intersecting runway geometry in Figure 3-3B is assumed to be such that the distance from the
arrival end of the arrival runway to the intersection, and the distance from the departure end of the
departure runway to the intersection are 5,000 feet each. (The influence of intersecting runway
geometry is discussed later in this chapter). The capacity envelopes are presented below in Figure
3-4 for the three runway configurations: single runway on the left, intersecting runways in the
middle, and CSPR on the right. The blue data points indicate individual Monte-Carlo simulation
run results and the red line represents the mean throughput, meaning the average throughput of the
runway system across the simulation runs.

78
Figure 3-4. Capacity envelopes for a single runway (left), two intersecting runways (middle), and a
set of closely spaced parallels (right).
The arrivals-only and departures-only capacities are identical under all three configurations
because all configurations behave as single runways in the simulation model when only arrivals or
departures are present. When comparing the capacity values in mixed-mode operations, however,
significant differences can be observed, as shown in Table 3-3. The 50%-50% point, alternating
departures and arrivals – where number of departures is equal to the number of arrivals, is higher
for the multi-runway configurations than for the single runway configuration. There is a 8.7%
mean capacity increase for the intersecting configuration over the single runway configuration,
and a 41.1% mean increase for the CSPR configuration over the single runway configuration.
Table 3-3. Airport capacity in mixed mode operations for U.S. representative fleet mix.
[Aircraft/Hour] Single Runway Intersecting Runways
(5,000ft-5,000ft) CSPR
Arrivals 36.7 36.7 36.7
Arrivals | Departures
50%-50% Point 24.2 | 24.2 26.3 | 26.3 34.2 | 34.2
Departures 45.8 45.8 45.8

79
It is also interesting to note that not only do the mean capacities change in the alternating arrivals
and departures mode between runway configurations, but also the variability in the simulation
results (variance). More variability can lead to higher delays [4].
Figure 3-5. Single runway capacity variability at the alternating arrivals and departures point.
Figure 3-5 shows the distribution of simulation results at the 50%-50% alternating point on the
single runway capacity curve. The data is fitted with a normal distribution with a mean of 24.2
aircraft per hour and a standard deviation of 0.2 aircraft per hour. The minimum throughput that
is captured by the simulation is 23.3 and the maximum throughput is 24.8 aircraft per hour.

80
Figure 3-6. CSPR capacity variability at the alternating arrivals and departures point.
Figure 3-6 shows the distribution of simulation results at the 50%-50% alternating point from the
CSPR capacity curve. The data is fitted with a normal distribution with a mean of 34.3 aircraft per
hour, and a standard deviation of 0.6 aircraft per hour. The simulation results range from 31.8 to
35.9 aircraft per hour. When comparing the fitted data distributions in Figure 3-7, the higher mean
and variance of the CSPR configuration can be clearly seen.
Figure 3-7. Comparison of fitted normal distributions for single runway and CSPR configurations.

81
The difference between the data distributions is due to the difference between arrival-departure
and departure-arrival separations for the two runway configurations. There is a larger variability
in the separations on closely spaced parallel runways, as illustrated with an example in Figure 3-8.
Figure 3-8. Sequence of alternating arrivals and departures on a single runway and on CSPR.
When the first arrival (A1) crosses the single runway arrival threshold, the second departure (D2)
can line up on the runway. This departure (D2) is cleared for takeoff when A1 does not occupy the
runway any longer (that is, the runway occupancy limit is satisfied) and the separation between
the earlier departure (D1) and D2 has been met. The earliest time D2 can depart on the single
runway is limited by the runway occupancy time of A1.
Looking at the same sequence on the CSPR configuration, D2 is already lined up on the departure
runway when A1 crosses the arrival runway threshold. The takeoff clearance can be given as soon
as the departure-departure separation between D1 and D2 has been met and A1 has crossed the
arrival runway threshold. Since arrivals need to be at least two miles from the arrival runway
threshold when a departure is cleared for takeoff, it is possible that by the time A1 lands, the D1-
D2 separation is not limiting the departure clearance for D2. Hence, the minimum arrival-departure
separation between A1 and D2 is the runway occupancy time of A1 on the single runway, but it
can be as little as zero seconds in the CSPR case. This means that although an additional runway
in CSPR configuration can increase capacity from a single runway configuration, the variance is
influenced by the operations on the arrival runway.
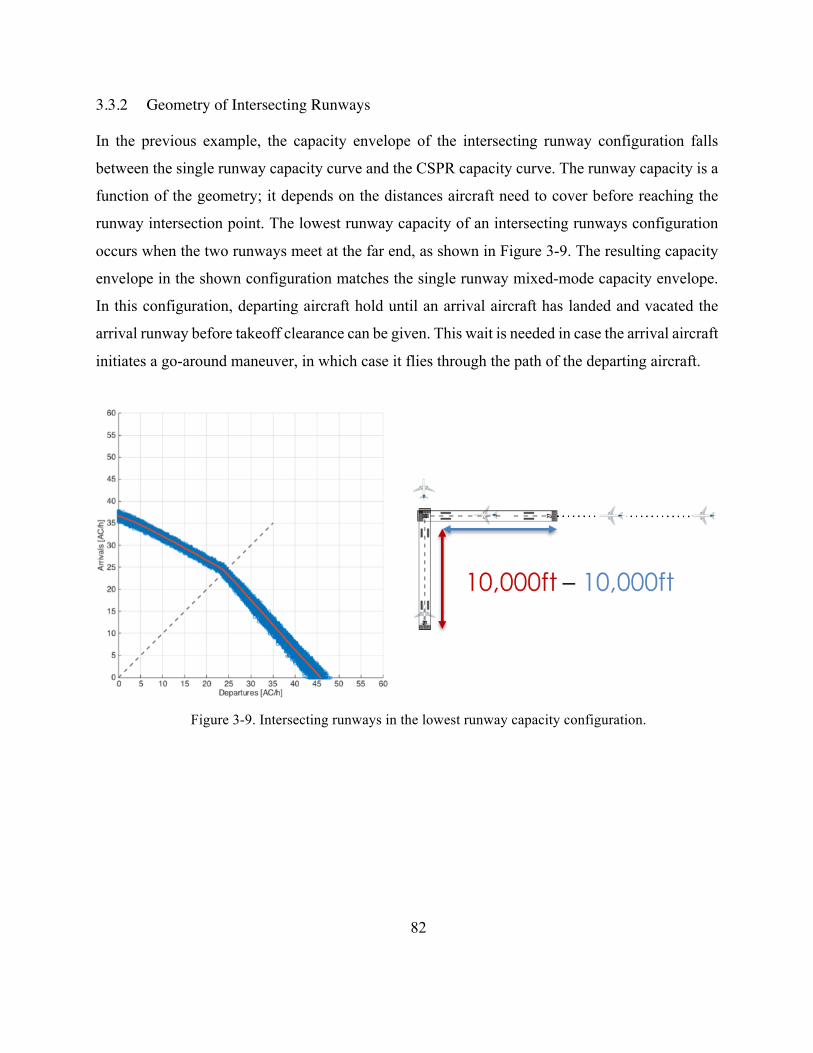
82
3.3.2 Geometry of Intersecting Runways
In the previous example, the capacity envelope of the intersecting runway configuration falls
between the single runway capacity curve and the CSPR capacity curve. The runway capacity is a
function of the geometry; it depends on the distances aircraft need to cover before reaching the
runway intersection point. The lowest runway capacity of an intersecting runways configuration
occurs when the two runways meet at the far end, as shown in Figure 3-9. The resulting capacity
envelope in the shown configuration matches the single runway mixed-mode capacity envelope.
In this configuration, departing aircraft hold until an arrival aircraft has landed and vacated the
arrival runway before takeoff clearance can be given. This wait is needed in case the arrival aircraft
initiates a go-around maneuver, in which case it flies through the path of the departing aircraft.
Figure 3-9. Intersecting runways in the lowest runway capacity configuration.

83
Figure 3-10. Intersecting runways meeting in the middle of the runway (same case as in Section 3.2).
Figure 3-10 shows two runways intersecting in the middle (this is the same case that was presented
in Section 3.2). In this configuration, arrivals touch down before the intersection and continue with
their landing rolls. Departing aircraft can be cleared for takeoff as soon as the preceding arrival
crosses the intersection. Since clearing the intersection for the arrival takes a shorter time than to
complete the entire landing roll and to exit the runway (Figure 3-9), the arrival-departure
separations become shorter. Accordingly, this configuration results in higher runway capacity.
Figure 3-11. Intersecting runways meeting at the short end of the arrival runway.

84
In the runway configuration presented in Figure 3-11, both arrivals and departures are airborne at
the runway intersection. This means that departure clearance after an arrival can be given sooner
than in the runway configurations presented previously, unless the arrival is a B757 or a Heavy
wake category aircraft. This is because if the departure flies through the airborne path of an arriving
B757/Heavy, or the arrival flies through the airborne path of a B757/Heavy departure, an
additional two-minute separation is necessary [48]. This extra separation is added for wake
turbulence encounter mitigation, but it can also lead to loss of runway capacity.
Figure 3-12. Intersecting runway configuration providing the highest capacity.
The intersecting runway geometry that yields the highest runway capacity is the one in presented
in Figure 3-12. The runways intersect at the short end, close to the departure end and arrival end.
Departures can be cleared as soon as arrivals cross the arrival runway threshold. Such
configuration operates similarly to a closely spaced parallel configuration and therefore it also
closely matches the capacity curve of shown in Figure 3-4 (CSPR).
Table 3-4 provides a summary of arrival and departure capacity at the 50%-50% point on the
capacity curve. The arrivals-only and departures-only points remain unchanged, as the simulation
model assumes that arrivals and departures use different runways.

85
Table 3-4. Arrival and departure capacity at the 50%-50% point under different intersecting runway
geometries, for U.S. representative fleet mix.
[Aircraft/Hour] 10,000ft –
10,000ft 5,000ft – 5,000ft
8,000ft –
1,000ft 0ft – 0ft
Arrivals |
Departures
50%-50% Point
24.2 | 24.2 26.3 | 26.3 32.1 | 32.1 34.2 | 34.2
To characterize the impact of intersecting runway geometry on runway capacity, a case study of
New York LaGuardia (LGA) airport in considered. LGA is one of the busiest airports in the U.S.
and is the busiest U.S. airport operating with two intersecting runways. The fleet mix consists of
mostly Large category aircraft as shown in Table 3-5.
Table 3-5. Assumed fleet mix for LaGuardia airport.
Percentage Small Large B757 Heavy Super
LGA 0.2 99.2 0.6 0.0 0.0
In this hypothetical scenario, the LGA fleet mix is held constant while the geometry of the
intersecting runways is modified such that the distance from the arrival threshold to the intersection
and the distance from the departure end to the intersection vary from zero to 7,000ft. Two
separation buffers are considered, the first one with a mean buffer of 0.25 miles, and the second
one with 1.0 mile. The most common intersecting runway configurations that LGA uses are 31|4
(shown with red arrows) and 22|13 (shown with blue arrows), indicating the arrival runway and
departure runway respectively (arrival runway | departure runway), as shown in Figure 3-13.

86
Figure 3-13. Two of the most common intersecting runway configurations at LaGuardia.
The resulting runway capacity curves are shown in Figure 3-14. The 22|13 runway configuration
provides a higher capacity than the 31|4 runway configuration, because the intersection is closer
to the arrival end and the departure end, and hence aircraft clear it sooner. It can be also observed
that a longer separation buffer results in lower capacity (loss of 10 arrivals per hour if buffer is
increased from 0.25NM to 1NM). Separation buffer will be studied in detail in Section 3.3.5.
Figure 3-14. Impact of runway geometry and separation buffer on capacity at LGA.

87
Since arrivals-only and departures-only capacities are consistent between runway configurations,
the alternating arrivals and departures 50%-50% point is considered for further evaluation.
Figure 3-15. Alternating arrivals and departures capacity with 0.25NM separation buffer.
Figure 3-15 shows the runway capacity at the 50%-50% point, with a 0.25NM buffer applied, as a
function of runway geometry. The two red data points indicate the simulated runway capacities
with the airport’s current intersecting runway geometry. Note that runway capacity only changes
as a function of the distance from the arrival end to the intersection. In the highest capacity
configuration where the arrival threshold is close to the intersection (<1,000ft), mean capacity is
at its highest at 47 arrivals and departures per hour. Capacity drops to 30 movements per hour as
the arrival distance to the intersection increases, but does not change when the departure end to
intersection distance increases. This behavior suggests that inter-arrival separation rules are more
limiting under today’s air traffic control separation procedures than inter-departure separation rules
for intersecting runway configurations.
When the separation buffer is increased to 1.0NM, mean arrival runway capacity drops by 6
arrivals per hour, as shown in Figure 3-16. The separation buffer is large enough that it reduces

88
the sensitivity to variations in the runway geometry. Capacity remains a function of only the
distance from the arrival end to the intersection, but the capacity is not reduced until it reaches
about 4,000ft. Beyond 4,000ft, capacity decreases from 37 arrivals and departures per hour to 30
arrivals and departures. The lowest capacity measured with the 1.0NM buffer is the same as the
lowest capacity measured with the 0.25NM for the worst-case runway configuration.
Figure 3-16. Alternating arrivals and departures capacity with 1.0NM separation buffer.
It is important to note that the distance from the departure runway end to the intersection does not
seem to impact runway capacity with either of the separation buffers. This is due to ATC separation
rules that requires the arrival to be at least two miles from the arrival runway threshold when the
departure is cleared for takeoff. This separation requirement is long enough to eliminate the
sensitivity of runway capacity to departure end to intersection distance. If this requirement is
eliminated, runway capacity becomes a function of both arrival end to intersection distance and of
departure end to intersection distance, as illustrated in Figure 3-17.

89
Figure 3-17. Alternating arrivals and departures capacity with 0.25NM and departure-arrival
separation requirement relaxed.
With the relaxation of the 2NM rule, mean capacity increases from 31 movements per hour to 36
movements per hour for the 31|4 runway configuration, and from 43 to 47 movements per hour
for the 22|13 runway configuration.
3.3.3 Final Approach Length
As introduced in Chapter 2, the common final approach path is the airspace that all arriving aircraft
share. The length of the final approach is defined by the location of the final approach fix (a
specified point that identifies the beginning of the final segment). Traditional ILS approaches have
a common final approach length between four and eight miles, while some new required navigation
performance (RNP) approaches can be of shorter lengths [59]. To evaluate the runway capacity
impact of final approach length, as shown in Figure 3-18, a single runway model is chosen in
arrivals-only configuration, and with the U.S. representative fleet mix. The mean arrival
throughput decreases from 37.1 arrivals per hour with a 4NM approach to 36.3arrivals per hour
with a 8NM approach, which is about a 2.2% decrease in capacity.

90
Figure 3-18. Single runway arrival capacity as a function of final approach length.
The impact of final approach length on runway throughput can only be seen if the fleet mix is
heterogeneous, or significant speed differences exist between arrivals. Figure 3-19 shows arrival
throughput for three different fleet mixes. The more diverse the fleet mix (and the more variability
in final approach speeds), the more sensitive runway capacity is to final approach length. For a
90% Large – 10% Heavy fleet mix, mean runway capacity drops by 1.5% when FAF is doubled.
For a 80% Large – 20% Heavy fleet mix, mean runway capacity drop by 2.6%, and for a 70%
Large – 30% Heavy fleet mix, runway capacity decreases by 3.3%. For a homogeneous fleet mix,
there are no to very little variations in approach speeds, and therefore final approach length has
very little if any impact.

91
Figure 3-19. Runway capacity sensitivity (means and standard deviations) to final approach length
and fleet mix.
3.3.4 Fleet Mix
Aircraft fleet mix and corresponding performance measures of different aircraft types are core
elements that affect runway capacity. First, separation rules are based on aircraft wake categories.
Required wake separations can vary depending on what aircraft operate at an airport, hence
influencing arrival and departure throughput rates. Second, the aircraft size, weight, flap and
landing gear configuration determine the speed on the common final approach. Larger aircraft
typically fly at higher speeds, allowing higher throughput, but often require longer separations.
Additionally, significant differences in the approach speeds can also adversely impact runway
capacity.
A single runway mixed-mode configuration is used to illustrate how fleet mix can impact capacity,
as shown in Figure 3-20. Three homogeneous fleet mixes are assumed: all Small, all Large, and

92
all Heavy aircraft. The legacy wake separation rules are applied, based on FAA Order 7110.65W
with an additional sixteen second standard deviation of the delivery error.
Figure 3-20. Impact of homogeneous fleet mix on single runway capacity.
The 100% Large category aircraft mix leads to the highest runway capacity, followed by the 100%
Small fleet mix. The departure capacity is the same for both cases, as the same separation rules
and aircraft performance are assumed for takeoffs. The difference in arrival capacity comes from
Large aircraft flying at higher approach speeds, even though the inter-arrival separation rules are
the same between Large-Large and Small-Small pairs. Heavy aircraft fly faster than the other two
categories, but the inter-arrival and inter-departure separations are longer, therefore leading to a
lower capacity envelope.
It was mentioned earlier in this chapter that on intersecting runways, an additional two-minute
wake separation is required when departures fly through the airborne path of a previous
B757/Heavy arrival, or when arrivals fly through the airborne path of a previous B757/Heavy
departure. This extra two-minute separation can lower runway capacity if a sufficient number of
B757 or Heavy category aircraft are present in the fleet mix. A comparison of single runway
capacity and intersecting runway capacity is shown in Figure 3-21 for four different fleet mixes.

93
Figure 3-21. Single runway vs. intersecting runway capacity for different fleet mixes.
The intersecting runway geometry is assumed to be such that both arrivals and departures are
airborne when they reach the runway intersection, the fleet mixes are indicated above, the standard
deviation of the delivery error is sixteen seconds, final approach length is 6.0NM, and wind speed
is zero. As seen earlier, intersecting runways can provide significant capacity increase over single
runways. When the fleet mix consists of less than 30% Heavy aircraft (or a combination of B757

94
and Heavy aircraft), intersecting runway capacity remains higher than single runway capacity.
However, when Heavy aircraft makes up 30% or more of the feet mix there are a sufficiently large
number of arrival-departure and departure-arrival pairs that require the extra two-minute wake
separation. These additional separations can lower intersecting runway capacity to below single
runway capacity levels, as shown in the bottom-right chart in Figure 3-21. This exercise illustrates
that under certain fleet mixes and wake separation rules, a single runway can provide higher
capacity than two runways in intersecting configuration.
Fleet mix can change throughout the day, as aircraft of different size operate flights in the morning
and in the afternoon. Long-haul international flights operated by Heavy category aircraft typically
arrive in the afternoon and leave in the evening at U.S. East Coast airports. The rest of the day
usually sees Large category aircraft, including many regional jets. Fleet mix variability can be seen
at cargo hub airports as well, since all cargo flights arrive and depart in a short time to allow for
the unloading, sorting, and re-loading of packages. An example has been presented in Figure 2-6
at Memphis, where cargo operations peak late at night and late morning.
Figure 3-22. Single runway arrival capacity variability due to changes in fleet mix at Memphis.

95
Assuming the hourly fleet mixes at MEM, a 6.0NM final approach, a sixteen second standard
deviation for the delivery error (separation buffer), and no wind, the arrival capacity of a single
runway is evaluated in Figure 3-22. Arrival runway capacity is around 30 movements per hour
when Heavy category cargo aircraft dominate the fleet mix at night and mid-morning. For the
remaining part of the day, runway capacity increases to 35 movements per hour. (There are no
operations at 3AM in the morning.) The 16.7% capacity boost is the result of only the change in
aircraft size, while all operational rules and assumptions remain the same.
3.3.5 Separation Buffer
Separation buffers are excess separation added on top of the required minimum separation to avoid
operational errors and to give more flexibility to the controller when sequencing and spacing
arrival aircraft on final approach. The impact of separation buffer on runway capacity is evaluated
for single runway mixed-mode operations, assuming the U.S. representative fleet mix, a 6.0NM
approach length, and no wind. The mean buffer size has been changed from no buffer to a 1.0NM
buffer at 0.1NM steps, and then increased to 2.0NM with 0.5NM steps. as shown in Figure 3-23.
Figure 3-23. Impact of separation buffer on single runway capacity.

96
Arrivals-only runway capacity decreases with increasing buffer from 48.8 arrivals per hour to 28.3
arrivals per hour, which equals to approximately 1 arrival per hour loss for every 0.1NM increase
in separation buffer. The 50-50 arrival-departure point decreases from 29.2 to 28.1 movements per
hour. This point on the capacity curve is affected less by the arrival buffer than the arrivals-only
point, as departure separations remain unchanged. (The departures-only capacity remains the same
with all arrival buffers.) The free departures point also shifts as separation buffer increases. This
point on the capacity curve shows the number of departures that can be inserted between arrivals
without interrupting the arrival flow. There are 0.9 free departures per hour with a 0.5NM buffer,
3.9 fee departures with a 1.0NM buffer, 5.6 free departures with 1.5NM buffer, and 28.1 free
departures with a 2.0NM buffer.
3.3.6 Wind and Wind Shear
Wind conditions also influence runway capacity. When headwinds are strong, the ground speed of
aircraft is reduced. As a consequence of this, aircraft take a longer time to cover the required
separation distance and to fly the common approach path in general. The time to fly a given
separation distance under various ground speeds is shown in Figure 3-24.
Figure 3-24. Reduced groundspeed due to headwind leads to longer flight times.

97
For instance, Large category aircraft have an approach speed of 130 knots, at which speed it takes
69 seconds to cover 2.5NM. With a 10-knot headwind, ground speed is reduced to 120 knots and
the time to fly 2.5NM increases to 75 seconds. Since separations take more time to fly, runway
throughput also drops, as shown below in Figure 3-25 for a single runway.
Figure 3-25. Single runway capacity as a function of headwind.
Headwind is increased from zero knots to 30 knots in 5-knot steps. Arrivals-only runway capacity
drops from 36.7 arrivals per hour at 0kt to 30.3 arrivals per hour with a 30kt headwind. The 50%-
50% arrival-departure point decreases from 24.3 to 21.8 movements per hour. Unlike in the
separation buffer case, the free departure point remains unchanged for all headwind speeds.
The stronger the headwind is, the longer it takes to fly a separation distance, which negatively
impacts arrival rates and capacity. There are two solutions to mitigate the loss of runway capacity
due to headwind. The first one is to fly faster approaches. Pilots can compensate for the wind by
increasing the approach speed, which is already built into modern cockpit systems, and it is a
technique often used by controllers. The second alternative to recover lost capacity is to maintain

98
a constant time interval separation between aircraft as opposed to distance based separations,
which is investigated in detail in the next chapter of this thesis.
Another aspect of wind on approach is compression. Compression refers to the reduction of in-
trail separation between pairs of arrivals due to the leading aircraft reducing its speed ahead of the
trailing aircraft. This can occur due to the aircraft changing aerodynamic configuration, such as
lowering flaps or landing gears, or due to wind shear. Wind shear occurs when as the aircraft
descends, it enters an area where wind speed and wind direction is different from before. The larger
the difference between wind speeds at different altitudes on approach, the more severe
compression becomes. The impact of wind shear on runway capacity is illustrated in Figure 3-26
on a single runway used solely for arrivals, assuming the U.S. representative fleet mix, 16-second
separation buffer standard deviation, 6.0NM final approach, and a wind shear altitude of 600ft
(about two miles from the runway threshold).
Figure 3-26. Impact of wind shear on arrival runway capacity.

99
Wind speeds are evaluated from zero knots to 20 knots with 5-knot steps both below and above
600ft on the final approach. Maximum capacity is reached when a tailwind occurs during both
segments, and lowest capacity is reached when the strongest headwind occurs on both segments
of the approach. When there is no wind on approach, the mean arrival throughput is 35.9 arrivals
per hour. When there is a constant headwind of 5 knots on the entire approach, throughput drops
to 34.9. If wind shear occurs such that the headwind is +5 knots above 600ft, and 0 knots below
600ft, runway capacity is 35.2 movements per hour. In the reverse scenario, where headwind is 0
knots above 600ft, and +5 knots below 600ft, capacity is 35.6 movements per hour. Finally, if
headwind is +5 knots above 600ft, and -5 knots below 600ft (tailwind), capacity is 35.5 arrivals
per hour, lower than when there is no wind on approach.
3.4 Conclusion
A comprehensive study of some of the factors that determine runway throughput was presented in
this chapter. The impact of these components was studied individually and the coupling between
them was also investigated. First, the study showed that an additional runway can provide
significant capacity increase over a single runway. The magnitude of benefits is a function of the
dependencies between arrival and departure operations. The more independent the operations are
on one runway from the other, the higher the additional capacity can be. Closely spaced parallel
runways have higher runway capacity than intersecting runways. The results indicated that
although capacity is higher for CSPR geometries, the variability in throughput also increases
compared to single runway operations, which can lead to decreased predictability in ATM decision
making. Intersecting runway capacity falls between single runway capacity and closely spaced
parallel runways capacity, depending on the geometry of the intersection. There are other benefits
associated with an additional runway that cannot be measured in terms of capacity. Although not
covered in this thesis, two runways can increase operational reliability and flexibility, and they can
provide redundancies when needed. If one runway is temporary decommissioned due to
construction work or a disabled aircraft, the other runway can still accommodate arrival and
departure operations. Additionally, two runways can provide a larger wind direction coverage over
a single runway if they are not aligned.

100
A case study of LaGuardia airport shows that runway capacity appears to be dependent on the
distance between the intersection and the arrival end of the runway only, and does not seem to
change with the distance between the intersection and the departure end of the other runway. This
is due to the nature of current separation rules and requirements for intersecting runway
movements. This study also shows that due to these separation rules, the capacity of a single
runway in mixed arrival-departures mode can be as high as the capacity of an intersecting runway
in mixed mode operations when the proportion of Heavy and B757 category aircraft is sufficiently
large in the fleet mix.
It can be concluded that runway configuration and fleet mix have the largest impact on runway
capacity among the factors considered in this study. These variables will be considered
independently when analyzing the impact of new wake separation rules. The length of common
final approach has very little impact on capacity and therefore a fixed approach length will be
considered for the scenarios studied in the next chapter.
A sensitivity analysis of wake separation buffer indicates that significant runway capacity is lost
due to separating aircraft beyond the required minimums. However, there are other benefits of
separation buffers, such as the prevention of loss of separation when compression occurs, or the
insertion of more free departures into the arrival flow when departure demand is high. Finally, the
impact of headwind and compression was studied. The presence of headwind on approach can lead
to significant loss of runway capacity (loss of approximately one arrival per hour for every 5kt of
headwind increase) due to lower groundspeed of the aircraft. The results suggest that there are
opportunities to increase or recover lost capacity if future wake separation rules consider wind
conditions. These new separation rules are the motivation for the next chapter of this thesis.

101
Chapter 4
4 Impact of New Wake Turbulence Separation Rules
The impact of current and new wake vortex separation requirements on runway capacity is
examined in this chapter. New wake vortex separation rules introduce new wake categories,
modify existing separation values, or incorporate wind and aircraft information in determining
minimum separation values. Since these new rules come in a variety of forms, with some of them
applicable to certain runway configurations or airports only, it is important to evaluate the potential
capacity increase they can provide beyond what is achievable with today’s existing rules and
technology. This chapter provides a detailed summary of recent wake vortex research, evaluates
the capacity impact of new rules, and provides recommendations on where authorities should focus
implementation efforts.
4.1 Wake Turbulence Study Objectives
Wake vortex separation is an additional factor that has the potential to limit runway capacity to the
same extent as the factors studied in Chapter 3. Much effort has been spent to study wake vortex
behavior, characterizing wake vortex encounters, and establishing new wake separation
requirements based on the results of these studies. New wake vortex separation requirements can
provide reduced separation values in certain conditions, and hence they can increase air
transportation system capacity. The current research work on reduced separation focuses on three
major areas. The first area is re-categorization of aircraft, or the introduction of additional aircraft
wake categories. The second area focuses on creating separation values dynamically adjusted to
wind conditions and, where applicable, to aircraft configuration. The third area focuses on closely
spaced parallel runway operations.

102
The objectives of this study are to collect and analyze recent wake vortex separation efforts, and
to estimate the additional runway capacity benefits that can be captured by them over the existing
capacity provided by current rules and requirements. Some of the major research questions this
study aims to answer are:
I. What are some of the new and emerging wake vortex separation rules and concepts that
can provide additional runway capacity?
II. How much additional capacity can these new concepts provide over what can be achieved
with today’s rules and technology?
III. How much additional runway capacity can be gained through increasing the number of
aircraft wake categories?
IV. Where and on what rules should authorities focus their implementation efforts on to
prioritize and use resources effectively?
The following section presents the research method selected for this study and the corresponding
simulation framework are presented next.
4.2 Study Method
To assess the benefits of new wake separation rules and procedures, this system-level study covers
a wide range of operational scenarios with the corresponding applicable separation rules, weather
scenarios, fleet mixes, and a variety of runway configurations. The study method can be described
as a two-step process: collection and analysis of separation rules followed by the evaluation of
potential runway capacity benefits.
The first step of this research is to review the existing literature on new wake separation concepts
and to analyze them in detail. Literature review is based on journal articles, conference
presentations, and in-person dialogues with industry experts from the FAA, Eurocontrol, and other
research organizations. Once existing literature is collected, separation rules are sorted based on
feasibility and categorized by their applicability to different runway configurations and their nature
of static or dynamic behavior.

103
The second step of this research is to estimate runway capacity benefits from the examined rules
and procedures. This part of the study is based on runway system simulations of arrival and
departure operations under various fleet mixes and runway configurations, using the fast-time
runway capacity simulator introduced in Chapter 3. For this study, capacity estimates are provided
for seven of the most delayed U.S. airports: Boston Logan (BOS), New York J.F. Kennedy (JFK),
New York LaGuardia (LGA), Newark (EWR), San Francisco (SFO), Los Angeles (LAX), and
Chicago O’Hare (ORD). These seven airports are ranked the lowest in terms of on-time arrival
performance in 2015 (out of 29 ranked major airports) [60]. One or two of the most constraining
runway configurations are selected at each of these airports for detailed capacity analysis, as
observed from the FAA’s Aviation System Performance Metrics (ASPM) data [1]. The fleet mixes
at these airports are estimated based on three days of operational data, as described in Chapter 3.
4.3 New Wake Turbulence Separation Rules and Procedures
Wake vortex separation has been an important safety consideration since the introduction of large,
commercial jets. As airplanes have gotten bigger with the introduction of the Boeing 747, and
much later with the Airbus A380, wake turbulence research initially focused on ensuring that
separations between smaller aircraft and large jetliners provided sufficient level of safety and
mitigated the risk of wake vortex encounters. As air traffic demand started to grow, wake
turbulence research priorities shifted to finding ways to reduce separation while maintaining
safety. The legacy separation rules established several decades ago have been modified several
times (for example the revision of B757 separations), but as demand continues to rise, there is a
strong need to reduce separations further. These efforts are motivated by the introduction of new
aircraft types into service (B787, A350, CS100, etc.); more accurate measurement of wake vortex
behavior; new air traffic control tools and ATM infrastructure; new on-board sensing, position
reporting, and Automatic Dependent Surveillance – Broadcast (ADS-B) capabilities; and new
weather and wind prediction algorithms. All the above reasons open new possibilities for reduced
wake separation concepts.

104
Some of these new wake separation concepts are applicable to single-arrival flows, while others
are applicable to closely-spaced parallel runways only. Their nature varies depending on whether
they include current wind and aircraft flight parameters in determining separation values between
pairs of aircraft. Separation rules that are updated based on current wind parameters are considered
dynamic separation rules. Separation rules that are constant and independent of wind are referred
to as static separation rules. Both are studied in detail in this chapter.
4.3.1 Re-Categorization of Aircraft
The aircraft re-categorization (RECAT) program is a joint initiative by the FAA and Eurocontrol,
although differences in the new separation rules can be found between the two implementations.
As mentioned earlier, aircraft in the past were categorized based on MTOW only, and separation
rules were established around those categories. These rules, however, can be too conservative for
certain pairs of aircraft, and hence there is an opportunity for reduction of separation between
them. For example, two aircraft belonging to the Heavy category can be of very different size. A
Boeing 747’s MTOW is much larger than a Boeing 767’s. When a B747 is followed by a B767 on
final approach in IMC, the FAA-specified legacy separation rules dictate a 4NM minimum
separation between the Heavy-Heavy pair. When the order of aircraft is reversed, and a B767 is
followed by the B747, the 4NM separation can be too conservative, since the wake vortices
generated by the B767 are weaker than the ones generated by the B747. Putting these two aircraft
into separate aircraft categories permits the application of reduced wake separations, which then
can increase runway capacity. This new categorization of aircraft is the motivation behind RECAT.
RECAT shifts from a solely MTOW-based wake category system to a categorization aircraft on
the basis of both MTOW and wingspan. The current RECAT categorization criteria are shown in
Table 4-1, as specified by the FAA in Order 7110.659C [61].

105
Table 4-1. RECAT wake categories in the U.S., based on wingspan and MTOW.
A B C D E F
MTOW
(lb) ≥300,000 ≥300,000 ≥300,000
I. <300,000 >41,000
I. <41,000
II. >41,000 II. <15,500
Wingspan
(ft) >245
175<
and
≤245
125<
and
≤175
I. 125< and ≤175 65<
and
≤90
I. ≤125
II. 90< and ≤125 II. -
Figure 4-1 provides a visual summary of changes from legacy weight classes to RECAT wake
categories. The Super category, now category A aircraft (indicated by blue points) remains
unchanged. Only the Airbus A380 and Antonov A225 belong to this category.
Figure 4-1. Legacy and RECAT wake categories based on wingspan and MTOW.
The Heavy weight class (indicated by green points) is divided into an upper and lower category,
B and C respectively. Category C includes the Airbus A310, Boeing 767, and MD10 aircraft, for
example. The Large weight class is also divided into two subsets, category D and E aircraft. The

106
Small weight class becomes category F. The required minimum wake separations on approach for
RECAT are shown below in Table 4-2, and same runway and closely-spaced parallel departure
separations are summarized in Table 4-3. Empty cells in the matrix indicate that no additional
wake separation is necessary, and standard departure separation can be applied (distance based
separations between IFR departures, where usually the lead aircraft is 6,000ft down the runway
and airborne).
Table 4-2. RECAT required minimum separation on approach.
Approach Separations
(nautical miles)
Follower
A B C D E F
Leader
A MRS 5 6 7 7 8
B MRS 3 4 5 5 7
C MRS MRS MRS 3.5 3.5 6
D MRS MRS MRS MRS MRS 4
E MRS MRS MRS MRS MRS MRS
F MRS MRS MRS MRS MRS MRS
Table 4-3. RECAT departure separations on single runway and on CSPR. Empty cells indicate that no
wake separation is necessary and standard departure separations can be applied (distance based).
Departure Separations
(seconds)
Follower
A B C D E F
Leader
A 180 180 180 180 240
B 120 120 120 120 210
C 120 120 180
D 120
E
F

107
The RECAT concept introduced above is referred to as RECAT Phase 1. It was first introduced in
Memphis in 2012 and has been in use with minor changes and adjustments in the separation matrix.
Since Memphis, the RECAT program has expanded to Atlanta, the New York metroplex airports,
Chicago O’Hare and Midway, and sixteen other airports as of 2016.
RECAT Phase 2 is a continuation of the RECAT Phase 1 program. It is a location-specific, static
categorization with more than six categories. RECAT Phase 2 has been implemented within the
Southern California Terminal Radar Approach Control (TRACON) in 2016 with seven wake
categories. Wake categories A through F remain, and an additional category, G, is created for
Heavy aircraft that are not included in Category B or C (for example the Airbus A340-200 used to
be category B, now belongs to category G [62] [63]). The new approach separations are shown in
Table 4-4. Separations have been reduced between A-B, and B-F pairs, and have increased for C-
E pairs compared to RECAT Phase 1. The values presented here are specific to the Southern
California TRACON. The grouping of aircraft and the corresponding separations may look
different at other TRACONs and at other airports. The Phase 2 aircraft categories and separation
values are based on a large pairwise separation matrix that has been narrowed down to seven
categories based on the local fleet mix characteristics.
Table 4-4. RECAT Phase 2 approach separation for Southern California TRACON.
Approach
Separations (nautical
miles)
Follower
A B C D E F G
Leader
A MRS 4.5 6 7 7 8 7
B MRS 3 4 5 5 6 7
C MRS MRS MRS 3.5 5 6 7
D MRS MRS MRS MRS MRS 4 7
E MRS MRS MRS MRS MRS MRS 7
F MRS MRS MRS MRS MRS MRS 7
G 7 7 7 7 7 7 7

108
The corresponding RECAT Phase 2 departure separations for same runway scenarios are shown
in Table 4-5. Separations behind A and B category aircraft have been reduced significantly, as
compared to RECAT Phase 1 separations shown in Table 4-3.
Table 4-5. RECAT Phase 2 time-based separation for Southern California TRACON.
Departure
Separations
(seconds)
Follower
A B C D E F G
Leader
A 120 150 180 180 240 210
B 90 120 120 120 180 210
C 120 120 180 210
D 120 210
E 210
F 210
G 210 210 210 210 210 210 210
RECAT 2 in Europe is a full pairwise separation (PWS) concept that, that similarly to the U.S.
version, can be optimized to a smaller number of categories based on local airport traffic mixes. It
can also be integrated with other new wake separation rules, such as Time-Based Separation
(TBS). At the time of writing of this thesis, the PWS distance-based separation matrix in the U.S.
was not published yet, and the final European PWS separation matrix was undergoing review by
the European Aviation Safety Authorities (EASA). Therefore, an early version of the European
PWS matrix serves as the basis for evaluating the impacts of pair-wise separation in this study.
The minimum wake separations in this pair-wise matrix are more aggressive than previous wake
separation rules. Therefore, the associated airport capacity benefits presented in this study are
plausible only if the PWS matrix specified minimum separations are both safe and feasible. This
preliminary European PWS matrix considers 97 individual aircraft types, whereas the U.S. PWS
matrix considers 123 aircraft types.

109
RECAT Phase 3 is still in early development, but it is planned to be a dynamic separation rule,
where separation minima are adjusted dynamically based on real-time wake turbulence
information, weather conditions, and aircraft data (weight and speed) from on-board systems.
Although the separation concept for Phase 3 has not been finalized yet, it is plausible that this
concept will delegate inter-arrival or inter-departure spacing to the pilot.
In terms of feasibility for implementation, RECAT 1 and RECAT 2 have been implemented at
certain airports and TRACONs in the U.S. The number of aircraft categories is higher than the
legacy FAA separation rules, but the new categories still follow some of the legacy weight classes.
Air traffic controllers can memorize the new categories and they can apply the new separation
requirements without the need for additional tools, although computer support, for example the
Automated Terminal Proximity Alert – ATPA, can be used simultaneously when needed [64].
ATPA monitors all aircraft on final approach, and provides minimum separation standards to
controllers. ATPA, or a similar support tool, is expected to become a major component for
implementing pair-wise separation rules, as very large separation matrices are much more difficult
to memorize than a five-by-five or six-by-six separation matrix. RECAT 3 increases
implementation complexity, as dynamic separations have higher data and surveillance
requirements due to constant wind and aircraft parameter monitoring. Therefore, RECAT 3 is more
likely to be a more distant concept in the future than the other static-separation RECAT concepts.
4.3.2 Reduced Separation Between Large-Large Pairs
One of the most straightforward wake separation improvement concepts proposes a reduction in
the minimum separation to 2NM between non-wake constrained arrival pairs, primarily for Large-
Large weight classes, as shown in Table 4-6 [65]. (This concept is not part of the RECAT
framework). The concept assumes that wake is not a factor between Large-Large pairs, and current
separation is limited by runway occupancy times mostly. If runway occupancy times can be
lowered to 45 seconds, a 2NM separation minima can be achieved. Lowering runway occupancy
time might require multiple high speed runway exits.

110
Table 4-6. Updated final approach separation matrix with Large-Large 2NM separation. MRS
remains 2.5NM/3.0NM, depending on average reported runway occupancy times.
Arrival Separations
(nautical miles)
Follower
Super Heavy B757 Large Small
Leader
Super MRS 6 7 7 8
Heavy MRS 4 5 5 6
B757 MRS MRS MRS MRS 4
Large MRS MRS MRS 2 4
Small MRS MRS MRS MRS MRS
Furthermore, the Large-Large reduced separation proposal assumes that current wake separation
buffers are large enough that even with the reduced 2NM separation minima, aircraft would still
be flying beyond today’s current minima. (Even with a 2NM minimum separation, the buffer
would extend the actual separation to more than MRS separation). Implementing a reduced wake
separation rule between Large-Large pairs requires updating the legacy wake separation matrix.
The number of weight classes and the size of the separation matrix remains the same, which means
that in terms of air traffic control, this rule is relatively easy to implement. However, the two-mile
separation also means that the limiting factor for increasing runway throughput can shift from
wake separation to runway occupancy.
4.3.3 Dual-Glideslope Approaches
The dual-glideslope approach concept proposes two airplanes landing on the same runway, with
one of them flying a standard approach and the other flying a higher approach and touching down
later on the runway [66]. The advantage of creating a higher approach is that separations between
the lower (standard) glideslope and the upper glideslope can be reduced significantly compared to
same-glideslope separations, due to the sinking nature of wake vortices. Both glideslopes provide
the same approach angle, enabled by the Ground Based Augmentation System (GBAS). The dual-
glideslope concept is illustrated below in Figure 4-2.

111
Figure 4-2. Dual-glideslope concept illustration.
Aircraft flying the lower glideslope fly a standard approach, touching down on the runway at about
1,000ft from the arrival threshold. The trailing aircraft (restricted to Small or Large weight classes
only) fly on the upper glideslope (same glide angle), but touch down at about 4,500ft from the
arrival threshold. This requires the runway to be sufficiently long to allow safe landings and
runway standard exits. Separation between aircraft on the same glideslope (upper-upper or lower-
lower) remains the single runway arrival separation, as specified in Order 7110.65. Separation
between aircraft leading on the upper approach and trailing on the lower approach require single
runway IFR separation plus one mile. Last, separation between aircraft leading on the lower
approach and trailing on the upper approach are specified in Table 4-7.
Table 4-7. IFR separation minimums between aircraft leading on lower-glideslope and aircraft trailing
on upper-glideslope. Super, Heavy, and B757 aircraft are not permitted to fly upper-glideslope approach.
Arrival Separations
(nautical miles)
Follower
Super Heavy B757 Large Small
Leader
Super - - - 7 8
Heavy - - - 3 3
B757 - - - 1.5 1.5
Large - - - 1.5 1.5
Small - - - 1.5 1.5

112
Standard separations apply behind A380 aircraft, 3NM for Small and Large weight classes behind
Heavy class, and 1.5NM for the remaining pairs. Separation values not shown in the table indicate
that separation is not applicable between those weight classes (due to limitations on what class can
fly the upper-glideslope approach). The dual-glideslope concept is technologically and
operationally more complex than the previous concepts introduced. Operating two glideslopes on
a single runway can increase both controller and pilot workload as it requires monitoring multiple
separation rules simultaneously.
4.3.4 Time-Based Separation
As previously discussed, strong headwinds can reduce the speed of aircraft on approach, which
increases the time to fly a given distance, and therefore can lead to loss of runway capacity. If
separation minimums are defined in units of time as opposed to units of distance, the time to fly a
given distance remains relatively constant despite the strong headwind, and hence runway capacity
can be recovered. This idea is the motivation behind the time-based separation (TBS) rule. TBS
can improve consistency of time spacing between arrivals so the time between arrivals in high
wind conditions is close to the time spacing achieved during light or no wind conditions, as
illustrated in Figure 4-3 [44]. TBS separation values are based on current distance-based values
flown in light wind conditions with an approach speed of 160 knots (UK – NATS). For example,
the required wake separation minima between an A380 and a Heavy class aircraft on approach is
6NM in the UK. Flying 6NM in no wind conditions takes 135 seconds at 160 knots.
Figure 4-3. Time-based separation illustration of concept [67].

113
When headwinds are strong, the same distance would take 160 seconds to fly. If the controllers
switch from distance-based to time-based separation rules, the 135-second inter-arrival separation
applies, which would be the equivalent of 5.1NM in no wind conditions. Irrespective of the
headwind conditions, an absolute distance-based wake turbulence separation minimum of 3NM
remains in effect for all wake turbulence requirements.
TBS is already operational at London Heathrow (LHR) airport, and Eurocontrol plans to expand
implementation to several other key European airports by 2024 [68]. At the time of writing, TBS
has not been implemented at any U.S. airports. Therefore, TBS is implemented in the fast time
runway capacity simulation model slightly differently from the one in use at Heathrow. First, the
aircraft weight classes are tailored to the legacy FAA weight classes, as opposed to the UK
classification of aircraft. Second, the final approach speed profiles implemented in the simulation
model are different from the constant 160-knot speed assumption that are needed to convert
distance values to equivalent times in no wind conditions. Accordingly, when the simulation model
converts from distance-based separation to time-based separation, the following minimum inter-
arrival times are applied, as shown in Table 4-8, independent of wind speed.
Table 4-8. Minimum inter-arrival times during time-based separation mode (as implemented in the
simulation model).
Inter-Arrival Time
(seconds)
Follower
Super Heavy B757 Large Small
Leader
Super 77 142 167 152 205
Heavy 65 98 105 117 169
B757 64 62 64 62 125
Large 64 62 64 69 114
Small 64 62 64 69 82
These separation values are more conservative than the TBS values implemented by NATS. The
inter-arrival times presented here show the minimum time interval between runway threshold

114
crossings for the leading and trailing aircraft, assuming that the minimum radar separation is
2.5NM. These values are calculated based on Equations 1, 2, 3, and based on the final approach
speeds presented in Table 3-1. The values do not account for runway occupancy times of the
leading aircraft, and they do not include a separation buffer, both of which are considered when
calculating runway throughput in a simulation run.
TBS implementation requires a computer support tool, which assists controllers with precise
monitoring of inter-arrival separations. Additionally, accurate wind forecasts are required for the
entire final approach path to enable time-based separation rules.
4.3.5 Closely Spaced Parallel Runway Operations
There are several wake separation rules specific to closely spaced parallel runway operations. The
reduced diagonal separation rule (7110.308) has been introduced already in the earlier chapters of
this thesis. The Wake Turbulence Mitigation for Arrivals – Procedure (WTMA-P) is an expansion
of the 308-rule that allows any aircraft type to lead the diagonal separation enabled pair (except
for the Super or RECAT Category A aircraft) [57]. The diagonal separation is a function of the
aircraft type of the leader and follower and the centerline separation between the closely spaced
parallel runways. WTMA-P is still a static separation concept as it does not consider wind or other
aircraft parameters, but there is a recently proposed version that does include dynamic weather
information. Wake Turbulence Mitigation for Arrivals – System (WTMA-S) requires a wind
forecast algorithm to determine procedure availability [69]. When winds are favorable, a rear gate
is added to the trailing aircraft’s diagonal position. The front gate is limited by the position of the
lead aircraft and its blunder zone. The rear gate is limited by the position of the wake vortex zone
that the lead aircraft generates. The follower aircraft needs to fly within the safe zone as determined
by the front and rear gates. The WTMA-S is a dynamic separation rule that is based on precise
wind forecasts. When winds are favorable the controller can apply reduced separations. There is
another CSPR wake mitigation concept like WTMA-S, called Interval Management – Paired
Approaches (IM-PA) [69]. IM-PA also requires knowledge of wind conditions to enable reduced
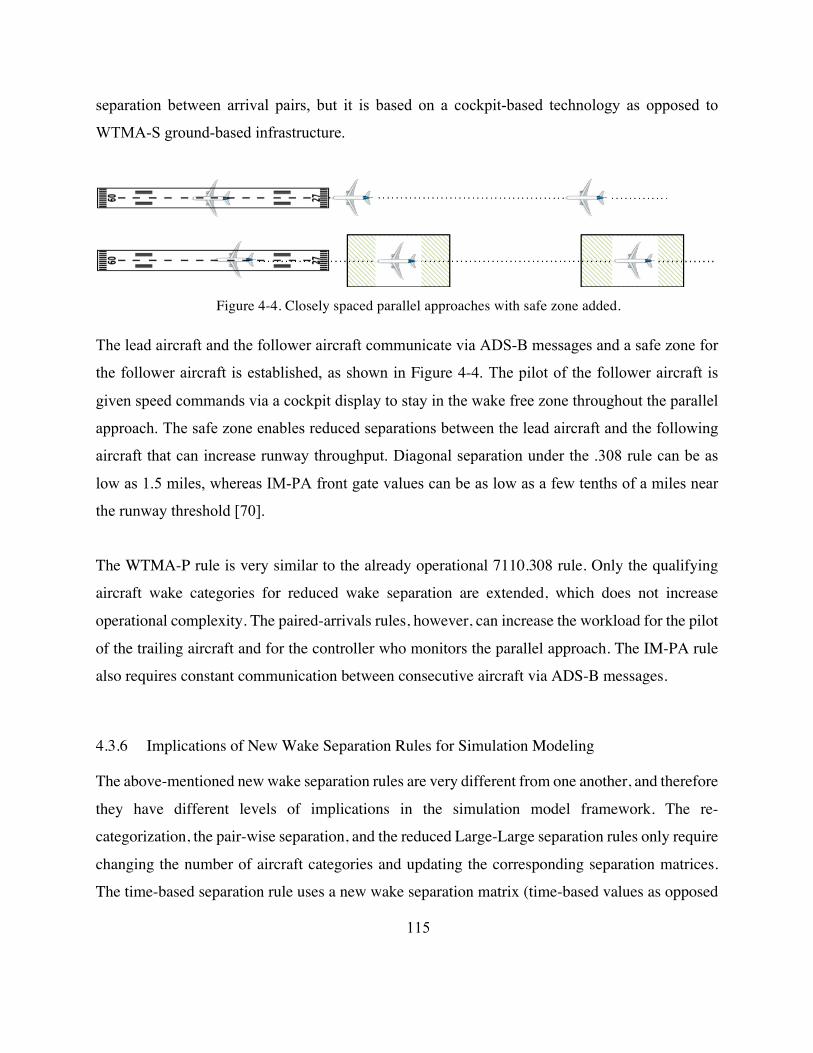
115
separation between arrival pairs, but it is based on a cockpit-based technology as opposed to
WTMA-S ground-based infrastructure.
Figure 4-4. Closely spaced parallel approaches with safe zone added.
The lead aircraft and the follower aircraft communicate via ADS-B messages and a safe zone for
the follower aircraft is established, as shown in Figure 4-4. The pilot of the follower aircraft is
given speed commands via a cockpit display to stay in the wake free zone throughout the parallel
approach. The safe zone enables reduced separations between the lead aircraft and the following
aircraft that can increase runway throughput. Diagonal separation under the .308 rule can be as
low as 1.5 miles, whereas IM-PA front gate values can be as low as a few tenths of a miles near
the runway threshold [70].
The WTMA-P rule is very similar to the already operational 7110.308 rule. Only the qualifying
aircraft wake categories for reduced wake separation are extended, which does not increase
operational complexity. The paired-arrivals rules, however, can increase the workload for the pilot
of the trailing aircraft and for the controller who monitors the parallel approach. The IM-PA rule
also requires constant communication between consecutive aircraft via ADS-B messages.
4.3.6 Implications of New Wake Separation Rules for Simulation Modeling
The above-mentioned new wake separation rules are very different from one another, and therefore
they have different levels of implications in the simulation model framework. The re-
categorization, the pair-wise separation, and the reduced Large-Large separation rules only require
changing the number of aircraft categories and updating the corresponding separation matrices.
The time-based separation rule uses a new wake separation matrix (time-based values as opposed

116
to distance-based) and it requires the adjustment of approach speeds based on headwind. Dual-
glideslope operations require additional separation matrices for consecutive arrivals flying lower-
upper, or upper-lower approaches. Additionally, the runway occupancy time of the aircraft flying
the upper approach is adjusted to account for the flight time between the arrival end of the runway
and touchdown. In the WTMA-P concept, like the FAA Order 7110.308 rule, only modifies the
qualifying aircraft category for reduced diagonal separation. Last, the paired-arrival concept
requires adjusting the final approach speed of the trailing aircraft of the diagonal pair to match the
speed of the lead aircraft (this ensures that the trailing aircraft stays in the wake safe zone).
4.4 Runway Configurations and Fleet Mixes for Case Studies
4.4.1 Runway Configurations
Seven of the busiest U.S. airports are selected for illustration of runway capacity benefits from
new wake separation rules and procedures. These airports were ranked the lowest of 29 total
airports by the Bureau of Transportation Statistics annual on-time arrival performance statistic in
2015 [60], summarized in Table 4-9. These airports are not only candidates for new wake
separation standards due to their congested facilities, but they also operate with a variety of runway
configurations and fleet mixes.
Table 4-9. Ranking of major airport on-time arrival performance for 2015 [60] [71].
Rank Jan 1 – Dec 31, 2015 % CY 2015 Enplanements
23 Los Angeles (LAX) 77.23 36,351,272
24 Boston (BOS) 77.03 16,290,362
25 Chicago (ORD) 76.95 36,305,668
26 San Francisco (SFO) 76.73 24,190,560
27 New York (JFK) 76.43 27,782,369
28 Newark (EWR) 75.42 18,684,818
29 New York (LGA) 70.91 14,319,924

117
LGA
EWR
JFK
SFO
ORD
BOS
LAX
Figure 4-5. Runway layouts at the selected airports.

118
The number of runways and their layouts are shown for each of the selected airports in Figure 4-5.
LGA is one of the busiest airports in the world with a set of intersecting runways. EWR has a pair
of closely spaced parallel runways with a third runway intersecting both. JFK has two sets of
parallel runways, one of which intersects two other runways. SFO has two sets of closely spaced
parallel runways. One set is usually used for arrivals and the other set for departures. ORD is
undergoing several runway alignment changes as of 2016. The intersecting configurations will be
gradually eliminated to increase the number of parallel operations. BOS has two sets of closely
spaced parallel runways and several intersecting runways. One of the runways (32) is
unidirectional and it is mainly used for small jet or turboprop arrivals. LAX has two sets of closely
spaced parallel runways. The outermost runways are usually used for arrivals and the inner
runways are mainly used for departures. Winds influence runway directions while cloud ceiling
and visibility restrict how many of the runways and in what configurations they can be operated.
Figure 4-6 shows the percentage of IMC and VMC operations as reported in the ASPM database
for 2015 [1].
Figure 4-6. Percentage of IMC weather at the selected airports for 2015 [ASPM].

119
Airports on the East Coast tend to operate less in IMC conditions than the other airports. SFO often
experiences fog and low visibility that limits operations while ORD is frequently hit by both
summer and winter storms that can restrict operations. Figure 4-7 shows five different runway
configurations these airports operate during IMC conditions for 2015: the airport has at least one
runway that is used for both arrivals and departures simultaneously; the airport operates in an
intersecting configuration with one runway assigned for arrivals and the other assigned for
departures; the airport operates a set of closely spaced parallel runways that intersect with other
runways; the airport operates a set of closely spaced parallel runways with one runway designated
for arrivals while the other is used for departures; or the airport operates in “other” configuration
with more than two runways [1].
Figure 4-7. Runway configurations in IMC conditions in 2015 [ASPM].
The most used runway configuration at LGA is an intersecting runway configuration with one
arrival runway and one departure runway. This configuration is used 86.2% of the time when IMC
conditions occur. The dominating runway configuration at EWR is a one-arrival, one-departure
CSPR arrangement that operates 91.6% of time. JFK operates with various other runway
configurations most of the time when a runway is shared between arrivals and departures or when

120
multiple independent runways are used for arrivals. This means that there is an independent single
arrival flow during this time. ORD also operates multiple runways in multiple configurations
during IMC. In a similar arrangement to JFK, ORD also has designated arrivals-only runways that
do not interact with other runways at the airport. The governing IMC runway configuration at BOS
is an intersecting runway alignment with one arrival-runway and one departure-runway. LAX
operates the Southern and Northern runways (Figure 4-5) as two independent complexes. Each of
the CSPR complexes has one arrival and one departure runway.
The selected test cases are summarized in Table 4-10 based on the most common IMC runway
configurations at the airports and the applicable wake separation rules.
Table 4-10. Selected runway configurations and wake separation rules for the case studies.
An additional single arrival-runway configuration is also evaluated besides the dominant CSPR
dual approach configuration at SFO. This additional configuration is selected to evaluate the
runway capacity benefits from some of the wake mitigation concepts (pair-wise, reduced pair-
wise, dual glideslope, and time-based separation) that are only applicable to this configuration.

121
The dual glideslope concept is not evaluated at LGA due to the runway length requirement. The
runways at LGA are too short to enable a secondary glideslope with a displaced threshold. The
seven-category RECAT Phase 2 rule is only evaluated at LAX because it is an airport-specific
wake separation rule that is only available for LAX out of the selected airports (as of 2016).
4.4.2 Fleet Mixes at Selected Airports
Figure 4-8 shows the fleet mixes for the selected airports (and the U.S. nationwide fleet mix) under
FAA legacy weight classification.
Figure 4-8. Fleet mixes based on FAA legacy weight classification.
LGA’s fleet mix is very homogeneous with 99.2% of the aircraft belonging to the Large weight
class. The remaining fleet consists of Small and B757 aircraft. Large aircraft tend to be the
dominating weight class across all airports. JFK, SFO, and LAX have at least 10% Heavy weight
class aircraft. These airports also receive a few A380 operated flights. JFK has the largest number
of Super class aircraft (1.8%), followed by LAX (1.2%). B757 operations are significant at EWR
(7.7%), JFK, SFO, and LAX. Small weight class aircraft have a strong presence at BOS (15.1%),

122
which is attributed to a local regional airline (Cape Air) operating multiple flights a day with twin-
engine Cessna aircraft. These aircraft tend to depart and land on shorter runways at BOS when
weather conditions permit (runway 32, 33R, etc.) to avoid delaying other traffic at the airport.
4.5 Results
4.5.1 Capacity Impacts of Increasing Number of Wake Categories
The legacy FAA weight class system categorized aircraft into five groups. RECAT Phase 1
changed the category boundaries and introduced a sixth wake category. RECAT Phase 2 goes a
step further to a seven-category system or to a pair-wise separation (in Europe) where every aircraft
has its own wake category. The results presented in this section investigate the capacity benefits
from increasing the number of aircraft wake categories. A single arrivals-only runway is assumed
with the U.S. representative fleet mix (Table 3-1), a 6-mile final approach length, and a standard
deviation of 16-seconds for the separation buffer (the expected value of the buffer is a function of
the approach speed and required minimum separation). A pair-wise separation matrix is assumed
based on a preliminary Eurocontrol pair-wise separation matrix for this analysis. This pair-wise
matrix contains 97 different aircraft types. Minimum separation values for certain pairs have been
reduced below the 2.5NM minimum radar separation. This matrix serves as the baseline for
establishing one, two, three, four, five, six, and pair-wise wake categories.
Table 4-11 through Table 4-13 show three examples how a small separation matrix can be
generated from the pair-wise baseline matrix. Aircraft in the first column (y-axis) define the type
of the lead aircraft and the first row (x-axis) defines the following aircraft. The minimum
separation between them is the corresponding value in the table. The tables presented here are only
a small subset of the pair-wise matrix and they serve for illustration-of-concept purposes only. If
all aircraft belong to the same group (K1) the required minimum separation between all pairs of
aircraft is the most restrictive separation from the pair-wise matrix: 7NM (shown in Table 4-11).
If aircraft are split into two wake groups (K1 and K2), the category boundary needs to be set
somewhere in the pair-wise matrix (along the x-axis and the y-axis), and the most restrictive

123
separation value in each of the four quadrants defines the new 2-by-2 separation matrix, as shown
on the right in Table 4-12.
Table 4-11. A one-category wake separation system. The most restrictive value (7NM) defines the
separation between all pairs of aircraft.
Table 4-12. Example for a two-category wake separation system.

124
Table 4-13 shows an example for a three-category wake separation system. This time the matrix
is divided into nine submatrices. The most restrictive separation values at each of the submatrices
define the new separation requirement for each of the three aircraft wake groups (K1, K2, and K3).
Table 4-13. Example for a three-category wake separation system.
The location of wake group boundaries is determined such that if all aircraft in the fleet are lined
up on an infinite final approach, the expected length of the arrival queue is minimized by finding
the minimum wake separation between every consecutive pair of landing aircraft, assuming a first-
come first-served order. In the case of a two-category wake separation system for instance, the
length of the imaginary final approach queue is calculated as follows:
𝐿�L�L� = 𝑃��𝑃��𝑠���� + 𝑃��𝑃��𝑠���� + 𝑃��𝑃��𝑠���� + 𝑃��𝑃��𝑠����
𝐿�L�L� = 𝑃��𝑃��×2.5 + 𝑃��𝑃��×𝑅𝑂𝑇�� + 𝑃��𝑃��×7 + 𝑃��𝑃��×5
where PK1 is the probability of an aircraft belonging to group K1, PK2 is the probability of an aircraft
belonging to group K2, sKxKx is the minimum separation between the pairs (based on the separation
matrix), and ROT is the runway occupancy of the lead aircraft between pairs where no minimum

125
wake separation is defined in the pair-wise matrix (inter-arrival separation is limited by the runway
occupancy time of the lead aircraft in this case).
The wake separation matrices for four, five, and six wake categories are generated the same way
as presented for the previous cases. A comparison of the legacy five-weight class FAA system and
the newly generated five group system (based on U.S. fleet mix and preliminary Eurocontrol pair-
wise matrix) is presented in Figure 4-9. The first group contains Small aircraft, but the upper limit
is moved to the left (smaller aircraft). The Large weight class is split into Group K2 and Group
K3. The Group K3 upper boundary aligns with the Large class upper boundary. The lower end of
the Heavy class is Group K4 and the remaining aircraft become Group K5.
Figure 4-9. Representative aircraft types for FAA legacy weight classes and newly generated five-
category system.
It should be noted that no values in the wake separation matrices generated here violate the
separation rules defined in the pair-wise matrix. No aircraft fly at a lower separation than originally
specified. The resulting wake separation matrices and aircraft categories are evaluated in the fast-
time airport capacity model for a single arrivals-only runway. The number of wake categories and
the resulting runway capacity is illustrated in Figure 4-10. The blue line indicates the mean arrival
throughput; the red dotted lines indicate the 25th and 75th percentiles.

126
Figure 4-10. Runway capacity vs. number of wake categories.
The mean arrival runway capacity is 18.1 arrivals per hour when all aircraft belong to the same
wake category and the minimum separation between all pairs is 7NM. Two wake groups can
increase runway capacity by 69.6% to 30.7 arrivals per hour. Three wake groups provide a further
capacity increase of 24.4% over two groups. Four wake groups yield 39.6 arrivals per hour, five
groups yield 40.7 arrivals per hour, and six groups yield 40.9 arrivals per hour. (The capacity with
the existing FAA five-category classification is 36.7 arrivals per hour.) If a full pair-wise
separation matrix is used (97 aircraft types, 97 wake groups), the additional capacity increase is
1.6 arrivals per hour. In this example a fleet mix tailored 5-by-5 wake separation matrix can capture
95.7% of the runway capacity that a pair-wise separation matrix can provide. Increasing the
number of wake categories can increase runway capacity but the magnitude of benefits decreases
with every additional wake category added. The results presented here are based on the assumed
U.S. representative fleet mix and the preliminary Eurocontrol pair-wise separation matrix.
Although the magnitude of benefits from additional wake categories can vary with fleet mix and
the initial pair-wise matrix, the benefits quickly diminish from additional categories.

127
It has been shown that runway capacity can be increased by creating new aircraft wake categories,
and the category boundaries depend on the values in the original pair-wise separation matrix and
the assumed fleet mix. Keeping the pair-wise matrix the same, the impact of fleet mix has been
investigated by evaluating the runway capacity for a single arrivals-only runway at each of the
seven selected airports for three different five-category separation rules. First, the legacy FAA
separation rule (FAA Order 7110.65) has been compared to the pair-wise separation matrix based
five-category rule (aircraft category boundaries are the same as the FAA weight classes, but the
separation values are based on the pair-wise matrix), as shown in Figure 4-11. This comparison
shows how much capacity can be gained from keeping the aircraft category boundaries the same,
while reducing separations between pairs of aircraft. The aircraft classes remain the same and the
values in the matrix are reduced accordingly, as shown in Table 4-14. Next, the newly generated
five-category wake separation rule that was calculated based on the U.S. representative fleet mix
(Table 3-1), and a newly-generated five-category wake separation rule that is generated based on
local fleet mixes at each of the airports have been compared, as shown in Figure 4-12. A 6NM
final approach, no wind, and a 16-second standard deviation of separation buffer are assumed in
all cases.
Table 4-14. FAA legacy separation matrix vs. FAA five-category separation matrix based on pair-
wise matrix-based values.

128
Figure 4-11 shows arrivals-only runway capacities at the seven airports under the legacy FAA
separation rule and a new five-by-five separation matrix that is based on the pair-wise matrix,
reduced to five categories per FAA legacy weight classification.
Figure 4-11. Arrival runway capacity under the FAA legacy separation rule and the pair-wise matrix-
based FAA weight class five-category system.
The red lines in the middle of the boxes represent the median runway capacity, the top and bottom
ends of the boxes represent the first and third quantiles, and the extended lines represent the
minimum and maximum values. The red data points are outliers or extreme cases. As expected
from the reduction of separation values and the elimination of minimum radar separation, runway
capacity increases under the new rule at all airports. LGA receives the greatest benefit (16.9%)
and the other airports see a capacity growth around 12-13%.
All the capacity benefits presented above come directly from reducing the minimum wake
separation between arrivals. The next step in this study is to investigate the capacity benefits that
can be gained from maintaining the number of categories at five and the minimum separation
values as they are, and only shifting aircraft group boundaries. Table 4-15 shows the FAA weight
class-based five-by-five matrix using separation values from the pair-wise matrix, and the new

129
U.S. fleet mix optimized separation matrix. The arrivals-only runway capacities are evaluated
again by applying these two separation matrices and a third, local-fleet-mix optimized, matrix at
each of the seven airports, as shown in Figure 4-12.
Table 4-15. FAA five-category separation matrix based on pair-wise matrix values and FAA legacy
weight classes (FAA 5-Cat. PWS) vs. U.S. fleet mix optimized five-category separation matrix based on
pair-wise matrix values (New 5-Cat. PWS).
Figure 4-12. Arrival runway capacity under the pair-wise FAA-weight-class five-category (FAA), the
U.S. fleet mix optimized five-category (US), and the local fleet mix optimized five-category separation
rules (Loc).

130
The means and standard deviations of the resulting capacities are summarized in in Table 4-16.
The means have been compared by means of statistical testing. An example calculation for EWR
is shown below for comparing the pair-wise FAA-weight-class five category rule (FAA) to the
U.S. fleet mix optimized five-category rule (US).
Hypotheses test for EWR: 𝐻�: 𝜇�� − 𝜇��� = 0 vs. 𝐻�: 𝜇�� − 𝜇��� ≠ 0
Assuming that the data comes from normally distributed independent random samples, the
appropriate test statistic is the following:
𝑍 =𝑋�� − 𝑋���𝑠���𝑛��
+ 𝑠����
𝑛���
=42.44 − 40.43
0.83�2000 +
0.66�2000
= 84.77
and the two-sided rejection region is (∝= 0.05):
𝑍 < −𝑧�.��� = −1.96 𝑎𝑛𝑑 𝑍 > 𝑧�.��� = 1.96
The null hypothesis can be rejected and the two capacity means differ at the 5% significance level.
The results indicate that the new U.S. fleet mix optimized five wake category system (middle
column box plot at every airport) results in significantly higher runway capacity than the current
FAA aircraft weight classification based system (left column box plot at every airport). EWR
receives the largest benefit of 4.9% and JFK receives the lowest, but still significant, benefit at a
0.5% arrival capacity increase. The capacity increase can be due to the changes in the fleet mix
(introduction of new aircraft types, retirement of other types, and changes in aircraft size) that have
occurred since the FAA legacy weight classes were established. Simply modifying and shifting
wake category boundaries to match today’s operational fleet mix while keeping the number of
categories the same can provide valuable capacity benefits, as summarized in Table 4-16.

131
Furthermore, the results also show that optimizing the aircraft wake group boundaries to local
(airport specific) fleet mixes and generating the separation matrices accordingly can provide
additional runway capacity benefits over what can be achieved with a country-wide (or global)
representative fleet mix (right column box plots at every airport in Figure 4-12). The greatest
capacity growth can be seen at JFK (2.6%) with four other airports also getting significant benefits
at a 5% significance level. The capacity benefits at EWR and SFO are not significant, but they are
still present, as shown in Table 4-16. It can be concluded that airport-specific separation rules have
the potential to increase runway capacity over a one-rule-fits-all separation system. This
decentralization of wake separation rules can be seen from recent trends in wake separation rule
implementations in the U.S. and in Europe. For example, RECAT Phase 2 in the Southern
California TRACON establishes the seventh wake category based on local fleet mix characteristics
[72].

132
Table 4-16. Comparison of arrivals-only, single runway capacities for U.S. fleet mix and local fleet
mix optimized wake separation rules.
Five
Cat.
Pair-Wise
FAA
Based
(I.)
Mean
(SD)
U.S. Mix
Optimized
(II.)
Mean
(SD)
Local Mix
Optimized
(III.)
Mean
(SD)
Mean
Difference
(I.-II.)
[95% CI]
p-value
(I.-II.)
Mean
Difference
(II.-III.)
[95% CI]
p-
value
(II.-
III.)
LGA 44.01
(0.18)
45.09
(0.16)
45.38
(0.13)
1.04
[1.09,
1.07]
<.001
0.29
[0.29,
0.27]
<.001
EWR 40.43
(0.66)
42.44
(0.83)
42.47
(0.81)
2.01
[2.05,
1.96]
<.001 0.03
[0.08, -0.02] .23
JFK 39.63
(0.67)
39.81
(0.91)
40.84
(0.83)
0.18
[0.23,
0.13]
<.001
1.03
[1.08,
0.97]
<.001
SFO 41.33
(0.61)
42.05
(0.86)
42.1
(0.87)
0.72
[0.77,
0.68]
<.001 0.05
[0.1, -0.01] .08
ORD 42.12
(0.57)
42.96
(0.74)
43.37
(0.59)
0.84
[0.88,
0.79]
<.001
0.41
[0.46,
0.37]
<.001
BOS 39.85
(0.72)
40.99
(0.84)
41.1
(0.87)
1.14
[1.17,
1.08]
<.001
0,11
[0.15,
0.05]
<.001
LAX 40.88
(0.63)
41.84
(0.9)
41.89
(0.88)
0.92
[1.01,
0.91]
<.001
0.05
[0.13,
0.01]
0.04

133
4.5.2 Airport Capacity Benefits from Re-Categorization Phase 1
Figure 4-14 through Figure 4-16 compares airport capacities at the selected case study airports
between the FAA legacy wake separation rules and the new RECAT Phase 1 separation rule.
RECAT 1 introduces six aircraft categories that are based on both wingspan and MTOW, as
opposed to the legacy, MTOW-based classification system of aircraft.
LGA (Intersecting Runways)
EWR (CSPR)
Figure 4-13. Comparison of airport capacity envelopes at LGA and EWR for FAA legacy and
RECAT Phase 1 separation rules.
A 6-mile common final approach path, zero wind speed, and a 16-second standard deviation for
the separation buffer is assumed in all cases. As mentioned in Table 4-10, LGA and BOS are
evaluated in an intersecting configuration, EWR, LAX, and SFO are studied in a CSPR runway
configuration, and JFK and ORD are studied in a single arrivals-only configuration.
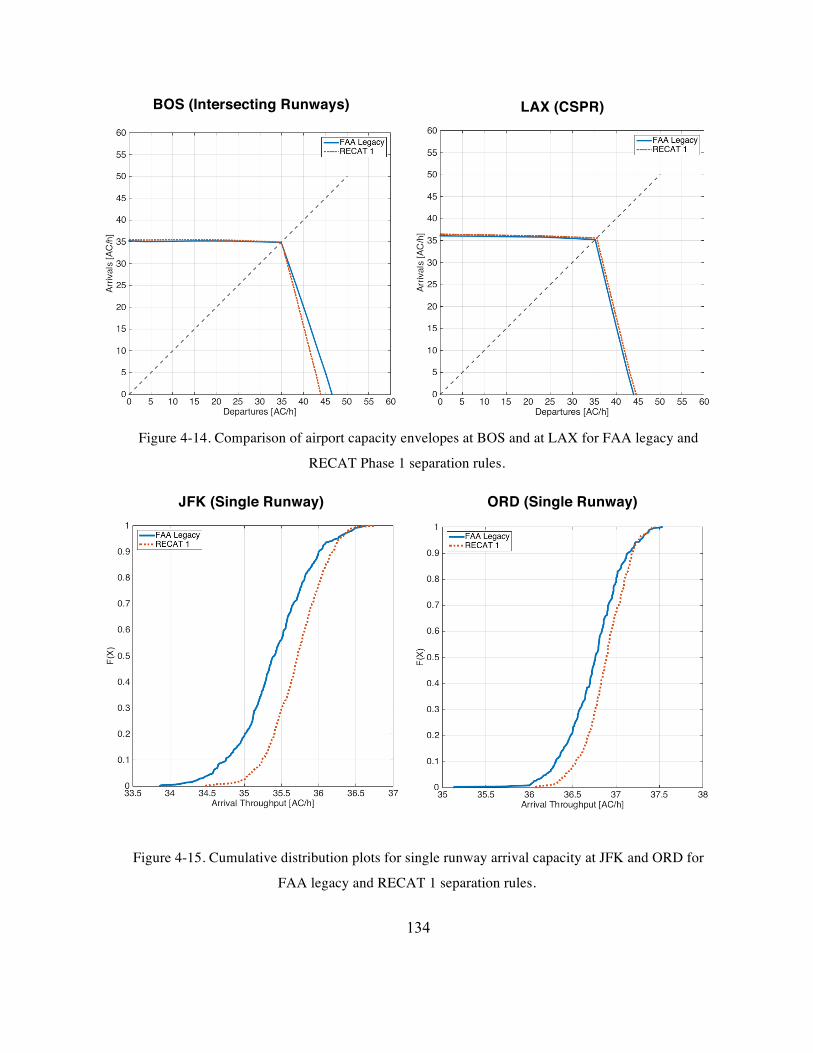
134
BOS (Intersecting Runways)
LAX (CSPR)
Figure 4-14. Comparison of airport capacity envelopes at BOS and at LAX for FAA legacy and
RECAT Phase 1 separation rules.
JFK (Single Runway)
ORD (Single Runway)
Figure 4-15. Cumulative distribution plots for single runway arrival capacity at JFK and ORD for
FAA legacy and RECAT 1 separation rules.

135
SFO (CSPR – ARR Only)
Figure 4-16. Cumulative distribution plot for CSPR arrivals-only runway capacity at SFO for FAA
legacy and RECAT 1 separation rules.
The results indicate that RECAT 1 separation rules can increase arrival capacity at all airports,
except at LGA. LGA’s fleet mix (mostly Large weight class) is such that the separation rules
between the pairs are the same under FAA legacy rule and RECAT 1 rule. The magnitude of arrival
capacity increase is a function of the local fleet mixes and it ranges from 0.4% (ORD) to 1.8%
(EWR). Additionally, the empirical cumulative distributions functions (CDF) in Figure 4-15 and
Figure 4-15 show that the arrival runway capacity increase under RECAT 1 is due to an upward
shift of the lower end values on the curve. The upper values on the CDF curve look similar under
both separation rules. This can be explained by the changes in the wake separation matrix. The
lowest separation values in the matrix remained the same (minimum radar separation) whereas
some of the longer separation values in the matrix have been reduced. Due to the greater incidence
of wide body aircraft at these airports, these reduced separations have a greater impact on capacity.
The arrival capacity results are summarized in Table 4-17.

136
Table 4-17. Arrival runway capacity benefits from RECAT Phase 1 wake separation rule.
Arrival
Capacity
FAA Legacy
Separation
Mean
(SD)
RECAT 1
Separation
Mean
(SD)
Mean Difference
[95% CI] p-value
LGA 37.61
(0.15)
37.6
(0.14)
-0.01
[0.01, -0.02] .986
EWR 35.99
(0.45)
36.65
(0.29)
0.66
[0.74, 0.61] <.001
JFK 35.4
(0.49)
35.71
(0.37)
0.31
[0.36, 0.26] <.001
SFO 41.43
(0.74)
41.75
(0.66)
0.32
[0.41, 0.24] <.001
ORD 36.75
(0.33)
36.88
(0.25)
0.13
[0.17, 0.1] <.001
BOS 35.23
(0.44)
35.47
(0.46)
0.24
[0.31, 0.17] <.001
LAX 36.11
(0.45)
36.54
(0.34)
0.43
[0.46, 0.31] <.001
Departure capacity remains almost the same at LGA and at EWR. The only statistically significant
departure throughput increase is observed at LAX. Interestingly, departure capacity gets lower at
BOS under RECAT 1 separation rules. The 5.6% capacity loss is due to the large percentage of
Small or Category F aircraft (15.1% of fleet mix) that receive longer separation departing behind
Large and Heavy aircraft than under legacy separation rules. Most of these Small aircraft
operations are twin-engine Cessna aircraft. The simulation model assumes that these aircraft share
the same runways as every other aircraft when departing in IMC weather conditions, which can
lead to loss of departure runway throughput. In real-world operations, these aircraft often takeoff

137
on other shorter runways (e.g. runway 14) without interrupting the flow of jet traffic. The departure
capacity benefits from RECAT 1 rule are shown in Table 4-18.
Table 4-18. Departure runway capacity benefits from RECAT Phase 1 wake separation rule.
Departure
Capacity
FAA Legacy
Separation
Mean
(SD)
RECAT 1
Separation
Mean
(SD)
Mean Difference
[95% CI] p-value
LGA 48.07
(0.22)
48.07
(0.21)
0.0
[-0.56, 0.56] .843
EWR 45.01
(0.81)
45.02
(0.79)
0.01
[-0.06, 0.08] .788
BOS 46.56
(0.59)
43.94
(0.91)
-2.62
[-2.53, -2.7] <.001
LAX 44.05
(1.01)
44.19
(0.98)
0.14
[0.25, 0.11] <.001
The RECAT Phase 1 study has showed that significant airport capacity growth can be achieved
from a six-category wake separation rule. The magnitude of benefits depends on the fleet mix.
LGA, with a mostly Large weight class mix, does not gain any capacity as the inter-arrival and
inter-departure separations between Large-Large pairs remain unchanged. Airports with
significant Small and Heavy weight class aircraft presence, like BOS, can lose capacity due to the
increased minimum separation between these pairs. The airports that benefit the most from
RECAT Phase 1 are the ones with many lower-Heavy or Category C aircraft (Boeing 767, DC10,
etc.). Most of the capacity benefits from RECAT are achieved through reducing the wake
separations behind these aircraft.

138
4.5.3 Airport Capacity Benefits from Re-Categorization Phase 2
As it was introduced earlier, the RECAT 2 rule establishes seven aircraft wake categories. One
additional aircraft category is created (category G) on top of the RECAT 1 six-category system.
Aircraft that are rare at an airport are take out from the existing six categories, and are placed in
the seventh category. This categorization can permit the reduction of separation between certain
aircraft category pairs in the original six-by-six matrix, while it assigns more conservative
separations for aircraft in the seventh group. RECAT 2 separation rules have been also evaluated
at LAX, as shown in Figure 4-17.
LAX (CSPR)
Figure 4-17. LAX airport capacity envelope for FAA legacy and RECAT 2 separation rules.
The results indicate a slightly higher arrival capacity (36.58 arrivals per hour) for RECAT 2 than
for RECAT 1 (36.54 arrivals per hour). Overall, RECAT 2 provides a significant arrival capacity
increase (1.3%) over the legacy wake separation rule, shown in Table 4-19.

139
Table 4-19. Arrival runway capacity benefits from RECAT Phase 2 wake separation rule.
Arrival
Capacity
FAA Legacy
Separation
Mean
(SD)
RECAT 2
Separation
Mean
(SD)
Mean Difference
[95% CI] p-value
LAX 36.11
(0.45)
36.58
(0.37)
0.47
[0.63, 0.29] <.001
Departure capacity increases at LAX for both RECAT Phase 1 and RECAT Phase 2 separation
rules. RECAT 1 provided a 0.3% departure capacity increase while RECAT 2 can provide a 1.2%
departure capacity growth. The departure capacity benefits are shown in Table 4-20.
Table 4-20. Departure runway capacity benefits from RECAT Phase 2 wake separation rule.
Departure
Capacity
FAA Legacy
Separation
Mean
(SD)
RECAT 2
Separation
Mean
(SD)
Mean Difference
[95% CI] p-value
LAX 44.05
(1.01)
44.58
(0.92)
0.53
[0.65, 0.5] <.001
4.5.4 Airport Capacity Benefits from Static Pair-Wise Separation
Figure 4-18 and Figure 4-19 compare airport capacities between the FAA legacy wake separation
rules and a preliminary RECAT EU pair-wise separation rule. This separation rule establishes
inter-arrival separations specific to individual aircraft types, as opposed to weight classes or other
categories. The minimum separations have been reduced significantly for many of the leader-
follower aircraft pairs in the pair-wise EU matrix, which means that runway occupancy can

140
become the limiting separation factor between them, and hence arrival capacity increases by a
larger magnitude.
LGA (Intersecting Runways)
EWR (CSPR)
BOS (Intersecting Runways)
LAX (CSPR)
Figure 4-18. Comparison of airport capacity envelopes at LGA, EWR, BOS, and LAX for FAA
legacy and pair-wise EU wake separation rules.

141
JFK (Single Runway)
ORD (Single Runway)
SFO (Single Runway)
Figure 4-19. Cumulative density functions for arrival runway capacity at JFK, ORD, and SFO under
FAA legacy and pair-wise EU wake separation rules.
The (preliminary) pair-wise separation rule provides significant arrival capacity growth at all the
airports (single runway configuration is compared at SFO because pair-wise separations only apply

142
for single runway arrivals and not for closely spaced parallel approaches), as presented in Table
4-21. The magnitude of capacity increase ranges from 24.4% (SFO) to 28.9% (LGA), which is
significantly larger than what was seen from RECAT Phase 1 and RECAT Phase 2 (seven-
category) separation rules. At SFO, the pair-wise separation rule results in higher arrival capacity
on a single runway (45.5 arrivals per hour) than what can be achieved both on a single runway
under FAA legacy separation rule (36.53 arrivals per hour) and on closely spaced parallel runways
under the FAA Order 7110.308 diagonal separation rule (41.43 arrivals per hour).
Table 4-21. Arrival runway capacity benefits from the pair-wise wake separation rule.
Arrival
Capacity
FAA Legacy
Separation
Mean
(SD)
Pair-Wise
Separation
Mean
(SD)
Mean Difference
[95% CI] p-value
LGA 37.61
(0.15)
48.51
(0.04)
10.9
[11.48, 9.91] <.001
EWR 35.99
(0.45)
46.32
(0.33)
10.33
[10.58, 9.28] <.001
JFK 35.4
(0.49)
44.25
(0.40)
8.85
[8.89, 8.8] <.001
SFO 36.53
(0.4)
45.5
(0.35)
8.97
[9.01, 8.93] <.001
ORD 36.75
(0.33)
46.48
(0.33)
9.73
[9.77, 9.7] <.001
BOS 35.23
(0.44)
45.34
(0.43)
10.11
[11.28, 9.58] <.001
LAX 36.11
(0.45)
45.92
(0.35)
9.81
[10.05, 9.43] <.001

143
This large arrival capacity increase is due to significant reductions in the separation values
compared to FAA legacy separation requirements. These capacity benefits only materialize if the
PWS minimum separations are both safe and feasible to achieve. In the PWS matrix, many of the
inter-arrival pairs are limited by the runway occupancy time of the leading aircraft as opposed to
its wake turbulence. Departure capacity remains the same as it was under FAA legacy separation
because the pair-wise separation rule in the simulation model is only applicable for arrivals.
4.5.5 Airport Capacity Benefits from Reduced Pair-Wise Separation (EU)
Last, the impacts of reduced pair-wise separation on runway capacity have been investigated. As
it was mentioned earlier, RECAT 3 is planned to be a dynamic wake separation rule where the
required minimum separations are constantly adjusted based on wind speed and wind direction,
with the possibility of adjustment for aircraft flight characteristics (approach speed, weight,
landing gear and flaps configuration). For the purpose of this study, the baseline scenario for
evaluating capacity benefits from a dynamic wake separation rule is the pair-wise separation rule
studied in Figure 4-18 and Figure 4-19, as opposed to the legacy FAA separation rule. The pair-
wise separation rule has been chosen as the baseline scenario because it is the static separation rule
that can provide the highest runway capacity. For any additional runway capacity growth, a
significant decline in runway occupancy times or dynamic wake separation rules are necessary
(assuming that separation buffers remain the same).
Since the reduction in separation values can vary in RECAT 3 as a function of wind and aircraft
parameters, a parametric study has been designed for evaluating runway capacity for three
different scenarios. Three plausible separation decrease values have been studied: 0.25NM,
0.5NM, and 1NM. This means that the separation values for wake restricted aircraft pairs are
reduced by the above-mentioned values compared to the pair-wise EU matrix. (For instance, if a
separation between a certain pair in the pair-wise EU matrix was 3NM, the capacity is evaluated
with a new 2.75NM, 2.5NM, and 2.0NM value.) No adjustments in the separation values have
been made between aircraft pairs where no wake separation requirement is specified. The
separation between these aircraft pairs remained the runway occupancy time of the leading aircraft.

144
The resulting runway capacity profiles from reduced wake separation are presented in Figure 4-20
and Figure 4-21.
LGA (Intersecting Runways)
EWR (CSPR)
BOS (Intersecting Runways)
LAX (CSPR)
Figure 4-20. Comparison of airport capacity envelopes at LGA, EWR, BOS, and LAX for pair-wise
and reduced pair-wise wake separation rules.

145
JFK (Single Runway)
ORD (Single Runway)
SFO (Single Runway)
Figure 4-21. Cumulative density functions for arrival runway capacity at JFK, ORD, and SFO under
pair-wise and reduced pair-wise wake separation rules.
Reduced pair-wise wake separation rule can provide additional runway capacity beyond the static
pair-wise wake separation rule. At a 95% confidence level, a 0.25NM reduction in the minimum

146
required separations increases arrival runway capacity significantly at EWR (p = .011), JFK, SFO,
and at ORD (all p<.001). The benefits range from 0.1 to 0.47 arrivals per hour (EWR, SFO). No
significant benefits can be seen at BOS (p = .333), LAX (p = .149), and at LGA (p = .844). At
BOS and at LAX, the additional runway capacity obtained from a 0.5NM minimum separation
reduction becomes significant (plus 0.8 and 0.52 arrivals per hour over static pair-wise separation
capacity). At LGA, not even the 1NM separation reduction can provide significant arrival capacity
increase due to the homogenous fleet mix (Figure 4-8) that consists of 99.2% Large weight class
aircraft. In the pair-wise separation matrix, there is no wake separation required on approach
between these aircraft (only runway occupancy limitation), therefore the reduction of separation
values by any amount has very little impact on runway capacity, as shown in Table 4-22.
Table 4-22. Arrival runway capacity benefits from reduced pair-wise wake separation rules.
Arrival
Capacity
Pair-Wise Static
Mean
(SD)
PWS – 0.25NM
Mean
(SD)
PWS - 0.5NM
Mean
(SD)
PWS - 1.0NM
Mean
(SD)
LGA 48.51
(0.04)
48.66
(0.04)
48.8
(0.04)
48.84
(0.04)
EWR 46.32
(0.33)
46.42
(0.32)
46.54
(0.28)
46.8
(0.26)
JFK 44.25
(0.40)
44.43
(0.38)
45.22
(0.36)
45.6
(0.33)
SFO 45.5
(0.35)
45.97
(0.34)
46.32
(0.32)
46.66
(0.28)
ORD 46.48
(0.33)
46.65
(0.3)
47
(0.29)
47.43
(0.25)
BOS 45.34
(0.43)
45.59
(0.39)
46.14
(0.37)
46.53
(0.31)
LAX 45.92
(0.35)
46.26
(0.39)
46.44
(0.33)
46.99
(0.28)

147
4.5.6 Runway Capacity Benefits from Reduced Large-Large 2NM Separation
Figure 4-22 and Figure 4-23 show runway capacity benefits from the Large-Large 2NM (originally
MRS) wake separation rule, while FAA legacy separation rules remain for all other pairs.
LGA (Intersecting Runways)
EWR (CSPR)
BOS (Intersecting Runways)
LAX (CSPR)
Figure 4-22. Comparison of airport capacity envelopes at LGA, EWR, BOS, and LAX for FAA
legacy and Large-Large 2NM wake separation rules.

148
JFK (Single Runway)
ORD (Single Runway)
SFO (CSPR)
Figure 4-23. Cumulative density functions for arrival runway capacity at JFK, ORD, and SFO under
FAA legacy and Large-Large 2NM wake separation rules.
As in the case of pair-wise separations, the reduced Large-Large 2NM separation only impacts
arrival movements. LGA receives the largest arrival capacity growth (17.1%) due to the local fleet

149
mix that consists of 99.2% Large weight class aircraft. The proportion of Large class to the overall
fleet mix has a direct influence on capacity growth at the other airports as well. The magnitude of
benefits range from 5.5% at SFO to 12.8% at ORD. The detailed results are summarized in Table
4-23.
Table 4-23. Arrival runway capacity benefits from the Large-Large 2NM wake separation rule.
Arrival
Capacity
FAA Legacy
Separation
Mean
(SD)
Large-Large 2NM
Separation
Mean
(SD)
Mean Difference
[95% CI] p-value
LGA 37.61
(0.15)
44.03
(0.15)
6.42
[6.45, 6.4] <.001
EWR 35.99
(0.45)
38.94
(0.85)
2.95
[3.05, 2.85] <.001
JFK 35.4
(0.49)
37.98
(0.83)
2.58
[2.66, 2.49] <.001
SFO 41.43
(0.74)
43.71
(1.01)
2.28
[2.39, 2.17] <.001
ORD 36.75
(0.33)
41.46
(0.75)
4.71
[4.78, 4.64] <.001
BOS 35.23
(0.44)
38.28
(0.85)
3.05
[3.14, 2.9] <.001
LAX 36.11
(0.45)
39.63
(0.89)
3.52
[3.62, 3.41] <.001
It is important to note that just like with the pair-wise separation rule, the reduced Large-Large
separation rule also relies heavily on short runway occupancy times, which can become the
limiting factor for inter-arrival separations. The current 2.5NM minimum radar separation in the
U.S. requires that the average runway occupancy time is 50 seconds or less. Therefore, a 2NM
separation would require significantly lower separation times.

150
4.5.7 Runway Capacity Benefits from Dual-Glideslope Operations
The impacts of a dual-glideslope approach (on the same runway) procedure are studied in Figure
4-24 and in Figure 4-25.
EWR (Single Runway)
JFK (Single Runway)
SFO (Single Runway)
ORD (Single Runway)
Figure 4-24. Comparison of airport capacity profiles at EWR, JFK, SFO and ORD for standard and
dual-glideslope operations.

151
BOS (Single Runway)
LAX (Single Runway)
Figure 4-25. Comparison of airport capacity profiles at BOS and LAX for standard and dual-
glideslope operations.
As previously described this procedure requires the arrival runway to be long enough (longer than
8,000ft) to allow operations on an upper glideslope where the aircraft touches down further down
the runway (4,500ft from threshold) [66]. Since both runways at LGA are below this requirement
(7,003ft – Runway 13/31, 7,001ft – Runway 4/22), LGA is not considered as a test case airport in
this analysis. Additionally, dual-glideslope operations are limited to single runways, therefore only
single runway capacities are compared at the other six airports. The results show that the additional
arrival capacity growth ranges between 11.9% and 15.5%. JFK airport benefits the least and ORD
gains the most capacity, as summarized in Table 4-24.
A similar dual threshold concept, called High Approach Landing System (HALS) and Dual
Threshold Operations (DTOP), was tested in Frankfurt (FRA) between 1999 and 2004 [73]. A
displaced threshold was created on a parallel runway (25L) to allow smaller aircraft to fly a higher
approach and avoid the wake vortices from a large jet flying a standard approach on the other
runway (25R). The capacity benefits from the HALS/DTOP concept did not materialize, as
controllers did not apply the reduced separations between arrival pairs. FRA airport eventually

152
abandoned the concept and built a new parallel runway instead. The system was uninstalled in
2009.
Table 4-24. Arrival runway capacity benefits from dual-glideslope approaches.
Arrival
Capacity
FAA Legacy
Separation
Mean
(SD)
Dual Glideslope
Approach
Mean
(SD)
Mean Difference
[95% CI] p-value
EWR 35.99
(0.45)
40.92
(0.59)
4.93
[4.94, 4.8] <.001
JFK 35.4
(0.49)
39.64
(0.77)
4.24
[4.32, 4.16] <.001
SFO 36.53
(0.4)
41.63
(0.61)
5.1
[5.16, 5.03] <.001
ORD 36.75
(0.33)
42.46
(0.53)
5.71
[5.77, 5.66] <.001
BOS 35.23
(0.44)
40.56
(0.64)
5.33
[5.35, 5.21] <.001
LAX 36.11
(0.45)
41.07
(0.71)
4.94
[4.97, 4.82] <.001
4.5.8 Runway Capacity Benefits from Time-Based Separation
Time-based separations are modeled such that when wind speed is more than zero, the separation
rules switch from distance-based inter-arrival rules to zero-wind-speed-equivalent time-based
values. Therefore, inter-arrival separations are maintained at all wind speeds and runway capacity
does not change. Figure 4-26 and Figure 4-27 show the loss of runway capacities due to changing

153
headwind speeds ranging from 0kt to 30kt and the new runway capacity profiles when time-based
separation mode is enabled (dashed cyan line).
LGA (Intersecting Runways)
EWR (CSPR)
BOS (Intersecting Runways)
LAX (CSPR)
Figure 4-26. The impact of headwind on airport capacity at LGA, EWR, BOS, and LAX for FAA
legacy wake separation rules.

154
JFK (Single Runway)
ORD (Single Runway)
SFO (CSPR)
Figure 4-27. The impact of headwind on arrival runway capacity at JFK, ORD, and SFO for FAA
legacy wake separation rules.
An average runway capacity loss of one arrival per hour can be observed for every five-knot
increase in the headwind speed at all airports. Time-based separation results in the same runway

155
capacity profile as if there was no headwind under the distance-based separation rule. This
illustrates that although the time-based separation rule does not increase runway capacity beyond
what can be achieved with a distance-based rule under no wind conditions, it can be significant
when headwinds are strong. Time-based rule can recover lost runway capacity and it can help to
reduce variability in the system, which can reduce delays when an airport is operating near its
maximum capacity [4].
4.5.9 Runway Capacity Benefits from new CSPR Separation Rules
Simultaneous approaches on closely spaced parallel runways are the most common configuration
at SFO (landing on runways 28L and 28R), as shown in Figure 4-5. As explained earlier, aircraft
flying closely spaced parallel approaches are separated per FAA Order 7110.308. This rule permits
a reduced, diagonal separation between an aircraft on the primary runway and an aircraft on the
secondary runway if the leading aircraft is of Small or Large weight class. This weight class
restriction is relaxed under the WTMA-P rule that permits B757 and Heavy aircraft to also lead
the diagonal pair. Furthermore, paired-arrivals (IM-PA) can be established when wind conditions
permit, with even smaller diagonal separation than what is permitted under WTMA-P. IM-PA has
been evaluated with a 0.2NM minimum front gate and a 0.5NM minimum front gate. It is assumed
in the simulation model that when the trailing aircraft approach speed is lower than the leading
aircraft speed, the trailing aircraft adjusts it to match the speed of the leading aircraft. The runway
capacity benefits provided by WTMA-P and the two IM-PA separation rules over the FAA Order
7110.308 rule are presented in Figure 4-28.

156
Figure 4-28. Cumulative density functions for arrival CSPR capacity at SFO under FAA Order
7110.308, WTMA-P, and IM-PA wake separation rules (IM-PA has been evaluated with 0.2NM and
0.5NM minimum front gate separations).
Both separation rules add significant runway capacity at SFO at the 95% level: WTMA-P increases
capacity by 4.1%, IM-PA (0.2NM front gate) grows by 34.7%, and IM-PA (0.5NM front gate)
raises capacity by 26.7% over the capacity provided by the FAA Order 7110.308 rule. The arrival
capacity growth from IM-PA (0.2NM front gate) over WTMA-P is an additional 29.4%.
Table 4-25. CSPR arrival runway capacity benefits from WTMA-P wake separation rule over FAA
Order 7110.308 rule.
Arrival
Capacity
FAA Order
7110.308
Separation
Mean
(SD)
WTMA-P
Separation
Mean
(SD)
Mean Difference
WTMA-P vs.
.308
[95% CI]
p-value
SFO 41.43
(0.74)
43.13
(0.47)
1.7
[1.77, 1.62] <.001

157
Table 4-26. CSPR arrival runway capacity benefits from IM-PA wake separation rule over FAA
Order 7110.308 rule.
Arrival
Capacity
FAA Order 7110.308
Mean
(SD)
IM-PA Separation
Mean
(SD)
Mean Difference
IM-PA vs. .308
[95% CI]
p-value
IM-PA
0.2NM Min
41.43
(0.74)
55.82
(0.97)
14.39
[14.5, 14.29] <.001
IM-PA
0.5NM Min
41.43
(0.74)
52.48
(0.76)
11.05
[11.03, 10.95] <.001
4.6 Summary and Conclusions
This chapter evaluated airport capacity benefits from nine wake separation rules (both static and
dynamic) at seven of the busiest U.S. airports. The results are summarized in Table 4-27. The static
separation rules included various re-categorizations of aircraft, reduced separation between certain
pairs, flying dual glideslope approaches to a single runway, and closely spaced parallel operations.
The dynamic separation rules considered adjusted pair-wise separation rules based on wind and
aircraft characteristics, and time-based separations when strong headwinds are present.
First, the number of aircraft wake categories and its impact on runway capacity was studied. A
new wake-category-generating approach was developed to analyze the impact of increasing the
number of wake categories and the corresponding wake separation matrix size from one to six and
to a pair-wise matrix, without violating any of the minimum separation requirements between
arrival pairs. The results showed that a five or six-category wake separation system can capture
most of the runway capacity benefits in the case of a single, arrivals-only runway scenario. The
five-category separation matrix provided 95.7% of the arrival runway capacity of a 97-by-97
separation matrix. Additionally, the study found that modifying the aircraft wake category
boundaries from the FAA legacy weight classes, based on the U.S. representative fleet mix, and

158
keeping the number of categories the same (five), can lead to a twelve to sixteen percent arrival
runway capacity increase, as shown in Figure 4-11. The impact of local fleet mix-optimized wake
categories on capacity was then investigated. The number of wake categories was kept at five, but
the category boundaries were shifted based on the fleet mix at each of the seven airports, such that
none of the minimum separation requirements between aircraft pairs violated the minimum
separation requirements specified in the pair-wise separation matrix. The locally optimized five-
category separation rules provided up to 2.6% additional arrival capacity over the U.S. wide fleet
mix optimized five-category separation rule.
Table 4-27. Summary of arrival capacity benefits from new wake turbulence separation rules
compared to legacy FAA separation rules (FAA Order 7110.65).
Arrival
Capacity
(Arr/Hr) LGA EWR JFK
SFO
CSPR / Single
Runway
ORD BOS LAX
Legacy
FAA Rule 37.61 35.99 35.4 41.43 36.53 36.75 35.23 36.11
RECAT 1 0% 1.8% 0.9% 0.8% N/A 0.4% 0.7% 1.2%
RECAT 2 N/A N/A N/A N/A N/A N/A N/A 1.3%
PWS EU 28.9% 28.7% 25% N/A 24.4% 26.5% 28.7% 27.2%
PWS-
0.25NM 29.4% 28.9% 25.5% N/A 25.8% 26.9% 29.4% 28.1%
PWS-
0.5NM 29.8% 29.3% 27.7% N/A 26.8% 27.9% 31% 28.6%
PWS-1NM 29.9% 30% 28.8% N/A 27.7% 29.1% 32.1% 30.1%
L-L 2NM 17.1% 8.2% 7.3% 5.5% N/A 12.8% 8.6% 9.7%
Dual G/S N/A 13.7% 11.9% N/A 13.9% 15.5% 15.1% 13.7%
TBS - - - - - - - -
WTMA-P N/A N/A N/A 4.1% N/A N/A N/A N/A
IM-PA N/A N/A N/A 34.7% N/A N/A N/A N/A

159
Continuing with changing wake category boundaries, the impact of re-categorization of aircraft on
airport capacity was evaluated. RECAT Phase 1, a six-category separation system, was tested and
analyzed at the seven case airports. Both the arrival and the departure capacity benefits were
statistically significant at all airports, except at LGA and BOS. At LGA, the fleet mix is dominated
by Large or RECAT category D and E aircraft. The inter-arrival and inter-departure separation
between these pairs remained unchanged in RECAT 1 and therefore runway capacity remained the
same. At BOS, the arrival capacity increase from RECAT 1 was significant, but the new separation
rule had a negative impact on departure capacity (loss of 2.62 departures per hour). 15.1% of the
fleet mix at BOS are Small weight class (RECAT category F) aircraft, which received longer
minimum separations under the RECAT 1 rule. The longer departure separations then led to a loss
of departure capacity.
RECAT Phase 2 was evaluated in two different ways. First, the FAA-proposed seven-aircraft
category system was analyzed at LAX. The resulting runway capacity was 1.3% higher than the
capacity under the FAA legacy separation rule. Second, a preliminary European pair-wise
separation rule was evaluated against the legacy separation rule, which showed a very large
capacity increase, ranging from 24.4% (SFO) to 28.9% (LGA). This large-scale capacity growth
was due to three reasons: the number of wake categories increased to 97 (small but significant
impact), the minimum separation values were reduced (large impact), and many of the arrival pairs
were limited by the runway occupancy time of the lead aircraft (large impact). The resulting airport
capacity benefits presented here are only valid if the minimum wake separations in the preliminary
PWS matrix are safe and feasible to achieve. Evaluating the feasibility of these minimum
separations is outside the scope of this research.
The pair-wise wake separation rule not only increased the mean runway capacity, but it also
reduced the variability in the Monte-Carlo simulation runs, which influence how air traffic
controllers sequence arrival flights. Since every aircraft pair is separated by the minimum possible
pair-wise separation, the sequencing of aircraft has little impact on runway capacity. It should also
be noted that although the estimated capacity benefits from the pair-wise separation are order of

160
magnitude larger than RECAT Phase 1 benefits, the implementation of such a concept can also
more difficult and it can come with many challenges.
Reduced pair-wise wake separation, similar to the proposed RECAT Phase 3 concept, was
evaluated in a parametric study. The capacity benefit pool was analyzed that can be achieved from
a possible reduction of 0.25NM, 0.5NM, or 1NM from the original static pair-wise separation
requirement. This reduction can be made possible by crosswinds, lower aircraft mass, or flying in
various flaps and landing gear configurations that are monitored constantly on approach. Then the
required minimum wake separations can be adjusted dynamically to match those parameters. The
purpose of this study was not to quantify how much of a reduction in separation was possible by
the adjustment of weather and aircraft parameters, but to estimate the potential runway capacity
increase that can be achieved from implementing a dynamic pair-wise rule. The results showed
that the capacity benefits were marginal over the static pair-wise separation rule (assuming that
the values in the pair-wise separation matrix are possible to achieve). Aircraft were already flying
very close to each other, and reducing the separation between them even further was often limited
by runway occupancy times. Since no simultaneous runway occupancy was allowed in the
simulation model, the runway occupancy time of the preceding landing aircraft became the
limitation for runway capacity growth. It was also observed that the throughput variability
(variance and standard deviation) got lower with each reduction step in the minimum separation
values. The variability in the airborne separations became less significant and the variability in
runway occupancy became more significant in influencing runway capacity.
Figure 4-29 shows what percentage of aircraft pairs were limited by runway occupancy time as
wake separations were reduced for the FAA legacy (Order 7110.65W) and preliminary pair-wise
E.U. separation rules. As the current wake separations were reduced by 40%, the number of
runway occupancy limited pairs increased exponentially under the legacy separation rule.
Reducing the static pair-wise separations, however, introduced only a marginal increase in runway
occupancy limited pairs, as most aircraft pairs were already limited by runway occupancy time.

161
Figure 4-29. Runway occupancy as the limiting factor for increasing airport capacity under the current
FAA legacy separation rule and the preliminary pair-wise E.U. separation rule. [D. Sherwood, 2017]
Alternatively, reducing runway occupancy times under the legacy FAA wake separation rule
introduced very little to no arrival capacity benefit, as shown in Figure 4-30. On the other hand,
reducing runway occupancy under the static pair-wise separation rule can increase arrival capacity
even further.
Figure 4-30. Arrival capacity benefit from reducing runway occupancy time under the current FAA
legacy separation rule and the preliminary pair-wise E.U. separation rule. [D. Sherwood, 2017]
0% -10% -20% -30% -40% -50% -60% -70% -80% -90%Reduction in Separations
0
10
20
30
40
50
60
70
80
90
100
Perc
enta
ge o
f RO
T-Li
mite
d C
ases
PWS EULegacy FAA
0% -10% -20% -30% -40% -50% -60% -70% -80% -90%Reduction in ROT
30
40
50
60
70
80
90
Arriv
al T
hrou
ghpu
t (AC
/hr)
PWS EULegacy FAA

162
Runway occupancy can be reduced by introducing new onboard aircraft technologies, such as
Airbus’ Brake To Vacate system - BTV, building new high-speed runway exits, or introducing
incentives for pilots to minimize their time spent on the runway, for instance charging landing fees
as a combination of aircraft weight and runway occupancy time [74].
Runway occupancy time can also become a limitation if the minimum arrival separation between
Large-Large pairs is reduced to 2NM from the current minimum radar separation. Figure 4-22
indicates that LGA would benefit the most (17.1% increase over FAA legacy separation rule) from
this reduced separation rule as the fleet mix is almost all Large weight class aircraft. The benefits
were also significant at the other six airports (at 95% level). This separation rule targets Large
weight class aircraft, which is the most popular weight class in the U.S. (for instance the A320 and
the B737 belong to this category). Therefore, the resulting capacity benefits are directly
proportional to the percentage of Large aircraft in the fleet mix.
Dual glideslope operations introduce a lower and a higher approach path with the same three-
degree glideslope on a single, arrivals-only runway. This new procedure was evaluated at six of
the airports (LGA was not evaluated due to length of runway limitations). The additional capacity
benefits ranged from 11.9% to 15.5% over legacy separation rules. Although the magnitude of
benefits was projected to be large, this approach procedure might increase complexity to pilots and
air traffic controllers compared to a single flow of arrival traffic.
The dynamic wake separation rule considered in this study was time-based separation. Runway
capacity was evaluated for six different headwind speeds from 0kt to 30kt using the standard
distance-based separation rule and the time-based separation rule. It was found that approximately
one arrival movement is lost per hour for every five-knot increase in the headwind speed. When
the separation rule was switched to TBS, runway capacity remained the same as it was before in
the no wind case. Although TBS did not provide additional runway capacity in its current form, it
did help to maintain runway capacity in strong headwind conditions. This means that TBS can
improve reliability and predictability of flight schedules in all weather conditions.

163
Last, two wake separation rules were evaluated for closely-spaced parallel arrivals at SFO airport.
Relaxing the restrictions on the leader aircraft type for reduced diagonal separation between an
arrival on the primary runway and an arrival on the secondary runway significantly reduced
separations. The WTMA-P rule can increase CSPR arrival runway capacity by as much as 4.1%
over the FAA Order 7110.308 separation rule without increasing the complexity of arrival
operations. Furthermore, on-board sensors and weather data can enable paired-arrivals that are
separated even closer than under the previous rules. Paired-arrival separation (IM-PA) has higher
operational and technological requirements than static separation rules, but it can lead to a as much
as 34.7% increase in arrival runway capacity over the FAA Order 7110.308 rule.

164

165
Chapter 5
5 Conclusion
5.1 Research Summary
This doctorate thesis evaluated the impacts of new and emerging wake turbulence separation rules
on runway capacity. To provide accurate and realistic estimates of future runway capacities, the
various airport, airspace, and aircraft components needed to be studied in detail to identify which
of these factors have the strongest and weakest influence on runway capacity, and to identify how
these components interact with one another. The findings of this analysis helped to formulate and
to calibrate a fast-time airport capacity simulation model developed for the purpose of analyzing
a wide range of wake separation concepts. The results showed that runway configuration and
runway geometry, fleet mix, wake separation rules, and wind had the strongest impact on capacity.
Next, a detailed literature review was completed to collect newly proposed and emerging wake
turbulence separation concepts that have the potential to increase runway and airport capacity.
These proposed wake separation concepts fell in the following categories: re-categorization of
aircraft into new wake categories; static reduced-separation concepts for single runway arrivals;
dynamic wake separation concepts incorporating weather information and aircraft flight
parameters; and wake mitigating solutions for closely spaced parallel runways. The first category
(re-categorization) included a six-category separation rule (RECAT Phase 1), a seven-category
system and a pair-wise separation concept (RECAT Phase 2), and parametric study of reduced
pair-wise separations (similar to RECAT Phase 3). Two other single runway concepts were
evaluated: a reduced separation between Large-Large weight class pairs, and dual glideslope
approaches. A time-based separation rule was also studied as a dynamic wake separation concept.
Last, two arrival separation rules were also evaluated for closely spaced parallel approaches:
reduced diagonal separation between pairs of arrivals on primary and secondary runway (WTMA-

166
P), and paired-arrivals (IM-PA). These new wake turbulence separation rules were studied in detail
and their impact on runway capacity was evaluated at seven of the busiest U.S. airports: New York
LaGuardia, Newark, New York J.F. Kennedy, San Francisco, Chicago O’Hare, Boston, and Los
Angeles.
5.2 Practical Implications
This study assessed the potential benefits of new wake turbulence mitigation concepts that can
provide guidance to aviation authorities and air traffic service providers, and that can also describe
the implications of these wake mitigation strategies on runway capacity to airport operators.
First, this research found that although increasing the number of aircraft wake categories (and
hence the size of the separation matrix) can increase runway capacity, the benefits become
marginal with each new category added. The arrival capacity of a single runway was evaluated for
one, two, three, four, five, six, and 97 different aircraft categories. The results showed that a five
or six category wake separation system can capture most of the runway capacity that can be
achieved with a 97-category system. A five-category system provided 95.7% of the 97-category
capacity, and the six-category system provided 96.2% (assuming all other parameters were kept
constant, and no minimum separations were violated). This means that with a careful selection of
wake category boundaries, a five or six-category wake separation system can be established
without the need of a very large-category system that would possibly also require additional
computer tools for air traffic controllers.
Second, the study investigated the impacts of shifting wake category boundaries while keeping the
number of categories constant. Since many new aircraft types have entered service in recent years,
many older aircraft types have retired, and the composition of the fleet mix has also changed (e.g.
larger regional jets and narrow body jets), reviewing the legacy FAA wake category boundaries
can influence runway capacity. The study showed that a five-category wake separation system
tailored to the U.S. representative fleet mix can provide up to 4.9% additional arrival runway

167
capacity compared to the FAA legacy wake category boundaries. Moreover, fleet mixes can vary
from airport to airport. The study investigated the possibility of introducing five-category wake
separation rules tailored to each of the selected seven test case airports. By shifting the wake
category boundaries based on local fleet mixes, up to 2.6% extra runway capacity can be gained
over the categories based on the national fleet mix. These results demonstrate that airport-specific
wake separation rules (tailored to local fleet mix) can provide significant runway capacity benefits
over a one separation rule-fits-all system, which can already be seen in the U.S. and in Europe.
For instance, the RECAT Phase 1 separation rule in the U.S. originated in Memphis, and hence
was motivated by local FedEx cargo operations, while the RECAT Phase 2 separation rule in the
Southern California TRACON created seven aircraft categories based on the local fleet mix (FAA
Order 7110.123) [63].
The arrival capacity benefits from the above mentioned two concepts (U.S. fleet mix and local
fleet mix tailored five-categories) are shown in the right-side columns of Figure 5-1. Both rules
have five aircraft wake categories, but their boundaries shift based on fleet mix. The corresponding
minimum separations are based on preliminary E.U. static pair-wise separations.
Figure 5-1. Summary of arrival capacity benefits from studied and proposed wake separation rules.
[Benefits shown over legacy FAA Order 7110.65W rule.]
168
Looking at new wake turbulence separation specific results, the study showed that RECAT Phase
1 rules can increase capacity over the legacy FAA separation rules. Most of the RECAT Phase 1
benefits are achieved through reducing the longer wake separation values. The airports that benefit
the most from this rule are the ones with many lower-Heavy or Category C aircraft (Boeing 767,
MD11, etc.). There were two airports where RECAT Phase 1 benefits were not seen. At
LaGuardia, the fleet mix is over 99% Large weight class aircraft, which receive the same
separations under RECAT Phase 1 as before. In Boston, a significant portion (15.1%) of the fleet
mix is Small weight class aircraft. These aircraft are separated by longer intervals under RECAT
Phase 1 than before, which can have an adverse impact on departure capacity. This can be avoided
if these Small aircraft operate independently on other runways or if the operations are cancelled in
bad weather, causing the fleet mix composition to change. The results also showed that reducing
wake separations further from current standards, under the pair-wise separation rule or the Large-
Large 2NM separation rule, can shift the operational bottleneck from the approach path to the
runway, as runway occupancy time became the limiting factor for inter-arrival separation. The
study also found that dual glideslope operations and paired arrivals can increase runway capacity
by much larger magnitudes. However, these concepts are much more challenging to implement
due to higher technology requirements and air traffic infrastructure advancements. Future cost-
benefit studies will need to be evaluated to determine the cost of implementation for such ATM
infrastructure investments. Some of these concepts also assume very short minimum separations
that require short runway occupancy times, which can be challenging to achieve outside the
simulation environment. Last, a dynamic wake separation concept was studied. The time-based
separation rule, which is designed to recover lost capacity due to strong headwinds, led to
significant impacts. Arrival capacity dropped by about one arrival per hour for every five-knot
increase in the headwind speed. Since most runways are designed to face into the most common
local wind direction, time-based separation can be of great value to increase operational reliability
and capacity predictability at airports.
A reduced pair-wise wake separation concept was also considered, similar to the proposed RECAT
Phase 3 rule, that proposes dynamically adjusted pair-wise separations based on weather and
aircraft parameters. The study found that a reduction of minimum separation by 0.25NM, 0.5NM,

169
and 1NM compared to the static pair-wise separation matrix can increase arrival runway capacity
by up to 3% (JFK) over the capacity enabled by the static pair-wise separation rule. Even though
the reductions in separations enabled by dynamic conditions are large, the added airport capacity
benefits are relatively small as more and more aircraft pairs are limited by runway occupancy time.
Some of the implementation issues for each of these new wake separation rules were also
discussed. Static separation rules are usually less challenging to implement than dynamic
separation rules. For example, RECAT 1, RECAT 2 (seven-category system), and the reduced
Large-Large separation rule only require slight modifications to existing separation rules, such as
updating certain values in the separation matrix, or creating one or two new aircraft categories.
Dynamic separation rules require accurate wind monitoring and forecasting, as well as onboard
technologies (IM-PA) for implementation. Other issues, such as controller and pilot workload, also
need to be considered. For instance, the dual-glideslope procedure may require more interaction
between controllers and crews and more precise monitoring of the final approach. Human-in-the-
loop simulation should be evaluated with all stakeholders involved to predict any operational
complications that may arise. Frankfurt airport tried a high approach landing system with dual
threshold operations that did not deliver capacity benefits, and hence the procedure was abandoned
and the system was uninstalled.
Last, the obtained airport capacity estimates from new separation rules create opportunities for
optimization. Since wake turbulence separation rules have a strong impact on airport capacity, they
also have a strong influence on many other air traffic management decisions. As it was mentioned
earlier, arrival and departure capacity are key input parameters for predicting future runway
configurations, optimizing airport capacity utilization, or analyzing flow management problems.
Furthermore, runway scheduling and aircraft sequencing decisions aim to minimize delays and
maximize throughput. With some of the new wake separation rules, such as the pair-wise
separation concept, all consecutive pairs of arrivals are flying at their minimum separation, and
hence the nature of arrival sequencing decisions can change from previous methods.

170
5.3 Future Work
Several potential future research areas have been identified to continue and extend the work
presented in this thesis. The first area for future work focuses on the fast-time runway capacity
simulation model. As explained earlier, one of the current limitations of the simulation model is
that it can only handle one-and two-runway configurations: single runway operations, intersecting
runways, and closely spaced parallel runways. The number of configurations could be extended to
include diverging/converging runway geometries and medium-spaced parallel runways. Once that
configuration is added, the next step can be to superimpose various configurations, which would
enable the evaluation of complex airfield capacities. Additionally, runway usage restrictions can
be implemented in the model to increase the realism of the simulation environment. For instance,
certain runways at airports are restricted to propeller aircraft or small aircraft. Implementing such
a rule would be a simple, but valuable addition to the existing framework.
As continuation of this work, the capacity envelopes obtained from the simulation model for the
various wake turbulence separation rules could be used as input parameters for evaluating delays.
Airport capacity and delays together provide valuable information to air traffic controllers,
authorities, and airport planners. Delays can also be used as capacity indicators for on-time
performance of an airport, which can be helpful in cost-benefit studies for evaluating investments
in airport or air traffic infrastructure.
Cost-benefit studies have been mentioned earlier in this study. The capacity results obtained here
present estimates of the benefits that can be achieved from new wake turbulence mitigation
strategies. To expand on this work, the cost of required technological investments that would
enable the use of some of the advanced wake separation rules, could also be evaluated. Dynamic
wake separation rules, for example, require weather and wind sensing capabilities, communication
between aircraft pairs and air traffic control, and new controller tools that come with significant
financial investment. The cost of these investments could be evaluated against the additional
capacity that can be gained. Another cost-benefit analysis would compare runway capacity benefits

171
to the complexity of these new wake separation rules. Human-in-the-loop experiments could be
conducted to measure controller and pilot workload, and to receive feedback from users.

172

173
References [1] Federal Aviation Administration, “Aviation System Performance Metrics (ASPM),” 2016.
[Online]. Available: https://aspm.faa.gov/apm/sys/main.asp.
[2] R. A. De Neufville and A. R. Odoni, Airport Systems: Planning, Design, and Management,
2nd ed. McGraw-Hill, 2013.
[3] Airports Commission, “Airports Commission: Final Report,” 2015.
[4] R. de Neufville and A. Odoni, Airport Systems: Planning, Design, and Management.
McGraw-Hill Professional, 2003.
[5] A. Blumstein, “The Landing Capacity of a Runway,” Oper. Res., vol. 7, no. 6, pp. 752–763,
Nov. 1959.
[6] R. M. Harris, “Models for Runway Capacity Analysis,” MITRE Corp. Techn. Rep., p. 129,
1972.
[7] A. R. Odoni, “An Analytical Investigation of Air Traffic In the Vicinity of Terminal Areas.”
1969.
[8] D. A. Lee, P. F. Kostiuk, R. V. . J. Hemm, E. R. . I. Wingrove, and G. Shapiro, “Estimating
the Effects of the Terminal Area Productivity Program,” 1997.
[9] M. A. Stamatopoulos, K. G. Zografos, and A. R. Odoni, “A decision support system for
airport strategic planning,” Transp. Res. Part C Emerg. Technol., vol. 12, no. 2, pp. 91–117,
2004.
[10] E. P. Gilbo, “Airport capacity: representation, estimation, optimization,” IEEE Trans.
Control Syst. Technol., vol. 1, no. 3, pp. 144–154, 1993.
[11] I. Simaiakis, “Analysis, modeling and control of the airport departure process,” 2013.
[12] W. E. Weiss and J. N. Barrer, “Analysis of Runway Occupancy Time and Separation Data
Collected at La Guardia, Boston, and Newark Airports,” Dec. 1984.
[13] B. Levy, J. Legge, and M. Romano, “Opportunities for improvements in simple models for
estimating runway capacity,” in The 23rd Digital Avionics Systems Conference (IEEE Cat.
No.04CH37576), vol. 1, p. 2.E.5-21-12.
[14] B. G. Jeddi, J. F. Shortle, and L. Sherry, “Statistics of the Approach Process at Detroit
Metropolitan Wayne County Airport,” 2nd ICRAT Conf., no. 703, pp. 1–8, 2006.

174
[15] V. Kumar and L. Sherry, “Runway Occupancy Time Extraction and Analysis Using Surface
Track Data,” 2009.
[16] T. Kolos-Lakatos, “The influence of runway occupancy time and wake vortex separation
requirements on runway throughput,” 2013.
[17] S. Zelinski, “Benefits of precision scheduling and spacing for arrival operations,” J. Aircr.,
2013.
[18] A. R. Odoni et al., “Existing and Required Modeling Capabilities for Evaluating ATM
Systems and Concepts,” NASA Contract. Rep., Mar. 1997.
[19] M. Bazargan, K. Fleming, and P. Subramanian, “A simulation study to investigate runway
capacity using TAAM,” in Proceedings of the Winter Simulation Conference, 2003, vol. 2,
pp. 1235–1243.
[20] P. CHOROBA, “Comprehensive study of the wake vortex phenomena to the assessment of
its incorporation to ATM for safety and capacity improvements,” 2006.
[21] Federal Aviation Administration and MITRE, “runwaySimulator Airport Capacity Model
– Airports,” 2015. [Online]. Available:
https://www.faa.gov/airports/planning_capacity/runwaysimulator/.
[22] Airport Cooperative Research Program, “Evaluating Airfield Capacity,” Transportation
Research Board, Washington, D.C., Dec. 2012.
[23] V. Ramanujam and H. Balakrishnan, “Data-Driven Modeling of the Airport Configuration
Selection Process.”
[24] Avery, Jacob, Balakrishnan, and Hamsa, “Data-Driven Modeling and Prediction of the
Process for Selecting Runway Configurations,” Transp. Res. Rec. J. Transp. Res. Board,
no. 2600, pp. 1–11, 2016.
[25] D. Bertsimas, M. Frankovich, and A. Odoni, “Optimal Selection of Airport Runway
Configurations,” Oper. Res., vol. 59, no. 6, pp. 1407–1419, Dec. 2011.
[26] A. Jacquillat, A. R. Odoni, and M. D. Webster, “Dynamic Control of Runway
Configurations and of Arrival and Departure Service Rates at JFK Airport Under Stochastic
Queue Conditions,” Transp. Sci., p. trsc.2015.0644, Jun. 2016.
[27] A. R. Odoni, “The Flow Management Problem in Air Traffic Control,” in Flow Control of
Congested Networks, Berlin, Heidelberg: Springer Berlin Heidelberg, 1987, pp. 269–288.

175
[28] O. Richetta and A. R. Odoni, “Solving Optimally the Static Ground-Holding Policy
Problem in Air Traffic Control,” Transp. Sci., vol. 27, no. 3, pp. 228–238, Aug. 1993.
[29] O. Richetta and A. R. Odoni, “Dynamic solution to the ground-holding problem in air traffic
control,” Transp. Res. Part A Policy Pract., vol. 28, no. 3, pp. 167–185, 1994.
[30] P. B. Vranas, D. J. Bertsimas, and A. R. Odoni, “The Multi-Airport Ground-Holding
Problem in Air Traffic Control,” Oper. Res., vol. 42, no. 2, pp. 249–261, Apr. 1994.
[31] D. Bertsimas and S. S. Patterson, “The Air Traffic Flow Management Problem with Enroute
Capacities,” Oper. Res., vol. 46, no. 3, pp. 406–422, Jun. 1998.
[32] D. Bertsimas, G. Lulli, and A. Odoni, “An Integer Optimization Approach to Large-Scale
Air Traffic Flow Management,” Oper. Res., vol. 59, no. 1, pp. 211–227, 2011.
[33] R. Dear, “The dynamic scheduling of aircraft in the near terminal area,” Cambridge, Mass.,
1976.
[34] H. Balakrishnan and B. G. Chandran, “Algorithms for scheduling runway operations under
constrained position shifting,” Oper. Res., vol. 58, no. 6, 2010.
[35] G. Solveling, S. Solak, J.-P. Clarke, and E. Johnson, “Runway Operations Optimization in
the Presence of Uncertainties,” J. Guid. Control. Dyn., vol. 34, no. 5, pp. 1373–1382, Sep.
2011.
[36] V. Vaze and C. Barnhart, “An assessment of the impact of demand management strategies
for efficient allocation of airport capacity,” Int. J. Revenue Manag., vol. 6, no. 1/2, p. 5,
2012.
[37] A. Jacquillat, “Integrated allocation and utilization of airport capacity to mitigate air traffic
congestion,” 2015.
[38] F. H. Proctor, D. W. Hamilton, and J. Han, “Wake Vortex Transport and Decay in Ground
Effect: Vortex Linking with the Ground,” 2000.
[39] F. Holzäpfel, T. Hofbauer, D. Darracq, H. Moet, F. Garnier, and C. Ferreira Gago, “Analysis
of wake vortex decay mechanisms in the atmosphere Analyse der Zerfallsmechanismen von
Wirbelschleppen in der Atmosphäre,” Aerosp. Sci. Technol., vol. 7, no. 7, pp. 263–275,
2003.
[40] F. H. Proctor, N. Ahmad, G. S. Switzer, and F. Limon Duparcmeur, “Three-Phased Wake
Vortex Decay,” 2010.

176
[41] Federal Aviation Administration, ATC, Order JO 7110.65t. 2010.
[42] Federal Aviation Administration, “JO 7110.608 Guidance for the Implementation of Wake
Turbulence Recategorization Separation Standards at Memphis International Airport,”
2013.
[43] J. Cheng, J. Tittsworth, W. Gallo, and A. Awwad, “The Development of Wake Turbulence
Re-Categorization in the United States,” 2016.
[44] NATS Services, “Aeronautical Information Circular P 001/2015,” 2015.
[45] C. Morris, J. Peters, and P. Choroba, “Validation of the Time Based Separation Concept at
London Heathrow Airport,” Eur. Air Traffic Manag. Res. Dev. Semin., 2013.
[46] F. Holzaepfel, “Aircraft Wake Vortex State-of-the-Art & Research Needs.”
[47] National Research Council, Wake Turbulence: An Obstacle to Increased Air Traffic
Capacity. Washington, D.C.: National Academies Press, 2008.
[48] Federal Aviation Administration and U.S. Department of Transportation, “FAA JO Order
7110.65W, Air Traffic Control,” Air Traffic Organ. Policy, 2015.
[49] “OEP 35 - ASPMHelp.” [Online]. Available: http://aspmhelp.faa.gov/index.php/OEP_35.
[50] Heathrow Airport, “A380 Operational Information.”
[51] Flight Safety Foundation, “Tool Kit FSF ALAR Briefing Note 4.1 — Descent-and-
approach Profile Management,” Flight Saf. Dig., no. August-November, 2000.
[52] U.S. Department of Transportation and Federal Aviation Administration, “Simultaneous
Dependent Approaches to Closely Spaced Parallel Runways Order JO7110.308,” 2015.
[53] Federal Aviation Administration, “NextGen – NextGen Tool Helps Aircraft Stay the
Course, ATPA,” 2013. [Online]. Available:
https://www.faa.gov/nextgen/snapshots/stories/?slide=19.
[54] Federal Aviation Administration, “Airport Capacity Profiles – Airports,” 2016. [Online].
Available: https://www.faa.gov/airports/planning_capacity/profiles/.
[55] M. Ballin and H. Erzberger, “An analysis of landing rates and separations at the Dallas/Fort
Worth International Airport,” 1996, no. July.
[56] S. J. Zelinski, “Benefits of Precision Scheduling and Spacing for Arrival Operations,” J.
Aircr., vol. 50, no. 6, pp. 1923–1932, Nov. 2013.
[57] Federal Aviation Administration and U.S. Department of Transportation, “Order

177
7110.308A Simultaneous Dependent Approaches to Closely Spaced Parallel Runways,”
2015.
[58] J. Cheng, “WTMA-P Order Approval Status and Next Steps,” Chicago, 2015.
[59] Federal Aviation Administration, “Satellite Navigation - NAS Implementation,” 2014.
[Online]. Available:
https://www.faa.gov/about/office_org/headquarters_offices/ato/service_units/techops/navs
ervices/gnss/nas/procedures/rnav_rnp/.
[60] United States Department of Transportation and Bureau of Transportation Statistics, “Table
4 Ranking of Major Airport On-Time Arrival Performance Year-to-date through December
2015 | Bureau of Transportation Statistics,” 2016. [Online]. Available:
https://www.rita.dot.gov/bts/subject_areas/airline_information/airline_ontime_tables/2015
_12/table_04.
[61] Federal Aviation Administration, “JO 7110.659C - Wake Turbulence Recategorization,”
2016.
[62] Federal Aviation Administration, “FAA Aircraft Wake Turbulence Re-Categorization
(RECAT) Phase II Implementation within Southern California Terminal Radar Approach
Control (TRACON) airspace,” 2016.
[63] Federal Aviation Administration, “ORDER JO 7110.123,” 2016.
[64] J. Robinson, O. Diallo, and R. J. Reisman, “Comparison of Trajectory Synthesis Algorithms
for Monitoring Final Approach Compression,” 2011.
[65] M. Koch and A. Elessawy, “Wake Turbulence Mitigation Single Runway ( WTMSR ),”
WakeNet USA, pp. 1–21, 2015.
[66] W. Weiss, C. Roberts, and W. Swedish, “Status of Airport Capacities for GBAS-Enabled
Dual-Glideslope Approaches.” Center for Advanced Aviation System Development, The
MITRE Corporation, 2016.
[67] National Air Traffic Services, “Time Based Separation - NATS.” [Online]. Available:
http://www.nats.aero/tbs/. [Accessed: 21-Feb-2017].
[68] Eurocontrol, “Time Based Separation | Eurocontrol.” [Online]. Available:
http://www.eurocontrol.int/service/time-based-separation. [Accessed: 31-Jan-2017].
[69] P. Strande, “WTMA-S / RG and Paired Approach Concepts,” 2016.

178
[70] M. Koch, “WTMA-S Evolution,” Chicago, 2015.
[71] Federal Aviation Administration, “Calendar Year 2015 Revenue Enplanements at
Commercial Service Airports,” 2016.
[72] U.S. Department of Transportation and Federal Aviation Administration, “InFO 16016:
Wake Turbulence Aircraft Re-Categorization (RECAT) Phase II Key Site Implementation
at Southern California (SoCal) Terminal Radar Control (TRACON) and follow-on
locations,” 2016.
[73] S. Wendenberg, “An Airport View on Wake Vortex Separation at FRA and its Affect on
Capacity - Today and in the Future,” London, 2011.
[74] Airbus, “Brake to Vacate | Airbus, a leading aircraft manufacturer.” [Online]. Available:
http://www.airbus.com/innovation/proven-concepts/in-operations/brake-to-vacate/.
[Accessed: 28-Dec-2016].