A Sustainability Assessment of Bioethanol (EtOH) Production
23
sustainability Article A Sustainability Assessment of Bioethanol (EtOH) Production: The Case of Cassava in Colombia Claudia Pabon-Pereira 1, * , Maja Slingerland 2 , Sanna Hogervorst 3 , Jules van Lier 4 and Rudy Rabbinge 5 1 Faculty of Engineering and Sciences, Universidad Adolfo Ibáñez, Santiago 7910000, Chile 2 Plant Production Systems group, Wageningen University and Research, 6708 PB Wageningen, The Netherlands 3 Sub-department of Environmental Technology, Agrotechnology & Food Sciences, Wageningen University and Research, 6708 PB Wageningen, The Netherlands 4 Section Sanitary Engineering, Department of Water Management, Delft University of Technology, 2628 CN Delft, The Netherlands 5 Sustainable Development & Food Security, Wageningen University and Research, 6700 AK Wageningen, The Netherlands * Correspondence: [email protected] Received: 29 May 2019; Accepted: 15 July 2019; Published: 22 July 2019 Abstract: This paper shows how system design determines sustainability outcomes of cassava bioethanol production in Colombia. The recovery of the energy contained in by-products is recommended as compared to single product production. In particular, this study assesses the energy, greenhouse gases, water, and land use performance of alternative cassava cascades working at different scales, highlighting the implications of including anaerobic digestion technology in the chain. The centralized systems showed a poorer energy and greenhouse gases performance as compared to decentralized ones in part due to the artificial drying of cassava chips in the centralized facility. Under solar drying of cassava chips, systems with anaerobic digestion produced three to five times more energy than demanded and produced greenhouse gas savings of 0.3 kgCO 2eq L EtOH -1 . The water balance output depends upon the water reuse within the ethanol industry, which demands 21–23 L EtOH -1 . In the anaerobic digestion scenarios, assuming liquid flows are treated separately, complete water recovery is feasible. Land use for cassava cultivation was calculated to be 0.27–0.35 ha tEtOH -1 . The energy and water content of the material to digest, the options for digestate reuse, and the recovery of the methane produced are major considerations substantially influencing the role of anaerobic digestion within cassava cascade configurations. Keywords: cassava; bioethanol; energy crops; sustainability analysis; biofuels; bioenergy production 1. Introduction Cassava is a tropical root crop mainly grown in Africa, Asia, and Latin America. It is the fifth staple food in the world after rice, wheat, maize, and potatoes, being a basic component of the diet of a billion people [1]. As it takes at least 8 months of warm weather to produce a harvestable root, cassava is mostly grown in tropical regions. In Latin America, about 12% of the world’s cassava production takes place in about 11.5% of the world’s cassava cultivated area [1]. Traditionally, cassava is cultivated by small-scale farmers who use it as a food crop. However, cassava is also used as animal fodder, for the industrial production of starch, gums, adhesives, and it is also considered an attractive crop for the production of ethanol. In Colombia, cassava’s main use has been domestic consumption (70.5%), followed by fresh animal feed (18.4%), dry cassava for concentrated feed (4.1%), bitter starch (2.2%), and sweet starch (1.8%) [2]. Sustainability 2019, 11, 3968; doi:10.3390/su11143968 www.mdpi.com/journal/sustainability
-
Upload
khangminh22 -
Category
Documents
-
view
0 -
download
0
Transcript of A Sustainability Assessment of Bioethanol (EtOH) Production
sustainability
Article
A Sustainability Assessment of Bioethanol (EtOH)Production: The Case of Cassava in Colombia
Claudia Pabon-Pereira 1,* , Maja Slingerland 2, Sanna Hogervorst 3, Jules van Lier 4 andRudy Rabbinge 5
1 Faculty of Engineering and Sciences, Universidad Adolfo Ibáñez, Santiago 7910000, Chile2 Plant Production Systems group, Wageningen University and Research, 6708 PB Wageningen,
The Netherlands3 Sub-department of Environmental Technology, Agrotechnology & Food Sciences,
Wageningen University and Research, 6708 PB Wageningen, The Netherlands4 Section Sanitary Engineering, Department of Water Management, Delft University of Technology,
2628 CN Delft, The Netherlands5 Sustainable Development & Food Security, Wageningen University and Research, 6700 AK Wageningen,
The Netherlands* Correspondence: [email protected]
Received: 29 May 2019; Accepted: 15 July 2019; Published: 22 July 2019�����������������
Abstract: This paper shows how system design determines sustainability outcomes of cassavabioethanol production in Colombia. The recovery of the energy contained in by-products isrecommended as compared to single product production. In particular, this study assesses theenergy, greenhouse gases, water, and land use performance of alternative cassava cascades workingat different scales, highlighting the implications of including anaerobic digestion technology inthe chain. The centralized systems showed a poorer energy and greenhouse gases performance ascompared to decentralized ones in part due to the artificial drying of cassava chips in the centralizedfacility. Under solar drying of cassava chips, systems with anaerobic digestion produced three to fivetimes more energy than demanded and produced greenhouse gas savings of 0.3 kgCO2eq L EtOH−1.The water balance output depends upon the water reuse within the ethanol industry, which demands21–23 L EtOH−1. In the anaerobic digestion scenarios, assuming liquid flows are treated separately,complete water recovery is feasible. Land use for cassava cultivation was calculated to be 0.27–0.35 hatEtOH−1. The energy and water content of the material to digest, the options for digestate reuse, andthe recovery of the methane produced are major considerations substantially influencing the role ofanaerobic digestion within cassava cascade configurations.
Keywords: cassava; bioethanol; energy crops; sustainability analysis; biofuels; bioenergy production
1. Introduction
Cassava is a tropical root crop mainly grown in Africa, Asia, and Latin America. It is the fifthstaple food in the world after rice, wheat, maize, and potatoes, being a basic component of the diet of abillion people [1]. As it takes at least 8 months of warm weather to produce a harvestable root, cassavais mostly grown in tropical regions. In Latin America, about 12% of the world’s cassava productiontakes place in about 11.5% of the world’s cassava cultivated area [1].
Traditionally, cassava is cultivated by small-scale farmers who use it as a food crop. However,cassava is also used as animal fodder, for the industrial production of starch, gums, adhesives, andit is also considered an attractive crop for the production of ethanol. In Colombia, cassava’s mainuse has been domestic consumption (70.5%), followed by fresh animal feed (18.4%), dry cassava forconcentrated feed (4.1%), bitter starch (2.2%), and sweet starch (1.8%) [2].
Sustainability 2019, 11, 3968; doi:10.3390/su11143968 www.mdpi.com/journal/sustainability
Sustainability 2019, 11, 3968 2 of 23
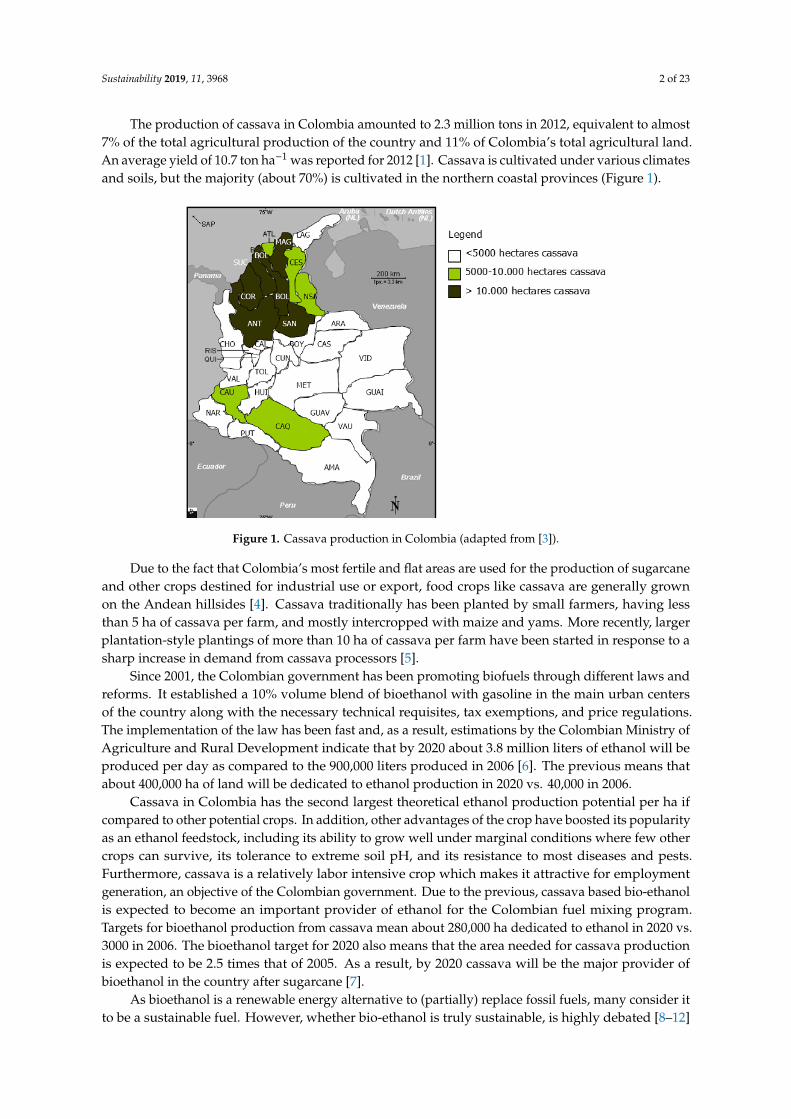
The production of cassava in Colombia amounted to 2.3 million tons in 2012, equivalent to almost7% of the total agricultural production of the country and 11% of Colombia’s total agricultural land.An average yield of 10.7 ton ha−1 was reported for 2012 [1]. Cassava is cultivated under various climatesand soils, but the majority (about 70%) is cultivated in the northern coastal provinces (Figure 1).
Sustainability 2019, 11, x FOR PEER REVIEW 2 of 24
The production of cassava in Colombia amounted to 2.3 million tons in 2012, equivalent to almost 7% of the total agricultural production of the country and 11% of Colombia’s total agricultural land. An average yield of 10.7 ton ha-1 was reported for 2012 [1]. Cassava is cultivated under various climates and soils, but the majority (about 70%) is cultivated in the northern coastal provinces (Figure 1).
Figure 1. Cassava production in Colombia (adapted from [3]).
Due to the fact that Colombia’s most fertile and flat areas are used for the production of sugarcane and other crops destined for industrial use or export, food crops like cassava are generally grown on the Andean hillsides [4]. Cassava traditionally has been planted by small farmers, having less than 5 ha of cassava per farm, and mostly intercropped with maize and yams. More recently, larger plantation-style plantings of more than 10 ha of cassava per farm have been started in response to a sharp increase in demand from cassava processors [5].
Since 2001, the Colombian government has been promoting biofuels through different laws and reforms. It established a 10% volume blend of bioethanol with gasoline in the main urban centers of the country along with the necessary technical requisites, tax exemptions, and price regulations. The implementation of the law has been fast and, as a result, estimations by the Colombian Ministry of Agriculture and Rural Development indicate that by 2020 about 3.8 million liters of ethanol will be produced per day as compared to the 900,000 liters produced in 2006 [6]. The previous means that about 400,000 ha of land will be dedicated to ethanol production in 2020 vs. 40,000 in 2006.
Cassava in Colombia has the second largest theoretical ethanol production potential per ha if compared to other potential crops. In addition, other advantages of the crop have boosted its popularity as an ethanol feedstock, including its ability to grow well under marginal conditions where few other crops can survive, its tolerance to extreme soil pH, and its resistance to most diseases and pests. Furthermore, cassava is a relatively labor intensive crop which makes it attractive for employment generation, an objective of the Colombian government. Due to the previous, cassava based bio-ethanol is expected to become an important provider of ethanol for the Colombian fuel mixing program. Targets for bioethanol production from cassava mean about 280,000 ha dedicated to ethanol in 2020 vs. 3000 in 2006. The bioethanol target for 2020 also means that the area needed for cassava production is expected to be 2.5 times that of 2005. As a result, by 2020 cassava will be the major provider of bioethanol in the country after sugarcane [7].
As bioethanol is a renewable energy alternative to (partially) replace fossil fuels, many consider it to be a sustainable fuel. However, whether bio-ethanol is truly sustainable, is highly debated [8–12] and depends upon several environmental, economic, and societal considerations. Main issues of
Figure 1. Cassava production in Colombia (adapted from [3]).
Due to the fact that Colombia’s most fertile and flat areas are used for the production of sugarcaneand other crops destined for industrial use or export, food crops like cassava are generally grownon the Andean hillsides [4]. Cassava traditionally has been planted by small farmers, having lessthan 5 ha of cassava per farm, and mostly intercropped with maize and yams. More recently, largerplantation-style plantings of more than 10 ha of cassava per farm have been started in response to asharp increase in demand from cassava processors [5].
Since 2001, the Colombian government has been promoting biofuels through different laws andreforms. It established a 10% volume blend of bioethanol with gasoline in the main urban centersof the country along with the necessary technical requisites, tax exemptions, and price regulations.The implementation of the law has been fast and, as a result, estimations by the Colombian Ministry ofAgriculture and Rural Development indicate that by 2020 about 3.8 million liters of ethanol will beproduced per day as compared to the 900,000 liters produced in 2006 [6]. The previous means thatabout 400,000 ha of land will be dedicated to ethanol production in 2020 vs. 40,000 in 2006.
Cassava in Colombia has the second largest theoretical ethanol production potential per ha ifcompared to other potential crops. In addition, other advantages of the crop have boosted its popularityas an ethanol feedstock, including its ability to grow well under marginal conditions where few othercrops can survive, its tolerance to extreme soil pH, and its resistance to most diseases and pests.Furthermore, cassava is a relatively labor intensive crop which makes it attractive for employmentgeneration, an objective of the Colombian government. Due to the previous, cassava based bio-ethanolis expected to become an important provider of ethanol for the Colombian fuel mixing program.Targets for bioethanol production from cassava mean about 280,000 ha dedicated to ethanol in 2020 vs.3000 in 2006. The bioethanol target for 2020 also means that the area needed for cassava productionis expected to be 2.5 times that of 2005. As a result, by 2020 cassava will be the major provider ofbioethanol in the country after sugarcane [7].
As bioethanol is a renewable energy alternative to (partially) replace fossil fuels, many consider itto be a sustainable fuel. However, whether bio-ethanol is truly sustainable, is highly debated [8–12]

Sustainability 2019, 11, 3968 3 of 23
and depends upon several environmental, economic, and societal considerations. Main issues ofconcern are the net energy balance of the whole production chain; the overall Greenhouse gases (GHG)(Abbreviations are presented in Table S1) mitigation potential; the competition for resources like landand water, which in turn potentially threaten food security and biodiversity; the large quantities ofby-products generated which can lead to substantial pollution; the air pollutant emissions of ethanolenriched gasoline; the GHG emissions associated with land conversion, and numerous social andeconomic considerations including human rights, property rights, income distribution, governance,and social structures, among others.
So far, no detailed analysis of the environmental implications of bioethanol production fromcassava in Colombia has been conducted. Furthermore, whereas other studies on bioethanol productionfrom cassava in Thailand and China [13–15] have included the anaerobic digestion step within theassumptions, no detailed description of the technological choices and analysis of its implicationshave been presented. The present study attempts to cover these knowledge gaps by analyzing thesustainability implications of bioethanol production from cassava in Colombia with two systemconfigurations, i.e., centralized and decentralized, emphasizing the role of anaerobic digestion (AD) toimprove sustainability of currently planned bioethanol production.
The indicators covered by this study belong to the environmental sustainability compartment,including energy balance, GHG balance, water, and land use. These indicators have been highlightedas most relevant in the analysis of environmental sustainability of bioenergy systems and/or biomasscascades [10,16–21]. In addition, they are most likely to be impacted by the addition of the anaerobicdigestion step [13,22–24].
2. Methodology
2.1. Goal and Scope Definition
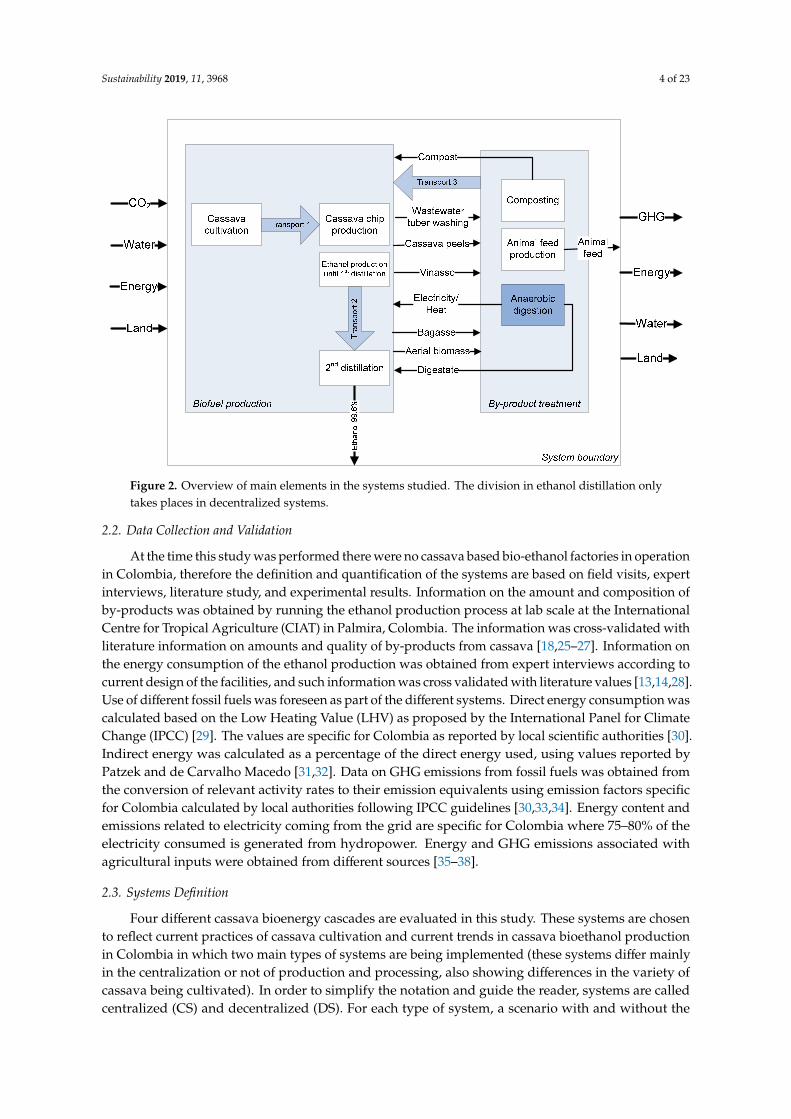
The goal of this study is to assess the energy performance, GHG emissions, water, and land useof alternative cassava cascades for bioethanol production working at different scales, highlightingthe implications of including an anaerobic digestion step in the cascade. Complete balances wereperformed including cassava biomass, carbon, energy, nutrients, and water following the flows andtransformation processes in each system. The study comprises the raw materials production, theirconversion into bioethanol, and the end-use of by-products. Emphasis is placed on flows relatedto the cultivation and processing of the cassava, including relevant transportation. Carbon flowsassociated with the uptake and release of atmospheric carbon during photosynthesis and oxidationof the (intermediate) products as well as those related to change in land use are included in thecalculations. N2O emissions from fertilization are also covered. Flows related to the construction ofthe facilities and transport of the fuels for final use are not included because of the difficulty in theirquantification plus their claimed minor contribution to ethanol energy balances [12]. The systemsboundary, main process units, and flows are presented in Figure 2. For comparability of results, thefunctional unit is the production of 100,000 liters fuel ethanol per day, which is about 6% of the expectedethanol production from cassava in Colombia for the year 2020.
Sustainability 2019, 11, 3968 4 of 23Sustainability 2019, 11, x FOR PEER REVIEW 4 of 24
Figure 2. Overview of main elements in the systems studied. The division in ethanol distillation only takes places in decentralized systems.
2.2. Data Collection and Validation
At the time this study was performed there were no cassava based bio-ethanol factories in operation in Colombia, therefore the definition and quantification of the systems are based on field visits, expert interviews, literature study, and experimental results. Information on the amount and composition of by-products was obtained by running the ethanol production process at lab scale at the International Centre for Tropical Agriculture (CIAT) in Palmira, Colombia. The information was cross-validated with literature information on amounts and quality of by-products from cassava [18,25–27]. Information on the energy consumption of the ethanol production was obtained from expert interviews according to current design of the facilities, and such information was cross validated with literature values [13,14,28]. Use of different fossil fuels was foreseen as part of the different systems. Direct energy consumption was calculated based on the Low Heating Value (LHV) as proposed by the International Panel for Climate Change (IPCC) [29]. The values are specific for Colombia as reported by local scientific authorities [30]. Indirect energy was calculated as a percentage of the direct energy used, using values reported by Patzek and de Carvalho Macedo [31,32]. Data on GHG emissions from fossil fuels was obtained from the conversion of relevant activity rates to their emission equivalents using emission factors specific for Colombia calculated by local authorities following IPCC guidelines [30,33,34]. Energy content and emissions related to electricity coming from the grid are specific for Colombia where 75%–80% of the electricity consumed is generated from hydropower. Energy and GHG emissions associated with agricultural inputs were obtained from different sources [35–38].
2.3. Systems Definition
Four different cassava bioenergy cascades are evaluated in this study. These systems are chosen to reflect current practices of cassava cultivation and current trends in cassava bioethanol production in Colombia in which two main types of systems are being implemented (these systems differ mainly in the centralization or not of production and processing, also showing differences in the variety of cassava being cultivated). In order to simplify the notation and guide the reader, systems are called centralized (CS) and decentralized (DS). For each type of system, a scenario with and without the
Figure 2. Overview of main elements in the systems studied. The division in ethanol distillation onlytakes places in decentralized systems.
2.2. Data Collection and Validation
At the time this study was performed there were no cassava based bio-ethanol factories in operationin Colombia, therefore the definition and quantification of the systems are based on field visits, expertinterviews, literature study, and experimental results. Information on the amount and composition ofby-products was obtained by running the ethanol production process at lab scale at the InternationalCentre for Tropical Agriculture (CIAT) in Palmira, Colombia. The information was cross-validated withliterature information on amounts and quality of by-products from cassava [18,25–27]. Information onthe energy consumption of the ethanol production was obtained from expert interviews according tocurrent design of the facilities, and such information was cross validated with literature values [13,14,28].Use of different fossil fuels was foreseen as part of the different systems. Direct energy consumption wascalculated based on the Low Heating Value (LHV) as proposed by the International Panel for ClimateChange (IPCC) [29]. The values are specific for Colombia as reported by local scientific authorities [30].Indirect energy was calculated as a percentage of the direct energy used, using values reported byPatzek and de Carvalho Macedo [31,32]. Data on GHG emissions from fossil fuels was obtained fromthe conversion of relevant activity rates to their emission equivalents using emission factors specificfor Colombia calculated by local authorities following IPCC guidelines [30,33,34]. Energy content andemissions related to electricity coming from the grid are specific for Colombia where 75–80% of theelectricity consumed is generated from hydropower. Energy and GHG emissions associated withagricultural inputs were obtained from different sources [35–38].
2.3. Systems Definition
Four different cassava bioenergy cascades are evaluated in this study. These systems are chosento reflect current practices of cassava cultivation and current trends in cassava bioethanol productionin Colombia in which two main types of systems are being implemented (these systems differ mainlyin the centralization or not of production and processing, also showing differences in the variety ofcassava being cultivated). In order to simplify the notation and guide the reader, systems are calledcentralized (CS) and decentralized (DS). For each type of system, a scenario with and without the

Sustainability 2019, 11, 3968 5 of 23
anaerobic technology was defined. In the scenarios where AD is not implemented, an alternative useof the by-products was defined for comparison purposes. As a result, the systems analyzed werecentralized bioethanol production without biogas production (CS); centralized bioethanol productionwith biogas production (CS + AD); decentralized bioethanol production without biogas production(DS); and a decentralized bioethanol production with biogas production (DS + AD) (see Table 1).
Table 1. Main systems characteristics.
System CS CS + AD DS DS + AD
Location Meta Bolivar, Atlantic coastAverage
production size 6–8 ha 2 ha
Soil quality Sandy/clay loam. Extreme acidLow nutrient content
Sandy/clay loam.Rich in P and K
Temperature 30 ◦C 27 ◦CRainfall 2652 mm 1057 mm
Cassava variety Roja (CM 4574-7) MTAI8 (Rayong 60)
Ethanol production CentralizedSingle facility
DecentralizedSeparate facilities
Type of energyused ethanol
Diesel (electricity)Fuel oil (distillation)
Hydropower (electricity)Coal (distillation)
Byproductstreatment Composting Anaerobic digestion Feed production Anaerobic digestion
Labor Mostly mechanized Mainly manual
CS: Centralized System; DS: Decentralized System; AD: Anaerobic Digestion.
The centralized systems are defined as fully mechanized ethanol production systems where bothethanol production and crop production are concentrated in one place. On the contrary, decentralizedsystems are defined as a number of small ethanol production and crop production sites, whereoperations are traditionally performed using a significant amount of hand labor, as is the case inColombia. In such systems, the distilling and dehydration steps do not take place in the same location.That is, at the microplant the ethanol is fermented and distilled until it reaches a 50% concentration andsubsequently the resulting EtOH-water mixture is transported to a central factory where the outputof 50 microplants is distilled and dehydrated to 99.6% EtOH. This central step reduces investmentcosts and aids in standardizing the quality of the final product. Two out of four systems make useof anaerobic digestion technology (biogas production) to treat the by-products generated during thebio-ethanol production process including wastewater from root washing, peels, bagasse, vinasse, andleaves/stalks. The other two systems make use of other technologies to add value to the by-products,i.e., composting and animal feed production for the centralized and decentralized system, respectively.
The centralized systems are projected in the eastern plains region (Llanos Orientales) of Colombia.Currently, the cassava cultivation area in the region accounts for 11.5% of the total in the country andthe production is concentrated in medium size farmers (6–8 ha) [38]. The average temperature in Metais 30 ◦C, and the average amount of rainfall is 2652 mm per year [39]. Eastern plains are considered tohave a good potential for centralized cassava cultivation because land is relatively flat, and cassava isone of the few crops that can resist the prevalent extremely acid soil conditions. The nutrient contentof the soil is very low, especially in P, K, Ca, and Mg [40]. Since connection to the grid is not in place inthis system, the required electricity is coming from burning diesel providing the energy needed fordistillation. The decentralized systems are projected in Bolivar, along the Atlantic Coast. This region isselected for its tradition of small-scale farming and cassava cultivation. In addition, the Colombiangovernment has selected this region to establish several cassava based bio-ethanol plants. Bolivaris a hilly region with a hot climate, with an average temperature of 27 ◦C and an average rainfall of1057 mm per year [39]. Soils are sandy or clay loam and rich in P and K [40]. It is estimated that the

Sustainability 2019, 11, 3968 6 of 23
average area used for the cultivation of cassava per farmer in Bolivar is 2 ha [41]. Electricity is availablefrom the grid and coal is used for the distillation as verified on site.
As reflected by the different regional climatic characteristics, two different cassava varieties areused in the centralized and decentralized systems. Roja (CM 4574-7) is used in the centralized systemsand MTAI8 (Rayong 60) in the decentralized ones, having an average yield of 25.7 and 28.5 ton freshroots ha−1 yr−1, respectively. Both varieties have relatively high ethanol yields per ton fresh roots andare already used for industrial production in the selected regions. Varieties are different as they are thebest adapted to the two regions identified, Roja is cultivated for the production of ethanol in LlanosOrientales, and MTAI8 has been identified as the best cassava variety for industrial applications in theAtlantic Coast [42].
3. Process Units and Quantification of Systems Flows
The analysis of the systems was performed considering as systems units: cassava cultivation,cassava chip production, ethanol production and by-products treatment, i.e., composting, animal feedor anaerobic digestion.
3.1. Cassava Cultivation
Cultivation of cassava involves ploughing, planting, fertilizer application, pesticide application,irrigation, harvesting, and packing activities within the farm. In the centralized systems, all processesare mechanized as much as possible. Planting of cassava is done semi-mechanically, as tractors areused to prepare the soil. A mixture of chemical and biological herbicides and pesticides are used forweeding and disease control. As assessed in the field, on average 5.5 kg ha−1 of herbicides (Alacror,Diuron and Glyphosate) are applied in the centralized system, whereas 2.8 kg ha−1 (Alacror andDiuron) are applied in the decentralized one. Despite these very high amounts applied, additionalmanual weeding is required. Pesticides are applied in the centralized and decentralized systemsat 4.3 and 0.7 kg ha−1, respectively [43]. Cassava harvesting is done using mechanical diggers topull out the roots. Based on Ospina et al., the fuel consumption per hectare was calculated from thepower specifications of the machinery a two-row model cassava planter PC-20 of 65 HP and a cassavaharvester P900 of 90 HP, and considering an average fuel consumption of 2.75 HP-h per liter dieselfuel [44]. The tractors operate at an efficiency of 6.2 and 6.5 ha d−1.
Cassava production in the decentralized systems is performed in a traditional way as is the case inBolivar department in Colombia. Planting, weeding, and harvesting are all done manually by the farmowners and their relatives (field interviews). Herbicides are applied but pesticides are not. Irrigationis disregarded considering that the minimal amount of water required for cassava cultivation, i.e.,555 mm per year [45], is exceeded by the rainfall in both regions. Fertilizer requirements are taken fromthe recommendations of Howeler and Cadavid considering differences per region [40]. The amountapplied was compared to the nutrient extraction as calculated following the study by Howeler [26]and compensated in the case of potassium, as in the long-term its application is important to avoiddepletion. The growing period is assumed to be 365 days, one crop rotation takes place once every threeyears and 10% of the fresh root harvest is lost due to diseases (field interviews). The labor requirementsper hectare of cassava are based on Cock, Perez Crespo and Ospina [46–48].
3.2. Cassava Chips Production
Fresh cassava needs to be processed into cassava chips to prevent deterioration. Once cassava isharvested it is transported to the drying facility, where it is weighed, washed, peeled, chopped, anddried. Per liter EtOH, 8 liters of water are used for root washing [27]. Drying can be done naturally,taking advantage of solar energy, or artificially, which allows for the operation to be independentof seasonality. In the decentralized systems cassava is dried using solar energy. A sun drying plantcovering an area of 2000 m2 and working 20 weeks per year, can process 1440 ton of fresh cassava inthe same period. It requires a chopping machine working with a diesel motor of 6 kW and 1 man-day
Sustainability 2019, 11, 3968 7 of 23
working force per ton fresh cassava [49]. In the centralized systems cassava is dried artificially, by asystem operating on diesel, consuming 121 L ton−1 fresh cassava. In addition, electricity is used forother operations at 78 kWh ton−1 fresh cassava [43].
3.3. Ethanol Production
The ethanol production starts by mixing the cassava chips with water and blending them intoa homogenous pulp. Each ton of cassava chips is mixed with 8 litres of water before entering thefermentation tanks. After the mixing and blending, the pulp passes through the hydrolysis andfermentation tanks where enzymes are dosed at 2 mL L−1 of starch [50]. The fermented cassava pulp isfiltered, and the remaining liquid is then purified to 99.6% in distillation and dehydration units. In thecentralized system, ethanol is produced in a modern facility using diesel for electricity generation.For the distillation, steam is produced using diesel fuel. In the decentralized system, the ethanolproduction process follows the design performed by researchers in CIAT, which aims to minimizeinvestment costs, give opportunities to small holders, and adapt to the available local resources.Electricity used is coming from the grid and distillation is performed using coal as fuel source. Energyinputs in ethanol conversion were assessed on site. Emissions associated to the material inputs intoethanol production other than fossil fuels were considered to be negligible [32].
3.4. Transport
Three segments of transport are considered, which include the transport of crop material, includingroots and aerial biomass, from the fields to the ethanol factories, the transport of crude ethanol fromthe microplants to the distillery in the case of the decentralized systems, and from the distillery tothe fields when compost or digestate is transported back. The average distance from the fields to theethanol factory in the centralized system was calculated to be 50 km by assuming a circular distributionof the area needed to produce the 100,000 L EtOH d−1. The cassava is transported in trucks with10 ton capacity. In the decentralized system, 113 farmers having an average farm size of 2 ha areneeded to supply each microplant with the demanded cassava. They transport their product also intrucks with 10 ton capacity, with the average distance to the microplant being 6 km. Partially distilledethanol is transported 40 km from the microplant to the central dehydration facility by means of truckshaving 6000 liter capacity. In all cases, diesel is used for transportation at an average efficiency of 2.5km L−1 [35].
3.5. By-Products Characterization and Treatment Options
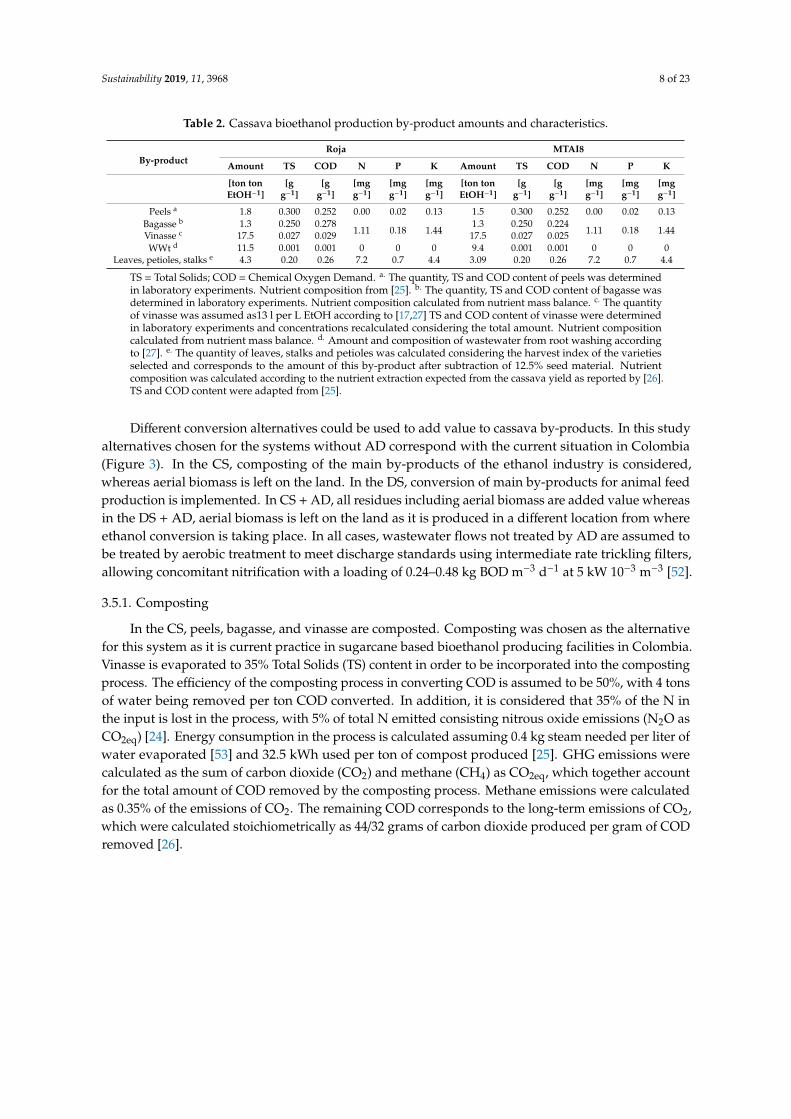
Five main by-products are generated in the systems, which are cassava aerial biomass, includingleaves, petioles and part of stalks, wastewater from root washing (WWt), peels, bagasse, and vinasse.It is considered that 87.5% of the stalks produced are available, the rest being used as planting materialfor the next season [50,51]. Quantification and characterization of the flows is presented in Table 2.Amount and composition of peels, bagasse, and vinasse were calculated according to laboratoryexperiments and cross-validated with pilot and full-scale facilities found in the literature [13,17,27,52].Cassava peels and bagasse are produced in similar amounts, showing also similar solids and organiccontent. Vinasse is produced in great quantities 12–15 liter per liter EtOH [17,27] and is a crucialresidue to treat due to its undesirable characteristics for direct reuse or disposal including offensivehigh organic load and odor. The wastewater from root washing is also a substantial amount with a lowChemical Oxygen Demand (COD) and nutrient content [27], which can be treated either for reuse atthe ethanol facility or for final disposal in the environment.
Sustainability 2019, 11, 3968 8 of 23
Table 2. Cassava bioethanol production by-product amounts and characteristics.
By-productRoja MTAI8
Amount TS COD N P K Amount TS COD N P K
[ton tonEtOH−1]
[gg−1]
[gg−1]
[mgg−1]
[mgg−1]
[mgg−1]
[ton tonEtOH−1]
[gg−1]
[gg−1]
[mgg−1]
[mgg−1]
[mgg−1]
Peels a 1.8 0.300 0.252 0.00 0.02 0.13 1.5 0.300 0.252 0.00 0.02 0.13Bagasse b 1.3 0.250 0.278
1.11 0.18 1.441.3 0.250 0.224
1.11 0.18 1.44Vinasse c 17.5 0.027 0.029 17.5 0.027 0.025WWt d 11.5 0.001 0.001 0 0 0 9.4 0.001 0.001 0 0 0
Leaves, petioles, stalks e 4.3 0.20 0.26 7.2 0.7 4.4 3.09 0.20 0.26 7.2 0.7 4.4
TS = Total Solids; COD = Chemical Oxygen Demand. a. The quantity, TS and COD content of peels was determinedin laboratory experiments. Nutrient composition from [25]. b. The quantity, TS and COD content of bagasse wasdetermined in laboratory experiments. Nutrient composition calculated from nutrient mass balance. c. The quantityof vinasse was assumed as13 l per L EtOH according to [17,27] TS and COD content of vinasse were determinedin laboratory experiments and concentrations recalculated considering the total amount. Nutrient compositioncalculated from nutrient mass balance. d. Amount and composition of wastewater from root washing accordingto [27]. e. The quantity of leaves, stalks and petioles was calculated considering the harvest index of the varietiesselected and corresponds to the amount of this by-product after subtraction of 12.5% seed material. Nutrientcomposition was calculated according to the nutrient extraction expected from the cassava yield as reported by [26].TS and COD content were adapted from [25].
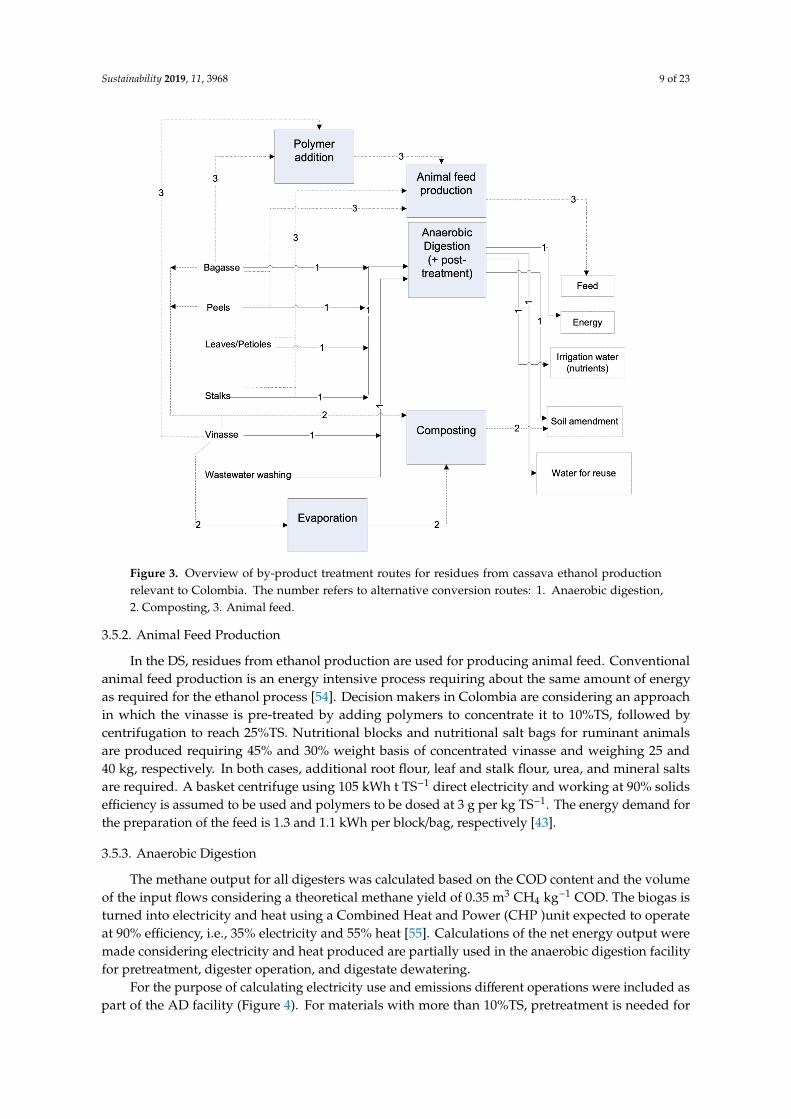
Different conversion alternatives could be used to add value to cassava by-products. In this studyalternatives chosen for the systems without AD correspond with the current situation in Colombia(Figure 3). In the CS, composting of the main by-products of the ethanol industry is considered,whereas aerial biomass is left on the land. In the DS, conversion of main by-products for animal feedproduction is implemented. In CS + AD, all residues including aerial biomass are added value whereasin the DS + AD, aerial biomass is left on the land as it is produced in a different location from whereethanol conversion is taking place. In all cases, wastewater flows not treated by AD are assumed tobe treated by aerobic treatment to meet discharge standards using intermediate rate trickling filters,allowing concomitant nitrification with a loading of 0.24–0.48 kg BOD m−3 d−1 at 5 kW 10−3 m−3 [52].
3.5.1. Composting
In the CS, peels, bagasse, and vinasse are composted. Composting was chosen as the alternativefor this system as it is current practice in sugarcane based bioethanol producing facilities in Colombia.Vinasse is evaporated to 35% Total Solids (TS) content in order to be incorporated into the compostingprocess. The efficiency of the composting process in converting COD is assumed to be 50%, with 4 tonsof water being removed per ton COD converted. In addition, it is considered that 35% of the N inthe input is lost in the process, with 5% of total N emitted consisting nitrous oxide emissions (N2O asCO2eq) [24]. Energy consumption in the process is calculated assuming 0.4 kg steam needed per liter ofwater evaporated [53] and 32.5 kWh used per ton of compost produced [25]. GHG emissions werecalculated as the sum of carbon dioxide (CO2) and methane (CH4) as CO2eq, which together accountfor the total amount of COD removed by the composting process. Methane emissions were calculatedas 0.35% of the emissions of CO2. The remaining COD corresponds to the long-term emissions of CO2,which were calculated stoichiometrically as 44/32 grams of carbon dioxide produced per gram of CODremoved [26].
Sustainability 2019, 11, 3968 9 of 23Sustainability 2019, 11, x FOR PEER REVIEW 9 of 24
Figure 3. Overview of by-product treatment routes for residues from cassava ethanol production relevant to Colombia.
The number refers to alternative conversion routes: 1. Anaerobic digestion, 2. Composting, 3. Animal feed
3.5.2. Animal Feed Production
In the DS, residues from ethanol production are used for producing animal feed. Conventional animal feed production is an energy intensive process requiring about the same amount of energy as required for the ethanol process [54]. Decision makers in Colombia are considering an approach in which the vinasse is pre-treated by adding polymers to concentrate it to 10%TS, followed by centrifugation to reach 25%TS. Nutritional blocks and nutritional salt bags for ruminant animals are produced requiring 45% and 30% weight basis of concentrated vinasse and weighing 25 and 40 kg, respectively. In both cases, additional root flour, leaf and stalk flour, urea, and mineral salts are required. A basket centrifuge using 105 kWh t TS-1 direct electricity and working at 90% solids efficiency is assumed to be used and polymers to be dosed at 3 g per kg TS-1. The energy demand for the preparation of the feed is 1.3 and 1.1 kWh per block/bag, respectively [43].
3.5.3. Anaerobic Digestion
The methane output for all digesters was calculated based on the COD content and the volume of the input flows considering a theoretical methane yield of 0.35 m3 CH4 kg-1 COD. The biogas is turned into electricity and heat using a Combined Heat and Power (CHP )unit expected to operate at 90% efficiency, i.e., 35% electricity and 55% heat [55]. Calculations of the net energy output were made considering electricity and heat produced are partially used in the anaerobic digestion facility for pretreatment, digester operation, and digestate dewatering.
Figure 3. Overview of by-product treatment routes for residues from cassava ethanol productionrelevant to Colombia. The number refers to alternative conversion routes: 1. Anaerobic digestion,2. Composting, 3. Animal feed.
3.5.2. Animal Feed Production
In the DS, residues from ethanol production are used for producing animal feed. Conventionalanimal feed production is an energy intensive process requiring about the same amount of energyas required for the ethanol process [54]. Decision makers in Colombia are considering an approachin which the vinasse is pre-treated by adding polymers to concentrate it to 10%TS, followed bycentrifugation to reach 25%TS. Nutritional blocks and nutritional salt bags for ruminant animalsare produced requiring 45% and 30% weight basis of concentrated vinasse and weighing 25 and40 kg, respectively. In both cases, additional root flour, leaf and stalk flour, urea, and mineral saltsare required. A basket centrifuge using 105 kWh t TS−1 direct electricity and working at 90% solidsefficiency is assumed to be used and polymers to be dosed at 3 g per kg TS−1. The energy demand forthe preparation of the feed is 1.3 and 1.1 kWh per block/bag, respectively [43].
3.5.3. Anaerobic Digestion
The methane output for all digesters was calculated based on the COD content and the volumeof the input flows considering a theoretical methane yield of 0.35 m3 CH4 kg−1 COD. The biogas isturned into electricity and heat using a Combined Heat and Power (CHP )unit expected to operateat 90% efficiency, i.e., 35% electricity and 55% heat [55]. Calculations of the net energy output weremade considering electricity and heat produced are partially used in the anaerobic digestion facilityfor pretreatment, digester operation, and digestate dewatering.
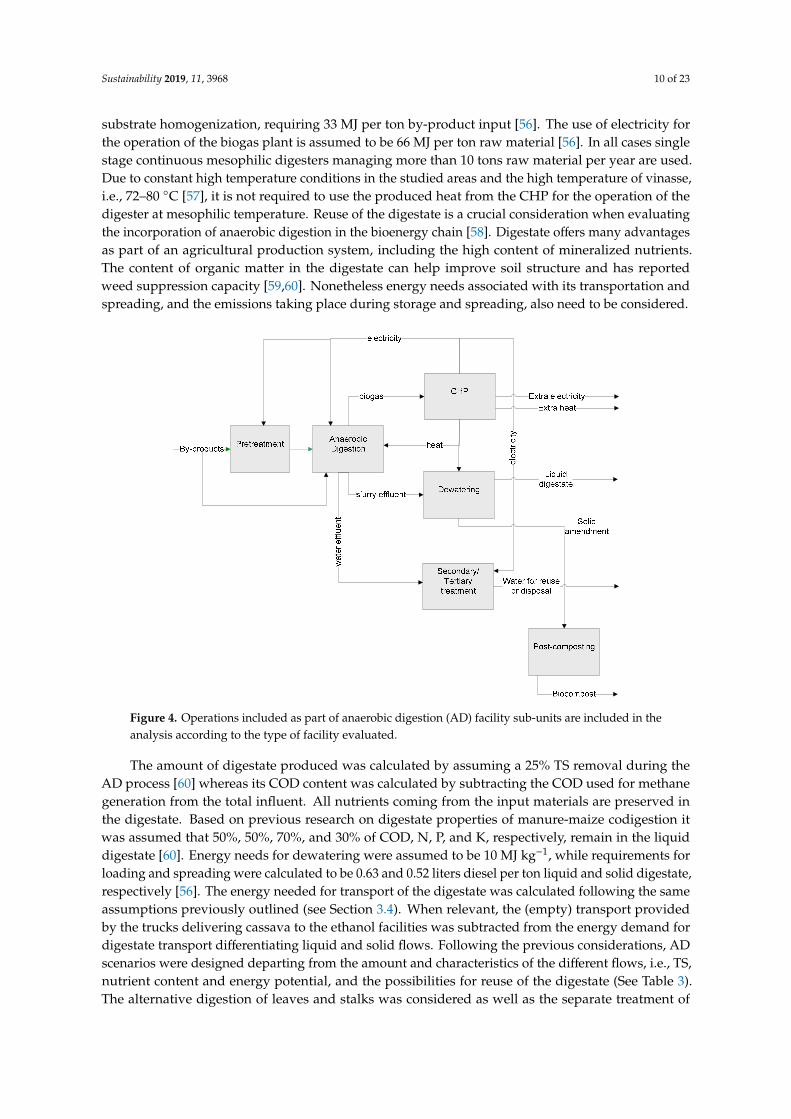
For the purpose of calculating electricity use and emissions different operations were included aspart of the AD facility (Figure 4). For materials with more than 10%TS, pretreatment is needed for
Sustainability 2019, 11, 3968 10 of 23
substrate homogenization, requiring 33 MJ per ton by-product input [56]. The use of electricity forthe operation of the biogas plant is assumed to be 66 MJ per ton raw material [56]. In all cases singlestage continuous mesophilic digesters managing more than 10 tons raw material per year are used.Due to constant high temperature conditions in the studied areas and the high temperature of vinasse,i.e., 72–80 ◦C [57], it is not required to use the produced heat from the CHP for the operation of thedigester at mesophilic temperature. Reuse of the digestate is a crucial consideration when evaluatingthe incorporation of anaerobic digestion in the bioenergy chain [58]. Digestate offers many advantagesas part of an agricultural production system, including the high content of mineralized nutrients.The content of organic matter in the digestate can help improve soil structure and has reportedweed suppression capacity [59,60]. Nonetheless energy needs associated with its transportation andspreading, and the emissions taking place during storage and spreading, also need to be considered.
Sustainability 2019, 11, x FOR PEER REVIEW 10 of 24
For the purpose of calculating electricity use and emissions different operations were included as part of the AD facility (Figure 4). For materials with more than 10%TS, pretreatment is needed for substrate homogenization, requiring 33 MJ per ton by-product input [56]. The use of electricity for the operation of the biogas plant is assumed to be 66 MJ per ton raw material [56]. In all cases single stage continuous mesophilic digesters managing more than 10 tons raw material per year are used. Due to constant high temperature conditions in the studied areas and the high temperature of vinasse, i.e., 72–80 °C [57], it is not required to use the produced heat from the CHP for the operation of the digester at mesophilic temperature. Reuse of the digestate is a crucial consideration when evaluating the incorporation of anaerobic digestion in the bioenergy chain [58]. Digestate offers many advantages as part of an agricultural production system, including the high content of mineralized nutrients. The content of organic matter in the digestate can help improve soil structure and has reported weed suppression capacity [59–60]. Nonetheless energy needs associated with its transportation and spreading, and the emissions taking place during storage and spreading, also need to be considered.
Figure 4. Operations included as part of anaerobic digestion (AD) facility sub-units are included in the analysis according to the type of facility evaluated.
The amount of digestate produced was calculated by assuming a 25% TS removal during the AD process [60] whereas its COD content was calculated by subtracting the COD used for methane generation from the total influent. All nutrients coming from the input materials are preserved in the digestate. Based on previous research on digestate properties of manure-maize codigestion it was assumed that 50%, 50%, 70%, and 30% of COD, N, P, and K, respectively, remain in the liquid digestate [60]. Energy needs for dewatering were assumed to be 10 MJ kg-1, while requirements for loading and spreading were calculated to be 0.63 and 0.52 liters diesel per ton liquid and solid digestate, respectively [56]. The energy needed for transport of the digestate was calculated following the same assumptions previously outlined (see Section 3.4). When relevant, the (empty) transport provided by the trucks delivering cassava to the ethanol facilities was subtracted from the energy demand for digestate transport differentiating liquid and solid flows. Following the previous considerations, AD scenarios were designed departing from the amount and characteristics of the different flows, i.e., TS, nutrient content and energy potential, and the possibilities for reuse of the digestate (See Table 3). The alternative digestion of leaves and stalks was considered as well as the separate treatment of wastewater from washing tubers. In all alternatives, digestate is dewatered, the
Figure 4. Operations included as part of anaerobic digestion (AD) facility sub-units are included in theanalysis according to the type of facility evaluated.
The amount of digestate produced was calculated by assuming a 25% TS removal during theAD process [60] whereas its COD content was calculated by subtracting the COD used for methanegeneration from the total influent. All nutrients coming from the input materials are preserved inthe digestate. Based on previous research on digestate properties of manure-maize codigestion itwas assumed that 50%, 50%, 70%, and 30% of COD, N, P, and K, respectively, remain in the liquiddigestate [60]. Energy needs for dewatering were assumed to be 10 MJ kg−1, while requirements forloading and spreading were calculated to be 0.63 and 0.52 liters diesel per ton liquid and solid digestate,respectively [56]. The energy needed for transport of the digestate was calculated following the sameassumptions previously outlined (see Section 3.4). When relevant, the (empty) transport providedby the trucks delivering cassava to the ethanol facilities was subtracted from the energy demand fordigestate transport differentiating liquid and solid flows. Following the previous considerations, ADscenarios were designed departing from the amount and characteristics of the different flows, i.e., TS,nutrient content and energy potential, and the possibilities for reuse of the digestate (See Table 3).The alternative digestion of leaves and stalks was considered as well as the separate treatment of
Sustainability 2019, 11, 3968 11 of 23
wastewater from washing tubers. In all alternatives, digestate is dewatered, the resulting solids arecomposted for further stabilization, and the liquid digestate is left for reuse in cassava fields.
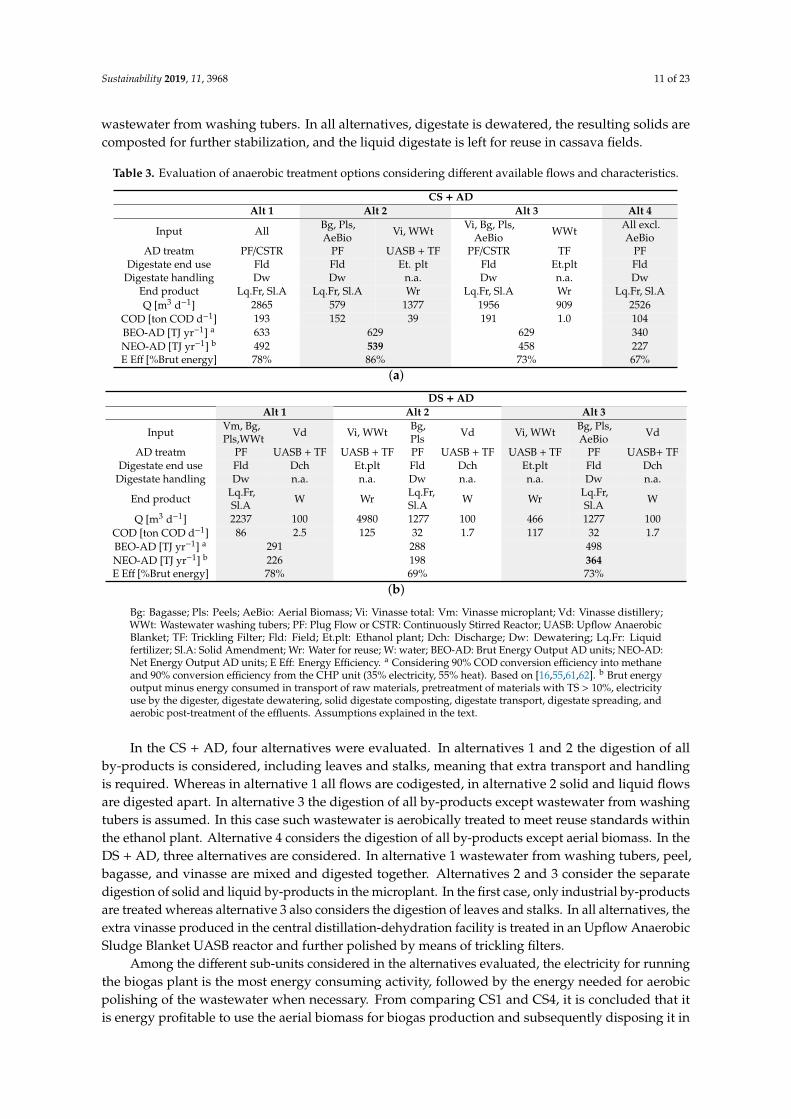
Table 3. Evaluation of anaerobic treatment options considering different available flows and characteristics.
CS + ADAlt 1 Alt 2 Alt 3 Alt 4
Input All Bg, Pls,AeBio Vi, WWt Vi, Bg, Pls,
AeBio WWt All excl.AeBio
AD treatm PF/CSTR PF UASB + TF PF/CSTR TF PFDigestate end use Fld Fld Et. plt Fld Et.plt Fld
Digestate handling Dw Dw n.a. Dw n.a. DwEnd product Lq.Fr, Sl.A Lq.Fr, Sl.A Wr Lq.Fr, Sl.A Wr Lq.Fr, Sl.AQ [m3 d−1] 2865 579 1377 1956 909 2526
COD [ton COD d−1] 193 152 39 191 1.0 104BEO-AD [TJ yr−1] a 633 629 629 340NEO-AD [TJ yr−1] b 492 539 458 227E Eff [%Brut energy] 78% 86% 73% 67%
(a)
DS + ADAlt 1 Alt 2 Alt 3
Input Vm, Bg,Pls,WWt Vd Vi, WWt Bg,
Pls Vd Vi, WWt Bg, Pls,AeBio Vd
AD treatm PF UASB + TF UASB + TF PF UASB + TF UASB + TF PF UASB+ TFDigestate end use Fld Dch Et.plt Fld Dch Et.plt Fld Dch
Digestate handling Dw n.a. n.a. Dw n.a. n.a. Dw n.a.
End product Lq.Fr,Sl.A W Wr Lq.Fr,
Sl.A W Wr Lq.Fr,Sl.A W
Q [m3 d−1] 2237 100 4980 1277 100 466 1277 100COD [ton COD d−1] 86 2.5 125 32 1.7 117 32 1.7BEO-AD [TJ yr−1] a 291 288 498NEO-AD [TJ yr−1] b 226 198 364E Eff [%Brut energy] 78% 69% 73%
(b)
Bg: Bagasse; Pls: Peels; AeBio: Aerial Biomass; Vi: Vinasse total: Vm: Vinasse microplant; Vd: Vinasse distillery;WWt: Wastewater washing tubers; PF: Plug Flow or CSTR: Continuously Stirred Reactor; UASB: Upflow AnaerobicBlanket; TF: Trickling Filter; Fld: Field; Et.plt: Ethanol plant; Dch: Discharge; Dw: Dewatering; Lq.Fr: Liquidfertilizer; Sl.A: Solid Amendment; Wr: Water for reuse; W: water; BEO-AD: Brut Energy Output AD units; NEO-AD:Net Energy Output AD units; E Eff: Energy Efficiency. a Considering 90% COD conversion efficiency into methaneand 90% conversion efficiency from the CHP unit (35% electricity, 55% heat). Based on [16,55,61,62]. b Brut energyoutput minus energy consumed in transport of raw materials, pretreatment of materials with TS > 10%, electricityuse by the digester, digestate dewatering, solid digestate composting, digestate transport, digestate spreading, andaerobic post-treatment of the effluents. Assumptions explained in the text.
In the CS + AD, four alternatives were evaluated. In alternatives 1 and 2 the digestion of allby-products is considered, including leaves and stalks, meaning that extra transport and handlingis required. Whereas in alternative 1 all flows are codigested, in alternative 2 solid and liquid flowsare digested apart. In alternative 3 the digestion of all by-products except wastewater from washingtubers is assumed. In this case such wastewater is aerobically treated to meet reuse standards withinthe ethanol plant. Alternative 4 considers the digestion of all by-products except aerial biomass. In theDS + AD, three alternatives are considered. In alternative 1 wastewater from washing tubers, peel,bagasse, and vinasse are mixed and digested together. Alternatives 2 and 3 consider the separatedigestion of solid and liquid by-products in the microplant. In the first case, only industrial by-productsare treated whereas alternative 3 also considers the digestion of leaves and stalks. In all alternatives, theextra vinasse produced in the central distillation-dehydration facility is treated in an Upflow AnaerobicSludge Blanket UASB reactor and further polished by means of trickling filters.
Among the different sub-units considered in the alternatives evaluated, the electricity for runningthe biogas plant is the most energy consuming activity, followed by the energy needed for aerobicpolishing of the wastewater when necessary. From comparing CS1 and CS4, it is concluded that itis energy profitable to use the aerial biomass for biogas production and subsequently disposing it in
Sustainability 2019, 11, 3968 12 of 23
land as the double amount of energy can be produced. Further, when comparing CS2 and CS3, it isnoticed that it is profitable to separately digest the solid and liquid flows and to avoid the anaerobictreatment of the water from tuber washing due to its low energy content. Hence, alternative CS2 isselected as it is the one producing more energy, the most energy efficient and the one providing morepossibilities for water reuse in the ethanol facility. In the case of the decentralized systems, alternative3, considering the digestion of aerial biomass, is also the most energy profitable, its energy efficiencybeing comparable to that of digesting only the industrial by-products.
4. Systems Performance
4.1. Energy Performance
The energy performance was evaluated by means of different indicators, which include EnergyBalance (Ebalance), Net Energy Ratio (NER), the Net Renewable Energy Ratio (NRER), and BiomassEnergy Efficiency (BEff). The Ebalance indicates the net energy produced by the systems after subtractionof all energy inputs. The NER reports the net energy recovered as a fraction of the total energyinput of the system. In turn, the NRER reports a ratio of the energy recovered but compared to thenon-renewable energy input only, this is an estimation of the fossil replacement value of the system.The BEff represents the percentage of energy from the cassava plant (root, leaves, and stacks) that isrecovered in ‘usable’ energy (ethanol, electricity, heat), being a measurement of resource use efficiency(see Equations (1)–(4)).
Ebalance = Eoutput−Einput (1)
NER =Eoutput − Einput
Einput(2)
NER =Eoutput − Einput
E f ossilinput(3)
NER =Eoutput
Einput biomass(4)
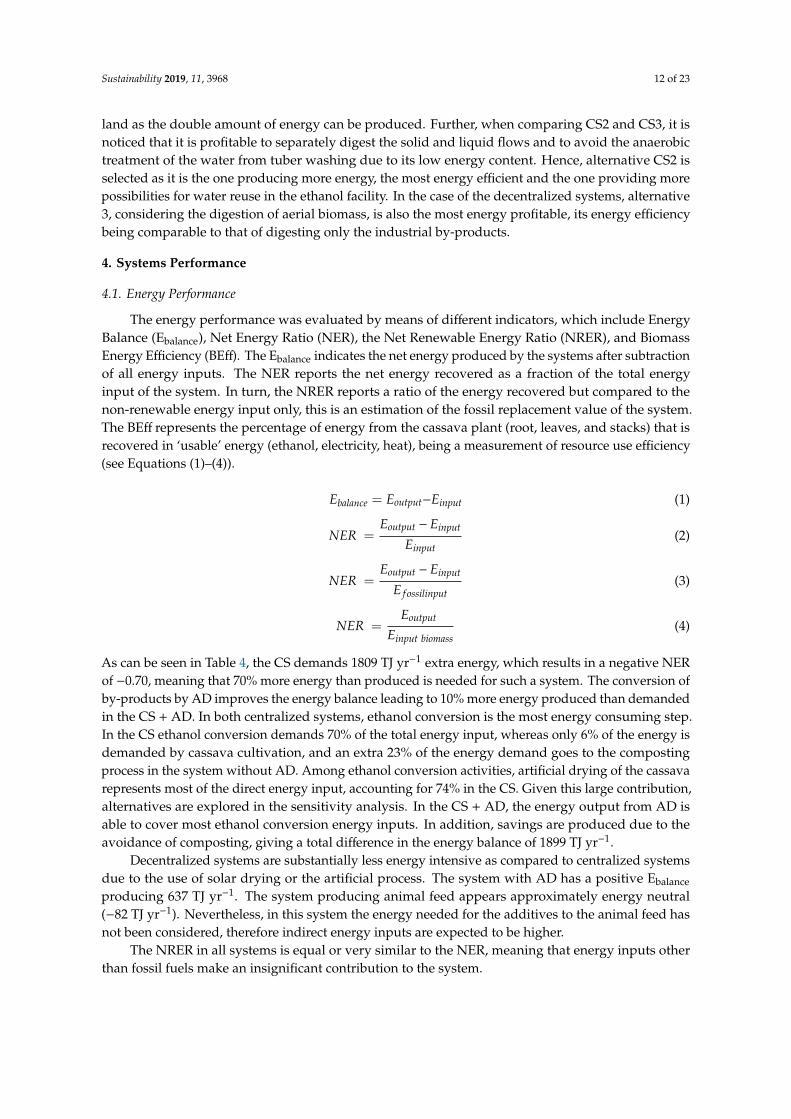
As can be seen in Table 4, the CS demands 1809 TJ yr−1 extra energy, which results in a negative NERof −0.70, meaning that 70% more energy than produced is needed for such a system. The conversion ofby-products by AD improves the energy balance leading to 10% more energy produced than demandedin the CS + AD. In both centralized systems, ethanol conversion is the most energy consuming step.In the CS ethanol conversion demands 70% of the total energy input, whereas only 6% of the energy isdemanded by cassava cultivation, and an extra 23% of the energy demand goes to the compostingprocess in the system without AD. Among ethanol conversion activities, artificial drying of the cassavarepresents most of the direct energy input, accounting for 74% in the CS. Given this large contribution,alternatives are explored in the sensitivity analysis. In the CS + AD, the energy output from AD isable to cover most ethanol conversion energy inputs. In addition, savings are produced due to theavoidance of composting, giving a total difference in the energy balance of 1899 TJ yr−1.
Decentralized systems are substantially less energy intensive as compared to centralized systemsdue to the use of solar drying or the artificial process. The system with AD has a positive Ebalance
producing 637 TJ yr−1. The system producing animal feed appears approximately energy neutral(−82 TJ yr−1). Nevertheless, in this system the energy needed for the additives to the animal feed hasnot been considered, therefore indirect energy inputs are expected to be higher.
The NRER in all systems is equal or very similar to the NER, meaning that energy inputs otherthan fossil fuels make an insignificant contribution to the system.
Sustainability 2019, 11, 3968 13 of 23
Table 4. Energy performance of alternative bioethanol production systems from cassava in Colombia.
CS CS + AD DS DS + ADTJ yr−1 TJ yr−1 TJ yr−1 TJ yr−1
Cassava cultivationDirect 44 59 3 12
Indirect 120 117 141 43Total 163 166 144 55
Ethanol conversionDirect 1515 403 550 39
Indirect 300 80 19 2Total 1816 482 569 40
Transport (cassava andethanol)
Direct 15 15 29 29Indirect 3 3 6 6
Total 18 18 35 35
Byproduct conversionDirect 470 0 52 0
Indirect 111 0 49 0Total 581 0 101 0
Byproduct transportDirect 0 11 1 2
Indirect 0 2 0 0Total 0 13 2 1
Total Direct Energy In 2044 488 637 81Total Indirect Energy In 534 210 214 50
TOTAL ENERGY INPUT 2578 698 851 131Ethanol 769 769 769 769
Extra electricity (from AD) 0 0 0 0Extra heat (from AD) 0 0 0 0
TOTAL ENERGYOUTPUT 769 769 769 769
Ebalance TJ yr−1 −1809 90 −82 637NER −0.70 0.13 −0.10 4.85
NRER −0.69 0.13 0.05 4.85
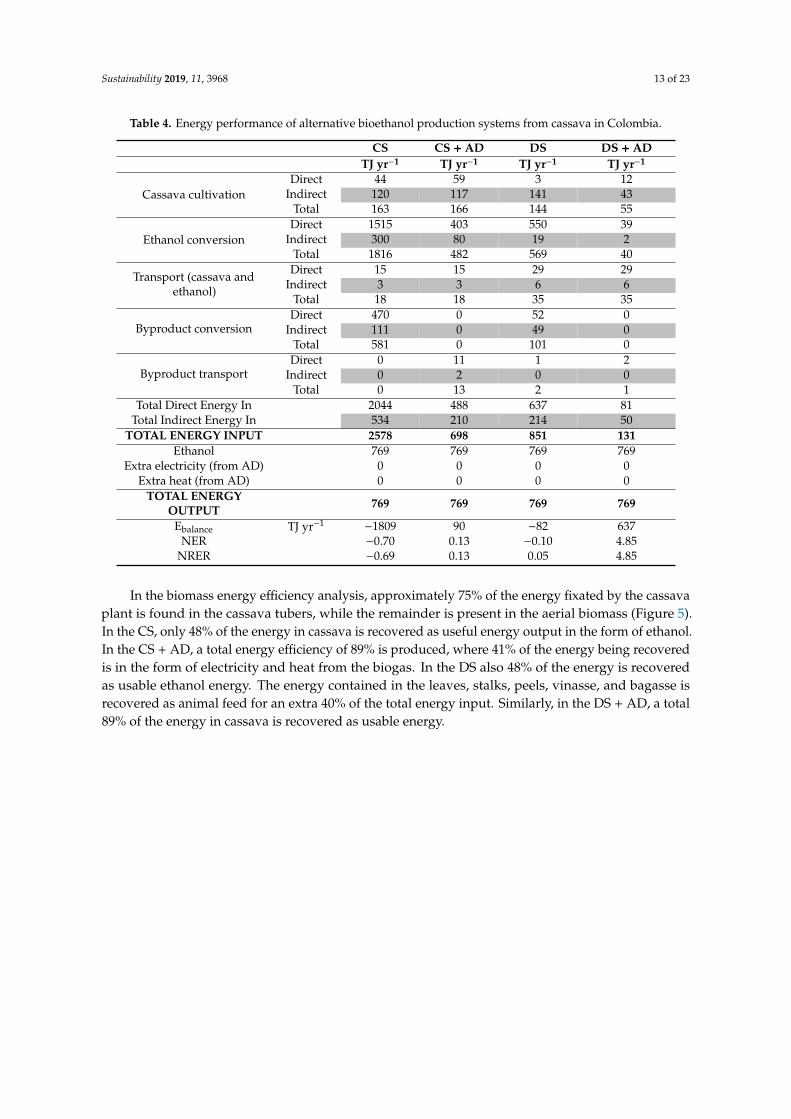
In the biomass energy efficiency analysis, approximately 75% of the energy fixated by the cassavaplant is found in the cassava tubers, while the remainder is present in the aerial biomass (Figure 5).In the CS, only 48% of the energy in cassava is recovered as useful energy output in the form of ethanol.In the CS + AD, a total energy efficiency of 89% is produced, where 41% of the energy being recoveredis in the form of electricity and heat from the biogas. In the DS also 48% of the energy is recoveredas usable ethanol energy. The energy contained in the leaves, stalks, peels, vinasse, and bagasse isrecovered as animal feed for an extra 40% of the total energy input. Similarly, in the DS + AD, a total89% of the energy in cassava is recovered as usable energy.
Sustainability 2019, 11, 3968 14 of 23Sustainability 2019, 11, x FOR PEER REVIEW 15 of 24
Figure 5. Biomass energy efficiency of alternative bioethanol production systems from cassava.
4.2. GHG Balance
GHG emissions were calculated and grouped in four categories. In category 1, flows related to the uptake of atmospheric carbon by photosynthesis and release by oxidation in the different industrial processes and final use of the products was included, as well as flows related to the application of nitrogen in fertilizers and amendments in cassava cultivation. In category 2, all flows related to the use of fossil fuels in the different processes were accounted for, whereas category 3 corresponds to an estimation of emissions related to change in land use. Category 4 corresponds to the avoided emissions due to the positive energy outcomes of the systems studied, i.e., ethanol, electricity, and heat. The total GHG balance is calculated following Equation (5) 𝐺𝐻𝐺 = 𝐺𝐻𝐺 + 𝐺𝐻𝐺 + 𝐺𝐻𝐺 – 𝐺𝐻𝐺 (5)
As can be seen in Table 5, the GHG emissions from category 2, i.e., ethanol production, are the most important in all systems except in the DS + AD where the emissions from category 1 are most prominent. In all cases, net emissions from category 1 exceed the carbon capture by the cassava plant. GHG emissions ranged from 33,345 to 63,372 tCO2eq yr-1 for the different systems, which is equivalent to 18%, 31%, 40%, and 78% of total emissions in the CS, CS + AD, DS, and DS + AD, respectively. The higher category 1 emissions in the decentralized systems is the result of lower amounts of fixated CO2 due to lower yields of the cassava variety compared to the centralized ones.
Table 5. Direct and indirect GHG emissions of alternative bioethanol production systems from cassava.
CS CS + AD DS DS + AD tCO2eq yr -1 tCO2eq yr -1 tCO2eq yr -1 tCO2eq yr -1
Uptake of atmospheric carbon a –196,733 –196,733 –167,469 –167,469 Released during ethanol production b 55,093 55,093 55,093 55,093
Released during composting c 25,760 0 0 0 Remaining in compost d 25,760 0 8201 0 Released from WWT e 566 566 4163 648
Released from biodigestion and burning f 0 62,835 0 50,061 Released during biogas production g 0 10,291 0 8008
Remaining in digestate d 0 6845 1 5395
25%
9%
48%
48% 48% 48% 48%
41% 41%40%
7%
11%
0%
100%
Cassava CS CS+AD DS DS+AD
Animal feed
Biogas
Ethanol
Vinasse
Bagasse
Peels
Leaves and stalks
Figure 5. Biomass energy efficiency of alternative bioethanol production systems from cassava.
4.2. GHG Balance
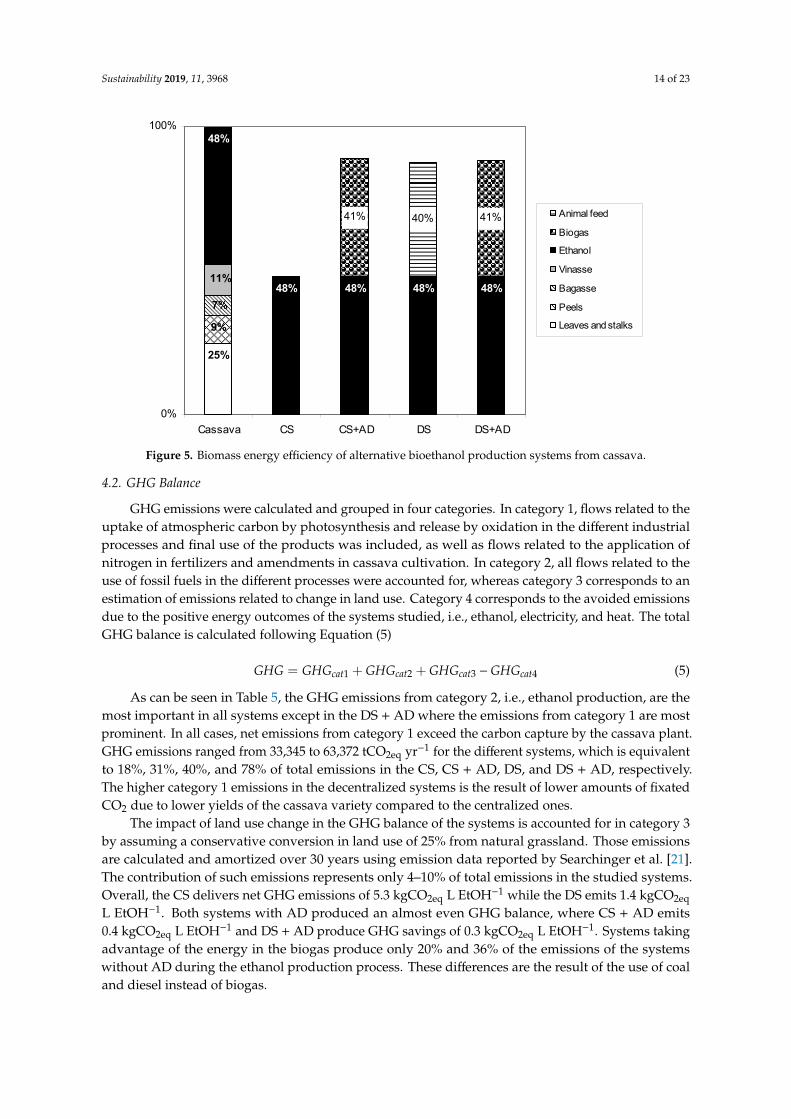
GHG emissions were calculated and grouped in four categories. In category 1, flows related to theuptake of atmospheric carbon by photosynthesis and release by oxidation in the different industrialprocesses and final use of the products was included, as well as flows related to the application ofnitrogen in fertilizers and amendments in cassava cultivation. In category 2, all flows related to theuse of fossil fuels in the different processes were accounted for, whereas category 3 corresponds to anestimation of emissions related to change in land use. Category 4 corresponds to the avoided emissionsdue to the positive energy outcomes of the systems studied, i.e., ethanol, electricity, and heat. The totalGHG balance is calculated following Equation (5)
GHG = GHGcat1 + GHGcat2 + GHGcat3 −GHGcat4 (5)
As can be seen in Table 5, the GHG emissions from category 2, i.e., ethanol production, are themost important in all systems except in the DS + AD where the emissions from category 1 are mostprominent. In all cases, net emissions from category 1 exceed the carbon capture by the cassava plant.GHG emissions ranged from 33,345 to 63,372 tCO2eq yr−1 for the different systems, which is equivalentto 18%, 31%, 40%, and 78% of total emissions in the CS, CS + AD, DS, and DS + AD, respectively.The higher category 1 emissions in the decentralized systems is the result of lower amounts of fixatedCO2 due to lower yields of the cassava variety compared to the centralized ones.
The impact of land use change in the GHG balance of the systems is accounted for in category 3by assuming a conservative conversion in land use of 25% from natural grassland. Those emissionsare calculated and amortized over 30 years using emission data reported by Searchinger et al. [21].The contribution of such emissions represents only 4–10% of total emissions in the studied systems.Overall, the CS delivers net GHG emissions of 5.3 kgCO2eq L EtOH−1 while the DS emits 1.4 kgCO2eq
L EtOH−1. Both systems with AD produced an almost even GHG balance, where CS + AD emits0.4 kgCO2eq L EtOH−1 and DS + AD produce GHG savings of 0.3 kgCO2eq L EtOH−1. Systems takingadvantage of the energy in the biogas produce only 20% and 36% of the emissions of the systemswithout AD during the ethanol production process. These differences are the result of the use of coaland diesel instead of biogas.
Sustainability 2019, 11, 3968 15 of 23
Table 5. Direct and indirect GHG emissions of alternative bioethanol production systems from cassava.
CS CS + AD DS DS + AD
tCO2eq yr −1 tCO2eq yr −1 tCO2eq yr −1 tCO2eq yr −1
Uptake of atmospheric carbon a –196,733 –196,733 –167,469 –167,469Released during ethanol production b 55,093 55,093 55,093 55,093
Released during composting c 25,760 0 0 0Remaining in compost d 25,760 0 8201 0Released from WWT e 566 566 4163 648
Released from biodigestion and burning f 0 62,835 0 50,061Released during biogas production g 0 10,291 0 8008
Remaining in digestate d 0 6845 1 5395Release during ethanol combustion h 54,593 54,593 54,593 54,593
Remaining in leaves and stalks i 32,279 3431 2468 2468Remaining in animal feed e 0 0 65,502 0
N2O fertilizer j 16,191 15,786 34,788 10,535N2O and CH4 compost k 12,065 0 0 0
N2O digestate j 7934 20,639 0 25,162N2O leaves and stalks j 18,877 0 0 18,877
Total Category 1 52,383 33,345 57,339 63,372
Use of fossil fuels in cassava cultivation 7733 8580 495 495Use of fossil fuels cassava transport 1362 2017 2100 2100
Use of fossil fuels ethanol production 155,764 41,379 55,726 3704Use of fossil fuels for crude ethanol transport 0 0 564 564
Use of fossil fuels for dig. handling 0 1487 0 814Use of fossil fuels for compost 46,055 0 0 0
Use of fossil fuels for animal feed production 0 0 516 0Use of fossil fuels for WWT 5817 2968 12,470 0
Use of fossil fuels in inputs for cassava production(fertilizer, pesticides, herbicides) 7077 7305 6419 1983
Use of fossil fuels in inputs for animal feed production l 0 0 41 0
Total Category 2 m 223,808 63,375 78,330 9659
Total Category 3: Emissions from change in land use n 10,551 10,551 8201 8201
Avoided emissions from gasoline 91,992 91,992 91,992 91,992Avoided emissions from electricity (extra AD) p 0 0 0 0
Avoided emissions from heat (extra AD) p 0 0 0 0
Total Category 4 91,992 91,992 91,992 91,992
TOTAL 194,751 15,639 51,878 10,760
Total (kgCO2eq L EtOH−1) 5.3 0.4 1.4 –0.3a Calculated considering the physicochemical composition of cassava root and leaves [25], its COD equivalence [63],and the Total Organic Carbon-COD ratio (TOC/COD) for the different physicochemical compounds. An averageof 0.15 and 0.09 gC g VS−1 was calculated for cassava root and cassava leaves (also used for stalks), respectively.When considering the total VS harvested per ha per year a total CO2 fixation of 18.4 and 19.5 tCO2 ha−1yr−1 iscalculated for the Roja and MTAI8 varieties, which is in agreement with total carbon contained in the differentcassava (by) products of the studied systems. b Stochiometrically per mol ethanol 1 mol of CO2 is produced permol ethanol. c Considering 50% of COD is lost during the composting process and assuming a TOC/COD ratio of2.67 (for carbohydrates) and molar weight ratio CO2/C of 44/12. d Corresponds to the emissions equivalent to theCOD remaining in compost or digestate assuming a TOC/COD ratio of 2.67 and molar weight ratio CO2/C of 44/12.Whereas in the case of compost and digestate this COD is expected to be (partly) incorporated as organic matterin soil, it is included in calculations to close the mass balance related to photosynthesis and oxidation of cassava(by) products. All emissions are assumed to be in the form of CO2. e CO2 emitted calculated from COD contentfollowing similar calculation as explained in d. f Biogas is assumed to have a 40% content of CO2. In addition,stochiometrically 1 mol methane is combusted into 1 mol CO2 in the CHP unit. g Includes unintended methaneemissions during biogas production, i.e., 2% of total CH4, [24] emissions from digestate storage (5% COD in liquiddigestate) and emissions from post-composting of solid digestate (15% COD in solid digestate). h Stochiometrically 2moles CO2 are produced per mol EtOH combusted. i Corresponds to the theoretical CO2 emissions from remainingCOD in leaves and stalks. Calculated considering a TOC/COD ratio of 2.67 (for carbohydrates) and molar weightratio CO2/C of 44/12. Whereas this COD is expected to be (partly) incorporated as organic matter in soil, it isincluded in calculations to close the mass balance related to photosynthesis and oxidation of cassava (by) products. j
Calculated considering 1.25% of applied N escapes into the air as N2O, 30% of applied N escapes from the field, and2.5% of that quantity is converted to N2O in the surface water, 10% of applied N escapes as NH3 into the air and1% of that becomes N2O. Hence a total 2.10% of applied N is lost as N2O. From [31] according to [29]. k Total Nemissions are 35% of N content in original material, N2O calculated as 5% of total N emissions. CH4 emissions fromthe applied compost are accounted, assuming 0.35% of the total emissions of carbon dioxide [24]. l Calculated basedon a polymer consumption of 300 g per liter vinasse and an assumed emission of 0.8 metric ton carbon equivalentper ton mined bentonite, value corresponding to clay mining according [64]. m Calculated considering fossil fuelconsumption and emissions as reported in the text. n According to [21], 20.5 and 224.5 tons C per ha grasslandand tropical forest are emitted when changing their use, respectively. A modest 25% land use change from landassumed to be previously natural grassland was considered in these calculations; they were amortized over 30 years.o Avoided emissions were calculated according to the direct and indirect emissions for the gasoline that the ethanolproduced is replacing. p Since all outputs from the AD process are used within the system, no additional emissionsare avoided for exporting the products.

Sustainability 2019, 11, 3968 16 of 23
4.3. Water Balance
According to our estimation, 27–31 L of water per liter of ethanol are used in the cassava productionsystems without accounting for the water needed for steam production. Of these, 21–23 L are providedfor the ethanol production in water for washing tubers and pulping, while the rest is incorporatedin the cassava biomass. Hence the net water use without accounting for rainwater incorporated inbiomass is 776,340–836,839 ton yr−1.
Water used in cleaning the cassava tubers constitutes about 30% of the water output, and inall systems is treated and reused within the ethanol process providing important water savings.If considering total water input and reuse, all systems except the CS would show substantial watersavings. In the CS, 46% of the water incorporated in the system is evaporated during the compostproduction process. Similarly, 44% of the water output leaving the DS is coming from the animalfeed production. This flow could be reused within the ethanol process. In the AD systems, thedigestion of by-products generates a substantial amount of water savings (70% of the total wateroutput). In addition, 12% to 14% of the water input is left in the digestate which needs to be adequatelydisposed of in the fields to take advantage of the nutrients they contain.
Overall, significant differences in net water use are found in the different systems. The CS is ahigh water demanding one (505,502 ton yr−1), in contrast with water saving system in the CS + AD(19,193 ton yr−1). In both DS systems, similar water consumption results equivalent to 10% of that inthe CS, i.e., 53,756–55,784 ton yr−1.
4.4. Land Use and Soil Quality
Approximately 13,092–16,844 ha yr−1 of arable land are needed in the centralized and decentralizedsystems, including rotation and losses. A total of 60% of this amount corresponds to the area cultivatedwith cassava [65]. This means that 0.27–0.35 ha need to be cultivated with cassava to produce 1 ton ofethanol. Solar drying of the cassava chips as performed in the decentralized systems also demand land,about 1.4 m2 ton−1 fresh cassava [49]. However, when calculating the total amount of land requiredfor the decentralized systems, such amount is insignificant as compared to the cultivated land, i.e.,31 ha yr−1.
With regards to soil quality, three of the different scenarios analyzed consider the return ofby-products to land in the form of compost or solid/liquid digestate which incorporates valuablematerial for building up soil structure and fertility. When such by-products are applied on the landcultivated with cassava, an application rate of 6, 14, and 16 ton ha−1 yr−1 compost/solid digestate resultsfrom the CS, CS + AD and DS + AD respectively. In the case of liquid digestate 6 and 5 ton ha−1 yr−1
are to be applied in the CS + AD and DS + AD, respectively.Total nutrient recirculation achieved in the different systems is 37%, 42%, −181%, and 73% for the
CS, CS + AD, DS, and DS + AD, respectively. In the CS + AD, AD allows for higher recirculation ofnutrients as composting is limited by the nitrogen losses during the process. The animal feed scenarioimplies the export of the nutrients outside the system boundaries including those present in the leavesfor which fertilization is originally not provided. Thus, a negative nutrient balance is a result.
4.5. Overall Performance of the Studied Systems
Through an analysis of the overall performance of the four systems, centralized systems show apoorer energy and GHG performance as compared to decentralized ones (Table 6). In addition, systemswith AD show a better energy balance and GHG performance as compared to their counterpart. The CS+ AD produce water savings, whereas the two decentralized systems consume limited amounts ofwater. All systems behave similarly in terms of land use, with the variability related to the yielddifferences of the two cassava varieties studied. Nutrient recirculation as performed in the AD systemsin the form of concentrated effluents made possible savings of 42–73% in imported fertilizers.
Sustainability 2019, 11, 3968 17 of 23
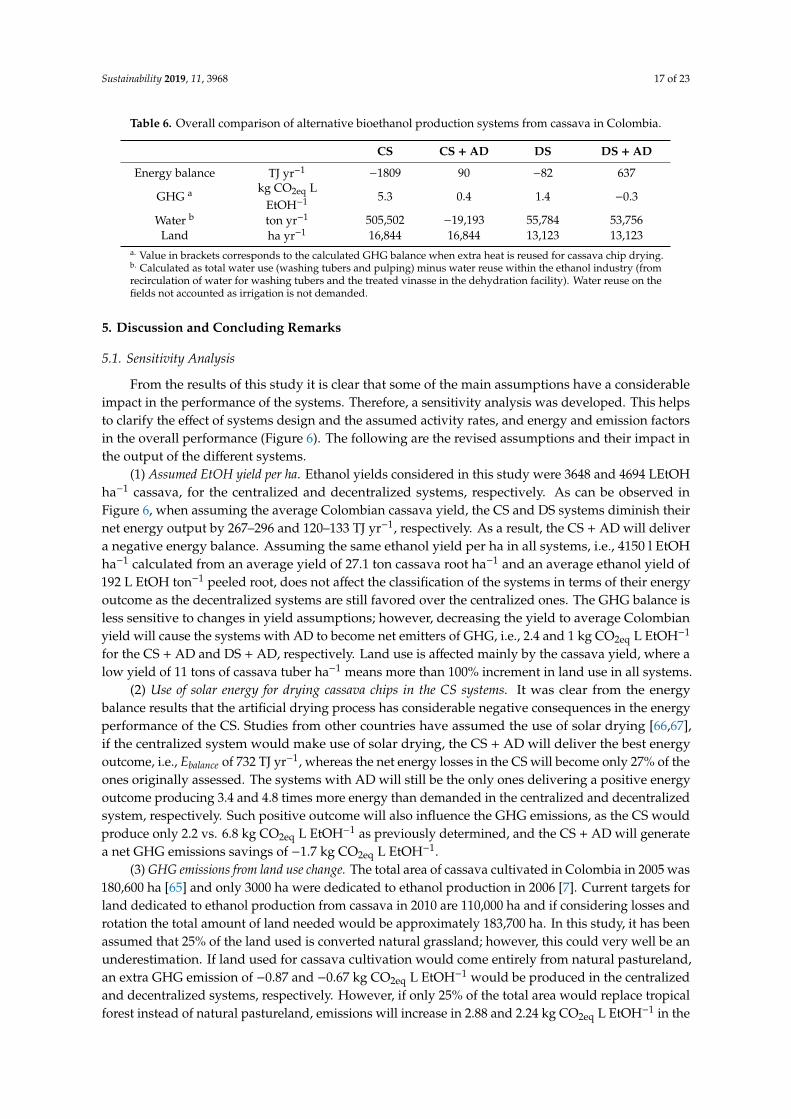
Table 6. Overall comparison of alternative bioethanol production systems from cassava in Colombia.
CS CS + AD DS DS + AD
Energy balance TJ yr−1 −1809 90 −82 637
GHG a kg CO2eq LEtOH−1 5.3 0.4 1.4 −0.3
Water b ton yr−1 505,502 −19,193 55,784 53,756Land ha yr−1 16,844 16,844 13,123 13,123
a. Value in brackets corresponds to the calculated GHG balance when extra heat is reused for cassava chip drying.b. Calculated as total water use (washing tubers and pulping) minus water reuse within the ethanol industry (fromrecirculation of water for washing tubers and the treated vinasse in the dehydration facility). Water reuse on thefields not accounted as irrigation is not demanded.
5. Discussion and Concluding Remarks
5.1. Sensitivity Analysis
From the results of this study it is clear that some of the main assumptions have a considerableimpact in the performance of the systems. Therefore, a sensitivity analysis was developed. This helpsto clarify the effect of systems design and the assumed activity rates, and energy and emission factorsin the overall performance (Figure 6). The following are the revised assumptions and their impact inthe output of the different systems.
(1) Assumed EtOH yield per ha. Ethanol yields considered in this study were 3648 and 4694 LEtOHha−1 cassava, for the centralized and decentralized systems, respectively. As can be observed inFigure 6, when assuming the average Colombian cassava yield, the CS and DS systems diminish theirnet energy output by 267–296 and 120–133 TJ yr−1, respectively. As a result, the CS + AD will delivera negative energy balance. Assuming the same ethanol yield per ha in all systems, i.e., 4150 l EtOHha−1 calculated from an average yield of 27.1 ton cassava root ha−1 and an average ethanol yield of192 L EtOH ton−1 peeled root, does not affect the classification of the systems in terms of their energyoutcome as the decentralized systems are still favored over the centralized ones. The GHG balance isless sensitive to changes in yield assumptions; however, decreasing the yield to average Colombianyield will cause the systems with AD to become net emitters of GHG, i.e., 2.4 and 1 kg CO2eq L EtOH−1
for the CS + AD and DS + AD, respectively. Land use is affected mainly by the cassava yield, where alow yield of 11 tons of cassava tuber ha−1 means more than 100% increment in land use in all systems.
(2) Use of solar energy for drying cassava chips in the CS systems. It was clear from the energybalance results that the artificial drying process has considerable negative consequences in the energyperformance of the CS. Studies from other countries have assumed the use of solar drying [66,67],if the centralized system would make use of solar drying, the CS + AD will deliver the best energyoutcome, i.e., Ebalance of 732 TJ yr−1, whereas the net energy losses in the CS will become only 27% of theones originally assessed. The systems with AD will still be the only ones delivering a positive energyoutcome producing 3.4 and 4.8 times more energy than demanded in the centralized and decentralizedsystem, respectively. Such positive outcome will also influence the GHG emissions, as the CS wouldproduce only 2.2 vs. 6.8 kg CO2eq L EtOH−1 as previously determined, and the CS + AD will generatea net GHG emissions savings of −1.7 kg CO2eq L EtOH−1.
(3) GHG emissions from land use change. The total area of cassava cultivated in Colombia in 2005 was180,600 ha [65] and only 3000 ha were dedicated to ethanol production in 2006 [7]. Current targets forland dedicated to ethanol production from cassava in 2010 are 110,000 ha and if considering losses androtation the total amount of land needed would be approximately 183,700 ha. In this study, it has beenassumed that 25% of the land used is converted natural grassland; however, this could very well be anunderestimation. If land used for cassava cultivation would come entirely from natural pastureland,an extra GHG emission of −0.87 and −0.67 kg CO2eq L EtOH−1 would be produced in the centralizedand decentralized systems, respectively. However, if only 25% of the total area would replace tropicalforest instead of natural pastureland, emissions will increase in 2.88 and 2.24 kg CO2eq L EtOH−1 in the

Sustainability 2019, 11, 3968 18 of 23
centralized and decentralized systems, respectively. These figures show the importance of properlyassessing the land use changes and their origin.
(4) Labor accountability within energy balance. Previous studies [11,13,15] have considered the energyembodied in human labor as part of the energy inputs into the ethanol systems. Although the additionof this flow is contestable because of its different nature in relation to other energy flows, it is a factthat energy embedded in labor is also indirectly coming from fossil energy. An energy consumptionof 2.3 MJ h−1 is frequently used for this type of calculation, although higher energy consumption(12.1 MJ h−1) has also been calculated [18]. In this study total energy coming from labor is substantiallydifferent in centralized and decentralized systems; hence an estimation of the extra energy invested inlabor is included considering 2.3 MJ h−1 energy consumption. The inclusion of labor within the energycalculations means extra 13 and 17 TJ yr−1 energy use in the centralized and decentralized systems,respectively, that is 1% and 20% differences in the Ebalance.
(5) Liquid digestate reuse and irrigation water demand. It is important to recognize that the positiveperformance of the AD systems is closely related to choice for separate treatment of liquid and solidsflows. Apart from allowing substantial water reuse within the ethanol industry, such choice impliesconsiderable energy savings and avoidance of GHG emissions related to liquid digestate handling.An alternative to the separate digestion could be the mixed digestion of liquid and solid flows. Howeveras there is a limited possibility for irrigation due to the limited water demand of cassava and therainfall availability in the studied regions, the (partial) evaporation of this digestate to concentratethe nutrients for agricultural reuse could be required. To exemplify the implications of such a choice,calculations were performed for a system digesting all cassava by-products assuming centrifugationfollowed by liquid digestate evaporation from 5 to 15%TS with an energy use of 0.93 GJ ton−1 waterevaporated [53]. Following the previous assumptions extra 605 TJ yr−1 will be demanded which isequivalent to the total energy use of the CS + AD.
(6) Change in assumptions anaerobic digestion. Energy recovery from AD can fluctuate dependingon system design and operation. In addition, due to the high global warming potential of CH4,assumptions on its losses are critical. A negative AD scenario of 20% more emissions, 20% more energyuse, and 70% energy recovery was evaluated. The change in assumptions substantially impact theoutcome of the systems. The NER substantially diminishes from 0.10 to −0.07 and from 4.85 to 2.17, inthe CS + AD and DS + AD, respectively. The GHG balance is less affected by emissions in the ADsystems increasing by 0.3–0.4 kgCO2eq L EtOH−1. The overall outcome will remain the same with theAD systems being more energy and GHG profitable than their counterparts. Further, the extreme caseof no methane recovery is considered. In such a case, the Ebalance will diminish by 884 and 609 TJ yr−1
in the CS + AD and DS + AD, respectively, whereas GHG emissions will increment in 8.9 and 7.1 kgCO2eq L EtOH−1. The benefits of AD will remain in terms of energy as the technology is significantlyless energy consuming than the compost scenario and slightly better than the animal feed productionprocesses. However, GHG emissions will significantly outweigh the other scenarios, making the ADoption no longer appealing.

Sustainability 2019, 11, 3968 19 of 23
Sustainability 2019, 11, x FOR PEER REVIEW 19 of 24
outcome, i.e., Ebalance of 732 TJ yr-1, whereas the net energy losses in the CS will become only 27% of the ones originally assessed. The systems with AD will still be the only ones delivering a positive energy outcome producing 3.4 and 4.8 times more energy than demanded in the centralized and decentralized system, respectively. Such positive outcome will also influence the GHG emissions, as the CS would produce only 2.2 vs. 6.8 kg CO2eq lEtOH-1 as previously determined, and the CS + AD will generate a net GHG emissions savings of –1.7 kg CO2eq lEtOH-1.
Figure 6. Sensitivity analysis of alternative scenarios of cassava bioethanol production.
Above Ebalance in TJ yr-1 and below GHG balance in kg CO2eq per lEtOH-1
(3) GHG emissions from land use change. The total area of cassava cultivated in Colombia in 2005 was 180,600 ha [65] and only 3000 ha were dedicated to ethanol production in 2006 [7]. Current targets for land dedicated to ethanol production from cassava in 2010 are 110,000 ha and if considering losses and rotation the total amount of land needed would be approximately 183,700 ha. In this study, it has been assumed that 25% of the land used is converted natural grassland; however, this could very well be an underestimation. If land used for cassava cultivation would come entirely from natural pastureland, an extra GHG emission of –0.87 and –0.67 kg CO2eq lEtOH-1 would be produced in the centralized and decentralized systems, respectively. However, if only 25% of the total area would
-4000
-3000
-2000
-1000
0
1000(0) Baseline
(1a) l EtOH per Ha +20%
(1b) l EtOH per Ha -20%
(1c) l EtOH per Ha = 11.04 t/Ha
(1d) l EtOH per Ha = 4150 lEtOH/ Ha
(2) Chip drying all so lar
(3a) GHG land use change 0%
(3b) GHG land use change 50%
(3c) GHG land use change 100%
(3d) GHG land use change 25% forest
(4) Labor energy
(5) Liquid digest. evap. 15%TS
(6a) AD assumpt. 20% negative
(6b) AD assumpt. No recovery
DS+ADCS+AD
DSCS
-2
1
4
7
10
13(0) Baseline
(1a) l EtOH per Ha +20%
(1b) l EtOH per Ha -20%
(1c) l EtOH per Ha = 11.04 t/Ha
(1d) l EtOH per Ha = 4150 lEtOH/ Ha
(2) Chip drying all solar
(3a) GHG land use change 0%
(3b) GHG land use change 50%
(3c) GHG land use change 100%
(3d) GHG land use change 25% forest
(4) Labor energy
(5) Liquid digest. evap. 15%TS
(6a) AD assumpt. 20% negative
(6b) AD assumpt. No recovery
CS
CS+AD
DS
DS+AD
Figure 6. Sensitivity analysis of alternative scenarios of cassava bioethanol production. Above Ebalance
in TJ yr−1 and below GHG balance in kg CO2eq per L EtOH−1.
5.2. Conclusions
Bioethanol production from cassava in Colombia was shown to deliver substantially differentenvironmental outcomes depending on the system design. The energy balance, GHG balance, andwater balances fluctuated in a wide range, i.e., −1809 to 637 TJ yr−1, −0.3–5.3 kg CO2eq L EtOH−1,−19,193–505,502 ton yr−1, respectively. Further, it was made evident that without the energy recoveryprovided by AD, the production of bioethanol from cassava in Colombia is not sustainable from anenergy and GHG perspective. In the centralized systems, it is not desirable to implement artificialdrying of cassava since it is an enormously energy consuming activity. The decentralized systemsdemonstrate that both animal feed production and anaerobic digestion can be feasible from an energyand GHG balance perspective although benefits from AD will be remarkably higher.
The energy outcome of the AD process was shown to always be greater than its energy inputfor the different configurations evaluated, i.e., above 67%. The energy and water content of thematerial to digest, the use of aerial biomass, the options for digestate reuse, and the recovery of
Sustainability 2019, 11, 3968 20 of 23
the methane produced are major considerations that substantially influence the role of AD withincascade configurations.
The role of AD in this study was clarified by defining different design options and furthercontesting assumptions within the sensitivity analysis. The energy outcome of the AD process hasalways been shown to be positive, i.e., above 67% for the different configurations. The importance of thetype of influent to be digested is evident. On one hand, the energy benefits of digesting aerial biomassoutweighed the energy costs of its loading and spreading by more than double in the centralizedsystem. On the other hand, the digestion of the diluted wastewater from root washing decreased thenet energy output of the system. The type of influent to digest needs to be carefully examined not onlyin view of its energy content but also taking into account the reuse of the digestate output.
Cassava bioethanol production in Colombia and other countries has to be approached with majorcaution; general analyses are not desirable as they hide the substantial differences in outcome comingfrom the system design and context conditions. The analysis and design of bioethanol production has tobe approached from a systems perspective in which by-products are added value in an energy rationalway if the systems are to be called ‘renewable’ and beneficial from an ‘environmental’ perspective.
Supplementary Materials: The following are available online at http://www.mdpi.com/2071-1050/11/14/3968/s1,Table S1: List of Abbreviations.
Author Contributions: Conceptualization, C.P.-P., M.S., J.v.L., R.R.; methodology, C.P.-P., M.S., J.v.L., R.R.;software, C.P.-P.; formal analysis, C.P.-P., M.S., J.v.L.; investigation, C.P.-P., S.H.; resources, M.S., R.R.; data curation,C.P.-P.; writing—original draft preparation, C.P.-P.; writing—review and editing, C.P.-P., M.S., J.v.L.,; visualization,C.P.-P.; supervision, M.S., J.v.L., R.R.; project administration, M.S.; funding acquisition, M.S.
Funding: This research received no external funding.
Acknowledgments: The authors acknowledge the valuable contribution of CIAT for the completion of this work,particularly Elizabeth Alvarez for facilitating the laboratory equipment and materials needed for the bioethanolexperiments conducted for this research. They also thank Marcelo Villena for his contribution in editing the finalversion of this scientific paper.
Conflicts of Interest: The authors declare no conflict of interest. The funders had no role in the design of thestudy; in the collection, analyses, or interpretation of data; in the writing of the manuscript, or in the decision topublish the results.
References
1. FAOSTAT. FAO ProdStat 2012. Available online: http://faostat.fao.org/site/567/DesktopDefault.aspx?PageID=
567#ancor (accessed on 11 October 2013).2. Balcazar, A.; Mansilla, H. Cassava Crop Development in Colombia; FAO: Bogotá, Colombia, 2004.3. Bajes Mora, F. La Yuca: Un Ingrediente Estratégico en la Fabricación de Alimentos Balanceados para Animales;
Ministerio de Agricultura y Desarrollo Rural: Bogotá, Colombia, 1998.4. Sonder, K.; Muller-Samann, K.; Hilger, T.; Leihner, D. Erosion Control and Prediction in Cassava Based Cropping
Systems in the Southern Andean Region of Colombia; Universidad Bonn: Bonn, Germany, 2001.5. Gottret, M.V.; Escobar, Z.; Perez, S. El sector yuquero en Colombia: Desarrollo y Competitividad. In La
Yuca en el Tercer Milenio. Sistemas Modernos de Producción, Procesamiento, Utilización y Comercialización Cali;Ospina, B., Ceballos, H., Eds.; CIAT, CLAYUCA: Cali, Colombia, 2002.
6. MADR. Apuesta Exportadora Agropecuaria 2006–2020; Ministerio de Agricultura y Desarrollo Rural: Bogotá,Colombia, 2006; 19p.
7. Henao Estrada, J. Potencial de Biocombustibles en Antioquia; BIRD Antioquia: Itagui, Colombia, 2008; 94p.8. Enguidanos, M.; Soria, A.; Kavalov, B.; Jensen, P. Techno-Economic Analysis of Bio-Alcohol Production in the EU:
A Short Summary for Decision-Makers; European Commission. Institute for Prospective Technological Studies:Seville, Spain, 2002; 34p.
9. Niven, R. Ethanol in gasoline: Environmental impacts and sustainability review article. Renew. Sustain.Energy Rev. 2005, 9, 535–555. [CrossRef]
10. Pimentel, D.P.T.; Cecil, G. Ethanol Production: Energy, Economic, and Environmental Losses. J. Environ.Contam. Toxicol. 2007, 189, 25–41.
Sustainability 2019, 11, 3968 21 of 23
11. Pimentel, D. Ethanol Fuels: Energy Balance, Economics and Environmental Impacts are Negative.Nat. Resour. Res. 2003, 12, 127–134. [CrossRef]
12. Shapouri, H.; Duffield, J.A.; Wang, M. The Energy Balance of Corn Ethanol Revisited. Trans. Am. Soc.Agric. Eng. 2003, 46, 959–968.
13. Dai, D.; Hu, Z.; Pu, G.; Li, H.; Wang, C. Energy efficiency and potentials of cassava fuel ethanol in Guangxiregion of China. Energy Convers. Manag. 2006, 4, 1686–1699. [CrossRef]
14. Leng, R.; Wang, Y.S.; Zhang, C.; Dai, D.; Pu, G. Life cycle inventory and energy analysis of cassava-based fuelethanol in China. J. Clean. Prod. 2008, 16, 374–384. [CrossRef]
15. Nguyen, T.L.T.; Gheewala, S.H.; Garivait, S. Full chain energy analysis of fuel ethanol from cassava inThailand. Environ. Sci. Technol. 2007, 41, 4135–4142. [CrossRef]
16. Van Haandel, A.C. Integrated energy production and reduction of the environmental impact at alcoholdistillery plants. Water Sci. Technol. 2005, 52, 49–57. [CrossRef]
17. Wilkie, A.C.; Riedesel, K.J.; Owens, J.M. Stillage characterization and anaerobic treatment of ethanol stillagefrom conventional and cellulosic feedstocks. Biomass Bioenergy 2000, 19, 63–102. [CrossRef]
18. Zvinavashe, E.; Elbersen, H.W.; Slingerland, M.; Kolijn, S.; Sanders, J.P. Cassava for food and energy:Exploring potential benefits of processing of cassava into cassava flour and bioenergy at farmstead andcommunity levels in rural Mozambique. Biofuels Bioprod. Biorefining 2011, 5, 151–164. [CrossRef]
19. Cramer, J.; Wissema, E.; van Bruijne, M.; Lammers, E.; Dijk, D.; Jager, H.; van Bennekom, S.; Breunese, E.;Horster, R.; van Leenders, C.; et al. Testing Frameworks for Sustainable Biomass; Project Group SustainableProduction of Biomass: Amsterdam, The Netherlands, 2007.
20. Dornburg, V. Multi-Functional Biomass Systems; Utrecht University: Utrecht, The Netherlands, 2004; 216p.21. Searchinger, T. Use of US croplands for biofuels increases greenhouse gases through emissions from land-use
change. Science 2008, 319, 1238–1240. [CrossRef] [PubMed]22. Baldassano, J.M.; Soriano, C. Emission of greenhouse gases from anaerobic digestion processes: comparison
with other municipal solid waste treatments. Water Sci. Technol. 2000, 41, 275–282. [CrossRef]23. Borjesson, P.; Berglund, M. Environmental systems analysis of biogas systems—Part I: Fuel-cycle emissions.
Biomass Bioenergy 2006, 30, 469–485. [CrossRef]24. Borjesson, P.; Berglund, M. Environmental systems analysis of biogas systems—Part II: The environmental
impact of replacing various reference systems. Biomass Bioenergy 2007, 31, 326–344. [CrossRef]25. Cereda, M.P.; Takahashi, M. Cassava wastes: Their characterization, and uses and treatment in Brazil.
In Cassava Flour and Starch: Progress in Research and Development; CIAT: Palmira, Colombia, 1996.26. Howeler, R.H. Nutrient inputs and losses in cassava-based cropping systems: Examples from Vietnam and
Thailand. In Proceedings of the Workshop on Nutrient Balances for Sustainable Agriculture Production andNatural Resource Management in Southeast Asia, Bangkok, Thailand, 20–22 February 2001.
27. Klinsukont, C.; Ploypatarapinyo, S.; Dararatana, K.; Pingchavalitsophee, J.; Chetthadomdecha, J. WastewaterTreatment System for Cassava Ethanol Distillery; Institute of Scientific and Technological Research: Bangkok,Thailand, 1991.
28. Nguyen, T.L.T.; Gheewala, S.; Garivait, S. Energy balance and GHG-abatement cost of cassava utilization forfuel ethanol in Vietnam. Energy Policy 2007, 35, 4585–4596. [CrossRef]
29. IPCC. Revised 1996 IPCC Guidelines for National Greenhouse Gas Inventories. 1996. Available online:http://www.ipcc-nggip.iges.or.jp/public/gl/invs6a.html (accessed on 10 March 2008).
30. ACCEFYN. Factores de Emisión de los Combustibles Colombianos- Emission Factors for Colombian Fuels; AcademiaColombiana de Ciencias Exactas, Físicas y Naturales: Bogotá, Colombia, 2003. Available online: http://www.siame.gov.co/siame/documentos/documentacion/mdl/DOC/18_FECOC.doc (accessed on 12 May 2007).
31. Patzek, T. Thermodynamics of the Corn-Ethanol Biofuel Cycle. Crit. Rev. Plant Sci. 2004, 23, 519–567.[CrossRef]
32. De Carvalho Macedo, I.; Lima Verde Leal, M.; Azevedo Ramos da Silva, J. Assessment of Greenhouse GasEmissions in the Production and Use of Ethanol in Brazil; Government of the State of Sao Paulo: Sao Paulo,Brazil, 2004; 37p.
33. ACCEFYN. Inventario Preliminar de Gases de Efecto Invernadero, Fuentes y Sumideros: Colombia-1990;Academia Colombiana de Ciencias Exactas, Físicas y Naturales: Bogotá, Colombia, 1990; Available online:http://www.accefyn.org.co/Web_GEI(actualizada)/Archivos_gei/I_Cap00_Generalidades.PDF (accessed on10 February 2009).
Sustainability 2019, 11, 3968 22 of 23
34. UPME. Metodología Simplificada Para el Cálculo de la Línea base para Proyectos de Pequeña Escala; Unidad dePlaneación Minero Energética: Bogotá, Colombia, 2004; 12p.
35. Fluck, R.C. Energy in Farm Production; Elsevier: Amsterdam, The Netherlands, 1992.36. Kongshaug, G. Energy consumption and greenhouse gas emissions in fertilizer production. In Proceedings
of the IFA Technical Conference, Marrakech, Morocco, 28 September–1 October 1998.37. Maraseni, T.; Cockfield, G.; Apan, A. A comparison of greenhouse gas emissions from inputs into farm
enterprises in Southeast Queensland, Australia. J. Environ. Sci. Health Part A 2007, 42, 11–18. [CrossRef]38. Bastianoni, S.; Marchettini, N. Ethanol production from biomass: Analysis of process efficiency and
sustainability. Biomass Bioenergy 1996, 11, 411–418. [CrossRef]39. IDEAM. Available online: www.ideam.gov.co (accessed on 10 February 2009).40. Howeler, R.H.; Cadavid, L.F. Short-and long-term fertility trials in Colombia to determine the nutrient
requirements of cassava. Fertil. Res. 1990, 26, 61–80. [CrossRef]41. Hogevorst, S. The Sustainability of Cassava Based Bioethanol Production in Colombia: The Added Value of Anaerobic
Digestion; Wageningen University: Wageningen, The Netherlands, 2007.42. Ceballos, H. La yuca en Colombia y el Mundo: Nuevas Perspectivas para un Cultivo Milenario. In La Yuca
en el Tercer Milenio. Sistemas Modernos de Producción, Procesamiento, Utilización y Comercialización; Ospina, B.,Ceballos, H., Eds.; CIAT, CLAYUCA: Cali, Colombia, 2002.
43. Arriaga Sierra, H. Economic Benefit and Costs of Ethanol Production from Cssava in Colombia. Master’sThesis, Wageningen University, Wageningen, The Netherlands, 2008; 81p.
44. Ospina, B.; Cadavid, L.F.; Garcia, M.L.; Alcalde, C. Mechanization of Cassava Production in Colombia;Howeler, R.H., Ed.; CIAT: Bangkok, Thailand, 2002.
45. Caraballo, L.; Velásquez, E. Respuestas de tres cultivares de yuca a diferentes condiciones hídricas y fechasde cosecha. Agronomía Tropical 2000, 50, 267–284.
46. Cock, J.H. Cassava: New Potential for a Neglected Crop; Westview Press Inc.: Boulder, CO, USA, 1985.47. Perez-Crespo. Integrated Cassava Projects; Report nr Working document No. 78; Catholic Relief Services:
Baltimore, MD, USA, 1991.48. Ospina, B.; García, M.L.; Alcalde, A. Sistemas mecanizados de siembra y cosecha para el cultivo de la yuca.
In La Yuca en el Tercer Milenio. Sistemas Modernos de Producción, Procesamiento, Utilización y Comercialización;Ospina, B., Ceballos, H., Eds.; CIAT-CLAYUCA: Cali, Colombia, 2002.
49. Ospina, B.; Best, R.; Alonso, L. Tecnologías para el manejo de la yuca en poscosecha. In La Yuca en el TercerMilenio. Sistemas Modernos de Producción, Procesamiento, Utilización y Comercialización; Ospina, B., Ceballos, H.,Eds.; CIAT-CLAYUCA: Cali, Colombia, 2002.
50. Castaño, H.; Cardona, M.; Mejía, C.; Acosta, A. Ethanol production from cassava flour in simultaneousenzymatic hydrolysis and fermentation system. Dyna 2011, 78, 158–166.
51. López, J. Semilla vegetativa de yuca. In La Yuca en el Tercer Milenio. Sistemas Modernos de Producción,Procesamiento, Utilización y Comercialización; Ospina, B., Ceballos, H., Eds.; CIAT, CLAYUCA: Cali,Colombia, 2002.
52. Tchobanoglous, G.; Burton, F.; Stensel, D. Wastewater Engineering Treatment and Reuse; McGraw-Hill: New York,NY, USA, 2004.
53. Maroulis, Z.; Zaravacos, G. Food Process Design; CRC Press: Boca Raton, FL, USA, 2003; 536p.54. Drosg, B.; Wirthensohn, T.; Konrad, G.; Hornbachner, D.; Loderer, C.; Waltenberger, R.; Kyrchmayr, R.;
Braun, R. Comparing central and peripheral anaerobic digestion of stillage from a large-scale bioethanolplant to animal feed production. Water Sci. Technol. 2008, 58, 1483–1489. [CrossRef] [PubMed]
55. De Mes, T.Z.D.; Stams, A.J.M.; Reith, J.H.; Zeeman, G. Methane production by anaerobic digestion ofwastewater and solid wastes. In Bio-Methane & Bio-Hydrogen. Status and Perspectives of Biological Methaneand Hydrogen Production; Reith, J.H., Wijfels, R.H., Barten, H., Eds.; Dutch Biological Hydrogen Foundation:The Hague, The Netherlands, 2003; pp. 58–102.
56. Berglund, M.; Borjesson, P. Assessment of energy performance in the life-cycle of biogas production.Biomass Bioenergy 2006, 30, 254–266. [CrossRef]
57. Nandy, T.; Shastry, S.; Kaul, S.N. Wastewater management in a cane molasses distillery involving bioresourcerecovery. J. Environ. Manag. 2002, 65, 25–38. [CrossRef]
58. Berglund, M. Biogas Production from a Systems Analytical Perspective. Ph.D. Thesis, Lund University,Lund, Sweden, 2006; 164p.
Sustainability 2019, 11, 3968 23 of 23
59. Lehtomaki, A.; Bjornsson, L. Two-stage anaerobic digestion of energy crops: Methane production, nitrogenmineralization and heavy metal mobilization. Environ. Technol. 2006, 27, 209–218. [CrossRef] [PubMed]
60. De Vries, J.W. Closing Material Cycles through Reincorporation of Digested Crop Material into theFarming Environment: Agricultural and Environmental Implications; Wageningen University: Wageningen,The Netherlands, 2007; 107p.
61. Cuzin, N.; Farinet, J.L.; Segretain, C.; Labat, M. Methanogenic fermentation of cassava peel using a pilot plugflow digester. Bioresour. Technol. 1992, 41, 259–264. [CrossRef]
62. Mai, H.N.P. Integrated Treatment of Tapioca Processing Industrial Wastewater. Based on EnvironmentalBiotechnology. Ph.D. Thesis, Wageningen University, Wageningen, The Netherlands, 2006; 177p.
63. Angelidaki, I.; Sanders, W. Assessment of the anaerobic biodegradability of macropollutants. Re/ViewsEnviron. Sci. Bio/Technol. 2004, 3, 1–13. [CrossRef]
64. United States Environmental Protection Agency—EPA. Solid Waste Management and Greenhouse Gases:A Life-Cycle Assessment of Emissions and Sinks, 3rd ed.; EPA: Washington, DC, USA, 2006; p. 170.
65. IICA. Observatorio Agrocadenas de Colombia; Ministerio de Agricultura y Desarrollo Rural: Bogotá, Colombia,2006. Available online: www.agrocadenas.gov.co (accessed on 10 February 2009).
66. Nguyen, T.L.T.; Gheewala, S.H. Life cycle assessment of fuel ethanol from Cassava in Thailand. Int. J. LifeCycle Assess. 2008, 13, 147–154. [CrossRef]
67. Von Blottnitz, H.; Curran, M.A. A review of assessments conducted on bio-ethanol as a transportation fuelfrom a net energy, greenhouse gas, and environmental life cycle perspective. J. Clean. Prod. 2007, 15, 607–619.[CrossRef]
© 2019 by the authors. Licensee MDPI, Basel, Switzerland. This article is an open accessarticle distributed under the terms and conditions of the Creative Commons Attribution(CC BY) license (http://creativecommons.org/licenses/by/4.0/).