A Survey of Innovation through Duplication in the Reduced Genomes of Twelve Parasites
15
A Survey of Innovation through Duplication in the Reduced Genomes of Twelve Parasites Jeremy D. DeBarry 1,2 *, Jessica C. Kissinger 1,2,3 1 Center for Tropical and Emerging Global Diseases, University of Georgia, Athens, Georgia, United States of America, 2 Department of Genetics, University of Georgia, Athens, Georgia, United States of America, 3 Institute of Bioinformatics, University of Georgia, Athens, Georgia, United States of America Abstract We characterize the prevalence, distribution, divergence, and putative functions of detectable two-copy paralogs and segmental duplications in the Apicomplexa, a phylum of parasitic protists. Apicomplexans are mostly obligate intracellular parasites responsible for human and animal diseases (e.g. malaria and toxoplasmosis). Gene loss is a major force in the phylum. Genomes are small and protein-encoding gene repertoires are reduced. Despite this genomic streamlining, duplications and gene family amplifications are present. The potential for innovation introduced by duplications is of particular interest. We compared genomes of twelve apicomplexans across four lineages and used orthology and genome cartography to map distributions of duplications against genome architectures. Segmental duplications appear limited to five species. Where present, they correspond to regions enriched for multi-copy and species-specific genes, pointing toward roles in adaptation and innovation. We found a phylum-wide association of duplications with dynamic chromosome regions and syntenic breakpoints. Trends in the distribution of duplicated genes indicate that recent, species-specific duplicates are often tandem while most others have been dispersed by genome rearrangements. These trends show a relationship between genome architecture and gene duplication. Functional analysis reveals: proteases, which are vital to a parasitic lifecycle, to be prominent in putative recent duplications; a pair of paralogous genes in Toxoplasma gondii previously shown to produce the rate-limiting step in dopamine synthesis in mammalian cells, a possible link to the modification of host behavior; and phylum-wide differences in expression and subcellular localization, indicative of modes of divergence. We have uncovered trends in multiple modes of duplicate divergence including sequence, intron content, expression, subcellular localization, and functions of putative recent duplicates that highlight the role of duplications in the continuum of forces that have shaped these genomes. Citation: DeBarry JD, Kissinger JC (2014) A Survey of Innovation through Duplication in the Reduced Genomes of Twelve Parasites. PLoS ONE 9(6): e99213. doi:10. 1371/journal.pone.0099213 Editor: Kelly A. Brayton, Washington State University, United States of America Received March 3, 2014; Accepted May 12, 2014; Published June 11, 2014 Copyright: ß 2014 DeBarry, Kissinger. This is an open-access article distributed under the terms of the Creative Commons Attribution License, which permits unrestricted use, distribution, and reproduction in any medium, provided the original author and source are credited. Data Availability: The authors confirm that all data underlying the findings are fully available without restriction. All data are available are available at EuPathDB (http://eupathdb.org/eupathdb/) on the Data Download page. Protein-encoding gene sequences and IDs and genome sequences and IDs are available and organized by species. Funding: This work was supported by National Institutes of Health grant number R01AI068908 to J.C.K. The funders had no role in study design, data collection and analysis, decision to publish, or preparation of the manuscript. Competing Interests: The authors have declared that no competing interests exist. * E-mail: [email protected] Introduction Gene Duplications are Critical Components of Genome Evolution What is the relationship between gene creation and organismal biology? Is genomic location an important factor in gene creation, maintenance, and potential for evolutionary innovation? While there are cases of apparent de novo gene creation, duplication of existing genes appears more common [1,2]. Thus, to answer these questions it is necessary to first identify species-specific trends and patterns that link gene duplication, genome architecture, and organismal biology. Even a single gene duplication can have profound consequences. For example, Zimmerman et al. hypoth- esize that a single duplication of the Plasmodium vivax gene that encodes Duffy binding protein, which facilitates entry into red blood cells via binding to the Duffy blood group antigen, may be responsible for the increase of P. vivax human malaria observed in Duffy negative patients in sub-Saharan Africa [3]. Gene duplication mechanisms have been established (Reviewed in [4–7]), from studies of copy number variation and gene family amplifications [8–14], to the causes and effects of whole genome duplications [15,16]. The innovative potential of paralogs can be explored via sequence, structure, and functional studies of the genes following duplication. Genome-scale data sets provide the means to discover the collective contribution of paralogs to gene repertoires, genome evolution, genome architecture, and adapta- tion across related species. The actual contribution of duplications to genome evolution is sure to be greater than what can be detected. Much duplication is quickly removed, or has diverged beyond detection. Genome assemblies may underestimate duplications due to difficulties in assembling repetitive genomic regions, especially with short-read sequences. Despite these limitations, valuable information about the trends and patterns in gene creation and subsequent diversification (or not) can be gathered from the data that are available. Genomic distributions of duplications have been used to identify regions of rapid chromosomal evolution, where they PLOS ONE | www.plosone.org 1 June 2014 | Volume 9 | Issue 6 | e99213
-
Upload
independent -
Category
Documents
-
view
0 -
download
0
Transcript of A Survey of Innovation through Duplication in the Reduced Genomes of Twelve Parasites

A Survey of Innovation through Duplication in theReduced Genomes of Twelve ParasitesJeremy D. DeBarry1,2*, Jessica C. Kissinger1,2,3
1 Center for Tropical and Emerging Global Diseases, University of Georgia, Athens, Georgia, United States of America, 2 Department of Genetics, University of Georgia,
Athens, Georgia, United States of America, 3 Institute of Bioinformatics, University of Georgia, Athens, Georgia, United States of America
Abstract
We characterize the prevalence, distribution, divergence, and putative functions of detectable two-copy paralogs andsegmental duplications in the Apicomplexa, a phylum of parasitic protists. Apicomplexans are mostly obligate intracellularparasites responsible for human and animal diseases (e.g. malaria and toxoplasmosis). Gene loss is a major force in thephylum. Genomes are small and protein-encoding gene repertoires are reduced. Despite this genomic streamlining,duplications and gene family amplifications are present. The potential for innovation introduced by duplications is ofparticular interest. We compared genomes of twelve apicomplexans across four lineages and used orthology and genomecartography to map distributions of duplications against genome architectures. Segmental duplications appear limited tofive species. Where present, they correspond to regions enriched for multi-copy and species-specific genes, pointing towardroles in adaptation and innovation. We found a phylum-wide association of duplications with dynamic chromosome regionsand syntenic breakpoints. Trends in the distribution of duplicated genes indicate that recent, species-specific duplicates areoften tandem while most others have been dispersed by genome rearrangements. These trends show a relationshipbetween genome architecture and gene duplication. Functional analysis reveals: proteases, which are vital to a parasiticlifecycle, to be prominent in putative recent duplications; a pair of paralogous genes in Toxoplasma gondii previously shownto produce the rate-limiting step in dopamine synthesis in mammalian cells, a possible link to the modification of hostbehavior; and phylum-wide differences in expression and subcellular localization, indicative of modes of divergence. Wehave uncovered trends in multiple modes of duplicate divergence including sequence, intron content, expression,subcellular localization, and functions of putative recent duplicates that highlight the role of duplications in the continuumof forces that have shaped these genomes.
Citation: DeBarry JD, Kissinger JC (2014) A Survey of Innovation through Duplication in the Reduced Genomes of Twelve Parasites. PLoS ONE 9(6): e99213. doi:10.1371/journal.pone.0099213
Editor: Kelly A. Brayton, Washington State University, United States of America
Received March 3, 2014; Accepted May 12, 2014; Published June 11, 2014
Copyright: � 2014 DeBarry, Kissinger. This is an open-access article distributed under the terms of the Creative Commons Attribution License, which permitsunrestricted use, distribution, and reproduction in any medium, provided the original author and source are credited.
Data Availability: The authors confirm that all data underlying the findings are fully available without restriction. All data are available are available at EuPathDB(http://eupathdb.org/eupathdb/) on the Data Download page. Protein-encoding gene sequences and IDs and genome sequences and IDs are available andorganized by species.
Funding: This work was supported by National Institutes of Health grant number R01AI068908 to J.C.K. The funders had no role in study design, data collectionand analysis, decision to publish, or preparation of the manuscript.
Competing Interests: The authors have declared that no competing interests exist.
* E-mail: [email protected]
Introduction
Gene Duplications are Critical Components of GenomeEvolution
What is the relationship between gene creation and organismal
biology? Is genomic location an important factor in gene creation,
maintenance, and potential for evolutionary innovation? While
there are cases of apparent de novo gene creation, duplication of
existing genes appears more common [1,2]. Thus, to answer these
questions it is necessary to first identify species-specific trends and
patterns that link gene duplication, genome architecture, and
organismal biology. Even a single gene duplication can have
profound consequences. For example, Zimmerman et al. hypoth-
esize that a single duplication of the Plasmodium vivax gene that
encodes Duffy binding protein, which facilitates entry into red
blood cells via binding to the Duffy blood group antigen, may be
responsible for the increase of P. vivax human malaria observed in
Duffy negative patients in sub-Saharan Africa [3].
Gene duplication mechanisms have been established (Reviewed
in [4–7]), from studies of copy number variation and gene family
amplifications [8–14], to the causes and effects of whole genome
duplications [15,16]. The innovative potential of paralogs can be
explored via sequence, structure, and functional studies of the
genes following duplication. Genome-scale data sets provide the
means to discover the collective contribution of paralogs to gene
repertoires, genome evolution, genome architecture, and adapta-
tion across related species.
The actual contribution of duplications to genome evolution is
sure to be greater than what can be detected. Much duplication is
quickly removed, or has diverged beyond detection. Genome
assemblies may underestimate duplications due to difficulties in
assembling repetitive genomic regions, especially with short-read
sequences. Despite these limitations, valuable information about
the trends and patterns in gene creation and subsequent
diversification (or not) can be gathered from the data that are
available. Genomic distributions of duplications have been used to
identify regions of rapid chromosomal evolution, where they
PLOS ONE | www.plosone.org 1 June 2014 | Volume 9 | Issue 6 | e99213

presumably serve as catalysts for the generation of adaptive and
diversifying functions [17,18]. For example, duplications in the
primate lineage have been implicated in gene creation, genome
rearrangements, and potentially in shaping human genetic
variation [19].
Genome Cartography is an Effective ComparativeGenomics Strategy
Genome sequences can serve as records of the adaptive histories
of their evolution [20]. By contextualizing genomes as ancient fluid
landscapes and mapping their features, it is possible to ‘get the lay
of the land’, and to compare and contrast the evolutionary forces
that have contributed to the variable genomic landscapes we
observe [21]. Mapping the distributions of detected duplications
can illustrate how they contribute to genome evolution and how
they evolve with time. Thus, duplications can, and have, served as
both a primary focus, and as tools to investigate molecular
evolution within and between genomes [4,6,8,18,19]. In this study,
we focus on an examination of duplications in the realm of
intracellular parasites and extreme genome reduction.
Apicomplexa: Characterization of Duplications in TwelveSpecies
The Apicomplexa are a eukaryotic phylum of unicellular
parasites responsible for significant human and veterinary disease
that affect millions worldwide. Diseases include malaria and
AIDS-related toxoplasmosis and cryptosporidiosis. Only a single
species has been shown to deviate from obligate intracellular
parasitism [22]. Apicomplexans in this study are grouped into four
lineages: Plasmodium spp. (agents of malaria), piroplasms (Babesia
and Theileria spp.), coccidians (Toxoplasma gondii and Neospora
caninum), and Cryptosporidium spp. Genome sizes and chromosome
numbers vary and gene repertoires are greatly reduced compared
to model eukaryotes (Figure 1 and Figure 2). Relationships in
Figure 1 are adapted from [21,23–25]. Genomic streamlining and
gene loss are major forces across the phylum (Reviewed in [21]).
Given the relationship between gene repertoires and niche
potential, the duplication of genetic material and its impact on
host range and pathogenicity are of particular interest. Loss of
synteny is very high compared to other eukaryotes, including other
parasites [23,26]. Transposable elements (TEs) which are ubiqui-
tous in all other phyla studied to date, as well as major contributors
to gene duplication and genome rearrangement, are conspicuously
absent in most apicomplexans, including those studied here (Barrie
A, Cheng S, Kissinger J, Pritham E, personal communication)
[27,28]. Apicomplexans offer an opportunity to explore the role of
gene duplication in the evolution of parasite genome sequences
over ,420 my [29,30], in the context of extreme genome
reduction. Since apicomplexan genomes are streamlined, dupli-
cations detected in the phylum are likely important to parasite
biology.
We used in silico methods to identify homologs in twelve species
comprising four apicomplexan lineages and identify two-copy
genes (duplicates) and segmental duplications in the genome
assemblies and annotations of each species. We chose two-copy
genes in an attempt to identify putative recent duplications and to
design questions focused on chromosomal distribution and copy
number evolution. We have investigated the scale, genomic
distributions, general timing, divergence, and functional conse-
quences of these duplications phylum-wide. For the Apicomplexa,
these data represent the first step towards answering the questions
posed above.
Methods
Data, Homolog Clusters, and Copy NumberDetermination
All data are from the most recent genome release at the time of
analysis. Annotated protein-encoding gene sequences, gene IDs,
functional annotations, gene coordinates, and the numbers, sizes,
and IDs of all chromosomes/contigs/scaffolds for all species were
obtained as follows: P. falciparum, P. vivax, P. knowlesi, P. berghei, and
P. chabaudi data were downloaded from PlasmoDB [31] version
7.0. C. muris and C. parvum data were downloaded from CryptoDB
[32] version 4.3. The 45 scaffolds from C. muris are not assigned to
chromosomes and are numbered 1–45. T. gondii and N. caninum
data were obtained from ToxoDB [33] version 6.2. B. bovis, T.
annulata, and T. parva data were downloaded from NCBI (http://
www.ncbi.nlm.nih.gov/) in March 2011. B. bovis data from
chromosomes 1 and 4 were present in fragments (7 and 3
respectively) caused by genome assembly gaps. Accession numbers
for these fragments are: Chromosome 1: AAXT01000005
AAXT01000006 AAXT01000008 AAXT01000009
AAXT01000010 AAXT01000011 and AAXT01000012, Chro-
mosome 2: Nc_010574, Chromosome 3: Nc_0105745, Chromo-
some 4: AAXT01000002 AAXT01000004 and AAXT01000013.
Homologs were clustered using WU-BLAST (http://blast.wustl.
edu/) (version 2.2.6), BLASTp [34], and OrthoMCL [35] as
described in [23]. Two-copy paralogs were parsed from
OrthoMCL output. As a guard against potential false positives,
available annotation information was consulted when available.
There were no cases of conflicting functional information among
cluster members. Thirty-nine potential P. falciparum duplicate pairs
were identified as completely overlapping gene models in
PlasmoDB and removed. Twenty-three additional duplicate pairs
were removed based on annotations from EuPathDB [36], either
because they likely belong to larger gene families, or because they
are annotated as pseudogenes. Ortholog copy numbers in the
closest relative(s) were parsed from OrthoMCL output.
Duplicate Gene DistributionsGene coordinates were used to classify duplicates as dispersed or
tandem. We define tandem duplicates based on the number of
intervening genes, #5, and the distance between them, #1% total
chromosome length. Most tandem duplicates have zero or one
intervening genes. Some duplicates have one or both members on
unassigned contigs. In these cases, the actual distribution could not
be determined and these were counted as dispersed: P. knowlesi has
three duplicate pairs where one member is on an unassigned
contig, P. vivax has ten with both members unassigned and fifteen
with one member unassigned, P. chabaudi has one with both
members unassigned and two with one member unassigned, P.
berghei has two with one member unassigned, T. gondii has two with
both members unassigned and two with one member unassigned,
N. caninum has one with both members unassigned and seven with
one member unassigned.
Segmental Duplications, Synteny, Gene Classes, andVisualization
Synteny and gene classes (core, species-specific, and multi-copy)
were calculated as in [23]. Briefly, all homologs detected by
OrthoMCL were input into MCSCAN [37] to calculate synteny
between all combinations of genomes. Parameters for synteny
detection are based on validated parameters from [23]. Gene
classes were parsed from OrthoMCL output. MCSCAN returned
segmental duplications as regions of within-genome synteny.
Unique gene IDs for syntenic markers were extracted from
Innovation through Duplication in the Genomes of Twelve Parasites
PLOS ONE | www.plosone.org 2 June 2014 | Volume 9 | Issue 6 | e99213

MCSCAN output. The position of genes relative to chromosome
ends and syntenic blocks are based on coordinates in MCSCAN
output. Duplicates on unassigned contigs were not included in
gap/end analyses. Visualizations of gene distributions, segmental
duplications, and synteny were produced from gene coordinates
and parsed MCSCAN output via Circos [38].
Duplicate DiversificationNucleotide sequences for P. falciparum and T. gondii duplicates
were obtained from EuPathDB. In separate analyses for each
species, all sequences from homolog clusters containing duplicates
were pooled in an all-by-all BLASTn (version 2.2.6, E-value cutoff
161023). To classify the level of similarity between duplicates,
alignments were manually inspected to identify pairs with no (no
hits between duplicates), weak (,200 bp hits that collectively
cover less than half of both duplicates), or strong (.80% identity
hits over more than half the total length of both members)
similarity.
Intron counts for all duplicates are from a search of gene IDs at
EuPathDB. Gene-product localization information was harvested
from the ApiLoc database [39]. IDs of all duplicates were used to
search the ApiLoc database. C. muris was the only species without
ApiLoc data. Localization data were available for a total of fifty
genes, mostly from P. falciparum and T. gondii.
Comparisons of expression profiles for duplicates identified in P.
falciparum and T. gondii genomes were based on searches of
microarray data at PlasmoDB and ToxoDB respectively. For P.
falciparum strain 3D7, all available time courses of the ‘‘Erythro-
cytic expression time series (3D7,DD2, & HB3)’’ from [40] were
searched based on the expression percentile values. All samples
were searched for minimum and maximum expression percentiles
of 50 and 100 respectively. For T. gondii, all available time courses
of the ‘‘T.g. Cell Cycle (percentile)’’ from [41] were searched based
on the expression percentile values. All samples were searched for
minimum and maximum expression percentiles of 50 and 100
respectively. Next we searched for duplicates with similar
expression profiles over the same, or shifted, time points for each
species. PlasmoDB’s expression profile comparison tool for this
Figure 1. Scale, scope, and outcome of detected apicomplexan innovative duplication. Cladogram branch colors indicate major lineages.Strains follow species names. Genome sizes and protein-encoding gene counts are below each species name. Circles located on each branch containcounts, results, and trends for detected measures of innovation and are only present if data were available. For ‘Two-Copy Gene Duplication’,numbers are for total duplicate pairs or pairs with detected differences. ‘Species-Centric Duplications’ includes two categories: ‘species-specific pairs’and ‘pairs with single copy ortholog’. ‘Differential Expression’ circles indicate detected differences over pairs with available data. A 60% cutoff wasused to identify the major trend for ‘Distribution’ and ‘Intron Number’. Numbers in white circles are of unique genes in segmental duplications. Whitecircles are scaled versions of distributions. Red ‘X’s = ‘none detected’.doi:10.1371/journal.pone.0099213.g001
Innovation through Duplication in the Genomes of Twelve Parasites
PLOS ONE | www.plosone.org 3 June 2014 | Volume 9 | Issue 6 | e99213

data set was used to compare profiles for each gene against the
profiles of all other genes. To search over the same time points, a
Euclidean search was used that allowed for a maximum 10% of
missing data points and a positive correlation with a 0-hour time
shift. To search over shifted time points, the same strategy was
used, but additional time points were also searched in 6-hour
increments (224, 218, 212, 26, 6, 12, 18, 24 hour time points
from 48 total time points). ToxoDB’s expression profile compar-
ison tool for this data set was used to compare profiles for each
gene against the profiles of all other genes. To search over the
same time points, a Euclidean search was used that allowed for a
maximum 10% of missing data points and a positive correlation
with a 0-hour time shift. To search over shifted time points, the
same strategy was used, but additional time points were also
searched in 2-hour increments (26, 24, 22, 2, 4, 6 time points
from 12 time points total). The ‘expression profile comparison’
tools at PlasmoDB and ToxoDB search within an experiment and
return genes with similar profiles. There were only a few duplicate
pairs with data from each species. Because no statistically
significant measure of similarity (e.g. p-value) is returned by this
search tool, profile matches between duplicates were manually
inspected to verify similarity.
BLAST2GO Functional AnalysesWe installed a local instance of BLAST2GO (B2G) version 2.5.0
[42]. All requisite databases were current at the time of analysis.
Protein sequences from all species were run through the B2G
pipeline according to documentation instructions. Because of the
large number of sequences investigated, BLAST and InterProScan
[43] steps were performed independently. All protein-encoding
sequences from all species were searched (BLASTp version 2.2.20)
against the latest available GenBank nr database with an E-value
cutoff of 161023. B2G steps used default parameters, with the
exception of the HSP cutoff percentage during the annotation
step, which was set to 25%. This parameter is intended to guard
against spurious domain matches. We tested HSP cutoffs of 50%
and 25%. Relaxing this parameter provided annotations for 1,167
additional sequences. InterProScan results greatly enhance the
ability of B2G to annotate sequences. InterProScan (version 4.8)
was run at the command line for all sequences. The –iprlookup, -
goterms, and –nocrc flags were used. The B2G Annex tool was
run to augment annotation. To capture as much available
functional information as possible, existing GO terms and EC
numbers for all genes from EUPathDB were manually incorpo-
rated into the B2G data.
To investigate functional trends among putative recently
duplicated genes and genes used as markers of segmental
duplications, we assembled sets of gene IDs and queried our
B2G database for each species. The number of putatively recent
duplicate genes with available GO annotations is generally low for
all species: B. bovis 38/52, C. muris 6/12, C. parvum 10/12, N.
caninum 23/36, P. berghei 8/26, P. chabaudi 4/6 P. falciparum 12/12,
P. knowlesi 11/26, P. vivax 32/46, T. annulata 6/20, T. gondii 59/96,
T. parva 40/76, for a total of 249/420. The number of genes with
GO annotations for markers of segmental duplications is even
lower: B. bovis 0/96, P. berghei 1/24, P. chabaudi 7/203, P. falciparum
180/216, T. annulata 4/19, for a total of 192/558. We also
searched the three main GO categories for statistical over- and
under-representations of terms. Two-tailed significance tests with
an alpha of 0.05 and an FDR correction were used for significance
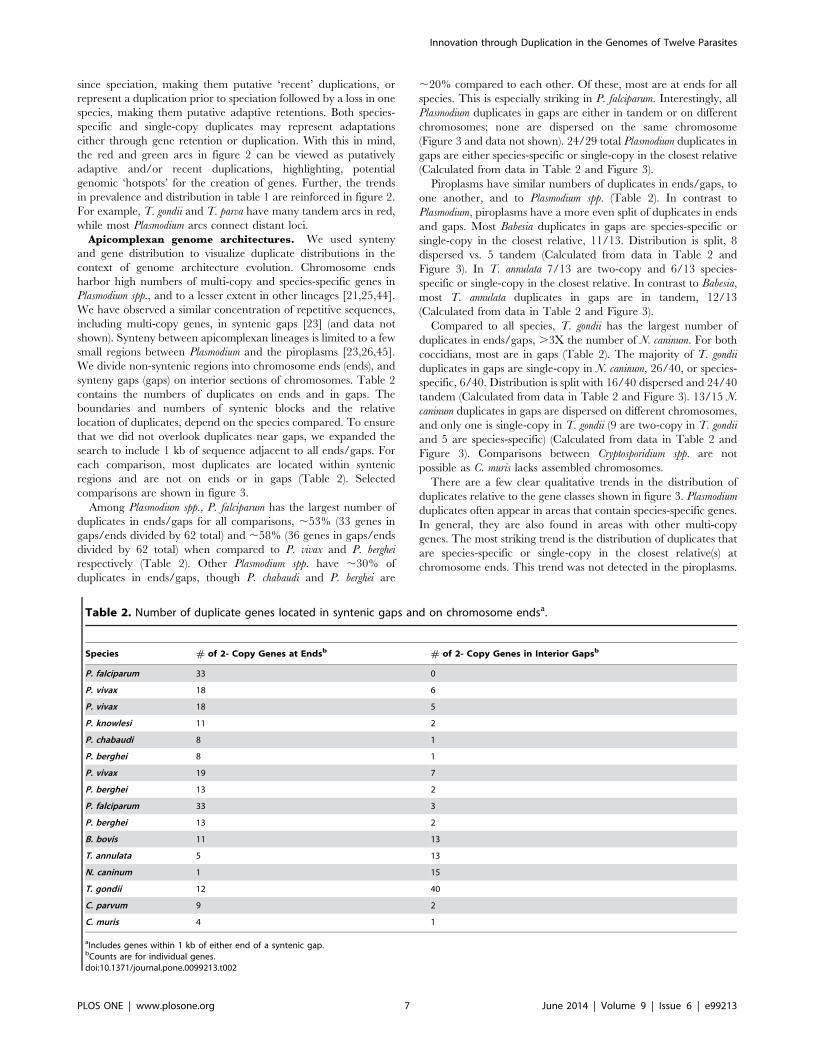
Figure 2. Duplicate gene distribution with respect to genome architecture. Colored circles represent the chromosomes and contigs in eachgenome (one color gradient/genome). Each species’ genome is labeled with the genus species abbreviation and chromosome/contig number Smallunassembled contigs appear as black lines at the end of the respective genome sequence. Species are grouped based on genome size andkaryotype. Tick marks = 1 Mb in A and 100 kb in B. Arcs connect two-copy paralog loci. All arcs have two ends; tandem copies may appear as a singleline. Paralog start and stop coordinates on chromosomes/contigs are expanded for visualization. Arc colors identify ortholog copy number in theclosest relative(s). Black = two-copy, Green = species-specific, Red = one copy, Blue.two-copy. Pf = Plasmodium falciparum, Pv = P. vivax,Tg = Toxoplasma gondii, Tp = Theileria parva, Cp = Cryptosporidium parvum. Red arrows in B indicate the fatty acid synthase and polyketide synthasegenes.doi:10.1371/journal.pone.0099213.g002
Innovation through Duplication in the Genomes of Twelve Parasites
PLOS ONE | www.plosone.org 4 June 2014 | Volume 9 | Issue 6 | e99213

tests. All available protein-encoding genes were used as a reference
for each species. Statistical differences were only detected in 5/12
species and were generally weak (data not shown).
Results
TerminologyIn this study, duplications are defined as protein-encoding
paralogs, i.e., at least two copies of a gene within the same genome
sequence. Copy number is the total number of paralogs identified
in a genome sequence. Multi-copy genes have at least two
paralogs. Two-copy paralogs have exactly two copies, and are
referred to as duplicates throughout. Tandem duplicates are
located near one another on the same chromosome (see Materials
and Methods) while dispersed duplicates are on different
chromosomes, or distant on the same chromosome. We identified
all detectable homologous gene clusters (orthologs and paralogs) in
the investigated species (see Materials and Methods). We classified
orthologs based on their copy numbers between species. Core
genes are defined as having at least one ortholog in all investigated
species. Species-specific genes have no orthologs in investigated
species. Synteny markers are conserved orthologs in syntenic
blocks. Synteny gaps are the non-syntenic regions between
syntenic blocks. We define chromosome ends as the areas between
the ends of available chromosome sequence and the first syntenic
block. Segmental duplications are defined as within-genome
synteny detected via paralogous syntenic markers. These regions
span multiple genes, but are distinct from whole genome
duplications [19].
Prevalence and Distribution of DuplicatesIdentification and trends. We used all annotated protein-
encoding genes from the twelve species in figure 1 to cluster
orthologs and paralogs in all species. Duplicates in each species
were identified from the subset of genes with paralogs, regardless
of ortholog copy numbers (see Materials and Methods). Gene IDs
for all duplicates are in table S1. We classified the chromosomal
distribution of all duplicates as dispersed or tandem. Duplications
can be created in tandem or as dispersed copies. Tandem gene
duplications are generally the result of unequal crossing over that
deletes sequence and replaces it with a duplicate copy of a gene.
Dispersed gene duplications generally occur through reverse
transcription of mRNA intermediates, and insertion of an
intronless cDNA into the genome, usually in an unlinked location.
Once created, tandem duplications may become dispersed via
genome rearrangement. It is less likely that dispersed duplicates
will become tandem due to rearrangement. Figure 1 and table 1
contain the numbers of duplicates for each species.
There are trends in the prevalence and distribution of the 1,062
detected duplicates, both within and among the four lineages
(Figure 1). Most duplicates in the genus Plasmodium are dispersed.
P. vivax contains more duplicates (tandem or dispersed) than other
Plasmodium species, though only 12 more than P. falciparum. In
contrast, most duplicates within the piroplasms are tandem. Since
piroplasms have fewer chromosomes than other species (Figure 2),
it is reasonable to expect them to have more pairs on the same
chromosome relative to other species, but not necessarily in
tandem. T. annulata has far fewer duplicates than the other
piroplasms, comparable to Plasmodium, while B. bovis and T. parva
have roughly double the number. Coccidians have the largest
number of duplicates and T. gondii has the largest number overall.
The numbers of dispersed vs. tandem duplicates are more evenly
split in T. gondii than in any other species, including N. caninum,
where most are dispersed. Cryptosporidium spp. are the most similar
with the same number of duplicates in each species. The majority
of Cryptosporidium duplicates are dispersed despite high nucleotide
similarity.
Circos was used to map the location of duplicates in each
genome (Figure 2). Visualization places the data in an intuitive
genomic context, where comparisons of genomic characteristics
like size and karyotype are easily made, and provides a platform
for more detailed comparisons (see below). Most duplicates are
localized to chromosomes; with only a few on unassigned contigs
(see Materials and Methods). There is a qualitative association of
duplicates near chromosome ends in Plasmodium spp. and C. parvum.
The distribution of duplicates is more uniform in T. gondii and T.
parva. These trends hold for other species in each lineage (data not
shown), with the exception of C. muris where chromosome ends are
not available. This is explored quantitatively below. There is a
large arc (span across the Circos diagram) connecting C. parvum
chromosomes three and four in figure 2. These duplicates are
,25 kb (gene ID cgd3_2180) and ,40 kb (gene ID cgd4_2900) in
size. They represent the very large fatty acid synthase and
polyketide synthase respectively. C. muris, T. gondii, and N. caninum
have duplicates in the same ortholog cluster with similar
annotations, thus, this duplication is ancient and predates
speciation.
Copy number evolution. To place the distribution of
duplicates in an evolutionary context, we calculated copy numbers
of orthologs present in the closest relative(s) for each duplicate pair
(Table 1). For equally close relatives, we considered both species
(e.g. T. annulata and T. parva are equally distant from B. bovis).
Duplicates were classified as species-specific or: single-copy, also
two-copy, or greater than two-copy in the closest relative in table 1.
Arcs in figure 2 are color-coded accordingly. There are few cases
where duplicates have orthologs with a copy number greater than
two. These are mostly restricted to the piroplasms and coccidians.
All Plasmodium spp. have roughly the same number of duplicates
that are also two-copy in the closest relative (Table 1). However,
other categories show differences within the genus. P. falciparum
and P. vivax have the largest number of species-specific duplicates,
while P. knowlesi, P. vivax, and P. berghei have the largest numbers of
duplicates with single-copy orthologs in neighbors. In general,
dispersed duplicates outnumber tandem duplicates in all categories
for Plasmodium spp. As shown in the previous section, T. annulata has
fewer duplicates than the other piroplasms overall. This is most
striking in the species-specific and single-copy categories. In
contrast to Plasmodium spp., most piroplasm duplicates with single-
copy orthologs are in tandem (Table 1). The lack of species-specific
and single-copy duplicates in T. annulata largely accounts for its
overall lack of duplicates compared to other piroplasms, where B.
bovis and T. parva have at least ,three times as many in each
category.
T. gondii and N. caninum have many duplicates that are either
lineage- or species-specific (lineage-specific data not shown). While
there are some species-specific T. gondii duplicates, the bulk of the
difference in prevalence compared to N. caninum is in the single-
copy category (Table 1). Additionally, the majority of these relative
‘extras’ are in tandem in T. gondii. C. parvum and C. muris, the basal
lineage in this study, share most of their duplicates, and the bulk of
them are dispersed. In contrast to other lineages, there is a more
uniform distribution for duplicates that are single-copy in the
closest relative.
Ortholog copy number differences can be caused by gene gains
or losses. Duplicates with two-copy orthologs likely arose prior to
speciation. Species-specific duplicates could result from phylum-
wide gene losses, or species-specific gains. Duplicates with single-
copy orthologs in the closest relative may have been duplicated
Innovation through Duplication in the Genomes of Twelve Parasites
PLOS ONE | www.plosone.org 5 June 2014 | Volume 9 | Issue 6 | e99213

Ta
ble
1.
Du
plic
ate
ort
ho
log
pre
vale
nce
and
dis
trib
uti
on
com
par
ed
tocl
ose
stre
lati
ve(s
)a.
Sp
eci
es
To
tal
#o
fp
air
s#
of
spe
cie
s-sp
eci
fic
pa
irs
#o
fp
air
sw
ith
sin
gle
cop
yo
rth
olo
g
#o
fp
air
sw
ith
two
-co
py
ort
ho
log
s
#o
fp
air
sw
ith
.tw
o-c
op
yo
rth
olo
gs
Db
Tc
DT
DT
DT
DT
P.
falc
ipar
um
26
51
43
51
71
00
P.
kno
wle
si2
23
30
12
16
21
0
P.
viva
x2
91
57
51
58
62
10
P.
be
rgh
ei
16
91
05
89
11
0
P.
chab
aud
i1
93
72
30
91
00
B.
bo
visd
20
31
77
10
16
21
01
T.
ann
ula
ta7
22
21
19
31
11
1
T.
par
va1
85
18
33
35
41
13
2
T.
go
nd
ii5
94
93
81
33
54
23
13
N.
can
inu
m5
31
93
37
11
43
20
3
C.
mu
ris
24
43
04
21
72
00
C.
par
vum
21
71
13
31
72
01
aC
lose
stre
lati
ve(s
)b
ase
do
nFi
gu
re1
.B
oth
eq
ual
lyd
ista
nt
rela
tive
sw
ere
con
sid
ere
dfo
rP
.fa
lcip
aru
man
dB
.b
ovi
s.b
Pai
rm
em
be
rsar
ed
isp
ers
ed
.cP
air
me
mb
ers
are
inta
nd
em
.d
7p
airs
hav
ed
iffe
ren
to
rth
olo
gco
un
tsin
the
eq
ual
lyd
ista
nt
T.a
nn
ula
taan
dT.
pa
rva
.d
oi:1
0.1
37
1/j
ou
rnal
.po
ne
.00
99
21
3.t
00
1
Innovation through Duplication in the Genomes of Twelve Parasites
PLOS ONE | www.plosone.org 6 June 2014 | Volume 9 | Issue 6 | e99213
since speciation, making them putative ‘recent’ duplications, or
represent a duplication prior to speciation followed by a loss in one
species, making them putative adaptive retentions. Both species-
specific and single-copy duplicates may represent adaptations
either through gene retention or duplication. With this in mind,
the red and green arcs in figure 2 can be viewed as putatively
adaptive and/or recent duplications, highlighting, potential
genomic ‘hotspots’ for the creation of genes. Further, the trends
in prevalence and distribution in table 1 are reinforced in figure 2.
For example, T. gondii and T. parva have many tandem arcs in red,
while most Plasmodium arcs connect distant loci.
Apicomplexan genome architectures. We used synteny
and gene distribution to visualize duplicate distributions in the
context of genome architecture evolution. Chromosome ends
harbor high numbers of multi-copy and species-specific genes in
Plasmodium spp., and to a lesser extent in other lineages [21,25,44].
We have observed a similar concentration of repetitive sequences,
including multi-copy genes, in syntenic gaps [23] (and data not
shown). Synteny between apicomplexan lineages is limited to a few
small regions between Plasmodium and the piroplasms [23,26,45].
We divide non-syntenic regions into chromosome ends (ends), and
synteny gaps (gaps) on interior sections of chromosomes. Table 2
contains the numbers of duplicates on ends and in gaps. The
boundaries and numbers of syntenic blocks and the relative
location of duplicates, depend on the species compared. To ensure
that we did not overlook duplicates near gaps, we expanded the
search to include 1 kb of sequence adjacent to all ends/gaps. For
each comparison, most duplicates are located within syntenic
regions and are not on ends or in gaps (Table 2). Selected
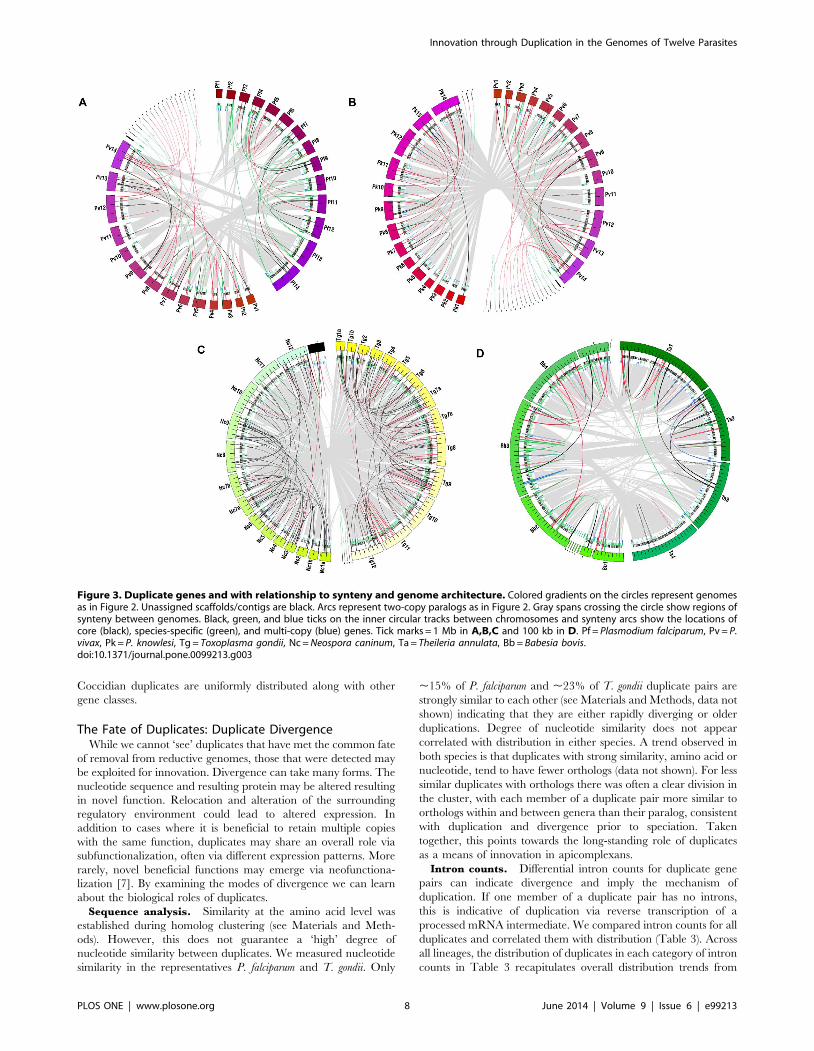
comparisons are shown in figure 3.
Among Plasmodium spp., P. falciparum has the largest number of
duplicates in ends/gaps for all comparisons, ,53% (33 genes in
gaps/ends divided by 62 total) and ,58% (36 genes in gaps/ends
divided by 62 total) when compared to P. vivax and P. berghei
respectively (Table 2). Other Plasmodium spp. have ,30% of
duplicates in ends/gaps, though P. chabaudi and P. berghei are
,20% compared to each other. Of these, most are at ends for all
species. This is especially striking in P. falciparum. Interestingly, all
Plasmodium duplicates in gaps are either in tandem or on different
chromosomes; none are dispersed on the same chromosome
(Figure 3 and data not shown). 24/29 total Plasmodium duplicates in
gaps are either species-specific or single-copy in the closest relative
(Calculated from data in Table 2 and Figure 3).
Piroplasms have similar numbers of duplicates in ends/gaps, to
one another, and to Plasmodium spp. (Table 2). In contrast to
Plasmodium, piroplasms have a more even split of duplicates in ends
and gaps. Most Babesia duplicates in gaps are species-specific or
single-copy in the closest relative, 11/13. Distribution is split, 8
dispersed vs. 5 tandem (Calculated from data in Table 2 and
Figure 3). In T. annulata 7/13 are two-copy and 6/13 species-
specific or single-copy in the closest relative. In contrast to Babesia,
most T. annulata duplicates in gaps are in tandem, 12/13
(Calculated from data in Table 2 and Figure 3).
Compared to all species, T. gondii has the largest number of
duplicates in ends/gaps, .3X the number of N. caninum. For both
coccidians, most are in gaps (Table 2). The majority of T. gondii
duplicates in gaps are single-copy in N. caninum, 26/40, or species-
specific, 6/40. Distribution is split with 16/40 dispersed and 24/40
tandem (Calculated from data in Table 2 and Figure 3). 13/15 N.
caninum duplicates in gaps are dispersed on different chromosomes,
and only one is single-copy in T. gondii (9 are two-copy in T. gondii
and 5 are species-specific) (Calculated from data in Table 2 and
Figure 3). Comparisons between Cryptosporidium spp. are not
possible as C. muris lacks assembled chromosomes.
There are a few clear qualitative trends in the distribution of
duplicates relative to the gene classes shown in figure 3. Plasmodium
duplicates often appear in areas that contain species-specific genes.
In general, they are also found in areas with other multi-copy
genes. The most striking trend is the distribution of duplicates that
are species-specific or single-copy in the closest relative(s) at
chromosome ends. This trend was not detected in the piroplasms.
Table 2. Number of duplicate genes located in syntenic gaps and on chromosome endsa.
Species # of 2- Copy Genes at Endsb # of 2- Copy Genes in Interior Gapsb
P. falciparum 33 0
P. vivax 18 6
P. vivax 18 5
P. knowlesi 11 2
P. chabaudi 8 1
P. berghei 8 1
P. vivax 19 7
P. berghei 13 2
P. falciparum 33 3
P. berghei 13 2
B. bovis 11 13
T. annulata 5 13
N. caninum 1 15
T. gondii 12 40
C. parvum 9 2
C. muris 4 1
aIncludes genes within 1 kb of either end of a syntenic gap.bCounts are for individual genes.doi:10.1371/journal.pone.0099213.t002
Innovation through Duplication in the Genomes of Twelve Parasites
PLOS ONE | www.plosone.org 7 June 2014 | Volume 9 | Issue 6 | e99213
Coccidian duplicates are uniformly distributed along with other
gene classes.
The Fate of Duplicates: Duplicate DivergenceWhile we cannot ‘see’ duplicates that have met the common fate
of removal from reductive genomes, those that were detected may
be exploited for innovation. Divergence can take many forms. The
nucleotide sequence and resulting protein may be altered resulting
in novel function. Relocation and alteration of the surrounding
regulatory environment could lead to altered expression. In
addition to cases where it is beneficial to retain multiple copies
with the same function, duplicates may share an overall role via
subfunctionalization, often via different expression patterns. More
rarely, novel beneficial functions may emerge via neofunctiona-
lization [7]. By examining the modes of divergence we can learn
about the biological roles of duplicates.
Sequence analysis. Similarity at the amino acid level was
established during homolog clustering (see Materials and Meth-
ods). However, this does not guarantee a ‘high’ degree of
nucleotide similarity between duplicates. We measured nucleotide
similarity in the representatives P. falciparum and T. gondii. Only
,15% of P. falciparum and ,23% of T. gondii duplicate pairs are
strongly similar to each other (see Materials and Methods, data not
shown) indicating that they are either rapidly diverging or older
duplications. Degree of nucleotide similarity does not appear
correlated with distribution in either species. A trend observed in
both species is that duplicates with strong similarity, amino acid or
nucleotide, tend to have fewer orthologs (data not shown). For less
similar duplicates with orthologs there was often a clear division in
the cluster, with each member of a duplicate pair more similar to
orthologs within and between genera than their paralog, consistent
with duplication and divergence prior to speciation. Taken
together, this points towards the long-standing role of duplicates
as a means of innovation in apicomplexans.
Intron counts. Differential intron counts for duplicate gene
pairs can indicate divergence and imply the mechanism of
duplication. If one member of a duplicate pair has no introns,
this is indicative of duplication via reverse transcription of a
processed mRNA intermediate. We compared intron counts for all
duplicates and correlated them with distribution (Table 3). Across
all lineages, the distribution of duplicates in each category of intron
counts in Table 3 recapitulates overall distribution trends from
Figure 3. Duplicate genes and with relationship to synteny and genome architecture. Colored gradients on the circles represent genomesas in Figure 2. Unassigned scaffolds/contigs are black. Arcs represent two-copy paralogs as in Figure 2. Gray spans crossing the circle show regions ofsynteny between genomes. Black, green, and blue ticks on the inner circular tracks between chromosomes and synteny arcs show the locations ofcore (black), species-specific (green), and multi-copy (blue) genes. Tick marks = 1 Mb in A,B,C and 100 kb in D. Pf = Plasmodium falciparum, Pv = P.vivax, Pk = P. knowlesi, Tg = Toxoplasma gondii, Nc = Neospora caninum, Ta = Theileria annulata, Bb = Babesia bovis.doi:10.1371/journal.pone.0099213.g003
Innovation through Duplication in the Genomes of Twelve Parasites
PLOS ONE | www.plosone.org 8 June 2014 | Volume 9 | Issue 6 | e99213

figure 1. Duplicates with different intron counts are most abundant
in the coccidians and T. parva, and generally underrepresented in
other lineages. Duplicates with one intron-less member were
counted separately. They are most common in Plasmodium spp.
where they are usually dispersed. Most Cryptosporidium duplicates
have no introns. This is unsurprising as introns are largely absent
in the genus, a common feature of genome reduction [46].
Gene expression. Duplicate genes can diverge via changes in
their promoters (or changes of their promoters via relocation) that
permit temporal and abundance changes in gene expression. We
searched available expression data to explore similarities and
differences in temporal gene expression profiles among duplicates
(see Materials and Methods). We focused on P. falciparum and T.
gondii because of the availability of relatively extensive expression
data for these species. Duplicates with expression data for each
paralog were limited (Figure 1 and Table 4). Gene expression
levels measured across multiple time points form a ‘profile’, with
peak expression at one measured time point. Genes with similar
profiles, over the same time points, have highly similar expression
profiles. Genes may also have similar profiles that are shifted in
time, with peak expression earlier or later. These may also be
considered similar profiles, though ‘shifted’. To differentiate
between these, expression profiles were searched with and without
time-shifts. P. falciparum has six duplicate pairs, mostly dispersed,
with similar profiles (with and without time-shifts) and six pairs,
also mostly dispersed, with different profiles (Table 4). The
majorities of pairs with data are dispersed for both species. For T.
gondii, the high number of pairs that are both dispersed and have
different expression profiles, points toward a correlation between
separation of duplicates in the genome and diverging expression,
though data are limited. We observed no trends in intron count,
ortholog copy number, or sequence similarity among those with
different expression profiles (data not shown). This is not entirely
unexpected as most are dispersed, making altered promoters a
likely cause of expression differences.
Subcellular localization. One of the most easily observed
indicators of divergence between paralogs is the differential
subcellular localization of gene products. We searched for
experimentally verified evidence of apicomplexan protein locali-
zation in the ApiLoc database (see Materials and Methods). We
found nine cases where each duplicate product has localization
evidence (Figure 1 and Table S2). In each case, the duplicate genes
are dispersed on different chromosomes. Eight of the duplicates
share the same, or similar, functional annotation. The remaining
duplicate has one member annotated as hypothetical. EuPathDB
gene IDs, annotated functions, and subcellular locations of gene
products are in table S2. Most (7/9) duplicates have differences in
the localization of their gene products. In the remaining cases, a
clear comparison could not be made. In two of the duplicate pairs,
C. parvum polyketide synthases and T. gondii acetyl co-a carbox-
ylases it appears that one copy of the pair was acquired by
horizontal transfer from a prokaryote and intracellular gene
transfer from an endosymbiont, respectively, rather than via
duplication [47–51].
Functions of recently duplicated genes. Are there identi-
fiable functional trends in putative recent duplicates (single-copy in
the closest relative(s))? More than half of apicomplexan genes are
annotated with unknown or hypothetical functions (Table 5). This
severely limits the analysis of gene functions. To directly tackle this
problem and provide as much functional information as possible,
we used BLAST2GO (B2G) to augment functional information
(see Materials and Methods). Combining B2G annotations with
available GO terms from EuPathDB, we more than doubled the
number of sequences with GO terms (Table 5). As expected given
the limited data, attempts to detect significant enrichments or
deficits of GO terms for each species were unsuccessful (see
Materials and Methods).
We examined the most-specific Molecular Function GO terms
for each species in figure S1 to determine trends within and
between species. As expected, few terms are shared between
species. Many, including shared terms, are too broad for
meaningful interpretation. For example: DNA binding, Protein
binding, DNA-directed RNA polymerase activity, and others.
Protease activity terms were found in all lineages. Proteases are key
players in all apicomplexan lifecycle stages, including many aspects
of the host-pathogen interaction such as immune evasion and,
tissue invasion [52,53]. We identified six types of peptidase
activities among recent duplicates: amino- in P. falciparum and C.
parvum, cysteine- in P. berghei, T. parva, and N. caninum, serine- in P.
chabaudi, B. bovis, and N. caninum, aspartic- in B. bovis, metallo- in C.
muris, and unspecified in T. gondii (figure S1).
Innovation can also be provided by changes in copy number,
rather than changes in function. We identified a known pair of T.
gondii tyrosine hydroxylases (tyrosine 3-monooxygenase) as possible
recent duplicates [54]. Our analyses showed that these genes,
TGME49_012740 and TGME49_087510, have a single apicom-
plexan ortholog in N. caninum. They are highly similar, have the
same number of introns and are on the same chromosome,
separated by 58 genes over ,450 kb. Further investigation at
OrthoMCL DB [55] confirmed their copy number in the
Apicomplexa and identified orthologs in animals, protozoa,
bacteria, and algae (see Discussion). TGME49_012740 has been
shown to increase dopamine metabolism via production of the
rate-limiting step in dopamine synthesis [56]. Together, these
findings are suggestive of a potential link between the function of a
recently duplicated gene and parasite-induced alteration of host
behavior.
Segmental Duplications Appear RareIdentification and trends. Homologs identified by
OrthoMCL were used to detect putative segmental duplications
as regions of ‘paralogous synteny’ via MCSCAN (see Materials
and Methods). Gene IDs for all markers in segmental duplications
are in table S3. The most striking aspect of this analysis is the
overall dearth of segmental duplications in the Apicomplexa. They
were found in only five of twelve species, with 2–57 duplicated
segments in each genome (Figure 1). The lack of segmental
duplications appears to be another feature of reductive apicom-
plexan genomes. Nearly all segmental duplications are concen-
trated on chromosome ends (Figure 4). It is possible that this
dearth may be an artifact of assembly errors (See Discussion).
Functional enrichment contained in segmental
duplicates. Functional analyses were limited by the lack of
genes with annotations, even after B2G enhancement (see
Materials and Methods). B2G was used to compare the functions
of segmental duplication marker genes against all annotations for
each species and to look for significant over or under represented
functions. Only P. falciparum and T. annulata had detectably
significant differences. Genes on T. annulata segmental duplicates
(4 total) are enriched for ATP binding and ATPase activity
coupled to transmembrane movement (data not shown). Genes on
P. falciparum segmental duplicates (180 total) are significantly
lacking in ATP binding and ATPase activity categories. Significant
functional enrichments in the main GO categories indicate roles in
pathogenesis and antigenic variation. Enriched categories include:
host cell plasma membrane, infected host cell surface knob,
Maurer’s cleft, antigenic variation, pathogenesis, rosetting, host
cell surface binding, and cytoadherance to microvasculature
Innovation through Duplication in the Genomes of Twelve Parasites
PLOS ONE | www.plosone.org 9 June 2014 | Volume 9 | Issue 6 | e99213
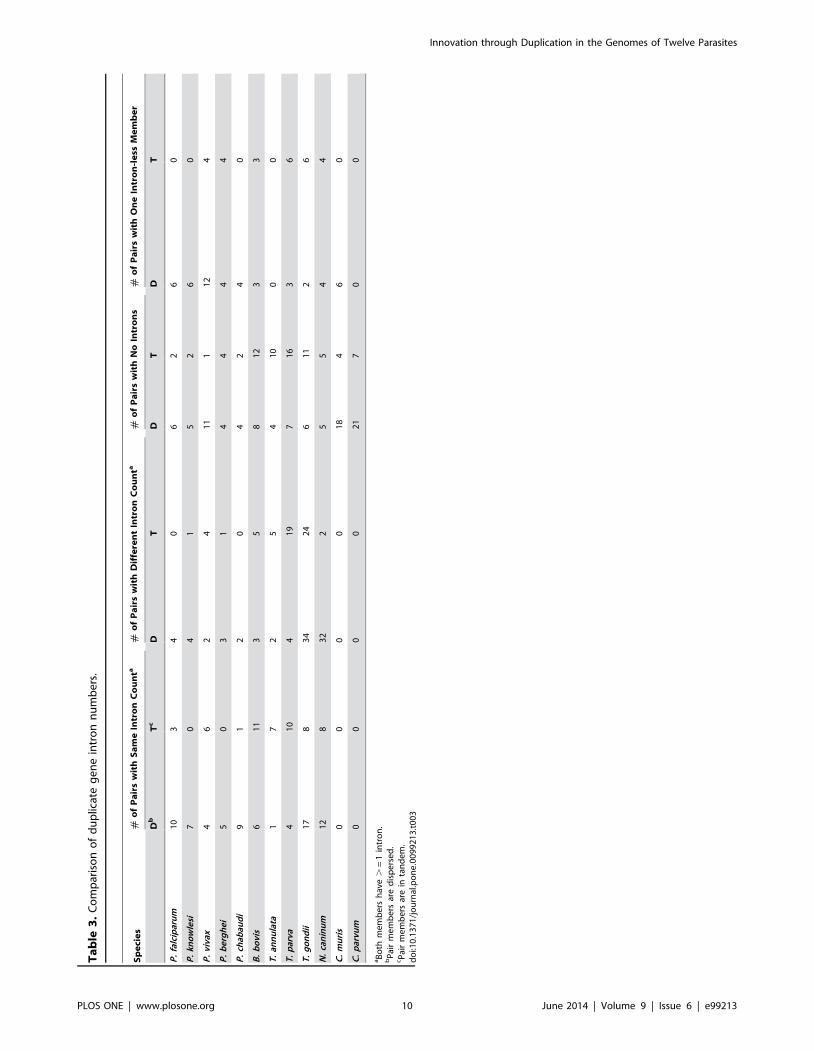
Ta
ble
3.
Co
mp
aris
on
of
du
plic
ate
ge
ne
intr
on
nu
mb
ers
.
Sp
eci
es
#o
fP
air
sw
ith
Sa
me
Intr
on
Co
un
ta#
of
Pa
irs
wit
hD
iffe
ren
tIn
tro
nC
ou
nta
#o
fP
air
sw
ith
No
Intr
on
s#
of
Pa
irs
wit
hO
ne
Intr
on
-le
ssM
em
be
r
Db
Tc
DT
DT
DT
P.
falc
ipar
um
10
34
06
26
0
P.
kno
wle
si7
04
15
26
0
P.
viva
x4
62
41
11
12
4
P.
be
rgh
ei
50
31
44
44
P.
chab
aud
i9
12
04
24
0
B.
bo
vis
61
13
58
12
33
T.
ann
ula
ta1
72
54
10
00
T.
par
va4
10
41
97
16
36
T.
go
nd
ii1
78
34
24
61
12
6
N.
can
inu
m1
28
32
25
54
4
C.
mu
ris
00
00
18
46
0
C.
par
vum
00
00
21
70
0
aB
oth
me
mb
ers
hav
e.
=1
intr
on
.b
Pai
rm
em
be
rsar
ed
isp
ers
ed
.cP
air
me
mb
ers
are
inta
nd
em
.d
oi:1
0.1
37
1/j
ou
rnal
.po
ne
.00
99
21
3.t
00
3
Innovation through Duplication in the Genomes of Twelve Parasites
PLOS ONE | www.plosone.org 10 June 2014 | Volume 9 | Issue 6 | e99213

(figure S2). Enrichments in these GO terms are somewhat
expected since the genes are located on chromosome ends where
genes implicated in infection and pathogenesis are localized. Less
expected are enrichments for several mitochondrial processes:
cytochrome c oxidase activity, mitochondrial electron transport,
and respiratory chain complex (figure S2).
Discussion
Duplications shape genomic landscapes. Broadly speak-
ing, any novel genomic feature that escapes removal is an
‘innovation’, though our ability to identify functional innovations
is limited by our understanding of gene functions and organism
biology. This is especially true in reductive genomes, where gene
loss predominates and genomic real estate is at a premium. This
feature of apicomplexan genome architecture is highlighted by the
lack of segmental duplications and two-copy genes with more than
two copies in closest relative(s) (Figure 1 and Table 1). The
processes of gene duplication and maintenance are among the
forces that shape genomic landscapes. By mapping detectable
duplications (genes and genomic segments) we learn which regions
of the genome, in duplicate, are tolerated by the organisms (at least
thus far), and where, within the genomic landscapes duplications
occur. Further, hypotheses about the timing of duplications are
possible based on their distribution among species and sequence
divergence. General timing of duplications, combined with
knowledge of host-pathogen interactions, provides a functional
context for the exploration of the functional consequences of
duplications. This is especially exciting and challenging given the
evolutionary time frame involved. The Apicomplexa are an
ancient phylum that diverged ,420 million years ago (mya)
[29,30]. Comparisons at this scale can be likened to those made
across the entire chordate lineage [57].
Apicomplexan genomes are dynamic and prone to extensive
rearrangement relative to other examined phyla [23]. Previously,
genomic repeats (genes or other repeats) have been treated as a
single genomic feature used only to highlight areas of genomic
interest. Here we have taken the next step in unraveling the
relationship between duplications and genome architecture with a
systematic focus on their distribution across the phylum. Tandem
duplicates are somewhat rare and are likely either under selection
to remain proximal, or recent enough to have not yet been
dispersed. It is possible that some tandem duplications may remain
undetected due to assembly errors (see below). In coccidians and
piroplasms, duplicates with single-copy orthologs in the closest
relative(s) are mostly tandem (Table 1). This finding correlates with
the hypothesis that these duplications occurred after the species
diverged. This trend is not observed in Plasmodium or Cryptosporid-
ium spp. where most duplicates are dispersed, regardless of copy
number in the closest relative(s). Estimates place the radiation of
Plasmodium spp. ,130–150 (mya) [58,59] and the last common
ancestor of T. gondii and N. caninum at ,28 mya [60]. If one
accepts these divergence times, then it appears that T. gondii has
accumulated duplicates faster than Plasmodium spp. Further, T.
gondii, with the largest overall genome size and largest number of
duplicates, also has the widest host range of the investigated
species.
Duplicated genes are one class of genomic repeats. Repetitive
sequences facilitate genomic rearrangements via homologous
recombination. We observe varying concentrations of duplicates
in and around interior syntenic gaps in coccidians and piroplasms
(Table 2). This suggests a correlation between duplicated sequence
and genome rearrangement. Is duplication restricted to these
genomic locations? Are these ‘hotspots’ of gene creation?
Ta
ble
4.
Co
mp
aris
on
of
du
plic
ate
ge
ne
exp
ress
ion
pro
file
s.
Sp
eci
es
#o
fP
air
sw
ith
Mic
roa
rra
yD
ata
#o
fP
air
sw
ith
Sim
ila
rP
rofi
les
#o
fP
air
sw
ith
Sim
ila
rT
ime
-Sh
ifte
dP
rofi
les
#o
fP
air
sw
ith
Dif
fere
nt
Pro
file
s
Da
Tb
DT
DT
DT
P.
falc
ipar
um
93
12
30
51
T.
go
nd
ii2
49
62
01
18
6
aP
air
me
mb
ers
are
dis
pe
rse
d.
bP
air
me
mb
ers
are
inta
nd
em
.d
oi:1
0.1
37
1/j
ou
rnal
.po
ne
.00
99
21
3.t
00
4
Innovation through Duplication in the Genomes of Twelve Parasites
PLOS ONE | www.plosone.org 11 June 2014 | Volume 9 | Issue 6 | e99213

Interestingly, most N. caninum duplicates in syntenic gaps are also
two-copy in T. gondii. However, the reverse is not true. Most T.
gondii duplicates in syntenic gaps are single-copy in N caninum
(Figure 3 and data not shown). It is attractive to think that these
duplicates have been generated since these species diverged and
that their genomic location is evidence of the relationship between
duplication and genome architecture. Similarly, 24/29 Plasmodium
duplicates in syntenic gaps are either single-copy in the closest
relative(s) or species-specific. Syntenic gaps may be ‘hot spots’ for
gene creation across the phylum. However, in contrast, to
coccidians and piroplasms, the majority of Plasmodium duplicates
in non-syntenic regions are located on dynamic chromosome ends.
While the specific chromosomal region (syntenic gap, chromosome
end, or both) differs with lineage, duplications are often associated
with and concentrated in dynamic genomic regions.
Duplicate Diversification Tracks Evolutionary TrajectoryGenome sequences are palimpsests that reveal their evolution-
ary history [20]. Documentation of the modes of duplicate
divergence informs on the forces that drive genomic innovation.
Comparison of gene sequences and intron counts provide a gross
look at duplicate divergence and mechanism of duplication. 10/31
P. falciparum and 66/108 T. gondii duplicates have no detectable
nucleotide similarity. Most of these duplicates are dispersed in
each species: 80% in P. falciparum and 55% in T. gondii. Duplicates
with nucleotide similarity, weak or strong (See Materials and
Methods), are also mostly dispersed, 18/21 (16 weak, 5 strong) in
P. falciparum and 23/42 (17 weak, 25 strong) in T. gondii. In nearly
every measure of nucleotide similarity and distribution, dispersed
duplicates outnumber tandem duplicates. The exception is highly
similar T. gondii duplicates, where tandem duplicates outnumber
dispersed 15 vs. 10. It is possible that highly similar, tandem
Table 5. BLAST2GO and EuPathDB annotation results.
Total Sequences 60455
Annotated as ‘Hypothetical’ or ‘Function Unknown’ 33020 (54.6%)
Sequences With GO Terms Before BLAST2GO 16938 (28%)
Sequences With GO Terms After BLAST2GO 32703 (54.1%)
Sequences With GO Terms After EuPathDB Incorporation 34979 (57.9%)
doi:10.1371/journal.pone.0099213.t005
Figure 4. Distribution of segmental duplications. Colored gradients on the circles represent genomes as in Figure 2. Unassigned scaffolds/contigs are black. Spans show segmental duplications in five species (A–E). Black spans have at least one end on an unassigned contig. Other colorsare arbitrary and delineate spans. Pf = Plasmodium falciparum, Pb = P. berghei, Pc = P. chabaudi, Bb = Babesia bovis, Ta = Theileria annulata.doi:10.1371/journal.pone.0099213.g004
Innovation through Duplication in the Genomes of Twelve Parasites
PLOS ONE | www.plosone.org 12 June 2014 | Volume 9 | Issue 6 | e99213

duplicates may have been missed due to collapsed genome
assemblies (see below). Duplicate genes with one intron-less
member are in the minority in all species. It follows that
duplication via reverse transcription of an RNA intermediate is
likely not a primary mechanism of gene duplication. This is not
surprising considering the dearth of transposable elements,
including retrotransposons, observed thus far, though telomere-
associated reverse transcriptase domains are present in several
species (data not shown). Trends vary across lineages, but once
again, T. gondii breaks ranks with the largest number of duplicates
with different intron counts (Table 3). It is intriguing to
hypothesize that the relatively wide host range of T. gondii may
be facilitated by the increased divergence of duplicated genes.
Duplicate genes that are maintained may reveal genes that are
beneficial for the parasite. Duplicate genes with products involved
in environmental interaction, hosts in this case, are more likely to
be maintained [18]. Trends and patterns that highlight this are
unfortunately difficult to detect given that the majority of
apicomplexan gene functions remain ‘in the dark’. Despite these
limits we have provided at least a partial light to allow a better
view of the functions of duplicates (figure S1). Proteases are critical
to pathogenicity and host interaction [52,53,61]. They are also
among recent duplicates found in 8/12 species, despite roughly
40% of genes having no GO terms. While this is not entirely
unexpected given that many genes in each species that have
protease or protease-annotated annotations, the broad categories
of different proteases identified in the functions of recent duplicates
reinforce their importance.
A pair of T. gondii tyrosine hydroxylase genes appear directly
related to host pathogen interaction, and alteration of host
behavior [54,56]. A putative mechanism for such alterations was
recently proposed [62]. Interestingly, they are differentially
expressed; one in the bradyzoite stage and the other constitutively
[54]. To better understand their evolution, we queried OrthoMCL
DB [55]. Both genes belong to the same OrthoMCL DB cluster.
At the time of analysis, of the 45 genes in the cluster, there were:
26 metazoan (including humans, other primates, and rodents), 5
plant (1 moss, 2 green algae, 1 red algae, and 1 diatom), 4
kinetoplastid, 3 apicomplexan (2 T. gondii and 1 N. caninum), 2
Tetrahymena thermophile (an Alveolate, along with apicomplexans), 3
unclassified eukaryote, and 2 bacterial genes. A BLASTp search of
the GenBank (BLAST version 2.2.29, search performed 12/2013)
confirmed the OrthoMCL DB range and also detected similarity
to a gene from Perkinsus marinus a dinoflagellate, even closer to the
Apicomplexa. Could a gene have been acquired in the last
common ancestor of N. caninum and T. gondii and duplicated in T.
gondii? Acquisition seems more parsimonious than loss in all other
apicomplexans, but the reductive nature of their genomes cannot
be ignored and a loss in all other examined apicomplexan lineages
is a possibility.
Limits of DetectionThe number of duplications (both genes and larger genome
segments) detected in this study likely underrepresents the
biological reality. As with any pan-genomic analysis, the
constraints of available genome assemblies and annotation apply.
We are particularly concerned about collapses of identical or
nearly identical genome segments into a single sequence segment
as has been documented in several assemblies [63–68]. As
available data (especially long-read data) and assembly methods
improve, the pool of duplicate regions available for analysis will
grow. Two potential sources of error should be understood and
both stem from the difficulty inherent in proving biological
absence. First, ortholog clustering is heavily dependent on the
species included, their assemblies and annotations, and parameter
selection. Missing orthologs and paralogs will affect the results. We
have dealt with this where possible. Likewise, ‘collapsed’ assem-
blies could hinder the detection of duplicate genes and segmental
duplications. For example, this is a possible culprit behind the lack
of duplicates in T. annulata compared to T. parva (Figure 1).
Further, if significant portions of a biological genome are
represented by unassigned contigs the detection of segmental
duplications will be hindered, especially if they contain only a few
genes each. This is particularly true for T. gondii and P. vivax, with
381 and 2,763 unassigned contigs respectively. All totals should be
considered as a baseline. Through careful selection of genome
data, parameter optimization, and curation of results (see
Materials and Methods) we sought to minimize false positives
and negatives. Second, some duplicate genes may be the result of
one copy arriving via horizontal or intracellular gene transfer
(HGT or IGT). We found two such cases in the literature (Table
S2). Targeted phylogenetic analysis is required to rule out HGT or
IGT.
Conclusions and Future DirectionsWe have taken a first step towards a better understanding of
apicomplexan gene and segmental duplication, divergence, and
how duplications relate to overall biology. This systematic
investigation lays the groundwork for further work with emerging
data on gene function and new genome sequences from other
apicomplexan species. We have identified clear trends and
interesting differences in the prevalence, distribution, divergence,
and biological innovation achieved in apicomplexan species and
lineages (Figure 1). These are guideposts to those studying both
genome evolution and parasite biology. While care must be taken
with conclusions made from the current data, many of these trends
are consistent with the patterns emerging from studies of
apicomplexan genome evolution. Apicomplexan genomes are
reductive in nature and highly dynamic with respect to genome
rearrangement where form serves function and where the ‘typical’
mode and tempo observed in model eukaryotes does not
necessarily apply. Repeats, duplicated genes or other genomic
features, can facilitate genome rearrangements by serving as
recombination sites. Rearrangements do not exist in a ‘vacuum’
and genes and/or regulatory elements can be relocated, causing
changes in gene expression [69]. Duplication of genes and
genomic segments is correlated with overall genome architecture,
and we show that their divergence and exploitation is likely a
significant component in the continuum of forces that have helped
shape these genomes.
Supporting Information
Figure S1 Most specific molecular function GO termsfor putative recent duplicates by species. Pie charts show
the number of genes with detected function from BLAST2GO
analyses. Not all genes identified as putative recent duplicates were
associated with functions.
(PDF)
Figure S2 Differential GO term distribution and mostspecific molecular function GO terms for P. falciparumsegmental duplication markers. Differential GO term
distribution analysis was performed with BLAST2GO. The ‘Test
Set’ is from markers in segmental duplications. The ‘Reference
Set’ is all apicomplexan genes with GO terms. All differences are
significant (see Materials and Methods). Enrichments were
calculated across all three GO categories. The pie chart shows
Innovation through Duplication in the Genomes of Twelve Parasites
PLOS ONE | www.plosone.org 13 June 2014 | Volume 9 | Issue 6 | e99213

the number of genes with detected function from BLAST2GO
analyses.
(PDF)
Table S1 Gene IDs for detected two-copy paralogs.
(TXT)
Table S2 Subcellular localization of duplicates.
(XLSX)
Table S3 Gene IDs for detected segmental duplications.
(TXT)
Acknowledgments
We gratefully acknowledge the generators of genome sequence data and
annotations used in this work. This study was supported in part by
resources and technical expertise from the Georgia Advanced Computing
Resource Center, a partnership between the University of Georgia’s Office
of the Vice President for Research and Office of the Vice President for
Information Technology. We also thank the Reviewer’s for improving
manuscript clarity.
Author Contributions
Conceived and designed the experiments: JDD JCK. Performed the
experiments: JDD. Analyzed the data: JDD. Contributed reagents/
materials/analysis tools: JDD. Wrote the paper: JDD. Edited the
manuscript: JCK.
References
1. Yang Z, Huang J (2011) De novo origin of new genes with introns in Plasmodium
vivax. FEBS Lett 585: 641–644.
2. Guerzoni D, McLysaght A (2011) De novo origins of human genes. PLoS Genet 7:
e1002381.
3. Menard D, Chan ER, Benedet C, Ratsimbasoa A, Kim S, et al. (2013) Whole
Genome Sequencing of Field Isolates Reveals a Common Duplication of the
Duffy Binding Protein Gene in Malagasy Plasmodium vivax Strains. PLoS Negl
Trop Dis 7: e2489.
4. Sankoff D (2001) Gene and genome duplication. Curr Opin Genet Dev 11: 681–
684.
5. Hurles M (2004) Gene duplication: the genomic trade in spare parts. PLoS Biol
2: E206.
6. Kaessmann H (2010) Origins, evolution, and phenotypic impact of new genes.
Genome Res 20: 1313–1326.
7. Zhang J (2003) Evolution by gene duplication: an update. Trends in Ecology &
Evolution 18: 292–298.
8. Anderson TJ, Patel J, Ferdig MT (2009) Gene copy number and malaria
biology. Trends Parasitol 25: 336–343.
9. Conrad DF, Pinto D, Redon R, Feuk L, Gokcumen O, et al. (2010) Origins and
functional impact of copy number variation in the human genome. Nature 464:
704–712.
10. Xu JH, Bennetzen JL, Messing J (2012) Dynamic gene copy number variation in
collinear regions of grass genomes. Mol Biol Evol 29: 861–871.
11. Sun J, Jiang H, Flores R, Wen J (2010) Gene duplication in the genome of
parasitic Giardia lamblia. BMC Evol Biol 10: 49.
12. Emes RD, Yang Z (2008) Duplicated paralogous genes subject to positive
selection in the genome of Trypanosoma brucei. PLoS One 3: e2295.
13. Nair S, Nash D, Sudimack D, Jaidee A, Barends M, et al. (2007) Recurrent gene
amplification and soft selective sweeps during evolution of multidrug resistance
in malaria parasites. Mol Biol Evol 24: 562–573.
14. Wasmuth J, Daub J, Peregrin-Alvarez JM, Finney CAM, Parkinson J (2009) The
origins of apicomplexan sequence innovation. Genome Research 19: 1202–
1213.
15. Schnable PS, Ware D, Fulton RS, Stein JC, Wei F, et al. (2009) The B73 maize
genome: complexity, diversity, and dynamics. Science 326: 1112–1115.
16. Van de Peer Y (2004) Tetraodon genome confirms Takifugu findings: most fish
are ancient polyploids. Genome Biol 5: 250.
17. Bailey JA, Yavor AM, Massa HF, Trask BJ, Eichler EE (2001) Segmental
duplications: organization and impact within the current human genome project
assembly. Genome Res 11: 1005–1017.
18. Kondrashov FA (2012) Gene duplication as a mechanism of genomic adaptation
to a changing environment. Proc Biol Sci 279: 5048–5057.
19. Bailey JA, Eichler EE (2006) Primate segmental duplications: crucibles of
evolution, diversity and disease. Nat Rev Genet 7: 552–564.
20. Delwiche CF (2004) The Genomic Palimpsest: Genomics in Evolution and
Ecology. BioScience 54: 991–1001.
21. Kissinger JC, DeBarry J (2011) Genome cartography: charting the apicom-
plexan genome. Trends Parasitol 27: 345–354.
22. Saffo MB, McCoy AM, Rieken C, Slamovits CH (2010) Nephromyces, a beneficial
apicomplexan symbiont in marine animals. Proceedings of the National
Academy of Sciences of the United States of America 107: 16190–16195.
23. DeBarry J, Kissinger J (2011) Jumbled Genomes: Missing Apicomplexan
Synteny. Molecular Biology and Evoluiton 28.
24. Kuo C-H, Wares JP, Kissinger JC (2008) The apicomplexan whole genome
phylogeny: an analysis of incongruence among gene trees. Molecular Biology
and Evolution: msn213.
25. Kuo CH, Kissinger JC (2008) Consistent and contrasting properties of lineage-
specific genes in the apicomplexan parasites Plasmodium and Theileria. BMC Evol
Biol 8: 108.
26. Brayton KA, Lau AO, Herndon DR, Hannick L, Kappmeyer LS, et al. (2007)
Genome sequence of Babesia bovis and comparative analysis of apicomplexan
hemoprotozoa. PLoS Pathog 3: 1401–1413.
27. Templeton TJ, Enomoto S, Chen W-J, Huang C-G, Lancto CA, et al. (2009) A
genome sequence survey for Ascogregarina taiwanensis supports evolutionary
affiliation, but metabolic diversity between a gregarine and Cryptosporidium.
Molecular Biology and Evolution: msp226.
28. Durand P, Oelofse A, Coetzer T (2006) An analysis of mobile genetic elements
in three Plasmodium species and their potential impact on the nucleotide
composition of the P. falciparum genome. BMC Genomics 7: 282.
29. Berney Cd, Pawlowski J (2006) A molecular time-scale for eukaryote evolution
recalibrated with the continuous microfossil record. Proceedings of the Royal
Society B: Biological Sciences 273: 1867–1872.
30. Okamoto N, McFadden GI (2008) The mother of all parasites. Future Microbiol
3: 391–395.
31. Aurrecoechea C, Brestelli J, Brunk BP, Dommer J, Fischer S, et al. (2009)
PlasmoDB: a functional genomic database for malaria parasites. Nucleic Acids
Res 37: D539–543.
32. Heiges M, Wang H, Robinson E, Aurrecoechea C, Gao X, et al. (2006)
CryptoDB: a Cryptosporidium bioinformatics resource update. Nucleic Acids Res
34: D419–D422.
33. Gajria B, Bahl A, Brestelli J, Dommer J, Fischer S, et al. (2008) ToxoDB: an
integrated Toxoplasma gondii database resource. Nucleic Acids Res 36: D553–556.
34. Altschul SF, Gish W, Miller W, Myers EW, Lipman DJ (1990) Basic local
alignment search tool. J Mol Biol 215: 403–410.
35. Li L, Stoeckert CJ, Jr., Roos DS (2003) OrthoMCL: identification of ortholog
groups for eukaryotic genomes. Genome Res 13: 2178–2189.
36. Aurrecoechea C, Brestelli J, Brunk BP, Fischer S, Gajria B, et al. (2009)
EuPathDB: a portal to eukaryotic pathogen databases. Nucleic Acids Research:
gkp941.
37. Tang H, Wang X, Bowers JE, Ming R, Alam M, et al. (2008) Unraveling ancient
hexaploidy through multiply-aligned angiosperm gene maps. Genome Res 18:
1944–1954.
38. Krzywinski M, Schein J, Birol I, Connors J, Gascoyne R, et al. (2009) Circos: An
information aesthetic for comparative genomics. Genome Res.
39. ApiLoc website. Available: http://apiloc.biochem.unimelb.edu.au/apiloc/
apiloc. Accessed 2012 Jun 20.
40. Llinas M, Bozdech Z, Wong ED, Adai AT, DeRisi JL (2006) Comparative whole
genome transcriptome analysis of three Plasmodium falciparum strains. Nucleic
Acids Res 34: 1166–1173.
41. Behnke MS, Wootton JC, Lehmann MM, Radke JB, Lucas O, et al. (2010)
Coordinated progression through two subtranscriptomes underlies the tachy-
zoite cycle of Toxoplasma gondii. PloS one 5: e12354.
42. Conesa A, Gotz S, Garcia-Gomez JM, Terol J, Talon M, et al. (2005) Blast2GO:
a universal tool for annotation, visualization and analysis in functional genomics
research. Bioinformatics 21: 3674–3676.
43. Quevillon E, Silventoinen V, Pillai S, Harte N, Mulder N, et al. (2005)
InterProScan: protein domains identifier. Nucleic Acids Res 33: W116–120.
44. Kooij TW, Carlton JM, Bidwell SL, Hall N, Ramesar J, et al. (2005) A
Plasmodium Whole-Genome Synteny Map: Indels and Synteny Breakpoints as
Foci for Species-Specific Genes. PLoS Pathog 1: e44.
45. Pain A, Renauld H, Berriman M, Murphy L, Yeats CA, et al. (2005) Genome of
the host-cell transforming parasite Theileria annulata compared with T. parva.
Science 309: 131–133.
46. Abrahamsen M, Templeton T, Enomoto S, Abrahante J, Zhu G, et al. (2004)
Complete genome sequence of the apicomplexan, Cryptosporidium parvum. Science
304: 441–445.
47. Zhu G, LaGier MJ, Stejskal F, Millership JJ, Cai X, et al. (2002) Cryptosporidium
parvum: the first protist known to encode a putative polyketide synthase. Gene
298: 79–89.
Innovation through Duplication in the Genomes of Twelve Parasites
PLOS ONE | www.plosone.org 14 June 2014 | Volume 9 | Issue 6 | e99213

48. Zhu G, Shi X, Cai X (2010) The reductase domain in a Type I fatty acid
synthase from the apicomplexan Cryptosporidium parvum: restricted substratepreference towards very long chain fatty acyl thioesters. BMC Biochem 11: 46.
49. Mazumdar J, Striepen B (2007) Make it or take it: fatty acid metabolism of
apicomplexan parasites. Eukaryot Cell 6: 1727–1735.50. Zuther E, Johnson JJ, Haselkorn R, McLeod R, Gornicki P (1999) Growth of
Toxoplasma gondii is inhibited by aryloxyphenoxypropionate herbicides targetingacetyl-CoA carboxylase. Proc Natl Acad Sci U S A 96: 13387–13392.
51. Jelenska J, Crawford MJ, Harb OS, Zuther E, Haselkorn R, et al. (2001)
Subcellular localization of acetyl-CoA carboxylase in the apicomplexan parasiteToxoplasma gondii. Proc Natl Acad Sci U S A 98: 2723–2728.
52. Sajid M, McKerrow JH (2002) Cysteine proteases of parasitic organisms. MolBiochem Parasitol 120: 1–21.
53. Li H, Child MA, Bogyo M (2012) Proteases as regulators of pathogenesis:examples from the Apicomplexa. Biochim Biophys Acta 1824: 177–185.
54. Gaskell EA, Smith JE, Pinney JW, Westhead DR, McConkey GA (2009) A
unique dual activity amino acid hydroxylase in Toxoplasma gondii. PLoS One 4:e4801.
55. Chen F, Mackey AJ, Stoeckert CJ, Jr., Roos DS (2006) OrthoMCL-DB:querying a comprehensive multi-species collection of ortholog groups. Nucleic
Acids Res 34: D363–368.
56. Prandovszky E, Gaskell E, Martin H, Dubey JP, Webster JP, et al. (2011) Theneurotropic parasite Toxoplasma gondii increases dopamine metabolism. PLoS
One 6: e23866.57. Putnam NH, Butts T, Ferrier DE, Furlong RF, Hellsten U, et al. (2008) The
amphioxus genome and the evolution of the chordate karyotype. Nature 453:1064–1071.
58. Escalante A, Ayala F (1995) Evolutionary origin of Plasmodium and other
Apicomplexa based on rRNA genes. PNAS 92: 5793–5797.
59. Nguyen HD, Yoshihama M, Kenmochi N (2007) The evolution of spliceosomal
introns in alveolates. Mol Biol Evol 24: 1093–1096.60. Reid AJ, Vermont SJ, Cotton JA, Harris D, Hill-Cawthorne GA, et al. (2012)
Comparative genomics of the apicomplexan parasites Toxoplasma gondii and
Neospora caninum: Coccidia differing in host range and transmission strategy.PLoS Pathog 8: e1002567.
61. McKerrow JH, Sun E, Rosenthal PJ, Bouvier J (1993) The proteases andpathogenicity of parasitic protozoa. Annu Rev Microbiol 47: 821–853.
62. McConkey GA, Martin HL, Bristow GC, Webster JP (2013) Toxoplasma gondii
infection and behaviour - location, location, location? J Exp Biol 216: 113–119.63. Pan G, Xu J, Li T, Xia Q, Liu SL, et al. (2013) Comparative genomics of
parasitic silkworm microsporidia reveal an association between genomeexpansion and host adaptation. BMC Genomics 14: 186.
64. She X, Jiang Z, Clark RA, Liu G, Cheng Z, et al. (2004) Shotgun sequenceassembly and recent segmental duplications within the human genome. Nature
431: 927–930.
65. Salzberg SL, Phillippy AM, Zimin A, Puiu D, Magoc T, et al. (2012) GAGE: Acritical evaluation of genome assemblies and assembly algorithms. Genome Res
22: 557–567.66. Salzberg SL, Yorke JA (2005) Beware of mis-assembled genomes. Bioinformatics
21: 4320–4321.
67. Kelley DR, Salzberg SL (2010) Detection and correction of false segmentalduplications caused by genome mis-assembly. Genome Biol 11: R28.
68. Bailey JA, Church DM, Ventura M, Rocchi M, Eichler EE (2004) Analysis ofsegmental duplications and genome assembly in the mouse. Genome Res 14:
789–801.69. Oberstaller J, Joseph SJ, Kissinger JC (2013) Genome-wide upstream motif
analysis of Cryptosporidium parvum genes clustered by expression profile. BMC
Genomics 14: 516.
Innovation through Duplication in the Genomes of Twelve Parasites
PLOS ONE | www.plosone.org 15 June 2014 | Volume 9 | Issue 6 | e99213