Violent crime and characteristics of twelve Inuit ... - CORE
189
@ IN THE BAFFIN REGION, NkT Darryl S. Wood % B C 1. New Mexicp state University, 1987 L 'L M C J New ,Mexico State University, 1989 J THESIS SUBMITTED IN PARTIAL FULFILLMENT OF THE REQUIREMENTS FOR THE DEGREE OF DOCTOR OF PHlLOSOPHY 1 in the School of Criminology @Darryl S wood 1997 SLMON FRASER CNVERSITY ; .%. July 1997 -3 All rights reserved This work may not be reproduced in whole or in part, by photocopy or other means, without permission of the author.
-
Upload
khangminh22 -
Category
Documents
-
view
0 -
download
0
Transcript of Violent crime and characteristics of twelve Inuit ... - CORE

@ IN THE BAFFIN REGION, NkT
Darryl S. Wood %
B C 1. New Mexicp state University, 1987 L
'L
M C J New ,Mexico State University, 1989 J
THESIS SUBMITTED IN PARTIAL FULFILLMENT OF
THE REQUIREMENTS FOR THE DEGREE OF
DOCTOR OF PHlLOSOPHY 1
in the
School of Criminology
@Darryl S wood 1997
SLMON FRASER CNVERSITY
; .%. July 1997
- 3
All rights reserved This work may not be reproduced in whole or in part, by photocopy
or other means, without permission of the author.

National Library e
of Canada Bibliotheque nationale du Canada t AcquiSitions.et services bibliograp.hiques
Acquisitions and Bibliographic Services
395 Wetflngton Street Ottawa O N K1 A ON4 Canada
395, rue Wefttngton OttawaON K l A O N 4 - Canada , *
' Ur
I
. Your fie Votre reference
The author has granted a non- exclusive licence allowing the ~at ional Library of Canada to .
reproduce, loan, dstribute or sell copies of th~s thesis in microform, paper or electronic formats.
I
L:auteur a accorde une licence non exclusive permetti.int a la Bibliotheque nationale du Canada de , . reproduire, pr&er, dstribuer ou vendre des copies de cette these sous la forme de rnicrofiche/film, de reproduction sur papier ou sur format electronique.
The author retams ownershtp of the copyright in tlus thesis. Neither the
' thesis nor substantial extracts fiom it may be printed or othenvise reproduced without the author's +
L'auteur conserve la propriete du droit d'auteur qui protege cette these. Ni la these ni des extraits substantiels de celle-ci ne doivent Btre imprimes ou autrement reproduits sans son autorisation. j permssion.

P
Name:
Degree:
Title of Thesis:
I
t
Y t .
APPROVAL
Darryl S Wood b
Doctor of Philosophy (Criminology)
%Violent Crime and Characteristjcs of Tw.elve Inuit Cornmunjties in the Baffin Region, NWT ,r
e . ,
Examining committee:
Chaif: Joan Brockman
P
\ I - - - William G. Glackman Senior Supervisor Associate Professor of Criminology
- ~ a ~ m o n d R. Corrado
- Professor of Criminolow
Professor hrt Griffitt of c minolow
V / - I
Douglas F. Cousineau Internal External Examiner
'Associate Professor of Criminology
- - . David M. Blurton External Examiner Associate Professor of Justice Unliersity of AlaskaZairbranks
Date Approved:
11

' ABSTRACT
-a Geographically isolated-in the 4 remote Canadian eastern arctic, the Inuit communities of
the Baffin Regian. Northwest Territohes share a common cultural and historical heritage that
makes the area a unique setting for the study of violent crime among aboriginal peoples
Despite that uniqueness. however, the communities of the Baffin Region have high rates of
violent crime that are typical of thosefound in aborignal populations acrbss Nonh America".
Previous attempts to account for the high rates of violent crime in aboriginal communities have
generally relied upon one of twb perspectives, both the socio-economic circumstances brought ,
about by the processtof colonization and the factors ~urrounding the consumption of alcoholic @
beverages have ehch been looked to for explanations of violent crime in pbonginal communities
, Both of these perspecti\.es were considered in this dissertation to account for the rates of violent
crime in the Baffin Region communities Indicators of community-level characteristics related to
the consumption of alcohol and to the circumstances surrounding the colonization process were
used to examine community-level measures of violent crime. Some of the community
characteristics were more adept at accounting for violent crime rates than were others Of the
characteristics related to the use of alcoholic beverages, the presence or absence of local alcohol
prohibitions did more to explain violent crime rates in Baffin Regon communities than did the
a\,erage amount of alcohol consumed in a community. Likewise, of the circumstances brought
about by the colonization process, the violent crime rate in Baffin Region communit3es appeared
to ha\.e more to do with whether a community was settled by forced relocation and less to do
with measures of levels of socio-economic deprivatibn These findings suggest that violent
crime in aboriginal communities cannot be attributed to colonization or to alcohol use by
themseh,es Instead, a clearer understanding of violent crime patterns in aboriginal communities
emerges with a detailed examination of certain aspects of those general factors

QUOTATION
1 don ' t know nothin'. but I ~-u~pei.r a lot of things
- Junior Samples .

ACKNOWLEDGMENTS
The completion of this dissertation would not have been.possible without the support
anb pidance I received during its creation I am thanml for the help I received &d for the
fnends I made alohg the way %
Utmo,st thanks go to the members of my supervisory committee First. I would like to \c
t. thank Bill Glackman, my senior supervisor, for his'patience and for pulling me through the latter , ,'
stages of the process He taught me some very important lessons which 1 won't soon forget ,
There is not suffi'cient space here for me to express my gratitude to Curt Gnffiths for all he gave
me, so I will just sav thank you - . for taking me under your wing and for providing me with
numerous opportunities to grow as a scholar I would also like to thank to Ray Corrado f ~ r his
valuable comments and for helping me to see the 'big picture' in my research I am also grateful
to Dai.id Blunon from the University of Alaska Fairbanks and'to Doug Cousineau from the ,
School of Criminology at SFU for giving me their time and their insights as members of my
examining committee
There were many people that were most helphl in allowing me access to specific data
sources used in this dissertatisn Jim Sturrock, Robert Allen, and, most importantly, Gordon '3
3lacKay of the Canadian Centre for Justice Statistics, David Stewart of the Bureau of Statistics, - Go\,ernment of the Northwest Temtories, Ron Courtoreille from the ~ o r t h w e l t Territorial
Liquor Commbsion, and, especially. Bame Stanton, formerly of the Department of Social
Senicqs. Government of the Northwest Temtoriel My field research in the eastem arctic
would ha\,e been much less productive whhout the help of the members of "G" Division of the
RChW I ~ o u l d like to give special thanks to RCMP members Chns Bergman, Tim Mac.hhur .
Tom Slilne. Lou Philip. Roger Piper, Dean Taylor, and Vern Whte for their assistance and their
insights
I would also like say thank you for the support I received from those individuals that
became very important to me during my time at SFU In particular, thanks must go out to John
Lou,man and Paul'Brantingham for steering me in the right direction, to Donna Robertson for
going beyond the call of duty for me, to Rob and Ev and Dave and Laura Adamoski for making u
me feel at home in the big city, and to Greg Saville for broadening my horizons I would also
like to give special thanks to my research accomplice Evelyn 'Thelma' Zellerer. I grew a lot as a

person because of her ina all^. I would like to express my utmost gratitude to Al and Darlene
Patehaude Ths research would not have been possible without Al's early effons'and without
the hospitality his fandy provided me in and out of the north ,
-, , This research waq supported by grant # 4 1 1-90-00 14 from the Social Sciences and
Huma-ties Research Council of\Canada and by grant # 1908 I-2-C 165-0 1 - 1 from hstice $
Canada ';All- content within remains the pp~onsibility of the author * .

=
TABLE OF. CONTENTS d
.. APPROVAL .......................... L. ........................................................................................................................... 11
... .............. ABSTRACT ............................................ ................................. .......................................... 111
. . * ......... QUOTATION ...................... : ..: .................................................... : ........................................* .-.,....... IV . I . , d
C e . . . . TABLE OF CONTENTS ................................................................................................................. ........... '11
8
. LIST OF TABLES ....,.................................................................................................................................. x ga
... LLST OF FIGURES ........................................................................................................................................ XIII .
CHAPTER I : INTRODUCTION .................................................................................................................. 1
STRUCTURE OF THE DISSERTATION . . . . . . . . . . . . . . . . . . . . . . . . . . . . . . . . . . . . . . . . . . . . . . . . . . . . . . . . . . . . . . . . . . . Y . . . . . . . 7
CH.4PTER 2: POPULATION, HISTORY, AhlD CFUME IN THE BAFFIEi .................................................. 4 r
INUIT AND THEIR LAhD . . . . . . . . . . . . . . . . . . . . . . . . . . . . . . . . . . . . . . . . . . . . . . . . . . . . . . 5 ,
.4 BRlEF HISTOR)' OF BAFFIN REGION COMMUNITIES 8
PATTERNS OF VIOLEM- CRIME IN BAFF~N REGION COMMUNITIES 1 1
J - <
COLONlZ ~TION=AND CRIME 25
ALCOHOL AND*CRI~IE AMONG NATIVE PEOPLES 28
Prei alence of.4 lcohnl I ~e 2 9
-1 Itohol ('ye and ('rimrnol Justrce S, srem Contoct 3 1
The -Itcoho1 I iolenr Crrme Relatronshrp 31
Biological E\planations 4 74
Social E\planat~ons 36

CBAPTER 4: DATA SOURCES AND ANALYTICAL TECHNIQUES ...................................................... 43
DATA SOURCES . . . . . . . . . . . . . . . . . . . .:. . . . . . . . . . . . . . . . . . . . . . . . . . . . . . . . . . . . . . . . . . . . . . . . . . . . . . . . . . . . . , . . . . . . . . . . . . . . . . . . . . . . . . . . . . . . . . . . . . . . . . . . . . . . . .43
Qualrtatrve Data Sources.. . .. .... . .. . ....... .. . . . .. . . . ... . . .. . . .... . . ... ,..... ... .. ..... . .. , . . ... . .. ... . ...... ......... ..... . . . . . . . . . . . . , . . .. . . . . . . 44 I
Field Notes 46 . I k Quantrtat~ \,e Data Sources *-;'. - 4 7 *
V~olenr Cnme Rate Data "
3 7
RCMP Operat~onal File Records 5 0
DATA ANALYSIS FOR SM4LL SAMPLE SIZES . . . . . . . . . . . . . . . . . . . . . . . . . . . . . . . . . . . . . . . . . . . . . . . . . . . . . . . . . . . . . . 52 i
.'rbnporamerrrc Sfatrstics and Exact Tests for Brvarrate Analvsrs. . . . . . . . . . . . . .. . . . . . . . . . . . . . . . . .. . . . . . . .. . . . . . . . . . . . . 5 4
Pooled T~me-Srr~es .-lnaIysrs o/.~lultrvarrate Data .. .. .. . . . .. ... . . . . . . . . . . . . . . . . . . . . . . . . . . . . . . . . . . . . . . . . . . . . . . . . . . 5-5
SOCIO-ECONOMIC UNDERDEVELOPMENT . . . . . . . . . . . . . . . . . . . . . . . . . . . .. . . . . . .. . . . . . . . . . . . . . . . . 5 9
I brrab!e.v and H~porheses . . . . . . . , , . . . . . . . . . . . . . . . . . . . . . . . . . . . . . . . . . . . . . . . . . . . . . . . . . . . . . . . . . . . 6 0
I arrable.\ nnd ff\porhe w s 7,'
Inol\ y c and Kewlrs '3 I
EXTERNAL MARKET FORCE$ ?
77
I arrahle\ and Ii\pothes~\ 79
CHAPTER 6: ALCOHOL AND VIOLENT.CRIME IN THE BAFFIN REGION ....................................... 88
CONCERN b 0 U T ALCOHOL A I j q E . IN THE BAFFIN REGION . . . . . . . . . . . . . . . . . . . . . . . . . . . 88 a* . ,
INDICATORS OF ALCOHOL USE -IN THE BAFFIN REGION . . .. ... . . ... :. . . . . . . . .... .:. . .. . . . . . . . . . . . . ... .. .. . . . . .. . . . . 93
Pre~salence of.llcoho1 I ke . . . . . . . . . . . . . . . . . . . . . . . . . . . . . . . . . . . . . . , . , . . . , . . , . . . , . . . . . . , . . , . . , . . . . . . . . . . . . . . . . . . . . . . . . . . . . . :. . . . . . . . . . . . . . . 93
LOCAL ALCOHOL C O ~ ~ O L LEGISLATION AND VIOLENT CRLW . . . . . . . . . . . . . . . . . . . . . . . . . . . . . . . . . . . . . . . . . . . 104
Trpes of Local .l lcohol Controls . . . . . . . . . . . . . . . . . . . . . . . . . . . . . . . . . . . . . . . . . . . . . . . . . . . . . . . . . . . . . . . . . . . . . . . . . . . . . . . . . . . . . . . . 104
1 iolent Cnme rn 'Il'et' and 'Dn.' Cop~munrtres . . . . . . . . . . . . . . . . . . . . . . . . ... . . . . . . . .. . . . . . . . . . . . . . . . . . . . . . . . . . . 107
ALCOHOL USE AND VIOLEhT CRIME . . . . . . . . . . . . . . . . . . . . . . . . . . . . . . . . . . . . . . . . . . . . . . . . . . . . . . . . . . . . . . . . . . . . . . . . . . . . . . . . . . . . 110
Pre~.alence 01.-llcohol I.se and I iolenr Crrme . . . . . . . . . . . . . . . . . . . . . . . . . . . . . . . . . . . .. . . . . . . . . . . . . . . . . . . . . . . . .. . . . . . . . I12

. . Per Capita Consumption of.4lcohol and C 'iolent Crime ............................................... ..,< ............................ 114 . i MODELS OF DRUNKEN BEHAVIOR AND VIOLENT CRIME ................................................................ 120
Drinkrng . 2fodels offhe Boffin Regron Inuit .............................................................................................. 121
I iolent Crime rn Transient and .fb n.Transient Communities ....................................................................... 124
. ... . . . . . . . . . . . . . . . . . . . . . . . . . SUMMARY .................................................................................................................... .: 130
. . CHAPTER 7: DISCUSSION ................................... ., .................................................... .......................... . 132
UN~QLZ FE.4n72~~ OF THE Sn'Dy . . ..,. ............................................................................................................. 132
THE FOCI'S OX VIOLENT CRIME ........................................................................... ......"..... ................................. 133
THEORETIC.-V. PERSPECTILT AND OLTRL~EH' OF FNDMGS ................................................................................. 135 X
Colonrzatron . . . . . . . . . . . . . . . . . . . . . . . . . . . . . . . . . . . . . . . . . . . . . . . . . . . . . . . . . . . . . . . . . . . . . . . . . . . . . . . . . . . . . . . . . . . . . . . . . . . . . . . . n. . . . . . . . . . . . . . I35
. Ilcohol I:rc- . . . . . . . . . . . . . . . . . . . . . . . . . . . . . . . . . . . . . . . . . . . . . . . . . . . . . . . . . . . . . . . . . . . . . . . . . . . . . . . . . . . . . . . . . . . . . . . . . . . . . . . . . . . . . . . . . . . . . . . . . . . . . I37
C O S C F P ~ ' . I I ~ ~ H ~ O R ~ TIC . IL I\IPLICXTIOSS OF THE S ~ D Y . . . . . . . . . . . . . . . . . . . . . . . . . . . . . . . . . . . . . . . . . . . . . . . . . . . . . . . . . . . . . . . . . . . . . . . . . . 138
"Co1onr:atr on " . . . . . . . . . . . . . . . . . . . . . . . . . . . . . . . . . . . . . . . . . . . . . . . . . . . . . . . . . . . . . . . . . . . . . . . . . . . . . . . . . . . . . . . . . . . . . . . . . . . . . . . . . . . . . . . . . . . . . . . . . . . . I39
.-I Icohol I k . . . . . . . . . . . . . . . . . . . . . . . . . . . . . . . . . . . . . . . . . . . . . . . . . . . . . . . . . . . . . . . . . . . . . . . . . . . . . . . . . . . . . . . . . . . . . . . . . . . . . . . . . . . . . . . . . . . . . . . 140
W O W CITED ............................................................................................... .......................................... 143
. APPENDIX A: INTERVIEW SCHEDULES ................................................................................................ 156
INTER\?EW SCHEDULE FOR BAFFIN REGION COMMUNITY RESIDENTS . . . . . . . . . . . . . . . . . . . . . . . . . . . . . . . . . . . . . . . . . 157
j - t h i ~ i ' ~ ~ ~ SCHEDULE FOR RCMP OFFICERS CURRENTLY SERVING . . . .. . . . . . . . . . . . . . 160
.............. APPENDIX B: SAMPLE SCREENS FROM RCMP OCCURRENCE REPORTS DATABASE 163 . APPENDIX C: LETTERS OF ETHICS APPROVAL AND UNIVERSITY SUPPORT FOR BAFFIN
REGION CRIME AND JUSTICE STUDY ................................................................................................ 166 .
6 APPENDIX D: SAMPLE LIQUOR COMMISSION MAIL ORDER INVOICE .................................. 169
...................................... APPENDIX E: SAMPLE LOCAL OPTION LIQUOR PLEBISCITE BALLOT 171 Q

I . $
0 I
LIST OF TABLES- TABLE 1 : CRIME RATES PER 1.000 POPLWTIOS, CANADA, w. AND B m REGION, 1992.. ............................ 13
. T.~\BLE 2: VIOLENT CRIME RATES PER 1.1)m POPLWTIOX FOR SELECTED ABORIGINAL COMMLW~IES .%YD
TABLE 4: VIOLE;~;T C~ihlE RATES PER 1,000 POPLZATION, T ~ T A L POPLZATION. AND NUMBER Of VIOLENT ,
OFFENCES, BAFFIS REGION COMW'XITIES. BY C o ~ t r i t 7 ~ 1 - r ~ POPLIATION GROLP. 1992. ........................ .:. . 2 i =+ .
T.UI.E 7 : EMPIX)'IXST. EDI.C.L\TIOS, HOL'SISG CONDITIONS, AND INCOME, BAFFIX REGION COMML?~;ITIES .A.D
T . ~ I . E 8. DESCRIPTIVF S.1 .ATISTICS FOR ALL V.WABLES USED E THE ANALYSIS OF OLTCOMES OF COLOSIZ~ZTIO~
UPON v10l . t~~ CRIME. B.GFIS REGION COM.W?;ITIES, 1981, 1986, A!!D 1991 (N = 34). . . . . . . . . . . . . . . . . . . . . . . . . .65 /'
TSLBL~ 9 Z~RO-ORDER CORRELATIOS COEFFICIENTS FOR ALL VAWABLES USED IN THE ANALYSIJ'~ OFOCTCOMES OF
2 C O I . O S I ~ T ~ O S UPOS VIOLEST CRIME. B.*FlS REGION CO~~MLNTIES, 1981, 1986. XND 19% (N = 34). . 67
T.4Bl.k 10 L E . ~ SQI'.-~RES REGRESSIO\ ESTIMATES OF EFFECTS OF ALL VARIABLES USED I S THE AXALj'SIS OF \
0 1 ~ C 0 3 1 t S OF COLOSLZ.AT~OS UPOS V I O L E ~ CRIME. B..\FFI?; REGIOS CO~IML'N~TIES. 198 1. 1986, XXD 199 1
T.m.t. 12 - M t . ~ u Rxxh; OF RCMP VIOLENT CRIME RATES BY COMMLWIT~' SETTLEMENT METHOD. BAFFIN
\.s &.I.OC.ATED). B.-\FFIS REGION. NWT. 198 1-1993 ................................................................................ .76
T . ~ L E 14. VIOLENT CRIME RATE (CCJS DATA) .%XD SALES OF Ras, 12 B m FUGIOS, N. W.T. COMML-SITILS.
1980. 1982. 1981, .GD 1987 .................................................................................................................... .78
PERC.WT.A S.UES OF Frx. B . m REGION C o k t h n x m ~ s ...................................................................... .83

T ~ L E 18. CROSSTABLZATION OF COM,MNITIES -\.'E AND BELOW h.1EDl.W VALLT: OF PERCENT CHANGE 1X
TABLE 20 CROSSTABL~.ATIQ~ OF COUML);ITIES ABO\-E AND BELOW h & D l k ~ VALVE OF i987 VIOLEST CCRIE
RATE BY CO>IMLYITIES - ABOL-E AYD BELOW ~&DIAN VALUE IX DOLLAR DECREASE'I~' PERCAPITA SALES OF
. NATI\&~LOPLES I S THE Wt'T ASD C.kNADA. 199 1 . . .................................................................... - . . 9 1 C . i
T.ml.t 22. S~SPECT'..ILUD V~cnxf ALCOHOL USE IN VIOLENT OFFENCES, BAFFIS REGION CO~IXI-LXITIES. 1991. x ()2
REGIOS. 199 1 . . . . . . . . . . . . . . . . . . . . . . . . . . . . . . . . . . . . . . . . . . . . . . . . . . . . . . . . . . . . . . . . . . . . . . . . . . . . . . . . . . . . . . . . . . . . . . . . . . . . . . . . . . . . . . . . . . . . . . . . . . . . . . . . . 92 \
T.ULF 24. PRF~..U.E\CE O F SELF-REPORTED AD~ZT ALCOHOL USE, IS-LTT IS BAFFW REGION C0Ml\fL?;lTlt~. AND - NATIL'E PEOPLES IS THE m T AND C.%KADA. 1991 ............................................................... . . . . . . . . . . . . . . . . . . . . 94
i - T . a ~ . t 25 .%'Ol-l.\l~ OF A B S O L ~ E ALCOHOL PER CAPITA (AGES 15 AND L'P) PLRCHASED, I?;I'IT AND NOS-1Sl.h
&SIDFSTS. N l ~ t 'W~.T' BAFFIN REGION Coalm<rn~s. THE NWT, AND CAN.-ZD.% 1991 . . . . . . . . . . . . . . . . . . . . 101
TV)LL 26' VOI 1Wt. OF ABSOLLTE ALCOHOL PER C . ~ T . A (AGES 15 A!D L'P) ~ R C H . ~ E D . ISLIT RESIDESTS 0~1.1'.
T.ULL. 2') ME.X\ Rxik OF RCMP VIOLENT CRIME R ~ T E S ( 3 YEAR RLIYNG A~FRAGE R ~ T F ) BY COMIILTIT~' B
ALCOHOL. REGL'L.ATIOY TYPE, BAFFIS REGION; NWT, 1985- 1992 .......................................................... 109 3
T . ~ E 3 0 . PROPORTIOX OF DRY C O ~ K W T I E S BELOW THE hfED1.i~ RCMI&VIOLEST CRIME RATE (3 YEAR
R r ~ w s c ; A\-ER~GE RATE). 1985-1992. ALL B . m REGION COMML?\'ITIES ............... t . . . . . . . . . . . . . . . . . . . . . . . . . . . . 1 10
T.UU 3 1 : Rk~k-ORDER ( S P E . ~ ~ . ~ L V ) CORRELATIONS BETWEEN THE 1990-92 RCW VIOLEST CRIME RATE .WU
199 1 PRL:V.VEXCFOF ALCOHOL USE ~ ~ E A S L X E . 'WET' ASD 'DRY' BAFFTN REGION COMMLYITIES.. . . . . . . . . . . 1 12
T.ULE 32. h k . 1 ~ R,Lv~; OF 1990-92 RCMP VIOLE%T CRIME R ~ T E FOR COMMLYITIFS ABOL-E XXD BELOW THE
h 1 ~ ~ 1 . w os 199 1 PREVALENC~. OF ALCOHOL USE. MEASL'RES. 'WET' ~L";D 'DRY' BAFFIN REGIOX
COI\ISR?;ITIES. ....................................................................................................................................... 1 13
T.IBLE 33: PROPORTIOS OF COMMXITIES A E ~ T THE MEDIA!! V.ULXS FOR THE 1990-92 RCMP ~ ~ O L E N T CRIME
RATE AND THE 199 1 P R E V . ~ E S C E OF ALCOHOL USE ~~EASL'RES, 'WET' .iVD 'DRY' BAFFIS REGIOS
C O X ~ S ~ Y I T I E S . . . . . . . . . . . . . . . . . . . . . . . . . . . . . . . . . . . . . . . . . . . . . . . . . . . . . . . . . . . . . . . . . . . . . . . . . . . . . . . . . . . . . . . . . . . . . . . . . . . . . . . . . . . . . . . . . . . . . . . . . . . 1 11

d d
k- TABLE. 31 ~ Y K - O R D E R (SPEARM.LLU) CORRELATIONS BETWEEN THE-1990-92 RCMP VIOLENT CRIME RATE .;LVD
W D I . ~ ON 199 1 ABSOLLTE ALCOHOL CONSL~MPTION MEASLTRES, 'WET' BAFFIN REGION COM,~WI?IES 1 17
TABLE 36 PROPORTION 6 F C O M ~ X I T I E S ABO* THE M ~ D l r n VALUES FOR THE 1990-92 RCMP . V I ~ & T CRIME , . @ - &ATE . C D THE ABOLT THE 199 1 ABSOLLTE ALCOHOL - . C O N S I U P T ~ O ~ ~ ~ ~ S L R E S , 'W~T' B~ REWON

* . . . . b ' . 6 .
LIST OF-FIGURES m
r
.............................................. F l o w 1 : A h4m OF THE ~ o x n n ~ m s OF ME B&~IOX, M, CAN AD^^.. 6
K FIGL-RE 9: MEAY R L U ~ OF RCMP VIOLENT CRIME RATES BY COMMLWITY S~JFI-LEMEST WTHOD, BAFFW REGIOS.
F ' .&ST; .,- .3 .. , C" NWT, 1981-1993 ............................................................................ ,ii ......-....... ........................... : 74 . . . . . . . . . . . . .
" "
FIGL-RE 1 1 . VIOL.EST C R I ~ I E RITES FOR 'WET' CO~IMLTITIES AVD 'DRY' COM~?;ITIES, B ~ I S REGION,

CHAPTER 1 : INTRODUCTION
.After hearing stories about the especially high pfevalence of violence in native
cornrnuiities such as Davis Inlet, Newfoukdland or Hobbema. Alberta, one might be tempted to
thmk that violence is prevalent in all native communities However, an examination of violent
. > crime statistics shows that there is a good deal of diversity in terms of the adount of violent .
crime in native communities Ulule there are native communities that are especially violent
places, many others are no more violent than a "typical" non-native community 14 is this
, variation in levels of violence in native communities that is &interest in t'his study. Instead of
asking "What makes native communities like Davis Inlet so violent?" the more interesting
question is "Why is it that only some naiive communities are as violent as Davis Inlet?".
By focusing upon the Inuit communities of the Baffin Region, Northwest Temtories
( W I T ) . this study attempted to amve at an understanding of why some native communities
ha\.e more crime than others by examining variations in community characteristics that might
possibljv be \piewed as being associated with variations in violent crime Two perspectives
previousiy used to espl-ain Liolent crime in native communities, the view that violent crime is
related to alcohol use apd the vie* that violent crime is the result ofthe colonization process.
uere considered in t hs study Different hypotheses developed from those viewpoints on violent 4
cnme in nati1.e communities were examined using a variety of data sources to determine the
extent to which variations in certain community characteristics corresponded with variations in
\.iolent crime rates in the Baffin Region
As a "research site" the Baffin Region is a unique locale that is especially well suited for
an analysis of inter-community ~iolent crime rate v-tions among native peoples Isolated in
the eastern Canadian arctic, the Baffin Region includes 13 widely scattered communities that are
largely populated by Inuit Its isolation, the distances between communities, the existence of
multiple communities, and the fact that the area is inhabited only by a single cultural group
creates a particular contest unlikesthat used in prior research on violent crime in native
communities.

S
STRUCTURE OF THE DISSERTATION
This dissertation can be broken down into two main parts The first part of this study in
Chapters 2, 3, and 4, lays the groundwork for the remainder of the study Then, in Chapters 5 ,
6,and 7, the community characteristics thought to be associated with violent crime in the Baffin
Region are examined
Chapter 2 serves two of purposes It provides the reader with an introduction to the
people, the land, and the culture of the region thereby providing a better understanding of the
historic, geographic, and cultural context of the study It also considers statistics on violent
crime in the Baffin Region, giving the reader an understanding of the extent of the violent crime
problem in the Baffin Region and the degree to which communities vary in their violent crime
rates As will be seen,,some communities in the Baffin Region are much more violent than
others
The research hterature concerning the two main perspectives predominantly used to
explain violent crime in native communities is considered in Chapter 3 That chapter first
reviews studies that have attempted to accwnt for the high rates of violent crime sometimes w ' found in native communities by pointing to tRe process of colonization and to the neo-colonial
relationship that is said to exist between native peoples and the larger political economy The
studies on the possible impact that the use of alcoholic beverages has had on violent crime
among native peoples are also considered. A number of different hypotheses suggested in the
prior research literature were of use in attempting to'find community characteristics that might ~
have been associated with community violent crime rates.
A description of the data sources and analytical techques used in this study is provided
in Chapter 4 Consideration is given in that chapter to the community-level measures of violent
crime and to the primary and secondary data sources that provided measures of community
characteristics used in the analyses that followed in the next two chapters.
In Chapter 5 the relationships between violent crime and three different factors said to
result from the colonization pLocess are examined. The possible associations between
socio-economic underdevelopment, community relocation, and the effects of external market
forces at the community-level, with \lolent crime are each considered. By loolung at these

C factors it is possible to explore the extent to which the colonization process might have had a
differential impact upon Baffin Region communities.
The relationship between violent crime and alcohol is onsidered in Chapter 6 . The
possible effects of community local option ordinances that prohibit the importation and
possession of alcohol upon violent crime are first examined. Then the association thought to
exist between the quantities of alcohol consumed in a community and the violent crime rate is
considered Finally, the potential impact that different'models of drunken behavior might have
had upon differences in violent crime in Baffin Region communities is examined.
chapt& 7 serves to summarize and provide highlights of the findings It concludes with
a discussion of the potential theoretical and policy implications of the study findings.

CHAPTER 2: POPULATION, HISTORY, AND CRIME IN THE BAFFIN
Before it is possible to begn laying a foundation for examining violent crime in the
Baffin, it 1s necessary to introduce the people, the land, and the culture of the region. To
understand where the Inuit are today requires an understanding where they have been The first gr
two sections of ths chapter briefly introduce the reader to the demography and history of the
people of tQe Baffin Region Ths allows violent crime in the region to be placed into its proper *
geographic and historical context in the final section. The last section describes characteristics
of violent crime in the Baffin Region. 9
Although the Baffin Region' Inuit have a culture and a history that are as unique to their 8
isolated arctic homeland, the patterns of crime found in the region are not atypical of those
found among native peoples across the North America As in other aboriginal regions, the
communities of the Baffin Region generally have violent crime rates that are often several times
higher than those found elsewhere in Canada Crime reports fiom the Canadian Centre for
Justice Statistics (CCJS) show that the Baffin Region has rates of rgported violent crime that are
among the highest in Canada
CCJS figures also indicate that the property crime rates in the Baffin Region are about
40 percent higher than those found for the country as a whole But concern about crime in the
Baffin Region is almost exclusively focused upon cnmes of violence This may be because the
property crimes in the region are relatively minor and appear to not have commanded much
attention within the community or the criminal justice system
Another characteristic of crime found in the Baffin Region, also common in other
aboriginal regions, is notable variability in crime rates between communities According to
crime figures published by the CCJS, some communities in the Baffin Region have rates of
violent crime that are similar to national rates, while other communities have rates 10 to I c tlmes greater
Each of these phenomena are described in the latter half of this chapter Three main
points will be established there ( I ) that the amount of violent and property crime in Baffin
Region communities appears to be quite large and should cause concern, (2) that crimes of
violence rather than property cnmes are the offences that are most in need of examination in

Baffin Region communities, and ( 3 ) that there is indeed variation between Baffin Region
communities in terms of their rates of reported crime.
INUIT AND THEIR LAND -
The Baffin Region is comprised of 13 communities, ransng in population fiom 130 to .
3,500 (Statistics Canada, 1992) These communities (Arctic Bay/Nanisivik,l ~ r o u ~ h t o n Island, 11
Cape Dorset, Clyde hver , Gnse Fiord, Hall Beach, Igloolik, Iqaluit, Lake Harbour,
Pangnirtung, Pond Inlet, Resolute Bay, and Sanihluaq) are shown in Figure 1 Five of the I #
1 $
communities (Cape Dorset, Igloolik, Iqaluit, Pangnirtung, and Pond Inlet) had populations of
over 1,000 residents As is the case with other NWT communities, Baffin Region communities
are accessible only by air, or, for a few weeks in late summer, by sea. The Baffin Region, like
other remote and northern regions of the country, is gener2lly invisible to the majority of
Canadians who reside in southern urban areas Few have had the opportunity to travel to t%
northem-most regions of their own province. and even fewer have gone north of 60' This
distance has tended to obscure the problems wtuch afflict many northern settlements
The Bafin Region population is young, rapidly growing, and primarily Inuit Figure 2
reveals that the populatkw of the Baffin Region is much younger than that of the rest of Canada
.4s of the 199 1 National Census, 47 percent of the residents in the Baffin Region were under the
age of 19. compared to 28 percent of the population fo; the rest of Canada (Statistics Canada,
Although the! are separated b! 10 lulometres (\la the longest stretch of road In the regon) Arcuc Ba? and Narusn ik are essentlall! a s~ngle commumh and are treated as such throughout t h ~ s stu& Both locales are policed from a slngle RCMP detachment In Narusnlk. and the a~adable cnme data does not &sungush benseen h e t\ho commulutles An! reerences made to Narusnlk should be read as "Narus~t?k and Arcuc Ba! "

Figure 1 : A Map of the Communities of the Baffin Region, NWT, Canada.
Communities of the Baffin Region,
Northwest Territories,
Canada. I
0 - Kilometers

Figure 2: Population Structure by Age, Baffin Region, NWT, and Canada, 1991.
Canada
+------ + - - - -- -. - 0 5 10 15
0 5 10 15
O/O Population % Population
Source Statlst~cs Canada. 1992
Figure 3: Baffin Region Total Population, 1976 to 1991, Projected to 2001.
Year Source Propcbons from 1991 to 2001 denved from popdabon growth propcbons made by Hagey Larocque 8 McBride (1989) usrng procedures outlined by Rives 8 Serwo (1984)

Accompanying the young population in the Baffin Regon is a rapid population growth
rate In Figure 3, the increase in the Baffin Region population fiom 1976 to 199 1, with
estimates to the year 200 1 , is presented. Between 1976 and 199 1 the population in the region
grew at an annual rate of 3 28 percent. The annual population growth rate in the Baffin Region.
largely the result of high birth rates common to Inuit of the eastern arctic (Nunavut
Implementation Commission, 1995), is much higher than the national annual population growth
rate of 1 09 percent It is even higher than the annual population growth rates of places with
reputations for high population growth such as Mexico (1.90 percent per year), Bangladesh
(2 32 percent per year), or Sierra Leone (2 63 percent per year) (Central Intelligence Agency, - 1996) At present growth rates, the population of the Baffin Region will double by the year
20 17 (and then every 2 1 years after that).
Most of the people that live in the Bafin Region are Inuit. According to census figures
from 199 1 . 8 1 percent of the Baffin Region population is of Inuit ethnic heritage (Statistics
Canada. 1992) Ten of the Baffin Region communities are at least 90 percent Inuit. Nanisivik.
where a nickel and zinc mine is located, is the only community in the region where Inuit are not
the majority (Statistics Canada, 1992)
A BRIEF HISTORY OF BAFFIN REGION COMMUNITIES
In earlier times. before the mid-to-late 1950s. Inuit lived in what has been characterized
as "i small-scale society whose members, living together in camps that changed in size and
location in accordance with the rhythm of the seasons, strongly depended on each other for their
suni\tal and well-being" (Rasing, 1994, p 2 5 ) . Nearly every aspect of social life among the
Inuit was geared toward survival All individuals performed. tasks which ensured the sunival of
--* the larger social group and its individual members These tasks were allocated by age and
gender .4s Rasing notes
Adult males had to hunt, the adult females were to take care of the household. The skills involved in these activities were taught when chldren were at a young age. Girls were expected to assist their mothers. The boys, from about age eight, were taken by their fathers on hunting excursions (1994, p. 20).
No single development had a greater impact on the Inuit of the Baffin Region than their
transformation fiom a subsistence culture, based on the l a ~ d , to a permanent settlement culture,

subsisting upon imported foods purchased with Funds distributed as government transfer
payments Until the late 1950s. most 1nuit lived a nomadic huntingigathering existence on the
land Life revolved around the seasons, the land, and the animals. 'The change from a culture
focused on a nomadic existence to the sedentary life in permanent settlements has had L
fundamental ,consequences for the culture and the people. In the words of one Inuit resident
intewiewed for the Baffin Region Crime and Justice Study
I have two different lifestyles the way it was and the way we are now, the white man's way of life The way the whte man lives has not changed much in a short period of time, but the Inuit way of life has changed very rapidly and changed in a way that is so much thatjt seems like it's been hundreds of years There's been so much change
h'hile life on the land had been harsh and unforgiving, life in permanent settlements has been
devastating, and the aftershocks are still being felt by the communities and their residents It is
often said that the Inui t went from the stone age to the space age in period of only 40 years .4s
one resource worker in the Bafin Region said, "They stepped right out of igloos and right into
rocket ships "j
In many ways, Canada's Inuit have adjusted to the technological and lifestyle changes
thrust upon them Ne\v methods of traveling by motorized snowmachme and boat, hunting with
scoped high-pou.ered rifles. and cachng food in refhgerated storage lockers have all been
incorporated into the lifest~4e of Inuit Inuit communities of the Baffin Region are now linked
by. and rely heavily upon, communication by telephone, fax, and video conference Via satellite,
community cable companies distribute the latest news, sports, and entertainment from the urban
centres of Toronto. \'ancou\.er, and Detroit
T h ~ s quotation. along w ~ t h others used in t h ~ s chapter. IS from an inteniew done for the B&n Regon Cnme and Justice Stud! Those intenieus were conducted based upon prormses of anon!mh for the respondents Throughout t h ~ s stud? these quotauons are included without staung the name of the indnidual source All quotations w~thout a source were taken from those field mteniews A full &scussion and jmficatlon of the use of these lntenieu materials 1s in the secuon on "face-to-face" in teniew In Chapter 4
Tlus is not as much of an oFerstatement of the changes Inwt have faced In the past 40 !ears as ,t might appear to be at first glance According to the RCMP lqaluit Sub/Dnision Staff sergeant. the arpon runua! at lqalu~t is - listed as 4th in line for a US Space Shuttle landmg (after Eienned~ Space Center in Flonda. Eduards AN Force Base In California. and Holllrnan h r Force Base in New Meuco) A plaque and thank >ou lener from the N.4SA Space Shuttle program thanlong the lqaluit RCMP for their a d and suppon IS proudl! &spla!ed In the canteen of the Iqalwt SubiDnislon Headquarters

Even though the Inuit have moved from a life dictated by the harsh arctic environment to
a life in permanent settlements that provides them with a measure of control over their
environment, there are remnants of the nomadic culture Inuktrtut, the Inuit language, is the
primary language of the community schools in grades one through three and is spoken among
community residents with pride Hunting and fishng are still a source of sustenance for some
Inuit families Time spent on the land with family and hends, away from the settlements, is now '
cherished Indeed, these remaining facets of nomadic culture serve to distinguish life among the
Inuit from that in whte or First Nations communities in the south.
With the increase in the rnaterral standard'of living brought to the Inuit by /
westernization has come an increased dependency of the Inult on the government. Government
agencies have replaced communities and families as prov~ders of services and Inuit communities
have become dependent upon outside government for education, medical care, criminal justice
and social services Shamanism has been largely eradicated, the extended family groupings have
been replaced'by nuclear families, modem schools=have replaced the oral and demonstrative
traditions of teaching the young. and the elders in many communities no longer play a role in
community life All told, the past 40 years has seen the displacement of Inuit culture by that of
the ~)o//wruut (white ~ u r o ~ e a n s ) - it is understandable that the Inuit have had considerable
difficulty in adapting to this new culture In the words of one Inuit resident interviewed for the
Bafin Region Crime and Justice Studv
The people have come from a very self-reliant existence into one that is a welfare state run by the government A lot of people have lost their sense of purpose and sense of values and that has taken a drastic toll on families and on the community
.An RChP officer posted to the Baffin Region in the 1960s, in an interview conducted for the
Baffin Region Crime and Justice ~ t u d b n 1991. noted that the move to permanent settlements
marked the beginning of intenention by outside justice and social service agencies into all facets
of Inuit life
All of a sudden there were 500 people living in a community They have never had the social skills to deal with each other on the basis of a group of 500 So, nou you have to bring in the white man's social skills - whch means the social worker. the clerg.. the justice system, more policemen, jail cells in each community

Today. the Inuit of the Baffin Region are faced with many challenges, including the fastest
growing population of any group in the country (largely the result of very high birth rates), the
lack of an economic base in many of the communities and the dilemma of how to retain
traditions while adjusting to the social, political and economic changes which are occurring all
around them A particularly critical challenge, in fact something that greatly hinders the
possibility of positive change in the Baffin Regon, is dealing with the widespread presence of
violent behavior As is shown in the remainder of this chapter, some Baffin Region communities P
are among the most violent places in Canada
PATTERNS OF VIOLENT CRIME IN BAFFIN REGION COMMUNITIES
I t is necessary to establish that there are measurable differences in the relative amount of
violent crime found in Baffin Region communities before it is possible to consider the
community characteristics that might be associated with those differences. In this section those 9
differences are examined Two different issues are addressed before the presence of
inter-community violent crime rate variations is established First, some justification for why
explanations of the patterns of crime in Baffin Region communities should be sought is
prokided Comparisons of Baffin Region crime rates with those'of other aboriginal and
non-aboriginal jurisdictions. the riewpoints of individuals interviewed for the Baffin ~ e ~ $ n
Crime and Justice Study, and the perceptions of community residents as recorded by the ' '
.Aboriginal Peoples Sun,ey (Statistics Canada, 1993a) all seem to suggest that crime problems in
the Bafin Region are acute and therefore need to be researched Second, it is necessary to
proiide a rationale for ~ . h y the study will only attempt to explain violent crime and will not
attempt to explain property crime As will be evident, there are a variety of reasons why
propert!, crime in the Bafin Region generally is seen as having less significance than violent
crime Once these tasks have been completed and the existence of inter-community violent ..J crime variations has been established, the focus of t h s study will shift to understanding the
community characteristics associated ~ l t h the variations in the patterns of violent crime
.b important point must first be made before looking at those differences in violent
crime between Baffin Region communities Although there are there are 13 different
communities in the Bafin Region, this study only considered the characteristics associated with

.%.
violent crime in I2 of those communities Iqaluit. the administrative centre and transponation
hub for the Baffin Region, was excluded From all analyses conducted in this study. A11 rates or
measures used in this-study for the Bafin Region as a whole do not include Iqaluit but are
instead totals or averages for the 12 other communities in the region
There were many good reasons for excluding Iqaluit in this study. One reason for not
considering Iqaluit in the analysis of inter-community violent crime rate variations is that it has
already been the focus of major studies of dehance and crime and justice (Finkler, 1976;
Hcnigmsnn & Honigmann, l96Sa; Szabo, Finkler, & Panzeau, 1973). Another reason for-
excluding Iqaluit from hnhe r study in t h s thesis is that it was impossible to do a complete
analysis of all RCklP operational files because time and resources only allowed the recording of
only one out of every five files However, the main reason for excluding Iqaluit fiom the
analysis is that it haS \.em little in common with the other Baffin Region communities Iqaluit is
unequaled in reputation as a place of crime and deviance in the eastern arctic4 and is dissimilar
to the other communities in the Baffin Region Iqaluit shares very few characteristics with the
other Bafin Region communities I t is the largest of the communities, having a population that
is at least -3 times as large as the next comparable community (Statistics Canada. 1992) The
region's residential high school and the main campus of the region's ioc8tional school are both
located in Iqaluit. d r a ~ i n g youth and young adults fiom all over the region There is a homeless
population in Iqaluit, including outcasts from the region's other communities Iqaluit is the
transport centre for the eastern arctic and the administrative centre for the Baffin Region I t
attracts visitors and residents fiom all the other communities, including those individuals looking
for a "good time " 3lany individuais that get into trouble in Iqaluit are fiom someplace else
For instance. an analysis ofjail records shows that about 13 percent of individuals held for public
intoxication hy the Iqaluit R C h P in 1991 and 1992 were visiting Iqaluit from other
communities As the only community in the Baffin Region with establishments that sell beer.
\vine, and liquor by the drink. Iqaluit is a magnet to those whose behav.iors are unacceptable in
.A banner in the canteen lounge of the RChlP sub~di\ision headquarters for the Baffm Region boldl! states that "Mter Iqaluit. E~.enthing Else is Fiction'"

their home communities All of these factors - the "large," disconnected, transient population
combined with a unique alcohol distribution arrangement - makes it necessary to exclude
Iqaluit from the analysis I t is difficult enough to account for the effect that factors that occur
within a single community have upon its vid~ent crime without having to account for the effects
that the social and economic structure of other communities have upon violent crime in that
community In other words, the high transience in Iqaluit makes it difficult to separate the . effects of the social processes and social structure in Iqaluit upon violent crime in Iqaluit from
I
the effects of social processes and social structures in the outlying communities upon violent
crime in I q a p
Levels of L i m e in the Baffin Region
The rates of violent and property crime found in the Baffin Region. when compared with
rates found elsewhere in the county, would be considered by most observers to be exceptionall),
high Compared with Canada as a whole, there is much more violent and property crime in the b
Baffin Region For instance. Table 1 , which compares the violent, property, and ('rrrnrnal ( 'od~)
total rates per 1,000 population, shows that in 1992 the Baffin Region property crime rate n,as
4O'percent higher than the national rate while the violent crime rate for the Bafin Region uas ' .
nearly four times the national rate Table 1 also shows that in 1992 the violent and property
crime rates in the Bafin Region were 15 and 8 percent less, respectively, than the rates recorded
for the NU'T as a whole
Table 1: Crime Rates per 1,000 Population, Canada, NWT, and BafTin Region, 1992. --. --
e \ lolent Propem C'rrmrnal Code
Junsdmon Cnme Rate Cnme Rate Total Rare
Baflin Reg~on 5 ; 8 8 245
Canada 1 1 6 1 103
Source CCJS. 199.7
There are well \+om snoumach~ne vads beh\een Lahe Harbour and lqallut for those ~1111ng to m J e the 5 to 8 hour tnp for a "cold one "
Geographers refer to the phenomena of spar~al autocorrelar~on to refer to the condmon of a banable m one locat~on bang ~nlluenced b! \slues on that same \anable m other locat~ons (Gnfflth. 1987. Odlund. 1988) Spatla1 autocorrelat~on IS s a ~ d to be a ~ ~ o l a t ~ o n of most multn anate stat~st~cal methods because the assumpt~on of mdependence of obsen atlons 1s \iolated (GnK~th. 1987. Odlund. 1988)

From the time that comparable records have been kept, crime rates in the Baffin Region
have generally been greater than those of Canada. Since the mid 1980s the crime rates of the
Baffin Region have come to equal those of the NWT. The Baffin Region violent and property m i .
crime rates over the 15 year period 1977 through 1992 are shown Figure 4 and Figure 5 whch
compares those rates with those of the NWT and of Canada for the same time As
illustrated in Figure 4, not only has the Baffin Region violent crime rate continually been hgher
than the Canadian rate, but the difference in rates has also continued to grow Between 1977
and 1992 the violent crime rate in Canada nearly doubled (fiom 5.8 per 1,000 population to I 1 2
per 1,000 population) while over that same period the violent crime rate in the Baffin Region has
quadrupled (from 10 7 per 1,000 population to 53 5 per 1.000 population) The differences in - .
Bafin Regional property crime rates and Canadian property crime rates have not been as great
as the d~fferences found for v~olent crime rates As seen in F=igure 5, it ha$only been since 1983 5- 2
that the property crime rate of Baffin Region communities has exceeded thp Canadian rate
N'hile the differences in rates are not all that large, the property crime rate for the Baffin Region
has increased at a much faster rate Over the 15 years from 1977 through 1992 shown in F~gure
5. the Canadian property crime rate' increased by roughly a quarter (from 46 per 1,000
,population to 61 per 1.000 population) while the Baffin Region property crime rate grew by a
factor of two-and-a-half-times (from 33 per 1,000 population to 88 per 1,000 population) -..- Crime rates over time in the Baffin Region can also be compared with those of the entire NU'T
v .
Both Figure 3 and Figure 5 shoG, that since the mid to late 1980s. the Baffin Region violent and
property cnme rates ha\.e begun to approach those for the entire NWT

Figure 4: Violent Crime Rate, Canada, NWT, and Baffin Region, 1977 to 1992.
Source CCJS , - Year
Figure 5: Property Crime Rate, Canada, NWT, and Baffin Region, 1977 to 1992.
- Baffin Region
- . - - N W T
D - m m o - m r n w r n m r . ~ a o . - ~ b b b a a K l W Q Q a a Q Q a a a c : ~ c c : : $ : ~ . g . $ ~ $ ~ ~
Source CCJS Year
Another indication that crime in the Baffin Region is problematic comes from a
comparison with cnme patterns of other aboriginal jurisdictions in Canada Although many
reports focus upon the fact that. on an aggregate basis, aboriginal communities have higher
cnme rates than those found in non-aboriginal jurisdictions (e g . Cawsey, 1991, Hamilton &

Sinclair, 199 1 ) some scholars r ecopze that there are sometimes tremendous differences in
patterns of crime between different aborignal cultural groupings (Haynes, 1942, May, 1982,
Wood & Gnffiths, 1996). Mean violent crime rates among different aboriginal groups located
across Canada are shown in Table 2 A few conclusions can be drawn fiom the figures in Table
2 . First of all, the mean rate of violent offences in each of the jurisdictions could be considered
to be quite high Each measure substantially exceeds the national violent crime rate for the year I
it was recorded Secondtthere is a large range of violent offence rates between the communities
within the various jurisdictions. Some communities reported no offences while others,reported
upwards of more than 1 offence for every 10 residents. Unfortunately, direct comparisons are
problematic because the violent crime rate measures displayed in Table 2 are fiom different years
and are reported by different police organizations In effect, there are too many validity issues
limiting comparisons. nonetheless the presented rates illustrate the fact that all of the aboriginal
jurisdictions have high violent rates and that there at least appears to be a great deal of variation
of violent crime rates between communities and populations within those jurisdictions
Table 2: Violent Crime Rates per 1,000 Population for Selected Aboriginal Communitiks and Populations.
Mean Rate of Range of Rates of Junsdlctlon and Year(s) Vlolent Cnrne Vlolent Cnme Sources
Amenndlan Resen es. H>de & Quebec. 1978 to 198; 19 0 to 57 LaPrame. 1987
.4bonginal Res~dents. 4 Western C~ties. 1990* Br 1992** 3 2
Trevethan. 1993. 17 to 58 Gnffiths. et a1 . I994
18 to63 Auger. et al . 1992
Baflin Region Commurut~es. NIiT. 1992 70 7 to 136 CCJS. 1993
*Ca lgw. Regina. and Saskatoon L'ancou\ er
***Range for Saskatchewan resenes 1s across the 43 Justlce Admmstration Areas in the P ro~mce rather than across all Indnn resen.es *

The Focus on Crimes of Violence
As shown in the above section, Baffin Region communities have rates of violent crime.
that are considerably hgher than those of the nation as a whole and property crime rates that are - about 40 greater than is found nationally Because property cnme can be seen as being much
less serious in comparison with the harm resulting fiorn violent crime, this dissertation will only
attempt to find the community characteristics that are associated with the inter-community
variations in violent crime
Prior studies of crime among aboriginal populations have generally treated violent crime
as being more senous than property crime Most of the academic research literature on mime
and criminal justice processing in aboriginal communities has focused primarily upon violent
cnme rather than property crime (e.g., Bachrnan, 1992, Gnffiths, et a]., 1995; Jayewardene,
1975. Laprairie. 199 1 . Millar. 1990) Likewise, the special g<vernment task forces and
commissions of inquirv in the hUrT have focused upon violence crime (and specifically on
\.ioience against women) rather than upon property crime (Bayley, 1985, Peterson, 1992)
If one also considers the types of property crimes committed in the Baffin Region and
their relati~rely low levels of harm: it becomes clear that energies are better spent trying to
understand the factors associated with violent crime. Most property crimes committed in the L
Bafin Region can be characterized as belonging to one of four types. The first type of property
crime commonly committed in the region is shoplifting. Although the managers of the Northern
and Co-op stores (which 'are about the only places to shop in these communities) would
disagree, the thefts from their markets are generally of a petty nature
A second type of property crime found quite often in Baffin Region communities is the
"pop-n-chip" break and enter These burglaries are generally committed by bored young
offenders who break into local stores for the soft drinks, snack foods, and. other perishables they
can plunder
The third type of cornrnorlly committed property crime, a type similar to the
"pop-n-chip" variety, is the break and enter committed by individuals in search of intoxicants
The school teacher that finds the lock on his or her fiont door smashed, the door left ajar, but
does not find anything inside to have been taken or disturbed would most likely be the victim of
a burglar in search of alcohol or other drugs Likewise, a construction contractor may discover

a workshop has been broken into overnight, and that a full propane tank has gone missing
Rather than attributing that burglary to someone that needed to refuel a bar-b-que, the police . would look for)loungsters with a history of "sniffing" and solvent abuse. While the
consequences of the use of stolen intoxicants are potentially quite harmful, the actual property
offences committed to steal hard liquor or beer or ABS glue or whatever other substances
people in the Baffin Region use to get high on are rather trivial
The last type of propeny crime that can be seen to be common to the Baffin Region is
"joyriding" Although many of the same elements are present when a culprit7 appropriates a
motor vehicle that he does not own, the lack of places to take a stolen snowmachne or ATV
makes the actual harm resulting from the offence "theft of a motor vehicle" in the isolated Bafin
Region communities much less severe In the typical motor vehicle theft in the Baffin Region,
the stolen machine is ridden in and around the community where it is stolen until it runs out of
gas At that point the vehicle is abandoned for the police and the owner to find and retrieve
Compared with motor vehicle theft outside the arctic. and cornparedkith most violent offences.
the harm resulting from 'joyriding" is relatively small and is usually only temporary
This classification of property offences into four types of offences that are claimed to be
of little severity should not be taken to indicate that there are no serious property offences in the
Baffin Region Some serious property crimes do occur Expensive audio-visual equipment is
sometimes stolen when local schools are broken into Snowmachines taken for joyrides are
sometimes wrecked, making them useless to their owners. However, those types of cases are
the exception rather than the rule The large majority of property crimes committed in the
Baffin Region are relatively minor compared to many of the violent crimes committed there.
Perceptions held by many of the people that live and work in Baffin Region communities
add hrther support for the idea that it is violent crime, not property crime, that is of utmost
concern There are two data sources of community resident viewpoints to consider. First of all,
we can look to the views of community residents collected through interviews during field visits
of the Baffin Region Crime and Justice Study. Secondly, we can look at the aggregate
' As ~ ~ t h the different hpes of break and enter. the .jo!ndmg" offences are general]! cornrmtted b! males under the age of majonh W~th the ekceptlon of shopllhng. whch 1s comrmtted b) in&\~duals of all ages. it appears as though propem cnme In the Baf5n Regon IS large]! the doman of !oung offenden (Gfiths. et al . 1995)

perceptions of community residents gathered in the Aboriginal Peoples Survey addendum to the
199 1 Census (Statistics Canada, 1993a)
The idea that violent crime is prevalent in the B&n Regon came through quite clearly
in interviews conducted with community residents and justice service providers Even the most
experienced RCMP members'were startled by the levels of violence in the regon, one RCMP
member recalling I
I was quite shocked and surprised when I went there and found the amount of violence that occurred in that community, and I'm talking about everytLng from murders to sexual assaults
Violence is a predominant factor of life in many Baffin Region communities and is not confined h
to specific groups I t occurs in different families across all communities One respondent *
It
argued that ~iolent crime occurs in all age groups.
Spousal assaults, sexual abuse -these crimes seem to go right across the age segment I think with things like break and enter and vandalism, they're restricted almost to. I've not done any statistical reviews of this, but I think they're restricted to the younger age groups But the sexual abuse, assaults, they can go, probably right through the whole society
The signs of violence are eveqwhere in the Baffin Region According t o the manager of the
Northern Store in one community, the results of spousal assault come walking through his store
on a frequent basis He pointed out that
Whene\.er we seem to get a lot of booze orders in on the plane, the next day you go to the store and a lot of women are coming in with black eyes and bruises and - that sort of stuff
Even those that are supposed to be helping victims of crime are themselves victims of violence
According to one social worker, "spousal assault is happening just continuously. All the B
workers here are victims It's just,so common and it's quite violent."
Concern about violent crime as a problem for Baffin Region community residents was
also recorded on an aggregate basis in the Aboriginal Peoples Survey (Statistics Canada, 1993a) i
Included in that addition tb the 1991 Census were questions on whether individuals felt certain
social problems were present in their community. One question asked individuals if they thought
family violence is a problem and another question asked if sexual abuse is a problem The
viewpoints of adults in Baffin Region communities on those two questions are presented in
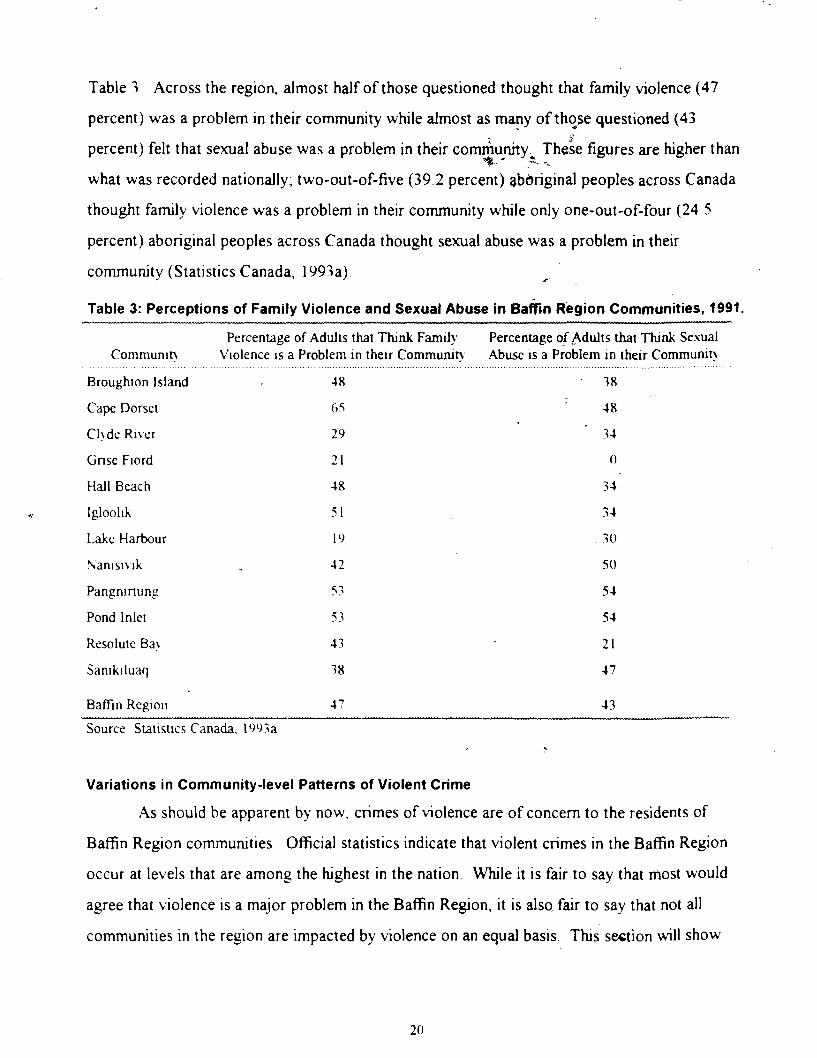
Table 3 Across the region, almost half of those questioned thought that family violence (47
percent) was a problem in their community whde almost as many of th2se questioned (43
percent) felt that sexual abuse was a problem in their corr&uruty ~ h d e figures are higher than -_ f % * - * .
what was recorded nationally, two-out-of-five (39 2 percent) abariginal peoples across Canada
thought family violence was a problem in their community while only one-out-of-four (24 5
percent) aboriginal peoples across Canada thought sexual abuse was a problem in their
community (Statistics Canada, 1993a) a'
Table 3: Perceptions of Family Violence and Sexual Abuse in ~ a h n Region Communities, 1991.
Percentage of Adults that f i n k Farml) Percentage of Adults that Ttunk S e u n l C o m m u n l ~ V~olence IS a Problem ~n thelr Commuruh Abuse IS a Problem ~n t h e ~ r Cornmurut\
Broughton lsland 4 8 38
6 5 Cape Dorset 48
Cl! de Rn er
Gnse Flord
Hall Beach
lglool1h
Lake Harbour
Nanlsn A
Pangninung
Pond Inlet
Resolute Ba!
Sanlk~luaq
B a n Reglon 17 43 P P
Source Statlst~cs Canada. lY93a
Variations in ~ommunity-level' Patterns of Violent Crime
As should be apparent by now, crimes of violence are of concern to the residents of
Baffin Region communities Official statistics indicate that violent crimes in the Baffin Region
occur at levels that are among the highest in the nation Wtule it is fair to say that most would
agree that violence is a major problem in the Baffin Repon, it is alss fair to say that not all
communities in the region are impacted by violence on an equal basis. Ths section will show

that there is a great deal of variation in the amount of violent crime found in Baflin Region
communities
The inter-community variation in 1992 violent crime rates for 12 communities of the
Baffin Region are shown in Table 4 According to these CCJS statistics, there are some
communities in the Baffin Region with very high violent crime rates and some communities with
very low violent crime rates. The differences between communities in terms of high and low
crime rates are tremendous For instance. the violent crime rate in Gnse Fiord of 7 violent
offences per 1,000 population was 129 violent crimes per 1,000 population less than its i
"neighbor" Resolute Bay
Table 4: Violent Crime Rates per 1,000 Population, Total Population, and Number of Violent Offences, Baffin Region Communities, by Community Population Group, 1992.
Comrnun~t! and Population Group . . . . . . . . , . . . . , . . . . . . . . . . . . . . . . . . . . . . . . . . . . . . . . .
Communities with biggest populations:
Cape Dorset
Igloolik
Pangninung
Pond Inlet
Communities nith midrange populations:
Cl!de Rner
Hall Beach
Communities with smallest populations:
Broughton Island
Gnse Fiord
Lake Harbour
Violent Crime Rate
Total Number of Violent Population Offences
. . . . . . .
Source CCJS. 1993
It is not just in recent times that the Baffin Region has exhibited variations in the amount
of crime present between communities An examination of crime statistics over recent history

confirms that, for many years, there has been variation in community-level crime rates The
inter-community variation of violent crime rates for the most populous communities, for the
middle size population communities, and for the least populous communities are presented in
Figure 6. Figure 7, and Figure 8, respectively Developed from community-level crime statistics
published by the RCMP,8 each of the figures shows that there is a great deal of variation
between communities of similar size Cape Dorset, as shown in Figure 6 , had the tughest violent
crime rates among the "larger" communities (those with populations of more than 1,000) in 12
out of 13 years from 198 1 through 1993 In Figure 7, which compares the violent crime rates of
the mid-sized B a f h Region communities, reveais that Hall Beach and Sanikiluaq generally have
had higher rates than Nanisivik or Clyde hver There is also a great deal of variation in the
violent crime rates of the smaller communities Figure 8 shows that Resolute Bay has, since
198 1 at least, always had the highest violent crime rate while the violent crime rates of Gnse
Flord and Lake Harbour hakve generally been quite low e
Figure 6: Violent Crime Rate, Four Most Populous Baffin Region Communities, 1981-1993.
, - Cape Dorset
1 4 - . - - Iglooh k
- - - Pangnirtung - Pond Inlet
Source RCMP Operaborn1 Sfabsbcs R e p o m q Year System Deta~led Crime Report. 'G' D~vtston
~ o r ' a cornpanson of RCMP and CCJS data. see the section in Chapter 3 on crime statisucs.

Figure 7: Violent Crime Rate, Four Middle Size Baffin Region Communities, 1981 -1 993.
4
I - I
Clyde Rwer
t - . - - Hall Beach I
.- .-- .- 7 r Y 7 v 7 7 .- Y v
Source RCMP Operabonal Stabsbcs Reporbng System Detalled Cnme Report. 'G' D ~ v ~ s ~ o n Year
Figure 8: Violent Crime Rate, Four Smallest Baffin Region Communities, 1981-1993.
Source System
RCMP Operabonal Stabsbcs Reporbng Detailed Cnme Report 'G' Diwsion Year
SUMMARY
The changes the Inuit of the Baffin Region have faced as a cultural group within the past
half-century have been tremendous Withn that time they have gone fiom a semi-nomadic

hunter-gatherer existence t"o: one rooted in permanent settlements and irreversibly linked to the
south of Canada for sustenance Besides their shared historical and cultural heritage, the Inuit
communities of the Baffin Region have a number of present-day attributes in common From a
geographic standpoint, the communities of the Baffin Region are all still relatively isolated and'
subject to the perils of the harsh arctic environment In terms of their demographic composition,
all Baffin Region communities have comparatively small populations that are growing at a pace
generally associated with third world nations

CHAPTER 3: PRIOR EXPLANATIONS OF VIOLENT CRIME IN NATIVE, COMMUNITIES
As shown in the previous chapter, violent crime is one of the larger concerns of
communities in the Baffin Region The frequency with which native peoples are touched bv
violent crime adds credence to those concerns. This chapter examines several of the major
attempts to explain violent crime among the native peoples of North America
Two major perspectives currently employed to explain violent crime in native
communities are considered here First, this chapter will review studies that have attempted to
link the process of European expansion and colonization to violent crime in native communities
in North America Second, studies on the possible impact that alcoholic beverage use has had
on violent cnme in nati\.e communities are considered.
There are several reasons why it is important to take a look at prior research on
correlates of cnme in nati\,e communities Most importantly, it provides a starting point for the
de\,elopment of theoretical models to understand the community characteristics associated with
~iolent crime Examinarion of the literature on violent crime in native communities also allows
for the identification of explanations that have proven fruitful in explaining why some nati\.e
communities ha\.e more violent crime than others, as well as pointing out which explanations are
of little informative value Ultimately, this examination will provide a basis for the selection of
meas~ires of community characteristics that might possibly be found to be associated with violent
crime at the community level
COLONIZATION AND CRIME
Over the past thirty-odd years the focus on the plight of natives in North America has
shifted Jorgensen ( 197 1 ) points out that prior to 1960, most of the social problems natives
encountered here attributed to their inability to become acculturated into mainstream society
Since then, these acculturation-failure models have fallen into disfavor and have been replaced
by a perspective that focuses on the relationship aboriginal peoples have had with the larger
political economy With the radicalization of the social sciences during the early 1970s came the a,
') N'here appropnate. due conslderat~on 1+-111 be gnen to studies lookmg at cnme among natne peoples in Australia. Greenland. and S ~ b e n a
25

application of theoretical models to the situation of aboriginal peoples d c h previously had
been used to explain poverty and underdevelopment in "third-world" nations.
Following the works on 20th century colonialism in Latin America (Snipp, 1986). a
multitude of studies loolung at the aboriginal peoples of North America have identified the
socio-structural position of aboriginal peoples within the parameters of a colonialist model
. Many scholars looking at the relationship between aboriginal peoples and the dominant whte
society speak in terms of a neo -c~ lon ia l~~ relationship in which the imposition of white economic
and social structures leads to the economic and social underdevelopment of the aboriginal
population (Anders, 1980, Harding, 1988, Jorgensen, 197 1 , 1978; LaDuke & Churchill. 1985, ,
Pretes, 1988, Snipp, l986a) These neo-colonial models are premised on the Marxist view that
the capitalist economic structure results in development for the few and underdevelopment for
the many, u.hich includes aboriginal peoples (Owens, 1976) This underdevelopment is said to
result in po\.erty. under- and unemployment, low levels of educational attainment, a lack of *
access to capital and land. social disorganization, and pretty much everything else that ails Y
aboriginal peoples (Jorgensen, 197 1 , 19?8)
The underdevelopment ,wtuch results from the neo-colonial relationshp is said to be
ultimately responsible for vioknt crime among aboriginal peoples Bachman (1992) argues that L -
measures of social disorganization, economic deprivation, and culture conflict (all said to be the
result of colonization) are all relatively strong predictors of county-level homicide rates among
aboriginal peoples in the CS She argues that "no model explaining any phenomenon with
regard to American Indians would be complete without acknowledgment of the colonization
process to which our go\.ernment has subjected this population" (Bachrnan, 1992, p. 36).
As might be expected, the rates that aboriginal peoples come into contact with the
criminal justice system are much higher than those of non-aboriginal peoples (Wood & Gnffiths,
1996) The highest pro~~inciaVtenitoria1 crime rates are in Canada's two northern territories,
where the largest proportions of aboriginal peoples reside The neo-colonial model serves as an
insighthl framework for explaining inter-cultural patterns ( i e , aboriginal vs non-aboriginal) of
The terms 'neo-colonlal' and 'colonial' ha\e been used ~nterchangeabl! 1978. p 5 )
to explan the relationship (Jorgensen.

..
%
crime, mainly because the many outcomes of colonialism - underdevelopment, social -4 r
disorganization. culture conflict. and relative depribation - which affect aboriginal peoples, are
thought to be associated with criminal behavior (Vold & Bernard, 1986; Bachman, 1992)
Fieras and Elli~tt ( 1992, pp 16- 18). for example, argue that aboriginal overrepresentation in
Canadian crime statistics is but one outcome of "colonialist domination" (see also Berger. 199 1.
p 36) Colonization (and its consequences such as poverty, underemployment, social
disorganization) has also been offered as an explanation for why the crime rates for aboriginal
peoples are higher than for non-aboriginals. Minnis (1963), for example, pointed to the
dilapidated and crowded housing, poverty. unemployment, and lack of access to farm land
among the Shashone-Bannock of Fort Hall, Idaho as a reason why that American Indian
resenation had crime rates many times that of surrounding non-Indian communities or the
national average In explaining the patterns of aboriginal crime in the urban centres of Calgay,
Regina. - and Saskatoon. Trevethan ( 1 993, p 34) argues that "the differences in crime patterns
bet~.een aboriginal and non-aboriginal persons may be attributed to several socio-demographic
x \.ariablesU including lower levels of educational attainment, labor force participation, average
income. and higher le\.els of unemployment This colonial perspective is valuable because it
suggests u h ) , aboriginal peoples who are subject to the effects of colonization may have higher
~iolent crime rates than non-aboriginal peoples who are not subject to the effects of
colonization
Although the colonization perspective is able to explain inter-cultural ( i e . aboriginal
Lrersus non-aboriginal) differences in levels of officially recorded criminal behavior, it has been '
less successfid in explaining the intra-cultural differences in crime among aboriginal peoples
The colonization perspective would lead one to predict that the consequences of colonization
were equal& as disastrous for all aboriginal cultures and communities and, therefore, there
should be little variation in violent crime among these cultures and communities And yet, there
is great \variation in levels of officially recorded violent criminal behavior between communities
(see Chapter 2) that share many of the same difficulties - low levels of education, employment.
and income, and loss of traditional cultural practices Ttus suggests that these types of variables

are unable to tell us why some abonginal communities have tugher rates of violent crime than
others (Marenin, 1992, Wood, 199 1 )
Only a couple of studies have attempted to account for variation in violent crime
between native populations using measures of the consequences of the neo-colonial relationstup
that exists between native peoples and the larger political economy Bachman's (1 992) multiple
regression model using measures of socio-economic underdevelopment showed some success
accounting for differences in American Indiafi homicide rates in 1 14 "reservation" counties
across the L'S Wolff ( 199 1 ), in a rank-order analysis of the crime patterns on Saskatchewan
yesen.es. found no relationstup between the manifestations of colonization (including single
parent families, pesons per dwelling, unemployment, labor force participation, education, 4.
average income, ahq Incbme from government transfer payments)'' and violent crime rates
Other than the studies by Bachman ( 1992) and Wolff ( 199 1 ), there has been little el .
research m,hich has attempted to explain differences in violent crime rates between native
'communities from the perspective of colonization Depending upon how one looks at it, the lack
of prio; reiearch using the colonization perspective to account for differences in violent crime
between a&ri%inal communities can be seen as a curse or as a blessing On the one hand. the
iack of prior research is a curse because there is little to guide the current study in linking
colonization to violent crime at the community level On the other hand, the lack of prior
research is a blessing becaw9 there are no set limits to the ways that colonization can be looked
at to find cornmunit>,-levelfa,~tors associated with violent crime That lack of limits will allow -3-
for the dei,elopment of theoretkal links between colonization and violent crime that take into - account the special historjcal, geographic, and cultural context of the Baffin Region
ALCOHOL AND CRIME AMONG NATIVE PEOPLES t,
In the study of criminal behavior among aboriginal peoples, a large amount of time and
effort is spent consid the role of alcohol consumption as a correlate of crime Some
f
* In thc abong~nal cnme l~terature. these measures are taken to be ~nd~cators of the effects of colon~zauon In that literature no connection 1s made betueen the measures and the Impact that the Euro-Canalan pol~ucal
*'r econom! has had upon abonginal peoples Howeker. research u h x h looks w n l j at the effects of coloruzat~on b wpon abonginal peoples would pant out that such \anables measure the extent to whch colonmuon has created
joc~al d~sorganizat~on In ab&h@nal communmes (Berger. 1991. Fleras & Elliott. 1992) . - *
1.
- 28

commentators argue that it is difficult to study crime among aborignal peoples without
considering the role of alcohol (Peak & Spencer, 1987, Mills, 1989) Respondent after
respondent in inteniews conducted for the Baffin R e g m Crime and Justice Study (Griffiths, et
a1 , 1995) pointed to the use of alcohol as a prime contributor to crime in the jurisdiction. As
will be seen below, there have been many studies which have attempted to account for the
seemingly all-pervasive amount of alcohol-related violence among native peoples Before that
discussion of the explanations for why alcoholic beverage use leads to violent crime among
native peop!es, this chapter examines the variability in alcohol use among different groups of
native peoples and then considers the degree to which alcohol use is implicated in the violent
offences for which native offenders come into contact with the criminal justice system
Prevalence of Alcohol Use
Zot all aboriginal peoples drink Among many aboriginal groups the proportion of
dnnkers is less than that found in non-aboriginal populations (May, 1989, 1992) There is a
great deal of variability across aboriginal cultural groups and across aboriginal communities in
terms of the proionion of i~&viduals that consume alcohol. It is important to point out the
variability in aboriginal drinking for two reasons First of all. as pointed out by May ( 1 992).
there are many misconceptions surrounding drinktng by aboriginal peoples. As he points out in
reference to American Indians, "[sltereotypes and myths have so clouded the perceptions of
rrfost .Americans, both Indian and non-Indian, that most people believe that a much greater
proportion of the Indian population drinks than actually does so" (May, 1992, p. 8) A
comparison of alcohol use among different aboriginal groups will help to disconfirm such
stereoty-pes A second reason for loolung at variation in aboriginal alcohol use, and the reason
whch is most important for the purposes of this study, is that community-level variations in
alcohol use must first be established before such variation can be implicated as being responsible
for variation in crime rates
The prevalence of alcohol use among aborignal peoples and its variations can be seen in
the numerous studies that have looked at aborignal drinktng over the last three decades. In
Table 5, the prevalence of alcohol use amdrig different aboriginal groups as reported in studies
of an ethnographic nature are shobn The proportion of drinkers reported varied from 'nearly

all' adult male Naskapi to 'slightly more than half of Navajo at Rimrock, New Mexico. All but
one of these ethnographic studies reported a high prevalence
Survey research cver the past quarter-century has shown that in some places, at specific
time periods, there have been recorded differences in the prevalence of alcohol us4 among
aboriginal peoples For instance, as is shown in Table 6 , only 30 percent of the Navajo surveyed
by Lecy and Kunitz (1974) in the early 1970s were drinkers Twenty years later Avkesntyuk
et a1 ( 1994) reported that 98 percent of the Chukchi and Eskimo peoples in Siberia they
surveyed were drinkers Because of the 20 year period of time between those studies, it is not
possible to say that more Chukchi and Eskimo of Siberia are drinkers compared to the Navajo
It is possible that very few Chukchi and Siberian Eskimos drank in 1974, as it is possible that
nearly all Navajo were drinkers in the early 1990s h the use of different time frames does not
allow for direct inter-cultural comparisons, all that can be claimed is that there were
proportionally more Chukchi and Siberian Eskimos that were drinkers in the early 1990s than
there were Navajo that were drinkers in the 1970s The best indication in Table 6 of
inter-cultural variation in the prevalence of drinkers is found in the results of the Health and
Welfare Canada ( 199 1 ) survey that compared the proportion of Inuit (at 48 percent drinkers)
and Dene (at 79 percent) in the NWT that were considered to be drinkers
Table .S: Alcohol Use Prevalence Among Different Aboriginal Cultural Groups As Reported in Ethnographic Studies.
Cultural Group and Locat~on . . . . . . . . . . . . . . . . .
Forest pot an atom^.
Upper Peninsula. hllchigan
Naskapi. Scheffen~lle. Quebec
Chpe\\?an. Snow dnfi. NRT
Mescalero Apache Males. Neu Meuco
hlescalero Apache Females. Sew M e w o
ha\ ajo. kmrock. Ne\\ Meslco
Proporuon of Drinkers Repdned . . . . . . . . . . . . . . . . . . . . . . . . . . . . . . , . . . . . . . . . . . . . . . . . . . . . . . . . . . . . . . . . . . . . . . . . . . . . . . . . . . . . . . . . . . . . . . . . . . . . . . . . . . . . . . . . . . .
"Of the 71 adults. only 7 could be considered as moderate dnnkers or nondnnkers"
"1 knew of only one adult male who claimed never to dnnk. Othemise. all Naskapi males dnnk. and most dnnk heaily"
"Nearly all . . . adult males dnnk home brew. and most of them become intoxicated at least once a month or oftener"
"Our of 54 men . . . , only 1 described themselves as absmners. and 15 stated that they drank at least mice a week"
"5 women out of 32 stated they abswned from dnnlung. and 6 that the! drank at least mice a week"
"shghtl! more that half of the total population of 6 1 1 would probabl! ha\,e to be counted as occasional dnnkers" ~r
Source
Robbins. 1973
Vanstone. 1965
Heath. 1961

For each aboriginal group save the Iiiupiat, the prevalence of drinlung is less than or
equal to that for the comparative group of non-aboriginal peoples For instance, the 79 percent
of Dene and 48 percent of Inuit in the NWT that drink is less than the 86 percent of
non-aboriginal peoples in the NWT that drink (Health & Welfare Canada, 199 1 ) Likewise, the
70 percent of all aboriginal peoples in Canada that drink is less than the 78 to 8 1 percent of the
Canadian population that drinks alcohol (Health & Welfare Canada, 198 1, 1988, 1990; 199 1.
1993) Even the high prevalence of drinking among the Chukchi and Eskimo peoples of Siberia
(who are said to be closely related to aboriginal peoples of North America (Shelds, et a1 ,
1993)) is roughly equal to the high prevalence of drinking by other Russians (Avksentyuk, et a1 ,
1994)
Table 6: Alcohol Use Prevalence Am~ng~Different Aboriginal Cultural Gfoups As Reported in Surveys on Alcohol Use.
Cultural &up and Locatlon Source
7 Na\ ajo Nauon Communltles. Anzona
South-central Na\qo Katlon Anzona
lnup~at. B a r r o ~ , Alaska
Inult Adulrs. 1985-86. NMT
Dene Adults. 1985-86. N\VT
Aboriginal Adults. 1990- 199 1. Canada
Chukchl & Esklmo. Northeastern Slbena. Russ~a
Proporuon of Drinkers Reported . . . . . . . . . . . . . . . . . . . . . . . . . . . . . . . . . . . . . . . . . . . . . . . . . . . . . . . . . . . . . . . . . . . . . . . . . . . . . . . . . . . . . . . . . .
30 percent of Na\,ajo sampled were current dnnkers
5 2 percent of Navajo adults were current dnnkers
83 percent of Adult Ifiup31 in Barrow were dnnkers.
48 percent of Inult had consumed alcohol in the !ear pre\lous to the suney.
79 percent of Dene had consumed alcohol in the !ear pre\-~ous to the s w e y
70 percent had consumed alcohol in the year pre\lous to the swe!
98 percent of males sampled had consumed
Le\? & Kunltr. 1974
Ma! & Smith. 1988
Klausner & Foulks. 1982
Health & Welfare Canada. 199 1
Health & Welfare Canada. 199 1
Statistics Canada. 1993a
Avksenhk, et al. alcohol In year prior to the suney.
Alcohol Use and Criminal Justice System Contact
Ofihe offenders that come into contact with the criminal justice system, many do so for
offences committed following the use of alcoholic beverages. Studies exploring the incidence of
alcohol use prior to the commission of a criminal act among native and non-native populations
alike are abundant (Greenberg, 198 1 ). The assumption that alcohol is a w o n g correlate of
violent criminal behavior in native communities is in pan based upon the idea that a large

propo~ion of native individuals coming into contact with the criminal justice system as offenders
do so while under the influence of alcohol As is shown below, the premise of the above
assumption does have some merit
Studies which have examined offence characteristic information in police reports show
that many offences are committed while an aboriginal individual is intoxicated Auger, Doob.
Auger, and Driben ( 1 99 1 , p 329) showed that fiom 3 1 percent to 48 percent of all offences
committed in 3 Nishnawbe-Ash Nation communities were alcohol related Laprairie ( 199 1 ), in
her analysis of police occurrence reports recorded in James Bay Cree communities, found a high
degree of alcohol involvement for many types of offences. For example, she found that alcohol
was involved in 76 percent of assaults and 100 percent of sexual assaults, In all, of the 500
occurrence reports which recorded alcohol as being involved in an offence, "69 percent of
interpersonal and 16 percent of property offences involved alcohol" (Laprairie, 199 1 p 50)
Alcohol was implicated in anywhere from 56 percent to 83 percent of offences against the
person in 5 Alaska Native \illages studied by Marenin (1992, p. 346) On various Indian
resenations in the L'S. according to Stewart ( 1964, pp. 62-65), the offender was under the
influence of alcohol in anywhere fiom 59 percent to 95 percent of all types of offences
committed I n Australia as well, alcohol "is a factor in as much as 80 to 95 percent of all
aboriginal entanglements in the legal process" (Sackett, 1988. p 66)
Besides the police statistics, there are other indicators fiom the criminal justice system .
~vhich show that alcohol is implicated in many offences involving aboriginal peoples Mills
- ( 1989. p 13) found that of Wind kver Shoshone convicted for violent felonies, 82 percent were
intoxicated at the time they committed their offence. Of those offenders, 77 percent had three
or more previous alcohol-related arrests (Mills, 1989, p. 13). In a survey of 30 native homicide
offenders done by Bachrnan ( 1 992, p 3 l) , all but one were under the influence of alcohol during
the commission of their offence
Victimization and self-report suweys which are independent of criminal justice
processing also show that many potential offences committed by native peoples are alcohol
related Two survevs, in particular, show a hgh level of alcohol involvement in actions which
could be classified as criminal Klausner and Foulks ( 1 982, p. 167). in a survey of Ifiupiat in
Barrow. Alaska, found that 62 percent .of the sample reported fighting while drinlung.

- Bachman's analysis of intake questionnaires at two battered women's shelters found that 75
percent of aboriginal women were physically abused by husbands or boyfiends who were under
the influence of alcohol ( 1992, p 92)
It must be pointed out, however, that it is not just native offenders that have consumed
alcohol prior to getting into trouble with the law. Wh~le it is difficult to make direct
comparisons, a multitude of studies showing that a great number of offences committed by
non-native offenders were alcohol related can be taken to indicate crime committed after
drinking isn't solely a native phenomena A host of studies fiom across the globe show that
manv of the individuals held in correctional institutions were incarcerated for offences
committed while under the influence of alcohol In the United States, for instance, depending on
the year, anjwhere from one-third (36 percent in 1986) to one-half (49 percent in 1979) of state
prisoners, two-fifths (4 1 percent in 1989) to one-half (48 percent) of municipal and county jail
inmates. and nearly one-third (32 percent in 1987) ofjuveniles held in state institutions were
under the influence of alcohol at the time of the offence that landed them in the institution
(Baunach, 1985, Beck. 199 1 , Beck, Kline, & Greenfeld, 1988, Imes, 1988) In England, 38
percent of young offenders in a borstal admitted drinlung prior to their present offence (Hollin,
1983) uhile 67 percent ofjuvenile "trainees" being held for a violent crime were under the
influence of alcohol at the time of the offence for which they were being held (Cookson, 1992)
Studies in Dsiimark, Sweden, Finland, Norway, and Iceland have shown that roughly 60 to 80
percent of violent offenders were under the influence of alcohol at the time of the offence
(Hague. 1990)
In short, it appears as though roughly equal proportions of the offences that come to the
attention of the criminal justice system for both native and non-native peoples are alcohol
related Furthermore, as seen in the preceding section, the differences in the prevalence of
alcohol use between native and non-native peoples are either small or seem to show that natives
are much less likelv to use alcohol (May, 1992) Despite those similarities, the relative amount
of violent crime found in many native jurisdictions is much more prevalent compared to that
found in non-native jurisdictions (see Chapter 2, especially Table 2) These latter two points
(roughly equivalent proportions of alcohol related violent crime and much higher rates of violent
crime in native jurisdictions), when taken together, indicate that there is a relatively greater

amount of alcohol related violent crime in native jurisdictions. The explanations for why there is
relatively so much more alcohol related violent crime among native populations are cbnsidered
below. * The Alcohol / Violent Crime Relationship
There is little agreement as to why drinking leads to violent crime. The explanations for
why alcoholic beverage use leads to violent behavior can be placed along a continuum ranging
from the biological to the social At the biological end of the continuum are the explanations
which link the physiological effects of alcohol to violent behavior. Explanations at the social end
of the continuum are predicated upon the premise that violent behavior resulting fiom alcohol
use is socially determined Located between the biological and social models are the various
bio-social explanations, which argue that the physiological effects of alcohol combined with a
pre-existing anti-social setting can lead to violent behavior Wh~le each of these general
categories of explanation are used to account for the effect of alcohol on violent crime among
aboriginal and non-aboriginal peoples, the following discussion focuses on those which have
attempted to address the issue among aboriginal peoples
Biological Explanations
The assertion that aboriginal peoples have a biological or genetic predisposition to
becoming violent when using alcohol has been widely debated (e g..Avksentyuk, et al., 1994,
Fenna, hlix, Schaefer & Gilbert. 197 1 , Wolf, 1980, v Schaefer, 198 1 , May, 1992) Biological
explanations are centred on the premise that as a pharmacological agent, alcohol causes specific
changes in physiological processes and identifiable psychological abilities including changes -
which produce violent behavior (Pernanen, 199 1 ) Proponents of biological explanations of the
alcoholicrime relationship axong aboriginal peoples offer three explanations of the effects of ,-
alcohol on aboriginal peoples 1 ) aboriginal peoples metabolize alcohol at a slower rate (Fenna,
et a1 , 197 1 ). which makes them more susceptible to committing criminal behavior while
intoxicated, 2) aboriginal peoples are genetically predisposed toward the abuse of alcohol
(Fenna. et a1 . 197 1 , Grygier. 1948) and the problems that accompany its use, and 3 ) aboriginal
peoples have a greater propensity toward 'blackouts' which are said to be accompanied by
kiolent and anti-social behavior (Wolf, 1980)

For the most part, these wholly biological explanations have been dismissed by both
medical and social scientists Schaefer (1981, p 114), in a thorough examination of the medical
literature argues that "we cannot prejudge a person's drinlung problem based on culture or race"
because medical science has yet to show that there are racial differences in rates of alcohol
metabolism or in the sensitivity toward alcohol, and that genetic differences have yet to be
mapped out. As May ( 1989) points out, because the infra-racial differences of biological factors
such as metabolism or sensitivity are much greater than the inter-racial differences on these
factors, it would be foolish to attribute the crime which results fiom the use of alcohol by
aboriginal peoples to such factors
The idea of trying to make inter-racial comparisons of the effects of alcoholic beverage
use has been strongly denounced by Fisher (1987) who raises two important points. First,
Fisher argues that using biological race as a scientifically valid concept is problematic because
there is not a great deal of diversity between racial groups. Fisher (1987) cites a study
(Leurontin. 1972) which showed that only 6 3 percent of human difference can be accounted for
by differences between racial groups. Second, Fisher argues that malung a "racial" comparison
between aboriginal and non-aboriginal peoples is problematic because the "racial" groups are
not as homogenous as would be necessary to make such comparisons. Fisher (1987) points to a
study (Szathman R: Reed, 1972) which shows that there is a significant European contribution
to the genetic make up of some aboriginal peoples in Canada.
While medical and social scientists have rejected the first two types of biological
explanations described above, theie has been no strong condemnation of the 'blackout'
explanation advocated by Wolf ( 1 980) According to this perspective, aboriginal peoples have a
lower threshold of 'alcoholic amnesia' after blood alcohol levels go above a certain point and
once blacked-out they are prone to commit violent crimes (Wolf, 1980). In his study, "alcoholic
amnesia was reproduced clinically in 5 Alaskan Native men who had committed homicide during
previous alcoholic blackouts but had no recollection of events" (Wolf, 1980, p. 456). The
subjects were said to e h b i t a violent and angry mood during these blackouts (Wolf, 1980, p
460) While Wolf (1980) does show that blackouts do occur and that they perhaps may lead to
violence, he fails to show that Alaska Natives have a lower threshold of alcoholic amnesia
because no comparative group of non-Alaska Natives is considered. He also fails to establish

the degree of "racial purity" of the Alaska Natives used in the study and to account for the
European contributior. to t h e genetic make-up of Alaska Natives It may be that it is because of
the blackout and not because of the race of the drinker that the violence occurred
Social Explanations
At the opposite end of the continuum is the social explanation for alcohol-related
violence From this perspective, violent behavior, as with most other "behavrors ofpeople
under the ~nfluence, are learned, socrally determrned behavrors" (May, 1992, pp 9- 10,
emphasis in original) These social explanations view violent drunken behavior "as rather
exclusivelv determined in a basically instrumental fashion by socially provided behavior norms"
(Pernanen, 199 1 , p 18) In their classic study of the "drunken comportment" of individuals
across many societies. MacAndrew and Edgerton (1969, p 88) argued that.
Chvr the course of .socra/r,-ari&, people learn about drunkenness what their S O ~ I ~ ~ J " ~ T C I I O H ~ S " uhout drunkenness; and, accepting am' acting upon the rrndt~rsraidings thus imparted to them, they become the livrng corljirmation of their .socit~h~'.s teach~ngs (italicized in original)
There are four types of social explanations for the relationship between alcohol use and crime
among aboriginal peoples The first is a modeling or social-learning approach. which purports
that aboriginal peoples get in trouble when they get drunk because their models of drinlilng
behavior have taught them that you are supposed to behave in such a manner when intoxicated
The second approach is one which looks at how the legal environrnentjnfluences drinking
habits. where alcohol is prohibited or strongly regulated, rapid binge drinking often occurs and
trouble erupts from quick and hgh levels of intoxication. A third'approach argues that cultural
influences remaining from pre-contact social organization still play a role in influencing behavior,
even drunken behavior The final social approach argues that drunken violence is a way for
aboriginal peoples to gain a form of social power in an unjust society where they have none
Proponents of the social learning or modeling approach assert that aboriginal peoples, as
social groups, have been exposed to models of intoxication in which violence is the norm. In
his historical look at the American fiontier Winkler (1966) describes how Indians became
l 2 Camell (1989) found that alcohol related \iolence is much lower on the islands of Pol!-nesia colonized b! the French. where access to liquor 1s much more permissi\.e and drunkenness is not associated uith ~iolence. compared to the ~slands colonized b! the Amencans or British.

entangled in the h n k e n debauchery which was the hallmark of the 'wild west', mainly because
they knew of no other way of drinlung alcohol except for the expressed purposes of becoming
drunk and rowdy Levy and Kunitzi1974, pp 68-71) note that in many ways drinking patterns
on the Navajo Reservation resemble the patterns of hard drinlung cowboys and railroad workers
from the 1880s. In many places in the Canadian and American west these models are still
provided to explain the drunken behavior of mn-natives of the area (Anderson, 198 1, p. 3 8,
Gray, 1995; Wilkinson, Thompson, Reynolds, & Ostresh, 1984). Because aboriginal peoples
have yet to develop a perspective on alcohol which is culturally relevant (Peak, 1989), and
because there are no traditional patterns of control (Northend Ferguson, 1968); their only
indication of what is acceptable intoxicated behavior comes from those who behave violently
while intoxicated ( ~ a c i & Bornstein, 198 1 ).
The arguments that the legal environment plays a role in the drinlung patterns of
aboriginal peoples, which, in turn, iead to violence, are rooted in a consideration of the special
alcohol prohibition legislation created for aboriginals Until 1958 in Canada (and in 1953 in the
CS) it was illegal for an aboriginal person to possess alcohol or for a non-aboriginal person to
sell it to an aboriginal person On over two-thlrds of American reservations and on many
Canadian resenes and aboriginal communities, it is still illegal for people to possess alcohol
Mav ( 197;) points out that because of prohibitions on the use of alcohol by aboriginal peoples
on resen.ations (and originally everywhere), they have ,learned to consume liquor rapidly so as to
reduce the risk of being caught with it in their possession. "In other words, the drinking patterns
which ha\.e developed in Native American society may have been highly influenced and shaped
bv the unique legal status of alcohol" (May, 1975, p 133) Hayner, more than 50 years ago,
tells us about the American Indian tribal leader who said that the rapid consumption of alcohol
on resenations to avoid confiscation and arrest was because "the boys figure they can't take it
away if it's inside" ( 1942, p 603)
Even within cultural groups the role of this prohibition on drunkenness and behavior is in
evidence L e ~ y and Kunitz ( 1974, pp 134- 14 1) compared the drinlung patterns of Navajos who
resided on the resenation with the drinking patterns of Navajos who lived in a nearby city which *
bordered the resenation. on-reservation Navajos were binge drinkers who often got in trouble
after consumption while off-resenation Navajos drank more like lower or middle class blue

collar workers who would pick up a six-pack on the way home from work and drink it while
watching television and then go to sleep to be ready for the next working day
The attention paid to the effect of alcohol prohibitions upon alcohol related trouble such
as violent crime fits within a larger concern over the effect of alcohsl control policies. There are
many studies outside of those concerned with native peoples that consider the impact different
alcohol control policies have upon crime in a population Those studies have been characterized
by Gtacopassi and Stitt ( 199 1 ) as falling under what they call the drstribution of consumptior1
model According to that model, policies that allow for the increased availability of alcohol
increase the aggregate consumption in a population which, in turn, increases the amount of
"alcohol-related" damage such as violent crime (Giacopassi and Stitt, 1991) Essentially, the
drsrrrhutron-of con.szrmptrori model predicts that there will be fewer violent crimes in
jurisdictions where there are greater restrictions on the availability of alcohol
A pair of studies have considered the drstrrhution ofcorlsumptror~ model when examining
the effects of changes in alcohol policies upon violent crime among native populations Smart
( 1979) looked at the impact of changes in alcohol policies upon arrests for assault (among other
offences) in some selected hW'T communities with primarily native populations. He found that
some restrictions were accompanied with decreases in violent crime while others were not The
establishment of a rationing system (another legal method of controlling the distribution of
consumption) in the Ylackenzie hver community of Fort Resolution, for instance, failed to
reduce the assault arrest rate, whereas the assault arrest rate was cut in half with the imposition
of prohibition in the Great Slave Lake community of Rae-Edzo and the closure of the liquor
store in Iqaluit (Smart, 1979, p. 9 1 1 ).
Schechter ( 1986) considered the impact an experimental alcohol rationing program had
upon crime among the primarily aboriginal population of Greenland A comparison of the
number of crimes in 1978 in Greenland (the full year before rationing took effect) with the
number of crimes in 1980 in Greenland (the full year afier rationing took effect) shows that the 4-
rationing apparently did have some influence on the amount of crime (Schechter, 1986) One of
the most positive effects of the rationing system, according to Schechter (1986), was the drop in
ciolent crime in Greenland during the period of raticming, between 1978 and 1980 there was a
53 percent drop in the number of homicides, a 12 percent decrease in the number of attempted

13 homicides, and an 18 percent decline in the number of assaults These declines came with a 33
percent reduction in the amount of alcohol consumed Greenland between 1978 and 1980
(Schechter, 1986, p 59 1 ) An increase in violent crimes followed the end of the rationing
program in 198 1 There was a 25 percent increase in assault and a 10 percent increase in sex
crimes between 1980 (the last full year that the rationing program wmin effect) and 1982 (the
first full year after the end of the rationing program) in Greenland (Schechter, 1986) However,
the increases in .Jiolent crime were not in direct proportion to the increase in the consumption of
alcohol which increased 96 percent between 1980 and 1982 (Schechter, 1986, p 59 1 ) 1
Most of the literature on aboriginal drinlung tends to discuss the reasons for drinking and\
criminal behavior among aboriginal peoples as if they were one homogeneous group, which they
certainly are not (hlav, 198 1 ) Some have looked to the distinctions between aboriginal cultures 7
for explanations of the links between alcohol use and criminal behavior Lecy and Kunitz (1974)
compared the king patterns and resulting behavior of three different southwestern US Indian
Tribes who had quite varying pre-contact social organizations The three tribes they studied r
, ' were looked at according to the degrees to which the socio-cultural integration was
indi\.idualistic or communalistic. the \khite Mountain Apache were said to be more
indi\idualistic than the Navajo who were more individualistic than the Hopi, who were the most
communalistic Both historical and contempor&-y statistics and sources were used by Le\y and
Kunitz ( 1974. pp 98- 103) to demonstrate that the Apache use alcohol more and are more
violent when intoxicated than the Navajo, who use alcohol more and are more violent when
intoxicated than the Hopi. who have relatively fewer problems with alcohol and alcohol related
violence
The final social approach considers the domination over aboriginal peoples' lives by
non-aboriginal colonizers as a source of drunken violence which serves as a means for aboriginal
peoples to gain a form of social power in an unjust society where they have none According to a
Lurie ( 197 I , pp 3 14- 15 [cited in Sackett, 1988]), aboriginal peoples use alcohol and sometimes
act in a violent manner "to register opposition and hold the line against what they do not want "
- - - -
I
here is. hor+e\er. a 28 percent Increase in the number of sex cnrnes In the 1978 to 1980 penod in Greenland. a figure that Schechter (1986) does not account for

Lurie ( 197 1 ) suggests that the use of alcohol by aborigmal peoples can be seen as protection
against the larger social order and as a tool for the maintenance of distinctness from the larger
assimilative society Sackett, who studied the use of alcohol and criminal behavior of
Aborigines in Western Australia argues that:
Liquor, the substance of disorder and chaos, provides an ideal way of responding - to the perceived threat of being ordered by and completely incorporated into the
wider society Intoxication simultaneously facilitates and to an extent excuses the apparently uncontrolled behavior of a people opposing the imposition of ever more constraints Certainly this is the case for Western Desert Aborigines (1988, p. 67)
In h s description of the drinlung behavior of the Aborigines of Wiluna, Sackett (1988, p. 69-70)
shows they drink "to get drunk" and that their reactions when intoxicated are violent, "especially
to attempts by others to order or control them "
BIO-Social Explanations
Situated in the middle of the explanatory continuum of alcohol related violence, the
bio-social explanations have most frequently (in the aboriginal alcohol use 1 crime literature)
been utilized to explain the violence associated with aborigmal alcohol use Most of these
bio-social explanations are made by those who wish to emphasize the influence of macro-level
social structural influences upon crime. but they also try to take into account the effects of
alcohol. which they treat as an intervening variable between the social world and crime Taking .
into account both the physiological and psychological effects of alcohol use and the social
setting in which alcohol use takes place, this perspective views alcohol as a "disinhibitor," a
"trigger," or even a "catalyst" for violent behavior Alcohol exacerbates a pre-existing
anti-social situation, thereby leading to violent behavior Using a largely bio-social explanation.
Jilek-Aa11 ( 1988, p 605) argues
Rapid Westernization, destroying the adaptive hnction of indigenous culture, has a detrimental effect upon these northern communities Alcohol abuse, killing the pride that was left, destroying family life and depleting resources, becomes a tragic and self-defeating means of relief The disintubiting effect of alcohol facilitates violence and &lf-destructive behavior
McCone ( 1966, p 150) also employs a bio-social explanation when he argues that "the
breakdown of the old cultural definitions then are a factor in the increased drunkenness, and
increased drunkenness in turn becomes a factor in increased crime against the person "

Jayewardene ( 1 975) argued that among the Inuit, alcohol~$~a catalyst for violence which
is grounded in psychologis;al stress produced by social disorganization In a similar light. Finkler
(1976, p 51), in a study of crime problems in Iqaluit, suggested that among the Inuit "aggressive
behavior, whch emanates fiom a situation of cumulative stress, appears to be unmasked by
alcohol " Researchers utilizing the bio-social approach have argued that socio-cultural strain
(Klausner & Foulks, 1982). rapid economic development and growth (Hobart, 1978). and
unemployment and poverty (Peak & Spencer, 1987, Mlls, 1989) among aboriginal peoples,
when combined with the use of alcoholic beverages, quite often leads to violent behavior
Implicit in these bio-social explanations of why alcohol consumption leads to violent
crime is the presumption that when all else is held equal in a population (e .g , poverty or
socio-cultu~al strain) there should be a direct relationship between the amount of alcohol used
and the amount of violent crime committed This underlying presumption is c o n t a i k in what
Giacopassi and Stirt ( 199 1 ) have termed the constant proportion hypothesis: the proportion of
excessi\.e drinkers and, therefore, the amount of alcohol related damage (such as violent crime)
in a population are directly related to the amount of consumption in the population (see also
Room, 1978. Rush, Gliksman, Br Brook, 1986)
b'hile the studies that have considered the constant proportion hypothesis in non-native
jurisdictions ha\,e provided mixed support (Giacopassi 8: Stitt, 1991, Lenke, 1984, Lester,
1992). there was little suppon fiom the one study that has attemptedYto use it to explain violent
crime among nati~.e peoples That study, by Hobart (1978). found iittle support for the idea that
the amount of consumption was related to the amount of violent crime in the Mackenzie k v e r
valley of the h i T , Canada There Lvas no relationship between the rate of convictions for
non-liquor offences in Magistrate's Court and the per capita dollars spent in local liquor outlets
during the years 1960 through 1975 Instead, Hobart (1978) pointed to the oil exploration
boom and the completion of a highway up the Mackenzie k v e r valley as a possible explanations
for increases in \.iolent crime rates
SUMMARY
This chapter has examined two different perspectives attempting to explain td high rates
of ~iolent crime found among native peoples First of all, a consideration of the colonization

perspective was undertaken The research reviewed in that section contends that the
socio-economic underdevelopment said to result from the colonization process is ultimately
responsible for the large amounts of violence found in native jurisdictions. Second, explanations
of the relationship between alcohol use and violent crime among native peoples were presented
The broad range of reasons, biological to social, for the acute prevalency of alcohol related
violent crime in many native populations were examined.
Although the range of explanations considered from both perspectiveq was quite diverse.
the research that has been performed is similar in at least one respect. The studies have
examined violent crime among native peoples either at the level of all aboriginal peoples or at
the level of a single community/tribal grouping. Relatively few studies have attempted to explain
the differences in violent crime rates between different ethrucally homogeneous native
communities As such, it is difficult to assess the degree to which the explanations that have
support when explaining the differences between native and non-native violent crime rates are
supported when applied to the differences between native jurisdictions. Later, in Chapters 5 and
6, both perspectives are considered in an attempt to find the community characteristics that are
associated with variation in Baffin Region community violent crime rates In the next chapter,
however. the data and the methods used to carry out the study are presented

CHAPTER 4: DATA SOURCES AND ANALYTICAL TECHNIQUES
This study is essentially a correlational analysis attempting to link variability in Baffin
Region community violent crime patterns with other community characteristics, within
theoretical frameworks tahng into account the potential effects of colonization and alcohol
consumption The community-level measures of violent crime, indicators of alcohol use, and
measures of the impact of the colonization process used in this study were developed fiom a
variety of primary and secondary data sources 'The examination of the correspondence between
violent crime variations and differences in community characteristics in this study was performed
using nonparametric statistical techruques which are especially suited for studies having a small
number of cases This chapter provides a description and explanation of the data sources used
and of the type of analyses performed in this study 9
DATA SOURCES
Both qualitative and quantitative data sources were used in this study The analyses that
attempted to determine the correspondence between violent crime and the community
characteristics related to alcohol use or to the colonization process, relied primarily upon
quantitati~re sources of data The conceptualization of the various hypotheses connecting Liolent
crime to alcohol use or to colonization was supported and illustrated by the use of qualitative
data sources
Some of the data used in this dissertation are from secondary sources One secondary
data source. especially as i t pertains to qualitative data, was the Baffin Region Crime and Justice
Study The BafTin Region Crime and Justice Study was carried out fiom 1990 to 1994 by a
multi-disciplinary research team (including Inuit field researchers) in the B a n Region
communities (Griffiths. et al . 1995) The primary mission of that study was to gather
information and provide analyses which would be of use to Inuit community leaders, hamlet
councils, and regional organizations in their efforts to improve the delivery ofjustice services in
the existing region, as well as in the soon-to-be-created territory of Nunavut The qualitative
data gathered in the Baffin Region Crime and Justice Study and used in the present study
included ( I ) responses gathered from semi-structured inteniews performed with community
residents, justice system personnel, and with other social and health service.providers, and (2)

the personal field notes of the author of the present study. Various sources of quantitative data
origmally gathered for the Bafin Regon Crime and Justice Study, including both the community
measures of violent crime and the individual offence characteristic information fiom RCMP
operational files, were also employed in the current study.
Not ail data sources used in this dissertation originated in the research done for the
Baffin Region Crime and Justice Study Other secondary data sources and a few key primary
data sources were obtained elsewhere. The majority of the measures of community
characteristics were gathered specifically for this study
Each of the different types of data sources used in this study are considered in hrther
detail below A consideration of the qualitative data gathered and used in this study is provided
to begin with. Then, the different quantitative indicators that were used in the study are
discussed For each of the different types of data an indication of the steps taken to gather the
information and an explanation of the usefihess of the information is provided
Qualitative Data Sources
Face -to-Face Interviews
The primary type of qualitative data utilized in this study was the responses fiom ., intemiews conducted with justice, health and social service personpel and community residents
by members of the Bafin Region Crime and Justice Study research team. These interviews
queried respondents about a wide range of issues relating to crime and victimization in the
communities, the delivery ofjustice sewices, and the development of community-based justice
senices and programs (Gnffiths, et a1 , 1995).
The creation of the schedules for the face-to-face interviews was a two step process
First of all. justice system officials representing the Bafin Region and the rest of the W T were
brought to Vancouver for a focus group meeting Those officials identified key issues relating to
crime and justice in the eastern arctic. Open-ended questions were then drafted to explore the
issues that had been identified. The actual drafting of the questions at the second step of the
inteniew schedule creation process was completed during a hrther series of meetings between
project team members Three Inuit researchers, who were hired for the express purpose of
conducting interviews with Baffin Region residents whose primary language was Inuktitzrt (the

Inuit language), also took part at this second step of the interview schedule creation. They
assisted in the phrasing of the questions to ensure the cultural relevancy of terms and concepts
(Gnffiths, et al., 1995). Ultimately, three different interview schedules were developed: one for
RCMP members currently serving in the Baffin Region, one for RCMP members previously
serving in the Baffin Region., and one for community residents and local justice and social
senice system personnel (see Appendix A).
A total of 367 individuals were interviewed by researchers fiom the Baffin Region Crime
and Justice Study Roughly two-fifths (.I 57 out of 367) of the interviews were conducted with
active and retired RCMP members who had, at some time during their career, been posted to
detachments in the Baffin Region One of the goals of the Baffin Region Crime and Justice
Study was to collect information relating to the historical and contemporary aspects of policing
in the region (Grifiths. et al . 1995) It was, therefore, necessary for interviews to be conducted
with a relatively high number of active and retired RCMP members. At least one RCMP
member from each decade (since the 1930s) fiom each Baffin Region community was included
in the sample of intemiews Intemiews with RCMP members that previously served in the
Baffin Re$ion were conducted across Canada, in: Nova Scotia; Ottawa (RCMP Headquarters),
the Okanagan \'alley of British Columbia (where a number of RCMP members have retired to).
and northern Alberta (Griffiths. et al , 1995)
The remaining three-fifths (2 10) of thesnterviews fiom the Baffin Region Crime and
Justice Study were conducted with persons other than the police. This sample included Inuit
and non-Inuit community residents, social workers, school teachers, judges and other lawyers.
and other criminal justice system personnel. With few exceptions, those interviews were
conducted in the Baffin Region communities l 4
Sampling for these face-to-face interviews began as a purposive sample followed by
"snowball" sampling (Griffiths, et a l , 1995) Research team members visiting Baffin Region :
communities made sure that in each of the communities the RCMP members, the social worker,
the hamlet's or municipality's Senior .4drninistrative Officer, and at least one of the nurses was
I A halfdozen or so i n t e n ~ e n r \nth nurses u h o had p r a ~ o u s l y worked in the B a n R e g o n were conducted in
the Vancouver. BC area

interviewed Individuals from initial group then identified other key informants in the
community Those key informants and knowledgeable community residents, in turn, often
identified other informants (Gnffiths, et a1 , 1995)
The Inuit research team members who assisted in desigrung the interview schedule, also
conducted intemiews in Inuktzrur (Griffiths, et a1 , 1995) Due to slight differences in Inuktr~ut i
dialect across the Baffin Region, each Inuit research team member conducted interviews in
communities where they were most comfortable with the local dialect These Inuit field
researchers relied upon friendshp and family networks to facilitate the "snowball" sampling
All respondents were interviewed following standard research protocols of voluntaq
participation and assurances of confidentiality 1 Only one potential interviewee rehsed to take
pan in the study Most intemiews lasted for one-and-a-half to two hours Many of the
respondents expressed appreciation for the "chance to tell their story" Interviews were tape
recorded, translated into English if necessary, and transcribed (Gnffiths, et a1 . 1995)
The information gathered in the field interviews served two important hnctions for ths
study I t helped to demonstrate the pervasiveness of violence and alcohol use in some Bafin
Region communities The perceptions of the respondents served to reinforce the quantitative
indicators of those factors and to put the problems of violent crime and alcohol abuse into
perspecti\.e Second. the inteniew data aided in the generation and clarification of measures and
hypotheses used in the analysis The task of linking theory to data was made much easier when
informed by the perceptions of those that experience the effects of violent crime on a day-to-day ,
basis
Field Notes
The second source of qualitative data used in this study is the field notes gathered during
research visits to Baffin Region communities Those unstructured records of the researcher's
field work assisted in reconstructing an accurate portrayal of how other forms of data were
gathered For instance, the field notes register the process followed and the problems
encountered in building a computer database to record the RCMP operational file data
'' See Appendi\ C for a cop! of leners indicating the unnersih ethlcs comrmtree's appro\al of the Baflin Region Cnme and Justice Stud! and the uru\ersi~'s support of that stu@
(discussed below) Likewise, the field notes documented the procedures by which respondents
were chosen for the face-to-face interviews. The most important purpose of the field notes,
however, is that they served as a chronicle of the researcher's observations and perceptions
about experiences and interactions with residents and justice and social system personnel in the
Baffin Region communities
Time in the field was not limited to conducting face-to-face interviews and collecting
police operational data. A single visit to a community ranged anywhere fiom 7 to 10 days, so
adequate time remained for less formal interactions with residents. In most of the communities,
for example, time was spent with RCMP officers on "ride alongs" observing how the officer and
community interacted. Those observations and perceptions were recorded in field notes, along
with many other observations and perceptions. There were many opportunities for observing
and arriving at a limited understanding of life in the BafKn Region. These included visits to
outpost camps, "chewing the fat" (quite literally with those that shared their muktuk) with
community residents visiting the hotel, eating supper with a RCMP detachment commander and
his wife and then watching a hockey game, attending community committee meetings, tahng
coffee breaks with RCMP members, and spending evenings at drinking establishments and
parties Generally speaking, all activities were incorporated in to the field notes
Quantitative Data Sources
Violent Crime Rate Data
To document crime in the communities of the Baffin Region, community-level crime data
produced by the Royal Canadian Mounted Police (RCMP) and by the Canadian Centre for
Justice Statistics (CCJS) were examined. Crime data for the Baffin Region communities were
available fiom CCJS for the years 1977 through 1991, RCMP data were available for the years
198 1 through 1993 CCJS figures were used to make comparisons between the Baffin Region
and other jurisdictions For intra-regional comparisons and analysis, depending upon the time
frame, both sources of data were used
There is no doubt that the use of official records of crime in this study will be questioned
by some It is for good reason that their use should be questioned Lowman and Palys (1991,

p. 366) identifj, three different categories of bias16 in official records of crime. First, there is
ideolol~~cal bias in which some activitievare classified as crimes while others are not. Secondly,
there is what they term rnstrumental bias which refers to techcal errors that result from the
ways information about crime is recorded and processed Finally, Lowman and Palys point out
that there is esserltral bras which "refers to the systematic effects of socially differentiated
structures of meaning on the signification of behavior as delinquent, criminal, or deviant (so that
some persons or groups are more likely than others to have their behavior considered criminal.
rlot because of differences in behavior, but because of their particular social status)" (1 99 1 ,
p 366)- This essential bias is said to be a result of the "institutional and organizational
imperatives of people who produce crime statistics" and from the discretion which "arises in the
context of police occupational culture and refers to the informal rules police use to apply the
criminal law" ( 199 1. p 366) The main question is. are the differences in crime rates between
jurisdictions (or over time) the result of the behavior of those we call 'criminals' or can the
differences be found in the activities of those who record the behavior as criminal3 Lowmml and
Palys ( 199 1 ) take the position that the above question cannot be answered prior to looking at a
jurisdiction's crime patterns but should instead be considered from an empirical point of view
Thev argue that
the extent to which any crime rate differential is produced by the one or the other (the beha~ior of 'criminals' or the activities of recorders) must ultimately remain an empirical question, it cannot be decided ahead of time theoretically. This still leaves the possibility that control factors are far more important that criminal behavior in producing crime rates in certain instances, vice versa in others (Lowman & Palys. 1991, p 365).
Whle it is impossible to rule out all sources of bias and to consider the police produced crime
statistics as wholly unbiased. there are some indications that the sources of bias pointed out by
Lowman and Palys ( 199 1 ) might not be as great a hindrance to the proper interpretation of
official crime data in the Baffin Region as they might be in other jurisdictions
First of all, it is clear that the crime rate data produced by the RCMP and the CCJS are
ideologically biased They do not consider the crimes of the elite of society The military and
I According to Lonman and Pal! s ( 199 1 ). these forms of "bm", should be \leued more broadlj than uould be connoted bj the term's normal stat~stlcal meaning

mining companies, for example, have been allowed to pollute the region 4 t h little or no censure
(Spence, 199 1 ) Their actions certainly have not been considered criminal but rather are seen by
some as 'the cost of doing business' (NWT Federation of Labour, 1991). This pollution and the
censure due it , however, are topics for another study The concern in this study was over the
violent behaviors considered illegal under the Camd~an Criminul Code.
The degree to which the crime rate data for the Baffin Region are subject to instrumental
bias is difficult to determine here, but it is fair to say that it probably does exist As in any other
police jurisdiction, the crime rate in the Baffin Region is a measure of offences that come to the
attention of the police These rates will be biased to the extent that the likelihood of an offence
being reported to the police in one community is larger than another community. Unfonunatelv,
there was no victimization survey component to the Baffin Region Crime and Justice Study, c.
making i t impossible to say with a high degree of certainty that residents of one community are
any more likely than the residents of another to report crimes. Gven the high levels of
dependency that Inuit have on government services (Irwin, 1988), inter-community variations in
reporting rates probably are not all that high The relatively small population sizes of the Bafin
Region communities also make it more likely that offences will eventually come to the attention
to the police so that any inter-community differences in reluctance to report an offence might be
irrele\.ant
The crime rate data of the Baffin Region are largely unaffected by the forms of essential
bias discussed by Lou.man and Palys ( I 99 1 ) . There are two main reasons for a l a d of essential
bias effects on inter-community crime rates in the Baffin Region. The first reason for a lack of
essential bias in the crime data of the Baffin Region is that the population is largely homogenous
For the most pan the population of the Baffin Region is .Inuit (as shown in Chapter 2) and of
middle or lower socio-economic status This makes it unlikely that one group is likely to receive
differential police compared with another group because there is only one group to be
policed The for a lack of essential bias is that the Baffin Region is a single police
jurisdiction, impossible, by definition, for crime rate variation to be the result of
variation in departmental goals, policies, and procedures Rather than seeing the Baffin Region
as being policed bv 12 different police departments, each with its own 'institutional and
organizational imperatives,' it is more appropriate to view the region as being policed by one

police department with 12 different "precincts " The ties that each detachment have with the
RCMP sub-division headquaners in Iqaluit are strong Records in each detachment are audited
at least once a year by a staff sergeant from sub-division headquarters in Iqaluit which insures
some degree of uniformity in recording practices Members posted to communities in the Baffin
Region are brought through the sub-division headquarters in lqaluit prior to their posting for an
orientation to the area Officers are rotated for short periods of time throughout the
sub-division as replacements for members who go out on holiday or other police business
Some RChP officers serve in more than one Baffin Regon community for extended periods of
time Individual detachments are in constant contact with each other and with the sub-division
headquaners assisting each other with cases For instance, an analysis of tasks performed by
Baffin Region RCMP detachments shows that nearly 13 percent of non-enforcement files and 5
percent of all files produced by those detachments in 1991 were for assistance to other Baffin
Reg~on RChIP detachments (Wood Bi Trostle, in press)
RCMP Operational Flle Records
Police file records are a second type of quantitative data that were used in ths study
Specifically. this study looked at data gleaned from the RCMP operational files in each of the
Baffin Region's detachments These operational files record each and every criminal and
non-criminal incident the RC.W respond to The breadth and depth of these files allowed for an
analysis of the patterns of violent crime in the Baffin Region that was more thorough than that
provided by the RCMP and CCJS violent crime rate measures
Operational file data were collected from each of the 13 RCMP detachments in the
Baffin Region for the year 199 1 Every operational file in all of the communities were recorded
into a database For criminal files, information about the offence, the suspect.offender, the
victim. and the way that the criminal justice system's handling of the case was recorded in the
database (see Appendix B for sample data entry screens) In all, information from 3,164
different RCMP operational files in the 12 communities were entered into the database The
major \value of the operational file data for this study is that when analyzed they allowed for the
identification of crime patterns in the Baffin Region beyond offence type and community In

Chapter 6, for instance, the proportion of violent offences in a community that were alcohol
related was calculated using these RCMP operational data i.
Community Charactenst~c Measures
The other major group of quantitative measures in this study are those used to examine
the relationstups between violent crime and alcohol consumption or between violent crime and
the impacts of colonization These measures came fiom a variety of sources, including Statistics
Canada, the GNWT Bureau of Statistics, and the GNWT Liquor Commission A general
description of the measures is provided below The specific operationalizations of the measures
are found in the chapters where they are used in analyses
One source of community characteristic indices was the census material produced and
published by Statistics Canada Population and socio-economic measures gathered in the I98 1 .
1986. and 199 1 quint-annual National Census (Statistics Canada, 1982, 1983, l987b, 1988,
1992, 1993 b) as well as measures gathered in the 199 1 Aborigmal Peoples Survey (Statistics
Canada, 1993a) were used to differentiate between communities on a number of factors in this
stud) The National Census, for example, provided community-level measures of employment.
income, and household occupancy The Aboriginal Peoples Survey provided some interesting
communit~~-level Indicators relating to health, use of harrnfbl substances such as alcohol and
drugs, and participation in native activities.
Another source of measures that served to characterize communities came fiom the
Go\,ernment of the W ' T (G!WrT) Those measures. which were used mainly to supplement
Xational Census measures, also provided indices with which to differentiate between
communities The GNWT. through its Bureau of Statistics, publishes inter-censusal
employment and income data not availabie fiom Statistics Caqada. For example, the GNN'T
Bureau of Statistics completes and publishes the results of a labor force survey (1984a; 1989)
, between the years the censuses are conducted The community-level measures of employment \
from that survey helped to f i l l the gap5 in census data, which allowed for a more in-depth
analysis of the relationship between employment and violent crime
In order to examine the association of alcohol use with violent crime in theYBaffin
Region. another set of variables was developed fiom information provided by the GNWT Liquor

Commission Community-level measures of alcohol consumption were created fiom individual
liquor sale mail order invoices made available to the author These invoices record the quantity
and brand of alcohol sold by the Liquor Commission to individuals living in non-dry
communities outside Iqaluit (a sample invoice is shown in Appendix D) Using the quantity and
brand of alGhol it was possible to construct a measure of absolute alcohol consumed on a per
capita basis'' for each of the communities in the Baffin Region where drinking alcohol is
allowed Xo other study has been able to compute a measure of per capita alcohol consumption
at the community level According to the literature examined for this study, measures of per
capita alcohol consumption have only been available at the provincial I territorial 1 state level
As will be shown later, where the specific stepstaken do compute the per capita consumption
measure described, the special geographic circumstances of the Baffin Region made it possible
to compute that measure at the community level + f
The final source of data used in this study was the situational and historical record of%w
communities There are many things in the histories and situations of the communities that
a provide theoretically compelling means of differentiation. For instance, variations in the liquor
laws of the communities. that is, whether or not alcohol is allowed in a community, were used to
differentiate betu,een communities to see which type of community had more violent crime
Other situational and historical factors that were used for differentiating between communities to
see how community types differed in terms of violent crime include whether a community was
settled by forcible relocation and whether a community had a population of transient non-Inuit
residents
DATA ANALYSIS FOR SMALL SAMPLE SIZES
.4 major limitation of this study was the small number of "cases" that were available for
analysis The small number of communities limited both the type of information that could be *a-
gathered and the way that the information was analyzed. Having 12 caseslwdas a problem
' To compute the standardmd measure of per-capita consumption of absolute alcohol (i e.. 100 % or 200 proof alcohol). the quantih. of be\.erage ordered was mult~plied by the volume of the beverage ordered mult~plied b\ the alcohol content in percentage. that figwe was then chided by the number of adults m the communlh to am\e at the per-caplta measure Measures of alcohol content by beverage were obtained from the product llstlngs of the Bnt~sh Columbia Liquor Distnbution Product Guide (M>fers, 1994).

because there were too many communities to employ ethnographic methods with the available
resources, but too few communities with the power to detect subtle effects. The end results of
that conundrum were that the qualitative data that were gathered and used could not be
considered to be as in-depth as those gathered in community ethnographies while the analysis of
the quantitative data required the use of rather basic statistical t e c h q u e s b
Although the qualitative methods of field interviews and participant observation were
used in the gathering of data for t h s study, the data gathered lack the depth one would generally
acquaint with such methods To acheve such depth would have required the completion of
community studies in all 12 of the communities Such an undertahng would have required
considerably more resources, a much broader time frame, and an ethnographic approach similar
to that employed by Condon (1987) in the central arctic Inuit community of Holman Island and
by Rasing ( 1994) in the Bafin' Region community of Igloolik. l 8 Both of those studies involved
in-depth documentation over a period of years with a great deal of time spent on the ground in
the community The qualitative data used in this study comes from the community research 4 visits done for the Hafin Region Crime and Justice Study Those visits generally lasted two
u.eeks or less As such, the qualitative information used in this study will mostly be limited to
perceptions gathered in face-to-face field intemiews rather than the perceptions of the researcher
gathered during field obsenation .- At the same time that having 12 communities to consider in the analysis limited the depth
of qua1itatk.e information gathered, the small number of units of analysis affected the types of
statistical techniques that could be used Multivariate statistical tests could not be used because
proper model specification would have required many more cases than variables. It was also
impractical to employ commonly used bivanate tests of statistical significance in analyses with
small numbers of cases because the assumptions of those tests are often violated with small
samples And in any event, they have little power to detect but the strongest effects There
were, howe~rer. alternatives to the avoidance of the use of statistical analysis in this dissertation
Solutions to the problem of having a small number of cases to analyze included 1 ) applying less
The depth of irdormatlon gamed ei en m those ethnograpluc s a d m can be questioned It is cbfficult to ascertain the extent to whch non-Inult field researchers From outside of the communih are successful m peelmg back what one mforrnant m termed the "layers of the onion" that surround Me in Inuit communities

commonly used tests of statistical significance that are not influenced by sample size and 2)
employing statistical techruques that increase the sample size. Solution number one involves the
use of nonparametric statistics (also referred to as rank-order statistics) with exact tests of
significance and solution number two involves pooling different years of cross-sections to
increase the number of cases available for analysis These broad classes of statistical analysis are
discussed below The specific statistical tests that are employed are introduced in the chapters in
which they are used
Nonparametric Statistics and Exact Tests for Bivariate Analysis
Nonparametric statistics should be used when the conditions of "classical" tests of
statistical significance (such as the t test or F test) ca'nnot be met (Seigel and Castella; 1988)
Before one can be confident with a probability statement obtained by the use of those "classical"
tests, one must insure that
the obsewations are drawn from normally distributed populations, the obsen,ations are independent. the trariables must have been measured at the interval scale (Seigel & Castella, 1988)
Although all of these stringent assumptions are rarely met in the social sciences (Leach, 1979, p
uiii). when dealing with small sample sizes the first assumption that the observations are drawn
from normally distributed populations is especially in jeopardy of being violated Nonparametric
statistics do not make such assumptions .4s pointed out by Conover and Iman (198 1 ) the key
difference bet~veen nonparametric statistics and parametric statistics is that the former allows for
measurement of the statistical significance of a relationship when the observations are not drawn / from a normall> d~stributed population These nonparametric statistics are also known as
"distribution Free" statistics (Stahl & Hennes, 1980) According to Dickinson Gibbons (1993, p
63) . the use of nonparametric meas4res of association and tests of significance is most
appropriate when the data are measfired on a nominal or an ordinal scale, when the shape of the I
distribution from which the sample is drawn is unknown. when there are outliers and/or extreme
values in the data, or. of most impodjince for this study. when dealing with small sample sizes /
As Seigel and Castella (1988, p zc-\..),'point out, a major "advantage of the nonparametric tests is /
their usefulness with small samples, a feature which should be helphl to the researcher collecting

pilot study data and to the researcher whose samples must be small because of their very
nature "
In most instances even nonparametric statistical tests require sample sizes larger than the
12 cases used in the bivariate analyses in this dissertation These nonparametric tests assume
that thenumber of cases in the analysis is "large enough for the test statistic to converge to an
appropriate limiting normal or ch-square distribution". (Mehta & Patel, 1996, 12) For example,
the 2 X 2, table chi-square test is said to be inappropriate if the grand total of the table is less
than 20 or if the total lies between 20 and 40 and the smallest expected (not observed) value is
less than 5 (Cochran, 1954) The general rule for larger tables is that the chi-square test is
inappropriate if anv cell has an expected value of less than 1 or if one-fifth of the cells have
expected values of less than 5 (Cochran, 1954, see also hlehta & Patel, 1996, Swinscow. 1978)
In other u.ords. the nonparametric statistical tests are appropriate when the sample is small,
sparse. unbalanced. or poorly distributed
When haking a small number of cases for analysis makes the use of nonparametric
statistical significance tests inappropriate, it is necessary to compute exact probabilities to test
the statistical significance of a relationship The exact probability is the probability of a single
outcome in a contingency table being present among all possible outcomes of that contingency
table u.hen the margins of the table are held constant In other words, the exact probability of an
outcome is computed by examining the observed table in relation to all other tables in a
reference set of tables ivhose margins are the same as those of the actually observed table
(Xlehta & Patel. 1996. Swinscow. 1978) Calculations of exact probabi always produce
reliable results regardless of the size, distribution. sparseness. or
they consider only the true distribution of the data (Mehta a at el. 1996)
Pooled TimeSeries Analysis of Multivariate Data
The use of nonparametric statistics and exact probability tests to determine the statistical
sisnificance of substantiire findings from a data set with relatively few members is limited to a set
of sequential bkariate a n a l ~ ~ e s '4ccording to Leach ( 1979), the major disadvantage of
nonparametric techniques is that they are not useful when mdre than two variables are being

9 analyzed at one time As such, the small sample size must be addressed in some other way to
. , produce any qon of multivariate statistical analysis
Pooledetime-series analysis is a-form of analysis for data that are a combination of time '0,
series a id cross-sections~(Schroeder, ~ j d ~ u i s t , & stiphan. 1986. 55) ' This method of D
6
bringing together different cross-sections fiom diffeient time periods is said to be "particularly
useful in applied research when the length of the tjme series is abbreviated andlorthe sample ilf
rross-.wrnom 1.5 rnodesr ot .s~:r." (Sayrs. 1989, p 7, emphasis added) In this dissertation. for
instance, any one cross-section of communities equals i 2 T h s small "n" is hardly large enough
to obtain meaninghl results from multivariate statistical a analyses However, an "n" large
enough to get meaninghl results can be obtainedb? taking into account a number of years
worth of data on those 12 communities For some meakures, especially those gatheredby the
twice-a-decade national census. it is possible to generate a large enbugh number of Cases to , ,
. carry out a form of basic multiplaregres-&!on wbz analysis ,
l I
SUMMARY
Given the research design employed, along with the small number of communities "
a\,ailable for analysis, the conclusions made in this study are based on associationibetween
measures I t is therefore, impossible to effectively rule out rival plausible explanations The > > i*
Len. nature of the type of research. the rxposr facto analysis of violent crime in different
jurisdictions, means that experimental designs which control for potential-ri\ral causal factors L
through the random assignment of cases to "treatments" are unavailable Having only 12 cases
sen,ed to rule out the use of multi~~ariate data analysis techniques to eliminate rival plausible
explanations using statistical controls In short, with the data and design used, this research must
be seen as euploraton rather than confirmatory But, while there certainly .limitations ?c, what
can be said in using a correlational strategy, it was still possible to conduct an informed
examination of the community characteristics that are associated with violent crime in the Baffin
Region The challenge in t h s study was not in employing sophisticated multivariate models, but
rather in coaxing substantive meaning out of the limited data sources that were available By
doing so, this study has contributed to knowledge about crime in native communities

CHAPTER 5: COLONEATION AND VIOLENT CRIME
I t is taken as a gven that the.expansion of &ite society in Nonh America has come at
the expense of the Native people that lived here k s t . There is general agreement that the
introduction of Euro-Canadian culture resulted in overwhelming change in Inuit culture ,
(Adamyk, 1987, Anderson, 197 1 , Brody, 1977, Hodglunson, 1972; Honigmann & H o n i g m a ~ ,
1965, Sammons, 1985, van Dyke. 1982, Wenzel, 1985, Whyte, 1976, Zaslow, 1984) Kellough
( 1980). Paine ( 1977), Rea ( 1968) and Tobias ( 1976) have argued that the relationship between
the federal government and the Inuit can best be understood fiom a colonial perspective These
obseners contend that the colonization of the Canadian arctic has been an intentional, long-term
process which has in\~olved replacing the traditional, self-reliant lifestyle of the Inuit with a
dependent and subordinate status
Crowe ( 1973). Ttlinor ( 1979), Swiderslu ( 1985) and Zaslow ( 197 1 ), among others, have
documented the role played by the missionaries, h r traders, whalers, and government officials as
agents of change in the colonization process (see also Coates, 1985, Coates & Powell, 1989,
Coates & Xlorrison. 1988) Through this process, Inuit culture was displaced and the Inuit were
swept into dependency and resignation (Irwin, 1988). Zaslow ( 1 984) and van Dyke ( 1982) note
that the introduction of Euro-Canadian culture resulted in rapid and overwhelming change in the
cultures of Inuit This. in turn. created widespread cultural shock and disruption at both t h e
community and indi\.idual le\.els (see also Pretes. 1988) Wi this chapter the possible impacts of
colonization upon Baffin Region communities are considered in an attempt to understand why
some communities ha\.e more ~iolent crime than others
The task of considering the potential impact of colonization upon v~olent crime in Baffin
Region communities in thls study was made sdmewhat difficult due to a lack of linkages
between those two constructs in the research literature Many studies have failed to provide an
exact specification of the reasons why colonization is said to lead to high levels of violence Of fi
the research that has attributed the high rat= of violent crime among aboriginal peoples to the
process of colonization. little of it has examined t e relationsfup fiom an empirical standpoint v Instead. a logical u connection is made between ( 1 ) the aboriginal peoples' having been through
the process of colonization resulting in their current domestic dependent relationship with
non-native go\.ernments and (2) the high rates of violent crime present in aboripnal populations,

to make the conclusion that the high rates of violent crime among aboriginal peoples is the result
of colonization The actual process by which colonization is translated into high rates of violent
crime has generally been the subject of speculation in those non-empirical studies In the few
studies that have taken an empirical approach to consider the effects of the process of
colonization upon violent crime, only one type of linkage between the tivo wnstructs has been
used Those studies have almost exclusively considered indicators of the socio-economic
underdevelopment said to have resulted from the colonization process to connect it to violent
crime among aboriginal populations.
By focusing only upon the socio-economic outcomes of the colonization process. those
prior empirical studies have not considered aspects of that process which could possibl!, be used
to hrther understand the dfferences in violent crime patterns found in natibe communities As
suggested by the research literature that has focused specifically upon the coloni~ation process . (without even considering violent crime). a pair of aspects of the colonization process that have
been played out in the Baffin Region and that might have had a differential impact upon violent
crime are looked at in this chapter In total, three hypotheses concerning the colonization
process as i t might have impacted Baffin Region community crime rates ucrc assessed in this - ,
chapter Each of the hypotheses were derived from some aspect of coloni~ation that took place
during. or is an outcome of, that process as it involved the communities of the Raffin Region
As with the prior empirical studies referred to above, this study also considered the
possible impact of socio-economic underdevelopment as one of the results of the coloni~ation
process upon violent crime Components of socio-economic underdevelopiicnt such as low
levels of emplovment, education, income, along with poor housing conditions, all said to be a
result of the colonization process (Hagan & Schaw, 1960, Pretes, 1988). could account for why
some Baffin Region communities have more violent crime than others As such, the first
hypothesis considered in ths chapter examined measures of socio-econonic underdevelopment
in an attempt to understand the degree t~ which variation in violent crime across communities Br
may be associated with variation in socio-economic measures
Another aspect of the colonization process which has been linked to many problems in
native communities and which might possibly account for differences said to Icad to social
problems such as violent crime is the forced se~lement and relocation of conlmunities

(Brokensha & Scudder, 1968; Scudder, 1982; Scudder & Colson, 1982). The second hypothesis
looked to the way that Baffin Region communities were settled, to understand the extent to
which violent crime in today's Baffin Region communities may be determined by the way in
which thev were settled and populated
An additional way that the colonization process is said to impact upon native
communities is that it brings them into the larger political economy, malung them vulnerable to
the effects of outside economic and political forces (Jorgensen. 197 1 ; Owens, 1976). The final
hypothesis in this chapter examines the possible impact of the European seal skin ban on
community-level violent crime
For each of these hypotheses, the theoretical connection between the hypothesis and
colonization will first be drawn Then, the concepts that are components of each hypothesis will
be operationalized in order to establish a connection between theory and data The results of the
appropriate statistical analvses will then be reported and interpreted. Following will be a
discussion of how the findings aid us in looking at the colonization process to gain an
understanding of the community characteristics that are associated with violent crime
SOCIO-ECONOMIC UNDERDEVELOPMENT
As a process. colonization is generally identified by its outcomes. One of the main
outcomes considered bv those studving the neo-colonial relationship between native people and
the larser non-native societv is the native peoples' low socio-economic status mkasured in terms
indicators such as income. levels of employment, or conditions and availability of housing.
The idea of characterizing the relationship between native people and the larger non-
native society as "neo-colonial" arose to explain the persistance of poverty and economic
underdevelopment among native people (Jorgensen, 197 1 ; Owens, 1976). Many observers
( Aberle, 1983. Anders. 1980. Dunbar-Ortiz, 1979, Harding, 1978, 1988, Jorgensen, 197 1 , 1972.
1978. LaDuke & Churchill, 1985, Owens, 1976, Pretes, 1988, Snipp, l986a, 1986b; Turner-
Rufing, 1979) have demonstrated how the growth of the non-native economy has been at the
expense of the native economy This growth is, in turn, said to result in native people having the
lowest le\.els of income. health, housing, employment, and educational attainment on a national
level According to Bachman ( 1 992. p 38), colonization "is perhaps the earliest antecedent to

some of the present deleterious conditions under which many American Indians live. . . . This
colonization process has undoubtedly contributed to economic deprivation and social
disorganization wittun American Indian populations."
The Inuit communities of the Baffin Region are clearly behind the rest of thenation on a
number of indicators of socio-economic well-being, Table 7 compares Bafin Region
communities with national totals on a number of socio-economic indicators, including measures
of employment, education, housing conditions, and income. The percentage of people age 15 /
and over that are employed in Baffin Regon communities is was considerably less than that
found nationally, only three of the communities had more people employed than what is found
on average in Canada There were three times as many people over the age of 15 with a less
than grade 9 education and twice as many people per room in Baffin ~ e ~ i o n communities than
what is found nationally A direct comparison of Bafin Region cornmurdy incomei with the
national average shows that the majority (9 out of 12) of communities were lower than the
national average However, when the cost of living differential is figured into the comparison, all
Baffin Region communities had incomes less than the national average Taken as a whole, it is
clear that the Ba6n Region communities have lagged far behind the rest of the nation in terms
of socio-economic conditions i
Variables and Hypotheses
The apparent relationship identified in the literature (Bachrnan, 1992; Kellough, 1980,
Thatcher. 1986, Zion & Zion 1996) between the socio-economic outcomes of colonization and
violent crime at the native 1 non-native level suggests several hypotheses that can be examined in
an inter-community level analysis. From that relationship one would expect to find an inverse
association between measures of violent crime and measures of income, education, employment,
and quality of housing conditions Communities where people are working, have good
educations and incomes. and are living in adequate housing should have less violent crime than
those communities where people are not working, have poor educations and low incomes and
are living in inadequate housing

Table 7: Employment, Education, Housing Conditions, and Income, Baffin Region Communities and Canada, 1991.
Percent Less Average Number Average Cost of Living Percent Than Grade 9 of People per Income in S Dlfferentiale*
Commun~h Employed* (a) Education* (a) Room (a) (b) t c)
Broughton Island
Cape Dorset
Cl?de F h er
Gnse F~ord
Hall Beach
lgloollk
Lake Harbour
Nan~sn ~k
Pangn~nung
Pond Inlet
Resolure Ba!
CANADA - *Includes populat~on age 15 and up **Montreal = 100
(a) Statlst~cs Canada. 1993b (b) GNN'T Bureau of Statlst~cs. 1Y96a Z
(c) GNUT Bureau of Statlstlcs. 199bb
There are many uavs of measuring the amount of employment, or the lack thereof, in a
population (Jacob. 198.1, National Commission on Employment and Unemployment, 1979) The
unemployment rate, the most common measure of employment levels, is a measure of those that
are actively seeking a job at the time ofmeasurement as a percentage of the total number of
people working plus the number of people actively seelung a job By only measuring the non-
employed status of those actively seelung employment, the unemployment rate excludes fiom
measurement those individuals that could be worlung but who #@we given up looking for a job
(Groth, 1982. Shskin. 1976) The unemployment rate, as an indicator of the extent to which
those that are able to work are working or are seeking work, is especially problematic irr
jurisdictions such as the Baffin Region where many individuals would not be likely to be seeking '

employment because the chances of ever being employed are very low. To measure levels of
employment in places such as the Baffin Region where the opportunity of employment is not
widespread, it is necessary to look beyond those that have employment or are seeking
employment at the time of measurement because the actual possible available labor pool is much
bigger
About the only way to capture the actual available labor pool (i.e , discouraged and non-
discouraged possible workers and workers) in the B a n Region is to account for all the
individuals that possibly could be workers The percentage of individuals age 15 and older that
are employed in a community will be therefore used Data his measure comes From the
national census (Statistics Canada, 1983, 1988, 1993b) an kl 1s available for all 12 Baffin Region
communities for the years 198 1 , 1986, and 199 1 An inverse relationship between the
percentage of individuals that are employed and the violent crime rate would be expected
As with employment, there are many ways to measure educational attainment at the
community level A number of census measures are a lable including the proportion of a
jurisdiction that has graduated from high school, uni ity, and trade school In the Baffin
Region, however, very few indi\.iduals graduate fro h school, much less, university
(Statistics Canada. 1993b) As such, the best measure of educational attainment to compare
Bafin Region communities is the percentage of individuals age 15 and older that have a less
than grade 9 education The national census (Statistics Canada, 1983, 1988, 1993b) is the
source for this measure. covering all 12 Baffin Region communities for the years 198 1, 1986,
and 199 1 A direct relationship between the percentage of individuals with less than grade 9
education and the violent crime rate was expected
.4 few measures from the national census provide indicators of housing conditions in a 10
jurisdiction Counts of the number of dwellings by dates of construction, the number of
dwellings with central heating. and the average rent or mortgage payment all provide some
insight into the housing situation However. the housing conditions in the Baffin Region are
generally satisfactory on these measures, most dwellings have been built in the last 20 years,
nearly all have central heating, and the rent and mortgage payments are very low compared to
national figures (Statistics Canada, 1993b) Although the houses in the Baffin Region may be
relatively neb. heated. and inexpensive to live in, they are also very crowded The one measure

fiat does indicate poor housing conditions in the Baffin Regon communities, the average
(mean) number of persons per room, provides an indication of how crowded the houses are
Once again, the national census (Statistics Canada, 1983, 1988, 1993b) is a source for this
measure of housing density covering ail 12 communities for the years 198 1, 1986, and 199 1 . It
was expected that the more crowded the housing condiths, the more violent crime there
should be
The national census also provides many measures of income in a community. However,
it is not possible to use the census measures because the census does not report incomes for
jurisdictions with kfery small populations (e g Grise Fiord and Resolute Bay) due to Prrvacy Act
restrictions (Statistics Canada, 1993b). It is possible to use a measure of income fiom another
source to avoid excluding the smallest communities from the analysis. The GNWT Bureau of
Statistics ( 1984b. 199 1 , 1996a) reports average (mean) incomes according to Revenue Canada
local it^. Code Statistics for all communities in the NWT including the 12 communities of the *
Baffin Region of interest to this dissertation As with the other measures of the outcomes of
colonization, the average community income measure is available for the years 198 1 , 1986, and
199 1 An inverse relationship between average income in a community and violent crime rate in
a cornmunit,, was expected
\'iolent crime is measured in this analysis with two different indicators The first measure'
of violLnt crime is the yearly violent crime rate per 1,000 population according to RCMP figures
("G" Division RChIP, 1982. 1987, 1992) The second measure of violent crime is the three year
mean crime rate per 1.000 population according to CCJS figures (CCJS, 1981-83. 1986-88,
1991 -93) Each of these violent crime rate measures has its advantages and disadvantages On
cne hand. RCMP figures are preferable because they aLe recorded closer to the source and
because they contain all violent offences including those that would be excluded by the CCJS
herarchy rule (which counts only the most serious offence in a multiple offence occurrence) On
the other hand, the use of CCJS figures is preferable because they were published for the year
1980 (wlule the RChIP figures were not) which allows for the calculation of an average violent L

crime rate that helps to adjust for the effects of "one man cnme waves"19 upon the relative
amount of violent crime in a community The mean of three years worth of CCJS violent crime
data (which includes the year of, the year before, and the year after the measurement of the
independent variables) is used in the present analysis\
Analysis and Results
In order to assess the relative effects of the different outcomes of the colonization
process upon violent crime at the community level, a pooled time-series regression model was
employed As pointed out in Chapter 4 of this study, a pooled time-series regression model
allows for the testing of the effects of multiple independent variables upon a single dependent
variable when the number of cases is small and when there are several years worth of data
available for analysis Three years of data ( 198 1, 1 986, and 199 1 )'were used for the 12
communities. resulting in 34 different data pointsf0 available for the regression analysis The
descriptive statistics for the variables used in the analysis are shown in Table 8.
Although there are benefits to combining three years worth of data to generate an
adequatemmber of units of analysis for the regression analysis, the use of pooled time-series C
regression brings with ~t all of the problems of cross-sectional analyses combined with the
problems of time-series analysis The assumptions behind the interpretation of regression
coefficients and, especially, tests of significance, must each be considered when employing
pooled time-series regression (Savrs, 1989, Schroeder, Sjoquist, & Stephan, 1986) Inspections
of the regression residuals of the results of the present analysis, however, showed the results to
be plagued neither by autocorrelation (the regression assumption violation generally confined to
time-series analyses that occurs when error terms for different observations are correlated) nor
l 9 Indn~dual offenders that commlt multiple offences have more of an impact on the rates of cnme in communiues uith small populations rather than in communities uith large populations. If =era1 \iolent offences are cornrnlned in a single year by a lone indnidual in a communih uith a v e n small population. it wi l l seem as though the comrnunin is cnme-ridden when. in fact. only a single indnidual is responsible (Marerun. 1992) 20 In h s anal!.sis n=?4. not n=36 The '.cases" of Broughton Island in 198 1 and Hall Beach in 198 1 are excluded from the anal! SIS because they uere policed from RCMP detachments in Clyde h v e r and Igloollk. respectively. at that tlme The "case" of Clyde h v e r in 1981 combmes independent variables from Broughton Island and Clyde Rner and the "case" of Igloollk in 1981 combines independent variables from Hall Beach and lgloollk
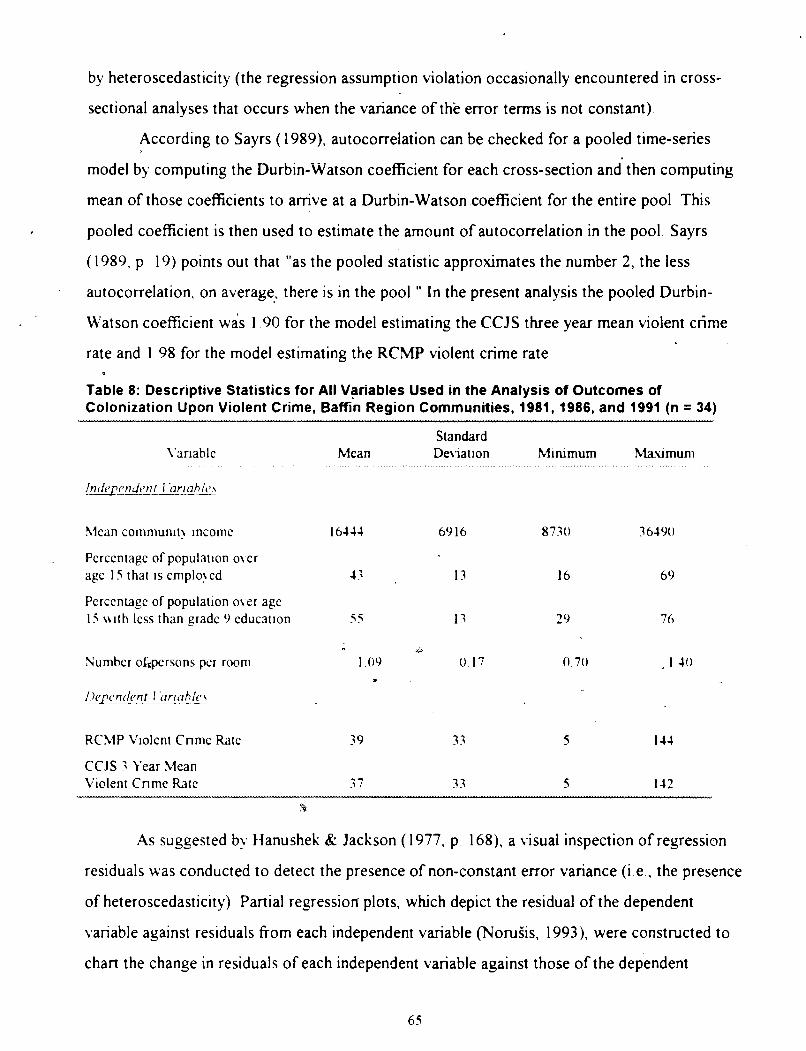
by heteroscedasticity (the regression assumption violation occasionally encountered in cross-
sectional analyses that occurs when the variance of the error terms is not constant)
According to Sayrs (1989), autocorrelation can be checked for a pooled time-series
model by computing the Durbin--Watson coefficient for each cross-section and then computing
mean of those coefficients to amve at a Durbin-Watson coefficient for the entire pool This
pooled coefficient is then used to estimate the amount of autocorrelation in the pool Sayrs
( 1 989, p 19) points out that "as the pooled statistic approximates the number 2, the less
autocorrelation, on average, there is in the pool." In the present analysis the pooled Durbin-
Watson coefficient was 1 90 for the model estimating the CCJS three year mean violent crime
rate and 1 98 for the model estimating the RCMP violent crime rate
Table 8: Descriptive Statistics for All Variables Used in the Analysis of Outcomes of Colonization Upon Violent Crime, ~ a f f f n Region Communities, 1981, 1986, and 1991 (n = 34)
Mean .. .. ..
Standard Dex~a t~on
, Percentage of populat~on o\ er age 15 that 1s emplo! ed
Percentage of populat~on o\ er age l i ~ l t h less than gradc 9 educat~on 5 5
Number ofrpersons pcr room
Ikpenr ivnr I arrohlc>\
R C h P V~olent Cnrne Rate 3 9 3 3 5 144
CCJS 7 Year Mean V~olent Cnme Rate 3 7 3 3 5
9
As suggested by Hanushek & Jackson ( 1977, p 168), a visual inspection of regression
residuals was conducted to detect the presence of non-constant error variance (i e , the presence
of heteroscedasticity) Partial regression plots, which depict the residual of the dependent
variable against residuals from each independent variable (NoruSis, 1993), were constructed to
chart the change in residuals of each independent variable against those of the dependent

variable Although these plots unveiled a few outliers, the visual inspection of these partial
regression plots show a general scattering of residual points in a band of relatively equal width
fiom the regression line This "general scattering" is indicative of a relationship absent of
constancy between error terms (Lewis-Beck, 1980) and therefore, the results are not plagued by
heteroscedasticity
After considering the assumptions involving residuals, a correlation matrix was
constructed to examine the zero-order relationships between the variables and to search for
possible multicollinearity between the independent variables in the analysis As is shown in Table
9 all of the correlations between the independent variables except for one were in excess of the
r = 60 level and two of the relationships were at the r = 70 level These relatively strong zero-
order relationships make sense from a theoretical standpoint One would expect high average
incomes in communities where a large proportion of residents are educated and employed along
uith low average incomes where people are not educated or employed And whle the
"clustering" of these variables adds support to their ability to indicate differences between
communities on the overall socio-economic impact of the colonization process. the high
correlations appear to indicate the presence of multicolinearity in the regression model
Illulticolinearit~. a problem in regression analysis that occurs when independent variables are
intercorrelated (Bern. & Feldman. 1985). is mainly a problem when trying to discern the effects
of individual independent variables upon the dependent variable. As Hanushek and Jackson point
out, "the more two variables covary or move together in a sample, the harder it is to ascertain
the independent-effect of one of them. holding the other constant" (1977, p 87). ow ever. multicolinearit~ is not as large a concern in the curreht analysis as it might be in other models
because the concern here is with the overall effect of the outcomes of colonization upon violent
;rime rather than the relatire effects of each individual independent variable Understanding the
total effect of all variables upon violent crime is considered to be more important in this analysis
than understanding the relative indi\idual effect if any one independent variable
An examination of the correlation coefficients revealed some interesting associations
between the two measures of violent crime and the independent variables The most interesting
outcome was that all of the correlations were opposite the direction anticipated from the
colonization perspective For example, there is a direct relationship between the average

community income and both measures of violent crime. There is also a direct relationship
between the proportion of adults employed and the measures of violent crime These findings
suggest that high violent crime rates in Baffin Region communities were associated with high,
not low, average incomes and high, not low, levels of employment The other associations
between the measures of violent crime and variables representing the outcomes of colonization
are also in the direction opposite that expected by the colonization perspective The education
measure (jhe proportion of adults with less than grade 9 education) and the housing density
measure (the mean number of people per room) were both inversely related to the two measures
of violent crime. These results of the correlational seem to indicate that high levels of violent
crime were associated with lower levels of housing density and with higher levels of educational
attainment
Table 9: Zero-Order Correlation Coefficients for All Variables Used in t h e Analysis of O u t c o m e s of Colonization Upon Violent Crime, Baffin Region Communit ies, 1981, 1986, a n d 1991 ( n = 34) ---
Percentage of Percentage of Mean populat~on o\ er population o\ er age
communlt! age 15 thar 1s 15 wth less than Number of lncome emplo! ed grade 9 educat~on persons per room
%lean communlh lncome I oo
Percentage of populatlon o \w age I5 that 1s crnplo! cd 64 * 1 00
Percentage of populat~nn o\ cr age I 5 u ~ t h less than grade 9 cducarlon - 671 - 70* 1 00
Number of persons per room - v* - 70* 65* I 00
RCW \ ' ~ o l ~ n t Cnme Rate JC
CCJS 7 ).ear Mean V~olent Cnme Rate 47* 77* - 49* - 55*
*Indlcares statlst~cal slgn~ficance at the 0s h e 1 or less
In order to estimate the overall effect of the model consisting of measures of
underdevelopment upon kiolent crime. ordinary least squares regression was applied Each of
the four independent variables described above, as measures of the socio-economic
underdevelopment said to result from colonization, were regressed on both of the violent crime

rate measures for each community The results of these regressions are shown in Table 10 For
the RCMP violent crime rate, only about 30 percent of variation is explained by the model
combining 4 variables, none of which contribute significantly to the explained variation For the
CCJS three year mean violent crime rate, the 4 combined variables explained about 35 percent
of the variation
Table 10: Least Squares Regression Estimates of Effects of All Variables Used in the Analysis of Outcbmes of Colonization Upon Violent Crime, Baffin Region Communities, 1981, 1986, and 1991 (n = 34)
Independent Vanable
Dependent Vanable ,
RCMP V~olent CCJS 3 Year Mean Cnrne Rate Violent Cnrne Rate
Percentage of population o\ er age 1 5 that is cnrplo! ed - 27
Percentage of populanon o\er age 15 w ~ t h less than grade 0 education - 2 3
Number of persons pcr room - 11 - 16*
R 30* Z 5 * ----.-
*Indicates statlsriivl significance at the 05 le\el or less
I t m,ould be foolish to strongly interpret the relative effects of the model's individual
independent \.ariables upon the violent crime measures because the results of these regression
analyses were affected by multicolinearity Due to the strong zero-order correlations between
those independent variables shown in Table 9, it would not be possible to separate the effects . ,
upon the dependent variable of one independent variable that is highly correlated with another
independent \.ariable in the model d
The combined effects of all independent variables used in the regreqsion models to
estimate yiolent crime rates indicate that violent crime was moderately associated with those
combined measures of socio-economic underdevelopment However, while it is very difficult to
specie the nature of that association, because the presence of multicolinearity made it difficult
to consider the direction of the individual independent variables used in the model, it appears

that the communities that were the most socio-economically underdeveloped had the lowest
rates of violent crime (cont rw to the colonization perspective). As it stands, neither regression
model adds support for the hypothesis that there is a direct relationship between measures of
socio-economic underdevelopment and the amount of violent crime in Baffin Region
communities
COMMUNITY RELQCATION
Socio-economic.underdevelopment is but one outcome of the
could possibly be used to understand why some Baffin Region
crime than others There are other effects of the colonization 0 -
impacts upon Baffin Region communities that could~account for the differences in le-f
violence One such impact of the colonization process is the effect of a community being
populated \,ia the relocation of residents from one part- of the arctic lo another In this section
the amount of~,ro!ent crime in a community is considered in light of the method in which it was
settled and populated This section first looks at the different ways in which Baffin Region
communities were settled Some reasons why different m&hods of community settlement might ,-
result in different le~tels of <.ibleflcrime are then considered Ily, a comparison of
community violent crime rates i n relation to their settlement method is made and interpreted to * ?.
try to come to an understanding of the differential impact of the col.onization pro.cess upon
~iolent crime in Baffin Region communities
The histoh 6f how the communities in the Baffin Region came to be settled is an6
interesting one Before the 1950s. most Inuit lived out on the land or in small camps along the
coast Although the RChfP, religious nussionaries, and Hudson's-Bay Company outposts all
entered the region in the early 1900s (Kemp, 1984, p 474), it was not until the 1950s when the
Inuit settled into communities During the 1950s a decline in the trapping economy, outbreaks of '
infectious disease among the Inuit and among their sled-dogs, and a growth in wage labour
opportunities brought most of the Inuit off the land and into permaneht settlements (Yatsushiro, -
1963) The rest a f the Inuit were brought to the communities in the 1960s when permanent
medical. educational, and governmental facilities were built (Kemp. 1984)

AJthotigh Baffin Region communities became populated by Inuit residents only withln
the past half century or less, the method in which they were populated (or settled) varies f
g, according to the community Even with this variation, three general patterns (or mghods) of
settlement can be identified' contpuous inhabitation, internal migration, and relocation
The majority of communities in the Baffin Regon were settled in and around places that
the Inuit had continuously inhabited for centuries prior to contact with Euro-Canadians In pre-
settlement times the nomadic Inuit followed a cycle of subsistence, moving fiom place to place
with the f lo i of game and fish Some places became seasonal places of encampment each year; 0
due to their location near subsistence sources It is in this sense that an area is considered to be 9
continuously inhabited Communities settled bv the "continuous inhabitation method" are those
that were settled in these yearly and traditional places of encampment. As is shown in Table 1 1 ,
7 out of I? of the Bafin Resion communities are considered to have been settled via the
continubus inhabitation method
About a quarter of the communities in the Baffin Region were settled through the
internal migration of Inuit from other parts of the region These communities were generally
established by the government near the weather stations and military installations that were
operated beginning in U'orld M'ar Two They are not. however, located in a place traditicqg)!~. ,--
8 relied upon by7he lnyit in pre-settlement times for subsistenie The Inuit moved into these* .
communities in a more or less voluntary migration fibm other areas during the late 1950s and *>
early 1960s when the communities established near areas of continuous inhabitation were also
populated
The most noteworthy of settlement methods is the government's relocation of 17 Inuit
. 'families comprising 87 persons (Soberman, 199 1 ), fiom areas around Inukjuak, Quebec to
create the high arctic communities of Grise Fiord and Resolute Bay i n 1953 Some argue that
these families were relocated because the Canadian government wanted to establish sovereignty - e Sr
% % .
over the high arctic due to American and Greenlandic intrusions (Marcus, 1990. 1991. ester 8:
.Kulchyski, 1994) Others argue that the families were relocated because of3windling \
subsistence opportunities in and around Inukjuak (Bell. 1993, Kenney. 1994). Wule a 4 , compelling argument can be made for each view (e g , Soberman. 1'991). the fact remains that

the families were removed from their homeland and placed in ah environment that was vastly
different than that from which they originated
Table 11: Methods of Community Settlement, Baffin Region, NWT Communities
Settlement Type and ~ o m m u ~ h Event
Continuous Inhabifation Cape Dorm Hudson's Bay Pon Opens
Cathol~c Mssion Opens Federal Nursing Stat~on Opens
Hall Beach Dew Line Station Opens Last F m l Leaves Land l ( i ,
"Alwa~s a large populauon in the area "
lgloohk Hudson's Ba! Posr Opens "Un~que record of unbroken Inwt hab~tation."
Lake Harbour Anglican Mssion RCMP Outpost Opens Canlne Distemper Outbreak. 80 percent of Dogs Die "Area lnhabtted for centuries "
Pangninung U'haltng Posts Lale 1800s RChiP Outpost Opened 1923 Canine Dlsremper Outbreak 1960 "Loss of dogs made peopl[move Into settlemen1 permanentl\ "
RCMP Outpost Opens 4 .Anglican h4m1on Opens Schools Open Last Famil! Leaves Land ".4ncestral homeland of Nonh B f i n Inlut "
Pond lnlet
Saniklluaq "Preth Much Always lnhablted "
Internal Migrotion rought ton Island Deu L~ne Construction Begins
Federal Offices Open +
Hudson's Ba\ Pon Opens "No settlement In current location until 1956 "
Cl\de Rner Hudson's B a Post Opens Weather Statlon Operated "Uninhabited before 1922 "
Nantsnlk 1 Weather Station Operated Arctic Ba! Zlnc Mlne at Xarusnlk Opens
Relocation :
Gnse Fiord Famllies Moved from Pond lnlet & Inukjuak. Que
Resolute Ba! Weather Station Opens 1947 Farmlies Moved from Pond Inlet & I n u k c 1953
Source Den\ ed from C O ~ ~ ~ h profiles compiled b! Outcrop Ptrblishng, 1990,
A common thread found in the operation of the colonization process across the world is
the relocation of indigenous inhabitants (Scudder & Colson, 1982) From the movement of
people in the path of man-made lakes in f i c a (Brokensha & Scudder, 1968) to the movement
of the Cherokee (among others) fiom the path of "progress" in the southeas: US (Deloria &
Lytle. 1983), the growth of a colonial power has often resulted in indigenous peoples' relocation
Apart fiom the general sense of loss of a home caused by being moved, relocation
undermines a peoples' faith in themselves, increases their dependency on government, disrupts
the f a d y and undermines the authority of parents, and weakens the influence and authority of
local leaders According to Scudder ( 1982, p 10).
The results of over twenty-five studies around the world indicate without exception that the compulsory relocation of low-income rural populations with strong ties to their land and homes is a traumatic experience. For the majority of
r those who have been moved, the profound shock of compulsory relocation is much like the bereavement caused by the death of a parent, spouse, or child. This multidimensional stress has been shown to have a number of negative effects
There is e~vidence, albeit mostly anecdotal, that increases in violence are one of these negative
effects following the relocation of a community There are many examples of relocation leading
to increased incidence of Lriolence In 1957 the Churchill Band of Chipewyan was moved many
miles From Duck Lake, Manitoba to Camp 10, just outside of Churchll, Manitoba, because of
the closure of the Hudson's Bay Company post at Duck Lake (Lal, 1969a, p 6) Once at the
new settlement. life quickly deteriorated as violence and alcohol abuse became widespread Lal
( 1969b) blames~his deterioration partly on the stress of being relocated and partly on the people
not being able to adjust to their new surroundings. Increases in violent behavior are also said to
have accompanied the relocation of the northern Manitoba Cree community of "Chemawawin"
(Waldram, l98O), of the Grassy Narrows Ojibwa (Shkdnyk, 1985). of the Fort Hope Ojibwa
(Driben & Trudeau, 1983). and of the northern Manitoba Cree community of "Rat Lake"
(Waldram. 1987) %
e-
Variables and Hypotheses +
A problem with prior studies considering the impact of relocation upon social problems
such as violent crime is that they only look at the communities that have been relocated They
don't consider what has happened in similar communities that have not been relocated For

instance, Waldram ( 1987) provides no indication of how the amount of violence in "Rat Lake"
compares with other Manitoba Cree communities. By not comparing the relocated communities
with those not relocated, it is difficultto attribute the changes in violence to the relocatzn This P
section of the dissertation attempts to correct that previous inattention by comparing violent
crime rates in communities settled by relocation with violent crime rates in communities settled
by other methods.
Given that settlement via relocation is thought to have had such profound impact upon
violence in communities outside the Baffin Region, it was expected that the communities in the *
Baffin Region that were settled by relocation would have greater levels of recorded violent
cnme than that found in con'imunities settled by other means. Since the effect of being relocated
is thought to be so strong because of the pains of being 'moved from a homeland, the opposite 3.
should also be true those communities that were settled in an area continuously inhabited by
Inuit would have the least amount of violence. It was also expected that the communities settled
through internal migration would have levels of violence between the relocated communities and
those settled in areas of continuous inhabitation a
Analysis aqd Results
Nonparametric statistical procedures were used to test comparisons of violent crime
indicators among communities of different types Community violent crime rates were first
ranked:! and then the mean rank for each community type was computed Due to the small
number of cases, exact tests of statistical significance were then performed to determine if the ,
differences betkveen the groups were likely to be "real", as opposed to sampling or other chance
variability
The mean violent crime rate ranking for each community type, based on RCMP fi
("G" Division RChfP. 1982- !994)22 for the years 198 1 through 1993, is shown in F ib re 9.
,fhe three types of communities, the mean rank of the communities settled by relocation is T 'I
generally the hghest In 9 out of 13 years the mean violent crime rate rank of communities
2\1 The iou est rank goes to the lowest rate and the tughest rank goes to the tughest rate (Leach. 1979. p. 5 1 ). 22 .Although not repqned In dew1 here, cornpansons of cornmufin. types were also made using CCJS figures. The results of those cornpansons were sirmlar to those reponed for RCMP figures most years the relocated
~ornrnuniues had the h~ghest rank of \lolent cnme rates but the hfferences were statistically sigruficant only for 3 of the 16 !ears e&ned.

settled by relocation was higher than the mean violent crime rate rank of communities settled by
internal migration or communities settled in areas continuously inhabited by the Inuit. The next
highest mean rank generally was for those communities that were settled in areas continuously
inhabited by the Inuit The mean rank for the communities that were settied by internal migration
generally was the lowest of the three community types. Those communities had the lowest mean
violent crime rate rank 10 out of the 13 years examined.
While the differences between the violent crime rate ranks of the different community
types were fairly constanc those differences were not often statistically significant In Table 12
the mean ranks of the different community types' RCMP violent crime rates are compared and
the exact significance level of the differences between the types is presented. In only five years
( 1982 - 1986) were the differences between the mean ranks less likely than 1 in 10 to be simply
due to chance
Figure 9: Mean Rank of RCMP Violent Crime Rates by Community Settlement Method, Baffin Region, NWT, 1981 to 1993
2 i - - - . . Internal M~grat~on 1 -A- Relocaton
I -+ - -
I 0 A
I
Year
'4s was expected, the communities that were settled by relocation generally had the
hghest violent crime rate ranks However, the violent crime rate ranks for the communities
settled by internal migration and by continuous inhabitation were usually the opposite of what

was expected. This apparent incons'istency suggests that what matters most in terms of the i i
amount of violent crime is whether was settled by relocation.
Table 12: Mean Rank of RCMP Settlement Method, Baffin
Mean Rank of Community Settlement ~ e & d
Continuous Internal \ % Exact Year Inhabitation Mgration Reloat~on Signdicance Level
. . . . . . . . . . . . . . . . . . . . . . . . . . . . . . . . . . . . . . . . . . . . . . . . . . . . . . . . . . . . . . . . . . . . . . . . . . . . . . . . . . . . . . . . . . . . . . . . . .> . . . . . . . . . . . . . . . . . . . . . . . . . . . . . . . . . . . . . . . . . . . . . . . . . . . . . . . . . . . . . . . . . . . . . . . . . . . . . . . . . . . . . . . . 1981 7.29 5.00 6.00 ,6742
'4 comparison of the mean ranks of RCMP violent crime rates in relocated communities
with the mean ranks of R C W violent crime rates in non-relocated communities is made in Table
13 and is graphically displayed in Figure 10. The mean rank of violent ciirne rates in relocated
communities is greater than that of non-relocated communities in 10 out of the 13 years
considered. The differences between the mean ranks are statistically significant at p < .10 in 8 of
the years and at p < .05 in 6 of those 13 years.
From both of the comparisons made above ([I ] relocated communities with internal
migration and continuously inhabited communities and [2] relocated communities with non-
relocated communities) it seems safe to say that communities settled by compulsory relocation
'Z
do have relatively more violent crime than communities settled in other ways. While it seems
\~ safe to say that relocated communities have greater violent crime rates than non-relocated

communities, .it. is not clear what features of relocation might be the cause of those high violent i
crime rates. U
Table 13: Mean Rank of RCMP Violent Crime Rates by Community Settlement Type (Non- Relocated vs. Relocated), Baffin Region, NWT, 1981 to 1993 -
Non- Exact Sig~uficance Year Relocated Relocated Level
. . . . . . . . . . . . . . . . . . . . . . . . . . . . . . . . . . . . . . . . . . . . . . . . . . . . . . . . . . . . . . . . . . . . . . . . . . . . . . . . . . . . . . . . . . . . . . . . . . . . . . . . . . . . . . . . . . . . . . . . . . . . . . . . . . . . . . . . . . . . . . . . . . . . . . . . . . . . . . . . . . . . . . . . . . . . . . . . . . 198 1 6.6 6.0 .4242
Although the quantitative comparison of settlement.-types provides some suppon for the
idea that relocation, as apart of the colonization process, could introduce factors responsible for
high levels of violent crime in some Bafiin Region communities, an inability to rule out rival
causal factors while simultaneously looking at the effect of relocation makes it impossible to
assert with any degree of confidence that re1 ation is likely a prime determinant of violent crime
in the Baffin Region. v

Figure 10: Mean Rank of RCMP Violent Crime Rates for Relocated and Nondelocated Communities, Baffin Region, NWT, 1981 to 1993.
i :-- , . - # 0
-, 2-+- w @y-! - - - a d ' b - * -
P)
4 1 0 E i Q,
-w Non-Relocated
5 2 t > I - - . - Relocated
i --- - ----- - --
/' Year
"?
EXTERNAL MARKET FORCES
Besides relocating people from their homelands and creating socio-economk r
underdevelopment. the colonization process is also said to impact upon native cornmunities-iq
bringing them into the larger political economy which makes them vulnerable to the effects of
outside economic and political forces. This section looks to the impact of the environmental
movement, as an outside political force, upon h r sales, as another possible explanation of why
some Baffin Region communities have more violent crime than others. It is expected that the
communities most impacted by the environmental movement through the loss of income from
fbr sales should be t h s communities which have had the biggest problems with violent crime
Hunting took on new meaning for the Inuit with their movement into settlements in the
late 1950s and early 1960s No longer was game taken only for food and for the clothes and
shelter it could provide At that time Inuit began to hunt for the money it would bring fiom the
sale of skins (Wenzel, 1989) Of all the animals hunted by the Inuit, the ringed seal became the
most important source of food and, through the sales of their skins, cash. According to Wenzel

The importance of ringed sealsluns as an exportable, cash earning commodity is that it enabled Inuit to maintain an important measure of local control* over community economic and social~conditions through the security of subsistence practices. Sealing provided a means of producing both food and money through a culturally relevant and cogent activity (1989, p. 5).
The selling of the sealsiuns provided the Inuit cash which allowed them to continue to
participate in traditional subsistence activities while residing in centralized communities
Rmged seals are still hunted today. However, Inuit currently hunt the ringed seal mainly
for its meat because the skins have little cash value. The reduction in income fiom the sale of
ringed sealskins is directly attributable to the efforts of environmentalists operating outside the
eastern arctic Beginning in the mid 1950s with the SPCA's concern over methods used to take
baby harp seaW3 in the Maritimes and culminating in a 1982 ban by the European Economic
Community on the importation of all seal products, environmental groups such as Greenpeace
effectively ended the sale of all seal products (Wenzel, 1985) The Inuit hunters that relied upon
the money they made in the seal hunt lost their independent means of maintaining a self-
sufficient and culturally relevant subsistence lifestyle because of the efforts of those outside
political forces
Table 14: Violent Crime Rate (CCJS Data) and Sales of Furs, 12 Baffin Region, NWT Communities, 1980,1982,1984, and 1987
Violent Sales of Furs in Year Cnme Rate Dollars Per Capita
1980 17 0 116
Sources CCJS. 1981. 1983. 1985. 1988. Outcrop Publlstung. 1982. 1984. 1986. 1990
As a result of the environmental movement, there was a tremendous decrease in fbr sales
in the Baffin Region during the 1980s Table 14 shows that the dollars per capita earned for
sales of fbrs decreased fiom $146 per Baffin Region resident in 1980 to $1 2 per Baffin Region
23 These are the cute little wtute coated seals generally associated with the anti-sealing movement. Harp seals and nnged seals are two Merent species ,

resident in 1987 Ths more than ten-fold decrease in per capita h r sales happened at the same
time that there was a large increase in violent crime rates across the region. As is also shown in
Table 14, the violent crime rate for the 12 Baffin Region communities more than doubled
between 1980 and 1987
Variables and Hypotheses
For a region that has had very few non-governmental sources of income, the loss of
eavings fiom the decline of the seal skin trade was especially profound. A number of negative
ramifications that resulted fiom that decline provide a theoretical basis for the expectation that
the demise of the seal skin trade would be associated with increased levels of violent crime
When the seal skin market was viable it did more than provide families with way to
support themselves financially The earned income allowed the Inuit to affoid the equipment
necessary to hunt seals and, just as importantly, to hunt the other animals which are valued not
for the money they bring but for the food they provide. Snowmachines, boats with outboard
motors, gasoline, firearms, and ammunition, all required for subsistence hunting in the arctic.
make it an expensive undertaking (Wenzel, 1989). The income fiom the sale of seal skins also
allowed the majority of Inuit (especially Inuit males) to take part in an activity that is considered
to be culturally relevant For individuals living in permanent settlements, hunting has been an
activity that has allowed an expression Inuit identity. Rasing argues that "hunting is the means
pur rxcullrr~r to express identity and maintain self-respect" among Inuit males (1994, p 132
emphasis in original).
With the loss of income fiom the sale of seal skins came a reduction in the number of
Inuit males that could afford to hunt The high costs of hunting combined with the depressed
seal skin prices made it so that only those Inuit with wage earning jobs could afford to hunt
Accordifig to Wenzei ( 1 989. p 17). the decline of the seal shn market created "two strata of
Inuit . those who are employed and have direct access to money but little available time [to
hunt], and those who hunt but are critically short on cash support " .The decrease in the number
of individuals able to afford to hunt brought additional changes that could have been responsible
for the changes in the amount of violence First, the patterns of community ~ , ~ s p e c i a l l y .
household interaction were altered Rasing ( 1 994, p 189) argues that the combinatiorfof low

levels of.employment with the large numbers of men that no longer hunted on a full-time basis
led to their spending much more time at home with their wives. At the very least, that change
raised the potential for violence to have occurred. Secondly, the loss of their ability to hunt
meant the loss of one of the few activities that men could look upon as malung themselves Inuit
It is possible that the psychological stress brought about by that loss of identity might have
increased the likelihood of violence by itself or by contributing to other factors thought to be P
related to violent behavior. Undoubtedly there are other possB~oreasons for why the reduction
in the number of Inuit males that could afford to hunt might have lead to increases in violent
crime What is most important is that there are reasons to believe that the decline of the seal skin
marked could ha\.e resulted in increases in violent crime.
While there was an overall drop in h r sales in the Baffin Region as a whole, some
communities were hit harder by the loss of fur markets than others A comparison of fur sales in
Baffin Region communities is shown in Table 15. Although all communities experienced a drop
in h r sales of at least three-fourths between 1980 and 1987, some communities. such as
Pangnirtung. saw a decrease of over 95 percent The extent to which those different decreases
in h r sales %,ere associated with community differences in violent crime was examined An
inverse relationship was expected in that greater decreases in fur sales would be associated with
higher levels of ~iolent crime
Two measures of fur sales losys and two measures of violent crime, as shown in Table
15. were used to examine expected connection between the two concepts Fur sales losses at the
community level here measured by the percent decrease in per capita sales of furs between 1980 A r- - and 1987 and by the dollar decrease in per capita sales of h r s between 1980 and 1987 Data for
these variables were !,early fUr sales repons fiom the GNWT Department of Renewable B
Resources recorded in the hi: 1.5'. T. Dara Book (Outcrop Publishing, 1982, 1990) The years 1980
and 1987 were chosen because they are representative of high and low points in fur sales and
because they were the f&t and last years for which data on fur sales at the community level
were available Violent crime rates fiom CCJS ( 198 1 ; 1988) were used as measures of violent
crime because only the CCJS data was available for the year 1980. One violent crime variable
measured the percent change in the community's violent crime rate between 1980 and 19878
while the other violent crime variable measured the violent crime rate for the year 1987. The use

of the percent change in violent crime rates variable made it possible to test the relative effect I
changes in h r sales losses mi ht have had upon changes in violent crime while the use of the t single year violent crime rate sure allowed for a consideration of the effect of prior fbr sales
income losses upon violent c at a later point in time
Table 15: Comparison of Fur ~ d e s , Bartin Region Communities, 1980 and 1987.
Percent Decrease Decrease in Fur 1980 Sales of 1987 Sales of in Per Capita Sales in Dollars
Furs in Dollars Furs in Dollars Sales of Furs, Per Capita. 1980 Cornrnun~h Per Capita Per Capita 1980 to 1987 to 1987
Broughton Island 253 2 1 88 232
Cape Dorsct
C l ~ d e Rner
Gnse Flord
Igloolik/Hall Beach 1 1 8 9 92 101
Lake Harbour 7 8 9 8 9 69
Pond Inlet 89 4 96 8 5
Resolutc Ba! I54 37 76 117
Sanlluluaq 115 2 8 7 5 8 7
Sources Outcrop Publ~shlng. 1982. 1 99cJ
Analysis and Results
Rank-order (Spearman) correlations were computed to check for a relationship between
losses in fbr sale income and violent crime at the ordinal level. As noted in Chap!er 4, it is
appropriate to use nonparametric measures of associations, such as rank-order correlations,
when dealing with small samples or with samples that are not normally distributed. In Table 16
the values of the rank-order correlations are shown Of the two measures of violent crime. the
one indicating the percent change in the violent crime rate between 1980 and 1987 had the
strongest rank-ordercorrelation with the measures of h r sales losses There were low to 9
moderate positive correlations between the variable measuring the percent change in the violent
crime rate between 1980 and 1987 and the variables measuring ( I ) the percent decrease in per
capita sales of h r s between 1980 and 1987 and (2) the dollar decrease in per capita sales of h r s d

between 1980 and 1987 These low to moderate positive correlations provide some evidence
that decreases in h r sales corresponded with increases in violent crime at the community level
The rank-order correlations between the other measure of violent crime, the 1987 violent crime
rate, and the measures of community-level f i r sales losses, are negligible. At least for the year
1987, there appears to be no relationship between the great declines in f i r sales and the amount
of violent crime a community endured As might be expected given the relatively weak
correlations between the loss of h r sales measures and both of the violent crime measures, none
of these relationsfups were shown to be statistically significant at the .05 level when exact tests
of significance were performed
Table 16: Rank-Order (Spearman) Correlations Between Violent Crime Measures and Loss of Fur Sales Measures, 10 Baffin Region Communities.'
LOSS OF FUR SALES MEASURE
Percent Decrease in Per Decrease in Fur Capita Sales of Furs. Sales in Dollars Per
1980 to 1987 Capita. 1980 to 1987
Percent Change In Vlolerlt 38 1 3
\'IOLEr\TT CRIME Cnme Rate. 1980- 1987 (exact p = 28) (exact p = 21)
hEASbW \'lolent Cnme 17 - 16 I Rate. 1987 (exact p = 6 1 ) -L (esact p = 65)
*There are I0 ralher than 1 2 cases in thls a n a l y s because Broughton Island IS comblned mth Clyde k \ . e r for a slngle case and Igloollk and Hall Beach are comblned for a single case These communities were combined because pnor to 1983 Broughton Island and Clyde h r e r were policed by a single RCMP detachment and lgloollk and Hall Beach \+ere policed b! a slngle RCMP detachment
,As a final step. to hrther tease out the impact of the decline in hr sales upon differences "
in the amounts of violent crime in Baffin Region communities, crosstabulations were constructed
to see if there is any correspondence between the group of communities with the greatest hr
sale income losges and the group of communities with the greatest increases or amounts of
violent crime Both types of variables, the violent crime variables and the loss of fbr income
variables. were dichotomized to make these crosstabulations possible Communities were
divided into those above and below the median on each violent crime variable and each h r
income loss variable to acfueve the reduction to the nominal level of measurement. From the
colonization perspective, it was expected that the communities above the median on the loss of

fur income variables should also be the communities above the median on the violent crime - variables E
Of the four crosstabulations constructed, only two provided results in the direction
expected fiom the hypothesis that losses in fkr sale income lead to greater levels of violent
crime Table 17 shows that four out of five of the communities above the median in dollars
decrease in per capita sales of fbr were also above the median in the percent change in the
violent crime rate Likewise;.as is shown in Table 18, three out of the five communities above
the percentage decrease in per capita fkr sales were also above the median in the percent change
in the violent crime rate The other two crosstabulations provide results that diverge fiom that - whch would be expected from the hypothesis that losses in fur sales income lead to greater
levels of violent crime As is seen in Table 19 and Table 20, just two out of five communities
above the median in percent decrease in per capita sales of furs and above the median in dollar
decrease in per capita sales of fiu were also above the median 1987 violent crime rate And
while all of these crosstab~lations point to different interpretations of the hypothesis that violent
crime was associated with losses in fbr sales, none had less than a 1 in 5 @ < 20) likelihood of
being the result of something besides random chance
Table 17: Crosstabulation of Communities Above and Below Median Value of Percent Change in Violent Crime Rate by Communities Above and Below Median Value in Dollars Decrease in Per Capita Sales of Fur, Baff~n Region Communities
P
Dollars Decrease In Per Capita Sales of Fur. 1980 to 1987
. . . . . . . . . . . . ......... " .......... .! "........... " ' . . . . . . .
Commuruues Below
. . . . . . . . . . . . . . . M e d m
4 Cornmurutles ,.
Percent Change in Vlolent Belou M e d m 4-@0",0) . . . . . . . . . . . . . . . . . . . . . . . . . . . . . . . . . . - Cnrnc Ratc. 1980 to 1987 Commuruties .- "
Above Mah'an 1 (20 O/b)
Comrnurutles Abo\.e
..................................................................................... Median
1 (20%) ............................................................................
4 (80•‹/b)

Table 18: Crosstabulation of Communities Above and Below Median Value of Percent Change in Violent Crime Rate by Communities Above and Below Median Value in Percent Decrease in ,
Per Capita Sales of Fur, Baffin Region Communities
Percent Decrease in Per Capita : ., Sales of Fur, 1980 to 1987
- - 8
.............. ................................... .................................
Communrties I I
Communibes Belo\+ Mednn .
Percent Change In \'lolent Belov M e d m 3 (60 90) 2 (40 %) C Cnme Rate. 1980 to 198' Communlt~es
Communities Above M&an
2 fNk0/&)
Exact Slgn~ficancc - 1 00
...................... ......................... * ...................... -.- .......
Table 19: Crosstabulation of Communities Above and Below Median Value of 1.987 Violent Crime Rate by Communities Above and Below Median Value i t Decrease in Per Capita Sales of Fur, Baffin Region Communities I
Communltles Below Medan 2 (40 '10) 3 (60 O/O)
6
L'~olcnt Cnnic Rate 1%' Commun~oes
.4bo\ e Medlan 3 (60 90) ---.----...--
Exnct Slpnlficmcc = I 00
* Percent Decrease In Per Caplta
Sales of Fur. 1980 to 1987
Table 20: Crosstabulation of Communities Above and Below Median Value of 1987 Violent Crime Rate by Communities Above and Below Median Value in Dollar Decrease in Per Capita Sales of Fur, Baffin Region Communities --..--..--
-. Dollar Decrease 1n Per Caplta Sales of Fur. 1980 to 1987
Commurut~es Below Medlan
Commurutles Belon Medran
Commurubes 2 (40 %)
Vlolent Cnme Belo\\ M e d m Rate 198' Communltles 7 (60 %)
A b o ~ e hled~an
Exact Slgn~ficance = 1 00
Commuruues . Abo\ e Medran
Communitres Above M e d m
.................................... P
3 (60 ?/o)
1 1

The relative geograptuc isolation of B2ffi.n Region communities has not kepi them I
immune fiom the effects of outside political and economic forces It is clear that t6e
en~j r~nmenta l movement. as an outside poliiical and economic force, has had a tremendous
impact upon the Inuit communities ,of the east& arctic (Wenzel, 1985, ,1989) The large decline - f
in income fiom the sales of f i n that occurred# in the 1980s, a decline that resulted from the 4
efforts of outside groups such as Greenpeace and the European~Economic Community, is one * b
piece of evidence of just how susceptible Inuit communities really are to those forces.
One can be quite certain that the enormous losses in fur salesincome experienced bv
Inuit families were the result of external market forces thousands of miles from the Baffin I '
. Region Ho\~e\.er. one must be less cdnain in attributing either the tremendous-growth in violent-
cnme in the region or the great differences between co&unities' violent crime rates to that loss x
in h r sales income N'h~le the rates of violent crime in the region increased in correspondence
with the immense decreases in fur sale income, the s,mple bkariate analyses conducted here do .. .
not allow fo~r the consideration of other rival, plausible explanations of why the regional increase
in L-iolent crime rates \vas so large In other words, one cannot say that the great losses in fkr
sales income caused the great increases in violeit crime across the ~ a f f i n Region P
If it dificult to say that the rea for the large violent crime increases in the Bafin
Region during the 1980s Lvas the decline of the seal hunt. then it is even more difficult to
attnbute the differences in violent crime in the Baffin Region communities to th; differences in
losses in h r sales income Depending upon which measure of violent crime was used, the
nonparametric analyses conducted above provided mixed iriterpretations of the direction and C
strength of that-relationship There was either no relationship between the 1987 violent crime
rate \.anable and the t ~ v o measures of h r sales income declines, or what relatively weak
relationships there were between those variables were contrary to the hypothesis that declin
h r sales are related to high le\.els of violent crime The relationstups between the other crime
rate iariable, the percent change in ~ i ~ l e n t crime rates from 1980 to 1987, and the two measures
of h r sales income declines were somewhat stronger and were in support of the hypothesis of a e
relationship bet~veen h r sales declines and increases in violent crime According to the results of
these nonparametric tests of the impact of h r sales losses upon violent cnme, none of the

- relationships were especially strong and none were statistically s ighcant when tests of exact C
l b significance were nducted %
@ 1
m i* . a 4UMMARY O
.This%chapter has examined three different aspects.of the col~mizatipn perspective and the
degree to which they were associated with violent crime among Baffin Region communities + e
~ i r s h the connectio? between socio-economic underdevelopment and violent crime was.
explored Next. the associatjon between violent crimeand the methods of community settlement.
especially the impact of community relocation, was considered. Finally, the correspondence
between \iolent crime and the effects of c anges brought by external economic market forces 9 uas looked at While the results of the individual analyses are mixed, none provided especially
:,strong support yor the hypotheses derived from the colonizatjon perspective for examination of
\.iolent crime at th.e community level
The results pf the regression analysis looking at the relationship between socio-economic
underde\,eldprn-ent uere dificult to interpret due to multicollinearity h h l e an apparent
moderate association between the entire set of indicators of socio-economic underdevelopment
and \.lolent cnme \%as found. i t was not possible to determine precisely the direction of that
association because of inter-correlations among independent variables used in the analysis
Hone\.er. it appears as thoush the communities that had the lowest crime rates were those uith
the highest le\.els of socio-economic underdevelopment Therefore, there is no support for the
h>,pothesis that the communities ivith the most violent crime are the communities that are the
most socio- conomically underdeveloped,' 6 The results of the analysis that considered the association between cornmunit; relocation
and ~iolent crime were the only ones that can be seen as being supportive of the colonization
perspecti\.e in terms of its ability to account for inter-community variations in violent crime
E\.en those results. hon.e\.er. p ro~ide only modest support N%ile the violent crime rates in
relocated communities were significantly higher than those of non-relocated communities in
tu.0-thirds of the years looked at. the type of data available did not allow for an understanding of
the features of relocation that might be the cause of those tugher violent crime rates

P fl
The least supporf fo; any of the hypotheses considered in this chapter was provided by
the analysis of the association between the amount of violent crime in a community a d effects
- of change in the region brought about by external market forces. ~ifferences in the changes
resulting fiom the demise of the seal skqtrade did not correspond with differences in changes - 2 %
over time in the amount of violent crime in a community The changes in the amount of violent - crime in the communities hlt hardest by actions of environmentalists fiom outside the%rctic were
not any greater than the communities which felt much less of an impact
Although the differences in violent crime found between native and non-native peoples
may be attributed to the effects of the colonization process as measured by factors sudh as those
, examined here, the analyses performed in ttus chapter call into question the ability of some of 8 - those factors to aocount for differences in the amounts of violent crime foe& between native
I communities he next chapter of tlus study will determine if factors surrounding the use of
alcohol are any more successful at explaining why some Baffin Region communities have more
crime than others

CHAPTER 6: ALCOHOL AND VIOLENT CRIME IN THE BAFFIN REGION . - Unlike the largely academic interest in the impact of colonization upon violent crime,
widespread attention is given a c a s s the nonh to the impact of alcoholic beverage use upon
violent crime Alcohol use is seen by justice system personnel and by community residents to be
a prime contributor to violence in native communities across the nonh TI-& chapter considers
the relationshipbetween alcohol and violent crime in the Baffin is ion Doing so may shed - additional light on the question of why some Baffin Region communities have more violent * cnme than others
B
Three different facets of the alcohol 1 violent crime relationship are examined in this
chapter First. the effects of community ordinances prohibiting the possession of alcohol ate
investigated Communities that have chosen to be "dry1' are compared with "wet" communities
to decide ~vhat impact such iegislation might have upon the prevalence of violent crime Nest, 1
cornmunit,,-le\.el patterns of alcohol consumption are'looked at in relation to community violent 93
crime rates In that section the constant proponion hypothesis (which holds that the proportion /
of eucessi\.e drinkers and the amount of alcohol related damage in a population are directly
related to the mount of consumption in the population) is examined using measures of e communit>4e\~el alcohol consumption Finally, this Aapter attempts to assess the possible
I
impact of different models of drunken behavior upon contemporary levels of violent crime in the
Baffin Region The amount of violent cnme in those communities that could be considered to
ha\.e had particularly poor models of drunken behavior is compared with the amount of violent
crime in communities with somewhat "better" models of drunken behavior Prior to looking at
the different explanations of the alcohol i violent crime relationship, t h s chapter reviews the
magnitude of alcohol abuse in the Baffin Region and then looks at indicators of the use of
alcohol in the region
CONCERN ABOUT ALCOHOL ABUSE IN THE BAFFIN REGION p.
For most people in the North. the problem of violent crime issynonymous with the
problem of alcohol abuse Given the lush levels of violent crime and the apparently widespread
occurrence of alcohol abuse in the Baffin Region, it is dtfficult to consider either social disorder
in isolation of the other A broad array of reiearch materials underscore the connection that is I

frequently made between alcohol abuse &nd violent crime .n the Baffin Regio-n Field interviews
with community residents and justice system personnel, surveys of Inuit residents, and the
occurrence records of the police, when considered in conjunction, show that the use and abuse
of alcohol is considered a problem and is seen to go hand-in-hand G t h violent crime by those
that live and work in the region' a
- - Community residents and justice system personnel alike see alcohol abuse as% major
\ problem in the Baffin Region The perceptions of respondents recorded in field interviews
conducted for the baffin Region Crime and Justice Study provide some insight into the extent of
concern about alcohol abuse and the association between alcohol abuse and violent crime 8 I
Some field inteniew respondents saw the abuse of alcohol as a prdblem by itself For instance.
a school counselor. an Inuk in his forties, was asked what kinds of problems there weie in tus
community His response was that "the major one [problem] is the alcohol I believe that' for
m!.self, that is \\,hat I i e e l c o h o l is the major problem within the community ''
Other respondents -. generally made a connection between the abuse of alcohol and violent
cnme .4lcohol is definitely seen by those respondents as'a, if not rhr. prime contributor to
kiolence in the Bafin Region One RCMP officer that sewed across the north throughout the
19;Os and 1960s said that "I don't think you could go too far wrong bv accepting the fact that I
all crime in the North\\-est Temtones, that is to say, or1 the native side, has its beginnings from
alcohol " h o l h e r RChW officer attributed much of the violence he saw during his two years
Baffin Region experience in the late 1970s to alcohol "I can't recall an assault tha occurred i that didn't in\.olt,e liquor '' his \ ieu was echoed by a female Elder who pointed out that
"alcohol is ahvays in\,ol\fed in spousal assaults We never heard of spousal assaults happening
without alcohol being involved " A long-time community resident and manager of a local "Balf"
store sau the violent effects of alcohol abuse walk into his shop quite often. $-k pointed out that I -. . p"
"u.henet.er we get a lot of booze orders in on the plane, the next day you g o to the store and a I
lot of ~vomen are coming in with black eyes and bruises and that sort of stuff" In some of the
field inteniq~vs it seemed as though some respondents took it for granted that alcohol abuse is a
major cause of violence in the north The response of a RChP officer who served in a
panicul$rly \.iolent Baffin Region community in the late 1980s underscores the extent of r\,

violence in some communities and how much of it is related to the use and abuse of alcohol
When asked about the prevalence of spousal assault he said that -
It's an everyday occurrence Often times I'd go to gwe my police report before the hamlet council and I'd look at the mayor and she'd have two black eyes I'd look at the secretary, she'd have a broken nose I'd 6e called up to the nursing s tdon at two or three o'clock in the morning because the nurse was crylng that * she couldn't control herself, so I'd go up there and I would have to stitch people
P up A cop A u l d actually have to stitch people-up because the nurse was so
. upset, emotionally distraught she couldn't do it What was it7 It was women that had the shit kicked out ofihem by the husband I'd go arrest the old man and always. not 99 9 percent of the time, but 100 percent of the time. they were drunk
.Uthough :his officer's experience probably goes beyond what most RCMP officers who have
sened in the Baffin Region faced. it does show just how pervasive alcohol related violence can
become
Depending upon the community, concern about alcohol abuse is widespread among
some Inuit reiidents of the Bafin Region Whde the findings of the Aboriginal Peoples Sumey
(see Table 2 1 ) show that a slim maj~~rity of Inuit residents across the region believe that their
community has problems with alcohol abuse, i~ some communities the concern about the
problem is especially high Across the region, a majority (54 pmcent) of Inuit residents felt that
alcohol abpse was a problem in their community (Statistics Canada, 1993a) Compared with
nati\.e people across the MA'T or Canada, the residents of the Baffin Region were less likely to'
ha\.e said that alcohol abuse is a problem Sixty three percent of native adults in the hU'T and
61 percent of nat~ve adults in Canada felt that alcohol abuse was a problem in their community
(Statistics Canada, 1993a) Although the amount of concern about alcohol abuse in some Bafin
Region communities such as Grise Fiord (36 percent) or Lake Harbour ( 1 9 percent) was quite
low, the Inuit residents of other Baffin Region communities saw it as a much bigger problem
.At least two-thirds of the residents of Cape Dorset (66 percent) and Pond Inlet (71 percent), for
example. thought alcohol abuse to be a problem in their commuriity (Statistics Canada. 1993a)
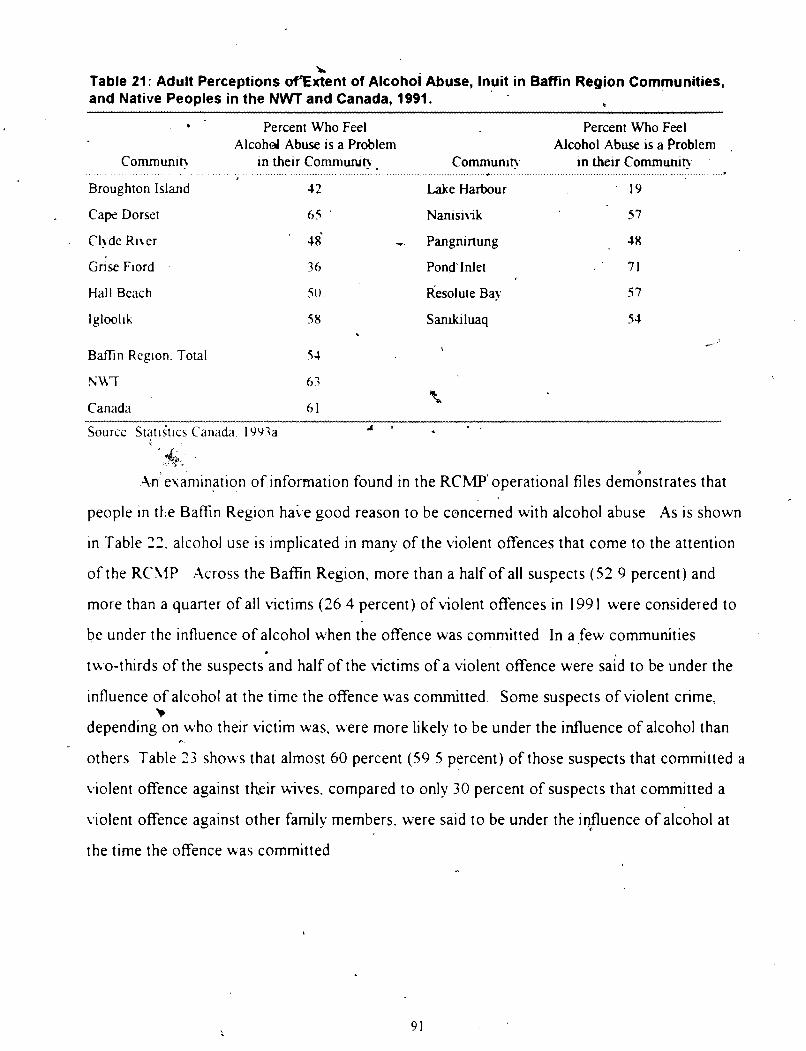
h Table 21: Adult Perceptions &xtent of ~ l c o h o i Abuse, Inuit in Baffin Region Communities, and Native Peoples in the NWT and Canada, 1991. e
C0IIUn~nlh
Broughton Island
Cape Dorset
Gnse Fiord
Hall Bcac h
Baffin Rcglon. Total
NQ-r
Canada
Percent Who Feel Alcohd Abuse is a Problem
In their Commuruh . . . . . . . . . . . . . . . . . . . . . . . . . . . . . . . . . . . . . . . . . . . . . . . .
4 2
65 '
4 8 f
36
50.
58
5 4
63
6 1
Percent Who Feel Alcohol Abuse is a Problem ,
Communih in their Comrnunih ..... . . . . _ ........... . . . . .... - Lake H d u r 19
Nanisn~k 57
Pangnirtung 48
Pond' Inlet 71
desolute Bay
Sankluaq
P
Source Stat~il~cs C a n a h . IW7a 1 - - ,
.*'e&ination of information found in the RCMP' operational files demAnstrates that
people in the Bafin Region haire good reason to be concerned with alcohol abuse As is shown
in Table 2 2 . alcohol use is implicated in many of the violent offences that come to the attention
of the RCAIP Across the Baffin Region, more than a half of all suspects ( 5 2 9 percent) and
more than a quarter of all victims (26 4 percent) of violent offences in 199 1 were considered to
be under the influence of alcohol when the offence was committed In a few communities
two-thirds of the suspects'and half of the victims of a violent offence were said to be under the
mfluence of alcohol at the time the offence was committed Some suspects of violent crime, 9
depending on who their victim was, were more likely to be under the influence of alcohol than P
others Table 23 shows that almost 60 percent (59 5 percent) of those suspects that committed
kiolent offence against their wives, compared to only 30 percent of suspects that committed a
biolent offence against other family members, were said to be under the influence of alcohol at
the time the offence was committed

Table 22: Suspect and Victim Alcohol Use in Violent Offences, Bamn Region Communities, 1991.
Nwnber of ,, Number of Suspects Under Number of Victims Under Cornmuill h Violent Offences Influence (Ojo) influence (%)
..._.._ ................... . .... ... ..... . ..... . .... . ..... ........................... ...< ..................................................................................................................... ,
Broughton Island 25 8 (32.0) - 3 (12.0)
Cape Dorset
Clyde k v e r 2 2 10 (45.4) 2 (9.1)
Gnse Fiord
Hall Beach
Iglool*
i Lake Harbour 8
Namsnik 2 7
Pangninung 31
Pond inlet J 5
Resolute Ba! 3
2 2
Saxuk~luaq 16
Total 3.82 202 (52.9) 101 (264)
Source Iqalult Sub-Dnx~on RCMP Operational Files
Table 23: Victim 1 Offender Relationship and Alcohol Use by Offender, Violent Crimes, Baffin '
P Region, 1991.
Offender Not Under Offender Under Influence vlctIm 1 offendcr Influence of Alcohol of Alcohol Totals
Relationship No Pct. . No. Pct . No. Pct
Acquaintance 3 2 45.7 38 51.3 70 100.0
' Famil! 15 69 2 20' 30.8 65 100.0
Stranger 5 55.6 4 14.4 9 100.0 '
a Unknown 1 1 39.3 17 60.7 2 8 100.0
Can't Tell 40 42.6 54 57.4 94 100.0
Total 180 47.1 202 5 2 . 9 ~ 382 100.0
Source. Iqaluit Sub-Dilislon RCMP Operational Files. e
There was a good degree of variability between the Baffin Region communities in terms 4 . .
of the amount and proportion of violent crime that is alcohol related and in terms of residents'
perceptions of whether alcohol abuse is a problem The figures presented here suggest that not
all the communities in the Baffin Region have had a problem with alcohol related violent crime
to the degree reported in the face-to-face interviews with justice system personnel and
community residents Some of the communities, however, do not appear to be too far removed
from the stories told in the interviews As is seen in the following section, there is also a good
degree of variability between communities in the use of alcohol
INDICATORS OF ALCOHOL USE IN THE BAFFIN REGION D
%
Given the general concern about alcohol abuse and the association of alcohol with
Liolence. one might assume the use of alcohol to be as, or more, prevalent in the Baffin Region 4
as it is else~vhere That assumption, however, yould be contrary to the available measures of
alcohol usage among the Inuit of the Bafin Region Below, figures from the 1991 Aboriginal
Peoples Sun,e>, are compared with findings from national health surveys to show that a smaller /'
proportion of Bafin Region Inuit drink alcohol than-is the case among the total Canadian
population and among nati\.e peoples outside the region Then, records from the h i T Liquor
Commission are analyzed to compare the amount of alcohol purchased by the residents of the
Bafin Region \ k i t h the amount purchased on average across Canada Even if it serves only to
combat "drunken Indian" stereotypes. this section will show that Baffin Region Inuit are less
likel~. to drink alcohol compared to the total Canadian population. and. of those that do drink,
thev consume much less alcohol than does the average Canadian drinker
Prevalence of Alcohol Use
Compared ~ i t h other Canadians, the average Baffin Region Inuk is less likely to be an
alcohol drinker Comparison of results from different surveys that included questions about
alcohol use21 sho~vs that the proportion of the Baffin Region Inuit population that uses alcohol is
smaller than ( 1 ) the proportion of Canadians that uses alcohol, (2) the proportion of all natik~e
people in Canada that uses alcohol. or ( 3 ) the proportion of all native people in the kU'T that
A
.4lthough there are uses for alcohol other than dnnlung (keeping gasollne from free7mg. for Instance) ~p this d ~ s s c m t ~ o n the on]! usc of alcohol of concern 1s for d n n h n g In this contea. alcohol use should be seen 4s the s a r n ~ h l n g as alcohol dnnklng

uses alcohol. In other words, Baffin Region Inuit Blcohol use is less prevalent than it is in most
other Canadian populations. a;
According to the Aboriginal Peoples Survey, three out of five adult Baffin Region Inuit
reported drinlung alcohol in the 12 months before the survey was administered in 199 1 . That 60
percent of adults were what could be considered ro be current drinkers25 in 1991 (Statistics
Canada, 1993a) 7 24 shows the proportion of the population in each Baffin Region
community thar could be considered to be current drinkers in 1991 There is a good deal of
variation between communities in the proportion of current drinkers Less than half of the adults
in two co~mmunities reported drinlung in she 12 months prior to the survey while roughly
4, three-quarters of the adults in three communities reported drinlung in the 12 months prior to the
.$ survey The proportion of Inuit adults that reported being current drinkers ranged from 46 \ '
percent of adults in Pangnirtung to 79 percent of adults in Resolute Bay.
- * . . Table 24: Prevalence of Self-Reported Adult Alcohol Use, Inuit in Baffin Region Communities,
" and Native Peoples in the NWT and Canada, 1991. /
Percent of Adults that D > ? Percent of Adults that Drank Communih Alcohol ~n the Pre~ious Year co&nunit? Alcohol jn the Prfiious Year
. , . . . . . . . . . . . . . . . . . . . . . . . . . . . . . . . . . . . . , . . . . . . . . . . . . . . . . . . . . . . . . . . . . . . . . . . . . . . . . . . . . . . . . . . . . . , . . . . . . . . . . . . . . . . . , , . . . . . . . . . . . . . . . . . . . . . . . . . . . . . . . . . . . . . . . . . . . . . . . . . . . . . . . . . . . . . . . . . . . . . . . . . . . . . . Broughton Island 56 Lake Harbour - 73
i. Cl!de Rner
- Gnse Flord
Pangnirtung
Pond Inlet
Resolute Bay
Sanrluluaq
B a f h Region. Total 60
h!VT Native Total 6 8
Canada Nati\.e Total 7 0
Source: Statistics Canada. 19933
25 In the man! w e ? s done by Statist~cs Canada and Health and Welfare Canada. a "current dnnker" is someone that had drank alcohol during the 12 months prior to the ahnis t ra t ion of the supey (Single, 1994). Although h s might not be the best measure of whether someone is a dnnker, it is a measure that has been used b? Statistics Canada in suney afier w e ! because it allows for comparisons among years and bemeen jurisdictions.

The Aborigmal Peoples Su&eY also provides a means to compare the prevalence of 3 .
alcohol use among the Baffin Region Inuit with the prevalence of alcohol use among other
native peoples in Canada Controlling for population size, in 199 1, when the Aboriginal Peoples f
Survey was conducted, there were fewer drinkers among the Baffin Region Inuit than there were
in the NWT native p & ulation or the Canadian native population As is shown at the bottom of
Table 24, the proportion of Baffin Region Inuit that were current drinkers in 1991 is smaller
than the proportion of native people in the NUrT or across Canada that were current drinkers in
199 1 (Statistics Canada, 1993a) ,
Not only is drinking less prevalent in the Baffin Region Inuit population compared to the
iarger native population, it $ also less prevalent than in the Canadian population A comparison
of the findings of the Aboriginal Peoples Survey concerning Baffin Region Inuit drinlung with _ * ,
the findings from national surveys of Canadian drinlung shows that a smaller proportion of - Bafin Region Inuit are what canbe considered current drinkers Since 1979, the proportion of .
current drinkers in Canada has wavered between 78 and 81 percent of the population (Health
and Welfare Canada, 198 1 , 1988, 1990, 1993, Single, 1994; Statistics Canada, l987a) When
compared to the 60 percent o f ~ a f i n ~ e i i o n Inuit that reported being current drinkers
(Statistics Canada. 1993a), the average Canadian is about 20 percent more likely to report being
a current drinker. In other words, the Inuit of the Baffin Region (as well as other native
Canadians) are less likely than Canadians in general to drink alcohol 4
Levels of Alcohol Consumption
Although it is interesting to know how many people in a given population drink alcohol,
the prevalency information bv itself only tells part of the story Within the group of those 6
identified as current drinkers in the various Statistics Canada surveys is a wide range of possible
drinlung experiences Those that drink a few times a year, such as malung a toast to the new r
year or having a few beers while watching the hockey playoffs, are considered the ;me as those
that drink a fifth of scotch every evening after work. All three groups of people are considered
to be current drinkers in those suneys. As such, prevalency measures can only tell us how many
people have used alcohol within a given time fiame. They do not allow us to know the amount
4

*
of alcohol that is used (i e , the quantity of alcohol consumed) by,an individual or within a
population
For comparison purposes, the volume of alcohol consumed in a population has generally 4
been measured by the per capita consumption of absolute alcohol in that population To
calculate per capita consumption, rhe total volume of absolute alcohol (i e , 100 percent pufk
alcohol or 200 proof alcohol) sold in a jurisdiction is divided by the"6opulation of the ages when
drinking is like]" to occur (generallpages 15 and above)> The total volume of absolute alcohol'
has typically been computed by adding up the sales volume for each of the three main types of
alcoholic beverages (spirits, wine, and beer), multiplying the total volume of each beverage type . 'pr
by a "con\.ersion f a ~ t o r ~ ~ ' ' o f its typical alcohol content to arrive at the total volume of absolute I
alcohol for that beverage tvpe, and then finally adding up those total volumes of absolute alcohol' -
for each beverage type to amve at a grand total of absolute alcohol sold (Single, 1994).
hleasures of per capita consumption of absolute alcohol are usually computed only at
larger levels of aggregation using pr 1 territorial alcohol tax or liquor sales records It
has been difficult to measure the am alcohol consumption at lower levels of aggregation <
because the tax and liquor sales rec generally not available at the municipal level So
whiie the current available data ( e , 1994) makes it easy to measure per capita
* consumptioti in the entire hWT, therejde y no readily available measures of per capita ?lcohol
consumption in Yellowkme or Iqaluit or ~uk$o~aktuk or any other community in the temtory P3
It is not impossible. however, to piece together alcohol consumption measures for the
Baffin Region communities. In fact, the geographic isolation and sparse population combined -
with strict alcohol control regulation makes the Baffin Region one of the few jurisdictions across
the cou
alcohol
, n t q where it is
consumption
possible to actually comp community-level measures of per capita
Individual alcohol sales fiom the Baffin Region liquor store in
Iqaluit provided to the researcher by the NWT Liquor Commission were used to calculate the
consumption measures discussed below. An analysis of those measures, which is provided
belotv, showed that the Inuit of the Baffin Regon consumed much less alcohol on a per capita r .
26 The Canadan Centre on S u b m c e Abuse in 1990 used conversion factors of 36.9 percent alcohol for spirits. 1 1 7 percent alcohol for Ibige. and 4.9 percent alcohol for beer to compute absolute alcohol (Single, 1994. p 18).

r - 0
ba'sis when compared to national or territorial figurss. Prior to considering those measures, .. Q
however, it is necessary to take a look at [ l ) the alcohol distribution system in the Baffin Region B
and (2) the techniques used to calculat'e the comm'uni~ per capita consumption measures in gr
order to establish the reliability of those measures - -,
The geographic remoteness, a relatively small population, and a closed liquor distribution
system all combine to make purchasing alcohol in ihe Baffin Regon a ;ather unique,.drawn out
process Of the 13 communities in the region, only Iqaluit has a place to buy spirits, beer, and
wine There are no places to legally purchase alcoholic beverages in the other nine communities
that allow the importation and possession of alcoh~lic beverages Residents of those
conynunities purchase their alcohol from the Territorial Liquor Store in Iqaluit A liquor
purchase begins with the buyer phoning the Iqaluit liquor store and placing his or her order. . . .
When placing the order the buyer is given.a total cost for the alcohol ordered and an estimated ,
cost for shipping 4n invoice is written up for each of tiese individual orders listing the 6
quantities, brands, types, and sizes of alcoholic beverages being ordered (See Appendix D).
.Mer placing the order the buyer mails to thilqaluit liquor store a check or money order .
(usually the latter as there are also no b a h i n the region besides the one in Iqaluit) for the
I liquor an4 shipping costs Upon receipt of payment, the Iqaluit liquor store ships the liquor
e buyer via one of the two airlines sewing the region. In short, the purchase of
(%lcohol in the Bafin Region is not as easy as stopping at the liquor store on the way home from
\ work to pick up a'bottle of wine or case of beer It can take anywhere fiom a few days to a few
months in the Baffin Region to receive a shipment of liquqr.
While the liquor distribution system in the Baffin Region makes it difficult for residents
to obtain alcoholic beverages, the individual sales receipts fiom that system make it possible to
actually calculate per capita alcohol consumption at the community level. Copies ofcach and
every liquor order invoice for an entire year for the Baffin Region were provided to the author
by the hWT Territorial Liquor Commission Calculation of the per capita alcohol consumption
measures involved the simple yet tedious process of entering the required information fiom each
invoice into a s readsheet and then doing the necessary calculations. The information required P fiom each invoice to calculate the absolute alcohol consumption measure included the number of
cases of beer or number of bottles of wine or spirits, the volume of cases of beer or bottles of .8

C" wine or spirits in millilitresfand - . the alco6ol I content of the beverage in percent based on brand of
beer. wine, or spirit, wine (as recorded in the British Columbia Liquor Distribution Branch
Guide to Products and SeMces (Myers, 1994)). The corr&~unit~ * and ethnicity (based on
surname) of the buyer on each invoice were also entered into the spreadsheet i_n order to make i'
comparisons&tween corftmunities and to see if there were differences in Inuit and non-Inuit
' consumption patterns 27 - A few assumptions must be made to use liquor order invoices as a measure of
community-level alcohol consumption The first of these is an assumption that liquor which is
purchased is liquor which iscmsumed If the respondents of field intewiews can be believed, J
this is a very safe assumption A to make about alcohohse the Baffin Region As an Inuit *> * woman in her early 20s put it, "when people get alcoha~ they just drink until it's gone " In other
@!
words, there are not a great number of bottles of rum that sit in the cabinet for three or four
years in the Baffin Region like there would be in any metropolitan home in Canada A second
point which must be made ikthat the liquor order invoices measure only that alcoho.1
consumption which is legal and whlch is confined to beverage alcohol. There is no way to
izauge the consumption of bootlegged alcohd, homemade alcohol, or denatured ethyl alcohol u
d q: b
based products such as Lysol (which is 79 percent alcohol) or hair spray (which ranges from 50
. to 85 percent alcohol) The third caveat concerning the use of this community measure of /
- alcohol consumption is that it only accounts for the consumption of alcohol that is shipped into,
and consumed in, the community It does not account for the alcohol that is consumed when ,
residents are, for example, away from the community at regional meetings in Iqaluit or doing
government business in Yellowkmfe From the standpoint of trylng to compare alcohol
consumption of Baffin Region residents with national averages2* this could be problematic
because the measure only accounts for alcohol consumed in the community thereby
underestimating the total amount of alcohol~consumed by community residents However, it
l7 The buier's surname pro~ided an approximation of the e h c i t y of the liquor orderer. It was also a good inlcauon of the ethmcih of the indniduals that are actually consuming the alcohol because Inuit and non-Inuit generall! do not sociaize in nonacupational sekngs. In the drinlung establishments in Iqaluit I visited during mv field research rb was rare to see members of the two groups dnrkng together. 2g Even the na6onal measures of consumpuon has some 'slippage' due to alcohol consumed outside the juridction: Those measures do not account for the alcohol c o n k e d by 'snowbirds' in Florida and Anzona or the beers c ed by Blue Jays fans on tnps to games in Seattle or Detroit.
I ,
98

may be the best available way of computing alcohol consumption for the parpose of considering
its effect on viorent crime at the community-level because, fiom a theoretical standpoint, this
dissertation is only interested in the effect of locally consumed alcohol on locally committed Clacrt
b
vioient crime
With these caveats in mind, it is now possible tb actually take,a look at how much . e
alcohol was consumed in the Baffin Region in 1991 and to compare the amounts consumed in
that regron with temtorial and national figures. In Table 25 the per capita absolute alcohol - consumption for the nine Baffin Region communities that allow alcohol importation and usage
( i e . wet communities) are shown with similar measures for the NWT and for all of Canada
Two things clearly stand out in that comparison First and foremost, there was much less
alcohol consrime'd on average in the nine wet Baffin Region communities than was found across
the \%'Tor nation'a~~~ Second. the types of alcoholic beverages generally consumed in the
BafEn Region were of much higher alcohol content compared'to the alcoholic beverages
cbnsumed elsewhere in the country . .
The residents of the Baffin Region drank a lot less alcohol compared to the rest of the
hWT or the nation Consumption of absolute alcohol in 1991 for all nirie of the wet Baffin 45
Region communitie; (at 1 59 litres per person age@ 15 and up) was five times smaller than the
national rate (of 8 65 litres per person aged 1 5 a* up) and about 7 times smaller than the rate
for the NM'T (at 1 1 05 iitres per person aged 1 5'and up) in 199 1 Put into real terms, the
average Bafin Region adult in 199 1 drank the equivalent in absolute alcohol of 8 cases of beer19
compared to the equivalent in absolute alcohol of roughly 42 cases per Canadian adult -Even
the community with the hghest per capita absolute alcohol consumption rate, Nanisivik, had a
rate that was less than half the national average and about a thlrd of.that for the territory
Nthough the residents of the Baffin Region consume relatively little alcoho!, the
alcoholic beverages they do consume generally have a high alcohol content The total per capita . .
absolute alcohol consumption is broken d o y in the three right hand columns of Table 25
according to the type of alcoholic beverage for the nine wet Baffin Region communities, the '
29 In Canada. a case of beer 1s 12 bottles oi cans conmiung an\% here from 34 1 to 3 55 rmll~l~ues for each can or bottle

NWT, and Canada Across the country in 199 1 , more absolute alcohol was coqsumed through
- the type of beverage with the lowest alcohol content, beer (56 percent), than through spirits (29
percent) or wine ( 15 percent), which contain much more alcohol Throughout the BaEn Region
in 199 1, most absolute alcohol was consumed through the drinking of spirits (7 1 percent) - the -?'-
beverage type with the highest alcohol content -than through beer (25 percent) or wine (4
percent) Gven the fact that most all of the alcohol shipped into the wet Baffin Region
communities comes by air, it is not surprising that most of the absolute _alcohol residents
consumed came in the form of spirits. These residents probably did not have a particular lilung
for hard liquor, but rather, they were interested in shipping the most amount of alcohol for the
least amount of money Of the three types of alcoholic beverages, shipping alcohol in its hard ',
liquor form is the most cost effective because the costs of flying goods fiom Iqaiuit into the
outlying communities are computed by the weight of the goods. As such, it is cheaper to shp a
bottle of 40 percent alcohol rum than it is to ship a case of 5 percent alcohol bker because you
get more alcohol per pound shipped when shipping the rum. It is not cost effective to ship beer I
bv air because. in essence, you are just shipping water.
A comparison of Inuit (see Table 26) and non-Inuit (see Table 27) consumption rates in
the nine wet Bafin Region communities shows that the non-Inuit residents of the region
consumed rhch more alcohol than the Inuit residents ofthe region. Overall, the non-Inuit
consumption rate in 199 I of 4.62 litres of absolute alcohol per capita was more than 4 times the
Inuit consumption rate of 1 1 1 litres of absolute alcohol per capita Even though in some
communities, such as Clyde River or Resolute Bay, the Inuit and non-Inuit consumption rates
were somewhat similar, the non-Inuit consumption rate was higher than the Inuit consumption
rate in all nine of the wet commqnities. In terms of the types of beverages consumed, Inuit
residents were more likely to consume spirits than beer or wine. By contrast, the non-Inuit
residents of the region consumed almost equal amounts of absolute alcohol from spirits and from
beer

Table 25: Volume of Absolute Alcohol Per Capita (ages 15 and up) Purchased, lnuit and non-Inuit Residents, Nine Wet' Baffin Region Communities, the NWT, and Canada, 1991.
Per Capita Litres of Absolute Aid to l Purchased (and Percent of Total)
Comrnuni t? Total Spirits Beer Wine . . . . . . . . . . . . . . . . . . . . . . . . . . . . . . . . . . . . . . . . . . . . . . . . . . . . . . . . . . . . . . . . . . . . . . . . . . . . . . . . . . . . . . . . . . . . . . . . . . . . . . . . . . . . . . . . . . . . . . . . . . . . . . . . . . . . . . . . . . . . . . . . . . . . . . . . . . . . . . . . . . . . . . . . . . . . . . . . . . . . . . . . . . . . . . . . . . . . . . . . . .
~Broughton Island 0 50 0.47 (94%) 0.03 ( 6O.6) 0 0 0 ( 0 % ) .
Cape Dorset ' 1 50 1.27 (85%) 0 22 (14%) 0.01 ( 1%)
Clyde k \ , e r 0.92 0.8 1 (8870) 0.09 (10%) 0.01 ( 2%)
Gnse Fiord 0.75 0 65 (87%) 0.08 (1 1%) 0.02 ( 3%)
Hall Beach 1.28 1.16(91%) . 0.11.(9%) 0.01 ( 1010)
Iglooiik I .52 1.18 (78%) 0.25 (16Y0) 0.09 ( 6%)
Nan~snlk 3.65 1.60 (44%) 1.85 (5 1%) 0.20 ( 5%)
Pond Inlet " 115 1 00 (8794) 0.07 ( 6%) 0.08 ( 79.b)
Resolute Ba! 1 67 1 43 (86%) 0.22 (13%) 0 02 ( 1%)
Nine 'Wct' Commun~t~es 1 59 1 12 (71%) 0 40 (25%) 0 07 ( 4Yo)
N N T
Canada
Sources Baffin Region,figures compiled from h%'T Liquor C o m s s i o n Liquor Order Invoices - NN'T and Canad~an figures as reported by Single (1994, p. 34).
Table 26: Volume of Absolute Alcohol Per Capita (ages 15 and up) Purchased, lnuit Residents Only, Nine 'Wet' Baffin Region Communities, 1991.
Per Capita Litres of Absolute Alcohol Purchased (and Percent of Total)
. . . . . . . . . . . . . . . . . . . . . . . . . . . . . . . . . . . . . . . . . . . . . . . . . . . . . . . . . . . . . . . . . . . . . . . . . . . . . . . . . . . . . . . . . . . . . . . . . . . . .
Commun~t! Total Sp~nts Beer . . . .
Wine . . . . . . . . . . . . .G. . . . . . . . . . . . . . . . . . . . . . . . . . . . . . . . . . . . . . . . . . . . . . . . . . . . . . . . . . . . . . . . . . . . . . . . . . . . . . . . . . . . . . . . . . . . . . . . . . . . . . . . . . . . . . . . . . . . . . .
Broughton Island 0 46 0.43 (93%) 0.03 ( 796) 0.00 ( 0%)
Cape Dorset 1 45 1.23 (85%) 0 21 (l4Y0) 001 ( 1%)
Gnse F~ord 0.67 0 59 (88%) 0.07 (10%) 0.01 ( 2%) &
Hall Beach 1 09 1.01 (93%) 0.08 ( 7?/0) 0.00 ( 0%)
Pond Inlet I 05 0.94 (89%) 0.04 ( 4?6) 0.07 ( 7%)
Resolute Ba! ' 161 1.50 (91%) 0.13 ( 8%) 0 01 ( 1%)
Nine 'Wet' Communities 1 1 1 0.95 (86%) 0.14 (12%) 0 02 ( 2O;O)
Sources Compiled from N L T Liquor Comrmssion Liquor Order Invoices.

While it is necessary to use the above measures of community-level alcohol consumption
with some prudence, it is also important to point out that the method used in this dissertation to
calculate the amount of absolute alcohol used in the Baffin Region is, in at least one way,
superior to methods used on a national scale Specifically, the method of calculation used here
was an improvement over other methods because the alcohol content of beverages used in
computing the amount of absolute alcohol was based upon the actual known brand of beverage
(e g . Bacardi - ~ u m or Moslon Dry Beer) rather than upon a conversion factor that was
estimated for the type of beverage (i e , spirits, beer, or wine) Use of the Canadian Centre on
Substance Abuse's conversion factors (36 9 percent alcohol content for spirits, 1 1 7 percent
alcohol content for wine, and 4 9 percent alcohol content for beer (Single, 1994, p IS)) would
have lead to a 7 percent underestimation of all absolute alcohol used in the Baffin Region and,
due to a high proportion of 15 1 proof (75 5 percent alcohol content) rum sales, a 9 percent
underestimation of absolute alcohol from the consumption of spirits.
Tabk 27: Volume of Absolute. Alcohol Per Capita (ages 15 and up) Purchased, non-lnuit Residents Only, Nine 'Wet' Baffin Region Communities, 1991.
Per Capita Litres of Absolute Alcohol Purchased (and Percent of Total)
..........................................................................................................................................................
Comrnunir~ . . . . . . . . . ... .........................................................................................................................................
TO& Spirits Beer Wine
Broughton Island 1.23 1.16 (94%) 0.01 ( 1%) 0.05 ( 5%)
Cape Dorset 1 93 1 57 (81%) 0.31 (16%) 0.05 ( 30i0)
Cl!de Rnm 1 06 0.78 (73Y0) 0.20 (19?/0) 0.08 ( 8O/b)
Gnse Fiord 1 1 1 0 95 (86%) 0.10 ( 9%) 0.06 ( YO)
Hall Beach 3.46 2.93 (85Y0) . 0.49 (14%) 0.01 ( 1%)
Igloolik 135 2.71 (62%) 0.86 (20%) 0.78 ( 18%)
Narusn~k 7 84 2.85 (36%) 4.48 (57%) 0.5 1 ( 7%)
Pond lnlet 2.44 1.79 (73%) 0.47 (19%) 0.19 ( 8%)
Resolute B ~ J 1 72 1.31 (76%) 0.39 (23%) 0.02 ( 1%)
Nine 'Wet' Communities 1.62 2.19 (47%) 2.1 1 (46%) 0.32 ( 794)
Sources Compiled from h7VT Liquor Comrmssion Liquor Order Invoices.

When the prevalency figures and the measures of consumption are looked at together, a
number of conclusions can be made about patterns of alcohol use in the Baffin ~ e ~ o n First of
all, in proportion to the size of the population, fewer B a n Region Inuit drink than most other
population groups The results of census and national social survey research show that the
average Baffin Region Inuk was less likely to be a drinker than was the average native person in - the NWT. the average native Znadian, or the average Canadian The second conclusion
concerning the use of alcohol in the Baffin Region is that less alcohol was consumed in the
region per person than was consumed per person in the NWT or across the country A
comparison of per capita absolute alcohol consumption rates shows that for the year 1991 the
average amount of alcohol consumed in the Baffin Region was about five times less than the
average amount consumed nationally and about seven times less than the average amount
consumed in the Mh'T The third conclusion that can be made about drinking in the Baffin
Region IS that the non-Inuit residents of the region consumed, on average, much more alcohol
than the Inuit residents of the region In terms of per capita absolute alcohol consumption in
199 1. the Inuit residents were outdrank by the non-Inuit residents by a ratio of four to one A
final conclusion which can be made regarding the use of alcohol in the Baffin Region is that the
alcoholic beverages consumed generally had a high alcohol content Since most of the alcohol
consumed in the region is shipped to the communities by air at the drinkers' expense on the basis
of weight. it is much more cost effective to purchase alcohol in the form of hard liquor rather
than in the form of beer or wine *
Compared with people outside the region, native and non-native alike, the Inuit of the
Baffin Region are less likely to drink alcohol, those that do drink on average consume less
alcohol, and when they drink they generally drink hard liquor But while there is relatively less
drinking in the Baffin Region than elsewhere. the driniung that does occur is apparently cause
for concern -4s was shown in the first part of this chapter, some residents and justice system
senice providers see the use of alcohol as a primary contributor to violent crime in the Baffin
Region and an analysis of police records shows that a good deal of violent crime in t b s e
communities is indeed alcohol related. In the.remainder of this chapter different factors
surrounding the use and control of alcohol at the community level are considered to further
examine why some Baffin Region communities have more violent crime than others - /

' I
LOCAL A iOL CONTRO rND VIOLENT CRIME
Legislators in the NWT have not just sat idly by and watched as alcohol related violence
has impacted communities throughout the territory Legislation has been passed to allow
communities in the NWT to attempt to deal with the alcohol related social problems through the
regulation of sale and possession of alcoholic beverages. Using a plebiscite process30 sanctioned + .
under the Northwest irrritor'ies Liquor Act (R.S.N.W.T. 1988, c. L9, s. 48 to 50)3', many
communities have exercised their local option to prohibit or restrict the sale or possession of
alcohol in the area within and immediately surrounding their municipality or hamlet. This
section considers the different ways that Baffin Region communities have chosen to control .
alcohol use and, especially, the effect that those controls have had upon violent crime
Types of Local Alcohol Controls
The local option on alcohol control restrictions and prbhibitions, as is shown in Table 28, '
has been exercised in one of three ways by the Baffin Region communities. Some have chosen
through the plebiscite process to prohibit the "consumption, possession, purchase, sale or
transport of liquor" (Lrqlror Act, s 48(2)(e)) in and around their communities These
communities that have chosen to prohibit alcohol, as shown in the right hand column of Table
28, are commonly referred to as 'dry' communities. Other communities in the region have
chosen not to control or restrict the use or possession of alcohol at the local level These
unrestricted communities. which are shown in the left hand column of Table 28, are "subject
only to the general liquor laws of the Territories" (Liquor Act, s. 48(2)(a)) and are more
commonly referred to as 'wet' communities. Voters in the majority of the communities in the
Baffin Region have chosen a middle ground between the total prohibition of alcohol and its
unrestricted availabilit!,. These communities. shown in the middle column of Table 28, have
instead decided upon a using an elected alcohol education committee*to try to control alcohol
use and abuse. The committees, upon election, decide "who may consume, possess, purchase"
or import and "the amount of liquor that a person may possess, purchase, transport, or import"
into the community" (Liquor Act, s. 48(2)(d)). For those individuals whose use of alcohol is
'" Change in local lquor controls under the irquo:.4cr is by a 60 percent supermajorih See Appenmr E for an example of an actual ballot used in one Baffin Region communih 's plebiscite.
Referred to as .Ltquor .4ct' hereafter

problematic, the alcohol education committees can ban them from purchasing, importing, or
even consuming alcohol within the community for periods of up to a year (Liquor Act, s
Although they are more commonly referred to as being 'controlled' rather than 'wet' or
'dry,' the communities which attempt to limit alcohol use and abuse through alcohol education 3%
committees should also be seen, at least for the purposes of this dissertation, as being 'wet' *
communities Whle there is no way to be certain that the system of local alcohol control by
committee is wholly ineffective, there is a good deal of skepticism over some committees' will
and ability to actually control individual drinkers. In one community the alcohol education
committee was called "invisible" (by an Inuk social worker) while in another community it was
seen as serving as a "rubber stamp" in approving orders (by the senior administrative officer) I n
a couple of other communities there was concern expressed that the individuals on the alcohol
education committee were the ones needing the most education about driniung; one committee
bras characterized (by a non-Inuit airline agent with 3 years of community residency) as being
the "biggest pack of drunks in [the] whole town." An RCMP officer in that same community .&
felt that the alcohol education committee was not doing its job of forbidding those individuals
that caused trouble while intoxicated He reported that his detachment would "supply them with
information on people uho have caused problems when they have beer, drinlung [In] the
ma-lorit! of cases that we refer[red] to them they continue[d] to provide them with their liquor
permits "
There is some evidence to be gleaned from the records of at least one alcohol education
committee to suggest that some alcohol education committees are but a "rubber stamp" in the
process of obtaining liquor Rasing (1994, p 258), in his ethnography of social conformity in
Iglooiik. found that community's alcohol education committee to have ~efbsed only 28 of the . . F a 2 liquor applications it processed in the 8 years between 1980 and 1987 He chalked their&
t~vo percent refkal rate up to a variety of factors including the committee's "familiarity with the
people who appear before them. a sensitivity to community reaction, and the underlying a~~ersion
to interfere with people's lives" (Rasing, l994, p. 259)

*+ T a l h 28: Types of Local Option Alcohol Controls, Baffin Region Communities, 1 9 9 6 - 'Dq' Cornmuruues ' 'Wet' Cornmu~ties
................................................ ................................................................................................................ ............
Alcohol Possession Restricted b! Local Alcohol Prohbited . Education Committee U mestncted
. . . . . . . . . . . . . . . . . . . . . . . . ......................................................................................................................
Lake Harbour Arctic Bay Gnse Fiord
Pangru nung Broughton Island Nanisibrk
. Saniki I uaq (I
Cape Dorset
Hall Beach . Iglool~k
Pond lnlet
Resolute Ba!
Source GNUT Go\ ernment Senwxs. 1992.
EL-en in communities where the committees are effective in keeping problem drinkers
from importing - alcohol. there is no guarantee that those individuals restricted from ordering
alcohol are not getting their booze from another source. In one community, where the alcohol
education committee did refhe a relatively higher number of orders, there were still doubts as to
the real effects of local control because, as some argued, those forbidden from importing alcohol
uould just get it from friends or relatives As an RCMP officer in that community pointed out
they can alu,ays drink with their neighbors or drink with their brother when he gets his order in It's not like they are cut off for good because somebody else - can go and get an order >laybe a wife or whatever A lot of times, you see the orders in women's names
Given both points of contention concerning the ability of the alcohol education
committees to actually make a community a 'controlled' community, it is difficult to see them as
reall), being all that different than the unrestricted 'wet' communities Although they are
controjled 'on paper,' the rehsal of some committees to reject orders and the ability of drinkers . in other communities to get alcohol from family and fnends when committees do reject orders
makes one question the dr-facto existence of alcohol control

Violent Crime in Wet' and 'Dry' Cmmunities
If one can agree that there teally is no difference between the 'wet' and 'controlled'
communities in terms of individuals' ability to obtain to alcohol, then it is possible to move on
and finally take a look at the effect that alcohol prohibition has had upon the amount of violent
crime in a community Below. a comparison is made between violent crime iates in communities
that prohibit alcohol possession and those that allow alcohol possession and consumption If
there is any merit to Giacopassi and Stitt's (-1991) distribution of consumption hypothesis
(see Chapter 3), that policies allowirig for greater alcohol consumption lead to greater amounts
of alcohol related damage such as violent crime, it would be expected that the communities that
use local option legislation to prohibit the possession p d use of alcohol would have less violent
crime than those communities that allow residents to possess and use alcohol
The RChlP violent crime rates over the 13 year period of 198 1 to 1993 ("G" Division ,'
RCXlP. 1982- 1994) for tge 'wet' and 'dry' communities are presented in Figure 1 1 As that figure
shows, the differences between the two types were not:always i'n the direction that corresponds
with the objectikfes of the Liqlror Act local option prohibitions In four of the six years prior to
1987 the violent crime rate of 'dry' communities was actually greater than that of 'wet
communities I t has only been since 1987 that the violent crime rate f p 'dry' communities has
been less than the rate for 'wet' communities Although the violent crime rate for the 'dry'
communities has not ahvays been less than for the 'wet' communities, the overall grouzh in
violent crime for the t~vo community types was less for the communities where alcohol is
prohibited than in the communities where alcohol is permitted. From 1984. when the violent
crime rate for both types of communities was 22 per 1,000 population, until 1993, the violent
crime rate in the 'wet' communities increased by 190 percent while the rate for 'dry' communities
increased 86 percent
.4s done elsewhere in ttus study, nonparametric statistical techruques were used to make
comparisons between the 'wet' and 'dry' communities' violent crime rates. A rank-sum test was
first conducted to compare violent crime rates in the two different types of communities.
hfedian tests were then performed to determine the correspondence between a community being
a 'dry' and haking relatively lower violent crime rates Exact tests of statistical significance were
conducted for both analyses to determine if the differences between the types of communities

were likely to be the result of sampling or other chance variability or if the differences were an
indication of 4 probable relationship p
7-
The violent crime rates for the two different types of communities were compared using -"a
the rank-sum test Violent crime rates for each community were first ranked and then the mean
rahk for each type of community as a group (i e , for the group of 'wet' communities and for the
group of 'dry' communities) was calculated. In Table.29 the mean violent crime rate ranks
between 1985 and 1992 for 'wet' and for 'dry' community- types were compared and the exact
significance level of the differences between the two community types is presented The
differences between the mean ranks of the two community types generally correspond with the
differences bet~veen the types seen above in Figure 1 1 based upon offence rates Contrary to the
desired results of the local control legislation, the mean violent crime rate ranks of the 'dry'
communities ere actually higher than those of the 'wet' communities in 1985 and 1986 AAer
that point. however. from 1987 to 1992, the mean violent crime rate ranks for the 'dry'
communities. as mould be expected given the aims of the protubition ordinances and whtt is
predicted bv the distribution of consumption hypothesis, were lower that those of the 'wet'
communities
Figure 11 : Violent Crime Rates for Wet' Communities and 'Dry' Co-unities, Baff~n Region,
- Wet Commuruhes
- - - - Dry Communhes
Source RCtW Operabonal Stabsbcs Repomng Year . System Deta~led Cnme Report 'G' D ~ s l o n

-t .. - Table 29: Mean Rank of RCMP Violent Crime Rates (3 Year Running Average Rate) by Community Afcohol Regulation Type, Baffin Region, NWT, 1985 to 1992.
Mean Rank of Communih Type
Year DP Wet Exact S~gruficance L a el
1 98_C 7 3 3 6 22 727
.Although there has been a reversal in ;he trends of violent crime rate ranks between the
.wet' and 'dn ' communities. the differences between those ranks were, more often than not. not
statistically significant For the first four years looked at (1985 to 1988), it appears as though
the differences betbeen the groups' mean ranks are generally not large enough to anticipate that
those differences are the result of something besides chancec However, the differences between
the mean ranks w ere large enough in three ( 1989,to 199 1 ) of the last four years examined ( 1989
to 1992) to ha\e had a 1 in 10 probability of likely being the result of sometlung besides random
chance
The patterns foundjn the results of the median tests were comparable to the patterns
found in the results of the rank-sum test and in the graphic comparison of 'wet' and 'dry'
communities' violent cgme rates Prior to 1988, as seen in Table 30, a third to two-thirds of the
' d ~ ' communities had violent crime rates that were actually higher than the Baffin ~ e g i o d C
median It was not until 1988 that all of the 'dry' communities' violent crime rates were below
the regional median violent crime rate It is difficult to attribute the correspondence between
communities having relatively low violent crime rates and their being 'dry' to the effects of
alcohol prohbition because the median tests used here were only able to demonstrate that the
three Id?' communities were among the six communities below the median crime rate As such.

there is roughly a one in five likelihood (p. = ,182) that it is only because of chance events that
those-'dry' communities are among the lowest in violent crime. 1. -
Table 30: Proportion of Dry Communities Below the Median RCMP Violent Crime Rate (3 Year Running Average Rate), 1,985 to 1992. All Baflin Region Communities
Proportion of Dg Communities Exact Signrficance %
.Year Below Medran Violent Crime Rate Level
1 out of 3" 1.000
1986 1 out of 3 1 ,000
2 out of 3
3 out o f? -
1991) 3 out of 3 ,182 * 1991 3 out of 3 ,182
. 3 out of 3 s 182
\ This examination of the relationship between coriununity alcohol prohibition and violent
crime has done little to settle the question of the impact that those prohibitions have on the
alle~iation of violence Likewise, it is difficult to accept or to reject Giacopassi and Stitt's
( 199 1 ) distribution of consumption hypothesis in light of the results obtained in these analysbs -: **
The comparisons of violent crime in 'wet' and 'dry' communities &er a eight year stretch
provided results which can only be described as contradictory. 'Dry' communities had a higher
violent crime for the first two years looked at and then a lower crime rate in the last six years
examined In only three of the six years when the 'dq' communities had less violent crime did
the results of the nonparametric analysis appear to lend support to the idea that the prohibition -
of alcohol in a community made it less prone to violence. Otherwise, the results do not
reason to argue either for or against the merits of local alcohol prohibitions. "
ALCOHOL USE AND VIOLENT CRIME
The contradictory results of the analysis comparing violent crime rates in 'wet' and 'dry'
communities suggest that it is necessary to look beyond the questionable impact of legislative
attempts to control alcohol related violence to account for variations in inter-community violent
crime rates Instead of tqing to understand the effects of alcohol prohibitions on violent crime,

this chapter now takes a look at the degree to which there is an association between the amount
of alcohol use and the amount of violent crime. How much alcohol is used, rather than whether
alcohol use is allowed, is the question which will now be cohsidered in an attempt to account for
differences in violent crime between Baffin Region communities.
As is shown in Table 24 through Table 27 above, there are some differences between the
communities according to the prevalency of alcohol use and between the nine 'wet' communities
in the volumes of alcohol consumed. In this section of this chapter the relationship between the
community-level indicators of alcohol use and the community-level measures of violent crime is
considered An attempt is made here to determine the degree to which variations in alcohol
consumption and variations in the prevalency of alcohol use coincide with variations in violent
cnme
The bio-social explanations of alcohol related violent crime among native peoples are the a
primary basis for this examination of the association between the indicis'of alcohol use and
violent crime Rather than attempting to measure at the community level the diaerent C E=
socio-cultural stressors said to combine with alcohol use to createviolent crimecin individuals.
ths section considers the latter half of the equation, namely the alcohol use. Gwen that alcohol
use is a necessary component of the causal chain in all of the bio-social explanations, holding the
other factors constant could mean that there.would be a direct relationship between the amount
of alcoholuse and the amount of violent crime committed. Without the alcohol the other factors
might not come into play
The examination of the association between violent crime and the indicators of alcohol
use allows for a consideration of what Giacopassi and Stitt ( 1 99 1) termed the constant
proportion hypothesis If that hypothesis, which holds that the proportion of excessive drinkers
and the amount of alcohol related damage (such as violent crime) in a population are directly
related to the amount of consumption in a population, has any merit, one would expect (1) a
direct relationship between the proportion of drinkers in a community's population and the
violent crime rate andi2) a direct relationship between the per capita alcohol consumption rate '
in a community and the violent crime rate Each of these expected relationships is explored f
below

Prevalence of Alcohol Use and Violent Crime
The only available measure of the number of alcohol users in Baffin Regon communities,
the percentage of the Inuit population that are current drinkers (see Tabie 24), comes fiom the
199 1 Aboriginal Peoples Survey (Statistics Canada, 1993a). The violent crime measure used to
examine the relationship between the number of people that dripk alcohol and the amount of
violent crime in a community is the mean RCMP violent crime rate for the years 1990 through
1992. As in the latter part of the previous chapter, the analyses in this section were complete&
using nonparametric statistics with exact tests of statistical significance because of the small
number of cases available for study
The rank-order (Spearman) correlation between the 1990-92 violent crim; rate measure
and the percentage of the lnuit population that reponedvbeing a current drinker in 1991 was -,
computed first As is shown in the first row of Table 3 1, the rank-order correlation *
(Spearman's r = 40) between the two variables was what can be considered to be indicative of '
only a weak to moderate relationship (Patten, 1997). The relationship was certainly not strong
enough to be relatively certain that the result is statistically significant and not the result of
chance alone w
Table 31: Rank-Order (Spearman) Correlations Between the 1990-92 RCMP Violeat Crime Rate and 1991 Prevalence of Alcohol Use Measure, 'Wet' and 'Dry' Baffin Region Communities.
Commun~t> -le\ el Pre\ alence 1990-92 RCMP Exact S~gnlficance of .4lcohol Use Measure V~olent Cnme-Rate Level
Percentage of Inuit Populal~on that are Current Drmkers .4O .201
To further explore the relationskp between the nuAber of people that drink and the - .
amount of violent crime in a community. the mean rank for the 1990-92 RCMP violent crime
rate of communities with a proportion of drinkers above the regional median was compared to
the mean rank of the same violent crime measure for communities with a proportion of drinkers
below the regional median That comparison, dispiayed in the first row of findings in-Table 32.
shows that the mean violent crime rate rank for the communities below the median of percentage
of current drinkers was smaller than the mean violent crime rate rank for the communities above t

the median percentage of crjrrent drinkers. Again, as with the rank-order correlation considered
above, it is difficult to say that the relationship is attributable to anything other than chance.
Tabte 32: Mean Rank of f 9M-92 RCMP Viotent Crime Rate for Communities Above and Below , the Median on 1991 Prevalency of Alcohol Use Measures, Wet' and 'Dry' Baffin Region
Communities.
Mean Rank of 1990-92 V~olent Cnme Rate for Communities on Prmalence
Cammuruh -level Prevalence of Alcohol Use Measure
of Alcohol Use Measure Below Med~an Above M d a n Exact Significance Level . . . . . . . . . . . . . , . . . . . . . . . . . . . . . . . . . . . . . . . . . . . . . . . . . . . . . . . . . . . . . . . . . . . . . . . . . . . . . . . . . . . . . . . . . . . . . . . . . . . . . . . . . . . . . . . . . . . . . . . . . . . . . . . . . . . . . . . . . . . . . . . . . . . . . . . . . . . . . . . . . . . . . . . . . . . . . . . . . . . . . . . . . . . . . . . . . .
Percentage of Inu~t Populat~on that are Current Dnnkers 5 83 7.17
Finally, a "median test" was used to examine the relationship between the number of
drinkers and the amount of violent crime in a community Use of the "median test" technique
in\.olved grouping communities on two different variables and then examining the
correspondence betueen the groups on those variables Communities were first grouped
according to whether they were above or below the median on the proportion of drinkers
\.anable and' then thev were grouped according to whether they were above or belowthe violent
crime rate variable A crosstabulation of the two grouped variables was then computed to~see if
communities above the median on one measure were also above the median on the other
measure I n this case the crosst.abulation was computed to find out, as hypothesized, if the
communities .that were above the median of percentage of the population that reported drinking
were also above the median violent crime rate The computed crosstabulation, as reported in the
first row of findings in Table 33, shows that three out of the six communities above the median
of percentage of population that were current drinkers were also above the median violent crime .
rate Those communities above the median percentage of the population that were current
drinkers were just as likely to be below the median violent crime rate as they were to be above
it In essence, ttus median test brings into question the relationship between the proportion of a
population that are aicohdl drinkers and the violent crime rate in that population. When taken
together, the three tests conducted to examine the relationship between the number of drinkers
in a community and biolent crime bring into question the idea that the greater the number of
drinkers there are in a commmity the more biolent crime there should be There is very little to

indicate that there is an association between those two variables for the twelve BafFin Region
communities studied in this dissertation &
Table 33: Proportion of Communities Above the Median Values for the 1990-92 RCMP Violent Crime Rate and the 1991 Prevalence of Alcohol Use Measures, Wet' and 'Dry' Baffin Region Communities.
Proportion of Communities Above Comnunih -le\,el Pre~,alence Medm Values for Violent Crime Rate *
of Alcohol Use Measure and Prwalence of Alcohol Use . Exact Sigruficance Level Measure
. .... ..,... .. .... .. . .. ..... ..,. . .. .. . , , . , . , , , . .. . .. ...... .... . . .... .... ....,........ .. ...................... .............. ...................... . .... . .. ....... .... ... .... .. .... ...... ....... .... ... ......... ..-. .. .. ... .. ... . .. ...
Percentage of Inuit Population that are Current Dnnkers 3 out of 6 1 .OM)
Per Capita Consumption of Alcohol and Violent Crime
It is necessary to examine the relationship between drinlung and violent crime with a
more precise indicator of alcohol use because the measure of the proportion of drinkers in a
community used above is a rather crude measure of alcohol use more accurate method of t
measuring alcdhol use in a community is to calculate the per capita consumption of absolute
alcohol Rather than just counting the number of 'current drinkers' in a cornnfunity - a crude
measure which puts individuals that have a glass of champagne at a wedding once a year in the *-
same category as those that drink a case of beer a nigh(- the per capita consumption measure
provides an indication of how much alcohol is used in a jurisdiction. This portion of the study
examines the relationship between the per capita consumption of absolute alc~hol and violent
crime As predicted by the constant proportion hypothesis, whch holds that the amount of
alcohol related damage such as violent crime is a result of the amount of alcohol consumed in a
population, it was expected that there would be a direct relationship between per capita
consumption of absolute alcohol and the violent crime rate in a cornmunitp'' a
The measures and methods used to examine the consumption 1 violent crime relationship
in this section are similar to those found elsewhere in the study. The vidient crime measure, the
1990 to 1992 mean RCMP violent crime rate, was the same as used elsewhere. A few different
measures of per capita consumption of absolute alcohol, all of which were computed from the
Iqaluit liquor store invoices, were used in the analysis. The tot sumption rate (see able 25) . the Inuit consumption~ate (see Table 26). the non-Inuit c ption rate (see Table 27)

spirits, beer, and wine for each 'wet' community in 1991 were all used to consider the
relationship between the amount of alcohol consumed and the amount of violent crime As has
been the case elsewhere in this dissertation, the small number of cases available to apalyze made
the use of nonparametric statistical techniques and exact tests of statistical sigruficance a
necessity for the analyses found in this section
Rank-order correlations were the first type of nonparametric statistic; calculated to
examine the alcohol consumption i violent crime relationship The rank-order correlations
between the 1990-92 RCMP violent crime rate and each of the six different measures of per
capita consumption of absolute alcohol are shown in Table 34 A couple of different points can
be made about the relationship between consumption and violent crime, each of which is
dependent upon the measure of consumption used First, the results indicate that there was no
apparent relationship between the total per capita consumption of absolute alcohol in a "
community and the violent rate in the community for the year 1991 The value for the
rank-order correlation (Spearman's r = 03) denotes a nearly complete absence of a relationship /
betueen those two ~rariables U%en the consumption figures are broken down according to
whether the purchaser was Inuit or non-Inuit and then the relationship is examined a couple of
relationships appears to emerge The weak negative relationship between non-Inuit
consumption and the violent crime rate (Spearman's r = - 13) is offset by the weak to moderate
positive relationship betueen Inuit consumption.and the violent c&e rate (Spearman's r = 40)
Of all the rank-order correlations the strongest is that between the Inuit per capita consumption
of spirits ( i e , hard liquor) and the violent crime rate (Spearman's r = 55) However, as the
values for the exact significance level show, even that relationship was not strong enough (p =
13) for it to be considered to be likely to be the result of something besides chance events
B

Table 34: Rank-Order (Spearman) Correlations Between the 1990-92 RCMP Violent Crime Rate and 1991 Absolute Alcohol Consumption Measures, 'Wet' Saffin Regibn Communities. P
Cornmuxi? -le\.el Absolute .4lcohol 1990-92 RCMP Exact Sigdicance - Consumption Measure Violent Crime Rate Level
. .......... ............................
Total Per Capita Consumpuon of All Bcerages .03 .948 "IT,
Non-Inuit Per Cap~ta Consumption of All Beverages
Inuit Per Capita Consurnpt!on of All Be\.erages
Inuit Per Caplta Consurnpt~on of Splnts
lnult Per Capita Consurnpt~on of Beer
lnult Per Cap~ta Consurnptlon of N'lne - 4•’ ,269 *
I
The second type of nonparametrical analysis conducted to examine the relationship
betmeen alcohol consumption and violent crime was the "rank-sum" test In that test the mean
rank of kiolent crime rates for communities above the median of the per capita consumption
measure Here compared with the mean rank of violent crime rates for communities at or belou
the median of the per capita consumption measure The results of comparisons calculated for
each of the consumption measures, as presented in Table 35, were similar to those resulting
from the rank-order analysis Those communities above the median in total per capita
consumption and those above the median in Inuit per capita consumption had only slightly
higher mean ranks on the violent crime rate when compared with the communities at or below
the median of total per capita consumption or communities at or below the median of Inuit per
capita consumption As was the case with the rank-order analysis, the strongest support for the
expected relationship between consumption and violent crime was that between the Inuit per
capita consumption of spirits and the vioPent crime rate, those communities above the median of
the Inuit per capit"aonsumption of spirits measure had a much higher mean rank on the violent
crime rate compared to thecommunities at or below the median of the Inuit per capita
consumption of spirits measure Of all the findings supporting the idea of a direct relationship
between alcohol consumption and violent crime, only that for the Inuit spirits consumption f

approached a probability level @ = . I 1 ) that was almost close enough to have led one to have
felt relatively safe to have rejected the null hypothesis.
Table 35: Mean Rank of 1990-92 RCMP Violent Crime Rate for Communities Above and Below the Median on 1991 Absolute Alcohol Consumption Measures, Wet' Baffin Region Communities.
c*
Communih -le\.el Absolute Alcohol - - - ,
Consumption Measure
Mean Rank of 1990-92 Violent Crime Rate for Communiues on Each
Alcohol Use Measure
Belou Above Mednn Med~an
Exact Slgruficance Level
Total Per Caplta Consumptton of All Be\erages
Non-lnult Per Caplta Consumprlon of All Be\ erages
5
lnutt Per Caplta Consumptlon of All Be\ erages
lnutr Per Caplta Consumptlon of Splnts
lnult Per Caplta Consumptton of Beer
Inult Per Captta Consumptton of \Vine
F~nall!.. as was done above in the esapunation of the effect of the number of drinkers In
the population upon violent crime, median tests were conducted to examine the relationship
betheen each of the alcohol consumption variables and the violent crime variable For each of
the six measures of consumption. communities were put into one of two groups based upon
their being abo~re or below (and equal to) the median value for that measure The communities ,
were also put into one of tuo groups based upon their being above or below (and equal to) the
median violent crime rate for 1990-92 .4 2 X 2 crosstabulation of the groups for each of the
consumption measures with the groups for the violent crime rate measure was then computed
Those crosstabulations were then checked to determine if those communities that were above
the median on the alcohol consumption measures were also the communities that were above the
median on the violent crime rate measure The results of the crosstabulations are pre;ented in
Table 36 as the proportion of the communities that were above the median for the alcohol

consumption variable and also above the median for the violent crime rate variable Only half
(2 out of 4) of the communities above the median for the consumption measure were also above
the median violent crime rate for three of the consumption measures the total per capita ,%% 2 &$ 7
consumption, the Inuit per capita consumption of all beveragesgmd the Inuit per capita beer * -.#
consumption The closest correspondence of measures aboye ihe median is for the Inuit per
capita spirits consumption measure where 3 out of 4 communities that were above the median
value of Inuit per capita spirits consumption were also above the median value of the violent
crime rate Even that relationship, however, cannot be considered to be statistically significant
and should be viewed as having at least a 1 in 5 likelihood (p = 20) of being the result of chance
events
Taken together, the results reported in Table 34 through Table 36 provided little
evidence indicative of a direct relationship between the total volume of alcohol consumption and
the amount of violent crime in a community Even with the use of three different types of
nonparametric analyses no relationship was hpnd between the 1990-92 violent crime rate and #'
the total per.capita consumption of absolute alcohol in 1991 by Inuit and non-Inuit together or
a< groups of their own That lack of a relationship between the total volume of consumption
and the amount of violent crime brings into question the constant proportion hypothesis for the
nine 'wet' Bafin Region communities in 1991 S

% . . <- 4'
Table 36: Proportion of Communities Above the Median Values for the 1990-92 RCMP Violent Crime Rate and the Above the 1991 Absolute Alcohol Consumption Measures, 'Wet' Baffin Region Communities.
Proporuon of Communities Above Communih-level Absolute Alcohol Median Values for Violent Crime
Consumpt~on Measure Rate and Alcohol Use Measure Exact Sigruficance Level
Total Per Capita Consumption of All Beverages
Non-Inuit Per Caplta Consurnptlon of All Be\wages
lnult Per Capita tr Consumption of All Be\.erages
Inuit Per Cap~ta Consumptlon of Splnts
Inwt Per Cap~ta Consurnptlon of Beer
Inwt Per Capm Consurnptlon of \V~ne
2 out of 4
1 out of 4
2 out of 4
3 out of 4
2 out of 4
0 out of 4
However, an interesting trend between the violent crime rate measures and the per capita
consumption measures for each beverage type did arise. In all three analyses the two strongest
outcomes were for ( 1 ) the direct association between the per capita consumption of spirits
( i e . '.hard liquory'\ :nd violent crime and (2) for the inverse associ?tion between the per qapita
consumption of wine and violent crime These results seem to indicate that different types of A.ir ..
rn
alcoholic be\,erages have different associations with violent crime high rates of spirits - ++ + consumption are associated with high rates of violent crime, high rates of wine consumption are ;
associated with low rates of violent crime 0
There are, however, reasons why these results can only be viewed with a great deal of
caution The relationship between the Inuit per capita spirits consumption variable and the
kiolent crime rate is tenuous at best because in all three analyses there was never less than a 1 in
10 probability of the relationship being the result of random chance Even though the
relationship between the Inuit per capita wine consumption variable and the violent crime rate
was statistically significant at thep < .10 in all but the rank-order analysis, it too must be seen as
only being suggestive due to the fact that on the basis of volume of consumption very little wine
was actuallv consumed in 199 1 (see Table 26)

*
MODELS OF DRUNKEN BEHAVIOR AND VIOLENT CRIME
Thus far the two explanations of the alcohol 1 violent crime zelationship looked at in this a
chapter have not proven to be particularly enlightening in terms of explaining why some Baffin fi
Region communities have more violent crime than others. Although there is some evidence that
might possibly support the proposition that communities with the least amount of violent crime
are also the communities which prohibit the importation, possession, and consumption of
alcohol, the relationship between the amount of alcohol consumed in a community and the
amount of violent crime-reported there appears to be more of a hnction of the type of alcoholic
beverage consumed than of the total amount used. It is therefore necessary to look beyond the
amount of alcohol consumed and to consider other factors related to the use of alcohol to
understand why some of the 'wet' communities have more violent crime than others. One such
factor focused upon in this section is the role of the models of drunken behavior that have been
provided to the Inuit of the Bafin Region The amount of violent crime in some 'wet'
communities ivhose models of drunken behavior have been especially poor is compared with the
amount of Liolent crime in the other 'wet' communities whose models have been somewhat
better Specifically. this section will determine if communities with a large transient non-Inuit L
workforce whose purpose in the arctic has no connection to the Inuit population, a group of
indi\.iduals thought to be particularly bad models of drinking behavior, have had more violent
crime than those without such a population of non-Inuit.
The idea that different models of drinlung behavior could account for variations in the
amount of violent crime in Baffin Region communities rests upon the presumption that an
individual's behavior when intoxicated is not governed by his or her physiology but is instead
determined by social norms of how one can and should act when drunk. This presumption, in
turn, is expressed best in the work of MacAndrew and Edgerton ( I 969) who showed that
"drunken comportment" varies widely across cultures and that in some societies it is unheard of
for people to become violent when in t~x ica ted .~~ The diversity of drunken behavior, they
argued. is the result of culturally specific socialization which imparts upon individuals the
j2 The comparatne cross-cultural e w n a t t o n of alcohol consumpon dates back to the 1940s ( B w e l . 1940. Honon. 1943) w h ~ l e spec~fic Interest In hou people learn to behave whle intoucated cari be traced to the earl! 1960s (Lemen. 1964. Slmmons. 1960)

socially known ways of acting when intoxicated (MacAndrew Br Edgerton, 1969, p. 88) In ' P
short, people act the way they d8kthen they are drunk because of the models of drinking
behavior available to them in their social world
Although the use of alcohol has historically been a part of all but a few cultures across
the globe, it was not until contact with Europeans that the native peoples in what is now Canada
and the US were introduced to the intoxicating beverages (Smith, 1973,'~. 15) 33 Given their
lack of experience in dealingmith alcohol when it was first introduced;"tKe native people looked
to the Europeans for "lessons" about how to act when intoxicated. By most accounts (e.g.,
Bach & Bornstein, 1.98 1 , Winkler, 1966), the models of intoxicated behavior that were provided
to the native people at the time were among the worst possible. '4s Smart points out.
Indian and Inuit drinlung shows many of the characteristics of drinlung found t among 'frontier' men loggers, trappers, oil rig workers, pipeline workers, and
probably early traders, soldiers, sailors, and others with whom Native peoples originally and currently come into contact (1986, p 105).
Rather than being exposed to models of restrained drinlung, native peoples only indication.of
acceptable intoxicated behavior came fiom those who behaved without restraint %hie
intoxicated
Drinking Models of the Baffin Region Inuit
Like the other native peoples of North America, the Baffin Region Inuit were not
exposed to alcoholic beverages until the amval of the Europeans Whaling crews, which
operated off the coast of Bafin Island as early as 1820 (Millward, 1930, p 35), were probably
first Europeans to introduce alcohol to the Inuit of the region (Lyon, 1824 [Cited in Brody,
19771) That early introduction, however, was probably sporadic and touched the lives of only a
few Inuit It was not until the 1960s that the Baffin Region Inuit contact with alcohol became
widespread
The introduction of alcohol to the Inuit came in the same period of time that they were
being moved into permanent communities Prior to then, when the Inuit were on the land. they
j3 Indians from Meslco to South America did produce and consme alcoholic beyerages before contact with Europeans. The onginal slanders of Pol~nesia are the only other main cultural group besides abongqal North Amencans that lunoncall~ d ~ d not use alcohol prior to contact with European colonialists (Lemen. 1961).

had tittle to do with alcohol This point is bluntly made in an interview done with Onille Troy,
the first Crown Attorney in the B&n Region. +
Interviewer A lot of the Mounties'who were up there in the 50s were telling us that there wasn't really a lot to do in those communities, there wasn't a lot of crime anyway
Troy. There wasn't because they all lived on the land and there was no . booze
Even if they would have had the money to import alcohol fiom the south and the time to drink
instead of working to survive on the land, the Inuit would not have been able to purchase
alcohol because until 1960 it was illegal for native people in Canada to do so Like the other
native cultures before them. the Baffin Region Inuit had n'o knowledge of how to deal with
alcohol once they were fully exposed to it. As one Inuk RCMP officer put it, "We [the Inuit]
don't have a liquor experience " One interview respondent pointed out that "their mother and
father never drank." and then she rather rhetorically asked "so who's going to teach them hou to
drink properly9"
Without indigenous examples to teach them how to act when intoxicated, the Inuit
turned to the closest available models, namely the non-Inuit in the region. According to
anthropologists Honigmann and Honigmann (19656). both of whom were doing field work in
Iqaluit at the time u,hen alcohol was first being introduced, the Inuit who were living in town at
that time learned drinking patterns and beliefs that resembled those of their non-Inuit neighbors
These adopted patterns and beliefs were anything but refined The Honigmanns observed that 7
the "people in Frobisher Bay . have not had a chance to obsewe the style of drinlilng that goes
on at the Lord Elgin (a popular hotel in Ottawa) but only the lund that construction workers do"
Not only did they begin to drink like the non-Inuit of the area, but they also reportedly
began to accept non-Inuit ideas about drinlung Even at that early date, the Honigmanns
suggested, the Iqaluit Inuit "share[d] the North American's traumatized, puritanical attitudes
toward alcohol. attitudes that picture drinking as a special category of behavior because it is
fiaught with menace or connotes depraviq" (1965b, p 78) Almost immediately, ody a few . years after the introduction of alcohol, the Inuit began to see its use as being related to violence

d - t
'i
According to the Honigmanns, - "a stereotjpe in Eskimo ideology connects dl in'hh; \kith violent -
agyession People blame it for a murdel that took place in 1963" (1965b, p 79) - - - -
Given the models of drinking the Inuit were first exposed to, the drinkirig ttf construction f
workers and military personnel, it is no-wonder they have come to see alcohol 11-e as "fraught
with menace" or full of "depravity." Research from the US shows that drinking among
construction workers and miIitary personnel tends to be marked by higher dail) ~t.~i~sumption
levels (Hitz, 1973) These transient types of indil iduals are more likely to drir;A rf:tm at any one
sitting, more likely to binge drink, more !ikely to drink for the expressed purposes of
intoxication, and more likely to have prublcms because of drinking (Burt, 1982, Parker & I
HarFord, 1992) Tee RCMP officers H hich sened in the outlying com~nunitirs in the 1960s 2
reported problems with the construction ~torkers and their drinking. For instatice, w e RClMP Ir
officer's story of the "two white fettows \\ho came into town on a survey for t t t t . , i i r p r t . and
they got a young girl all drunked up" is typical. Another RCMP oficer ~ h o x in ihe Rafin
Region in the early 1970s characterized ma1ty"of the construction and r n ~ ; ! ~ t t . n n t ; ~ c ii urkers in
the region at that time in a not so positive light: 8
There were a lot of "white trash," I guess would be the best tenn for it, that came in, and they brought alcohol. They brou2ht less than acceptable standards to these people and introduced.&cm. Unfortunately, that happens all the t ime when opening up an area like that If I could have, 1 would have kept those kind of white people down south where they belong.
Some of the military personnel who have served in the region could probably il,,irazteri/ed in
a similar light. The shenanigans of two ~lmerican servicemen stationed at 111;. Lril;ir.il States Air
Force Strategic Air Command air base at Iqaluit in the early 1960s, as d e ~ c r i h 1' i:: a Iclter from T -
the head government administrator in the eastern nixtic to the commander of t h ~ S 4C base,34 5
are characteristic of the type of model pro~ided to the Bafin Region Inuit nht.:? alcohol was *
first iniroduced:
[djuring February and March, 1961, we had some complaints from the Eskimo residents at Apex Hill about t\\o American servicemen whom we later identified as and .- They said that these men spent a great deal of time at Apex Hill in search of M omen During the early part of %larch the
3J Confidential Letter from J. P. ~t iantc . Rcgiorl;il Adrrlinizlrator. Frobisher Bay. KN'T to I t Coi R. L. Weniger. Commanding Officer. X&th .Air B a x Squadron (SAC), .April 21. 1961. Olll,tilrk C i :,om NWT Arcluves. Yellowknife.

~ehabilhation CentrGJ Superintendent had a report that these two men had gone * to house No 60, which is the dormitory for single girls residing in the
Rehabilitation Centre. They had apparently b r 0 u . t along'a considerable amount of beer and two of the girls obtained some of this beer and became quite intoxicated It is against the rules of the Rehabilitation Centre for the single persons to consume alcoholic beverages in their quarters. It is also against the rules of the Centre for the single girls to have me; visiting them at night.. . . It
I has been reported that these two men have entered several of the Eskimo residences and asked muse the telephone., It is believed that they used this as an excuse to get into the houses to look for women. We haye had one report that
entered a private dwelling and asked if there were any women to be obtained.
The drinking, and more importantly, the intoxicated behavior, of the construction workers and
the military personnel that served in the Baffin Region during the first decade-and-a-half of local
alcohol availability provided everything except a model of rectitude and refinement to-the
region's Inuit population.
Violent Crime in Transient and Non-Transient Communities
Over the years the models of non-Inuit drinking behavior found in Baffin Region
communities have diverged according to the type of non-Inuit population present in the
community Today there are three main types of non-Inuit present in Baffin Region *
communities First, there are the non-Inuit that have a service commitment to the Inuit
population This group of non-Inuit includes civil servants (such as nurses, hamlet
administrators, teachers, and police officers), store managers, and members of the clergy A
second group of non-Inuit residing in Baffin Region communities are the seasonal construction
workers. These construction wdrkers' contact with the local Inuit population is usually limited
to instances where Inuit and non-Inuit are on the job together. The first two types of non-Inuit
are found in all communities across the region. The third group of non-Inuit present in the
Baffin Region, a type found only in certain communities, is composed of transient individuals
whose purpose in the arctic is wholly unrelated to'the provision of services to the Inuit
population and whose local residence is separate from that of the Inuit population. Employees
, 35 Besides bang an institution which taught disabled Inuit hunters the skills necessary for living in permanent settlements, the Rehabilitation Centre also held "promiscuous guls whom the court recommended to the Centre" (Honigmann & Homgmann. 1965, p 74). f

of the Distant Early Waniing (DEW Line) radar sites (which are located adjacent to two Baffin * ' Region communities) are examples of these transient employees Their only purpose in the
arctic is the year-round maintenance and operation of the DEW Line sites; they eat, sleep, work,
and socialize among themselves and apart from the Inuit community they are located adjacent
In general, the Inuit of the Baffin Region have the most contact with the first group of
non-Inuit (i e . the civil senants, store managers, clergy). During their daily lives the Inuit have
little contact with the construction workers or with those individuals that are a part of the
transient population That lack of contact is probably for the best as the drunken behavior of the
construction workers and thetransient workers has not always been the best.
It is likely that all of the communities have, at one time or another, had some problems
with the seasonal constructim workers in their midst. Since the workers' stays in the C :
communities are usually 'short term and because they generally have a job to do, those problems
have tended to be isolated and to have come and gone with the summer construction season .
Howe~~er, the problems that have come wi th transient workers' drinhng have been present
through& the ewre year and, despite those workers' being housed and employed apart from
the Inuit. the piobiems probably have occurred much more frequently Gwen that the . .I
communities with the year-round transient non-Inuit population are continuously exposid to the '*
worst models of intoxicated behavior, it is expected that they should also have more criminal
behavior compared to communities without the year round non-Inuit transient population
The idea that the transie@tecommunities (i e , the communities with year-round transient
non-Inuit populations), ha\,e 6 ad t h t ' worst models of drinking was shared by some of the "
individuals inteniewed for the-Baffin'Region Crime and Justice Study. In fact. at least pan of
the credit for the idea that the m ~ u i e r ~ t communities might be the ones which were exposed to
the worst -of the models of drunken behavior must be given to the longtime resident and
non-Inuit proprietor of a locai hotel in Resolute Bay. In an interview that hotel proprietor' . *
sensitized us to the notionmat it is the transiency of non-Inuit individuals which has led them to
j6 These workers are transient In the sense that the! work for b o or three weeks sua~ght and then ha\e a week or two aua! from work outs~de the arcoc As a group the! are present in the effected commumoes on a ear-round bas~s
+ :-

be poor models of drunken behavior and that some communities have had large groups of the
transient individuals.
Resolute Bay is like some other transient communities like Iqaluit or Hall Beach where two groups of people live. Some call it home. Like the Inuit and myself, we call this Resolute Bay our home. But the people at' the airport who are here for a certain time, their home is somewhere else; their f&ly. wife, chldren, they are somewhere dse. So they don't have the same values for this community. There are some good people there too but some not so good people. So I think occasionally there are some contacts made by the fiom there for here that are not necessarily on good terms
Others intemiewed for the Baffin ~ e g i o n Crime and Justice Study were of the opinion that some
of the transient workers were drawn to the arctic because of troubles they had in the south For
= instance. one RCMP officer who served, in a DEW Line community at the beginning of this
decade observed that "a lot of those people [DEW Line workers] are escaping from their
problems You hear rumors of what kind of people'the DEW Line is made ip of, so you're not
really hitting the upper echelon of society A lot of those guys don't have any morals or
whatever. and they get away from home and get worse." It is important to note, however. that
for the most pan. the transient workers such as those working on the DEW Line have not
contributed to the \.iolent crime rates in those communities by committing violent offences
thernsel\.es The intemiew data and records'in the RCMP operational files indicate that the +
trouble the transient workers have found themselves in has generally been related to the *
possession of marijuana and cocaine
As with the construction workers throughout the region and the airmen in Iqaluit,
contact between the local Inuit and non-Inuit populations in transient communities oftentimes
occurred in conjunction with the consumption of alcohol. According to one RCMP officer who
semed in one DEW Line community in the l early 1980s, the transient workers there "did not
have a lot of contact back and forth with the Native people It seemed that any contact they had
was liquor related " The same RCMP officer noted that "a lot of alcohol was used up there [at
the DEW Line site] "
Three of the twelve communities being looked at in this study can be considered to be
"transient communities " Hall Beach and Broughton Island (the two DEW line site communities
in the region) and Resolute Bay (the air travel hub for high arctic petroleum and mineral

exploration) each have year-round populations of non-Inuit workers that are generally in and out
of the community on a bi-weekly or monthly basis Of all the communities in the Baftin Region,
these three communities with their transient populat~ons have had, on a permanent basis since
they were settled,37 poor models of how one should act when intoxicated. Given those poor
models, it was expected that the transient communities would have more violent crime than the
non-transient communities
Comparisons of the transient and non-transient communities' 1990- 1992 mean violent #
crime rates and 199 1 measures of alcohol use were conducted using the nonparametrical
"rank-sum" test Those comparisons provided indications of the differences in violent crime
rates and the differences in alcohol use between the two types of communities. As is seen in
Table 37, the results of those comparisons were supportive of the modeling explanation of
alcohol related violent crime The comparison made in the first row of Table 33 shows that the '
communities that had the poorest models of drunken behavior, the transient communities, also
had the most violent crime The exact test of statistical significance conducted for that
comparison indicates that there was a less than 1 in 10 chance ( p = 095) that the differences
between the transient and non-transient communities' mean ranks of violent crime rates were the
. result of random chance
While there b a s a significant difference in the amount of violent crime, there was no
appreciable difference in the number of drinkers or the relative amounts of alcohol consumed in
transient and non-transient communities As s'een in middle six rows of Table 37, the percentage
of current drinkers and the different amounts of per capita alcohol consumption were not all that
different for the two types of communities The only other difference large enough to be
considered to be sratisticall'~ significant @ = ,048) -that between the mean ranks of Inuit per
capita consumption of wine - could hardly be considered to be theoret~cally sigruficant because
veq little wine was consumed in any of the communities (see Table 25. Table 26, and Table 27
on pages 99 through 102)
7- - Probabl! for the purposes of ache\ing econom! of scale. d l three of these communities were settled adjacent to the pre-erlstlng non-Inuit outposts (Outcrop Publishmg. 1990). In other words. when the ton-Inuit were alrea* there rn these transient communities when Inuit were settled. I,

Table 37: Comparison of Transient Communities and Non-Transient Communities on Violent Crime and Alcohol Consumption, 1991.
--.
Mean Rank of Cornmunie Type \
Cornm~nit.~ -level Measure Non-Transient Transient Exact Sigruficance Level . . . . . . . . . . . . . . . . . . . . . . . . . . . . . . . . . . . . . . . . . . . . . . . . . . . . . . . . . . . . . . . . . . . . . . . . . . . . . . . . . . . . . . . . . . . . . . . . . . . . . . . . . . . . . . . . . . . . . . . . . . . . . . . . . . . . . . . . . . . . . . . . . . .. . . . . . . . . . . . . . . . . . . . . . . . . . . . . . . . . . . . . . . . . . . . . . . . . . . . . . . . . . . . . . . . . . . . . . . . . . . . . . . . . . . . .
1990-92 Average RCMP Violent Crime Rate 3.83 7.33 ,095
Percentage of Inuit Populat~on
.& *iC-
that are Current Dnnkers 'if
Total Per Capita Absolute Alcohol Consumpr~on of All Be\.erages
Non-Inuit Per Capita Absolute Alcohol Consumption of All Beverages 5. 17 4.67
Inuit Per Capita Absolute Alcohol Consumprlon of All Beverages 5.00 5 00
Inut Per Caplta Absolute Alcohol Consumptton of Splnts 4 83 5 7 3 38 1
Inu~t Per Caplta Absolute Alcohol Consumption of Beer 5 6 7 * 3 67 905
Inut Per Caplta Absolute Alcohol Consumprlon of W~nc 6.33 2.33
Although the mean ranking of violent crime rates in the transient communities was
significantly higher than that of the non-transient communities in 1991, a comparison of the &?
violent crime rate rankings over an 8 year period displayed in Figure 12 was only partially
supportive of the expected association between the amount of violent crime in a community and
their exposure to poor models of drunken behavior. In Table 38 the mean violent crime rate
ranks of the transient and non-transient communities were compared for the years 1985 through
1992 using the nonparametric "rank-sum" test. The mean violent crime rate rank for the
transient communities was lugher than that of . , the non-transient communities in each of the eight *
years analyzed Those differences between the two community types were large enough &be
considered to be statistically significant at p < .10 in 3 of the 8 years examined

Figure 12: Rank of RCMP Violent Crime Rates, Transient and Non-Transient 'Wet' Saffin Region Communities, 1985 to 1992.
- - - - Non-Translent -- -- - . - -. .
1985 1985 1987 1988 1989 1990 1991 1992 Year
Table 38: Mean Rank of RCMP Violent Crime Rates (3 Year Running Average Rate) for Transient Communities and Non-Transient Communities, Baffin Region, NWT, 1985 to 1992.
Mean Rank of Comrnunih T>pe
a Non-Transienl Transient Esact Sigmfkance Level . . . ... . ... .. ... . . . ....... .... .... ... . . . ...- ............................................. .....
4 198s 4 17 6.67 ,263
1986 4 00 7.00 ,167
The results of the analyses conducted in this section do indeed provide some support for
hypotheses derived from the modeling approach to explaining alcohol related violent crime in
native populations As was expected, the cross-sectional analysis conducted for the year 1991
clearly indicates that the Baffin Region communities with a transient population had an average

\
1 \, '.
\
violent crime rate that was significantly higher than that of non-transient
fact that the amounts of afcohol'consumed in both types of communities f
communities despite the
were essentially the
same Furthermore, the average violenm crime rate for the transient communities was higher than
that of the non-transient communities in each of the eight years examined although the
differences could be considered statistically significant in only three of those years Although
there is a moderate level of support for the idea that, on average, the communities that have had
the worst models of drunken behavior have also had the host violent crime, the mechanism by
whch those models of drunken behavior are translated into violent crime remains to be
determined
SUMMARY
This chapter has considered three facets of the relationship between violent crime and
alcohol use The effects of community ordinances prohibiting the possession of alcohol upon
violent crime were first examined Only recently is there support for the expectation that 'dry'
communities should have less violent crime than 'wet' communities. It was not until 1987 that
the a\,erage violent crime rate for the 'dry' communities was actually less than that of 'wet'
communities and only in a few of those years did the differences in violent crime rates between
'wet' and - d n ' communities become large enough for them to be statistically significant. These
results make it difficult to unreservedly accept the distribution of consumption hypothesis that
restrictions on the distribution of alcohol will be associated with reduced amounts of violent iarr
crime
The association between cornrnunity-level patterns of alcohol consumption and violent
crime was considered nest Gven the results of correlational analyses conducted in that section, a
it is possible to conclude that there was no association between the total per capita cons"mption
of alcoholic beverages and the amount of violent crime in 'wet' Baffin Region communities in
199 1 For that one year, the amount of violent crime committed in a community was not a
result of the total amount of alcohol that was consumed That lack of an association leads one
to reject the constant proportion hypothesis for the year and communities examined
In the final section of this chapter the potential impact of different models of drunken
behavior upon violent crime in Baffin Region communities was examined The amount of violent

crime in those communities that may have had particularly poor models of drunken behavior was
found to be consistently higher than that found in communities which may have had somewhat . lesFpoor models of drunken behavior Of the three hypotheses linking factors surrounding the
use of alcohol to violent crime, this final hypothesis concerning the effects of models of drunken
behavior upon violent crime received the most support.

CHAPTER 7: DISCUSSION
This study set out to come to an understanding of the community characteristics
associated with differences in community-level violent crime rates in the Inuit communities of
the Baffin Region, NWT As a jurisdiction, the Baffin Regon is uniquely suited for the
- consideration of variations in inter-community violent crime rates among native peoples because
of its geographic isolation, the fact that the communities are populated by a single native cultural
group, and because there are multiple communities Each of these factors are significant in
allowing a comparison of communities in terms of violent crime and characteristics thought to
be associated with violent crime, while minimizing the impact of dynamics such as
inter-community migration by violent offenders and the influence of dissimilar native cultures
Together, these features made this study unlike any other which has been done
Unique Features of the Study
The 13 communities of the Baffin Region are isolated and widely scattered across an
area covering about &e-ninth of the entire area of Canada. Travel in and out of the region and
between the communities is difficult and costly, because access is only by air. or for a few
months during the summer, by sea. Although isolation in the arctic, and the great.ciistances
between communities, are important in terms of factors such as the cost of living, their main
importance for this study is that they helped to rule out the influence of individuals fiom one
communitv upon violent crime in another community. With the exception of violent offences d
committed in Iqaluit. which serves as magnet of social negativity for the eastern arctic, offenders
almost never commit violent crimes outside their community of residence
Another aspect of the Baffin Region which makes it an ideal locale for the examination
of inter-community variations in violent crime, and adds to the uniqueness of the present study,
is the fact that all communities in the region are primarily populated by a single native cultural *
group This makes it feasible to rule out inter-cultural differences when attempting to
understand variation in violent crime rates between communities. Not having to account for the
effects of different cultures allowed for the examination of other possible community
characteristics that might be associated with violent crime

The final notable aspect of the Baffin Regon is that it is an entire region with multiple R
communities that were included in the study Rather than just considering violent crime in a
single community, the presence or1 2 communities allowed for the examination of community
characteristics thought to be associated with violent crime within a comparative framework
Not only was this study able to address the degree to which community characteristics thought
to be associated with violent crime in onecommunity corresponded with the different violent
crime rates in the other communities, it was also able to show that some communities have a lot
less violence than others The ability to compare communities is an advantage found in this
study that is lacking in the largely ethnographic examinations of violent crime within a single '1
community For instance, Igloolik, the communi&that Rasing (1992) studied, does not seem
quite as violent when compared with communities of similar size
The research design used in this study provides one of the first instances in which the
concept of colonization has been empirically'operationalized utilizing data gathered in
indigenous communities It also represents one of the only empirical studies which has - examined the role of alcohol, as operationalized on three dimensions across multiple
communities, as a determinant of violent crime The multiple sources of data used to consider
those concepts. especially the alcohol consumption data and the RCMP operational file reports. *
allowed for the consideration of community characteristics generally only looked at when
dealing with higher levels of aggregation Very few studiks have been able to bring these types
of data to bear on a study of violent crime rates across
group
The Focus on Violent Crime
There are good reasons for focusing on violent
multiple c~mmunities~of the same native
crime and for why it is desirable to be '
able to compare the rates of violent crime across communities A justification for why violent
crime. rather than property crime, was the concentration of this study was given in Chapter 2
There it was argued that it was more important to look at violent crimes rather than property
crimes, becake the rates of violent crime in the Baffin Region are especially acute, because most
property crimes committed in the region arelof a trivial nature, and because violent crime, was
the major community concern While those are good reasons for choosing to consider violent

crimes rather than propeny crimes, they do not completely get to the heart of why it is
important, in and of itself to look at violent crime at the community level
Knowing how much violent crime there is in a community is a measure of how well
people are able to live together As an aggregate index of "quality of life," the amount of violent
crime in a community can be seen as an indicator of community residents' ability to live among
one another, if not in peace and harmony, then at least in safety and security If a community
has high levels of violent crime, one can be fairly certain that there is a great degree of
dysfimction in at least some aspects of the community In essence, the amount of violent crime
in a community provides an igdication of the ability of families and communities to protect
individuals from harm, and indicates the degree to which informal social controls witfun the
c o m d h e family. and the individual serve to keep people from beating their wives. lulling
their ex-lovers. and assaultin;: neighbors
While it IS important to assess the effectiveness of the informal social controls within any
population group, their viabiiity among the Inuit of the eastern arctic is of particular interest due
to the transformation of the Inuit from a semi-nomadic hunting and gathering people, to one
based in permanent settlements and maintained largely through the support of the welfare state
Over centuries in the arctic prior to settlement in permanent communities, the Inuit developed a 3 .
set of non-confrontational informal social controls, based primarily upon the avoidance of
others' detrimental behavior, that were especially well suited for group survival in the harsh
arctic environment However, as Ross ( 1992) has shown, those non-confrontational ways of
dealing with anti-social behavior have not been successfbl in the permanent settlements the Inuit
and other native Canadians inhabit today. The examination of violent crime among the Inuit
allows for an understanding of the degree to which they have moved beyond the
non-confrontational hunter and gatherer social controls to a set of social controls that are viable
in the community context In short. the amount of violent crime in a community is of particular
interest because it provides one way to understand the degree to which the Inuit have been able
to develop a culture that is conducive to living in permanent settlements h

Theoretical Perspective and Overview of Findings
Based on an extensive literature review, "colonization" and alcohol use are the two
constructs that have been used most often to explain high rates of violent crime among native
peoples Both perspectives were considered in this study in an attempt to arrive at an
understanding of community characteristics that might have been associated with violent crime
Each of those constructs was operationalized at the community-level ir! different ways, leading
to hypotheses about the possible associations that might have existed between alcohol and
violent crime and between colonization and violent crime.
Colonization
The process of colonization and its consequences for native peoples, in Canada and - througHout the world, is perhaps the most widely used concept to explain the plight of
indigenous and Aboriginal peoples Research scholars and native peoples themselves have ,>. ?'
argued that, through contact with non-n'atiye .-, + : - setffqrs and governments, the cultural . * - * .
underpinnings of indigenous society were destroyed. This produced a number of outcomes.
including sickness, disease, the loss of language, the loss of political autonomy and control, and
loss of traditional land base and traditional lifestyle activities In the published literature, the
process of colonization is said to result in negative outcomes marginal native communities
afflicted by poverty, high rates of crime and disorder (including alcohol and drug abuse and
suicide) This collective trauma (as identified by Kai T. Erikson in his preface to the book '4
Poison Srror~ger Than Lolle) is penasive, generational, arid reaches throughout the community
to families and individuals
Three different factors said to be the result of the process of colonization were
considered. First, the relationship between socio-economic underdevelopment and violent crime
was considered Second, the possible association between community relocation and violent
P b crime was explored Finally, the association between the effects of changes brought to Baffin
. Region communities through external market forces and violent crime were observed. While the
first factor has previously been considered in the research literature on violence in native 4
communities, the examination of the other two factors can be seen as an expansion of the
colonization 1 violent crime literature, because no study has considered them before.

The %st set of hypotheses linlung aspects of colonization 8nd violent crime involved the
potential associations between indices of socio-economic underdevelopment, which is said to be
one result of the colonization process, and violent crime A positive association between
socio-economic underdevelopment and violent crime was expected due to the supposed
detrimental effects of socio-economic underdevelopment identified in the research literature In
other words, it was expected that those communities that were the most socio-economically
underdeveloped should have been the communities with the most violent crime. However, the
results of the analysis employing a pooled-time series multiple regression model using measures
of employment. income, education, and housing density to assess the possible association
between socio-economic underdevelopment and violent crime were, if anything, contrary to
expectations The results of the analysis suggested that communities that were more
socio-economically underdeveloped had less violent crime Given that finding it appears that, at
least for the years 198 1 986, and 1991 in the 12 Baffin Region communities examined, there
was little or no connection between colonization as mediated by socio~economic
underdevelopment and violent crime
A second hypothesis considered the possible connection between a community's status
as a relocated community and its violent crime rate Given the trauma said to have resulted from
the relocation of native communities elsewhere in the north, it was expected that those L
communities that had been relocated would have had the most violent crime Nonparametric
statistical comparisons of violent crime rates in relocated and non-relocated communities
prokided some support for that expectation. Although somewhat lower in a few of the years
examined. more often than not the relocated communities had,violent crime rates that were
significantly higher than those of the non-relocated communities. To the extent that the effects
of relocations that occurred in the late 1950s were still being felt in the 1980s and 1990s, there is
support for the hypothesis that community relocation is one aspect of the colonization process d
that varied across communities and that might be associated with inter-community variations in
violent crime rates
The final hypothesis pertaining to the colonization perspective considered the association '
between the possible impact of external market forces at the-community-level and violent crime.
In the case of the Baffin Region, the "shock" created by external market forces resultring fiom

the European Economic Community's ban on the importation of seal skins, which essentially
broaht the demise of the seal skiii trade, was examined Given the many negative changes
brought by the end of the seal skin trade, it was expected that the violent crime rate would be
higher in those communities most affected Using nonparametric statistical techniques, it was
possible to examine the association between income losses during the decline of the seal skin
trade and changes in the amount of violent crime The results of those analyses provided no
support'for the hypothesis At least for the years-considered in the analysis, thereappeared to be
no connection between colonization as mediated by the external market forces that brought the
decline of the seal skin trade in the Inuit communities of the Baffin Region afid violent crime
Alcohol Use
The second factor examined in this study in connection with violent crime is alcohol use
There is an extensive literature which posits that alcohol is a major precipitating factor in violent
crime among native peoples In fact, alcohol is mentioned throughout the international literature
as the one factor which is directly related to crime and disorder, whether the subject population
be Australian Aborigines, American Indians, Alaska Natives, or Canadian Inuit and Native
Indians By emploving alcohol use as a key explanatory variable, it was possible to test the
assumed relationships between alcohol uselabuse. and crime
In addition to colonization, alcohol is the explanatory factor most often used in attempts
to understand violent crime among native peoples. For purposes of this study, alcohol use was,
operationalized in three ways 1) whether the community is question was "wet" or "dry", 2)
levels of consumption in the communities, and 3) the particular model -transient or non-
transient - of drinking behavior that Inuit in the communities were exposed to
Prior to investigating those possible relationships, an attempt was made to determine the
actual prevalence of alcohol use among the Inuit of the Baffin Region It was determined that, in
comparison to native and non-native people in other regons, the ~affininuit were less likely to
consume alcohol, but to the extent that they did so, they most often drank high alcohol content
spirits rather than other forms of lower alcohol content beverages i

It was also notable, that in spite of lower than "typical" consumption levels, there was an
almost ubiquitous belief that alcohol was implicated in most of the violent crime in the region
And indeed, examination of police records corroborated that view.
Comparisons were made over a nine year period of violent crime rates in 'wet' and 'dry'
communities. 'Dry' communities had higher crime rates for the first few years in the series and t
then lower crime rates for the last five years examined. However, in only three of those five
years did'the results of the nonparametric analysis lend definitive support to the idea that the
prohibition of alcohol in a community made it less prone to violence Otherwise, the results did
not provide a strong basis to argue either for or against the merits of local alcohol prohibitions
Consideration next turned to the issue of the amount of alcohol consumed on a per
capita basis within the "wet" communities Various nonparametric analyses were undertaken, "$(
but none showed strong relationships between per capita alcohol consumption and violence
Some associations between crime rates and types'of alcohol consumed were suggested, but
these did not appear to be consequential
The final hypothesis derived from the literature, focused on potential community
exposure to models of inappropriate drinking behavior as a result of the historical association of
the community with "outside" influences in the form of transient elements. As was anticipated,
Baffin Region communities with a transient population had an average violent crime rate that
was notably higher than that of non-transient communities, despite the fact that the amount of /
/<
alcohol consumed in both types of communities was essentially the same. While this provides
modest support for the idea that communities that have had poorer models of drunken behauor
have also had the most violent crime. the process whereby suih exposure results in increased
biolent crime is yet to be determined
Conceptual~heoretlcal Implications of the Study
A number of the findings of the study suggest a need to reconsider some of the
constructs typically used when trying to understand violent crime in native communities

e
"Colonization"
In its present form in the published literature, the ci6cept of colonization is vague and
ill-defined Although i t has use as a historical tool, the resuits of this study suggest that it has -:, -- ,a
little explanatory power in considering the dynamics of contemporary Inuit communities
With the possible exception of the association between cohnu,nity relocation and vklent
crime, the factors said to result from the process of colonization.appear not to tell us much
about why some Baffin Region communities have more violent crime than others In terms of
violent crime as an indicator of the "quality of life" in the Baffin Regon, those factors appear to
not make a difference in the ability of communities to keep their members safe From violence
The findings of this study suggest that the things that allow individuals From being the victim of
a violent crime have nothing to do with how much income there is, how well educated people
are, how many people have jobs, or how crowded homes are Given what was found for the
Baffin Region in the 1980s and early 1990s, socio-economic underdevelopment may be a result
of the colonization process, but it does not appear to have anything to do with whether people
are able to live together without assaulting and raping one another.
The inabilitv of the measures for the factors said to be the result of colonization to
account for differences in violent crime between the Inuit communities of the Baffin Region
raises an issue surrounding the use of indicators of constructs such as socio-economic
underdevelopment that make sense from a non-native point of view but might have no meaning
within the native cultural conte;ut A good example involves the question of the possible X 1
i relationshp that might kist between crowded housing and rneas"res of violent crime From a i
b n - n a t i v e . p o i n t of view it would probably seem logical to think that the high housing densities
that have resulted from%the tremendous population growth in the Baffin Region could have
' , ' possibly. through the stresses <aid to result fro,m crowding, have played a criminogenic role in
violent crir;le ~oweve'r. some of the infohation gathered in the face-to-face interviews ) . ' ~ - . . \
anecdotally suggested that c6wding within a h ~ m e might not'be so'stressfbl for the h i t and 2 .B '
that the houses ochpied by the Inuit in permanent settlementsare not any more'crpwded than
the cramped quarteis they lived in while on the land. What might seem stressfd and a source of 5 '
violent behavior among non-Inuit rmght be seen to have, from a traditional Inuit standpoint:noA
influence on violent behavior among the Inuit +
. a _ - y - - . 139

The difficulties surrounding the operationalization of the concept of colonization call into
question the manner in which it has an effect upon native peoples. The process of colonization,
if it does impact life in contemporary Inuit communities, is not a linear process, but one in which .. there are undoubtedly a number of intervening variables. And while the operationalization is
difficult, scholars who attempt to utilize colonizatibn in an explanatory framework should be #
expected to empirically test their constructs and to do so within a comparative context
Alcohol Use
As was the case for the colonizption constructs. the factors traditionally identified in the
literature implicated in the relationship between alcohol use and violence were not shown to be
operative in this study Research which makes claims about the link between presence of
alcohol, amount of alcohol consumed, and associated violence, should utilize variables wtuch r*
have been operationalized at an appropriate level of aggre'gat~on, and again, be examined within
relevant structural contexts
PolicyIProgram Implications
The results presented in Chapter 6 pertaining to the potential impact of the existence of
community alcohol prohibitions upon violent crime might at first seem to support those policies
as a means of hindering violence and of making communities more livable. The figures there
show that the 'dt-3;' communities do have less violent crime than the 'wet' communities. The
problem is. hou.ever, that there was a continual increase in violent crime rates for both the 'wet'
and ' d q ' communities over the years examined Even with alcohol prohibitions, the violent
crime rates in the ' d ~ ' communities almost doubled (an 86 percent increase) over a 10 year .
period .+d while the rates have remained lower than those of the 'wet' communities, the / average violent crime rate f i r the 'dry' com nities remains three to fouitimes higher than the "r national violent crime rate.
b
The continuing increase in violent crime in the 'dry' communities leads to questions of
whether formal, legal prohibitions are the answer to deahhg with the violent crime that follows
the consumption of alcoholic beverages Just because community residents have voted for the
legal prohibition of alcohol does not necessarily mean that they are going to stop using it in the * community Many different measures show that people in prohibited communities continue to

consume alcohol despite its prohibition. The results of the Aboriginal Peoples Survey indicate
" that many people in 'dry' communities still consume alcohol. Respondents to field interviews in
'dry' communities fieely admitted that alcohol use was still quite prevident. As a result the
community by community tally of arrests for alc~hul related violent offences continues to show
that a large part of the violence in 'dry' d o m n i t i e s is still alcohol related
Besides the questionable effect o~comrnunity alcohol prohibitions upon viojent crime.
there is reason to suspect that the restr@tive akohol distribution system might be doing more
harm than good in terms of its effect on violent crime. Due to the fact that alcohol cannot be
purchased in any of the communities, and because there are high minimum-air freight costs from
Iqaluit, drinkers usually purchase hard liquor in large quantities, presumably to achieve
cost-effectiveness Those two factors, combined with traditional values surrounding the
necessity of sharing, leads to "partying" once the liquor amves in the community, and binge
drinking until all the liquor is consumed. Indeed, the RCMP members' numerous tales about the
violence that followed the arrival of "a planeload of booze" coincide with the results of the
analysis conducted in this study, that indicates that hard liquor (rather than beer or wine) is most
closelv associated with violent crime In short. methods other than the restrictive distribution
system or legal prohibition might be found to reduce alcohol related violence in Baffin Region
communities
One thing that is clear, is that those who will attempt to find solutions must remember
that not all of the communities are the same As well as variations in rates of violent crime, the
communjties differ on a number of characteristics related to violent crime, which must be taken
into account in the formation of policies and planning of programs Otherwise, the same
predictible result of increasing rates of violence, and, more importantly, a greatly declining
"qualitv of life" will result
This study attempted to provide insights into the dynamics which result in high rates of
violent crime in some Baffin Region communities It had only limited success in doing so. This
work has. however, cast doubt on the utility of some factors which have traditionally been
assumed to be important contributors to the problem of violence. It has also, hopefully, provided
some guidance for future research in the area, particularly with respect to the operationalization B

of indicators, and the selection of research sites which are structurally appropriate for the testing
of theoretical fonnulations

WORKS CITED
Aberle, D F 1983 Navajo Economic Development. In Ortiz, A. (Ed.) Handbook of North iimerrcan Indrans: Southwest. Washington, DC: Smithsonian Institution, pp. 641-658
Adamyk, M . 1 98 7. Northern Industrialization: Resistance and Change, Unpublished M . A Thesis Ottawa, Ont.. Carleton University.
Anders, G C 1980 Theories of Underdevelopment and the American Indian Journal of &onom~c /ssues, 14, 68 1-70 1
Anderson, A 198 1 Roughnecks & Wildcatters. Toronto, Ont. Macmillan C '
Anderson, E 0 1 97 1. Eskmo Ethnic Identip: A Synthesis of Problems and Approaches. Unpublished M . A Thesis Winnipeg, Man.: University of Manitoba.
Auger. D J , Doob, A N , Auger, R P , and Driben, P 199 1 Crrme attd Control J H 7;hree ,Vishr1m he-Ask1 ll'at~ons Communrtres: An Exploratory Investrgatlon. Thunder Bay, Ont Nishnawbe-Ask] Legal Services Corgoration
Auger. D J , Doob, A N , Auger, R. P.. and Driben, P. 1992. Crime and Control in Three Nishnawbe-Aski Nation Coinmunities: An Exploratory Investigation. Canadian Journal qf C'riminoloffr~, 34, . 3 1 7-338.
,4vksentquk. '4 V . Nikitin, Y P , Kurilovich, S A , Segal, B , D u e , L K , Astakhova, T I . Khramtsova, L .4 , and Voevoda, M I 1994 Drinlung and Genetic Factors Among Russians and Chukotka Natives in Siberia Drugs & Socre~, 8(2), 3-48
Bach. P J and Bornstein, P H 198 1 . A Social Learning Rationale and Suggestions for Behavioral Treatment with American Indian Alcohol Abusers. Add~ctive Behaviors, 6. 75-8 1
Bachman, R 1 992 Druth arld I Iolenct. on the Reservation: Homicide, Farnib, I i'olence and S~rrcrdi. rtr America,~ Indim Populations. Westport, CT: Auburn House.
Baunach, P J. 1985 Bureau of Justice Statistics Bulletin: Jail Inmates 1983 ,~ Washington, DC - * . US Bureau of Justice Statistics.
Bayley. J. L'. (Chair) 1985. Task Force on Spousal Assault. Yellowknife, NWT: Government of the Northwest Temtories -
Beck, .4 J 199 1 . Burruu of Justice Statistics Special Report: Profile of Jail Inmates, 1989. Washington. DC- US Bureau of Justice Statistics.
Beck. -4 J., Kline, S A . and Greenfeld. L. A. 1988. Bureau of Justice Statistics Special Report: Sunq. of Youth in Custocj: 1987. Washington, DC: US Bureau of Justice Statistics.
Bell. J 1993 Royal Commission Exiles Inquiry Unfair, Says Bureaucrat Who Planned the Move. ,Vunarsiaq ATews, 21 ( 1 9 - June 4), pp. 1, 2, .9.
Berger. T R 199 1 A Long and Terrrble Shado~s Vanckver, BC Douglas and McIntyre d '?.

Berry, W. D. and Feldman, Stanley. 1 985. Multiple Regression in Practice. Newbury Park, CA: Sage Publications.
Brody, H. 1 977 Alcohok Change, and the Industrial Frontier. Etudes Inuit Studies, I ( 3 , 3 1-46,
Brokensha, D. and Scudder, T. 1968. Resettlement. In Rubin, N. and Warren, W. M. (eds.) Dams in Africa: An InterTDisciplinarv Study of Man-Made Lakes in Africa. London, 2;.
England: Frank Cass & C o p p 20-62. . .- ..". ? *
I
Bunzel, R 1940 The Role of Alcoholism in Two Central American Cultures. Psychian): 3, " . - A r. - e
36 1-387.
Burt, M R 1982. Prevalence and Consequences of Alcohol Use Among US Military Persomel, 1980. Journal of Studies on Alcohol, 33, 1097- 1 107.
Canadian Centre for Justice Statistics. 1978- 1993. Final Crime Statistics, 1977-1 99,'. (Annual Report) Ottawa, Ont. : Statistics Canada.
g Caswell, S. 1989. Alcohol-Related Casualties in Oceania. In Giesbrecht, N., Gonzilez, R.,
Grant, M, Osterberg, E . Room, R., Rootman. I., and Towie, L (eds.). Drinking and ('a-sualtres: Accidents, Poisonings arui Z,'iolence in an International Perspective . London, England. Tavistock. pp. 1 12- 129.
Causey, R A. 199 1 Justice on Trial: Report of the Task Force on the Criminal Justice System unJ rrs Impuc; on the Indian andMetis People pf Alberta. Edmonton, Alta. Attorney General of Alberta.
Central Intelligence Agency, 1996 The World Factbook, 1995 Hypertext Document (http lluuw odci gov/cia~publications/95fact/index html)
Coat es. K S 1 98 5 Canada's f olorlles: A History of the Yukon and Northwest Tern torres Toronto, Ont James Lorimer and Company
Coates. K S and Morrison. W R 1988 Lund of the Mldnght Sun: A History of the Yukorr -f
Edmonton, .4lta Hertig
Coates. K and Powell. J 1989 The Modern ?vrorth - People, Polrtrcs and the Rejectron qf ('oloir~alr.srn Toronto. Ont James Lorimer and Company
Cochran, W G 1954. Some Methods for Strengthening the Common Chi-square Tests Biometrrcs, 10, 4 17-45 1 .
Condon. R G. 1987. Inuit Youth: Growth and Change in the Canadian Arctrc. New Brunswick, NJ: Rutgers University Press
Conover, W J and Iman. R L 198 1 Nonparametrrc Statutrcs. Short Course Presented at the 198 1 Annual Meeting of the American Statistical Association, August 8-9, 198 1, Detroit, h4ichgan
Cookson, H. M. 1992. Alcohol Use and Offence Type in Young Offenders. British Journal of Crrminoloa*, 32, 3 52-360.
Crowe. K J. 1974. A History of the Origirul Peoples ofNorthem Canada. Montreal, Que.. .
Arctic Institute of North America, McGill-Queen's University Press.

Curley, R. T. 1967. Drinking Patterns of the Mescalero Apache. Quarterly Jountal ofstudies on Alcohbl. 28,116- 13 1
Deloria, V. Jr , and Lytle, C . M. 1983. American Indians, American Justice. Austin, TX: University of Texas Press I
Dickiqson Gibbons, Jean. 1993. Nonparametric Statistics: An Introduction. Newbury Park, CA: Sage Publications
Driben, P. and Trudeau, R. S. 1983. m e n Freedom is Lost: The Dark Side of the Relationship Between Government attd the Fort Hope Band. Toronto, Ont.: University of Toronto Press.
Dunbar-Ortiz, R. 1979. Sources of Underdevelopment. In Dunbar-Ortiz, R., (ed.) Economic De\~elopment ~n Amencan hdian Reservations. Albuquerque, NM: Native American Studies, University of New Mexico. pp. 6 1-75. .-
Fenna, D. , Mix, L , Schaefer, O., and Gilbert, J . A. 197 1 . Ethanol metabolism in various racial groups. (hnadiun Medical Association Journal, 105, 472-475.
~inkle; H W 1 976. Inuit and the Adninistration of Criminal Justice in the Northwest ir'errirorlrs: The Case of Frobisher Bay. Ottawa, Ont.: Indian and Northern Wairs
Fisher, A. D 1 987. Alcoholism and race: The Misapplication of Both Concepts to North .American Indians Canadian Reiiew of Sociology and Anthropology, 24, 8 1 -98
Fleras, A and J L Elliott 1992 7he Nat~ons W~thin Toronto, Ont: Oxford University Press
"G" Division, RCMP 1982- 1 994 Operational Statisrics Reporting System Detailed Crime Rrporr, 1981-1993. (Annual Report) Yellowknife, NWT: "G" Division, RCMP, Infomatics Section.
Giacopassi, D J and Stitt, B G. 199 1 . Per Capita Alcohol Consumption and Crime: An Unexamined Relationship. International Jotrrnal of Comparative and Applied ( 'rrmrt~olo~~, 15, 269-275 *
GhWT Bureau of Statistics. 1984a. 1984 NW'T Labor Force Survey: OveraN Reslrlts 8- ( 'omrnlrnirj. Lktail Yellowknife, NWT: Bureau of Statistics, GNWT.
GhWT Bureau of Statistics I 984b. Personal income statistics: Northwest Terrirories: 19 76 to 1981 Yellowknife, hWT: Bureau of Statistics, GNWI"T
GhWT Bureau of Statistics. 1989. 1989 hiW Labor Force Survey: Overall Results & . Commtrni?- Detail. Yeliowkrufe, hWT: Bureau of Statistics, GNWT.
GhWT Bureau of Statistics. 199 1. Northwest Terrirories Community Profiles Yellowknife, W T : Bureau of Statistics, GNWT.
GMtTT Bureau of Statistics. 1 996a. Norrhwest Territories Cornmunig Profiles. Yellowknife, hWT: Bureau of Statistics, GNWT. Hypertext Document. uuw. stats gov nt ca~ureau/StatInfo/CornmProfiles/~ComrnPro htrnl

GNWT Bureau of Statistics. 1 996b Northwest Territories Statistics Quarterlq,, September 1996. Yellowkrufe, NWT: Bureau of Statistics, GNWT. Hypertext Document. www. stats.gov.nt .ca/Bureau/StatInfo/ StatsQuarterly/_StatQ.htd
GNWT Government Services. 1992. Status of Liquor Restrictions by Cornmuniy. Jamiavj 1992. Yellowknife, NWT: Govenunent Services, GNWT.
Gray, J. H. 1995. Booze: &%en Whish Ruled the West. (2nd ed.) Saskatoon, Sask. Fifth House Press.
Greenberg, S. W. 198 1 . Alcohol and Crime: A Methodological Critique of the Literature. In ' Collins, J J Jr (ed.)'Drmhng and Crime: Perspectives on the Relatior~ships Between
.4lcohol (btisumption atld Crimirlal Behavior. New York, NY: Guilford Press. pp. 70- 109.
Gnffith, D. A. 1987. Spatial Autocorrelation: A Primer. Washington, DC: Association of American Geographers
Grifiths, C. T., Wood, D S., Zellerer, E., and J. Simon. 1994. Ahoriginal Policing rn Brrmh , ('oltrmbiu Report prepared for Commission of Inquiry; Policing in British Columbia
Victoria, B C. - Ministry of Attorney General,
Griffiths, Curt T , Zellerer, E., Wood, D. S., and Saville, G . 1995. Crime, h; andJustice A morig Inuit iri the Baffjt~ Region, N. W. T., C1anada. Burnaby, BC : Criminolog Research Centre, Simon Fraser University.
Groth. P G 1982 Values and the Measurement of Unemployment Socral Scrence Quarter/r*, 63. 154-1 59
Grygier. T 1948 Psychiatric observations in the Arctic British Journal of Psycho1og~-, 1-1. 84-96
Hagen, E E , and Schaw, L B 1960 The Sioux on the Resen~atron: AN American Cbloriral Problem Cambridge, M A Center for International Studies
Hagey, J . K . Larocque, G , and McBride, C. 1989. Highlights of Aborigi~lal Conditiorts I Y X I - 2001: Part I , Demographic Trends. Ottawa, Ont.: Finance and Professional Services, Indian and Northern .4!Tairs Canada. e
Hague. R 1990. Alcohol and Criminal Violence in the Nordic Countries. In Snare. A. (ed ) Crimirial I i01e)ice in Sca)ldinm*ia: Selected Topics (Scandinavian Studies in Criminology, Vol. 1 1 ) Oslo, N w a y : Universitetsforiaget AS. pp. 65-75.
Hamer, J H. 1965. Acculturation Stress and the Functions of Alcohol among the Forest Potawatomi. Quarterly Journal of Studies on Alcohol. 26, 285-302.
Hamilton, Associate Chief Justice A. C . . and Sinclair, Associate Chief Judge C. M. 1991. Report of the Aborrprlal Jztstice Inquiry of Manitoba. The Justice Sysrem and Aboriginal '
People. Vol 1 . Winnipeg, Man. : Queen's Printer.
Hanushek, E. A and Jackson, J E. 1977. Statistical Methods for Social Scientists New York, NY: Academic Press.

Harding, J . 1978. Development, Underdevelopment and Alcohol Disabilities in Northern Saskatchewan. A lternatives: Perspectives on Socie ry and Env i ro~en t , 7(4), 3 0-3 9
Harding, J . 1988 Aboriginal Rights and Government Wrongs: Uranium Mining and Neocolonialism in Northent Saskatchewan. Regina, Sask. : Prairie Justice Research. University of Regina.
9
Hayner, Norman S,. 1942 Variability in the Criminal Behavior of American Indians. American Journal of Sociology, 47, 602-6 13.
Health & Welfare Canada, 198 1 . 177e Health of Canadians - Report of the Canada Health Survej,. Ottawa, Ont : Health and Welfare Canada and Statistics Canada
Health & Welfare Canada, 1988. Canada's Health Promotion Survey. Ottawa, Ont.: Health and Welfare Canada.
Health & Welfare Canada, 1990. Natronal Alcohol and Other Dmgs Survey. Ottawa, Ont Health and Welfare Canada.
Health & Welfare Canada, 199 1 . Health Status of Canadian Indians and Inuit - 1990. Ottawa, Ont Minister of Supply and Services.
Health & Welfare Canada, 1993. Canada's Health Promotion.Sun?e~~ I990 - Technical Heporr. Ottawa, Ont Health and Welfare Canada
Heath, D B 1964 Prohibition and Post-Repeal Drinhng Patterns among the Navaho Quarter!r. ./ourrial of Studies on Alcohol. 25, 1 19- 13 5
Hitz, D 3 973 Drunken Sailors and Others Drinlung Problems in Specific Occupations Otrurterf,,. - Journal of Studres on Alcohol, 34, 496-505
Hobart, C W 1978 Economic Development, Liquor Consumption and Offence Rates in the Northwest Territories. Canadian Journal of Criminologr, 20, 259-278.
Hodgkinson, C J . 1972. Socio-Ctrltural Change and Continuing Education Among the Eskimo iri Frohisher B ~ L . , A'. U'. T. Unpublished M Ed. Thesis. Edmonton, Alta. : University. of A1 berta
Hollin, C R 1983. Young Offenders and Alcohol: A Survey of the Drinlung Behaviour of a Borstal Population. Journal of Adolesce,nce, 6, 16 1 - 174.
Honigmam, J . J . , and Honigmam, I . 1965a. Eskrmo Tuwnsmen. Ottawa, Ont.: Canadian Research Centre for Anthropology, University of Ottawa.
Honigmann, J J and Honigmam. I 1965b How Baffin Island Eslumo Have Learned to Use .4lcohol Social Forces, 44, 73-83
Horton. D 1943. The Functions of Alcohol in Primitive Societies: A Crosscultural Study Quarterf.t, Jounial of Studies on Alcohol, 4, 199-320.
Hvde. h4 and Laprairie, C 1987. Amerindian Police Crime Prevention. Ottawa, Ont.: Mnistry of the Solicitor General
Imes, C A 1988. Bureau of Justice Statistics Special Report: Profile of State Prison Inmates, 1986. Washington, DC: US Bureau of Justice Statistics.

Irwin, C. 1988. Lords of the Arctic: War& ofthe state. Ottawa, Ont. : Health-and Welfare Canada.
Jacob, H 1984. Ilsing Published Data: Errors and Remedies. Newbury Park, CA: Sage Publications.
Jayewardene. C H S 1975. Violence Among the ~skimos. ~ o u ~ l of Canadian Crirninolom* and (brrections. 1 7, 3 07- 1 4.
Jilek-Aall, L. 1988 Juvenile Alcohol Use and Self-Destructive Behavior in Northern Populations. A Cross-Cultural Comparison. Arctic Medical Research, 47, 604- 10
Jorgensen, J G 1971 Indians and the Metropolis. In Waddell, J . 0. and Watson, 0. M., (ids ) 731e American I~ldiari in urban socie&. Boston, MA: Little, Brown & Company, pp 67-1 13
Jorgensen. J G . 1972 The Strn Dance Religon. Chicago, IL: Uriiversity of Chicago Press
Jorgensen, J G 1978 A Century of Political Economic Effects on American Indian Society. 1 880- 1 980 Jorrrml of Ethnrc Studies, 6(3), 1-82
Kellough, G 1980 From Colonialism to Imperialism The Experience of Canadian Indians In J Harp and J R Hofley (eds ) Structured lnequalry ln Car& Scarborough, Ont Prentice-Hall pp 343-377
Kemp. W B 1984 Bafinland Eskimo. In Stunevant, W. C and Damas, D 1.. (eds ) Handhook o f North Amencan Indram, C oltrme 5: The Arctic. Washington, DC : Smi t hsonian institute. pp 463-475.
Kennev. G 1 . 1994 Arcr~c Smoke & A4irror.y Prescott, Ont Voyageur Publishing
Kidder, L H 198 1 Qualitative Research and Quasi-E~pe~mental Frameworks In Brewer, hl B and Collins, B E (eds ) Sclentlfic Inquiry and the Social Sciences: A I bhme rfi
Horlor of llot~ald T. Campbell San Francisco, CA Jossey-Bass, pp 226-256
Klausner. S Z and Foulks, E. F. 1982 Eshmo Capitalists: Oil, politic^ and Alcohol Totowa. NJ. Allanheld. Osmun & Co.
LaDuke, W. and C hurchill, W. 1985. Native America: The Political Economy of Radioactive Colonialism. Journal of Ethnic Studies, 13(3), 107- 132. *
Lal. R 1969a From Duck Lake to Camp 10: Old-Fashioned Relocation. Musk-Ox, 6, 5- 13
Lal. R l969b Some Observations on the Social Life of the Chipayyam of Camp 10, Churchill and their Implications for Comq~unity Development Musk-ox, 6, 14-20
LaPrairie. C. 199 1 . Jusrrce for the Cree: Communities, Crime and Order. Chisasibi, Quebec. Grand Council of the Crees.
LaPrairie, C. 1992. Exploring the Boundaries of Justice: Aborignal Justice in the Yukon. Ottawa, Ont . Justice Canada.
Leach, C. 1979. I~~rroductior~ to Statistics: A Nonparametric Approach for the Social Sciences. Chichester, England: John Wiley & Sons

Lemert, E. M. 1964. Forms and Pathology of Drinking in Three Polynesian Societies. Amer~can Anthropologrst, 66, 36 1 -3 74.
Lenke, L 1984 Alcohol and d e s of Violence: A Causal Analysis. Contemporary Drug Problems, 10, 355-365..
Levy, J . E, and Kunitz, S. J. 1974. Indian Drinkmg: Navajo Practices and Anglo-rlmerican Theories. New Bbrk, hN. John Wiley & Sons.
Lewis-Beck, M S 1980 Applied Regression: An Introduction. Newbury Park, CA: Sage Publications.
I 4
Lewontin, R C 1972 The Apportionment of Human Diversity. Evolut iona~ Broloa, 6, 381-396
Lowman. J and Palys, T. S. ( 199 1 ). Interpreting criminal justice system records of crime In Grifiths, C T and Jackson, M. A. (Eds.) Canadian Criminology: Perspectives,or~ Crime unJS'o~-ierq.. Toronto, Ont.: Holt - HBJ. pp. 349-369.
Lurie, N 197 1 The World's Oldest On-Going Protest Demonstration: North American Indian Drinking Patterns Yacrfic Historical Review, 40, 3 1 1-33?,
Lyon, G F. 1 823. 7he Pri~tate Jolrrnal. London, England: J . Murray t
P Mac Andreu . C and Edgerton, R B 1969 Drunken Comportment: A Socral Fxplanarron
Chicago, IL Aldine Publishing Company \
hlarcus. 4 R 1990 Out i , ~ the i h l d Thr Legacy of Canada? Ittuit Relocation Experimenr in ' (he H~gh .4rctrc, 1953- 1990. Cambridge, England: Scott Polar Research Institute,
Uni\-ersity of Cambridge
Marcus, .4 R 199 1 in the Cold Canada's Experimental Inuit Relocation to Grise Fiord and Resolute Bay golar Record 2 7 , 285-96 " .
Marenin. 0 1992 lain in in^ Patterns of Crime in the Native Villages of Alaska Canadran Jotrrnul c!f Crrm~nology 34, 339-368
May, P A 1975 Arrests. Alcohol, and Alcohol Legalization Among an American Indian Tribe Plarns Anthropologsr, 20(68), 129- 134
May, I?. A. i 98 1 . Susceptibility to Substance Abuse Among American Indians: Variation Across Sociocultural Settings. In Problems of Drug Qependence, 1981. N.I.D.A. Research Monograph, No. 4 1 . Washington, DC: US Department of Health and Human Services, pp. 34-44.
May. P A 1982. Contemporary Crime and the American Indian: A Survey and of the Literature. Plairzs Anthropologtst, 27,225-23 8 -. -
May, P. A. 1989. Alcohol abuse and alcoholism among American Indians: An overview. In Watts. T D and Wright. R., J r (eds.) Alcoholism in Minority ~ o ~ u l a t ~ o r n . Springfield, IL Charles C Thomas publishing C o pp. 95-f19.
May. P A 1992 Alcohol Policy Considerations for Indian Reservations ad30rdenown Communities American Indran and Alaska Nafrve ~entnPHealth Research, 4(3), 5-59

f i
May, P A and Smith, h4 B 1988 Some Navajo Indian Opinions About Alcohol Abuse and Prohibition A Survey and Recommendatioris for Policy Journal of Stud~es on Alcohol, 49, 324-334
McCone, R C. 1966 Cultural Factors in Crime Among the Dakota Indians. Plains' Anthropologist, 11, 144- 1 5 1 .
Mehta, C. R and Patel, N R. 1996. SPSSExact Tests 6.1 for Windows. Chicago, IL: SPSS Inc
Millar, H A. 1990. Judicial Reasoning in the Northwest Territories: An Explorator)! S t u 4 of Sexual Assault Sentencing Decisions, 1983-1986. Unpublished MA Thesis. Burnaby, B.C.: School of Criminology, Simon Fraser University.
Mills, D. K 1989. Alcohol and Crime on the Reservation: A 10-Year Perspective. Federal Probution, 53(4), 1 2- 1 5.
Millward, A E 1930. Southern Baffin Island: An Account o f Exploration, Investigatio)~ and Settlrrnrt~t Lhritlg the Past Frfg Years. Ottawa, Ont. : North West Territories and Yukon Branch, Department of the Interior.
Minnis, M S 1963 The Relationship of the Social Structure of and Indian Community to Adult and Ju\.enile Delinquency Soc~al Forces, 41, 395-403.
Minor, N . K h4 1 979. Con~lerts and Cuslomers: Traditional I m i t Shamanism and Its I)rstr~rctro~l bj. Christian Missionaries. Unpublished paper. Available fiom the Northern Justice Society Resource Centre, Simon Fraser University, Burnaby, B.C.
hlvers, L 1994. H ( % GrrrJ~.: Summer '94. Vancouver, BC: British Columbia Liquor Distribution Branch
National Commission on Employment and Unemployment and Unemployment Statistics. 1979 ( 'n~rtitu~g- the l,uhor Force. Washington, DC. US Government Printing Office
Northend Ferguson, F 1968 Navaho Drinking- Some Tentative Hypotheses. Human Orp~rr~rzatiari, 2 -(a, 159- 167.
Noruiis, M J 1993. SPSS for Windows Base System User's Guide Release 6 0. Chicago. 6. '
: SPSS Inc.
hW'T Federation of Labour. 199 1 . Politicians Ignore Pollution Heading North. Nunatsiaq 1Ve6x 19 (23 - June 28), p. 7
Nunacvt Implementation Commission, 1995. Footprints In Nm' S ~ O H - . Iqaluit, NWT: Nunavut Implementation Commission
Odlund, J . I988 Spatral.4utocorrelation. Beverly fills, CA. Sage Publications
Outcrop Publishing, 1982 NV'T Data Book 1982 83. Yellowkmfe, NUT: Outcrop Publishing.
Outcrop Publishng, 1984 AWT Data Book 1984 85. Yellowkmfe, NWT: Outcrop Publishing
Outcrop Publishing, 1986 h%'T Data Book 1986 8 7 Yellowkrufe, NWT: Outcrop Publishing
Outcrop Putilishing, 1990 h W T Data Book 1990 91. Yellowkrufe, NWT: Outcrop Publishing

Owens, N J 1976 Indran Kesen~ations and Bordertoum: The Metropolrs-Satellrte Model ' U- >
Applred to the Northwestern Navahos and the UmatrNas Ph D Dissertation, University of Oregon
Paine, R 1977 The Nursery Game - Colonizers and Colonized in the Canadian Arctic Etudes . *
Inurt Studies, 1, 5-32
Parker, D A and Harford, T C 1992 The Epidemiology of Alcohol Consumption and ~-~ -, Dependence Across Occupations in the United States Alcohol Health a ~ ~ d Research World, 16, 97- 1 05
Patten, M L. 1997 Understanding Research M e t h d : An Overview ofthe Essentials Los Angeles, CA- Pyrczak Publishing.
Peak, K 1989. Criminal Justice, Law, and Policy in Indian Country: A I-Iistorical Perspective. Journal of ('riminal Justice, 17, 393-407.
Peak, K and Spencer, J 1987 Crime rri Indian c o u n ~ , : Another "trarl of tears." Journal of -. ('rrminal Jusrm, IS. 485-494
Pernanen, K 199 1 Alcohol in Human l7olence. New York, NY: Guilford Press
Peterson, K R 1992 The Justrce House: Report of the Specral Advrsor on Gender Equalin Yellowknife, W T Department of Justice, GNWT
Pretes, hl 1988 Underdevelopment in Two Norths. The Brazilian Amazon and the Canadian Arctic Arctic, JI(.?). 109- 1 16
Rasing, W C E 1993 'Too marr)+people:' Order and Nonconformr~ rn Iglulrrigmrirt Social Procrs~. Nijmegen. Netherlands Recht & Samenleving
Rea. K J 1968 771r Yolrrical Lconorn?? of .Worthern Development. Ottawa, Ont. : Information Canada
h . e s , S M' J r and Sewo, M' J 1984 Introduction to Applied Demograph?.: Data Estrmatron 7kchniqtrc~s Beverly Hills. CA Sage Publications
Robbins. R H 1973 Alcohol and the Identity Struggle Some Effects of Economic Change on Interpersonal Relations Amerrcan Anthropolopst, 75, 99- 122
Room, R. 1978 Evaluating the Effects of Drinhng Laws on Drinking. In Ewing, J and Rouse, B (eds.) Drinhng: Alcohol in American Societ)., Issues and Current Research. Chicago. 111. Nelson-Hall, pp. 267-290.
Ross, R 1992. Daticirig Uith a Ghost: Exploring Indian Reality. Markham, Ont.: Reed Books.
Rush, B , Gliksman, L , and Brook, R - 1986 .4icohol Availability, Alcohol Consumption and PJcohol Related Damage I The Distribution of Consumption Model Journal of stud re^ on .4 /coho/. 4 7 , 1 - 1 0 B
Sackett L 1988 Resisting Arrests. Drinlung. Development and Discipline in a Desert Context. 1 i Social Ana!r*sis, 24, 66-84. /
Samrnons, hl S. 1985 I~iuktrtut in Ranhn Inlet Unpublished Ph.D. Dissertation. Ann Arbor, MI. University of Mxhigan.

Sayrs, L. W. 1989 Pooled Time-Series Analysis. Newbury Park, CA: Sage Publications
Schaefer, J. M 198 1 . Firewater Myths Revisited: Review of Findings and Some New Directions Journal of Studies on Alcohol, Suppl. 9, 99- 1 1 7 .
Schechter, E J . 1 986. Alcohol Rationing and Control Systems in Greenland. Conzemporar), Drug Problems, 13, 587-620.
Schroeder, L. D., Sjoqu,ist, D. L. and Stephan, P. E. 1986. Understanding Regression Analysis: An Introductory Guide. Newbury Park, CA: Sage Publications.
Scudder, T., and Colson, E. 1982. From Welfare to Development: A Conceptual Framework for the Analysis of Dislocated People. In Hansen, A. and Oliver-Smith, A. (eds.) Involunta~~ M~~utrorr and Resetrlernent: The Problems and Responses o/Dislocated People. Boulder, CO. Westview Press. pp 267-287.
Scudder, T 1982 No Place to Go: Effects of Compulsory Relocatmn on Navcqos. Philadelpha, PA Institute for the Study of Human Issues
Seigel, S and Cast ella, N J . 1 988. Nonpurametric Statistics for the Behmioral Sciences (2nd ed ). New York, NY: McGraw-Hill.
Shields, G F , Schrniechen, A. M., Frazier, B. L., Redd, A. Voevoda, M. I., Reed, J . K. , Ward, R. H., Hecker. K . , and Reed, J . 1993. Mitochondria1 DNA Sequences Suggest a Recent Evolutionary Divergence for Beringeans and Northern American Populations Amer~car~ Jotrrnal of Hurnurr Genetla, 53, 549-563
Shiskin, J 1975 Employment and Unemployment The doughnut or the hole3 Monthl~q Labor RC\WW, Y9(Feb), 3- 10
S hkilnyk. A M 1 985 A Po~son Stronger Than Love: The ~ e s h c t i o n of an Ojibwa I C'ornm~rmt)*. New Haven, CT. Yale University Press.
Simmons, 0 G 1960 Ambivalence and the Learning of Drinking Behavior in a Peruvian Community .4mer~an Anthropologst, 62, 10 18- 1027
Single. E 1993 (hnadarr Profile: Alcohol, Tobacco R. Other Drugs Ottawa, Canadian Centre on Substance Abuse
Smart, R G 1979 A Note on the Effects of Changes in Alcohol Control Canadian North Journal of Studies on Alcohol, 40, 908-9 13
Smart, R. G. 1 986. Northern Spirits: Drinlnng in Canada, then and now. Toronto, Ont . : Addiction Research Foundation.
Snit h, L J . 1 973. Beer, Wine and Spirits: Beverage Differences and Public Policy in Canada Ottawa, Ont: Brewers Association of Canada.
Soberman, D . 1 99 1 . Report to the Camdian Human Rights Commission on the Complaints of the Inuit People Relocatedfrom Inukjuak and Pond Inlet to Grise Fiord and Resolute Bq' in 1953 and 1955. hngston, Ont. : Author.
Snipp. C M. 1986a American Indians and Natural Resource Development. American Journal of Economics and Sociolog)., 45(-1), 45 7-474.

%
- 3
2 -
I . , ? t4 - - sniip, C M l986b he Changing ~oliticil'and Econoniic Status of the American Indians:
From Captive Nations to Internal Colonies. American Joumol of ~corzomics and Sociologv, 45(2), 145-157. " - ,
Spence. M: -199 1 . 'Upper Base Clean-Up !&arting Soon. Nunotsiaq News, 19 (23 - June 28), 4 ,
pp. 1-2. 'a . - Stahl, S. M. and Hemes, J. De 4 980. Reading and Understahding Applied ,- Statistics: A .
Selj-Learning Apprqach. St. Louis, MO: C*. V. Mosby Company. i
Statistics Canada. 1 982. Census Divisions and ~ubdiv~sions: Population, .Occupied P~ivate . ~ e l l i r i y s . Private Househol& Census ~antil&s ih Private Householrir: Selected Characteristics - No~hwest TerritorieS. Ottawii, Ogt . : Mnister of Supply and Services, Canada
Statistics Canada, 1983, Census Divisions and Subdivjsions: Populotion. occupied P;ivorr Lh~ellirigs, Private Househol&. Census and Econo@ic Families in Private Househol&:Selected Social and Economic ~ha;bcteristics - Northwest Te,rritones. Ottawa. Ont. 'Minister of Supply and Services, Canada. a l
-6-
St at ist ics Canada. 1 98 7a. (;enera/ Soci6l Survty Analysis Series, Health and Social Support, I985 Ottawa. Ont . Minister of Supply and Services, Canada. . .
\
Statistics Canada. 1 98 7b Population &id Ll'e~r~~~haracieristic.~ - Census ~;visioni and Slrhdn~rsroris: Northwest Terrrrories: Part 2 . Ottawa, Ont. MnisterSof Supply+and, - Senices, Canada.
e
Statistics Canada, 1 98 8 Poprrlation and Dwelling Characteristics - Cend~s Divisions-and '
S~rhdr~vsio~i.~: iVorthwest Terri~ories: Part 2 Ottawa, Ont : Minister of Supply and Services. Canada
5. 8%
Statistics Canada 1 992 Projile of Census DiriWns and Subd~~isions in the Northwest - . Terrrtorr~s -Part A . Ottawa, Ont. : IMnister of Industry, Science and Technology
Statistics Canada. 1993a A boriptal Peoples Survey: Language. Trqdirion, Health. Llfesr)*le and Social 1.ssuc.s Ottawa, Ont. : Mnister of Industry, Science and Technology
St at ist ics Canada. 1 993 b ProJile of C hnsus Divisiorzs and Subdivisions in the Northest Territories -Part B Ottawa. O n t Minister of industry, Science and Technology
Stewart, 0 196.1 Questions Regarding American Indian Criminality. Human Organization, 23, 6 1-66.
Swiderski. A. 1985. Images of an Inuit Commtmi~~: Cape Dorset, N. W. T. Unpublished M.A Thesis Edmonton, Aha.. University of Alberta.
Swinscow, T. D V 1978. Statisr~cs at Square One (3rd ed.). London, England. British Medical Association.
Szabo. D . FinMer, H. W . and ~arizea", A 1973. Deviance and Social Control: Manrjrstation. Trnsiorz arid Coriflrct in Frobisher Bgt. Montreal, Que. : Centre International de Crirninologie Comparee. Universite de Montreal.

szathrnary, E 1 E. and Reed, T. E 1972 Caucasian ~drnixture in Two Ojibwa Indian Comrnunites in Ontario..Human Biology, 41, 655-671. .,
Tester, S . J , and Kulchyski, P. I 994. Tammarniit (Mistakes): Inuit Relocation in the Eastern Arctic, 1939-1963. Vancouver, B. C. : UBC Press.
Thatcher, R. W. 1986 The Functions of Minority Group Disrepute: The Case of Native Peoples in Canada. In MacLean, 8. D. (ed.) The Political Economy of Crime: Readings for a
- Critical Criminolog)?. Scarborough, Ont.: Prentice-Hall. pp. 272-294.
Tobias, J L 1976 Protection, Civilization, Assimilation An Outline History of Canada's Indian Policy Western Canadran Journal ofAnthropology, 6 , 39-55
Trevethan. S 1993 Polrce-Reported Aborrgnal Crime m ~i&ary, Regna and Saskatoon Ottawa, Ont Canadian Centre for Justice Statistics
Turner-Rufing, L 1979 Dependence and Underdevelopment In dunb bar-Ortiz, R . (ed ) Economtc Ik\vlopment in American Indian Resen~ations Albuquerque, NM Native .American Studies. University of New Mexico, pp 9 1 - 1 13 --a -
m
Van Dyke, E 1982. Between Worla!~ - Problems in Culture Transition Unpublished paper. Available from the Northern Justice Society Resource Centre, Simon Fraser University, Burnaby, B C
\.'anstone, James W 1965 The Chatrgng Culture of /he Snowdrfl Chipmyan, National Museum of Canada, Bulletin 209, pp. 96- 10.2.
Vold, G B' and Bernard. T J 1986 Theoretical Crimr,~olog)?, (3rd ed ) New York. NY Oxford University Press
Waldram. J B 1980 Relocation and Political change in a Manitoba Native Community ('unad~ar~ Jotrrnul of '4 nthroplog), 12(2). 1 73 - 1 78
Waldram, J B 1987 Relocation, Consolidation, and Settlement Pattern in the Canadian sbbarctic Humun Ecolog): 15(2), 1 1 7- 13 1
Wenzel. G 1985 Marooned in a~ l i zza rd of Contradictions: Inuit and the Anti Sealing Movement. Enrdes Inuit Stzrdes, 9, 77-9 1 e,
Wenzel, G. 1989 Sealing at Clyde River, N.W.T. : A Discussion of Inuit Economy Etudes Intr~t St~rdt's, 13, 3-22
Whyte, K . J. 1 976 A Shr4. of the l blue Orientations of People of the Inuit and Eurocanadian Ct~lrures Within a School Setting in the Northwest Territories. Unpublished Ph.D. Dissertation Eugene, OR: University of Oregon.
Wilkinson, K. P., Thompson, J . G. , R&olds, R. R., Jr., and Ostresh, L. M. 1984. Violent s
Crime in the Western Energy-Development Regon. Pacific Sociologxal Review, 2 7 , 24 1-256.
Winkler, A M 1966 Drinking on the Amencan Frontier Quarterb* Jhurnal of Studies on AlcohoI, 26, 4 13-45

Wolf, A 1980 Homicide and Blackout in the Alaska Native Journal of Studres on Alcohol, -If, 456-62
WoIfF, L 199 1 Crime in Aboripnal Communities, Saskatchewan 1989. Ottawa, Ont. : Canadian Centre for Justice Statistics.
Wood. D S 1 99 1 Demographrc Change, Relocatron, and Patterns of Crme m the Baffin Repor], Northwest Terrrtorres, Can& Paper presented at the annual meeting of the Academy of Criminal Justice Sciences, Pittsburgh, PA
Wood, D S and Griffiths, C T 1996 Patterns of Aboriginal Crime In Silverman, Robert, . Teevan, James J . Jr and Sacco, Vincent (eds ) Crrme m Canadran Socrey (5th ed )
Toronto, Ont Butterworths *
Wood, D S and Trostle, L C In Press. The Nonenforcement Role of Police in Western ~ l a s k a and the Eastern Canadian Arctic. An .4nalysis of Police Tasks in Remote Arctic
4
Communities Jourrlul of Cr~mrrtal Jtrstice, .?S(.?).
Y atsushiro, T 1963 Frohrsher Bar: 1958 Ottawa, Ont. : Northern Co-ordination and Research Centre. Department of Northern Affairs and National Resources.
Zaslo~. , h1 1 97 1 7hr Opcr~ir~g ofthe Canadian North, 1870- 191 7 . Toronto, Ont. McClelland and Stewart Ltd
Zaslon., 31 1983 7hu ,Vmhrtv.st Terrrtories, 1905-1980 Ottawa, Ont Canadian lstorical Association
Zion. J and Zion. E B d 996 Hazho's Sokee' - Stay Together Nicely. Domestic Violence Under Navajo Common Law In Nielsen. M 0 and Silverman, R A. (eds ) h/'at~\~e r l r n ~ w c ~ t r r ~ . \ . ('rrnw, arld./tr.strce. Boulder. CO Westview Press pp 96- 1 12

Appendix A: Interview Schedules.

INTERVIEW SCHEDULE FOR BAFFIN REGION COMMUNITY RESIDENTS
A. Personal Information Name of community? What is your name? How long have you made this community your heme?
Sex? How old are you? Are you married? Do you have children?
How many children do you have? How many people live in your house? Is anyone else in your house being interviewed for this study? In what community did you grow up? Where did you go to school? What graxe did you complete?
What is the ethnic origin of your parents? B. Community Life
' f 15 Are you employed? 16 What do you do?
17. Are there other activities in which you participate in your community?
18. If so, what are they? (e.g., recreational activities, community comniittees such as youth justice committees, etc.).
19. How do you feel about your community? 20. What do you like about your community?
21. What changes have you seen in your community in the past twenty years? 22. What effect have these changes had in your community? 23 Is this a relocated community?
24. If yes, then how has this affected community life? 25. Did you have a traditional upbringing?
26. What were the traditional things that were part of your family life? 27. What do you think about the youth in your community? 28. What do you see happening with the youth in your community in the next ten years? 29. What role do the elders play in this community?
30. Do you seek the advice of elders?
: 31. Do you think others seek the advice of elders? 32. How has this changed over the years?
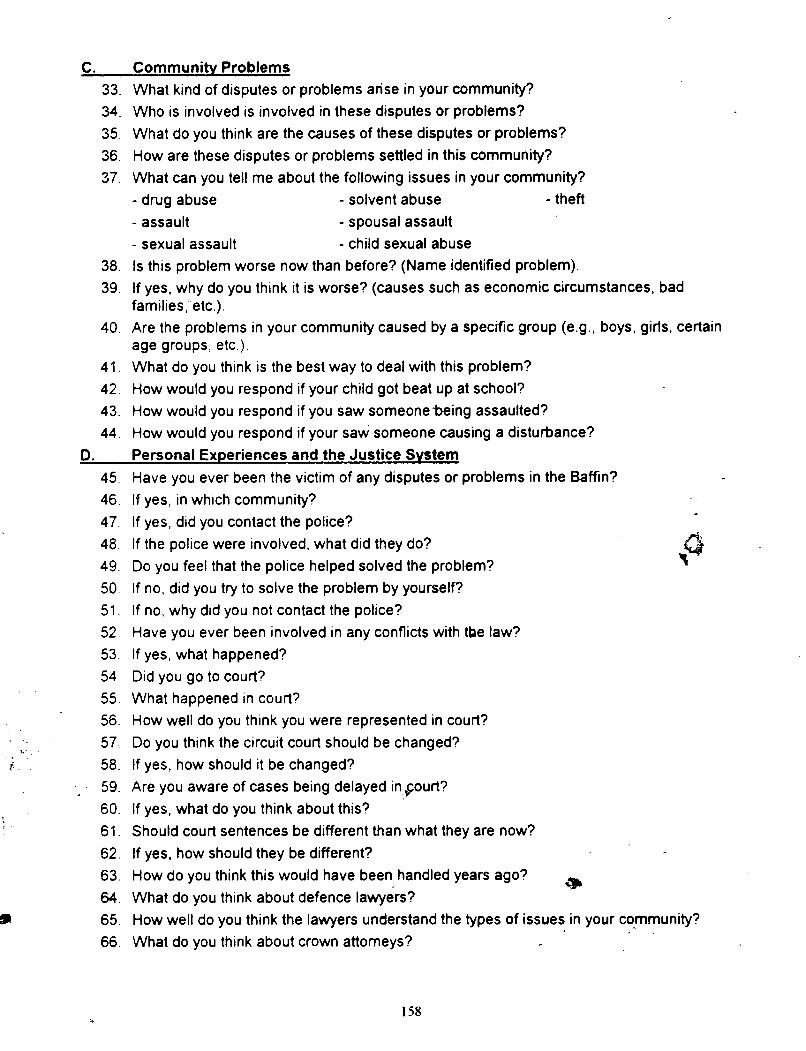
C. Community Problems 33. What kind of disputes or problems arise in your community? 34. Who is involved is involved in these disputes or problems? 35. What do you think are the causes of these disputes or problems?
36. How are these disputes or problems settled in this community? 37. What can you tell me about the following issues in your community?
- drug abuse - solvent abuse - theft - assault - spousal assault - sexual assault - child sexual abuse
38. Is this problem worse now than before? (Name identified problem).
39. If yes, why do you think it is worse? (causes such as economic circumstances, bad families, etc.).
40. Are the problems in your community caused by a specific group (e.g., boys, giris, certain age groups, etc.).
41. What do you think is the best way to deal with this problem?
42. How would you respond if your child got beat up at school? 43. How would you respond if you saw someonebeing assaulted? 44. How would you respond if your saw someone causing a disturbance?
D. Personal Experiences and the Justice System
Have you ever been the victim of any disputes or problems in the Baffin? If yes, in which community? If yes, did you contact the poke?
if the police were involved, what did they do? Do you feel that the police helped solved the problem? If no, did you try to solve the problem by yourself? If no, why did you not contact the police? Have you ever been involved in any conflicts with tbe law?
If yes, what happened? Did you go to court? What happened in court? How well do you think you were represented in court?
Do you think the circuit court should be changed? If yes, how should it be changed? Are you aware of cases being delayed in,,court?
If yes, what do you think about this? Should court sentences be different than what they are now?
If yes, how should they be different? HOW do you think this would have been handled years ago?
% ,
What do you think about defence lawyers? How well do you think the lawyers understand the types of issues in your community? What do you think about crown attorneys?

67. How well do you think the crown attorneys understand the types of issues in your community?
68. Have any of your family or friends had contact with the law? 69. If yes, wefe they a victim or an offender? 70. As far as you can remember, what pappened?

INTERVIEW SCHEDULE FOR RCMP OFFICERS CURRENTLY SERVING
1. Personal
2. Family and Community
2.1 What was your marital status? Do you have children?
2.2 How does your family feel about going to and living in the Baffin?
2.3 Describe the relationship your family has with the community (e.g., participate in community activities inclusion/exclusion). Do you feel welcomed?
3. Police Work 3.1 Were you provided with a job description for the North?
3.2 If no, what did you expect your job to be in the North?
3.3 How does the reality of working in the North meet your expectations?
3.4 What responsibilities do you take on that did not fall within your expectations?
3.5 Are there responsibilities that were particular to the North? - 3.6 If you have worked in more than one Northern community, are there differences tn your
responsibilities.
a 160
What i s your name?
When were you born? Where did you grow up? What was your education when you joined? When did you join the RCMP? How old were you? Where have you been stationed and for how long? Where have you served in the North? What were the years of your service in the North? Was a Northern assignment your choice? If so, why? , -
Could you speak Inuktitut?' If yes, did you speak any before you anived? Bid the RCMP provide any language training?
# Have you learned any of the lnuktitut language since you have arrived? How did you learn the language? Is it necessary for you to use an interpreter for normal police work?
*What kinds of problems have arisen as a result?
Has the RCMP provided any cross-cultural training for living in an Inuit community? (e.g., family customs, lifestyles, importance of huntinglgathering).
Has there been any on-going support by the RCMP provided to deal with cross-cultural issues? (e.g.,. available information about cultural taboos).
Do you think officers should be selected to work in the North? t
If so, what criteria should be used? Has your experience in the Baffin influenced your careefl Has the reality of transfers, organizational factors (e.g., work space, available transportation, quotas) influenced how you police?

Have your responsibilities changed during your appointment in the North? If so, how and why? Describe your daily activities? Are there any routine or emergency duties (e,g..! food and mail deliveries, evacuations) that are part of your job? Types of Trouble
\ We would like to know about the kinds of cases you deal with. What can you tell us about the following? Fighting 8
Spousal Assault Sexual Assault Child Sexual Abuse Verbal of Physical Threats Child Neglect Break and Enter Mischief and Vandalism Drug Dealing and Drug Abuse Bootlegging Making and Selling of Home Brew
Alcohol Abuse substance and Solvent Abuse
Other Criminal Code Offences (i.e., Robbery, Weapons, Homicide) Other Problems, NoniCriminal (eg., Over-Hunting, Not Sharing Food. Gossiping)
Responses to Question 4 To each of the above in question 4, ask the following:
How frequently are you called to investigate ?
What do you normally do about this?
Do you think is occurring that you are not called in to investigate?
If yes, then how frequently? Does the community have its own ways of dealing with this problem (e.g., elders, hamlet council, family pressure, back to the land programs, a drylwet community policy) If yes, what were they? Is nothing done? (if so, why?) Is there a procedure for dealing with this problem (e.g., refer to nurselsocial worker for therapy, youth justice committees, alternative sentencing measures)

5. Contributors to Trouble How much does the following contribute to trouble in each of the communities? Economic Problems of a Hunting and Fishing Economy (e.g., Game Laws, Difficulty Making a Living) Availability of Housing Availability of Employment SociallCultural Pressures on lnuit Values and Lifestyles New Technologies (e.g., Television, Telephones, Skidoos, Air Travel) Residential Schools Availability of Education Jealousy and Family Feuds Availability of Alcohol
Demographic and Environmental Issues Relocation of Communities Age Distribution
Pollution
Scarcity of Game and Fish Impact of the Environmental Movement
6. Criminal Justice System Initiatives and Responses Is there'a person or committee who liaised between the community and RCMP? Are any lnuit people involved in delivering justice services (e.g., lnuit special constable program, Justice of the Peace, youth justice committee)? Are the elders in the communities given a voice and role in the administration of justice?
What has been the impact of the Young Offenders Act upon the administration of youth justice in the Baffin Region communities? What crime prevention activities are you involved with? Are there sufficient r e s o u r - r o v i d e d for crime prevention work in the community? Are the cdncerns and needs of the victiqs of criminal acts met by the criminal justice system in the Baffin Region? How often does the court come to the community?
Does the court play a useful role in administering justice in the community? How does the court perform in the community? Do you think that the court does what the community wants it to do (e.g., lenientltoo severe sentences)? If not, what is the court doing that the community doesn't like?
3 If so, what is the court doing that the community approves of?
What changes would you make to improve the justice system serving the citizens of the Baffin Region?

Appendix B: Sample' Screens from RCMP Occurrence Reports Database f
r

---- Page 1 --------- OCCURREBCE REPORT ILATA ENTRY SCREEld ---------- Paga 1 ---- Our Raport Mo.: 3062 Camunity #we: 1- Year: 1991
Report Entered Bg: Ewelyn
................................................................................ ..*/ Occurrence Report l io . : 911 6 2 + Date: 05-12-1991 Time: 14:30
Bature of Event: sexual assault
Location: Airport
Occurred Between: 05-11-1991 at 18:20 and at
*******+********t***** Tormation on Suspect/Off@nder ....................... Suspect no. : 1 Last Wane P - Sex: Bl D.O.B. : -
Given Wane : - Race: IRUIT
Mfence Discovered By: Victim Was Alcohol a Factor? : n VrctrnjOffender Relatlonshrp: Can't tell Suspect Under Influence?: n
Victim Undar Influanca?: n # --------------------------------------------------------------------------------
Was Suspect Charged?: y If not, why not?: U/A Charges: Sexual Assault Breach Undertaking
Humber of Previous Convictions: 23 Were others accused in THIS occurrance report?: n If so, how many?: 0
Official 1st Charge: Sex. Ass. Changed Assault Charge Date: 05-13-1991 Plea to 1st Charge: GuLlty Disposition of 1st Charge: Convicted
1st Sentence for 1st Char: PRISON lhRount of 1st Sant: 3 months consec 2nd Sentence for 1st Char: N/A h u n t of 2nd Sent: 3rd Sentence for 1st Char: N/A Bmmunt of 3rd Sent:
Date of Plaa: 05-30-1991 Date of Disposition: 05-30-1991 Date of Sentences: 05-30-1991
Presiding Judge : Davis Type of Court: Territorial/Supreme

O f f i c i a l 2nd Charge: Breach Of Undertaking Charge Date: 05-13-1991 ' Plea t o 2nd Charge: Cu i l t y Disposition of 2nd Charge: Convicted 1 s t Sentence f o r 2nd Char: PRISON Amount of 1st Sent: 1 nonth consec 2nd Sentence f o r 2nd Char: H/A Anrount of 2nd Sent: 3rd Sentence f o r 2nd Char: H/A Arount of 3rd Sent:
Date of Plea: 05-30-1991 Date of Disposi t ion: 05-30-1991 Date of Sentences: 05-36-1991
Presldrng Judge : Davis Type of Court: Territorial/Supresae
* 4 4 * * 4 * 4 4 * * 4 * * t p + * * * * * 1 . 4 * * 4 * * Charge 3 I n f o m t i o n ** '+******a********&******** O f f i c i a l 3rd Charge: Charge Date:
P lea t o 3rd Charge: N/A Disposition of 3rd Charge: M/A 1 s t Sentence f o r 3rd Char: H/A Amount of l e t Sent: 2nd Sentence f o r 3rd Char: H/A Arnount of 2nd Sent: 3rd Sentence f o r 3rd Char: H/A Amount of 3rd Sent :
Date of Plea: Date of Disposi t ion: Date of Sentences:
Presiding Judge: Type of Court: R/A
- - - - Page 4 --------- OCCURREHCE REPORT WTA ENTRY SCREEN ---------- Page 4 ---- 4 4 * 4 + 4 * 4 4 t 4 * * * ' 4 4 4 * 4 4 4 4 * 4 * * 4 * Charge 4 Infornat ion 4 4 * * * * 4 * * * 4 * 4 * * 4 4 4 * * * * * * * * * 4
O f f i c i a l 4 t h Charge : Charge Date: P lea t o 4 t h Charge: Dlspositron of 4 t h Charge:
1 s t Sentence f o r 4 t h Char: Amount of 1st Sent : 2nd Sentence f o r 4 t h Char: , h u n t of 2nd Sent : 3rd Sentence f o r 4 t h Char: \., Amount of 3rd Sent :
Date of P lea : Date of Disposi t ion: Date of Sentences:
Presldrng Judge : Type of Court:
Any specLa.1 c m e n t s which might r e a l l y ba o f i n t e r e s t l a t e r ? : Accused went t o a i r p o r t t e r n i n a l where vict im works as an a i r p o r t observer (age 2 8 ) , she was c los ing up o f f i c e . Accused of fered her a r i d e and then gr &bad her from behind, l i f t e d and ca r r i ed her out of o f f i c e and pul led her on top of him on a cha i r . ~e
Any more s p e c i a l comnents which might r e a l l y be of i n t e r e s t l a t e r ? : asked f o r sex , Bald he had a " r u b b e r U , and t r i e d t o p u l l her &to wash rob .
She got m a y , locked herse l f in off i c e . 4 years ago, they had a sho r t r e l a 1 - t i o n s h i p , v ic t im scared of accused. Copied some b f o . Plead g u i l t y t o l e s s e
r charge a s s a u l t . Other chgs. - -

Appendix C: Letters of Ethics Approval and University Support for Baffin Region Crime and Justice Study

Professor Cun Taylor Gndftths Schaof of Cnminabgy Simon Fraser University Burnaby, B.C. '
Re: Crlme and Crlminai Jurllcr Among the Inuit: -- Sincerely,
'Thomas W. C a h r t , Char Udyerslty Elhlck Review Committee


4 4 Appendix D: Sample Liquor Commission Mail Order Invoice

iT
% -
NORTHWEST
\
T E R R T ~ E S LKXN CMWN WlJlT, N.W.T.
MAIL ORDER STATEMENT
Dote: * b

Appendix E: Sample Local Option Liquor Plebiscite Ballot. .

DO YOU AGREE THAT TBE LARE BARBOUR ALCOI10 E W C A q I O N COMIITEZ SHOULD BE ESTABLIBBBD AND GIVEN TBE PO- TO DBCI '0. t
1 WHO M Y PURCI?ASE L I Q U a OR BRING LIQFR IRlu, TEB COblHUXITY,
AND WHO MAY W E BEER OR WI- IN TEE CQ)(WUYITYr
2 ) THE AMOUNT OF LIQUOR A PERSON M Y PURCXASS OR BRXNG INTO TEE COHWUNITY, AND THE AMOUIlT OF BIER OR WINS A PERSON MAY MAKE
IN THE COHMONITY.
ALCOHOL