A Study on Variations in ndustrial Electricity Tariff & Regulatory ...
337
A STUDY ON VARIATIONS IN INDUSTRIAL ELECTRICITY TARIFF & REGULATORY INTERVENTION IN KERALA STATE Thesis Submitted in Partial Fulfillment of the Requirements for the Thesis Submitted in Partial Fulfillment of the Requirements for the Thesis Submitted in Partial Fulfillment of the Requirements for the Thesis Submitted in Partial Fulfillment of the Requirements for the Award of the Degree of Award of the Degree of Award of the Degree of Award of the Degree of Doctor of Philosophy in Applied Economics Doctor of Philosophy in Applied Economics Doctor of Philosophy in Applied Economics Doctor of Philosophy in Applied Economics By By By By V.SREEKUMAR Reg. No. 3250 Under the Guidance of Under the Guidance of Under the Guidance of Under the Guidance of Dr. M. MEERA BAI DEPARTMENT OF APPLIED ECONOMICS COCHIN UNIVERSITY OF SCIENCE AND TECHNOLOGY KOCHI-682 022 SEPTEMBER-2011
-
Upload
khangminh22 -
Category
Documents
-
view
4 -
download
0
Transcript of A Study on Variations in ndustrial Electricity Tariff & Regulatory ...
A STUDY ON VARIATIONS IN INDUSTRIAL
ELECTRICITY TARIFF & REGULATORY
INTERVENTION IN KERALA STATE
Thesis Submitted in Partial Fulfillment of the Requirements for the Thesis Submitted in Partial Fulfillment of the Requirements for the Thesis Submitted in Partial Fulfillment of the Requirements for the Thesis Submitted in Partial Fulfillment of the Requirements for the
Award of the Degree ofAward of the Degree ofAward of the Degree ofAward of the Degree of
Doctor of Philosophy in Applied EconomicsDoctor of Philosophy in Applied EconomicsDoctor of Philosophy in Applied EconomicsDoctor of Philosophy in Applied Economics
ByByByBy
V.SREEKUMAR
Reg. No. 3250
Under the Guidance of Under the Guidance of Under the Guidance of Under the Guidance of
Dr. M. MEERA BAI
DEPARTMENT OF APPLIED ECONOMICS
COCHIN UNIVERSITY OF SCIENCE AND TECHNOLOGY
KOCHI-682 022
SEPTEMBER-2011
DEPARTMENT OF APPLIED ECONOMICS
COCHIN UNIVERSITY OF SCIENCE AND TECHNOLOGY KOCHI-682 022, KERALA, S. INDIA
Phone: 0484:2556030
Fax: 0484:532495
No. AE
Date:……………..…...
CERTIFICATE
I certify that the work entitled, “A STUDY ON VARIATIONS
IN INDUSTRIAL ELECTRICITY TARIFF AND REGULATORY
INTERVENTION IN KERALA STATE” is a bonafide research work done
by Sri. V. SREEKUMAR in partial fulfillment of the requirements for the
award of the degree of Doctor of Philosophy in the Department of Applied
Economics, Cochin University of Science and Technology, Kochi-22 under
my supervision and guidance. This thesis has not been the basis of the award
of any degree, diploma, fellowship or other similar titles of recognition. The
thesis is the outcome of personal research work done by the candidate under
my overall supervision.
Dr. M.MEERA BAI
DECLARATION
I hereby declare that the thesis entitled “A STUDY ON
VARIATIONS IN INDUSTRIAL ELECTRICITY TARIFF AND
REGULATORY INTERVENTION IN KERALA STATE” is the record
of bonafide research carried out by me under the supervision of
Dr. M. MEERA BAI, Head, Department of Applied Economics, Cochin
University of Science and Technology in partial fulfillment of the
requirements for the award of the degree of Doctor of Philosophy in the
Department of Applied Economics, Cochin University of Science and
Technology, Kochi-22. I further declare that this has not been the basis of the
award of any degree, diploma, fellowship or other similar titles of recognition.
V.SREEKUMAR
Kochi-22
Date:…………........

Dedicated to
My Beloved Father,
Sri. P. K.Vasudeva
Kurup.
Acknowledgement
ACKNOWLEDGEMENT
At the very outset, I have great pleasure to express my heartfelt gratitude
to my supervisor and guide Dr. M.Meera Bai, Head of the Department,
Department of Applied Economics, Cochin University of Science and Technology.
The motivation given by her alone helped me to start and proceed on the work. In
spite of her busy schedule, she was ready to help me always by sparing a lot of
her valuable time to me for this work. I sincerely acknowledge all help and
guidance extended to me and my gratitude to her is beyond expressing by words.
My thanks are due to Dr. P.Arunachalam, Prof. (Dr.) D. Rajasenan, Prof.
(Dr.) S. Harikumar and Dr. P. K. Manoj for their valuable suggestions. I would
like to thank the Office Staff and Sri. K. Balachandran, Librarian, Department of
Applied Economics, for their timely help.
My sincere thanks are also due to Dr. K. C. Sankaranarayanan, Director
Management Studies, M.E.S College Marambilly; Dr. P.R. Poduval, Retired
Director, School of Management Studies; Dr. M.Bhasi, Dean, School of
Management Studies; Dr. D. Mavooth, Faculty Member, School of Management
Studies; Sri.M.K.G.Pillai, Former Chairman, Kerala State Electricity Regulatory
Commission, for having sharpened many of my observations.
No word can express my gratitude to Sri. C .G. Jolly, Senior Vice
President (Retired), Hindalco Industries Limited, Kalamassery, who has given me
an opportunity to work for the electricity related matters of Hindalco Industries
Limited and constantly encouraged me to acquire more and more knowledge on
power sector.
My since thanks are also due to Dr. B. Jayashankar, Senior Economic
Analyst, Kerala State Electricity Regulatory Commission, Sri. George Thomas,
President, Kerala HT&EHT Industrial Electricity Consumers Association;

Acknowledgement
Sri. A.R. Satheesh, General Manager, Carborundum Universal Limited; Sri. A.
M. Muhammed Nawas, Vice President, Binani Zinc Limited; Sri.K.K.George,
Secretary, Kerala HT& EHT Industrial Electricity Consumers Association for
giving me necessary insight and direction in getting the required data for my
research work.
It is a privilege to express my sincere and deep gratitude to
Sri.N.Peethambara Kurup, MP (Kollam), Sri.P.K.Kumara Kurup, Social Activist
and former President of Co-Operative Urban Bank Ltd, Cherthala,
Sri.K.Chandran Pillai, Ex MP(Rajya Sabha), Sri. C.M. Dinesh Mani, Ex. MLA
and Syndicate Member, CUSAT, Sri. N.K.Vasudevan, Syndicate Member,
CUSAT, Sri. A. M. Yusaf, Ex. MLA, Dr. A. B. Aliyar, Administrative Officer,
United India Insurance Company Limited, who inspired me by giving timely
advice and instructions.
I also owe a deep debt of gratitude to my present as well as retired
colleagues in Hindalco Industries Limited, Mr.D.Bhattacharya ( M.D,Hindalco),
Mr.R.S.Dhulkhed, Mr.N.Mohan (Retd.),Dr.E.C.Jose (Retd.), Mr. B. J. Alexander,
Mr.K.Kumaravel, Mr. P. C. Bhasuran (Retd.), Mr.C.K.Krishnan, Mr.J.Haridas,
Mr. K. V. Prabhakaran, Mr.K. G. Vinod Kumar and all my well wishers in
Hindalco (Indal) family who constantly encouraged me for the completion of this
research work.
Finally, I wish to thank my mother Smt. G. Bhanumathy Amma, my father-
in-law Sri V.Damodaran Pillai and my mother in law Smt.K.Ammini Amma, for
their prayers and blessings. I also thank my wife Anitha, my son Sooryanarayan,
my daughter Vyshnavi, my sister Umadevi and my brother Raveendranadh and
all other family members whose support goes beyond my academic domain. It is
because of them that I am able to achieve my goal of finishing the thesis.
V.SREEKUMAR
Contents
CONTENTS Page No.
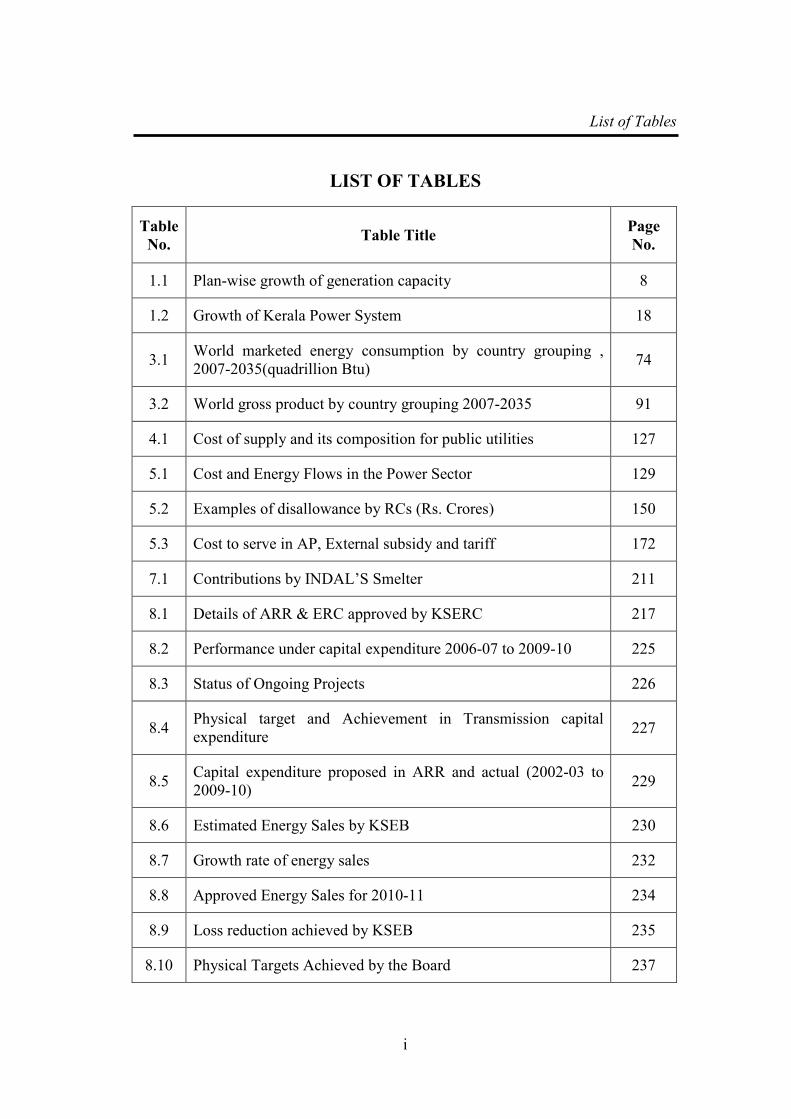
List of Tables i-iv List of Figures v-vi
Chapter 1 INTRODUCTION 1
1.1 Review of Indian Power sector 4 1.1.1 Introduction 4 1.1.2 Power Generation Details 5 1.1.2.1 Thermal Power 5 1.1.2.2 Hydro Power 6 1.1.2.3 Nuclear 6 1.1.2.4 Renewable Power 7 1.1.3 Transmission 9 1.1.4 Distribution 10 1.2 Power for all by 2012 11 1.2.1 Objectives or for all by 2012 13 1.2.2 Strategies 14 1.3 Industrial Power Consumption in Kerala 14 1.4 Kerala Power Sector and KSEB 16 1.4.1 Introduction 16 1.4.2 Features of Kerala Power System 19 1.4.2.1 Dependency on Monsoon 20 1.4.2.2 Hydro-thermal Ratio 21 1.4.2.3 Adverse Consumer Mix 21 1.4.2.4 High Peak Load 21 1.4.2.5 High Cost of Thermal Power 23 1.4.2.6 Adverse LT-HT Ratio 23 1.5 Significance of the Study 26 1.6 Statement of the Problem 27 1.7 Objectives of Study 29 1.8 Hypothesis 30 1.9 Methodology 31 1.10 Limitations 31 1.11 Scheme of the Study 31 Chapter 2 LITERATURE REVIEW 2.1 Introduction 33 2.2 Definition of Regulation 33 2.3 Policy formulation, Implementation etc. 35 2.4 The nature of regulation 38 2.5 Why Independent Regulators? 41
Contents 2.6 What is independence ? 40 2.7 Independence and legitimacy 41 2.8 Regulatory powers of independent RC 41 2.9 Regulation of electricity – International Scenario 42 2.10 Electricity Reform Models 42 2.10.1 The US Model 43 2.10.2 Australian Model 43 2.10.3 The UK Model 44 2.10.4 The Latin American Model 45 2.10.4.1 Chile 45 2.10.4.2 Peru 45 2.11 Power Sector reforms in India 46
2.12 Institution Framework Analysing Regulatory Structures 48
2.13 Criteria for Regulatory Governance and Best Practice Definitions 51
2.14 National Institutional Endowment in India 52 2.15 Electricity Regulation in India 54 2.16 Regulatory Process 57 2.16.1 Clarity of Roles and Objectives 57 2.16.2 Autonomy 58 2.16.3 Participation 59 2.16.4 Accountability 59 2.16.5 Transparency 60 2.16.6 Predictability 60 2.17 A case of mix up of institutional roles 61
2.18 Core issues in power regulatory sector 62 2.19 Performance Appraisal of New 64
Regulatory Arrangement 2.20 Simulation of Competitive Market 67
Type Conditions 2.21 Regulatory Process and Governance – 68
case of GERC & CERC 2.22 Conclusion 71
Chapter 3 WORLD ENERGY DEMAND AND ECONOMIC OUTLOOK
3.1 Introduction 73 3.2 Outlook for world energy consumption by source 77 3.3 Delivered energy consumption by end-use sector 84 3.3.1 Residential sector 85 3.3.2 Commercial sector 86 3.3.3 Industrial sector 87 3.3.4 Transportation sector 88 3.4 World economic outlook 89 3.4.1 OECD economies 91

Contents
3.4.2 Non-OECD economies 94 3.5 Sensitivity analyses in IEO2010 Alternative 99
Economic Growth cases 3.5.1 Alternative oil price cases 101 Chapter – 4 COST STRUCTURE OF POWER SECTOR
4.1 Introduction 104 4.2 Fixed Cost 104 4.2.1 O&M Costs 105 4.2. 2 Return (Profit) on Equity: 105 4.2.3 Income Tax 105 4.2.4 Interest on Loan 105 4.2.5 Repayment of Loan / depreciation 106 4.2.6 Cost of Working Capital 107 4.3 Variable cost 107 4.4 Move towards normative or 108
benchmark values 4.5 Hidden costs – the externalities 108 4.6 Generation tariff 109 4.6.1 Single-part versus two-part tariff 110 4.6.2 Two-part, cost-plus tariff for IPPs 110 4.6.3 Availability Based Tariff (ABT) 112 4.6.4 Risk sharing 116 4.6.5 Incentive to increase capital cost 116 4.6.6 Competitive bidding – second 117
generation IPPs 4.6.7 Recent changes as per Electricity Act-2003 118 4.6.8 Tariff for renewable energy projects 119 4.7 Transmission Tariff 120 4.8 Distribution tariff 121 4.9 Financing of power sector investment 124 4.9.1 Financing of IPP projects 125 4.10 Changing composition of SEB costs 126
Chapter-5 PROCESS AND PRINCIPLES OF REGULATORY REVIEW 5.1 Introduction: 129
5.2 Regulatory Review 130 5.2.1 Cost-Plus Method 131 5.2.2 Performance Based Regulation 133 5.2.3 Market Based Tariff 135 5.2.4 Principles of tariff setting 136 5.3 The process of tariff approval 138 5.3.1 Demand Estimation 140 5.3.1.1 Estimation of metered sales 141
Contents
5.3.1.2 Estimation of un-metered sales and T&D losses 142 5.3.2 Power generation and purchase plan 143 5.3.3 Capital related costs 145 5.3.4 Cost of acquiring a new power plant 146 5.3.5 Operating costs 147 5.3.6 Calculation of ARR 148 5.4 Special considerations in tariff setting 150 5.4.1 Fuel and other cost adjustments (FOCA) 151 5.4.2 Government subsidy 152 5.4.3 Regulatory asset and liability 152 5.5 Consumer tariff 153 5.5.1 Tariff components and billing 155 5.5.1.1 Billing Cycle 155 5.5.1.2 Fixed and variable charges 156 5.5.1.3 Tariff linked to kind of service 157 5.5.1.4 Tariff linked to quality of supply 158 5.5.2 Consumer category tariff 159 5.5.2.1 Falling cross subsidy 159 5.5.2.2 Residential tariff 161 5.5.2.3 Agricultural tariff 163 5.5.2.4 Industrial Tariff 166 5.5.3 Tariff philosophy 169 5.5.3.1 Tariff issues in open access 174 5.6 Conclusion 176
Chapter – 6 TARIFF REGULATORY FRAMEWORK IN KERALA
6.1 Introduction 177 6.2 The Organization of Regulatory Commission 177 6.3 Functions of the Commission 179 6.4 The Mission of the Commission 180 6.5 Objectives of Tariff determination by KSERC 181 6.6 Procedure for Annual ERC filing 181 6.7 Procedure for Tariff filing 183 6.8 Publication of petition 185 6.9 Commission’s powers for verification 186 6.10 Saving of inherent power of the Commission 186 6.11 Relevant provisions in the 187
Central Act to empower regulation: 6.11.1 Electricity Act – 2003 187 6.11.2 Key provisions in EA-2003 188 6.11.3 National Electricity Policy 188 6.11.4 National Tariff Policy: 190 6.11.5 Regulations by CERC & KSERC 191
Contents
Chapter – 7 A CASE OF POWER TARIFF HIKE WITH RESPECT TO A POWER INTENSIVE CONSUMER IN KERALA 7.1 Introduction 193 7.2 Brief history of the company under study 194 7.2.1 Growth of Alupuram Factory 194 7.2.2 Products 195 7.2.3 Operations 196 7.2.3.1 Pot Room 196 7.2.3.2 Casting Plant 197 7.2.3.3 Carbon Paste plant. 197 7.3 Power Tariff increase and viability crisis 198 7.4 Absence of independent regulation 203 7.5 Present status 207 7.6 Socio-economic impact of closure of smelter 210
consequent to tariff hike 7.7 Conclusion 213
Chapter – 8 THE IMPACT OF REGULATORY REGIME IN KERALA
8.1 Introduction 215 8.2 Summary of ARR&ERC approvals done by 216
the Commission 8.2.1 Procedural Overview 219 8.3 Review of Capital Expenditure 222 8.3.1 Introduction 222 8.3.2 Analysis and decision of the Commission 224 8.4 Sales Energy Projections 229 8.4.1. Sales projections 229
8.4.2 Analysis 231 8.5 Transmission and distribution loss 235 8.5.1 Introduction 235 8.5.2 Analysis 238 8.5.3 Progress of replacement of faulty meters 242 8.5.4 Progress in achieving planned capital investment
programme 244 8.5.5 AT & C Loss 246 8.6 Review Of Annual Revenue Requirements 247 8.6.1 Introduction 247 8.6.2 Generation and Power purchase 247 8.6.3 Internal Generation 248 8.6.4 Purchase of power from Central Generating 249
Stations (CGS) 8.6.5 Power purchase from IPPs 252

Contents
8.6.6 Transmission charges 254 8.6.7 Analysis 256 8.6.7.1 Internal generation 256 8.6.7.2 Availability of power from CGS 258 8.6.7.3 Energy purchase from other sources: 262 8.6.8 Interest and financing charges: 266 8.6.9 Analysis 270 8.6.10 Other interest charges 273 8.7 Depreciation 274 8.7.1 Analysis 275
8.8 Employee cost 278 8.8.1 Analysis 281
8.8.1.2 Comparison of cost structure 285 8.9 A & G Expenses 289
8.9.1 Analysis 290 8.10 Repair and Maintenance Expenses: 292 8.11 Return on Equity 294
8.11.1 Analysis 295 8.12 Expenses and Interest Capitalized 297 8.13 Aggregate Revenue Requirements 297 8.14 Order of the Commission 298 8.15 Tariff petitions & tariff revision orders 299 8.16 Conclusion 300
Chapter – 9 MAJOR FINDINGS, SUGGESTIONS AND CONCLUSIONS
9.1 Introduction 302 9.2 Major Findings 302 9.2.1 Aggregate Revenue Requirement & Expected 302
Revenue from Charges (ARR & ERC) 9.2.2 Truing up 303 9.2.3 Variation in Industrial tariff 304 9.2.4 Capital Investments 305 9.2.5 Reduction in T&D Loss 308 9.2.6 Interest burden of KSEB reduced 309 9.2.7 Energy sale forecast 310 9.2.8 Optimum Scheduling of Internal Generation 311 9.2.9 TOD tariff 311 9.2.10 Power factor & other Incentives 313 9.2.11 Power Purchase optimization and Generation
Cost 313 9.2.12 Depreciation 315 9.2.13 Employee expenses 316 9.2.14 Reduction in penal charges 317 9.2.15 Interest for cash security 317 9.2.16 Transparent process of decision making 317
Contents
9.2.17 Open Access Order. 318 9.2.18 Appointment of Ombudsman and 318
Formation of CGRF 9.2.19 Services 319 9.2.20 Performance Standards for Licensees in
the State 319 9.2.21 Non-compliance to Multi Year Tariff
framework regulations 322 9.2.22 Violation of timelines for submission of
Application for ARR and ERC filing 328 9.2.23 Regulation issued by the commission 328 9.2.24 Segregation of Accounts for Generation,
Transmission, Distribution and Supply 329 9.2.25 Cross Subsidy 330 9.2.26 Subsidy 333 9.2.27 Regulatory Asset 335 9.2.28 Revised filings for FY2009-10 336 9.2.29 Continued non-compliance to Commission
Orders 337 9.3 Suggestions 338 9.4 Conclusions 339
Bibliography i – xi
Annexure – I xii-xiv
Annexure – II xv
Annexure – III xvi-xvii
Annexure – IV xviii-xxxiv
Annexure – V xxxv-xxxviii
Annexure – VI xxxix-xxxxi
List of Tables
i
LIST OF TABLES
Table
No. Table Title
Page
No.
1.1 Plan-wise growth of generation capacity 8
1.2 Growth of Kerala Power System 18
3.1 World marketed energy consumption by country grouping ,
2007-2035(quadrillion Btu) 74
3.2 World gross product by country grouping 2007-2035 91
4.1 Cost of supply and its composition for public utilities 127
5.1 Cost and Energy Flows in the Power Sector 129
5.2 Examples of disallowance by RCs (Rs. Crores) 150
5.3 Cost to serve in AP, External subsidy and tariff 172
7.1 Contributions by INDAL’S Smelter 211
8.1 Details of ARR & ERC approved by KSERC 217
8.2 Performance under capital expenditure 2006-07 to 2009-10 225
8.3 Status of Ongoing Projects 226
8.4 Physical target and Achievement in Transmission capital
expenditure 227
8.5 Capital expenditure proposed in ARR and actual (2002-03 to
2009-10) 229
8.6 Estimated Energy Sales by KSEB 230
8.7 Growth rate of energy sales 232
8.8 Approved Energy Sales for 2010-11 234
8.9 Loss reduction achieved by KSEB 235
8.10 Physical Targets Achieved by the Board 237
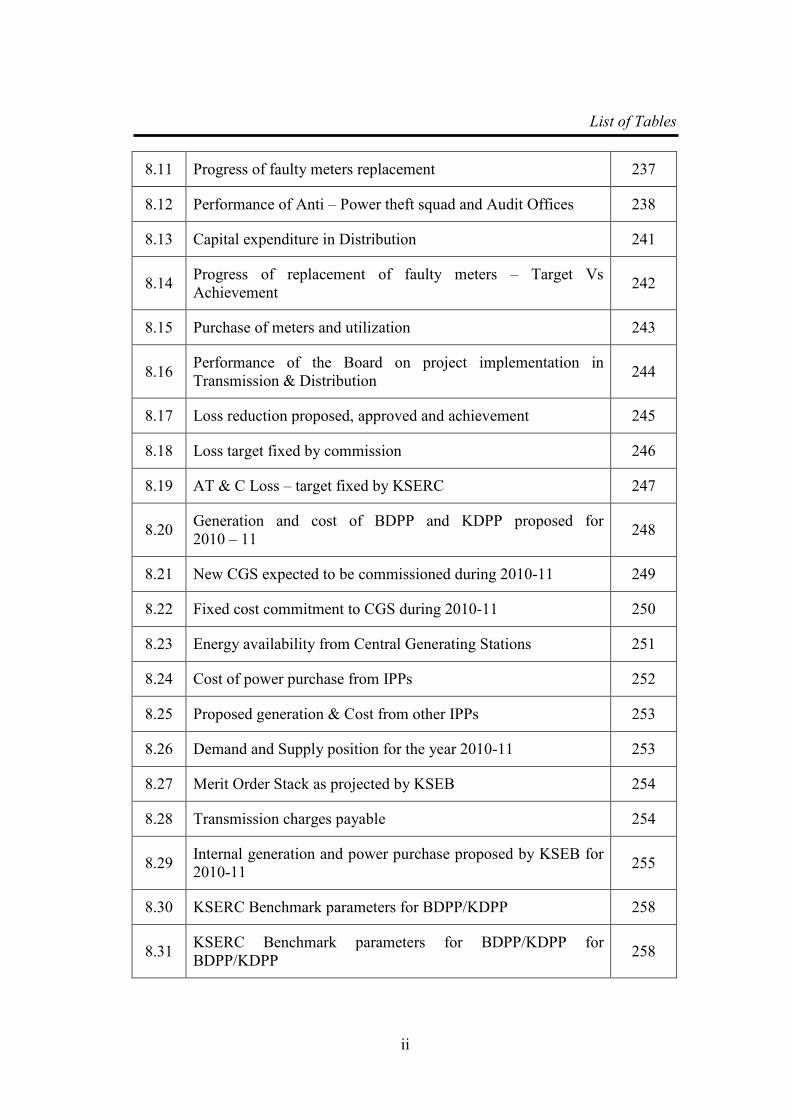
List of Tables
ii
8.11 Progress of faulty meters replacement 237
8.12 Performance of Anti – Power theft squad and Audit Offices 238
8.13 Capital expenditure in Distribution 241
8.14 Progress of replacement of faulty meters – Target Vs
Achievement 242
8.15 Purchase of meters and utilization 243
8.16 Performance of the Board on project implementation in
Transmission & Distribution 244
8.17 Loss reduction proposed, approved and achievement 245
8.18 Loss target fixed by commission 246
8.19 AT & C Loss – target fixed by KSERC 247
8.20 Generation and cost of BDPP and KDPP proposed for
2010 – 11 248
8.21 New CGS expected to be commissioned during 2010-11 249
8.22 Fixed cost commitment to CGS during 2010-11 250
8.23 Energy availability from Central Generating Stations 251
8.24 Cost of power purchase from IPPs 252
8.25 Proposed generation & Cost from other IPPs 253
8.26 Demand and Supply position for the year 2010-11 253
8.27 Merit Order Stack as projected by KSEB 254
8.28 Transmission charges payable 254
8.29 Internal generation and power purchase proposed by KSEB for
2010-11 255
8.30 KSERC Benchmark parameters for BDPP/KDPP 258
8.31 KSERC Benchmark parameters for BDPP/KDPP for
BDPP/KDPP 258
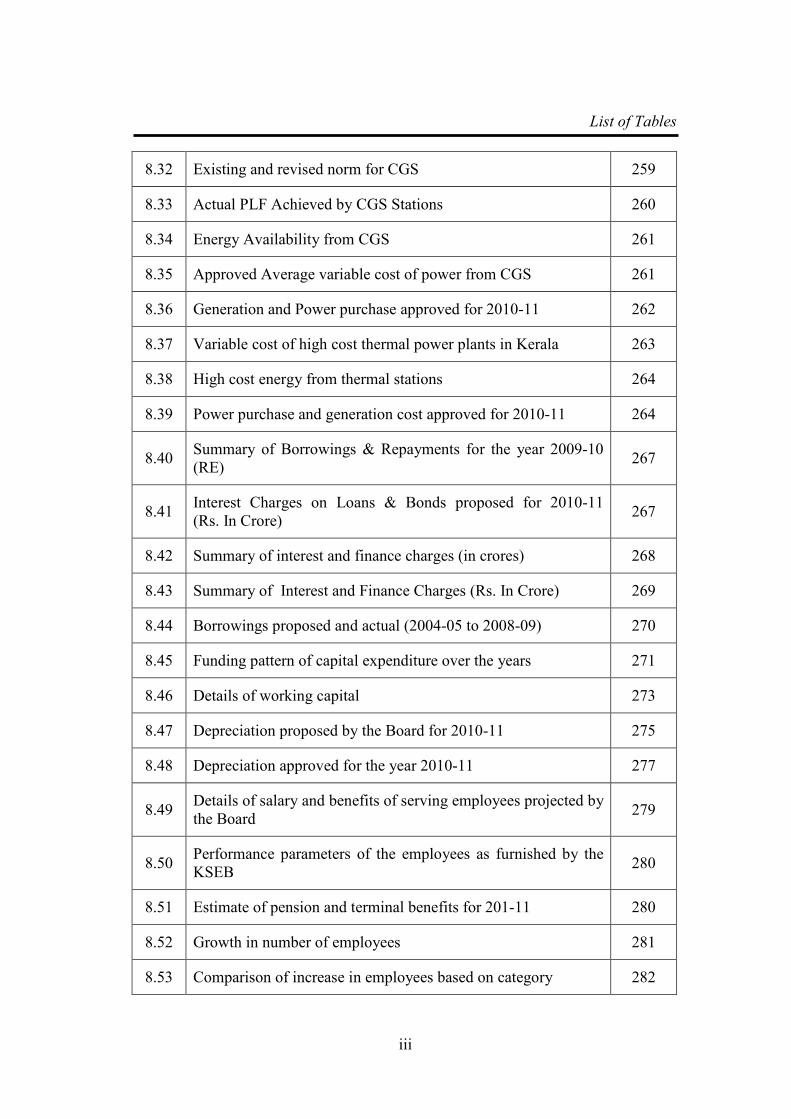
List of Tables
iii
8.32 Existing and revised norm for CGS 259
8.33 Actual PLF Achieved by CGS Stations 260
8.34 Energy Availability from CGS 261
8.35 Approved Average variable cost of power from CGS 261
8.36 Generation and Power purchase approved for 2010-11 262
8.37 Variable cost of high cost thermal power plants in Kerala 263
8.38 High cost energy from thermal stations 264
8.39 Power purchase and generation cost approved for 2010-11 264
8.40 Summary of Borrowings & Repayments for the year 2009-10
(RE) 267
8.41 Interest Charges on Loans & Bonds proposed for 2010-11
(Rs. In Crore) 267
8.42 Summary of interest and finance charges (in crores) 268
8.43 Summary of Interest and Finance Charges (Rs. In Crore) 269
8.44 Borrowings proposed and actual (2004-05 to 2008-09) 270
8.45 Funding pattern of capital expenditure over the years 271
8.46 Details of working capital 273
8.47 Depreciation proposed by the Board for 2010-11 275
8.48 Depreciation approved for the year 2010-11 277
8.49 Details of salary and benefits of serving employees projected by
the Board 279
8.50 Performance parameters of the employees as furnished by the
KSEB 280
8.51 Estimate of pension and terminal benefits for 201-11 280
8.52 Growth in number of employees 281
8.53 Comparison of increase in employees based on category 282
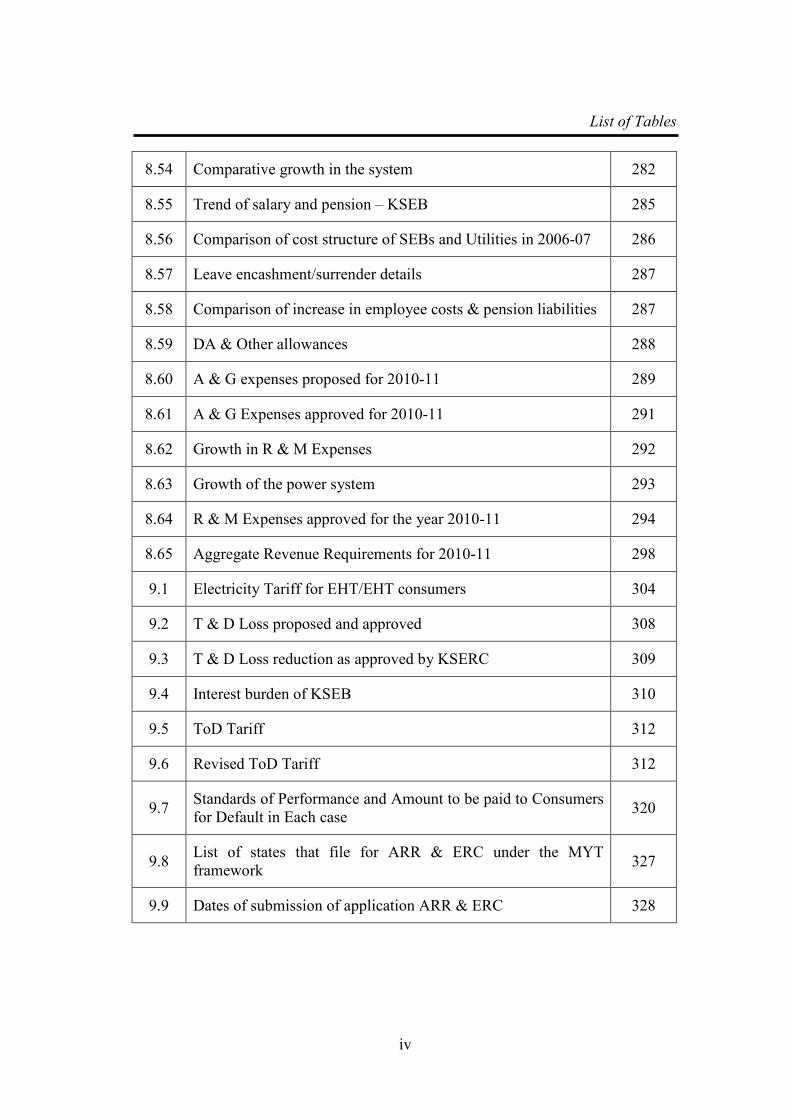
List of Tables
iv
8.54 Comparative growth in the system 282
8.55 Trend of salary and pension – KSEB 285
8.56 Comparison of cost structure of SEBs and Utilities in 2006-07 286
8.57 Leave encashment/surrender details 287
8.58 Comparison of increase in employee costs & pension liabilities 287
8.59 DA & Other allowances 288
8.60 A & G expenses proposed for 2010-11 289
8.61 A & G Expenses approved for 2010-11 291
8.62 Growth in R & M Expenses 292
8.63 Growth of the power system 293
8.64 R & M Expenses approved for the year 2010-11 294
8.65 Aggregate Revenue Requirements for 2010-11 298
9.1 Electricity Tariff for EHT/EHT consumers 304
9.2 T & D Loss proposed and approved 308
9.3 T & D Loss reduction as approved by KSERC 309
9.4 Interest burden of KSEB 310
9.5 ToD Tariff 312
9.6 Revised ToD Tariff 312
9.7 Standards of Performance and Amount to be paid to Consumers
for Default in Each case 320
9.8 List of states that file for ARR & ERC under the MYT
framework 327
9.9 Dates of submission of application ARR & ERC 328
List of Figures
v
LIST OF FIGURES
Figure
No. Figure Title Page No.
1.1 Total installed capacity of power in India 162366 MW 7
1.2 Thermal Power Generation in India -104424 MW 8
1.3 Planwise Growth of Hydro Power in India 9
1.4 Growth of installed capacity of power in Kerala 19
1.5 Growth of capacity, consumers and per capita consumption 20
1.6 Load Curve - Kerala Power System 22
1.7 Peak Power and Energy Shortages in States/UTs. In 2004-05 22
2.1 Pre and post EA 2003 Market design 47
2.2 Segment-wise impact of Electricity Act-2003 in different
segment of electricity 48
3.1 World marketed energy consumption , 1990-2035
( quadrillion Btu) 74
3.2 World marketed energy consumption OECD & non-OECD
countries. 75
3.3 Shares of world energy consumption in the US, China, and
India.1990-2035(Percent of world total) 76
3.4 Marketed energy use in Non-OECD economies by region,
1990-2035 77
3.5 World marketed energy use by fuel type, 1990-2035
(quadrillion Btu) 78
3.6 Coal consumption in selected world regions, 1990-2035
(quadrillion Btu) 80
3.7 World electricity generation by fuel, 2007-2035 (trillion kilo
watt hours) 81
List of Figures
vi
3.8 Renewable electricity generation in China by energy source,
2007-2035 (billion Kilowatt-hours) 84
3.9 World nuclear generating capacity by region,2007 and
2035((gigawatts) 84
3.10 OECD and Non OECD total Gross domestic product, 1990-
2035 (trillion 2005 U.S. dollars) 90
3.11 World Marketed Energy Consumption in three economic
growth cases 1990-2035 100
3.12 World oil prices in three various cases (dollar/barrel) 100
3.13 World marketed energy consumption in three oil price cases 101
3.14 World marketed energy consumption by fuel in three oil
price cases 102
3.15 World liquid fuel consumption by sector in three price cases 102
4.1 DERC-UI Rates as on 31-03-2007 115
4.2 ABT Impact – Improvement in frequency fluctuation 115
5.1 Stages in Tariff Determination for SEB 139
5.2 Trends in cost of supply, agricultural and industrial tariff 160
6.1 Organisation Chart of KSERC 178
7.1 Typical arrangement of Electrolytic cell for making
aluminium 196
7.2 Comparison of Electricity tariff – Aluminium smelters 199
7.3
Comparison of cost of production before and after the tariff
hike imposed in October 2002 201
7.4 Split up of cost of production before and after the tariff hike 202
7.5 Tariff hike imposed on EHT consumers during 1997-2002 207
8.1 Tariff variation 1997-2010 300

List of Figures
vii
Chapter – I Introduction
1
CHAPTER-1
INTRODUCTION
Electricity is the prime mover of a modern society. It is regarded as the
lifeblood of economic activities. Electricity is an essential requirement for all facets
of our life. It has been recognized as a basic human need. It is a critical infrastructure
on which the socio-economic development of the country depends. Supply of
electricity at reasonable rate to rural India is essential for its overall development. In
the first hundred years of its commercialization, electricity was supplied to
consumers by vertically integrated monopolies. It was generally felt that this was the
only feasible option due to complexity as commodity and its natural monopoly
aspects.
It is one of the major infrastructural facilities required for setting up
manufacturing industries in the country. Generation of electricity in Kerala was
mainly focused on hydroelectric potential, started with the installation of Pallivasal
hydroelectric project by the Maharajah of erstwhile Travancore State in the year
1939. Electricity was comparatively very cheap and a number of major Industries
were attracted to the state of Travancore in 1940s and to the State of Kerala in the
subsequent decades. After the successful commissioning of Pallivasal Hydroelectric
Project, a number of major hydroelectric schemes were executed in the State
including Idukki (760 MW) and Sabarigiri (320 MW). The pace of development of
hydroelectric power projects was slowed down due to environmental and other
sociopolitical considerations. As a result, the state of Kerala was compelled to set up
thermal power stations and to depend on central share from central generating
stations (CGS), which are mainly coal based stations, to meet the demand and as a
result the average cost of electricity/per unit in the state has increased considerably.
Kerala State is gifted by nature with two monsoons and other sporadic rains,
having good yield of water from its 44 rivers with good number of streams and
tributaries. The maximum rainfall occurring in the high ranges is 7620 mm and the
Chapter – I Introduction
2
average is 3065 mm. The annual water yield is not experiencing much variation.
Out of 4000 MW of estimated hydroelectric power potential in the state, only 45 %
has been tapped so far. In other words, vast potential for hydroelectric power
generation schemes is available in the state for exploitation. The main natural
resource that Kerala can depend for power generation is water, especially in the
absence of other resources in the state for power generation. Water is replenished
every year during the two monsoon periods. The quantity of rainfall occurring in a
particular region is only experiencing slight variation annually. Therefore, the
availability of water for power generation is fairly dependable. Since water is
received from nature, generally no separate cost is considered for it as a raw material,
when used for various purposes, including power generation. Therefore, the cost of
energy generated from hydropower station is relatively very less. The repeated
increases in cost of fuel at the places of production would result in the increase in
cost of production of power every year. In India, the price of oil alone has become
more than the double in the last decade.
Since the power generated from hydroelectric stations depend up on the head
available, more power could be generated from same quantity of water in schemes
having higher heads. So also, more quantity of water will be required for generating
same quantity of power in low head schemes. The potential head of water available
and its quantity are nature’s gift. But in the case of fossil fuel based stations the
quantum of energy that could be generated from a measure of fuel is limited and also
depend on the quality of fuel (calorific value) and efficiency of equipment. Out of the
ten numbers of major hydroelectric projects so far completed in Kerala, the
Idamalayar Project, which has the lowest head of 110 metres, requires 4000 litres of
water for generating one unit of energy, whereas Sabarigiri Project having a head of
750 metres requires only 620 Litres.
All rivers and their tributaries originate from high ranges on the eastern side
of Kerala, flowing down to lower reaches and finally joins the sea. The same
water could be repeatedly be utilised for power generation in all power stations
formed along the course of the river by making use of the height difference of
Chapter – I Introduction
3
terrain at different locations. But in the case of fossil fuels, once when used for any
purpose, they are lost forever.
The life span or serviceable period of structures and station equipment of
hydel projects is very much longer than other types. The life expectancy of a hydel
power station is 100 years whereas that of thermal station is only 25 to 30 years.
However, the growth of hydroelectric power sector in the state depicts a
dismal picture mainly because of the problems associated with acquisition of
forestland, rehabilitation of people and other environmental considerations and
issues. However, in the context of global warming, development of non-polluting
hydel projects attain paramount importance. The average cost of power generated
from hydroelectric power plants is very less compared to thermal stations. Estimated
variable cost of hydel power as projected by KSEB for 2010-11 was almost zero
paise per unit (Refer table no. 8.27 – Merit order stack as projected by KSEB)
Affordability of Electricity Tariff is the one of most important factors, which
decides the survival of industrial units, especially the power intensive ones.
Electricity Tariff fixation in Kerala was done by State Government as per the
proposal of Kerala State Electricity Board (KSEB). The Government seldom
questioned the reasons for poor efficiency and the spiraling increase in the cost of
KSEB before tariff approval. The tariff setting process has changed totally after the
setting up of Kerala State Electricity Regulatory Commission (KSERC) in November
2002. Now, the efficiencies and costs of KSEB are subjected to close scrutiny by the
commission as well as public as the tariff fixing process was made totally transparent
as per the Electricity Act-2003. Arresting the steep increase in electricity tariff,
which was in vogue for a decade, and maintaining it at the same level for almost
another decade is the single largest achievement the regulatory regime (KSERC) in
Kerala. It has prevented closure of several industries in the state. This is not a simple
achievement when we compare the functioning of KSEB as a monopoly public
sector utility in the past decades. But this is not properly realized and appreciated by
the public and media. KSEB has now started to realize the power of KSERC, though
Chapter – I Introduction
4
belatedly. The pivotal theme of this research work is the impact of regulatory regime
in Kerala’s power sector.
1.1 Review of Indian Power Sector
1.1.1 Introduction
The electricity sector in India is predominantly controlled by the Government
of India's public sector undertakings (PSUs). Major PSUs involved in the generation
of electricity include National Thermal Power Corporation (NTPC), National
Hydroelectric Power Corporation (NHPC) and Nuclear Power Corporation of India
(NPCI). Besides PSUs, several state-level corporations, such as Maharashtra State
Electricty board (MSEB), Kerala State Electicty Board (KSEB), Tamil Nadu State
Electricity Board (TNEB), Gujarat State Electricity Board (four distribution
Companies viz. MGVCL, PGVCL, DGVCL and UGVCL, one controlling body
GUVNL, and one generation company GSEC) are also involved in the generation
and intra-state distribution of electricity. The Power Grid Corporation of India
limited (PGCIL) is responsible for the inter-state transmission of electricity and the
development of national grid.
The Ministry of Power is the apex body responsible for the development of
electrical energy in India. This ministry started functioning independently from
2 July 1992, earlier it was known as the Ministry of Energy.
India is world's 6th largest energy consumer, accounting for 3.4 % of global
energy consumption. Due to India's economic rise, the demand for energy has grown
at an average of 3.6% per annum over the past 30 years. In June 2010, the installed
power generation capacity of India stood at 162,366 MW, while the per capita energy
consumption stood at 612 kWh (Units). The country's annual energy production
increased from about 190 billion units (kWh) in 1986 to more than 680 billion units
(kWh) in 2006. The Indian government has set an ambitious target to add
approximately 78,000 MW of installed generation capacity by 2012. The total
demand for electricity in India is expected to cross 950,000 MW by 2030. About
Chapter – I Introduction
5
70% of the electricity consumed in India is generated by thermal power plants, 21%
by hydroelectric power plants and and 4% by nuclear power plants. More than 50 %
of India's commercial energy demand is met through the country's vast coal reserves.
The country has also invested heavily in the recent years on renewable sources of
energy such as wind energy. As of 2008, India's installed wind power generation
capacity stood at 9,655 MW. Additionally, India has committed massive amount of
funds for the construction of various nuclear reactors which would generate at least
30,000 MW. In July 2009, India unveiled a $19 billion plan to produce 20,000 MW
of solar power by 2020.
Electricity losses in India during transmission and distribution are extremely
high and vary between 30 to 45%. In 2004-05, electricity demand outstripped supply
by 7-11%. Due to shortage of electricity, power cuts are common throughout India
and this has adversely affected the country's economic growth.Theft of electricity
which is common in most parts of urban India, amounts to 1.5% of India's GDP.
Despite an ambitious rural electrification program, some 400 million Indians lose
electricity access during blackouts.While 80 percent of Indian villages have at least
an electricity line, just 44 percent of rural households only have access to electricity.
According to a sample of 97,882 households carried out in 2002, electricity was the
main source of lighting for 53% of rural households compared to 36% in 1993. Multi
Commodity Exchange has sought permission to offer electricity future markets.
1.1.2 Power Generation Details (June-2010)
Grand Total Installed Capacity is 1,62,366 MW (Figure 1.1 to 1.3 for details)
1.1.2.1 Thermal Power
• Current installed capacity of Thermal Power as of June 2010 is 1,04,424
MW which is 64 % of total installed capacity.
• Current installed base of Coal Based Thermal Power is 86003 MW which
comes to 53% of total installed base.
• Current installed base of Gas Based Thermal Power is 17,221 MW which
is 10.61% of total installed base.

Chapter – I Introduction
6
• Current installed base of Oil Based Thermal Power is 1,199.75 MW
which is 0.74% of total installed base.
• The state of Maharashtra is the largest producer of thermal power in the
country.
1.1.2.2 Hydro Power
India was one of the pioneering countries in establishing hydroelectric power
plants. The power plants at Darjeeling and Shimsha (Shivanasamudra) were
established in 1898 and 1902 respectively and are regarded as first hydel plants in
Asia. The installed capacity as of 2008 was approximately 36877.76 MW. The public
sector has a predominant share of 97% in Hydel Sector.
1.1.2.3 Nuclear Power
As of June 2010, seventeen nuclear power plants in India produce 4,560 MW (2.81%
of total installed base) electricity. Nuclear power is the fourth largest source of
electricity in India after thermal, hydro and renewable sources of electricity. By the
end of 2011, the number of nuclear power plants in operation in the country would
be twenty with a combined installed capacity of 4780 MW. The Centre had given a
financial sanction of Rs 24,000 crore in October 2009 for building four units of 700
MW of PHWRs (Pressurised Heavy Water Reactors), two each at Kakrapar and
Rawatbhata in Rajasthan and the construction is in progress. NPCIL is building two
nos., 1000 MW nuclear power plants at Koodamkulam; first unit is expected to be
commissioned by the end of 2011 followed by the second unit by middle of 2012.
With the progressive completion of the Kudankulam reactors and the four 700 MW
PHWRs at Kakrapar and Rawatbhata, the installed nuclear power capacity of NPCIL
is expected to reach 9,580 MW by 2016. India is now involved in the development of
fusion reactors through its participation in the ITER (International Thermonuclear
Experimental Reactor) Project. Since early 1990s, Russia has been a major source of
nuclear fuel to India. Due to dwindling domestic uranium reserves, electricity
generation from nuclear power in India declined by 12.83 % from 2006 to 2008.
Following a waiver from Nuclear Suppliers Group (NSG) in September 2008 which
allowed the country to commence International Nuclear Trade, India has signed
Chapter – I Introduction
7
nuclear deals with several other countries including France, United States, United
Kingdom, Canada, Namibia, Mongolia, Argentina, and Kazakhstan in February
2009. India has also signed a $700 million deal with Russia for the supply of 2000
tonnes of nuclear fuel. India has drawn up an ambitious plan to reach a nuclear
power capacity of 63,000 MW in 2032 by setting up of 16 indigenous Pressurised
Heavy Water Reactors (PHWR) each, including ten based on reprocessed uranium.
India would export 220 MW, 540 MW and 700 MW, PHWRs by 2032. Beyond
2032, large capacity addition would be taken up by setting up metallic fuel FBRs and
introduction of reactors based on thorium 232 and uranium 233 fuel cycle. Crrently,
India was in a position for setting up its export model 220 MW PHWR in friendly
countries
1.1.2.4 Renewable Power
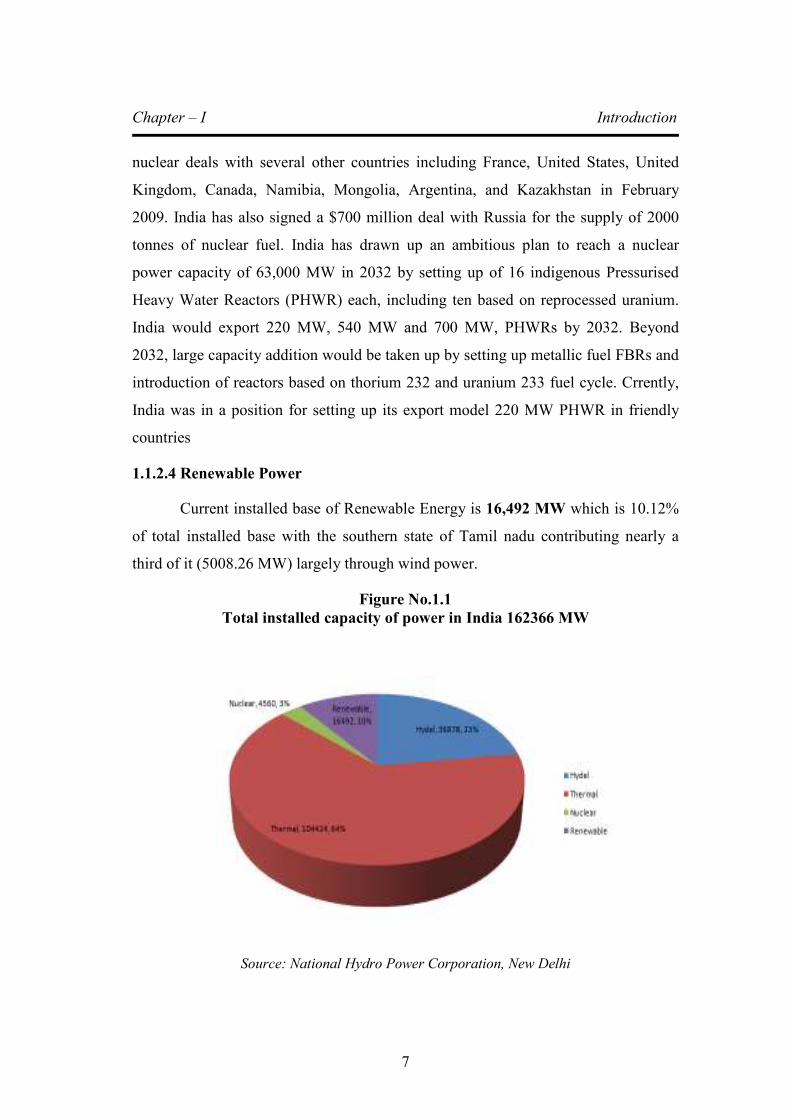
Current installed base of Renewable Energy is 16,492 MW which is 10.12%
of total installed base with the southern state of Tamil nadu contributing nearly a
third of it (5008.26 MW) largely through wind power.
Figure No.1.1
Total installed capacity of power in India 162366 MW
Source: National Hydro Power Corporation, New Delhi

Chapter – I Introduction
8
Figure 1.2
Thermal Power Generation in India -104424 MW
Source: National Hydro Power Corporation, New Delhi
Table 1.1
Plan-wise growth of generation capacity
Source: National Hydropower Development Corporation, New Delhi
Chapter – I Introduction
9
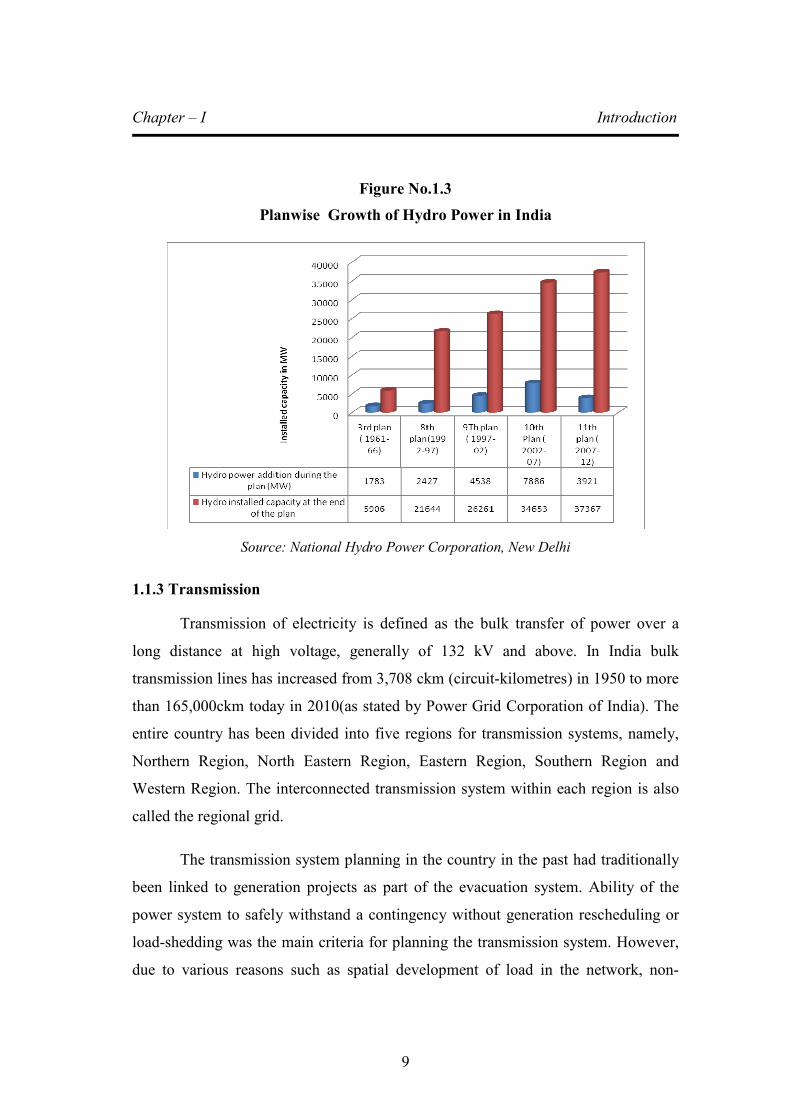
Figure No.1.3
Planwise Growth of Hydro Power in India
Source: National Hydro Power Corporation, New Delhi
1.1.3 Transmission
Transmission of electricity is defined as the bulk transfer of power over a
long distance at high voltage, generally of 132 kV and above. In India bulk
transmission lines has increased from 3,708 ckm (circuit-kilometres) in 1950 to more
than 165,000ckm today in 2010(as stated by Power Grid Corporation of India). The
entire country has been divided into five regions for transmission systems, namely,
Northern Region, North Eastern Region, Eastern Region, Southern Region and
Western Region. The interconnected transmission system within each region is also
called the regional grid.
The transmission system planning in the country in the past had traditionally
been linked to generation projects as part of the evacuation system. Ability of the
power system to safely withstand a contingency without generation rescheduling or
load-shedding was the main criteria for planning the transmission system. However,
due to various reasons such as spatial development of load in the network, non-
Chapter – I Introduction
10
commissioning of load center and generating units originally planned and deficit in
reactive compensation, certain pockets in the power system could not safely operate
even under normal conditions. This had necessitated backing down of generation and
operating at a lower load generation balance in the past. Transmission planning has
therefore moved away from the earlier generation evacuation system planning to
integrated system planning.
While the predominant technology for electricity transmission and
distribution has been Alternating Current (AC) technology, High Voltage Direct
Current (HVDC) technology has also been used for interconnection of all regional
grids across the country and for bulk transmission of power over long distances.
Certain provisions in the Electricity Act 2003 such as open access to the
transmission and distribution network, recognition of power trading as a distinct
activity, the liberal definition of a captive generating plant and provision for supply
in rural areas are expected to introduce and encourage competition in the electricity
sector. It is expected that all the above measures on the generation, transmission and
distribution front would result in formation of a robust electricity grid in the country.
1.1.4 Distribution
The total installed generating capacity in the country is 1,62,366 MW as of
June 2010 and the total number of consumers is over 144 million. Apart from an
extensive transmission system network, at 500 kV HVDC, 400kV, 220kV, 132kV,
110 kV and 66kV, which has developed to transmit the power from generating
stations to the grid substations, a vast network of sub-transmission in distribution
system has also come up for utilisation of the power by the ultimate consumers.
However, due to lack of adequate investment on transmission and distribution
(T&D) networks, the T&D losses have been consistently on the higher side, and
reached to the level of 32.86% in the year 2000-01. The reduction of these losses was
essential to bring economic viability to the State Utilities.

Chapter – I Introduction
11
As the T&D loss was not able to capture all the losses in the net work,
concept of Aggregate Technical and Commercial (AT&C) loss was introduced.
AT&C loss captures technical as well as commercial losses in the network and is a
true indicator of total losses in the system.
High technical losses in the system are primarily due to inadequate
investments over the years for system improvement works, which has resulted in
unplanned extensions of the distribution lines, overloading of the system elements
like transformers and conductors, and lack of adequate reactive power support.
The commercial losses are mainly due to low metering efficiency, theft &
pilferages. This may be eliminated by improving metering efficiency, proper energy
accounting & auditing and improved billing & collection efficiency. Fixing of
accountability of the personnel / feeder managers may help considerably in reduction
of AT&C loss.With the initiative of the Government of India and of the States, the
Accelerated Power Development & Reform Programme (APDRP) was launched in
2001, for the strengthening of Sub-transmission and Distribution network and
reduction in AT&C losses. The main objective of the programme was to bring
Aggregate Technical & Commercial (AT&C) losses below 15% in five years in
urban and in high-density areas. The programme, along with other initiatives of the
Government of India and of the States, has led to reduction in the overall AT&C loss
from 38.86% in 2001-02 to 34.54% in 2005-06. The commercial loss of the State
Power Utilities reduced significantly during this period from Rs. 29331 Crores Rs.
19546 Crore. The loss as percentage of turnover was reduced from 33% in 2000-01
to 16.60% in 2005-06.
The APDRP programme is being restructured by the Government of India, so
that the desired level of 15% AT&C loss could be achieved by the end of 11th plan.
1.2 Power for ALL by 2012
The Government of India has an ambitious mission of ‘POWER FOR ALL
BY 2012’. This mission would require that the installed generation capacity should
Chapter – I Introduction
12
be at least 200,000 MW by 2012 from the present level of 162,366 MW. Power
requirement in India is expected to double by 2020 to 400,000 MW. The country's
National Electricity Policy wants the entire billion plus population to have access to
power by 2012 and to raise the per capita availability of electricity by nearly 50
percent. This goal requires another 40000 MW of capacity by 2012. The Indian
economy is growing at one of the fastest rates in the world. This leads to a high
demand for additional energy, in particular electricity, at the rate of 9 percent every
year. India's electricity consumption is sixth globally and third in Asia with 612 units
of per capita consumption per annum. It is set to increase to 1,000 units per annum
by 2012. The power generation capacity has to grow by at least 10 percent to sustain
the current GDP growth of 9 percent, say industry experts. Ideally, they say, the ratio
of energy generation and GDP growth should be 1:1.
The government has set an ambitious capacity addition target of 78,557 MW
during the country's 11th five-year economic plan period (2007-12). The envisaged
capacity addition of over 76,000 MW comprises 58,644 MW or 75 percent in
thermal, 16,553 MW or 21 percent in hydropower and 3,380 MW or 4 percent in
nuclear power. Currently, 44,000 MW is under construction.
However, most experts dismiss this target as unrealistic given the country's
past track record. During the 10th plan period (2002-07), which ended in March, the
country could add just half of the targeted 41,000 MW. The story was not different
during the ninth plan period (1997-2002), when only 19,000 MW or less than half
the target was achieved.
On the distribution front too, there has been little solace in the overall
transmission and distribution losses or the broader measure of aggregate technical
and commercial losses. Over a third of the power generated fails to reach the
consumer. The transmission segment also requires massive investment to boost
capacity. The power sector will need investment of around $100 billion if it goes in
for a capacity addition of 78,000 MW during the 11th Plan period. Of the total
amount, $50 billion would alone be needed for raising the generation capacity while
Chapter – I Introduction
13
the rest would be required for transmission, distribution and related activities, says
India's top bureaucrat in the power sector, R.V.Shahi. As such, the government's
slogan of ‘Power for all by 2012’ sounds increasingly problematic.
However, one bright spot in this dismal scenario is that nuclear power and
wind energy is looking up. India's emerging nuclear power sector received a major
boost in mid-2006 when it signed a civilian nuclear cooperation agreement with the
United States. The government recently announced plans for massive investments in
nuclear power plants by 2030. Country is planning to reach its nuclear generation
capacity 20,000 MW and scale it up to 40,000 MW by 2030 according to the
Chairman, Atomic Energy Commission.
As for wind energy, India has emerged as the world's fifth-largest wind
energy producer. Today, windmills dot the landscape in several southern and western
states such as Tamil Nadu, Rajasthan, Gujarat and Maharashtra, producing a total of
6,000 MW of power. So far, wind energy accounts for a meager one percent of the
total power produced in the country. Over the next five years, wind energy
generation is expected to be more than double, with the addition of 8,000 MW to the
existing capacity. That is still far short of India's potential wind-power generation,
which has been estimated at 45,000 MW.
1.2.1 Objectives “Power for ALL by 2012”
• Sufficient power to achieve GDP growth rate of 8%
• Reliable power
• Quality power
• Optimum power cost
• Commercial viability of power industry
• Power for all
Chapter – I Introduction
14
1.2.2 Strategies
• Power Generation Strategy with focus on low cost generation,
optimization of capacity utilization, controlling the input cost, optimisation
of fuel mix, Technology upgradation and utilization of Non-conventional
energy sources
• Transmission Strategy with focus on development of National Grid
including Interstate connections, Technology upgradation & optimization of
transmission cost.
• Distribution strategy to achieve Distribution Reforms with focus on
System upgradation, loss reduction, theft control, consumer service
orientation, quality power supply, commercialization, decentralized
distributed generation and supply for rural areas.
• Regulation Strategy aimed at protecting consumer interests and making
the sector commercially viable.
• Financing Strategy to generate resources for required growth of the power
sector.
• Conservation Strategy to optimise the utilization of electricity with focus
on Demand Side management, Load management and Technology
upgradation to provide energy efficient equipment / gadgets.
• Communication Strategy for political consensus with media support to
enhance the general public awareness.,
1.3 Industrial Power Consumption in Kerala
Electricity at cheaper rate was the sole reason for attracting manufacturing
industries to the state of Kerala till 1980s. After the commissioning of 780 MW
capacity Idukki Hydroelectric Project in 1976, not a single project of similar
Chapter – I Introduction
15
capacity was executed in Kerala’s Hydel Power Sector. The state started
witnessing acute power shortages right from 1983 onwards mainly because of the
demand – supply mismatch. In other words, the additional power generation
actually taken place was much less compared to the ever-increasing demand of
electricity. The reasons for steady increase in demand are mainly attributed to the
following:
(a) Lower price of electricity mainly in the agriculture and the residential sectors
as compared to the real cost of supply of electricity
(b) Increased personal income and penetration of consumer durables,
(c) Rapid pace of urbanization
(d) Level of activity in individual electricity using sectors,
(e) Increasing penetration of irrigation pump-sets due to mechanization of
agriculture
(f) Changes in the composition of GDP, and
(g) Changes in technology.
The industrial electricity consumption in Kerala was about 60 % of the total
consumption during early 1980s. At present the industrial electricity consumption by
the High Tension (HT) & Extra High Tension (EHT) consumers account for 28 % of
the total energy sales to the consumers by KSEB and they contribute about 37 % of
the total revenue collected from tariffs. The contributing factors for a comparative
low level of industrial consumption are the permanent closure of power intensive
manufacturing industries on account of unaffordable tariff and increase in domestic
and commercial consumption due to increase in pace of urbanisation and high level
of consumerism in the state and other factors mentioned above. The tariff as
applicable to the HT & EHT Industrial Electricity consumers is comparatively higher
than domestic or agricultural tariff even though the actual cost of supply or the ‘cost
to serve’ of industrial power per unit is much lesser than that of domestic,
agricultural and other low tension (LT) supply.
Chapter – I Introduction
16
Some characteristics of the Industrial consumers that benefit the Board are:
(a) They are the subsidising category of consumers for the Board. Hence they are
the revenue earners ensuring better returns for the Board.
(b) The Load curve and consumption pattern enable better capacity utilisation
and low Cost of Service for the Board in comparison to LT consumer
categories.
1.4 Kerala’s Power Sector & KSEB
1.4.1 Introduction
The Kerala State Electricity Board is the single statutory body in the state
responsible for generation, transmission and distribution of electricity in the state of
Kerala. The Kerala power system consists of 13 Hydel stations, 11 small Hydel
stations, 2 captive power plants, 2 thermal stations, 3 IPPs, and 1 windmill. The grid
is connected to the Southern Region Transmission system through two 400 kV
double circuit lines at Madakkathara and Thiruvananthapuram. There are 5 major
inter-state transmission lines. The major substations include one 400 KV sub-station,
and fourteen 220 KV substations and four 220kV substations are under construction.
The main grid comprises of the 220 KV systems.
The projected energy sale for the year 2010-11 is estimated as 14830.10MU.
The actual T&D loss within KSEB for the year 2008-09 was 18.83%. The projected
total energy requirement within the state for the year 2010-11 is 17821.18 MU
considering the regional losses, total energy requirement would be 18203.16 MU.
KSEB expect an overall increase of 1029.03MU (6%) during the year 2010-11 over
2009-10.The highest peak demand in the system met during the last year was 2911
MW on 2 November-2009, it was about 22% higher than the peak demand met
during previous year and on average basis annual growth is 6% over 2007-08. KSEB
expect the annual growth of 6% in peak demand during the year 2009-10 and 2010-
11 over the peak demand met during 2007-08 (the year without demand restriction /
power cut). The peak demand projection for the year 2010-11 is 3280 MW.
Chapter – I Introduction
17
The Kerala State Electricity Board (KSEB) is a statutory body constituted on
01-04-1957 under Section 5 of the Electricity Supply (Act), 1948 for the coordinated
development of Generation, Transmission and Distribution of electricity in the State
of Kerala. As per the provisions of the Electricity Act-2003, KSEB continued as a
State Transmission Utility (STU) and Distribution Licensee till 24-09-2008,
performing same functions of generation, transmission and distribution of electricity
within the State of Kerala. In exercise of powers conferred under sub-sections (1),
(2), (5), (6) and (7) of section 131 of the Electricity Act, 2003, State Government
vide the notification G.O (Ms). 37/2008/PD dated 25th September, 2008 has vested
all functions, properties, interests, rights, obligations and liabilities of KSEB with the
State Government till it is re-vested the same in a corporate entity. Accordingly,
KSEB has been continuing all the functions as a Generator, State Transmission
Utility and a Distribution Licensee in the State.
In tune with the increase in electricity demand of the State, KSEB has been
performing the planning and development of the power system over the years by
utilizing the resources in the State. As on March 2010, KSEB is catering the
electricity needs of about 99 lakhs consumers in the State.
As a Government owned public entity, KSEB has been implementing all the
policy directions of the State Government such as providing free electricity to
consumers below poverty line, giving priorities for service connections to weaker
sections in the society, subsidy to Agricultural consumers, Orphanages and other
eligible consumers as decided by the Government from time to time, tariff
concessions to Industrial sectors etc. KSEB has been implementing various schemes
formulated by Central Government such as APDRP, RGGVY schemes in the State
towards accomplishing the national goals such as cent percent household
electrification, electrification of all dwellings, settlements etc.
The growth of the Kerala power system during the last 50 years is given in the Table
No.1.1 below.
Chapter – I
Introduction
18
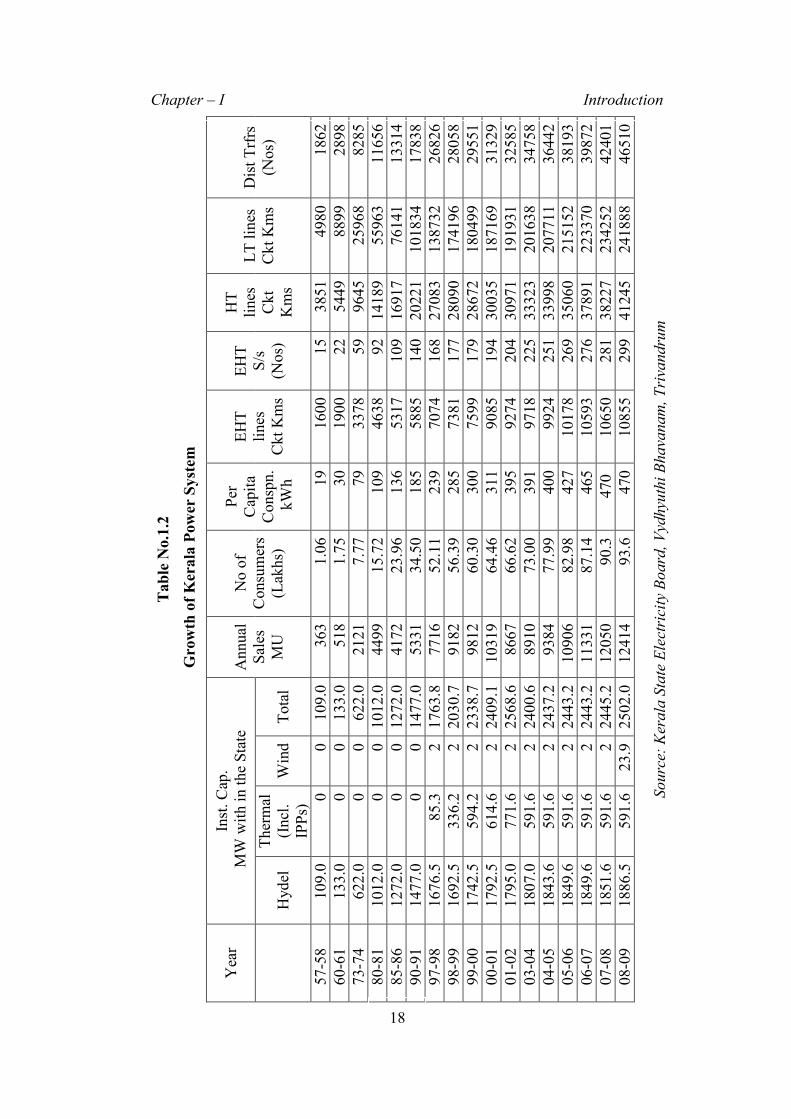
Table No.1.2
Growth of Kerala Power System
Year
Inst. Cap.
MW with in the State
Annual
Sales
MU
No of
Consumers
(Lakhs)
Per
Capita
Conspn.
kWh
EHT
lines
Ckt Kms
EHT
S/s
(Nos)
HT
lines
Ckt
Kms
LT lines
Ckt Kms
Dist Trfrs
(Nos)
Hydel
Thermal
(Incl.
IPPs)
Wind
Total
57-58
109.0
0
0
109.0
363
1.06
19
1600
15
3851
4980
1862
60-61
133.0
0
0
133.0
518
1.75
30
1900
22
5449
8899
2898
73-74
622.0
0
0
622.0
2121
7.77
79
3378
59
9645
25968
8285
80-81
1012.0
0
0 1012.0
4499
15.72
109
4638
92
14189
55963
11656
85-86
1272.0
0
0 1272.0
4172
23.96
136
5317
109
16917
76141
13314
90-91
1477.0
0
0 1477.0
5331
34.50
185
5885
140
20221
101834
17838
97-98
1676.5
85.3
2 1763.8
7716
52.11
239
7074
168
27083
138732
26826
98-99
1692.5
336.2
2 2030.7
9182
56.39
285
7381
177
28090
174196
28058
99-00
1742.5
594.2
2 2338.7
9812
60.30
300
7599
179
28672
180499
29551
00-01
1792.5
614.6
2 2409.1
10319
64.46
311
9085
194
30035
187169
31329
01-02
1795.0
771.6
2 2568.6
8667
66.62
395
9274
204
30971
191931
32585
03-04
1807.0
591.6
2 2400.6
8910
73.00
391
9718
225
33323
201638
34758
04-05
1843.6
591.6
2 2437.2
9384
77.99
400
9924
251
33998
207711
36442
05-06
1849.6
591.6
2 2443.2
10906
82.98
427
10178
269
35060
215152
38193
06-07
1849.6
591.6
2 2443.2
11331
87.14
465
10593
276
37891
223370
39872
07-08
1851.6
591.6
2 2445.2
12050
90.3
470
10650
281 38227
234252
42401
08-09
1886.5
591.6
23.9 2502.0
12414
93.6
470
10855
299
41245
241888
46510
Source: Kerala State Electricity Board, Vydhyuthi Bhavanam, Trivandrum
Chapter – I Introduction
18
Chapter – I Introduction
19
The consumer strength has increased from 1.06 lakhs in 1957 to 93.6 lakhs in
March 2009. The installed capacity with in the State has increased from 109 MW in
1957 to 2502 MW in 2008-09. In addition to this, KSEB has an allocation of about
1041 MW from Central Generating Stations of NTPC, NLC and NPC.
1.4.2 Features of Kerala Power System
The Kerala Power system has certain unique characteristics, which are
adverse to the efficient functioning of the system. Kerala is relatively poor in energy
resources. There are no known reserves of coal, oil or similar fossil fuels in Kerala.
The main source of energy in Kerala is its hydro electric potential. By harnessing just
1886.5 MW of the vast hydro potential of the State so far, the Board has been able to
provide electricity at relatively lower rates to the consumers for the last few decades.
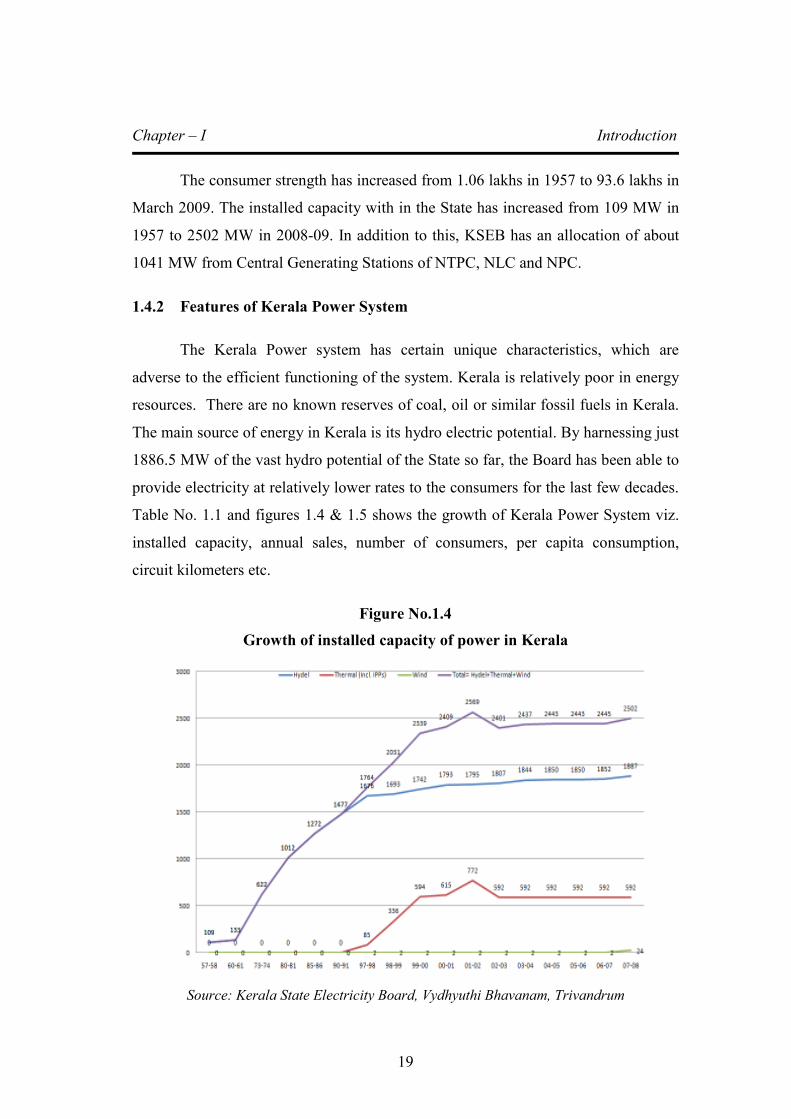
Table No. 1.1 and figures 1.4 & 1.5 shows the growth of Kerala Power System viz.
installed capacity, annual sales, number of consumers, per capita consumption,
circuit kilometers etc.
Figure No.1.4
Growth of installed capacity of power in Kerala
Source: Kerala State Electricity Board, Vydhyuthi Bhavanam, Trivandrum

Chapter – I Introduction
20
Figure No.1.5
Growth of capacity, consumers and per capita consumption
Source: Kerala State Electricity Board, Vydhyuthi Bhavanam, Trivandrum
Some of the characteristics of the Kerala Power System are discussed below:
1.4.2.1 Dependency on Monsoon:
The generation from Hydel plants is largely dependant on the Southwest and
Northeast monsoons received during the months from June to November of a year.
The State receives 65% of the annual rainfall from the South-West monsoon, and
20% from the North-East monsoon. The monsoon received widely fluctuates from
year over year and at times, there are drastic variations severely affecting the
generation of hydropower. Only tapping more and more hydel potential can
minimize the adverse impact of vagaries of monsoon. But due to environmental and
other public issues, Board could not add more Hydel capacity in tune with the
increase in demand.
Chapter – I Introduction
21
1.4.2.2 Hydro - thermal ratio
As explained earlier, KSEB could not start more Hydel projects in tune with
the increase in electricity demand. So, the State became more and more dependant on
the high cost thermal power, especially from liquid fuel stations set up within the
State. This has resulted change of the hydro-thermal mix from 85:15 in 1992-93 to
40: 60 in 2008-09 and consequent heavy expenditure on power purchase.
1.4.2.3 Adverse Consumer-mix
The composition of the consumers and the pattern of their consumption has
also undergone major changes. Though availability of cheap electricity in the past
had attracted energy intensive heavy industries to the State, the industrial
development of the State has been affected due to various other factors. The
industrial consumption in the State has not increased appreciably during the last few
years. At the same time, there has been steady growth in the number of domestic and
commercial consumers. During the last few years, an average 5.0 lakhs LT
consumers were annually added to the system and out of this about 78 % were
domestic consumers. The electricity is supplied to the domestic consumers at
considerably subsidized rate. The average revenue realized from them is about Rs.
1.90 per unit. The steep rise in domestic consumption coupled with the stagnant
industrial consumption has seriously affected the revenue of the Board. However, the
commercial and industrial consumers compensated low revenue from the subsidized
domestic sector by way of cross-subsidy. This imbalance has been widening due to
the increase in domestic consumption.
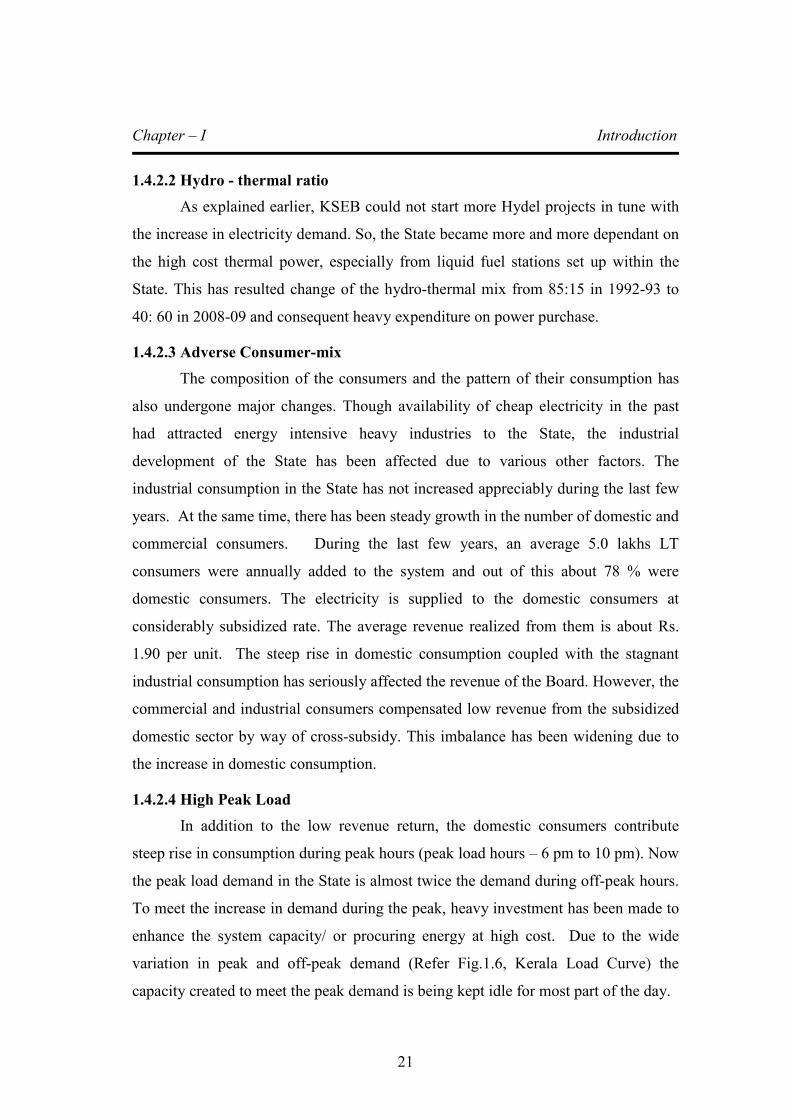
1.4.2.4 High Peak Load
In addition to the low revenue return, the domestic consumers contribute
steep rise in consumption during peak hours (peak load hours – 6 pm to 10 pm). Now
the peak load demand in the State is almost twice the demand during off-peak hours.
To meet the increase in demand during the peak, heavy investment has been made to
enhance the system capacity/ or procuring energy at high cost. Due to the wide
variation in peak and off-peak demand (Refer Fig.1.6, Kerala Load Curve) the
capacity created to meet the peak demand is being kept idle for most part of the day.
Chapter – I Introduction
22
Figure 1.6
Load Curve - Kerala Power System
Source: Report on Establishment of Kerala State Energy Conservation fund by International
Resources Group, Ltd. (For EMC, Kerala)
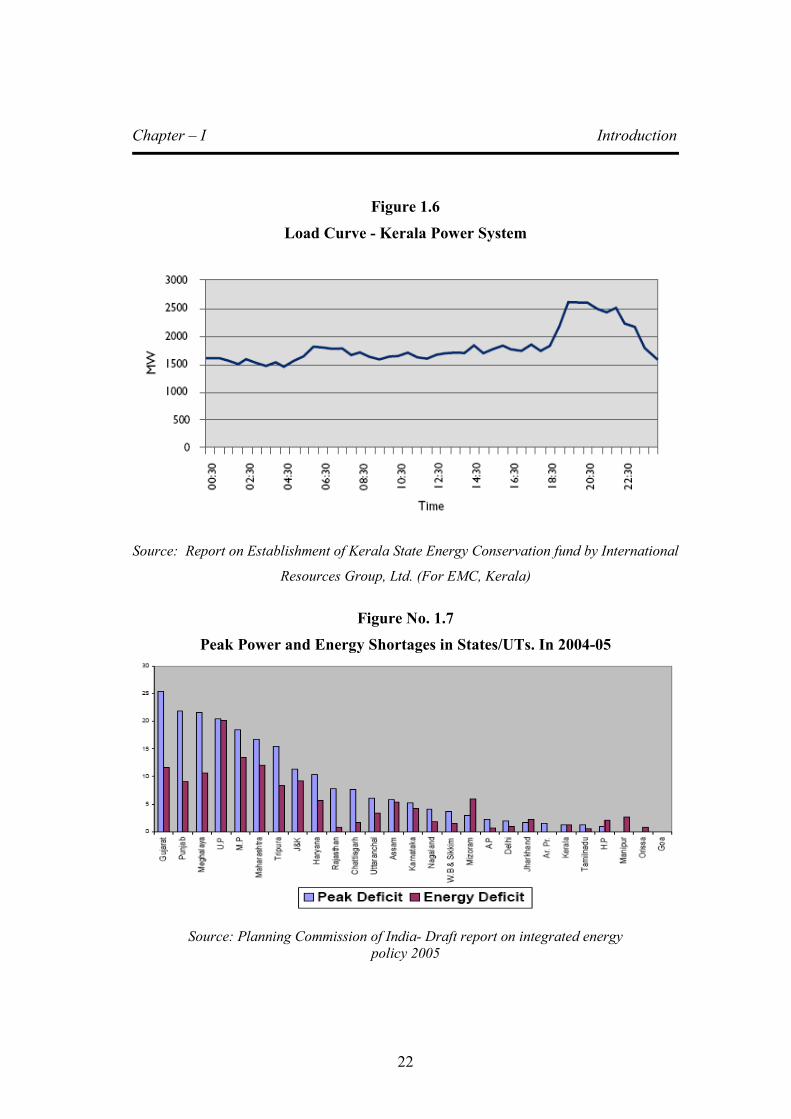
Figure No. 1.7
Peak Power and Energy Shortages in States/UTs. In 2004-05
Source: Planning Commission of India- Draft report on integrated energy
policy 2005
Chapter – I Introduction
23
From the figure no.1.7 it can be seen that Kerala’s power requirement is more
or less matching with power availability during peak hours. During peak hours
KSEB is maximising own generation and availing the allocated share from the
Central Generating Stations. However, during off-peak hours Kerala demand is only
about half of that of peak demand (figure-1.6).
1.4.2.5 High Cost of thermal power.
To meet the increase in electricity demand, KSEB has commissioned two
thermal plants – one in Brahmapuram (Kochi) (106.5 MW) and the other in
Kozhikkode (128 MW). These plants are driven with Low Sulphur Heavy Stock
(LSHS) fuel for generating electricity as the primary fuel and start up fuel is HSD.
There is also one private owned LSHS based thermal station (IPP) of 20 MW at
Kasaragode (KPCL). In addition to the above, there are two Naphtha based thermal
plants in Kerala viz., the NTPC’s RGCCPP Kayamkulam (360 MW) and BSES plant
at Kochi (163 MW). Due to global factors, price of LSHS and Naphtha are heavily
fluctuating. During July-2008, the per unit cost of electricity from Naphtha based
plants was about Rs 12.00 per unit and at the same from LSHS was Rs 10.00 per
unit. Recently, the price of Naphtha was come down and as result the cost of
generation has also come down drastically. Because of the volatility in petroleum
prices, there is wide variation in the cost of generation of power from the thermal
power plants within the state.
1.4.2.6 Adverse LT-HT ratio
Kerala is one of the most densely populated states in the country. As per the
census conducted in 2001, the total population in Kerala is 31.83 million. About
23.57 million (74%) of the population live in villages, rural areas and remote places
in high ranges. The rural population in Kerala, unlike in other states in India, do not
live in clusters of houses forming Basthis, Hamlets or large villages and they live in
individual houses built within their agricultural land segregated in distance from their
neighbours. Because of this peculiarity of living pattern, more low-tension (LT) lines
have to be built to supply electricity to rural houses. The ratio of Low Tension
Chapter – I Introduction
24
distribution lines to the High Tension lines is 6:1 in Kerala against the norm of 1:1.
This high LT/HT ratio has adverse effect on the investment cost of distribution
network as well as the distribution losses. KSEB is targeting to reduce the LT-HT
ratio to 4:1 by the end of the 11th plan.
The mission of KSEB is to supply quality power at affordable cost on
demand to the people of the State, endeavor to supply quality and uninterrupted
power, improve the consumer satisfaction and to act as a catalyst for development of
the State. The Board, though a State undertaking, required to function on commercial
principles, cannot evade the social obligations to general public, in the midst of
economic reform process underway in the country.
The State Load Dispatch Station situated at Kalamassery manages the grid.
There are three Sub Load Dispatch Centres – at Thiruvananthapuram, Kalamassery
and Kannur (Kanhirode). The Load Dispatch activities are carried out with the aid of
state-of-the-art technology Computerized Supervisory Control and Data Acquisition
System (SCADA). Real-time data from 30 Remote Terminal Units including
generating stations and major sub-stations are acquired at the Load Dispatch Station.
One more RTU is being installed. The data acquisition is through the communication
network installed and maintained by the Board comprising of microwave link from
Thiruvananthapuram to Kalamassery and Fibre Optic (FO) link from Kalamassery to
Kannur. Data from remote stations are collected through Power Line Carrier
Communication Network (PLCC) to the nearest nodal station in the broadband
network. The state LD Station is connected to the Southern Regional Load Dispatch
Centre, Bangalore, through FO link for real time data transfer. The real time
generation details of all central sector stations are made available through the
SRLDC.
The State Load Dispatch Centre schedules generation from various
generating stations, central sector stations and IPPs depending on the load condition
and the real time frequency. Transaction of unscheduled energy from the pool when
Chapter – I Introduction
25
the frequency profile is favourable is coordinated by the SLDC effectively. The Load
Dispatch Centre also monitors the transmission system and issues sanction for
shutdowns. Water availability, inflow, consumption, demand etc. are daily collected
and monitored in the Load Dispatch Station.
The major activities undertaken by this wing are:
1. Daily Scheduling of Generation
2. Short term and long term planning of Generation Schedule
3. Preparation of Load Generation Balance Reports on short term and long
term basis
4. Verification of energy drawls from various Central Generating Stations
(CGS) and Regional Energy Accounts
5. Verification of energy availed on unscheduled basis from the central grid
depending on the frequency.
6. Certification of energy generated from all internal generating stations and
the energy received on the grid.
7. Maintenance scheduling of generating units and transmission lines.
8. Economic load dispatching
9. Grid discipline
10. Load forecasting and demand estimation
11. System security and islanding facility
12. Black start preparedness
13. Event analysis and preventive measures
14. Coordination with neighbour Grids
15. Public relation and consumer interaction.
16. Certification of availability of generating stations and transmission system.
Chapter – I Introduction
26
17. Maintenance of the communication network, communication equipment and
SCADA system
18. Protection coordination, commissioning and troubleshooting of protection
schemes at all substations and generating stations.
19. Performance monitoring of major grid elements like power transformers,
instrument transformers, generators, capacitor banks, etc.
20. Undertakes testing and commissioning of protection schemes of major EHT
consumers on a payment basis.
1.5 Significance of the study:
Industrial Electricity consumption in the State was about 60 % of the total
consumption till early 1980s. Kerala State was one of the most favored destinations
for setting up manufacturing Industries. Major industrial units like FACT, INDAL,
TCC were established during 1940s by the initiative of the then Maharajah of
erstwhile Travancore State. Kerala’s first and foremost hydroelectric power project
called Pallivasal was commissioned in the year 1939 with an intention to provide
electricity at cheaper rates to facilitate industrial development and economic growth
of the Travancore State. The performance of SEB in the State was quite well until
1980s. From then on there has been deterioration in the performance, which can be
traced to failures on four fronts:
a) Techno-economic - High losses, low efficiency, poor project implementation
etc.
b) Policy - Poor targeting of subsidy, shifts in fuel choice and approach to self
reliance etc
c) Planning - Overemphasis on centralized supply approach, neglect of end use
efficiency etc and
Chapter – I Introduction
27
d) Governance - Undue interferences in SEB functioning by the State
Government, corruption, undue delays in executing projects, bad
management etc.
The distortions caused by these failures led the sector into a crisis in the
beginning of the 1990s. The crisis in the electricity sector has three important
components:
a) Performance crisis – Low efficiencies and lethargic administration
b) Financial crisis – Stagnant revenues, increasing expenditure, increasing
arrears, increasing losses, lack of capital and
c) Credibility crisis – Loss of credibility in the eyes of consumers, common
citizens and funding agencies.
Before the establishment of State Regulatory Commission, State Electricity
Board was authorised to set consumer tariffs so as to achieve a surplus of 3 % on the
value of fixed assets. In practice, the State Government approved the tariffs without
seriously questioning the SEB’s efficiency or costs. The industrial consumption in
the State has reduced from 60 % in 1980s to 30 % in 2008-09 and a number of power
intensive industrial units have been wound up due to spiraling increase in electricity
charges. With the establishment of State Regulatory Commission, the situation has
changed.
A study on variation in industrial tariff before and after the setting up State
Regulatory Commission and the impact of ERC in the performance of KSEB to be
conducted in detail.
1.6 Statement of the problem:
Electricity is the prime mover of economic activities in any State. Survival of
industrial consumers especially power intensive consumers in the State depends up

Chapter – I Introduction
28
on affordable or economically viable tariff rates offered by the Utility (SEB).
Electricity Tariff of High Tension (HT) and Extra High Tension (EHT) industrial
electricity consumers had undergone several revisions in the pre-regulatory period
especially during 1997 to 2002. The industrial power consumption in the state has
come down from 60 % of the total power consumption in early 1980s to 28 % of the
total power consumption in 2009-10.
The period from 1997 to 2010 can be broadly divided into two separate
periods viz. pre-regulatory regime and regulatory regime. Before the establishment
of Kerala State Electricity Regulatory Commission (KSERC), KSEB was authorised
to set consumer tariff so as to achieve a surplus of 3 % on the value of fixed assets.
In practice, the tariff hike was affected by KSEB with the approval of State
Government. The State Government’s decisions to increase tariff, mainly industrial
tariff was adhoc and arbitrary and without seriously questioning the efficiency
parameters, costs and financial performance of State Electricity Board. This has
resulted in heavy cross subsidization by industrial consumers mainly High Tension
and Extra High Tension Consumers (HT & EHT) to other categories of consumers.
When the overall industrial consumption has come down progressively from 60 % to
28 %, the industrial consumers were forced to take more burden of cross-subsidy on
its shoulders.
State Electricity Boards (SEBs) like KSEB have been functioning as
vertically integrated monopolies with the State Governments regulating its function.
Vertical integration implies the same utility handles the functions of generation,
transmission and distribution of power. Monopoly implies the absence of any
competition. With the establishment of State Regulatory Commission, the situation
has changed and the whole process of tariff revision has taken a different route.
After nearly three years of drafting, the Electricity Act 2003 was enacted by
the Parliament, the apex legislative body in the Republic of India, representing the
will of the entire people of India in June 2003 with the following intent:
Chapter – I Introduction
29
“An Act to consolidate the laws relating to generation, transmission,
distribution, trading and use of electricity and generally for taking measures
conducive to development of electricity industry, promoting competition therein,
protecting interest of consumers and supply of electricity to all areas, rationalisation
of electricity tariff, ensuring transparent policies regarding subsidies, promotion of
efficient and environmentally benign policies, constitution of Central Electricity
Authority, Regulatory Commissions and establishment of Appellate Tribunal for
Electricity and for matters connected therewith or incidental thereto.”
The electricity Act - 2003 marks a watershed in the Indian Power Sector, with
fundamental and far-reaching impacts on reform, deregulation and restructuring. The
State Electricity Regulatory Commission is expected to work as a watchdog to
ensure a vibrant power sector in the State by ensuring the overall growth and
development of power sector in the State viz. Improvement of operating efficiencies,
rationalization of tariff, cross subsidy minimization, eliminating non-value adding
activities, minimizing Transmission and Distribution losses, minimizing Commercial
and Technical (C&T) losses, timely implementation of capital expenditure plans,
encourage competition, enhance speed and accountability and to fulfill all other
regulatory objectives as envisaged in the Electricity Act 2003.
In broader terms, the main objectives of KSERC are reform, deregulation and
restructuring of State Power Sector to make it more and more vibrant.
1.7 Objectives of Study:
The following are the major objectives of study:
1. To understand the Industrial Electricity Tariff prevailed in Kerala State
during the period 1997 to 2010 by taking the EHT tariff as the representative
data and find out the variation in Tariff structure during the above period.
2. To understand the impact of tariff variation of one of the major EHT
Industrial Electricity Consumers in the state and its consequential impacts
like loss of production, loss of revenue, loss of employment etc.

Chapter – I Introduction
30
3. To understand the impact of intervention of regulatory regime in the State of
Kerala in the areas of industrial tariff, operating performance of KSEB
including T&D loss reduction, scheduling and generation of power, power
purchase etc.
4. To understand the compliance of KSEB and Kerala State Electricity
Regulatory Commission in meeting the key provisions of Electricity Act
2003, National Power Policy and National Tariff Policy in general and other
regulations pertaining to tariff fixation and finalisation of ARR & ERC
(Annual Revenue Requirements and Expected Revenue from Charges).
1.8 Hypothesis:
On the basis of the objectives stated above, it is hypothesized that:
a) There was no increase in tariff for High Tension and Extra High Tension
Industrial Electricity Consumers since the inception of Kerala State
Electricity Regulatory Commission
b) There are significant improvements in the following areas of Power
Sector in Kerala:
� T&D loss reduction,
� Optimum scheduling, internal generation and power purchase,
� Reduction in Interest burden of KSEB
� Transparent process of decision-making
� Consumer Grievance Redressal
c) There are willful deviations in many areas from the provisions of
Electricity Act 2003, National Energy Policy 2005 and National Tariff
Policy 2006 by the KSEB.
Chapter – I Introduction
31
1.9 Methodology:
The study is mainly based on secondary data collected from Kerala State
Electricity Regulatory Commission, Kerala State Electricity Board and the Kerala
High Tension and Extra High Tension Industrial Electricity Consumers Association.
Published information on scheduling and generation of power, purchase of
power, T&D loss data, C&T loss data, capital expenditure, repayment of loans etc
will be analysed to determine performance and efficiency improvement. Simple
statistical tools like average, percentage variation etc will be used for analysis.
Compliance to the relevant provisions of Electricity Act-2003, NEP-2005,
NTP-2006 by KSEB and KSERC will be scrutinized with the help of published
ARR&ERC orders of the KSERC, ARR & ERC Petitions filed by the KSEB and the
objections raised by consumers in general and industrial consumers in particular.
1.10 Limitations:
The study is primarily based on secondary data available with Regulatory
Commission, KSEB and Industrial Electricity Consumers, which are authentic and
accurate. Since KSEB has not completed the unbundling process, segregation of
assets and liabilities of generation, transmission and distribution wings are still
remain incomplete.
1.11 Scheme of the study:
The study has been arranged into eight chapters as given below:
Chapter – I deals with Introduction, review of Power Sector, significance of the
study, statement of the problem, objectives of the study, methodology, limitations of
the study and scheme of the study.
Chapter – II deals with literature review
Chapter – I Introduction
32
Chapter – III deals with World Energy Demand and Economic Outlook
Chapter – IV deals with economic aspects of power sector, different types of
electricity tariff, different pricing methods of electricity
Chapter – V deals with Process and principles of regulatory review, cost plus
method, performance based regulation, principles of tariff setting,
process of tariff approval, tariff philosophy etc.
Chapter – VI deals with tariff regulatory framework in Kerala, relevant provisions
in Electricity Act -2003, National Electricity Ploicy-2005, National
Tariff Policy-2006 etc.
Chapter – VII a case of power tariff hike with respect to a power intensive
consumer in Kerala.
Chapter – VIII deals with analysis on impact of regulatory regime in Kerala
Chapter – IX deals with major findings, suggestions and conclusions of study
Chapter – II Literature Review
33
CHAPTER-2
LITERATURE REVIEW
2.1 Introduction
The objectives and hypothesis of the study explained in the previous chapter
are formulated in accordance with a detailed and thorough review of relevant
literatures comprising of books, journals, periodicals and published documents
pertaining to functioning, performance and regulation of power sector in India. While
a few of them are focusing on theoretical framework a good many are related to the
practical applications of the concepts.
2.2 Definitions of Regulation
The term ‘regulation’ refers to the various instruments by which the
governments impose requirements on enterprise and citizens. It thus embraces laws,
formal and informal orders, administrative guidance, and subordinate rules issued by
all levels of government or professional self regulatory bodies to which governments
have delegated regulatory powers.
The judgment of Air India Statutory Corporation vs United Labour Union1
held, ‘The legislature passes laws within the overall constitutional framework. These
laws are state policy. Its implementation is by the executive. The person(s)
implementing the laws are regulators who are regulating the implementation. A
regulator must convert the legislation into rules, regulations and procedures that
make it possible to achieve the intentions of the legislation. Legislation can lay down
general directions or it can be very detailed. I whichever manner the legislation may
be drafted, the implementing bureaucrat exercises varying degree of discretionary
authority as he interprets the law.’
1 Supreme Court proceedings, MANU/SC/0163/1997
Chapter – II Literature Review
34
This discretional authority is not different from the policy–making authority
of the legislature. Of course, the legislature could - if he wishes – legislate in greater
deal as in countries like Chile. However, in any event, the regulator is constrained by
the boundaries of the legislation that he has to implement. When the legislation is
not precise or is ambiguous, there is scope for the regulator to interpret it and even to
stretch his authority under the shelter of that interpretation. To the extent that the
legislation has drafted the legislation loosely, many major and minor policy decisions
might be taken during the implementation. If the legislation is drafted in a very tight
fashion, the flexibility required because of the varying local situations might make
the implementation process excessively constrained. The drafting of legislation has
to strike a balance between flexibility for the implementing agency and ensuring that
the intention of the legislature is carried out. The American and Indian legislative
processes produce legislation that provides flexibility; the Latin American legislation
is much more close drafted and lays down considerable detail, thus reducing the
extent of flexibility.
As an example, the Indian law (Electricity Regulatory Commissions Act
1998; now repealed by Electricity Act 2003) asks regulators to promote efficiency,
and economy; encourage investment in the sector; and safeguard consumer interest2.
It does not lay down the targets for transmission and distribution losses, metering,
extent of rural electrification, electricity quality, return on investment to investors in
generation, etc. As a consequence, these have been left to the ERCs (Electricity
Regulatory Commissions) to decide. However the Central Electricity Regulatory
Commission and State Regulatory Commissions have issued, consequent to the
enactment of Electricity Act-2003, necessary policy directives.
In Black’s Law Dictionary, ‘regulation’ is defined as ‘the act of regulating, a
rule or order prescribed for management or Government; a regulating principle; a
precept, rule, or order prescribed by superior or competent authority relating to
action of those under its control’.
2 Section 13(d) of the Electricity Regulatory Commissions Act, 1998
Chapter – II Literature Review
35
In Corpus Juris Secundum, it has been provided that the power to regulate
carries with it full power over the thing subject to regulation and, in the absence of
restrictive words, the power must be regarded as plenary or in the interest of the
public. It has been held to contemplate or employ the continued existence of the
subject matter.
In Craise on Statute Law, it is stated that if the legislation enables something
to be done, it gives power at the same time ‘by necessary implication, to do
everything, which is indispensable for the purpose of carrying out the purposes in
view’. Thus the legislation sets out objects it seek to achieve and lays down the
responsibilities, authorities and penalties and the regulator has to formulate the rules,
principles etc in order to carry them out. For example, the National Tariff Policy –
2006, which is modeled on Chilean regulatory law and lays down extremely detailed
rules for tariff determination.
2.3 Policy formulation, policy implementation, and regulation
While Black’s law Dictionary refers to policy as ‘the general principles by
which a government is guided in its management of public affairs or the legislature
in its measures’, Webster’s Third International Dictionary defines policy as ‘a
definite course or method of action selected (as by a government institution, group or
individual) from among alternatives and in the light of given conditions to guide and
usually determine the present and future decision.’ While in general sense, policy
could be understood as principles and guidelines around certain issues within the
broad framework of which laws are made and translated into action, it specifically
refers to a proposed course of action adopted by, for example, an individual, a group,
an institution, or a government to realize a specific objective or purpose within a
government environment. In other words, it is the policy that lays down the
framework within which organizational goals are to be accomplished. The objectives
of an organisation, which are often vague and general, are concretized in the policy
goals, which set the administrative wheels in motion.
Chapter – II Literature Review
36
Policymaking is a very complex process and there exists some confusion
regarding policy formulation, its conversion into acts through legislation, and the
implementation of these acts. In fact, the confusion has stemmed mostly from the
politics – administration dichotomy model in public administration propounded by
Woodrow Wilson. This model refers to the sharp distinction drawn between politics
and administration. While politics was concerned with laying down of policies, the
administration’s task was to carry out these policies as economically and efficiently
as possible. Thus, the spheres of the two were made to appear quite separate and
distinct. While Woodrow Wilson, the father of public administration, in his article
titles ‘The Study of Administration’ (Wilson 1966), considered politics and
administration as separate processes and attempted to conceptually distinguish
between the two areas of study, Goodnow (1990) observed that politics has to do
with the policies or expressions of state while administration has to do with the
execution of such policies. Thus policy making was regarded as the realm of politics,
execution was considered as the realm of public administration. As opposed to this
model the latest theories of policy-making emphasis the need of multiple agencies in
policy making. In earlier literature, while the focus was on legislature and the role of
executive in the formulation stage during which bills become acts, more recently a
number additional stages have been identified in the policy making process.
According to the ‘policy cycle’ theory they include agenda setting for policy
initiation, formulation, implementation, evaluation and review.
While policy initiation sets the agenda by defining certain problems and
issues as matters that engage the interests of the government, policy formulation is
seen as a critical stage in policy process as it develops a political issue into a firm
policy proposal through a process of debate, analysis and review. Policy
implementation, on the other hand, comprises the actions through which policy is put
to effect, sometimes in ways that differ from the original intentions of policy makers
as Edelman (1964) observes, policies in American politics are largely symbolic.
They are often vague and general and the actual meanings are attached during
implementation.
Chapter – II Literature Review
37
It is clear that policy making is a complicated and interactive process and the
content of policies is not merely determined ion the decision making phase. Rather as
Nelson (1996) observes, policy content is negotiated over and over again in problem
definition, legislation, regulation, and court decisions and yet again in the decisions
made by street-level bureaucrats. While arguing in favour of insulating
administration from partisan political interference, Goodnow (1990) stated that when
one moves beyond general execution to specialised administration (as in the case of
present-day regulators having specialised knowledge, technical expertise, and quasi
judicial authority), ‘much must be left to official discretion, since what is demanded
of the officers is not doing of a concrete thing but the exercise of judgment’.
Thus it is clear that policy-making does not end with cabinet decision on a
particular issues or the legislature’s enactment of law. In fact, it takes place at
various stages and at various levels. In implementing laws or acts (based on
government policies) passed by the legislature, by drafting concrete rules and
regulations for smooth transaction of government business, administrators
(executives) at every level of bureaucracy interpret policy by applying their own
judgement and regulate the behavior of members of the society. It thus appears that
policy implementation necessarily involves some amount of ‘discretion’, which the
administrators (as regulators) apply to define and refine it periodically.
‘Delegated legislation’ is the means by which the legislature delegates the
executive withy law making power on a variety of complex issues. It empowers the
administrator to design the detailed rules and regulations within their discretion.
With the expansion in the functions of the government, laws have to be made on a
variety of issues. Many of these are complex. Legislators may not have the expertise
or time to understand them. This gives the opportunity for the executive to interpret
and make rules that would otherwise have been in the legislation.
The growing complexity of public policy continues to erode the effectiveness
of traditional command - and - control techniques of the government bureaucracy.
Until fairly recently, most tasks undertaken by the national governments were simple
Chapter – II Literature Review
38
enough to be organized along traditional bureaucratic lines. Once a policy or
programme as enacted, the details of its operation could be formulated and
appropriate commands issued by highly centralised centres. ‘By contrast, the single
most important characteristics of newer forms of economic and social regulation is
that their success depends on affecting the attitudes, consumption habits, and
production patterns of millions of individuals and hundred of thousands of firms and
local units of government. The tasks are difficult not only because of they often deal
with technologically complex matters but even more because they aim ultimately at
modifying expectations’ (Schultze 1977). In this context, credibility becomes an
essential condition of policy effectiveness and achieving this requires delegating
powers to designated institutions.
2.4 The nature of regulation
The nature of regulatory powers or functions that traditional administrators
enjoy involves drafting of clear and concrete rules and regulations concerning the
subject and implementing or enforcing them. It thus involves only legislative and
administrative powers and does not confer judicial powers.
In contrary to old style regulation, independent regulatory commission – as
they have come into existence since the mid 1990s – wield regulatory powers with
legislative, executive, and judicial jurisdiction and are termed as quasi-judicial
authorities. As Phillips (1993) observes, ‘The independent regulator considers
information available to him as well as evidence presented by the company and
interveners, and makes a decision when prescribing certain rules of conduct for a
utility, such as fixing prices. Contrary to the basis pattern of American government,
which is based on the doctrine of separation of powers, a commission assumes the
charge of administrator, judge, and legislator. When investigating rates or service
and safety standards, a commission performs an administrative function. When
holding hearings, examining evidence and making decisions, a commission acts as a
judge of the utility’s conduct. Moreover, the commission can even determine the
rules it wants to administer, and it can decide to prosecute a utility and gather
Chapter – II Literature Review
39
evidence against the firm. It then sits in judgement on the evidence collected by bit.
This suggests that the independent regulatory commission acts in a legislative
capacity as well’. A similar comment is made in the report of the Indian
Parliamentary Standing Committee when examining the Electricity Bill (2001),
which is now the Electricity Act (2003).
In addition to technical expertise and specialised knowledge, the quasi-
judicial power to hear petitions, examine evidence, and take decisions differentiates
today’s independent regulatory authorities from the traditional public administrations
entities.
2.5 Why Independent Regulators?
Independent regulation has been practiced in the US longer than anywhere
else. An important justification used for the creation of IRAs (Independent
Regulatory Agencies) is that they enable complex matters to be considered without
discrimination between parties. A variety of disciplines have to interact for reaching
a conclusion. The task is therefore delegated to a group of experts, who concentrate
on such matters to the exclusion of others.
The need for expertise sometimes accompanies the requirement for rule-
making, decision-making, and adjudicative function that may be inappropriate for a
government department or a court (Galligan-1996). Sometimes a government
department may be perceived as not being able to provide insulation from external
influences. As far as the courts are concerned, it is considered difficult to develop in
them the different kinds of expertise required. New specialised bodies with judicial
powers are needed. A new administrative agency is therefore created to perform this
function. Further, the expenditure of the time and prestige of the highly qualified
senior judges on such specialised issues is not justified, given their other judicial
workload.
Chapter – II Literature Review
40
The Parliamentary Committee that examined the Electricity Bill-2003,
mentions that these ERCs (Electricity Regulatory Commissions) combine with
themselves the powers of rule-making (legislative) and implementation and
enforcement (executive) with the quasi-judicial powers of review and appeal against
their orders (judicial). Joskow (1997) says, ‘Contrary to the basic pattern of
American government, which is based on the doctrine of separation of powers, a
commission assumes the tasks of administrator, judge and legislator.’ This
fundamental change in the separation powers through this institution of independent
regulation has sometimes – as in India – created conflicts with existing institutions,
especially the government executive.
Because of their expertise and narrow focus, these new agencies may bring in
economy, speed in decision-making, quick adaptation to change in conditions, and
freedom from technicality and procedures. They can relax the formal rules of
evidence when appropriate, to avoid over-reliance on adversarial techniques and to
avoid strict adherence to their own precedence (Galligan-1996). The IRCs are
thought not be as restricted to formulating decisions on a case-by-case basis as
courts. As government expands into such unfamiliar territory in which complex
factors have to be considered together, criteria that will adequately anticipate
marginal cases become difficult to identify. Sometimes it is not possible to foresee
what circumstances will arise. In these cases, a greater or lesser degree of
discretionary powers may need to be left to the regulator, that is now the IRC.
Rulemaking power is often found where regulation of highly complex nature is
required. Delegation of rule-making power may also be needed where constant fine-
tuning of rules and quick adaptation to meet new circumstances are required
(Galligan-1996).
Chapter – II Literature Review
41
2.6 What is independence?
This is a somewhat misused and misunderstood term in the context of IRCs.
There cannot be complete independence from government since the IRCs are also
part of government. There can, however, the autonomy in functioning, especially in
the performance of critical task like tariff regulation and determination. However,
independence certainly cannot mean the absence of accountability. Further, the IRC
cannot have total authority over all decisions to do with any issue including
electricity. Even when the legislation and the policy enunciated by the government
give the authority, the government might have legitimate concerns regarding law and
order, public peace etc. The IRC must respond to public concerns and interests in
performing its functions and objectives. The government must be in a position to ask
the IRCs to take account of such concerns. The purpose of the degree of
independence or autonomy given to the IRCs is to allow them to be seen as having a
credible commitment to investors and consumers.
2.7 Independence and legitimacy
We must link independence to legitimacy. Independence is not an end in
itself. The regulator must use what independence it has to establish its legitimacy as
an objective body not influenced by any of the parties interested in the issue. It gives
reasons for all its decisions after having engaged in the maximum possible
consultation within all the uninterested parties. (Unfortunately, in that respect, it
cannot be said that all ERCs in India have been legitimate. Legitimacy is largely a
function of the capability of the members and their staff, but the Indian system of
selections and deputations does not guarantee adequate capability.)
2.8 Regulatory powers of independent regulatory commissions
The regulatory powers exercised by the IRCs fall under three broad categories
(Schwartz-1994).
Chapter – II Literature Review
42
1. Licensing power – The agency controls entry into the given economic
activity. Thus, no airline may operate or extend its routes without a license
from the Civil Aeronautics Board in the US or from the Civil Aviation
Organisation in India. Similar authority over rail, motor, and water carriers
and pipelines is given to the Interstate Commerce Commission in the US
while there are government departments in India exercising similar powers.
2. Rate-making power- The agency possesses authority to fix the rates charged
by utilities and such companies subject to its jurisdiction. Such authority is
vested in the IRCs or government departments that regulate utilities and
carriers.
3. Power over business practices – The agency is given authority to approve or
prohibit practices employed in business.
2.9 Regulation of Electricity - International scenario
The process of electricity reforms can be said to have begun in world in the mid
1980s. The reforming countries can be broadly divided into three categories.
1) Those that were early reformers and where reforms have been consolidated
to varying degrees (eg: Argentina, Australia, Chile, England, The US)
2) Those that started later and are now in transition (eg; Belgium, Brazil,
Holland, Northern Ireland, Portugal, Scotland, Sweden)
3) Those that are formulating reform programmes or are in the early stages of
implementation (eg: Germany, India, Peru, Russia, South Africa, Spain,
Ukraine, Zambia) (Baijal – 1999)
2.10 Electricity Reform Models
Electricity reforms have followed three main models internationally.
Australian model given below is a variant of the US model.
Chapter – II Literature Review
43
2.10.1 The US model
In this model, private-investor-owned utilities dominate electricity generation
and other downstream activities. However, regulatory intervention (Public Utility
Regulatory Policies Act, in the case of the US) has led to competition in the
wholesale as well as retail markets and diminished this dominance. Due to the
creation of vertically integrated geographical monopolies, the privately owned
electricity sector in the US has been sheltered from competition and also criticized
for being inefficient.
The main characteristics of this model are listed below:
• The generation and T&D (transmission and distribution) of electricity are
vertically integrated.
• There is an established presence of independent power producers and trading
in electricity.
• The presence of federal and state- government- owned utilities is minuscule
(Grey-1996).
• Federal nature of the US rules this model. The states set their own
development policies. The state utility commission establishes entry rules and
incentives to bring in more competition and lower consumer prices.
• At the federal level, the FERC (Federal Electricity Regulatory Commission)
sets prices in the US for interconnected transmission services.
• Transmission capacity in the US is inadequate as are interstate connections.
• Independent LDCs (Load Dispatch Centres) are owned by members of the
system but inter-regional regulation is weak.
2.10.2 Australian Model
Initiated in Australia in the mid-1990s, electricity reforms have occurred at
both the state and national levels. The national government has played a more
Chapter – II Literature Review
44
activist role through the establishment of a national grid and a national pool (A pool
for electricity refers to the equivalent of a stock exchange in financial markets. Since
electricity is not identifiable like the scrip of a company, all electricity supplied and
demanded is poled together and the LDC keeps track of who supplied how much and
who drew how much). The national regulatory regime is light-handed and a form of
priced regulation has been applied to the regulated sectors (Baijal-1999). The
national electricity code establishes the regulatory and operational framework of the
new electricity market and binds all participants in the wholesale power generation
market to specified rules. The code addresses market rules, grid connection and
access, metering, network pricing, system security, and procedures for code
administration.
2.10.3 The UK Model
The UK has three separate and differently organized electricity markets.
1) England and Wales,
2) Scotland, and
3) Northern Ireland
The Electricity Act 1990 created the market system of England, Wales and
Scotland. Before reforms, the Central Electricity Generating Board held the
monopoly for generation and transmission. Area Boards had similar monopolies for
distribution. Competition was introduced by separating generation, transmission, and
distribution and by adding intermediary systems that allowed the cheapest generator
to produce more by being able to sell more to the grid and by contracts between
generators and large consumers. The success of the UK model is attributed to a well-
structured and sequenced regulatory and unbundled system and the maturity of the
restructured components that enhanced investor confidence in their potential
profitability, thus increasing investment in the sector. This led to more competition
and, consequently, greater efficiency.
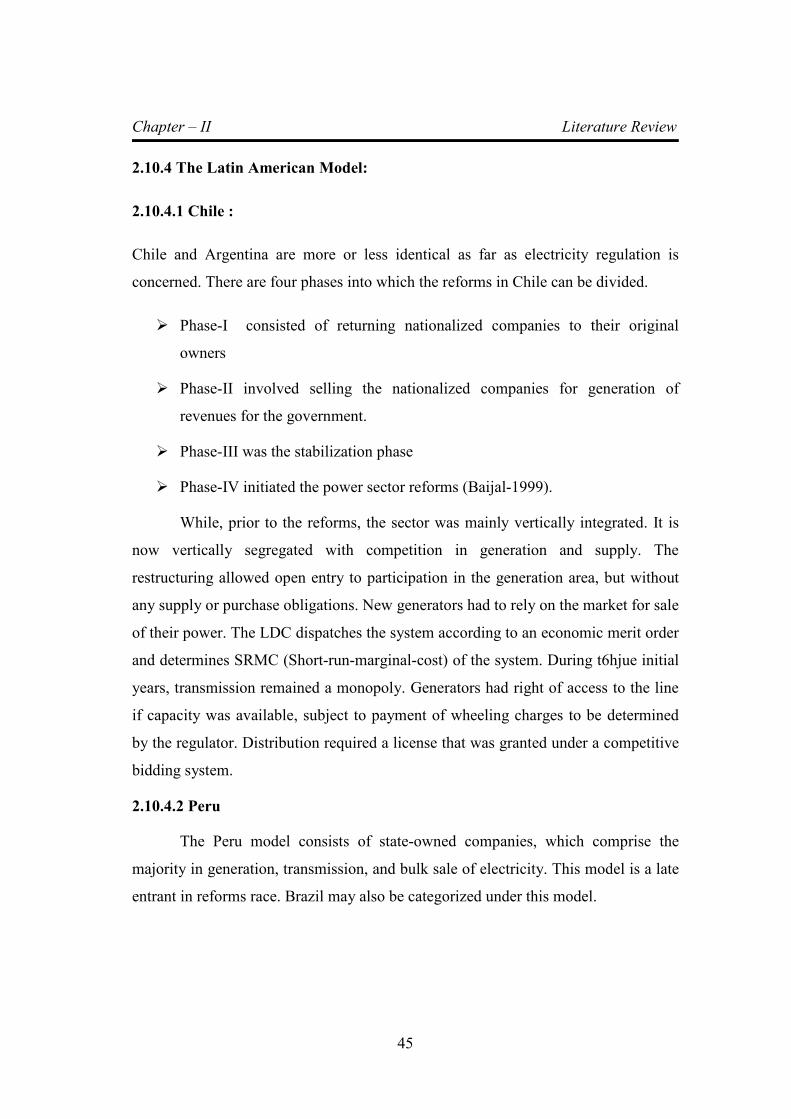
Chapter – II Literature Review
45
2.10.4 The Latin American Model:
2.10.4.1 Chile :
Chile and Argentina are more or less identical as far as electricity regulation is
concerned. There are four phases into which the reforms in Chile can be divided.
� Phase-I consisted of returning nationalized companies to their original
owners
� Phase-II involved selling the nationalized companies for generation of
revenues for the government.
� Phase-III was the stabilization phase
� Phase-IV initiated the power sector reforms (Baijal-1999).
While, prior to the reforms, the sector was mainly vertically integrated. It is
now vertically segregated with competition in generation and supply. The
restructuring allowed open entry to participation in the generation area, but without
any supply or purchase obligations. New generators had to rely on the market for sale
of their power. The LDC dispatches the system according to an economic merit order
and determines SRMC (Short-run-marginal-cost) of the system. During t6hjue initial
years, transmission remained a monopoly. Generators had right of access to the line
if capacity was available, subject to payment of wheeling charges to be determined
by the regulator. Distribution required a license that was granted under a competitive
bidding system.
2.10.4.2 Peru
The Peru model consists of state-owned companies, which comprise the
majority in generation, transmission, and bulk sale of electricity. This model is a late
entrant in reforms race. Brazil may also be categorized under this model.

Chapter – II Literature Review
46
2.11 Power Sector reforms in India
In 1991 Indian government launched systematic economic reforms
programme. The infrastructure industries such as telecommunications and electricity
have subsequently been restructured and opened to private sector participation.
Accompanied with the restructuring and privatisation has been setting up of
independent regulatory agencies for telecommunications and electricity. While there
is a single Telecom Regulatory Authority of India (TRAI) for whole country, the
electricity regulatory system in India is central and provincial. In addition to Central
Electricity Regulatory Commission there are 26 other provincial (state level) State
Electricity Regulatory Commissions (SERCs) that have been set up by the local
(State) governments and union territories to regulate electricity markets, encourage
competition and private investment. This is due to the federal nature of government
in India and also because Indian constitution lists electricity in Concurrent List,
meaning both the federal and state level governments are authorised to frame policies
regarding electricity supply industry except for nuclear power which is in the domain
of only federal government. Although most of the government owned state electricity
boards are now unbundled and corporatised, there is little or no privatisation and the
private sector investment in generation and distribution has been very little. A major
cause for this could be lack of effective regulatory arrangements.
This session will examine the Indian electricity regulatory developments from
an institutional economics perspective following Levy and Spiller (1994) and Stern
and Holder (1999) framework to analyse the regulatory systems. While discussion
will encompass issues at national level, a case of a particular state Gujarat will also
be mentioned to map the regulatory developments in context of the institutional
endowments and see whether that could explain the limited success of regulatory
system in achieving the expected outcomes namely effective economic regulation
and encouraging competition in the segments where it is possible.
Regulatory reforms in developed and developing countries accompanied with
privatisation and deregulation of public utilities have generated substantial research
interest in academic circles. The focus of much of the work on economic regulation
Chapter – II Literature Review
47
has been on the instruments of regulation such as incentive regulation based on rate
of return or price cap. Only recently the issues of the regulatory process and
institutional arrangements have started attracting attention of the scholars. Levy and
Spiller (1994) in their seminal paper argued that institutional aspects regulation need
equal attention if the regulatory reform has to be effective in creating and sustaining
environment for attracting and retaining private investment in the regulated
industries. Institutional arrangements for practice of regulatory policy play a key role
in providing stable and effective regulatory environment. Levy and Spiller (1994)
provide empirical support for their arguments in their study of national institutional
endowments and telecom regulatory institutions in five countries. Subsequently, the
analytical framework has been used by Stern and Holder (1999) to study regulatory
governance in developing countries of Asia. This study proposes to extend this work
in Indian context with reference to electricity regulation. Stern and Holder (1999) did
include electricity regulators in India in their study, but since 1999 there have been
legislative changes as well as setting of many more state level regulatory
commissions. Impacts of Electricity Act-2003 on pre and post electricity markets and
power sector segments in India are self explanatory in Figure Nos. 2.1 & 2.2
Figure No.2.1
Pre and post EA 2003 Market design
Source: World Bank seminar on ‘ Indian power sector-Challenges and
opportunities’ New Delhi- 12 May 2006

Chapter – II Literature Review
48
Figure No.2.2
Segment-wise impact of Electricity Act-2003 in different segment of electricity
Source: D&B Industry Research Service
2.12 Institutional Framework Analysing Regulatory Structures
The privatisation and regulation experiment in the UK and many other
countries is much-studied phenomenon. In most of the studies on economic
regulation, the focus has been on instruments of regulatory policies such as price
controls or rate of return. Earlier literature on regulation of US electricity,
telecommunications and other regulated industries also show similar trends. As Levy
and Spiller (1994) note that much of the literature on regulatory challenges
concentrates on regulatory instruments such as incentive regulation.
Attempts by several economies in since 1980s to find market-based solutions
to supply of infrastructure services have not been uniformly effective. Levy and
Spiller (1994) argue that a nation’s institutional endowments influence the regulatory
design. Following North (1990) and others, a nation’s institutional endowment is
argued to comprise five elements:
1. Country’s legislative and executive institutions
2. Country’s judicial institutions
Chapter – II Literature Review
49
3. Customs and other informal but broadly accepted norms that are
generally understood to constrain the action of individual or institution
4. Character of contending social interests within a society and the balance
between them, including role of ideology.
5. Administrative capabilities of the nation
Through historical analysis of the regulatory structure in the broader contexts
of the national institutional framework of their sample countries, Spiller and Levy
highlight the interaction of political institutions with regulatory process and potential
impact of such interaction on the regulatory performance. They analysed the
regulatory designs of telecommunications industry in five countries (UK, Jamaica,
Philippines, Argentina and Chile). They argue that, “the credibility and effectiveness
of a regulatory framework and hence its ability to facilitate private investment varies
with a country’s political and social institutions.” (Spiller and Levy, 1994, p.202).
Therefore, of the five elements of national institutional endowments listed by North
(1990), Spiller and Levy concentrate on the first two elements in their study. They
conclude, “that success of regulatory systems depends on how well it fits with a
country’s prevailing institutions, if a country lacks the requisite institutions or
regulatory system that is incompatible with its institutional endowment, efforts at
privatization may end in disappointment, recriminations, and the resurgence of
demands for re-nationalisation.” (Spiller and Levy, 1994, p. 242).3
Spiller and Levy’s study makes another important contribution by providing
an analytical framework to study the regulatory governance separately. They identify
regulatory design as comprising of two elements namely regulatory governance and
regulatory incentives. They define regulatory governance as, “governance structure
of a regulatory system as the mechanism that societies use to constrain regulatory
discretion and to resolve conflicts that arise in relation to these constraints.” (p. 205).
3Levy, B and P.T. Spiller (1994) The Institutional Foundations of Regulatory Commitment: A Comparative
Analysis of Telecommunication Regulation, Journal of Law Economics and Organisation, V 10, No. 2, 201-246.
Chapter – II Literature Review
50
Regulatory incentives on other hand comprise the rules governing utility pricing,
cross or direct subsidies, entry, interconnections etc.
Stern and Holder (1997)4 extend the study of regulatory systems but
concentrate on the regulatory process in addition to Levy and Spiller’s focus on
institutional design and formal accountability of regulatory institutions. Stern (1997)
focuses on issues of informal accountability, which are listed by North as points 3
and 4 above. Explaining the distinction between the formal and informal
accountability, Stern and Holder (1997) split the attributes of institutional framework
into two categories. They describe formal institutional mechanisms that are written in
the legislation and informal mechanisms as regulatory process encompassing the
implementation of the regulatory laws. The later process involves interpretation and
understanding of law among the stakeholders (namely regulators, regulated
participants and consumers).
Stern and Holder (1997) identify six inter related aspects of regulatory
framework and provide results from a survey of regulatory practice for infrastructure
industries in Asian countries. Three of the six aspects relate to institutional design
(the formal accountability) and other three relate to regulatory process and practices
(informal accountability). The formal accountability aspects include:
� Clarity of Roles and Objectives
� Autonomy
� Accountability
The informal accountability aspects studied are:
� Participation
� Transparency, and
� Predictability.
4 Stern, J, S Holder (1999) Regulatory governance: Criteria for assessing the performance of regulatory systems -
An application to infrastructure industries in the developing countries of Asia. Utilities Policy, 33-50.
Chapter – II Literature Review
51
Stern and Holder report the results of a survey of a twelve infrastructure
industries in six developing countries from Asia namely, Bangladesh, India,
Indonesia, Malaysia, Pakistan and Philippines. Regulatory arrangements were
appraised on above-mentioned aspects of regulatory accountability against an
‘international best practice’, which authors develop based on regulatory experience
in OECD countries. The definitions used for best practice by Stern and Holder
(1999) are given below:
2.13
Chapter – III World energy demand and economic outlook
73
CHAPTER 3
WORLD ENERGY DEMAND AND ECONOMIC OUTLOOK
3.1 Introduction
In the International Energy Outlook-2010 (IEO-2010) projections, world
energy consumption increases by 49 percent, or 1.4 percent per year, from 495
quadrillion Btu in 2007 to 739 quadrillion Btu in 2035 (Figure 3.1 and Table 3.1).
The global economic recession that began in 2008 and continued into 2009 had a
profound impact on world income (as measured by GDP) and energy use. After
expanding at an average annual rate of 4.9 percent from 2003 to 2007, worldwide
GDP growth slowed to 3.0 percent in 2008 and contracted by 1.0 percent in 2009.
Similarly, growth in world energy use slowed to 1.2 percent in 2008 and then
declined by an estimated 2.2 percent in 2009.
Global economic recovery from the recession has been uneven so far.
Developing non-OECD Asian economies have led the global recovery, and many are
already out of recession. While there are indications that the recession in the United
States has ended, recovery in Europe and Japan has lagged. The IEO2010 assumes
that, by 2015, most nations of the world will have resumed their expected rates of
long-term growth before the recession. World GDP rises by an average of 3.2 percent
per year from 2007 to 2035 in the reference case, with non-OECD economies
averaging 4.4 percent per year and OECD economies 2.0 percent per year.
Historically, OECD member countries have accounted for the largest share of
current world energy consumption; however, in 2007 - for the first time - energy use
among non-OECD nations exceeded that among OECD nations (Figure 3.2). The
discrepancy between OECD and non-OECD energy use grows in the future, given
the more rapid growth in energy demand expected for the emerging non-OECD
economies. In 2007, energy use in non-OECD nations was 1.5 percent higher than
that in OECD nations. In the IEO2010, non-OECD economies consume 32 percent
more energy than OECD economies in 2020 and 63 percent more in 2035. OECD
Chapter – III World energy demand and economic outlook
74
energy use grows slowly over the projection period, averaging 0.5 percent per year
from 2007 to 2035, as compared with 2.2 percent per year for the emerging non-
OECD economies.
Figure No. 3.1
World marketed energy consumption , 1990-2035 ( quadrillion Btu)
Source: U.S. Energy Information Administration / International Energy Outlook 2010
Table No. 3.1
World marketed energy consumption by country grouping,
2007-2035(quadrillion Btu)
Source: U.S. Energy Information Administration / International Energy Outlook 2010
Chapter – III World energy demand and economic outlook
75
Two nations that were among the least affected by the global recession were
China and India, and they continue to lead the world’s economic growth and energy
demand growth in the Reference case. Since 1990, energy consumption as a share of
total world energy use has increased significantly in both countries, and together they
accounted for about 10 percent of the world’s total energy consumption in 1990 and
20 percent in 2007. Strong economic growth in both countries continues over the
projection period, with their combined energy use more than doubling and
accounting for 30 percent of total world energy consumption in 2035 in the
Reference case. In contrast, the U.S. share of world energy consumption falls from
21 percent in 2007 to about 16 percent in 2035 (Figure 3.3).
Energy use in non-OECD Asia (led by China and India) shows the most
robust growth of all the non-OECD regions, rising by 118 percent from 2007 to 2035
(Figure 3.4 15). However, strong growth in energy use also is projected for much of
the rest of the non-OECD regions. With fast-paced growth in population and access
to rich resources, energy demand in the Middle East increases by 82 percent over the
projection period. In Central and South America and Africa, energy consumption
increases by 63 percent. The slowest projected growth among non-OECD regions is
for non-OECD Europe and Eurasia, which includes Russia and the other former
Soviet Republics. Growth in energy use for the region totals 17 percent from 2007 to
2035, as its population declines and substantial gains in energy efficiency are
achieved through the replacement of inefficient Soviet era Capital equipment.
Figure 3.2
World marketed energy consumption: OECD and Non – OECD, 1990-2035
(quadrillion BTU)
Source: U.S. Energy Information Administration / International Energy Outlook 2010
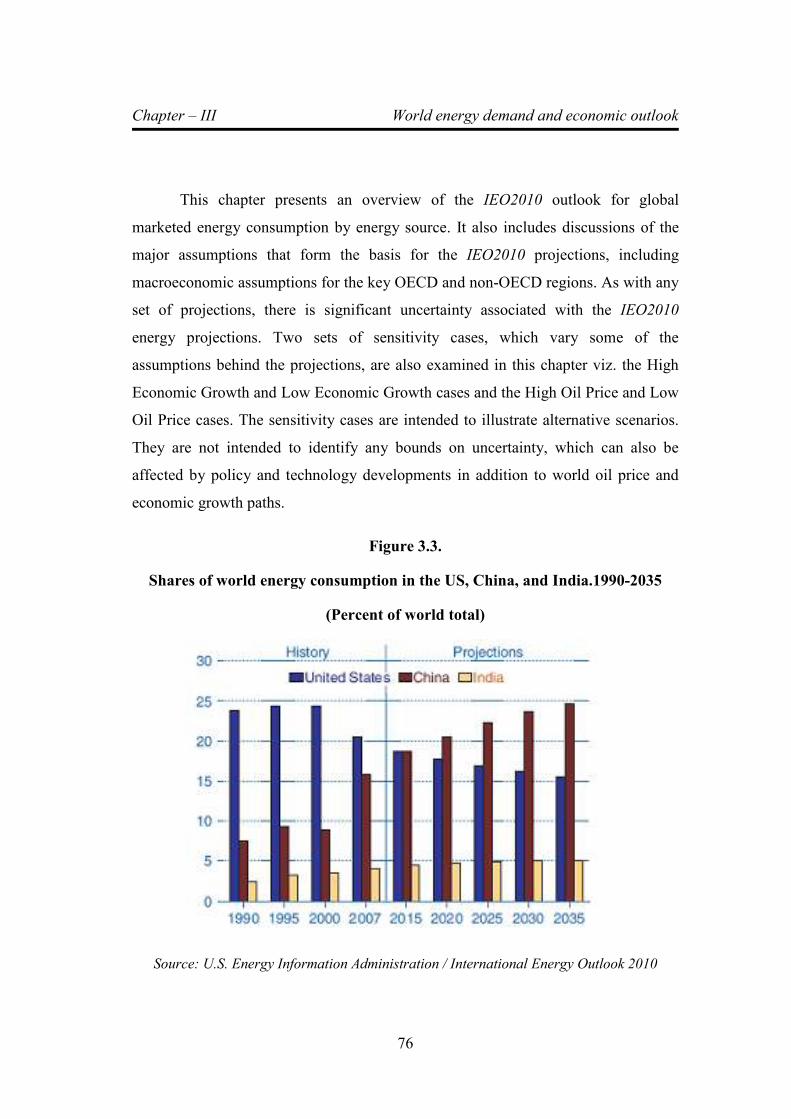
Chapter – III World energy demand and economic outlook
76
This chapter presents an overview of the IEO2010 outlook for global
marketed energy consumption by energy source. It also includes discussions of the
major assumptions that form the basis for the IEO2010 projections, including
macroeconomic assumptions for the key OECD and non-OECD regions. As with any
set of projections, there is significant uncertainty associated with the IEO2010
energy projections. Two sets of sensitivity cases, which vary some of the
assumptions behind the projections, are also examined in this chapter viz. the High
Economic Growth and Low Economic Growth cases and the High Oil Price and Low
Oil Price cases. The sensitivity cases are intended to illustrate alternative scenarios.
They are not intended to identify any bounds on uncertainty, which can also be
affected by policy and technology developments in addition to world oil price and
economic growth paths.
Figure 3.3.
Shares of world energy consumption in the US, China, and India.1990-2035
(Percent of world total)
Source: U.S. Energy Information Administration / International Energy Outlook 2010

Chapter – III World energy demand and economic outlook
77
Figure 3.4.
Marketed energy use in Non-OECD economies by region, 1990-2035
(Percent of world total)
Source: U.S. Energy Information Administration / International Energy Outlook 2010
3.2 Outlook for world energy consumption by source
The use of all energy sources increases over the time horizon of the IEO2010
Reference case (Figure 3.5). Given expectations that world oil prices will remain
relatively high through most of the projection period, liquid fuels and other
petroleum are the world’s slowest-growing source of energy. Liquids consumption
increases at an average annual rate of 0.9 percent from 2007 to 2035, whereas total
energy demand increases by 1.4 percent per year. Renewables are the fastest-growing
source of world energy, with consumption increasing by 2.6 percent per year.
Projected oil prices, as well as concern about the environmental impacts of fossil fuel
use and strong government incentives for increasing the use of renewable energy in
many countries around the world, improve the prospects for renewable energy
sources worldwide in the outlook.
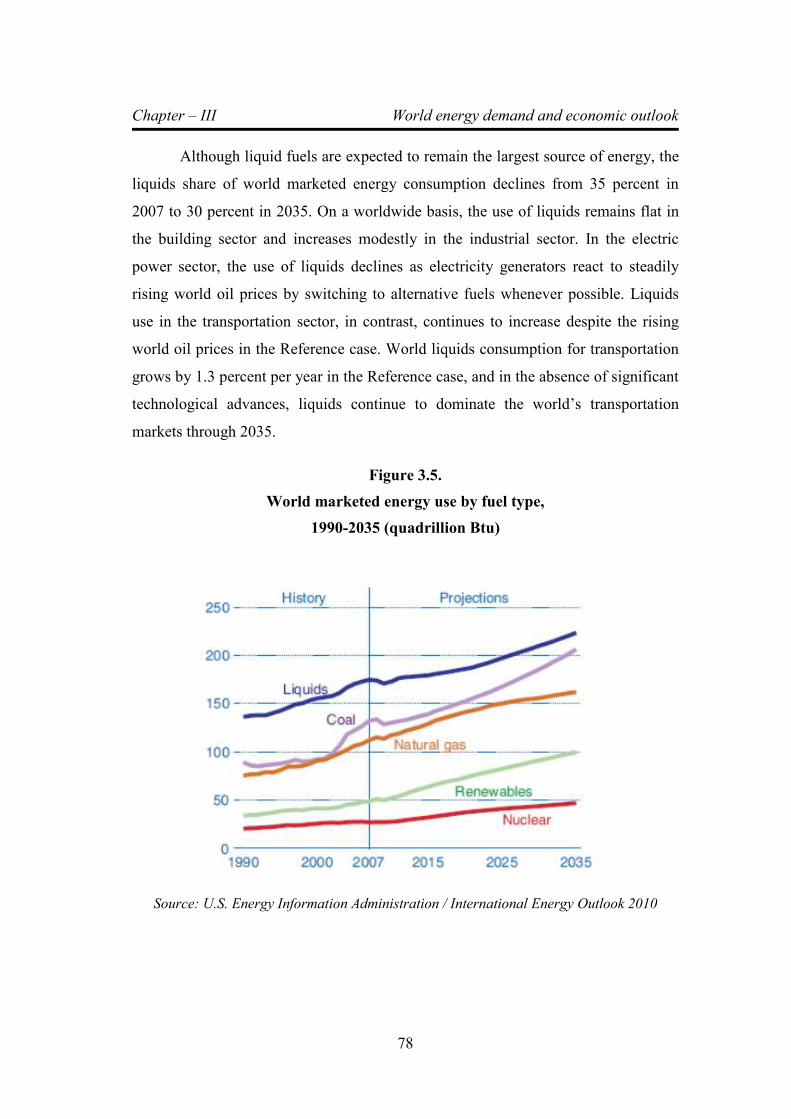
Chapter – III World energy demand and economic outlook
78
Although liquid fuels are expected to remain the largest source of energy, the
liquids share of world marketed energy consumption declines from 35 percent in
2007 to 30 percent in 2035. On a worldwide basis, the use of liquids remains flat in
the building sector and increases modestly in the industrial sector. In the electric
power sector, the use of liquids declines as electricity generators react to steadily
rising world oil prices by switching to alternative fuels whenever possible. Liquids
use in the transportation sector, in contrast, continues to increase despite the rising
world oil prices in the Reference case. World liquids consumption for transportation
grows by 1.3 percent per year in the Reference case, and in the absence of significant
technological advances, liquids continue to dominate the world’s transportation
markets through 2035.
Figure 3.5.
World marketed energy use by fuel type,
1990-2035 (quadrillion Btu)
Source: U.S. Energy Information Administration / International Energy Outlook 2010

Chapter – III World energy demand and economic outlook
79
Natural gas remains an important fuel for electricity generation worldwide.
Electricity generation is less expensive with natural gas than with oil as the primary
energy source, and natural-gas-fired generating plants are less capital-intensive than
plants that use coal, nuclear, or most renewable energy sources. In the IEO2010
Reference case, the world’s total natural gas consumption increases by 1.3 percent
per year on average, from 108 trillion cubic feet in 2007 to 156 trillion cubic feet in
2035, and its use in the electric power sector increases by 1.6 percent per year.
High world oil prices encourage consumers to turn to natural gas in the near
future, but as supplies of natural gas become increasingly expensive to produce after
2020, the growth of natural gas use slows substantially. Between 2007 and 2020,
worldwide natural gas demand increases by 1.8 percent per year, but between 2020
and 2035 the rate of growth is only 0.9 percent per year, as consumers turn to
alternative sources of generation - notably, renewable energy sources, nuclear power,
and, in the absence of policies that would limit its use, coal. World coal consumption
increases by 1.6 percent per year on average from 2007 to 2035, but most of the
growth in demand occurs after 2020. Worldwide coal consumption increased by 35
percent between 2002 and 2007; largely because of the growth in China’s coal use.
Between 2007 and 2009, however, coal consumption declined by 3 percent.
Coal use was strongly affected by the global recession, and consumption contracted
strongly in 2009, in large part because coal is widely used in the production of heavy
commodities (such as, steel and pig iron), which were particularly hard hit in the
recession.
In the absence of policies or legislation that would limit the growth of coal
use, China and, to a lesser extent, India and the other nations of non-OECD Asia
consume coal in place of more expensive fuels. China alone accounts for 78 percent
of the net increase in world coal consumption, whereas India and the rest of non-
OECD Asia combined account for 17 percent of the world increase (Figure 3.6).
Electricity is the world’s fastest-growing form of endues energy consumption
in the Reference case, as it has been for the past several decades. Net electricity
generation worldwide rises by 2.3 percent per year on average from 2007 to 2035,

Chapter – III World energy demand and economic outlook
80
while total world energy demand grows by 1.4 percent per year. The strongest
growth in electricity generation is for non-OECD countries.
Non-OECD electricity generation increases by an average annual rate of 3.3
percent in the Reference case, as rising standards of living increase demand for home
appliances and the expansion of commercial services, including hospitals, office
buildings, and shopping malls. In OECD nations, where infrastructures are more
mature and population growth is relatively slow, growth in generation is much
slower, averaging 1.1 percent per year from 2007 to 2035. Coal provides the largest
share of world electricity generation in the Reference case. It accounted for 42
percent of total generation in 2007, and its share is largely unchanged through 2035
(Figure 3.7). In contrast, liquids, natural gas, and nuclear power all lose market share
of world generation over the course of the projection period, displaced by the strong
growth projected for renewable sources of generation. Renewable generation is the
world’s fastest-growing source of electric power in the IEO2010 Reference case,
rising at an average annual rate of 3.0 percent over the projection period, as
compared with increases of 2.3 percent per year for coal, 2.1 percent per year for
natural gas, and 2.0 percent per year for nuclear power. With government policies
and incentives throughout the world supporting the rapid construction of renewable
generation facilities, the renewable share of world generation increases from 18
percent in 2007 to 23 percent in 2035.
Figure 3.6
Coal consumption in selected world regions, 1990-2035 (quadrillion Btu)
Source: U.S. Energy Information Administration / International Energy Outlook 2010
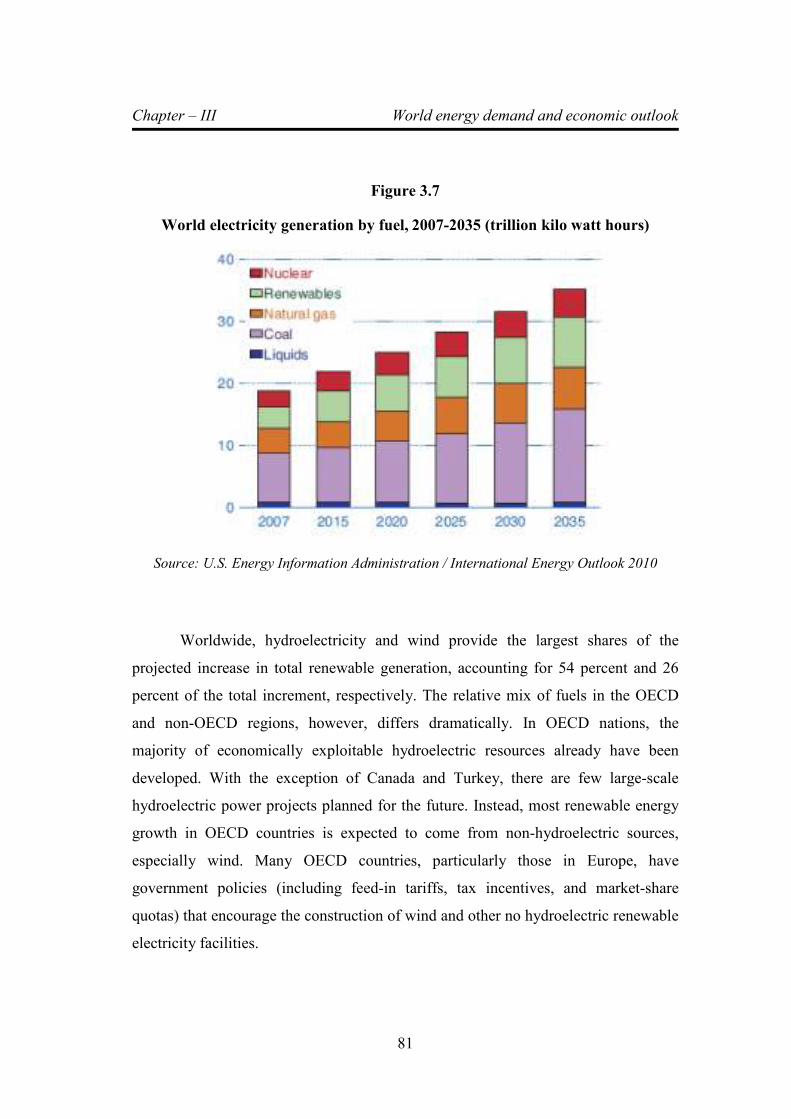
Chapter – III World energy demand and economic outlook
81
Figure 3.7
World electricity generation by fuel, 2007-2035 (trillion kilo watt hours)
Source: U.S. Energy Information Administration / International Energy Outlook 2010
Worldwide, hydroelectricity and wind provide the largest shares of the
projected increase in total renewable generation, accounting for 54 percent and 26
percent of the total increment, respectively. The relative mix of fuels in the OECD
and non-OECD regions, however, differs dramatically. In OECD nations, the
majority of economically exploitable hydroelectric resources already have been
developed. With the exception of Canada and Turkey, there are few large-scale
hydroelectric power projects planned for the future. Instead, most renewable energy
growth in OECD countries is expected to come from non-hydroelectric sources,
especially wind. Many OECD countries, particularly those in Europe, have
government policies (including feed-in tariffs, tax incentives, and market-share
quotas) that encourage the construction of wind and other no hydroelectric renewable
electricity facilities.
Chapter – III World energy demand and economic outlook
82
In non-OECD nations, hydroelectric power is the predominant source of
renewable energy growth. Strong increases in hydroelectric generation, primarily
from mid- to large-scale power plants, are expected in Brazil and in non-OECD Asia
(especially, China and India), which in combination account for 83 percent of the
total increase in non-OECD hydroelectric generation over the projection period.
Growth rates for wind-powered electricity generation also are high in non-OECD
countries.
The fastest-growing non-OECD regional market for wind power is attributed
to China, where total generation from wind power plants increases from 6 billion
kilowatt-hours in 2007 to 374 billion kilowatt-hours in 2035. Still, the total increase
in China’s wind-powered generation is less than half the increase in its hydroelectric
generation (Figure 3.8).
Electricity generation from nuclear power worldwide increases from 2.6
trillion kilowatt-hours in 2007 to 4.5 trillion kilowatt-hours in 2035 in the IEO2010
Reference case, as high fossil fuel prices and concerns about energy security and
greenhouse gas emissions support the development of new nuclear generating
capacity. World average capacity utilization rates have continued to rise over time,
from about 65 percent in 1990 to about 80 percent today, with some increases still
anticipated in the future. In addition, most of the older plants now operating in
OECD countries and in non-OECD Eurasia probably will be granted extensions to
their operating licenses.
Nuclear power, however, and a number of issues could slow the development
of new nuclear power plants. Plant safety, radioactive waste disposal, and nuclear
material proliferation concerns, which continue to raise public concerns in many
countries, may hinder plans for new installations, and high capital and maintenance
costs may keep some countries from expanding their nuclear power programs.
Nearly 72 percent of the world expansion in installed nuclear power capacity
is expected in non-OECD countries (Figure 3.9). China, India, and Russia account
for the largest increment in world net installed nuclear power between 2007 and
Chapter – III World energy demand and economic outlook
83
2035. In the Reference case, China adds 66 GW (gigawatts) of nuclear capacity
between 2007 and 2035, India 23 gigawatts, and Russia 25 gigawatts. Within the
OECD, every region increases its installed nuclear capacity to some extent, except
for Australia and New Zealand, where existing policies that discourage nuclear
power are assumed to remain unchanged through the end of the projection period.
In a change from past IEOs, OECD Europe sees an increase in nuclear power
capacity over the projection period, as a number of European countries have
reassessed their nuclear stance in the past year. The governments of several countries
have announced changes in their positions since 2009, including the Belgian
government, which decided to delay its phase out plans by 10 years; the German
government, which has expressed willingness to reconsider its nuclear phase out
policies; and the Italian government, which has formally ended its anti-nuclear
policies and announced plans for constructing a new reactor by 2020. There are also
indications that several other European countries, including Poland and Turkey, plan
to begin new nuclear generation programs. In the IEO-2010, OECD Europe adds a
net 10 gigawatts of installed nuclear capacity between 2006 and 2030, as compared
with a net loss of 11 gigawatts of nuclear capacity projected in IEO2009.
In the United States, Title XVII of the Energy Policy Act of 2005
(EPACT2005, Public Law 109-58) authorizes the U.S. Department of Energy to
issue loan guarantees for innovative technologies that “avoid, reduce, or sequester
greenhouse gases”. In addition, subsequent legislative provisions in the Consolidated
Appropriation Act of 2008 (Public Law 110-161) allocated $18.5 billion in
guarantees for nuclear power plants. That legislation, along with high fossil fuel
prices, results in increases of 8.4 gigawatts of capacity at newly built U.S. nuclear
power plants between 2007 and 2035 and 4.0 gigawatts from expansion projects at
existing plants. All existing U.S. nuclear units continue to operate through 2035 in
the Reference case, which assumes that the owners will apply for and receive
operating license renewals including, in some cases, a second extension after they
reach 60 years of operation.

Chapter – III World energy demand and economic outlook
84
3.3 Delivered energy consumption by end-use sector
Understanding patterns in the consumption of energy delivered to end users is
important to the development of projections for global energy use. Outside the
transportation sector, which at present is dominated by liquid fuels, the mix of energy
use in the residential, commercial, and industrial sectors varies widely by region,
depending on a combination of regional factors, such as the availability of energy
resources, levels of economic development, and political, social, and demographic
factors.
Figure 3.8
Renewable electricity generation in China by energy source,
2007-2035 (billion Kilowatt-hours)
U.S. Energy Information Administration / International Energy Outlook 2010
Figure3.9
World nuclear generating capacity by region,2007 and 2035 (gigawatts)
U.S. Energy Information Administration / International Energy Outlook 2010

Chapter – III World energy demand and economic outlook
85
3.3.1 Residential sector
Energy use in the residential sector, which accounted for about 14 percent of
world delivered energy consumption in 2007, is defined as the energy consumed by
households, excluding transportation uses. Residential energy use grows at an
average rate of 1.1 percent per year from 2007 to 2035. The type and amount of
energy used by households vary from country to country, depending on income
levels, natural resources, climate, and available energy infrastructure. In general,
typical households in OECD nations use more energy than those in non-OECD
nations, in part because higher income levels allow OECD households to have larger
homes and purchase more energy-using equipment. In the United States, for
example, GDP per capita in 2007 was $43,076 , and residential energy use per capita
was estimated at 37.2 million Btu. In contrast, China’s per-capita income in 2007, at
$5,162, was only about one-eighth the U.S. level, and its residential energy use per
capita, at 4.0 million Btu, was about one-ninth the U.S. level. For residential
buildings, the physical size of a structure is one key indicator of the amount of
energy used by its occupants, although income level and a number of other factors,
such as weather, can also affect the amount of energy consumed per household.
Controlling for those factors, larger homes generally require more energy to provide
heating, air conditioning, and lighting, and they tend to include more energy-using
appliances, such as televisions and laundry equipment. Smaller structures usually
require less energy, because they contain less space to be heated or cooled, produce
less heat transfer with the outdoor environment, and typically have fewer occupants.
For instance, residential energy consumption is lower in China, where the average
residence currently has an estimated 300 square feet of living space or less per
person, than in the United States, where the average residence has an estimated 680
square feet of living space per person.
Although the IEO2010 projections account for marketed energy use only,
households in many non-OECD countries still rely heavily on traditional, non-
marketed energy sources, including wood and waste, for heating and cooking. Much
of Africa remains unconnected to power grids, and the International Energy Agency

Chapter – III World energy demand and economic outlook
86
estimates that more than 70 percent of the sub-Saharan African population does not
have access to electricity. About 37 percent of the world population - largely in India
and Africa - still relies on animal dung, fuel wood, and agricultural residues for
cooking fuel. Some areas of China and India also rely heavily on fuel wood, wood
waste, and charcoal for cooking. As incomes rise in the developing world over the
course of the projection, households replace the use of traditional fuels with
marketed ones, such as propane and electricity, as they become more widely
accessible.
3.3.2Commercial sector
The commercial sector - often referred to as the service sector or the services
and institutional sector - consists of businesses, institutions, and organizations that
provide services. The sector, which accounted for 7 percent of total delivered energy
consumption in 2007, encompasses many different types of buildings and a wide
range of activities and energy-related services. Commercial sector energy use grows
by an average of 1.5 percent per year from 2007 to 2035. Examples of commercial
sector facilities include schools, stores, correctional institutions, restaurants, hotels,
hospitals, museums, office buildings, banks, and sports arenas. Most commercial
energy use occurs in buildings or structures, supplying services such as space
heating, water heating, lighting, cooking, and cooling. Energy consumed for services
not associated with buildings, such as for traffic lights and city water and sewer
services, is also categorized as commercial energy use.
Economic trends and population growth drive commercial- sector activity and
the resulting energy use. The need for services (health, education, financial, and
government) increases as populations increase. The degree to which additional needs
are met depends in large measure on economic resources whether from domestic or
foreign sources and economic growth. Economic growth also determines the degree
to which additional activities are offered and used in the commercial sector. Higher
levels of economic activity and disposable income lead to increased demand for
hotels and restaurants to meet business and leisure requirements; for office and retail
space to house and service new and expanding businesses; and for cultural and
Chapter – III World energy demand and economic outlook
87
leisure space such as theaters, galleries, and arenas. In the commercial sector, energy
intensity or energy use per dollar of income as measured by GDP in non-OECD
countries is much lower than in OECD countries. Non-OECD commercial energy
intensity in 2007, at 281 Btu per dollar of GDP, was only about half the OECD level
(522 Btu per dollar of GDP).
In the future, slower expansion of GDP and low or declining population
growth in many OECD nations contribute to slower anticipated rates of increase in
commercial energy demand. In addition, continued efficiency improvements
moderate the growth of energy demand over time, as energy-using equipment is
replaced with newer, more efficient stock. Conversely, continued economic growth is
expected to include growth in business activity, with its associated energy use, in
areas such as retail and wholesale trade and business, financial services, and leisure
services. The United States is the largest consumer of commercial delivered energy
in the OECD and remains in that position throughout the projection, accounting for
about 45 percent of the OECD total in 2035.
In non-OECD nations, economic activity and commerce increase rapidly,
fueling additional demand for energy in the service sectors. Population growth also is
more rapid than in OECD countries, portending increases in the need for education,
health care, and social services and the energy required to provide them. In addition,
as developing nations mature, they transition to more service- related enterprises,
increasing demand for energy in the commercial sector. The energy needed to fuel
growth in commercial buildings will be substantial, with total delivered commercial
energy use among non-OECD nations growing by 2.7 percent per year from 2007 to
2035.
3.3.3 Industrial sector
Energy is consumed in the industrial sector by a diverse group of industries -
including manufacturing, agriculture, mining, and construction - and for a wide range
of activities, such as processing and assembly, space conditioning, and lighting. The
industrial sector comprised 51 percent of global delivered energy use in 2007 and
Chapter – III World energy demand and economic outlook
88
grows by an average annual 1.3 percent over the projection. Industrial energy
demand varies across regions and countries of the world, based on the level and mix
of economic activity and technological development, among other factors. Industrial
energy use also includes natural gas and petroleum products used as feedstocks to
produce non-energy products, such as plastics and fertilizer. In aggregate, the
industrial sector uses more energy than any other end-use sector, consuming about
one-half of the world’s total delivered energy.
OECD economies generally have more energy-efficient industrial operations
and a mix of industrial output that is more heavily weighted toward non-energy-
intensive sectors than the mix in non-OECD countries. As a result, the ratio of
industrial energy consumption to total GDP tends to be higher in non-OECD
economies than in OECD economies. On average, industrial energy intensity (the
consumption of energy consumed in the industrial sector per dollar of economic
output) in non-OECD countries is double that in OECD countries.
3.3.4 Transportation sector
Energy use in the transportation sector includes the energy consumed in
moving people and goods by road, rail, air, water, and pipeline. The transportation
sector accounted for 27 percent of total world delivered energy consumption in 2007,
and transportation energy use increases by 1.3 percent per year from 2007 to 2035.
The road transport component includes light-duty vehicles, such as automobiles,
sport utility vehicles, minivans, small trucks, and motorbikes, as well as heavy-duty
vehicles, such as large trucks used for moving freight and buses used for passenger
travel. Growth rates for economic activity and population are the key factors for
transportation energy demand. Economic growth spurs increases in industrial output,
which requires the movement of raw materials to manufacturing sites, as well as the
movement of manufactured goods to end users.
For both non-OECD and OECD economies, steadily increasing demand for
personal travel is a primary factor underlying projected increases in energy demand
for transportation. Increases in urbanization and in personal incomes have
Chapter – III World energy demand and economic outlook
89
contributed to increases in air travel and motorization (more vehicles per capita) in
the growing economies. Increases in the transport of goods result from continued
economic growth in both OECD and non-OECD economies. For freight
transportation, trucking leads the growth in demand for transportation fuels. In
addition, as trade among countries increases, the volume of freight transported by air
and marine vessels increases rapidly.
3.4 World economic outlook
Economic growth is among the most important factors to be considered in
projecting changes in world energy consumption. In IEO2010, assumptions about
regional economic growth measured in terms of real GDP in 2005 U.S. dollars at
purchasing power parity rates underlie the projections of regional energy demand.
Starting in 2008, the world experienced its worst recession of the past 60 years.
Although it appears that recovery has begun, its strength and timing are not entirely
clear. The emerging economies of Asia (led by China and India) appear to be
recovering quickly. The advanced economies, particularly the European countries
and Japan, are improving much more slowly and have had concerns about a return to
recession in the short term.
Substantial stimulus packages in the United States and China, as well as in a
number of other countries around the world, are widely credited with averting
another Great Depression. China’s $586 billion stimulus package has been used
largely to fund infrastructure projects (including railways, roads, airports, urban
power grids, and irrigation projects) and also for social programs, both domestically
and abroad. Many non-OECD Asian economies that are trading partners with China
also have benefited from their ties with China. The emerging Asian economies -
particularly those strongly dependent on exports for revenues - saw profound
decreases in economic activity in 2008 and into 2009, as demand for goods among
OECD economies declined sharply. The recovery in China has bolstered their
recovery. From 2007 to 2035, growth in world real GDP (on a purchasing power
parity basis) averages 3.2 percent per year in the Reference case (Table 3.2). In the
long term, the ability to produce goods and services (the supply side) determines the
growth potential of each country’s economy.
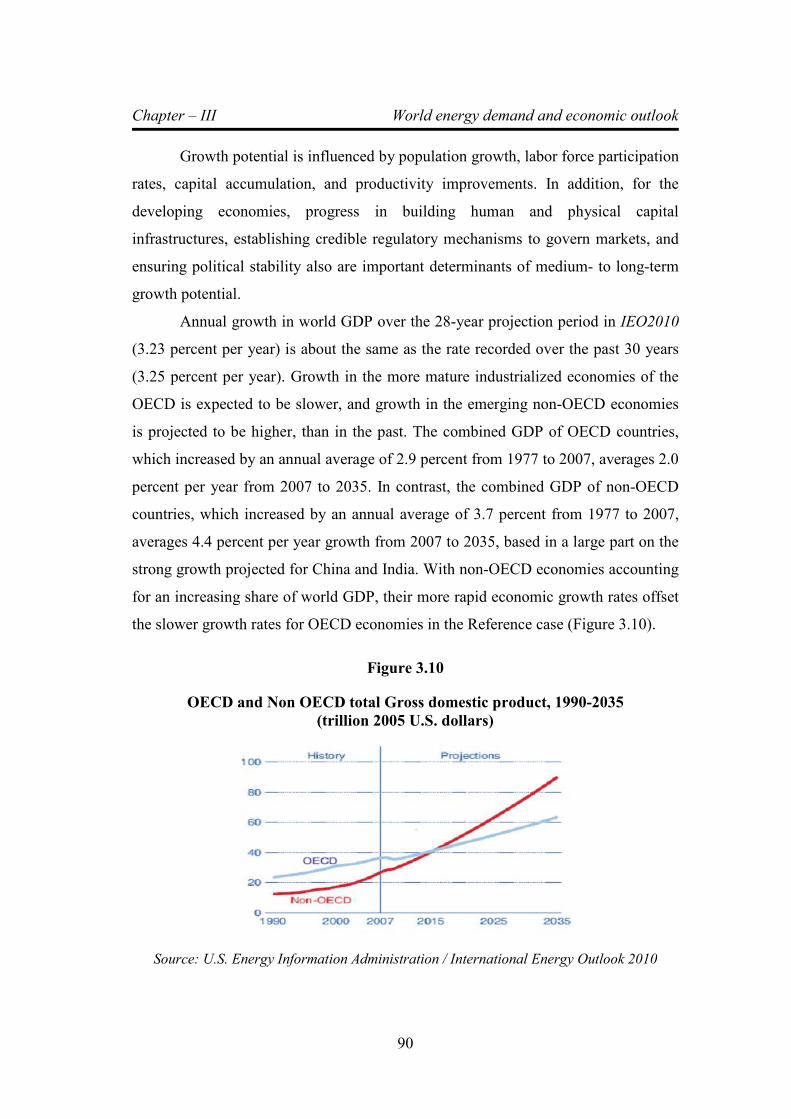
Chapter – III World energy demand and economic outlook
90
Growth potential is influenced by population growth, labor force participation
rates, capital accumulation, and productivity improvements. In addition, for the
developing economies, progress in building human and physical capital
infrastructures, establishing credible regulatory mechanisms to govern markets, and
ensuring political stability also are important determinants of medium- to long-term
growth potential.
Annual growth in world GDP over the 28-year projection period in IEO2010
(3.23 percent per year) is about the same as the rate recorded over the past 30 years
(3.25 percent per year). Growth in the more mature industrialized economies of the
OECD is expected to be slower, and growth in the emerging non-OECD economies
is projected to be higher, than in the past. The combined GDP of OECD countries,
which increased by an annual average of 2.9 percent from 1977 to 2007, averages 2.0
percent per year from 2007 to 2035. In contrast, the combined GDP of non-OECD
countries, which increased by an annual average of 3.7 percent from 1977 to 2007,
averages 4.4 percent per year growth from 2007 to 2035, based in a large part on the
strong growth projected for China and India. With non-OECD economies accounting
for an increasing share of world GDP, their more rapid economic growth rates offset
the slower growth rates for OECD economies in the Reference case (Figure 3.10).
Figure 3.10
OECD and Non OECD total Gross domestic product, 1990-2035
(trillion 2005 U.S. dollars)
Source: U.S. Energy Information Administration / International Energy Outlook 2010
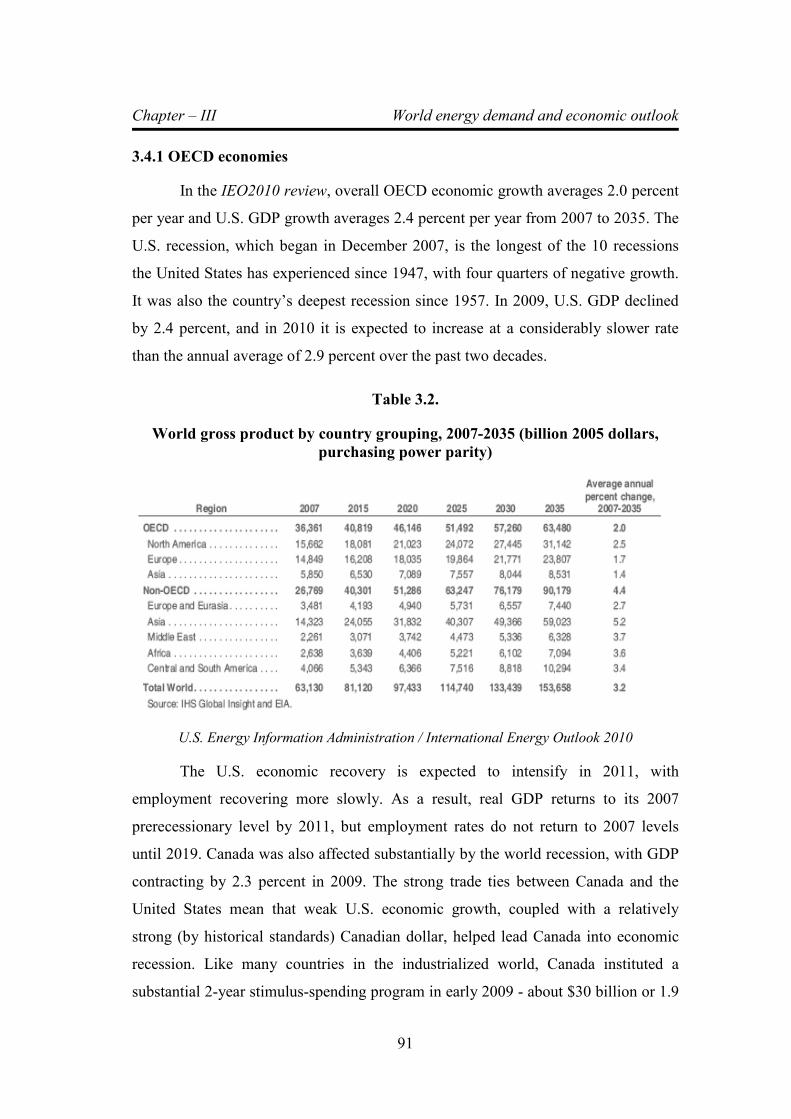
Chapter – III World energy demand and economic outlook
91
3.4.1 OECD economies
In the IEO2010 review, overall OECD economic growth averages 2.0 percent
per year and U.S. GDP growth averages 2.4 percent per year from 2007 to 2035. The
U.S. recession, which began in December 2007, is the longest of the 10 recessions
the United States has experienced since 1947, with four quarters of negative growth.
It was also the country’s deepest recession since 1957. In 2009, U.S. GDP declined
by 2.4 percent, and in 2010 it is expected to increase at a considerably slower rate
than the annual average of 2.9 percent over the past two decades.
Table 3.2.
World gross product by country grouping, 2007-2035 (billion 2005 dollars,
purchasing power parity)
U.S. Energy Information Administration / International Energy Outlook 2010
The U.S. economic recovery is expected to intensify in 2011, with
employment recovering more slowly. As a result, real GDP returns to its 2007
prerecessionary level by 2011, but employment rates do not return to 2007 levels
until 2019. Canada was also affected substantially by the world recession, with GDP
contracting by 2.3 percent in 2009. The strong trade ties between Canada and the
United States mean that weak U.S. economic growth, coupled with a relatively
strong (by historical standards) Canadian dollar, helped lead Canada into economic
recession. Like many countries in the industrialized world, Canada instituted a
substantial 2-year stimulus-spending program in early 2009 - about $30 billion or 1.9
Chapter – III World energy demand and economic outlook
92
percent of GDP - for infrastructure improvements, income tax reductions, and
housing construction incentives, among other programs.
The Canadian economy showed signs of recovery at the end of 2009, with
5.0-percent GDP growth in the fourth quarter. In 2010, the government announced
plans to phase out stimulus spending by March 2011 and, through budget austerity
measures, to cut Canada’s $54 billion deficit in half within 2 years. In the long term,
as U.S. consumer demand returns and export markets improve, economic growth in
Canada returns to its potential. In the IEO2010 Reference case, Canada’s GDP grows
by an average of 2.1 percent per year from 2007 to 2035.
Mexico was the Western Hemisphere’s hardest-hit economy in the 2008-2009
recession. Not only did it suffer when worldwide commodity exports collapsed, but
the impact of the recession was compounded by the outbreak of H1N1 “swine flu” in
2009. Mexico’s high reliance on the United States as a market for its manufacturing
exports suggests that its economic recovery will be dependent on the U.S. recovery.
About 80 percent of Mexico’s exports are sent to the United States. Rising world oil
prices and recovery of the U.S. economy are expected to support Mexico’s return to
trend growth, with GDP increasing by an average of 3.5 percent per year from 2007
to 2035.
In 2009, GDP in the economies of OECD Europe contracted by 3.9 percent,
much more sharply than the 0.2-percent decline anticipated in last year’s IEO. In
2010, economic growth in OECD Europe is expected to average only 1.0 percent.
Several economies in the region, notably those of Greece, Spain, Portugal, and
Ireland, are currently carrying very high debt levels. In Greece, for instance, the high
current account deficit, which surpassed 12 percent of total GDP and triggered a debt
crisis, led the country nearly to default. However, a rescue package assembled jointly
by the European Union, the International Monetary Fund, and the European Central
Bank was implemented in May 2010 to prevent default and stop the crisis from
spreading to other economies of the European Union. Greece accounts for less than 3
percent of the European Union’s total GDP, but signs of structural problems in the

Chapter – III World energy demand and economic outlook
93
economies of Spain, Portugal, Ireland, and to a lesser extent Italy may weigh heavily
on the economic recovery of OECD Europe as a whole. In the IEO2010 Reference
case, total GDP in OECD Europe does not recover to its 2007 level until 2012.
Economic growth in the region averages 1.7 percent per year from 2007 to 2035,
below the increase of 2.0 percent per year for the OECD as a whole.
Japan was among the OECD economies hardest hit by the global economic
downturn. Beginning in the second quarter of 2008, its GDP declined in four
consecutive quarters. The International Monetary Fund estimates that, on an
annualized basis, Japan’s GDP contracted by more than 10 percent per year in the
fourth quarter of 2008 and the first quarter of 2009. Although the Japanese banking
sector was relatively insulated from the global financial crisis that began in 2007 and
worsened in 2008, demand for Japanese goods declined precipitously as some of
Japan’s largest customers fell into recession. In the past, Japan has relied on exports
to generate about one-third of its GDP growth, and the decrease in exports strongly
affected its economy.
Although improving exports and government incentive programs (which have
stimulated domestic consumer demand) should allow Japan’s GDP growth rate to
improve in 2010, the pace of recovery is likely to be tied to those of its major
customers in the United States and OECD Europe. In the long term, Japan’s aging
labor force and declining population are likely to result in substantially slower
economic growth over the projection period, averaging 1.4 percent per year from
2009 to 2020 and 0.3 percent per year from 2020 to 2035.
More robust economic growth occurs in the rest of OECD Asia. In South
Korea, GDP growth averages 2.9 percent per year from 2007 to 2035. The global
recession led to profound declines in Korea’s exports and domestic demand in 2008
and into 2009. In response to the deepening economic crisis, the Bank of Korea cut
its interest rate six times between October 2008 and February 2009, to 2.0 percent,
where it remained into 2010. In addition, the South Korean government introduced
stimulus packages worth about $44 billion (50 trillion won) into the economy to
Chapter – III World energy demand and economic outlook
94
stimulate domestic demand. South Korea’s economy began to recover in the second
half of 2009, recording double-digit growth rates in the second and third quarters, as
exports to China increased sharply and the effects of the stimulus funds were felt. A
return to world demand for Korean goods will support the South Korean economic
recovery in the near term. In the long term, however, its growth tapers off as the
growth of its labor force slows.
GDP growth in Australia/New Zealand averages 2.6 percent per year from
2007 to 2035 in the IEO2010 Review case. To address GDP growth that slowed
markedly in Australia and declined in New Zealand as a result of the global
recession, the Reserve Bank of Australia and the Reserve Bank of New Zealand
eased monetary cushion the impact of the global economic downturn. Australia’s
recovery is already well underway, with GDP growth expected to return to pre-crisis
trend levels of about 3.0 percent per year in 2010. In fact, Australia was the first
“Group of 20” nation to begin tightening monetary policy and increasing interest
rates in October 2009. Interest rates have increased periodically since that time,
reaching 4.0 percent in 2010. In comparison with Australia, New Zealand’s
economic recovery has been tepid, and interest rates remained at record low levels of
2.5 percent through the first quarter of 2010 with assurances that monetary policy
would begin to be tightened by mid-year. Long-term prospects in both countries are
relatively healthy, given their consistent track records of fiscal prudence and
structural reforms aimed at maintaining competitive product markets and flexible
labor markets.
3.4.2 Non-OECD economies
Overall non-OECD economic growth averages 4.4 percent per year in the
IEO2010 Reference case from 2007 to 2035. Economic growth in non-OECD
Europe and Eurasia as a whole averages 2.7 percent per year. After several years of
strong regional economic growth (the region’s GDP grew by an average of 6.7
percent per year from 2000 to 2008), GDP in non-OECD Europe and Eurasia
contracted by 7.3 percent in 2009. The region has a fairly diverse set of economies,
Chapter – III World energy demand and economic outlook
95
and while some suffered deep recessions in 2008-2009, others saw economic growth
slow but remain positive.
Those nations reliant on commodity exports tended to fare worse than their
neighbors in the recent recession. For example, in Russia - the region’s largest
economy - GDP declined by 8.0 percent in 2009; Ukraine’s GDP declined by 15.0
percent; and Kazakhstan’s GDP declined by a more modest 1.1 percent. In contrast
to the sharp economic declines among the energy-exporting nations of non-OECD
Europe and Eurasia, other smaller regional economies with strong domestic demand
were affected only slightly by the global economic downturn. For instance, both
Albania and Uzbekistan recorded GDP growth of more than 4 percent in 2009.
Beginning in late 2007, it became more difficult for banks and other entities in non-
OECD Europe and Eurasia - particularly, Russia, Kazakhstan, and Ukraine - to gain
access to foreign loans. The impact was softened somewhat by higher world market
prices for commodity exports, but with the subsequent collapse of commodity prices
and worsening global economic situation, the region’s economic growth declined
sharply. In the mid- to long term, a return to high world oil prices stimulates
investment outlays, especially in the energy sector of the Caspian region. Given the
volatility of energy market prices, however, it is unlikely that the economies of non-
OECD Europe and Eurasia will be able to sustain their recent growth rates until they
have achieved more broad-based diversification from energy production and exports.
Much of the growth in world economic activity between 2007 and 2035
occurs among the nations of non-OECD Asia, where regional GDP growth averages
5.2 percent per year. China, non-OECD Asia’s largest economy, continues playing a
major role in both the supply and demand sides of the global economy. IEO2010
projects an average annual growth rate of approximately 5.8 percent for China’s
economy from 2007 to 2035 - the highest among all the world’s economies. Non-
OECD Asia is leading the recovery from the 2008-2009 global economic recession.
The substantial Chinese stimulus, considerable loosening of lending terms, and tax
breaks for new cars and appliances have translated to a 17-percent increase in retail
sales (the largest increase in more than 20 years) and an 18-percent increase in
Chapter – III World energy demand and economic outlook
96
industrial production. It now appears that China posted a 9 % increase in GDP in
2009, and that it is on its way to returning to double-digit growth in 2010. One caveat
is that the government is attempting to remove stimulus spending and tighten lending
terms in order to eliminate incentives for over investment and to control price
inflation in the short term. Many non-OECD Asian economies that are trade partners
with China have also benefited from their ties with China. Although these emerging
Asian economies - particularly those strongly dependent on exports for revenues -
experienced profound decreases in economic activity in 2008 and into 2009 as
demand for goods among OECD economies sharply declined, the recovery in China
has bolstered their recovery.
Structural issues that have implications for economic growth in China in the
mid to long term include the pace of reform affecting inefficient state-owned
companies and a banking system that is carrying a significant amount of non
performing loans. Development of domestic capital markets continues in the
IEO2010 Reference case, providing macroeconomic stability and ensuring that
China’s large domestic savings are used more efficiently.
India’s economy is not as dependent on export revenues as are the economies
of China and some of the other non-OECD Asian countries. About 75 percent of
India’s population still depends on farming for income. As a result, India was
affected far less by the global economic downturn than were many other nations of
the world. India’s GDP grew by about 6.0 percent in 2008 and 2009 and is expected
to grow by 7.5 percent in 2010.
Its GDP growth is expected to return to pre-recession trends over the next
year or so, with positive prospects for the economy in the mid-term, as it continues to
privatize state enterprises and increasingly adopts free market policies. Accelerating
structural reforms including ending regulatory impediments to the consolidation of
labor-intensive industries, labor market and bankruptcy reforms, and agricultural and
trade liberalization remain essential for stimulating potential growth and reducing
poverty in India over the mid to long term. In the IEO2010 Reference case, GDP
Chapter – III World energy demand and economic outlook
97
growth in India averages 5.0 percent per year from 2007 to 2035. Outside China and
India, recovery from the global recession in the countries of non-OECD Asia is
likely to vary. Those economies that are export-dependent (including Hong Kong,
Indonesia, Singapore, and Taiwan) weakened substantially in 2009, as demand in the
United States, Europe, and Asia declined and industrial production contracted by
about 25 percent. For the export-dependent nations, China’s strong economic
rebound is likely to support recovery in the near term.
For nations where domestic demand remains healthy (including Vietnam and
the Philippines), the impact of the global recession was less severe, although their
growth did slow in 2009. Overall, long-term economic activity in the nations of non-
OECD Asia remains robust. From 2007 to 2035, national economic growth rates for
the region excluding China and India average 4.3 percent per year, as labour force
growth rates decline and economies mature.
From 2003 to 2008, rising oil production and prices helped boost economic
growth in the oil-exporting countries of the Middle East, many of which also
benefited from spillover effects on trade, tourism, and financial flows from the
region’s oil exports. The sharp decline in world oil prices at the end of 2008 and into
2009, combined with OPEC-imposed production cuts, declining demand for other
exports, and reduced capital inflows, slowed economic growth to its lowest rate since
1994. Stimulus funding from Saudi Arabia, the United Arab Emirates, and other
countries in the region helped to keep GDP from falling lower. With strengthening
oil prices and rebounding demand for the region’s export commodities, prospects for
economic growth remain favorable. The Middle East’s reliance on oil and natural gas
revenues continues for much of the projection period.
The impact of the global recession on the economies of Africa varied across
the continent. In the countries of Southern Africa, GDP declined by 1.9 percent in
2009. South Africa, the region’s largest economy, experienced its first recession
since 1992, and the impact spread to neighboring countries. Western Africa’s
economic growth slowed but remained positive, as Nigeria, the second largest
Chapter – III World energy demand and economic outlook
98
economy in sub-Saharan Africa after South Africa, saw increases in agricultural
output that offset declines in industrial output and oil production. Northern African
nations benefited from strong domestic demand and high agricultural output from
Algeria and Morocco. Eastern African nations experienced robust economic growth
in 2009, largely because of strong economic performance in Ethiopia and the
member countries of the East African Community (Kenya, Uganda, Rwanda,
Burundi, and Tanzania).
In the IEO2010 Reference case, Africa’s combined economy grows at an
average annual rate of 3.6 percent from 2007 to 2035, supported by the expansion of
exports and robust domestic demand in many of the continent’s national economies.
Nevertheless, both economic and political factors, such as low savings and
investment rates, lack of strong economic and political institutions, limited quantity
and quality of infrastructure and human capital, negative perceptions on the part of
international investors, protracted civil unrest and political disturbances, and the
impact of disease present formidable obstacles to growth in a number of African
countries.
As in Africa, the impact of the global economic downturn on the nations of
Central and South America varied across the region. Brazil, the region’s largest
economy, is already well along the path of recovery after experiencing a relatively
short and mild recession in 2009. Its recovery is supported by domestic and foreign
investment, along with strengthening domestic consumption. Other countries
including Argentina, Bolivia, Ecuador, and Venezuela are expected to recover much
more slowly.
Investment in the countries of Central and South America is constrained by
adverse economic circumstances, and revenues from commodities exports are not
expected to provide the level of government revenue that they had from 2003 to
2008. The proximity of the region to the United States and the trade relationships of
its national economies with the U.S. economy suggest that the region’s recovery will
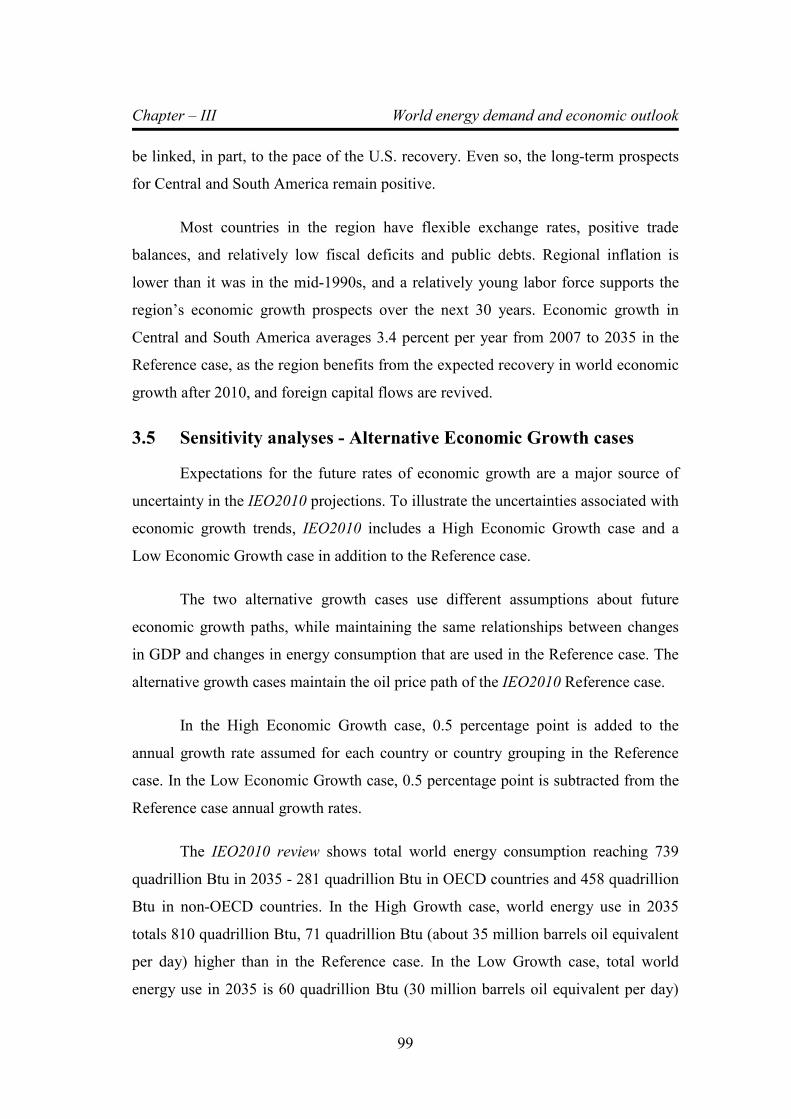
Chapter – III World energy demand and economic outlook
99
be linked, in part, to the pace of the U.S. recovery. Even so, the long-term prospects
for Central and South America remain positive.
Most countries in the region have flexible exchange rates, positive trade
balances, and relatively low fiscal deficits and public debts. Regional inflation is
lower than it was in the mid-1990s, and a relatively young labor force supports the
region’s economic growth prospects over the next 30 years. Economic growth in
Central and South America averages 3.4 percent per year from 2007 to 2035 in the
Reference case, as the region benefits from the expected recovery in world economic
growth after 2010, and foreign capital flows are revived.
3.5 Sensitivity analyses - Alternative Economic Growth cases
Expectations for the future rates of economic growth are a major source of
uncertainty in the IEO2010 projections. To illustrate the uncertainties associated with
economic growth trends, IEO2010 includes a High Economic Growth case and a
Low Economic Growth case in addition to the Reference case.
The two alternative growth cases use different assumptions about future
economic growth paths, while maintaining the same relationships between changes
in GDP and changes in energy consumption that are used in the Reference case. The
alternative growth cases maintain the oil price path of the IEO2010 Reference case.
In the High Economic Growth case, 0.5 percentage point is added to the
annual growth rate assumed for each country or country grouping in the Reference
case. In the Low Economic Growth case, 0.5 percentage point is subtracted from the
Reference case annual growth rates.
The IEO2010 review shows total world energy consumption reaching 739
quadrillion Btu in 2035 - 281 quadrillion Btu in OECD countries and 458 quadrillion
Btu in non-OECD countries. In the High Growth case, world energy use in 2035
totals 810 quadrillion Btu, 71 quadrillion Btu (about 35 million barrels oil equivalent
per day) higher than in the Reference case. In the Low Growth case, total world
energy use in 2035 is 60 quadrillion Btu (30 million barrels oil equivalent per day)
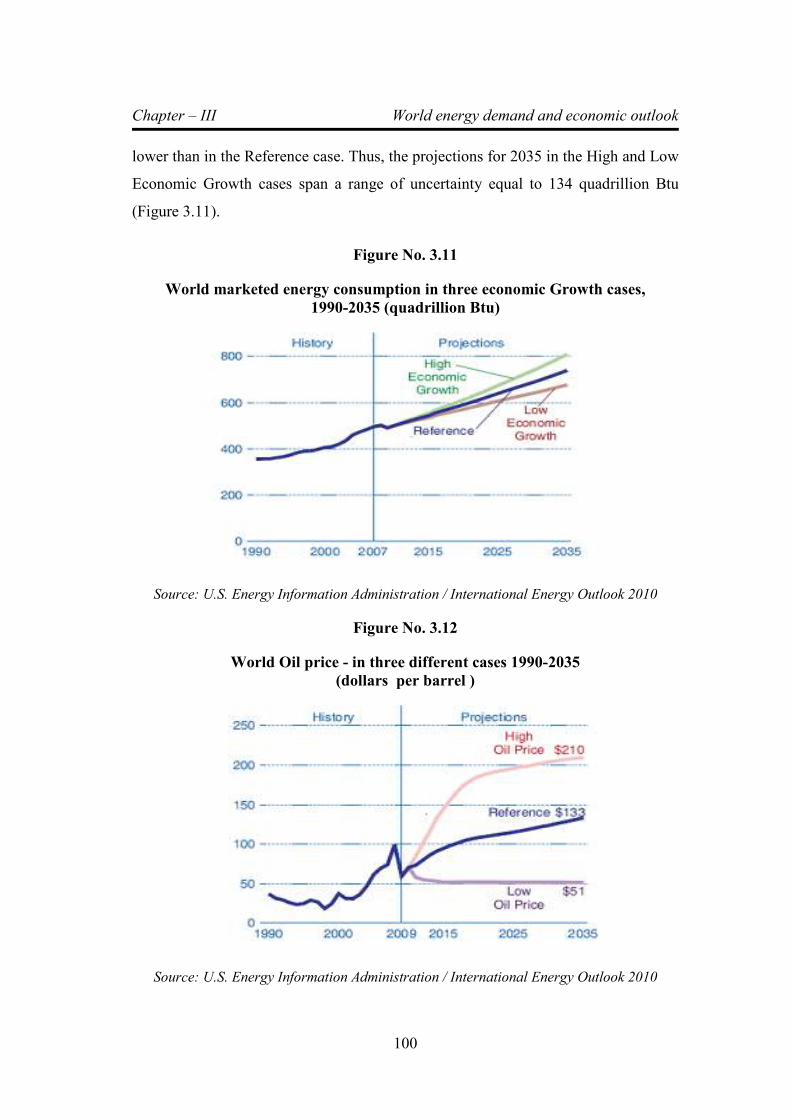
Chapter – III World energy demand and economic outlook
100
lower than in the Reference case. Thus, the projections for 2035 in the High and Low
Economic Growth cases span a range of uncertainty equal to 134 quadrillion Btu
(Figure 3.11).
Figure No. 3.11
World marketed energy consumption in three economic Growth cases,
1990-2035 (quadrillion Btu)
Source: U.S. Energy Information Administration / International Energy Outlook 2010
Figure No. 3.12
World Oil price - in three different cases 1990-2035
(dollars per barrel )
Source: U.S. Energy Information Administration / International Energy Outlook 2010

Chapter – III World energy demand and economic outlook
101
3.5.1 Alternative Oil Price cases
Assumptions about world oil prices are another important factor that
underscores the considerable uncertainty in long-term energy market projections.
The effects of different assumptions about future oil prices are illustrated in IEO2010
by two alternative oil price cases. In the High Oil Price case, world oil prices (in real
2008 dollars) climb from $59 per barrel in 2009 to $210 per barrel in 2035; in the
Low Oil Price case, they decline to $52 per barrel in 2015 and remain approximately
at that real level through 2035. In comparison, world oil prices rise to $133 per barrel
in 2035 in the Reference case (Figure 3.12).
Figure No. 3.13
World marketed energy consumption in three oil price cases,
2007-2035 ( quadrillion btu)
Source: U.S. Energy Information Administration / International Energy Outlook 2010
Although the difference in world oil prices between the High and Low Oil
Price cases is considerable, the projections for total world energy consumption in
2035 do not vary substantially among the cases. The projections for total world
energy use in 2035 in the High and Low Oil Price cases are separated by 33
quadrillion Btu (Figure 3.13), as compared with the difference of 134 quadrillion Btu
between the High and Low Economic Growth cases. The most substantial impacts of
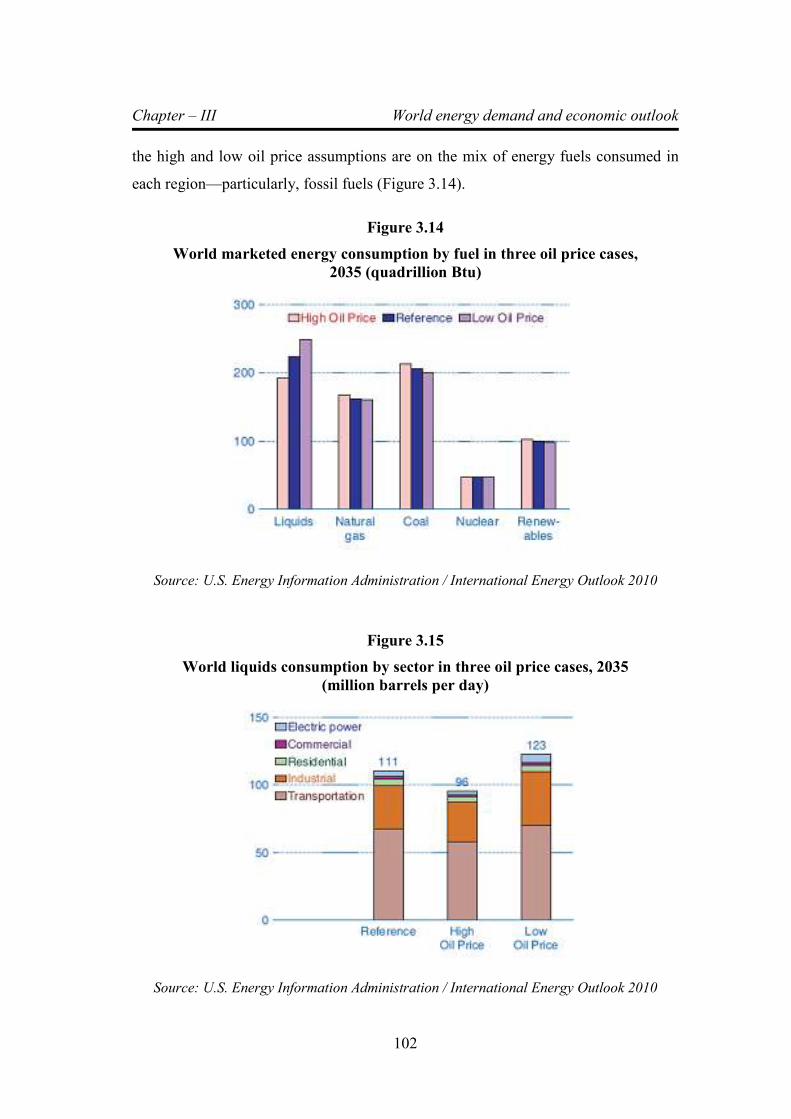
Chapter – III World energy demand and economic outlook
102
the high and low oil price assumptions are on the mix of energy fuels consumed in
each region—particularly, fossil fuels (Figure 3.14).
Figure 3.14
World marketed energy consumption by fuel in three oil price cases,
2035 (quadrillion Btu)
Source: U.S. Energy Information Administration / International Energy Outlook 2010
Figure 3.15
World liquids consumption by sector in three oil price cases, 2035
(million barrels per day)
Source: U.S. Energy Information Administration / International Energy Outlook 2010
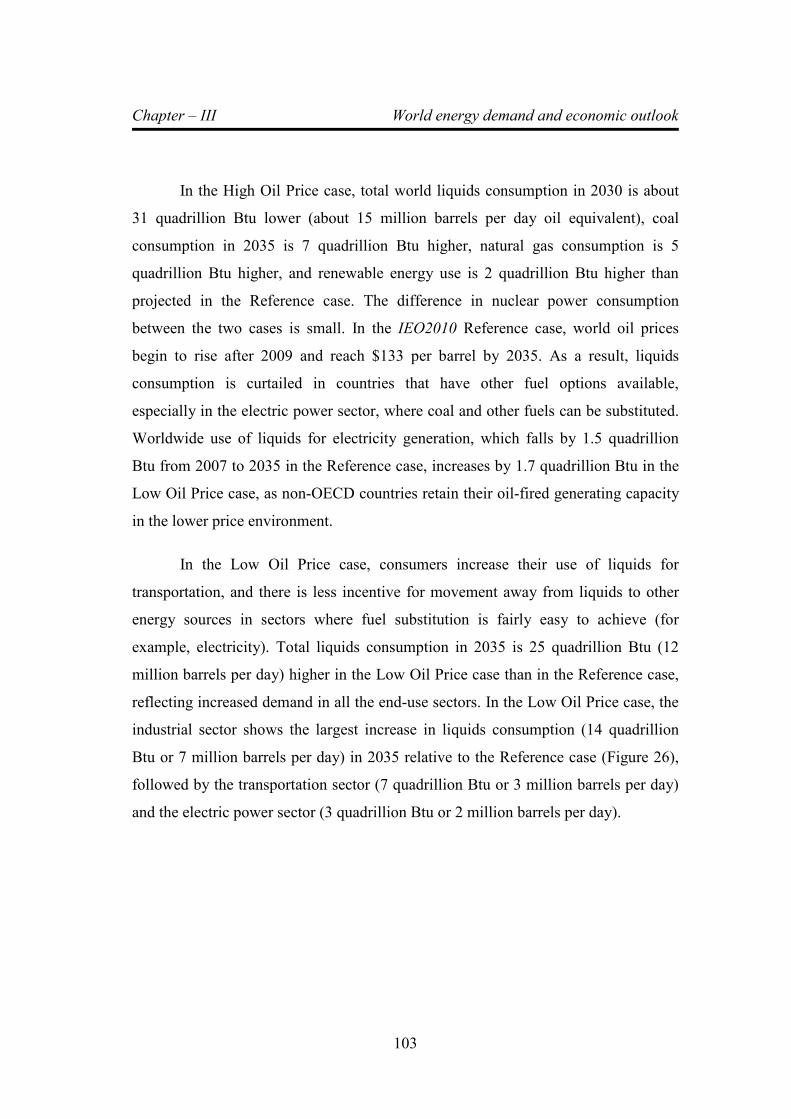
Chapter – III World energy demand and economic outlook
103
In the High Oil Price case, total world liquids consumption in 2030 is about
31 quadrillion Btu lower (about 15 million barrels per day oil equivalent), coal
consumption in 2035 is 7 quadrillion Btu higher, natural gas consumption is 5
quadrillion Btu higher, and renewable energy use is 2 quadrillion Btu higher than
projected in the Reference case. The difference in nuclear power consumption
between the two cases is small. In the IEO2010 Reference case, world oil prices
begin to rise after 2009 and reach $133 per barrel by 2035. As a result, liquids
consumption is curtailed in countries that have other fuel options available,
especially in the electric power sector, where coal and other fuels can be substituted.
Worldwide use of liquids for electricity generation, which falls by 1.5 quadrillion
Btu from 2007 to 2035 in the Reference case, increases by 1.7 quadrillion Btu in the
Low Oil Price case, as non-OECD countries retain their oil-fired generating capacity
in the lower price environment.
In the Low Oil Price case, consumers increase their use of liquids for
transportation, and there is less incentive for movement away from liquids to other
energy sources in sectors where fuel substitution is fairly easy to achieve (for
example, electricity). Total liquids consumption in 2035 is 25 quadrillion Btu (12
million barrels per day) higher in the Low Oil Price case than in the Reference case,
reflecting increased demand in all the end-use sectors. In the Low Oil Price case, the
industrial sector shows the largest increase in liquids consumption (14 quadrillion
Btu or 7 million barrels per day) in 2035 relative to the Reference case (Figure 26),
followed by the transportation sector (7 quadrillion Btu or 3 million barrels per day)
and the electric power sector (3 quadrillion Btu or 2 million barrels per day).
Chapter – IV Cost structure of power sector
104
CHAPTER – 4
COST STRUCTURE OF POWER SECTOR
4.1 Introduction
The various components, which constitute power tariff, are deliberated in this
chapter. The cost of a power project is recovered over a long period of time say 10 to
35 years by selling electricity generated from the project or power plant. The capital
cost of power plant, transmission and distribution lines, substations and other
infrastructural facilities and cost of operation and maintenance etc will have to be
recovered from selling energy over a period of time.
Since capital investment decisions are irreversible in nature, various
economic and financial aspects of the new projects need to be evaluated before
taking a final decision to go ahead with implementation of projects. Various financial
tools or models used are payback period, accounting rate of returns, net present
value, internal rate of return, cost-benefit analysis etc. The plant load factor and
economics aspects of generation, transmission and distribution charges including
losses, operation and maintenance costs, depreciation, return on equity, interest on
loan etc also to be considered.
The project cost is recovered over a long period to smooth out the tariff
impact arising out of lumpy additions of infrastructure, and also to match the tariff
payments with the repayment of investment, which is done over the life of the asset.
The costs associated with capital expenditure can be broadly classified as fixed and
variable costs. Since most of the capital investments are materialized through a
combination of loan and equity, loan repayment and profit on equity are legitimate
costs associated with the investment.
4.2 Fixed Cost
Fixed costs recovered from consumers can be organized under the following
five major heads.
Chapter – IV Cost structure of power sector
105
4.2.1 O&M Costs
Operating and Maintenance costs cover the cost of repairs of transmission
and distribution lines, meters, transformers or power stations. The routine operation
and essential maintenance expenses are charged to this head. The salaries directly
attributed to these functions and the cost of jobs contracted out can also form part of
it. The cost of insurance against accidents, natural calamity etc payable in the form of
annual installments is included under O&M head or shown under a separate head.
All these costs are recovered from consumers through tariff in the same year.
4.2.2 Return (Profit) on Equity:
It is legitimate for the project owner to seek a profit on his equity. For the
most private projects in the past, the allowed profit varied between 12 to 30 % of the
equity amount. This is directly recovered from the consumers through the tariff. This
charge remains till the project remains in operation. The recent regulatory orders
indicate a base return on equity around 12-14 %. But actual profitability can vary
depending upon the performance linked incentives / disincentives.
4.2.3 Income Tax
The income tax of the utility on the base return (profit excluding incentive) is
a pass through – implying that it is recovered through tariff. Hence the consumers
pays not just utility profits but also tax on the profit.
4.2.4 Interest on Loan
The project owner has to pay the interest on loan taken to construct the
project. The interest burden goes on reducing as the principal amount of loan is
repaid and finally vanishes along with the loan. Interest payment expenses are also
directly recovered from the consumers in the same year. Therefore, for consumers it
is important that the power project gets a low interest loan so that this charge is low.
Chapter – IV Cost structure of power sector
106
4.2.5 Repayment of Loan / depreciation
Loan repayment is a cost to the project and is paid through tariff. However,
accounting norms do not allow this to be charged directly to the tariff, but use a
concept called depreciation. Depreciation measures the reduction of value of an asset
due to aging and use. Towards the end of the life of an asset, the asset value drops to
a negligible amount. Depreciation is recovered through the life of the equipment, and
hence the longer the life, the less the depreciation per year. Therefore, the rate
depreciation is different for different equipment or assets. Depreciation is calculated
as a percentage of cost of assets and this percentage is called ‘allowed rate of
depreciation’.
The repayment period of loans availed by private sector projects is shorter (8
to 10 years) compared to that of government loans availed by SEBs (15 to 20 years).
Therefore, in case of private companies producing power (IPPS), the old rate of
depreciation was not sufficient enough to repay the loans and in such cases the
promoter had to repay the loan from its profit resulting in reduction of profit during
the initial years. This was not acceptable to private investors and hence the
Government of India permitted IPPs to claim additional depreciation in advance to
match the loan repayment schedule. This increase in depreciation rate has resulted in
higher tariffs for a decade or so, i.e. till the loan repayment is complete. This was
seen by public sector as a discrimination against them and subsequently the
Government also increased the depreciation rate applicable to public sector.
Due to depreciation, the value of machinery or assets is getting reduced in the
account books. This reduced value is called ‘book value’ of an asset (also known as
net fixed assets). After some years, the assets become worthless in the account
books, but have a lot of useful life left out and have substantial market value. This
happens especially for land or hydro plants, which have more life than what is
considered by accounting rules.
Chapter – IV Cost structure of power sector
107
In Orissa, the electricity tariff increased due to asset revaluation, which is not.
As the book value of an asset can be much lower than its usefulness or market value
(i.e. ability of assets to generate future income) revaluation of assets, which is paper
magic, can be done to increase the value of assets to reflect market value. The
increased value of assets was shown as coming from the government in the form of
increase in equity. This window dressing was done because the cost of assets was
low compared to the loan the SEB had, and it would not be considered as a viable
enterprise. The evaluation increased the cost of assets to balance the loan.
This paper transaction increased the cost of assets, leading to a higher amount
being charged as depreciation and higher profit being demanded corresponding to
increase in equity. Both these factors increased the tariff. In simple terms, the magic
by the economists and accountants painted a rosy picture, while increasing future
tariffs for consumers. However, the regulatory commission later addressed this
problem by treating some of the increased costs as ‘regulatory assets’, which are not
recovered immediately but maintained on the utility’s balance sheet to be recovered
in the future. After the Orissa experience, other reforming states have avoided such
revaluation of assets.
4.2.6 Cost of Working Capital
The last and relatively small component of fixed cost is to cover the cost of
obtaining working capital. The spares or the stored fuel are funded through working
capital. The owner of the project can charge interest on the working capital in the
tariff.
4.3 Variable cost
Variable cost is a significant cost for fuel based (coal, naphtha, furnace oil,
diesel, LNG, CNG etc) power projects. Fuel cost is dependent on the unit price of the
fuel, specific fuel consumption, actual generation of the plant or PLF (Plant Load
Factor). Hence, this cost is a variable cost. In some situations, part of O&M cost is
also linked to usage of plant or equipment. This is can also form part of variable cost.
Chapter – IV Cost structure of power sector
108
On the other hand, in some situations even the fuel cost ends up becoming a
fixed cost. This happens if the fuel is purchased through contracts that have a ‘take-
or-pay’ clause. Some of the earlier LNG contracts had such terms. In such cases,
some minimum guaranteed fuel purchase was mandated, which was equal to the fuel
requirement of the plant at, say, 60-70 % PLF. Consequently, irrespective of whether
one runs the plant to that extent, the minimum fuel cost has to be paid. Therefore,
this part of fuel cost no more remains a variable cost but becomes a fixed cost. The
minimum plant usage gets fixed as per the fuel contract or the PPA and the plant is
called a ‘must run’ plant. Such plants have to be kept out of the load-dispatch logic
that gives priority to the lowest variable cost plants.
The fixed and variable costs have to be recovered from consumers through
tariff. All costs are clubbed and divided by the useful output to arrive at the tariff of
that project.
4.4 Moves towards normative or benchmark values
The National Tariff Policy – 2006 as per Electricity Act 2003 clearly moves
away from project-by-project approvals. Now the regulator is allowed to use
normative values for loan term and interest rates. The CERC has already set the
norms for fuel consumption (heat rate) and O&M costs as function of size of the
plant, technology and plant vintage. If the project owner can avail a cheaper loan or
long-term loan, or can improve the heat rate below the benchmark rate, he makes the
profit, which is acceptable in law. On the other hand, the plants exceeding the norm
cannot pass on this high cost to consumers.
4.5 Hidden costs – the externalities
Other than conventional cost as appearing in the account books, there are
several other costs that are paid by people, which seldom appear on paper. These
costs are never internalized by power sector and hence are called externalities.
Chapter – IV Cost structure of power sector
109
Electricity is a non-polluting form of energy at the point of use, but at the
point of generation, the social and environmental impacts of the power sector are
very serious. Coal projects are responsible for carbon dioxide emission, which
contributes to global warming. Increasing global temperatures are likely to cause
massive and unpredictable changes in the global weather and increase in coastal
flooding. Coal burning creates ash as a by-product, which is cause of heavy metal
pollution. Sulphur dioxide and nitrogen oxide emissions induce acid rain, which
causes water pollution and reduces crop yield. Historically, it has remained hard to
quantify the cost associated with emissions. Hydroelectric or nuclear plants produce
no emissions but these sources have their own serious problems.
Dams and mines uproot thousands of people, disrupt local environment and
disturb the water balance in surrounding areas. All these costs are actually paid by
someone, either as reduced fish catch in the river or people being uprooted or
deprived of their natural habitats. If we fail to take care of the externalities of hidden
costs, we would be stepping on the toes of the poor and disadvantaged and neglecting
the future of next generations. Hence it is imperative to take these costs seriously.
Some steps to reduce these costs are:
� Environment and social impact assessment to be conducted with serious intent,
and results inclusive mitigation plans to be made public.
� Proper project siting can substantially reduce the impact of pollution and other
harmful social impacts.
� Rehabilitation and settlement of displaced people needs to be ensured before the
project goes ahead. Moreover, energy conservation, efficiency improvement and
promoting development of renewable energy projects needs to given due focus.
4.6 Generation tariff
Generation tariff constitutes about half of the cost paid by the consumer. It is
usually described as cost of unit of service. Service could be energy supplied in units
(kWh) and maximum power demand (MW).
Chapter – IV Cost structure of power sector
110
4.6.1 Single part versus two-part tariff
The simplest form of tariff is the single part tariff, which is worked out by
dividing all approved costs (fixed + variable costs) by the net generation. The net
generation is equal to the gross generation minus the auxiliary consumption of the
plant. NTPC followed this tariff plan till some years ago with State Electricity
Boards (SEBs) as captive customers. But the singe part tariff resulted in lot of
problems as SEBs were unwilling to purchase power during night as they had
sufficient generation at that time and low requirement during off-peak hours (10 pm
to 6 am). The NTPC did not reduce power generation at night, resulting in excess
generation, high frequency and even grid instability at night. These problems were
resolved by converting NTPC tariff from single part tariff to two-part tariff. In two-
part tariff, the fixed cost is linked to plant availability and the right of the customer to
use capacity of the plant. The monthly fixed cost is divided by plant capacity to
arrive at this fixed charge (Rs./MW/month). This is like a rent. The variable cost
charged on the energy sold. Therefore, the monthly cost has two parts, one derived
from Rs./MW per month, and the second derived from variable cost of Rs./Unit
(kWh)
4.6.2 Two part, cost plus tariff for IPPs
During the mid 1990s, SEBs and state governments secretly negotiated IPP
projects without competitive bidding or transparency. After signing the initial
contract, the IPP needed the CEA to approve the capital cost, debt equity ratio and
details of the loan package (interest and term of loan). But the CEA scrutiny was
liberal and in some cases CEA was also under pressure from the ministry to give
approval irrespective of its views. As a result, the CEA overview did not always
work.
Some of the infamous IPPs in India include: Dabhol Power Company (DPC)
in Maharashtra promoted by Enron, Cogentrix in Karnataka, and Spectrum in AP.
Chapter – IV Cost structure of power sector
111
Almost all IPP contracts in India have a two-part tariff. As integrated utilities
are now being unbundled, even the public sector generation plants are employing
two-part, cost plus tariff. For simplicity and ease of understanding, let us continue
with the example of IPP. If the IPP ensures that plant availability is maintained above
the agreed level, the· fixed cost has to be paid irrespective of dispatch (PLF). The
components of fixed cost, i.e. O&M cost, insurance cost, interest on working capital,
return on equity (RoE) etc were agreed in the power purchase contract, with a ceiling
set by the Ministry of Power. An incentive in the form of increase in RoE is given if
plant availability or PLF is above the normative level. The Ministry of Power
announced a ceiling rate for different charges, maximum allowed incentive, and the
fuel consumption norm (heat rate – means heat in kilocalories required to produce
one unit of power from a thermal power plant which in turn depends on the overall
thermal efficiency of power plant). These ceiling norms were criticised as being too
liberal and were later made somewhat more stringent. The MoP norms for IPPs
differed with the type of generating plant. For example, the ceiling for O&M cost
was 2.5% of capital cost for coal projects and 1.5 % for hydro projects. Initially an
RoE of 16% was allowed for normative plant availability. Normative availability was
initially pegged at 68.5%. For availability greater than the normative level, each
percentage point of higher availability was awarded an incentive of 0.7% increase in
the RoE. So 95% availability would imply a RoE of 34.6 (=16 + (95-68.5) x 0.7).
This was excessive profitability, especially as the RoE was given in the same
currency as the equity (so an investment in US $ would get 34.6% RoE in US $). The
tax on profit was considered as a pass-through in tariff and hence this was post tax
profit. To reduce the profitability, CEA raised the normative availability level for
coal and CCGT plants and allowed incentive only if the plant was actually
dispatched. The tax exemption and the foreign exchange protection were restricted to
only the first 16 % of the assured return and not on the incentive.
Chapter – IV Cost structure of power sector
112
As the process was not fully rational, many inconsistencies and deficiencies
remain. For example, to get high incentive, some IPPs demanded (and SEBs/State
governments accepted) that the IPP plant would be the last to be backed down,
irrespective of its variable cost. Such provisions ensured that IPPs got higher
dispatch of power quantity and hence higher profits. This harmed the public interest
much more than the higher profit given to IPPs, as it went against merit order
principle (Merit order principle means shutting down or backing down costly
generating stations, in the order of variable cost (or fuel cost) of generation per unit
(kWh) during periods of low energy demand. When there is low demand, only low
cost generating stations need to be operated to bring down average cost of energy per
unit). In some other cases, IPP plants were run at near full load even when the system
was over producing (with frequency higher than 50 Hz). This must have been done to
achieve higher PLF of these plants in order to reduce their tariff (in Rs./Unit).
4.6.3 Availability Based Tariff (ABT)
Almost all Indian States including Kerala entered into ABT regime from
1 January 2003 onwards. ABT is a three-part tariff system implemented throughout
the country (except in one region in north) with the following specific intentions:
1. To make an integrated national grid by maintaining uniform frequency
throughout the regional grids and minimising variations in operational
parameters of the grid for achieving grid discipline. The target frequency
prescribed by Indian electricity rules is 50 Hz.
2. Normalisation of grid frequency necessitates proactive load management
by beneficiaries (state Electricity Boards and other supply utilities) and
dispatch discipline by Generating companies.
Chapter – IV Cost structure of power sector
113
3. Financial incentives to promote grid discipline – Those who overdraw
power (compared to their scheduled power demand declared on the
previous day – this over-drawing/under-drawing is called Unscheduled
Interchange (or UI)), at lower frequencies will be penalized by imposing a
high tariff rate and those who draw more power at higher frequencies
need pay less or nil tariff rate. The tariff rate for Unscheduled Interchange
in the drawing of power varies from Rs. 0 (zero) to Rs. 6 (subject to
periodic revision by CERC), which is inversely with system frequency
prevailing at the time of supply/consumption. In a similar way, generating
companies, which make variations in the scheduled supply of power, will
be penalized or given incentives. In short, it is system of rewards and
penalties seeking to enforce day ahead pre-committed schedules, to
maintain grid discipline, though variations are permitted if notified 1 ½
hours in advance.
4. ABT facilitates ‘merit order backing down’ of generating stations during
low demand or off peak period. That is, generating stations with high unit
cost of power would be shutting down first followed by other stations on
the basis of unit cost of generation. Considering Kerala State’s
comparatively superior position in the generation of low cost hydel
power, which can be easily regulated unlike thermal power stations, state
can harness the advantage of ABT tariff by maximising consumption
during off peak hour. In other words, during off peak hours, if frequency
is high, KSEB can draw power at very low rate / unit (UI rate) and reduce
hydel generation to preserve water in dams so that generation of low cost
hydel power can be maximised during peak hours. If meticulously
planned and implemented, KSEB can avail the double benefit of drawing
low cost power from central grid during off-peak hours (frequency is high
and rate is very low) and reduce the import of costly power during peak
hours (when frequency is low and rate is high) by maximising own
generation.
Chapter – IV Cost structure of power sector
114
The three-part tariff consists of:
Part (a): A fixed charge payable every month by the beneficiary (SEBs or other
utilities) to the generating company for making capacity available for use.
This varies with the share of a beneficiary in a generators capacity and also
with the level of availability of achieved by a generator.
Part (b):An energy charge per unit of energy supplied on the basis of variable cost
and as per the pre-committed schedule of supply from the generating
station, drawn up on daily basis.
Part (c):A charge for Unscheduled Interchange in supply and consumption of
energy in variation from the pre-committed daily schedule. This charge
varies inversely with system frequency prevailing at the time of
supply/consumption.
ABT Tariff = Part (a) + Part (b) + Part (c)
ABT was first introduced on 1 January 2003 to enforce frequency discipline
among various transmission regions as well as among the states coming under a
particular region. For example Kerala, Tamil Nadu, Karnataka, Andhra Pradesh, Goa
and Pondicherry are the states coming under southern regional grid. SRLDC
(Southern Regional Load Dispatch Centre) is the nodal agency administering ABT in
Southern Region. At present states are moving towards intra-state ABT regime,
which is similar to the ABT scheme mentioned above. In other words, intra-state
ABT is a techno-economic tool similar inter-state ABT for bringing rational tariff
structure for supply of electricity from state generators to the distribution licensees
with the sole purpose enforcing discipline in the state grid, which in turn would
benefit the region in which the state belongs.
Chapter – IV Cost structure of power sector
115
Figure No. 4.1
DERC-Unscheduled Interchange (UI) rates as on 31/03/2007
0
100
200
300
400
500
600
UI Rate -Paise/Unit
Frequency (in Hz)
UI Rates (paise/unit)
UI Rates …
Source: Intra-state ABT order of Delhi Electricity Regulatory Commission
(DERC) dated 31/03/2007
Figure No. 4.2
ABT Impact – Improvement in frequency fluctuations
Source: Planning Commission of India- Draft report on integrated energy policy 2005
Chapter – IV Cost structure of power sector
116
Availability Based Tariff (ABT) and unscheduled interchange of power
introduced in 2003 for inter-state exchange of power have reduced voltage and
frequency fluctuations. They are still, however, not as stable as one would like.
Figure 4.2 shows improvement in frequency fluctuation. Excepting for the Northern
region frequency was within normal band for more than 98 percent of the time in
2004-05. The UI charges as decided by DERC on the basis of CERC guidelines is
shown in figure 4.1
4.6.4 Risk sharing
In most IPP contracts, SEBs took all the risks apart from the plant
construction and performance risk. These risks include the fuel cost variation,
currency variation (as the loan and equity return were protected against currency
variation), and possibility of lower demand etc. The promoters passed on the plant
construction and performance risk to the equipment suppliers through construction
contracts, the increased cost for which was built into the PPA. So, the promoters
took effectively no risk. In fact, the only risk the promoters took was the risk of
SEBs paying their bills!. But the high cost of IPP generation added to this risk and
many SEBs started having problems in making timely payment to IPP projects.
4.6.5 Incentive to increase capital cost
The promoter had all the incentive to inflate the capital cost of the project.
This would increase the tariff and actually the promoter would not put in the equity
that is seen on paper. Through accounting jugglery, the promoter could claim that he
had put in the agreed equity amount. A 10% increase in capital cost could allow the
promoter to save nearly a third of his equity (assuming equity is 30% of project cost)
whereas on paper his equity and profit would remain unchanged. Actually, the profit
on real equity put in would increase substantially.
Let us understand this with the help of an example. The international norm
for Capital cost of CCGT plants is about 600 $/kW. But an IPP gets approval for the
capital cost of 800 $ /kW. He is expected to finance it by a combination of debt of $

Chapter – IV Cost structure of power sector
117
560 and equity of $ 240 per kW. In reality, since his cost is only $600, he would put
in the equity of $40 per kW. So the equity reduces substantially, but profit in dollar
terms remains the same. Hence the profit as percentage of equity sharply increases.
The situation was worse for several projects in India. The costs of CCGT
based IPP projects have been around 900 $/kW in India. In the case of Enron's
Dabhol power project, the cost approved was 1,100 $/kW - nearly twice the norm. In
such situations, one suspects that promoters are claiming that they have invested
large amounts of money in building the project, when actually they have not
invested any money but have constructed the project entirely with loans and,
moreover, might have diverted part of the loan amount (for their own use).
In most cases, no stakeholder - Regulatory Commission, SEBs, or the
government - has investigated the expenditure for the project. In a few cases where
investigations have been done little action has been taken. In some cases, the high
cost PPAs have been renegotiated or rescinded.
• In Gujarat and Tamil Nadu, the state government/SEBs renegotiated IPP
contracts to lower the tariffs.
• MSEB rescinding the DPC contract was an attempt to reduce the damage.
This led to a host of legal cases in Indian courts and in international
arbitrations. Finally, in 2005, the NTPC and Gas Authority of India,
along with MSEB took over the DPC from the foreign equity owners.
The loan from foreign institutions was paid off. The fully Indian plant is
now getting ready.
4.6.6 Competitive bidding – second generation IPPs
The misdeeds related to IPPs met with a lot of criticism following which, in
February 1995, the Ministry of Power mandated competitive bidding for all new
IPPs. The utility was to invite bids after announcing the type, location and size of the
plant. Bidding was done on tariff for the energy generated. A pre-decided PPA was
then signed with the lowest bidder. Only a few projects have been taken up through
this route. These projects have clearly shown that cost could be substantially lowered
Chapter – IV Cost structure of power sector
118
through competitive bidding. But the risk-sharing pattern continued as earlier. The
fuel price and demand risk continue to be taken by the utility. The recent
development of allowing IPPs to directly sell to industry (open access) is one way of
avoiding such risks. But, then, tariff is market driven, and if care is not taken it can
be highly volatile.
A slightly modified form, called "all source bidding", can be used to remove
one more disadvantage. The utility calls bids for generation of certain MW of power
in a certain part of the state. The choice of fuel and the size of the plant are open to
the bidders. Persons with existing captive plants can also supply excess power to the
grid. Any person capable of supplying even part of the requirement at lower cost can
compete. Cogeneration and small gas turbine plants (where piped gas is available)
have been beneficiaries of this process in the USA and Europe.
4.6.7 Recent changes as per Electricity Act-2003
The Electricity Act has encouraged competitive bidding for all generation
projects. The Ministry of Power has come out with guidelines for carrying out
competitive bidding. Once the tariff of the project is determined through such
competition, the regulatory commission has to accept that tariff. All private green-
field projects have to be competitively bid. The government owned projects could be
without competitively bidding for the next five years, where the regulatory
commission is expected to oversee the reasonableness of capital cost. All the norms
mentioned earlier, such as O&M cost, depreciation rate, heat rate (fuel
consumption), terms of loan, and share of equity etc. are now decided by regulatory
commissions. These norms are applicable only to the projects, which are based on
capital cost approval - hence not applicable to projects decided through competitive
bidding route. As mentioned previously, the regulatory commissions are moving
toward normative values for all these factors, allowing inherent incentive to the
project that can do better than these norms.
Hence, now for generation projects in the country, healthy and effective
competition is critical in reducing the capital cost of power. As we have seen, the
fuel cost constitutes a very large share of the generation cost. The Government of
Chapter – IV Cost structure of power sector
119
India is in the process of setting up a system for determination of fuel prices,
especially the coal prices that is based partly on regulation and partly on market
forces.
4.6.8 Tariff for renewable energy projects
The world over, Renewable Energy power projects (RE projects) have been
treated differently compared to conventional generation projects. They are given
different incentives by several governments. RE projects are not seen as
commercially viable by the utilities. This is partly due to the limited vision of the
utilities and partly due to the emerging nature of the technologies. Different
mechanisms have been evolved to encourage RE projects. These include (i) giving
upfront subsidies including tax rebates. This is followed in India and the USA. (ii)
Giving subsidy at the time of sale of power. The government pays a pre-decided
subsidy per unit generation to the producer. This is followed in some parts of
Europe. (iii) Forcing utilities to purchase a share of their power from RE projects,
also called renewable energy portfolio standard. At times, a combination of these
incentives is given. In India, the Ministry of Non-conventional Energy and the
Ministry of Power decide these policies and subsidies.
There are cases of some RE projects finding undue favour with some state
governments and getting excessive subsidies. The example of wind projects is worth
mentioning. Initially, these projects received a large upfront subsidy without any
control on quality or technology. As a result, the country saw several bad quality
projects being put up while the promoter cashed the subsidy. Later, some state
governments gave large sales tax exemptions linked to the capital cost of the project.
This subsidy was higher than required when the preferential tariff was assured for
the wind power. The subsidy (including tax concessions) over a period of six years
has been nearly equal to the entire capital cost of the project. For example, wind
projects in Maharashtra received tax breaks of nearly Rs. 2,000 crore for a capacity
of 400 MW that produced electricity equivalent to a standard base-load plant of only
125MW. Moreover, as per the order of the regulatory commission, electricity from
such highly subsidised projects is being purchased by the state utility (SEB) for a

Chapter – IV Cost structure of power sector
120
high cost of Rs. 3.25/unit. These subsidies could have been better utilised to support
more wind projects. If the subsidy was utilised for energy conservation, then it
would have saved much more electricity than is being produced by the windmills.
The policies are now improving and projects that are technically better are also
coming up.
The Electricity Act-2003 requires all state regulators to direct utilities to
purchase a minimum of some percentage of power from renewable sources.
Additionally, the National Tariff Policy requires the Central Regulatory Commission
to set the tariff for electricity from the renewable energy sources that are not
purchased through competitive bidding.
4.7 Transmission Tariff
Transmission tariff is similar to that of generation but is relatively simpler.
The capital cost, transmission losses, and the availability of transmission lines are the
three critical parameters for a transmission utility. The normative availability of
transmission lines is 98% or more. The ERCs or government departments (in the
absence of commissions) decide the norms for tariff and performance. The public
sector transmission company POWERGRID has been responsible for strengthening
and expanding the national grid. Intra-state lines were owned by the integrated SEB
and there was no need to work out a separate tariff for these. In the restructured
environment, where the state transmission company is separated, the construction of
new lines is subjected to regulatory approval. The capital cost of such lines is
recovered from all users of the network (irrespective of their actual use of the line).
The long-term consumers of network, such as distribution utilities pay for the annual
capacity charge of the entire network of the transmission utility. In other words,
transmission is seen as a regulated activity. The regulatory commission is supposed
to optimize the transmission planning and also take into consideration comments of
all constituents or grid users. There is an exception of point-to-point (dedicated)
transmission line, where the identified user pays for the full cost.
Chapter – IV Cost structure of power sector
121
Regulator works out transmission tariff by dividing the approved cost (which
consists mainly of the fixed costs) by the units transmitted by that line. It used to be
worked out as Rs./Unit transmitted. Usually, the units sold to consumers are
considered for tariff calculation, implying that the transmission losses are accepted
without much scrutiny. Exceptions have been made as in the case of the AP
Transmission Corporation, where the commission gave a target for reducing losses.
If the Corporation is unable to reduce losses, it has to pay for the disallowed losses
through its profits (and may even end up making losses). .
There is a move to allocate transmission charges not on units transmitted, but
on the right to use the system. This is similar to the capacity charge for power plants
(akin to rent). The consumers (typically SEBs) will have to pay these even if they do
not use the transmission network, and can allow others to use the network. The tariff
policy mandates CERC to evolve a system where the transmission charges would be
a function of quantity of power transmitted, direction of flow, time, and distance of
power flow. CERC is in the process of evolving such a tariff. The states would be
then expected to follow similar tariff for intra-state transmission charges.
At times, customers of a transmission utility pay the power generator directly
and pay only the transmission charges to the transmission utility. At other times, the
payment for power purchase from the generator is made through the transmission
utility. This is the case when TRANSCO (transmission company) is the single buyer
and sells power to DISCOMs (distribution companies). In such cases, the
transmission utility adds all its costs (including its power purchase cost) and bills it
to its customers. In such cases, the Transco tariff is called Bulk Supply Tariff (BST).
This can be just an energy charge (single-part tariff) but usually is a two-part tariff
consisting of energy charge plus the demand charge (maximum demand met by
Transco).
4.8 Distribution tariff
The economic issues in distribution are conceptually similar to that of
transmission. However, the following features of the distribution business make the
process of tariff determination complicated:

Chapter – IV Cost structure of power sector
122
(a) Scattered points of sale
(b) Highly dispersed assets over a large geographical area
(c) Varied types of consumers with different consumption patterns and different
commercial behaviour. (peaking versus nearly constant power requirement,
Low Tension (LT) versus High tension (HT) supply etc.)
(d) Need for different performance parameters. For example distribution losses,
recovery of bills (or revenue collection), line outages etc. Many of these
parameters are difficult to monitor.
As we know, different tariff is applicable to different categories of consumers
to reflect the cost to serve. However, by keeping the issues related to consumer tariff
aside, an attempt made to understand the distribution costs and performance. The
cost of distribution utility consists of the following:
(i) Power purchase
(ii) Transmission charges
(iii) Operating cost (O&M, depreciation, return on equity, interest on loan,
depreciation etc.)
All these costs are examined by the regulatory commission and then allowed or
disallowed. We have already discussed the first two cost components. Let us find out
what constitutes the third component i.e. the operating costs of the distribution
utility.
The O&M costs of distribution include the following:
(i) The salaries of staff for line maintenance, metering, billing, cash
collection etc.
(ii) Cost of administrative offices, vehicles etc.
Chapter – IV Cost structure of power sector
123
(iii) The cost of consumer grievance handling and fault reporting centres
(iv) Repair and maintenance of lines, substations and distribution
transformers.
(v) Replacement of meters etc.
Since these costs are large, it is a practice to show the costs associated with
establishment and administration separate from purely operation and maintenance
cost. The establishment and administration cost includes cost of offices, office staff,
vehicles, phone bills and cost of lawyers or legal proceedings. The O&M cost
includes the cost of actual repairs, maintenance and the salaries of the staff directly
involved in R&M. At times, even the material and manpower component of O&M
cost is separately shown.
The assets of a distribution utility include the land, buildings and equipment of
substations, Distribution Transformers (DTs), lines, meters etc. These assets are
acquired by raising money in the form of a loan and/or equity. As in the case of
generation and transmission assets, the cost of distribution assets - the interest on
loan, depreciation, and the return on the equity - are recovered from the consumers as
expenses.
The average tariff (for sale of electricity) is calculated by dividing the total
allowed costs by the expected electricity sales. This is not a uniform tariff for all
categories of consumers but an average of all consumers. The category-wise tariff
setting has several different considerations as discussed in the next chapter.
At this point, let us briefly discuss the additional issues that need to be
considered while deciding the average distribution tariff:
(i) Power distribution entails losses; these are technical as well as non-
technical losses. Theft, malfunctioning of meters, un-read meters, and
misplaced consumers ("meter-not found" category) are all included in
non-technical losses. Hence, the average cost is worked out on the basis
of likely sale of energy, taking into account such losses.
Chapter – IV Cost structure of power sector
124
(ii) In Indian utilities, a large number of consumers are un-metered and their
consumption is estimated. The losses are calculated using such estimated
consumption. The method of arriving at this estimation has been a matter
of dispute. Sample metering of such customers is becoming a more
common method of such estimation. The National Tariff Policy expects
the regulators to carry out Third Party measurements to verify such
critical performance parameters of the utilities.
(iii) Even after billing, there are some consumers who may not pay their bill.
And some amount of nonpayment, despite the best efforts of the
company, is anticipated. This is referred to as ‘bad debts’ of the company
and is usually in the range of 2 to 3% of revenue. This is not considered
as income of the company. This is also called bill ‘Collection efficiency’.
Bad debts or arrears of the current and past years should be examined
while determining tariff.
(iv) In the new environment, there has been an attempt to link both the factors
- T&D losses and Collection efficiency - into a single parameter called
AT&C (Aggregate Technical and Commercial) losses. This method was
attempted to regulate the privatized distribution utilities in Delhi.
4.9 Financing of power sector investment
Financing of high investments in the power sector is a major worry for all
power planners. Till the early 1990s, investments in the power sector were largely
financed from government loans. The power sector was state owned and the
government loans either came as budgetary support or as special purpose loans such
as for rural electrification or for power plant renovation. The budgetary support came
from the state and central government budget. But the power sector did not fully
repay the budgetary support (loans), and some SEBs did not even pay the interest on
these loans. The governments continued to give budgetary support even while having
a deficit budget (expenditure exceeding income). By the early 1990s, India faced a
foreign exchange crisis, and the state and central budgetary deficit had also increased
Chapter – IV Cost structure of power sector
125
substantially. An IMF loan was sought, which came with a condition: governments
must reduce their budgetary deficit. The state utilities were not in a good financial
situation - and no commercial lending agency would lend them money. As a result,
the capital availability for the power sector reduced drastically.
To address this problem, the government decided to invite the private sector
to build generation plants, which took the shape of IPPs. The SEBs were expected to
get into long term contracts with these IPPs and the IPPs were to raise money from
the market.
4.9.1 Financing of IPP projects
The promoters of IPP projects needed loans to fund the project (usually
between 70 to 75% of the total investment). In most non-infrastructure projects, like
a car factory, the owner takes a loan on the strength of the balance sheet of his other
businesses. If the car factory cannot make a profit, the owner loses money; moreover
the assets of his other businesses are at risk, as they are hypothecated against the
loan for the car project. This mode of financing is called 'corporate finance'.
Infrastructure projects (including power projects) need very large capital, and
few promoters are prepared to hypothecate (and risk) their ongoing business for
these projects. Moreover, in India, the power utilities were the sole buyers for the
IPP power - and were making large losses. Hence, the logic of the owner taking a
business risk through such 'corporate finance' did not apply for power projects.
The promoters of IPPs insisted that the loan be given to the project, without
hypothecating their balance sheet. This is called 'project finance'. Here, the security
needed for lenders came from the power purchase agreement and the associated
guarantees for payment. Hence, the lending agencies played a critical role in the
project preparation period. They were expected to check if the project was really
viable, equipment quality was good and the price was reasonable. They were
expected to ensure that the project was profitable and, in turn, could ensure
repayment of their loan. But in practice, most banks gave loans only on the strength
Chapter – IV Cost structure of power sector
126
of the guarantees associated with the PPA without a thorough scrutiny of the project.
The banks did not even object to the high capital cost of IPP projects.
For many IPPs, a sizeable share of the loan came from the EXIM banks
(Export promotion banks) of industrialised countries. Industrialised countries have
these Export Promotion banks that give loans for different projects, provided the
equipment required for the project is procured from that industrialised country.
Funny as the world can be, these EXIM banks do not rely on PPAs, state
government guarantees or even escrow accounts. Some EXIM banks demand that
financing agencies in the borrowing country guarantee repayment of their loan
(which was given to promote their exports) in the case of default. Some EXIM banks
have sought guarantee from the Central government. In short, financing of IPP
projects is a neatly woven web of guarantees given by different Indian entities on
behalf of the Indian public.
Promoters of IPP projects typically put only half of the equity or less
(implying less than 15% of the project cost, since equity is around 30% of total
project cost). The promoter has full control of expenditure and project design, but
has only a small stake (~15% of project cost). This becomes critical when there is a
suspicion that the project cost is inflated. In such cases, the money actually invested
(or risked) by the promoter may be negligible or nothing at all. As a result,
consumers, government, or public owned financial agencies take nearly all the risks,
while the promoter controls the expenditure.
4.10 Changing composition of SEB costs
The cost structure of utilities varies from utility to utility. It depends on the
utility's historical cost and asset structure, and accounting practices. To get a broad
idea of cost structure in India, let us see the accounting classification of the costs for
27 major public utilities (SEBs) in India. The SEBs are integrated utilities and hence
costs of all segments are clubbed together and represented as paise per unit sold to
consumers. The SEBs are being un-bundled into separate distribution, transmission
and generation companies but this section will help us get a feel of the overall costs.
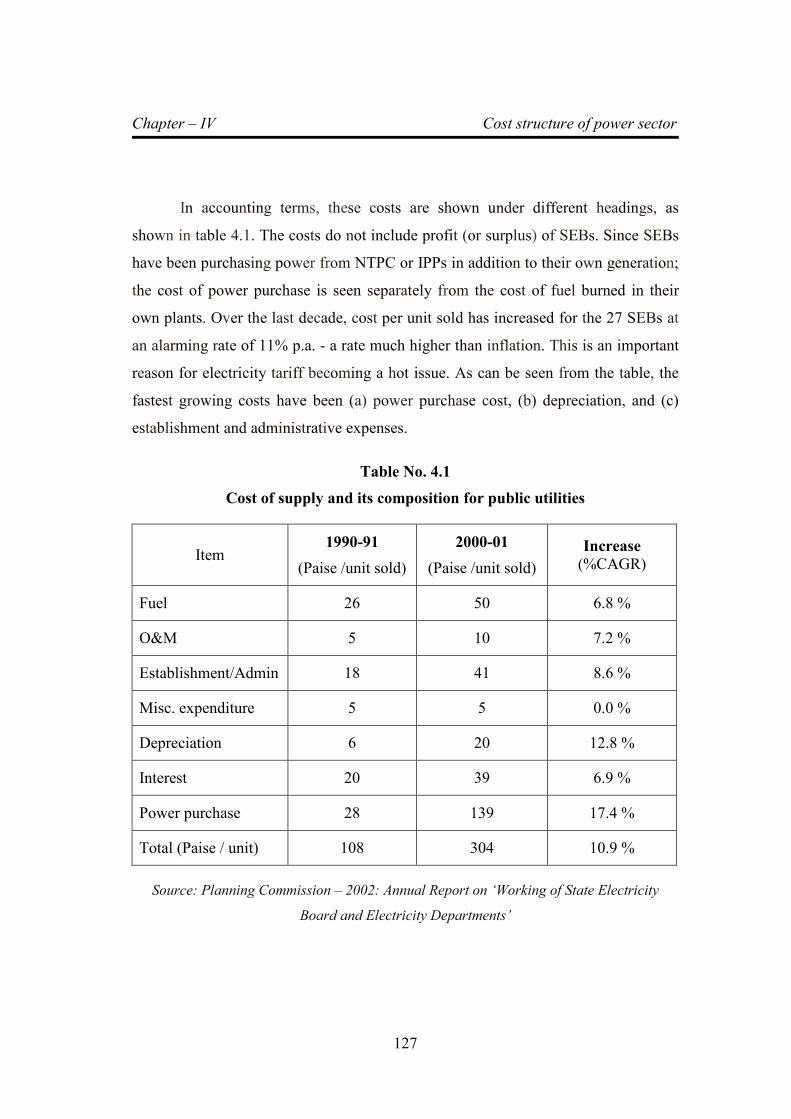
Chapter – IV Cost structure of power sector
127
In accounting terms, these costs are shown under different headings, as
shown in table 4.1. The costs do not include profit (or surplus) of SEBs. Since SEBs
have been purchasing power from NTPC or IPPs in addition to their own generation;
the cost of power purchase is seen separately from the cost of fuel burned in their
own plants. Over the last decade, cost per unit sold has increased for the 27 SEBs at
an alarming rate of 11% p.a. - a rate much higher than inflation. This is an important
reason for electricity tariff becoming a hot issue. As can be seen from the table, the
fastest growing costs have been (a) power purchase cost, (b) depreciation, and (c)
establishment and administrative expenses.
Table No. 4.1
Cost of supply and its composition for public utilities
Item 1990-91
(Paise /unit sold)
2000-01
(Paise /unit sold)
Increase
(%CAGR)
Fuel 26 50 6.8 %
O&M 5 10 7.2 %
Establishment/Admin 18 41 8.6 %
Misc. expenditure 5 5 0.0 %
Depreciation 6 20 12.8 %
Interest 20 39 6.9 %
Power purchase 28 139 17.4 %
Total (Paise / unit) 108 304 10.9 %
Source: Planning Commission – 2002: Annual Report on ‘Working of State Electricity
Board and Electricity Departments’
Chapter – IV Cost structure of power sector
128
The SEBs were short of capital and did not build their own plants, but rather
depended on central sector plants to meet the need for incremental demand. The
depreciation has increased rapidly in the last decade because the depreciation rates
were hiked in the last decade and the capital investments by SEBs were not well
regulated. The fuel cost increase appears small (6.8 % p.a.) but if fuel cost was
calculated as Rs./self-generation, the fuel cost increase would be much higher. The
share of self-generation has been decreasing due to increasing power purchase. The
fuel cost increase was high due to rapid increase in administered coal prices.
When electricity tariffs increase at a greater rate than the rate of inflation, it
hinders the growth of the economy. Hence consumers need to understand and care
about these issues.

Chapter – V Process and principles of regulatory review
129
CHAPTER-5
PROCESS AND PRINCIPLES OF REGULATORY REVIEW
5.1 Introduction:
Tariff is the rate at which electricity is sold to the consumers. It is the most
common interface between the consumer and the utility. Tariff depends upon utility’s
costs, which in turn are dependent on the utility’s planning and operational decisions.
Tariff for the individual consumer depends on the tariff philosophy followed by the
Government. Social, political and economic considerations exert pressure on the
tariff philosophy because of which there is no uniformity in tariff structure in
different states, though the approach used by different states has a lot in common.
With the advent of reforms, economic considerations are gaining an upper hand. The
electricity consumers pay these costs as well as profits on the investments made by
the utility and the tax on profit.
Table No. 5.1
Cost and Energy Flows in the Power Sector
Items Generation Transmission Distribution
Million Units passed on / sold 44393 41285 33458
Cumulative cost (Rs. Cr.) 7591 8805 10254
Cumulative Unit Cost (Rs./Unit) 1.71 2.13 3.06
Source: Tariff order of AP Electricity Regulatory Commission(APERC), March 2003
The table 5.1 shows the electricity sold and the cost of electricity at the
generation, transmission and distribution stages. The calculation is based on the
actual numbers of a state utility for the year 2003-04. The units passed on keep
decreasing because of losses in transmission and distribution segments. The
cumulative costs include the cost incurred by that and previous segments. The last
row in the table shows the cumulative unit cost (i.e. Costs of all previous stages
divided by the units sold to the next segment). Generation refers to the state owned
Chapter – V Process and principles of regulatory review
130
generation wing which is a mix of low cost hydro and coal based plants, power
purchase from IPPs and Central Generating Stations (CGS). Looking at the first row,
it can be seen that the transmission loss = [(44393-41285)/44393] is around 7 %.
In the distribution segment, the units sold reduce substantially due to high
distribution losses. Distribution loss = [(41285-33458)/41285] as around 19 %. In the
second row, we can see that the largest share of cost paid by consumers attribute to
generation. The tariff determination as per the provisions of Electricity Act 2003
require that consumer tariffs are set such that reasonable costs of Utility are fully
recovered through tariff. As a result, at the consumer end all costs and all losses
add up.
The numbers mentioned above can change substantially from state to state or
region to region. The T&D loss as percentage of generation in the above example is
seen to be 24.6 % ie. [(44393-33458)/44393]. The T&D loss figures of most utilities
range between 20 to 40 %.
The following inferences can be made from the above table:
� The largest share of cost usually comes from generation.
� The largest share of leakage comes from distribution
� Consumers pay for both
� Such analysis helps in identifying focus areas needing attention.
When we add the allowed profit and income tax of the utility to its costs, the
cost plus recoverable profit is called the Annual Revenue Requirement (ARR) of the
utility. ARR is the common term used in the regulatory process and it has a direct
impact on the average tariff of consumers.
5.2 Regulatory Review
Before the establishment of Regulatory Commissions, State Electricity
Boards (SEBs) were authorised to set consumer tariffs so as to achieve a surplus of 3
% on value of fixed assets. In practice, the state governments approved the tariffs
without seriously questioning SEBs efficiency or costs. The state regulatory
Chapter – V Process and principles of regulatory review
131
commission now has the responsibility and authority of deciding tariff and is also a
countervailing authority to decide what costs are reasonable. Regulatory Commission
takes a detailed review of the performance of Utility (KSEB in Kerala) and also
holds public hearings to gather evidence and opinion.
Typically, the process of regulatory review has the following parts:
1. The Utility files a tariff application a few months before the start of a
financial year. The data for the ongoing year are used to project the sales,
performance and costs for the next year.
2. The RC checks the utility’s application for consistency and sufficiency of
data. This process is called ‘Technical Validation’. If additional data or
corrections are required, the RC directs the utility to file a revised application.
3. The RC then publishes the corrected application (or tariff petition) and invite
objections from public.
4. Based on the objections, feedbacks and comments of public, through public
hearing or otherwise, the commission analyses the logic and reasonability of
various issues.
5. Finally, the RC gives an order, wherein the logic of RC’s decision is spelt
out.
There are different methods to regulate utilities tariffs. The most common
method is the ‘Cost Plus’ method.
5.2.1 Cost-Plus Method
In this method, the commission examines all costs incurred by the utility.
Based on the evidence produced before the commission (by consumers or
commission staff), it may conclude that some of the costs are not reasonable and may
disallow these. The disallowed expenses are not counted as expenses of the utility
and hence not passed on in the consumer tariff. Based on legal norms the
Chapter – V Process and principles of regulatory review
132
commission allows the utility to add its profit to the approved costs. Approved costs
plus the profit is then called Annual Revenue Requirement (ARR). Hence the term
'cost-plus’ or cost +'. The income tax is considered as an expense of the utility and is
recovered from the consumers as per the Indian regulations.
There are some advantages and also some limitations of this method. Some of
the limitations are:
1) Time consuming process: Some have argued that this entails an in-
depth review of all costs, which can be a time consuming process.
2) Information asymmetry: The utility controls data and tends to resist
giving key data / information. So it invariably ends up being a struggle
to get correct and useful data.
3) Lack of incentive to the utility: Annual tariff reviews pass on the
costs/ benefits immediately to the consumers. The benefit of improved
efficiency or the (cost of) lack of efficiency is passed on to consumers.
Hence, there is little incentive for a utility to improve efficiency.
4) Tendency to over invest: A utility's profitability generally increases if
it invests more in (capital) assets, leading to what is called 'gold plating'
of investments. This phenomenon is a well-established concept in
Regulatory Economics called as the Averch-Johnson Effect (A-J
Effect)1.
The key idea in Averch and Johnson's 1962 paper is that because allowed
profit varies directly with the rate base (capital), the firm will tend to substitute too
much capital for other inputs.
In practice, a pure cost-plus method is rarely applied. Usually, the RC
examines the expenditure against two tests (i) usefulness and (ii) prudence of
expenditure. The usefulness test examines if the said expense was necessary and
whether it has achieved its stated benefit. The prudence test is an evaluation of
1H. Averch and L. Johnson. "The Behavior of the Firm Under Regulatory Constraint," American Economic
Review, December 1962.
Chapter – VI Tariff regulatory framework in Kerala
177
CHAPTER – 6
TARIFF REGULATORY FRAMEWORK IN KERALA
6.1 Introduction
This chapter deals with the electricity tariff regulatory frame-work in Kerala
state vis-à-vis functioning of Kerala State Electricity Regulatory Commission
(KSERC) and discuss the enabling regulations which have been framed by the State
Commission to determine power tariff of generating companies, the Electricity Board
or a licensee in pursuance of the provisions of Electricity Act 2003.
6.2 The Organization of Regulatory Commission
With the policy of encouraging private sector participation in Generation,
Transmission and Distribution and the objective of distancing the regulatory
responsibilities from the Government to the Regulatory Commissions, the need for
harmonizing and rationalizing the provisions in the Indian Electricity Act, 1910, the
Electricity (Supply) Act, 1948 and the Electricity Regulatory Commission Act 1998
in a new self contained comprehensive legislation arose. On the basis of the above
objective, the Electricity Act 2003 has been enacted and the provisions of the Act
have been brought into force with effect from the 10th of June 2003.
Kerala State Electricity Regulatory Commission was constituted vide
Government Order G.O.(Ms).No.34/ 2002/PD dated 14 November, 2002 notified in
the Government of Kerala Gazette, Extra-Ordinary dated 18 November, 2002
The Kerala State Electricity Regulatory Commission is a quasi-judicial body
corporate having perpetual succession and a common seal, with power to acquire,
hold and dispose of property, both movable and immovable, and to contract and
shall, by the said name, sue or be sued. With effect from 10 June, 2003, the
Commission has come under the purview of the Electricity Act, 2003, as the
Electricity Regulatory Commissions Act, 1998 has since been repealed.
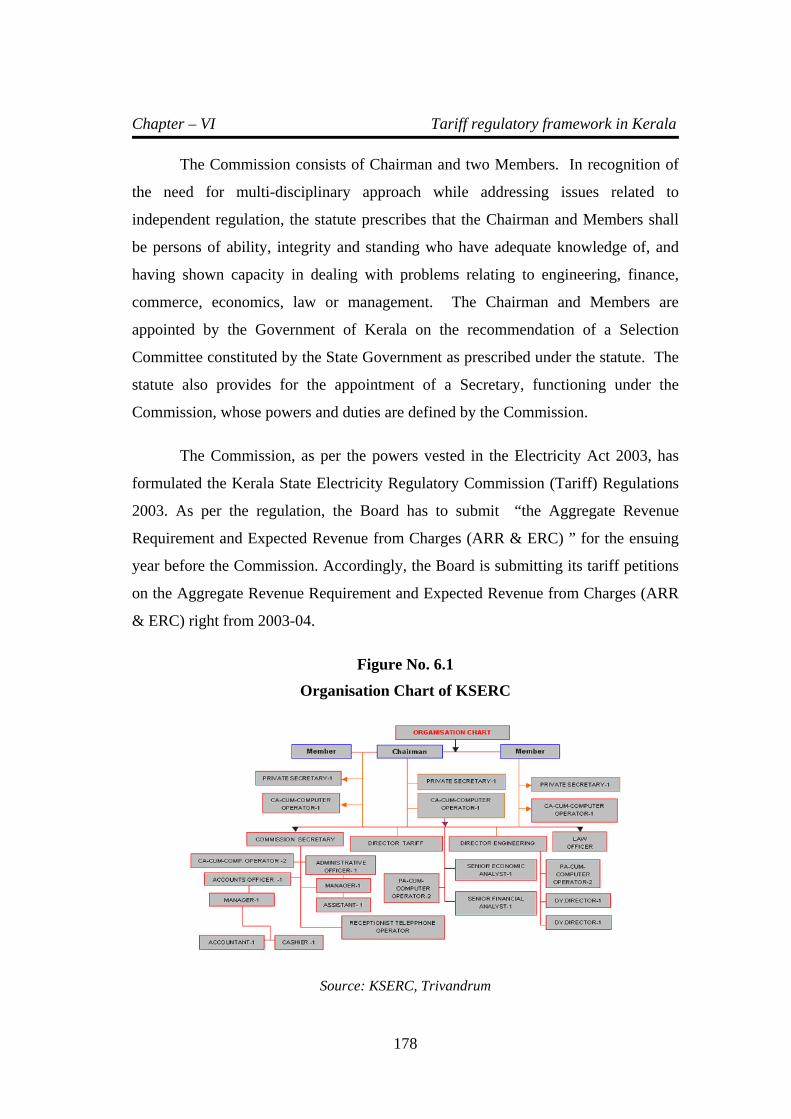
Chapter – VI Tariff regulatory framework in Kerala
178
The Commission consists of Chairman and two Members. In recognition of
the need for multi-disciplinary approach while addressing issues related to
independent regulation, the statute prescribes that the Chairman and Members shall
be persons of ability, integrity and standing who have adequate knowledge of, and
having shown capacity in dealing with problems relating to engineering, finance,
commerce, economics, law or management. The Chairman and Members are
appointed by the Government of Kerala on the recommendation of a Selection
Committee constituted by the State Government as prescribed under the statute. The
statute also provides for the appointment of a Secretary, functioning under the
Commission, whose powers and duties are defined by the Commission.
The Commission, as per the powers vested in the Electricity Act 2003, has
formulated the Kerala State Electricity Regulatory Commission (Tariff) Regulations
2003. As per the regulation, the Board has to submit “the Aggregate Revenue
Requirement and Expected Revenue from Charges (ARR & ERC) ” for the ensuing
year before the Commission. Accordingly, the Board is submitting its tariff petitions
on the Aggregate Revenue Requirement and Expected Revenue from Charges (ARR
& ERC) right from 2003-04.
Figure No. 6.1
Organisation Chart of KSERC
Source: KSERC, Trivandrum
Chapter – VI Tariff regulatory framework in Kerala
179
6.3 Functions of the Commission
The Commission is vested with the responsibility of discharging the
following functions:
(a) Determine the tariff for generation, supply, transmission and wheeling
of electricity, wholesale, bulk or retail, as the case may be, within the
State;
(b) Regulate electricity purchase and procurement process of distribution
licensees including the price at which electricity shall be procured from
the generating companies or licensees or from other sources through
agreements for purchase of power for distribution and supply within the
State;
(c) Facilitate intra-State transmission and wheeling of electricity;
(d) Issue licenses to persons seeking to act as transmission licensees,
distribution licensees and electricity traders with respect to their
operations within the State;
(e) Promote cogeneration and generation of electricity from renewable
sources of energy by providing suitable measures for connectivity with
the grid and sale of electricity to any person, and also specify, for
purchase of electricity from such sources, a percentage of the total
consumption of electricity in the area of a distribution licensee;
(f) Adjudicate upon the disputes between the licensees and generating
companies and to refer any dispute for arbitration;
(g) Levy fee for the purposes of the Electricity Act, 2003;
(h) Specify State Grid Code;
(i) Specify or enforce standards with respect to quality, continuity and
reliability of service by licensees;

Chapter – VI Tariff regulatory framework in Kerala
180
(j) Fix the trading margin in the intra-State trading of electricity, if
considered, necessary;
(k) Discharge such other functions as may be assigned to it under the
Electricity Act, 2003;
(l) Advise the State Government on all or any of the following matters,
namely:–
(m) Promotion of competition, efficiency and economy in activities of the
electricity industry;
(n) Promotion of investment in electricity industry;
(o) Re-organization and restructuring of electricity industry in the State;
(p) matters concerning generation, transmission, distribution and trading of
electricity or any other matter referred to the State Commission by the
State Government.
6.4 The Mission of the Commission
The mission of the Commission is:
a) To promote competition, efficiency and economy in the activities of the
Electricity Industry within the State of Kerala.
b) To regulate the power purchase and procurement process of the
distribution licensees for sale, distribution and supply of electricity
within the State of Kerala.
c) To determine the tariff for generation, transmission, wheeling and
supply of electricity, wholesale, bulk or retail, as the case may be,
within the State of Kerala.
Chapter – VI Tariff regulatory framework in Kerala
181
6.5 Objectives of Tariff determination by KSERC
As per subsection (5) of Section-62 of the Electricity Act, 2003 (Central Act
No. 36 of 2003) the Commission may require a generating company or licensee to
comply with such procedure as may be specified in calculating the expected revenue
from the tariff and charges which he or it is permitted to recover. Application for
determination of tariff shall be made by a Generating Company, the Board or a
licensee in accordance with the provisions of Subsection (1) of Section 64 of the Act.
The regulations have been framed in pursuance of the above provisions of the
Act. In designing the scheme contained in the regulations, the Commission expects
to achieve the following objectives:-
a) To inform Generating companies, the Board or licensees of the basic
minimum data on information requirements for seeking the
Commission’s approval to the expected revenue from charges and for
any proposal of modification of the tariffs;
b) To provide standardised formats in which such information is to be
provided;
c) To specify the procedure by which the Commission would take up the
ERC filings and Tariff filings for its consideration and appropriate
orders thereon; and
d) To ensure the greatest possible transparency in such procedure and the
fullest possible opportunity for all concerned to participate in such a
process.
6.6 Procedure for Annual ERC filing
1. Not later than 4 months before the commencement of any financial
year, generating companies, the Board or licensees shall provide to the
Commission full details of its calculations for the ensuing financial year
of the ERC for that year.
Chapter – VI Tariff regulatory framework in Kerala
182
2. The details of calculations of ERC and other related information shall
be provided in the format prescribed and shall be provided for each of
the financial years as directed by the instructions given in each of these
formats.
3. Where any entity holds more than one category of license, the details in
the prescribed formats have to be filed separately in respect of each
license.
4. The details of calculations of ERC in the prescribed formats have to be
filled by the Generating Companies, Board or licensee in 6 sets with
each format being signed by an authorised officer of Generating
Company, the Board or licensee respectively who shall be responsible
for verifying and certifying the correctness thereof. In addition to the
hard copies of the ERC formats, Generating Company, the Board or
licensee has also to furnish the said formats in electronic form in disc
using the MS Excel spreadsheet package.
5. The ERC filed by Generating Company, the Board or licensee will be
scrutinised by the Commission and as a result of such scrutiny, the
Commission may, within 15 working days, call for such further
information and clarifications, as it may deem fit.
6. The ERC filed by Generating Company, the Board or licensee will be
treated as a petition upon the Commission deciding that all the
information and clarifications sought for by it have been produced to
the satisfaction of the Commission. Generating Company, the Board or
licensee will thereafter be informed of this decision.
7. The Commission will thereafter follow, as far as may be practicable, the
procedure specified in the General Regulations for hearing on the ERC
filing and for passing orders.
Chapter – VI Tariff regulatory framework in Kerala
183
6.7 Procedure for Tariff filing
1. The Commission may, on its own, on being satisfied that there is need to
review the tariff of a Generating Company, the Board or any other licensee,
shall initiate the process of review in accordance with the procedures set out
para 6.10 below.
2. If Generating Company, the Board or licensee desires to amend the current
tariff, it shall prepare and lodge with the Commission its application for
amendments, provided that no tariff or part of any tariff shall be amended
more than once in any financial year. Provided further that the application for
amendment of tariff shall be filed not later than 4 months before the intended
date of implementation of such amended tariff.
3. The application for amendment of tariff may be filed along with ERC filing
or at any later date.
4. The details of calculations of proposed tariff by the Board or licensee shall be
in the prescribed formats and have to be filed in 6 sets with each format being
signed by an authorised officer of the Board or licensee who shall be
responsible for verifying and certifying the correctness there of. In addition to
the hard copies of the formats, it is also necessary to furnish the said formats
in electronic form in disc using the MS Excel Spread sheet package.
5. Generating Company's, Board’s or licensee’s application for amendment of
tariff shall contain the following:
a) A statement of the current tariffs and charges, that are proposed to be
amended, together with all applicable terms and conditions;
b) A statement of amendments proposed with the proposed tariffs and
proposed terms and conditions;

Chapter – VI Tariff regulatory framework in Kerala
184
c) A statement of the estimated change in the annual gross revenue that
would result in the ensuing financial year, from the proposed
amendments, stated in rupees and as percentage of annual revenue from
existing tariffs. The change in annual revenue for the Board or licensee
should be shown as a whole and for each tariff category affected;
d) Following additional information in respect of the Board or distribution
licensee:
i) An embedded cost study showing the cost of service of supply of
electricity to each consumer category;
ii) An analysis of the effect of the proposed tariff changes on the
average as well as typical small, medium and large consumers in
each affected tariff category and the changes in annual bills and
monthly bills by season (where applicable) in both rupees and
percentage terms;
iii) A statement of any proposed cross subsidy including the amount of
such subsidy to the affected consumer category and the source of
offset of this subsidy (e.g. other consumer category/categories);
iv) A comparison of the percentage of cost of service expected to be
recovered in the ensuing financial year by the current and proposed
tariff for each consumer category;
v) A statement of any subsidy committed by the Government of
Kerala to the consumers to whom it is directed and the way in
which such subsidy is proposed to be reflected in the proposed
tariff applicable to these consumers;
vi) A written explanation of the rationale for the proposed tariff
changes, including justification of the rate of return being proposed
vii) Any other information as required by the Commission.

Chapter – VI Tariff regulatory framework in Kerala
185
6. Within 15 working days of the receipt of the Tariff filing, the Commission
shall notify Generating Company, the Board or licensee whether any
additional information is required by the Commission to assess Generating
Company's Board’s or licensee’s calculation, specifying the date by which
such information is to be filed.
7. The filled up formats filed by Generating Company, the Board or licensee
will be treated as a petition upon the Commission deciding that all the
information and clarification sought for by it have been produced to the
satisfaction of the Commission.
8. The Commission will there after follow, as far as may be practicable, the
procedure specified in para 6.10 below for hearing on the Tariff filing and for
passing orders thereon
6.8 Publication of petition
The Generating Company, the Board or licensee shall arrange for publication
of the petition on ERC filing or Tariff filing in the following manner:
(a) The summary of the petition, in such format, as may be approved by the
Commission shall be published in one issue each of two daily newspapers
in English language and two daily newspapers in Malayalam language
having wide circulation in the State. The advertisement should invite
interested persons to file their objections and such documents as they
seek to rely upon supported by an Affidavit, in six copies, within the date
as specified by the Commission and also indicate whether they would like
to be heard in person by the Commission.
(b) The advertisement shall also specify that interested persons may inspect
the copies of the petitions in specified offices of Generating Company,
the Board or licensee during normal working hours within 10 working
days of the publication of the notice and also obtain the salient features of
the petition at such specified places.

Chapter – VI Tariff regulatory framework in Kerala
186
(c) The advertisement shall also mention that the full set of the petition /
application together with supporting material would be made available at
the specified offices of Generating Company, the Board or licensee to any
interested person who may ask for it on payment of cost of photocopying.
6.9 Commission’s powers for verification
(1) The Commission may get the books and records of Generating Company,
the Board or licensee concerned examined by its officers and/or by
consultants and/or by any authorized person at any point of time during the
pendency of the petition or otherwise. The report of the officers /
consultants / or authorized person shall be made available to the parties
concerned and they shall be given opportunity to react on the reports. The
Commission shall duly take into account the report or the opinion given by
the officers and/or by consultants or any authorised person and the reply
filed by the parties while deciding the matter, and if considered necessary,
the examination before the Commission of the person giving the report or
the opinion.
(2) Generating Company, the Board and licensee shall submit periodic returns,
as may be prescribed containing operational and cost data to enable the
Commission to monitor the implementation of its order and reassess the
basis on which tariff was approved.
(3) All filings should be in conformity with the conditions of license, in the
case of a licensee.
6.10 Saving of inherent power of the Commission
1) Nothing in these Regulations shall be deemed to limit or otherwise affect
the inherent power of the Commission to make such orders, as may be
necessary for meeting the ends of justice or to prevent abuse of the process
of the Commission.
Chapter – VI Tariff regulatory framework in Kerala
187
(2) Nothing in these Regulations shall bar the Commission from adopting, in
conformity with the provisions of the Act, a procedure, which is at
variance with any of the provisions of these Regulations, if the
Commission, in view of the special circumstances of a matter or class of
matters and for reasons to be recorded in writing, deems it necessary or
expedient for dealing with such a matter or class of matters.
(3) Nothing in these Regulations shall expressly or impliedly bar the
Commission dealing with any matter or exercising any power under the
Act for which no Regulation have been framed and the Commission may
deal with such matters, powers and functions in a manner it deems fit.
6.11 Relevant provisions in the Central Act to empower regulation:
By the enactment of Electricity Act –2003 and by force of the relevant
provisions contained in the Act and by force of the provisions in the National
Electricity Policy-2005 (NEP-2005) and National Tariff Policy 2006 (NTP-2006) the
central and state regulatory commissions have been provided with sufficient
legitimate rights and power to enforce an independent regulatory regime to make
country’s power sector more vibrant.
6.11.1 Electricity Act – 2003
It is stated in the preamble of the Electricity Act-2003 : ‘It is an Act to
consolidate the laws relating to generation, transmission, distribution, trading and use
of electricity and generally for taking measures conducive to development of
electricity industry, promoting competition therein, protecting interest of consumers
and supply of electricity to all areas, rationalisation of electricity tariff, ensuring
transparent policies regarding subsidies, promotion of efficient and environmentally
benign policies, constitution of Central Electricity Authority, Regulatory
Commissions and establishment of Appellate Tribunal and for matters connected
therewith or incidental thereto.”
Chapter – VI Tariff regulatory framework in Kerala
188
6.11.2 Key provisions in EA-2003
Section 61. The Appropriate Commission shall, subject to the provisions of
this Act, specify the terms and conditions for the determination of tariff, and in doing
so, shall be guided by the following, namely:-
a) The principles and methodologies specified by the Central Commission
for determination of the tariff applicable to generating companies and
transmission licensees;
b) The generation, transmission, distribution and supply of electricity are
conducted on commercial principles;
c) The factors which would encourage competition, efficiency, economical
use of the resources, good performance and optimum investments
d) Safeguarding of consumers interest and at the same time, recovery of
the cost of electricity in a reasonable manner;
e) The principles rewarding efficiency in performance
f) Multi year tariff principles;
g) That the tariff progressively reflects the cost of supply of electricity and
also reduces cross subsidies in the manner specified by the Appropriate
Commission;
h) The promotion of co-generation and generation of electricity from
renewable sources of energy;
i) The National Electricity Policy and tariff policy:
6.11.3 National Electricity Policy
Section 3 (1) of the Act, requires the Central Government to prepare the National
Electricity Policy and the National Tariff Policy to guide the development of the
Chapter – VI Tariff regulatory framework in Kerala
189
electricity sector of the country in an optimal manner to achieve the objectives of the
Act. The Government of India notified the National Electricity Policy 2005 on 12th
February 2005, and the introductory section elaborates on (a) the importance of
electricity to economic development of the country, (b) attendant social benefits of
economic development, (c) problems plaguing the sector, (d) reiterates the intent of
the Act, and (e) the intent of the NEP05.
Relevant sections of the National Electricity Policy - 2005, which are applicable to
the functions of State Commission, are given below:
Section 1.2: “Electricity is an essential requirement for all facets of our life. It has
been recognized as a basic human need. It is a critical infrastructure on which the
socio-economic development of the country depends. Supply of electricity at
reasonable rate to rural India is essential for its overall development. Equally
important is availability of reliable and quality power at competitive rates to Indian
Industry to make it globally competitive and to enable it to exploit the tremendous
potential of employment generation. Services sector has made significant
contribution to the growth of our economy. Availability of quality supply of
electricity is very crucial to sustained growth of this segment”.
Section1.4: “Indian Power sector is witnessing major changes. Growth of Power
Sector in India since its Independence has been noteworthy. However, the demand
for power has been outstripping the growth of availability. Substantial peak and
energy shortages prevail in the country. This is due to inadequacies in generation,
transmission & distribution as well as inefficient use of electricity. Very high level of
technical and commercial losses and lack of commercial approach in management of
utilities has led to unsustainable financial operations. Cross-subsidies have risen to
unsustainable levels. Inadequacy in distribution networks has been one of the major
reasons for poor quality of supply”.
Section 1.6: “Electricity Act-2003 provides an enabling framework for accelerated
and more efficient development of the power sector. The Act seeks to encourage
Chapter – VI Tariff regulatory framework in Kerala
190
competition with appropriate regulatory intervention. Competition is expected to
yield efficiency gains and in turn result in availability of quality supply of electricity
to consumers at competitive rates”.
Section 1.8: “The National Electricity Policy aims at laying guidelines for
accelerated development of the power sector, providing supply of electricity to all
areas and protecting interests of consumers and other stakeholders keeping in view
availability of energy resources, technology available to exploit these resources,
economics of generation using different resources, and energy security issues”.
6.11.4 National Tariff Policy
The Government of India notified the National Tariff Policy-2006 on 6th
January 2006, in continuation of the National Electricity Policy-2005. The National
Tariff Policy-2006 reiterates the importance of providing reliable supply of
electricity, and reasonable rates to consumers to ensure rapid economic development,
and attendant social benefits.
Relevant sections of the National Tariff Policy - 2006 in support of the above
and as applicable to State Commission are given below:
Section 1.3. “It is therefore essential to attract adequate investments in the
power sector by providing appropriate return on investment as budgetary resources
of the Central and State Governments are incapable of providing the requisite funds.
It is equally necessary to ensure availability of electricity to different categories of
consumers at reasonable rates for achieving the objectives of rapid economic
development of the country and improvement in the living standards of the people”
Further, it lays out the critical challenge of the regulatory process – ensuring
reasonable rates for electricity, whilst attracting sufficient investment to the sector
and promoting a consistent regulatory approach across the country.
Section 1.4 – “Balancing the requirement of attracting adequate investments
to the sector and that of ensuring reasonability of user charges for the consumers is
Chapter – VI Tariff regulatory framework in Kerala
191
the critical challenge for the regulatory process. Accelerated development of the
power sector and its ability to attract necessary investments calls for, inter alia,
consistent regulatory approach across the country. Consistency in approach becomes
all the more necessary considering the large number of States and the diversities
involved”.
The legal position of the NTP-06 is laid out clearly in the NTP-06, and
requires the CERC and SERCs to be guided by the NTP-06 in discharging their
functions, including in framing the regulations under Section 61 of the Act.
Relevant extracts of the NTP-06 in support of the above are given below:
Section 2.2: “The Act also requires that the Central Electricity Regulatory
Commission (CERC) and State Electricity Regulatory Commissions (SERCs) shall
be guided by the tariff policy in discharging their functions including framing the
regulations under section 61 of the Act”.
Section 2.3: “Section 61 of the Act provides that Regulatory Commissions shall be
guided by the principles and methodologies specified by the Central Commission for
determination of tariff applicable to generating companies and transmission
licensees”.
Section 2.4 “The Forum of Regulators has been constituted by the Central
Government under the provisions of the Act, which would, inter-alia, facilitate
consistency in approach especially in the area of distribution”.
6.11.5 Regulations by CERC & KSERC
Following from the provisions of the Act the CERC had notified the Central
Electricity Regulatory Commission (Terms & Conditions of Tariff) Regulations 2004
on 26th March 2004. The Forum of Regulators (FOR) was constituted vide
Notification dated 16th February, 2005 in pursuance of the provision under section
166(2) of the Electricity Act 2003, to facilitate consistency in approach, especially in
the area of distribution.
Chapter – VI Tariff regulatory framework in Kerala
192
Following from the provisions of the Act, National Electricity Policy – 2005
& National Tariff Policy – 2006, the KSERC has notified the following regulations
relating to tariff:
(a) The Kerala State Electricity Regulatory Commission (Tariff)
Regulations 2003 on 3rd January 2004
(b) The Kerala State Electricity Regulatory Commission (Terms &
Conditions of Tariff for Retail Sale of Electricity) Regulations 2006 on
23rd March 2006
(c) The Kerala State Electricity Regulatory Commission (Terms &
Conditions for Determination of Tariff for Distribution and Retail Sale
of Electricity under Multi-Year Tariff (MYT) framework) Regulations
2006 on 12th October 2006
(d) As stated in the Central Electricity Regulatory Commission (Terms &
Conditions of Tariff) Regulations 2004 dated 26th March 2004, the term
of the regulations was 5 years, unless otherwise reviewed by the CERC
prior to that. Accordingly the CERC has now notified the Central
Electricity Regulatory Commission (Terms & Conditions of Tariff)
Regulations 2009 dated 19th January 2009, that came into effect on 1st
April 2009. The list of regulations notified by the Kerala State
Electricity Regulatory Commission is given in Annexure – II.
A Comparative analysis of Tariff Regulatory Policies (Historical Back ground
of Legislative and Regulatory Initiatives) is given in Annexure VI.
Chapter – VII A case of power tariff hike w.r.to. Indal (Hindalco)
193
CHAPTER – 7
A CASE OF POWER TARIFF HIKE WITH RESPECT TO A
POWER INTENSIVE CONSUMER IN KERALA
7.1 Introduction
Indian Aluminium Company Limited (presently known as Hindalco
Industries Limited), Alupuram Smelter, India’s first primary aluminium smelter was
set up at Alupuram, Kalamassery in Kerala with an initial annual capacity of 2500 T
primary aluminium metal in the year 1943, by the joint initiative of His Highness the
Maharaja of erstwhile Travancore and Aluminium Company of Canada (ALCAN).
The plant at Alupuram was continuously expanded to reach an annual capacity of
21500 Tonne by 1989. In fact, the then Dewan of Travancore State Sir. C. P.
Ramaswami Iyer had initiated discussions with ALCAN, Canada during late 1930s
and entered into an agreement with Indian Aluminium Company on 13 July 1941 to
supply cheap electric power generated from the first hydroelectric plant of
Travancore State called Pallivasal Hydroelectric Project and further facilitated setting
up of all infrastructural facilities required to commence production of primary
aluminium metal at Alupuram Smelter. Since aluminium metal is produced by power
intensive electrolytic reduction of aluminium oxide (alumina, the purified form of
bauxite), it was a well thought out and planned decision by the Maharajah of
erstwhile Travancore to invite a multi-national aluminium company to set up a power
intensive aluminium smelter to ensure evacuation of power generated at Pallivasal, at
a time when there were not much consumers for electricity and the transmission and
distribution network in the state was at the infant stage. The setting up Indian
Aluminium Company Limited at Kalamassery, Kerala by the multinational
aluminium giant ALCAN can be regarded as the first global investment initiative of
its kind in the erstwhile Travancore or in the whole of Kerala. The success of
Pallivasal project paved the way for its progressive expansion and further growth of
State’s power sector.
Chapter – VII A case of power tariff hike w.r.to. Indal (Hindalco)
194
Indian Alumium Company Limited (INDAL), Alupuram Smelter (now
Hindalco Industries Limited, an Aditya Birla Group company) has been part of
India’s Aluminium Industries for over six decades. Established in 1938 at Belur,
West Bengal, the Company is vertically integrated through all stages of Aluminium
business – from Bauxite mining, Alumina refining, power generation, Aluminium
Smelting, to the manufacture of semi fabricated products of Sheet, Foil, Extrusion,
wire rods, alloy ingots and Aluminium Scrap remelting. Till June 2000 INDAL was
operating as an Indian subsidiary of ALCAN Canada, and it has been taken over by
Aditya Birla Group as a subsidiary of Hindalco Industries Limited and subsequently
merged with Hindalco Industries Limited with effect from 7 March 2004.
INDAL’s alumium metal manufacturing pot lines (Line-I with an amperage
of 25kA and Line-II with an amperage of 50kA) were closed one after the other due
to the spiraling increase in cost of production on account of unaffordable electricity
charges. INDAL was the single largest consumer of electricity in Kerala State till the
closure of Smelter unit.
7.2 Brief history of the company under study
7.2.1 Growth of Alupuram Factory
The Alupuram Smelter was commissioned in the year 1943, with an initial
installed capacity of 2500 TPA with 25 KA pot line. The most important raw
material required for the electrolytic reduction of alumina (purified form of bauxite
ore) into aluminium metal is electricity, which was supplied from Pallivasal
Hydroelectric Project, Kerala’s first Hydel power station. This is the first Aluminium
smelter in India. Over the years, it has undergone several expansions including the
addition of 50 KA pot lines and has reached the capacity of 21500 TPA during the
year 1983. The growth of power sector and industrialisation in Kerala was
tantamount with the gradual expansion of Alupuram smelter during first three
decades of operation of Alupuram smelter from its inception. The 25 KA line having
7500 TPA capacity was de-energised in 1996 due to economic unviability on account
Chapter – VII A case of power tariff hike w.r.to. Indal (Hindalco)
195
of excessive power tariff and subsequently the plant was shutdown. The total plant
capacity was then reduced to 14000 TPA.
The alumina required for the process was received from INDAL’s own
alumina plants at Belgaum (Karnataka) and at Muri (Bihar). Other major raw
materials required for the process like cryolite, aluminium fluoride, petroleum coke,
pitch, furnace oil, etc. were either imported or purchased from indigenous sources.
The aluminium production process is a high temperature electrolytic reduction
process, wherein the alumina dissolved in molten cryolite undergoes electrolysis by
using carbon electrodes. The electrical energy required for the process was supplied
by KSEB. About 17000 units of electrical energy are required to produce one tonne
of aluminium. The monthly power consumption corresponding to 21500 TPA of
primary aluminium metal production was more than 30 million units till the closure
of line-I pot room in 1996 and that corresponding to 14000 TPA of metal production
was more than 20 million units per month.
7.2.2 Products
The primary product of Alupuram smelter was molten Aluminium metal,
which was cast in to billets, ingots, alloy ingots or wire rods as per the requirements
at our Casting plant. When there was shortage of primary metal it was also procured
from other Hindalco units or from the market to meet Casting Plant requirement.
Billets were cast in to 6”, 9” and 12” diameter sizes and supplied, as per the
requirement of Hindalco Alupuram Extrusion Unit. Aluminium ingots weighing 20
Kg (1-20K) and 10 Kg (1-10K) were cast and sold to external customers. The
extruded products to serve different industrial and architectural applications and
ingots were used for the manufacture of sheets, automobile parts etc. The Extrusion
Plant at Alupuram is now working and Casting Plant is supplying aluminium sawn
billets to extrusion plant. Wire rods produced were sold to external customers. The
carbon electrode paste for electrolysis was manufactured at the Carbon plant. A part
of the Carbon paste was to external parties as per market demand. The main product,
viz. billets are used for the manufacture of extruded aluminium
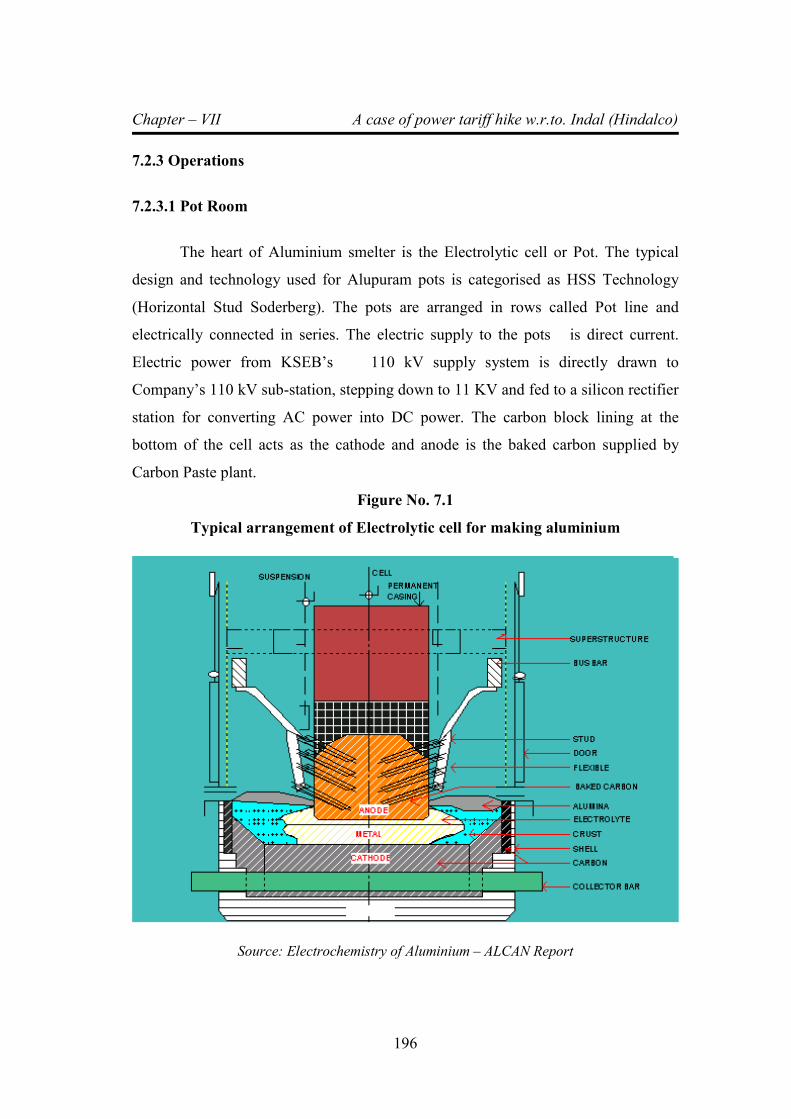
Chapter – VII A case of power tariff hike w.r.to. Indal (Hindalco)
196
7.2.3 Operations
7.2.3.1 Pot Room
The heart of Aluminium smelter is the Electrolytic cell or Pot. The typical
design and technology used for Alupuram pots is categorised as HSS Technology
(Horizontal Stud Soderberg). The pots are arranged in rows called Pot line and
electrically connected in series. The electric supply to the pots is direct current.
Electric power from KSEB’s 110 kV supply system is directly drawn to
Company’s 110 kV sub-station, stepping down to 11 KV and fed to a silicon rectifier
station for converting AC power into DC power. The carbon block lining at the
bottom of the cell acts as the cathode and anode is the baked carbon supplied by
Carbon Paste plant.
Figure No. 7.1
Typical arrangement of Electrolytic cell for making aluminium
Source: Electrochemistry of Aluminium – ALCAN Report
Chapter – VII A case of power tariff hike w.r.to. Indal (Hindalco)
197
The electrolyte consists of alumina dissolved in Cryolite. Alumina is added
intermittently to maintain the concentration of dissolved Alumina within the desired
range. The molten Aluminium is withdrawn intermittently from the bottom of the
cells by using pneumatic suction equipment called vacuum crucible. Pot room was
de-energised on 1 August 2003 due to economically unviable operations consequent
upon the tariff hike imposed from October 2002 by the Government / KSEB. Figure
No. 7.1 shows typical arrangement showing various components of an HSS
Electrolytic Cell, which is also called HSS pot.
7.2.3.2 Casting Plant
The Aluminium metal drawn from the Pot room and /or the cold metal
sourced from other Hindalco units is fed to the Casting plant furnaces. When molten
metal from pot room was available, the oil heating required in furnaces was limited
to the purpose of holding metal in molten stage and for melting aluminium scrap
generated in extrusion and casting plants. Molten metal is cast either as billets / alloy
ingots, CG/EC grade ingots or as wire rods. In the case of billets and alloy ingots,
which are basically Aluminium alloys, alloying materials are added at desired levels
and cast as billets/ ingots. The as cast billets are homogenized, ultrasonically tested
for cracks and the defect free billets are cut into desired length and are transferred to
Extrusion plant for the manufacture of Extruded sections. Extruded products are sold
in the Indian markets and some special products are exported. The Alloy Ingots /
ingots/ wire rods are sold to Indian customers or exported.
7.2.3.3 Carbon Paste plant.
Carbon electrode paste is used as anode at the Pot rooms and this is
manufactured in this plant. The raw materials used are coal tar pitch and calcined
petroleum coke. Coke of different fractions and molten pitch at a fixed formulation is
mixed at the mixer at the desired temperature and it is either sent directly to Pot
rooms or cast in drums as sales paste. The sales paste is sold to third parties. This
was shut down effective September 2003 consequent to Pot room de- energisation.

Chapter – VII A case of power tariff hike w.r.to. Indal (Hindalco)
198
7.3 Power Tariff increase and viability crisis
As mentioned earlier, the most important factor in selecting Alupuram as the
location of Smelter unit, even though located far away from Bauxite mines, was the
cheap electricity made available by the State, as power development in Kerala was
mainly Hydel. The growth of Hydel power continued at a reasonable pace till 1976,
with the commissioning of Idukki power project. All major hydro development plans
have since been held up due to environmental considerations. Of late, the State is
turning increasingly towards thermal power from within the state or from Central
generating stations (CGS) outside for meeting its growing energy demands even
though the State has abundant resources of hydro potential and as a result, there has
been a substantial increase in the power tariff in the State for the period from 1997 to
2002. This unaffordable electricity tariff forced INDAL to restrict the smelting
capacity to 14000 Tonnes from 21500 Tonnes in the year 1996 as mentioned earlier.
Power is the main raw material for aluminium smelter and about 17000 units
of energy is required for producing one Tonne of aluminium, which constitutes about
60% of the total production cost at the prevailing electricity tariff as applicable for
EHT Industrial Electricity Consumers (Rs. 3.40 per Unit at the time of de-
energisation of smelter unit on 1 Aug 2003) while for smelters abroad, the energy
cost averages only about 20% of the cost of production. All major players in
aluminium business, nationally / internationally, are supported by either Captive or
Utility power at a unit cost of less than a rupee. The selling price of aluminium is
independent of the cost of individual producers, being governed by the LME
(London Metal Exchange) price and market conditions. Figure 7.2 shows comparison
of power tariff as applicable to primary aluminium smelters India and abroad.
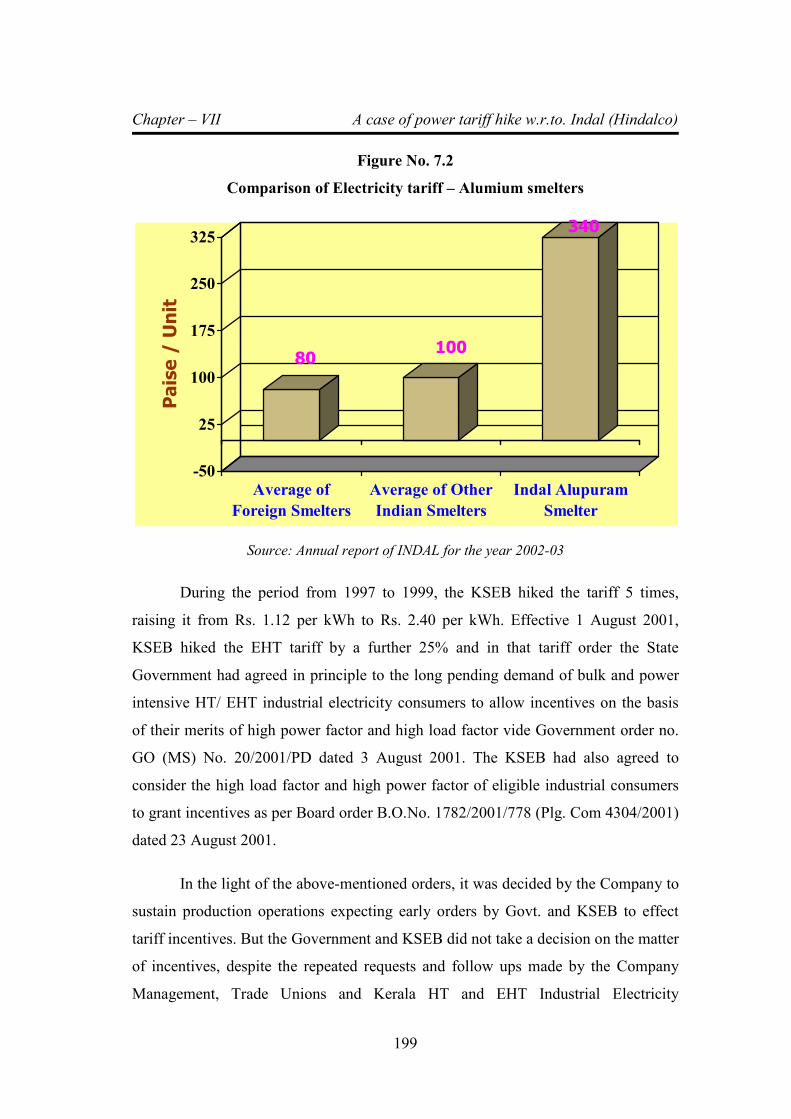
Chapter – VII A case of power tariff hike w.r.to. Indal (Hindalco)
199
Figure No. 7.2
Comparison of Electricity tariff – Alumium smelters
Source: Annual report of INDAL for the year 2002-03
During the period from 1997 to 1999, the KSEB hiked the tariff 5 times,
raising it from Rs. 1.12 per kWh to Rs. 2.40 per kWh. Effective 1 August 2001,
KSEB hiked the EHT tariff by a further 25% and in that tariff order the State
Government had agreed in principle to the long pending demand of bulk and power
intensive HT/ EHT industrial electricity consumers to allow incentives on the basis
of their merits of high power factor and high load factor vide Government order no.
GO (MS) No. 20/2001/PD dated 3 August 2001. The KSEB had also agreed to
consider the high load factor and high power factor of eligible industrial consumers
to grant incentives as per Board order B.O.No. 1782/2001/778 (Plg. Com 4304/2001)
dated 23 August 2001.
In the light of the above-mentioned orders, it was decided by the Company to
sustain production operations expecting early orders by Govt. and KSEB to effect
tariff incentives. But the Government and KSEB did not take a decision on the matter
of incentives, despite the repeated requests and follow ups made by the Company
Management, Trade Unions and Kerala HT and EHT Industrial Electricity
80100
340
-50
25
100
175
250
325
Paise / Unit
Average of
Foreign Smelters
Average of Other
Indian Smelters
Indal Alupuram
Smelter
Chapter – VII A case of power tariff hike w.r.to. Indal (Hindalco)
200
Consumers Association till 1 August 2003 (the date of de-energisation of line – II pot
room).
When the Company was expecting a reasonable relief in tariff in the form of
power factor and load factor incentives, to circumvent the effect of earlier hikes in
electricity tariffs, the Government and KSEB effected another tariff hike by 50 paise
per unit effective 1 October 2002. The tariff as applicable effective 1 October 2002
was Rs 3.40 per kWh. Being critically dependent on the power cost, where a hike of
10 paise per kWh increases the metal cost by about Rs 1700/- per Tonne, the Smelter
has become completely unviable due to the oppressive hike in tariff. The hike in
power has resulted in a monthly loss of Rs.2 Crores or an annual loss of Rs.24
Crores. Comparison of cost of production of primary metal before and after tariff
hike is shown in figure no. 7.3 and impact of power tariff increase in the cost of
productions is shown in figure 7.4.
The Company and Trade Unions made repeated requests and appeals to the
KSEB as well as the Government of Kerala to fix a reasonable tariff taking into
account the bulk and steady consumption, purpose of use of electricity as a raw
material, the substantial monetary benefits to the State Government as well as the
Central Government and local authorities by way of central excise duty, central sales
tax, Kerala General Sales Tax, income tax and other local taxes. The annual
electricity charge to KSEB was around Rs. 68 Crores before the tariff hike in
October 2002. The tariff hike effected in October 2002 @ 50 ps. / unit imposed upon
the company an additional burden of Rs. 12 Crores per year in electricity charges.
The company was providing employment to more than 1000 and odd employees
including indirect employment. Neither the KSEB nor the Government of Kerala has
cared to study the impact of oppressive hike in electricity tariff on the economic
unviability of smelting operations of INDAL, Alupuram.
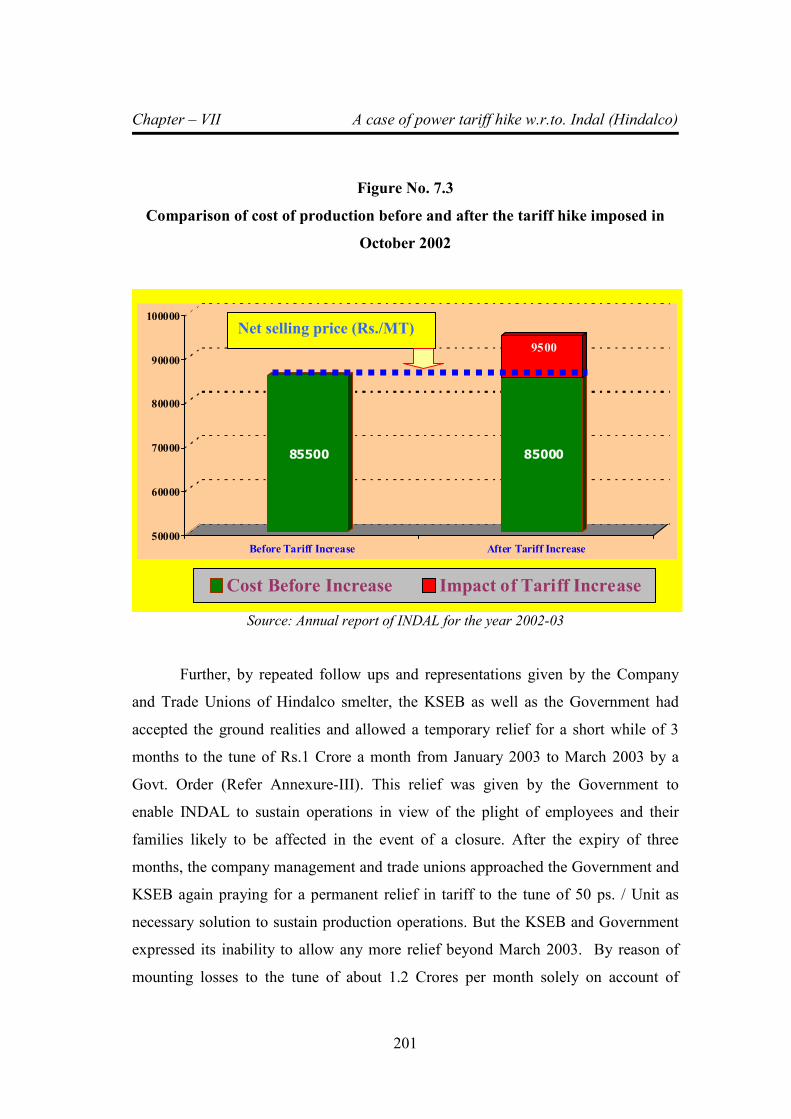
Chapter – VII A case of power tariff hike w.r.to. Indal (Hindalco)
201
Figure No. 7.3
Comparison of cost of production before and after the tariff hike imposed in
October 2002
Source: Annual report of INDAL for the year 2002-03
Further, by repeated follow ups and representations given by the Company
and Trade Unions of Hindalco smelter, the KSEB as well as the Government had
accepted the ground realities and allowed a temporary relief for a short while of 3
months to the tune of Rs.1 Crore a month from January 2003 to March 2003 by a
Govt. Order (Refer Annexure-III). This relief was given by the Government to
enable INDAL to sustain operations in view of the plight of employees and their
families likely to be affected in the event of a closure. After the expiry of three
months, the company management and trade unions approached the Government and
KSEB again praying for a permanent relief in tariff to the tune of 50 ps. / Unit as
necessary solution to sustain production operations. But the KSEB and Government
expressed its inability to allow any more relief beyond March 2003. By reason of
mounting losses to the tune of about 1.2 Crores per month solely on account of
85500 85000
9500
50000
60000
70000
80000
90000
100000
Before Tariff Increase After Tariff Increase
Cost Before Increase Impact of Tariff Increase
Net selling price (Rs./MT)
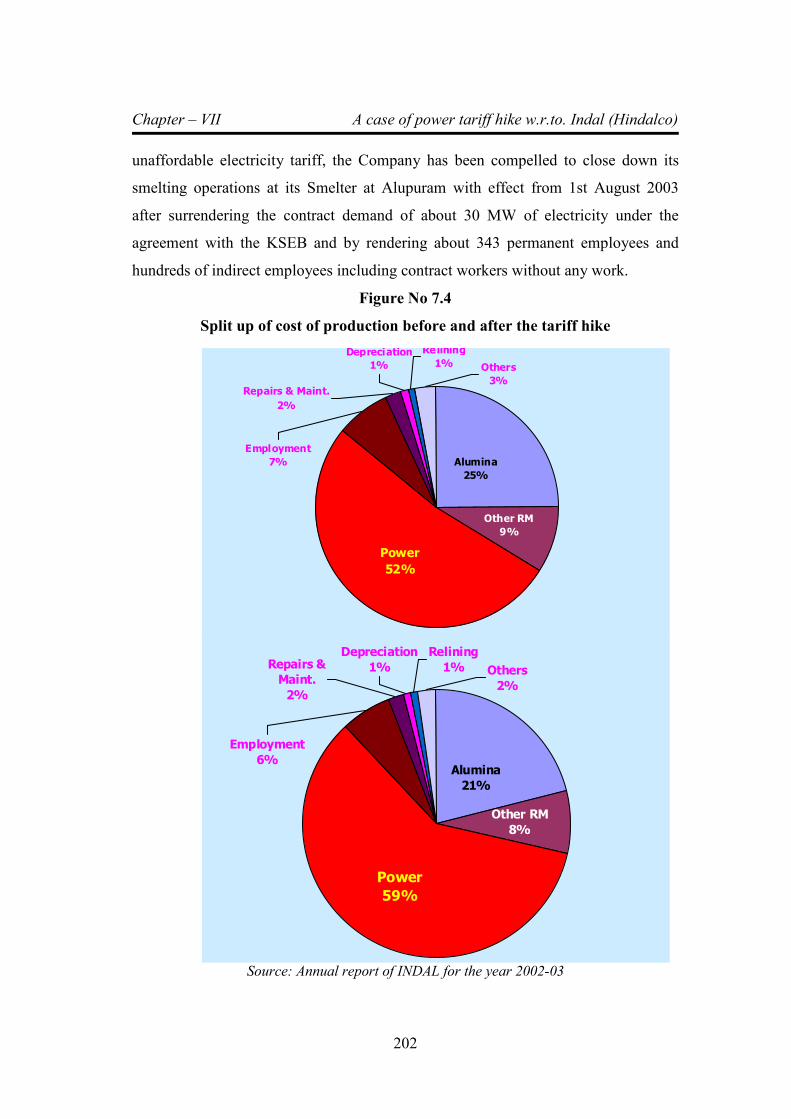
Chapter – VII A case of power tariff hike w.r.to. Indal (Hindalco)
202
unaffordable electricity tariff, the Company has been compelled to close down its
smelting operations at its Smelter at Alupuram with effect from 1st August 2003
after surrendering the contract demand of about 30 MW of electricity under the
agreement with the KSEB and by rendering about 343 permanent employees and
hundreds of indirect employees including contract workers without any work.
Figure No 7.4
Split up of cost of production before and after the tariff hike
Source: Annual report of INDAL for the year 2002-03
Others
3%
Employment
7%
Depreciation
1%
Relining
1%
Alumina
25%
Repairs & Maint.
2%
Power
52%
Other RM
9%
Others
2%
Employment
6%
Depreciation
1%
Relining
1%
Alumina
21%
Repairs &
Maint.
2%
Power
59%
Other RM
8%
Chapter – VII A case of power tariff hike w.r.to. Indal (Hindalco)
203
From the figure 7.3, it can be seen that after the tariff increase in October
2002, the cost of production has increased by Rs 9500 / MT against the net selling
price of primary aluminium metal. The monthly production of aluminium was 1200
MT and therefore the company was incurring a direct loss of Rs. (1200 x 9500),
which amounts to Rs. 1.14 Crores on smelting operations alone. Other products like
wire rods and alloy ingots were also making loss and thus total monthly loss was
about Rs. 2 Crores. Cost structure of primary metal production before and after tariff
hike is shown in figure no. 7.4. The relief allowed by Government was just sufficient
for the company to keep its nose above water.
7.4 Absence of independent regulation (State Commission)
The Electricity Regulatory Commissions Act, 1998 was promulgated by the
President of India as an ordinance and came into force on the 25 April 1998. This
was an Act to provide for the establishment of a Central Electricity Regulatory
Commission and State Electricity Regulatory Commissions, rationalization of
electricity tariff, transparent policies regarding subsidies, promotion of efficient and
environmentally benign policies and matters connected therewith or incidental
thereto. Even though the Central Electricity Regulatory commission was constituted
by the central government followed by constitution of State Electricity Regulatory
Commissions by many states, the Government of Kerala did not constitute state
commission till November 2002.
As per the ERC Act-1998, state commission is the sole authority to determine
tariff in a scientific manner as per the tariff determination procedure deliberated in
the previous chapters. The ERC Act-1998 empowers the Central and State
Commissions to assume the role of an independent regulator and take suitable
decisions on all matters related to electricity generation, transmission, distribution,
purchase of power, fixing of retail and bilk tariff, open access etc in accordance with
Chapter – VII A case of power tariff hike w.r.to. Indal (Hindalco)
204
terms specified in the Act and to safeguard the legitimate interests of all
stakeholders.
As section 29 (2) (e) of the Act, the State Commission shall determine by
regulations the terms and conditions for the fixation of tariff, and in doing so, shall
be guided by the following “the interests of the consumers are safeguarded and at the
same time, the consumers pay for the use of electricity in a reasonable manner based
on the average cost of supply of energy”.
Further, as per Section 29 (3) of the ERC Act 1998, “the State Commission,
while determining the tariff under the Act, shall not show undue preference to any
consumer of electricity, but may differentiate according to the consumer's load
factor, power factor, total consumption of energy during any specified period or the
time at which the supply is required or the geographical position of any area, the
nature of supply and the purpose for which the supply is required”.
As mentioned earlier, the KSEB by the order state government had hiked
tariff seven times during the period from 1997 to 2002. Tariff hike was implemented
without looking into the rationale of cost of supply or cost to serve as applicable to
different categories of consumers with different voltage levels of supply. The State
Electricity Regulatory Commission was constituted in the State of Kerala in
November 2002. Prior to that the KSEB by the order of the Government had hiked
tariff in August 2001 (25 % of base energy charges) and October 2002 (50 ps. Per
Unit). The State Commission was constituted after doing all the harm to the
industrial consumers, especially to the single largest consumer INDAL, whose cost
of power is a significant component in the total cost of production as shown in
Figure 7.4.
Prior to the appointment of Kerala State Electricity Regulatory Commission,
KSEB was authorised to set or hike consumer tariffs. In practice State Government
approved the tariff hikes from time to time as per the proposal of KSEB, without
seriously analysing the efficiency or costs of the board. KSEB was functioning as a
vertically integrated public sector monopoly under the direct control of State
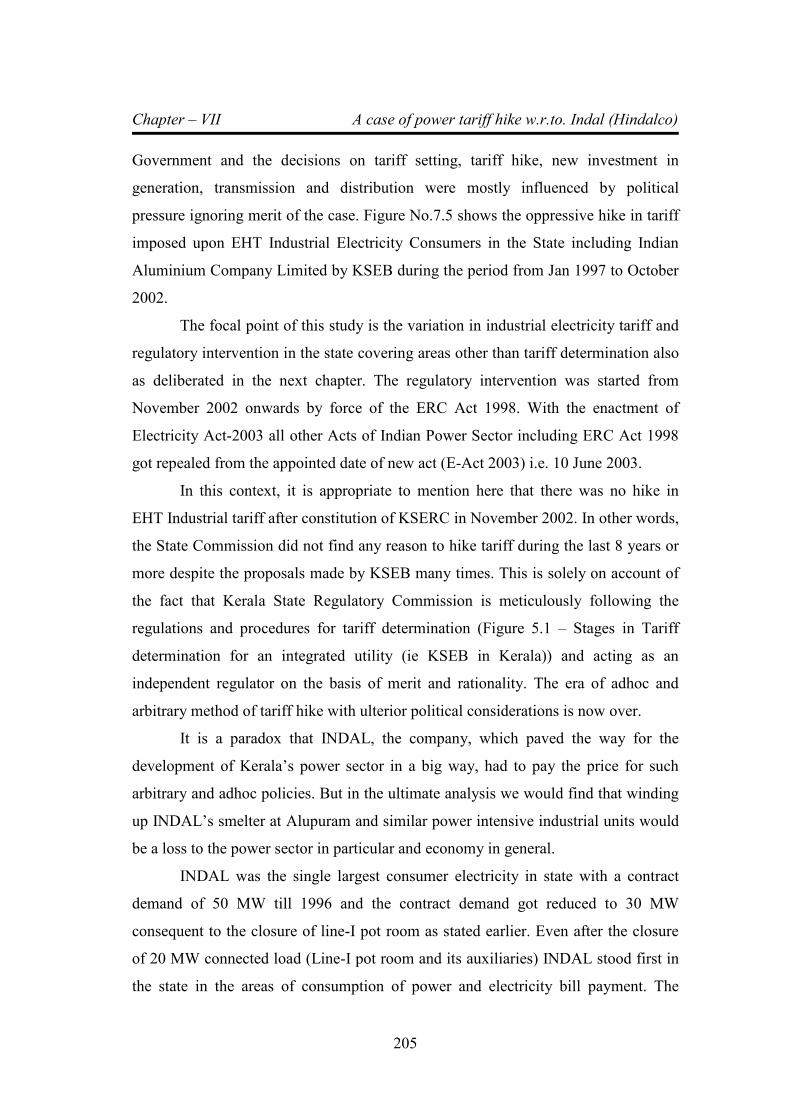
Chapter – VII A case of power tariff hike w.r.to. Indal (Hindalco)
205
Government and the decisions on tariff setting, tariff hike, new investment in
generation, transmission and distribution were mostly influenced by political
pressure ignoring merit of the case. Figure No.7.5 shows the oppressive hike in tariff
imposed upon EHT Industrial Electricity Consumers in the State including Indian
Aluminium Company Limited by KSEB during the period from Jan 1997 to October
2002.
The focal point of this study is the variation in industrial electricity tariff and
regulatory intervention in the state covering areas other than tariff determination also
as deliberated in the next chapter. The regulatory intervention was started from
November 2002 onwards by force of the ERC Act 1998. With the enactment of
Electricity Act-2003 all other Acts of Indian Power Sector including ERC Act 1998
got repealed from the appointed date of new act (E-Act 2003) i.e. 10 June 2003.
In this context, it is appropriate to mention here that there was no hike in
EHT Industrial tariff after constitution of KSERC in November 2002. In other words,
the State Commission did not find any reason to hike tariff during the last 8 years or
more despite the proposals made by KSEB many times. This is solely on account of
the fact that Kerala State Regulatory Commission is meticulously following the
regulations and procedures for tariff determination (Figure 5.1 – Stages in Tariff
determination for an integrated utility (ie KSEB in Kerala)) and acting as an
independent regulator on the basis of merit and rationality. The era of adhoc and
arbitrary method of tariff hike with ulterior political considerations is now over.
It is a paradox that INDAL, the company, which paved the way for the
development of Kerala’s power sector in a big way, had to pay the price for such
arbitrary and adhoc policies. But in the ultimate analysis we would find that winding
up INDAL’s smelter at Alupuram and similar power intensive industrial units would
be a loss to the power sector in particular and economy in general.
INDAL was the single largest consumer electricity in state with a contract
demand of 50 MW till 1996 and the contract demand got reduced to 30 MW
consequent to the closure of line-I pot room as stated earlier. Even after the closure
of 20 MW connected load (Line-I pot room and its auxiliaries) INDAL stood first in
the state in the areas of consumption of power and electricity bill payment. The
Chapter – VII A case of power tariff hike w.r.to. Indal (Hindalco)
206
following are the distinctive factors pertaining to INDAL, which differentiates a
consumer as mentioned in section 29 (3) of ERC Act 1998.
1. INDAL was a bulk consumer of energy with a monthly consumption of
more than 20 million units. Company was paying an electricity bill of
Rs. 6.75 to 7 Crores per month.
2. INDAL was a steady consumer of power with a load factor above 95 %
which was the highest achieved figure among similar industries in the
state. Since INDAL’s main raw material was electricity and
electrochemical reduction of alumium was a continuous operation,
uninterrupted supply of electricity was essential.
3. INDAL’s power factor (PF) was almost unity which is in proof of
energy efficient and operation and maintenance of load as well as
electrical system
4. Since INDAL was paying monthly charges to the tune of 6.75 to 7
Crores against a single bill, KSEB’s revenue collection expenditure was
negligible compared to the situation when KSEB diverts the same
quantum of power to LT users or other small industrial units.
5. During monsoon period, except Idukki and Sabarigiri reservoirs, all
other storage dams start overflowing and the overflowing water wasted
and ultimately reach Arabian Sea. This is due to insufficient storage
capacity or reservoir capacity of Hydel projects. During such period of
continuous rain, if a consumer like INDAL is present in the system
KSEB would be able to generate income by making use of the
opportunity.
6. Disappearance of major loads like alumium smelter would adversely
affect grid the management of state grid.
The sole intention of reforms in electricity sector by the enactment of ERC
Act 1998 or Electricity Act 2003 is to give due weightage to the factors mentioned
above in a rational manner and thus evaluate the overall economic impact of
Chapter – VII A case of power tariff hike w.r.to. Indal (Hindalco)
207
exorbitant hike of electricity tariff as it would be permanent loss to the State’s
economy besides several socio-political issues.
Figure No. 7.5
Tariff hike imposed on EHT consumers during 1997-2002
Source: HT&EHT Industrial Electricity Consumers Association, Productivity
Council,Kalamassery
7.5 Present status
Frustrated by the indifferent attitude of the KSEB and Government to
consider the genuine demands of the company and its workforce, the company had to
seek alternate source to procure electricity to maintain its smelting operations at
Alupuram. Finding it impossible to continue the smelting operations using grid
power, the Company approached the Power Trading Corporation of India Limited, a
Central Government Undertaking (for short PTCIL) who offered to supply power at
the interconnection point of Kerala grid with Southern Region Transmission System
in the State of Kerala for Rs.2.50 paise per kWh. The Company had entered into an
understanding with PTCIL who offered to supply 30 MW firm power at the rate of
Rs.2.50 per kWh for a period up to 31 May 2004. Subsequently, the Company
1.12
1.521.66
1.87
2.40
2.90
3.40
0.0
0.5
1.0
1.5
2.0
2.5
3.0
3.5
4.0
Jan 97 Feb 97 Feb 98 Feb 99 May 99 'Aug 01 Oct-02
Tariff in Rs./Unit
Chapter – VII A case of power tariff hike w.r.to. Indal (Hindalco)
208
Management approached the K.S.E Board for transmission of 30 MW of firm power
(round the clock) to be delivered at the point of interconnection between Kerala
Transmission System and Southern Region Transmission System. Representations
made to the Government and Board were not fruitful and the KSEB wanted the
Company to take up the matter before the Kerala State Electricity Regulatory
Commission. The Kerala State Electricity Regulatory Commission had conducted a
hearing on 2 September 2003 on Company’s petition to wheel power from PTC. The
KSERC allowed wheeling of 30 MW power from outside the state through PTC by a
landmark order on 14 January 2004. (Annexure-IV, KSERC Order dated 14 January
2004)
The above order is regarded as the first of its kind in the whole country
allowing open access (ie. Wheeling of power for the use of a consumer using
KSEB’s transmission lines) to a private company. The Board raised several
objections against allowing wheeling to INDAL, but the Regulatory Commission has
allowed open access to INDAL rejecting KSEB’s arguments.
In section 3.1 (Findings of Commission) of the above order, the Commission
Stated the following:
“3.1 - Indal has closed down the smelter plant with effect from 1.8.2003 and
reduced its power intake from 30 MW to 5 MW. This development is a matter of
serious concern to the Commission as the KSE Board has lost a major industrial
consumer and it will further aggravate the already strained finances of the KSEB.
The reduction in revenue collection by the KSEB on account of the closure of
smelter plant is estimated to be around Rs. 5.5 Crores per month on an average.
The average realization from Indal was Rs. 3.38 per kWh excluding electricity duty
of Ps. 1/kWh and surcharge of Ps. 2.5 per kWh. The present level average
realization by KSEB per kWh of energy sold is Rs. 2.96. Therefore the loss to
KSEB due to the closure of Indal or grant of permission to Indal for availing
power from PTC as requested in the petition of Indal would be Ps 42 per kWh of
the energy consumption of the smelter plant. The KSEB has not indicated any
Chapter – VII A case of power tariff hike w.r.to. Indal (Hindalco)
209
strategy to deal with the situation arising out of the closure of Indal, even though
the Commission had made a specific reference to the Board in this regard”
In section 3.5.2 of the wheeling order, the Regulatory Commission has
further stated the following:
“3.5.2 The Commission recognizes the fact that in deciding the various charges
related to the import of 30 MW power by Indal, it has to strike a balance between
two conflicting interests. Any adverse effect on the finances of the KSEB due to
the transaction is detrimental to power development in the State. The continued
closure of the smelter plant and the subsequent total closure of Indal would
adversely affect the climate for industrial development with consequent setback to
power development in the State. This is especially so, since the industrial
consumption in the State is gradually coming down. The Commission firmly
believes that it is impossible to sustain power development without industrial
development”
It is clear from the above observations of the Regulatory Commission that
KSEB was not serious about the impact of closure of INDAL - one of the major
industrial consumers in the State - and the Board has not framed any strategy to deal
with the adverse impact on industrial power consumption in the state consequent to
the closure of INDAL’s smelter.
Unfortunately, Company could not avail PTC power due to the fact that PTC
had expressed their inability to supply power @ Rs 2.50 per unit as promised earlier
due to the grim power situation in southern states caused mainly due to declaration of
free power for agricultural sector by states like Andhra Pradesh and Tamil Nadu.
As mentioned earlier, after the de-energisation of Smelter on 1 August 2003,
the company rendered the surplus 343 permanent employees on ‘stay home’ paying
full salary, annual bonus and all other benefits including medical reimbursements.
The Government of Kerala constituted a high level committee called ‘Hindalco
Committee’ comprising of Ministers of Industries and Labour, Chairman KSEB,

Chapter – VII A case of power tariff hike w.r.to. Indal (Hindalco)
210
Principal Secretaries of Power and Industries, Labour Commissioner, Trade Union
and political leaders and representatives of Company Management. After several
deliberations, the Hindalco committee concluded in the month of May 2008 that re-
energisation of Alupuram smelter would not be feasible as there is no grid power
available at economically viable rates either from within the state or from outside the
state through wheeling at rates affordable for smelting operations. Hence the
committee requested management to submit alternatives. The company management
proposed expansion of extrusion plant by adding one more extrusion press and
thereby increase extrusion production from the present level of 1000 TPM to 2000
TPM. The casting plant, which supplies aluminium billets to extrusion plant, also
will be augmented to gear up increase in billet production. A conciliation agreement
to this effect was executed between Management and Trade Unions in the presence
of Labour Commissioner on 30 May 2008. However, due to the long pending issues
with KSEB and Government, the implementation of the above mentioned agreement
was done only on 1 June 2009. Even though the original number of permanent
workmen rendered surplus and put on stay home with full wages and other benefits
on 1 August 2003 was 343, due to retirement and optional VRS, the number has
come down nearly 200. As per the terms of the conciliation agreement executed on
30 May 2008, company has created a reserve pool of 85 workmen under ‘stay home’
(with wages and other benefits) for the proposed expansion of extrusion plant and
remaining people opted for voluntary retirement.
The company is in the process of inviting bids for the proposed expansion of
extrusion business at Alupuram, but a final decision to commence the project would
be taken after evaluating the market conditions so that the new capital investment
should not affect the overall viability of the present business.
7.6 Socio-economic impact of closure of smelter consequent to
tariff hike
When INDAL’s Alupuram Smelter was working in full swing and
manufacturing primary alumium smelter in its full capacity of 21500 TPA, the total
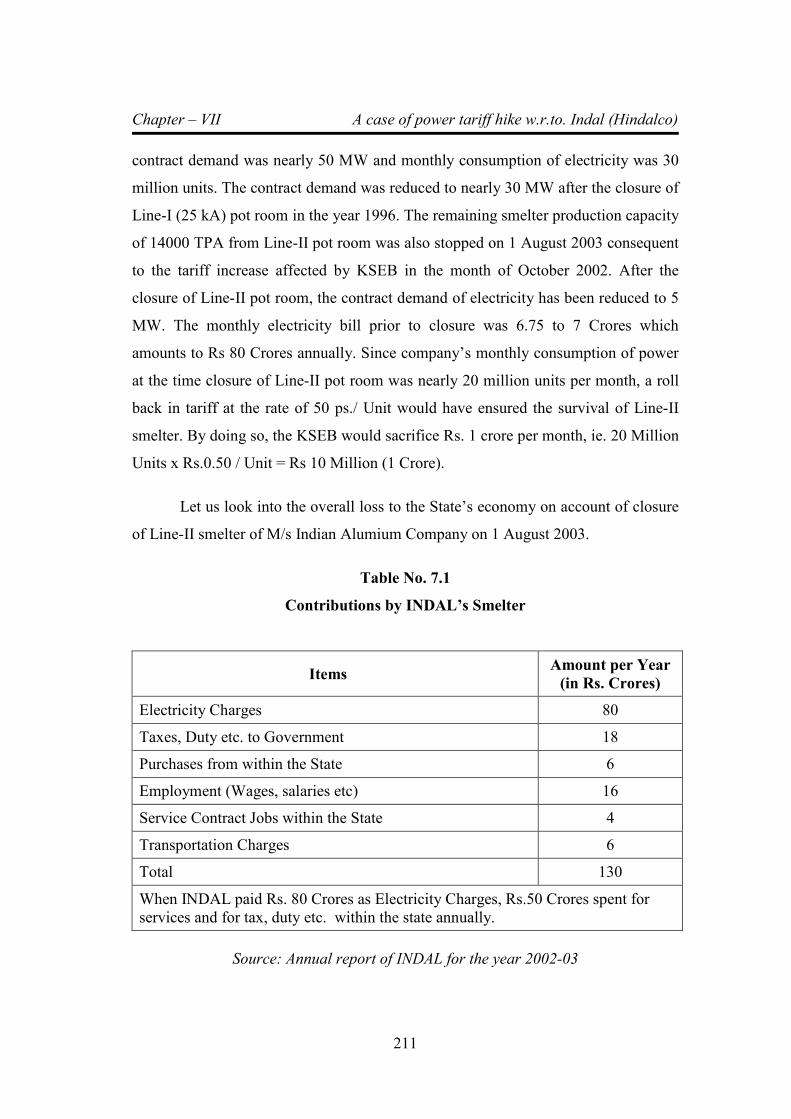
Chapter – VII A case of power tariff hike w.r.to. Indal (Hindalco)
211
contract demand was nearly 50 MW and monthly consumption of electricity was 30
million units. The contract demand was reduced to nearly 30 MW after the closure of
Line-I (25 kA) pot room in the year 1996. The remaining smelter production capacity
of 14000 TPA from Line-II pot room was also stopped on 1 August 2003 consequent
to the tariff increase affected by KSEB in the month of October 2002. After the
closure of Line-II pot room, the contract demand of electricity has been reduced to 5
MW. The monthly electricity bill prior to closure was 6.75 to 7 Crores which
amounts to Rs 80 Crores annually. Since company’s monthly consumption of power
at the time closure of Line-II pot room was nearly 20 million units per month, a roll
back in tariff at the rate of 50 ps./ Unit would have ensured the survival of Line-II
smelter. By doing so, the KSEB would sacrifice Rs. 1 crore per month, ie. 20 Million
Units x Rs.0.50 / Unit = Rs 10 Million (1 Crore).
Let us look into the overall loss to the State’s economy on account of closure
of Line-II smelter of M/s Indian Alumium Company on 1 August 2003.
Table No. 7.1
Contributions by INDAL’s Smelter
Items Amount per Year
(in Rs. Crores)
Electricity Charges 80
Taxes, Duty etc. to Government 18
Purchases from within the State 6
Employment (Wages, salaries etc) 16
Service Contract Jobs within the State 4
Transportation Charges 6
Total 130
When INDAL paid Rs. 80 Crores as Electricity Charges, Rs.50 Crores spent for
services and for tax, duty etc. within the state annually.
Source: Annual report of INDAL for the year 2002-03

Chapter – VII A case of power tariff hike w.r.to. Indal (Hindalco)
212
From the table No.7.1 it can be seen that INDAL was contributing to the
Government exchequer Rs. 18 Crores per annum by way of taxes and duties. In
addition to that, Government is also benefited by at least a portion other payments
made to employees, suppliers, service contractors, transporting companies etc by
way of downstream economic activities. The amount disbursed to the above groups
will automatically trickle down to the various sections of the society. When INDAL
was working in full swing the total strength of permanent workmen was 1091, which
has now come down to 350 on account of closure of two major plants (Line-I and
Line-II pot rooms). The total number of staff members has come down during the
said period from 300 to 75. Similarly the total number of casual, temporary and
contract workmen has also reduced from 200 to 50. There is a substantial reduction
in number of indirect employment also which is not quantified here.
If we go by the merit and rationale of overall impact to the State economy,
we can infer that, if the Government and KSEB had allowed a roll-back in tariff to
the tune of 50 ps./Unit as requested by the company (which is equivalent to Rs. 1
Crore per month), the closure of smelter could have been avoided. By doing so, the
direct revenue loss to the KSEB would be Rs. 12 per annum (without looking at the
benefits to the KSEB in retaining a bulk consumer like INDAL within its grip as
mentioned in section 7.4), but the Government could have saved Rs 18 Crores to the
exchequer in terms of taxes and duties. In addition to above all, by avoiding closure,
the plight of the affected stakeholders like employees (who lost the job), suppliers
(who lost orders), transporters (who lost transport contract), service contractors (who
lost service jobs), contract workmen (who lost job) and other indirectly employed
workmen could have been avoided.
As per the Government Order (G.O.(Rt) No. 163/03/03/PD), the relief was
granted to INDAL for a period of three months (Refer Annexure – II) after detailed
consideration by the Government in view of the probable plight of employees and
workforce in case company shuts down its smelting operations. That means,
Chapter – VII A case of power tariff hike w.r.to. Indal (Hindalco)
213
Government got convinced that relief in tariff was essential to sustain operations. But
there was no Government will to extend the relief, which was granted on the basis of
merit, for further periods. Even after agreeing in principle that there is a potential
threat on the future of employees and workforce and the management is left with no
option other than closing down smelter, there was no concerted move by the
Government or KSEB to extend relief or to allow tariff incentives or roll-back in
tariff to make the operation of smelter economically viable and thereby ensure its
survival.
After the permanent closure of smelters, INDAL (Hindalco) disposed off
most of the equipment and facilities of pot rooms including electrolytic reduction
cells. In this context, it is worth mentioning here that, as per the present capital
investment norms, the amount required to set up such a new smelting facility would
be approximately 450 to 500 Crores including new power plant.
7.7 Conclusion
This case study on INDAL is classical example to demonstrate the illogical,
adhoc and arbitrary decisions taken by the Board during the pre-regulatory period.
During that period, there was no mechanism in place with the decision makers in the
Government and bureaucracy to study the impact of such hike in tariff on the
industries and society in general and state’s economy in particular. No system was
there with the Government to assess the direct and indirect losses likely to be
suffered on account of sudden closure of a factory due to oppressive hike in tariff.
No study was conducted by KSEB prior to tariff hikes to assess the potential losses
in various areas like revenue earnings, opportunity loss, load management issues etc
in the event of closure of a major consumer like Indian Alumium Company Limited.
It is imperative to note that no tariff hike was imposed upon EHT Industrial
consumers till date right from the inception of Kerala State Electricity Regulatory
Commission in November 2002. That means there was no hike for the last 8 and
more years. The tariff of EHT Industrial consumers revised by KSEB is still in force.
The KSERC has allowed power factor incentive and rationalized ToD tariff in
Chapter – VII A case of power tariff hike w.r.to. Indal (Hindalco)
214
between and which in turn has resulted in marginal reduction of EHT tariff. This is
more than sufficient to prove that the hike in tariff imposed upon HT/EHT
consumers during the period from January 97 to October 2002 was oppressive and
arbitrary.
It can be concluded that, the closure of Indian Alumium Company Limited,
Alupuram Smelter (INDAL – Presently known as Hindalco Industries Limited) is a
permanent loss to the industrial, power and socioeconomic sectors of Kerala State.
Chapter – VIII The impact of regulatory regime in Kerala: An analysis
215
CHAPTER – 8
THE IMPACT OF REGULATORY REGIME IN KERALA:
AN ANALYSIS
8.1 Introduction
The Kerala State Electricity Regulatory Commission (KSERC) was
constituted under the provisions of Subsection (1) of Section 17 of the Electricity
Regulatory Commissions Act, 1998. With effect from 10th June, 2003, the
Commission has come under the purview of the Electricity Act, 2003, as the
Electricity Regulatory Commissions Act, 1998 has since been repealed. The
Commission was constituted vide Government of Kerala Order (Ms) No.34/2002/PD
dated 14 November, 2002 notified in the Govt. of Kerala Gazette, Extra Ordinary
dated 18 November, 2002. The Kerala State Electricity Regulatory Commission is a
body corporate having perpetual succession and a common seal, with power to
acquire, hold and dispose of property, both movable and immovable, and to contract
and shall, by the said name, sue or be sued. In addition, the Commission is a quasi-
judicial body. With effect from 10 June, 2003, the Commission has come under the
purview of the Electricity Act, 2003, as the Electricity Regulatory Commissions Act,
1998 has since been repealed.
The Commission consists of Chairman and two Members. In recognition of
the need for multi-disciplinary approach while addressing issues related to
independent regulation, the statute prescribes that the Chairman and Members shall
be persons of ability, integrity and standing who have adequate knowledge of, and
having shown capacity in, dealing with problems relating to engineering, finance,
commerce, economics, law or management. The Chairman and Members are
appointed by the Government of Kerala on the recommendation of a selection
committee constituted by the State Government as prescribed under the statute. The
statute also provides for the appointment of a Secretary, functioning under the
Commission, whose powers and duties are defined by the Commission.
Chapter – VIII The impact of regulatory regime in Kerala: An analysis
216
In this chapter, an attempt is made to analyse the impact of electricity
regulatory regime in Kerala in areas like ARR approval, industrial tariff, financial
performance of KSEB, T&D loss, Scheduling and generation, power purchase etc.
The compliance of KSEB and KSERC in meeting the key provisions of Electricity
Act 2003, National Power Policy and National Tariff Policy in meeting the
requirements of Industrial Consumers in the State of Kerala also will be studied. The
period of study in this chapter is from the inception of KSERC in 2002 to 2010. We
can find from following sections that the KSERC has shown at maximum prudence
in the analysis of KSEB’s tariff petitions and has questioned the merit of each and
every demands put forward by the Board. The analysis of ARR & ERC by KSERC
for the year 2010-11 has been taken as a typical case for analysis and at the same the
regulatory intervention by the Commission for the period from 2002 to 2010 is also
analysed.
8.2 Summary of ARR&ERC approvals done by the Commission
The Kerala State Electricity Board (hereinafter referred to as KSEB or the
Board) in accordance with the KSERC (Tariff) Regulations 2003, filed the
Aggregate Revenue Requirements (ARR) and the Expected Revenue from Charges
(ERC) for FY 2010-11 before the Commission on 24-12-2009. Prior to filing of the
petition, the Board had sought extension of time for filing the petition till 31-12-
2009, and the Commission after considering the request had allowed time till 24-12-
2009. In the petition the Board has proposed a record revenue gap of Rs.2219.60
crore and no proposal was made for bridging such a large revenue gap. The
Commission directed the Board to file the proposal for bridging the revenue gap and
the Board expressed reluctance raising certain reasons. Therefore the Commission
admitted the petition on 15-1-2010 to avoid further delay. The Commission so far
has issued six Orders on ARR & ERC of the Board starting from 2003-04 as shown
below (Table8.1)
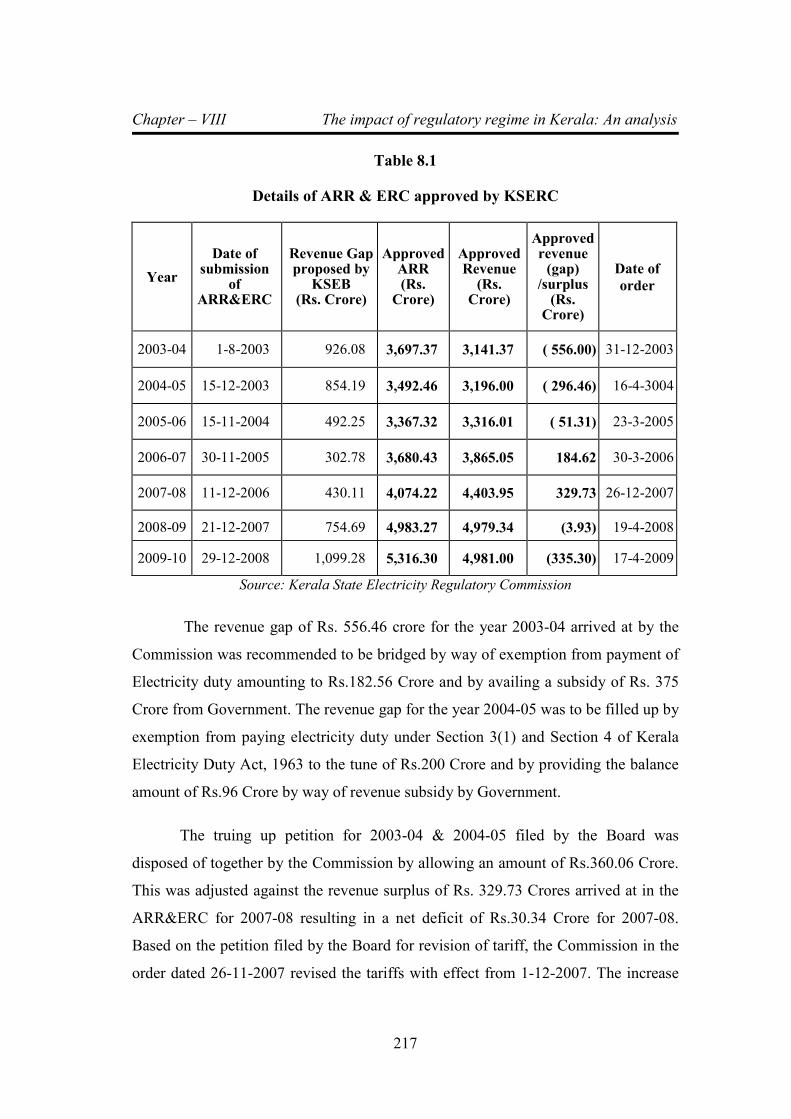
Chapter – VIII The impact of regulatory regime in Kerala: An analysis
217
Table 8.1
Details of ARR & ERC approved by KSERC
Year
Date of submission
of ARR&ERC
Revenue Gap proposed by
KSEB (Rs. Crore)
Approved ARR (Rs.
Crore)
Approved Revenue
(Rs. Crore)
Approved revenue
(gap) /surplus
(Rs. Crore)
Date of
order
2003-04 1-8-2003 926.08 3,697.37 3,141.37 ( 556.00) 31-12-2003
2004-05 15-12-2003 854.19 3,492.46 3,196.00 ( 296.46) 16-4-3004
2005-06 15-11-2004 492.25 3,367.32 3,316.01 ( 51.31) 23-3-2005
2006-07 30-11-2005 302.78 3,680.43 3,865.05 184.62 30-3-2006
2007-08 11-12-2006 430.11 4,074.22 4,403.95 329.73 26-12-2007
2008-09 21-12-2007 754.69 4,983.27 4,979.34 (3.93) 19-4-2008
2009-10 29-12-2008 1,099.28 5,316.30 4,981.00 (335.30) 17-4-2009
Source: Kerala State Electricity Regulatory Commission
The revenue gap of Rs. 556.46 crore for the year 2003-04 arrived at by the
Commission was recommended to be bridged by way of exemption from payment of
Electricity duty amounting to Rs.182.56 Crore and by availing a subsidy of Rs. 375
Crore from Government. The revenue gap for the year 2004-05 was to be filled up by
exemption from paying electricity duty under Section 3(1) and Section 4 of Kerala
Electricity Duty Act, 1963 to the tune of Rs.200 Crore and by providing the balance
amount of Rs.96 Crore by way of revenue subsidy by Government.
The truing up petition for 2003-04 & 2004-05 filed by the Board was
disposed of together by the Commission by allowing an amount of Rs.360.06 Crore.
This was adjusted against the revenue surplus of Rs. 329.73 Crores arrived at in the
ARR&ERC for 2007-08 resulting in a net deficit of Rs.30.34 Crore for 2007-08.
Based on the petition filed by the Board for revision of tariff, the Commission in the
order dated 26-11-2007 revised the tariffs with effect from 1-12-2007. The increase
Chapter – VIII The impact of regulatory regime in Kerala: An analysis
218
in revenue due to tariff revision was estimated as Rs.69.79 Crore for a full year and
Rs.23.26 Crore for the balance four months of 2007-08.
Against the revenue surplus of Rs.184.64 crore fixed in 2006-07, the
Commission directed the Board to file tariff revision proposal, however, the Board
did not file the same. The Commission finalized truing up for the year 2005-06 by
approving the revenue surplus of Rs.181.36 crore, which was adjusted against the
revenue gap of Rs.335.30 crore approved for the year 2009-10. The Commission
directed the Board to file appropriate proposals for tariff rationalization for 2009-10
and accordingly KSEB filed a tariff petition on 24-07-2009, for additional revenue of
Rs.150.86 crore on a yearly basis. Other major highlights of the proposal were (a)
introduction of non-telescopic tariff for domestic consumers, (b) 15% & 20%
increase in demand and energy charges respectively for HT Commercial class, (c)
25% increase in tariff for Bulk supply (BST) to Licensees and (d) reduction to the
tune of 10% of the tariff applicable to Kerala Water Authority (KWA). KSEB also
proposed to rationalize the ToD tariff applicable to HT/EHT consumers and
proposed a new ToD tariff for LT industrial consumers. The Commission in its order
dated 2-12-2009 rejected the proposal on rationalization/revision of tariff proposed
by KSEB for LT-I A(Domestic) and HT-IV (Commercial) since the proposals were
against the provisions of the Act and would entail a tariff shock for certain group of
consumers. Besides the Commission noticed that after the completion of pending
truing up proposals from 2006-07 onwards, the picture of deficit might change. The
Commission deferred the proposal on Bulk Supply Tariff to licensees. The
Commission revised the Time of Day Tariff for HT-EHT consumers to be effective
from 1-1-2010. Maximum demand based tariff was introduced for LT Industrial and
LT VII (A) & (C) consumers having connected load of 20 kW and above as an
optional scheme. With a view to staggering the peak time load demand, an optional
Time of Day tariff was also introduced for LT Industrial consumers who have opted
for a maximum demand based tariff and having 30 kVA contract demand or above.
Chapter – VIII The impact of regulatory regime in Kerala: An analysis
219
8.2.1 Procedural Overview
In the ARR for FY 2010-11, the Board has projected a revenue requirement
of Rs.7503.98 Crores and a revenue receipt of Rs. 5284.38 Crores thereby leaving a
revenue gap of Rs.2219.60 Crores. Since such a gap would entail increase in existing
tariff by about 46%, before admitting the petition, the Commission vide letter dated
2-1-2010 directed the Board to provide a detailed proposal on bridging the revenue
gap. The Commission also directed the Board to ascertain from the Government
whether subsidy if any is intended by the Government to avoid a steep tariff increase.
The Board in its reply stated that, filing a proposal on the revenue gap projected by
Board would be a futile exercise since in the past, the Commission had substantially
reduced the ARR proposed by the Board. Hence, appropriate measures like filing
tariff petition or seeking subsidy from the Government or to keep the revenue gap, as
regulatory asset will be taken once the Commission approves the ARR&ERC. The
Board also informed that, they had requested the Government to communicate the
decision, if any, on the provision of subsidy to the consumers. In the letter dated
29-1-2010, the Board further attempted to appraise the Commission on the issues on
revenue gap. According to the Board, the accounts of the Board are still being
prepared under Electricity (Supply) Annual Accounts Rules (ESAAR) - 1985 which
are being audited by C&AG. The actual revenue gap for various years has been
substantially higher than what has been approved by the Commission. It would be
difficult for the Board as a distribution licensee, to limit expenses especially for
power purchase cost. The Board further stated that it cannot propose on its own tariff
proposals under the provisions of the Act and conceded that they did not possess
necessary expertise to conduct studies on T&D loss reduction, improving efficiency
of generating stations, man power utilisation etc., as directed by the Commission.
Before taking up the ARR&ERC for 2010-11, the Commission expressed its
views on the reply given by the Board, which were communicated to the Board vide
letter dated 15-1-2010. The Commission was not in agreement with the contentions
of the Board on major issues such as proposal on bridging revenue gap and various
directions issued to the Board. According to the Commission, KSEB is a responsible

Chapter – VIII The impact of regulatory regime in Kerala: An analysis
220
public entity entrusted with the task of providing electricity at a reasonable cost to
the public. The Government at all levels is taking maximum effort to keep the entity
under public ownership. The Board has inherent obligation and duty to optimally
plan, develop and maintain the electricity system, and is expected to exercise such
functions in the most reasonable and efficient manner. KSEB has been consistently
projecting expenses more than what is optimally required for efficient service. Such
projections are placed before the public, without serious concern on its impact,
thereby revealing an unwholesome aspect of cost plus regime. In the absence of
proper and reliable estimates from KSEB, the Commission in the past was forced to
exercise its regulatory scrutiny to optimize, control and prune certain expenses. The
Commission was of the firm view that it was not bound to accept all the projections
of the Board without scrutiny. It was not the intention of the regulatory scrutiny to
scale down the expenses, which were over projected by the licensee (KSEB). In
actual terms, KSEB has failed to control the expenses at the approved level, notably
in areas where restraints have to be observed such as many items of revenue
expenditure, and reduced the expenditure much below the desired level in areas
where it was very much needed such as capital expenditure. Even after seven years
of regulatory regime in the State, the Commission has received no material on record
to establish that a professional body like KSEB has an internal mechanism to limit
the various expenses at the approved level and implement the capital programmes as
proposed. The Commission opined that, such an approach of the licensee (KSEB) in
not having a system or initiative to optimize the operations may render the regulatory
regime less effective in the State.
The Commission insisted on proposals for filling up the revenue gap of
Rs.2219.60 Crore as projected by the Board mainly on the reason that KSEB should
visualize and gauge the impact of such a huge revenue gap on 97 lakh consumers in
the State. According to the Commission, if KSEB proposes such a huge revenue gap,
it cannot shy away from its responsibility of proposing the means to bridge the
revenue shortfall through tariff revision or efficiency improvement or direct subsidy
from the government or a combination of all of these. As per the ARR&ERC for
Chapter – VIII The impact of regulatory regime in Kerala: An analysis
221
2010-11 projected by the Board, the average cost of supply was estimated to
Rs.5.06/kWh (Rupees five and paise six), which was much higher than the levels
existing elsewhere. KSERC in principle disagreed with KSEB’s practice to project
such a high level of expenditure, without proposals or attempts to plan and control
the expenses saying that Cost plus regulatory regime is not about passing on all costs
incurred by the utilities, but about prudently optimal and efficiently managed costs
being loaded on to the consumers.
Regarding the lack of expertise for the conduct of various studies, the
argument of the Board was surprising. If in a particular domain, expertise was not
available, either the expertise should be acquired or outsourcing to be resorted to.
Commission opined that the Board is not the only one electric utility in India and is
not required to reinvent the wheel. It can emulate the best practices adopted
elsewhere in the Country. There are several success stories reported on the
achievements in the power sector in India especially under public management.
Further, there is no dearth of expertise in the country. Already M/s. PFC Consulting
and others are helping the Board on re-organisation. In the past also Board has
benefited from the services of consultants. It was surprising to note that it took nearly
seven years since the directions have been issued, to understand its own the
limitations. Commission observed that the Board has to realize the cost of time and
should speed up the efforts. The Commission after considering all these aspects and
also the fact that the ARR&ERC for the year 2010-11 was delayed, decided to admit
the petition on 15-1-2010.
After admitting the petition, the Commission sought clarifications on various
issues on the petition from the Board vide letter dated 15-1-2010. The Board
provided its reply on 5-3-2010 after some delay. The Commission directed the Board
to publish the summary of the petition by giving time till 1-3-2010 for providing
comments by the Public and stakeholders. The Board published the summary of the
petition in the leading dailies.
Chapter – VIII The impact of regulatory regime in Kerala: An analysis
222
In the meanwhile, the Commission vide letter dated 10-1-2010 directed the
Board to submit truing up petitions for the years from 2006-07 to 2008-09. On the
request of the Board the Commission allowed time till 20-1-2010 for filing the
Truing up petition for 2006-07 and for other years till 31-1-2010. Further extension
of time was also given. As on date of this order, the petition for 2007-08 and 2008-09
were not yet filed. In its absence, the Commission could not take a considered view
on the exact position of revenue gap/surplus for the years till 2008-09. Hence
Commission ordered that the present order on ARR&ERC 2010-11 will be subjected
to the outcome of truing up exercise for the years 2006-07 to 2008-09.
8.3 Review of Capital Expenditure
8.3.1 Introduction
The Board has initiated a new interactive approach for identifying capital
projects in generation, transmission and distribution since 2008-09. Probable load
growth was projected based on the feedback received from stakeholders and in
consultation with elected people’s representatives certain projects were formulated.
An ambitious plan of capital expenditure for Rs.1377.70 Crores proposed in 2009-10
was revised by the Board to Rs.947.66 Crore. For the year 2010-11, capital
expenditure of Rs.995.15 Crores was proposed.
The capital expenditure for generation in 2009-10 and 2010-11 includes 9
ongoing projects viz., Kuttiyadi tail race, Kuttiyadi additional extension, Pallivasal
extension, Kuttiar diversion, Ranni-Perunad SHP, Thottiyar, Sengulam
Augmentation, Adyanpara SHP, and Poozhithodu SHP, with a total out lay for the
year 2009-10 and 2010-11 as Rs.113.70 Crore and Rs.124.26 crore respectively. Out
of the 6 tendered projects, 3 projects were under pre-qualification stage and two
other projects were already tendered. One project (Athirappally) was held up. The
total out lay for tendered projects for 2010-11 was Rs.22.65 crore.
In 2009-10, 8 projects were taken up for tendering which were in various
stages for which Rs.19.74 crore was earmarked for 2010-11. Another 14 projects

Chapter – VIII The impact of regulatory regime in Kerala: An analysis
223
were prioritized for approval (total 207MW to generate 592.02MU) during the year
2010-11 and 2011-12. Other capital works in generation include, capital works for
diesel projects BDPP/KDPP, renovation and modernization of hydro stations, survey
and investigation, revamping seismic network in Idukki region, mechanical
fabrication, civil R&D, construction of administrative complexes, and Dam safety
works etc., the total outlay for these works was Rs.284.34 crore.
In transmission, the projects planned for 2010-11 are 2 nos. of 220kV
substations, 19 nos. of 110kV substations, 6 nos. of 66kV substations and 19nos of
33 kV substations. Further 28.5 km of 220 kV lines, 138.8 km of 110 kV lines, 13.5
km of 66 kV lines and 138 km of 33 kV lines were also planned. In the petition, the
Board has committed that the financial viability of these projects will be submitted
by January 2010. Modernisation of Load Dispatch centre was another project
included as part of transmission.
In the distribution wing, Board was planning to provide 5 lakh connections
and to construct 3000 km of 11kV lines, 3800km of LT lines and installation of 5000
distribution transformers. 8 lakh faulty meters were also proposed for replacement in
2010-11.
The Board reported that APDRP scheme sanctioned by Government of India
for Rs.853.62 crore included 3 circle schemes (Rs.148.24 crore), 46 nos. of town
schemes (Rs.341.87 Crore) and 3 nos. of sub-transmission and distribution project
for cities (Rs.373.56 crore). These projects were either completed or short closed on
31-3-2009. The total allowable expenditure under APDRP is Rs.556.60 Crore. For
the completed schemes 25% of the amount will be provided as grant. The city
scheme (Thiruvananthapuram, Ernakulam and Kozhikode) envisages laying of 11kV
UG cables and installation of RMUs, compact secondary substations and
transformers. The expenditure up to 31-3-2009 under the city scheme was Rs.82.19
crore. Balance work under the project was planned to be completed using Board’s
own funds.
Chapter – VIII The impact of regulatory regime in Kerala: An analysis
224
The Board obtained sanction for implementing RAPDRP scheme during 11th
five-year plan from Government of India. The project is proposed to be implemented
in 43 towns. Part A of the project consists of establishment of IT infrastructure and
part B consists of distribution infrastructure. As part of Part A, project worth
Rs.288.33 crore was forwarded and Rs.241.39 crore is expected from the
Government of India and balance Rs.76.04 crore to be met from Own fund. If the
project is implemented in time, the complete funding under Part A will be converted
as grant.
As part of RGGVY projects for all districts are under preparation. Revised
DPRs for southern districts such as Thiruvananthapuram, Kollam, Pathanamthitta,
Alappuzha, Kottayam, Ernakulam and Thrissur are being submitted for REC
approval.
8. 3.2 Analysis
The KSERC in the previous Orders had mentioned the lack of progress in
capital expenditure programmes. The Board has been submitting the investment
proposal as part of the annual budget, without providing the scheme-wise details or
viability studies. The information provided by the Board even after several queries
was incomplete and hence which was not useful for continuous monitoring of the
projects. Hence, project monitoring and evaluation could not be taken up effectively.
The Commission on several occasions had made it clear that for the approval of the
investment plan, project-wise details with necessary information on the viability of
the project need to be submitted. In the ARR petition, the Board stated that scheme-
wise details with DPR would be submitted by February 2010 and Chief Engineer
Planning was entrusted with the task. However, the information was provided by the
Board only on 24-4-2010, which KSERC could not be evaluated.
The KSERC noted that the Board was following a strategy of projecting the
capital expenditure initially high, which was later scaled down successively. The
Board has proposed Rs.1022.38 Crore in the ARR for 2007-08, which was revised to
Rs.956.17 Crore subsequently. Similarly, for the year 2008-09, Rs.1145 Crore was
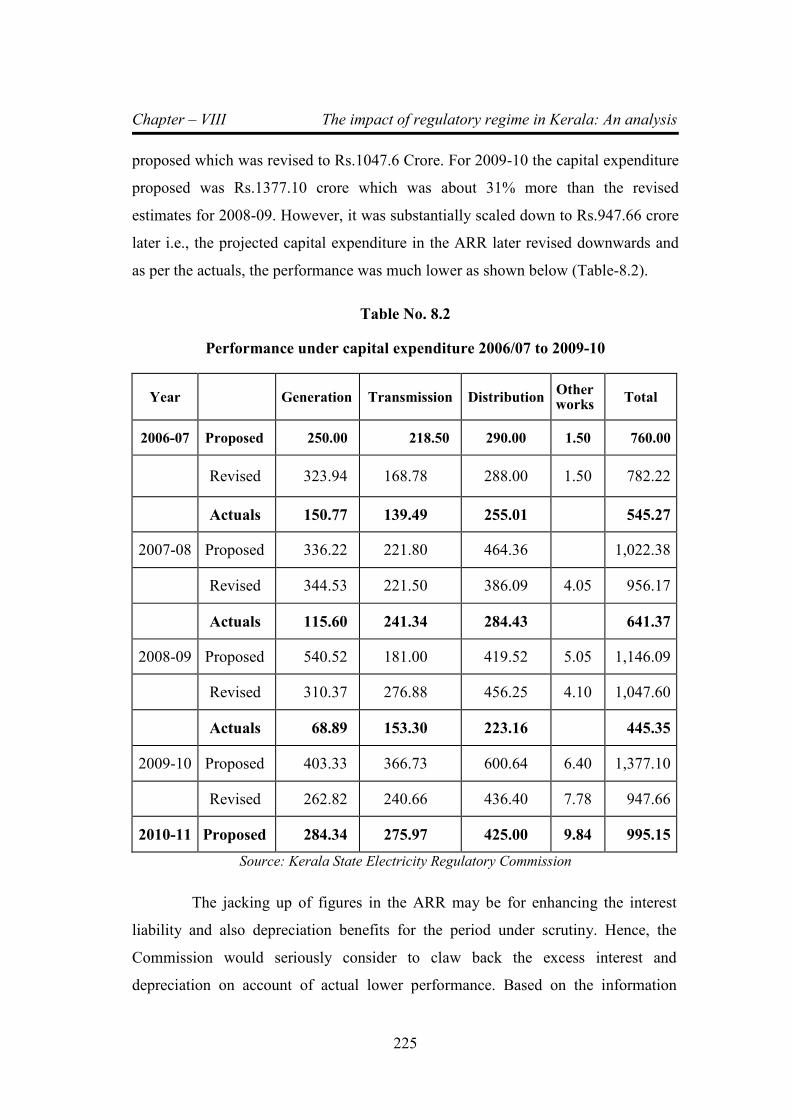
Chapter – VIII The impact of regulatory regime in Kerala: An analysis
225
proposed which was revised to Rs.1047.6 Crore. For 2009-10 the capital expenditure
proposed was Rs.1377.10 crore which was about 31% more than the revised
estimates for 2008-09. However, it was substantially scaled down to Rs.947.66 crore
later i.e., the projected capital expenditure in the ARR later revised downwards and
as per the actuals, the performance was much lower as shown below (Table-8.2).
Table No. 8.2
Performance under capital expenditure 2006/07 to 2009-10
Year Generation Transmission Distribution Other works
Total
2006-07 Proposed 250.00 218.50 290.00 1.50 760.00
Revised 323.94 168.78 288.00 1.50 782.22
Actuals 150.77 139.49 255.01 545.27
2007-08 Proposed 336.22 221.80 464.36 1,022.38
Revised 344.53 221.50 386.09 4.05 956.17
Actuals 115.60 241.34 284.43 641.37
2008-09 Proposed 540.52 181.00 419.52 5.05 1,146.09
Revised 310.37 276.88 456.25 4.10 1,047.60
Actuals 68.89 153.30 223.16 445.35
2009-10 Proposed 403.33 366.73 600.64 6.40 1,377.10
Revised 262.82 240.66 436.40 7.78 947.66
2010-11 Proposed 284.34 275.97 425.00 9.84 995.15
Source: Kerala State Electricity Regulatory Commission
The jacking up of figures in the ARR may be for enhancing the interest
liability and also depreciation benefits for the period under scrutiny. Hence, the
Commission would seriously consider to claw back the excess interest and
depreciation on account of actual lower performance. Based on the information

Chapter – VIII The impact of regulatory regime in Kerala: An analysis
226
provided by the Board over the years, the physical progress in the generation sector
is analysed below (Table 8.3):
Table No. 8.3
Status of Ongoing Projects
Capacity Target date
Hydel schemes
As per Five year plan
As per 2008/09 ARR
As per 2009-10 ARR
Kuttiyadi tail race 3.75MW 2007-08 Nov.2008
Commissioned 1
st unit on
9-11-2008 and 22-10-09
Neriamangalam Extn 25MW 2007-08 May-08 22-5-2008
Kuttiyadi Addl Extn 100 MW 2007-08 May-09 Mar-10
Azhutha Diversion 57MU 2006-07 Apr-07 May 2007
Kuttiyar Diversion 37MU 2007-08 Jun-07 Jun-09
Source: Kerala State Electricity Regulatory Commission
All the on going projects are delayed beyond the initial target dates. As per
the information available, 3 projects have been completed now. The cost due to
delay in commissioning the projects is the additional cost of power purchase
necessitated, which needs to be imposed on the Board as penalty. The Commission
will be addressing this issue separately.
The Commission’s observation on Baitarni Coal block and the proposed
Cheemeni Power project was that without even a prefeasibility report, no evaluation
of the project would be possible.
The achievements in transmission and distribution sector were very low as
per the five-year plan targets as shown below (Table No.8.4):
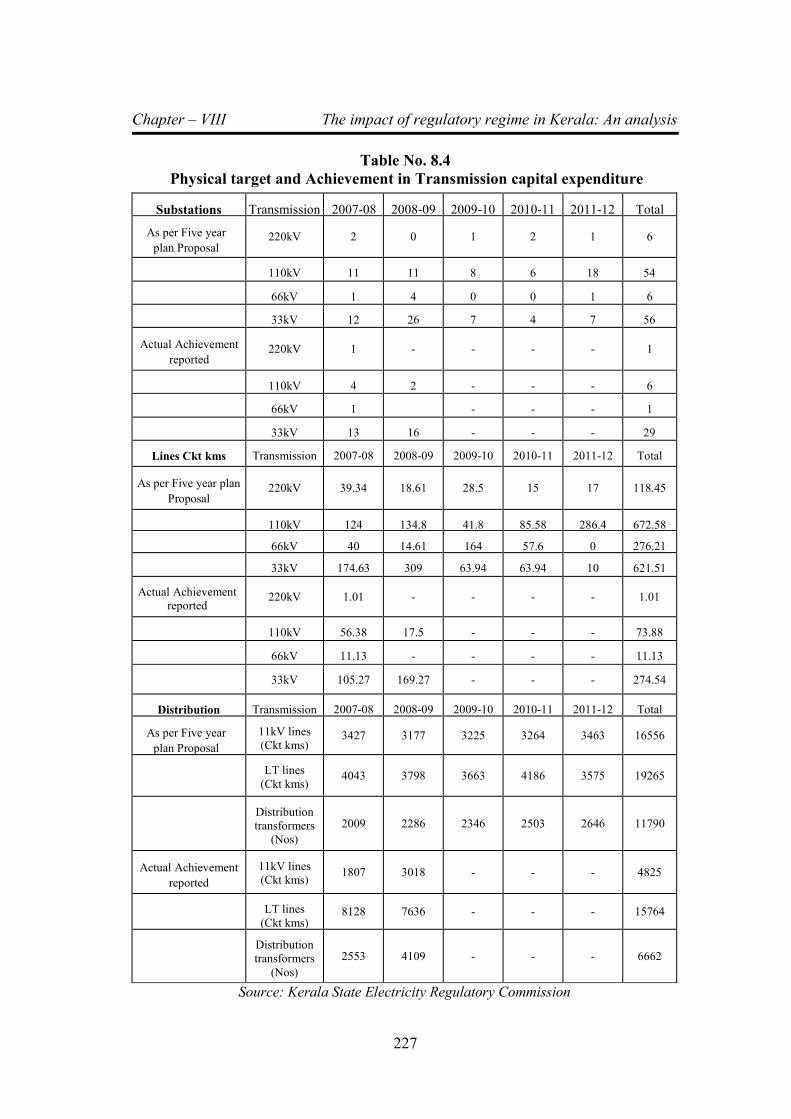
Chapter – VIII The impact of regulatory regime in Kerala: An analysis
227
Table No. 8.4
Physical target and Achievement in Transmission capital expenditure
Substations Transmission 2007-08 2008-09 2009-10 2010-11 2011-12 Total
As per Five year
plan Proposal 220kV 2 0 1 2 1 6
110kV 11 11 8 6 18 54
66kV 1 4 0 0 1 6
33kV 12 26 7 4 7 56
Actual Achievement
reported 220kV 1 - - - - 1
110kV 4 2 - - - 6
66kV 1 - - - 1
33kV 13 16 - - - 29
Lines Ckt kms Transmission 2007-08 2008-09 2009-10 2010-11 2011-12 Total
As per Five year plan
Proposal 220kV 39.34 18.61 28.5 15 17 118.45
110kV 124 134.8 41.8 85.58 286.4 672.58
66kV 40 14.61 164 57.6 0 276.21
33kV 174.63 309 63.94 63.94 10 621.51
Actual Achievement
reported 220kV 1.01 - - - - 1.01
110kV 56.38 17.5 - - - 73.88
66kV 11.13 - - - - 11.13
33kV 105.27 169.27 - - - 274.54
Distribution Transmission 2007-08 2008-09 2009-10 2010-11 2011-12 Total
As per Five year
plan Proposal
11kV lines
(Ckt kms) 3427 3177 3225 3264 3463 16556
LT lines
(Ckt kms) 4043 3798 3663 4186 3575 19265
Distribution
transformers
(Nos)
2009 2286 2346 2503 2646 11790
Actual Achievement
reported
11kV lines
(Ckt kms) 1807 3018 - - - 4825
LT lines
(Ckt kms) 8128 7636 - - - 15764
Distribution
transformers
(Nos)
2553 4109 - - - 6662
Source: Kerala State Electricity Regulatory Commission
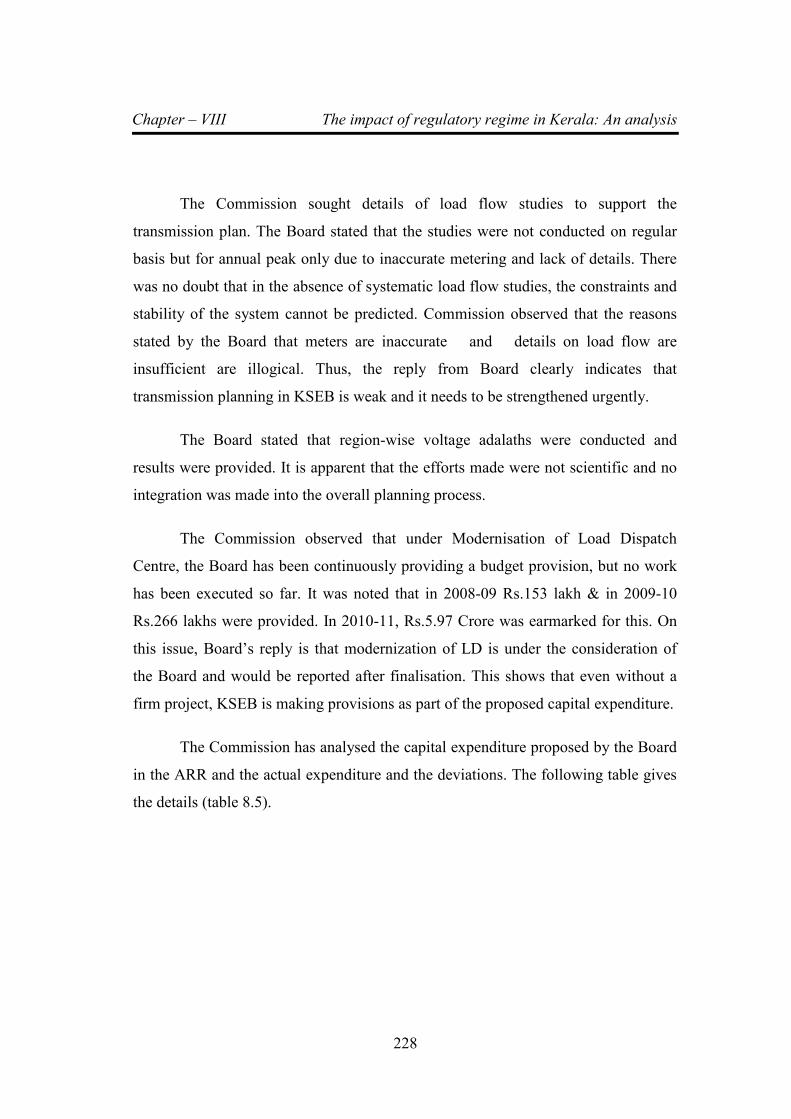
Chapter – VIII The impact of regulatory regime in Kerala: An analysis
228
The Commission sought details of load flow studies to support the
transmission plan. The Board stated that the studies were not conducted on regular
basis but for annual peak only due to inaccurate metering and lack of details. There
was no doubt that in the absence of systematic load flow studies, the constraints and
stability of the system cannot be predicted. Commission observed that the reasons
stated by the Board that meters are inaccurate and details on load flow are
insufficient are illogical. Thus, the reply from Board clearly indicates that
transmission planning in KSEB is weak and it needs to be strengthened urgently.
The Board stated that region-wise voltage adalaths were conducted and
results were provided. It is apparent that the efforts made were not scientific and no
integration was made into the overall planning process.
The Commission observed that under Modernisation of Load Dispatch
Centre, the Board has been continuously providing a budget provision, but no work
has been executed so far. It was noted that in 2008-09 Rs.153 lakh & in 2009-10
Rs.266 lakhs were provided. In 2010-11, Rs.5.97 Crore was earmarked for this. On
this issue, Board’s reply is that modernization of LD is under the consideration of
the Board and would be reported after finalisation. This shows that even without a
firm project, KSEB is making provisions as part of the proposed capital expenditure.
The Commission has analysed the capital expenditure proposed by the Board
in the ARR and the actual expenditure and the deviations. The following table gives
the details (table 8.5).
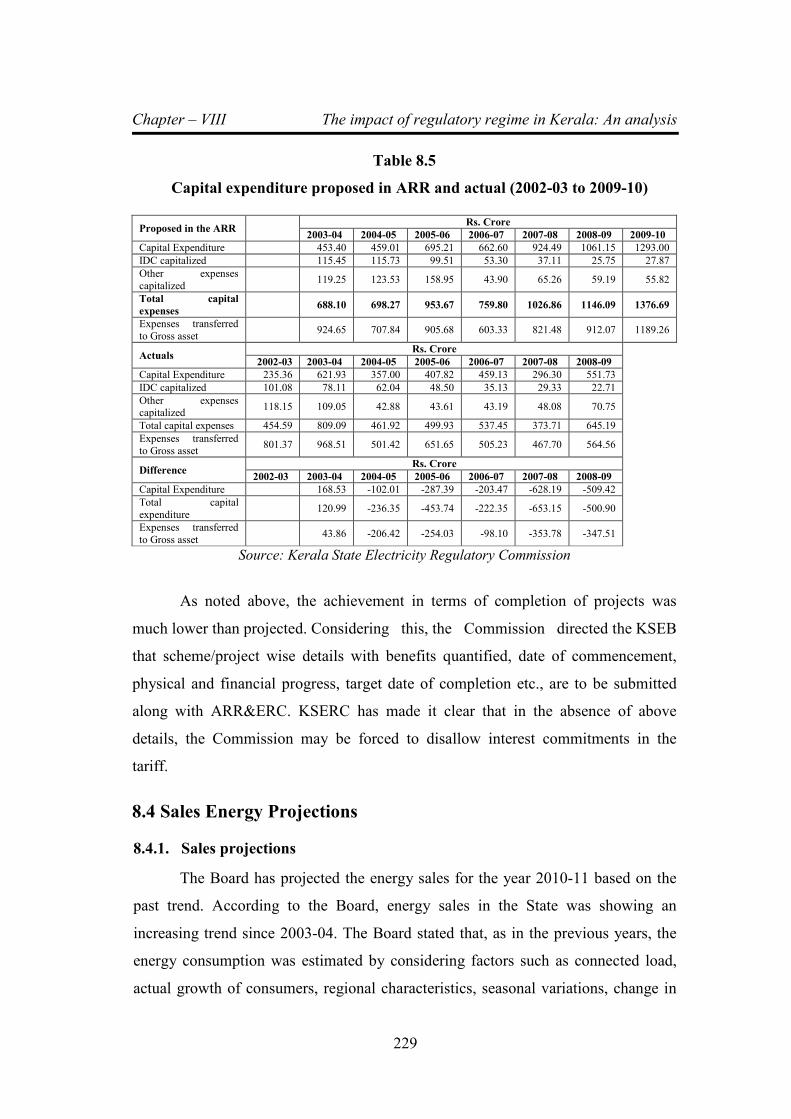
Chapter – VIII The impact of regulatory regime in Kerala: An analysis
229
Table 8.5
Capital expenditure proposed in ARR and actual (2002-03 to 2009-10)
Proposed in the ARR Rs. Crore
2003-04 2004-05 2005-06 2006-07 2007-08 2008-09 2009-10
Capital Expenditure 453.40 459.01 695.21 662.60 924.49 1061.15 1293.00
IDC capitalized 115.45 115.73 99.51 53.30 37.11 25.75 27.87
Other expenses
capitalized 119.25 123.53 158.95 43.90 65.26 59.19 55.82
Total capital
expenses 688.10 698.27 953.67 759.80 1026.86 1146.09 1376.69
Expenses transferred
to Gross asset 924.65 707.84 905.68 603.33 821.48 912.07 1189.26
Actuals Rs. Crore
2002-03 2003-04 2004-05 2005-06 2006-07 2007-08 2008-09
Capital Expenditure 235.36 621.93 357.00 407.82 459.13 296.30 551.73
IDC capitalized 101.08 78.11 62.04 48.50 35.13 29.33 22.71
Other expenses capitalized
118.15 109.05 42.88 43.61 43.19 48.08 70.75
Total capital expenses 454.59 809.09 461.92 499.93 537.45 373.71 645.19
Expenses transferred
to Gross asset 801.37 968.51 501.42 651.65 505.23 467.70 564.56
Difference Rs. Crore
2002-03 2003-04 2004-05 2005-06 2006-07 2007-08 2008-09
Capital Expenditure 168.53 -102.01 -287.39 -203.47 -628.19 -509.42
Total capital
expenditure 120.99 -236.35 -453.74 -222.35 -653.15 -500.90
Expenses transferred
to Gross asset 43.86 -206.42 -254.03 -98.10 -353.78 -347.51
Source: Kerala State Electricity Regulatory Commission
As noted above, the achievement in terms of completion of projects was
much lower than projected. Considering this, the Commission directed the KSEB
that scheme/project wise details with benefits quantified, date of commencement,
physical and financial progress, target date of completion etc., are to be submitted
along with ARR&ERC. KSERC has made it clear that in the absence of above
details, the Commission may be forced to disallow interest commitments in the
tariff.
8.4 Sales Energy Projections
8.4.1. Sales projections
The Board has projected the energy sales for the year 2010-11 based on the
past trend. According to the Board, energy sales in the State was showing an
increasing trend since 2003-04. The Board stated that, as in the previous years, the
energy consumption was estimated by considering factors such as connected load,
actual growth of consumers, regional characteristics, seasonal variations, change in
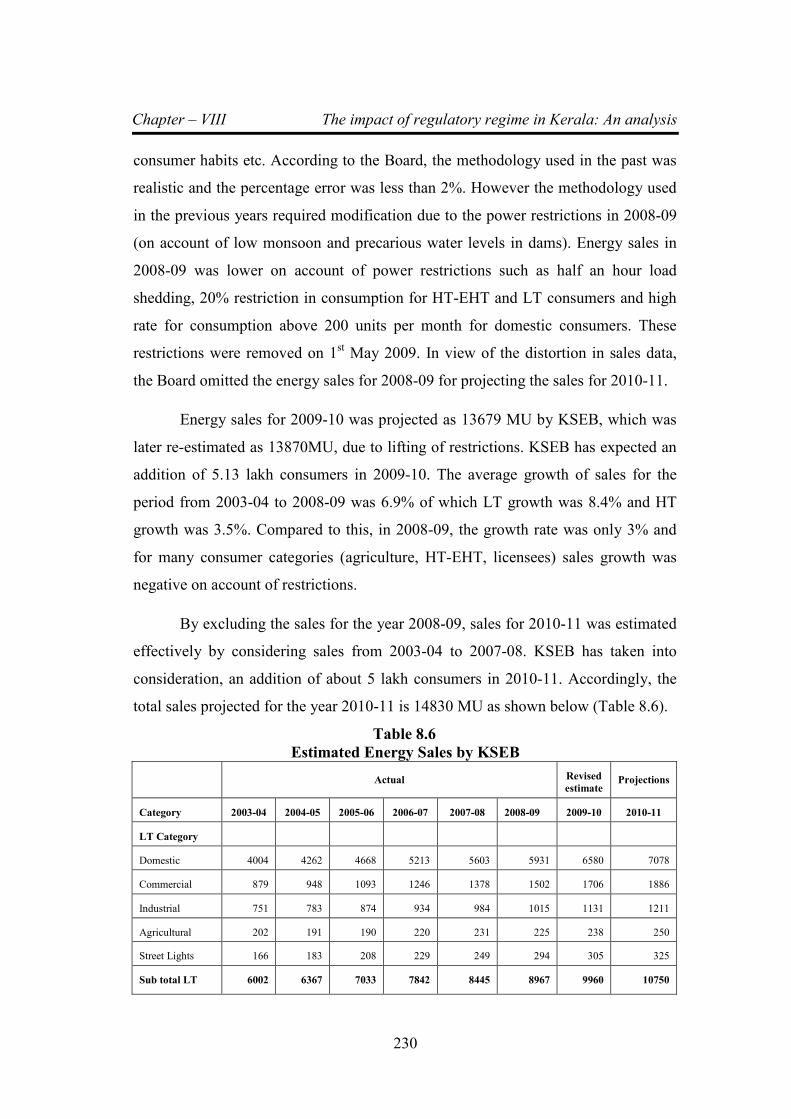
Chapter – VIII The impact of regulatory regime in Kerala: An analysis
230
consumer habits etc. According to the Board, the methodology used in the past was
realistic and the percentage error was less than 2%. However the methodology used
in the previous years required modification due to the power restrictions in 2008-09
(on account of low monsoon and precarious water levels in dams). Energy sales in
2008-09 was lower on account of power restrictions such as half an hour load
shedding, 20% restriction in consumption for HT-EHT and LT consumers and high
rate for consumption above 200 units per month for domestic consumers. These
restrictions were removed on 1st May 2009. In view of the distortion in sales data,
the Board omitted the energy sales for 2008-09 for projecting the sales for 2010-11.
Energy sales for 2009-10 was projected as 13679 MU by KSEB, which was
later re-estimated as 13870MU, due to lifting of restrictions. KSEB has expected an
addition of 5.13 lakh consumers in 2009-10. The average growth of sales for the
period from 2003-04 to 2008-09 was 6.9% of which LT growth was 8.4% and HT
growth was 3.5%. Compared to this, in 2008-09, the growth rate was only 3% and
for many consumer categories (agriculture, HT-EHT, licensees) sales growth was
negative on account of restrictions.
By excluding the sales for the year 2008-09, sales for 2010-11 was estimated
effectively by considering sales from 2003-04 to 2007-08. KSEB has taken into
consideration, an addition of about 5 lakh consumers in 2010-11. Accordingly, the
total sales projected for the year 2010-11 is 14830 MU as shown below (Table 8.6).
Table 8.6
Estimated Energy Sales by KSEB
Actual Revised
estimate Projections
Category 2003-04 2004-05 2005-06 2006-07 2007-08 2008-09 2009-10 2010-11
LT Category
Domestic 4004 4262 4668 5213 5603 5931 6580 7078
Commercial 879 948 1093 1246 1378 1502 1706 1886
Industrial 751 783 874 934 984 1015 1131 1211
Agricultural 202 191 190 220 231 225 238 250
Street Lights 166 183 208 229 249 294 305 325
Sub total LT 6002 6367 7033 7842 8445 8967 9960 10750
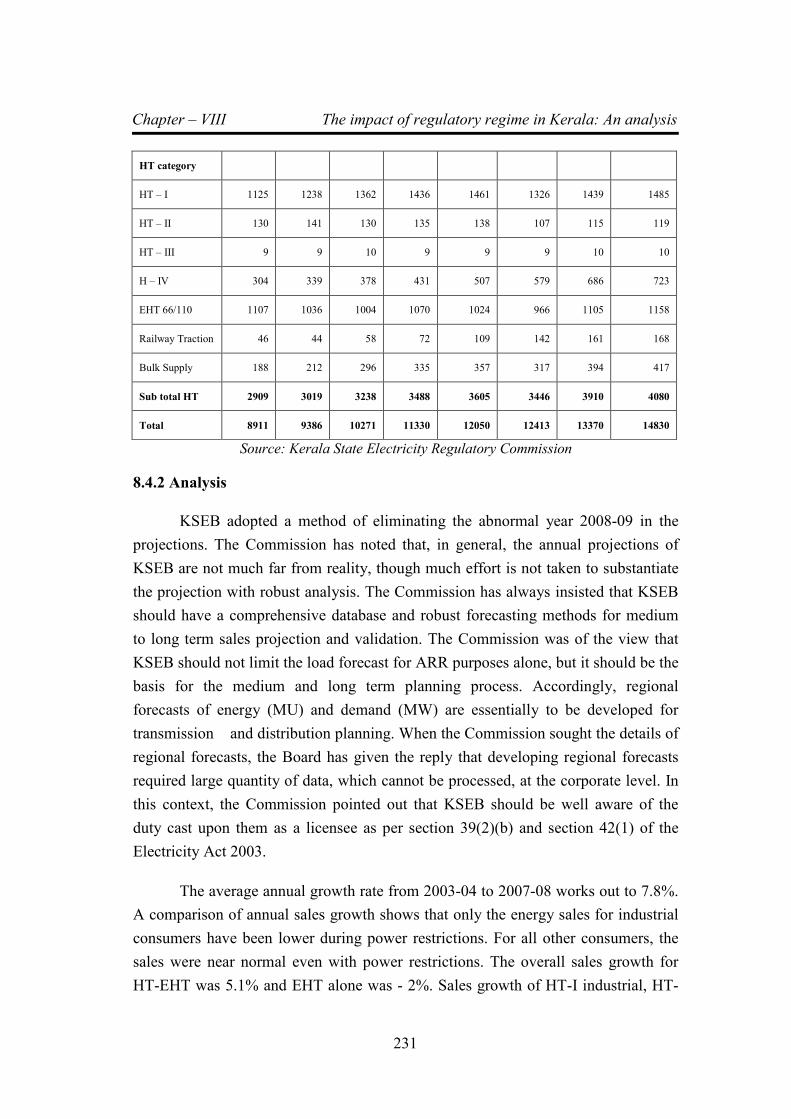
Chapter – VIII The impact of regulatory regime in Kerala: An analysis
231
HT category
HT – I 1125 1238 1362 1436 1461 1326 1439 1485
HT – II 130 141 130 135 138 107 115 119
HT – III 9 9 10 9 9 9 10 10
H – IV 304 339 378 431 507 579 686 723
EHT 66/110 1107 1036 1004 1070 1024 966 1105 1158
Railway Traction 46 44 58 72 109 142 161 168
Bulk Supply 188 212 296 335 357 317 394 417
Sub total HT 2909 3019 3238 3488 3605 3446 3910 4080
Total 8911 9386 10271 11330 12050 12413 13370 14830
Source: Kerala State Electricity Regulatory Commission
8.4.2 Analysis
KSEB adopted a method of eliminating the abnormal year 2008-09 in the
projections. The Commission has noted that, in general, the annual projections of
KSEB are not much far from reality, though much effort is not taken to substantiate
the projection with robust analysis. The Commission has always insisted that KSEB
should have a comprehensive database and robust forecasting methods for medium
to long term sales projection and validation. The Commission was of the view that
KSEB should not limit the load forecast for ARR purposes alone, but it should be the
basis for the medium and long term planning process. Accordingly, regional
forecasts of energy (MU) and demand (MW) are essentially to be developed for
transmission and distribution planning. When the Commission sought the details of
regional forecasts, the Board has given the reply that developing regional forecasts
required large quantity of data, which cannot be processed, at the corporate level. In
this context, the Commission pointed out that KSEB should be well aware of the
duty cast upon them as a licensee as per section 39(2)(b) and section 42(1) of the
Electricity Act 2003.
The average annual growth rate from 2003-04 to 2007-08 works out to 7.8%.
A comparison of annual sales growth shows that only the energy sales for industrial
consumers have been lower during power restrictions. For all other consumers, the
sales were near normal even with power restrictions. The overall sales growth for
HT-EHT was 5.1% and EHT alone was - 2%. Sales growth of HT-I industrial, HT-
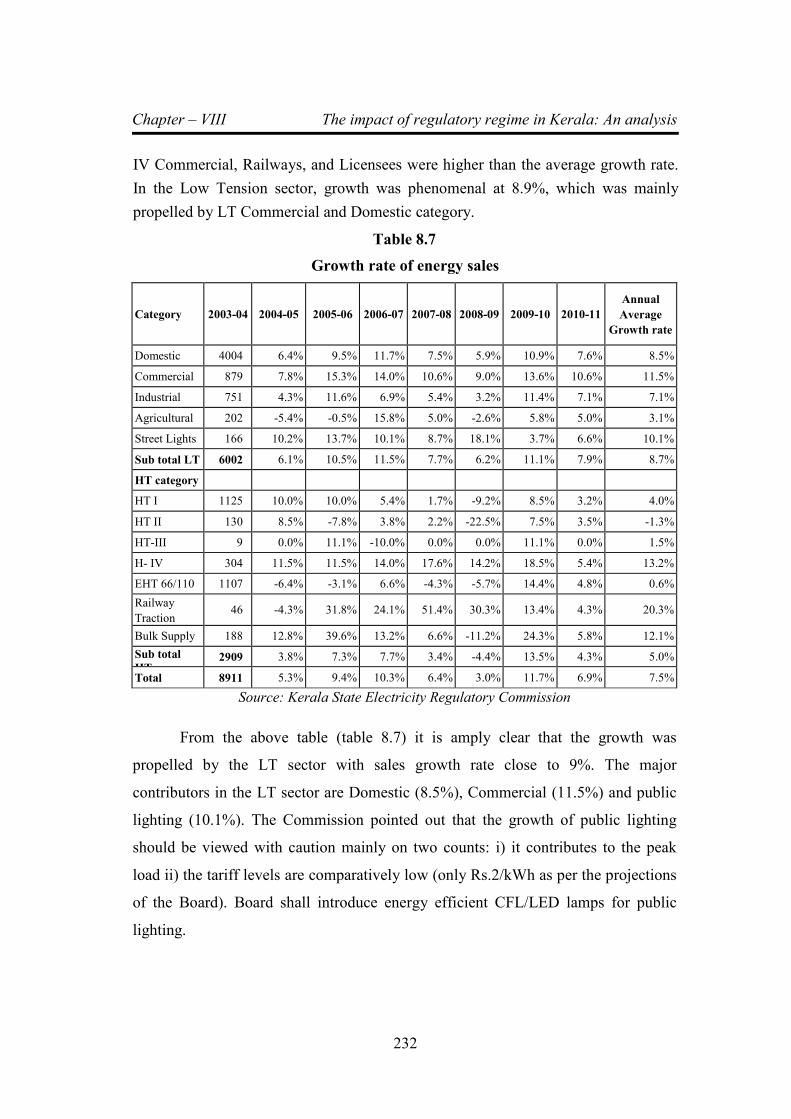
Chapter – VIII The impact of regulatory regime in Kerala: An analysis
232
IV Commercial, Railways, and Licensees were higher than the average growth rate.
In the Low Tension sector, growth was phenomenal at 8.9%, which was mainly
propelled by LT Commercial and Domestic category.
Table 8.7
Growth rate of energy sales
Category 2003-04 2004-05 2005-06 2006-07 2007-08 2008-09 2009-10 2010-11
Annual
Average
Growth rate
Domestic 4004 6.4% 9.5% 11.7% 7.5% 5.9% 10.9% 7.6% 8.5%
Commercial 879 7.8% 15.3% 14.0% 10.6% 9.0% 13.6% 10.6% 11.5%
Industrial 751 4.3% 11.6% 6.9% 5.4% 3.2% 11.4% 7.1% 7.1%
Agricultural 202 -5.4% -0.5% 15.8% 5.0% -2.6% 5.8% 5.0% 3.1%
Street Lights 166 10.2% 13.7% 10.1% 8.7% 18.1% 3.7% 6.6% 10.1%
Sub total LT 6002 6.1% 10.5% 11.5% 7.7% 6.2% 11.1% 7.9% 8.7%
HT category
HT I 1125 10.0% 10.0% 5.4% 1.7% -9.2% 8.5% 3.2% 4.0%
HT II 130 8.5% -7.8% 3.8% 2.2% -22.5% 7.5% 3.5% -1.3%
HT-III 9 0.0% 11.1% -10.0% 0.0% 0.0% 11.1% 0.0% 1.5%
H- IV 304 11.5% 11.5% 14.0% 17.6% 14.2% 18.5% 5.4% 13.2%
EHT 66/110 1107 -6.4% -3.1% 6.6% -4.3% -5.7% 14.4% 4.8% 0.6%
Railway
Traction 46 -4.3% 31.8% 24.1% 51.4% 30.3% 13.4% 4.3% 20.3%
Bulk Supply 188 12.8% 39.6% 13.2% 6.6% -11.2% 24.3% 5.8% 12.1%
Sub total
HT 2909 3.8% 7.3% 7.7% 3.4% -4.4% 13.5% 4.3% 5.0%
Total 8911 5.3% 9.4% 10.3% 6.4% 3.0% 11.7% 6.9% 7.5%
Source: Kerala State Electricity Regulatory Commission
From the above table (table 8.7) it is amply clear that the growth was
propelled by the LT sector with sales growth rate close to 9%. The major
contributors in the LT sector are Domestic (8.5%), Commercial (11.5%) and public
lighting (10.1%). The Commission pointed out that the growth of public lighting
should be viewed with caution mainly on two counts: i) it contributes to the peak
load ii) the tariff levels are comparatively low (only Rs.2/kWh as per the projections
of the Board). Board shall introduce energy efficient CFL/LED lamps for public
lighting.
Chapter – VIII The impact of regulatory regime in Kerala: An analysis
233
Based on the proposal from KSEB, the Commission in its order dated
2 December 2009 has revised the ToD tariff for HT-EHT categories and also
introduced Maximum Demand based tariff and ToD tariff for LT industrial
consumers as an optional scheme. Since the impact of peak shifting is difficult to
assess, the Commission directed the Board to study and report not later than 6
months, the impact of the approved TOD tariff on peak shifting and on the revenue.
It was also directed that KSEB should approach the Commission with all supporting
materials, if the approved tariff has substantial financial or any other adverse
impacts. Since the Board so far has not approached the Commission on this count,
the Commission assumed that the new and revised schemes have a positive effect on
the system.
The Board in its petition dated 25-3-2010 proposed power restrictions for
two months April and May 2010. The Board proposed to impose 25% restriction on
all HT&EHT consumers, LT-II, LT-IV, LT-VI(A), LT-VI(B), LT-VI (C ), LT-VII
(A), LT-VII(B), LT-VII (C) and to restrict domestic consumption by 200 units per
month. As per the projections of the Board, due to restrictions, the consumption
would reduce by 5.97 MU per day and energy requirement by 6.87 MU per day.
After following the due procedure the Commission disposed of the petition by
allowing 10% restrictions on all consumers except LT-VID and LT-V. In the case of
domestic category the limit was fixed as 300 units/month. Accordingly, the
Commission projected that the sales would be about 2.67MU less per day for the
month of April and May 2010 ie., a total of 163MU. Hence the Commission
assumed that energy sales would be about 163MU less than the level projected by
KSEB due to power restrictions. Considering all the above, energy sales for the year
2010-11 was estimated as follows (Table-8.8):
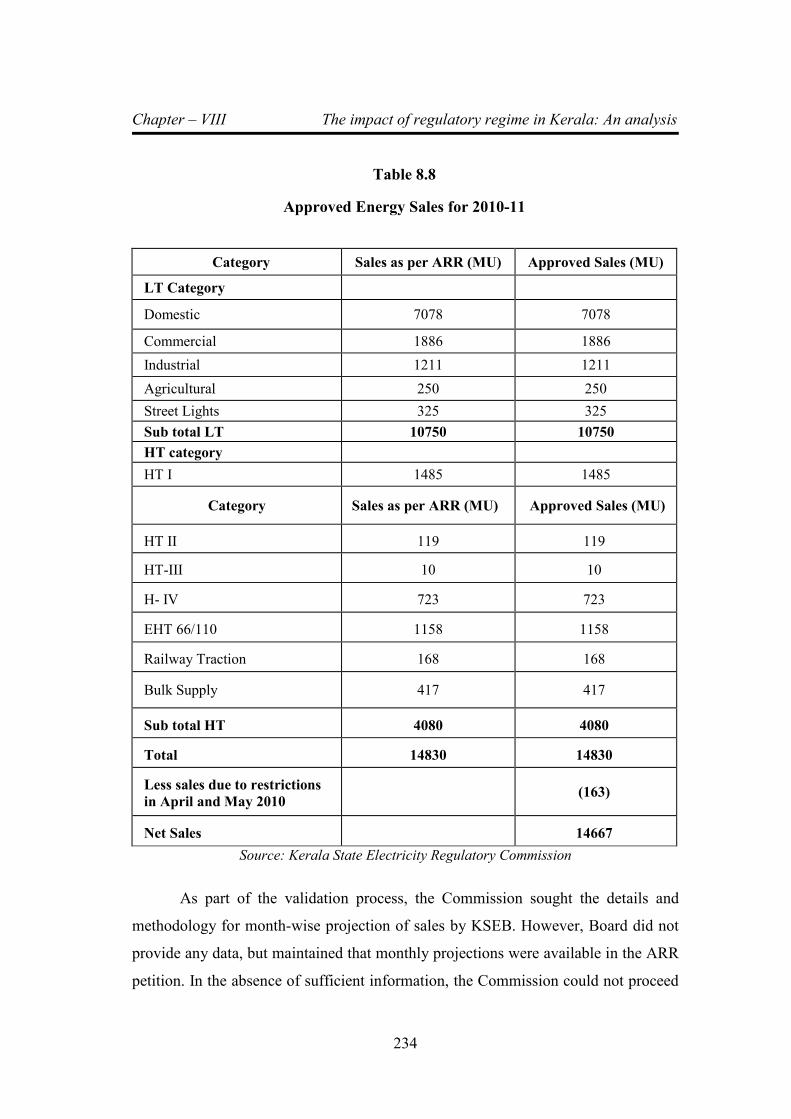
Chapter – VIII The impact of regulatory regime in Kerala: An analysis
234
Table 8.8
Approved Energy Sales for 2010-11
Category Sales as per ARR (MU) Approved Sales (MU)
LT Category
Domestic 7078 7078
Commercial 1886 1886
Industrial 1211 1211
Agricultural 250 250
Street Lights 325 325
Sub total LT 10750 10750
HT category
HT I 1485 1485
Category Sales as per ARR (MU) Approved Sales (MU)
HT II 119 119
HT-III 10 10
H- IV 723 723
EHT 66/110 1158 1158
Railway Traction 168 168
Bulk Supply 417 417
Sub total HT 4080 4080
Total 14830 14830
Less sales due to restrictions
in April and May 2010 (163)
Net Sales 14667
Source: Kerala State Electricity Regulatory Commission
As part of the validation process, the Commission sought the details and
methodology for month-wise projection of sales by KSEB. However, Board did not
provide any data, but maintained that monthly projections were available in the ARR
petition. In the absence of sufficient information, the Commission could not proceed
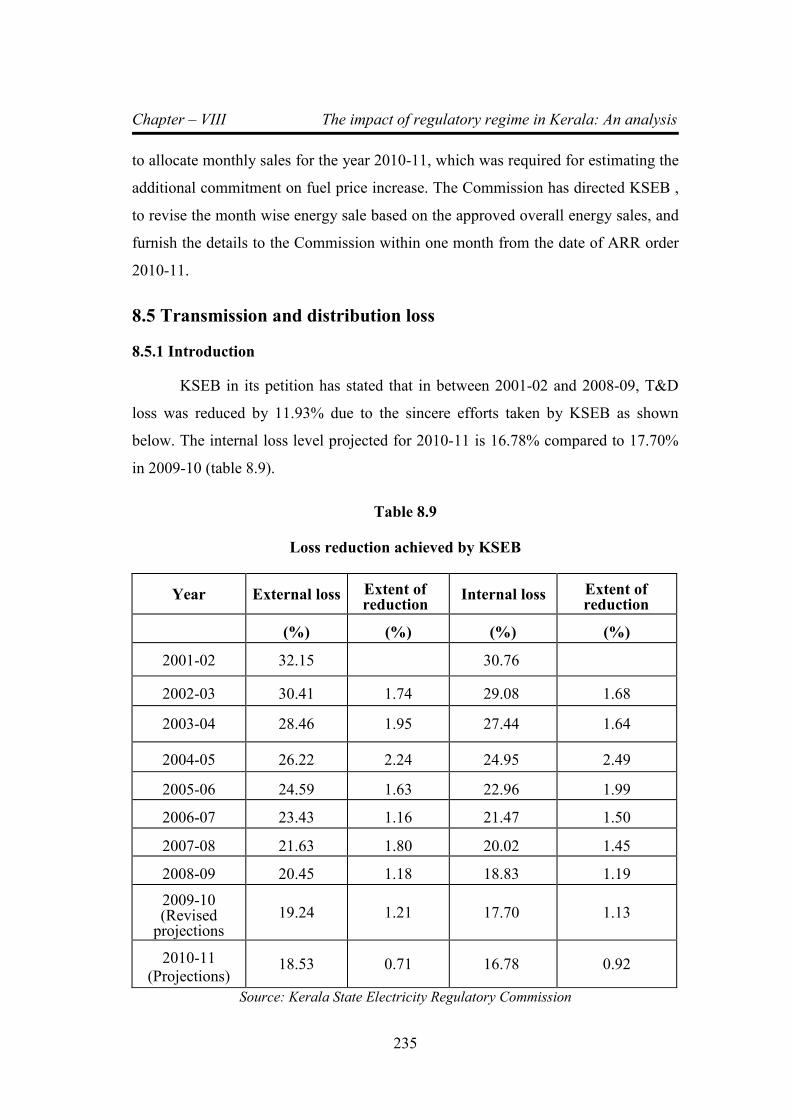
Chapter – VIII The impact of regulatory regime in Kerala: An analysis
235
to allocate monthly sales for the year 2010-11, which was required for estimating the
additional commitment on fuel price increase. The Commission has directed KSEB ,
to revise the month wise energy sale based on the approved overall energy sales, and
furnish the details to the Commission within one month from the date of ARR order
2010-11.
8.5 Transmission and distribution loss
8.5.1 Introduction
KSEB in its petition has stated that in between 2001-02 and 2008-09, T&D
loss was reduced by 11.93% due to the sincere efforts taken by KSEB as shown
below. The internal loss level projected for 2010-11 is 16.78% compared to 17.70%
in 2009-10 (table 8.9).
Table 8.9
Loss reduction achieved by KSEB
Year External loss Extent of reduction
Internal loss Extent of reduction
(%) (%) (%) (%)
2001-02 32.15 30.76
2002-03 30.41 1.74 29.08 1.68
2003-04 28.46 1.95 27.44 1.64
2004-05 26.22 2.24 24.95 2.49
2005-06 24.59 1.63 22.96 1.99
2006-07 23.43 1.16 21.47 1.50
2007-08 21.63 1.80 20.02 1.45
2008-09 20.45 1.18 18.83 1.19
2009-10 (Revised
projections
19.24 1.21 17.70 1.13
2010-11
(Projections) 18.53 0.71 16.78 0.92
Source: Kerala State Electricity Regulatory Commission

Chapter – VIII The impact of regulatory regime in Kerala: An analysis
236
KSEB estimated that transmission system loss is about 5% and distribution
loss is 14.55%. As per the study report of the Power Finance Corporation, the T&D
losses of KSEB for the year 2007-08 was better compared to other states except
Andhra Pradesh and Tamil Nadu. According to KSEB, in Tamil Nadu and Andhra
Pradesh, about 20 to 30% of the consumers are unmetered and consumption is based
on assessment. In the case of Kerala metering is 100% and hence estimates are more
reliable. The Board has also given a calculation of Rs.790.55 Crore of saving through
reduction in energy losses from 2001-02 to 2008-09. According to the Board, the
target level of distribution losses stipulated by Ministry of Power at the end of 11th
plan is 15%, but the distribution losses in Kerala has already reached that level. With
respect to the directions issued by the Commission such as separation of transmission
and distribution losses, estimate of voltage level distribution losses and separation of
technical and commercial losses, the Board has forwarded a status report which was
communicated to the Commission vide letter 21-11-2009. KSEB stated that the
attempt to study losses through load flow analysis had failed due to inaccurate
database and mismatch of meters due to difference in loading in off-peak and peak
periods. A pilot study was initiated to assess the distribution losses separately in
urban and rural areas with target date of completion as February 2010. Transmission
losses could not be estimated because of inaccurate meters and low
accuracy meters in EHT panels. The replacement of meters requires considerable
capital investment and the tasks were assigned to Transmission Chief Engineers and
the reports are awaited. KSEB further reported that one of the objectives of R-
APDRP is to assess and segregate technical and commercial losses in the system.
Part-A of the R-APDRP includes establishment of base line data using IT
applications for energy accounting. The Board is in the process of replacement of
faulty meters in a phased manner. After completion of these works, AT&C loss can
be accurately quantified. In order to reduce the losses Board has narrated several text
book steps such as reduction in LT:HT ratio, strengthening of transmission network,
reconditioning of lines, capacitor compensation, realigning of LT feeders,
reallocation of transformers, use of amorphous core transformers, introducing ‘LT
less’ system, load balancing, energy audit at transformer level etc., However, no

Chapter – VIII The impact of regulatory regime in Kerala: An analysis
237
action taken report was submitted and the status of the above measures are not
known. The progress of capital works in transmission & distribution and the
proposed works for 2010-11 are shown below (Table-8.10):
Table 8.10
Physical Targets Achieved by the Board
Year 2003-04 2004-05 2005-06 2006-07 2007-08 2008-09 2009-10
(Revised)
2010-11
(projection)
Substations (Nos)
220kV 1 1 1 0 1 3 2
110 kV 6 8 4 2 4 2 20 19
66kV 3 2 4 3 1 4 6
33kV 7 15 10 10 13 16 39 19
Lines (Km)
220kV 4.3 15 56 1.01 0 29.1 28.5
110 kV 154.6 30 55 30 56.38 17.5 100 138.5
66kV 8.4 5 13 15 11.13 0 0.3 13.5
33kV 95.4 157 131 95 105.44 169.27 457.8 138
11 kV lines 1269 955 1062 1820 1807 3018 4880 3000
LT lines 4429 6074 7441 8229 8128 7636 6666 3800
Distribution Transformers
(Nos) 1063 1882 1751 2124 2553 4109 5400 5000
Source: Kerala State Electricity Regulatory Commission
As in the case of previous ARR&ERC petitions, the Board narrated the usual
steps being taken for reducing the commercial losses such as replacement of faulty
meters, anti-power theft activities, computerization of billing and revenue collection,
energy audit, loss monitoring at circle level, installing meters at transformers,
feeders and border points, providing load factor and power factor incentives etc., The
Board has stated that in 2009-10, target for replacement of meters was 7.44 lakhs of
which 3.78 has been already completed (upto September). In 2010-11, the Board’s
proposal was to replace 8 lakh meters. The status of replacement of faulty meters
reported by the Board is as follows (Table 8.11):
Table 8.11
Progress of faulty meters replacement
Year No. of faculty meters replaced
2002-03 4.21
2003-04 8.67
2004-05 4.35
2005-06 6.38
2006-07 2.69
2007-08 5.80
2008-09 6.44
Source: Kerala State Electricity Regulatory Commission
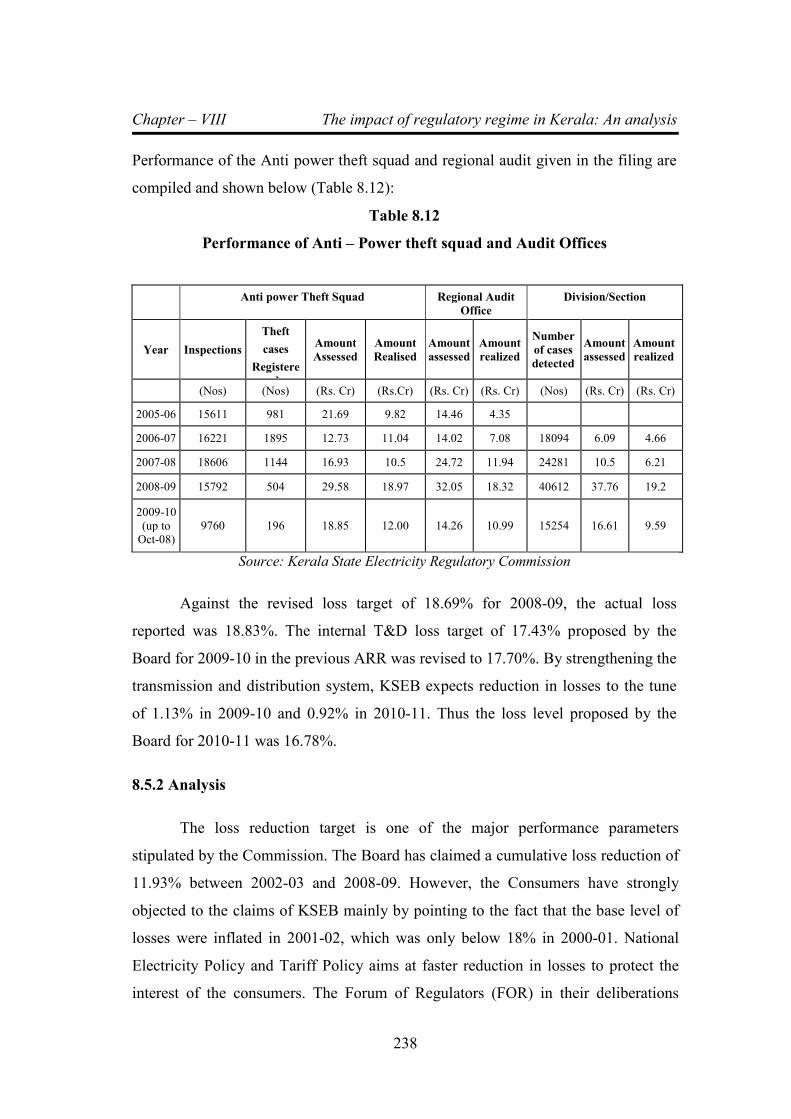
Chapter – VIII The impact of regulatory regime in Kerala: An analysis
238
Performance of the Anti power theft squad and regional audit given in the filing are
compiled and shown below (Table 8.12):
Table 8.12
Performance of Anti – Power theft squad and Audit Offices
Anti power Theft Squad
Regional Audit
Office
Division/Section
Year Inspections
Theft
cases Registere
d
Amount
Assessed Amount
Realised Amount
assessed Amount
realized
Number
of cases
detected
Amount
assessed Amount
realized
(Nos) (Nos) (Rs. Cr) (Rs.Cr) (Rs. Cr) (Rs. Cr) (Nos) (Rs. Cr) (Rs. Cr)
2005-06 15611 981 21.69 9.82 14.46 4.35
2006-07 16221 1895 12.73 11.04 14.02 7.08 18094 6.09 4.66
2007-08 18606 1144 16.93 10.5 24.72 11.94 24281 10.5 6.21
2008-09 15792 504 29.58 18.97 32.05 18.32 40612 37.76 19.2
2009-10
(up to Oct-08)
9760 196 18.85 12.00 14.26 10.99 15254 16.61 9.59
Source: Kerala State Electricity Regulatory Commission
Against the revised loss target of 18.69% for 2008-09, the actual loss
reported was 18.83%. The internal T&D loss target of 17.43% proposed by the
Board for 2009-10 in the previous ARR was revised to 17.70%. By strengthening the
transmission and distribution system, KSEB expects reduction in losses to the tune
of 1.13% in 2009-10 and 0.92% in 2010-11. Thus the loss level proposed by the
Board for 2010-11 was 16.78%.
8.5.2 Analysis
The loss reduction target is one of the major performance parameters
stipulated by the Commission. The Board has claimed a cumulative loss reduction of
11.93% between 2002-03 and 2008-09. However, the Consumers have strongly
objected to the claims of KSEB mainly by pointing to the fact that the base level of
losses were inflated in 2001-02, which was only below 18% in 2000-01. National
Electricity Policy and Tariff Policy aims at faster reduction in losses to protect the
interest of the consumers. The Forum of Regulators (FOR) in their deliberations
Chapter – VIII The impact of regulatory regime in Kerala: An analysis
239
stressed the need for aggressive reduction of AT&C losses. The Sub Committee of
Forum of Regulators on “Methods of loss reduction” has suggested that loss
reduction target of not less than 10% of the current level to be set if the current loss
level is above 20% (ie., 2% reduction every year). It is also pertinent to point out that
the Board could not achieve the proposed loss reduction in any of the ARR&ERC
petitions in the last 6 years. Kerala is a 100% metered State with low level of non-
technical losses compared to other states. However, so far the Board did not initiate a
comprehensive exercise to assess the base level of T&D loss in the State. In the
absence of any reliable studies on loss level, the loss reduction targets proposed by
the Board is more of an assumption than realistic assessment. The Commission since
its inception, has repeatedly given directions for carrying out loss studies at different
levels for reasonable assessment of the base level of losses. In the compliance report
on directives, the Board has admitted that the directions have been not complied so
far. After the lapse of four years, Board has reported in the letter dated 24-11-2009 as
follows:
(1) Board has made an attempt to find out transmission and distribution losses
through load flow analysis. But this was not successful for want of sufficiently
accurate database, issues of accuracy of meters and large number of
arbitrary assumptions required. Hence Board has taken alternative steps for
assessment of T&D losses.
(2) In the distribution wing a pilot study is initiated for assessment of
distribution losses in 33kV/11kV and LT system as well as commercial
losses, separately in urban and rural areas. the Board has targeting to
complete the study by 15th February 2010.
(3) Transmission loss: to find out transmission losses accurate metered data
are required. Many meters with EHV panels are of lower accuracy levels and
need to be replaced with accurate meters. The Board has directed
Transmission chief engineers to evolve a suitable methodology for
segregation of transmission losses at different voltage levels.”
Chapter – VIII The impact of regulatory regime in Kerala: An analysis
240
The above reply shows the state of affairs in the Board in dealing with
creation of basic database on the system. In the absence of such information, the
rationale for investments proposed by the Board for system strengthening and
expansion are quite questionable. The Commission could infer from the above reply
that the transmission and distribution loss of 5% and 14.55% respectively claimed by
the Board is only by a thumb rule. The contention of the Board that heavy investment
is required for replacing EHV panels needs to be viewed seriously since, it shows
even after providing substantial amount under R&M expenses, basic monitoring
systems are not kept in sound condition. Further such approach would look lime a
deliberate attempt to withhold critical information so as to escape proper scrutiny and
the matter deserves in depth probe.
As noted above, the Commission faces the problem of lack of authenticity of
data since the loss figures are never supported with adequate data. As per the data
provided by the Board, about 45 lakhs of faulty /electromechanical meters were
replaced (other than new connections) with electronic meters in the last 5 years. It is
reasonable to attribute the reduction in losses to the replacement of more sensitive
electronic meters, than proper strengthening of the distribution system. It has been
noticed that after the introduction of electronic meters, recorded sales have been
substantially improved, which could be one reason for improvement in loss reduction
without corresponding reduction in technical loss. This conclusion carries more
weight in the absence of any better information or supporting details provided by
KSEB. Even though a wing of KSEB namely TRAC is communicating with plan and
programmes for loss reduction, it is reasonably suspected that none of the such plans
and programmes and consequent targeted loss reduction are seen communicated to
the field office through the Chief Engineers of Transmission and Distribution wings.
The Commission also noted that the Board has taken little effort in estimating
losses using the existing facilities. The Board has already invested more than Rs.500
Crore in APDRP scheme. One of the major objectives of the APDRP scheme is
energy audit and systems are created for measurement of losses since funds
allocation as well as incentives is based on the reduction in distribution loss. If such
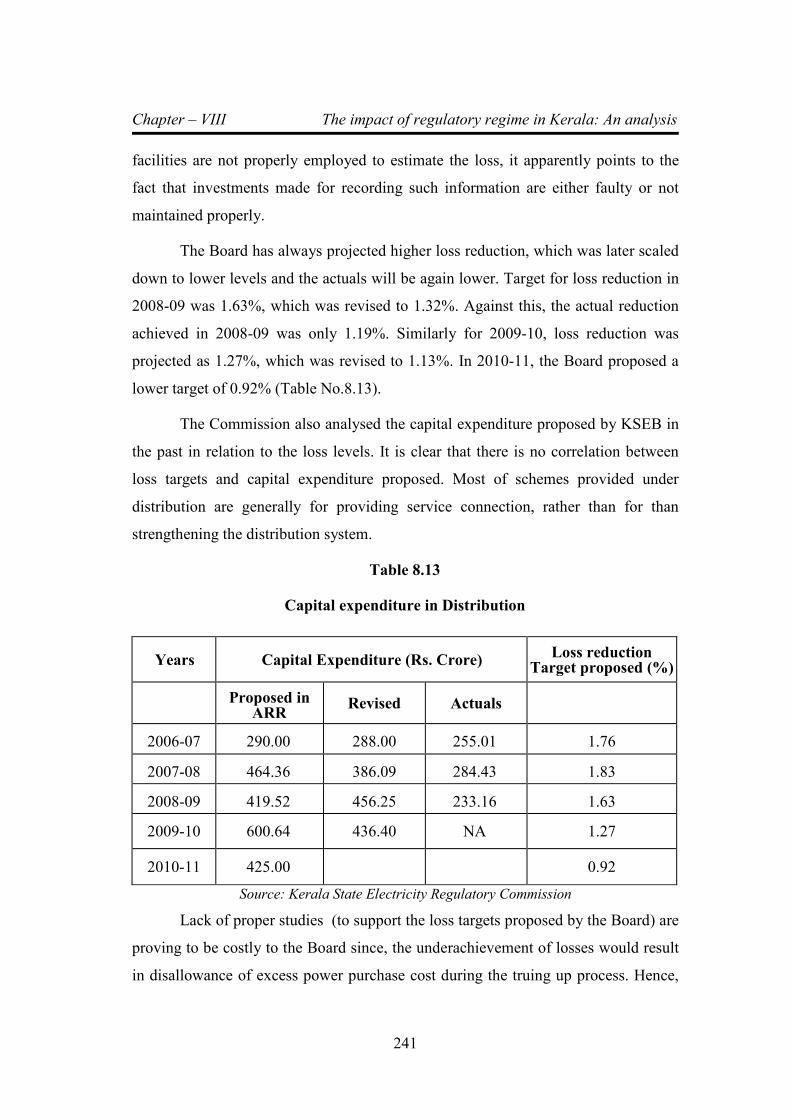
Chapter – VIII The impact of regulatory regime in Kerala: An analysis
241
facilities are not properly employed to estimate the loss, it apparently points to the
fact that investments made for recording such information are either faulty or not
maintained properly.
The Board has always projected higher loss reduction, which was later scaled
down to lower levels and the actuals will be again lower. Target for loss reduction in
2008-09 was 1.63%, which was revised to 1.32%. Against this, the actual reduction
achieved in 2008-09 was only 1.19%. Similarly for 2009-10, loss reduction was
projected as 1.27%, which was revised to 1.13%. In 2010-11, the Board proposed a
lower target of 0.92% (Table No.8.13).
The Commission also analysed the capital expenditure proposed by KSEB in
the past in relation to the loss levels. It is clear that there is no correlation between
loss targets and capital expenditure proposed. Most of schemes provided under
distribution are generally for providing service connection, rather than for than
strengthening the distribution system.
Table 8.13
Capital expenditure in Distribution
Years Capital Expenditure (Rs. Crore) Loss reduction
Target proposed (%)
Proposed in ARR
Revised Actuals
2006-07 290.00 288.00 255.01 1.76
2007-08 464.36 386.09 284.43 1.83
2008-09 419.52 456.25 233.16 1.63
2009-10 600.64 436.40 NA 1.27
2010-11 425.00 0.92
Source: Kerala State Electricity Regulatory Commission
Lack of proper studies (to support the loss targets proposed by the Board) are
proving to be costly to the Board since, the underachievement of losses would result
in disallowance of excess power purchase cost during the truing up process. Hence,

Chapter – VIII The impact of regulatory regime in Kerala: An analysis
242
the Board should realise the facts and immediately initiate proper system to estimate
the losses on a sound footing by giving instructions to Chief Engineers to fix section-
wise loss reduction targets and to conduct month-wise monitoring of input energy
into the section and revenue realisation. Best achievements have to be properly
rewarded.
8.5.3 Progress of replacement of faulty meters
The Commission noted that progress in the area of replacement of faulty
meters is also tardy. As against the target of 10.3 lakhs in 2008-09, only 6.44 lakhs
meters were replaced. In 2009-10 target set by the Board was 8 lakhs, which was
later revised to 7.44 lakhs. Against this, the achievement reported as on 30-9-2009 is
only 3.78 lakhs. The Commission noted that total number of faulty meters in the
system remains at very high levels (7.44 lakhs). In the letter dated 13-8-
2009 on status of compliance, the Board reported that about 3.9 lakh faulty meters
are expected to be faulty thus the total faulty meters will be 11.39 lakhs (single phase
only). The Board also provided a plan for complete replacement of meters by March
2010 along with a purchase plan of about 17 lakh Single-phase static meters with
LCD (Ref table-8.14). Mere purchase of meters at competitive rates without
ensuring quality of meters is likely to increase the number of faulty meters year by
year even if Crores of meters are replaced.
Table 8.14
Progress of replacement of faulty metes – Target Vs Achievement
Year Target given in
the ARR (Lakhs) Revised Target
(Lakhs)
No. of Faulty meters actually replaced
(Lakhs)
2002-03 4.21
2003-04 8.67
2004-05 5.00 4.35
2005-06 5.00 8.50 6.38
2006-07 4.00 4.00 2.69
2007-08 4.13 6.00 5.80
2008-09 6.00 10.30 6.44
2009-10 8.00 7.44 (data not available)
Source: Kerala State Electricity Regulatory Commission

Chapter – VIII The impact of regulatory regime in Kerala: An analysis
243
Considering the routine exercise of purchase of meters, the Commission
sought year-wise details of purchase of meters, number of faulty meters reported,
new connection provided, number of faulty meters replaced, total number of meters
used and closing stock in the following format. Board conveniently, skipped the data
on total number of purchase of meters over the years and gave only the following
data (Table 8.15) which is incomplete.
Table 8.15
Purchase of meters and utilization
Year
No. of
faulty
meters as
on 1st April
No. of
faulty
meters
reported
Total
number of
meters
purchased
No. of new
connections
provided
No. of
faulty
meters
replaced
Total No.
of meters
used
Closing stock
of meters as
on 31st
March
2002-03 355520 427000
2003-04 391815 863536
2004-05 548307 418791
2005-06 497222 608445 548521 636256
2006-07 469411 481355 478745 269844
2007-08 680922 583630 482725 580484
2008-09 684068 747922 482766 647282 2009-10 784708 553400 323814 741015
Total 2974752 3612213 4584208
Source: Kerala State Electricity Regulatory Commission
The Board did not provide the critical information on number of meters
purchased and closing stock of meters. The data provided by the Board shows that
even after replacing considerable number of meters every year the opening position
of faulty meters each year has in fact increased. This is on account of substantial
number of meters becoming faulty every year, which raises the concern on the
quality of meters being procured. It should also be noted with concern that from
2005-06 to 2009-10 (5 years), about 29.74 lakh meters become faulty, which is about
37% of the total number of consumers. There are reports that the new meters
purchased for replacing faulty meters becoming faulty within a short time. It is
alarming to note that from 2002-03 to 2009-10, Board has replaced 45.85lakh faulty
meters. Assuming Rs.300 per meter, about Rs.137.52 crore has been spent on
replacing faulty meters, which is being loaded on to the consumers. The Commission
in the previous order observed that a large number of meters are becoming faulty
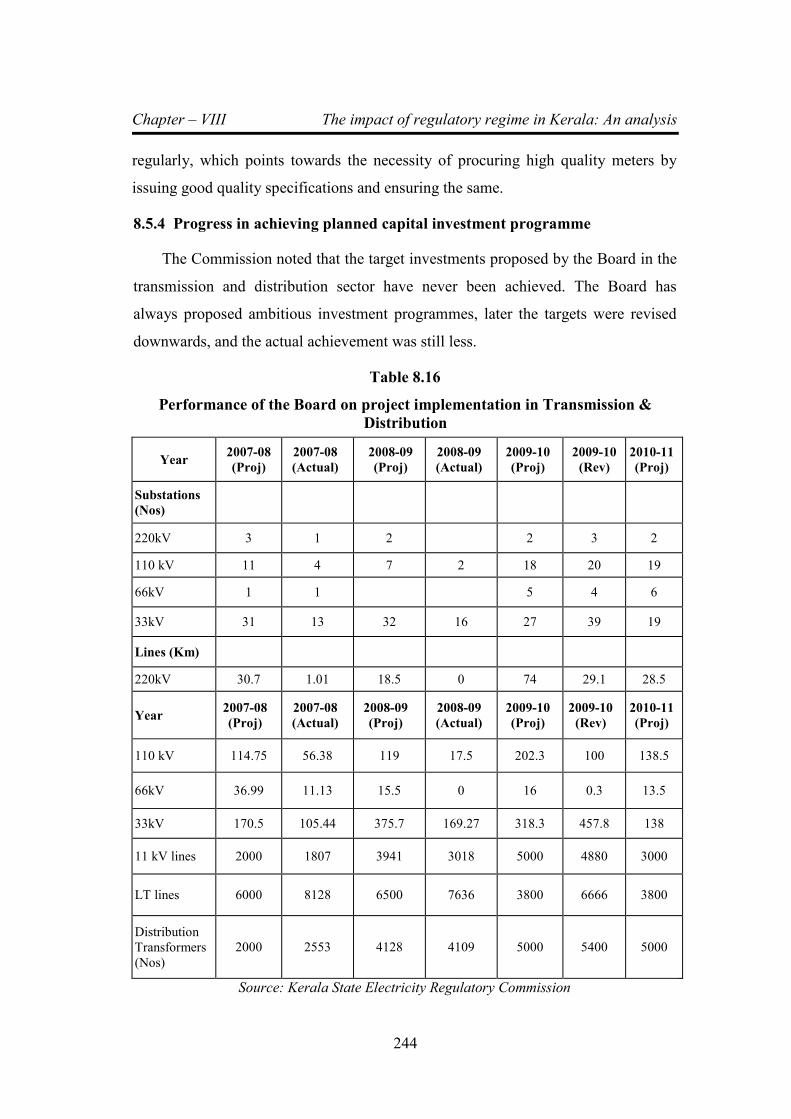
Chapter – VIII The impact of regulatory regime in Kerala: An analysis
244
regularly, which points towards the necessity of procuring high quality meters by
issuing good quality specifications and ensuring the same.
8.5.4 Progress in achieving planned capital investment programme
The Commission noted that the target investments proposed by the Board in the
transmission and distribution sector have never been achieved. The Board has
always proposed ambitious investment programmes, later the targets were revised
downwards, and the actual achievement was still less.
Table 8.16
Performance of the Board on project implementation in Transmission &
Distribution
Year 2007-08
(Proj)
2007-08
(Actual)
2008-09
(Proj)
2008-09
(Actual)
2009-10
(Proj)
2009-10
(Rev)
2010-11
(Proj)
Substations
(Nos)
220kV 3 1 2 2 3 2
110 kV 11 4 7 2 18 20 19
66kV 1 1 5 4 6
33kV 31 13 32 16 27 39 19
Lines (Km)
220kV 30.7 1.01 18.5 0 74 29.1 28.5
Year 2007-08
(Proj)
2007-08
(Actual)
2008-09
(Proj)
2008-09
(Actual)
2009-10
(Proj)
2009-10
(Rev)
2010-11
(Proj)
110 kV 114.75 56.38 119 17.5 202.3 100 138.5
66kV 36.99 11.13 15.5 0 16 0.3 13.5
33kV 170.5 105.44 375.7 169.27 318.3 457.8 138
11 kV lines 2000 1807 3941 3018 5000 4880 3000
LT lines 6000 8128 6500 7636 3800 6666 3800
Distribution
Transformers
(Nos)
2000 2553 4128 4109 5000 5400 5000
Source: Kerala State Electricity Regulatory Commission
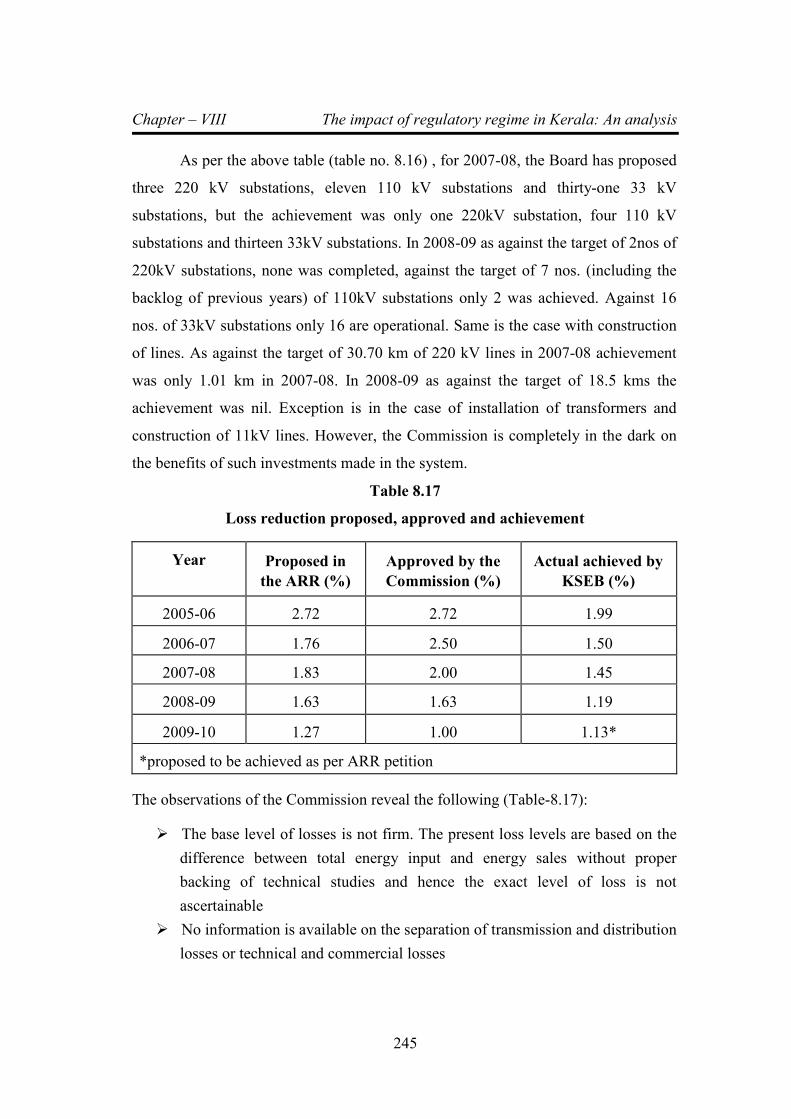
Chapter – VIII The impact of regulatory regime in Kerala: An analysis
245
As per the above table (table no. 8.16) , for 2007-08, the Board has proposed
three 220 kV substations, eleven 110 kV substations and thirty-one 33 kV
substations, but the achievement was only one 220kV substation, four 110 kV
substations and thirteen 33kV substations. In 2008-09 as against the target of 2nos of
220kV substations, none was completed, against the target of 7 nos. (including the
backlog of previous years) of 110kV substations only 2 was achieved. Against 16
nos. of 33kV substations only 16 are operational. Same is the case with construction
of lines. As against the target of 30.70 km of 220 kV lines in 2007-08 achievement
was only 1.01 km in 2007-08. In 2008-09 as against the target of 18.5 kms the
achievement was nil. Exception is in the case of installation of transformers and
construction of 11kV lines. However, the Commission is completely in the dark on
the benefits of such investments made in the system.
Table 8.17
Loss reduction proposed, approved and achievement
Year Proposed in
the ARR (%)
Approved by the
Commission (%)
Actual achieved by
KSEB (%)
2005-06 2.72 2.72 1.99
2006-07 1.76 2.50 1.50
2007-08 1.83 2.00 1.45
2008-09 1.63 1.63 1.19
2009-10 1.27 1.00 1.13*
*proposed to be achieved as per ARR petition
The observations of the Commission reveal the following (Table-8.17):
� The base level of losses is not firm. The present loss levels are based on the
difference between total energy input and energy sales without proper
backing of technical studies and hence the exact level of loss is not
ascertainable
� No information is available on the separation of transmission and distribution
losses or technical and commercial losses
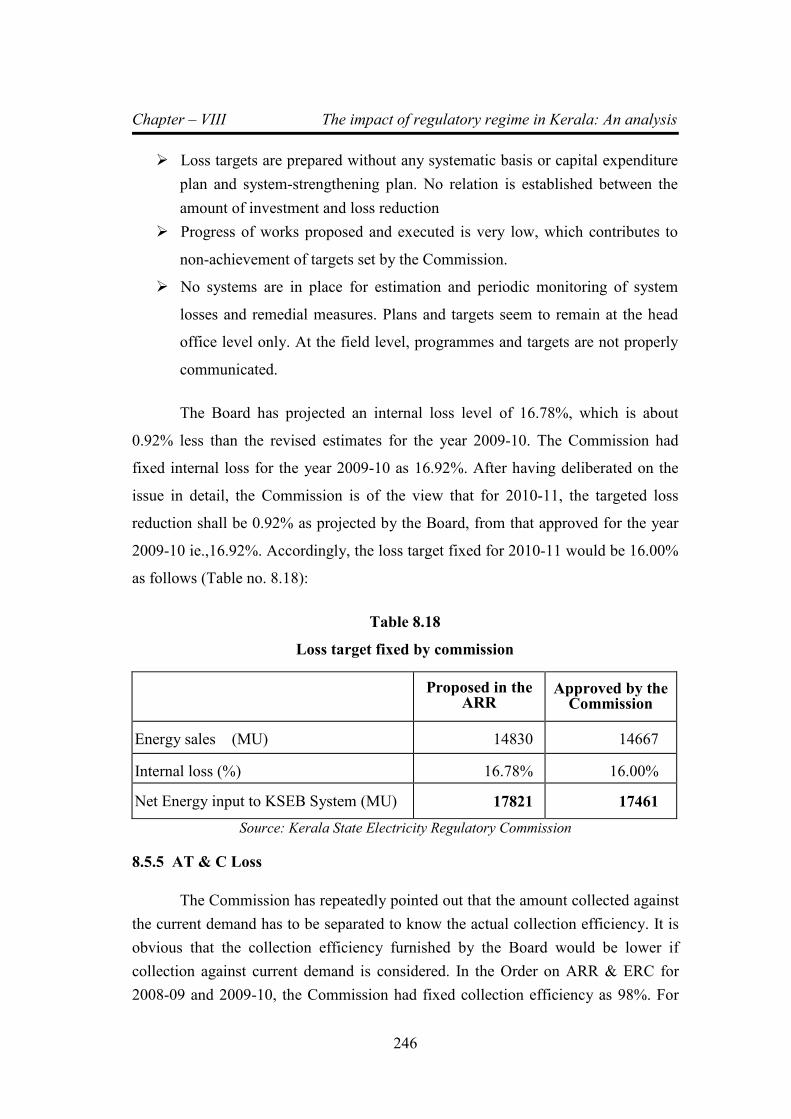
Chapter – VIII The impact of regulatory regime in Kerala: An analysis
246
� Loss targets are prepared without any systematic basis or capital expenditure
plan and system-strengthening plan. No relation is established between the
amount of investment and loss reduction
� Progress of works proposed and executed is very low, which contributes to
non-achievement of targets set by the Commission.
� No systems are in place for estimation and periodic monitoring of system
losses and remedial measures. Plans and targets seem to remain at the head
office level only. At the field level, programmes and targets are not properly
communicated.
The Board has projected an internal loss level of 16.78%, which is about
0.92% less than the revised estimates for the year 2009-10. The Commission had
fixed internal loss for the year 2009-10 as 16.92%. After having deliberated on the
issue in detail, the Commission is of the view that for 2010-11, the targeted loss
reduction shall be 0.92% as projected by the Board, from that approved for the year
2009-10 ie.,16.92%. Accordingly, the loss target fixed for 2010-11 would be 16.00%
as follows (Table no. 8.18):
Table 8.18
Loss target fixed by commission
Proposed in the
ARR
14830
Approved by the Commission
Energy sales (MU) 14830 14667
Internal loss (%) 16.78% 16.00%
Net Energy input to KSEB System (MU) 17821 17461
Source: Kerala State Electricity Regulatory Commission
8.5.5 AT & C Loss
The Commission has repeatedly pointed out that the amount collected against
the current demand has to be separated to know the actual collection efficiency. It is
obvious that the collection efficiency furnished by the Board would be lower if
collection against current demand is considered. In the Order on ARR & ERC for
2008-09 and 2009-10, the Commission had fixed collection efficiency as 98%. For
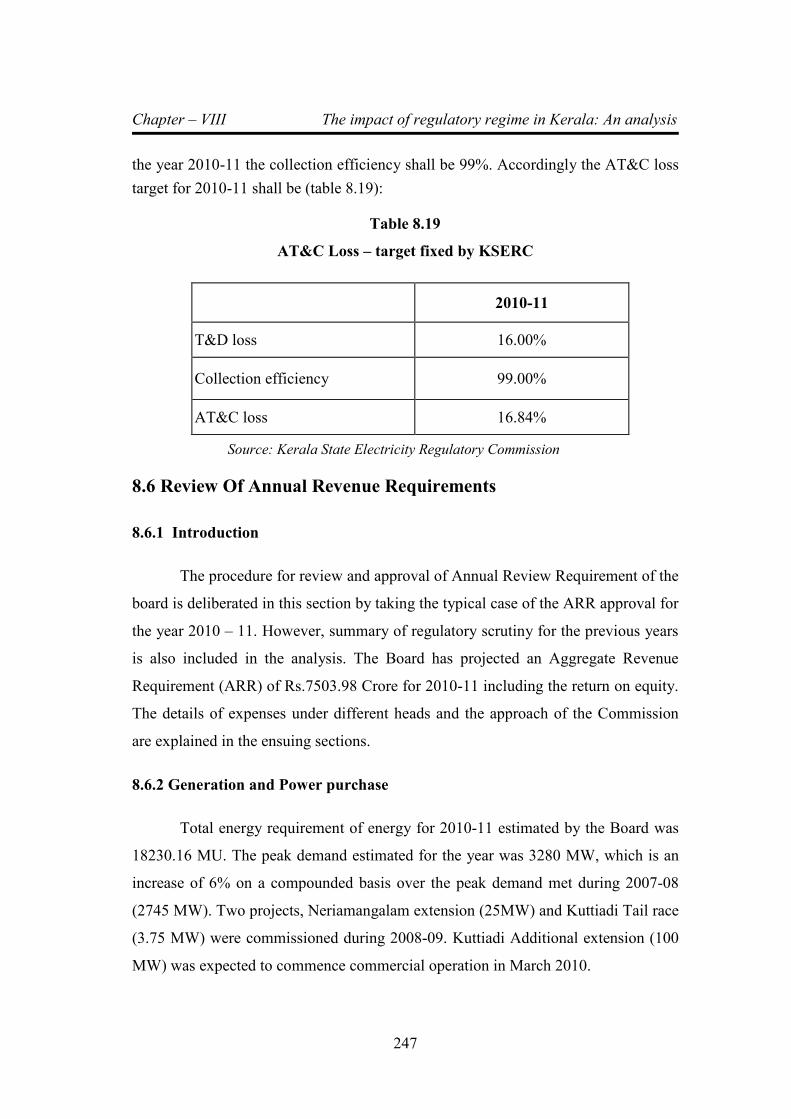
Chapter – VIII The impact of regulatory regime in Kerala: An analysis
247
the year 2010-11 the collection efficiency shall be 99%. Accordingly the AT&C loss
target for 2010-11 shall be (table 8.19):
Table 8.19
AT&C Loss – target fixed by KSERC
2010-11
T&D loss 16.00%
Collection efficiency 99.00%
AT&C loss 16.84%
Source: Kerala State Electricity Regulatory Commission
8.6 Review Of Annual Revenue Requirements
8.6.1 Introduction
The procedure for review and approval of Annual Review Requirement of the
board is deliberated in this section by taking the typical case of the ARR approval for
the year 2010 – 11. However, summary of regulatory scrutiny for the previous years
is also included in the analysis. The Board has projected an Aggregate Revenue
Requirement (ARR) of Rs.7503.98 Crore for 2010-11 including the return on equity.
The details of expenses under different heads and the approach of the Commission
are explained in the ensuing sections.
8.6.2 Generation and Power purchase
Total energy requirement of energy for 2010-11 estimated by the Board was
18230.16 MU. The peak demand estimated for the year was 3280 MW, which is an
increase of 6% on a compounded basis over the peak demand met during 2007-08
(2745 MW). Two projects, Neriamangalam extension (25MW) and Kuttiadi Tail race
(3.75 MW) were commissioned during 2008-09. Kuttiadi Additional extension (100
MW) was expected to commence commercial operation in March 2010.
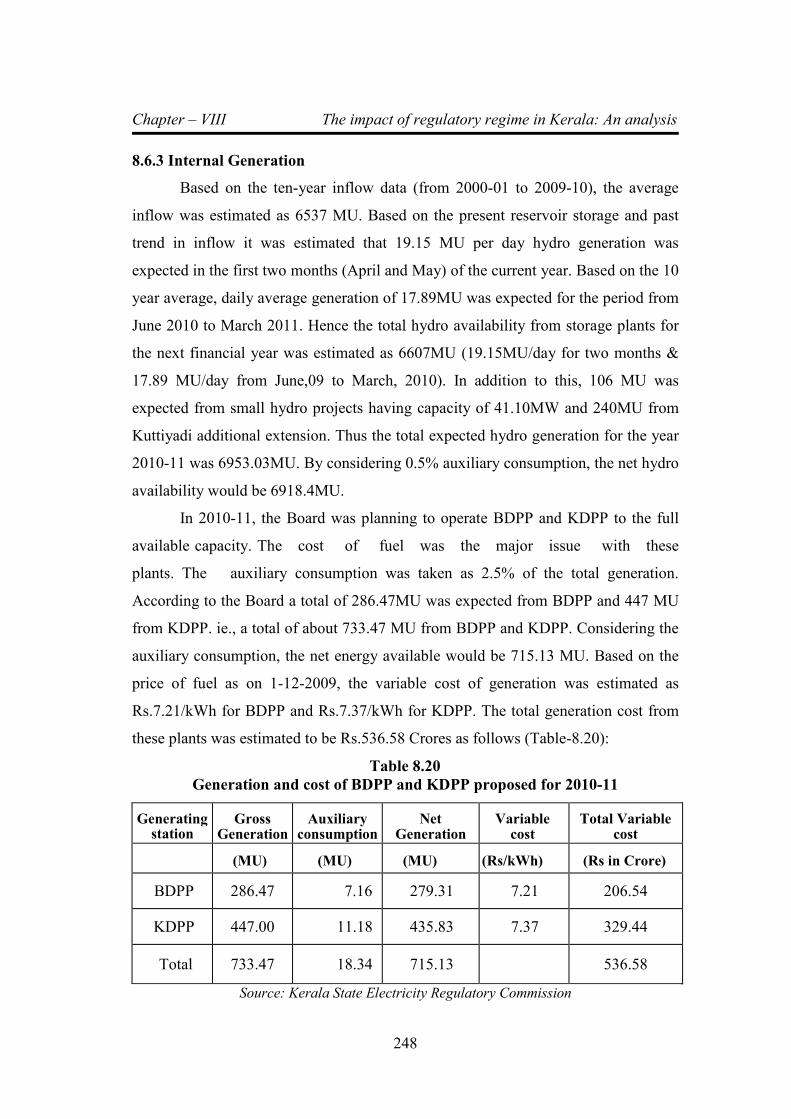
Chapter – VIII The impact of regulatory regime in Kerala: An analysis
248
8.6.3 Internal Generation
Based on the ten-year inflow data (from 2000-01 to 2009-10), the average
inflow was estimated as 6537 MU. Based on the present reservoir storage and past
trend in inflow it was estimated that 19.15 MU per day hydro generation was
expected in the first two months (April and May) of the current year. Based on the 10
year average, daily average generation of 17.89MU was expected for the period from
June 2010 to March 2011. Hence the total hydro availability from storage plants for
the next financial year was estimated as 6607MU (19.15MU/day for two months &
17.89 MU/day from June,09 to March, 2010). In addition to this, 106 MU was
expected from small hydro projects having capacity of 41.10MW and 240MU from
Kuttiyadi additional extension. Thus the total expected hydro generation for the year
2010-11 was 6953.03MU. By considering 0.5% auxiliary consumption, the net hydro
availability would be 6918.4MU.
In 2010-11, the Board was planning to operate BDPP and KDPP to the full
available capacity. The cost of fuel was the major issue with these
plants. The auxiliary consumption was taken as 2.5% of the total generation.
According to the Board a total of 286.47MU was expected from BDPP and 447 MU
from KDPP. ie., a total of about 733.47 MU from BDPP and KDPP. Considering the
auxiliary consumption, the net energy available would be 715.13 MU. Based on the
price of fuel as on 1-12-2009, the variable cost of generation was estimated as
Rs.7.21/kWh for BDPP and Rs.7.37/kWh for KDPP. The total generation cost from
these plants was estimated to be Rs.536.58 Crores as follows (Table-8.20):
Table 8.20
Generation and cost of BDPP and KDPP proposed for 2010-11
Generating station
Gross Generation
Auxiliary consumption
Net Generation
Variable cost
Total Variable cost
(MU) (MU) (MU) (Rs/kWh) (Rs in Crore)
BDPP 286.47 7.16 279.31 7.21 206.54
KDPP 447.00 11.18 435.83 7.37 329.44
Total 733.47 18.34 715.13 536.58
Source: Kerala State Electricity Regulatory Commission
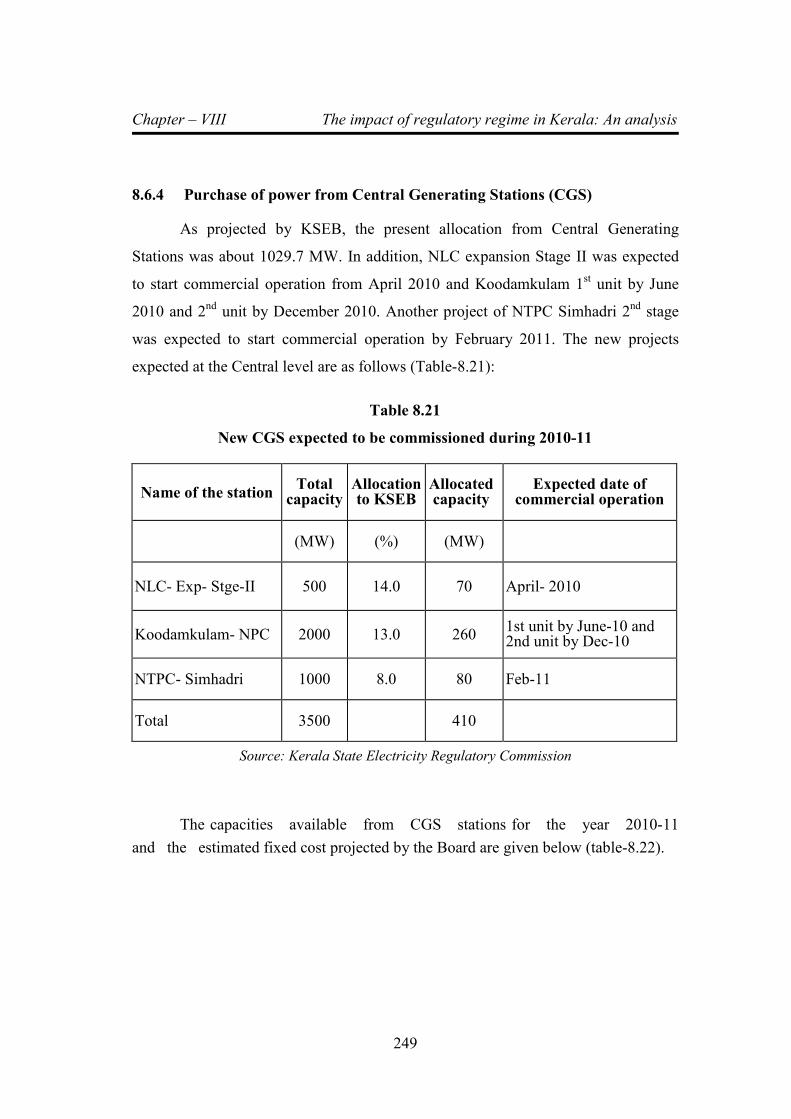
Chapter – VIII The impact of regulatory regime in Kerala: An analysis
249
8.6.4 Purchase of power from Central Generating Stations (CGS)
As projected by KSEB, the present allocation from Central Generating
Stations was about 1029.7 MW. In addition, NLC expansion Stage II was expected
to start commercial operation from April 2010 and Koodamkulam 1st unit by June
2010 and 2nd
unit by December 2010. Another project of NTPC Simhadri 2nd
stage
was expected to start commercial operation by February 2011. The new projects
expected at the Central level are as follows (Table-8.21):
Table 8.21
New CGS expected to be commissioned during 2010-11
Name of the station Total
capacity Allocation to KSEB
Allocated capacity
Expected date of commercial operation
(MW) (%) (MW)
NLC- Exp- Stge-II 500 14.0 70 April- 2010
Koodamkulam- NPC 2000 13.0 260 1st unit by June-10 and 2nd unit by Dec-10
NTPC- Simhadri 1000 8.0 80 Feb-11
Total 3500 410
Source: Kerala State Electricity Regulatory Commission
The capacities available from CGS stations for the year 2010-11
and the estimated fixed cost projected by the Board are given below (table-8.22).
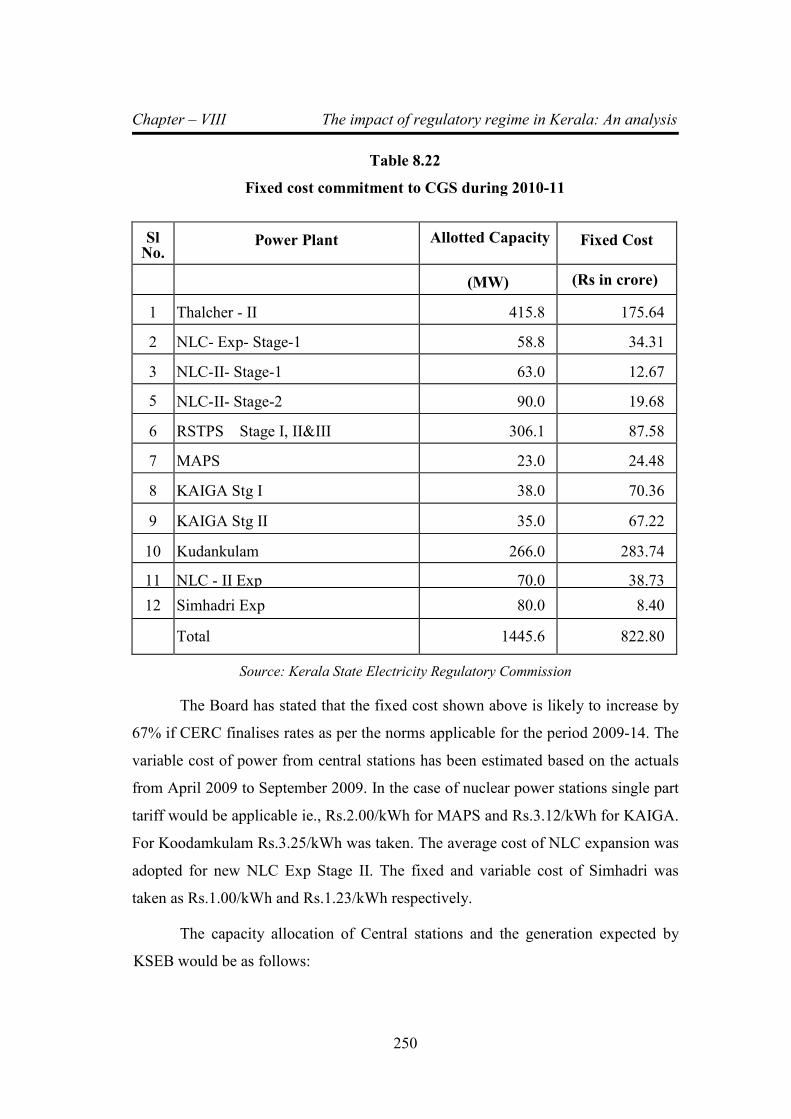
Chapter – VIII The impact of regulatory regime in Kerala: An analysis
250
Table 8.22
Fixed cost commitment to CGS during 2010-11
Sl No.
Power Plant Allotted Capacity Fixed Cost
(MW) (Rs in crore)
1 Thalcher - II 415.8 175.64
2 NLC- Exp- Stage-1 58.8 34.31
3 NLC-II- Stage-1 63.0 12.67
5 NLC-II- Stage-2 90.0 19.68
6 RSTPS Stage I, II&III 306.1 87.58
7 MAPS 23.0 24.48
8 KAIGA Stg I 38.0 70.36
9 KAIGA Stg II 35.0 67.22
10 Kudankulam 266.0 283.74
11 NLC - II Exp 70.0 38.73
12 Simhadri Exp 80.0 8.40
Total 1445.6 822.80
Source: Kerala State Electricity Regulatory Commission
The Board has stated that the fixed cost shown above is likely to increase by
67% if CERC finalises rates as per the norms applicable for the period 2009-14. The
variable cost of power from central stations has been estimated based on the actuals
from April 2009 to September 2009. In the case of nuclear power stations single part
tariff would be applicable ie., Rs.2.00/kWh for MAPS and Rs.3.12/kWh for KAIGA.
For Koodamkulam Rs.3.25/kWh was taken. The average cost of NLC expansion was
adopted for new NLC Exp Stage II. The fixed and variable cost of Simhadri was
taken as Rs.1.00/kWh and Rs.1.23/kWh respectively.
The capacity allocation of Central stations and the generation expected by
KSEB would be as follows:
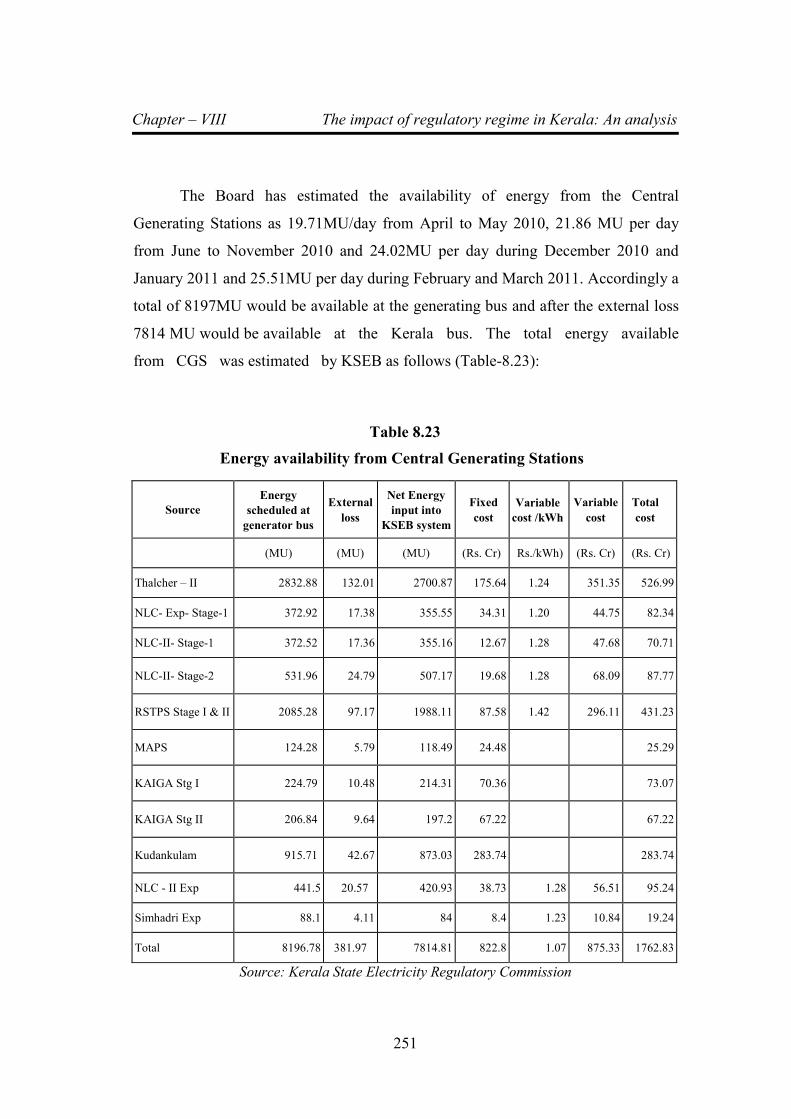
Chapter – VIII The impact of regulatory regime in Kerala: An analysis
251
The Board has estimated the availability of energy from the Central
Generating Stations as 19.71MU/day from April to May 2010, 21.86 MU per day
from June to November 2010 and 24.02MU per day during December 2010 and
January 2011 and 25.51MU per day during February and March 2011. Accordingly a
total of 8197MU would be available at the generating bus and after the external loss
7814 MU would be available at the Kerala bus. The total energy available
from CGS was estimated by KSEB as follows (Table-8.23):
Table 8.23
Energy availability from Central Generating Stations
Source
Energy
scheduled at
generator bus
External
loss
Net Energy
input into
KSEB system
Fixed
cost
Variable
cost /kWh
Variable
cost
Total
cost
(MU) (MU) (MU) (Rs. Cr) Rs./kWh) (Rs. Cr) (Rs. Cr)
Thalcher – II 2832.88 132.01 2700.87 175.64 1.24 351.35 526.99
NLC- Exp- Stage-1 372.92 17.38 355.55 34.31 1.20 44.75 82.34
NLC-II- Stage-1 372.52 17.36 355.16 12.67 1.28 47.68 70.71
NLC-II- Stage-2 531.96 24.79 507.17 19.68 1.28 68.09 87.77
RSTPS Stage I & II 2085.28 97.17 1988.11 87.58 1.42 296.11 431.23
MAPS 124.28 5.79 118.49 24.48 25.29
KAIGA Stg I 224.79 10.48 214.31 70.36 73.07
KAIGA Stg II 206.84 9.64 197.2 67.22 67.22
Kudankulam 915.71 42.67 873.03 283.74 283.74
NLC - II Exp 441.5 20.57 420.93 38.73 1.28 56.51 95.24
Simhadri Exp 88.1 4.11 84 8.4 1.23 10.84 19.24
Total 8196.78 381.97 7814.81 822.8 1.07 875.33 1762.83
Source: Kerala State Electricity Regulatory Commission
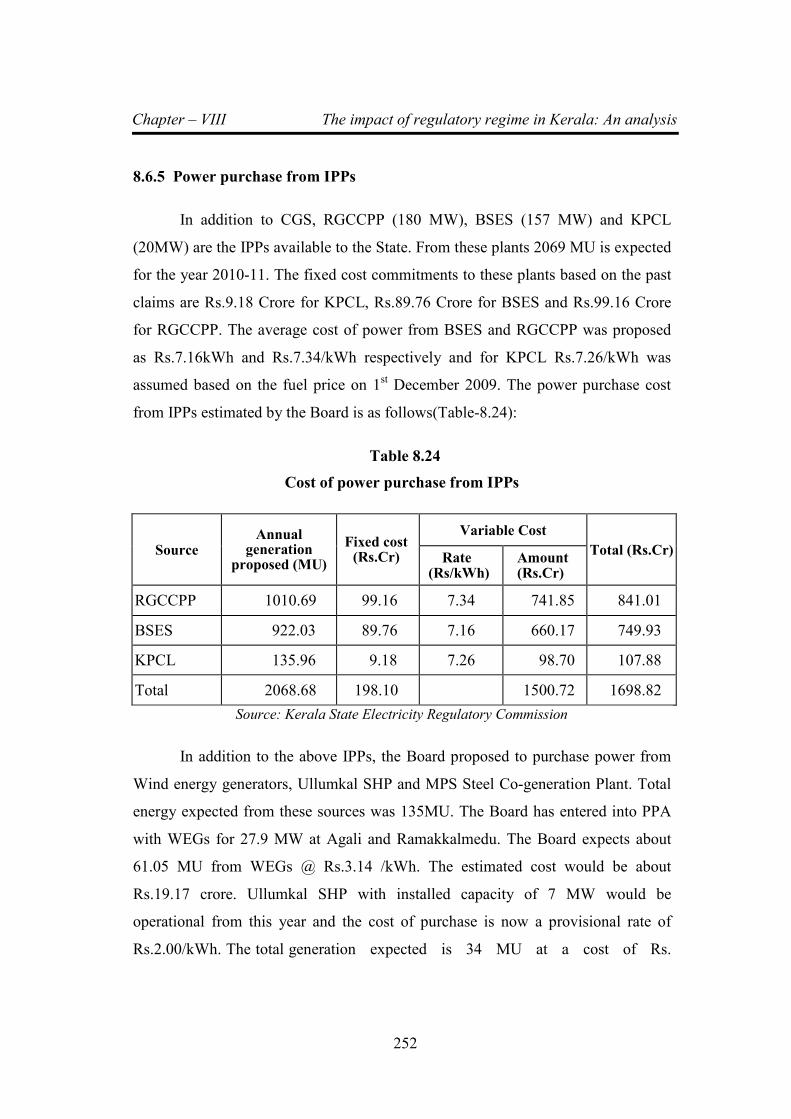
Chapter – VIII The impact of regulatory regime in Kerala: An analysis
252
8.6.5 Power purchase from IPPs
In addition to CGS, RGCCPP (180 MW), BSES (157 MW) and KPCL
(20MW) are the IPPs available to the State. From these plants 2069 MU is expected
for the year 2010-11. The fixed cost commitments to these plants based on the past
claims are Rs.9.18 Crore for KPCL, Rs.89.76 Crore for BSES and Rs.99.16 Crore
for RGCCPP. The average cost of power from BSES and RGCCPP was proposed
as Rs.7.16kWh and Rs.7.34/kWh respectively and for KPCL Rs.7.26/kWh was
assumed based on the fuel price on 1st December 2009. The power purchase cost
from IPPs estimated by the Board is as follows(Table-8.24):
Table 8.24
Cost of power purchase from IPPs
Source Annual
generation proposed (MU)
Fixed cost (Rs.Cr)
Variable Cost
Total (Rs.Cr) Rate
(Rs/kWh) Amount (Rs.Cr)
RGCCPP 1010.69 99.16 7.34 741.85 841.01
BSES 922.03 89.76 7.16 660.17 749.93
KPCL 135.96 9.18 7.26 98.70 107.88
Total 2068.68 198.10 1500.72 1698.82
Source: Kerala State Electricity Regulatory Commission
In addition to the above IPPs, the Board proposed to purchase power from
Wind energy generators, Ullumkal SHP and MPS Steel Co-generation Plant. Total
energy expected from these sources was 135MU. The Board has entered into PPA
with WEGs for 27.9 MW at Agali and Ramakkalmedu. The Board expects about
61.05 MU from WEGs @ Rs.3.14 /kWh. The estimated cost would be about
Rs.19.17 crore. Ullumkal SHP with installed capacity of 7 MW would be
operational from this year and the cost of purchase is now a provisional rate of
Rs.2.00/kWh. The total generation expected is 34 MU at a cost of Rs.
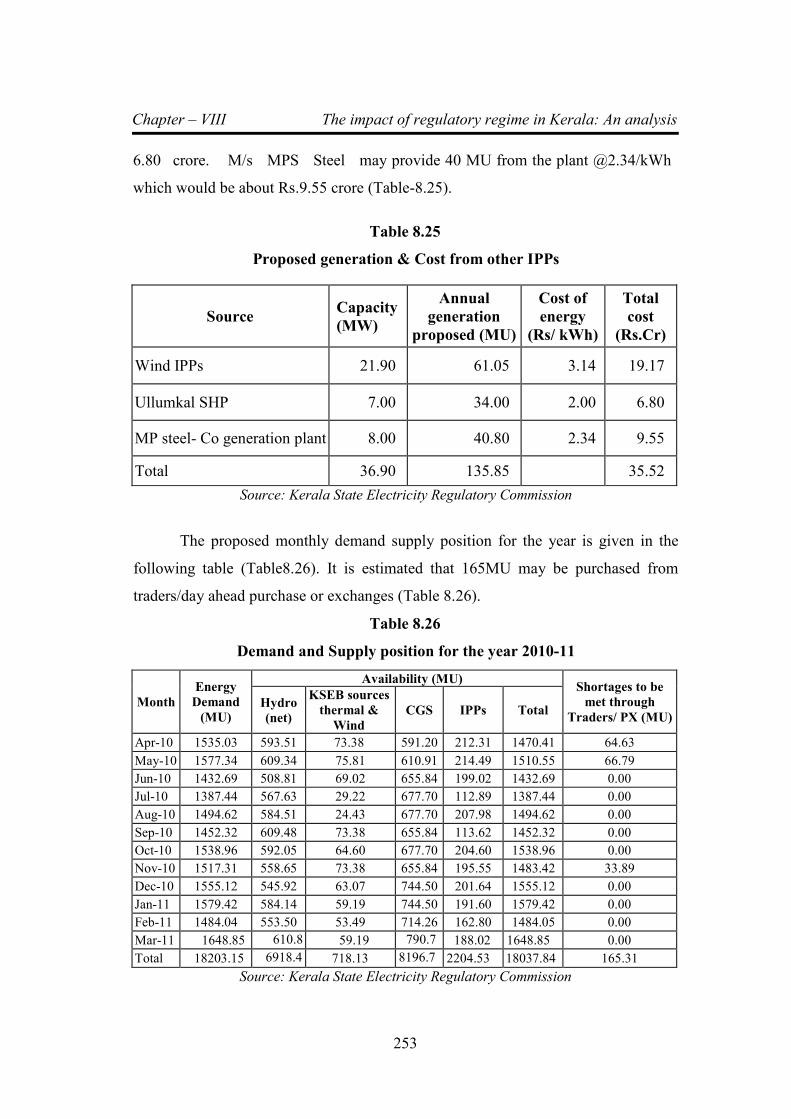
Chapter – VIII The impact of regulatory regime in Kerala: An analysis
253
6.80 crore. M/s MPS Steel may provide 40 MU from the plant @2.34/kWh
which would be about Rs.9.55 crore (Table-8.25).
Table 8.25
Proposed generation & Cost from other IPPs
Source Capacity
(MW)
Annual
generation
proposed (MU)
Cost of
energy
(Rs/ kWh)
Total
cost
(Rs.Cr)
Wind IPPs 21.90 61.05 3.14 19.17
Ullumkal SHP 7.00 34.00 2.00 6.80
MP steel- Co generation plant 8.00 40.80 2.34 9.55
Total 36.90 135.85 35.52
Source: Kerala State Electricity Regulatory Commission
The proposed monthly demand supply position for the year is given in the
following table (Table8.26). It is estimated that 165MU may be purchased from
traders/day ahead purchase or exchanges (Table 8.26).
Table 8.26
Demand and Supply position for the year 2010-11
Month
Energy
Demand
(MU)
Availability (MU) Shortages to be
met through
Traders/ PX (MU) Hydro
(net)
KSEB sources
thermal &
Wind
CGS IPPs Total
Apr-10 1535.03 593.51 73.38 591.20 212.31 1470.41 64.63
May-10 1577.34 609.34 75.81 610.91 214.49 1510.55 66.79
Jun-10 1432.69 508.81 69.02 655.84 199.02 1432.69 0.00
Jul-10 1387.44 567.63 29.22 677.70 112.89 1387.44 0.00
Aug-10 1494.62 584.51 24.43 677.70 207.98 1494.62 0.00
Sep-10 1452.32 609.48 73.38 655.84 113.62 1452.32 0.00
Oct-10 1538.96 592.05 64.60 677.70 204.60 1538.96 0.00
Nov-10 1517.31 558.65 73.38 655.84 195.55 1483.42 33.89
Dec-10 1555.12 545.92 63.07 744.50 201.64 1555.12 0.00
Jan-11 1579.42 584.14 59.19 744.50 191.60 1579.42 0.00
Feb-11 1484.04 553.50 53.49 714.26 162.80 1484.05 0.00
Mar-11 1648.85 610.8
5 59.19 790.7
9 188.02 1648.85 0.00
Total 18203.15 6918.4
0 718.13 8196.7
8 2204.53 18037.84 165.31
Source: Kerala State Electricity Regulatory Commission
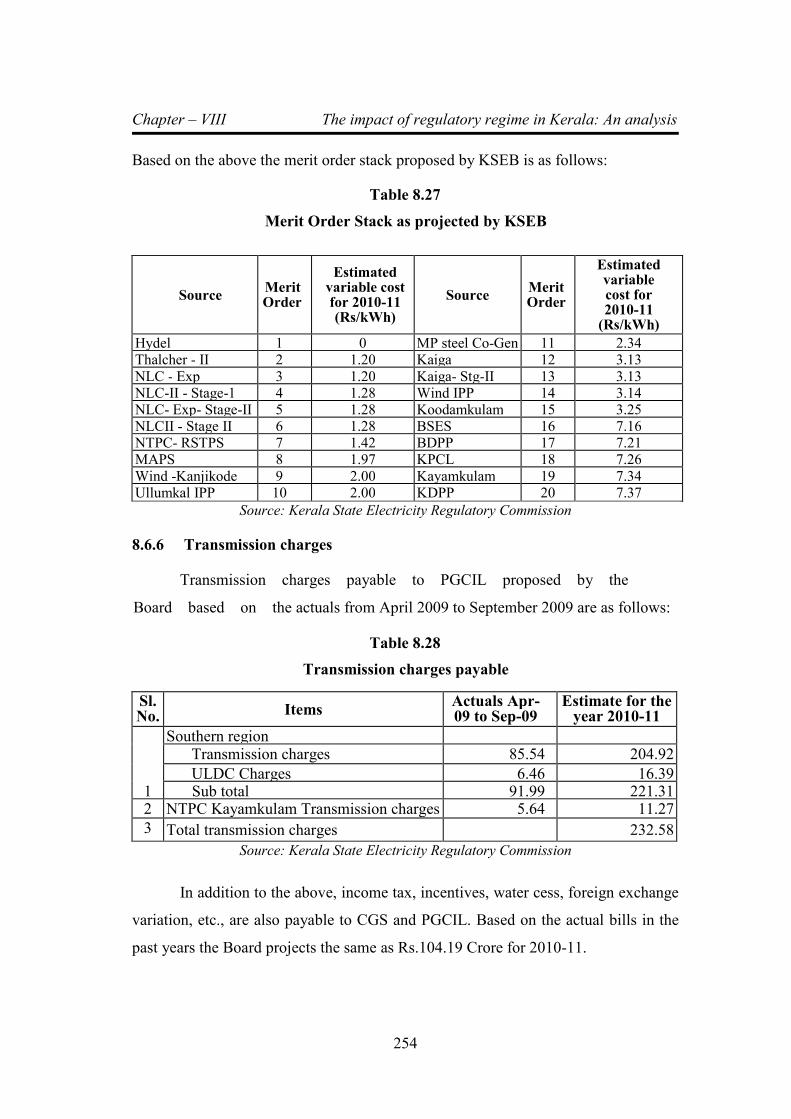
Chapter – VIII The impact of regulatory regime in Kerala: An analysis
254
Based on the above the merit order stack proposed by KSEB is as follows:
Table 8.27
Merit Order Stack as projected by KSEB
Source Merit Order
Estimated variable cost for 2010-11 (Rs/kWh)
Source Merit Order
Estimated variable cost for 2010-11
(Rs/kWh)
Hydel 1 0 MP steel Co-Gen 11 2.34 Thalcher - II 2 1.20 Kaiga 12 3.13
NLC - Exp 3 1.20 Kaiga- Stg-II 13 3.13 NLC-II - Stage-1 4 1.28 Wind IPP 14 3.14 NLC- Exp- Stage-II 5 1.28 Koodamkulam 15 3.25 NLCII - Stage II 6 1.28 BSES 16 7.16 NTPC- RSTPS 7 1.42 BDPP 17 7.21 MAPS 8 1.97 KPCL 18 7.26
Wind -Kanjikode 9 2.00 Kayamkulam 19 7.34 Ullumkal IPP 10 2.00 KDPP 20 7.37
Source: Kerala State Electricity Regulatory Commission
8.6.6 Transmission charges
Transmission charges payable to PGCIL proposed by the
Board based on the actuals from April 2009 to September 2009 are as follows:
Table 8.28
Transmission charges payable
Sl. No. Items
Actuals Apr-09 to Sep-09
Estimate for the year 2010-11
1
Southern region Transmission charges 85.54 204.92
ULDC Charges 6.46 16.39 Sub total 91.99 221.31
2 NTPC Kayamkulam Transmission charges 5.64 11.27
3
Total transmission charges 232.58
Source: Kerala State Electricity Regulatory Commission
In addition to the above, income tax, incentives, water cess, foreign exchange
variation, etc., are also payable to CGS and PGCIL. Based on the actual bills in the
past years the Board projects the same as Rs.104.19 Crore for 2010-11.
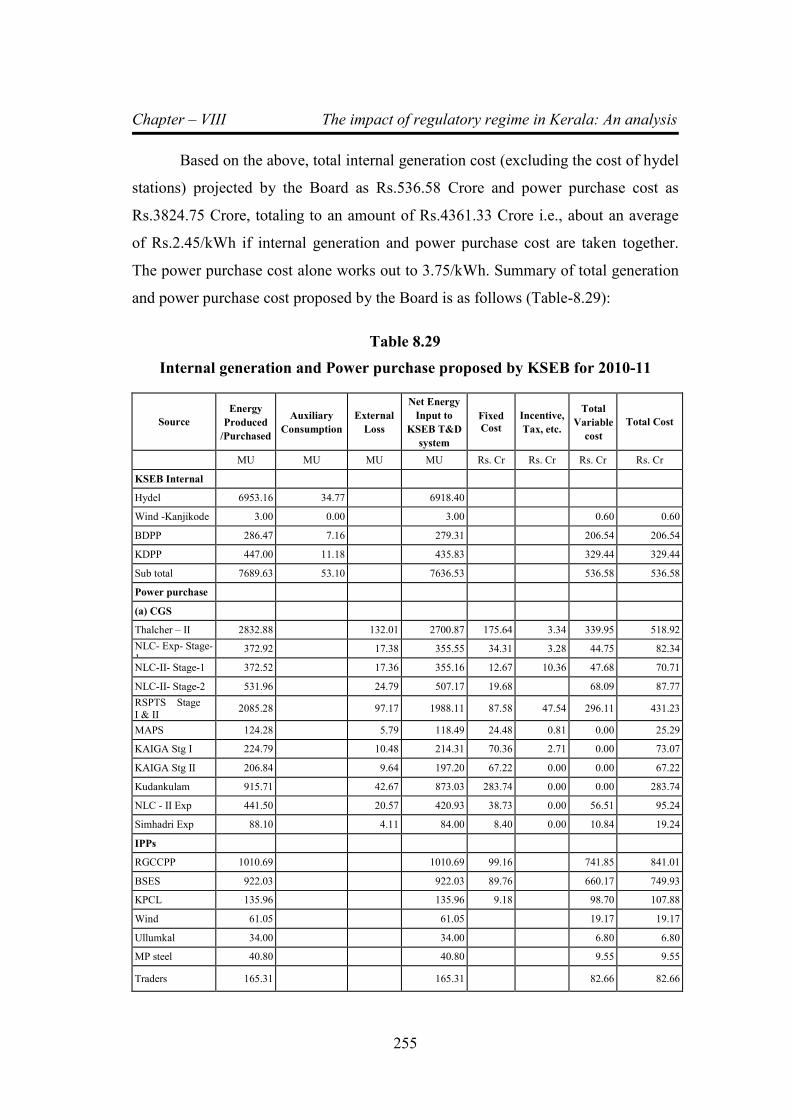
Chapter – VIII The impact of regulatory regime in Kerala: An analysis
255
Based on the above, total internal generation cost (excluding the cost of hydel
stations) projected by the Board as Rs.536.58 Crore and power purchase cost as
Rs.3824.75 Crore, totaling to an amount of Rs.4361.33 Crore i.e., about an average
of Rs.2.45/kWh if internal generation and power purchase cost are taken together.
The power purchase cost alone works out to 3.75/kWh. Summary of total generation
and power purchase cost proposed by the Board is as follows (Table-8.29):
Table 8.29
Internal generation and Power purchase proposed by KSEB for 2010-11
Source
Energy
Produced
/Purchased
Auxiliary
Consumption
External
Loss
Net Energy
Input to
KSEB T&D
system
Fixed
Cost
Incentive,
Tax, etc.
Total
Variable
cost
Total Cost
MU MU MU MU Rs. Cr Rs. Cr Rs. Cr Rs. Cr
KSEB Internal
Hydel 6953.16 34.77 6918.40
Wind -Kanjikode 3.00 0.00 3.00 0.60 0.60
BDPP 286.47 7.16 279.31 206.54 206.54
KDPP 447.00 11.18 435.83 329.44 329.44
Sub total 7689.63 53.10 7636.53 536.58 536.58
Power purchase
(a) CGS
Thalcher – II 2832.88 132.01 2700.87 175.64 3.34 339.95 518.92
NLC- Exp- Stage-1
372.92 17.38 355.55 34.31 3.28 44.75 82.34
NLC-II- Stage-1 372.52 17.36 355.16 12.67 10.36 47.68 70.71
NLC-II- Stage-2 531.96 24.79 507.17 19.68 68.09 87.77
RSPTS Stage
I & II 2085.28 97.17 1988.11 87.58 47.54 296.11 431.23
MAPS 124.28 5.79 118.49 24.48 0.81 0.00 25.29
KAIGA Stg I 224.79 10.48 214.31 70.36 2.71 0.00 73.07
KAIGA Stg II 206.84 9.64 197.20 67.22 0.00 0.00 67.22
Kudankulam 915.71 42.67 873.03 283.74 0.00 0.00 283.74
NLC - II Exp 441.50 20.57 420.93 38.73 0.00 56.51 95.24
Simhadri Exp 88.10 4.11 84.00 8.40 0.00 10.84 19.24
IPPs
RGCCPP 1010.69 1010.69 99.16 741.85 841.01
BSES 922.03 922.03 89.76 660.17 749.93
KPCL 135.96 135.96 9.18 98.70 107.88
Wind 61.05 61.05 19.17 19.17
Ullumkal 34.00 34.00 6.80 6.80
MP steel 40.80 40.80 9.55 9.55
Traders 165.31 165.31 82.66 82.66
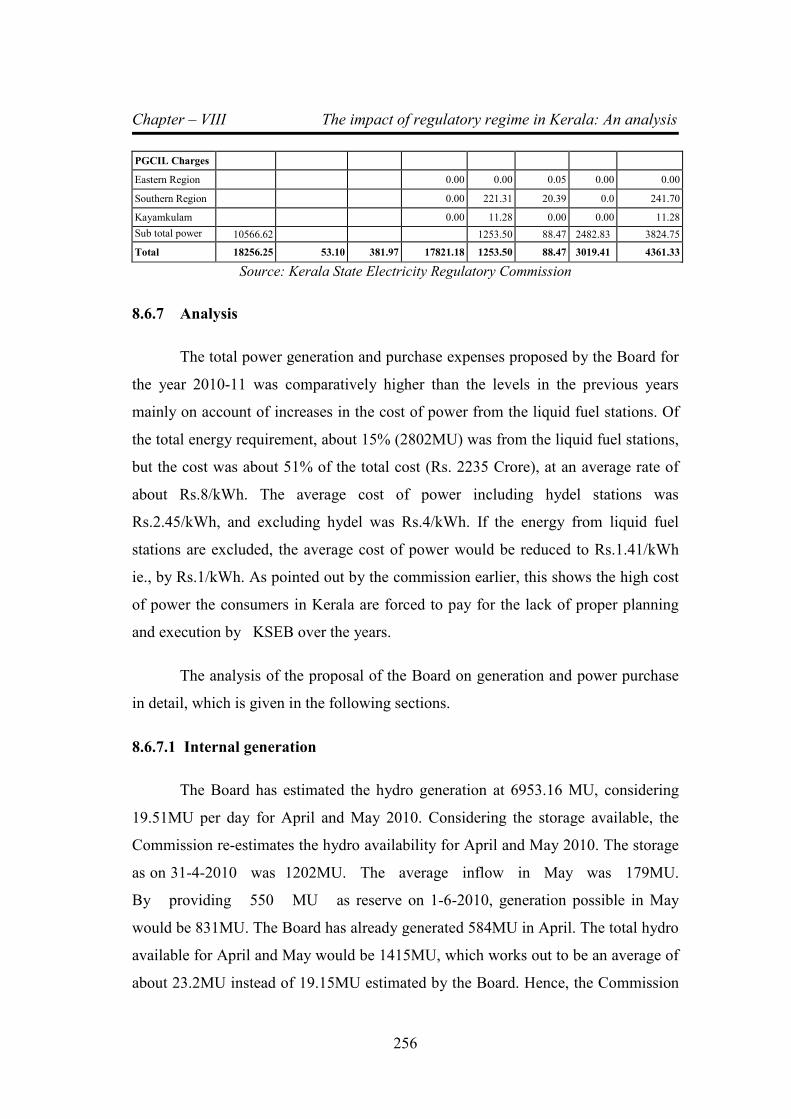
Chapter – VIII The impact of regulatory regime in Kerala: An analysis
256
PGCIL Charges
Eastern Region 0.00 0.00 0.05 0.00 0.00
Southern Region 0.00 221.31 20.39 0.0 241.70
Kayamkulam 0.00 11.28 0.00 0.00 11.28
Sub total power
purchase 10566.62 1253.50 88.47 2482.83 3824.75
Total 18256.25 53.10 381.97 17821.18 1253.50 88.47 3019.41 4361.33
Source: Kerala State Electricity Regulatory Commission
8.6.7 Analysis
The total power generation and purchase expenses proposed by the Board for
the year 2010-11 was comparatively higher than the levels in the previous years
mainly on account of increases in the cost of power from the liquid fuel stations. Of
the total energy requirement, about 15% (2802MU) was from the liquid fuel stations,
but the cost was about 51% of the total cost (Rs. 2235 Crore), at an average rate of
about Rs.8/kWh. The average cost of power including hydel stations was
Rs.2.45/kWh, and excluding hydel was Rs.4/kWh. If the energy from liquid fuel
stations are excluded, the average cost of power would be reduced to Rs.1.41/kWh
ie., by Rs.1/kWh. As pointed out by the commission earlier, this shows the high cost
of power the consumers in Kerala are forced to pay for the lack of proper planning
and execution by KSEB over the years.
The analysis of the proposal of the Board on generation and power purchase
in detail, which is given in the following sections.
8.6.7.1 Internal generation
The Board has estimated the hydro generation at 6953.16 MU, considering
19.51MU per day for April and May 2010. Considering the storage available, the
Commission re-estimates the hydro availability for April and May 2010. The storage
as on 31-4-2010 was 1202MU. The average inflow in May was 179MU.
By providing 550 MU as reserve on 1-6-2010, generation possible in May
would be 831MU. The Board has already generated 584MU in April. The total hydro
available for April and May would be 1415MU, which works out to be an average of
about 23.2MU instead of 19.15MU estimated by the Board. Hence, the Commission
Chapter – VIII The impact of regulatory regime in Kerala: An analysis
257
considered a conservative estimate of 23MU per day for April and May, 2010. Thus
the estimated hydro generation for 2010-11 would be about 234MU higher than the
estimates of the Board. Hence the Commission re-estimated the hydro availability at
7187 MU.
The Board has projected 733.47 MU from BDPP and KDPP at the rate of
Rs.7.21/kWh and Rs.7.37/kWh. The Commission generally projects the cost of
power from these stations based on the projections of KSEB and price of fuel. The
Commission has already issued KSERC (Fuel Price Adjustment formula)
Regulations, 2009. As per the regulation, the difference in fuel cost over the
approved level will be adjusted in each quarter considering the benchmark
performance parameter such as station heat rate, specific fuel oil consumption etc.,
The Commission as part of fixing the benchmark parameters, sought the details of
station heat rate (including the heat rate prescribed by the manufacturers) and other
parameters. KSEB provided the actual performance parameters up to the month of
December 2009. The Commission also convened a meeting with KSEB on this issue
on 16-4-2010. In the meeting, the Board presented its draft normative calculations by
considering derating, PLF and other corrections, which was about 10 to 20% higher
than the actual values. In the case of KDPP, the Board has stated certain assumptions
have been used in the past to estimate the parameters. The Commission has directed
the Board to separately provide its proposal on this. The Commission was of the
view that the proposal of the Board can be considered after a consultation process. In
the mean time, for the purpose of estimation, following values based on the data
submitted by KSEB was used, which shall be replaced with approved normative
parameters as and when it is approved by the Commission. Accordingly tentative
benchmark parameters are worked out as follows (Table-8.30)
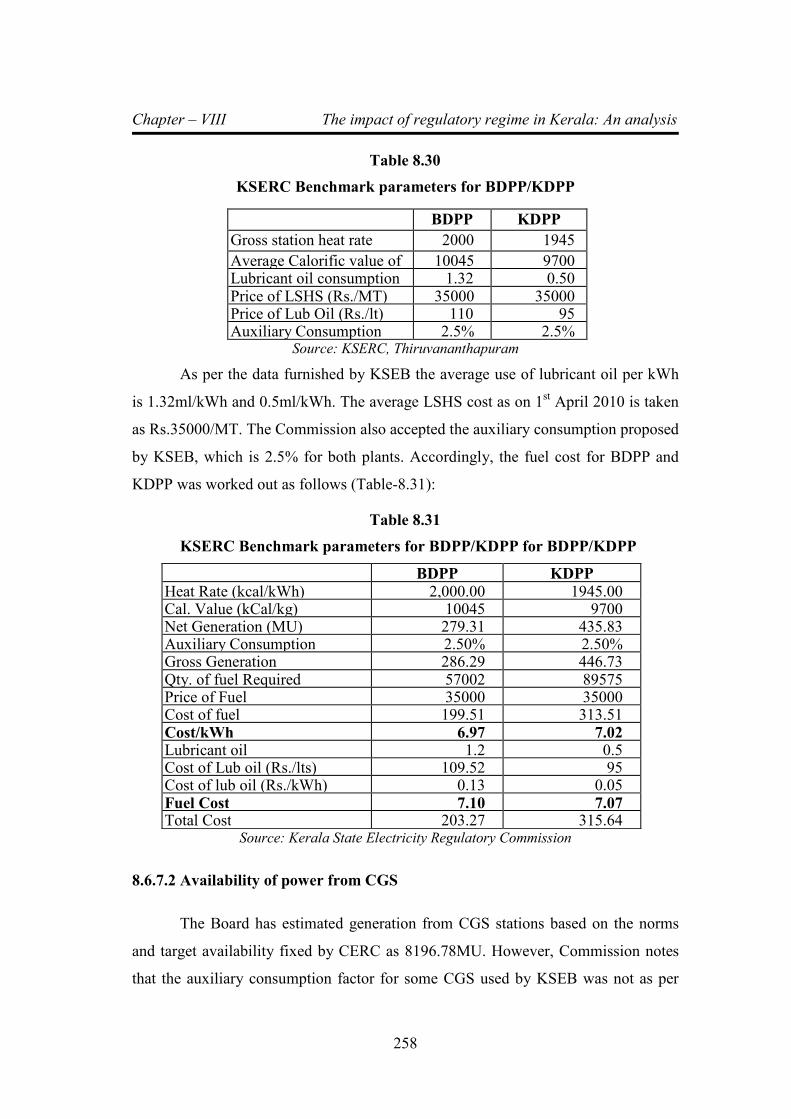
Chapter – VIII The impact of regulatory regime in Kerala: An analysis
258
Table 8.30
KSERC Benchmark parameters for BDPP/KDPP
BDPP KDPP
Gross station heat rate
(kCal/kWh)
2000 1945
Average Calorific value of 10045 9700 Lubricant oil consumption 1.32 0.50 Price of LSHS (Rs./MT) 35000 35000 Price of Lub Oil (Rs./lt) 110 95 Auxiliary Consumption 2.5% 2.5%
Source: KSERC, Thiruvananthapuram
As per the data furnished by KSEB the average use of lubricant oil per kWh
is 1.32ml/kWh and 0.5ml/kWh. The average LSHS cost as on 1st April 2010 is taken
as Rs.35000/MT. The Commission also accepted the auxiliary consumption proposed
by KSEB, which is 2.5% for both plants. Accordingly, the fuel cost for BDPP and
KDPP was worked out as follows (Table-8.31):
Table 8.31
KSERC Benchmark parameters for BDPP/KDPP for BDPP/KDPP
BDPP KDPP
Heat Rate (kcal/kWh) 2,000.00 1945.00 Cal. Value (kCal/kg) 10045 9700 Net Generation (MU) 279.31 435.83 Auxiliary Consumption 2.50% 2.50% Gross Generation 286.29 446.73 Qty. of fuel Required 57002 89575 Price of Fuel 35000 35000 Cost of fuel 199.51 313.51 Cost/kWh 6.97 7.02 Lubricant oil 1.2 0.5 Cost of Lub oil (Rs./lts) 109.52 95 Cost of lub oil (Rs./kWh) 0.13 0.05 Fuel Cost 7.10 7.07 Total Cost 203.27 315.64
Source: Kerala State Electricity Regulatory Commission
8.6.7.2 Availability of power from CGS
The Board has estimated generation from CGS stations based on the norms
and target availability fixed by CERC as 8196.78MU. However, Commission notes
that the auxiliary consumption factor for some CGS used by KSEB was not as per
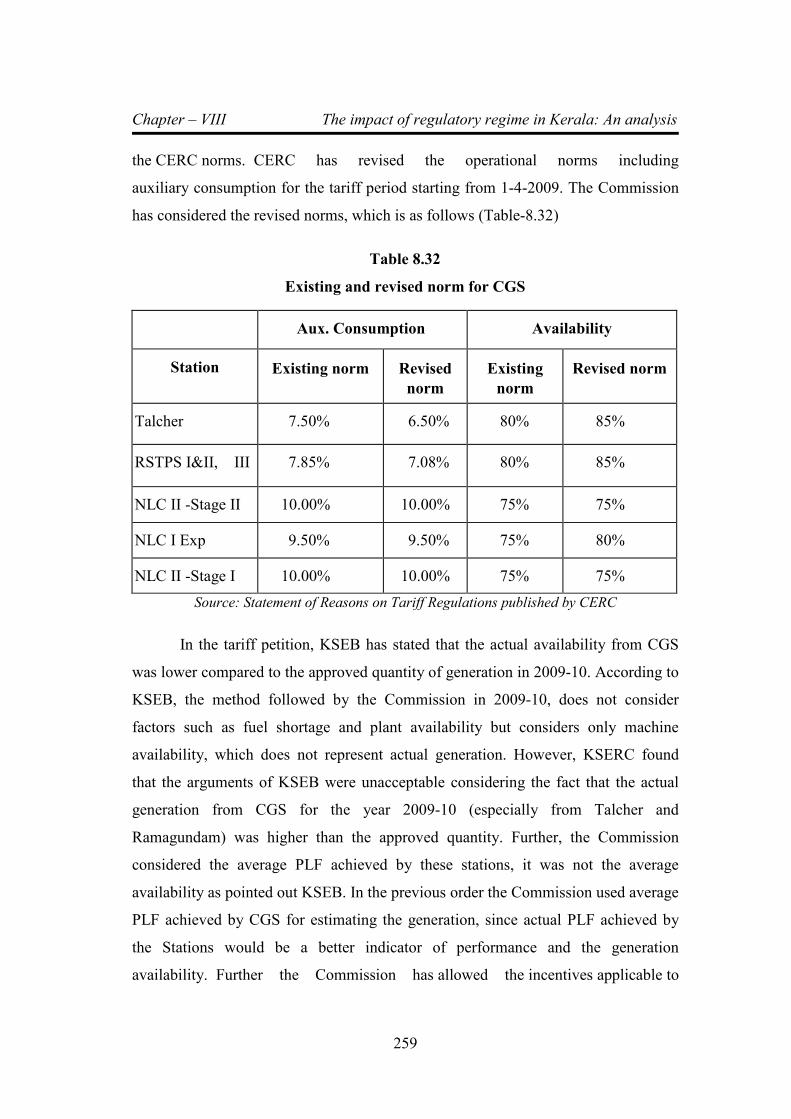
Chapter – VIII The impact of regulatory regime in Kerala: An analysis
259
the CERC norms. CERC has revised the operational norms including
auxiliary consumption for the tariff period starting from 1-4-2009. The Commission
has considered the revised norms, which is as follows (Table-8.32)
Table 8.32
Existing and revised norm for CGS
Aux. Consumption Availability
Station Existing norm Revised
norm
Existing
norm
Revised norm
Talcher 7.50% 6.50% 80% 85%
RSTPS I&II, III 7.85% 7.08% 80% 85%
NLC II -Stage II 10.00% 10.00% 75% 75%
NLC I Exp 9.50% 9.50% 75% 80%
NLC II -Stage I 10.00% 10.00% 75% 75%
Source: Statement of Reasons on Tariff Regulations published by CERC
In the tariff petition, KSEB has stated that the actual availability from CGS
was lower compared to the approved quantity of generation in 2009-10. According to
KSEB, the method followed by the Commission in 2009-10, does not consider
factors such as fuel shortage and plant availability but considers only machine
availability, which does not represent actual generation. However, KSERC found
that the arguments of KSEB were unacceptable considering the fact that the actual
generation from CGS for the year 2009-10 (especially from Talcher and
Ramagundam) was higher than the approved quantity. Further, the Commission
considered the average PLF achieved by these stations, it was not the average
availability as pointed out KSEB. In the previous order the Commission used average
PLF achieved by CGS for estimating the generation, since actual PLF achieved by
the Stations would be a better indicator of performance and the generation
availability. Further the Commission has allowed the incentives applicable to

Chapter – VIII The impact of regulatory regime in Kerala: An analysis
260
the CGS at actuals. Since incentives are based on the actual performance, it would
always fair to consider the average performance over the years. The PLF represents
the actual performance of the station, which takes into consideration the availability
of fuel. The performance of Central Stations as given by CERC is given below
(Table-8.33):
Table 8.33
Actual PLF Achieved by CGS Stations
CGS 2002-03 2003-04 2004-05 2005-06 2006-07 2007-08 Average
Talcher 73% 82% 82% 84% 90% 94% 88%
RSTPS I&II,
III
92% 89% 91% 86% 89% 90% 89%
NLC II -
Stage II
80% 80% 72% 72% 73% 81% 75%
NLC I Exp 54% 88% 84% 89% 89% 87%
NLC II -Stage I 83% 74% 72% 70% 57% 82% 70%
Source: Statement of reasons published by CERC
The average PLF of Central stations is much higher than the target
availability norms especially in the case of Ramagundam and Talcher. The
Commission also verified the actual PLF achieved by the existing CGS especially
Talcher and NTPC Ramagudam, which are much higher for the year 2009-10 than
the PLF used by the Commission in 2009-10. Hence, the Commission concluded that
there is no reason to deviate from the methodology followed in the previous order.
Hence the Commission has decided to approach the matter following the same
method as used in 2009-10. Accordingly, the Commission re-estimated the
generation from CGS stations as below (Table 8.34).
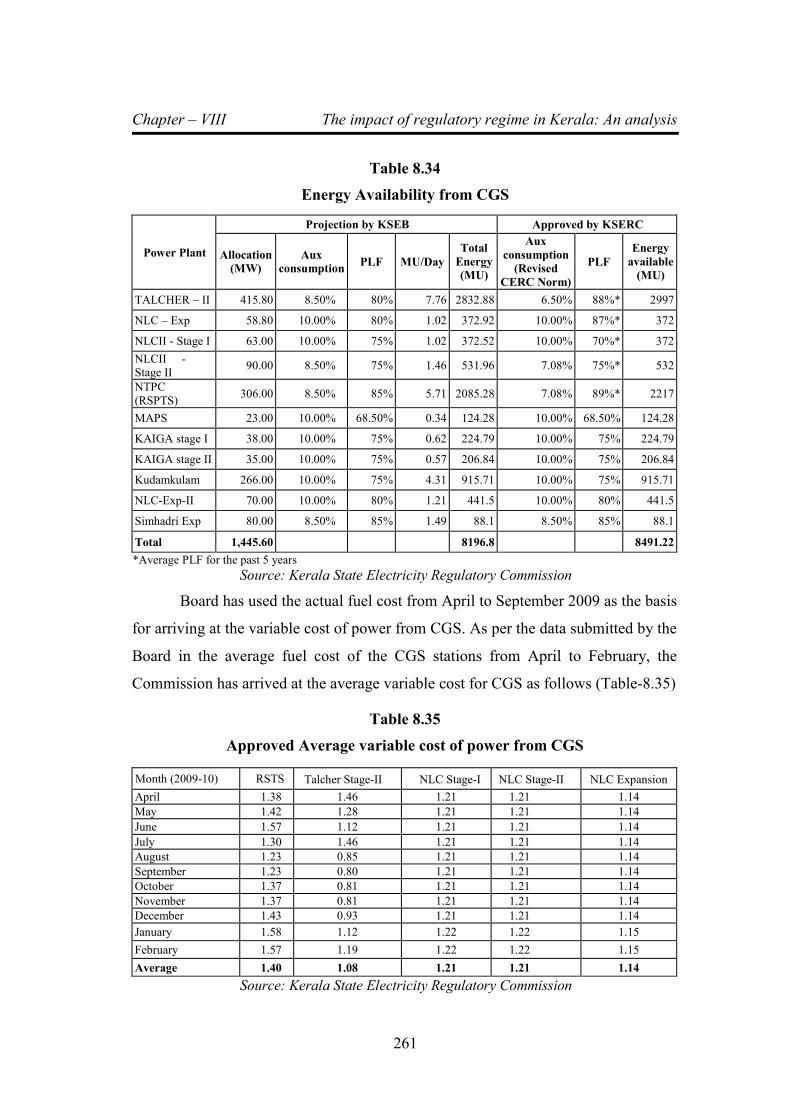
Chapter – VIII The impact of regulatory regime in Kerala: An analysis
261
Table 8.34
Energy Availability from CGS
Power Plant
Projection by KSEB Approved by KSERC
Allocation
(MW) Aux
consumption PLF MU/Day Total
Energy (MU)
Aux
consumption (Revised
CERC Norm)
PLF Energy
available (MU)
TALCHER – II 415.80 8.50% 80% 7.76 2832.88 6.50% 88%* 2997
NLC – Exp 58.80 10.00% 80% 1.02 372.92 10.00% 87%* 372
NLCII - Stage I 63.00 10.00% 75% 1.02 372.52 10.00% 70%* 372 NLCII - Stage II 90.00 8.50% 75% 1.46 531.96 7.08% 75%* 532
NTPC
(RSPTS) 306.00 8.50% 85% 5.71 2085.28 7.08% 89%* 2217
MAPS 23.00 10.00% 68.50% 0.34 124.28 10.00% 68.50% 124.28
KAIGA stage I 38.00 10.00% 75% 0.62 224.79 10.00% 75% 224.79
KAIGA stage II 35.00 10.00% 75% 0.57 206.84 10.00% 75% 206.84
Kudamkulam 266.00 10.00% 75% 4.31 915.71 10.00% 75% 915.71
NLC-Exp-II 70.00 10.00% 80% 1.21 441.5 10.00% 80% 441.5
Simhadri Exp 80.00 8.50% 85% 1.49 88.1 8.50% 85% 88.1
Total 1,445.60 8196.8 8491.22 *Average PLF for the past 5 years
Source: Kerala State Electricity Regulatory Commission
Board has used the actual fuel cost from April to September 2009 as the basis
for arriving at the variable cost of power from CGS. As per the data submitted by the
Board in the average fuel cost of the CGS stations from April to February, the
Commission has arrived at the average variable cost for CGS as follows (Table-8.35)
Table 8.35
Approved Average variable cost of power from CGS
Month (2009-10) RSTS Talcher Stage-II NLC Stage-I NLC Stage-II NLC Expansion
April 1.38 1.46 1.21 1.21 1.14
May 1.42 1.28 1.21 1.21 1.14
June 1.57 1.12 1.21 1.21 1.14
July 1.30 1.46 1.21 1.21 1.14
August 1.23 0.85 1.21 1.21 1.14
September 1.23 0.80 1.21 1.21 1.14
October 1.37 0.81 1.21 1.21 1.14
November 1.37 0.81 1.21 1.21 1.14
December 1.43 0.93 1.21 1.21 1.14
January 1.58 1.12 1.22 1.22 1.15
February 1.57 1.19 1.22 1.22 1.15
Average 1.40 1.08 1.21 1.21 1.14
Source: Kerala State Electricity Regulatory Commission
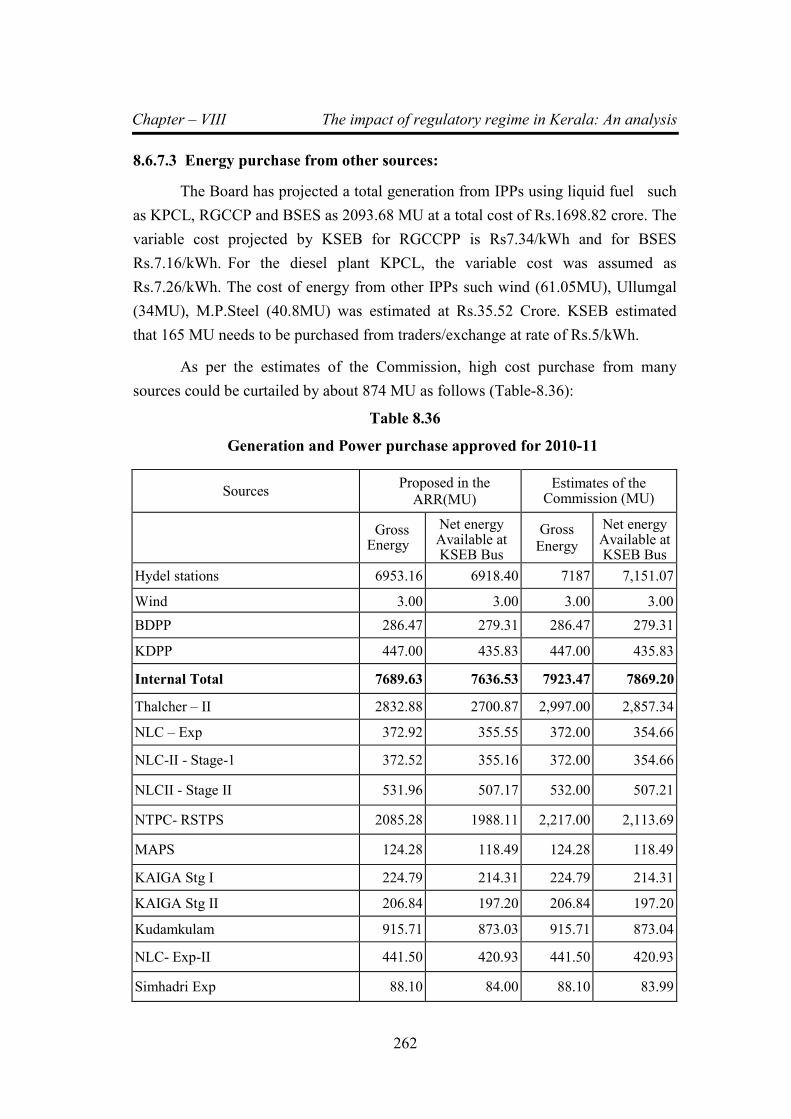
Chapter – VIII The impact of regulatory regime in Kerala: An analysis
262
8.6.7.3 Energy purchase from other sources:
The Board has projected a total generation from IPPs using liquid fuel such
as KPCL, RGCCP and BSES as 2093.68 MU at a total cost of Rs.1698.82 crore. The
variable cost projected by KSEB for RGCCPP is Rs7.34/kWh and for BSES
Rs.7.16/kWh. For the diesel plant KPCL, the variable cost was assumed as
Rs.7.26/kWh. The cost of energy from other IPPs such wind (61.05MU), Ullumgal
(34MU), M.P.Steel (40.8MU) was estimated at Rs.35.52 Crore. KSEB estimated
that 165 MU needs to be purchased from traders/exchange at rate of Rs.5/kWh.
As per the estimates of the Commission, high cost purchase from many
sources could be curtailed by about 874 MU as follows (Table-8.36):
Table 8.36
Generation and Power purchase approved for 2010-11
Sources Proposed in the
ARR(MU) Estimates of the
Commission (MU)
Gross Energy
Net energy Available at KSEB Bus
Gross
Energy
Net energy Available at KSEB Bus
Hydel stations 6953.16 6918.40 7187 7,151.07
Wind 3.00 3.00 3.00 3.00
BDPP 286.47 279.31 286.47 279.31
KDPP 447.00 435.83 447.00 435.83
Internal Total 7689.63 7636.53 7923.47 7869.20
Thalcher – II 2832.88 2700.87 2,997.00 2,857.34
NLC – Exp 372.92 355.55 372.00 354.66
NLC-II - Stage-1 372.52 355.16 372.00 354.66
NLCII - Stage II 531.96 507.17 532.00 507.21
NTPC- RSTPS 2085.28 1988.11 2,217.00 2,113.69
MAPS 124.28 118.49 124.28 118.49
KAIGA Stg I 224.79 214.31 224.79 214.31
KAIGA Stg II 206.84 197.20 206.84 197.20
Kudamkulam 915.71 873.03 915.71 873.04
NLC- Exp-II 441.50 420.93 441.50 420.93
Simhadri Exp 88.10 84.00 88.10 83.99

Chapter – VIII The impact of regulatory regime in Kerala: An analysis
263
CGS Total 8196.78 7814.81 8491.22 8095.53
Kayamkulam 1010.69 1010.69 1010.69 1010.69
BSES 922.03 922.03 922.03 922.03
KPCL 135.96 135.96 135.96 135.96
Wind 61.05 61.05 61.05 61.05
Ullumkal 34.00 34.00 34.00 34.00
MPS Steel 40.80 40.80 40.80 40.80
Purchase from Traders 165.31 165.31 165.31 165.31
Purchase other than CGS 2370 2370 2370 2370
Total 18256 17821 18785 18335
Energy requirement at KSEB BUS
17821 17461
Surplus 0 874
Source: Kerala State Electricity Regulatory Commission
Based on the merit order principle, the surplus energy should be deducted
from the high cost sources. As per the merit order, the highest cost plants are the
liquid fuel stations as follows (Table 8.37):
Table 8.37
Variable cost of high cost thermal power plants in Kerala
Stations Rate (Rs./kWh)
KDPP 7.07 BDPP 7.10
BSES 7.16
KPCL 7.26
RGCCPP 7.34
Source: Kerala State Electricity Regulatory Commission
Though the RGCCP is the bottom of the merit order stack, because of
compensatory share received from CGS, the pooled cost of RGCCP would be lower
than Rs.7/kWh, hence, it is excluded from the list. For the other stations the cost
ranges from Rs.7.00/kWh to Rs,7.30/kWh. Since all the plants are required for
meeting the peak, proportionate reduction method was followed for eliminating the
surplus energy (Table 8.38).
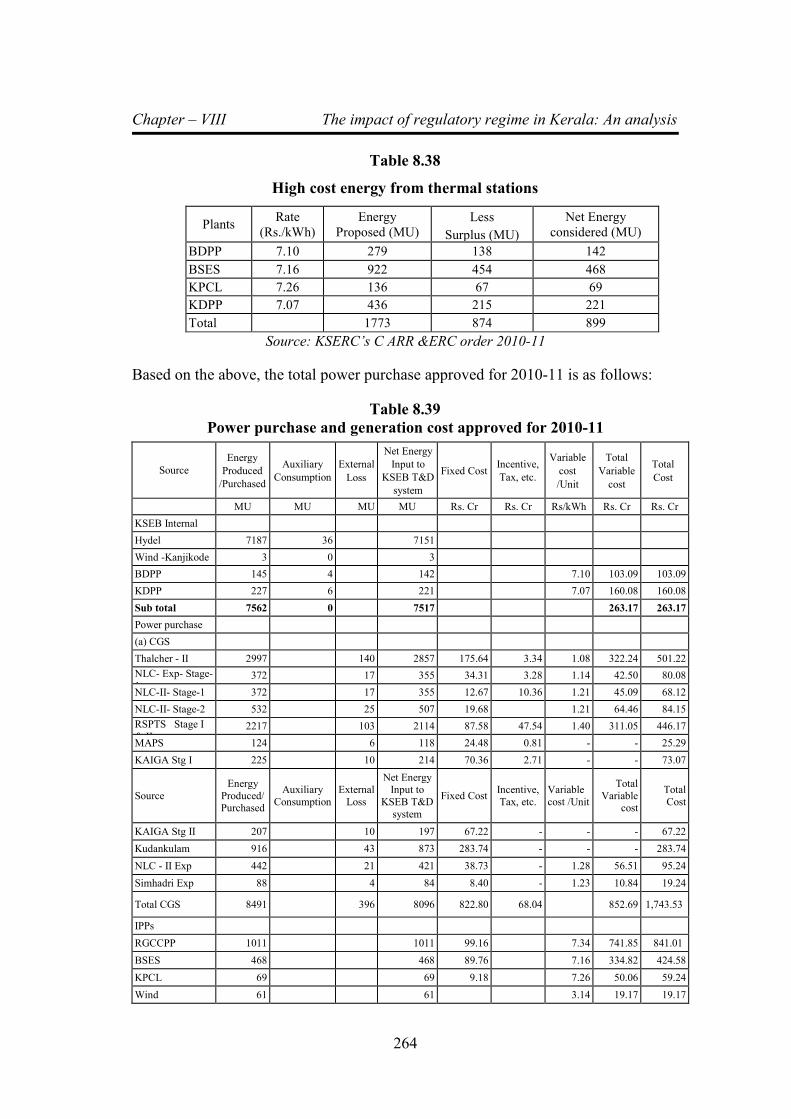
Chapter – VIII The impact of regulatory regime in Kerala: An analysis
264
Table 8.38
High cost energy from thermal stations
Plants Rate
(Rs./kWh)
Energy
Proposed (MU)
Less
Surplus (MU)
Net Energy
considered (MU)
BDPP 7.10 279 138 142
BSES 7.16 922 454 468
KPCL 7.26 136 67 69
KDPP 7.07 436 215 221
Total 1773 874 899
Source: KSERC’s C ARR &ERC order 2010-11
Based on the above, the total power purchase approved for 2010-11 is as follows:
Table 8.39
Power purchase and generation cost approved for 2010-11
Source
Energy
Produced
/Purchased
Auxiliary
Consumption
External
Loss
Net Energy
Input to
KSEB T&D
system
Fixed Cost Incentive,
Tax, etc.
Variable
cost
/Unit
Total
Variable
cost
Total
Cost
MU MU MU MU Rs. Cr Rs. Cr Rs/kWh Rs. Cr Rs. Cr
KSEB Internal
Hydel 7187 36 7151
Wind -Kanjikode 3 0 3
BDPP 145 4 142 7.10 103.09 103.09
KDPP 227 6 221 7.07 160.08 160.08
Sub total 7562 0 7517 263.17 263.17
Power purchase
(a) CGS
Thalcher - II 2997 140 2857 175.64 3.34 1.08 322.24 501.22
NLC- Exp- Stage-
1 372 17 355 34.31 3.28 1.14 42.50 80.08
NLC-II- Stage-1 372 17 355 12.67 10.36 1.21 45.09 68.12
NLC-II- Stage-2 532 25 507 19.68 1.21 64.46 84.15
RSPTS Stage I
& II 2217 103 2114 87.58 47.54 1.40 311.05 446.17
MAPS 124 6 118 24.48 0.81 - - 25.29
KAIGA Stg I 225 10 214 70.36 2.71 - - 73.07
Source
Energy
Produced/ Purchased
Auxiliary
Consumption
External
Loss
Net Energy Input to
KSEB T&D
system
Fixed Cost Incentive,
Tax, etc.
Variable
cost /Unit
Total
Variable cost
Total
Cost
KAIGA Stg II 207 10 197 67.22 - - - 67.22
Kudankulam 916 43 873 283.74 - - - 283.74
NLC - II Exp 442 21 421 38.73 - 1.28 56.51 95.24
Simhadri Exp 88 4 84 8.40 - 1.23 10.84 19.24
Total CGS 8491 396 8096 822.80 68.04 852.69 1,743.53
IPPs
RGCCPP 1011 1011 99.16 7.34 741.85 841.01
BSES 468 468 89.76 7.16 334.82 424.58
KPCL 69 69 9.18 7.26 50.06 59.24
Wind 61 61 3.14 19.17 19.17
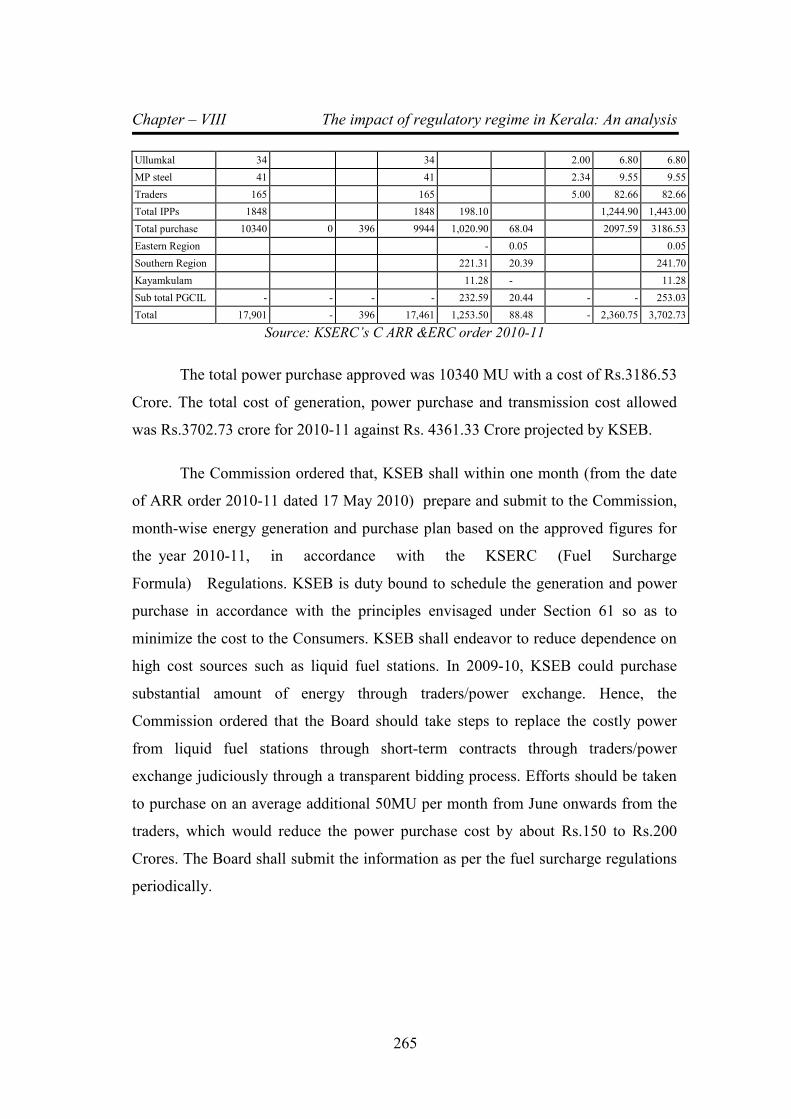
Chapter – VIII The impact of regulatory regime in Kerala: An analysis
265
Ullumkal 34 34 2.00 6.80 6.80
MP steel 41 41 2.34 9.55 9.55
Traders 165 165 5.00 82.66 82.66
Total IPPs 1848 1848 198.10 1,244.90 1,443.00
Total purchase 10340 0 396 9944 1,020.90 68.04 2097.59 3186.53
Eastern Region - 0.05 0.05
Southern Region 221.31 20.39 241.70
Kayamkulam 11.28 - 11.28
Sub total PGCIL - - - - 232.59 20.44 - - 253.03
Total 17,901 - 396 17,461 1,253.50 88.48 - 2,360.75 3,702.73
Source: KSERC’s C ARR &ERC order 2010-11
The total power purchase approved was 10340 MU with a cost of Rs.3186.53
Crore. The total cost of generation, power purchase and transmission cost allowed
was Rs.3702.73 crore for 2010-11 against Rs. 4361.33 Crore projected by KSEB.
The Commission ordered that, KSEB shall within one month (from the date
of ARR order 2010-11 dated 17 May 2010) prepare and submit to the Commission,
month-wise energy generation and purchase plan based on the approved figures for
the year 2010-11, in accordance with the KSERC (Fuel Surcharge
Formula) Regulations. KSEB is duty bound to schedule the generation and power
purchase in accordance with the principles envisaged under Section 61 so as to
minimize the cost to the Consumers. KSEB shall endeavor to reduce dependence on
high cost sources such as liquid fuel stations. In 2009-10, KSEB could purchase
substantial amount of energy through traders/power exchange. Hence, the
Commission ordered that the Board should take steps to replace the costly power
from liquid fuel stations through short-term contracts through traders/power
exchange judiciously through a transparent bidding process. Efforts should be taken
to purchase on an average additional 50MU per month from June onwards from the
traders, which would reduce the power purchase cost by about Rs.150 to Rs.200
Crores. The Board shall submit the information as per the fuel surcharge regulations
periodically.
Chapter – VIII The impact of regulatory regime in Kerala: An analysis
266
In order to insulate the licensee from hydro risk, the Commission would
resort to a comprehensive review of hydro energy availability in the month of
December 2010, by then the rainfall position and the shortage/surpluses if any would
be reasonably established. Accordingly, KSEB shall approach the Commission with
all necessary details for the review and if necessary, a reasonable proposal for short
term purchase in a situation of hydro failure or reduction in availability from CGS or
short fall in meeting peak load.
8.6.8 Interest and financing charges:
The Board has projected Rs.391.62 crore towards interests and finance
charges for the year 2010-11. As against the borrowing of Rs.587 Crore and
repayment of Rs.587.34 crore proposed in 2008-09, the actual borrowing was
Rs.94.49 crore (out of which Rs.9.34 crore was on account of foreign exchange
variation) and repayment was Rs.850.crore, which was made possible by utilizing
the deposits made earlier for this purpose. Accordingly, the outstanding liability as
on 31-3-2009 was only Rs.1100 crore only compared to Rs.2295.54 crore proposed.
It was made possible by resorting to swapping of loans, borrowing from least cost
options, restricting the borrowing and reduction in cost of borrowing from Govt., and
preclosure of loans and bonds. The Board claimed that as against the approved
interest cost of Rs.365.60 crore, the actual interest cost was only Rs.339.60 crore.
In 2009-10, Board has revised estimates on capital expenditure, borrowing
and repayment. As against the proposed capital expenditure of Rs.1377.10Crore, the
revised estimate was Rs.947.65 crore. The revised borrowing would be Rs.655.79
Crore against Rs.764.87 crore proposed. As per the revised estimate for 2009-10, the
closing balance of loans and bonds will be Rs.1206.99 crore. The revised borrowing
plan proposed by the Board for 2009-10 is as follows (Table 8.40):
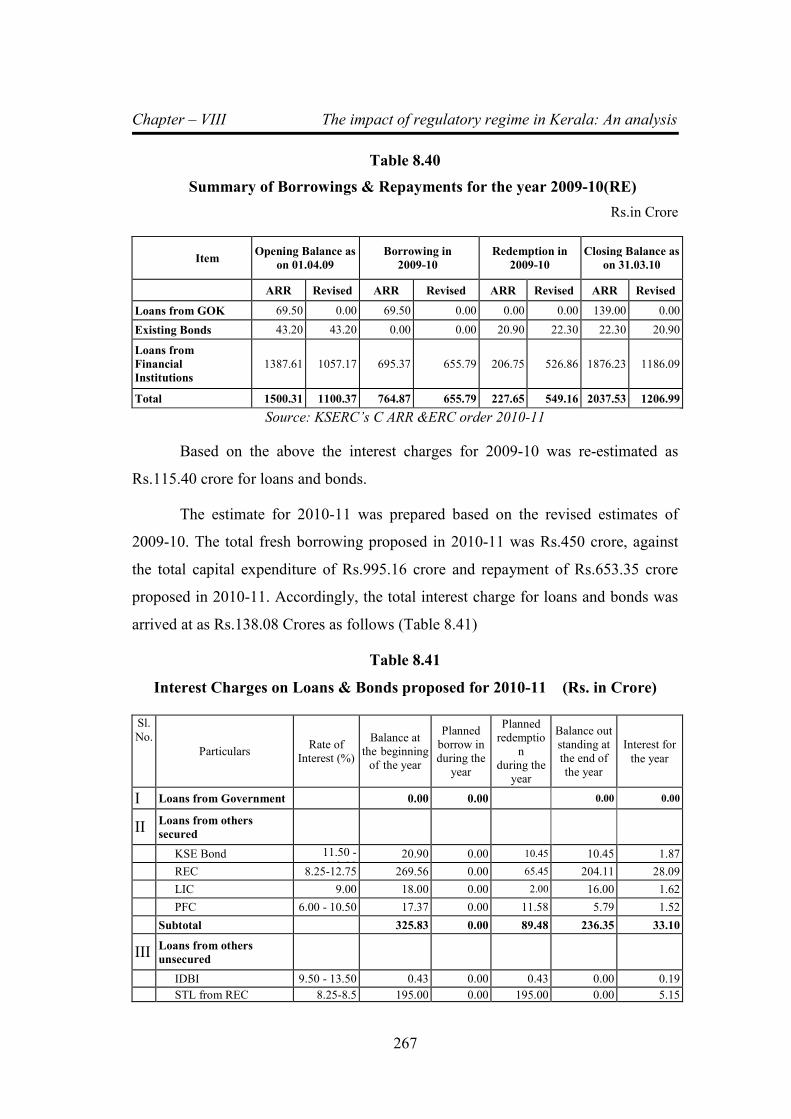
Chapter – VIII The impact of regulatory regime in Kerala: An analysis
267
Table 8.40
Summary of Borrowings & Repayments for the year 2009-10(RE)
Rs.in Crore
Item Opening Balance as
on 01.04.09 Borrowing in
2009-10 Redemption in
2009-10 Closing Balance as
on 31.03.10
ARR Revised ARR Revised ARR Revised ARR Revised
Loans from GOK 69.50 0.00 69.50 0.00 0.00 0.00 139.00 0.00
Existing Bonds 43.20 43.20 0.00 0.00 20.90 22.30 22.30 20.90
Loans from
Financial
Institutions 1387.61 1057.17 695.37 655.79 206.75 526.86 1876.23 1186.09
Total 1500.31 1100.37 764.87 655.79 227.65 549.16 2037.53 1206.99
Source: KSERC’s C ARR &ERC order 2010-11
Based on the above the interest charges for 2009-10 was re-estimated as
Rs.115.40 crore for loans and bonds.
The estimate for 2010-11 was prepared based on the revised estimates of
2009-10. The total fresh borrowing proposed in 2010-11 was Rs.450 crore, against
the total capital expenditure of Rs.995.16 crore and repayment of Rs.653.35 crore
proposed in 2010-11. Accordingly, the total interest charge for loans and bonds was
arrived at as Rs.138.08 Crores as follows (Table 8.41)
Table 8.41
Interest Charges on Loans & Bonds proposed for 2010-11 (Rs. in Crore)
Sl.
No. Particulars Rate of
Interest (%)
Balance at the beginning
of the year
Planned borrow in
during the year
Planned redemptio
n during the
year
Balance out standing at the end of the year
Interest for
the year
I Loans from Government 0.00 0.00 0.00 0.00
II Loans from others
secured
KSE Bond 11.50 -
13.00 20.90 0.00 10.45 10.45 1.87
REC 8.25-12.75 269.56 0.00 65.45 204.11 28.09
LIC 9.00 18.00 0.00 2.00 16.00 1.62
PFC 6.00 - 10.50 17.37 0.00 11.58 5.79 1.52
Subtotal 325.83 0.00 89.48 236.35 33.10
III Loans from others
unsecured
IDBI 9.50 - 13.50 0.43 0.00 0.43 0.00 0.19
STL from REC 8.25-8.5 195.00 0.00 195.00 0.00 5.15
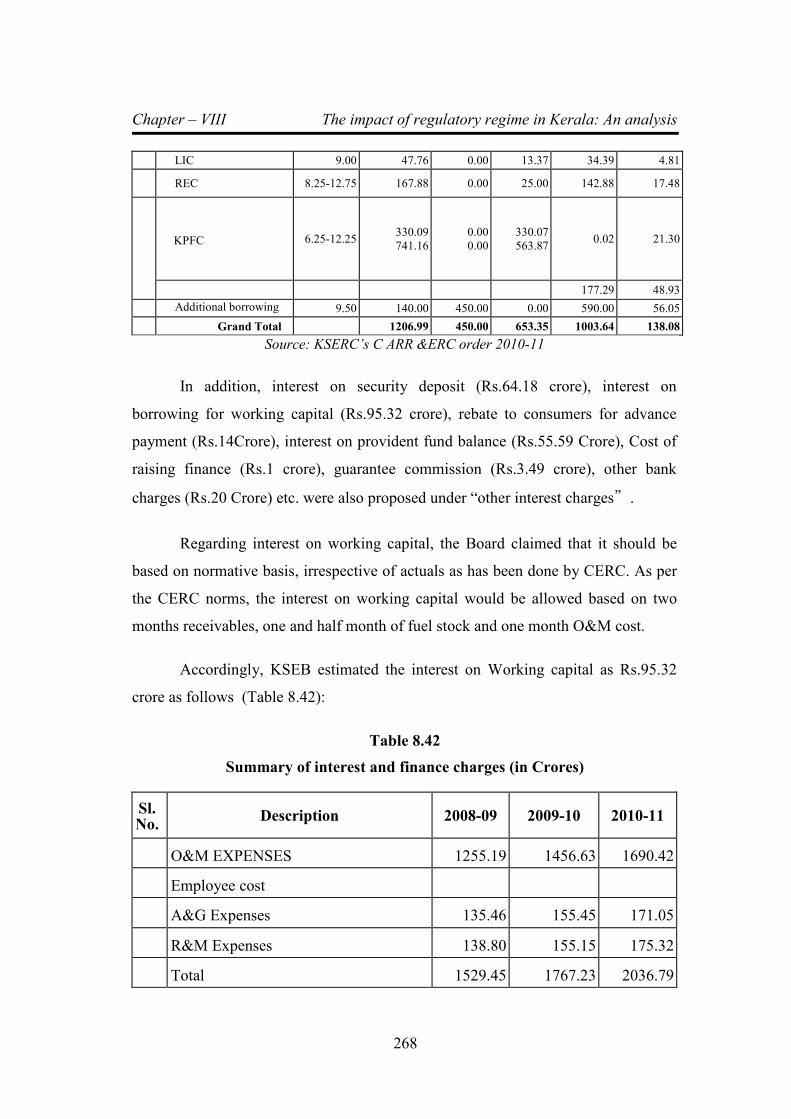
Chapter – VIII The impact of regulatory regime in Kerala: An analysis
268
LIC 9.00 47.76 0.00 13.37 34.39 4.81
REC 8.25-12.75 167.88 0.00 25.00 142.88 17.48
KPFC 6.25-12.25 330.09
741.16 0.00 0.00
330.07 563.87 0.02 21.30
177.29 48.93
Additional borrowing
10-11 9.50 140.00 450.00 0.00 590.00 56.05
Grand Total 1206.99 450.00 653.35 1003.64 138.08
Source: KSERC’s C ARR &ERC order 2010-11
In addition, interest on security deposit (Rs.64.18 crore), interest on
borrowing for working capital (Rs.95.32 crore), rebate to consumers for advance
payment (Rs.14Crore), interest on provident fund balance (Rs.55.59 Crore), Cost of
raising finance (Rs.1 crore), guarantee commission (Rs.3.49 crore), other bank
charges (Rs.20 Crore) etc. were also proposed under “other interest charges”.
Regarding interest on working capital, the Board claimed that it should be
based on normative basis, irrespective of actuals as has been done by CERC. As per
the CERC norms, the interest on working capital would be allowed based on two
months receivables, one and half month of fuel stock and one month O&M cost.
Accordingly, KSEB estimated the interest on Working capital as Rs.95.32
crore as follows (Table 8.42):
Table 8.42
Summary of interest and finance charges (in Crores)
Sl. No.
Description 2008-09 2009-10 2010-11
O&M EXPENSES 1255.19 1456.63 1690.42
Employee cost
A&G Expenses 135.46 155.45 171.05
R&M Expenses 138.80 155.15 175.32
Total 1529.45 1767.23 2036.79

Chapter – VIII The impact of regulatory regime in Kerala: An analysis
269
1/12th of above A 127.45 147.27 169.73
Receivables
Annual Revenue 4893.02 4531.00 4867.00
Receivables equivalent to 2 months 815.50 753.83 809.00
Fuel including stock 322.21 330.12 334.28
Fuel and stock equivalent to 1 ½
months 40.28 41.27 41.78
Total Working Capital (A+B+C) 983.23 943.7 1020.51
Interest on working capital @9.34% 95.32
Source: KSERC’s C ARR &ERC order 2010-11
Thus, total interest & financing charges proposed at Rs.391.632 crore for 2010-11
as follows (Table 8.43):
Table No. 8.43
Summary of Interest and Finance Charges (Rs. in Crores)
Particulars 2008-09 2009-10 2010-11
Accounts RR SERC Revised Estimate
I - Interest on outstanding Loans & Bonds 151.31 188.45 188.94 115.40 138.08
II - Interest on Security Deposit 50.50 50.50 50.50 55.35 64.18
III - Other Interest and Finance Charges
Interest on borrowings for working
capital
22.14 18.00 5.31 27.00 95.32
Rebate to consumers for timely payment 10.46 5.50 5.50 12.00 14.00
Interest on PF 37.93 64.88 64.88 51.34 55.59
Other Interest 0.00 0.01 0.01 0.01 0.01
Cost of raising finance: 0.03 1.00 1.00 1.00 1.00
Guarantee Commission 67.23 3.97 13.00 16.97 4.02 3.49
Bank Charges
17.00 20.00
Total of (III) 137.79 106.36 93.67 112.37 189.41
Grand Total (I+II+III) 339.60 345.31 333.11 283.12 391.62
Source: KSERC’s C ARR &ERC order 2010-11
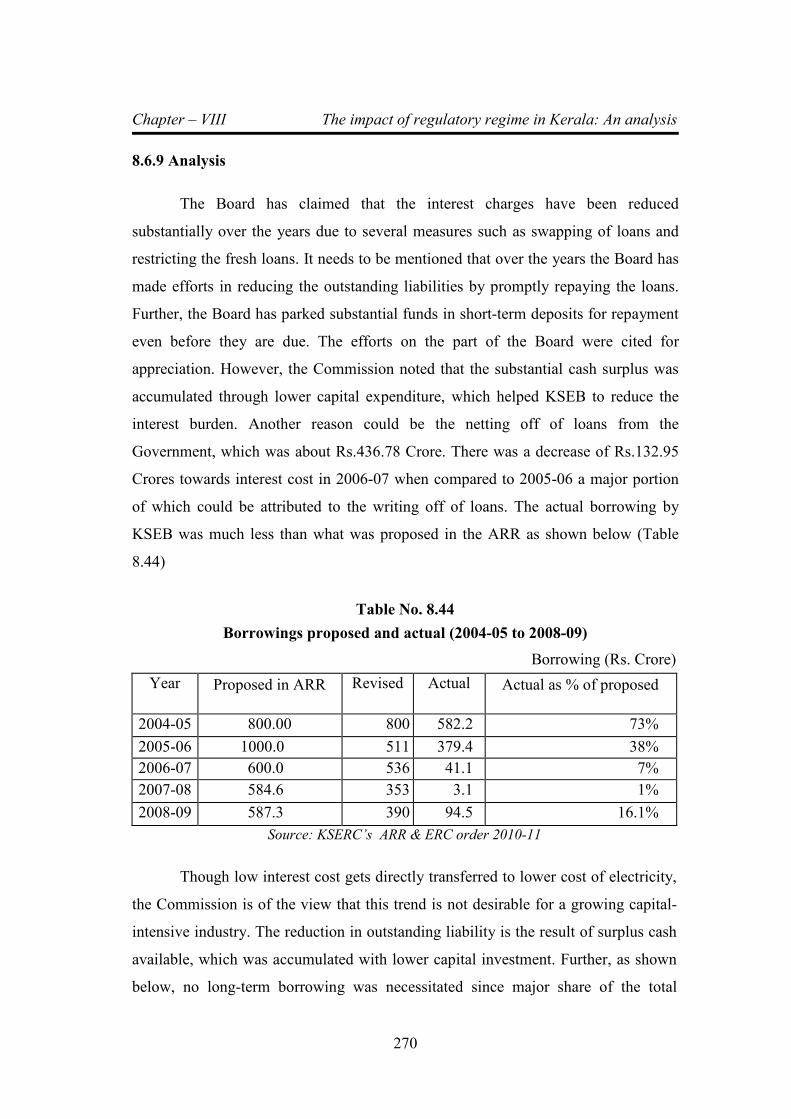
Chapter – VIII The impact of regulatory regime in Kerala: An analysis
270
8.6.9 Analysis
The Board has claimed that the interest charges have been reduced
substantially over the years due to several measures such as swapping of loans and
restricting the fresh loans. It needs to be mentioned that over the years the Board has
made efforts in reducing the outstanding liabilities by promptly repaying the loans.
Further, the Board has parked substantial funds in short-term deposits for repayment
even before they are due. The efforts on the part of the Board were cited for
appreciation. However, the Commission noted that the substantial cash surplus was
accumulated through lower capital expenditure, which helped KSEB to reduce the
interest burden. Another reason could be the netting off of loans from the
Government, which was about Rs.436.78 Crore. There was a decrease of Rs.132.95
Crores towards interest cost in 2006-07 when compared to 2005-06 a major portion
of which could be attributed to the writing off of loans. The actual borrowing by
KSEB was much less than what was proposed in the ARR as shown below (Table
8.44)
Table No. 8.44
Borrowings proposed and actual (2004-05 to 2008-09)
Borrowing (Rs. Crore)
Year Proposed in ARR Revised Actual Actual as % of proposed
2004-05 800.00 800
.0
582.2 73%
2005-06 1000.0 511
.4
379.4 38%
2006-07 600.0 536
.5
41.1 7%
2007-08 584.6 353
.6
3.1 1%
2008-09 587.3 390
.1
94.5 16.1%
Source: KSERC’s ARR & ERC order 2010-11
Though low interest cost gets directly transferred to lower cost of electricity,
the Commission is of the view that this trend is not desirable for a growing capital-
intensive industry. The reduction in outstanding liability is the result of surplus cash
available, which was accumulated with lower capital investment. Further, as shown
below, no long-term borrowing was necessitated since major share of the total
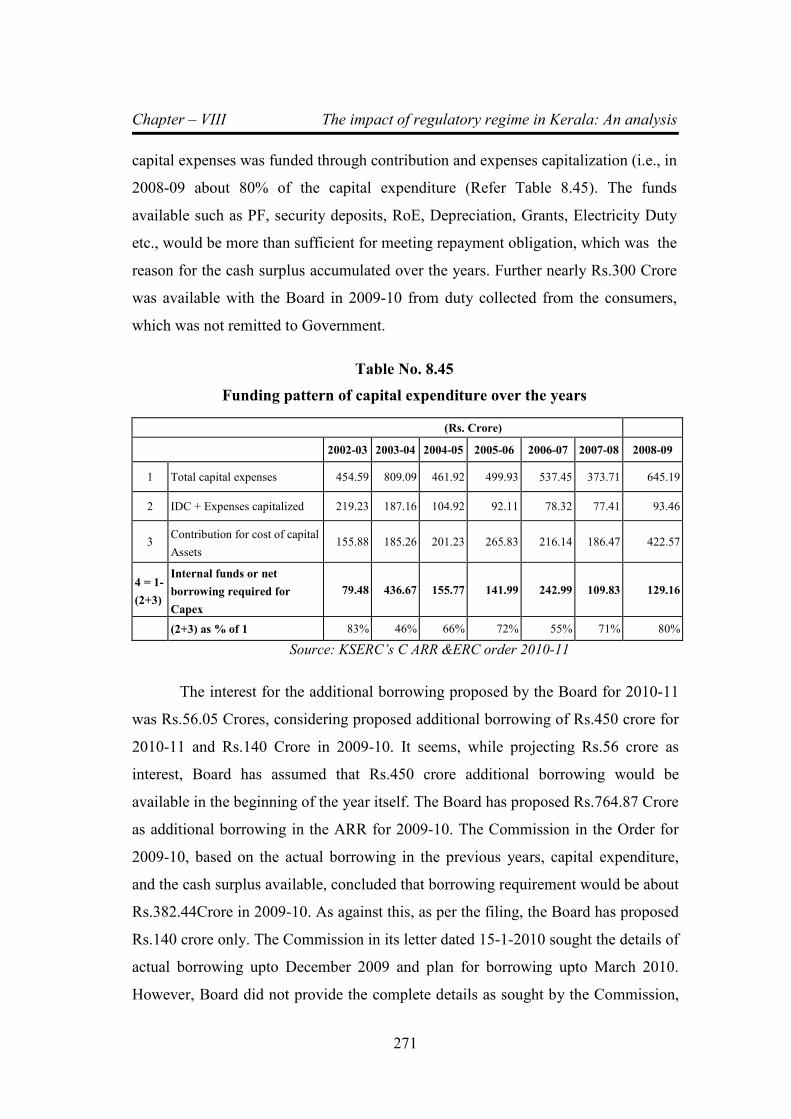
Chapter – VIII The impact of regulatory regime in Kerala: An analysis
271
capital expenses was funded through contribution and expenses capitalization (i.e., in
2008-09 about 80% of the capital expenditure (Refer Table 8.45). The funds
available such as PF, security deposits, RoE, Depreciation, Grants, Electricity Duty
etc., would be more than sufficient for meeting repayment obligation, which was the
reason for the cash surplus accumulated over the years. Further nearly Rs.300 Crore
was available with the Board in 2009-10 from duty collected from the consumers,
which was not remitted to Government.
Table No. 8.45
Funding pattern of capital expenditure over the years
(Rs. Crore)
2002-03 2003-04 2004-05 2005-06 2006-07 2007-08 2008-09
1 Total capital expenses 454.59 809.09 461.92 499.93 537.45 373.71 645.19
2 IDC + Expenses capitalized 219.23 187.16 104.92 92.11 78.32 77.41 93.46
3 Contribution for cost of capital
Assets 155.88 185.26 201.23 265.83 216.14 186.47 422.57
4 = 1-
(2+3)
Internal funds or net
borrowing required for
Capex
79.48 436.67 155.77 141.99 242.99 109.83 129.16
(2+3) as % of 1 83% 46% 66% 72% 55% 71% 80%
Source: KSERC’s C ARR &ERC order 2010-11
The interest for the additional borrowing proposed by the Board for 2010-11
was Rs.56.05 Crores, considering proposed additional borrowing of Rs.450 crore for
2010-11 and Rs.140 Crore in 2009-10. It seems, while projecting Rs.56 crore as
interest, Board has assumed that Rs.450 crore additional borrowing would be
available in the beginning of the year itself. The Board has proposed Rs.764.87 Crore
as additional borrowing in the ARR for 2009-10. The Commission in the Order for
2009-10, based on the actual borrowing in the previous years, capital expenditure,
and the cash surplus available, concluded that borrowing requirement would be about
Rs.382.44Crore in 2009-10. As against this, as per the filing, the Board has proposed
Rs.140 crore only. The Commission in its letter dated 15-1-2010 sought the details of
actual borrowing upto December 2009 and plan for borrowing upto March 2010.
However, Board did not provide the complete details as sought by the Commission,
Chapter – VIII The impact of regulatory regime in Kerala: An analysis
272
but provided total borrowing including short term working capital loans/overdraft
etc. Based on the information given by the Board, Rs.600 Crore was availed
as short term loan/over draft. Since the Board did not provide the information as
sought, the Commission was compelled to proceed with the information available in
the filing. For 2010-11, the Board has proposed Rs.450 Crore as borrowing.
However, the Commission was of the view that, borrowing level proposed by the
Board was not at all required since, substantial revenue realized from the consumers
in the form of Electricity Duty was retained by the Board and used as internal
sources, which was about Rs.227 crore in 2008-09. The same was revealed in the
actual financial position shown above.
Considering the above and the planned redemption proposed to the tune of
Rs.653.35crore and depreciation and other non-cash expenses available to the Board,
the Commission concluded that the borrowing proposed to the tune of Rs.450 Crore
may not be required for 2010-11. From the experience of previous years, the
Commission could not judge reasonably the actual amount of capital investment to
be incurred in 2010-11 against the proposed Rs.995 Crore. The Board has estimated
interest for additional borrowing as Rs.56.05 Crore, apparently assuming all
borrowing at the beginning of the year. Even if the projections on additional
borrowings were considered, the interest for the additional borrowing would only be
Rs.34.67 crore since borrowings are resorted to staggered manner.
The Board has incorporated the impact of netting off of Government loans
while estimating the interest and financing charges. The Commission in its Order on
ARR&&ERC for 2008-09 has taken a position that netting off in the present form
would not be acceptable. Similar stand has been taken by the Comptroller and
Auditor General of India. Still no conclusive decision was taken by the Government
on this issue. Since the decision on netting of was delayed, Commission was not in a
position to provide the interest on Government loans in the ARR in a fictitious
manner, which allows the Board to have excess cash without corresponding liability.
Hence, as and when netting of proposal will be decided, the Commission will
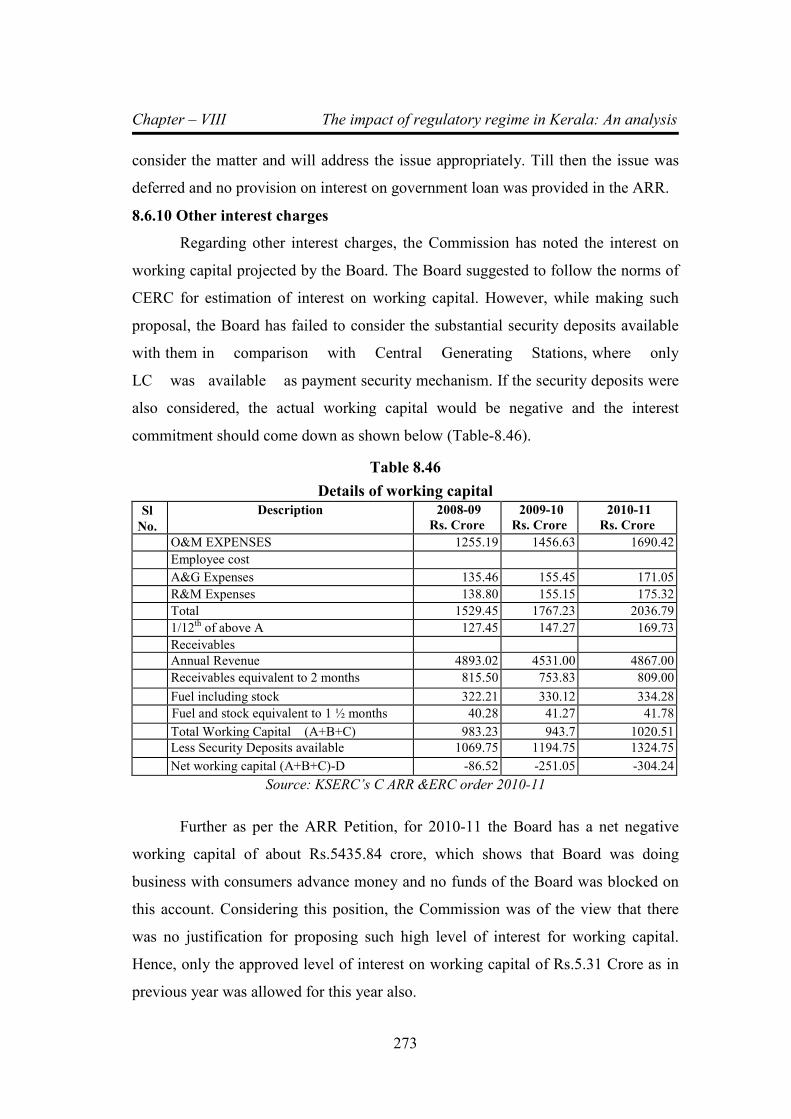
Chapter – VIII The impact of regulatory regime in Kerala: An analysis
273
consider the matter and will address the issue appropriately. Till then the issue was
deferred and no provision on interest on government loan was provided in the ARR.
8.6.10 Other interest charges
Regarding other interest charges, the Commission has noted the interest on
working capital projected by the Board. The Board suggested to follow the norms of
CERC for estimation of interest on working capital. However, while making such
proposal, the Board has failed to consider the substantial security deposits available
with them in comparison with Central Generating Stations, where only
LC was available as payment security mechanism. If the security deposits were
also considered, the actual working capital would be negative and the interest
commitment should come down as shown below (Table-8.46).
Table 8.46
Details of working capital
Sl
No.
Description 2008-09
Rs. Crore
2009-10
Rs. Crore
2010-11
Rs. Crore
O&M EXPENSES 1255.19 1456.63 1690.42
Employee cost
A&G Expenses 135.46 155.45 171.05
R&M Expenses 138.80 155.15 175.32
Total 1529.45 1767.23 2036.79
1/12th of above A 127.45 147.27 169.73
Receivables
Annual Revenue 4893.02 4531.00 4867.00
Receivables equivalent to 2 months 815.50 753.83 809.00
Fuel including stock 322.21 330.12 334.28
Fuel and stock equivalent to 1 ½ months 40.28 41.27 41.78
Total Working Capital (A+B+C) 983.23 943.7 1020.51
Less Security Deposits available 1069.75 1194.75 1324.75
Net working capital (A+B+C)-D -86.52 -251.05 -304.24
Source: KSERC’s C ARR &ERC order 2010-11
Further as per the ARR Petition, for 2010-11 the Board has a net negative
working capital of about Rs.5435.84 crore, which shows that Board was doing
business with consumers advance money and no funds of the Board was blocked on
this account. Considering this position, the Commission was of the view that there
was no justification for proposing such high level of interest for working capital.
Hence, only the approved level of interest on working capital of Rs.5.31 Crore as in
previous year was allowed for this year also.
Chapter – VIII The impact of regulatory regime in Kerala: An analysis
274
The Board has proposed Rs.64.18 Crore on interest on security deposits as it
expects that the outstanding as on 1-4-2009 would be Rs.1069.75 Crore. The
Commission sought the details of debts and deposits for 2010-11, in which Board has
shown the addition to security deposit as Rs.130 Crore only in 2010-11. However,
addition to security deposits for the year 2009-10 itself was about Rs.147.32 crore as
per the ARR. Since the Board provided not much information, the Commission
agreed to the proposal of the Board. Similarly, the Board estimated Rs.14 crore
towards rebate for advance payment by the consumers. The actual rebate paid to the
consumers was only Rs.1.7 Crore in 2008-09. Considering this, the Commission has
allowed Rs.2 crore on this head. Cost of raising finance, Bank charges, Guarantee
Commission and interest on outstanding on provident fund balance are allowed as
projected by the Board. The Commission reiterated that, these payments shall only
be allowed on actual basis after the prudence check in the truing up process.
Accordingly, the interest charge for 2010-11 was approved as shown below on a
provisional basis considering the ambiguity in the netting off proposal.
8.7 Depreciation
The Board has estimated the depreciation for 2010-11 as Rs.532.89 Crore.
The Board argued that since 2006-07, the Commission was adopting CERC norms
for depreciation as per Tariff policy. KSEB further stated that FOR is yet to make
modification on the depreciation rates notified by CERC for generation and
transmission assets. Though KSEB follows Annual Account Rules for 2010-11, as
directed by the Commission, KSEB has claimed depreciation as per CERC norms.
As part of the restructuring process, KSEB formed committees to rectify the
anomalies in the capitalization, and it was estimated that after rectification, an
amount of about Rs.690 Crores might be added to assets at the end of the year.
Hence the opening gross fixed assets for 2010-11 would be Rs.10744.62 Crore,
accordingly the depreciation is worked out as follows (Table 8.47):
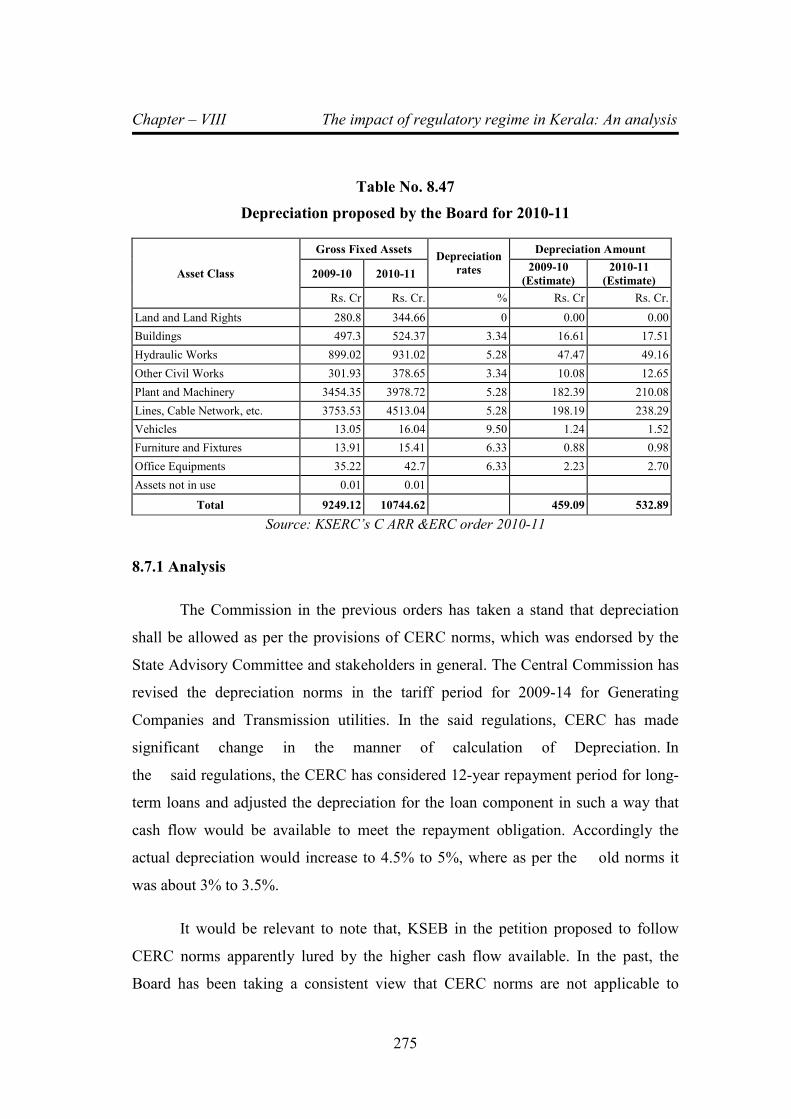
Chapter – VIII The impact of regulatory regime in Kerala: An analysis
275
Table No. 8.47
Depreciation proposed by the Board for 2010-11
Asset Class
Gross Fixed Assets Depreciation
rates
Depreciation Amount
2009-10 2010-11 2009-10
(Estimate) 2010-11
(Estimate) Rs. Cr Rs. Cr. % Rs. Cr Rs. Cr.
Land and Land Rights 280.8 344.66 0 0.00 0.00
Buildings 497.3 524.37 3.34 16.61 17.51
Hydraulic Works 899.02 931.02 5.28 47.47 49.16
Other Civil Works 301.93 378.65 3.34 10.08 12.65
Plant and Machinery 3454.35 3978.72 5.28 182.39 210.08
Lines, Cable Network, etc. 3753.53 4513.04 5.28 198.19 238.29
Vehicles 13.05 16.04 9.50 1.24 1.52
Furniture and Fixtures 13.91 15.41 6.33 0.88 0.98
Office Equipments 35.22 42.7 6.33 2.23 2.70
Assets not in use 0.01 0.01
Total 9249.12 10744.62 459.09 532.89
Source: KSERC’s C ARR &ERC order 2010-11
8.7.1 Analysis
The Commission in the previous orders has taken a stand that depreciation
shall be allowed as per the provisions of CERC norms, which was endorsed by the
State Advisory Committee and stakeholders in general. The Central Commission has
revised the depreciation norms in the tariff period for 2009-14 for Generating
Companies and Transmission utilities. In the said regulations, CERC has made
significant change in the manner of calculation of Depreciation. In
the said regulations, the CERC has considered 12-year repayment period for long-
term loans and adjusted the depreciation for the loan component in such a way that
cash flow would be available to meet the repayment obligation. Accordingly the
actual depreciation would increase to 4.5% to 5%, where as per the old norms it
was about 3% to 3.5%.
It would be relevant to note that, KSEB in the petition proposed to follow
CERC norms apparently lured by the higher cash flow available. In the past, the
Board has been taking a consistent view that CERC norms are not applicable to
Chapter – VIII The impact of regulatory regime in Kerala: An analysis
276
them. The Board all along had argued that, it is mandatory on its part to keep the
accounts as per the Annual Accounting Rules in force, where norms as per
Government of India notification 1994 shall apply. The Policy directions issued by
the Government and the request of the Government to the Commission vide letter
dated 15-7-2008, were repeatedly quoted in support of the claim, in spite of serious
audit objections of C&AG. Almost all the orders of the Commission on ARR&ERC
and Truing up in various years have been challenged by KSEB at the Appellate
Tribunal on this ground at the cost of public funds. This being the situation, the
Board suddenly proposed the CERC norms with no supporting claims as to why such
change in stand was required.
The Board has increased the addition to capital assets for the year 2010-11 to
the tune of about Rs.690 crore in the name of rectification of accounts, which is yet
to be completed. Commission found that such claims of the Board without proper
supporting details would be untenable and hence cannot be admitted. Hence it was
decided by the Commission to reject the addition of Rs. 1495.50 Crores for the year
2009-10. Nowhere in the history of the Board, such high level of capitalization has
been recorded. In the absence of authentic data, the KSERC used average
capitalisation from 2002-03 to 2008-09, which is Rs.637.21 crore for arriving at the
opening GFA (Gross Fixed Assets) for the year 2010-11.
As per the para 5.3(c) of Tariff Policy, the Forum of Regulators (FOR) vide
letter dated 23-6-2006 had communicated that depreciation as per CERC (Terms and
conditions of Tariff) Regulations 2004 shall be applicable for distribution. FOR has
not taken any decision on depreciation consequent to the revision of rates by CERC
since the said regulation was applicable for the period 2004-09 only. Hence, the
depreciation allowed would be subject to the revision by FOR if any.
Accordingly, Rs.485.75 Crore was estimated provisionally by KSERC as
depreciation for the year 2010-11 (Table 8.48). Commission ordered that as and
when properly authenticated information is provided, depreciation would be re-
estimated after prudence check.
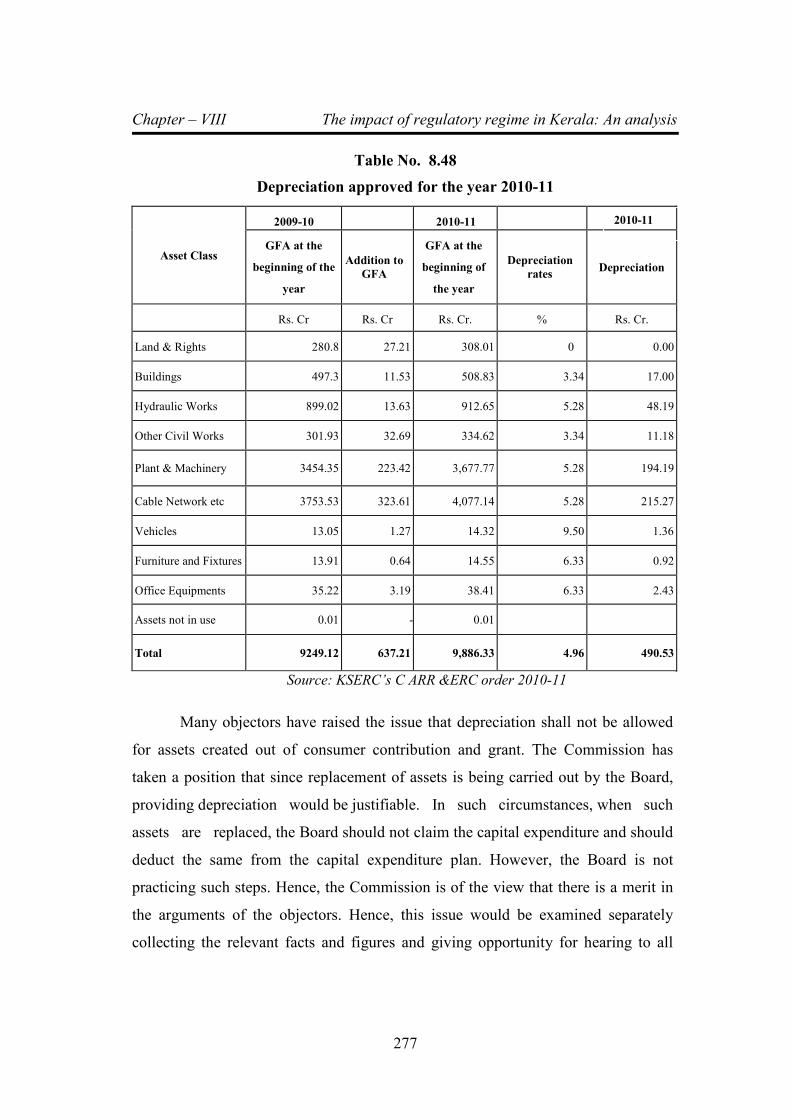
Chapter – VIII The impact of regulatory regime in Kerala: An analysis
277
Table No. 8.48
Depreciation approved for the year 2010-11
Asset Class
2009-10 2010-11
GFA at the
beginning of the
year
Addition to
GFA
GFA at the
beginning of
the year
Depreciation
rates Depreciation
Rs. Cr Rs. Cr Rs. Cr. % Rs. Cr.
Land & Rights 280.8 27.21 308.01 0 0.00
Buildings 497.3 11.53 508.83 3.34 17.00
Hydraulic Works 899.02 13.63 912.65 5.28 48.19
Other Civil Works 301.93 32.69 334.62 3.34 11.18
Plant & Machinery 3454.35 223.42 3,677.77 5.28 194.19
Cable Network etc 3753.53 323.61 4,077.14 5.28 215.27
Vehicles 13.05 1.27 14.32 9.50 1.36
Furniture and Fixtures 13.91 0.64 14.55 6.33 0.92
Office Equipments 35.22 3.19 38.41 6.33 2.43
Assets not in use 0.01 - 0.01
Total 9249.12 637.21 9,886.33 4.96 490.53
Source: KSERC’s C ARR &ERC order 2010-11
Many objectors have raised the issue that depreciation shall not be allowed
for assets created out of consumer contribution and grant. The Commission has
taken a position that since replacement of assets is being carried out by the Board,
providing depreciation would be justifiable. In such circumstances, when such
assets are replaced, the Board should not claim the capital expenditure and should
deduct the same from the capital expenditure plan. However, the Board is not
practicing such steps. Hence, the Commission is of the view that there is a merit in
the arguments of the objectors. Hence, this issue would be examined separately
collecting the relevant facts and figures and giving opportunity for hearing to all
2010-11

Chapter – VIII The impact of regulatory regime in Kerala: An analysis
278
concerned. Therefore the provision agreed to for depreciation will be treated as
provisional.
8.8 Employee cost:
The Board has projected substantially high employee cost of Rs.1690.42
crore for the year 2010-11 which is about 58% higher than the approved level in
2009-10. The Board has revised the employee cost for 2009-10 as Rs.1456.63 crore
by about 36% over the approved level. The total number of employees as on 31-3-
2009 was reported as 27089, of which distribution sector accounts for 21690
numbers. According to the Board, the salary and terminal benefits are allowed
periodically in line with the policy of the Government, which the Board cannot deny
to the employees. The salary and other benefits for the serving employees are
estimated at Rs.927.59 crore for 2010-11. While projecting salary & DA Board
considered DA as on 31-3-2010 as 73% and for the ensuring year an addition of 18%
(9% from July 10 and another 9% from Jan 2011). A provision of Rs.70 crore was
given for leave encashment. In order to accommodate the salary revision due
from August 2008 to workmen and from July 2008 to Officers a provision of 12%
was also included as part of employee cost. To support this provision, the Board has
referred to the judgment of Hon. Supreme Court dated 3-3-2009 in appeal No. 1110,
1112, 1138, 1152 and 1327 of 2007. According to the Board, as per the judgment
appropriate provision for pay and allowance has to be made in the respective years in
which it becomes due. Board also stated that the salary is only 12.35% of the total
expenses. According to the Board the number of consumers served per employee and
also employee per MU sold are the productivity parameters to be considered for
evaluation of employee costs. The number of consumers per employee increased
from 295 in 2003-04 to 375 in 2010-11, and employee per MU sold is 2.78 in 2003-
04 and 1.86 in 2010-11. The employee cost (excluding pension) per unit of energy is
45 paise unit in 2003-04 and in 2010-11 it is 63 paise/unit. The cost of serving
employees for the year 2010-11 is estimated by the Board (table 8.49) is as follows:
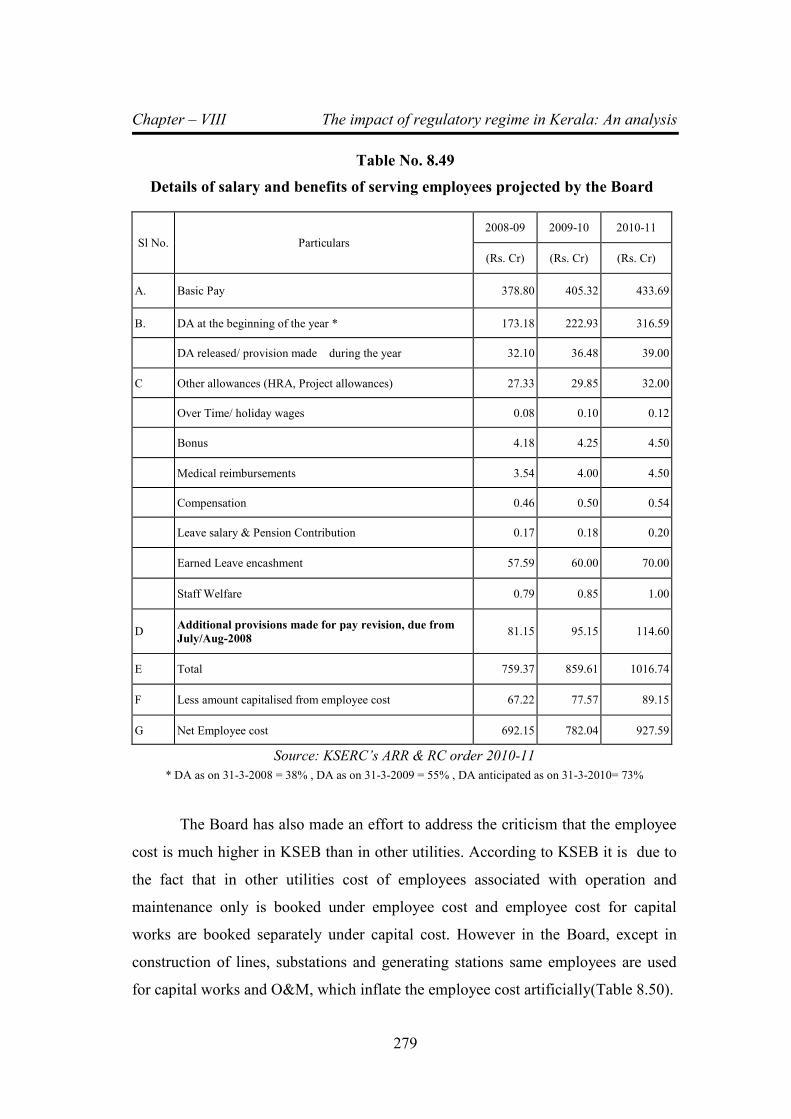
Chapter – VIII The impact of regulatory regime in Kerala: An analysis
279
Table No. 8.49
Details of salary and benefits of serving employees projected by the Board
Sl No. Particulars
2008-09 2009-10 2010-11
(Rs. Cr) (Rs. Cr) (Rs. Cr)
A. Basic Pay 378.80 405.32 433.69
B. DA at the beginning of the year * 173.18 222.93 316.59
DA released/ provision made during the year 32.10 36.48 39.00
C Other allowances (HRA, Project allowances) 27.33 29.85 32.00
Over Time/ holiday wages 0.08 0.10 0.12
Bonus 4.18 4.25 4.50
Medical reimbursements 3.54 4.00 4.50
Compensation 0.46 0.50 0.54
Leave salary & Pension Contribution 0.17 0.18 0.20
Earned Leave encashment 57.59 60.00 70.00
Staff Welfare 0.79 0.85 1.00
D Additional provisions made for pay revision, due from
July/Aug-2008 81.15 95.15 114.60
E Total 759.37 859.61 1016.74
F Less amount capitalised from employee cost 67.22 77.57 89.15
G Net Employee cost 692.15 782.04 927.59
Source: KSERC’s ARR & RC order 2010-11
* DA as on 31-3-2008 = 38% , DA as on 31-3-2009 = 55% , DA anticipated as on 31-3-2010= 73%
The Board has also made an effort to address the criticism that the employee
cost is much higher in KSEB than in other utilities. According to KSEB it is due to
the fact that in other utilities cost of employees associated with operation and
maintenance only is booked under employee cost and employee cost for capital
works are booked separately under capital cost. However in the Board, except in
construction of lines, substations and generating stations same employees are used
for capital works and O&M, which inflate the employee cost artificially(Table 8.50).
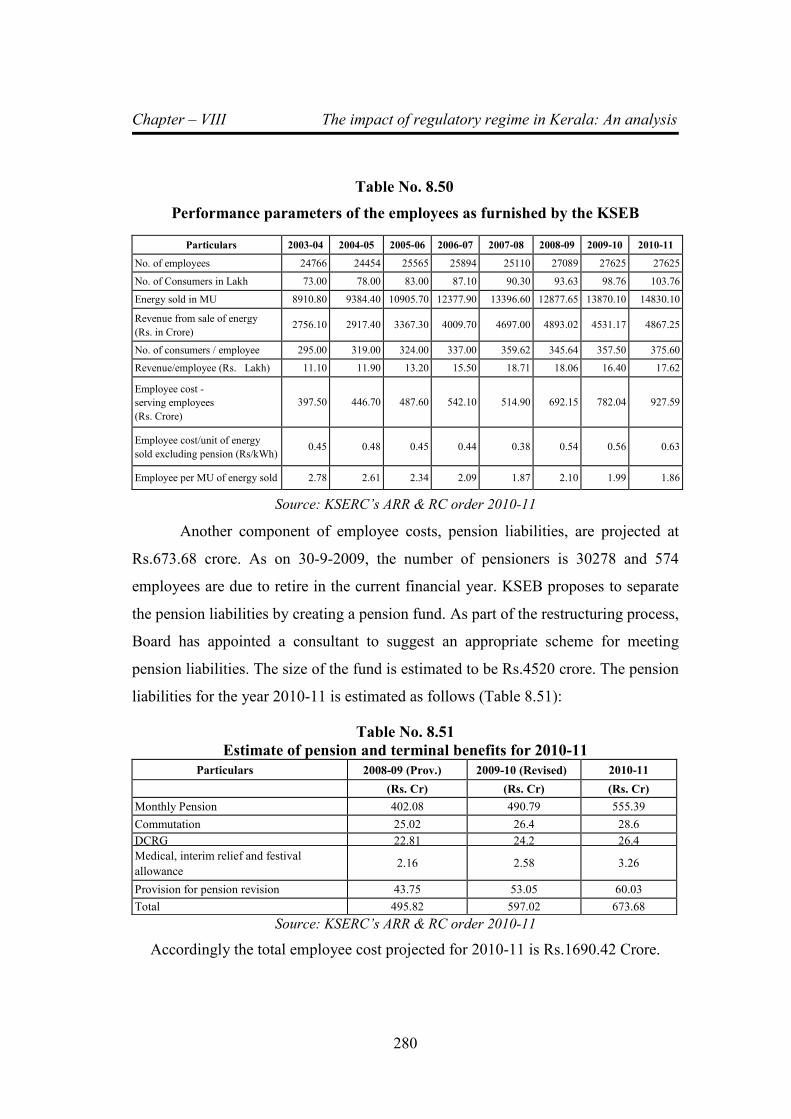
Chapter – VIII The impact of regulatory regime in Kerala: An analysis
280
Table No. 8.50
Performance parameters of the employees as furnished by the KSEB
Particulars 2003-04 2004-05 2005-06 2006-07 2007-08 2008-09 2009-10 2010-11
No. of employees 24766 24454 25565 25894 25110 27089 27625 27625
No. of Consumers in Lakh 73.00 78.00 83.00 87.10 90.30 93.63 98.76 103.76
Energy sold in MU 8910.80 9384.40 10905.70 12377.90 13396.60 12877.65 13870.10 14830.10
Revenue from sale of energy
(Rs. in Crore) 2756.10 2917.40 3367.30 4009.70 4697.00 4893.02 4531.17 4867.25
No. of consumers / employee 295.00 319.00 324.00 337.00 359.62 345.64 357.50 375.60
Revenue/employee (Rs. Lakh) 11.10 11.90 13.20 15.50 18.71 18.06 16.40 17.62
Employee cost -
serving employees
(Rs. Crore)
397.50 446.70 487.60 542.10 514.90 692.15 782.04 927.59
Employee cost/unit of energy
sold excluding pension (Rs/kWh) 0.45 0.48 0.45 0.44 0.38 0.54 0.56 0.63
Employee per MU of energy sold 2.78 2.61 2.34 2.09 1.87 2.10 1.99 1.86
Source: KSERC’s ARR & RC order 2010-11
Another component of employee costs, pension liabilities, are projected at
Rs.673.68 crore. As on 30-9-2009, the number of pensioners is 30278 and 574
employees are due to retire in the current financial year. KSEB proposes to separate
the pension liabilities by creating a pension fund. As part of the restructuring process,
Board has appointed a consultant to suggest an appropriate scheme for meeting
pension liabilities. The size of the fund is estimated to be Rs.4520 crore. The pension
liabilities for the year 2010-11 is estimated as follows (Table 8.51):
Table No. 8.51
Estimate of pension and terminal benefits for 2010-11
Particulars 2008-09 (Prov.) 2009-10 (Revised) 2010-11
(Rs. Cr) (Rs. Cr) (Rs. Cr)
Monthly Pension 402.08 490.79 555.39
Commutation 25.02 26.4 28.6
DCRG 22.81 24.2 26.4
Medical, interim relief and festival
allowance 2.16 2.58 3.26
Provision for pension revision 43.75 53.05 60.03
Total 495.82 597.02 673.68
Source: KSERC’s ARR & RC order 2010-11
Accordingly the total employee cost projected for 2010-11 is Rs.1690.42 Crore.

Chapter – VIII The impact of regulatory regime in Kerala: An analysis
281
8.8.1 Analysis
There was a strong criticism in the public hearing about huge employee
expenses in KSEB. The staggering increase in employee cost was a concern to all the
stakeholders and many have pointed out this. The Commission pointed out that
Board has not taken any concrete measures in addressing this pertinent issue over the
years. The Board has been impervious to the directions of the Commission as well as
to the concerns expressed by the consumers on the increasing employee cost. The
Commission has analysed this issue in detail. The increase in employee cost is due to
uncontrolled increase in wages as well as in pensions. There was no effort to control
the number of employees in the organization. Over the years (between 2004-05 to
2008-09), though the number of sanctioned places have decreased by about 5000,
actual number of employees have increased by about 2600 at a rate of 11%.(Ref.
Table 8.52). KSERC ordered KSEB to review these figures on an urgent basis.
Table No. 8.52
Growth in number of employees
No. of employees
Year Sanctioned Annual
Increase (%) Actual
Annual
Increase (%)
2004-05 35870 24454
2005-06 35870 0.0% 25565 4.5%
2006-07 30877 -13.9% 25894 1.3%
2007-08 30862 0.0% 25110 -3.0%
2008-09 30862 0.0% 27089 7.9%
Overall Increase -5008 -14.0% 2635 10.8%
Source: KSERC’s ARR & RC order 2010-11
The table below shows the category wise increase in number of employees.
Over the last four years, the category wise increase in number of employees is about
20% to over 85%. Number of chief engineers have increased by 45%, Asst.
Engineers or equivalent have increased by a staggering 85%, Executive Engineers by
31%, other non-technical officers by 42% and technical staff by 20%. In spite of
considerable increase at all levels, the overall increase was limited to 11% on
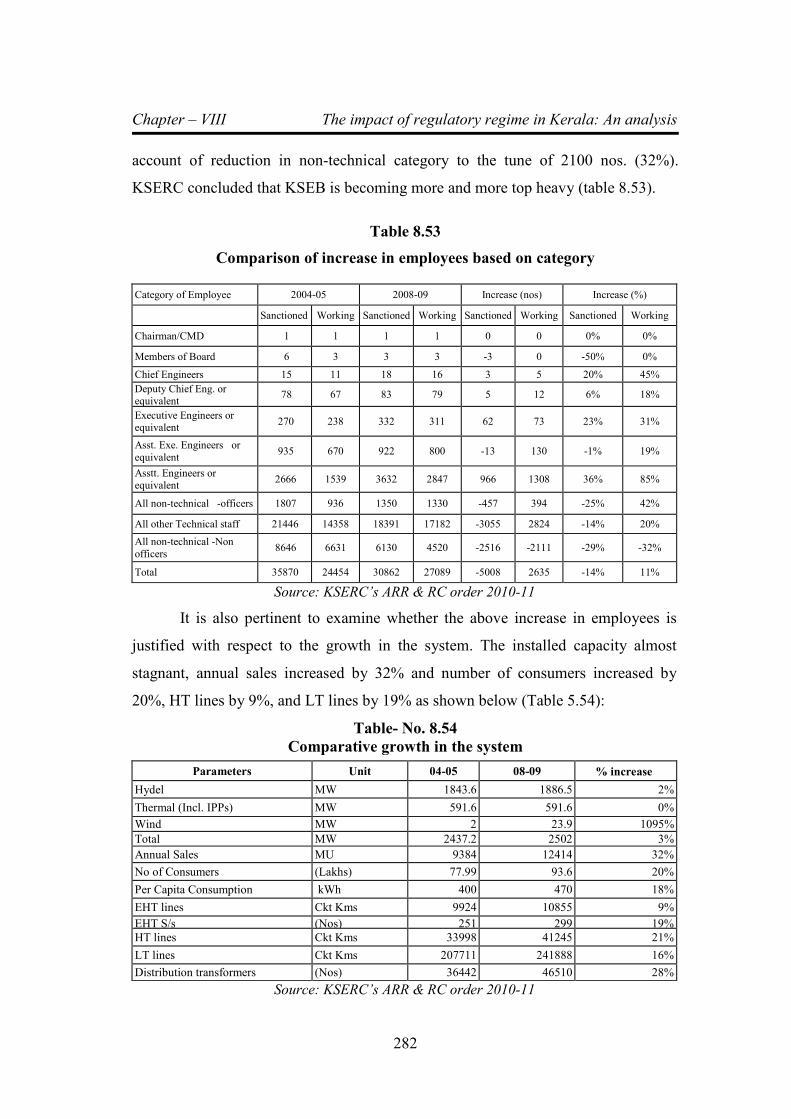
Chapter – VIII The impact of regulatory regime in Kerala: An analysis
282
account of reduction in non-technical category to the tune of 2100 nos. (32%).
KSERC concluded that KSEB is becoming more and more top heavy (table 8.53).
Table 8.53
Comparison of increase in employees based on category
Category of Employee 2004-05 2008-09 Increase (nos) Increase (%)
Sanctioned Working Sanctioned Working Sanctioned Working Sanctioned Working
Chairman/CMD 1 1 1 1 0 0 0% 0%
Members of Board 6 3 3 3 -3 0 -50% 0%
Chief Engineers 15 11 18 16 3 5 20% 45%
Deputy Chief Eng. or equivalent
78 67 83 79 5 12 6% 18%
Executive Engineers or equivalent
270 238 332 311 62 73 23% 31%
Asst. Exe. Engineers or
equivalent 935 670 922 800 -13 130 -1% 19%
Asstt. Engineers or equivalent
2666 1539 3632 2847 966 1308 36% 85%
All non-technical -officers 1807 936 1350 1330 -457 394 -25% 42%
All other Technical staff 21446 14358 18391 17182 -3055 2824 -14% 20%
All non-technical -Non
officers 8646 6631 6130 4520 -2516 -2111 -29% -32%
Total 35870 24454 30862 27089 -5008 2635 -14% 11%
Source: KSERC’s ARR & RC order 2010-11
It is also pertinent to examine whether the above increase in employees is
justified with respect to the growth in the system. The installed capacity almost
stagnant, annual sales increased by 32% and number of consumers increased by
20%, HT lines by 9%, and LT lines by 19% as shown below (Table 5.54):
Table- No. 8.54
Comparative growth in the system
Parameters Unit 04-05 08-09 % increase
Hydel MW 1843.6 1886.5 2%
Thermal (Incl. IPPs) MW 591.6 591.6 0%
Wind MW 2 23.9 1095%
Total MW 2437.2 2502 3%
Annual Sales MU 9384 12414 32%
No of Consumers (Lakhs) 77.99 93.6 20%
Per Capita Consumption kWh 400 470 18%
EHT lines Ckt Kms 9924 10855 9%
EHT S/s (Nos) 251 299 19%
HT lines Ckt Kms 33998 41245 21%
LT lines Ckt Kms 207711 241888 16%
Distribution transformers (Nos) 36442 46510 28%
Source: KSERC’s ARR & RC order 2010-11
Chapter – VIII The impact of regulatory regime in Kerala: An analysis
283
The above analysis shows that the uncontrollable increase in employee cost
needs urgent attention. The Commission since inception had issued several
directions to KSEB to control/limit the expenses and to improve the productivity so
as to justify high employee costs. However, no action has been taken till now. The
Commission as part of the clarification process raised about 10 questions on
employee cost. KSEB could not provide convincing answers to the queries. Since as
per the estimates of the Board, the employee cost/kWh sale for 2010-11 works out to
about Rs.1.14, the Commission sought the long-term steps taken to arrest the
employee costs by KSEB. The Board instead of suggesting any means, justified the
high level of employee cost with innovative replies. According to KSEB, cost of
employees working in capital works is not completely included in capital expenses,
which inflate the employee cost (revenue expenses). At present no separate
employees are provided for carrying out capital works in the distribution sector. If
the cost of employees executing the capital works in generation, transmission and
distribution are separated; the cost of employees will be comparable to other
distribution utilities. According to KSEB, the criticism on employee cost is without
appreciating these facts. Further, according to the Board, comparison of per unit cost
of employees is misleading in the case of Kerala, which is an industrially backward
state. As part of the restructuring process M/s PFC Consulting Limited has submitted
actuarial valuation report, which is under the consideration of the Government.
Commission found that the arguments put forwarded by the Board for
justifying the employee expenses were neither reasonable nor logical. As per the
provisions of the Act, electricity has to be supplied at a reasonable cost. Hence it is
pertinent to compare the per unit cost, since that is what the consumer is ultimately
concerned with. The justification that high employee cost in distribution was due to
capital works is no way helpful for the Board in supporting their claim since the
accounting practices followed in all SEBs are the same. Further, almost all
the capital works are carried out through contractors and at the most only
the supervision charges needs to be accounted. Further provision of capitalizing the
Chapter – VIII The impact of regulatory regime in Kerala: An analysis
284
employee cost is available and in 2010-11 about 9% of the employee cost is
proposed to be capitalized by the Board.
Commission observed that the efforts of the Board in curtailing employee
expenses are cosmetic and halfhearted. To cite an example, while finalizing the
ARR&ERC for 2009-10, the Board vide letter dated 26-3-2009, stated that several
steps are taken to improve the productivity of the employees by fixing
responsibilities. Circulars were issued on the guidelines for promotion to the post of
managerial cadres. The task of work-study on various functional areas has been
entrusted to M/s Centre for Management Development. However, no update or
follow-up action on the above steps has been reported in the present ARR.
It is also pertinent to verify the parameters supplied by the Board to show the
improving level of productivity/efficiency. The employee per MU of energy sold
increased from 1.87 in 2007-08 to 2.10 in 2008-09 & in 2009-10 it is 1.99. In 2010-
11, the numbers of employees are held constant to reduce the ratio to 1.86. While
estimating employee related performance parameters, the Board has excluded
pension liabilities, which cannot be justified. Though the Board has repeatedly stated
about the consultant’s report on structuring of pension liabilities, the report was not
produced before the Commission even after despite several reminders by
Commission. The Commission is of the considered view that any justification
provided by the Board to substantiate the increase in employee costs is self defeating
unless concrete steps are taken to address the issue rather than evading it.
There is widespread criticism that the salary levels of employees in the Board
are higher than that in Government or any other comparable organizations. Several
objectors have pointed to the share of salaries in the total income. The following
table (Table 8.55) shows the cost per employee and pension, which is self-
explanatory.
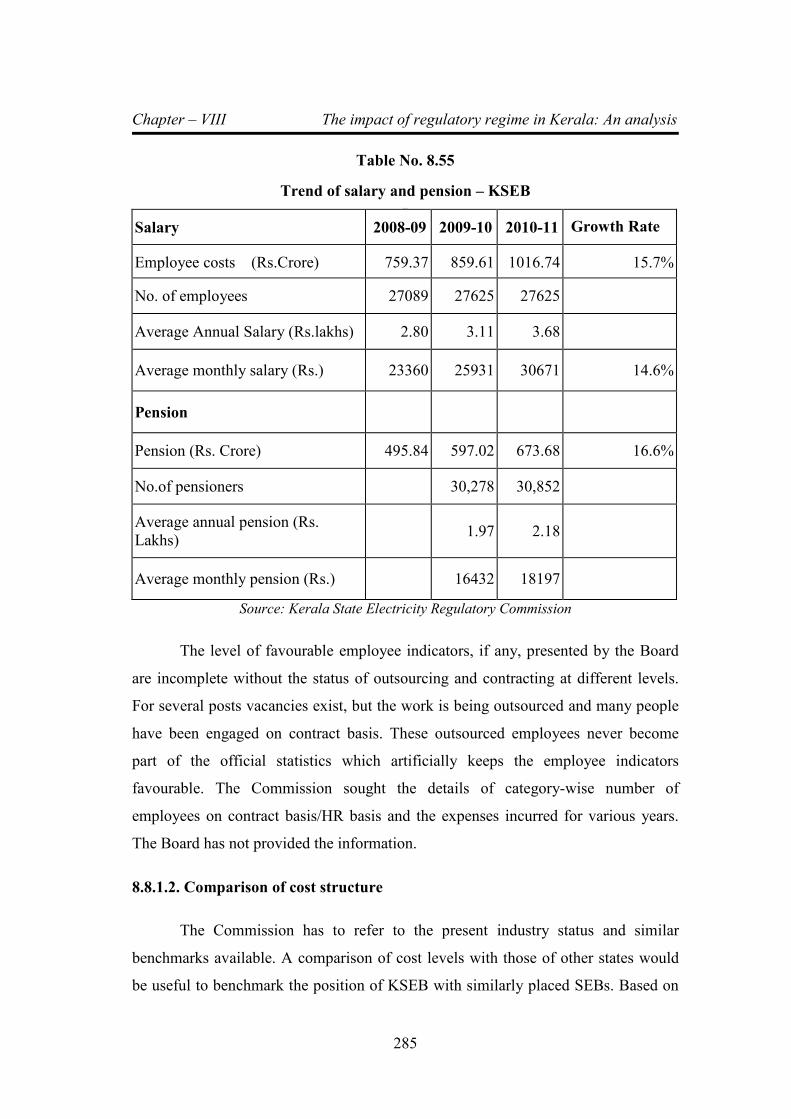
Chapter – VIII The impact of regulatory regime in Kerala: An analysis
285
Table No. 8.55
Trend of salary and pension – KSEB Table No.
Salary 2008-09 2009-10 2010-11 Growth Rate
Employee costs (Rs.Crore) 759.37 859.61 1016.74 15.7%
No. of employees 27089 27625 27625
Average Annual Salary (Rs.lakhs) 2.80 3.11 3.68
Average monthly salary (Rs.) 23360 25931 30671 14.6%
Pension
Pension (Rs. Crore) 495.84 597.02 673.68 16.6%
No.of pensioners 30,278 30,852
Average annual pension (Rs.
Lakhs) 1.97 2.18
Average monthly pension (Rs.) 16432 18197
Source: Kerala State Electricity Regulatory Commission
The level of favourable employee indicators, if any, presented by the Board
are incomplete without the status of outsourcing and contracting at different levels.
For several posts vacancies exist, but the work is being outsourced and many people
have been engaged on contract basis. These outsourced employees never become
part of the official statistics which artificially keeps the employee indicators
favourable. The Commission sought the details of category-wise number of
employees on contract basis/HR basis and the expenses incurred for various years.
The Board has not provided the information.
8.8.1.2. Comparison of cost structure
The Commission has to refer to the present industry status and similar
benchmarks available. A comparison of cost levels with those of other states would
be useful to benchmark the position of KSEB with similarly placed SEBs. Based on
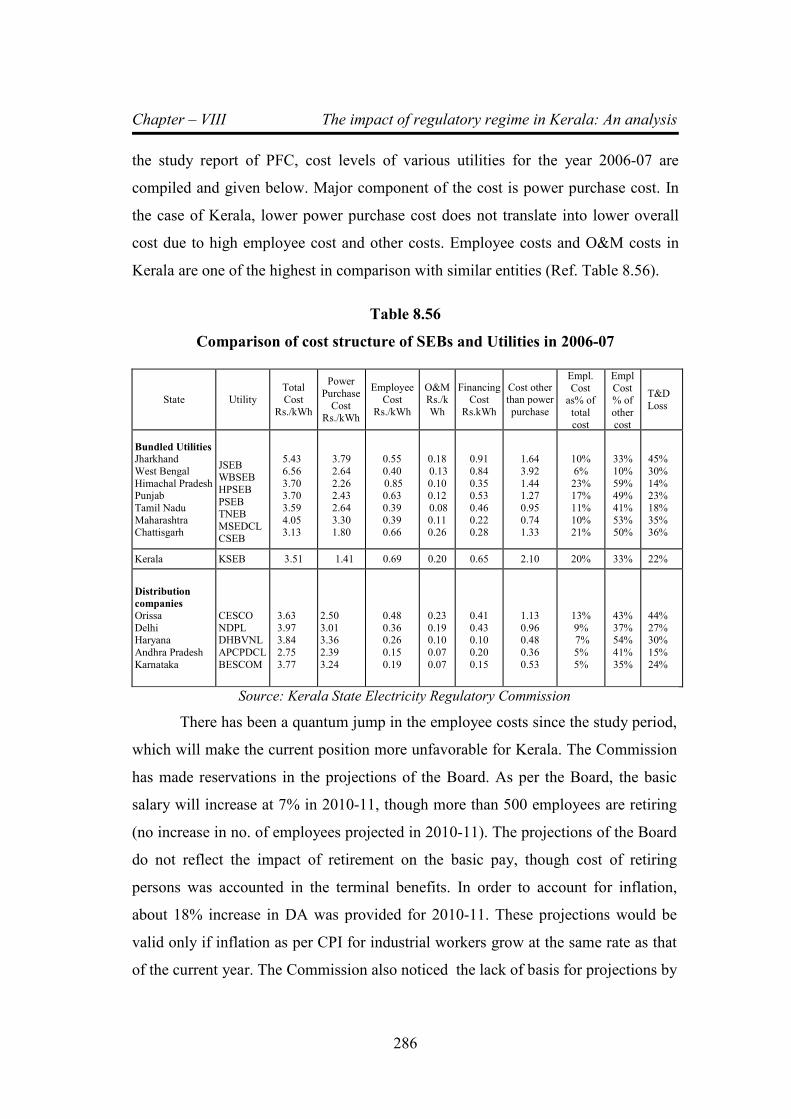
Chapter – VIII The impact of regulatory regime in Kerala: An analysis
286
the study report of PFC, cost levels of various utilities for the year 2006-07 are
compiled and given below. Major component of the cost is power purchase cost. In
the case of Kerala, lower power purchase cost does not translate into lower overall
cost due to high employee cost and other costs. Employee costs and O&M costs in
Kerala are one of the highest in comparison with similar entities (Ref. Table 8.56).
Table 8.56
Comparison of cost structure of SEBs and Utilities in 2006-07
State Utility Total Cost
Rs./kWh
Power
Purchase
Cost Rs./kWh
Employee Cost
Rs./kWh
O&M Rs./k
Wh
Financing Cost
Rs.kWh
Cost other than power
purchase
Empl.
Cost as% of
total
cost
Empl
Cost % of
other
cost
T&D
Loss
Bundled Utilities Jharkhand
West Bengal
Himachal Pradesh Punjab
Tamil Nadu
Maharashtra Chattisgarh
JSEB WBSEB
HPSEB
PSEB TNEB
MSEDCL
CSEB
5.43
6.56
3.70 3.70
3.59
4.05 3.13
3.79
2.64
2.26 2.43
2.64
3.30 1.80
0.55
0.40
0.85 0.63
0.39
0.39 0.66
0.18
0.13
0.10 0.12
0.08
0.11 0.26
0.91
0.84
0.35 0.53
0.46
0.22 0.28
1.64
3.92
1.44 1.27
0.95
0.74 1.33
10%
6%
23% 17%
11%
10% 21%
33%
10%
59% 49%
41%
53% 50%
45%
30%
14% 23%
18%
35% 36%
Kerala KSEB 3.51 1.41 0.69 0.20 0.65 2.10 20% 33% 22%
Distribution
companies Orissa
Delhi Haryana
Andhra Pradesh
Karnataka
CESCO
NDPL DHBVNL
APCPDCL
BESCOM
3.63
3.97 3.84
2.75
3.77
2.50
3.01 3.36
2.39
3.24
0.48
0.36 0.26
0.15
0.19
0.23
0.19 0.10
0.07
0.07
0.41
0.43 0.10
0.20
0.15
1.13
0.96 0.48
0.36
0.53
13%
9% 7%
5%
5%
43%
37% 54%
41%
35%
44%
27% 30%
15%
24%
Source: Kerala State Electricity Regulatory Commission
There has been a quantum jump in the employee costs since the study period,
which will make the current position more unfavorable for Kerala. The Commission
has made reservations in the projections of the Board. As per the Board, the basic
salary will increase at 7% in 2010-11, though more than 500 employees are retiring
(no increase in no. of employees projected in 2010-11). The projections of the Board
do not reflect the impact of retirement on the basic pay, though cost of retiring
persons was accounted in the terminal benefits. In order to account for inflation,
about 18% increase in DA was provided for 2010-11. These projections would be
valid only if inflation as per CPI for industrial workers grow at the same rate as that
of the current year. The Commission also noticed the lack of basis for projections by
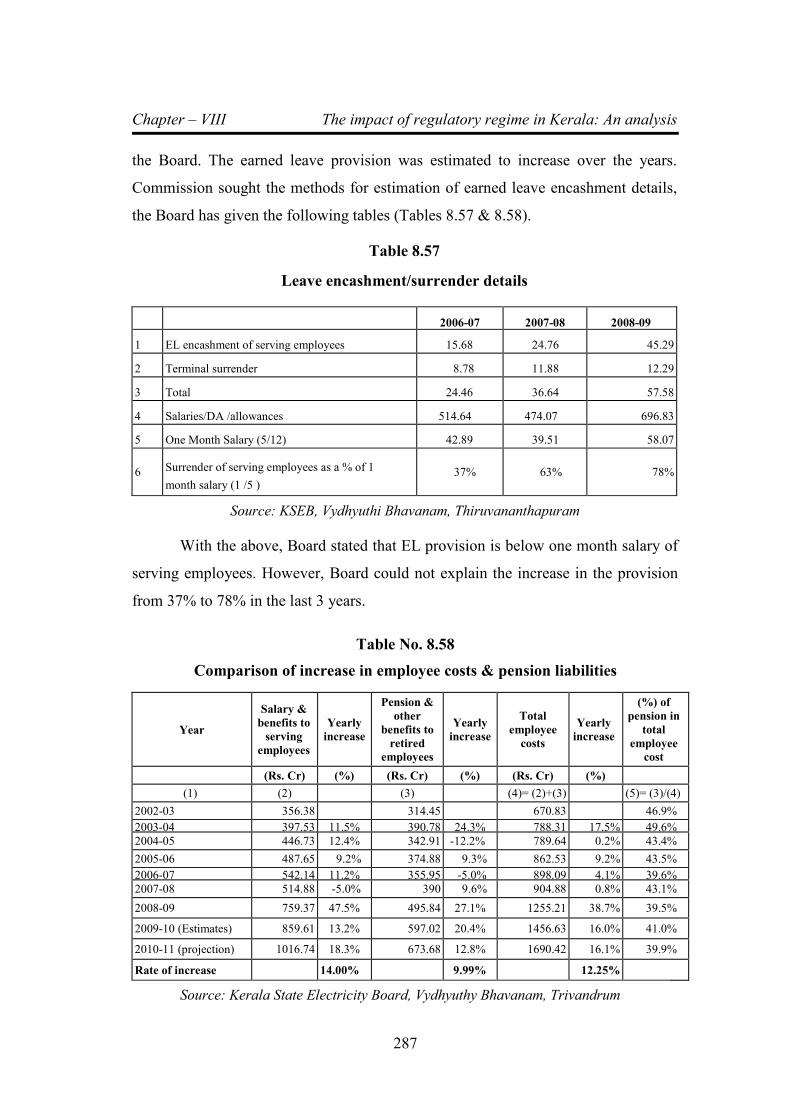
Chapter – VIII The impact of regulatory regime in Kerala: An analysis
287
the Board. The earned leave provision was estimated to increase over the years.
Commission sought the methods for estimation of earned leave encashment details,
the Board has given the following tables (Tables 8.57 & 8.58).
Table 8.57
Leave encashment/surrender details
2006-07 2007-08 2008-09
1 EL encashment of serving employees 15.68 24.76 45.29
2 Terminal surrender 8.78 11.88 12.29
3 Total 24.46 36.64 57.58
4 Salaries/DA /allowances 514.64 474.07 696.83
5 One Month Salary (5/12) 42.89 39.51 58.07
6 Surrender of serving employees as a % of 1
month salary (1 /5 ) 37% 63% 78%
Source: KSEB, Vydhyuthi Bhavanam, Thiruvananthapuram
With the above, Board stated that EL provision is below one month salary of
serving employees. However, Board could not explain the increase in the provision
from 37% to 78% in the last 3 years.
Table No. 8.58
Comparison of increase in employee costs & pension liabilities
Year
Salary &
benefits to
serving
employees
Yearly
increase
Pension &
other
benefits to
retired
employees
Yearly
increase
Total
employee
costs
Yearly
increase
(%) of
pension in
total
employee
cost
(Rs. Cr) (%) (Rs. Cr) (%) (Rs. Cr) (%)
(1) (2) (3) (4)= (2)+(3) (5)= (3)/(4)
2002-03 356.38 314.45 670.83 46.9%
2003-04 397.53 11.5% 390.78 24.3% 788.31 17.5% 49.6%
2004-05 446.73 12.4% 342.91 -12.2% 789.64 0.2% 43.4%
2005-06 487.65 9.2% 374.88 9.3% 862.53 9.2% 43.5%
2006-07 542.14 11.2% 355.95 -5.0% 898.09 4.1% 39.6%
2007-08 514.88 -5.0% 390 9.6% 904.88 0.8% 43.1%
2008-09 759.37 47.5% 495.84 27.1% 1255.21 38.7% 39.5%
2009-10 (Estimates) 859.61 13.2% 597.02 20.4% 1456.63 16.0% 41.0%
2010-11 (projection) 1016.74 18.3% 673.68 12.8% 1690.42 16.1% 39.9%
Rate of increase 14.00% 9.99% 12.25%
Source: Kerala State Electricity Board, Vydhyuthy Bhavanam, Trivandrum
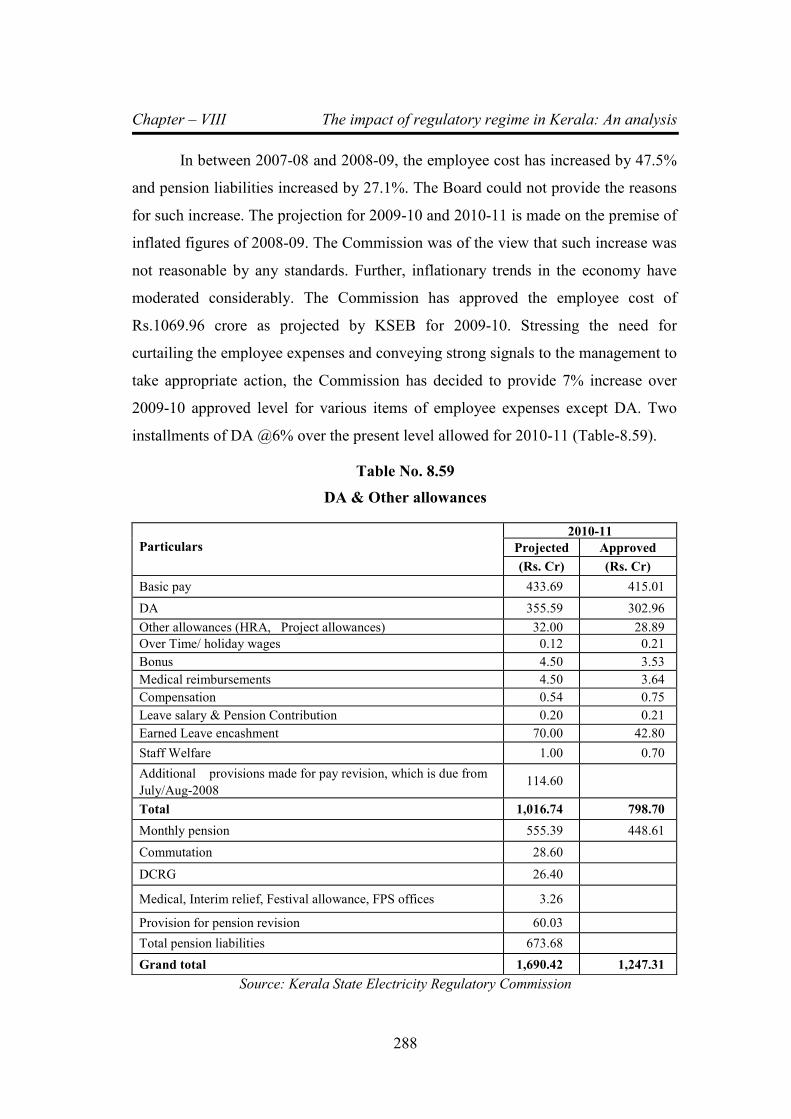
Chapter – VIII The impact of regulatory regime in Kerala: An analysis
288
In between 2007-08 and 2008-09, the employee cost has increased by 47.5%
and pension liabilities increased by 27.1%. The Board could not provide the reasons
for such increase. The projection for 2009-10 and 2010-11 is made on the premise of
inflated figures of 2008-09. The Commission was of the view that such increase was
not reasonable by any standards. Further, inflationary trends in the economy have
moderated considerably. The Commission has approved the employee cost of
Rs.1069.96 crore as projected by KSEB for 2009-10. Stressing the need for
curtailing the employee expenses and conveying strong signals to the management to
take appropriate action, the Commission has decided to provide 7% increase over
2009-10 approved level for various items of employee expenses except DA. Two
installments of DA @6% over the present level allowed for 2010-11 (Table-8.59).
Table No. 8.59
DA & Other allowances
Particulars
2010-11
Projected Approved
(Rs. Cr) (Rs. Cr)
Basic pay 433.69 415.01
DA 355.59 302.96
Other allowances (HRA, Project allowances) 32.00 28.89
Over Time/ holiday wages 0.12 0.21
Bonus 4.50 3.53
Medical reimbursements 4.50 3.64
Compensation 0.54 0.75
Leave salary & Pension Contribution 0.20 0.21
Earned Leave encashment 70.00 42.80
Staff Welfare 1.00 0.70
Additional provisions made for pay revision, which is due from
July/Aug-2008 114.60
Total 1,016.74 798.70
Monthly pension 555.39 448.61
Commutation 28.60
DCRG 26.40
Medical, Interim relief, Festival allowance, FPS offices 3.26
Provision for pension revision 60.03
Total pension liabilities 673.68
Grand total 1,690.42 1,247.31
Source: Kerala State Electricity Regulatory Commission
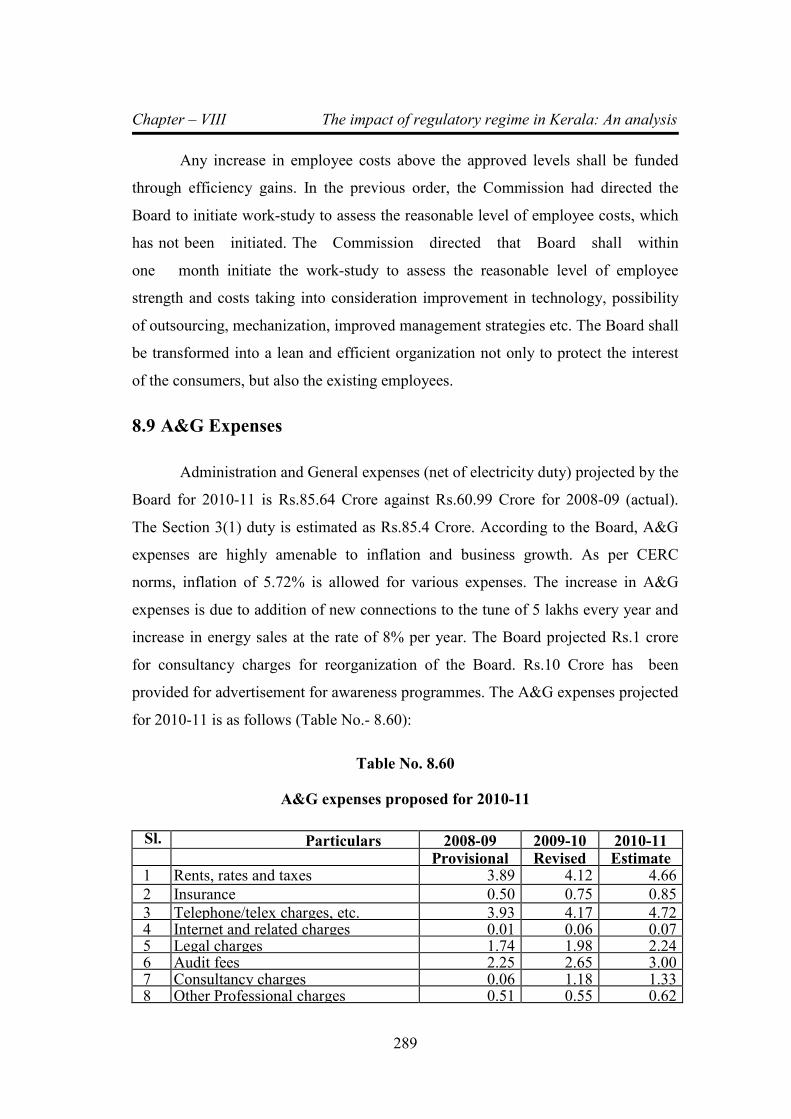
Chapter – VIII The impact of regulatory regime in Kerala: An analysis
289
Any increase in employee costs above the approved levels shall be funded
through efficiency gains. In the previous order, the Commission had directed the
Board to initiate work-study to assess the reasonable level of employee costs, which
has not been initiated. The Commission directed that Board shall within
one month initiate the work-study to assess the reasonable level of employee
strength and costs taking into consideration improvement in technology, possibility
of outsourcing, mechanization, improved management strategies etc. The Board shall
be transformed into a lean and efficient organization not only to protect the interest
of the consumers, but also the existing employees.
8.9 A&G Expenses
Administration and General expenses (net of electricity duty) projected by the
Board for 2010-11 is Rs.85.64 Crore against Rs.60.99 Crore for 2008-09 (actual).
The Section 3(1) duty is estimated as Rs.85.4 Crore. According to the Board, A&G
expenses are highly amenable to inflation and business growth. As per CERC
norms, inflation of 5.72% is allowed for various expenses. The increase in A&G
expenses is due to addition of new connections to the tune of 5 lakhs every year and
increase in energy sales at the rate of 8% per year. The Board projected Rs.1 crore
for consultancy charges for reorganization of the Board. Rs.10 Crore has been
provided for advertisement for awareness programmes. The A&G expenses projected
for 2010-11 is as follows (Table No.- 8.60):
Table No. 8.60
A&G expenses proposed for 2010-11
Sl. No.
Particulars 2008-09 2009-10 2010-11 Provisional Revised Estimate
1 Rents, rates and taxes 3.89 4.12 4.66
2 Insurance 0.50 0.75 0.85
3 Telephone/telex charges, etc. 3.93 4.17 4.72 4 Internet and related charges 0.01 0.06 0.07 5 Legal charges 1.74 1.98 2.24 6 Audit fees 2.25 2.65 3.00 7 Consultancy charges 0.06 1.18 1.33 8 Other Professional charges 0.51 0.55 0.62
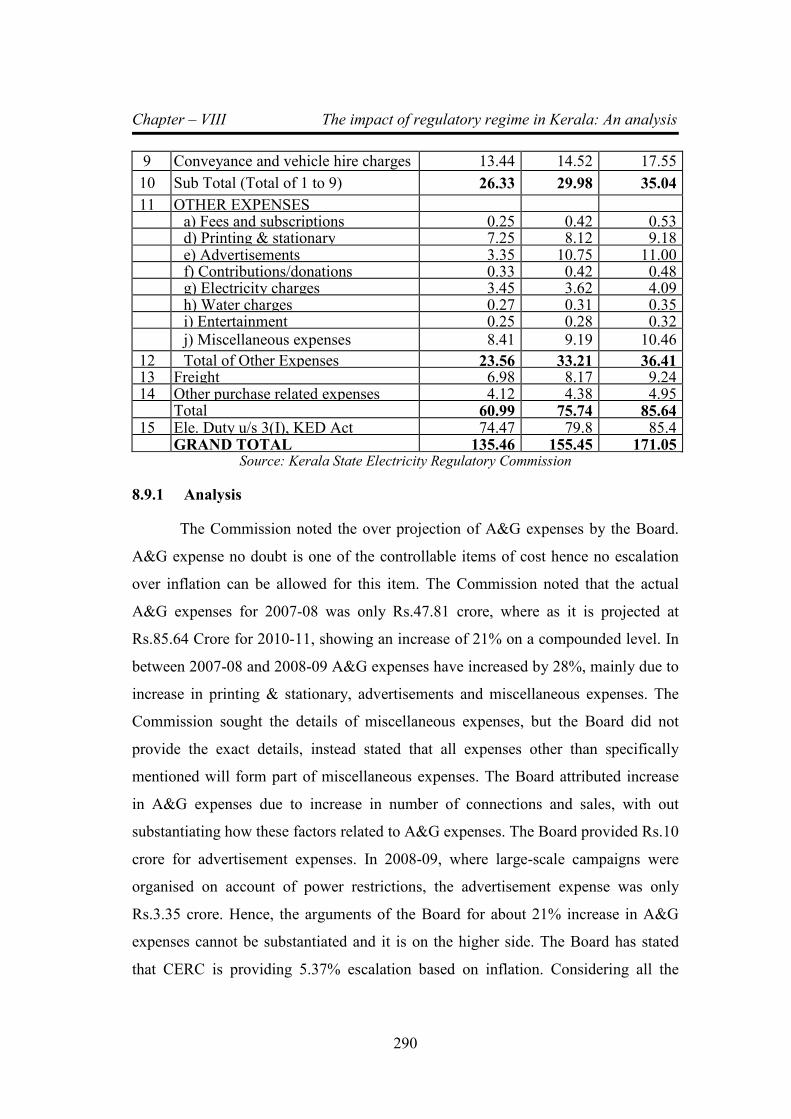
Chapter – VIII The impact of regulatory regime in Kerala: An analysis
290
9 Conveyance and vehicle hire charges 13.44 14.52 17.55
10 Sub Total (Total of 1 to 9) 26.33 29.98 35.04
11 OTHER EXPENSES a) Fees and subscriptions 0.25 0.42 0.53 d) Printing & stationary 7.25 8.12 9.18 e) Advertisements 3.35 10.75 11.00 f) Contributions/donations 0.33 0.42 0.48 g) Electricity charges 3.45 3.62 4.09 h) Water charges 0.27 0.31 0.35 i) Entertainment 0.25 0.28 0.32
j) Miscellaneous expenses 8.41 9.19 10.46
12 Total of Other Expenses 23.56 33.21 36.41 13 Freight 6.98 8.17 9.24 14 Other purchase related expenses 4.12 4.38 4.95 Total 60.99 75.74 85.64 15 Ele. Duty u/s 3(I), KED Act 74.47 79.8 85.4 GRAND TOTAL 135.46 155.45 171.05
Source: Kerala State Electricity Regulatory Commission
8.9.1 Analysis
The Commission noted the over projection of A&G expenses by the Board.
A&G expense no doubt is one of the controllable items of cost hence no escalation
over inflation can be allowed for this item. The Commission noted that the actual
A&G expenses for 2007-08 was only Rs.47.81 crore, where as it is projected at
Rs.85.64 Crore for 2010-11, showing an increase of 21% on a compounded level. In
between 2007-08 and 2008-09 A&G expenses have increased by 28%, mainly due to
increase in printing & stationary, advertisements and miscellaneous expenses. The
Commission sought the details of miscellaneous expenses, but the Board did not
provide the exact details, instead stated that all expenses other than specifically
mentioned will form part of miscellaneous expenses. The Board attributed increase
in A&G expenses due to increase in number of connections and sales, with out
substantiating how these factors related to A&G expenses. The Board provided Rs.10
crore for advertisement expenses. In 2008-09, where large-scale campaigns were
organised on account of power restrictions, the advertisement expense was only
Rs.3.35 crore. Hence, the arguments of the Board for about 21% increase in A&G
expenses cannot be substantiated and it is on the higher side. The Board has stated
that CERC is providing 5.37% escalation based on inflation. Considering all the
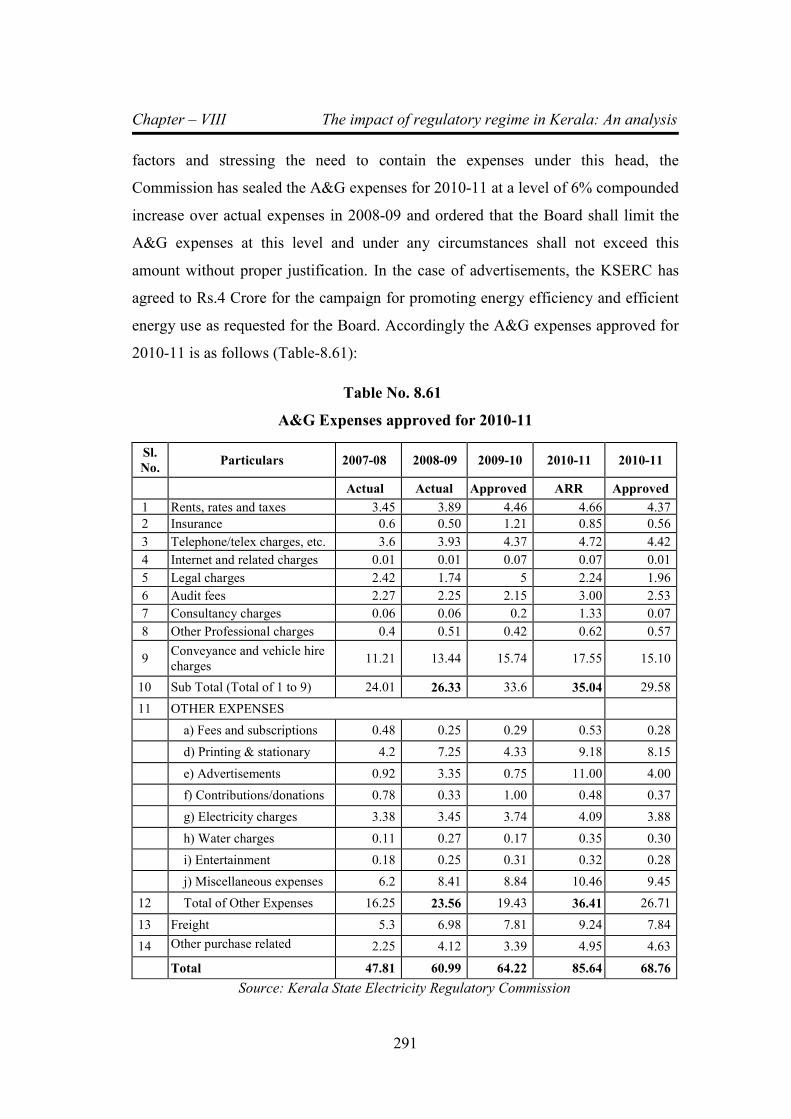
Chapter – VIII The impact of regulatory regime in Kerala: An analysis
291
factors and stressing the need to contain the expenses under this head, the
Commission has sealed the A&G expenses for 2010-11 at a level of 6% compounded
increase over actual expenses in 2008-09 and ordered that the Board shall limit the
A&G expenses at this level and under any circumstances shall not exceed this
amount without proper justification. In the case of advertisements, the KSERC has
agreed to Rs.4 Crore for the campaign for promoting energy efficiency and efficient
energy use as requested for the Board. Accordingly the A&G expenses approved for
2010-11 is as follows (Table-8.61):
Table No. 8.61
A&G Expenses approved for 2010-11
Sl.
No. Particulars 2007-08 2008-09 2009-10 2010-11 2010-11
Actual Actual Approved ARR Approved
1 Rents, rates and taxes 3.45 3.89 4.46 4.66 4.37
2 Insurance 0.6 0.50 1.21 0.85 0.56
3 Telephone/telex charges, etc. 3.6 3.93 4.37 4.72 4.42
4 Internet and related charges 0.01 0.01 0.07 0.07 0.01
5 Legal charges 2.42 1.74 5 2.24 1.96
6 Audit fees 2.27 2.25 2.15 3.00 2.53
7 Consultancy charges 0.06 0.06 0.2 1.33 0.07
8 Other Professional charges 0.4 0.51 0.42 0.62 0.57
9 Conveyance and vehicle hire
charges 11.21 13.44 15.74 17.55 15.10
10 Sub Total (Total of 1 to 9) 24.01 26.33 33.6 35.04 29.58
11 OTHER EXPENSES
a) Fees and subscriptions 0.48 0.25 0.29 0.53 0.28
d) Printing & stationary 4.2 7.25 4.33 9.18 8.15
e) Advertisements 0.92 3.35 0.75 11.00 4.00
f) Contributions/donations 0.78 0.33 1.00 0.48 0.37
g) Electricity charges 3.38 3.45 3.74 4.09 3.88
h) Water charges 0.11 0.27 0.17 0.35 0.30
i) Entertainment 0.18 0.25 0.31 0.32 0.28
j) Miscellaneous expenses 6.2 8.41 8.84 10.46 9.45
12 Total of Other Expenses 16.25 23.56 19.43 36.41 26.71
13 Freight 5.3 6.98 7.81 9.24 7.84
14 Other purchase related
expenses 2.25 4.12 3.39 4.95 4.63
Total 47.81 60.99 64.22 85.64 68.76
Source: Kerala State Electricity Regulatory Commission
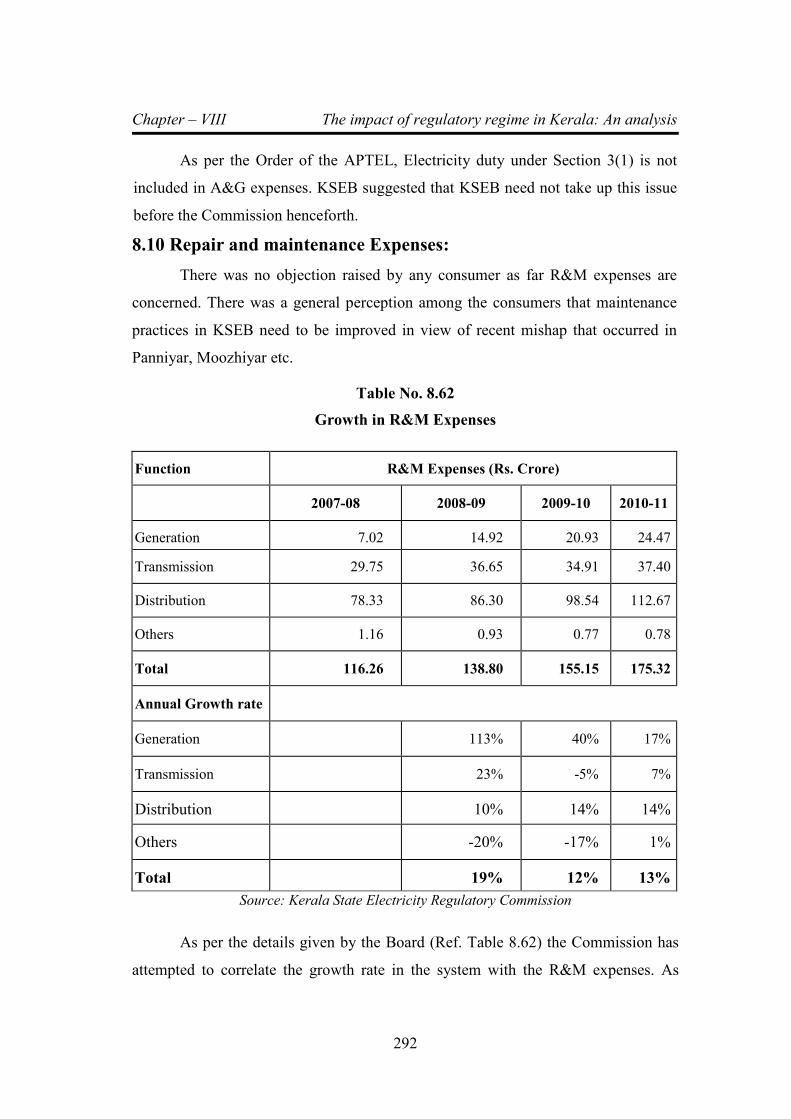
Chapter – VIII The impact of regulatory regime in Kerala: An analysis
292
As per the Order of the APTEL, Electricity duty under Section 3(1) is not
included in A&G expenses. KSEB suggested that KSEB need not take up this issue
before the Commission henceforth.
8.10 Repair and maintenance Expenses:
There was no objection raised by any consumer as far R&M expenses are
concerned. There was a general perception among the consumers that maintenance
practices in KSEB need to be improved in view of recent mishap that occurred in
Panniyar, Moozhiyar etc.
Table No. 8.62
Growth in R&M Expenses
Function R&M Expenses (Rs. Crore)
2007-08 2008-09 2009-10 2010-11
Generation 7.02 14.92 20.93 24.47
Transmission 29.75 36.65 34.91 37.40
Distribution 78.33 86.30 98.54 112.67
Others 1.16 0.93 0.77 0.78
Total 116.26 138.80 155.15 175.32
Annual Growth rate
Generation 113% 40% 17%
Transmission 23% -5% 7%
Distribution 10% 14% 14%
Others -20% -17% 1%
Total 19% 12% 13%
Source: Kerala State Electricity Regulatory Commission
As per the details given by the Board (Ref. Table 8.62) the Commission has
attempted to correlate the growth rate in the system with the R&M expenses. As
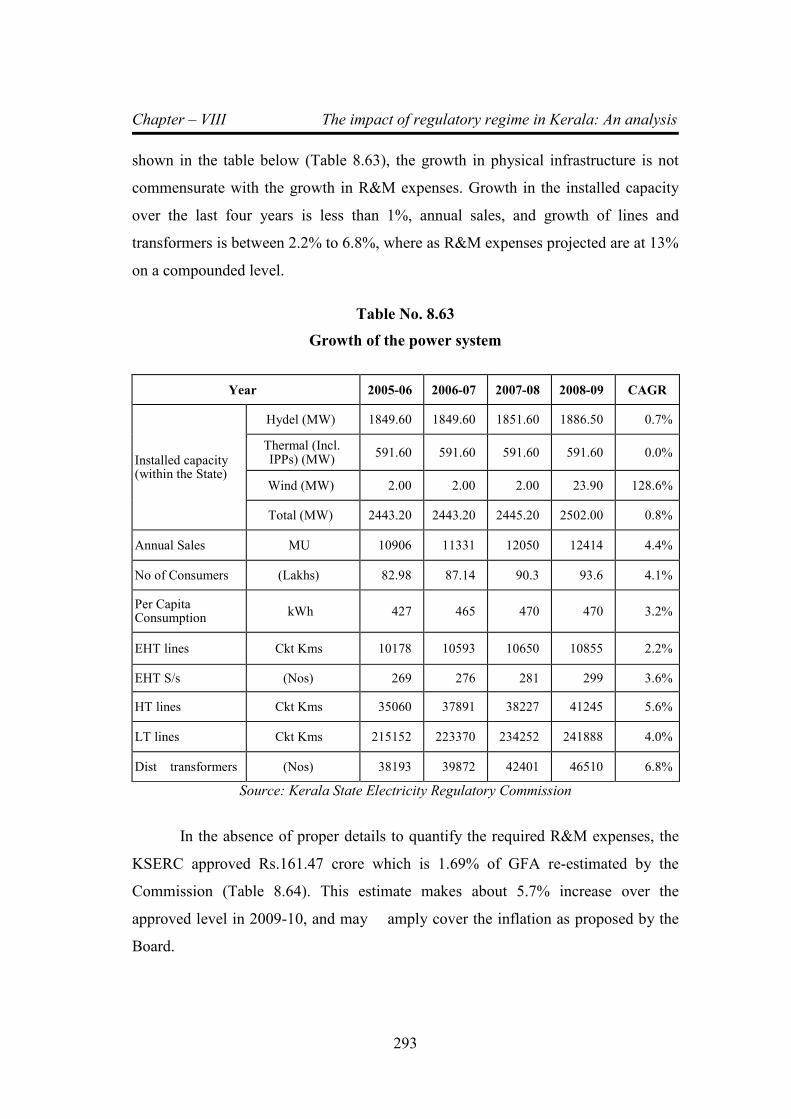
Chapter – VIII The impact of regulatory regime in Kerala: An analysis
293
shown in the table below (Table 8.63), the growth in physical infrastructure is not
commensurate with the growth in R&M expenses. Growth in the installed capacity
over the last four years is less than 1%, annual sales, and growth of lines and
transformers is between 2.2% to 6.8%, where as R&M expenses projected are at 13%
on a compounded level.
Table No. 8.63
Growth of the power system
Year 2005-06 2006-07 2007-08 2008-09 CAGR
Installed capacity (within the State)
Hydel (MW) 1849.60 1849.60 1851.60 1886.50 0.7%
Thermal (Incl. IPPs) (MW)
591.60 591.60 591.60 591.60 0.0%
Wind (MW) 2.00 2.00 2.00 23.90 128.6%
Total (MW) 2443.20 2443.20 2445.20 2502.00 0.8%
Annual Sales MU 10906 11331 12050 12414 4.4%
No of Consumers (Lakhs) 82.98 87.14 90.3 93.6 4.1%
Per Capita Consumption
kWh 427 465 470 470 3.2%
EHT lines Ckt Kms 10178 10593 10650 10855 2.2%
EHT S/s (Nos) 269 276 281 299 3.6%
HT lines Ckt Kms 35060 37891 38227 41245 5.6%
LT lines Ckt Kms 215152 223370 234252 241888 4.0%
Dist transformers (Nos) 38193 39872 42401 46510 6.8%
Source: Kerala State Electricity Regulatory Commission
In the absence of proper details to quantify the required R&M expenses, the
KSERC approved Rs.161.47 crore which is 1.69% of GFA re-estimated by the
Commission (Table 8.64). This estimate makes about 5.7% increase over the
approved level in 2009-10, and may amply cover the inflation as proposed by the
Board.

Chapter – VIII The impact of regulatory regime in Kerala: An analysis
294
Table No. 8.64
R&M Expenses approved for the year 2010-11
Asset Category
R&M expenses proposed in the
ARR
Revised GFA at the
beginning of the year
R&M Expenses Approved
%of
GFA
Rs. Crore Rs. Crore Rs. Crore
Buildings 4.92 508.83 4.53 0.94%
Hydraulic Works 2.12 912.65 1.95 0.23%
Other Civil Works 6.25 334.62 5.76 1.65%
Plant & Machinery 47.63 3,677.77 43.87 1.20%
Cable Network etc 107.49 4,077.14 99.00 2.38%
Vehicles 6.01 14.32 5.54 37.47%
Furniture and Fixtures 0.28 14.55 0.26 1.82%
Office Equipments 0.62 38.41 0.57 1.45%
Total 175.32 9,578.31 161.47 1.69%
Source: Kerala State Electricity Regulatory Commission
The higher provision of R&M can be justified only if performance
benchmarks are achieved progressively. The Commission has already introduced
standards of performance for distribution licensees. The Commission has directed the
Board to provide the base level of SoP achieved by the Board, which is yet to be
furnished. In its absence, it is difficult to assess the R&M requirement for
maintaining the standards. Hence, the Board shall with all supporting details provide
the actual base level of performance standards at the sections for the year 2009-10,
by the end of the first quarter of 2010-11. Commission ordered that unless such
details are provided, any increase in R&M expenses cannot be entertained. Similar
exercise would be extended for Generation and Transmission also.
8.11 Return on Equity
The Board has projected the return on equity of Rs.286.99 crore for 2010-11.
According to the Board, the Tariff Policy and CERC regulations permit them to
claim a return on the 30% contribution made from its internal resources. From
2010-11 onwards KSEB is giving due attention on capital investment and it is
finding it difficult to meet the fund requirements for 30% contribution. Hence from
Chapter – VIII The impact of regulatory regime in Kerala: An analysis
295
2010-11 onwards return as per CERC norms for the investment made by KSEB from
its own resources has to be allowed. Accordingly, KSEB estimated that of the capital
expenditure proposed of Rs.995.17 crore, 30% ie., Rs.298.55 crore is treated as from
own resources. Thus the total equity will be Rs.1851.55 crore. As per the revised
CERC norms the return on equity is at 15.5%, thus Rs.286.99 crore is claimed as
RoE. In support of the claim KSEB has also provided a copy of the letter from the
Secretary, Ministry of Power Government of India, which expresses concern over the
state utilities foregoing the permissible RoE. According to KSEB, in the said letter,
the Central Government had directed the State Governments to issue directions to
SERCs to initiate regulatory initiatives in line with CERC Tariff Regulations, 2009.
8.11.1 Analysis
The proposal of KSEB that 15.5% return on normative Debt Equity Ratio is
surprising. The Commission has given a thought to the contentions of KSEB so as to
examine its legality. According to the Board it is difficult to meet the funds for
capital expenditure to maintain DE ratio of 70:30. In the petition KSEB estimated
that Rs.286.99 Crore should be the investment from own sources in 2010-11.
Generally returns are allowed/claimed for the amount actually invested in the
regulated business. In this case KSEB has not made any investment. Further no
evidence is available that 30% of the funds have been generated from own sources.
In this respect it is interesting to see the provision in the CERC Regulations, 2009.
Clause 3(2), which is as follows:
Clause 3(2) ‘expenditure incurred’ means the fund, whether the equity or
debt or both, actually deployed and paid in cash or cash equivalent, for creation or
acquisition of a useful asset and does not include commitments or liabilities for
which no payment has been released;
KSEB’s claims do not fall under the above definition. The guiding principles
on determination of tariff under Clauses (a) to (h) of the Section 61 of the Act are as
follows:
Chapter – VIII The impact of regulatory regime in Kerala: An analysis
296
(a) commercial principles
(b) competition, efficiency, economical use of resources, good performance and
optimum investments
(c) balance between consumer interest and recovery of the cost of electricity in a
reasonable manner
(d) reward of efficiency of performance
(e) multi-year tariff principles
(f) tariff progressively reflects cost of generation and reduces cross subsidies
(g) promotion of cogeneration and generation from renewable resources
(h) National Electricity Policy
(i) Tariff Policy
Para 5.8.5 of the National Electricity Policy provides as under:
“All efforts will have to be made to improve the efficiency of operations in all
the segments of the industry. Suitable performance norms of operations together with
incentives and disincentives will need to be evolved along with appropriate
arrangement for sharing the gains of efficient operations with the consumers. This
will ensure protection of consumer interests on the one hand and provide motivation
for improving the efficiency of operations on the other.”
Hence, KSEB must realize that the provisions in the Regulations, need not
automatically make them eligible to get return which are passed on to the
consumers. The Board has no right or permission under the regulations to claim
returns without any basis. The regulations are clear in this respect that the
licensees/generating companies become eligible for return on their investment based
on the performance. No regulation guarantees any return for non-performance.
Chapter – VIII The impact of regulatory regime in Kerala: An analysis
297
Hence, in a performance based regulatory regime, return on equity is not a
right of the licensee, but it has to be directly linked with the fulfillment of the duty
cast upon the licensee and the efficiency with which they carryout such business. The
intention of the Act, Policies and Regulations is very clear in this respect. The
generating companies and licensees are ensured adequate return to attract sufficient
funds for investment. Adequacy of return‟ thus depends on the ability to attract
investment. As far as the Commission knows, KSEB has no difficulty in attracting
funds for investment. As long as KSEB exists as a monolithic entity, there is limited
scope for investment by any other sector. Hence the argument based on attracting
investment for a high rate of return is not sustainable.
Hence, as an interim measure, the Commission allowed a notional return of
Rs.100 Crore to Board. This provision will be treated as provisional and will be
refixed on the basis of real equity or what can be treated as equity for the purpose
calculating return on investment, which will be submitted by the Board on the basis
of a study by a reputed agency with approval of the Commission.
8.12 Expenses and Interest Capitalized
The Board has provided Rs.23.24 Crore towards interest and financing
charges capitalized and Rs.94.10crore towards expenses capitalized. The
Commission provisionally allowed these items in the ARR for 2010-11 as proposed
by the Board.
8.13 Aggregate Revenue Requirements
The summary of Aggregate Revenue Requirements projected by
the Board and approved by the Commission for 2010-11 is as follows (Table-8.64):
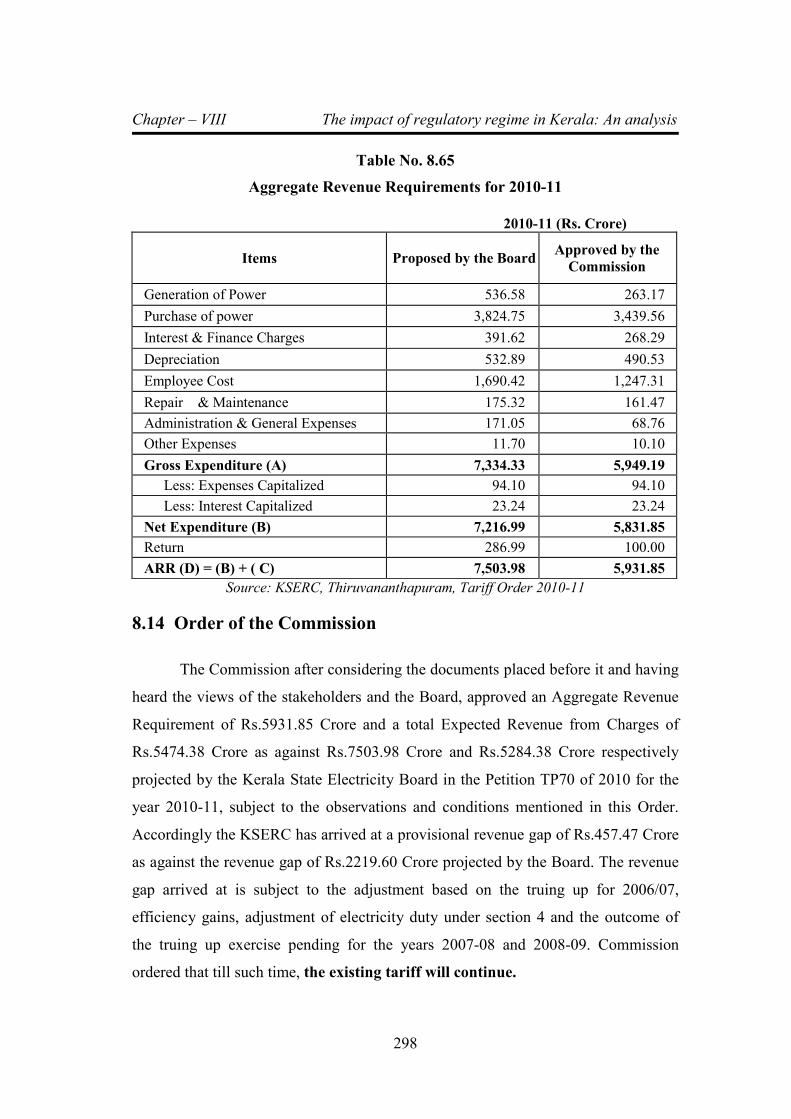
Chapter – VIII The impact of regulatory regime in Kerala: An analysis
298
Table No. 8.65
Aggregate Revenue Requirements for 2010-11
2010-11 (Rs. Crore)
Items Proposed by the Board Approved by the
Commission
Generation of Power 536.58 263.17
Purchase of power 3,824.75 3,439.56
Interest & Finance Charges 391.62 268.29
Depreciation 532.89 490.53
Employee Cost 1,690.42 1,247.31
Repair & Maintenance 175.32 161.47
Administration & General Expenses 171.05 68.76
Other Expenses 11.70 10.10
Gross Expenditure (A) 7,334.33 5,949.19
Less: Expenses Capitalized 94.10 94.10
Less: Interest Capitalized 23.24 23.24
Net Expenditure (B) 7,216.99 5,831.85
Return 286.99 100.00
ARR (D) = (B) + ( C) 7,503.98 5,931.85
Source: KSERC, Thiruvananthapuram, Tariff Order 2010-11
8.14 Order of the Commission
The Commission after considering the documents placed before it and having
heard the views of the stakeholders and the Board, approved an Aggregate Revenue
Requirement of Rs.5931.85 Crore and a total Expected Revenue from Charges of
Rs.5474.38 Crore as against Rs.7503.98 Crore and Rs.5284.38 Crore respectively
projected by the Kerala State Electricity Board in the Petition TP70 of 2010 for the
year 2010-11, subject to the observations and conditions mentioned in this Order.
Accordingly the KSERC has arrived at a provisional revenue gap of Rs.457.47 Crore
as against the revenue gap of Rs.2219.60 Crore projected by the Board. The revenue
gap arrived at is subject to the adjustment based on the truing up for 2006/07,
efficiency gains, adjustment of electricity duty under section 4 and the outcome of
the truing up exercise pending for the years 2007-08 and 2008-09. Commission
ordered that till such time, the existing tariff will continue.
Chapter – VIII The impact of regulatory regime in Kerala: An analysis
299
8.15 Tariff petitions & tariff revision orders
The electricity tariff for domestic consumers was reduced by 20 ps / unit with
effect from 1-1-2006 by KSERC. Earlier, Government of Kerala had agreed to
KSERC to release subsidy to KSEB to meet the additional expenditure incurred
towards implementing the tariff reduction. GoK paid the subsidy for 3 months only.
The reduction was withdrawn only during the next tariff revision in Nov. 2007.
KSERC should have withdrawn the tariff reduction immediately after Government of
Kerala stopped payment of subsidy to KSEB. This is a lapse on the part of KSERC.
KSEB submitted tariff proposal in June 2007 for revising the electricity tariff.
An increase of Rs. 1/unit was proposed in energy charges for HT & EHT industrial
electricity consumers. An increase of Rs. 70/kVA was proposed for demand charges
and Rs. 1.25/unit was proposed for energy for Railway traction. Such a tariff
increase would have resulted in closure of several power intensive industries working
in the State for the last many decades. This was fought tooth and nail by the
Industrial Electricity Consumers under the banner of Kerala HT & EHT Industrial
Electricity Consumers Association. The Trade Unions also realized the danger.
They also opposed the increase vehemently. The Commission issued its Order
revising tariff with effect from 1-12-2007. But there was no increase for most of the
categories including Domestic, HT and EHT Industrial, Commercial consumers etc.
Power Intensive Industries who started functioning after 17-12-1996 was imposed
with an increase of 50 paise / unit and also double the rates during peak time. Those
existed prior to December 1996 were exempted from the increase.
The basic tariff structure remains the same after the constitution of KSERC in
year 2002 (Ref. Figure 8.1).This is the single largest achievement of KSERC. The
increase from 1997 to 2002 i.e. 7 years prior to 2002 was from 112 paise / unit to 340
paise / unit i.e. more than 200 % and there was no increase since 2002. A graph
depicting the increase is attached in figure 9.1
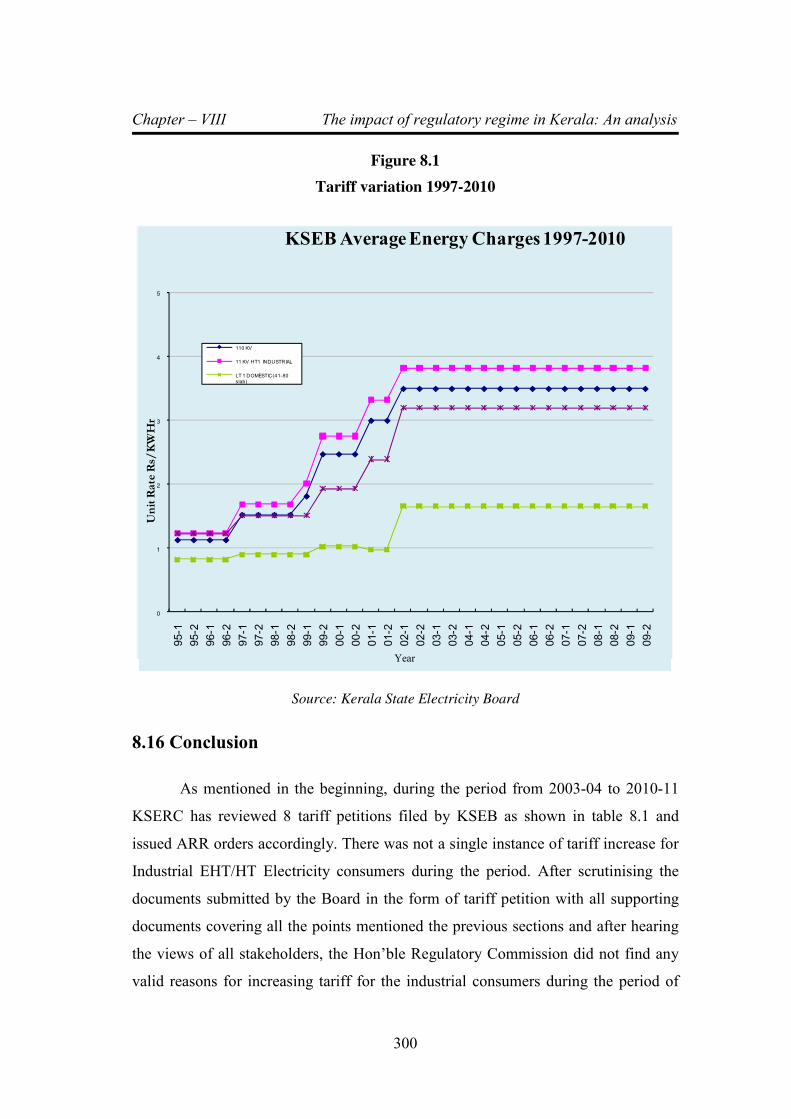
Chapter – VIII The impact of regulatory regime in Kerala: An analysis
300
Figure 8.1
Tariff variation 1997-2010
0
1
2
3
4
5
95-1
95-2
96-1
96-2
97-1
97-2
98-1
98-2
99-1
99-2
00-1
00-2
01-1
01-2
02-1
02-2
03-1
03-2
04-1
04-2
05-1
05-2
06-1
06-2
07-1
07-2
08-1
08-2
09-1
09-2
Unit Rate Rs/KWHr
KSEB Average Energy Charges 1997-2010
110 KV
11 KV HT1 INDUSTRIAL
LT 1 DOMESTIC(41-80
slab)
Source: Kerala State Electricity Board
8.16 Conclusion
As mentioned in the beginning, during the period from 2003-04 to 2010-11
KSERC has reviewed 8 tariff petitions filed by KSEB as shown in table 8.1 and
issued ARR orders accordingly. There was not a single instance of tariff increase for
Industrial EHT/HT Electricity consumers during the period. After scrutinising the
documents submitted by the Board in the form of tariff petition with all supporting
documents covering all the points mentioned the previous sections and after hearing
the views of all stakeholders, the Hon’ble Regulatory Commission did not find any
valid reasons for increasing tariff for the industrial consumers during the period of
Year
Chapter – VIII The impact of regulatory regime in Kerala: An analysis
301
regulatory regime under study (i.e. 2002 to 2010) or till date. The thorough prudence
check and close scrutiny of each and every items of expenditure by SERC has
brought about a discipline in the functioning of KSEB. The style of independent
regulatory process and independent decision-making by the KSERC on the basis of
merit, after hearing the views of licensee (KSEB) as well as consumers by
conducting open public hearing and inviting objections has strengthened the
regulatory review as a whole. KSEB did not like the control on their activities by
KSERC and the Board filed appeals at Appellate Tribunal for Electricity (ATE),
New Delhi against the orders of KSERC. But most of the appeals were dismissed.
An appeal on truing up was allowed partially. ARR & ERC Orders are, in effect, a
thorough review of the functioning of KSEB. KSERC issued a few directives in its
Order every year. Though, initially, KSEB was disregarding the directives, they
have started giving explanation now for not carrying out the directives.
Arresting the steep increase in electricity tariff, which was in vogue for a
decade, and maintaining it at the same level for almost another decade is the single
largest achievement of KSERC. It has saved many industrials units from closure.
Industries cross-subsidise heavily to other categories of consumers. Therefore, the
survival of high revenue contributing industrial consumers is a must for the survival
of KSEB and for the benefit of other categories of consumers. This is a great
achievement of KSERC, but it is not properly realized and appreciated. KSEB has
started to realize the power of KSERC, though belatedly. T & D losses and quality
of power are areas of improvement. Collection of service connection charges by
KSEB was declared illegal and stopped. Of course, there are areas where KSERC
could not achieve much progress. Multi Year Tariff, Open Access, Reduction in
Employment Cost, Open Access regulations which improve power trading in the
State, Cross subsidy reduction etc. are the main such areas. But overall, the
functioning of KSERC has been a grand success.
Chapter – IX Major findings, suggestions and conclusions
302
CHAPTER – 9
MAJOR FINDINGS, SUGGESTIONS AND CONCLUSIONS
9.1 Introduction
The Regulatory Commissions Act 1998 was formulated with the objective of
transforming the power sector. The financial position of the State Electricity Bonds
was in a poor state, mainly due to the inefficient and improper governance by State
Governments. The Act envisaged constituting State & Central Electricity Regulatory
Commissions for monitoring the functioning of Power Sector. The authority for
approving yearly Income & Expenditure statements, revising electricity tariff etc.
was vested with SERCs. The State Governments were denuded of the authority to
revise tariff. Electricity Act 2003 was formulated repealing prior Acts of 1910 &
1948. The Act envisaged unbundling of SEBs functionally on the basis of
generation, transmission & distribution. The ERCs were vested with sweeping
powers.
The regulatory framework, regulatory review process and the impact of
regulatory regime in Kerala are analysed in the previous chapters. The findings of the
study, suggestions and conclusions are detailed in this chapter.
9.2 Major Findings
9.2.1 Aggregate Revenue Requirement & Expected Revenue from Charges
(ARR & ERC)
ARR & ERC is the income-expenditure proposal of KSEB and other
licensees for the ensuing year. KSEB and other licensees in the State started
submitting ARR & ERC petitions before KSERC from 2003-2004 onwards, as
directed by the Commission. The KSERC publish the petitions in its web site and
seek ‘objections’ from the stakeholders. Commission conduct hearings at two or
three places in the state and finally pass orders. KSEB has all along been trying to

Chapter – IX Major findings, suggestions and conclusions
303
project higher ARR and lower ERC so as to project a ‘revenue gap’. Initially there
was mainly the HT & EHT Industrial Electricity Consumers Association to present
the ‘objections’. Later, Small Scale Industries Associations, Resident Associations
and NGOs also started to participate. But, generally, the participation in the
proceedings is poor.
The close scrutiny of each and every item of expenditure by SERC has
brought about a discipline in the functioning of KSEB. ARR & ERC Orders are, in
effect, a review of functioning of KSEB. Since the Board was functioning as a
monopoly public sector utility till the inception of KSERC, it took a rebellious
attitude towards KSERC by not complying with the directives of Regulatory
Commission on several occasions as the Board did not like Regulatory Commission
to control its activity. The Board filed appeals at Appellate Tribunal for Electricity
(ATE), New Delhi against several orders of KSERC, but most of the appeals were
dismissed. Now KSEB has started giving explanation for not carrying out the
directives of Commission. However KSEB has not complied with a no. of directives
issued by the KSERC. A consolidated list of directives, which await further actions
from KSEB, is attached as Annexure-V.
9.2.2 Truing up
There will be some additional expenditure incurred by KSEB over and above
what was approved in the ARR & ERC. The exercise of KSEB submitting a
proposal for additional sanction for previous years for the additional expenditure
involved is the truing up process. KSERC analyses the proposal and expenditure due
to uncontrollable factors (viz. high power purchase cost due to increase in fuel prize,
low rainfall etc.) are allowed and others are disallowed. This is practically an
extension of the ARR & ERC Order. KSERC has been generally doing an excellent
job in analyzing the expenditures and passing orders. But KSERC has not succeeded
in bringing about discipline in timely passing of the orders. Truing up orders have
been passed upto 2008-2009 only. The main reason is the late submission of the
truing up petitions by KSEB.
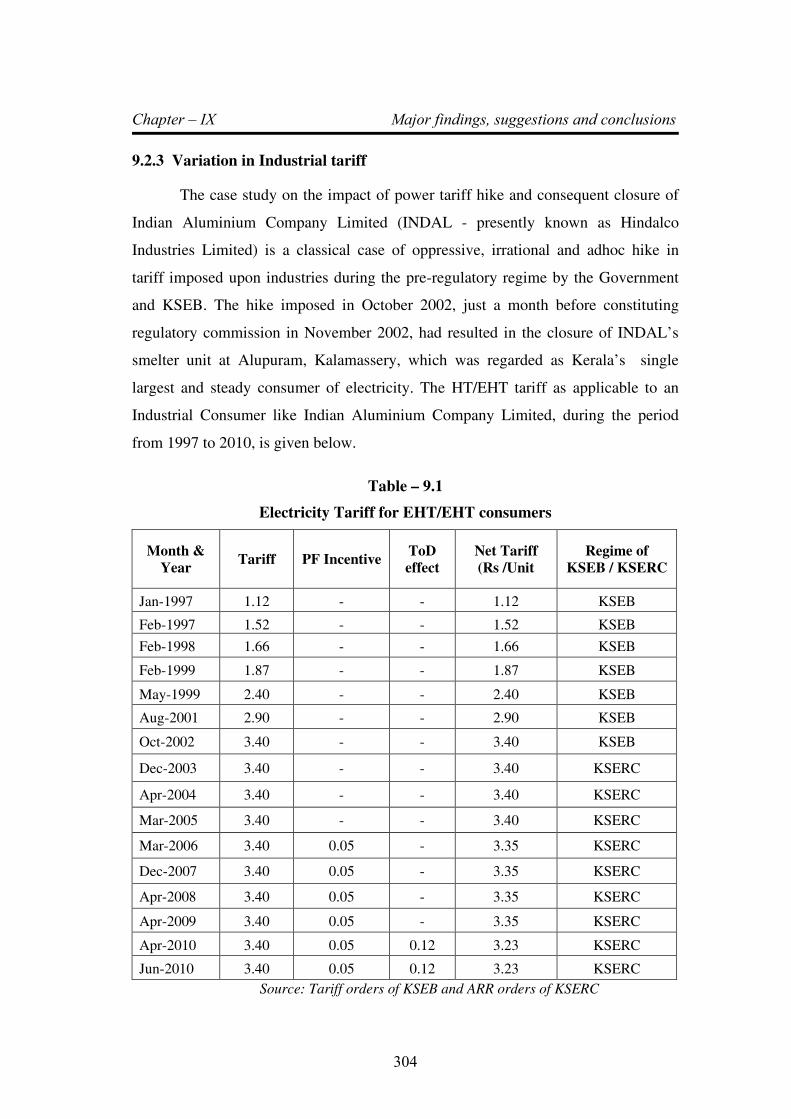
Chapter – IX Major findings, suggestions and conclusions
304
9.2.3 Variation in Industrial tariff
The case study on the impact of power tariff hike and consequent closure of
Indian Aluminium Company Limited (INDAL - presently known as Hindalco
Industries Limited) is a classical case of oppressive, irrational and adhoc hike in
tariff imposed upon industries during the pre-regulatory regime by the Government
and KSEB. The hike imposed in October 2002, just a month before constituting
regulatory commission in November 2002, had resulted in the closure of INDAL’s
smelter unit at Alupuram, Kalamassery, which was regarded as Kerala’s single
largest and steady consumer of electricity. The HT/EHT tariff as applicable to an
Industrial Consumer like Indian Aluminium Company Limited, during the period
from 1997 to 2010, is given below.
Table – 9.1
Electricity Tariff for EHT/EHT consumers
Month &
Year Tariff PF Incentive
ToD
effect
Net Tariff
(Rs /Unit
Regime of
KSEB / KSERC
Jan-1997 1.12 - - 1.12 KSEB
Feb-1997 1.52 - - 1.52 KSEB
Feb-1998 1.66 - - 1.66 KSEB
Feb-1999 1.87 - - 1.87 KSEB
May-1999 2.40 - - 2.40 KSEB
Aug-2001 2.90 - - 2.90 KSEB
Oct-2002 3.40 - - 3.40 KSEB
Dec-2003 3.40 - - 3.40 KSERC
Apr-2004 3.40 - - 3.40 KSERC
Mar-2005 3.40 - - 3.40 KSERC
Mar-2006 3.40 0.05 - 3.35 KSERC
Dec-2007 3.40 0.05 - 3.35 KSERC
Apr-2008 3.40 0.05 - 3.35 KSERC
Apr-2009 3.40 0.05 - 3.35 KSERC
Apr-2010 3.40 0.05 0.12 3.23 KSERC
Jun-2010 3.40 0.05 0.12 3.23 KSERC
Source: Tariff orders of KSEB and ARR orders of KSERC
Chapter – IX Major findings, suggestions and conclusions
305
From the table no. 9.1, it can be seen that the KSEB raised electricity tariff
from Rs. 1.12 / Unit in January 1997 to Rs. 3.40 / unit in October 2002. This is
equivalent an increase above 200 % from 1997 level. There was no hike in tariff
during the period from November 2002 to June 2010 (the period considered for
study) or even till date. This period corresponds to the regulatory regime in Kerala.
Even though KSEB had made several attempts to increase the tariff of HT/EHT
consumers by filing tariff petition before the Commission, the regulatory process
carried out by the Commission could not find any merit in KSEB’s demand. The
KSERC has introduced power factor incentive in March 2006 and ToD
rationalisation in December 2009. The average savings in tariff on account of PF
incentive for a power intensive industrial consumer would be 5 to 7 paise per unit on
an average and 10 to 12 paise per unit on an average on account of ToD
rationalisation. The above incentives or relief in tariff would result in a total
reduction in tariff to the tune of 17 to 20 paise per unit on an average. However,
those industrial units who are unable to shift the load from peak to off peak to avail
ToD benefit or who are not in apposition to improve power factor beyond the
specified limit would not get this advantage.
It can seen that in comparison with the frequent and steep hike in tariff
imposed upon by the KSEB as per the approval and directives of the Government
during pre-regulatory period, the KSERC could maintain a steady tariff without any
increase for a period of more than 8 years. KSERC had introduced incentives by
rationalizing ToD tariff and introducing PF incentive as stated above. This implies
that the tariff level during pre-regulatory period was exorbitant in real economic
terms.
9.2.4 Capital Investments
As per KSERC (Terms & Conditions of Tariff for retail sale of Electricity)
Regulations, 2006, the licensees shall (1) propose in their filings a detailed capital
investment plan covering spending on capital equipment that augments fixed assets,
and capitalization of corresponding interest and expenses determined as per the
applicable accounting policies and guidelines. Capital investments may address a
Chapter – IX Major findings, suggestions and conclusions
306
variety of needs such as meeting load growth, refurbishment and replacement of
equipment, reduction of losses, improvement of voltage profile, improvement of
quality of supply and system reliability, metering, communication, computerization,
etc. (2) The investment plan must separately show ongoing projects that will spill
into the year under consideration, and new projects that will commence but may be
completed within or beyond the tariff period. For the new projects, the filings must
provide justification as per the guidelines prescribed by the Commission from time to
time.(3) The Commission will review the licensee’s investment plan for approval, and
for this purpose may require the licensees to provide relevant technical and
commercial details. The costs corresponding to the approved investment plan of a
licensee for a given year shall, normally, be considered for its revenue requirement .
(4) In addition to the approved capital investment plan, licensees can seek provision
for additional capital expenditure any time during the tariff year to meet natural
calamities involving substantial investments. The Commission will examine such
demands and if satisfied shall approve the corresponding costs for inclusion in
revenue requirement in the next period (5) In presenting the justification for new
projects, the licensees shall detail the specific nature of the works, and outcomes
sought to be achieved. The details must be shown in the form of physical parameters,
e.g. new capacity added, to be added, meters replaced, customer service centres set
up, etc., so that it is amenable to physical verification. This is necessary to ensure
that the approved investment plans are implemented and the licensees do not derive
improper financial benefit by delaying or neglecting to make the proposed
investment. In case of any significant shortfall in physical implementation, the
Commission may require the licensees to explain the reasons, and may
proportionately reduce the provision, including the interest and the return
component, made towards revenue requirement, in the subsequent period (6) In case
a licensee proposes to set up generation projects, details of tariff calculations for the
electricity generated along with full justification there of should be furnished.
KSEB has projected capital expenditure of Rs 995.15 Crores for FY 2010-
11, a considerable decrease from the impractical targets that the Board used to
306
Chapter – IX Major findings, suggestions and conclusions
307
propose, and of course not achieve, in previous years. The main investment
objectives stated by KSEB are as below:
(a) To provide quality and reliable power at affordable cost to consumers
(b) To reduce the T&D loss within the targets set out by the CEA.
(c) Improve the performance of the Board through achieving further improvements
in the quality of power delivered to consumers.
(d) To provide power supply on demand to consumers and accomplish various
directions and standards within the time frames set out by the KSERC.
However, it is not clear from the ARR filing for FY10-11 how the proposed
investment will be implemented to achieve the objectives set by KSEB. All that has
been provided is a request to allow filing of capital investment plan by end of
January 2010. This has not been filed, and it is a violation of one of the main
conditions of the applicable regulations. Clearly, the Board has absolutely no clue
about what its capital investment program will be, and neither does it have a
streamlined, efficient project management team that can deliver projects on time and
within allocated budgets.
KSEB did not explain as to how the proposed investments meet the
objectives set down by it. KSEB also failed to state the benefits which can be
attained by the proposed investments. This is despite the Commission giving clear
directions to KSEB on the approach to be followed while proposing capital
investments.
The proposed capital investments need to be accompanied by the following:
(a) Detailed report explaining the cost and benefits derived from the investment
like; decrease in losses, improved quality of service, etc
(b) Detailed planning of the investment covering the start and end date of the
project, capitalisation schedule, etc
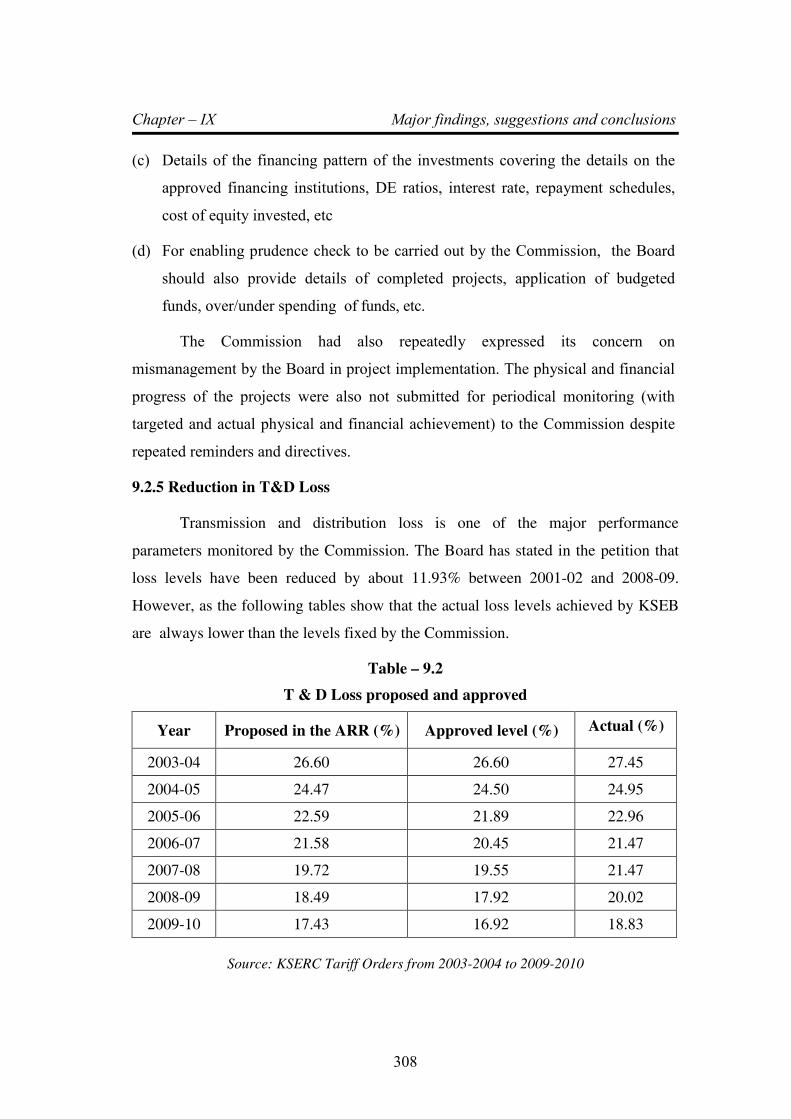
Chapter – IX Major findings, suggestions and conclusions
308
(c) Details of the financing pattern of the investments covering the details on the
approved financing institutions, DE ratios, interest rate, repayment schedules,
cost of equity invested, etc
(d) For enabling prudence check to be carried out by the Commission, the Board
should also provide details of completed projects, application of budgeted
funds, over/under spending of funds, etc.
The Commission had also repeatedly expressed its concern on
mismanagement by the Board in project implementation. The physical and financial
progress of the projects were also not submitted for periodical monitoring (with
targeted and actual physical and financial achievement) to the Commission despite
repeated reminders and directives.
9.2.5 Reduction in T&D Loss
Transmission and distribution loss is one of the major performance
parameters monitored by the Commission. The Board has stated in the petition that
loss levels have been reduced by about 11.93% between 2001-02 and 2008-09.
However, as the following tables show that the actual loss levels achieved by KSEB
are always lower than the levels fixed by the Commission.
Table – 9.2
T & D Loss proposed and approved
Year Proposed in the ARR (%) Approved level (%) Actual (%)
2003-04 26.60 26.60 27.45
2004-05 24.47 24.50 24.95
2005-06 22.59 21.89 22.96
2006-07 21.58 20.45 21.47
2007-08 19.72 19.55 21.47
2008-09 18.49 17.92 20.02
2009-10 17.43 16.92 18.83
Source: KSERC Tariff Orders from 2003-2004 to 2009-2010
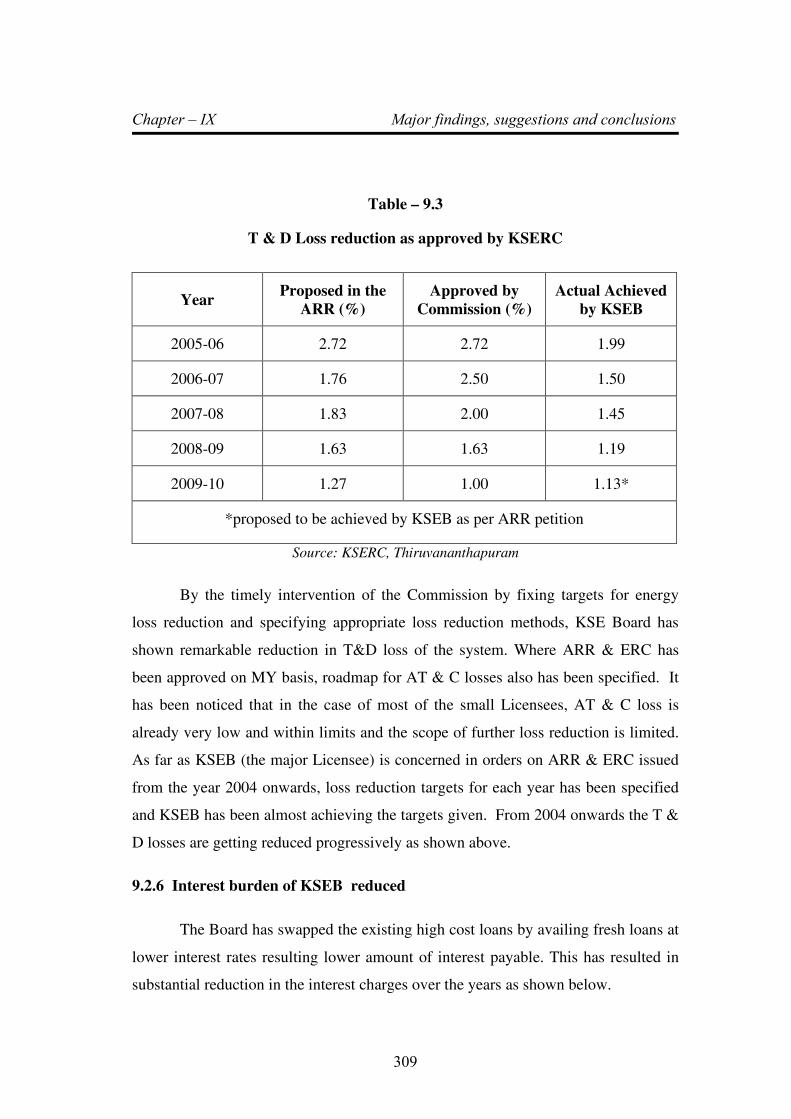
Chapter – IX Major findings, suggestions and conclusions
309
Table – 9.3
T & D Loss reduction as approved by KSERC
Year Proposed in the
ARR (%)
Approved by
Commission (%)
Actual Achieved
by KSEB
2005-06 2.72 2.72 1.99
2006-07 1.76 2.50 1.50
2007-08 1.83 2.00 1.45
2008-09 1.63 1.63 1.19
2009-10 1.27 1.00 1.13*
*proposed to be achieved by KSEB as per ARR petition
Source: KSERC, Thiruvananthapuram
By the timely intervention of the Commission by fixing targets for energy
loss reduction and specifying appropriate loss reduction methods, KSE Board has
shown remarkable reduction in T&D loss of the system. Where ARR & ERC has
been approved on MY basis, roadmap for AT & C losses also has been specified. It
has been noticed that in the case of most of the small Licensees, AT & C loss is
already very low and within limits and the scope of further loss reduction is limited.
As far as KSEB (the major Licensee) is concerned in orders on ARR & ERC issued
from the year 2004 onwards, loss reduction targets for each year has been specified
and KSEB has been almost achieving the targets given. From 2004 onwards the T &
D losses are getting reduced progressively as shown above.
9.2.6 Interest burden of KSEB reduced
The Board has swapped the existing high cost loans by availing fresh loans at
lower interest rates resulting lower amount of interest payable. This has resulted in
substantial reduction in the interest charges over the years as shown below.
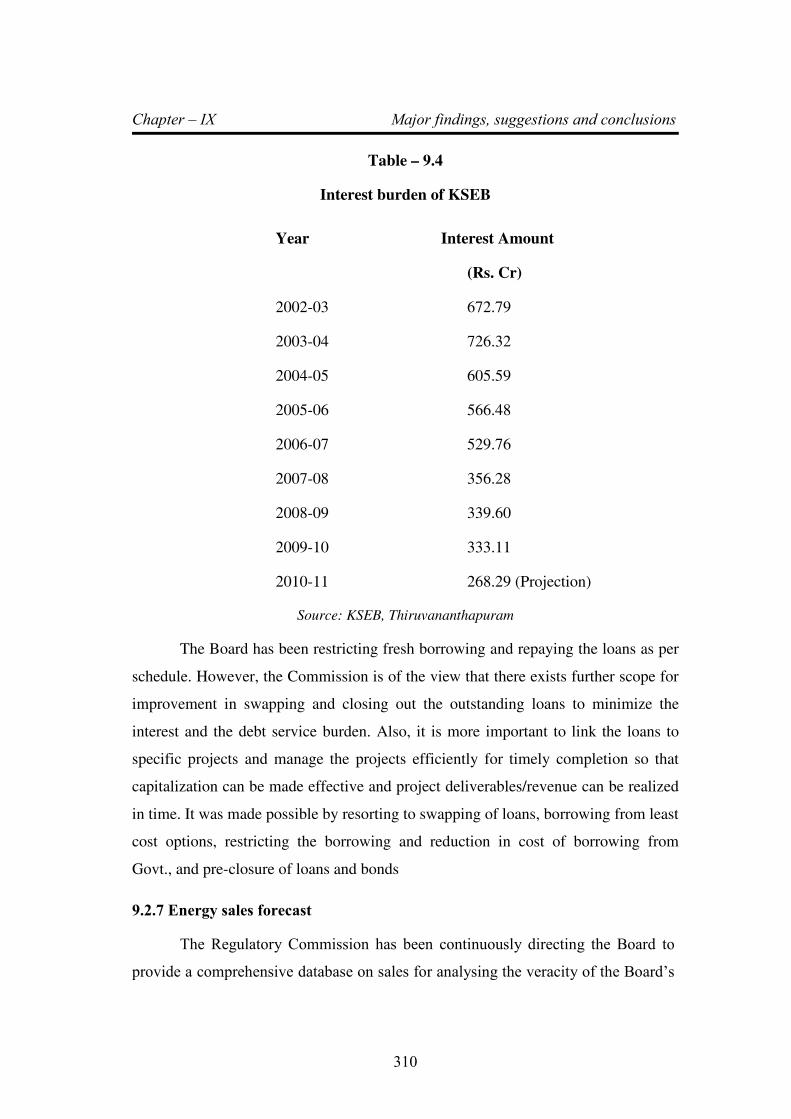
Chapter – IX Major findings, suggestions and conclusions
310
Table – 9.4
Interest burden of KSEB
Year Interest Amount
(Rs. Cr)
2002-03 672.79
2003-04 726.32
2004-05 605.59
2005-06 566.48
2006-07 529.76
2007-08 356.28
2008-09 339.60
2009-10 333.11
2010-11 268.29 (Projection)
Source: KSEB, Thiruvananthapuram
The Board has been restricting fresh borrowing and repaying the loans as per
schedule. However, the Commission is of the view that there exists further scope for
improvement in swapping and closing out the outstanding loans to minimize the
interest and the debt service burden. Also, it is more important to link the loans to
specific projects and manage the projects efficiently for timely completion so that
capitalization can be made effective and project deliverables/revenue can be realized
in time. It was made possible by resorting to swapping of loans, borrowing from least
cost options, restricting the borrowing and reduction in cost of borrowing from
Govt., and pre-closure of loans and bonds
9.2.7 Energy sales forecast
The Regulatory Commission has been continuously directing the Board to
provide a comprehensive database on sales for analysing the veracity of the Board’s

Chapter – IX Major findings, suggestions and conclusions
311
projections on energy sales. However, this remains merely on paper due to the
Board’s refusal to comply. The relevant extract from the Hon’ble Commissions
Order on ARR & ERC for FY10 is reproduced below “Though the Commission has
continuously directed the Board to provide comprehensive database on sales for
analyzing the veracity of the projections, the same was not provided nor any attempt
was made to create such database. The Commission in all its previous orders had
directed the Board to improve the methods of load forecast, which has not
materialized so far.”
Board had claimed that since its forecast was very close to reality, its current
method of forecasting sales is more than adequate, notwithstanding the explicit
directive of the Regulatory Commission to provide a comprehensive database of
sales. Since approved sales numbers are the starting point for determining generation
& power purchase cost, which is seen to be one of the major cost items of the Board.
This is especially important in the light of the Board’s trend of projecting gaps
running into thousands of crores on the grounds that it is being forced to purchase
expensive power to satisfy demand.
9.2.8 Optimum Scheduling of Internal Generation
The Commission keeps track of the daily generation scheduling of the Board
including the UI transaction by monitoring the daily system statistics and reservoir
report from SLDC. The power purchase schedule on merit order basis is
implemented and co-coordinated with internal hydro generation according to the
requirements by the Board and the same is regularly reviewed at various levels in
KSEB through appropriate management information system. The Commission
expects the Board to achieve further improvement in the Optimum Scheduling of
Internal Generation during FY 2010-11.
9.2.9 TOD tariff
ToD (Time of Day) tariff is techno-commercial tool used for encouraging
consumers to shift their load from, peak to off peak as all utilities in India are facing
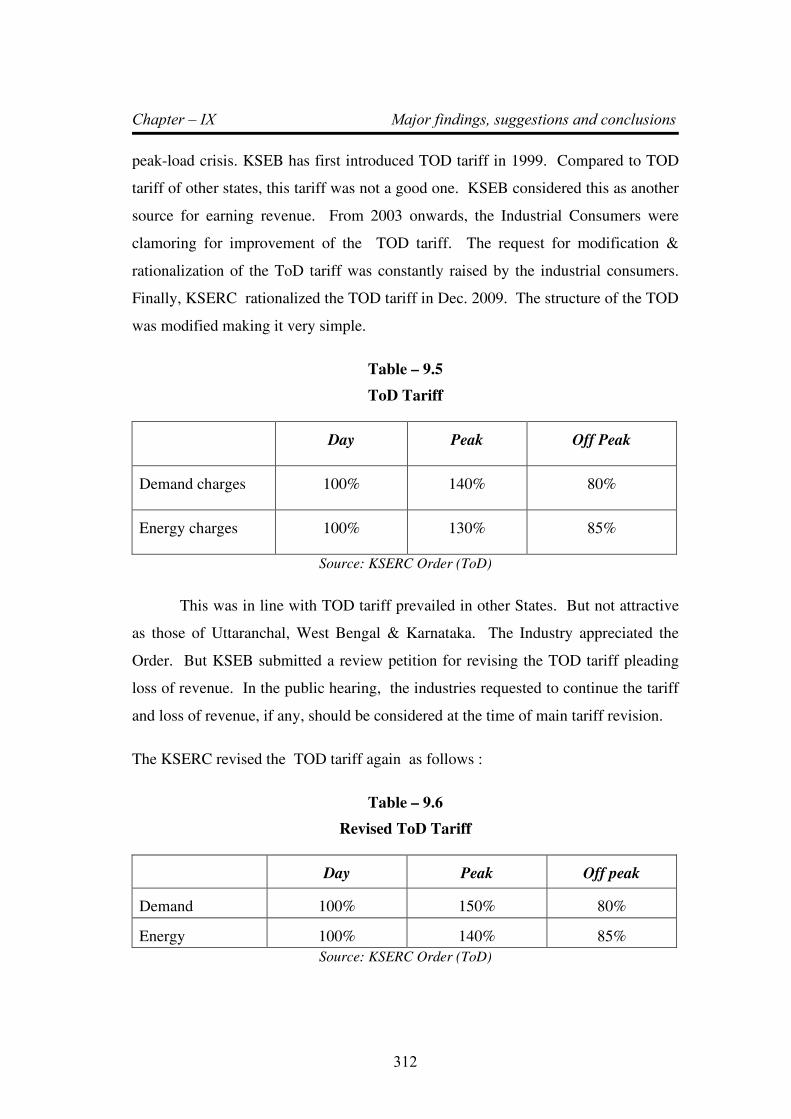
Chapter – IX Major findings, suggestions and conclusions
312
peak-load crisis. KSEB has first introduced TOD tariff in 1999. Compared to TOD
tariff of other states, this tariff was not a good one. KSEB considered this as another
source for earning revenue. From 2003 onwards, the Industrial Consumers were
clamoring for improvement of the TOD tariff. The request for modification &
rationalization of the ToD tariff was constantly raised by the industrial consumers.
Finally, KSERC rationalized the TOD tariff in Dec. 2009. The structure of the TOD
was modified making it very simple.
Table – 9.5
ToD Tariff
Day Peak Off Peak
Demand charges 100% 140% 80%
Energy charges 100% 130% 85%
Source: KSERC Order (ToD)
This was in line with TOD tariff prevailed in other States. But not attractive
as those of Uttaranchal, West Bengal & Karnataka. The Industry appreciated the
Order. But KSEB submitted a review petition for revising the TOD tariff pleading
loss of revenue. In the public hearing, the industries requested to continue the tariff
and loss of revenue, if any, should be considered at the time of main tariff revision.
The KSERC revised the TOD tariff again as follows :
Table – 9.6
Revised ToD Tariff
Day Peak Off peak
Demand 100% 150% 80%
Energy 100% 140% 85%
Source: KSERC Order (ToD)
Chapter – IX Major findings, suggestions and conclusions
313
By this order, the basic principle of ToD tariff was compromised i.e. there
should be proper incentive for shifting load from peak hours to off – peak hours and
& disincentive for consumption during peak hours. In this case the commission has
increased the penalty for peak consumption while keeping they incentive for
consumption during of peak hours same as that of previous ToD scheme. By this
revision, KSERC ensured more revenue for KSEB, but the requirement of DSM as
well as the genuine interest of the Industrial Consumers was compromised.
9.2.10 Power factor & other Incentives
PF incentives prevailed in India in a few States for more than a decade. The
request for a similar incentive scheme was finally accepted by KSERC in 2006. The
incentive was 0.15% for every % increase. Maximum incentive was 1.5%. But the
penalty is 1% for every % fall below 0.9. The penalty is stringent but the incentive is
not attractive. In Maharashtra the maximum PF incentive is 7% and in Gujarat it is
5%. The request of the Industries to make the PF incentive & disincentive more
reasonable has not been accepted so far. But it is good that such a scheme is in
vogue.
Incentive Schemes for Load factor and Bulk consumption are prevailing in
other States. But the request to introduce such incentives in Kerala has not been
accepted by KSERC so far.
9.2.11 Power Purchase optimization and Generation Cost
Section 13 of the KSERC (Terms and Conditions of Tariff for Distribution &
Retail Sale of Electricity under MYT Framework) Regulations, 2006 dated October
12 2006 clearly provides for the manner in which power purchase and associated
cost will be approved. The relevant extract of the regulations is reproduced below.
“Cost of Power purchase.- (1) The Distribution Licensee shall be allowed to
recover the cost of power it procures, from all the sources including the power
Chapter – IX Major findings, suggestions and conclusions
314
procurement from the State owned Generating stations, independent power
producers, Central generating stations, renewable energy sources and others for
supply of power to consumers, based on the Load Forecast approved by the
Commission for each of the financial years of the control period. (2) For the purpose
of determining the power purchase requirement of the Distribution Licensee for a
control period, the Commission shall adopt the sales forecast, the distribution loss
trajectory and power procurement plan approved by the Commission.(3) Approved
retail sales level shall be grossed up by normative level of T&D losses as indicated
in the MYT trajectory for allowing power purchase quantity. (4) While approving the
cost of power purchases, the Commission shall determine the quantum of power
from various sources in accordance with the principles of merit order schedule and
despatch based on a ranking of all approved sources of supply in the order of
variable cost. (5) All power purchase costs will be considered legitimate unless it is
established that the merit order principle has been violated or power has been
purchased at unreasonable rates.
In the ARR & ERC Order for FY09-10, the Commission had directed that
henceforth, the inflow data over a period of 20 years would be used to estimate the
inflow for the year under consideration. The relevant portion of the Hon’ble
Commission’s directive is reproduced below:
“Hence, the Commission is of the view that from next year onwards, the
method of estimation is to be changed from 10 years to 20 years, which would
reduce the influence of extreme values. Further, data for the current year (in the
present case 2008-09) be excluded from calculating the average, as about 7 months
data (ie., from November to May) for the current year have to be estimated as the
actual is not available.”
The Board has not complied with this directive of the Regulatory Commission.
However, the Commission has been regulating the power purchase of the
Board on merit order basis and the Board has been very effectively implementing the
same. As part of renewal of the PPA with NTPC-Kayamkulam plant, the Board was
314
Chapter – IX Major findings, suggestions and conclusions
315
successful in its attempt to derive commercial advantage of lower rate of overall
pooled cost of NTPC Kayamkulam by getting additional allocation of 180 MW with
effect from 1-11-2005 from NTPC- Talcher-II from the unallocated portion.
9.2.12 Depreciation
Depreciation is accounted for in ARR as a means to generate funds for
repayment of loans taken to fund capital investments. Capital investments plans are
being approved separately and loans for creation of these capital assets is being
allowed on normative basis, with interest on these loans being allowed separately.
Subsequently, these assets will be capitalised and depreciation claimed thereon,
which provides the funds needed for repayment of capital loans. When assets are
created through consumer contribution, the use of internal resources and/or external
borrowings is avoided. Therefore the need for depreciation on the portion of assets
created through consumer contributions, in order to meet RoE or loan repayment is
avoided.
When depreciation is allowed on consumer contribution funded assets, this
feeds through into tariff, and the consumer is being charged twice - (a) when his
funds were used for creation of asset wherein he incurs losses on the time value of
money, (b) when he has to pay a tariff which is higher by the amount of depreciation
allowed on the asset created with his funds. This is against the principles of natural
justice. In addition to this, due to the fact that depreciation is being recovered
through tariff as a revenue expense and there is no corresponding repayment / RoE
needed on assets created through consumer contribution, the funds so recovered
accrue to the Board as excess cash. This double recovery of funds from the
consumer is one of the main reasons responsible for the huge cash balances shown
on the Board’s balance sheet.
As the investments proposed are being separately approved by the
Regulatory Commission and as it would be difficult for the Commission to monitor
the depreciation amount collected towards consumer contribution and therefore, it
would be appropriate to disallow depreciation on assets funded by consumers and
other grants. The KSERC has taken into account this aspect in the ARR Order
2010-11.

Chapter – IX Major findings, suggestions and conclusions
316
9.2.13 Employee expenses
A few of the statements from the filings of the Board are indicative of the
attitude of the Board to the issue of stringent cost controls and driving efficiency in
operations. They are reproduced below for easy reference:
‘DA and terminal benefits are allowed periodically in line with the policy of
Government of Kerala and hence the Board cannot deny payment of such benefits.
As and when the Government releases DA installments to its employees, the same
are extended to the employees in the Board as well. This is in line with the wage
agreement with the employees and Government policy. This practice is in vogue for
the last several decades. With a view to improve operating efficiency and timely
service, the number of employees has to be increased in proportion to the number of
consumers. The commission may be well aware that in recruitment, payment of
remuneration etc. the system in the Board is very transparent and is totally in line
with Government Policy.’
The Board claims that it has to continue practices because they have been in
vogue for several decades. This shows KSEB is unaware of the changes that have
been sweeping across the country as a whole and the electricity sector in particular.
In several states, once monolithic, inefficient SEBs, have been unbundled.
Generation, transmission & distribution have been thrown open to private
participation since the governments of the country will be unable to fund the massive
expansion in capacity needed in generation, transmission and distribution to support
the economic growth and progress of the country. All these happened though they
had not been in vogue for several decades.
The Commission had earlier expressed its concern over Board’s irrational
approach towards projection of employee expense in various ARR and ERC orders.
The Commissions observations in previous Orders in this regard are reproduced
below:
316
Chapter – IX Major findings, suggestions and conclusions
317
“The share of employee cost in the ARR is an area of concern. The
Commission in its previous Orders had raised this issue in unequivocal terms. As
stated in the previous Order, the Board may review and critically evaluate
innovative and acceptable alternative options to mitigate the liabilities and burden
of terminal benefits, such as transition to a funded system of pension payments for
new employees and senior level executives and a system of incentives to encourage
migration of existing employees to funded systems”.
“The Board has not submitted any material on employee productivity and
functional deployment of existing and proposed manpower as well as human
resource policies to achieve the Standards of Performance stipulated by the
Commission and other regulatory measures envisaged in the Act and Policies. The
Commission refers to the directives in the previous Orders that an in-house team of
the Board may identify the scope for methods of improvement, rationalization of
manpower etc. aiming at enhanced employee productivity”
“The Commission is of the view that the Board has to attempt in addressing
the employee cost on the above lines and apprise the Commission.”
Needless to say, these directives of the KSERC are yet to be complied by
KSEB.
9.2.14 Reduction in penal charges
KSERC as per regulations has reduced penal interest on belated payment of
consumers from 24% to 12%. This has imparted great relief to consumers.
9.2.15 Interest for cash security
Board has been collecting cash deposits from consumers for giving new
connection. Commission has issued orders to KSEB and other licensees to pay
interest at Bank rates to consumers for the deposits.
Chapter – IX Major findings, suggestions and conclusions
318
9.2.16 Transparent process of decision making
The Commission organizes Public Hearings on all matters for presenting
facts & grievances of the public and other stakeholders in various parts of the State to
reach a vide spectrum of the population. Further the public can submit written
opinion on tariff and other matters. Commission finalizes its Orders through this
transparent process. Thus the Commission through its concerted efforts could instill
confidence in the minds of the stake holders and the general public as a judicial body
imbibing the true spirit of the Electricity Act, 2003.
In this context, it may be noted that during the pre-regulatory period
electricity tariff was fixed by KSEB with the permission of Government. KSEB or
Government before effecting such abnormal upward revisions in tariff did not study
the impact of tariff hike on the industrial consumers, especially power intensive
manufacturing units. As a result, a number power intensive manufacturing units
became economically unviable and ultimately wound up. For example, Indian
Alumium Company Limited, Alupuram Works, India’s first primary aluminium
smelter and the single largest consumer of electricity in the state right from its
inception in 1943 became economically unviable due to spiraling increase in cost of
production on account of frequent tariff hike and ultimately wound up its smelting
operations in August 2003.
9.2.17 Open Access Order.
Commission has issued an order on open access in the year 2004 which was
the first order on open access in the country. This order was issued to Indian
Aluminium Company Ltd to wheel 30 MW power from outside the state through
KSEB’s transmission lines as mentioned in Chapter – VII. This order of the
commission is attached as Annexure – III.
9.2.18 Appointment of Ombudsman and Formation of CGRF
For addressing consumer complaints, 3 Nos. of Consumer Grievance
Redressal Forums have been constituted under KSEB and one each under other
Licensees with two members from the licensee one member from the public
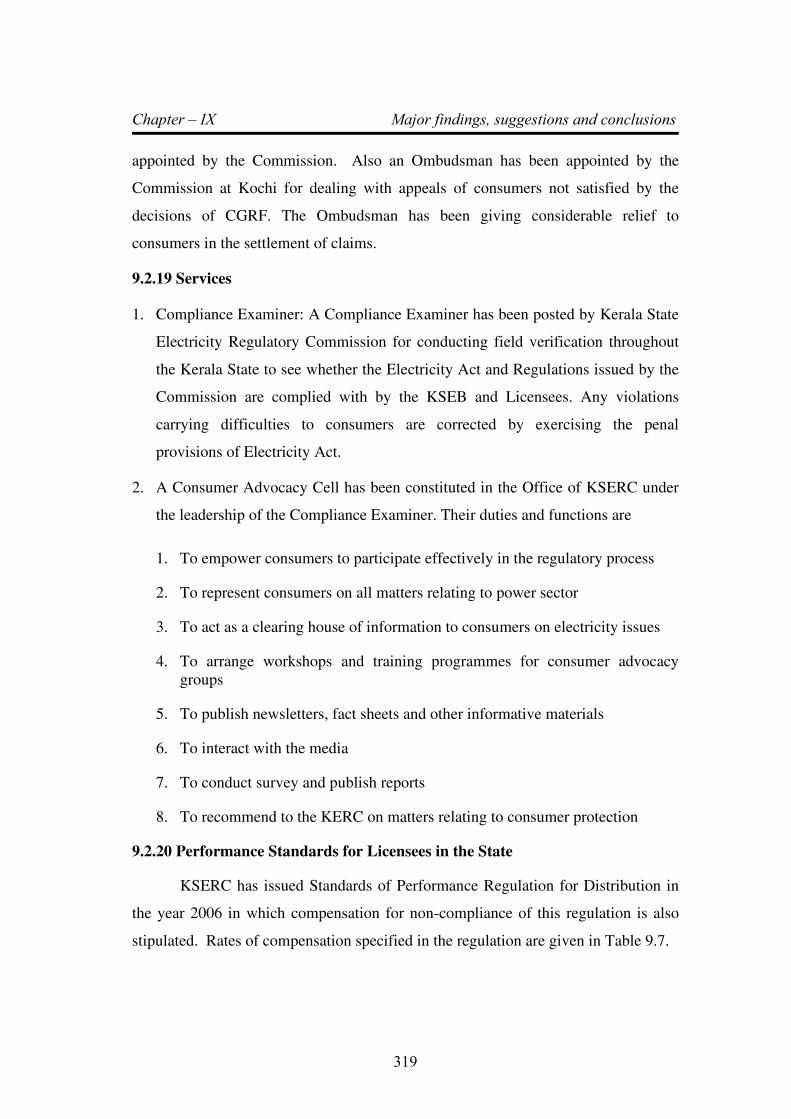
Chapter – IX Major findings, suggestions and conclusions
319
appointed by the Commission. Also an Ombudsman has been appointed by the
Commission at Kochi for dealing with appeals of consumers not satisfied by the
decisions of CGRF. The Ombudsman has been giving considerable relief to
consumers in the settlement of claims.
9.2.19 Services
1. Compliance Examiner: A Compliance Examiner has been posted by Kerala State
Electricity Regulatory Commission for conducting field verification throughout
the Kerala State to see whether the Electricity Act and Regulations issued by the
Commission are complied with by the KSEB and Licensees. Any violations
carrying difficulties to consumers are corrected by exercising the penal
provisions of Electricity Act.
2. A Consumer Advocacy Cell has been constituted in the Office of KSERC under
the leadership of the Compliance Examiner. Their duties and functions are
1. To empower consumers to participate effectively in the regulatory process
2. To represent consumers on all matters relating to power sector
3. To act as a clearing house of information to consumers on electricity issues
4. To arrange workshops and training programmes for consumer advocacy
groups
5. To publish newsletters, fact sheets and other informative materials
6. To interact with the media
7. To conduct survey and publish reports
8. To recommend to the KERC on matters relating to consumer protection
9.2.20 Performance Standards for Licensees in the State
KSERC has issued Standards of Performance Regulation for Distribution in
the year 2006 in which compensation for non-compliance of this regulation is also
stipulated. Rates of compensation specified in the regulation are given in Table 9.7.
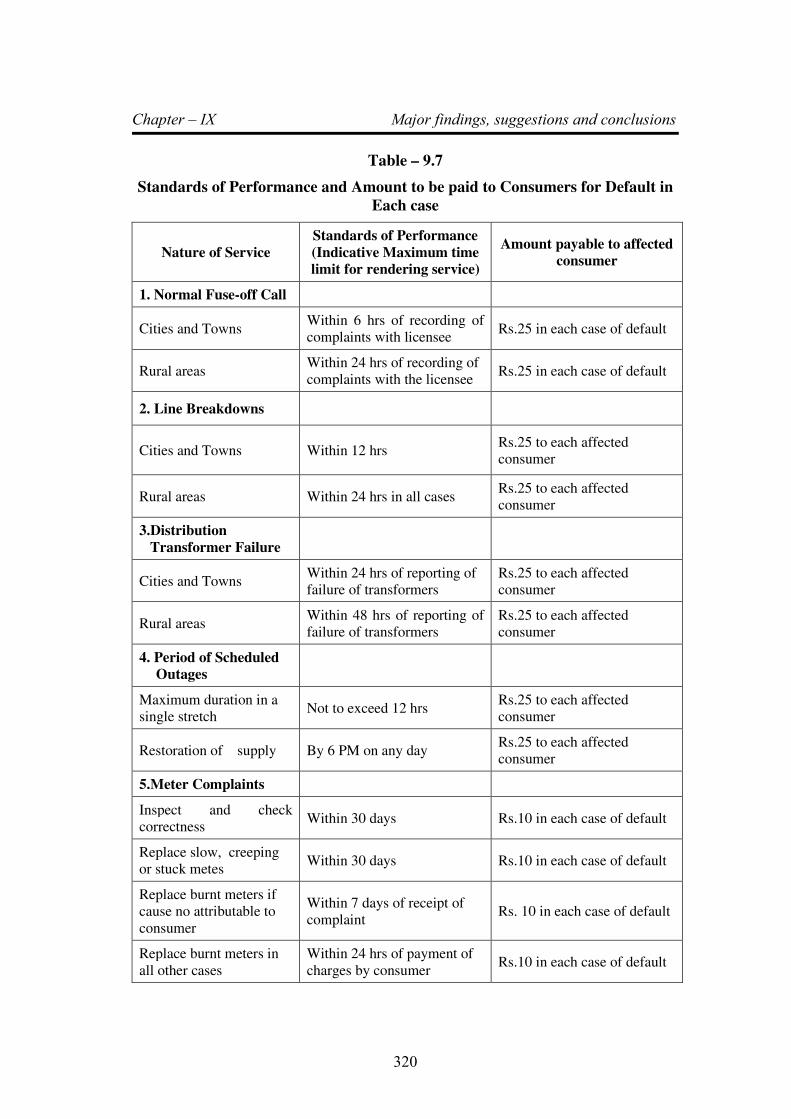
Chapter – IX Major findings, suggestions and conclusions
320
Table – 9.7
Standards of Performance and Amount to be paid to Consumers for Default in
Each case
Nature of Service
Standards of Performance
(Indicative Maximum time
limit for rendering service)
Amount payable to affected
consumer
1. Normal Fuse-off Call
Cities and Towns Within 6 hrs of recording of
complaints with licensee Rs.25 in each case of default
Rural areas Within 24 hrs of recording of
complaints with the licensee Rs.25 in each case of default
2. Line Breakdowns
Cities and Towns Within 12 hrs Rs.25 to each affected
consumer
Rural areas Within 24 hrs in all cases Rs.25 to each affected
consumer
3.Distribution
Transformer Failure
Cities and Towns Within 24 hrs of reporting of
failure of transformers
Rs.25 to each affected
consumer
Rural areas Within 48 hrs of reporting of
failure of transformers
Rs.25 to each affected
consumer
4. Period of Scheduled
Outages
Maximum duration in a
single stretch Not to exceed 12 hrs
Rs.25 to each affected
consumer
Restoration of supply By 6 PM on any day Rs.25 to each affected
consumer
5.Meter Complaints
Inspect and check
correctness Within 30 days Rs.10 in each case of default
Replace slow, creeping
or stuck metes Within 30 days Rs.10 in each case of default
Replace burnt meters if
cause no attributable to
consumer
Within 7 days of receipt of
complaint Rs. 10 in each case of default
Replace burnt meters in
all other cases
Within 24 hrs of payment of
charges by consumer Rs.10 in each case of default
Chapter – IX Major findings, suggestions and conclusions
321
6. Application for new
connection/additional
load
Release of supply where
service is feasible from
existing line without
system Deviation.
(Weatherproof
connection only)
Within one month of receipt
of application in complete
shape and remittance of CD
& connection charges. As per
Supply Code
Rs.50 for each day of default
Release of supply where,
extension of line,
Network expansion/
enhancement required for
providing connection
As specified by the
Commission in the Kerala
Electricity Supply Code,
2005
Rs.50 for each day of default
in case of LT and Rs.50 for
each day of default in case of
HT.
7. Erection of substation
for release of supply
As specified by the
Commission in the Kerala
Electricity Supply Code,
2005. This will be applicable
in the case of applicants who
have remitted cost as per
Section 46 of the Electricity
Act.
Rs.100 for each day of
default.
8. Transfer of
ownership and
Change of category
Within 14 days of receipt of
application in complete shape Rs.50 for each day of default
9. Conversion of LT
single phase to LT
three phase service
connection
Within 30 days from the date
of payment of charges if no
additional line or substation is
involved
Rs.50 for each day of default
10.Conversion from LT
to HT if HT line is
involved, if
transformer
substation is involved
As per Kerala Electricity
Supply Code 2005 Rs. 50 for each day of default
11.Resolution of
complaints on
consumers’ Bills if no
additional
information is
required
Within 24 hrs of receipt of
complaint Rs.25 for each day of default
If additional information
is required
Within 7 days of receipt of
complaint Rs.25 for each day of default

Chapter – IX Major findings, suggestions and conclusions
322
12. Reconnection of
supply following
disconnection
Towns and cities On the same day Rs.50 for each day of default
Rural areas Within 24 hrs of receipt of
payment from consumer Rs. 50 for each day of default
13. Payment of
Exgratia in case of
electric accidents
Cases where it is
established beyond doubt
that the accident is not
due to the fault of the
victim
Within 30 days without
waiting for the report from
CEIG
Rs.50 for each day of default
In other cases Within 30 days after receipt
of report from CEIG Rs.50 for each day of default
14.Refund of Deposits Within 60 days after receipt
of request and deposit receipt Rs.50 for each day of delay
Source: KSERC, Thiruvananthapuram
9.2.21 Non-compliance to Multi Year Tariff framework regulations
While filing tariff petitions, the KSEB used to make a declaration that tariff
application has been prepared as per the terms and conditions for determination of
tariff under section -61 of the Electricity Act, 2003 and the terms and conditions of
the KSERC (Tariff) Regulations, 2003 issued by the Commission. Further, the
relevant provisions of Indian Electricity Act 1910, Electricity (Supply) Act, 1948 and
Electricity Regulatory Commission Act, 1998 which are not contradictory to the
Electricity Act 2003, are also claimed to have been taken into consideration while
preparing this petition. But section 61(f) mandates that in specifying the terms and
conditions of tariff, the Regulatory Commission is required to adopt the principles of
multi-year tariff determination. The relevant extract from the Act is reproduced
below for easy reference
Chapter – IX Major findings, suggestions and conclusions
323
“61. The Appropriate Commission shall, subject to the provisions of this Act,
specify the terms and conditions for the determination of tariff, and in doing so, shall
be guided by the following, namely (f) multi year tariff principles;”
Further, the National Electricity Policy 2005 states that the MYT framework
is an important structural incentive framework, to minimise risks for all stakeholders
and drive improvements in system losses and operational efficiencies. The relevant
portion of NEP 2005 is given below:
“5.4.4 Conducive business environment in terms of adequate returns and
suitable transitional model with predetermined improvements in efficiency
parameters in distribution business would be necessary for facilitating funding and
attracting investments in distribution. Multi-Year Tariff (MYT) framework is an
important structural incentive to minimize risks for utilities and consumers, promote
efficiency and rapid reduction of system losses. It would serve public interest through
economic efficiency and improved service quality. It would also bring greater
predictability to consumer tariffs by restricting tariff adjustments to known
indicators such as power purchase prices and inflation indices. Private sector
participation in distribution needs to be encouraged for achieving the requisite
reduction in transmission and distribution losses and improving the quality of service
to the consumers.”
Similarly, Section 5.3 (h) of the National Tariff Policy 2006 deals with the
issue of MYT framework
h) Multiyear Tariff –
1) Section 61 of the Act states that the Appropriate Commission, for
determining the terms and conditions for the determination of tariff, shall
be guided inter-alia, by multi-year tariff principles. The MYT framework
is to be adopted for any tariffs to be determined from April 1, 2006. The
framework should feature a five-year control period. The initial control
period may however be of 3 year duration for transmission and
Chapter – IX Major findings, suggestions and conclusions
324
distribution if deemed necessary by the Regulatory Commission on
account of data uncertainties and other practical considerations. In cases
of lack of reliable data, the Appropriate Commission may state
assumptions in MYT for first control period and a fresh control period
may be started as and when more reliable data becomes available.
5) Clear guidelines and regulations on information disclosure may be
developed by the Regulatory Commissions. Section 62 (2) of the Act
empowers the Appropriate Commission to require licensees to furnish
separate details, as may be specified in respect of generation, transmission
and distribution for determination of tariff.
Section 8.1 of the National Tariff Policy deals specifically with MYT
framework implementation in distribution, and relevant sections are reproduced
below:
Implementation of Multi-Year Tariff (MYT) framework
1) This would minimise risks for utilities and consumers, promote efficiency
and appropriate reduction of system losses and attract investments and
would also bring greater predictability to consumer tariffs on the whole by
restricting tariff adjustments to known indicators on power purchase
prices and inflation indices. The framework should be applied for both
public and private utilities.
7) Appropriate Commissions should initiate tariff determination and
regulatory scrutiny on a suo-moto basis in case the licensee does not
initiate filings in time. It is desirable that requisite tariff changes come into
effect from the date of commencement of each financial year and any gap
on account of delay in filing should be on account of licensee.
As per Section 61(f) of the Electricity Act, and provisions of the NEP05 &
NTP06, the Commission has issued the KSERC (Terms and Conditions of Tariff for
Chapter – IX Major findings, suggestions and conclusions
325
Distribution & Retail sale of Electricity under Multi Year Tariff Framework)
Regulations 2006 on 12th
October 2006. The regulations require the licensee to file
for ARR for a period of three years, which is the first control period, starting from
FY07–08.
In Chapter XI – Directives, Section 11.1 of the ARR and ERC Order for the
year FY2007-08, the Commission has given the following directive to the Board:
“The Commission in accordance with the provisions of Sub Sections (2) and
(5) of Section 62 of the Act and Section 86(1) (a) thereof, is mandated to determine
separate tariff for generation, supply, transmission, distribution, wheeling and retail
sale of electricity within the State irrespective of the fact that whether the State utility
has remained vertically integrated or has been unbundled. The statute does not make
any distinction between a licensee and a deemed licensee; and same procedure shall
be applicable for determination of tariff for transmission and distribution of
electricity to new licensees as well as the deemed licensees”
Also, reference is made to the Section 5.3(h) of the Tariff Policy wherein it is
stated that the MYT framework has to be adopted for tariff determination in future.
“The forum of Regulators has considered the time requirement of data
collection for the preparation of MYT and decided that filing under MYT regime
might be commenced from the base year of FY2008-09. Therefore, in line with these
requirements, the Board shall submit a detailed Multi Year Tariff petition from FY
2008-09 with complete supporting data and analysis in accordance with the relevant
sections/ provisions of Electricity Act 2003 and Tariff Policy”
Since the issuance of the ARR & ERC Order for FY07-08, directing filing
under MYT framework from FY08-09 onwards, the Board has filed ARR & ERC
applications for approval to the Commission for FY08-09, FY09-10 and FY10-11 on
an annual basis. Therefore, KSEB has not complied with the provisions of the Act,
the NEP05, the NTP06, applicable regulations and lawful directives of KSERC,
which is in violation of the existing legal, policy & regulatory regime in the country.
Chapter – IX Major findings, suggestions and conclusions
326
However, KSERC has continued to accept the Board’s filings without dissent on this
crucial non-compliance, which in turn would encourage KSEB to default on its
regulatory obligations, and flout the authority and power of the Commission with
impunity. The Board was wilfully refusing to comply with regulations that it is
legally bound to follow, since it is under the impression that the Commission will
allow business as usual to continue.
The idea behind the multi-year tariff regime is to provide certainty to
consumers regarding tariffs for electricity over an extended period of time, to have a
clear path defined with measurable milestones to guide the process of reforms in the
electricity sector and to provide certainty to the licensee with regards to its costs and
revenue. By refusing to follow the MYT regulations, the Board is actually holding
up the progress of the electricity sector reforms in the state, as this allows it to
continue with business as usual of inflated costs foisted onto hapless consumers, and
this situation need to be changed. MYT framework is an incentive framework which
motivates the licensee to reduce losses and improve efficiencies. Any delay in the
filing of multiyear tariffs will completely be against the principles of efficiency. The
States which are already implemented Multi-year tariff structure are listed in
Table 9.8.

Chapter – IX Major findings, suggestions and conclusions
327
Table 9.8
List of states that file for ARR & ERC under the MYT framework
States
Maharashtra
Andhra Pradesh
Madhya Pradesh
Orissa
Karnataka
Himachal Pradesh
Delhi
West Bengal
Rajasthan
Gujarat
Assam
Source: Central Electricity Regulatory Commission, Delhi
327
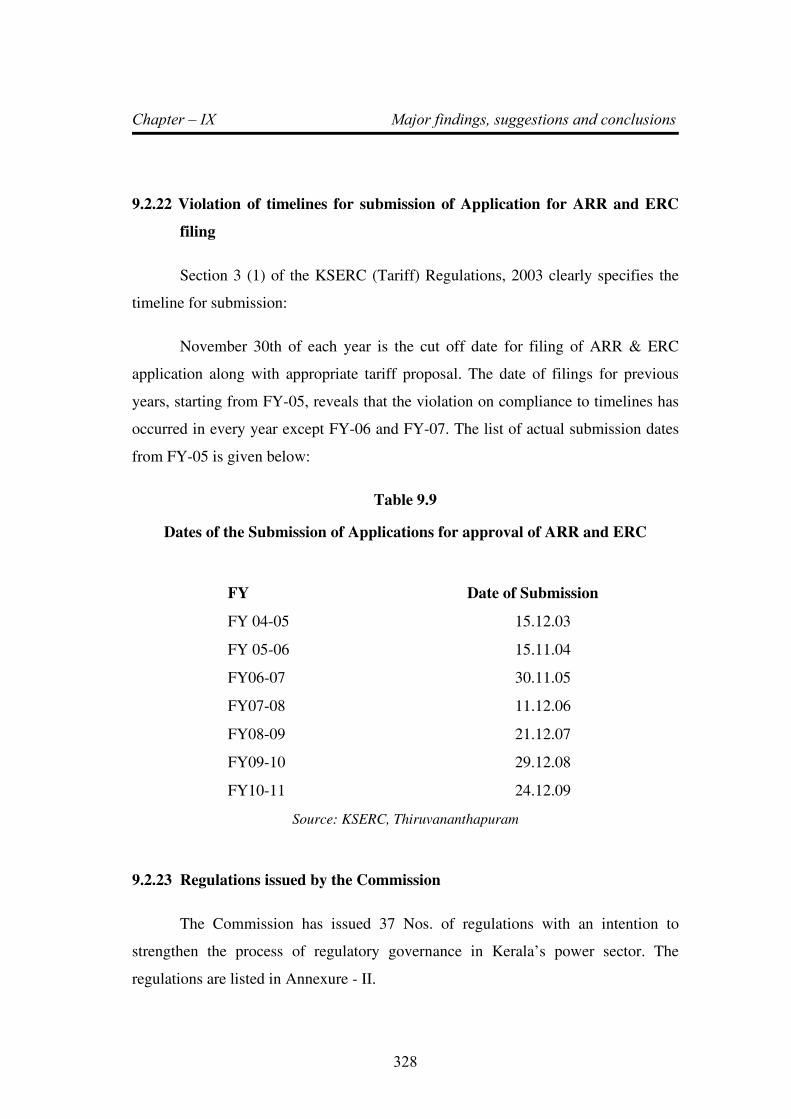
Chapter – IX Major findings, suggestions and conclusions
328
9.2.22 Violation of timelines for submission of Application for ARR and ERC
filing
Section 3 (1) of the KSERC (Tariff) Regulations, 2003 clearly specifies the
timeline for submission:
November 30th of each year is the cut off date for filing of ARR & ERC
application along with appropriate tariff proposal. The date of filings for previous
years, starting from FY-05, reveals that the violation on compliance to timelines has
occurred in every year except FY-06 and FY-07. The list of actual submission dates
from FY-05 is given below:
Table 9.9
Dates of the Submission of Applications for approval of ARR and ERC
FY Date of Submission
FY 04-05 15.12.03
FY 05-06 15.11.04
FY06-07 30.11.05
FY07-08 11.12.06
FY08-09 21.12.07
FY09-10 29.12.08
FY10-11 24.12.09
Source: KSERC, Thiruvananthapuram
9.2.23 Regulations issued by the Commission
The Commission has issued 37 Nos. of regulations with an intention to
strengthen the process of regulatory governance in Kerala’s power sector. The
regulations are listed in Annexure - II.
Chapter – IX Major findings, suggestions and conclusions
329
9.2.24 Segregation of Accounts for Generation, Transmission, Distribution and
Supply
The unbundling of vertically integrated utilities in the country into the distinct
functions of generation, transmission and distribution is called for in the Electricity
Act 2003. The reason for this is that these three functional areas are distinct in the
electricity supply activity chain, and each calls for a different set of competencies,
which when developed will ensure efficient and effective operations leading to
quality of service improvements, identification of areas of deficiency and focused
activity to drive efficiency gains resulting in benefits to consumers and sustainable,
profitable operations of the utilities. The Commission has directed the Board to
provide segregated accounts for each function of the Board to enable the
Commission to determine separate tariffs for each business. However, the Board has
repeatedly failed to provide the details. The directive of the Commission as per the
ARR and ERC order for FY07-08 is as shown below:
‘The Commission in accordance with the provisions of Sub Sections (2) and
(5) of Section 62 of the Act and Section 86(1) (a) thereof, is mandated to determine
separate tariff for generation, supply, transmission, distribution, wheeling and retail
sale of electricity within the State irrespective of the fact that whether the State utility
has remained vertically integrated or has been unbundled. The statute does not make
any distinction between a licensee and a deemed licensee; the same procedure shall
be applicable for determination of tariff for transmission and distribution of
electricity to new licensees as well as the deemed licensees.’
The Commission has repeated its direction to the KSEB to initiate the process
of segregation of the accounts for each function in its Order dated August 27, 2009
in response to KSEB’s Review Petition on May 27, 2009 on the ARR and ERC
Order for FY09-10. The relevant extract from the Order is “Hence, by accepting the
suggestion of KSEB for fixing norms for various items, the Commission hereby
directs that a proposal for fixing norms for generation, transmission and distribution
329
Chapter – IX Major findings, suggestions and conclusions
330
separately shall be filed by KSEB within two months, with all supporting details
including past 10 years function level expenses and performance.”
The regulations of the Commission also call for segregation of ARR between
distribution and supply, to ensure transparency in the functioning of the Board and
ensure that efficiency targets are met in each functional area of the Board. Naturally,
the Board with its vested interest in maintaining status quo to avoid scrutiny of its
operations, which allows it the freedom to inflate costs at will, has failed to comply
with this directive as well. The Board has failed to comply with the two-months
timeline, and has refused to provide segregated costs. After inordinate delay, the
Government has initiated the first steps towards corporatisation of the Board. The
Board in its filing for FY09-10 had stated that “Government of Kerala as per Section
131 of the Electricity Act, 2003 has vide Order No.MS 37/2008/PD dated 25-10-
2008, had issued orders for vesting all the functions, properties, interests, rights,
obligations and liabilities of KSEB which will be revested to a new entity within one
year ie., by September 2009.” KSEB in its ARR&ERC petition for 2010-11,the
same lines have been repeated, but it is interesting to note that no timeline has been
specified for completion of the process, reflecting the attitude the Board to fight
change at any cost. The unbundling of KSEB would obviously lead to segregation of
accounts, which is necessary to target efficiency measures at each functional level. It
can be seen from Commission’s observations that unbundling is being deliberately
delayed by the Board to avoid segregation of accounts and exposure of inefficiencies
in operations. Further, the Government would like to continue its practice of
mandating subsidies for certain categories of consumers, whilst continuing to shirk
its responsibility of bearing the cost of such subsidies, as mandated in the Act, and
the Board would not like do ununbundling as it would throw more light on its
inefficiencies.
9.2.25 Cross Subsidy
As per Section 61 of the Electricity Act, the State Electricity Regulatory
Commission has to be guided by the principles enumerated in the said section in
330
Chapter – IX Major findings, suggestions and conclusions
331
determining terms and conditions of tariff. The National Tariff Policy requires the
State Commissions to reduce cross subsidies and bring down tariffs within the levels
of ±20% of the average cost of supply by year 2010-2011. And as per Section-19 of
the KSERC (Terms and Conditions of Tariff for Retail Sale of Electricity)
Regulations, 2006 “A road map for cross subsidy reduction will be fixed by the
Commission and will be reviewed on the basis of average cost of supply”. Till date
the KSEB has submitted no proposal towards the same, as reduction in cross subsidy,
in the absence of Government subsidy support, will necessarily raise tariffs, leading
to a firestorm of protest against the inefficient operations of the Board, which will
force the change which the Board has been resisting all along. There is also an
important observation made by the Hon’ble Appellate Tribunal of Electricity (ATE)
in Appeal No. 131 of 2005
“On consideration of the submissions of the learned counsel for the Appellant
and Respondents, the provisions of the Electricity Act 2003, the National Electricity
and Tariff Policies, we are of the view that the cross-subsides can only be gradually
reduced and brought to the levels envisaged by the Act and the Tariff Policy.”
From the above reading of the Tribunal order, it is evident that the cross-
subsidies can only be reduced and the Commission should ensure reduction of cross-
subsidies. The Tribunal’s order further states that “there is an urgent need for
ensuring recovery of cost of service from consumers to make the power sector
sustainable”. Thus, the Commission ensure category-wise CoS (Cost of Supply)
determination and fix tariffs to recover costs based on this.
Tamil Nadu ERC Tariff Order dated 15-03-2003 in section 7.5 Cross-subsidy
Reduction says:
“The Commission is committed to gradually reduce the cross-subsidies in the
State over a five-year period, by increasing the tariffs applicable to the subsidised
categories, viz. agriculture, domestic, Lift Irrigation Societies, power looms and
Cottage industries, and reducing the tariffs applicable to the subsidising categories,
viz. HT and LT industrial consumers, Railway Traction, HT and LT Commercial
Chapter – IX Major findings, suggestions and conclusions
332
category, etc. However, the magnitude of the tariff revision required and the level of
cross-subsidy is such that the Commission has been compelled to increase the tariffs
for the subsidising categories also, in order to avoid tariff shock for the subsidised
categories. The Commission has endeavoured to minimise the tariff increase for the
subsidising categories while undertaking higher tariff increases for the subsidised
categories”
In this order, in line with the decision of the Commission as above, Tariff
increase for HT Industry was 6.69% and for total HT Category it was 7.14% only
where as for Domestic Category the increase was 22.13% and for total LT Category
it was 19.30%. This clearly shows that TNERC rationalized tariffs by reducing cross-
subsidies in line with Electricity Act 2003.
Also on the requirement of category-wise and voltage-wise cost of supply,
the Hon’ble ATE in its order in Appeal Nos. 4, 13, 14, 23, 25, 26, 35, 36, 54 & 55 of
2005, dated 26th May 2006, Punjab Industries Vs Punjab State Electricity
Regulatory Commission:
“110. Keeping in view the provisions of Section 61 (g), which requires tariff
to ultimately reflect the cost of supply of electricity and the National Tariff Policy,
which requires tariff to be within +- 20% of the average cost of supply, it seems to us
that the Commission must determine the cost of supply, as that is the goal set by the
Act. It should also determine the average cost of supply. Once the figures are known,
they must be juxtaposed, with the actual tariff fixed by the commission. This will
transparently show the extent of cross subsidy added to the tariff, which will be the
difference between the tariff per unit and the actual cost of supply.”
On the above grounds the Commission to clearly specify cross subsidy
reduction plan and targets, determine category or voltage-wise cost of service and
ensure cross subsidy reduction plan targets and consumer category wise cost
recovery. The average cost of supply is only an intermediate target as it cannot be
inconsistent with the Act. In case, where tariffs are already reflecting average cost of
332
Chapter – IX Major findings, suggestions and conclusions
333
supply targets, the KSERC need to focus on the principles of the Act i.e. moving
towards category-wise / voltage-wise cost of supply.
9.2.26 Subsidy
Section-65 of the Electricity Act states that the State Government can choose
to subsidise the consumption of a consumer or category of consumers. However, it
also lays the responsibility of funding the cost of that subsidy on the State
Government. The relevant extracts are reproduced below:
‘If the State Government requires the grant of any subsidy to any consumer
or class of consumers in the tariff determined by the State Commission under section
62, the State Government shall, notwithstanding any direction which may be given
under section 108, pay, within in advance in the manner as may be specified , by the
State Commission the amount to compensate the person affected by the grant of
subsidy in the manner the State Commission may direct, as a condition for
the license or any other person concerned to implement the subsidy provided for by
the State Government :
Provided that no such direction of the State Government shall be operative if
the payment is not made in accordance with the provisions contained in this section
and the tariff fixed by State Commission shall be applicable from the date of issue of
orders by the Commission in this regard”’
It is clear from a reading of Section 65 of the Act that, to implement the
decision of the Government to subsidise consumption, the Government has to release
the committed subsidy to the Board, in advance.
The Board has stated that it has been providing subsidised electricity, even in
the absence of such advance payment of amounts required to implement the subsidy
decision of the GoK, which has resulted in the need for “heavy borrowings to meet
the expenses”. This is in fact is in violation of Section 65 of the Act.
333
Chapter – IX Major findings, suggestions and conclusions
334
The extract from the National Tariff Policy 2006 is instructive on the
modality of implementation of subsidy decisions of the Government, if any. Relevant
sections of NTP-2006 are reproduced below :
“8.2.1 (3) Section 65 of the Act provides that no direction of the State
Government regarding grant of subsidy to consumers in the tariff determined by the
State Commission shall be operative if the payment on account of subsidy as decided
by the State Commission is not made to the utilities and the tariff fixed by the State
Commission shall be applicable from the date of issue of orders by the Commission
in this regard. The State Commissions should ensure compliance of this provision of
law to ensure financial viability of the utilities. To ensure implementation of the
provision of the law, the State Commission should determine the tariff initially,
without considering the subsidy commitment by the State Government and subsidised
tariff shall be arrived at thereafter considering the subsidy by the State Government
for the respective categories of consumers.”
This indicates that there is a requirement for two sets of tariffs. One would be
as determined by the Commission as per the guiding factors given in section 61 of
the Electricity Act - 2003 and would ensure full recovery of cost by the licensee in
the absence of any subsidy decision by the Government. The second set of tariffs
would be determined after factoring in the policy decision of the Government
regarding provision of subsidies to relevant categories of consumers and the quantum
of such subsidy.
These two set of tariffs would enable the Regulatory Commission to be in
compliance with the directive of the NTP 2006, requiring SERCs to ensure
compliance to separation of subsidy and cross subsidy, and implementation of
subsidy only if subsidy amounts due are paid in advance, as directed by the State
Regulatory Commission. Thus KSERC to determine the “Commission Determined
Tariff” which should meet approved aggregate revenue requirement without
government subsidy, and if and when government subsidy is received, in advance,
alternate Retail Supply Tariff may be implemented.
334
Chapter – IX Major findings, suggestions and conclusions
335
9.2.27 Regulatory Asset
In the Application for approval of the ARR and ERC for the FY10-11 KSEB
has requested KSERC to recognize the concept of Regulatory Asset and treat the
revenue gaps as Regulatory Asset, if the gaps are not otherwise covered by tariff
revision or subsidy from the Government.
The relevant extracts from KSERC (Terms and Conditions of Tariff for Retail
Sale of Electricity) Regulations, 2006 are:
“18. Regulatory Asset. –
(1) The Commission shall, at its discretion, provide for regulatory asset by
specifying the amortization and financing rules of the regulatory assets
submitted by the licensees and adopted by the Commission.
(2) Regulatory assets shall be allowed at the discretion of Commission and
allowed to take care of force-majeure or cost variations due to uncontrollable
factors.
(3) Financing cost of regulatory asset shall be allowed to the licensees.
(4) Recovery of regulatory assets should be time bound and within a period
normally not exceeding 3 years”
These principles are laid out in the NTP 2006 as well as reproduced below:
“8.2.2. The facility of a regulatory asset has been adopted by some Regulatory
Commissions in the past to limit tariff impact in a particular year. This should be
done only as exception, and subject to the following guidelines:
a) The circumstances should be clearly defined through regulations, and should only
include natural causes or force majeure conditions. Under business as usual
conditions, the opening balances of uncovered gap must be covered through
transition financing arrangement or capital restructuring;
b) Carrying cost of Regulatory Asset should be allowed to the utilities;
Chapter – IX Major findings, suggestions and conclusions
336
c) Recovery of Regulatory Asset should be time-bound and within a period not
exceeding three years at the most and preferably within control period;
d) The use of the facility of Regulatory Asset should not be repetitive.
e) In cases where regulatory asset is proposed to be adopted, it should be ensured
that the return on equity should not become unreasonably low in any year so that
the capability of the licensee to borrow is not adversely affected.
It is pertinent to point out that the concept of a regulatory asset has been
introduced to handle cost variations due to uncontrollable factors and thus prevent a
tariff shock to consumers. In the present situation in Kerala, where the Board is
showing revenue gaps year after year, leading to gaps running into thousands of
Crores of rupees, it is hard to foresee a situation in the near future where the Board
will show revenue surpluses to offset the impact of amortization of the regulatory
asset as per the regulations of the Commission. This is just postponing the day of
reckoning and storing up problems for later, at which point in time, it will be much
harder to tackle the issue.
However, KSERC did not allow creation of regulatory asset during the above
mentioned ARR & ERC approval for 2010-11
9.2.28 Revised filings for FY2009-10
The Board repeatedly filed the revised estimates for ARR and ERC of the
previous year as part of the filing for the current year, which is not maintainable.
This should be done as part of an annual true up exercise only, as has been provided
for in applicable regulations. This is the practice followed by utilities and
Commissions in other states. The State Commission, by allowing the Board to
continue with this practice of filing revised estimates for previous years, as part of
the filing of ARR & ERC for the ensuing year, is allowing unnecessary complexity
and confusion to creep into the whole electricity sector reforms process of the state.
It must be pointed out that this serves the sole intent of the Board - to delay the
process of reforms as long as possible.

Chapter – IX Major findings, suggestions and conclusions
337
The Board has requested, and the Commission has conducted true-up for
FY03-04, FY04-05 and FY05-06. Further, the true-up petition for FY06-07 is
presently before this Hon’ble Commission for its consideration. This is sufficient
mechanism for the Board to recover any gaps or return the surpluses that it has
earned in previous years. The delays in the true-ups in the State are on account of
unnecessary delays by the Board itself in filing true-up petitions. For example, the
Petition on Truing-up of Cost and Revenue for FY06-07 has been filed only in 2010.
There is sufficient reason to suspect that the delay is intentional to avoid returning
the surpluses that it has earned in previous years to consumers. The huge cash &
bank balances shown in the balance sheet of the Board is an indicator of this fact.
9.2.29 Continued non-compliance to Commission Orders
Category-wise CoS study - The Commission has been repeatedly directing
the Board to conduct appropriate studies to determine consumer category-wise CoS
(Cost of Supply). However, the Board has not undertaken any such study.
Capital expenditure - The regulations applicable state that the Board has to
file detailed capital expenditure plans for the approval of the Commission. However,
the Board has repeatedly failed to file Capex plans detailing timelines, expenditure,
cost benefit analysis etc. The directives of the Commission’s Order for FY09-10
specified that the Board should have prepared an implementation plan including
procurement plan for all the important capital projects under generation, transmission
and distribution with information to the Commission. No plan or any detailed
description of the capital projects was submitted till date. The chapter on Capital
Investments of the Application for the approval of the ARR and ERC for the FY10-
11 doesn’t contain description of the major generation /transmission/ distribution
projects.
As per the KSERC Order for FY09-10 separation of Transmission and
Distribution Losses should be performed by the Board - In the KSERC Order for
FY09-10 the Board was directed to initiate a study for assessing loss levels in
33kV/11kV system and LT system separately. The study was initiated, however, the
337

Chapter – IX Major findings, suggestions and conclusions
338
Board did not come up with preliminary results within the timeframe specified in the
Order and put forward its own timelines, claiming that its interface meters are
inaccurate. The Commission had directed the Board to provide separate estimates of
transmission and distribution losses at different voltage levels with the ARR and
ERC filing for subsequent years. In the filing for FY10-11 there are no estimates
provided separately for transmission and distribution losses, but stated that the
exercise failed due to various technical reasons. The KSERC (Tariff) Regulations
2003, notified in January 2004, itself lays out the need for provide losses separately.
Now the Board claims that it is unable to provide voltage-wise losses.
Board has not complied with repeated directives of the Hon’ble Commission
on crucial points and that the Hon’ble Commission has condoned these non-
compliances of the Board (Refer Annexure-V).
9.3 Suggestions
Even though the intervention of Regulatory Commission is strongly felt in
Kerala’s power sector and KSEB started showing visible improvements in its
financial and operating performance, certain key objectives of the power sector
reforms Act viz. Electricity Act-2003, National Electricity Policy-2005 and National
Tariff Policy-2006 are not yet complied with by the KSEB. The tendency of the
licensee to evade from the directives of SERC is evident in many cases.
Following are the main suggestions to ensure reform, deregulation and
restructuring of power sector as envisaged in the preamble of Electricity Act 2003,
which is regarded as the driving force of regulatory regime.
1. KSEB has to do unbundling of generation, transmission and distribution and
separate accounts for each function as per the provisions of the Electricity
Act-2003.
2. KSEB to file proposals for Multi-Year Tariff (MYT) without further delay.
338
Chapter – IX Major findings, suggestions and conclusions
339
3. Rationalization of power tariff on the basis of “Actual Cost of Supply” or
“Cost to Serve Model” for different voltage category of consumers to reflect
actual cost and to eliminate cross subsidy in a phased manner
4. KSEB to submit time bound action plans for eliminating cross subsidy in a
phased manner and comply with the orders of KSERC in reducing /
eliminating cross subsidy.
5. Separation of Transmission & Distribution losses to be done by KSEB
6. Separation of Technical and Commercial losses to be done by KSEB
7. Violation of time limits in submitting application for ARR & ERC and
Truing up of ARR& ERC to be avoided.
8. Compliance to the directives issued by KSERC from time to time.
9. KSEB to study the socio-economic impact of closure of power intensive
industries (like the Smelter Unit of Indian Aluminium Company Limited,
which was KSEB’s largest consumer of power till its) consumers in the state
during pre-regulatory regime to determine direct and indirect loss of revenue
to the KSEB in particular and the State in general and initiate appropriate
steps to bring such industrial consumers back to KSEB’s fold.
9.4 Conclusions
Electricity is an essential requirement for all facets of our life. It has been
recognized as a basic human need. It is a critical infrastructure on which the socio-
economic development of the country depends. Industrial growth in Kerala State,
especially in the manufacturing sector is quite dismal over the last 20 years. Growth
of manufacturing industries is one of the major contributing factors for economic
growth, generation of direct and indirect employment opportunities. The
socioeconomic development of various regions within the State is directly linked to
Chapter – IX Major findings, suggestions and conclusions
340
the Industrial growth and development of those regions. It will accelerate the overall
economic development of the State including power sector.
Through various ARR & ERC Orders the KSERC has reminded KSEB about
its inherent obligation and duty to optimally plan, develop and maintain the
electricity system in the most reasonable and efficient manner. KSEB has been
consistently projecting expenses more than what is optimally required for efficient
services. On several occasions, KSERC in principle disagreed with KSEB’s practice
of projecting high level of expenditure, without any proposals or attempts to plan and
control the expenses. Commission opined on several occasions that ‘Cost plus
regulatory regime’ is not about passing on all costs incurred by the utilities, but about
prudently optimal and efficiently managed costs being loaded on to the consumers.
The KSERC was forced to exercise its regulatory scrutiny to optimize, control and
prune certain expenses during the reviews of KSEB’s petitions on ARR&ERC in the
past. In reality, KSEB has failed to control the expenses at the approved level,
notably in areas where restraints have to be observed such as many items of revenue
expenditure, and reduced the expenditure much below the desired level in areas
where it was very much needed such as capital expenditure. The Kerala Regulatory
Commission is doing an excellent prudence check of KSEB’s tariff petitions with the
involvement of all stakeholders by conducting public hearings and thus making the
process of approval of ARR&ERC more meaningful.
There is a visible change in the performance of power sector consequent to
the establishment of KSERC. The tariff rates are almost stable and there was no hike
in the tariff of Industrial Consumers for the last nine years (ie after the setting up of
KSERC). Arresting the steep increase in the electricity tariff which was in vogue for
a decade and maintaining it at the same level for almost another decade is the single
largest achievement of Kerala State Electricity Regulatory Commission. This is a
silver line in the history of Kerala Power Sector. This is not properly realized and
appreciated by the public and media.
Chapter – IX Major findings, suggestions and conclusions
341
KSEB has shown a lot of reluctance in complying with the directives of
KSERC during the initial years of regulatory regime as it was a monopoly public
sector utility under the control of Government and its decisions were mostly based on
political compulsions rather than operating efficiencies and cost. Now KSEB started
realizing the fact that KSERC is a reality and there is no shortcut to escape from the
reforms taking place in the country in which the role of power sector is vital.
However, more awareness needs to be created among the stakeholders, especially all
sections of electricity consumers to enhance the level of participation and
involvement in the regulatory process. More awareness needs to be created among
the public on the conservation, economic use and actual voltage category-wise cost
of electricity.
Besides maintaining a stable industrial electricity tariff, the Commission
could achieve improvements in the areas of T & D lose reduction quality of power
generation and purchase in the order of merit and consumer grievance Redressal as
mentioned in the findings. However the areas where KSERC could not achieve much
progress are, multi-year tariff, reduction in employment cost, open access regulations
to improve power trading in the State, cross subsidy reduction etc. But, we can
conclude that the overall functioning of KSERC has been a grand success.
A vibrant power sector will ensure industrial growth in the state which in turn
will result in the growth and development of the state in general and power sector in
particular on account of the fact that even today Industrial Electricity consumers,
who consume about 28% of the total energy sales to consumers by the Kerala State
Electricity Board contribute about 37% to the total revenue from tariffs. Similarly,
services sector has made significant contribution to the growth of our State.
Availability and affordability of quality supply of electricity is very crucial to
sustained growth of this segment also. As observed by the Regulatory Commission in
the open access order issued to INDAL “it is impossible to sustain power
development without industrial development”.
Bibliography
i
BIBLIOGRAPHY
1. A. Kish, IHS Global Insight, Inc., ‘Quarterly Review and Outlook First
Quarter 2010: United States, Canada, and Eurozone’ (Lexington, MA, March
2010), p. 16.
2. Agarwal O P and P Paul. 2001, ‘Framework for Independent Regulation in
India: an overview’ In Regulation in Infrastructure Services: Progress and the
Way Forward, edited by S K Sarkar and Kaushik Deb New Delhi: Tata Energy
Research Institute
3. Alexander, Ian (2003), ‘UK Model on Developing and Transition Economies:
Common Issues and Misconceptions’, South Asia Energy and Infrastructure
Unit, World Bank, Washington DC, http ://info.worldbank.org/
etools/docs/library/86469/ ses2.1_ ukmodelondeveloping.pdf
4. Averch.H and Johnson L ‘The Behaviour of the Firm Under Regulatory
Constraint,’ American Economic Review, December 1962
5. B. Neff, IHS Global Insight, ‘Quarterly Review and Outlook: Asia-Pacific’
(Lexington, MA, March 2010), pp. 1 and 109.
6. Baijal P. 199, ‘Restructuring Power Sector in India: a base paper’ Economic
and Political Weekly (25 September 1999)
7. Bakovic T, Tenenbaum B, and Woolf F. 2003, ‘Regulation by Contract: a new
way to privatize electricity distribution’? Washington, DC: The World Bank
Group's Mining Sector Board
8. Basu D D. 1998 , ‘Administrative law’ (5th edn)Calcutta: Kamal Law House
9. ‘Belgium Postpones Nuclear Phase-Out’, - World Nuclear News (October 13,
2009), web site www. nuclear-news.org; and ‘Germany’s New Government
May Extend Reactor Lifetime’ - Spiegel Online (September 29, 2009), web site
www.spiegel.de.
10. ‘China Updates Spending Details of Stimulus Fund,’ Xinhua News Agency
(May 21, 2009), website http://news.xinhuanet.com/english/2009-05/21/
content_11415559.htm.
Bibliography
ii
11. D. Ryan, IHS Global Insight, ‘Quarterly Review and Outlook: Asia-Pacific’
(Lexington, MA, March 2010), p. 79.
12. D. Ryan, IHS Global Insight, ‘Quarterly Review and Outlook: Asia-Pacific’
(Lexington, MA, March 2010), p. 77.
13. D. Ryan, IHS Global Insight, ‘Quarterly Review and Outlook: Asia-Pacific’
(Lexington, MA, March 2010), p. 151.
14. D. Ryan, IHS Global Insight, ‘Quarterly Review and Outlook: Asia-Pacific’
(Lexington, MA, March 2010), p. 153.
15. Department of Finance Canada, ‘Budget 2009: Canada’s Economic Action
Plan’ (Press Announcement: Ottawa, Canada, January 27, 2009), web site
www.fin.gc.ca/n08/09-11-eng.asp.
16. Dokeniya, Anupama (1999) ‘Re-forming the state: telecom liberalization in
India, Telecommunications Policy’, 23, 105-128.
17. Edelman M. 1964, ‘The Symbolic Uses of Politics’ University of Illinois Press
18. Fuchs R F. 1969 ‘The new administrative state: Judicial sanction for agency
self determination in the regulation of industry’ Columbia Law Review, p. 216
19. Galligan D J . 1996 ‘A reader on Administrative Law’, p. 152 Oxford: Oxford
University Press
20. Galligan DJ. 1996, ‘A reader on administrative law’, p. 108 Oxford: Oxford
University Press
21. Garner J F, et al. 1985 , ‘Administrative Law’ (6th edn) London: Butterworths
22. Gilbert R L and Kahn E P (eds). 1996 ‘International Comparisons of
Electricity Regulation’, p. 182 Cambridge: Cambridge University Press
23. Goodnow F J. 1990, ‘Politics and Administration’ New York: Macmillan
24. Grey P. 1996, ‘Comparative Electricity Regulation’ Washington, DC: World
Bank
25. H. Archer, IHS Global Insight, ‘Eurozone—Greece: Concerns Persist Over
Eurozone Despite EU’s Pledge to Greece’ (February 16, 2010), web site
www.ihsglobalinsight.com (subscription site).

Bibliography
iii
26. Harris, Clive, John Hodges, Michael Schur, and Padmesh Shukla (2003) ‘A
Review of Cancelled Projects’, Note Number, 252, World Bank, Washington
DC.
27. Hart H LA. 1961, The Concept of Law, p. 202 Oxford: Oxford University Press
28. IHS Global Insight, World Overview: First Quarter 2010 (Lexington, MA,
March 2010), p. 74. ‘Pulling Apart: The World’s Big Economies Were All Hit
by the Recession. Now the Field Is Spreading,’ The Economist (January 23,
2010), pp. 69-70.
29. IHS Global Insight, ‘World Overview: First Quarter 2010’ (Lexington, MA,
March 2010), pp. 71-72 and U.S. Department of State, “Background Note:
Philippines,” (October 2009), web site www.state.gov/r/pa/ei/bgn/2794.htm.
30. IHS Global Insight, ‘World Overview: First Quarter 2010’ (Lexington, MA,
March 2010), p.119.
31. IHS Global Insight, ‘World Overview: First Quarter 2010’ (Lexington, MA,
March 2010), pp. 102-112
32. International Energy Agency, World Energy Outlook 2009 (Paris, France,
November 2009), pp. 128 and 134. IHS Global Insight, Inc., “A New Year, a
New Direction for the Global Economy,” Global Executive Summary
(Lexington, MA, January 2010), p. 1.
33. International Monetary Fund, ‘IMF Revises Up Global Forecast to Near 4% for
2010,’ IMF Survey Magazine: In the News (Washington, DC, January 26,
2010), web site www.imf. org/external/ pubs/ft/survey/so/2010 /NEW012610B.
htm.
34. International Monetary Fund, ‘World Economic Outlook 2009’ (Washington,
DC, October 2009), pp. 84-85, web site www.imf.org/external/pubs/ft/
weo/2009/02/index.htm. ‘New Dangers for the World Economy’ The Economist
(February 13, 2010), p. 13.
35. International Monetary Fund, World Economic Outlook October 2009
(Washington, DC, October 2009), p. 71, web site www.imf.org/external/
pubs/ft/ weo/2009/02/index.htm; and D. Ryan, IHS Global Insight, Quarterly
Review and Outlook: Asia-Pacific (Lexington, MA, March 2010), p. 77.

Bibliography
iv
36. International Monetary Fund, ‘World Economic Outlook October 2009’
(Washington, DC, October 2009), pp. 71-73, web site
www.imf.org/external/pubs/ ft/weo/2009/02/index.htm.
37. International Monetary Fund, ‘World Economic Outlook October 2009’ 2009
(October 2009), p. 72, web site www.imf.org/external/pubs/ft/weo/2009/02/
index.htm (Washington, DC, October 2009).
38. International Monetary Fund, ‘World Economic Outlook Update’
(Washington, DC, January 26, 2010), p. 1; and IHS Global Insight, ‘Global
Executive Summary: A New Year, a New Direction for the Global Econom’y
(Lexington, MA, January 2010), p. 1.
39. J. Carney, “The Greek Debt Crisis Was Resolved by a Confidence Game,”
Business Insider: Clusterstock (March 8, 2010), web site www.businessinsider.
com.
40. J. Narasimhan, IHS Global Insight, Quarterly Review and Outlook: Asia-
Pacific: First Quarter 2010 (Lexington, MA, March 9, 2010), p. 48.
41. Jain M P, et al. 1997, Principles of Administrative Law (4th edn) Nagpur:
Wadhwa & Co.
42. Jain, Rekha (2006) Interconnection regulation in India: Lessons for developing
countries, Telecommunications Policy, 30, 183-200.
43. Joskow P. 1997 , Restructuring, Competition and Regulatory Reform in the
US Electricity Sector Journal of Economic Perspectives 11(3): 119-138
44. K. Olsen, “Bank of Korea Keeps Interest Rate at Record Low,” Associated
Press News Release (March 11, 2010).
45. Kannan, K. P., and Pillai, N. Vijayamohanan (2001a) ‘Plight of the Power
Sector in India - I: Physical Performance of SEBs- II: Financial Performance
of SEBs’, Economic and Political Weekly, January 13 and 20: 130 – 139, 234 –
246.
46. Kannan, K. P., and Pillai, N. Vijayamohanan (2001b) ‘The Political Economy
of Public Utilities: A Study of the Indian Power Sector’ Working paper No.
316, June, Centre for Development Studies, Thiruvananthapuram.
Bibliography
v
47. Know Your Power (2006) – ‘A Citizens’ Primer on the Electricity Sector ,
Prayas (Energy Group)’ , Pune
48. Rao, S.L (2004), ‘Governing Power – A New institution og governance: the
experience with independent regulation of electricity’. The Energy and
Resource Institute
49. Kolamkar D S. 2002 , ‘Regulation and Policy Issues for Commodity
Derivatives in India’. - Mumbai: Indira Gandhi Institute of Development
Research
50. Levy, B and P.T. Spiller (1994) The Institutional Foundations of Regulatory
Commitment: A Comparative Analysis of Telecommunication Regulation,
Journal of Law Economics and Organisation, V 10, No. 2, 201-246.
51. Lewis N. 1996 , ‘Choice and the legal order: Rising above politics’ London:
Butterworths
52. Lewis N. 1996, Choice and the Legal Order: rising above politics London:
Butterwoths
53. Lipsky M. 1980, Street Level Bureaucracy New York: Russel Sage
54. Longley D, et al. 1996 , Administrative justice: Central issues in UK and
European administrative law London: Cavendish Publishing Ltd
55. Longley D, et al.1996, Administrative Justice: Central issues in UK and
European
administrative law London: Cavendish Publishing Ltd
56. Mehta, A. (2000) Power Play: A Study of the Enron Project, Orient Longman,
New Delhi.
57. Meier K. 1979, Politics and Bureaucracy: policy making in the fourth branch
of government North Scituate: Duxbury Press
58. Mitchell J M, et al. 1972, Political Analysis and Public Policy: an Introduction
to Political Science New Delhi: Thomson Press India Ltd
59. Montjoy R S and Watson D J. 1995 , A Case for Reinterpreted Dchotomy of
Politics and Admnistration as a Professional Standard in Council-
Manager Government Public Administration Review 55 (3): 231-39
Bibliography
vi
60. Morris, Sebastian (1996). “Political Economy of Electric Power in India”
Economic and Political Weekly, May 18, pp. 1201-1210.
61. Morris, Sebastian, (2000). “Regulatory Strategy and Restructuring Model for
Gujarat Power Sector”, Economic and Political Weekly, June 3: 1915-1928.
62. Mukherji, Rahul (2004) ‘Managing Competition: Politics and the Building of
Independent Regulatory Institutions’, India Review, vol 3 No.4 pp.278-305.
63. Nachmias D and Rosenbloom D H. 1978 , ‘Bureaucratic Culture: citizens and
administrators in Israel’ New York: St. Martin's Press
64. Nelson B J. 1996 , ‘Public Policy and Administration: an overview
in a New Handbook of Political Science,’ edited by Robert E Goodin and Hans-
Dieter Klingemann Oxford: Oxford University Press
65. Newbery, David M, and M G Pollitt (1997) ‘The Restructuring and
Privatisation of the UK Electricity Supply-Was it Worth it?’, Public Policy for
the Private Sector, No. 124, World Bank, Washington DC.
66. Ocana C. 2003, ‘Trends in the management of regulation: a comparison of
energy regulators in member countries of the Organisation for Economic Co-
operation and Development’ International Journal of Regulation and
Governance 3 (1): 13-32
67. P. Newport, IHS Global Insight, Inc., Quarterly Review and Outlook First
Quarter 2010: United States, Canada, and Eurozone (Lexington, MA, March
2010), p. 11.
68. P. Vieira, “Budget 2010: A Second Year of Stimulus Spending,” The National
Post (March 4, 2010), web site www.nationalpost.com).
69. Parker, D, Kirkpatrick, C. (2005) Privatisation in developing countries: a
review of the evidence and the policy lessons, Journal of Development Studies,
41(4), 513-41
70. PEG (Prayas Energy Group). 2003, Good Beginning but Challenges Galore
(Electricity Regulatory Commissions in India: Resource, Transparency and
public Participation) Survey undertaken in February 2003
Bibliography
vii
71. Pereira, Carlos, Bernardo Mueller and Marcus Melo (2006) Regulatory
Governance in Infrastructure Industries; An Assessment and Measurement of
Brazilian Regulators, The World Bank, Washington DC.
72. Pereira, Carlos, Bernardo Mueller and Marcus Melo (2006) Regulatory
Governance in Infrastructure Industries; An Assessment and Measurement of
Brazilian Regulators, The World Bank, Washington DC.
73. Phillips Gr) C F. 1993 The Regulation 0/ Public Utilities: theory and practice
Arlington: Public Utilities Reports, Inc.
74. Pillai, N, Vijayamohanan (1995), 'Liberalisation of Poverty', Paper presented in
a Seminar on "Economic Issues Relating to Social Welfare in Post-
Liberalisation India' on February 10, 1995 in the Dept. of Econometrics,
Madras University, Chennai.
75. Pillai, N. Vijayamohanan (1999) ‘Reliability Analysis of Power Generation
System: A Case Study’, Productivity, Vol. 40(2), July- September: 310 – 318.
76. Pillai, N. Vijayamohanan (2001) Electricity Demand Analysis and Forecasting
– The Tradition is Questioned! Working Paper No. 312, February, Centre For
Development Studies, Thiruvananthapuram.
77. Pillai, N. Vijayamohanan and Kannan, K. P. (2001) Time and Cost Overruns of
the Power Projects in Kerala, Working Paper No. 320, October, Centre For
Development Studies, Thiruvananthapuram.
78. Planning Commission, Government of India, New Delhi – draft report of the
Expert Committee on Integrated Energy Policy 2005
79. Prayas Group (2003) A Good Beginning But Challenges Galore, Prayas Group,
Pune, India.
80. Quinglian, He (2000) China’s Descent into a Quagmire, reprinted in The
Chinese Economy, 33(3), May-June.
81. R. Howard, I. Nam, and J. Shin, “New Zealand, Korea Hold Rates,” The Wall
Street Journal Online Edition (March 10, 2010), web site www.wsj.com
(subscription site).
Bibliography
viii
82. Rao S L. 2000, Electricity reform and regulation Economic and Political
Weekly XXXV(26): 2231-34
83. Rao S L. 2001 , Regulating Power The Telegraph, 24 September 200I
84. Rao S L. 2001, Perfect hindsight PowerLine (May 2001)
85. Rao S L. 2001, The last resort PowerLine (December 2001)
86. Rao S L. 2003, Competition in electricity Maharashtra Economic Development
Council Journal (July 2003)
87. Rao S L. 2003, Competition Policy in Electricity and Other Fuels Bombay
Management Association Review (March-April 2003)
88. Rao, M. Govinda, Shand, R. T., and Kalirajan, K. P. (1998-99) ‘State
Electricity Boards: A Performance Evaluation’, The Indian Economic Journal,
Vol. 46(2), October-December.
89. Ripley-R. 1982, Bureaucracy and Policy Implementation Homewood: Dorsey
Press
90. Rose-Ackerman, S. (1999) Corruption and Government: Causes,
Consequences and Reform, Cambridge University Press, Cambridge.
91. Sathe S P. 1999 , Administrative Law (6th edn) New Delhi: Butterworths India
92. Sathe S P. 1999, Administrative Law (6th edn) New Delhi: Butterworths India
93. Schultze C L. 1977 , The Public Use 0/ Private Interest Washington, DC:
Brookings Institution
94. Schwartz B and Wade. 1972, Legal Control of Government: administrative
law in Britain and the United States Oxford: Clarendon Press
95. Schwartz B, et al. 1972 Legal control of government: Administrative law in
Britain and the United States Oxford: Clarendon Press
96. Schwartz B. 1994 , Administrative Law London: Little, Brown, and Co.
97. Schwartz B. 1994, Administrative Law, p. 12 London: Little, Brown, & Co.
98. Sellers J M. 1984 , Regulatory values and the exceptions process Yale Law
Journal 93: 943-45
99. Shapiro D L. 1965, The choice of rule making or adjudication in the
developments of agency policy Harvard Law Review, pp. 947-52
Bibliography
ix
100. Singh N K and Jha V. 200 I ,’ Liberalization and the growth of regulatory
agencies - Indian Review
101. Sinha, Nikhil (1996) The political economy of India’s telecommunications
reforms, Telecommunications Policy, 20, pp. 23-38.
102. Spiller P T. 1996, A positive political theory of regulatory instruments:
contracts, admnistrative law or regulatory specificity? Southern California
Law Review Ganuary 1996)
103. Stern, J, S Holder (1999) Regulatory governance: criteria for assessing the
performance of regulatory systems. An application to infrastructure industries
in the developing countries of Asia. Utilities Policy, 33-50.
104. Stewart R B. 1975 The reformation of American administrative law Harvard
Law Review 88: 1671-75
105. Sundar Sand Sarkar S K. 1999 , ‘Framework for regulation: the Indian
experience’
106. ‘In Transition to a Liberalized Environment: experiences and issues in
regulation, edited by L Srivastava and S K Sarkar, pp. 39-53
New Delhi: Tata Energy Research Institute
107. Sunstein C R. 1990 , Law and administration after Chevron Columbia Law
Review 90: 2078-79
108. Tang B. 2000 , Government: Regulatory Perspective Available online at
http://www.apec-finsecreg.org/MRCProgram/SessionII-TangPDF.
109. Turnbull P. 1999 , Regulation or Re-regulation of Transport? [Discussion
Paper]
110. Geneva: International Labour Organization [Available online at www.oftel.gov.
uk/publications/about_oftel/ whit0700.htm.
111. U.S. Department of Energy, Loan Guarantee Program, “Key Documents: Title
XVII. Incentives for Innovative Technologies” (August 8, 2005), web site
www.lgprogram.energy.gov.
112. United Nations, ‘World Economic Situation and Prospects 2010’ (New York,
NY, 2010), pp. 125-126,web site www.un.org/esa/policy/wess/wesp2010
files/wesp2010.pdf.

Bibliography
x
113. Vickers, J., G Yarrow (1988) ‘Privatization: An Economic Analysis’, MIT
Press Ltd, London, UK.
114. ‘Weatherly R, et al. 1977 ‘Street-Level Bureaucrats and Institutional
Innovation in Implementing Special Educational Reforms’ Harvard Educational
Review 17(2): 171-97
115. Electricity Regulatory Commissions Act - 1998
116. Electricity Act – 2003
117. National Electricity Policy – 2005
118. National Tariff Policy – 2006
119. Consolidated Works Report of Indian Aluminium Company Limited for the
periods 2002-03 & 2003-04
120. Cost report of Indian Aluminium Company Limited for the period 2002-03 and
2003-04
Websites:
http://powermin.gov.in : Website of Ministry of Power, Government of
India, New Delhi
http://www.erckerala.org : Website of Kerala State Electricity Regulatory
Commission, Trivandrum
http://www.cercind.gov.in : Website of Central Electricity Regulatory
Commission , New Delhi
http://aptel.gov.in : Website of Apellate Tribunal of Electricity,
New Delhi
http://www.dae.gov.in : Website of Department of Automic Energy,
Government of India, Delhi
http://cea.nic.in : Website of Central Electricity Authority,
Government of India, Delhi
http://www.beeindia.in : Website of Bureau of Energy Efficiciency,
Ministry of Power, Government of India
http://www.kerc.org : Website of Karnataka Electricty Regulatory
Commission
Bibliography
xi
http://www.wberc.net : Website of West Bengal Electricty Regulatory
Commission
http://www.uperc.org : Website of Uttar Pradesh Electricty Regulatory
Commission
http://tnerc.tn.nic.in : Website of Tamil Nadu Electricty Regulatory
Commission
http://www.aperc.gov.in : Website of Andhra Pradesh Electricty
Regulatory commission
http://www.derc.gov.in : Website of Delhi Electricty Regulatory
Commission
http://www.gercin.org : Website of Gujarat Electricty Regulatory
Commission
http://www.pserc.nic.in : Website of Punjab State Electricty Regulatory
Commission
http://www.orierc.org : Website of Orissa Electricty Regulatory
Commission
http://www.mercindia.org.in : Website of Maharashtra Electricty Regulatory
Commission
http://herc.gov.in : Website of Haryana Electricty Regulatory
Commission
http://jercuts.gov.in : Website of Joint Electricity Regulatory
Commission for the State of Goa and Union
Territories
http://india.gov.in : Website of Government of India
http://kerala.gov.in : Website of Government of Kerala
http://www.kseb.in : Website of Kerala State Electricity Board
http://www.kseb.in : Website of KSEB Officers Association
http://epw.in : Website of Economic & Political Weekly
http://planningcommission.nic.in : Website of Planning Commission, Govt of
India, Delhi
http://www.forumofregulators.gov.in :Website of Forum of Regulators
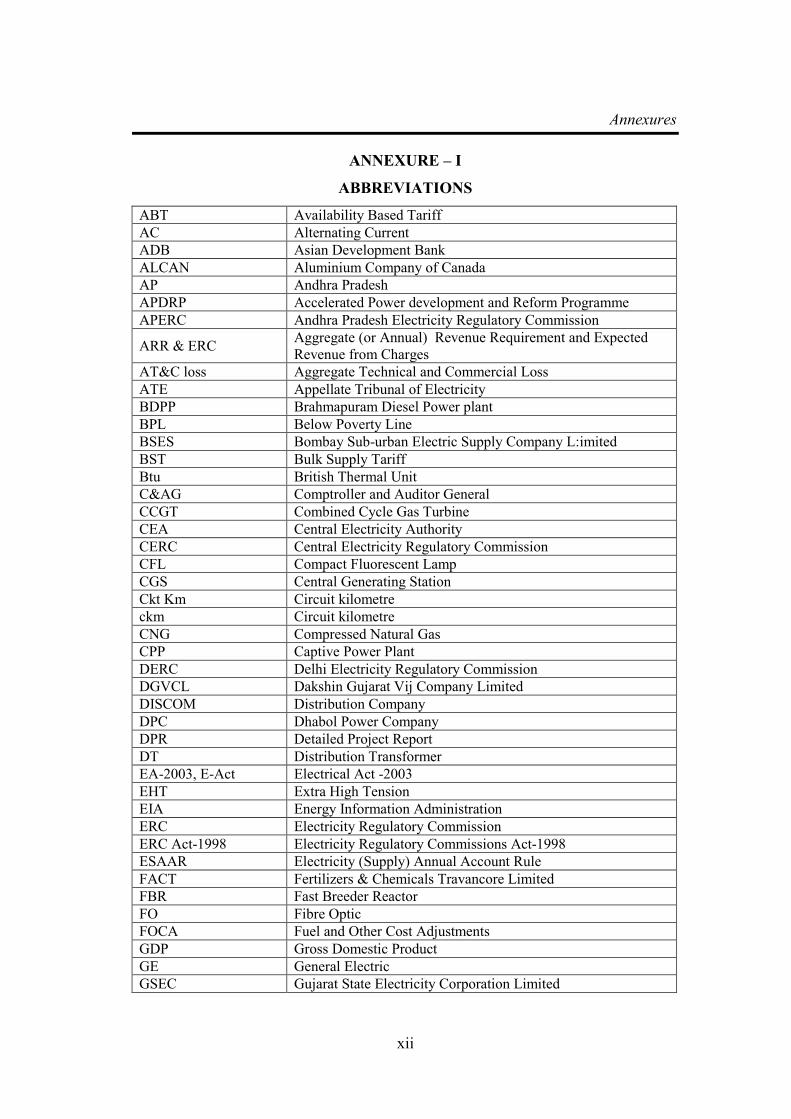
Annexures
xii
ANNEXURE – I
ABBREVIATIONS
ABT Availability Based Tariff
AC Alternating Current
ADB Asian Development Bank
ALCAN Aluminium Company of Canada
AP Andhra Pradesh
APDRP Accelerated Power development and Reform Programme
APERC Andhra Pradesh Electricity Regulatory Commission
ARR & ERC Aggregate (or Annual) Revenue Requirement and Expected
Revenue from Charges
AT&C loss Aggregate Technical and Commercial Loss
ATE Appellate Tribunal of Electricity
BDPP Brahmapuram Diesel Power plant
BPL Below Poverty Line
BSES Bombay Sub-urban Electric Supply Company L:imited
BST Bulk Supply Tariff
Btu British Thermal Unit
C&AG Comptroller and Auditor General
CCGT Combined Cycle Gas Turbine
CEA Central Electricity Authority
CERC Central Electricity Regulatory Commission
CFL Compact Fluorescent Lamp
CGS Central Generating Station
Ckt Km Circuit kilometre
ckm Circuit kilometre
CNG Compressed Natural Gas
CPP Captive Power Plant
DERC Delhi Electricity Regulatory Commission
DGVCL Dakshin Gujarat Vij Company Limited
DISCOM Distribution Company
DPC Dhabol Power Company
DPR Detailed Project Report
DT Distribution Transformer
EA-2003, E-Act Electrical Act -2003
EHT Extra High Tension
EIA Energy Information Administration
ERC Electricity Regulatory Commission
ERC Act-1998 Electricity Regulatory Commissions Act-1998
ESAAR Electricity (Supply) Annual Account Rule
FACT Fertilizers & Chemicals Travancore Limited
FBR Fast Breeder Reactor
FO Fibre Optic
FOCA Fuel and Other Cost Adjustments
GDP Gross Domestic Product
GE General Electric
GSEC Gujarat State Electricity Corporation Limited
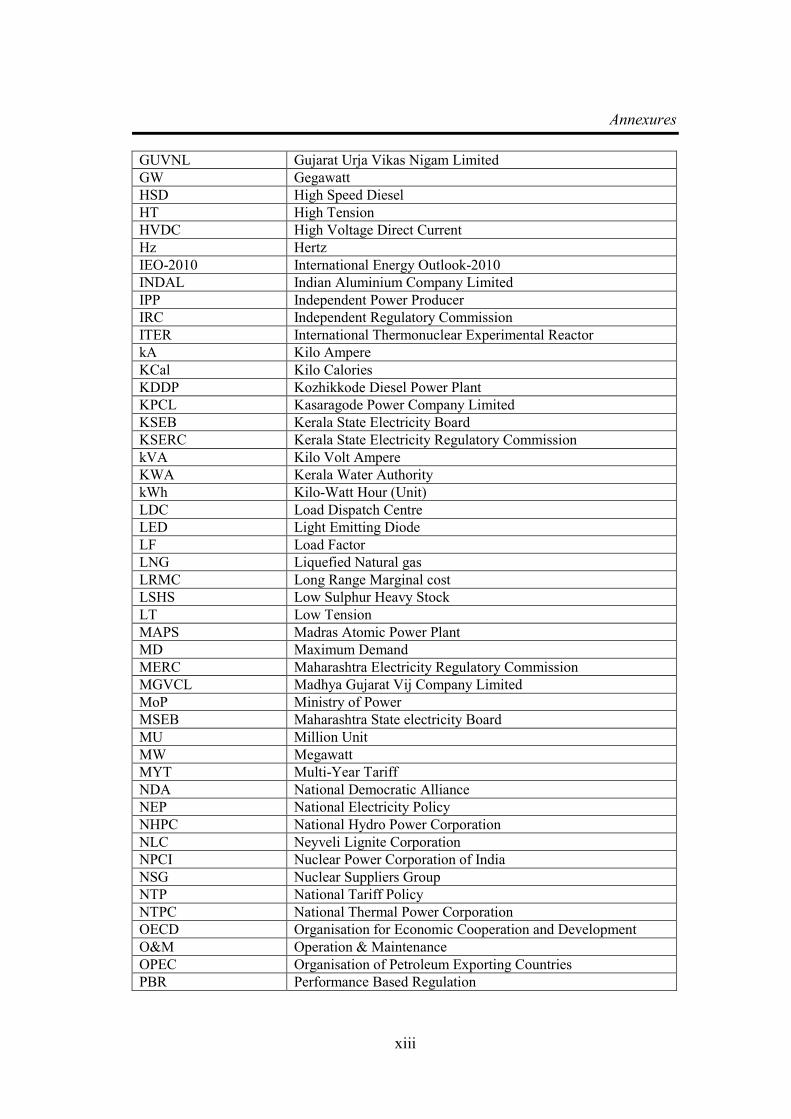
Annexures
xiii
GUVNL Gujarat Urja Vikas Nigam Limited
GW Gegawatt
HSD High Speed Diesel
HT High Tension
HVDC High Voltage Direct Current
Hz Hertz
IEO-2010 International Energy Outlook-2010
INDAL Indian Aluminium Company Limited
IPP Independent Power Producer
IRC Independent Regulatory Commission
ITER International Thermonuclear Experimental Reactor
kA Kilo Ampere
KCal Kilo Calories
KDDP Kozhikkode Diesel Power Plant
KPCL Kasaragode Power Company Limited
KSEB Kerala State Electricity Board
KSERC Kerala State Electricity Regulatory Commission
kVA Kilo Volt Ampere
KWA Kerala Water Authority
kWh Kilo-Watt Hour (Unit)
LDC Load Dispatch Centre
LED Light Emitting Diode
LF Load Factor
LNG Liquefied Natural gas
LRMC Long Range Marginal cost
LSHS Low Sulphur Heavy Stock
LT Low Tension
MAPS Madras Atomic Power Plant
MD Maximum Demand
MERC Maharashtra Electricity Regulatory Commission
MGVCL Madhya Gujarat Vij Company Limited
MoP Ministry of Power
MSEB Maharashtra State electricity Board
MU Million Unit
MW Megawatt
MYT Multi-Year Tariff
NDA National Democratic Alliance
NEP National Electricity Policy
NHPC National Hydro Power Corporation
NLC Neyveli Lignite Corporation
NPCI Nuclear Power Corporation of India
NSG Nuclear Suppliers Group
NTP National Tariff Policy
NTPC National Thermal Power Corporation
OECD Organisation for Economic Cooperation and Development
O&M Operation & Maintenance
OPEC Organisation of Petroleum Exporting Countries
PBR Performance Based Regulation

Annexures
xiv
PF Power Factor /Provident Fund
PGCIL Power Grid Corporation of India Limited
PGVCL Paschim Gujarat Vij Company Limited
PHWR Pressurised Heavy Water Reactor
PLCC Power Line Carrier Communication Network
PLF Plant Load Factor
PPA Power Purchase Agreement
PSU Public Sector Unit
PTC Power Trading Corporation
RC Regulatory Commission
RE Renewable Energy
RGCCPP Rajiv Gandhi Combined Cycle Power Plant
RGGVY Rajiv Gandhi Grameen Vidyutikaran Yojana
RLDC Regional Load Dispatch Centre
RMD Recorded maximum Demand
RoE Return on Equity
RST Retail Supply tariff
RSTPS (RSPTS) Ramagundam Super Thermal Power Station
RTU Remote Terminal Unit
SCADA Computerised Supervisory Control and Data Acquisition
System
SEB / EB State Electricity Board / Electricity Board
SHP Small Hydroelectric Project
SLDC State Load Dispatch Centre
SRLDC Southern Regional Load Despatch centre
T&D Loss Transmission and Distribution Loss
TCC Travancore Cochin Chemicals Limited
TN Tamil Nadu
TNEB Tamil Nadu electricity Board
ToD Time of Day
TRAC Tariff Regulatory Assistance Cell
TRAI Telecom Regulatory Authority of India
TRANSCOM Transmission Company
UG Underground
UGVCL Uttar Gujarat Vij Company Limited
UI Unscheduled Interchange
ULDC Unified Load Dispatch Centre
UP Uttar Pradesh
UPA United Progressive Alliance
WEG Wind Energy Generators
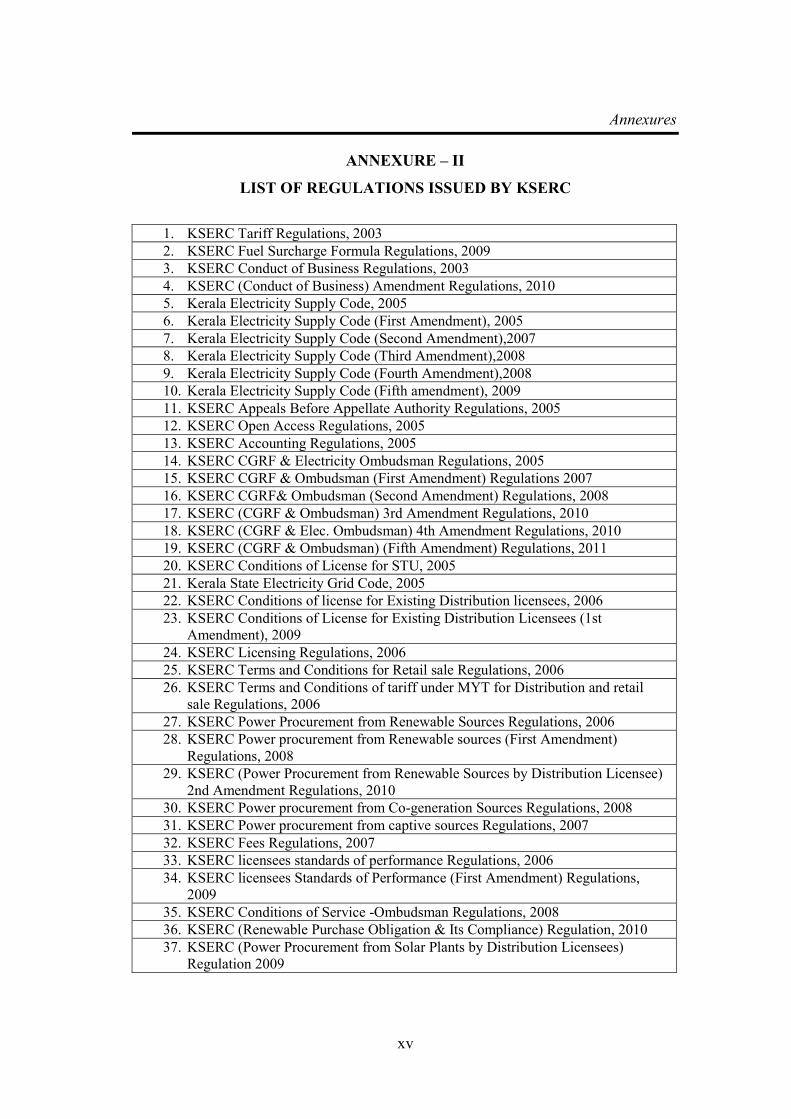
Annexures
xv
ANNEXURE – II
LIST OF REGULATIONS ISSUED BY KSERC
1. KSERC Tariff Regulations, 2003
2. KSERC Fuel Surcharge Formula Regulations, 2009
3. KSERC Conduct of Business Regulations, 2003
4. KSERC (Conduct of Business) Amendment Regulations, 2010
5. Kerala Electricity Supply Code, 2005
6. Kerala Electricity Supply Code (First Amendment), 2005
7. Kerala Electricity Supply Code (Second Amendment),2007
8. Kerala Electricity Supply Code (Third Amendment),2008
9. Kerala Electricity Supply Code (Fourth Amendment),2008
10. Kerala Electricity Supply Code (Fifth amendment), 2009
11. KSERC Appeals Before Appellate Authority Regulations, 2005
12. KSERC Open Access Regulations, 2005
13. KSERC Accounting Regulations, 2005
14. KSERC CGRF & Electricity Ombudsman Regulations, 2005
15. KSERC CGRF & Ombudsman (First Amendment) Regulations 2007
16. KSERC CGRF& Ombudsman (Second Amendment) Regulations, 2008
17. KSERC (CGRF & Ombudsman) 3rd Amendment Regulations, 2010
18. KSERC (CGRF & Elec. Ombudsman) 4th Amendment Regulations, 2010
19. KSERC (CGRF & Ombudsman) (Fifth Amendment) Regulations, 2011
20. KSERC Conditions of License for STU, 2005
21. Kerala State Electricity Grid Code, 2005
22. KSERC Conditions of license for Existing Distribution licensees, 2006
23. KSERC Conditions of License for Existing Distribution Licensees (1st
Amendment), 2009
24. KSERC Licensing Regulations, 2006
25. KSERC Terms and Conditions for Retail sale Regulations, 2006
26. KSERC Terms and Conditions of tariff under MYT for Distribution and retail
sale Regulations, 2006
27. KSERC Power Procurement from Renewable Sources Regulations, 2006
28. KSERC Power procurement from Renewable sources (First Amendment)
Regulations, 2008
29. KSERC (Power Procurement from Renewable Sources by Distribution Licensee)
2nd Amendment Regulations, 2010
30. KSERC Power procurement from Co-generation Sources Regulations, 2008
31. KSERC Power procurement from captive sources Regulations, 2007
32. KSERC Fees Regulations, 2007
33. KSERC licensees standards of performance Regulations, 2006
34. KSERC licensees Standards of Performance (First Amendment) Regulations,
2009
35. KSERC Conditions of Service -Ombudsman Regulations, 2008
36. KSERC (Renewable Purchase Obligation & Its Compliance) Regulation, 2010
37. KSERC (Power Procurement from Solar Plants by Distribution Licensees)
Regulation 2009
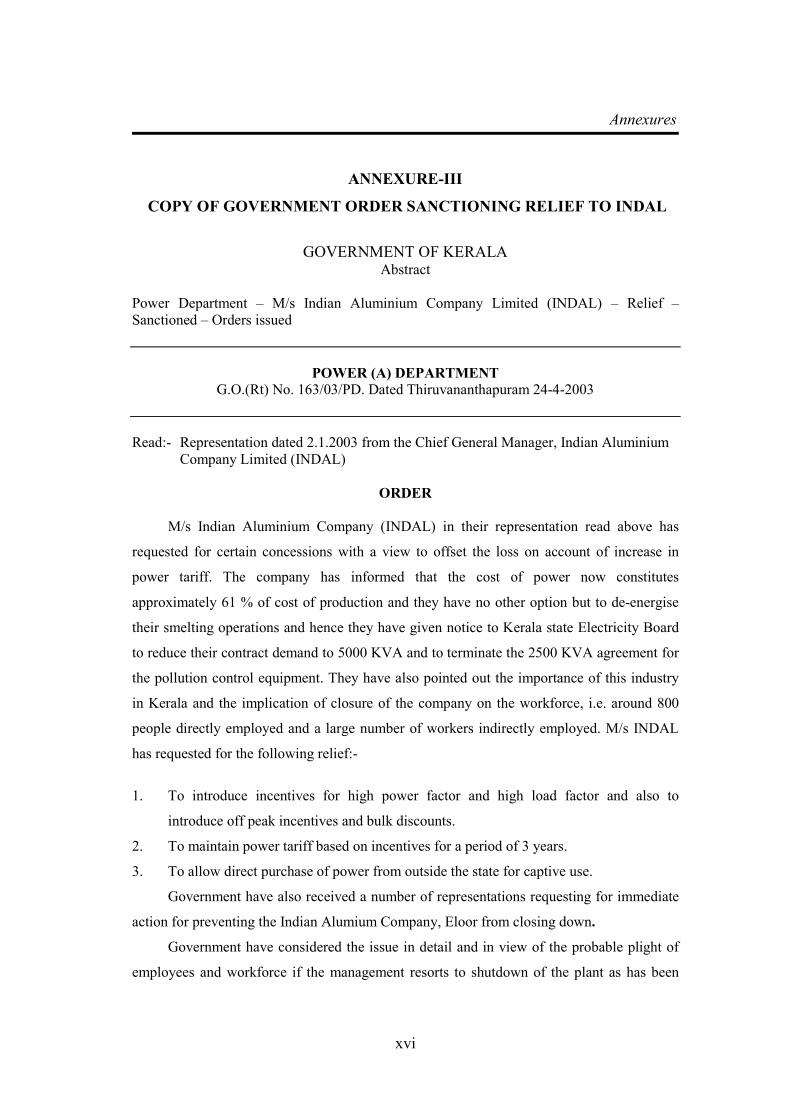
Annexures
xvi
ANNEXURE-III
COPY OF GOVERNMENT ORDER SANCTIONING RELIEF TO INDAL
GOVERNMENT OF KERALA Abstract
Power Department – M/s Indian Aluminium Company Limited (INDAL) – Relief –
Sanctioned – Orders issued
POWER (A) DEPARTMENT
G.O.(Rt) No. 163/03/PD. Dated Thiruvananthapuram 24-4-2003
Read:- Representation dated 2.1.2003 from the Chief General Manager, Indian Aluminium
Company Limited (INDAL)
ORDER
M/s Indian Aluminium Company (INDAL) in their representation read above has
requested for certain concessions with a view to offset the loss on account of increase in
power tariff. The company has informed that the cost of power now constitutes
approximately 61 % of cost of production and they have no other option but to de-energise
their smelting operations and hence they have given notice to Kerala state Electricity Board
to reduce their contract demand to 5000 KVA and to terminate the 2500 KVA agreement for
the pollution control equipment. They have also pointed out the importance of this industry
in Kerala and the implication of closure of the company on the workforce, i.e. around 800
people directly employed and a large number of workers indirectly employed. M/s INDAL
has requested for the following relief:-
1. To introduce incentives for high power factor and high load factor and also to
introduce off peak incentives and bulk discounts.
2. To maintain power tariff based on incentives for a period of 3 years.
3. To allow direct purchase of power from outside the state for captive use.
Government have also received a number of representations requesting for immediate
action for preventing the Indian Alumium Company, Eloor from closing down.
Government have considered the issue in detail and in view of the probable plight of
employees and workforce if the management resorts to shutdown of the plant as has been
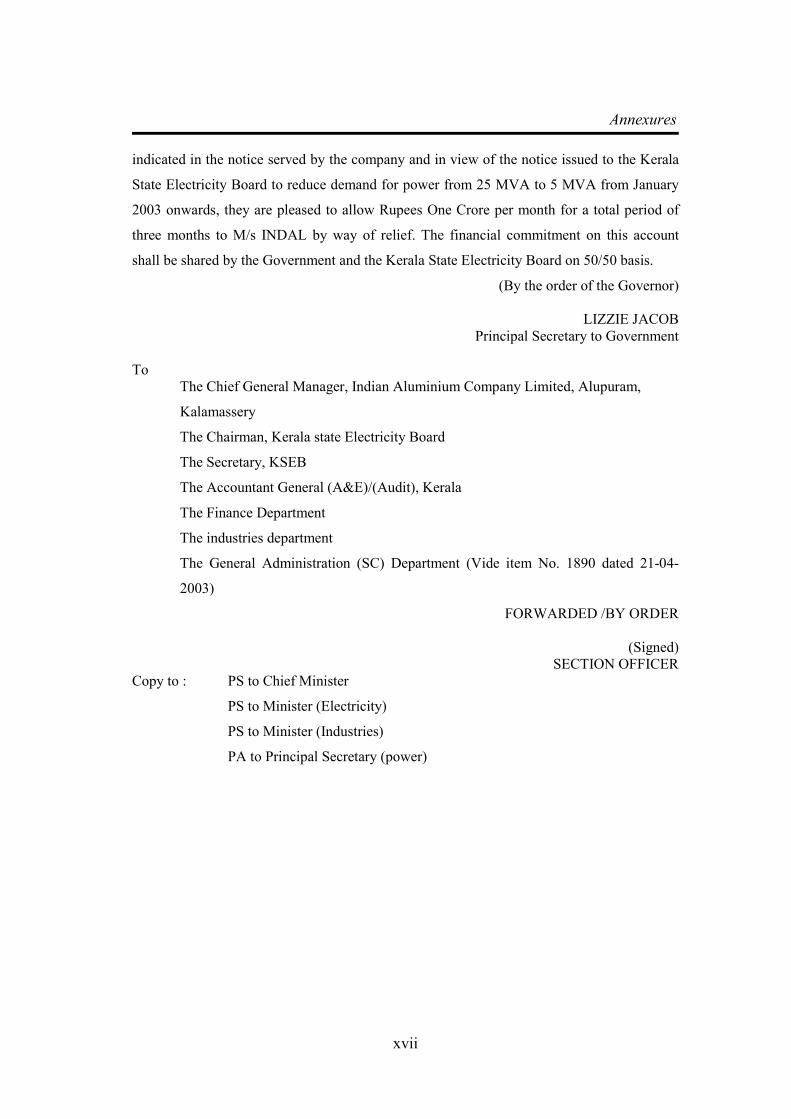
Annexures
xvii
indicated in the notice served by the company and in view of the notice issued to the Kerala
State Electricity Board to reduce demand for power from 25 MVA to 5 MVA from January
2003 onwards, they are pleased to allow Rupees One Crore per month for a total period of
three months to M/s INDAL by way of relief. The financial commitment on this account
shall be shared by the Government and the Kerala State Electricity Board on 50/50 basis.
(By the order of the Governor)
LIZZIE JACOB
Principal Secretary to Government
To
The Chief General Manager, Indian Aluminium Company Limited, Alupuram,
Kalamassery
The Chairman, Kerala state Electricity Board
The Secretary, KSEB
The Accountant General (A&E)/(Audit), Kerala
The Finance Department
The industries department
The General Administration (SC) Department (Vide item No. 1890 dated 21-04-
2003)
FORWARDED /BY ORDER
(Signed)
SECTION OFFICER
Copy to : PS to Chief Minister
PS to Minister (Electricity)
PS to Minister (Industries)
PA to Principal Secretary (power)

Annexures
xviii
ANNEXURE – IV
KSERC ORDER ALLOWING WHEELING OF 30 MW TO INDAL
KERALA STATE ELECTRICITY REGULATORY COMMISSION
THIRUVANANTHAPURAM 695 003
PRESENT: Shri M.K.G. Pillai, Chairman Shri C. Balakrishnan, Member
January 14, 2004
Petition
No. DP-6
Dy. No.
00113 dtd.
24-06-2003
Indian Aluminium Co. Ltd., Alupuram,
Kalamassery 683 104. Kerala State
Electricity Board,Thiruvananthapuram.
Petitioner
Respondent
ORDER
1. Background:
1.1 The petitioner, Indian Aluminium Co. Ltd., Alupuram, hereinafter called Indal is an
extra high-tension consumer availing power at the voltage of 110 kV from the
Kerala State Electricity Board hereinafter called the KSEB or Board. The petitioner
has stated that aluminium smelting, the activity in which it is engaged, is a power
intensive industry and cost of power is the single most important driver in the cost of
production. Cost of power at the existing tariff formed over 65% of the total cost of
production while for the smelters abroad, the energy cost averages to only 20%.
The selling price of aluminium is independent of the cost of individual producers,
being governed by the London Metal Exchange (LME) price and market conditions.
LME price has been reducing in real terms over the past several years.
The petitioner further stated that between 1997 and 1999, the KSEB hiked tariff five
times, raising it from Rs 1.12 per kWh to Rs 2.4 per kWh. KSEB hiked EHT tariff
with effect from August 1, 2001 by a further 25% and again hiked the tariff by
another Ps. 50 per kWh with effect from 1st October, 2002. The tariff as
applicable now is Rs. 3.35 per kWh. The petitioner has stated that being critically
dependent on the power cost, where a hike of Ps. 10 per kWh would increase the
Annexures
xix
metal cost by about Rs. 1700/- per tonne, the smelter has become completely
unviable due to the frequent hike in tariff. From a profit-making unit of Indal, the
smelter has now turned into a loss making unit. The hike in power tariff has resulted
in an annual loss of Rs. 24 Crores.
Under the circumstances, the petitioner was compelled to look to other sources of
supply of less costly power. The Power Trading Corporation has agreed to supply
power to the petitioner at the rate of Rs. 2.50 per kWh at the point of interconnection
between the Kerala Transmission System and Southern Region Transmission
System. The power received at the interconnecting point is to be transmitted to the
smelter located at Alupuram, Kalamassery using the transmission system of KSEB.
The petitioner has therefore requested the Commission to allow it to avail power
from PTC using the transmission system of the KSEB on open access basis in
accordance with the provisions of the Electricity Act, 2003 and also decide on the
wheeling charges, etc., for the usage. The petitioner suggested a wheeling charge
including losses, not exceeding Ps. 10/kWh.
1.2 The petition was notified to the KSEB on 3.7.2003 requesting for its response to the
petition. The Government of Kerala were also requested to offer the views of the
Government in the matter.
The KSEB in its reply dated 4.8.2003 stated that the present network of KSEB
would become insufficient to transmit KSEB's entitlement from the Central Sector
Power Stations located outside Kerala, which may reach a level of 900-1000 MW in
the immediate future. The Board also pointed out certain constraints in the 400/220
kV transformer capacity for availing power by Indal through the Madakkathara
400/220 kV substation. The Board suggested fixing the transmission charges at Ps.
35/kWh based on the transmission charges for the transmission system associated
with the Kayamkulam power station of NTPC. The Board also demanded
transmission losses @ 8% of the transmitted energy, a surcharge of Ps. 42/kWh and
an additional surcharge to offset the commitment charges.
1.3 The response of the Board was notified to Indal seeking their views on the demands
of the KSEB. The petitioner in its rejoinder filed on 15th August 2003 refuted the
contention of the KSEB regarding transmission constraints. The petitioner stated
that the Board had a normal transmission capacity of 1100 MW for import of power
Annexures
xx
from outside the State, if the capacities of all the inter-State 400 kV and 200 kV
lines were utilized. The maximum import so far made by KSEB was 620 MW in
April 2003 when the hydel generation was an all time low. The petitioner contented
that the quantum of import of power by KSEB, under any circumstance would not
exceed 750 MW in the near future. To reinforce the argument, the petitioner quoting
from the budget of the KSEB, stated that the power purchase projection for 2003-04
was only 6156 MU including that from power stations of other agencies located
within the State. Further, by Board's own admission, the 400 kV Madurai-
Thiruvananthapuram line and associated substation would be commissioned by
December, 2003. The petitioner therefore contented that the Board's transmission
system had sufficient capacity for transmission of 30 MW of power, as sought by the
petitioner. The petitioner further stated that the maximum import by KSEB through
the 400/220 kV substation at Madakkathara had never exceeded 400 MW and
therefore there would not be any difficulty of importing additional 30 MW for the
use by the petitioner, as the transformers at Madakkathara substation had a capacity
of 630 MW.
As regards transmission charges, the petitioner contented that the charges should be
worked out on the basis of the depreciation of the original cost of the transmission
system from Madakkathara to Kalamassery, interest on loan, if any, and O&M
expenses and pro-rata charges for 30 MW apportioned against the maximum
loading of 400 MW for the transmission lines. The petitioner has estimated that the
transmission charges for transmission of power from Madakkathara to Indal
Alupuram Smelter premises would be Ps 2.5/kWh only. The petitioner has pointed
out that the wheeling charge levied by the Board on TNEB for transmitting power
through Moozhiyar-Theni 220 kV feeder was only Ps 2.5/kWh. The petitioner has
therefore contented that the transmission charges for transmitting power from
Madakkathara to Indal should not exceed Ps 2.5/kWh.
As regards transmission losses, the petitioner has contented that the transmission
loss of 8% claimed by the Board included losses in the 220 kV, 110 kV and 66 kV
systems. The actual transmission loss in 220 kV system would be much lower than
2%. As per the calculation submitted by the petitioner, transmission loss for
transmitting power from Madakkathara to Indal would work out only to 2.54%.
Annexures
xxi
As regards surcharge to compensate the cross subsidy, the petitioner stated that the
cross subsidy should be determined by comparing the Board's average cost of
supply with the tariff rate for the consumer. Therefore the question of cross
subsidy would arise only when the tariff of a particular consumer is more than the
average cost of supply. Since in this particular case, the average cost of supply is Rs
3.99/kWh and the average tariff rate of the consumer (petitioner) is Rs 3.38, there
was no cross subsidy applicable to the petitioner. The petitioner was therefore not
liable to pay any surcharge to the Board.
1.4 In response to certain clarification sought by the Commission from the KSEB on 6th
August, 2003, the KSEB furnished the reply on 25th August, 2003.
On the query regarding quantum and direction of power flow on the 220 kV system,
the KSEB has informed that power flow is from Idukki/Bhramapuram to
Kalamassery and from Lower Periyar/Idukki to Madakkathara under all operating
conditions. The Board did not furnish details of calculation for arriving at the
transmission loss of 8%.
Board further stated that fixed charges on account of withdrawal of 30 MW by Indal
would cause an additional liability of approximately Rs 2 crores per month which
need to be compensated by Indal.
1.5 Indal surrendered the power supply by KSEB to the smelter plant with effect
from 1.8.2003.
2. Hearing of the Matter
2.1 In the proceedings of the Commission held on 2.9.2003, the parties to the petition
were heard.
2.2 The representatives of the petitioner reiterated the arguments made in the petition
and the subsequent rejoinder to the response of the KSEB. The petitioner contented
that there was no transmission constraint in transmitting 30 MW power from the
interconnecting point at Madakkathara to the Aluminium smelter plant at Alupuram.
The representatives of the petitioner stated that till recently the smelter plant was
receiving about 30 MW from the KSEB system. This quantum of power physically
flowed from the BSES power station to the smelter plant and the same situation will
continue even after delivery of 30 MW at Madakkathara by PTC. The only
Annexures
xxii
difference would be that generation in the KSEB system in the southern part could
be correspondingly reduced. The total capability of import of power into KSEB
system was around 1100 MW and the actual import requirement in the immediate
future would not exceed 750 MW. The petitioner also contented that there was
adequate margin in the 400/220 kV transformer capacity at Madakkathara to permit
import of 30 MW of power required by the petitioner. The petitioner therefore
pleaded for allowing open access to the transmission system of KSEB for importing
30 MW of power from PTC at Madakkathara and transmitting the power to the
smelter plant at Alupuram.
On transmission charges, the petitioner stated that the demand of KSEB for a
transmission charge of Ps 35/kWh was exorbitant. The petitioner argued that it was
unscientific to base the transmission charges on the cost of transmission for
Kayamkulam power station as the transmission system associated with the station
was dedicated for transmitting the power from the station alone. The cost of
transmission would vary depending on the quantum of energy generated at the
station and the capital cost. If the generation was low, the per unit transmission
charges would be high. The charges would be still higher in the case of
Kayamkulam transmission system since it was constructed very recently with huge
capital investment. The petitioner pointed out that for supply of Kayamkulam
power to Tamil Nadu, KSEB was charging only Ps 2.5/kWh for usage of the 220
kV Moozhiar-Theni line of KSEB. The representatives of the petitioner also quoted
an instance where the Central Electricity Regulatory Commission had fixed the tariff
@ Ps 2.5/kWh for usage of 220 kV transmission system of Grid Corporation of
Orissa by the Madhya Pradesh Electricity Board. The petitioner also stated that in
the concept paper on open access in Inter-State Transmission brought out by the
Central Electricity Regulatory Commission, the transmission charge has been
worked out as Ps 1.98/kWh for 100 KM usage of transmission system. The
petitioner stated that taking into account the transmission systems between
Madakkathara and Alupuram, the transmission charges would not exceed Ps
2.5/kWh. The petitioner therefore pleaded that the transmission charge should not
be fixed higher than Ps 2.5/kWh.
Annexures
xxiii
As regards transmission losses, the petitioner stated that the power flow would be by
displacement. While the petitioner would be physically drawing power from the
BSES power station, the 30 MW power received at Madakkathara would be flowing
to North Kerala. The representatives of the petitioner argued that the KSEB would
be in a position to reduce power generation to the extent of 30 MW in the power
stations in the southern part of the State with consequent reduction in the power flow
from southern part to Madakkathara. On account of this, there would be reduction
in losses. However, even if the losses were calculated on the basis of contracted
path method from Madakkathara to Alupuram, the actual loss would work out only
to 2.54%. The petitioner therefore pleaded that the transmission losses should not be
fixed higher than 2.54%.
As regards the demand for surcharge towards cross subsidy, the petitioner stated that
the question would arise only when the tariff of a particular category of consumer
was more than the average cost of supply. Since the KSEB's average cost of supply
and the petitioner's tariff were stated to be Rs 3.99/kWh and Rs 3.38/kWh
respectively, the petitioner was not liable to pay any surcharge towards cross
subsidy. The petitioner further stated that presently KSEB was meeting its demand
partly through power purchase. The cost of power purchase in certain cases was as
high as Rs 4.50 /kWh. Hence if 30 MW power was wheeled to the petitioner from
outside the State, the KSEB could reduce the power purchase to the same extent
from costly sources. Thus, the KSEB would stand to gain to the extent of Rs 1.12
per kWh (Rs 4.50 - Rs 3.38) during the operation of wheeling of power to the
petitioner. The petitioner, therefore, stated that even if it was admitted for the sake
of argument that there was a loss of Ps 42/kWh on account of cross subsidy factor,
the loss would be well compensated by the gain of Rs 1.12 per kWh through
reduction of purchase of costliest power. The petitioner therefore pleaded for
exemption from payment of surcharge towards cross subsidy. The petitioner also
argued against the additional surcharge as the entire demand of the petitioner would
be met by PTC continuously and no additional facility was needed to be created for
the proposed wheeling of 30 MW of power.
2.3 The representatives of the workers' Union of Indal stated that the production in the
plant was getting affected due to the frequent revision in the power tariff by the
KSEB and Indal was scaling down production through gradual layoffs. The
Annexures
xxiv
operation of the smelter plant has been totally stopped with effect from 1.8.2003.
Indal is presently maintaining only marginal operations with power intake of 5 MW.
The workers apprehended that even this small scale operation may come to a stop in
course of time. As a result of this, about 1000 workers would become jobless which
might adversely affect about 5000 affiliated families. This may affect the industrial
climate of the State besides loss of direct and indirect revenue to the Government to
the extent of Rs 80 crores per annum. Closure of Indal may also come in the way of
flow of investment for new industrial ventures in the State. The representatives of
the Workers' unions pleaded for every possible action on the part of the
Commission, Government of Kerala and the KSEB in restarting the smelter plant, as
early as possible.
2.4 The representative of the Government of Kerala stated that the State Government
had no objection in permitting open access to the transmission system of KSEB for
delivering power to Indal by PTC subject to technical suitability of the proposal.
The Government representative stated that the Commission might decide the
wheeling and other charges applicable to the case.
2.5 The representatives of the KSE Board stated that considering the power entitlement
of KSEB in the Central Sector Stations and also the contracted power from other
sources outside the State, the total power import in the immediate future would be of
the order of 1170 MW. The existing transmission capacity would not be adequate
to facilitate import of this quantum of power. The 400/220 kV transformer capacity
at Madakkathara also imposed a constraint on import of additional power. However,
since the requirement of Indal was only of the order of 30 MW, the Board would not
raise any objection for permitting this import by Indal.
As regards charges for transmitting power to Indal using the transmission system of
KSEB, the representatives of KSEB stated that as the actual power flow would take
place through displacement in an interconnecting network, the transmission charges
were necessarily to be worked out on the basis of the pooled cost of transmission in
the State. However, as the valuation of assets and other costs relating to the
transmission profit centre of the Board had not been worked out separately, it was
not possible to arrive at the appropriate value for the transmission/wheeling charges,
on this basis. Pending calculation of the transmission tariff on pooled cost basis, the
Board would opt for deciding the transmission tariff on the basis of transmission
Annexures
xxv
charges paid by the Board to POWERGRID for Kayamkulam transmission system,
as this transmission system formed an integral part of the overall transmission
system in the State. Presently the charges for Kayamkulam transmission system
worked out to Ps 35/kWh. The Board therefore pleaded that the transmission
charges for usage of KSEB's transmission system by Indal should be fixed at Ps
35/kWh.
As regards losses in the transmission system, the Board's representatives stated that
presently the average transmission losses at EHT level worked out to 7.1% and
allowing for incremental losses for transmission of additional power of 30 MW, the
losses would work out to 8% and therefore the power transfer to Indal should
provide for transmission loss of 8%. On a query from the Commission, the Board's
representatives stated that this included also the losses in the 66 kV system.
The Board's representatives further stated that the Board was entitled for a surcharge
based on the difference between tariff for Indal and average realization by the Board.
The average charges for Indal worked out to Rs 3.36/kWh including electricity duty
of Ps 1/kWh and surcharge of Ps 2.5/kWh. As the average realization was Rs
2.96/kWh, it was argued that the Board was entitled for a surcharge of Ps 40/kWh.
It was also argued that the Indal should also pay an additional surcharge of Rs 2
crores per month towards the liability of the Board by way of fixed charges to be
paid to independent power producers. The representatives of the Board further
stated that in the event of failure of power supply from PTC, if Indal desired to avail
supply from KSEB, it should be liable to pay Rs 2 crores per month as grid support
charges in addition to the normal supply tariff of the KSEB.
2.6 The representatives of Indal disputed the arguments of KSEB in regard to
transmission charges, losses and surcharge. They reiterated that the Kayamkulam
transmission system was dedicated to the Kayamkulam power station and was
constructed with 400 kV parameters and the transmission system therefore had a
much higher capacity than the 220 kV system. Working out the transmission charge
on the basis of Kayamkulam transmission was unscientific as the transmission
charge was dependent on the power generated at Kayamkulam. Therefore the
petitioner argued that a transmission charge of Ps 35/kWh based on the Kayamkulam
transmission charges was unjustified.
Annexures
xxvi
As regards transmission losses, the representatives of the petitioner reemphasised
that power imported at Madakkathara would generally flow to the northern parts of
the State and the requirements of power in the central areas would be met from the
local generation and actually there would not be any physical transmission of
imported power from Madakkathara to Indal over the dedicated path, as a result of
which there would be a reduction in losses to the extent of 0.2 MW in the KSEB's
220 kV system. Thus there would be an indirect gain for the KSEB due to the
import of 30 MW for Indal. The petitioner argued that this point also should be
taken into account while fixing the wheeling losses for the petitioner.
The representatives of the petitioner further stated that the load of Indal was such
that the energy drawls remained more or less constant with a load factor of around
96%. However in the event of minor variations in actual practice, overdrawals /
underdrawals might take place to some extent. Therefore, the petitioner suggested
that actual energy schedule for drawal should be made on monthly basis.
2.7 Subsequent to the hearing on 2.9.2003, the KSEB vide letter
No.TRAC/SERC/INDAL/440 dated 16.10.2003 raised its claim towards total
wheeling charges for transmission of power to Indal to Ps.147 per unit of energy as
per the following brake-up:
Ps.
1 Wheeling Charges 32/40
2 Additional surcharge for compensating fixed cost of transmission 03
and distribution
3 Surcharge to compensate revenue loss 96/88
4 Load despatch, scheduling and system operation charges 10
5 ROE 06
147
The claim was based on the assumption that power flow to Indal would be taking
place over the Edemon-Sabarigiri-Pallom-Brahmapuram-Kalamassery-Indal feeders.
The Commission vide letter No.12/4/KERC/2003/310 dated 21st October 2003 asked
for details of load flow studies to substantiate the premise that power to Indal would
be fed through the Edemon-Sabarigiri-Pallom-Brahmapuram-Kalamassery-Indal
feeders and also the details of arriving at the cost per km of 220 kV and 110kV lines
Annexures
xxvii
considered by the KSEB in working out the transmission charges. KSEB was also
asked to furnish the details of other assumptions made in the letter including the cost
of supply to Indal when the KSEB was supplying power. The KSEB has not yet
furnished these details.
3. Commission's Findings:
3.1 Indal has closed down the smelter plant with effect from 1.8.2003 and reduced its
power intake from 30 MW to 5 MW. This development is a matter of serious
concern to the Commission as the KSE Board has lost a major industrial consumer
and it will further aggravate the already strained finances of the KSEB. The
reduction in revenue collection by the KSEB on account of the closure of smelter
plant is estimated to be around Rs. 5.5 Crores per month on an average. The average
realization from Indal was Rs. 3.38 per kWh excluding electricity duty of Ps. 1/kWh
and surcharge of Ps. 2.5 per kWh. The present level average realization by KSEB
per kWh of energy sold is Rs. 2.96. Therefore the loss to KSEB due to the closure
of Indal or grant of permission to Indal for availing power from PTC as requested in
the petition of Indal would be Ps 42 per kWh of the energy consumption of the
smelter plant. The KSEB has not indicated any strategy to deal with the situation
arising out of the closure of Indal, even though the Commission had made a specific
reference to the Board in this regard.
3.2 During the hearing, the representative of the Government of Kerala conveyed no
objection to the proposal for open access subject to technical suitability and
determination of transmission charges, etc., by the Commission. The KSE Board, in
written response earlier had expressed reservations regarding permission of open
access to Indal, citing transmission constraint as the reason. However, during the
hearing, the representatives of the KSEB expressed the view that since the additional
import was only to the extent of 30 MW, the Board would not object to granting
permission to Indal for importing this quantum of power from PTC.
3.3 Under Subsection (2) (d) (ii) of section 39 and Subsection (2) of Section 42 of the
Electricity Act, 2003, the Commission is vested with the authority to introduce open
access for using the transmission system by a licensee or consumer and the Act
allows sufficient time to the Commission for introduction of open access after
framing regulations thereof. In the present case, Indal has surrendered the power

Annexures
xxviii
and the smelter unit has become inoperative. It would appear that the smelter unit
may get ultimately closed, if open access is not allowed. The Commission views
this as an unprecedented and extraordinary situation warranting immediate decision,
in the matter, by the Commission. During the hearing, the Government of Kerala and
the KSEB have given in principle clearance for import of power by Indal from PTC
using the transmission system of KSEB. Under the circumstances, the commission
is inclined to allow open access to the transmission system of KSEB for use by Indal
for transmitting the power purchased from PTC on an experimental basis. The
Commission is therefore required to determine the charges to be paid by Indal to
KSEB for such usage of the transmission system.
3.4 The components of the charges for permitting import of power by Indal from PTC
would essentially cover the charges for usage of the transmission system of KSEB
and compensation for transmission losses. As per sub-section 2(d) of Section 39 of
the Act, any consumer provided with open access to the transmission system by a
licensee is required to pay the transmission charges and a surcharge thereon, as may
be specified by the State Commission and the surcharge shall be utilized for meeting
the current level of cross subsidy. The Commission has to keep the above provision
in the Act also in mind, while deciding the charges for permitting import of power
by Indal.
3.5 As regards charges for usage of the transmission system, the petitioner has argued in
favour of a transmission charge of Ps 2.5/kWh. In support of this, the petitioner has
cited certain instances where similar charges were levied. The matter was examined
in detail by the Commission. The Commission has found that the details of arriving
at a transmission charge of Rs. 2.5/kWh, viz; the various components of the cost of
transmission system, energy handled, distance of transmission, etc., have not been
furnished. Further, it appears that the calculation is based on historical cost of the
transmission system. The Commission is not in favour of deciding transmission
charges on the basis of historical cost alone, as this approach will hamper
development of the transmission system. In Commission's view, a combination of
historical cost and opportunity cost need to be followed in deciding the transmission
charges. As regards the transmission charge of Ps 1.98/kWh for 100 KM usage of
400 kV transmission system worked out by Central Electricity Regulatory
Commission, it has been found that this is arrived at on the basis of a uniform
Annexures
xxix
loading of 500 MW on all the 400 kV lines. As actual loading on most of the lines
would be much lower than this figure, the transmission charge may undergo an
upward revision. Further, the proposal of CERC is in the form of a concept paper in
draft stage, which may undergo many changes before finalization. The CERC has
issued an interim order based on the existing tariff norms which is on pooled cost
basis.
In view of the above, the Commission is not in a position to accept the proposal of
the petitioner for fixing a transmission tariff of Ps 2.5/ kWh.
The Board, on the other hand, has stated that the transmission charge should be fixed
on the basis of the charges for Kayamkulam transmission of POWERGRID which
averages out to Ps 35/kWh. On scrutiny, the Commission has found that this figure
has been arrived at by dividing the monthly transmission service charges by 100
million units. However, the average monthly generation at Kayamkulam power
station is about 200 million units. This clearly shows that while working out the
transmission charges, the Board has not taken into account the supply of 50% of the
energy generation at Kayamkulam Station to Tamil Nadu. If this supply is also
taken into account, the transmission charges on the basis of generation at
Kayamkulam could workout Ps 17.5/kWh. The Commission notes that out of the
two 220 kV double circuit transmission lines from Kayamkulam station, one line has
been constructed with 400 kV parameters. On this basis, the total transmission
capacity of the Kayamkulam transmission system would work out to about 800 MW.
Thus, the monthly energy handling capacity of the transmission system, on a
moderate scale, would be 400 million units per month. The transmission charges on
this basis would work out to Ps 8.75/kWh. The Commission is also not in a position
to consider the subsequent claim of KSEB for a total wheeling charge of Ps.147,
since the supporting information called for by the Commission has not yet been
furnished by the Board.
The Commission is therefore not agreeable to fix the transmission charges on the
basis of the calculations furnished by the KSEB for working out charges for usage of
the transmission system.
The Commission recognizes that there are different methods for working out the
transmission charges, viz., pooled cost (postage stamp) method, contracted path
Annexures
xxx
method, MW-KM method, etc. In the particular case of import of 30 MW of power
by Indal, as per the existing system configuration and operating conditions, most of
the power would be received at Madakkathara 400 kV sub station. However, a part
of the power, though small in quantum, may find its path over the other
interconnecting lines. The situation may further change after the commissioning of
the 400 kV Madurai-Thiruvananthapurm line, when a small portion of the power
may find its path over this line also. This would mean that it would be difficult to
distinctly identify the transmission path for transfer of 30 MW of power by Indal
through the KSEB system. The Commission is therefore of the view that the most
preferable method of determining the transmission charge is on the basis of the
pooled cost of 220 kV transmission system in Kerala including the Kayamkulam
transmission system. To this, the charges for usage of 110 kV transmission system
from Kalamassery to Indal could be added. However, the KSEB was not in a
position to furnish the cost details needed for arriving at the transmission charges on
this basis.
Under the circumstances, the only option before the Commission is to arrive at the
charges on the basis of the cost of a fairly new dedicated transmission system from
Madakkathara to Alupuram, if constructed for transmission of 30 MW of power.
The Commission collected cost data in this connection from various sources
including the Central Electricity Authority. It has been found that the annual cost of
such a transmission system apportioned for transfer of 30 MW power to Alupuram
(over a distance of 70 KM) would work out to Rs. 2.2 crores. Based on an annual
energy transfer of 240 million units, the cost per unit would work out to Ps 9/kWh.
This may have to be increased by another Ps 1 /kWh as compensation for
accommodating minor variations in power absorption on an instant to instant basis,
SLDC charges, RLDC charges (if any) energy accounting charges, etc. Even though
this rate of Ps 10/kWh may be higher than the normal charges for energy transfer
over a 220 kV system of appropriate distance, the Commission feels that it would be
necessary to adopt this figure in order to promote transmission system development
in future. The Commission is therefore of the opinion that a charge of Ps 10/kWh
should be fixed on composite basis to take care of transmission and related charges.
3.5.1 As regards system losses, the petitioner has worked out energy losses @ 2.54%
on the basis of an absolute power flow of 30 MW over contracted path. The Board
Annexures
xxxi
has estimated the energy losses @ 8% on pooled basis in the EHT system at 66 kV
and above.
Based on the information furnished by the KSEB , the Commission has found that
presently the power is flowing from Lower Periyar/Idukki to Madakkathara and
from Madakkathara to northern Kerala under all operating conditions. This situation
is likely to continue even after commissioning of the 400 kV Madurai-
Thiruvananthapuram line. Import of 30 MW of power for Indal would therefore
reduce the flow over the 220 kV Lower Periyar-Madakkathara and Idukki-
Madakkathara lines. Thus there would be a reduction in the losses of the KSEB
system due to the import of 30 MW power by Indal. However, the system
conditions would not remain constant and might vary in accordance with the changes
in system configuration and generation capacity additions. The Commission is
therefore of the view that it would be necessary to keep an allowance to take care of
the changing system conditions. As the loss worked out on contracted path basis is
the lowest, it would be appropriate to adopt such a loss figure for this purpose. The
Commission is however inclined to round off this figure to 3% since the calculation
to arrive at a loss figure of 2.54% was made on the basis of absolute power flow and
not on the basis of incremental power flow. The Commission is therefore of the
view that the Board should be compensated for transmission losses to the extent of
3% of the energy transmitted.
3.5.2 As regards the surcharge on transmission charges, the petitioner has argued that
since the average cost of supply by the Board is Rs. 3.99/kWh which is higher than
the average tariff for Indal, the petitioner was not cross subsidizing any other type of
consumer, and therefore no surcharge should be levied. The Board, on the other
hand, maintained that average energy charges for Indal worked out to Rs 3.36 kWh
while the average realization by KSEB was Rs 2.96/kWh and there was cross
subsidization to the extent of Ps 40/kWh. Therefore the surcharge should be levied
@ Ps 40/kWh. The Board has subsequently revised this figure to Ps.88/96.
The Commission is not in a position to accept both the above arguments. By
definition, cross subsidy is the difference between the tariff for the consumer and the
actual cost of supply to the consumer, if the former is higher than the latter.
Although the Commission has sought the information regarding the cost of supply to
EHT consumers at 110 kV, the KSEB was not in a position to furnish the same due
Annexures
xxxii
to lack of data and asked for one year time to work out the details. Under the
circumstances, the Commission is not in a position to decide the rate of surcharge
based on the current level cross subsidy.
The Commission recognizes the fact that in deciding the various charges related to
the import of 30 MW power by Indal, it has to strike a balance between two
conflicting interests. Any adverse effect on the finances of the KSEB due to the
transaction is detrimental to power development in the State. The continued closure
of the smelter plant and the subsequent total closure of Indal would adversely affect
the climate for industrial development with consequent setback to power
development in the State. This is especially so, since the industrial consumption in
the State is gradually coming down. The Commission firmly believes that it is
impossible to sustain power development without industrial development.
In determining the rate for surcharge, the Commission has to ensure that there is no
immediate financial loss to KSEB. In order to avoid financial loss to KSEB, it has to
be compensated for the difference between the average tariff for Indal i.e. Rs.
3.38/kWh and the overall average realization of Rs 2.96/kWh for the energy
supplied by KSEB. After taking into account the transmission charges and
compensation for transmission losses as worked out above, it is felt that a levy of Ps
25/kWh towards surcharge would satisfy the above requirement.
3.8 The Commission considered the request of the KSEB for an additional surcharge of
Rs 2 crores/month. As per the provisions of the Electricity Act, 2003, this surcharge
is meant to meet the fixed cost of the licensee arising out of its obligation to supply.
Since Indal has been an industrial consumer even before the constitution of the
KSEB, the Commission finds no justification in calling upon the Company to pay
any surcharge arising out of the Board's obligation to supply. Payment against
commitment charges to Independent Power Producers has also no relevance under
the power shortage conditions. The Commission is therefore not in a position to
accept the request of the KSEB for the levy of additional surcharge on Indal.
4. Commission's decision:
4.1 In view of the foregoing discussion, the Commission in accordance with the
provisions of Subsection 2(d)(ii) of Section 39 and Subsection(2) of Section 42 of the
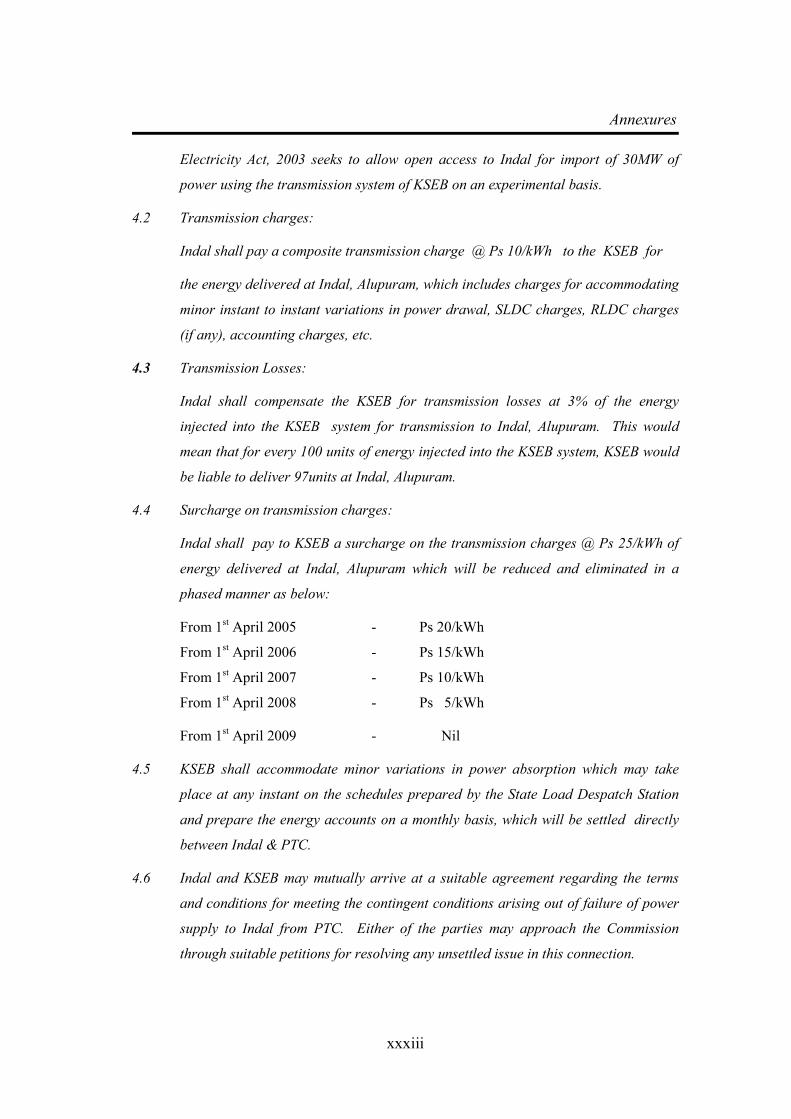
Annexures
xxxiii
Electricity Act, 2003 seeks to allow open access to Indal for import of 30MW of
power using the transmission system of KSEB on an experimental basis.
4.2 Transmission charges:
Indal shall pay a composite transmission charge @ Ps 10/kWh to the KSEB for
the energy delivered at Indal, Alupuram, which includes charges for accommodating
minor instant to instant variations in power drawal, SLDC charges, RLDC charges
(if any), accounting charges, etc.
4.3 Transmission Losses:
Indal shall compensate the KSEB for transmission losses at 3% of the energy
injected into the KSEB system for transmission to Indal, Alupuram. This would
mean that for every 100 units of energy injected into the KSEB system, KSEB would
be liable to deliver 97units at Indal, Alupuram.
4.4 Surcharge on transmission charges:
Indal shall pay to KSEB a surcharge on the transmission charges @ Ps 25/kWh of
energy delivered at Indal, Alupuram which will be reduced and eliminated in a
phased manner as below:
From 1st April 2005 - Ps 20/kWh
From 1st April 2006 - Ps 15/kWh
From 1st April 2007 - Ps 10/kWh
From 1st April 2008 - Ps 5/kWh
From 1st April 2009 - Nil
4.5 KSEB shall accommodate minor variations in power absorption which may take
place at any instant on the schedules prepared by the State Load Despatch Station
and prepare the energy accounts on a monthly basis, which will be settled directly
between Indal & PTC.
4.6 Indal and KSEB may mutually arrive at a suitable agreement regarding the terms
and conditions for meeting the contingent conditions arising out of failure of power
supply to Indal from PTC. Either of the parties may approach the Commission
through suitable petitions for resolving any unsettled issue in this connection.
Annexures
xxxiv
4.7 The above decisions of the Commission will not prohibit the parties to the petition
including the successor bodies to the KSEB at a later date in filing review petitions
with full supporting details thereof. The Commission's decision on such review
petitions will only be operative prospectively.
Petition No. DP-6 from Indian Aluminium Co. Ltd., Alupuram is disposed of
accordingly.
Sd/- Sd/-
C. BALAKRISHNAN M.K.G. PILLAI
MEMBER CHAIRMAN
Authenticated copy for issue
SECRETARY -IN-CHARGE
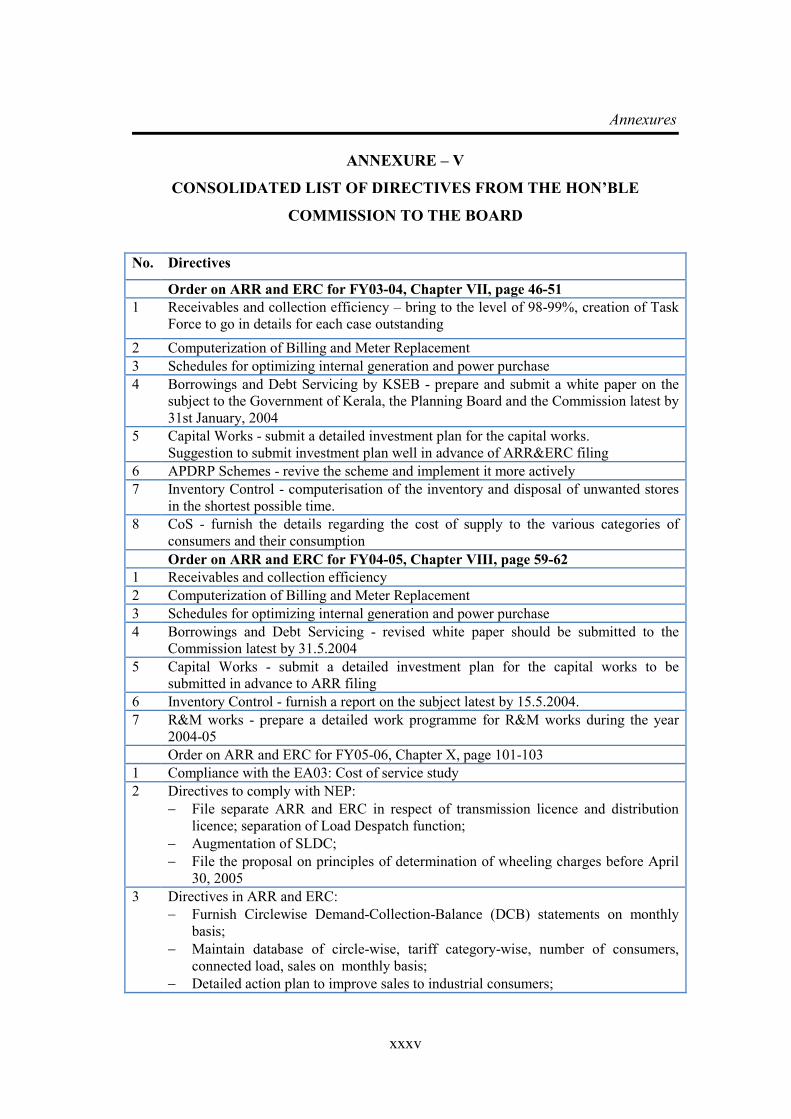
Annexures
xxxv
ANNEXURE – V
CONSOLIDATED LIST OF DIRECTIVES FROM THE HON’BLE
COMMISSION TO THE BOARD
No. Directives
Order on ARR and ERC for FY03-04, Chapter VII, page 46-51
1 Receivables and collection efficiency – bring to the level of 98-99%, creation of Task
Force to go in details for each case outstanding
2 Computerization of Billing and Meter Replacement
3 Schedules for optimizing internal generation and power purchase
4 Borrowings and Debt Servicing by KSEB - prepare and submit a white paper on the
subject to the Government of Kerala, the Planning Board and the Commission latest by
31st January, 2004
5 Capital Works - submit a detailed investment plan for the capital works.
Suggestion to submit investment plan well in advance of ARR&ERC filing
6 APDRP Schemes - revive the scheme and implement it more actively
7 Inventory Control - computerisation of the inventory and disposal of unwanted stores
in the shortest possible time.
8 CoS - furnish the details regarding the cost of supply to the various categories of
consumers and their consumption
Order on ARR and ERC for FY04-05, Chapter VIII, page 59-62
1 Receivables and collection efficiency
2 Computerization of Billing and Meter Replacement
3 Schedules for optimizing internal generation and power purchase
4 Borrowings and Debt Servicing - revised white paper should be submitted to the
Commission latest by 31.5.2004
5 Capital Works - submit a detailed investment plan for the capital works to be
submitted in advance to ARR filing
6 Inventory Control - furnish a report on the subject latest by 15.5.2004.
7 R&M works - prepare a detailed work programme for R&M works during the year
2004-05
Order on ARR and ERC for FY05-06, Chapter X, page 101-103
1 Compliance with the EA03: Cost of service study
2 Directives to comply with NEP:
− File separate ARR and ERC in respect of transmission licence and distribution
licence; separation of Load Despatch function;
− Augmentation of SLDC;
− File the proposal on principles of determination of wheeling charges before April
30, 2005
3 Directives in ARR and ERC:
− Furnish Circlewise Demand-Collection-Balance (DCB) statements on monthly
basis;
− Maintain database of circle-wise, tariff category-wise, number of consumers,
connected load, sales on monthly basis;
− Detailed action plan to improve sales to industrial consumers;
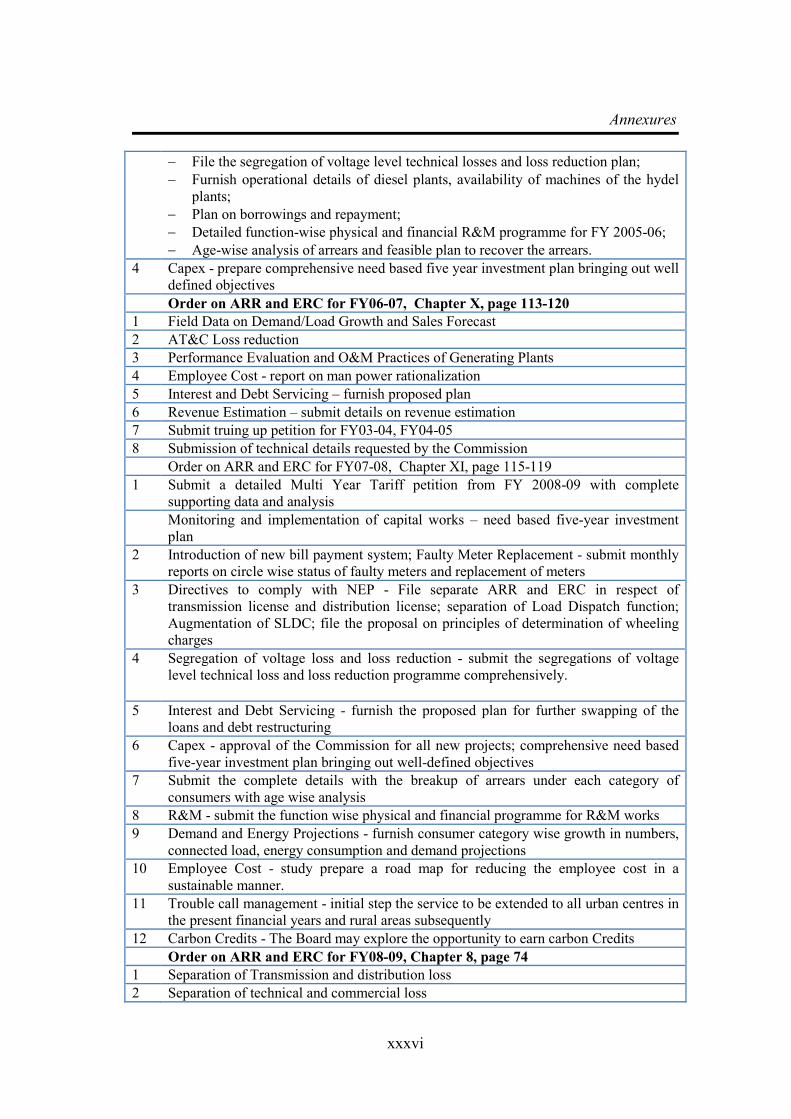
Annexures
xxxvi
− File the segregation of voltage level technical losses and loss reduction plan;
− Furnish operational details of diesel plants, availability of machines of the hydel
plants;
− Plan on borrowings and repayment;
− Detailed function-wise physical and financial R&M programme for FY 2005-06;
− Age-wise analysis of arrears and feasible plan to recover the arrears.
4 Capex - prepare comprehensive need based five year investment plan bringing out well
defined objectives
Order on ARR and ERC for FY06-07, Chapter X, page 113-120
1 Field Data on Demand/Load Growth and Sales Forecast
2 AT&C Loss reduction
3 Performance Evaluation and O&M Practices of Generating Plants
4 Employee Cost - report on man power rationalization
5 Interest and Debt Servicing – furnish proposed plan
6 Revenue Estimation – submit details on revenue estimation
7 Submit truing up petition for FY03-04, FY04-05
8 Submission of technical details requested by the Commission
Order on ARR and ERC for FY07-08, Chapter XI, page 115-119
1 Submit a detailed Multi Year Tariff petition from FY 2008-09 with complete
supporting data and analysis
Monitoring and implementation of capital works – need based five-year investment
plan
2 Introduction of new bill payment system; Faulty Meter Replacement - submit monthly
reports on circle wise status of faulty meters and replacement of meters
3 Directives to comply with NEP - File separate ARR and ERC in respect of
transmission license and distribution license; separation of Load Dispatch function;
Augmentation of SLDC; file the proposal on principles of determination of wheeling
charges
4 Segregation of voltage loss and loss reduction - submit the segregations of voltage
level technical loss and loss reduction programme comprehensively.
5 Interest and Debt Servicing - furnish the proposed plan for further swapping of the
loans and debt restructuring
6 Capex - approval of the Commission for all new projects; comprehensive need based
five-year investment plan bringing out well-defined objectives
7 Submit the complete details with the breakup of arrears under each category of
consumers with age wise analysis
8 R&M - submit the function wise physical and financial programme for R&M works
9 Demand and Energy Projections - furnish consumer category wise growth in numbers,
connected load, energy consumption and demand projections
10 Employee Cost - study prepare a road map for reducing the employee cost in a
sustainable manner.
11 Trouble call management - initial step the service to be extended to all urban centres in
the present financial years and rural areas subsequently
12 Carbon Credits - The Board may explore the opportunity to earn carbon Credits
Order on ARR and ERC for FY08-09, Chapter 8, page 74
1 Separation of Transmission and distribution loss
2 Separation of technical and commercial loss
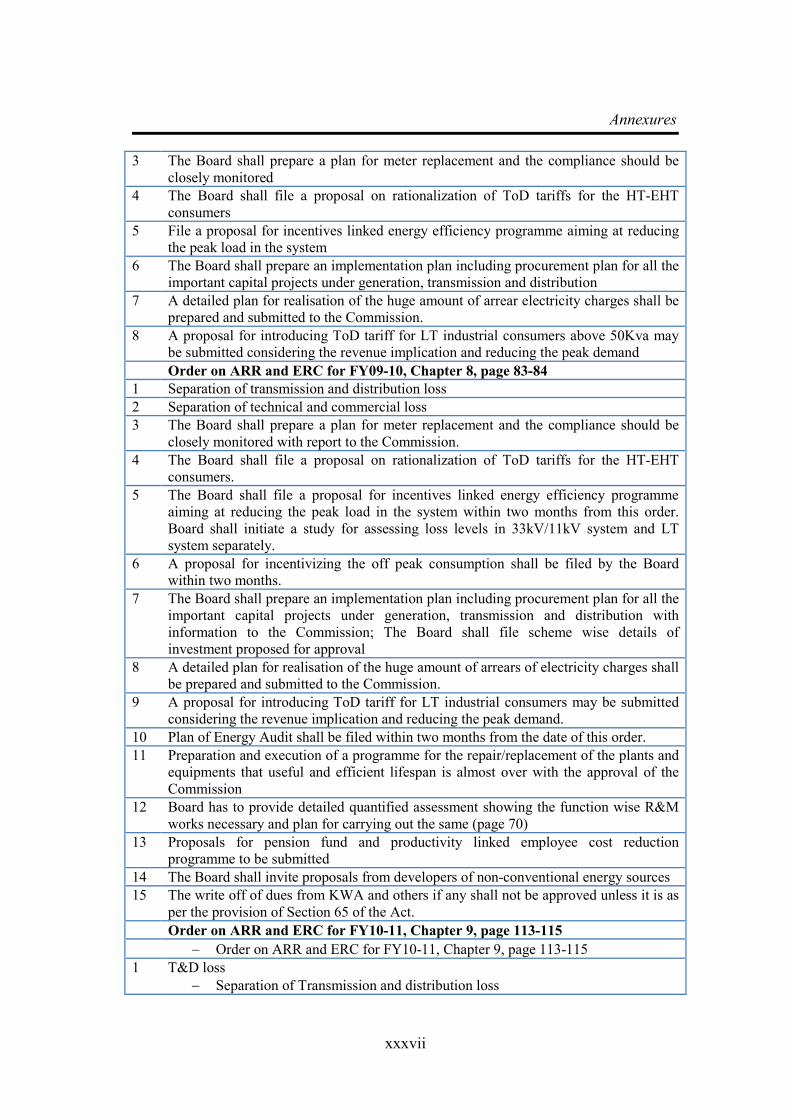
Annexures
xxxvii
3 The Board shall prepare a plan for meter replacement and the compliance should be
closely monitored
4 The Board shall file a proposal on rationalization of ToD tariffs for the HT-EHT
consumers
5 File a proposal for incentives linked energy efficiency programme aiming at reducing
the peak load in the system
6 The Board shall prepare an implementation plan including procurement plan for all the
important capital projects under generation, transmission and distribution
7 A detailed plan for realisation of the huge amount of arrear electricity charges shall be
prepared and submitted to the Commission.
8 A proposal for introducing ToD tariff for LT industrial consumers above 50Kva may
be submitted considering the revenue implication and reducing the peak demand
Order on ARR and ERC for FY09-10, Chapter 8, page 83-84
1 Separation of transmission and distribution loss
2 Separation of technical and commercial loss
3 The Board shall prepare a plan for meter replacement and the compliance should be
closely monitored with report to the Commission.
4 The Board shall file a proposal on rationalization of ToD tariffs for the HT-EHT
consumers.
5 The Board shall file a proposal for incentives linked energy efficiency programme
aiming at reducing the peak load in the system within two months from this order.
Board shall initiate a study for assessing loss levels in 33kV/11kV system and LT
system separately.
6 A proposal for incentivizing the off peak consumption shall be filed by the Board
within two months.
7 The Board shall prepare an implementation plan including procurement plan for all the
important capital projects under generation, transmission and distribution with
information to the Commission; The Board shall file scheme wise details of
investment proposed for approval
8 A detailed plan for realisation of the huge amount of arrears of electricity charges shall
be prepared and submitted to the Commission.
9 A proposal for introducing ToD tariff for LT industrial consumers may be submitted
considering the revenue implication and reducing the peak demand.
10 Plan of Energy Audit shall be filed within two months from the date of this order.
11 Preparation and execution of a programme for the repair/replacement of the plants and
equipments that useful and efficient lifespan is almost over with the approval of the
Commission
12 Board has to provide detailed quantified assessment showing the function wise R&M
works necessary and plan for carrying out the same (page 70)
13 Proposals for pension fund and productivity linked employee cost reduction
programme to be submitted
14 The Board shall invite proposals from developers of non-conventional energy sources
15 The write off of dues from KWA and others if any shall not be approved unless it is as
per the provision of Section 65 of the Act.
Order on ARR and ERC for FY10-11, Chapter 9, page 113-115
− Order on ARR and ERC for FY10-11, Chapter 9, page 113-115
1 T&D loss
− Separation of Transmission and distribution loss
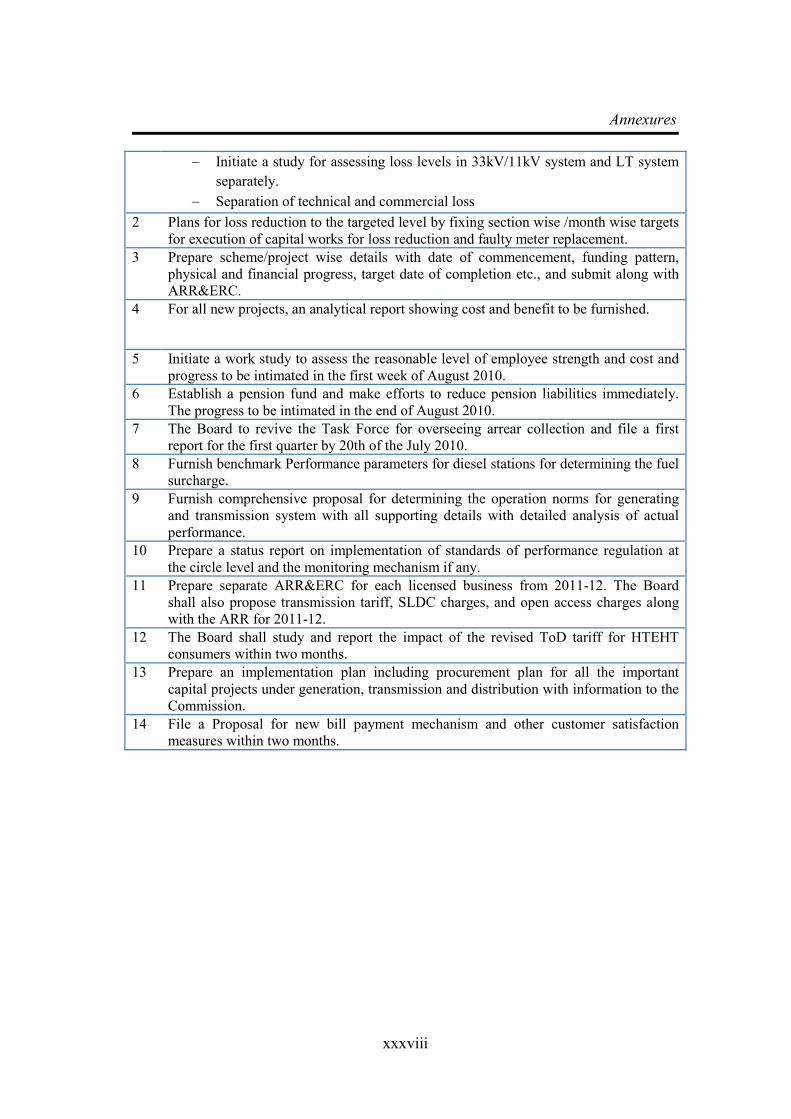
Annexures
xxxviii
− Initiate a study for assessing loss levels in 33kV/11kV system and LT system
separately.
− Separation of technical and commercial loss
2 Plans for loss reduction to the targeted level by fixing section wise /month wise targets
for execution of capital works for loss reduction and faulty meter replacement.
3 Prepare scheme/project wise details with date of commencement, funding pattern,
physical and financial progress, target date of completion etc., and submit along with
ARR&ERC.
4 For all new projects, an analytical report showing cost and benefit to be furnished.
5 Initiate a work study to assess the reasonable level of employee strength and cost and
progress to be intimated in the first week of August 2010.
6 Establish a pension fund and make efforts to reduce pension liabilities immediately.
The progress to be intimated in the end of August 2010.
7 The Board to revive the Task Force for overseeing arrear collection and file a first
report for the first quarter by 20th of the July 2010.
8 Furnish benchmark Performance parameters for diesel stations for determining the fuel
surcharge.
9 Furnish comprehensive proposal for determining the operation norms for generating
and transmission system with all supporting details with detailed analysis of actual
performance.
10 Prepare a status report on implementation of standards of performance regulation at
the circle level and the monitoring mechanism if any.
11 Prepare separate ARR&ERC for each licensed business from 2011-12. The Board
shall also propose transmission tariff, SLDC charges, and open access charges along
with the ARR for 2011-12.
12 The Board shall study and report the impact of the revised ToD tariff for HTEHT
consumers within two months.
13 Prepare an implementation plan including procurement plan for all the important
capital projects under generation, transmission and distribution with information to the
Commission.
14 File a Proposal for new bill payment mechanism and other customer satisfaction
measures within two months.
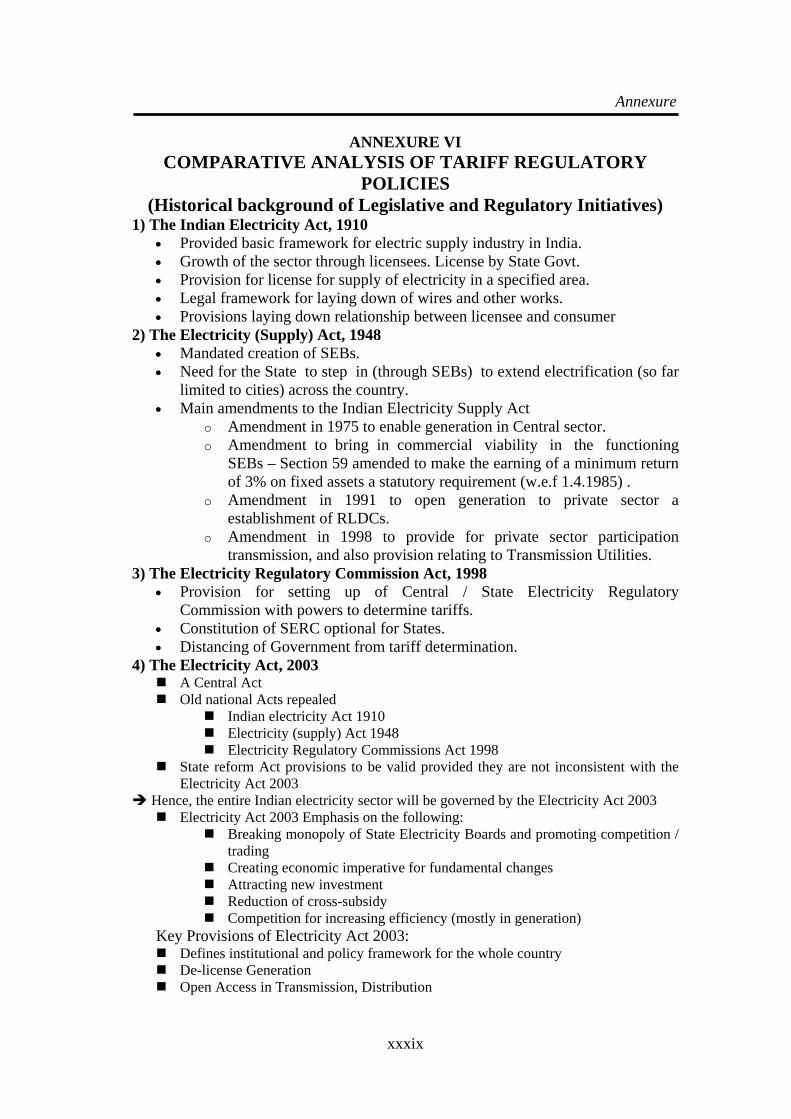
Annexure
xxxix
ANNEXURE VI COMPARATIVE ANALYSIS OF TARIFF REGULATORY
POLICIES (Historical background of Legislative and Regulatory Initiatives)
1) The Indian Electricity Act, 1910 • Provided basic framework for electric supply industry in India. • Growth of the sector through licensees. License by State Govt. • Provision for license for supply of electricity in a specified area. • Legal framework for laying down of wires and other works. • Provisions laying down relationship between licensee and consumer
2) The Electricity (Supply) Act, 1948 • Mandated creation of SEBs. • Need for the State to step in (through SEBs) to extend electrification (so far
limited to cities) across the country. • Main amendments to the Indian Electricity Supply Act
o Amendment in 1975 to enable generation in Central sector. o Amendment to bring in commercial viability in the functioning
SEBs – Section 59 amended to make the earning of a minimum return of 3% on fixed assets a statutory requirement (w.e.f 1.4.1985) .
o Amendment in 1991 to open generation to private sector a establishment of RLDCs.
o Amendment in 1998 to provide for private sector participation transmission, and also provision relating to Transmission Utilities.
3) The Electricity Regulatory Commission Act, 1998 • Provision for setting up of Central / State Electricity Regulatory
Commission with powers to determine tariffs. • Constitution of SERC optional for States. • Distancing of Government from tariff determination.
4) The Electricity Act, 2003 A Central Act Old national Acts repealed
Indian electricity Act 1910 Electricity (supply) Act 1948 Electricity Regulatory Commissions Act 1998
State reform Act provisions to be valid provided they are not inconsistent with the Electricity Act 2003
Hence, the entire Indian electricity sector will be governed by the Electricity Act 2003 Electricity Act 2003 Emphasis on the following:
Breaking monopoly of State Electricity Boards and promoting competition / trading
Creating economic imperative for fundamental changes Attracting new investment Reduction of cross-subsidy Competition for increasing efficiency (mostly in generation)
Key Provisions of Electricity Act 2003: Defines institutional and policy framework for the whole country De-license Generation Open Access in Transmission, Distribution
Annexure
xl
Promote trading and markets De-license rural distribution Establishes norms for transparency and public participation Re-defined role and mandate of State Governments, Regulators and Licensees Establishment of Consumer Grievance Redressal Forums
5) National Electricity Policy 2005 Emphasises the electricity – development link:
“Electricity is an essential requirement for all facets of our life. It has been recognized as a basic human need. It is a critical infrastructure on which the socio-economic development of the country depends”
Issues addressed: Rural Electrification Generation , Transmission, Distribution Recovery of Cost of services & Targeted Subsidies. Technology Development and Research and Development (R&D) Competition aimed at Consumer Benefits Financing Power Sector Programmes Including Private Sector Participation. Energy Conservation , Environmental Issues Training and Human Resource Development Cogeneration and Non-Conventional Energy Sources Protection of Consumer interests and Quality Standards
Generation Power-Demand to be fully met by 2012 A part of new generating capacity (say 15%) may be sold outside long term
Power Purchase Agreements (PPAs) Transmission & Distribution
Development of National Grid National and State level Open access to be facilitated Demand side management
Consumers Access to electricity for all households by 2010 Per capita availability of electricity to be increased to over 1000 units by
2012 Minimum lifeline consumption of 1 unit/household/day as a merit good by
year 2012 Cross subsidies to be reduced gradually Provision of support to lifeline consumers (households below poverty line
having consumption of 30 units per month) with tariff being at least 50% of average cost of supply.
Grievance Forum and Ombudsman to be set up Government and RCs to facilitate capacity building of consumer groups.
6) National Tariff Policy 2006 Objectives
Ensure availability of electricity to consumers at reasonable and competitive rates
Ensure financial viability of the sector and attract investments; Promote transparency, consistency and predictability in regulatory
approaches across jurisdictions and minimise perceptions of regulatory risks; Promote competition, efficiency in operations and improvement in quality of
supply
Annexure
xli
Covers General approach to tariff Generation, Transmission, Distribution Tariff Trade margin
Power purchase by DISCOMS to be based on competitive bidding (exception for public sector)
Cross subsidy surcharge is to be paid by open access consumers. This is calculated as the difference between the consumer tariff and the cost of supply
Poor consumers (consuming say less than 30 units/month) will get support through cross subsidy. Their tariff will be at least 50% the average cost of supply. SERCs will notify a roadmap to reduce cross subsidy so that by 2011, tariffs would be within +/- 20% the average cost of supply
Amendment (Mar 08) on Hydro tariff (transparent bidding, long term PPA for 60%, R&R, development fund etc
7) National Rural Electrification Policy Goals
Provision of access to electricity to all households by year 2009 Quality and reliable power supply at reasonable rates Minimum lifeline consumption of 1 unit per household per day as a merit
good by year 2012. Covers
Approach to rural electrification; RGGVY program; Definition of electrified village; Involvement of local community; Financial assistance, Stand-alone systems, Bulk power purchase & management of rural distribution
Grid and off grid solutions for Household electrification and economic activities
Rural Electrification Corporation to be the nodal agency, Central support to States for RE
States to prepare RE Plan, set up District Committees, notify rural areas . SERCs to monitor
Franchisees for rural distribution 8) Rural Electrification: Rajiv Gandhi Grameen Vidhyutikaran Yojana (RGGVY) 2005
Village (1,25,000) and rural household (78 million) electrification Central government to provide financial and implementation support to
States Guarantee by States for minimum 6-8 hours of power supply Decentralised Distributed Generation (DDG) to supplement grid power US$ 12,500 m outlay
9) Urban Distribution: Re-structured Accelerated Power Development and Reforms Programme (R-APDRP) 2008
Focus on base line data creation and distribution loss reduction (urban) US$ 2500 m for base line data and IT applications US$ 10,000 m for distribution strengthening