A study on the structure of the convective atmosphere over the Bay of Bengal during BOBMEX-99
17
A study on the structure of the convective atmosphere over the Bay of Bengal during BOBMEX-99 U C Mohanty * , N V Sam, S Das 1 , A N V Satyanarayana Centre for Atmospheric Sciences, Indian Institute of Technology, Delhi, New Delhi, India. 1 National Centre for Medium Range Weather Forecasting, Lodhi Road, New Delhi, India. * e-mail: [email protected] Convective activity is one of the major processes in the atmosphere influencing the local and large- scale weather in the tropics. The latent heat released by the cumulus cloud is known to drive monsoon circulation, which on the other hand supplies the moisture that maintains the cumulus clouds. An investigation is carried out on the convective structure of the atmosphere during active and suppressed periods of convection using data sets obtained from the Bay of Bengal and Monsoon Experiment (BOBMEX). The cumulus convection though being a small-scale phenomenon, still influences its embedding environment by interaction through various scales. This study shows the variation in the kinematic and convective parameters during the transition from suppressed to active periods of convection. Convergence in the lower levels and strong upward vertical velocity, significant during active convection are associated with the formation of monsoon depressions. The apparent heat source due to latent heat release and the vertical transport of the eddy heat by cumulus convection, and the apparent moisture sink due to net condensation and vertical divergence of the eddy transport of moisture, are estimated through residuals of the thermodynamic equation and examined in relation to monsoon activity during BOBMEX. 1. Introduction Deep and intense cumulus convection can have an important effect on the dynamics and ener- getics of large-scale atmospheric systems, because of the large magnitudes of the energy trans- formations associated with changes of phase of water in precipitating cumulus clouds as well as the strong updrafts and downdrafts which often extend through the troposphere. The importance of deep cumulus clouds in the heat balance of the tropical atmosphere was first pointed out by Riehl and Malkus (1958). They depicted that deep cumulus clouds can carry the released latent heat of condensation to the upper troposphere where the local vertical gradient of moist static energy is positive. The tropical cyclone is perhaps the best example of a mesoscale atmospheric system that owes its existence to the release of latent heat in cumulus convection (Riehl and Malkus 1961; Yanai 1961 a, b). The first theoretical for- mulation of the cumulus macro-motion coupling through boundary layer convergence was made by Charney and Eliassen (1964) and Ooyama (1964, 1969a), in their attempts to explain the growth of tropical cyclones, where they introduced the concept of conditional instability of the second kind (CISK). Studies of tropical convective systems over Marshall Islands in the Pacific Ocean and over the eastern Atlantic Ocean during GARP Atlantic Tropical Experiment (GATE) has indicated a strong control of cumulus convection, and efforts are still on to clarify the nature of the interac- tion between small-scale cumulus convection and the large-scale circulation of the troposphere. Much attention is given to the diagnostic study of the interaction processes. Yanai et al (1973) devel- Keywords. Convection; monsoon depression; Bay of Bengal; BOBMEX. Proc. Indian Acad. Sci. (Earth Planet. Sci.), 112, No. 2, June 2003, pp. 147–163 © Printed in India. 147
Transcript of A study on the structure of the convective atmosphere over the Bay of Bengal during BOBMEX-99

A study on the structure of the convective atmosphereover the Bay of Bengal during BOBMEX-99
U C Mohanty∗, N V Sam, S Das1, A N V Satyanarayana
Centre for Atmospheric Sciences, Indian Institute of Technology, Delhi, New Delhi, India.1National Centre for Medium Range Weather Forecasting, Lodhi Road, New Delhi, India.
∗e-mail: [email protected]
Convective activity is one of the major processes in the atmosphere influencing the local and large-scale weather in the tropics. The latent heat released by the cumulus cloud is known to drivemonsoon circulation, which on the other hand supplies the moisture that maintains the cumulusclouds. An investigation is carried out on the convective structure of the atmosphere during activeand suppressed periods of convection using data sets obtained from the Bay of Bengal and MonsoonExperiment (BOBMEX). The cumulus convection though being a small-scale phenomenon, stillinfluences its embedding environment by interaction through various scales. This study shows thevariation in the kinematic and convective parameters during the transition from suppressed toactive periods of convection. Convergence in the lower levels and strong upward vertical velocity,significant during active convection are associated with the formation of monsoon depressions. Theapparent heat source due to latent heat release and the vertical transport of the eddy heat bycumulus convection, and the apparent moisture sink due to net condensation and vertical divergenceof the eddy transport of moisture, are estimated through residuals of the thermodynamic equationand examined in relation to monsoon activity during BOBMEX.
1. Introduction
Deep and intense cumulus convection can havean important effect on the dynamics and ener-getics of large-scale atmospheric systems, becauseof the large magnitudes of the energy trans-formations associated with changes of phase ofwater in precipitating cumulus clouds as well asthe strong updrafts and downdrafts which oftenextend through the troposphere. The importanceof deep cumulus clouds in the heat balance ofthe tropical atmosphere was first pointed out byRiehl and Malkus (1958). They depicted that deepcumulus clouds can carry the released latent heatof condensation to the upper troposphere wherethe local vertical gradient of moist static energyis positive. The tropical cyclone is perhaps thebest example of a mesoscale atmospheric systemthat owes its existence to the release of latent
heat in cumulus convection (Riehl and Malkus1961; Yanai 1961 a, b). The first theoretical for-mulation of the cumulus macro-motion couplingthrough boundary layer convergence was made byCharney and Eliassen (1964) and Ooyama (1964,1969a), in their attempts to explain the growthof tropical cyclones, where they introduced theconcept of conditional instability of the secondkind (CISK).
Studies of tropical convective systems overMarshall Islands in the Pacific Ocean and overthe eastern Atlantic Ocean during GARP AtlanticTropical Experiment (GATE) has indicated astrong control of cumulus convection, and effortsare still on to clarify the nature of the interac-tion between small-scale cumulus convection andthe large-scale circulation of the troposphere. Muchattention is given to the diagnostic study of theinteraction processes. Yanai et al (1973) devel-
Keywords. Convection; monsoon depression; Bay of Bengal; BOBMEX.
Proc. Indian Acad. Sci. (Earth Planet. Sci.), 112, No. 2, June 2003, pp. 147–163© Printed in India. 147

148 U C Mohanty et al
oped a diagnostic method for the determinationof the bulk or averaged profiles of clusters ofcumulus clouds from the observations of large-scalemeteorological variables. Various other methods,developed by Ogura and Cho (1973) and Nitta(1975), enabled the study of spectral distribu-tion of cumulus mass flux, for clusters of cumulusclouds to be diagnosed from large-scale variables.In these studies, the cumulus cloud has been mod-eled as a one-dimensional, steady state entrainingplume updraft.
It is evident that a large amount of latent heatis liberated in cumulus clouds and the releasedheat is transported upwards, but how this heatis utilized in warming the large-scale environ-ment, is not so obvious. Therefore it becomesvery necessary to have a better understanding ofthis physical process to improve cumulus para-meterization. The prime objective of this studyis to understand the convective structure of theatmosphere, both in convectively active and sup-pressed episodes observed during BOBMEX-99.BOBMEX, an observational program under theICRP (Indian Climate Research Program) overthe Bay of Bengal was conducted during July –August 1999. ICRP gives a major thrust on mon-soon variability on various timescales ranging fromsubseasonal-interannual and decadal (DST 1996).Most of the rainfall observed during the monsoonperiod over the Indo-Gangetic plain occurs mostlydue to lows and monsoon depressions originatingover the waters that move on to the landmasses.The genesis of monsoon depressions are very highover the Bay of Bengal (Rao 1976). Bhat et al(2001) stated that the distribution of the sum-mer monsoon rainfall during June to Septemberover the Indian region is linked to the variation ofconvective activities over the Bay of Bengal. Thespecial observation programme BOBMEX, there-fore, paved the way in collecting critical dataon the subseasonal variation of important vari-ables of the atmosphere, ocean and their inter-face to get a deeper insight into some of theprocesses that govern the variability of organizedconvection over the Bay of Bengal (Bhat et al2001).
Very high-resolution upper air data wereobtained from Vaisala sondes during this exper-iment that was used to study the variability oforganized convection over the Bay of Bengal. It isfor the first time that such high-resolution upperair data were obtained over the Bay of Bengal.These observations show that the magnitudes ofthe convective available potential energy (CAPE)and the convective inhibition energy were compa-rable to those for the atmosphere over the westPacific warm pool, where CAPE decreased by2–3 kJkg−1, following convection and recovered in a
time period of 1–2 days (Bhat et al 2001). The kine-matic and convective budgets of an environmentduring BOBMEX-99 over a scale of 100–1000 kmare grouped in B-Scale (GARP). For the convec-tively active and suppressed periods the profiles ofkinematic parameters viz., mean zonal and merid-ional wind; the vertical velocity and its daily vari-ation and profiles of convective parameters (dry,moist and saturation moist static energy; appar-ent heat source and moisture sink, etc) have beencomputed.
2. Data and synoptic condition
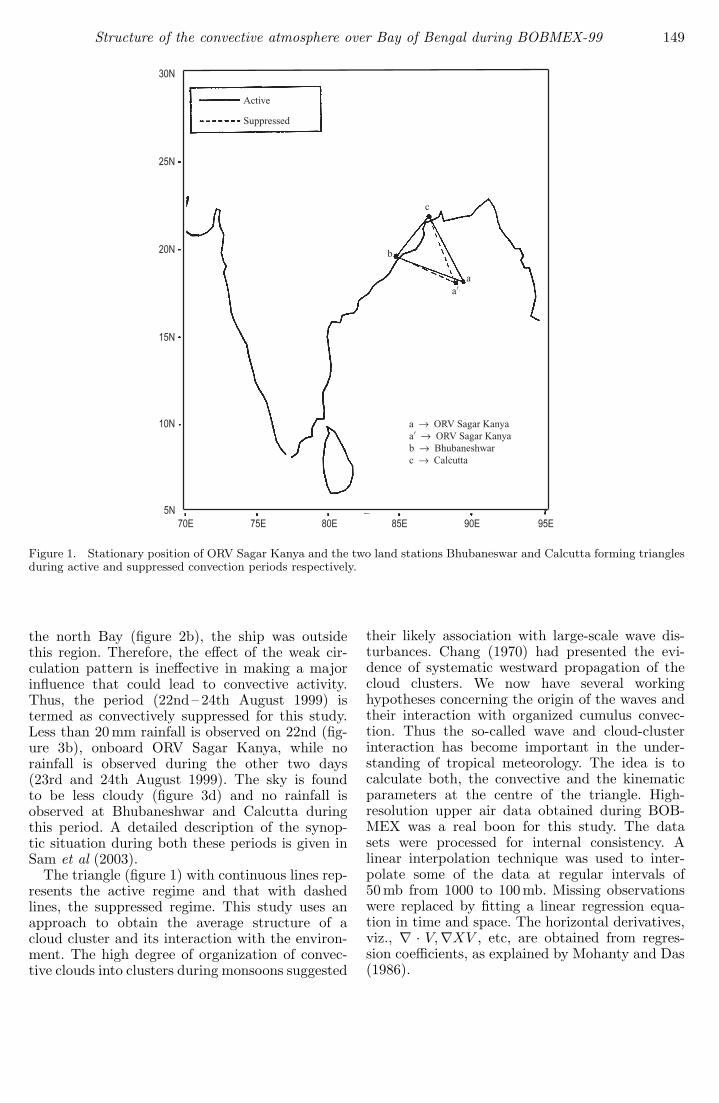
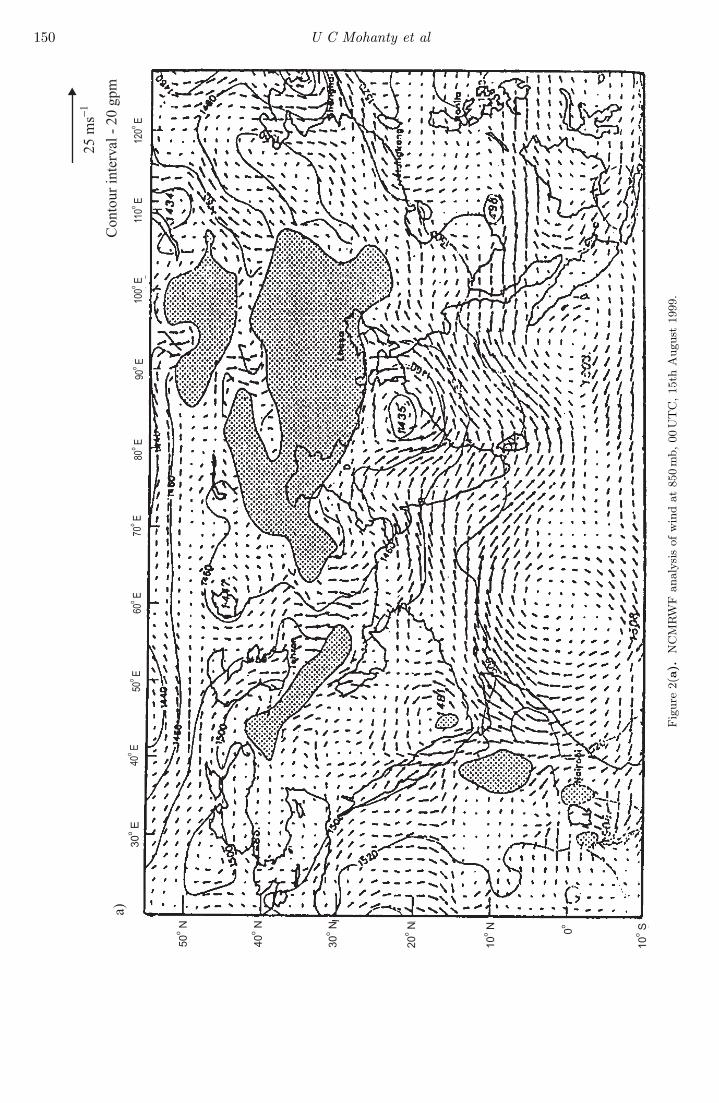
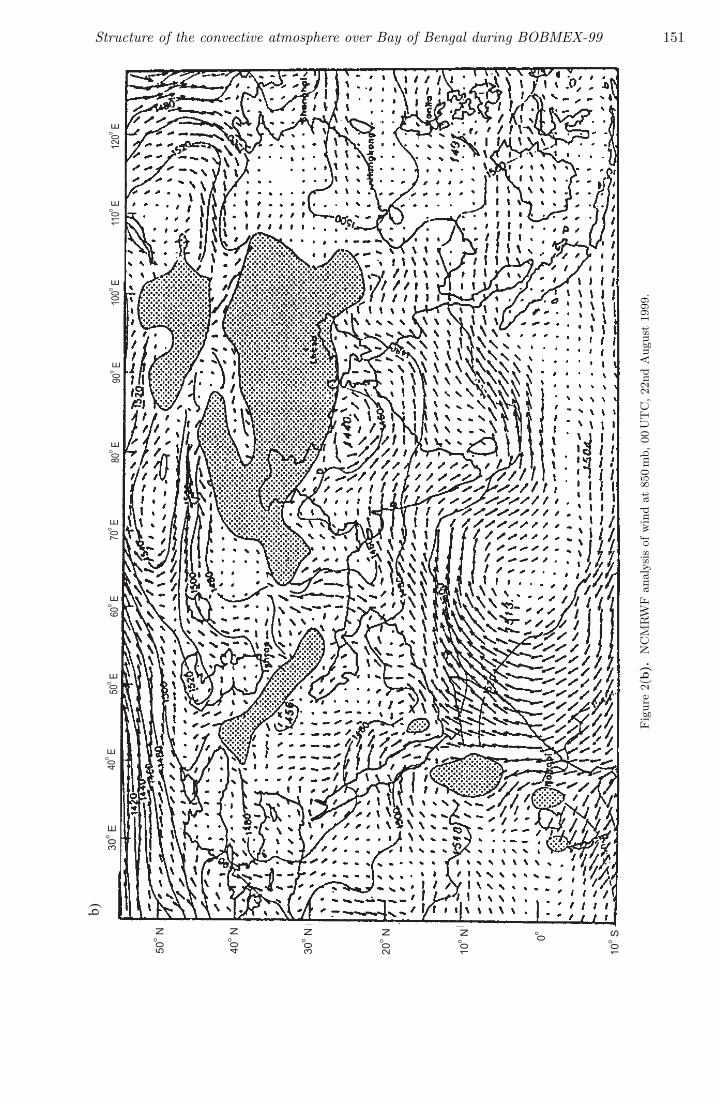
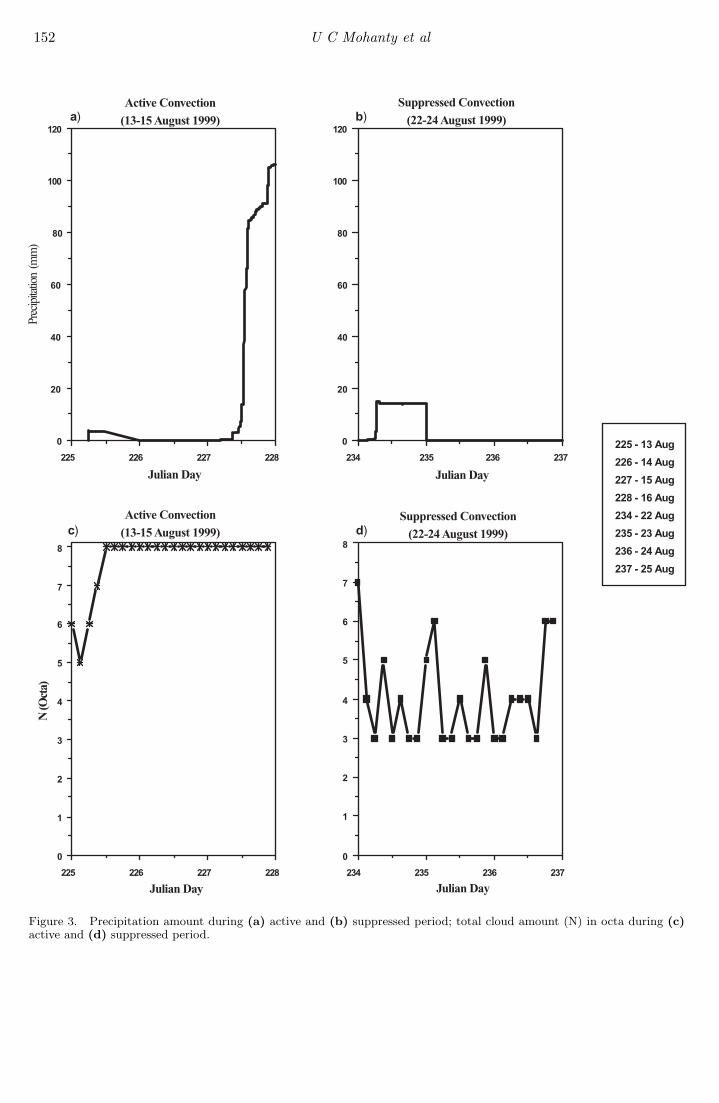
Two different sets of data consisting of six hourly(00, 06, 12, 18 GMT) obtained onboard ORV SagarKanya and from land stations viz., Bhubaneshwarand Calcutta are used in this study. Each set isa period of three days. In the first set (Ist period:13th – 15th August 1999) ORV Sagar Kanya wasstationed approximately at 17.54◦N, 89.02◦E. Theobservations taken over land stations, Bhubanesh-war and Calcutta are respectively at 20.1◦N, 85.1◦Eand 23.4◦N, 86.5◦E. Figure 1 shows the positionof ship and land stations during the period. Thethree observation points together formed a trian-gular column of atmosphere representing the B-scale as defined during GATE. The period (13th –15th August 1999) is termed as the convectivelyactive period based on observed rainfall and synop-tic situations. The 850 mb wind analysis of NCM-RWF (National Centre for Medium Range WeatherForecasting) at 00 UTC show strong westerlies inthe convectively active regime. On the 15th (fig-ure 2a), a well-marked low (north Bay) is noticedover land near Bhubaneshwar. Also rain (figure 3a)amounting to approximately 120 mm is observedonboard ORV Sagar Kanya on the 15th. Thisrainfall is measured using the precipitation gaugefrom R. M. Young (U.S.A) that was placed inan open space on the upper deck of the ship.In this period the sky (figure 3c) is also foundto be almost all the time overcast (8 octa). Fig-ure 4 (a and b) shows the observed rainfall atBhubaneshwar (max. 51 mm on 15th August 1999)and Calcutta (max. 35 mm on 14th August 1999)respectively. The sky is also noticed to be par-tially cloudy (figure 4c and d) during this period.Satellite pictures show more of stratus clouds overBhubaneshwar during this period. During the IIndphase of observations (22nd – 24th August 1999),ORV Sagar Kanya was approximately located at17.59◦N, 88.84◦E (figure 1). The NCMRWF 850 mbwind analysis during this period does not showstrong westerlies as seen in the case of the convec-tively active period. Although, a circulation pat-tern is seen to be developing near the head of
Structure of the convective atmosphere over Bay of Bengal during BOBMEX-99 149
Figure 1. Stationary position of ORV Sagar Kanya and the two land stations Bhubaneswar and Calcutta forming trianglesduring active and suppressed convection periods respectively.
the north Bay (figure 2b), the ship was outsidethis region. Therefore, the effect of the weak cir-culation pattern is ineffective in making a majorinfluence that could lead to convective activity.Thus, the period (22nd – 24th August 1999) istermed as convectively suppressed for this study.Less than 20 mm rainfall is observed on 22nd (fig-ure 3b), onboard ORV Sagar Kanya, while norainfall is observed during the other two days(23rd and 24th August 1999). The sky is foundto be less cloudy (figure 3d) and no rainfall isobserved at Bhubaneshwar and Calcutta duringthis period. A detailed description of the synop-tic situation during both these periods is given inSam et al (2003).
The triangle (figure 1) with continuous lines rep-resents the active regime and that with dashedlines, the suppressed regime. This study uses anapproach to obtain the average structure of acloud cluster and its interaction with the environ-ment. The high degree of organization of convec-tive clouds into clusters during monsoons suggested
their likely association with large-scale wave dis-turbances. Chang (1970) had presented the evi-dence of systematic westward propagation of thecloud clusters. We now have several workinghypotheses concerning the origin of the waves andtheir interaction with organized cumulus convec-tion. Thus the so-called wave and cloud-clusterinteraction has become important in the under-standing of tropical meteorology. The idea is tocalculate both, the convective and the kinematicparameters at the centre of the triangle. High-resolution upper air data obtained during BOB-MEX was a real boon for this study. The datasets were processed for internal consistency. Alinear interpolation technique was used to inter-polate some of the data at regular intervals of50 mb from 1000 to 100 mb. Missing observationswere replaced by fitting a linear regression equa-tion in time and space. The horizontal derivatives,viz., ∇ · V,∇XV , etc, are obtained from regres-sion coefficients, as explained by Mohanty and Das(1986).
150 U C Mohanty et al
Fig
ure
2(a)
.N
CM
RW
Fan
alys
isof
win
dat
850
mb,
00U
TC
,15
thA
ugus
t19
99.
Structure of the convective atmosphere over Bay of Bengal during BOBMEX-99 151
Fig
ure
2(b).
NC
MRW
Fan
alys
isof
win
dat
850
mb,
00U
TC
,22
ndA
ugus
t19
99.
152 U C Mohanty et al
Figure 3. Precipitation amount during (a) active and (b) suppressed period; total cloud amount (N) in octa during (c)active and (d) suppressed period.

Structure of the convective atmosphere over Bay of Bengal during BOBMEX-99 153
Figure 4. Precipitation amount during active period (a) at Bhubaneswar and (b) at Calcutta; total cloud amount (N) inocta during the same period (c) at Bhubaneswar and (d) at Calcutta.
154 U C Mohanty et al
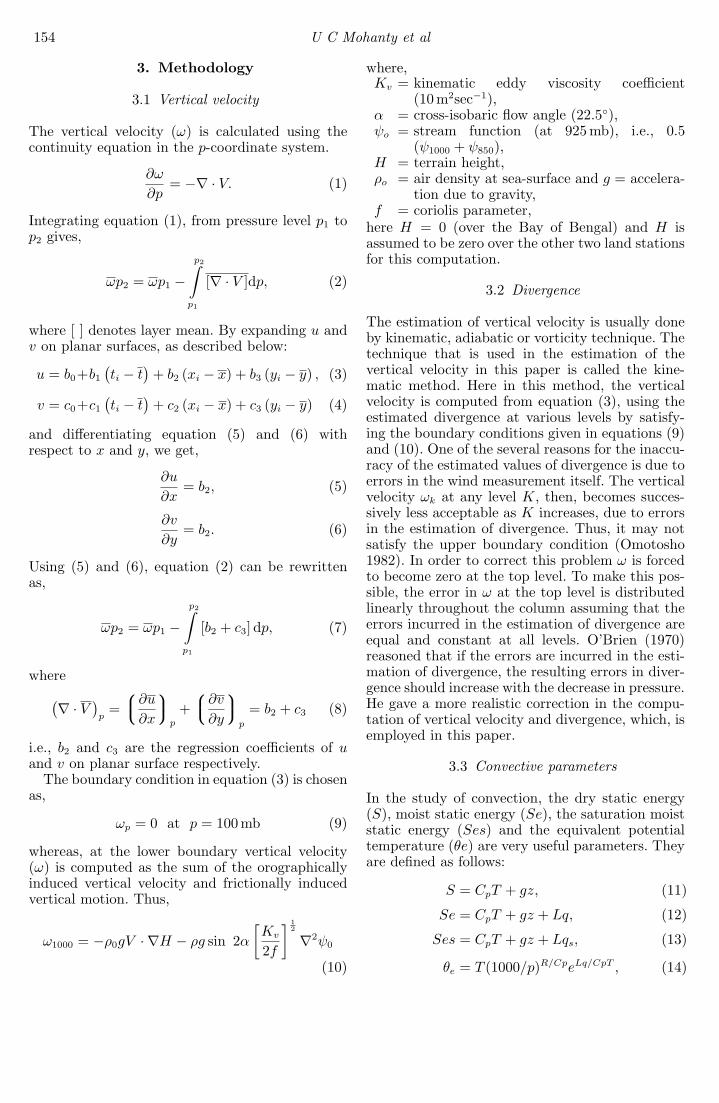
3. Methodology
3.1 Vertical velocity
The vertical velocity (ω) is calculated using thecontinuity equation in the p-coordinate system.
∂ω
∂p= −∇ · V. (1)
Integrating equation (1), from pressure level p1 top2 gives,
ωp2 = ωp1 −p2∫
p1
[∇ · V ]dp, (2)
where [ ] denotes layer mean. By expanding u andv on planar surfaces, as described below:
u = b0+b1(ti − t
)+ b2 (xi − x) + b3 (yi − y) , (3)
v = c0+c1(ti − t
)+ c2 (xi − x) + c3 (yi − y) (4)
and differentiating equation (5) and (6) withrespect to x and y, we get,
∂u
∂x= b2, (5)
∂v
∂y= b2. (6)
Using (5) and (6), equation (2) can be rewrittenas,
ωp2 = ωp1 −p2∫
p1
[b2 + c3] dp, (7)
where(∇ · V )
p=
∂u
∂x
p
+∂v
∂y
p
= b2 + c3 (8)
i.e., b2 and c3 are the regression coefficients of uand v on planar surface respectively.
The boundary condition in equation (3) is chosenas,
ωp = 0 at p = 100 mb (9)
whereas, at the lower boundary vertical velocity(ω) is computed as the sum of the orographicallyinduced vertical velocity and frictionally inducedvertical motion. Thus,
ω1000 = −ρ0gV · ∇H − ρg sin 2α[Kv
2f
] 12
∇2ψ0
(10)
where,Kv = kinematic eddy viscosity coefficient
(10 m2sec−1),α = cross-isobaric flow angle (22.5◦),ψo = stream function (at 925 mb), i.e., 0.5
(ψ1000 + ψ850),H = terrain height,ρo = air density at sea-surface and g = accelera-
tion due to gravity,f = coriolis parameter,
here H = 0 (over the Bay of Bengal) and H isassumed to be zero over the other two land stationsfor this computation.
3.2 Divergence
The estimation of vertical velocity is usually doneby kinematic, adiabatic or vorticity technique. Thetechnique that is used in the estimation of thevertical velocity in this paper is called the kine-matic method. Here in this method, the verticalvelocity is computed from equation (3), using theestimated divergence at various levels by satisfy-ing the boundary conditions given in equations (9)and (10). One of the several reasons for the inaccu-racy of the estimated values of divergence is due toerrors in the wind measurement itself. The verticalvelocity ωk at any level K, then, becomes succes-sively less acceptable as K increases, due to errorsin the estimation of divergence. Thus, it may notsatisfy the upper boundary condition (Omotosho1982). In order to correct this problem ω is forcedto become zero at the top level. To make this pos-sible, the error in ω at the top level is distributedlinearly throughout the column assuming that theerrors incurred in the estimation of divergence areequal and constant at all levels. O’Brien (1970)reasoned that if the errors are incurred in the esti-mation of divergence, the resulting errors in diver-gence should increase with the decrease in pressure.He gave a more realistic correction in the compu-tation of vertical velocity and divergence, which, isemployed in this paper.
3.3 Convective parameters
In the study of convection, the dry static energy(S), moist static energy (Se), the saturation moiststatic energy (Ses) and the equivalent potentialtemperature (θe) are very useful parameters. Theyare defined as follows:
S = CpT + gz, (11)
Se = CpT + gz + Lq, (12)
Ses = CpT + gz + Lqs, (13)
θe = T (1000/p)R/CpeLq/CpT , (14)
Structure of the convective atmosphere over Bay of Bengal during BOBMEX-99 155
where q is the specific humidity and qs is the sat-uration specific humidity. The moist static energyremains conserved during both dry and moistadiabatic processes. Observed estimates of thehorizontal and vertical advections of tempera-ture and moisture may be combined with theirobserved temperature and moisture tendencies toproduce residuals in the budgets of thermodynamicand moisture continuity equation, denoted by theapparent heat source (Q1) and moisture sink (Q2),which are defined as (Yanai et al 1973)
Q1 ≡ ∂S
∂t+ V · ∇S + ω
∂S
∂p, (15)
Q2 ≡ −L[∂q
∂t+ V · ∇q + ω
∂q
∂p
]. (16)
Here, Cp is the specific heat of air at constantpressure; V is the horizontal velocity, ∇ the hor-izontal gradient operator, ω the vertical velocity,p the pressure, L the latent heat of condensation.The over-bar denotes a large-scale horizontal aver-age. From Q1 and Q2, and estimates of surfacefluxes and the radiative heating rate (QR), the pre-cipitation from a vertical column and the verticaldistributions of warming and drying by cumulusclouds may be diagnosed assuming that the verti-cal eddy transports are primarily due to the clouds(e.g., Nitta 1972; Thompson et al 1979). QR is notincluded in this study as its contribution to thewarming/moistening is very less compared to theconvective component.
4. Results and discussion
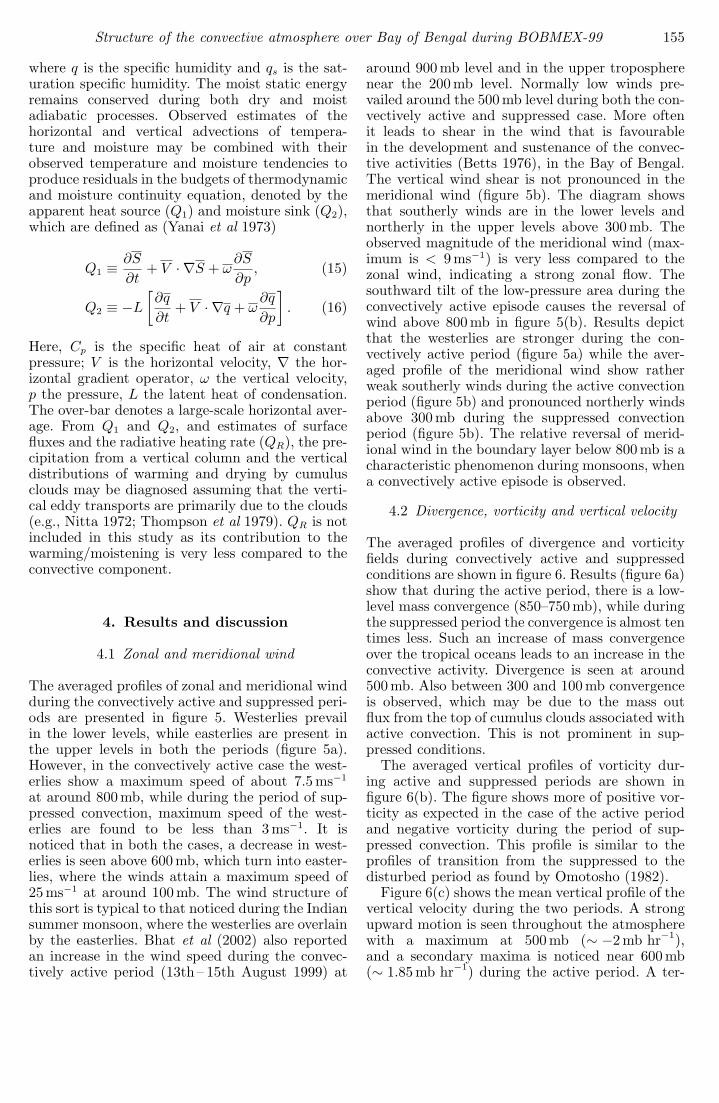
4.1 Zonal and meridional wind
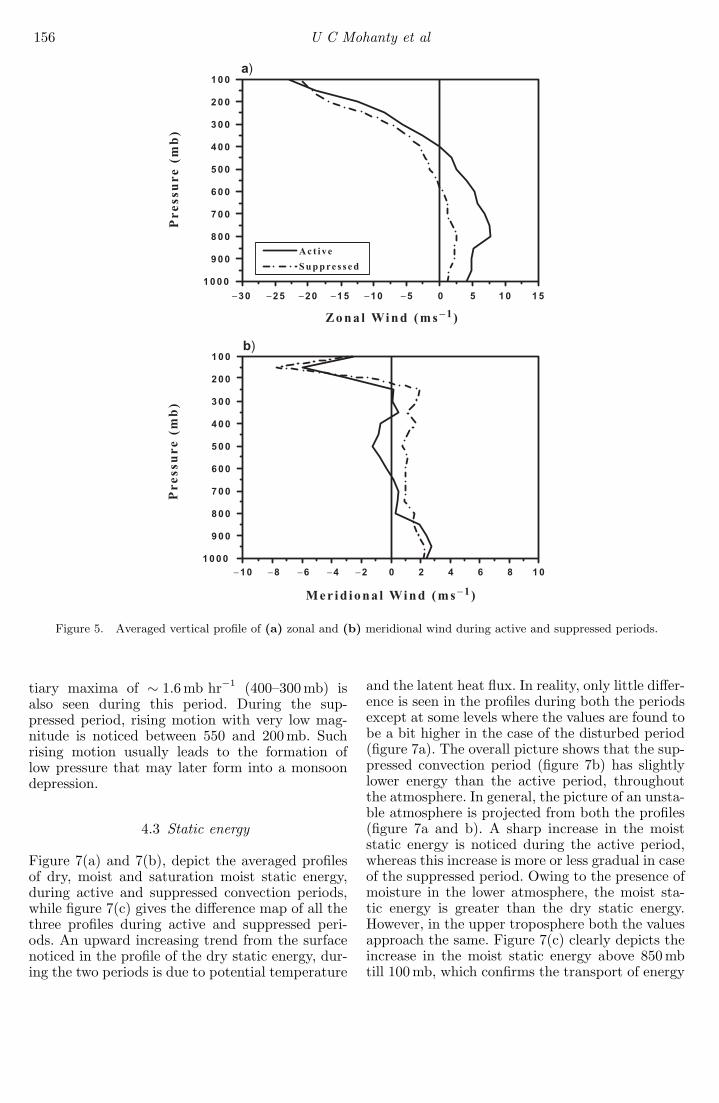
The averaged profiles of zonal and meridional windduring the convectively active and suppressed peri-ods are presented in figure 5. Westerlies prevailin the lower levels, while easterlies are present inthe upper levels in both the periods (figure 5a).However, in the convectively active case the west-erlies show a maximum speed of about 7.5 ms−1
at around 800 mb, while during the period of sup-pressed convection, maximum speed of the west-erlies are found to be less than 3 ms−1. It isnoticed that in both the cases, a decrease in west-erlies is seen above 600 mb, which turn into easter-lies, where the winds attain a maximum speed of25 ms−1 at around 100 mb. The wind structure ofthis sort is typical to that noticed during the Indiansummer monsoon, where the westerlies are overlainby the easterlies. Bhat et al (2002) also reportedan increase in the wind speed during the convec-tively active period (13th – 15th August 1999) at
around 900 mb level and in the upper tropospherenear the 200 mb level. Normally low winds pre-vailed around the 500 mb level during both the con-vectively active and suppressed case. More oftenit leads to shear in the wind that is favourablein the development and sustenance of the convec-tive activities (Betts 1976), in the Bay of Bengal.The vertical wind shear is not pronounced in themeridional wind (figure 5b). The diagram showsthat southerly winds are in the lower levels andnortherly in the upper levels above 300 mb. Theobserved magnitude of the meridional wind (max-imum is < 9 ms−1) is very less compared to thezonal wind, indicating a strong zonal flow. Thesouthward tilt of the low-pressure area during theconvectively active episode causes the reversal ofwind above 800 mb in figure 5(b). Results depictthat the westerlies are stronger during the con-vectively active period (figure 5a) while the aver-aged profile of the meridional wind show ratherweak southerly winds during the active convectionperiod (figure 5b) and pronounced northerly windsabove 300 mb during the suppressed convectionperiod (figure 5b). The relative reversal of merid-ional wind in the boundary layer below 800 mb is acharacteristic phenomenon during monsoons, whena convectively active episode is observed.
4.2 Divergence, vorticity and vertical velocity
The averaged profiles of divergence and vorticityfields during convectively active and suppressedconditions are shown in figure 6. Results (figure 6a)show that during the active period, there is a low-level mass convergence (850–750 mb), while duringthe suppressed period the convergence is almost tentimes less. Such an increase of mass convergenceover the tropical oceans leads to an increase in theconvective activity. Divergence is seen at around500 mb. Also between 300 and 100 mb convergenceis observed, which may be due to the mass outflux from the top of cumulus clouds associated withactive convection. This is not prominent in sup-pressed conditions.
The averaged vertical profiles of vorticity dur-ing active and suppressed periods are shown infigure 6(b). The figure shows more of positive vor-ticity as expected in the case of the active periodand negative vorticity during the period of sup-pressed convection. This profile is similar to theprofiles of transition from the suppressed to thedisturbed period as found by Omotosho (1982).
Figure 6(c) shows the mean vertical profile of thevertical velocity during the two periods. A strongupward motion is seen throughout the atmospherewith a maximum at 500 mb (∼ −2 mb hr−1),and a secondary maxima is noticed near 600 mb(∼ 1.85 mb hr−1) during the active period. A ter-
156 U C Mohanty et al
Figure 5. Averaged vertical profile of (a) zonal and (b) meridional wind during active and suppressed periods.
tiary maxima of ∼ 1.6 mb hr−1 (400–300 mb) isalso seen during this period. During the sup-pressed period, rising motion with very low mag-nitude is noticed between 550 and 200 mb. Suchrising motion usually leads to the formation oflow pressure that may later form into a monsoondepression.
4.3 Static energy
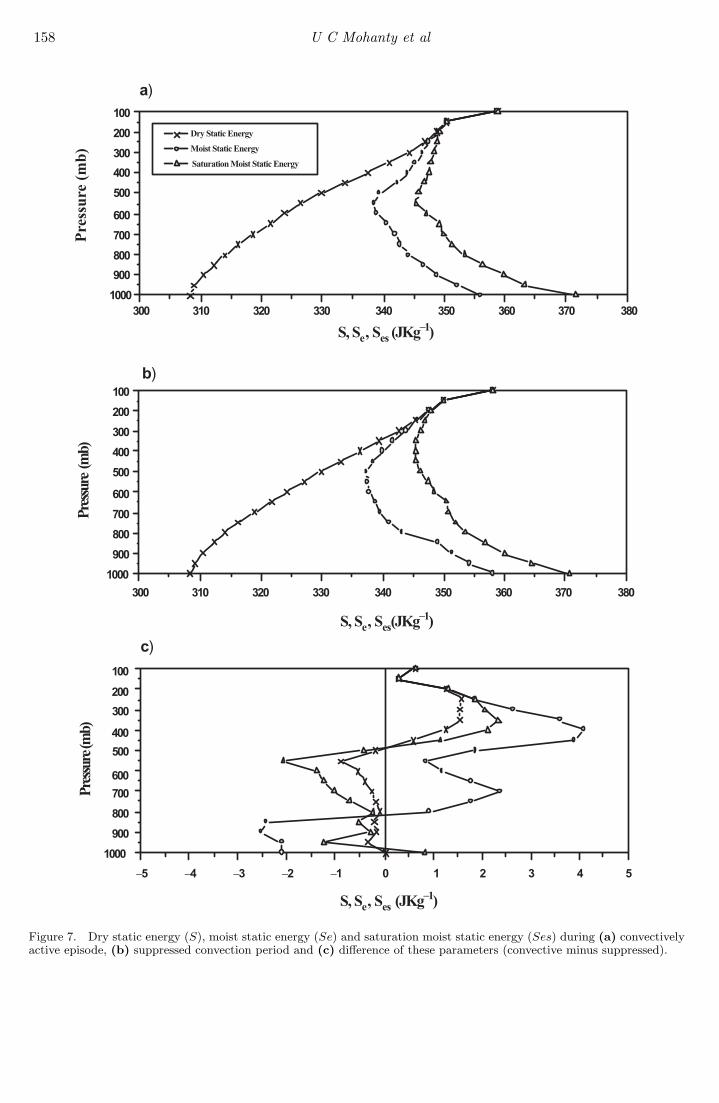
Figure 7(a) and 7(b), depict the averaged profilesof dry, moist and saturation moist static energy,during active and suppressed convection periods,while figure 7(c) gives the difference map of all thethree profiles during active and suppressed peri-ods. An upward increasing trend from the surfacenoticed in the profile of the dry static energy, dur-ing the two periods is due to potential temperature
and the latent heat flux. In reality, only little differ-ence is seen in the profiles during both the periodsexcept at some levels where the values are found tobe a bit higher in the case of the disturbed period(figure 7a). The overall picture shows that the sup-pressed convection period (figure 7b) has slightlylower energy than the active period, throughoutthe atmosphere. In general, the picture of an unsta-ble atmosphere is projected from both the profiles(figure 7a and b). A sharp increase in the moiststatic energy is noticed during the active period,whereas this increase is more or less gradual in caseof the suppressed period. Owing to the presence ofmoisture in the lower atmosphere, the moist sta-tic energy is greater than the dry static energy.However, in the upper troposphere both the valuesapproach the same. Figure 7(c) clearly depicts theincrease in the moist static energy above 850 mbtill 100 mb, which confirms the transport of energy

Structure of the convective atmosphere over Bay of Bengal during BOBMEX-99 157
Figure 6. Averaged vertical profiles of (a) divergence, (b) vorticity and (c) omega during active and suppressed periods.
during the convective process into the higher levels.Lesser energy in the lower levels during the con-vectively active episode is due to cooling after theoccurrence of rain.
4.4 Apparent heat source (Q1) andmoisture sink (Q2)
The daily variation and the 3-day averaged pro-files of Q1 and Q2 during both active and sup-
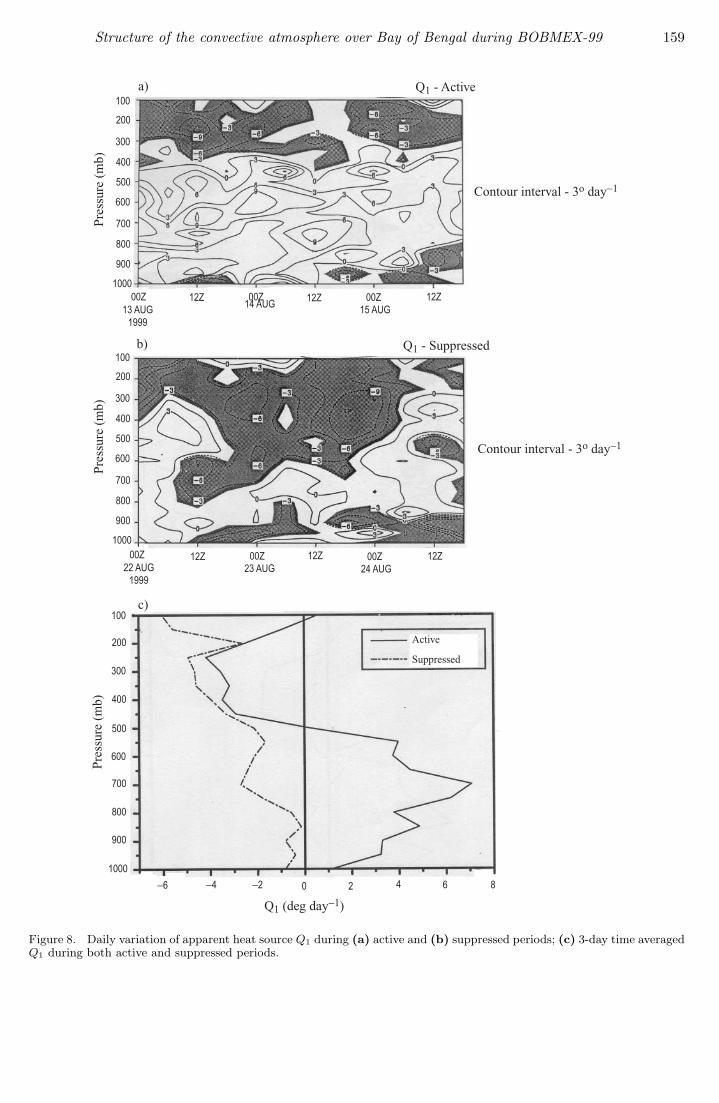
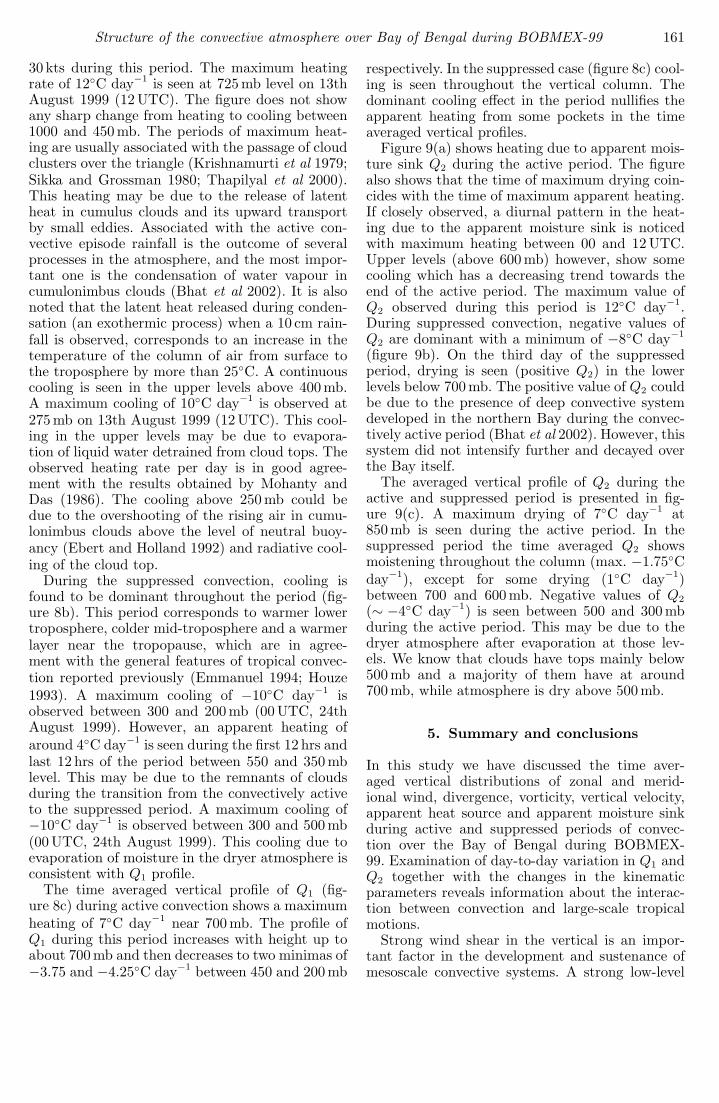
pressed periods of convection are respectively givenin figures 8 and 9. A continuous heating trend(between 1000 and 450 mb) is observed through-out the active period with pockets of maximalocated around 800–700 mb and 600–450 mb (fig-ure 8a). Some pockets of cooling are also seen inthe lower levels below 800 mb. This cooling maybe due to evaporation from the sea surface. Obser-vations indicate that SST was above 28◦C (Bhatet al 2001) and surface winds were of the order of
158 U C Mohanty et al
Figure 7. Dry static energy (S), moist static energy (Se) and saturation moist static energy (Ses) during (a) convectivelyactive episode, (b) suppressed convection period and (c) difference of these parameters (convective minus suppressed).
Structure of the convective atmosphere over Bay of Bengal during BOBMEX-99 159
Figure 8. Daily variation of apparent heat source Q1 during (a) active and (b) suppressed periods; (c) 3-day time averagedQ1 during both active and suppressed periods.
160 U C Mohanty et al
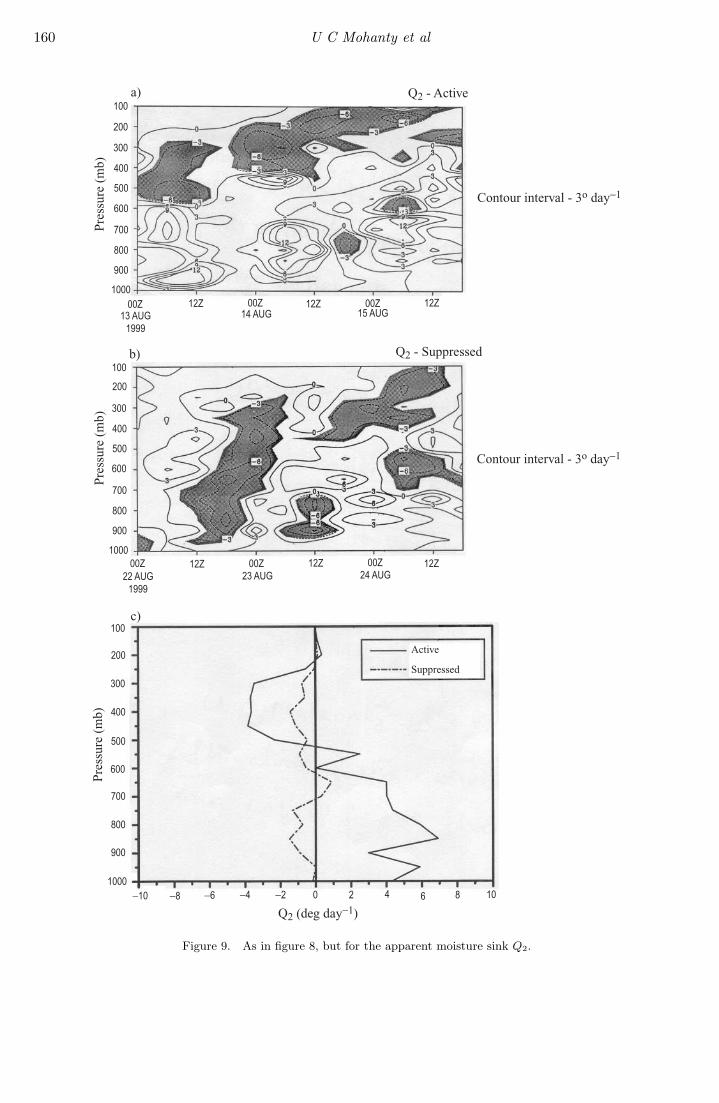
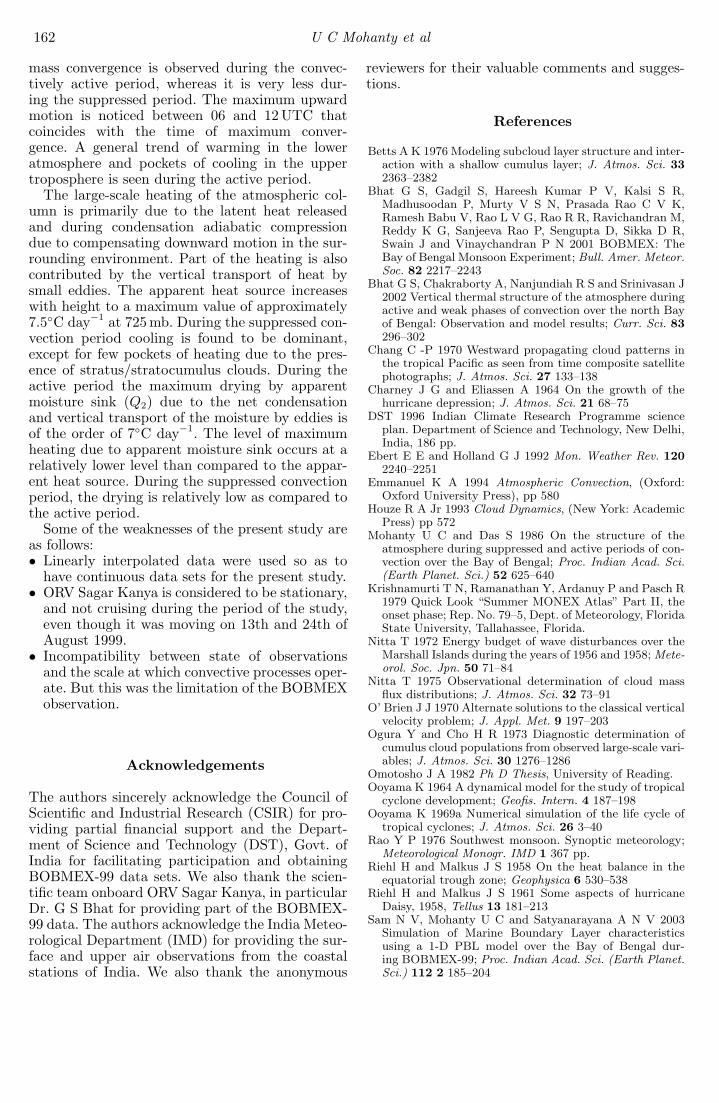
Figure 9. As in figure 8, but for the apparent moisture sink Q2.
Structure of the convective atmosphere over Bay of Bengal during BOBMEX-99 161
30 kts during this period. The maximum heatingrate of 12◦C day−1 is seen at 725 mb level on 13thAugust 1999 (12 UTC). The figure does not showany sharp change from heating to cooling between1000 and 450 mb. The periods of maximum heat-ing are usually associated with the passage of cloudclusters over the triangle (Krishnamurti et al 1979;Sikka and Grossman 1980; Thapilyal et al 2000).This heating may be due to the release of latentheat in cumulus clouds and its upward transportby small eddies. Associated with the active con-vective episode rainfall is the outcome of severalprocesses in the atmosphere, and the most impor-tant one is the condensation of water vapour incumulonimbus clouds (Bhat et al 2002). It is alsonoted that the latent heat released during conden-sation (an exothermic process) when a 10 cm rain-fall is observed, corresponds to an increase in thetemperature of the column of air from surface tothe troposphere by more than 25◦C. A continuouscooling is seen in the upper levels above 400 mb.A maximum cooling of 10◦C day−1 is observed at275 mb on 13th August 1999 (12 UTC). This cool-ing in the upper levels may be due to evapora-tion of liquid water detrained from cloud tops. Theobserved heating rate per day is in good agree-ment with the results obtained by Mohanty andDas (1986). The cooling above 250 mb could bedue to the overshooting of the rising air in cumu-lonimbus clouds above the level of neutral buoy-ancy (Ebert and Holland 1992) and radiative cool-ing of the cloud top.
During the suppressed convection, cooling isfound to be dominant throughout the period (fig-ure 8b). This period corresponds to warmer lowertroposphere, colder mid-troposphere and a warmerlayer near the tropopause, which are in agree-ment with the general features of tropical convec-tion reported previously (Emmanuel 1994; Houze1993). A maximum cooling of −10◦C day−1 isobserved between 300 and 200 mb (00 UTC, 24thAugust 1999). However, an apparent heating ofaround 4◦C day−1 is seen during the first 12 hrs andlast 12 hrs of the period between 550 and 350 mblevel. This may be due to the remnants of cloudsduring the transition from the convectively activeto the suppressed period. A maximum cooling of−10◦C day−1 is observed between 300 and 500 mb(00 UTC, 24th August 1999). This cooling due toevaporation of moisture in the dryer atmosphere isconsistent with Q1 profile.
The time averaged vertical profile of Q1 (fig-ure 8c) during active convection shows a maximumheating of 7◦C day−1 near 700 mb. The profile ofQ1 during this period increases with height up toabout 700 mb and then decreases to two minimas of−3.75 and −4.25◦C day−1 between 450 and 200 mb
respectively. In the suppressed case (figure 8c) cool-ing is seen throughout the vertical column. Thedominant cooling effect in the period nullifies theapparent heating from some pockets in the timeaveraged vertical profiles.
Figure 9(a) shows heating due to apparent mois-ture sink Q2 during the active period. The figurealso shows that the time of maximum drying coin-cides with the time of maximum apparent heating.If closely observed, a diurnal pattern in the heat-ing due to the apparent moisture sink is noticedwith maximum heating between 00 and 12 UTC.Upper levels (above 600 mb) however, show somecooling which has a decreasing trend towards theend of the active period. The maximum value ofQ2 observed during this period is 12◦C day−1.During suppressed convection, negative values ofQ2 are dominant with a minimum of −8◦C day−1
(figure 9b). On the third day of the suppressedperiod, drying is seen (positive Q2) in the lowerlevels below 700 mb. The positive value of Q2 couldbe due to the presence of deep convective systemdeveloped in the northern Bay during the convec-tively active period (Bhat et al 2002). However, thissystem did not intensify further and decayed overthe Bay itself.
The averaged vertical profile of Q2 during theactive and suppressed period is presented in fig-ure 9(c). A maximum drying of 7◦C day−1 at850 mb is seen during the active period. In thesuppressed period the time averaged Q2 showsmoistening throughout the column (max. −1.75◦Cday−1), except for some drying (1◦C day−1)between 700 and 600 mb. Negative values of Q2(∼ −4◦C day−1) is seen between 500 and 300 mbduring the active period. This may be due to thedryer atmosphere after evaporation at those lev-els. We know that clouds have tops mainly below500 mb and a majority of them have at around700 mb, while atmosphere is dry above 500 mb.
5. Summary and conclusions
In this study we have discussed the time aver-aged vertical distributions of zonal and merid-ional wind, divergence, vorticity, vertical velocity,apparent heat source and apparent moisture sinkduring active and suppressed periods of convec-tion over the Bay of Bengal during BOBMEX-99. Examination of day-to-day variation in Q1 andQ2 together with the changes in the kinematicparameters reveals information about the interac-tion between convection and large-scale tropicalmotions.
Strong wind shear in the vertical is an impor-tant factor in the development and sustenance ofmesoscale convective systems. A strong low-level
162 U C Mohanty et al
mass convergence is observed during the convec-tively active period, whereas it is very less dur-ing the suppressed period. The maximum upwardmotion is noticed between 06 and 12 UTC thatcoincides with the time of maximum conver-gence. A general trend of warming in the loweratmosphere and pockets of cooling in the uppertroposphere is seen during the active period.
The large-scale heating of the atmospheric col-umn is primarily due to the latent heat releasedand during condensation adiabatic compressiondue to compensating downward motion in the sur-rounding environment. Part of the heating is alsocontributed by the vertical transport of heat bysmall eddies. The apparent heat source increaseswith height to a maximum value of approximately7.5◦C day−1 at 725 mb. During the suppressed con-vection period cooling is found to be dominant,except for few pockets of heating due to the pres-ence of stratus/stratocumulus clouds. During theactive period the maximum drying by apparentmoisture sink (Q2) due to the net condensationand vertical transport of the moisture by eddies isof the order of 7◦C day−1. The level of maximumheating due to apparent moisture sink occurs at arelatively lower level than compared to the appar-ent heat source. During the suppressed convectionperiod, the drying is relatively low as compared tothe active period.
Some of the weaknesses of the present study areas follows:• Linearly interpolated data were used so as to
have continuous data sets for the present study.• ORV Sagar Kanya is considered to be stationary,
and not cruising during the period of the study,even though it was moving on 13th and 24th ofAugust 1999.
• Incompatibility between state of observationsand the scale at which convective processes oper-ate. But this was the limitation of the BOBMEXobservation.
Acknowledgements
The authors sincerely acknowledge the Council ofScientific and Industrial Research (CSIR) for pro-viding partial financial support and the Depart-ment of Science and Technology (DST), Govt. ofIndia for facilitating participation and obtainingBOBMEX-99 data sets. We also thank the scien-tific team onboard ORV Sagar Kanya, in particularDr. G S Bhat for providing part of the BOBMEX-99 data. The authors acknowledge the India Meteo-rological Department (IMD) for providing the sur-face and upper air observations from the coastalstations of India. We also thank the anonymous
reviewers for their valuable comments and sugges-tions.
References
Betts A K 1976 Modeling subcloud layer structure and inter-action with a shallow cumulus layer; J. Atmos. Sci. 332363–2382
Bhat G S, Gadgil S, Hareesh Kumar P V, Kalsi S R,Madhusoodan P, Murty V S N, Prasada Rao C V K,Ramesh Babu V, Rao L V G, Rao R R, Ravichandran M,Reddy K G, Sanjeeva Rao P, Sengupta D, Sikka D R,Swain J and Vinaychandran P N 2001 BOBMEX: TheBay of Bengal Monsoon Experiment; Bull. Amer. Meteor.Soc. 82 2217–2243
Bhat G S, Chakraborty A, Nanjundiah R S and Srinivasan J2002 Vertical thermal structure of the atmosphere duringactive and weak phases of convection over the north Bayof Bengal: Observation and model results; Curr. Sci. 83296–302
Chang C -P 1970 Westward propagating cloud patterns inthe tropical Pacific as seen from time composite satellitephotographs; J. Atmos. Sci. 27 133–138
Charney J G and Eliassen A 1964 On the growth of thehurricane depression; J. Atmos. Sci. 21 68–75
DST 1996 Indian Climate Research Programme scienceplan. Department of Science and Technology, New Delhi,India, 186 pp.
Ebert E E and Holland G J 1992 Mon. Weather Rev. 1202240–2251
Emmanuel K A 1994 Atmospheric Convection, (Oxford:Oxford University Press), pp 580
Houze R A Jr 1993 Cloud Dynamics, (New York: AcademicPress) pp 572
Mohanty U C and Das S 1986 On the structure of theatmosphere during suppressed and active periods of con-vection over the Bay of Bengal; Proc. Indian Acad. Sci.(Earth Planet. Sci.) 52 625–640
Krishnamurti T N, Ramanathan Y, Ardanuy P and Pasch R1979 Quick Look “Summer MONEX Atlas” Part II, theonset phase; Rep. No. 79–5, Dept. of Meteorology, FloridaState University, Tallahassee, Florida.
Nitta T 1972 Energy budget of wave disturbances over theMarshall Islands during the years of 1956 and 1958; Mete-orol. Soc. Jpn. 50 71–84
Nitta T 1975 Observational determination of cloud massflux distributions; J. Atmos. Sci. 32 73–91
O’ Brien J J 1970 Alternate solutions to the classical verticalvelocity problem; J. Appl. Met. 9 197–203
Ogura Y and Cho H R 1973 Diagnostic determination ofcumulus cloud populations from observed large-scale vari-ables; J. Atmos. Sci. 30 1276–1286
Omotosho J A 1982 Ph D Thesis, University of Reading.Ooyama K 1964 A dynamical model for the study of tropical
cyclone development; Geofis. Intern. 4 187–198Ooyama K 1969a Numerical simulation of the life cycle of
tropical cyclones; J. Atmos. Sci. 26 3–40Rao Y P 1976 Southwest monsoon. Synoptic meteorology;
Meteorological Monogr. IMD 1 367 pp.Riehl H and Malkus J S 1958 On the heat balance in the
equatorial trough zone; Geophysica 6 530–538Riehl H and Malkus J S 1961 Some aspects of hurricane
Daisy, 1958, Tellus 13 181–213Sam N V, Mohanty U C and Satyanarayana A N V 2003
Simulation of Marine Boundary Layer characteristicsusing a 1-D PBL model over the Bay of Bengal dur-ing BOBMEX-99; Proc. Indian Acad. Sci. (Earth Planet.Sci.) 112 2 185–204

Structure of the convective atmosphere over Bay of Bengal during BOBMEX-99 163
Sikka D R and Grossman B 1980 Summer MONEX chrono-logical weather summary, International MONEX Man-agement Centre, New Delhi.
Thapliyal V, Desai D S and Krishnan V 2000 Weather inIndia, monsoon season (June–September 1999); Mausam51 285–318
Thompson R M Jr, Payne S W, Recker E E andReed R J 1979 Structures and properties of synoptic-scale wave disturbances in the inter-tropical conver-
gence zone of the eastern Atlantic; J. Atmos. Sci. 3653–72
Yanai M 1961a A detailed analysis of typhoon formation, J.Meteorol. Soc. Jpn. 39 187–214
Yanai M 1961b Dynamical aspects of typhoon formation; J.Meteorol. Soc. Jpn. 39 283–309
Yanai M, Esbensen S and Chu J 1973 Determination of bulkproperties of tropical cloud clusters from large-scale heatand moisture budgets; J. Atmos. Sci. 30 611–627