a study on the performance of co-operative silk producers in ...
287
A STUDY ON THE PERFORMANCE OF CO-OPERATIVE SILK PRODUCERS IN KUMBAKONAM TALUK OF TAMIL NADU Thesis submitted to the Bharathidasan University for The award of the degree of DOCTOR OF PHILOSOPHY IN COMMERCE By T. SENTHIL RAJESWARI Under the guidance of Dr.M.SELVACHANDRA, M.Com., M.B.A., M.Phil., PGDCA., Ph.D., Associate Professor and Head, Post-graduate and Research Department of Commerce A.D.M. College for Woman (Autonomous) Nagapattinam - 611 001. BHARATHIDASAN UNIVERSITY TIRUCHIRAPPALLI-620 024 DECEMBER-2013
-
Upload
khangminh22 -
Category
Documents
-
view
0 -
download
0
Transcript of a study on the performance of co-operative silk producers in ...

A STUDY ON THE PERFORMANCE OF CO-OPERATIVE SILK
PRODUCERS IN KUMBAKONAM TALUK OF TAMIL NADU
Thesis submitted to the Bharathidasan University for
The award of the degree of
DOCTOR OF PHILOSOPHY IN COMMERCE
By
T. SENTHIL RAJESWARI
Under the guidance of
Dr.M.SELVACHANDRA, M.Com., M.B.A., M.Phil., PGDCA., Ph.D.,
Associate Professor and Head,
Post-graduate and Research Department of Commerce
A.D.M. College for Woman (Autonomous)
Nagapattinam - 611 001.
BHARATHIDASAN UNIVERSITY
TIRUCHIRAPPALLI-620 024
DECEMBER-2013
Dr. M. SELVACHANDRA, M.Com., M.B.A., M.Phil., PGDCA., Ph.D.,
Associate Professor., HOD and Research Advisor in Commerce,
A.D.M. College for Woman (Autonomous),
Nagapattinam-611 001, Tamilnadu, India
Email: [email protected]
Mobil: +91 98426 39030
Date:
CERTIFICATE
This is to certify that the dissertation entitled “A STUDY ON THE
PERFORMANCE OF CO-OPERATIVE SILK PRODUCERS IN
KUMBAKONAM TALUK OF TAMIL NADU” submitted to Bharathidasan
University, Tiruchirappalli in partial fulfillment of the requirement for the award of
the degree of Doctor of Philosophy in Commerce is a record of original research
work carried out by Mr. T. Senthil Rajeswari, under my supervision and guidance and
the thesis has not formed the basis for the award of any Degree / Diploma /
Associateship / Fellowship or similar title to any candidate of any university.
(M. SELVACHANDRA)

DECLARATION
I hereby declare that the thesis entitled “A STUDY ON THE
PERFORMANCE OF CO-OPERATIVE SILK PRODUCERS IN
KUMBAKONAM TALUK OF TAMIL NADU submitted to Bharathidasan
University, Tiruchirappalli in partial fulfillment of the requirement for the award of
the degree of Doctor of philosophy in Commerce is a record of original research
work done by me under the supervision and guidance of
Dr. M. SELVACHANDRA, M.Com., M.B.A., M.Phil., PGDCA., Ph.D., Associate
professor and Head of the Department, Post-graduate and Research Department of
Commerce, A.D.M. College for woman (Autonomous), Nagapattinam 611 001,
Tamilnadu and that the thesis has not formed the basis for the award of any Degree /
Diploma / Associateship / Fellowship or other similar title.
Signature of the candidate
(T. SENTHIL RAJESWARI)

ACKNOWLEDGEMENT
At the outset let me prostrate and express my heartfelt gratitude to the
LORD MURUGA who motivated and stood by my side to accomplish this noble
task.
I express my deep sense of gratitude to my guide and supervisor,
Dr. SELVACHANDRA, Head, Department of commerce and Associate professor
in commerce, A.D.M. College for Woman (Autonomous), Nagapattinam. Whose
constant and valuable guidance made the study possible in spite of her extremely
busy academic pursuits; she always spared time for me. In fact, she has created in
me a life-long impression by this unstinted kindness, affectionate guidance, critical
comment, valuable suggestions, advice and noble generosity. But for this support
and encouragement, the present work would not have seen in the light of the day.
My sincere thanks are due to Dr. S. MYHILI, M.com., M.Phil,. Ph.D.,
Principal, A.D.M. College for Woman ( Autonomous), Nagapattinam, and other
faculty members of the Department of commerce, A.D.M. College for Woman
(autonomous), Nagapattinam.
I am grateful to Dr. S. MUTHUKUMAR, M.com., M.phil., Ph.D.,
Reader and Hod of commerce, AVC College (Autonomous) Mayiladuthurai, for his
association with the Doctoral committee and also for his valuable advice at different
stage of the entire study.

My sense of gratitude to Dr. S.P.DHANDAYUTHAPANI, faculty of
Management studies, Anna University of technology, Trichy, Dr. A. MOHAMED
SIDDIK, Principal, RDB COLLEGE OF Arts & Science, Papanasam for their
initiation and continuous support .
It is the time to express my sincere thanks to DR.M.MOHAMED
SADIQ, Principal, Adhi parasakthi College of Arts and Science, Kalavai District.
Dr. G. ARULSELVAN,Vice Principal, Adhiparaskthi college G.B.
Nagar kalavai.for their continuous support for the completion of this study.
It is my duty to thank, M. UMA MAGESWARI, Assistant Professor of
Management, T. RAMESH, Asst. Professor of Management studies
V. CHANDRALEKHA, Asst. Professor of Management studies Adhiparasakthi
college of Engineering, Kalavai. Asst. Professor S.LAKSHMI, HOD of Dept of
Commerce, A. SATHIYA , Asst. Professor , R. SATHIYA MURTHY, Asst.
Professor, A.UDAYA KUMAR, Asst. Professor, Department of Commerce ,and
Asst.Professor U. KANNAGAVALLI., Adhiparasakthi College, Kalavai.for their
contribution to complete of this study in time.
I am very grateful to my beloved Husband MR. S.SINGARAVELU, my
children S. SWAMINATHAN and S.SWEATHA to help me in every walk of my
life.
I convey my heartfelt thanks to my beloved aunty
Mrs. SANGARANAYAHI SWAMINATHAN and my beloved mother

MRS.SEETHALAKSHMI THANGAM for their regular support and
encouragement of my achievement.
I indebted my heart full thanks to my uncle Mr. S.SELLAPPAN,
Agriculture officer, Mr. S.SIVA GURUNATHAN , Mr. S. THANGAVELU, and
S. BALAMURUGAN to their fullest support to the completion of project work.
I extend my thanks to my brother Mr. T. KRISHNA MOHAN, Sisters
E. KUMARA DEVI , K. SINGARAVALLI ,G.ANITHAELAVARASI for their
motivation to complete this project work.
(T. SENTHIL RAJESWARI )
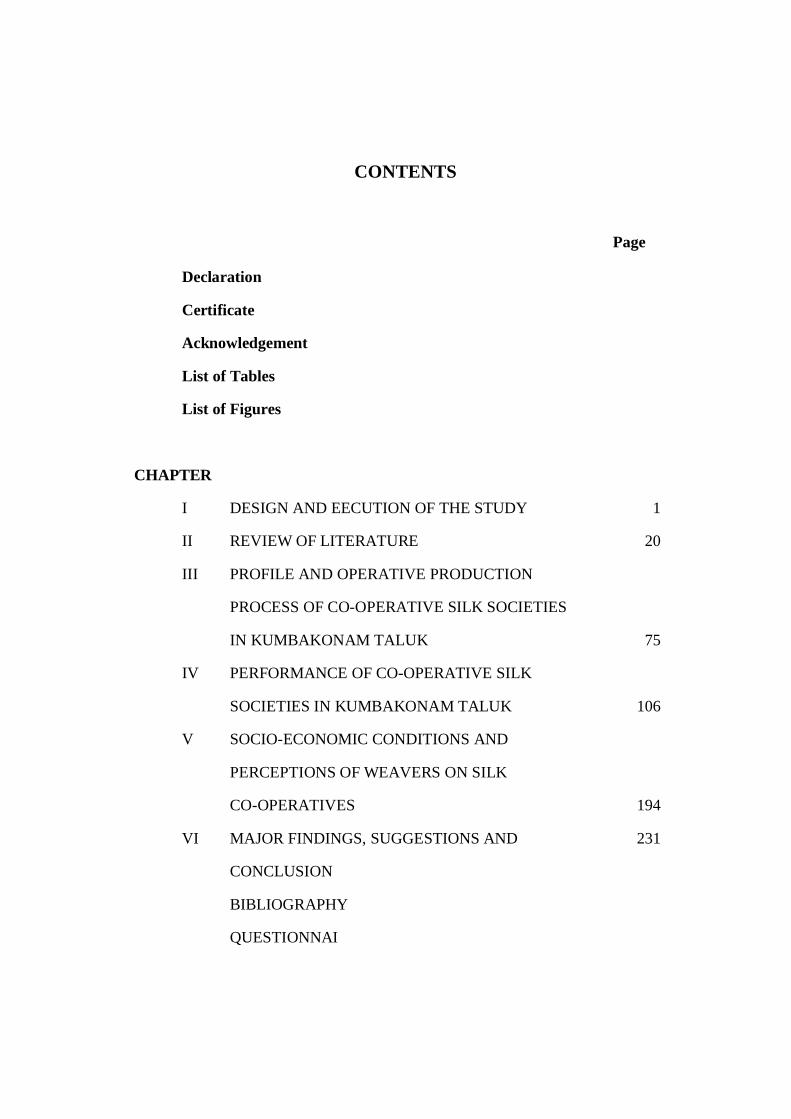
CONTENTS
Page
Declaration
Certificate
Acknowledgement
List of Tables
List of Figures
CHAPTER
I DESIGN AND EECUTION OF THE STUDY 1
II REVIEW OF LITERATURE 20
III PROFILE AND OPERATIVE PRODUCTION
PROCESS OF CO-OPERATIVE SILK SOCIETIES
IN KUMBAKONAM TALUK 75
IV PERFORMANCE OF CO-OPERATIVE SILK
SOCIETIES IN KUMBAKONAM TALUK 106
V SOCIO-ECONOMIC CONDITIONS AND
PERCEPTIONS OF WEAVERS ON SILK
CO-OPERATIVES 194
VI MAJOR FINDINGS, SUGGESTIONS AND 231
CONCLUSION
BIBLIOGRAPHY
QUESTIONNAI

LIST OF TABLES
S. No Title Of The Table Page. No
III. 1 Various Types Of Dyes 93
III. 2 Classification Of Natural Dyes 95
III.3 Sources Of Natural Dyes 97
IV.1 Number Of Members And Looms 107
IV.2 Sources Of Capital Of Thirubuvanam Co-Operative Silk Society 108
IV.3 Sales Of Thirubuvanam Co-Operative Silk Society 110
IV.4 Purchase Of Material Of Thirubuvanam Co-Operative Silk
Society
112
IV.5 Operational Expenditure Of Thirubuvanam Co-Operative Silk
Society
114
IV .6 Marketing Expenditure Incurred By Thirubuvanam Co-
Operative Silk Society
116
IV.7 Source Of Loan Of Thirubuvanam Co-Operative Silk Society 118
IV.8 Sources Of Capital Of Cholan Co-Operative Silk Society 120
IV.9 Sales Of Cholan Co-Operative Silk Society 122
IV.10 Cost of Raw Material Of Cholan Co-Operative Silk Society 124
IV.11 Operational expenditure of cholan co-operative silk society 126
IV.12 Marketing expenditure incurred by Cholan co-operative silk
society
128
IV.13 Outstanding loans of Cholan co-operative silk society 130
IV.14 Sources of capital of Dharasuram co-operative silk society 131
IV.15 Sales of Dharasuram co-operative silk society 133
IV.16 Dharasuram co-operative purchase of raw materials 135

S. No Title Of The Table Page. No
IV.17 Operational expenditure of Dharasuram co-operative silk society 136
IV.18 Marketing expenditure incurred by Dharasuram
co-operative silk society
139
IV.18-A Outstanding loans of Dharasuram co-operativsilk society 142
IV.19 Sources of capital of Thiruvalluvar co-operativ silk society 143
IV.20 Sales of Thiruvalluvar co-operative silk society 144
IV.21 Thiruvalluvar Co-operative Purchase of Raw Materials 147
IV.22 Operational expenditure of Thiruvalluvar co-operative silk
society
149
IV.23 Marketing expenditure incurred by Thiruvalluvar co-operative
silk society
151
IV.24 Outstanding of Thiruvalluvar co-operative silk society 153
IV.25 Sources of capital of Kalaivanar co-operative silk society 155
IV.26 Sales of kalaivanar co-operative silk society 157
IV.27 Kalaivanar co-operative purchase of raw materials 159
IV.28 Operational expenditure of Kalaivan co-operative silk society 161
IV.29 Marketing expenditure incurred by Kalaivanar
co-operative silk society
163
IV.30 Outstanding loans of kalaivanar co-operative silk society 165
IV.31 Sources of capital of super silk co-operative silk society 166
IV.32 Sales of super co-operative silk society 168
IV.33 Super silks co-operative purchase of raw materials 170
IV.34 Operational expenditure of super co-operative silk society 172
IV.35 Marketing expenditure incurred by super co-operative silk
society
174

S. No Title Of The Table Page. No
IV.36 Outstanding loans of super silk co-operative silk society 176
IV.37 Sources of capital of kamarajar co-operative silk society 177
IV.38 Sales of kamarajar co-operative silk society 179
IV.39 Kamarajar co-operative purchase of raw materials 181
IV.40 Operational expenditure of kamarajar co-operative silk society 183
IV.41 Marketing expenditure incurred by kamarajar co-operative silk
society
184
IV.42 Outstanding loans of kamarajar co-operative silk society 186
IV.43 Comparative profitability analysis of seven silk co-operative
societies in kumbakonam taluk gross profit
188
IV.44 Net profit 190
IV.45 Return on Investment of Thirubuvanam Co-Oprative Silk
Socities
192

LIST OF FIGURES
S. No Title Of The Figure Page.No
III.1 Zari plate 88
III.2 Bobbin winding 90
III.3 Warping (silk) 90
III.4 Dyeing of silk yarns 92
III.5 Shade drying of dyed silk yarns 98
III.6 Swift winding 100
III.7 Pirn winding of silk yarn 100
III.8 Saree weaving with throw – shuttle 102
III.9 Mounting of saree on beam for finishing 104
III.10 Polishing process 105
IV.1 Sources Of Capital Of Thirubuvanam Co-Operative Silk
Society
109
IV.2 Sales Of Thirubuvanam Co-Operative Silk Society 111

BIBLIOGRAPHY
1. A.C.K. Nambiar (1996): ‘Handloom Industry in India’-APH Publishing
Corporation, New Delhi.
2. A.K. Mishra: ‘Social Impact of Handloom Co-operatives on Weavers in
Western Orissa – An Empirical Study’ Journal of Rural Development, Vol.
13(2), 1994, pp. 259-267.
3. Agrawal, Y., 1999, Silk Brocades. Lustre Press, Roli Books, New Delhi.
4. Amrita Singh Shailaja.D.Naik, “Status of Banaras weavers: A profile”
Karnataka J. Agric. Sci., 22(2) :(408-411) 2009
5. Alin Borah Bortamuly and Kishor Goswami “FACTORS INFLUENCING
WAGE STRUCTURE OF HANDLOOM WORKERS IN ASSAM” Journal of
Rural Development, Vol. 31, No. (2) pp. 139 – 150 April-june. 2012
6. Anuual Report of Silk Board 2011-12, Centarl silk Board, Banglore.
7. Aswini Kumar Mishra(1994) “Social Impact of Handloom Co-operatives
on Weavers in Western Orissa: An Empirical Study”, Journal of
Rural Development, Vol.13, No.2, April-June 1994, Pp. 259-267.
8. Arterburn, J. Yvonne (1982) The Loom of Interdependence: Silk Weaving
Co-operative in Kanchipuram. New Delhi: Hindustan Publishing
Corporation.
9. B. Bowonder, J.V. Sailesh “ICT for the renewal of a traditional industry: a
case study of Kancheepuram silk sarees” Volume 6, Number 3-5/2005
10. Bandana Mahan “Silk Industry among the Tai-Ahom of Assam, India as an
Attraction of Tourist”International Journal of Scientific and Research
Publications, Volume 2, Issue 12, December 2012.
11. Bhuimali Anil (2003), “Rural Co-operative and Economic Development”,
Sarup and Sons Pub., New Delhi, 2003
12. Bhagat, S.S., 1998, Silk products of Madhya Pradesh. Indian Silk, 37 (6-7):
84-86.

13. Bherathan “Cotton handloom industry in Tamil Nadu”, Working paper,
Madras Institute of Development studies Madras, June 1983, p.4.
14. BabuP.Ramesh, “Organizational Structure, Labour Relations and
Employment in Kancheepuram Silk Weaving”, NLI Research Studies Series
No. 021/2001, V.V. Giri National Labour Institute, Noida,2001
15. B. Subburaj, “A change in Approach for Sustainable Employment by
Handloom co-operatives”, The Tamil Nadu journal of Co-operation, Vol.80,
No.12, March 1995,p.29.
16. Chakraborty, J.N., Gupta, R., Rani, V. and Das, M., 2005, Chemical
processing of silk. The Indian Tex. J., 116(3): 39-51.
17. Chalam G. V. (2001) “Problems and Prospects of Handloom Industry in
Co- operative Sector A Study of Handloom Weavers Co-operative
Societies in Krishna District”, Indian Co-operative Review, Vol.
XXXVIII, No. 3, January 2001, Pp. 137- 142 .
18. Das Banshree, Dr. Palai N.K., and Dr. Das Kumar (2006), “Problems and
Prospects of the Co-operative Movement in India under the Globalization
Regime”, XIV International Economic History Congress, Helsinki 2006,
Session 72.
19. Dash S. (1995): ‘Handloom Industry in India’. Mittal Publications, New
Delhi.
20. Dharmaraju P. “Marketing in Handloom Cooperatives” Economic and
Political Weekly, Vol. 41, No. 31 Aug. .2006 P.3385-3387
21. Dubhashi P.R. (1969), “Co-operation: An Interdisciplinary Approach”,
Edited by P.R.Dubhashi, Director, Pub. by VaikunthMehata National
Institute of Co-operative and Management (VMNICOM), Pune, 1969
22. Ghosh, T.K., 1984, Bengal handloom industry. Tex. Trends, 26: 41-47
23. Gopinath, WAGES, WORKING CONDITIONS AND SOCIO-
ECONOMIC MOBILITY OF SPINNERS AND WEAVERS IN THE
UNORGANISED KHADI INDUSTRY: FINDINGS FROM A SURVEY IN
INDIA,The Indian Journal of Labour Economics, Vol. 53, No. 2, 2010.

24. Gill Anita (2004), “Interlinked Agrarian Credit Markets: Case Study of
Panjab”, Economic and Political Weekly, August 14, 2004. Vol., No., P.
3741-3751.
25. Goel B.B. (2006), “Co-operative Legislation- Trends and Dimensions”, Deep
& Deep Publications Pvt. Ltd., New Delhi, 2006. 47
26. Gundeti Ramesh (2009) “Some Issues of Handloom Weavers A Study in
Karimnagar District of Andhra Pradesh”, Kurukshetra, Vol. 57, No. 8,
June 2009, Pp. 33-37.
27. Hazari R.K.: ‘Mills, Powerlooms, Handlooms’. Economic and Political
Weekly, 6(47), 1954, p. 1303.
28. I.M. Desai, “Living with Indian Handlooms”, Journal of Industry and trade,
Vol. XXVIII, No. 9&10,September & October 1978. p.13-15.
29. Jan. L.C, “Handlooms face liquidation”, Economic and Political weekly,
Vol.18, No.35, August 1983, P.1521-1522
30. Jacob, M., 1996, Grandeur of Kancheepuram. The Indian Tex. J., 106(1):
52-55.
31. Jyothi and Aruna, .Problems and Prospects of Handloom Industry.,Indian
Journal of Commerce, Vol. 59, No.1, January-March 2006, Pp.87.95.
32. Kamat G.S.: ‘Handloom Industry: Pampering Ego of Consumer’. Industrial
Times, 20(13), 19th June 1976.
33. KanakalathaMukund and Syamasundari. B., .Doomed to Fail?.Handloom
Weavers. Co-operatives in Andhra Pradesh., Economic and Political Weekly,
Vol. XXXIII, No.52, Dec.26, 1998-Jan.1, 1999, Pp. 3323.3332.
34. Kuldeep Singh and Monica Bansal “AN ANALYTICAL STUDY OF
HANDLOOM INDUSTRY IN INDIA” Volume 1, Issue 12 (December
2012)
35. K. V. Rao& Naga Raju G, .Working of Handloom Industry in Andhra
Pradesh., Indian Co-operative Review, Vol. 46, No. 1, July 2008,
Pp. 1.21.
36. Lakshmi Narsaiah (2004): ‘Economics of Handloom Industry’. Sonali
Publications, New Delhi.

37. Mathur, A.R., 2002, Woven wonder: The tradition of Indian textiles, Rupa
and Co., New Delhi.
38. Mahapatro P. C (1996) “Economics of Cotton Handloom Industry in
India”, Ashish Publishing House, New Delhi, 1996.
39. Maurya, S.D. “Women in India” Chugh publications, Allahabad 1988. p.2.
40. Mamatha, A., 1997, Socio-economic status of handloom weavers and impact
of weaving on their livelihood. M.H.Sc. Thesis, Univ. Agric. Sci., Dharwad.
41. MeherRajkishor: ‘The Handloom Industry and the Socio-economic
Conditions of Weavers in Orissa’. Journal of Rural Development, 14(3),
1995, p. 301.
42. MahendraDev, S. Galab, P. Prudhuikar Reddy and Soumya Vinayan,.
Economics of Handloom Weaving; A Field Study in Andhra Pradesh.,
Economic and Political Weekly, Vol. XLIII, No. 21, May 2008, Pp. 43.51.
43. Mishra, S.N., 1997, Silk industry of Assam. Indian Silk, 35(10): 22-26
44. Murlidharan, B. and Shanmugasundharan, M., 1999, A study on redox
system assisted dyeing of silk with kemacid yellow-2G. The Tex. Ind. Trade
J., 37(3-4): 107-109.
45. Munikrishnappa, H.M., Madhavarao, Y.R. and Mallikarjuna, B.M., 1996,
Silk fabric marketing.The Indian Tex. J., 106(10): 48-49.
46. Muley S.S. (2007), “Role of Co-operative Banks in Rural Credit”, Co-
operative Perspective, Journal of Co-operative Management, Vaikunth
Mehta National Institute of Co-operative Management, Pune, Vol.42, No.01,
April-September, 2007.
47. NagenC.Das, “Development of Handloom Industry”, Deep and Deep
Publications, New Delhi, 1986,p.40-61.
48. Narasingha Behera, .Economic Impact of Weavers. Co-operatives on
Member. Weavers in Bargarh District, Orissa., Journal of Rural
Development, Vol. 28, No. 2, April-June 2009, Pp. 159.168.
49. Noorbasha Abdul, “Handlooms in Distress” Economic and Political weekly,
Vol.XXXI,No.23, June,1996,p.1384-1386

50. Nadigar, G.S., Shmbhulingappa, H.H. and Krishnamurthy, B.T., 1995,
Marvelous Kancheepuramsarees. Indian Silk, 35(8): 19-22.
51. Prabhakara Sarma & Joglekar P.V.N., .Upgradation of Handloom
Cooperatives., Indian Co-operative Review, Vol. XXXIX, No: 3, January
2002, Pp. 234.243.
52. Prabha and Kumara Kannan “An empirical study on Retail branding and
brand extension strategies in the Chennai Silks,Tamil Nadu” IJEMR –
December 2011-Vol 1 Issue 7 - Online - ISSN 2249 – 2585 - Print - ISSN
2249 – 8672.
53. Prem Kumar and M. Sadika Sultana “STRATEGIES TO IMPROVE SALES
OF HANDLOOM PRODUCTS WITH SPECIAL REFERENCE TO
PONDICHERRY” TECNIA Journal of Management Studies, Vol. 4, No. 2,
October 2009 – March 2010
54. Pathak, S., Sambhulingappa, Nagabhushanaiah, Y.N. and Nadigar G.S.,
1993, Varanasi silk industry - A survey. Indian Silk, 31(12): 6-10.
55. PagarSudhakar K. (2007), “Impact of Sugar Co-operative Industry on Rural
Development”, ChandralokPrakashan, Kanpur, 2007.
56. Rama, Mohan Rao (1990): ‘Development of Handloom Industry’. Discovery
Publishing House, New Delhi.
57. R.K. Meher: ‘The Handloom Industry and the Socio-Economic Conditions
of Weavers in Orissa’. Journal of Rural Development, Vol. 14(3), 1995,
pp. 301-322.
58. Rama MohanaRao. K., .Impact of Handloom Co-operatives on the Socio-
Economic Conditions of Weavers in Visakhapatnam District., Indian
Co-operative Review, Vol. XXXV, No.2, October 1997, Pp. 126.132.
59. Ramalingam, .Socio-Economic Status of Handloom Weavers.,Kisan World,
Vol. 38, No.1, 2010, Pp. 29.31.
60. Rama Mohan Rao K. &Subrahmanyam G, .Crisis in the Handloom Industry:
Some Solutions., Kurukshetra, Vol. XLIII, No.12, September 1995,
Pp. 36.38.
61. Rajini: ‘An Overview of the Indian Textile Industry’. Readers Shelf,
December 2008, Vol. 5(2-3), pp. 20-24.

62. Raja Gopalan.V. “The Handloom Industry in North and South Kerala: A
study of production and Marketing structure” Centre for Development
Studies, 1990.
63. Ramesh M. Bhatt, “Women should be Equal Partners in Handloom Sector”,
Yojana, Vol.27, No.5 March 16-31, 1983, p.25.
64. Rajula Devi, “Plight of Handlooms”, Kurukshetra, Vol.XXXI, No.7, January
1, 1983, p.21.
65. Ramakrishna Rao and G.Subarahmanyam, “Handloom industry in Coastal
Andhra Pradesh: a Survey”, Kurukshetra, Vol.XXXV, No.6, 1987,
p. 14,15,16,21,22 & 34.
66. Reddy, S.N. and Jayaram, H., 2001, Performance of primary silk handloom
weavers cooperative societies in Andhra Pradesh – A financial evaluation.
Indian Silk, 40(3):28-31.
67. Roy Chowdhury Supriya: ‘Powerlooms in Silk Weaving: Case Studies from
Karnataka’. Indian Journal of Labour Economics, 43(1), 2000, p. 139.
68. Sameer Sharma (Commissioner of Industries, Government of Andhra
Pradesh), .APCO . An Experience of Restructuring an Organisation in an
Emerging Market Economy.,Indian Co-operative Review, Vol.42, No.1, July
2004, Pp. 26.34.
69. SliendraNarain, “Traditional industries”, SIDBI Report on SSI Sector -2000,
issue-2, 2000,pp.47-48.
70. Sanapapamma, K.J. and Mahale, G., 2001, Molakalmuru weavers – present
status. IndianSilk, 40(1): 30-31
71. SatyaNarayana Dash, .Role and Working of Handloom Industry in Western
Orissa. Finance India, Vol. X, No.1, March 1996, pp.108. 110.
72. Savithri, P. Sujathamma& CH. Ramanamma “GLORY OF INDIAN
TRADITIONAL SILK SAREES” International Journal of Textile and
Fashion Technology (IJTFT), 3(2), 61 – 68. 2013
73. Saxena K.K. (1974), “Evolution of the Co-operative Thought”,
SomaiyaPub.Pvt.Ltd., New Delhi, 1974.
74. Seemanthini Niranjana “Thinking with Handlooms: Perspectives from
Andhra Pradesh” Economic and Political Weekly, Vol. 39, No. 6 (Feb. 7-13,
2004), pp. 553-563
75. Simon Charsley “Developing Market Mechanisms in Indian Silk Industry”
Economic and Political Weekly, Vol. 27, No. 35 (Aug. 29, 1992), pp. M117-
M121.
76. Shah, “Co-operative Development, Progress and Trends”, The Tamil Nadu
Journal of Co-operation, Vol.87, No.8, November 1995,p.23.
77. Sharma, M.B., 2005, Silk Mekhela Chador – A traditional dress of Assamese
women. IndianSilk, 44(5): 26-29.
78. Sharma ShantanuNandan(2006), “NE Centre to Train Entrepreneurs”, The
Economics Times, 18th June 2006, http://articles.economictimes.
indiatimes.com / 2006-06- /news/27455087_1_handicraft-handloom-centre.
79. Shailaja, D.N. and Survarnagouri, Y., 2005, MavellousGarbha silk sarees of
Bhagyanagar.Indian Silk, 43(11): 17-18.
80. Srinivansalu: ‘1985 Textile Policy and Handloom Industry – Policy,
Promises and Performance’. Economic and Political Weekly, 31(49), 1996,
p. 3198.
81. Suresh K.A., Joseph Molly (1990), “Co-operatives and Rural Development
in India”, Published by-Ahish Publishing House, New Delhi, 1990.
82. Suresh Kumar K.S. & Ganesh G., .Product Strategies of Handloom Weavers.
Co-operative Societies . An Empirical Enquiry. Kurukshetra, Vol. XLVI,
No.5, Pp. 45.46. 2008
83. Suyambulingam “Handloom Exports in India”, Co-operation, August
1986,p.116.
84. Surjit Kumar Kar, (2012) "Knowledge process of rural handloom community
enterprise: A narrative study of SambalpuriBastralaya in India", Society and
Business Review, Vol. 7 Iss: 2, pp.114 – 133.
85. Swami H.R. and Gupta B.P. (2006), “Rural Development And Co-operation
in India”, Indus Valley Publications, New Delhi, 2006.

86. Tandon, P., 1997, Marketing of Banarasi silk goods. Indian Silk, 35(10): 17.
87. Thirunarayanasamy M. & Paramasivam J. “Welfare Schemes for
Handloom Weavers An Outline” Kisan World, Vol. 36, No. 10,
October 2009, Pp. 18-22.
88. T.R.Gurumoorthy, “Market Development Assistance to Handloom Co-
operative Societies”, TamilNadu Journal of Co-operation, vol.87, No.5,
August 1995, p.7
89. Venugopal Rao K. and Chandrasekhar M., .Problems of Handloom Industry.,
Kurukshetra, Vol. XLVI, No.6, March 1998, Pp. 24.26.
90. Venkatesh Kumar R., Seema Chauhan, “Women Empowerment in
Sericulture: A Current Scenario in Rural India” ASIA-PACIFIC JOURNAL
OF RURAL DEVELOPMENT Volume XX July 2010.
91. Vinayagamoorthy A. (2007) – “Globalization and Co-operative Sector in
India , Co-operative Perspective, Journal of Co-operative Management,
Vaikunth Mehta National Institute of Co-op. Management, Pune, Vol.41,
(Annual Issue), April 06-March 07.

QUESTIONNAIRE I
PRODUCTION AND MARKETING OF SILK TEXTILE PRODUCTS.
(Questionnaire for Co-Operative Silk Societies)
NAME OF THE SOCIETY :
Date of the registration :
Date of commencement of operation :
No. of. Members as on 1.1.2000 :
No. of. Looms held by members as on 1.1.2000. :
PURCHASE OF MATERIALS : SOURCE
Silk Yarn
Zari
Dyes
Chemicals and other materials
VARIETIES PRODUCED :
Sarees
Dhoties
Skirt bits
Other goods
COST OF PRODUCTION PER UNIT/PIECE IN RUPEES:
Yarn
Zari
Chemicals
Wages

Other Expenses
Total Cost of Production………………………………………………............
% of margin added……………………………………………………….........
Price…………………………………………………………………………...
10. Finance: (a) Owned Capital:
Year 2006 2007 2008 2009 2010 2011 2012
1. Share capital by
members
2. Share capital by
state Government
3. Reserve Funds
Total .
(b) Borrowed funds:
Year. 2006 2007 2008 2009 2010 2011 2012
1. Deposits from members
2. Cash credit from District Co-operative central Bank.
3. Reserve fund loan from Govt.
4. Reserve fund loan from D.C.C.B.
5. From any other source.
Total
Grand Total

11. SOURCES MARKETING:
Year 2006 2007 2008 2009 2010 2011 2012
1. Direct sale
2. Sales through
Exhibition
3. Sales through
commission agents
4. Co-optex
12. EXPENTIURES INCURRED FOR MARKETING:
Year 2006 2007 2008 2009 2010 2011 2012
1. Commission to
consumers
2. Commission to selling
Agents
3. Salary of sales men
4. Advertisement
Total
13. VALUE OF PRODUCTION:
Year 2006 2007 2008 2009 2010 2011 2012
1. Co-operative
Societies
2. Private silk
manufacturer
Total.

14. VALUE OF SALES: (Rs. In lakhs)
Year 2006 2007 2008 2009 2010 2011 2012
1. Direct sales
2. Sales through
Exhibition
3. Sales to commission
Agents
4. Sales to commission
Agents
6. Other Sources
15 . STOCK HELD AT THE END OF THE YEAR:
Year 2006 2007 2008 2009 2010 2011 2012
1. Co-operative Societies.
2. Private silk manufacture.
Total.
16. OPERATIONAL EXPENDITURE
YEAR. 2006 2007 2008 2009 2010 2011 2012
1. Establishment
expenses
2. Trade charges
3. Bonus to weavers
4. Interest on the
borrowings
Total

17. OPERATIONAL RESULTS.
Year 2006 2007 2008 2009 2010 2011 2012
1. G.P
2. N.P.
3. Reserve fund.
4. Dividend to
members.
18. Problems faced in
a. Purchase of Raw materials.
b. Obtaining finance.
c. Controlling cost.
d. Maintaining cost.
f. Admitting members
g. Marketing the products
h. Other problems
19. Remedial measures suggested :
20. Whether there is possibility for increasing the productivity.
21. Suggestions & Recommendations :
22. Remarks. :
**************

SCHEDULE TO WEAVERS
I Socio-Demographic Information
1. Name of the head of the family/ : Household
2. Place of Domicile Village :
3. Sex : Male/Female
4. Age (in years) :
5. Marital Status : Married / Unmarried
6. Social Class : OC / BC / SC / ST / Minority
7. Religion : Hindu / Muslim / Christian /
Others if any Specify
8. Since, how long you have been living here : (years)
9. Native Place :
8. No. of earning members in the family:
9. No. of dependents : One member/Two members/
Three members/Four members
10. Nature of house accommodation : Thatched/ Tiled/ Pucca / RCC
11. Possession of house : Owned / Rented
12. In case of owned house : i. Constructed by own Funds
[ ]
ii. Build under the scheme of
[ ] Workshed-cum- House
iii. Any other specify [ ]

13. If house is constructed under any : Rs. much amount was received scheme, how: under the scheme
14. In case of rented house, rent paid per month : Rs.
15. No. of rooms in the house :
16. Monthly expenditure of your family?
17. Monthly Average income of your family:
18. Do you have any savings :
19. Debt condition :
20. Source of borrowing :
II. Information on occupation
1. What is occupational distribution of family members :
2. Is weaving primary or secondary : a) Primary [ ] occupation b) Secondary [ ]
3. Why did you enter into weaving : a) Hereditary Occupation profession? : b) No formal education
c) No infrastructure d) Don’t know e) Others (specify)
4. No. of working days for month :
5. Are you getting full work through : Yes / No weaving throughout the year
6. If not, what is the alternative : a) Work as Agriculture Labourer
source of work? : b) Work as Construction Labourer
c) Others (specify)

7. Are the looms you are working : i. Own with are : ii. Borrowed from Master
Weaver / Society
III. Information pertains to the perception of Weavers on Co-operatives
1. What are the constraints encountered in weaving profession?
2. Have you ever underwent any discrimination?
3. Work environment and health issues:
Yes No
Work Environment is responsible for Headache
work environment cause Anxiety disorder
Work Environment caused back pain
Work Environment caused any injuries
Work environment causes skin rashes
Work Environment caused Ulcers
Work Environment caused Dust allergy problem
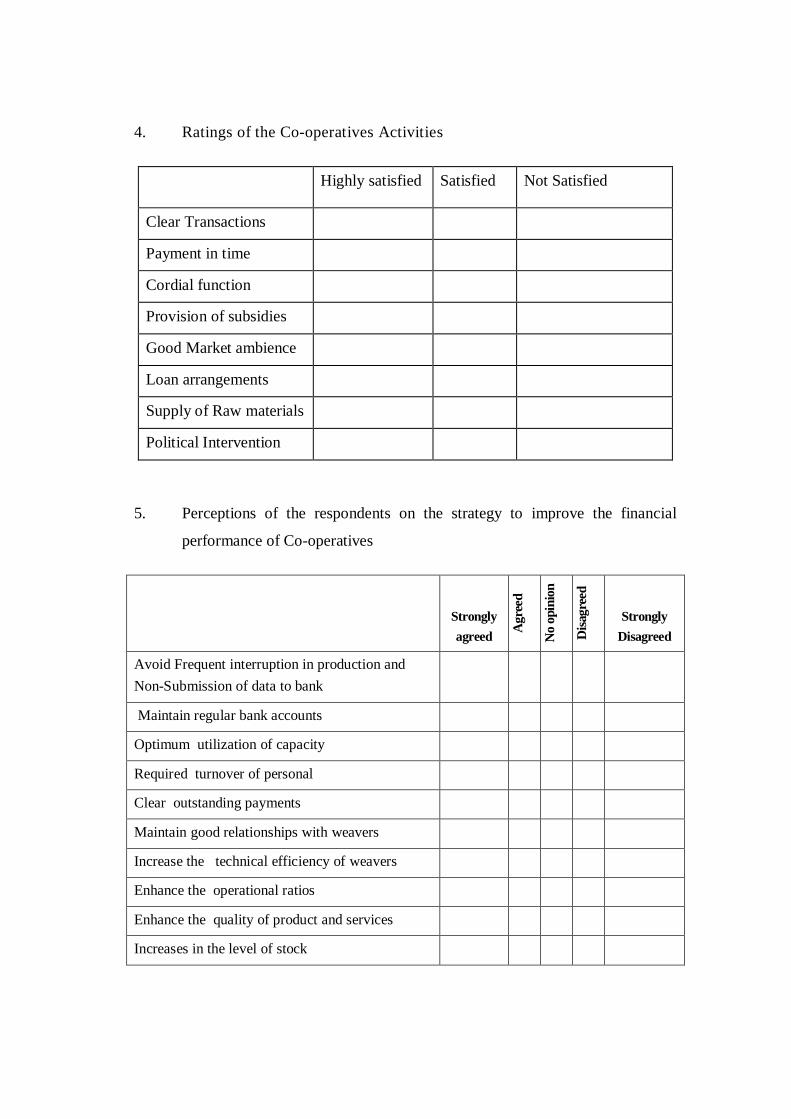
4. Ratings of the Co-operatives Activities
Highly satisfied Satisfied Not Satisfied
Clear Transactions
Payment in time
Cordial function
Provision of subsidies
Good Market ambience
Loan arrangements
Supply of Raw materials
Political Intervention
5. Perceptions of the respondents on the strategy to improve the financial
performance of Co-operatives
Strongly agreed A
gree
d
No
opin
ion
Disa
gree
d
Strongly Disagreed
Avoid Frequent interruption in production and Non-Submission of data to bank
Maintain regular bank accounts
Optimum utilization of capacity
Required turnover of personal
Clear outstanding payments
Maintain good relationships with weavers
Increase the technical efficiency of weavers
Enhance the operational ratios
Enhance the quality of product and services
Increases in the level of stock

6. Opinion on statement for failure of funds management of co-operatives
Strongly
agreed
Agreed No opinion
Disagreed Strongly Disagreed
Deliberate diversion of funds
Poor collections
Unplanned payments to creditors
High Inventory
Unproductive expenditure
Delay in Sanction of loans
Delay in sanction of working capital limits by bank
Delay in implementation of project
7. Suggestion to improve Co-operative silk producers
1
CHAPTER I
DESIGN AND EECUTION OF THE STUDY
INTRODUCTION
Silk is the most elegant textile in the world with unparalleled grandeur,
natural sheen, and inherent affinity for dyes, high absorbance, light weight, soft
touch and high durability and known as the “Queen of Textiles”. On the other hand,
it stands for livelihood opportunity for millions owing to high employment oriented,
low capital intensive and remunerative nature of its production. The very nature of
this industry with its rural based on-farm and off-farm activities and enormous
employment generation potential has attracted the attention of the planners and
policy makers to recognize the industry among one of the most appropriate avenues
for socio-economic development of a largely agrarian economy like India. Silk has
been intermingled with the life and culture of the Indians1. India has a rich and
complex history in silk production and its silk trade dates back to 15th century.
Sericulture industry provides employment to approximately 7.56 million persons in
rural and semi-urban areas in India2. Of these, a sizeable number of workers belong
to the economically weaker sections of society, including women. India’s traditional
and culture bound domestic market and an amazing diversity of silk garments that
1Agrawal, Y., 1999, Silk Brocades.Lustre Press, Roli Books, New Delhi 2Bhagat, S.S., 1998, Silk products of Madhya Pradesh. Indian Silk, 37(6-7): 84-86.

2
reflect geographic specificity has helped the country to achieve a leading position in
silk industry.
India has the unique distinction of being the only country producing all
the five known commercial silks namely, mulberry, tropical tasar, oak tasar, eri and
muga, of which muga with its golden yellow glitter is unique and prerogative of
India. The world’s raw silk production was about 1, 31,479 meter in 2012. China
leads the world with silk production of 1, 04,000 meter or 79.1% of the produce.
India is the second largest producer of silk in the world and has 17.5% share in
global raw silk production. All the countries except China and India have been
witnessing a declining trend in raw silk production in the last two decades. However,
it is worthwhile to note whether the increasing production encompassed the
indigenous people contribution and unleash the benefits to them, silk producing
units have been categorized into private silk producers and the co-operative silk
producers across India, the contribution of the silk producers need to be assessed in
order to map-out the contribution made by the all the segments of the silk producers,
thus, the present study would be propelled to make analysis of co-operative silk
producers to find out the contribution towards silk sarees production in the same
line. The studies also unearth the socio-economic conditions of silk weavers and
their perception on co-operatives. Thirubhuvanam silk is traditionally occupied an
important place in the silk industries and a particular segment of community largely
engaged in this activities for a long period of time, so it would be imperative to take
this silk for the study purpose in order to understand the silk production in Tamil
Nadu.
3
Production and consumption of silk
Production of raw silk in India was 23,060 meter in 2011-12, of which,
mulberry raw silk output aggregated to 18,272 meter (79.24%). The remaining 4,788
meter (20.76%) was vanyasilks. Mulberry sericulture is mainly practiced in five
states namely, Karnataka, Andhra Pradesh, West Bengal, Tamil Nadu and Jammu &
Kashmir jointly account for about 97% of the total mulberry silk production in the
country. India is the largest consumer of raw silk in the world. As the consumption
of raw silk (around 28,733 meter) exceeds the production, the additional requirement
of around 5,700 meter of silk (particularly bivoltine mulberry silk of international
quality) is imported mainly from China3.
Productivity of Silk
According to the annual report of Central silk board the area under
sericulture has increased to 1, 81,089 Ha in 2011-12 compared to 1, 70,314 Ha in
2010-11. Year-wise incremental in the mulberry area during XI Plan is marginal,
which is due to rapid urbanization in the sericulture belts, increase in input costs,
labour problems, drought in Andhra Pradesh and Karnataka, and frequent price
fluctuations. Though the area under sericulture has fallen significantly, the
productivity levels in mulberry cocoon as well as in raw silk have been steadily
improving. The main reasons behind increase in productivity are adoption of higher
leaf yielding mulberry varieties, improved silkworm hybrids and better technologies
in silkworm rearing and silk reeling.
3 Annual Report of Silk Board 2011-12, Central silk Board, Bangalore

4
Significance of Handloom silk Industry
The Handloom Industry of India is essentially a traditional one. It is also a
cottage industry in the best sense of the term, as the work is done largely in the
home of the weaver himself. The loom just like the plough symbolizes the ethos of
India. In fact, the handloom industry along with agriculture is the main stay of our
rural economy. The handloom textile is unique to mill made textiles and it has a very
good glorious heritage, over the years. Handloom goods are no longer the choice of
the poor alone, but a favourite of the elite in India and abroad. Next to agriculture
the handloom industry accounts most of rural employment and income. It meets
about a quarter of the clothing needs of the country. It is essentially a very big labour
intensive and low capital industry. Handloom assumes importance because it not
only meets clothing needs of the people, but also gives expression to Indian art and
culture, craftsmanship and heritage4. The handloom industry, the largest segment in
the unorganized sector, plays a very important role in the country’s economy. The
traditional industry, known for excellence in workmanship and value addition the
world over employs over seven million weavers and about four million looms.
About 27 per cent of the total textile production in the country comes from the
handloom sector. It is agro-based and highly labour-intensive. From very early
period, this huge cottage industry was supported by the rulers and petty kings of the
country and here lies the birth of co-operative movement of state support in its crude
form. This is evident from the fact that even in the early centuries A.D. Indian
navigators who sailed to various countries had been exporting locally produced fine
variety handloom cloths only with the strong support of their petty kings and local
4Dash S. (1995): ‘Handloom Industry in India’. Metal Publications, New Delhi.

5
rulers. The organization, production and the extensive use of handloom products
were supported by the local government for several centuries and these facts are
referred to many a time by the old writers of the early centuries. Handloom cloth is
obtained from cotton. Cotton fibers (yarn) are produced by cotton hand spinning
wheels (charkas). Afterwards, these cotton fibers are dyed and woven by a
handloom and thus handloom cloths are produced.
Historical Origin and Development of Handloom Industry
The Indian handloom textile industry has an ancient lineage and was
renowned since the Indus valley civilization of 3,000 years B.C. During the mogul
period, among cottons the muslin of Decca was the most famous. In silks, the
choppers’, bandanas and corals of murshidabad were particularly fine, and the
woolen shawls of Kashmir and Amritsar were very popular in Europe, especially
France during the mid-nineteenth century. Throughout the century the European
demand led to a phenomenal expansion of Indian trade in her cotton and silk
manufactures. In the early days of colonialism, from Clive’s victory at Plessey in
1757 to the abolition of the East India Company’s monopoly in 1813, the handicraft
industries still managed to export substantially, partly by trading with the company.
As the handloom industry is an employment oriented industry today, it provides
direct employment to about 100 lake persons for their livelihood in the country in
weaving and other connected activities of handloom5.
5A.C.K. Namibia (1996): ‘Handloom Industry in India’-APH Publishing Corporation, New Delhi.

6
Handloom Industry in India
Handloom industry is the most important and the largest one in India.
Handloom weaving is in vogue from the ancient days and there are a large number
of people who are still earning their living by it. To provide effective support and
protection to this sector, a co-ordinate national policy has been evolved by the
Government of India through which it is hoped to Amelia-rate the living standard of
the weaver. As the handloom weaver is at present poorly served in most of these
respects, a massive national Handloom Development Programmed had been
launched to ensure adequate and timely supply of yarn, dyes and chemicals at
reasonable prices to the weavers and to get rid of the fear that his product may not
be sold. In India, handloom societies are concentrated in the small segment and are
mainly concentrated in different parts of the country6. On attaining independence,
Government of India rightly recognized the important role that the industry can play
well and a number of policy measures were formulated and executed to bring the
industry on sound footing. India is an agricultural country. But, the age old
handloom industry gets the second big occupation in the decentralized sector of the
country with 3.8 million meter handlooms, with an average annual production of
2900 million metres of handloom cloth and this constitutes one third (1/3) of the
country’s total cloth production.
6Rama, Mohan Rae (1990): ‘Development of Handloom Industry’. Discovery Publishing House, New Delhi.

7
Handloom Industry in the Indian Perspective
Handloom weaving is the India’s biggest cottage and labour intensive
sector, which has been playing a very important role in the country’s economy by
forming part of India’s rich heritage and exemplifying the rich artistry of the
weavers. The artisans of India are famous for hand spinning, hand printing and
hand-dyeing. They are accustomed to the art of weaving as a hereditary occupation.
There are historical records to show that handloom fabrics of India had established
their reputation in the international market long before the historic Industrial
Revolution in the West and the Indian handloom fabrics received popular patronage
and adorned regal personages, besides having received acclaim abroad in the olden
days.7 As an economic activity, the handloom sector occupies a place second only to
agriculture in terms of employment. The sector with about 23.77 lake handlooms
provides employment to 43.31 lake persons. Of which, 77.9 per cent are women, and
28 per cent belong to scheduled castes and scheduled tribes. However, this sector is
confronted with various problems, such as, obsolete technology, unorganized
production system, low productivity, inadequate working capital, conventional
product range, and weak marketing links. Handloom sector has always been a weak
competitor against power loom and mill sectors. But the significance of handloom
industry needs to be looked and assessed from the point of view of the number of
people deriving their livelihood from this sector. Unfortunately, the Government of
India has only meted out raw deal to the handloom sector through its successive
Textile Policies.
7A.K. Mishear: ‘Social Impact of Handloom Co-operatives on Weavers in Western Orissa – An Empirical Study’ Journal of Rural Development, Vol. 13(2), 1994, pp. 259-267.

8
The Role of Co-operative Movement and the Growth of Handloom Industry
Development of the Handloom industry on co-operative lines was the
cardinal element in all the plans. Co-operation has the advantage of bringing
freedom and opportunity of people with benefits of large scale management and
organization. Co-operative societies are expected to perform functions of bulk
purchase of raw material, raise capital by the issue of shares, procure finished goods
from members and minced them on favorable terms. The first Handloom Weavers
Co-operative Society was formed in 1905 after the Co-operative Societies Act had
come into existence. From that time onwards, the number of weavers’ co-operative
societies has been increased. Co-operative of Handloom has been one of the major
strategies of the government for bringing handloom weavers to an organized forum
for production. It has been the policy of the State Government to channelize all the
government assistance to the handloom weavers through the weavers’ co-operatives.
Organization of industrial weavers’ co-operative societies has been one of the
important schemes implemented by the state government for the welfare of the loom
less weavers.
Silk Production in India
Indian ‘silk industry’ is very ancient and mainly cottage based till today,
right from cocoon (raw material) production to fabric manufacture. The term
‘industry’ has been widely defined as “manufacturing through organized activity”.
However, a look at the silk industry in India, finds it as mostly unorganized existing
in the form of a farm sector and or a cottage industry. India ranks second in respect

9
of world raw silk production8. It is this position, as one of only two major silk
producers in the world, and from its employment potential, that sericulture and silk
derive their importance in the Indian textile map. Silk as produced by cultivated silk
worm was at one time the most priced of all the textile fibers. The biggest strength
of the Indian silk industry is that India happens to be the only country in the world
which produces all the four types of silk namely, mulberry, tassar, eri and muga.
Yet, currently, India produces only 15,000 tonnes of raw silk per year against the
annual requirement of 24,000 tonnes.
India continues to be the second largest producer of silk in the world.
India has the unique distinction of being the only country producing all the five
kinds of silk like, Mulberry, Eri, Muga, Tropical Tasar and Temperate Tasar.
Sericulture is an important labour-intensive and agro-based cottage industry,
providing gainful occupation to around 7.25 million persons in rural and semi-urban
areas in India. Of these, a sizeable number of workers belong to the economically
weaker sections of society. There is substantial involvement of women in this
Industry. In India, Sericulture is mostly a village-based industry providing
employment opportunities to a large section of the population. Although Sericulture
is considered as a subsidiary occupation, technological innovation has made it
possible to take it up on an intensive scale capable of generating adequate income. It
is also capable of providing continuous income to farmers. India is the second
largest producer of silk in the world with an annual silk production of more than
21,000 meters tonness in 2011-12. Although, all the known varieties of silk, viz.,
Mulberry, Eri, Muga and Tasar are produced in India, Mulberry silk is the most
8Mishra, S.N., 1997, Silk industry of Assam. Indian Silk, 35(10): 22-26
10
popular variety. Mulberry silk alone contributes more than 80% of the Country’s silk
production. Silk and silk goods are very good foreign exchange earners. Export
potential of this sector is promising as silk production in Japan is declining and that
of China, the largest silk producer the World, it is stagnant. The present global
scenario clearly indicates the enormous opportunities for the Indian Silk Industry. In
India, because of the prevalence of favourable climatic conditions, mulberry is
cultivated mainly in five states, viz., Karnataka, Andhra Pradesh, Tamil Nadu, West
Bengal and Jammu & Kashmir. These five states collectively account for 97% of the
total area under mulberry cultivation and 95% of raw silk production in the country.
Now, as a result of growing realization, sericulture is gaining ground in non-
traditional areas too.
Silk Handloom Industries in Tamil Nadu
Tamil Nadu has weavers who have migrated from other states. Many of
these migrants are from Saurashtra and Andhrapradesh. Some of the Saurashtrians
migrated more than 700 years ago. The Tamil Nadu weavers belong to the mudaliar.
The Tamil Nadu Handloom weavers cooperative society limited popularly known as
“co-optex” was established in 1935 under Co-operative Societies Act with the main
objective of organizing and promoting the handloom industry in Tamil Nadu on a
commercial basis. In Tamil Nadu, Erode district handloom societies occupy a prince
position; particularly handloom bed sheets are most popular in the southern parts of
the country. Against this back ground, it will be worth understanding the
performance of leading handloom societies9. Tamil Nadu occupies the third position
9Reddy, S.N. and Jayaram, H., 2001, Performance of primary silk handloom weavers cooperative

11
in the country with regard to the production of handloom cloth. During the year
1989-90, the approximate production of handloom cloth by the co-operative sector is
about 136 million metres with regard to the productivity per loom, the average daily
production works out to 4.8 metres per day per loom, as against the national average
of 5.1 metres per day. There is a need to improve the productivity of the handlooms
substantially. Tamil Nadu handloom industry produces a wide range of products
meant for export mancent. Madras check lunghies, Real Madras hand kerchieves,
Kancheepuram silk sarees, terry towels, furnishing materials produced at Karur,
Chennimalai areas are the product ranges being exported from Tamil Nadu. To
increase the earning of the handloom weavers and to alleviate their poverty, the
government has set up four co-operative intensive handloom development projects
at Kancheepuram, Erode, Salem and Madurai and two export production projects at
Karur and Kurinjipadi with all essential infrastructural facilities for production of
handloom cloth. TamilNadu ranks first in the country in the achievement of the co-
operative coverage of handlooms. There are still poor loom less weavers working
under the master weavers in the private sector. Government intends providing a
package of assistance to these weavers in terms of capital assistance and state
participation in the weavers’ co-operative societies. There were 2,077 primary
weavers’ co-operative societies as on 28th February 2012.
Silk weaving in Kumbakonam Taluk
Weaving is the important occupation in the district next to agriculture.
Though weaving is undertaken as a main occupation in all parts of the district, it is
Societies in Andhra Pradesh – A financial evaluation. Indian Silk, 40(3):28-31.

12
mostly concentrated in four taluks, viz., Thanjavur , Papanasam, Kumbakonam, and
Thiruvidaimaruthur. Of these four taluks silk weaving is more popular in the last
two taluks. In the district, handloom weaving is undertaken and there is no power
loom here as in Salem and Coimbatore districts. Weaving of both cotton fabrics and
silk fabrics are undertaken in the district. But in all aspects silk weaving out-
numbers the cotton weaving in the district and this point is substantiated from the
information given by the Assistant Directorate of Handlooms and Textiles.
Research Objectives
To study the profile of the co-operative silk in Kumbakonam
Taluk
To find out the capacity utilization of silk producing units under
study
To know about the marketing strategies of co-operative silk
producers in the study area
To analyse the problems and prospects of co-operative silk
producing units under study.
Statement of the Research Problem
In spite of implementation of various development schemes to protect the
silk handloom industries , the handloom sectors did not improve as it was
envisaged. Co-operative coverage was 85 per cent out of the total products. The
inherent weaknesses of the handloom industry like weak organization, officialisation
of handloom co-operatives, inadequate credit from financial institutions, inadequate

13
and poor infrastructure have made it more vulnerable to competitions from the
organized mills and the decentralized Power looms sector. The steep increase in silk
yarn prices, heaps of unsold stock, delayed payments to primary societies by the
Apex societies and the poor marketing conditions have further deteriorated
conditions. This actually poses a real problem to the poor and deprived handloom.
Traditionally, a class of handloom weavers is working under the Master weavers’ for
daily wages. These dependent weavers do not have their own looms and are under
the clutches of Master Weavers. The first and foremost measure adopted was the
restriction of the weaving capacity in the organized Mill sector. The additional cloth
requirements were to be met mainly by the handlooms. One of the major problems
faced by the handlooms societies is the inadequate supply of yarn in hank form.
Another major problem of the handloom industry is marketing. There is no clear
mechanism to transfer market intelligence to handloom weavers. Technological
backwardness is create problem to the industry. High cost of production to this
industrial sector also leads the problems to both silk producers and the marketers..
The competition from Power looms is another serious problem afflicting the
handlooms of the different areas. Yet another weakness of handloom industry is its
unorganized character. Eventhough the handloom industry of Thanjavur District
has a long heritage, traditional value and global market changes, performance of the
co-operative system in deciding the decisive factors of the silk production in the
region, it is really a mystery to note that the real silk handloom weavers of the
district have a very low living standard. Their social and economic conditions are at
a very poor condition. Plethora of the studies on the chosen domain have
concentrated on performance of silk co-operatives, socio-economic conditions of

14
the hanloom weavers, but none of the studies have introspected strategies adopted by
the silk producing units to withstand in the changing business environment and how
the customers have perceived about the quality of the sarees produced, the present
study holistically encompassed all the issues to tried to understand the issues in
business environment along with the social dimension.
Research Problem and the Parameters to be examined
As specified in the objectives the parameters to be examined under the
research problem are;
Capacity utilization in co-operatives silk producing units
Progress and working of silk producing units and sales and the
strategy adopted
Marketing methods practiced by the units.
Socio-economic conditions of the silk weavers
The objectives set forth clearly indicate the areas of handloom silk
industries to be examined. These constitute the parameters to be examined which are
investigated through primary data obtained through personal interviews with the
study units. Statistical techniques employed for examining these parameters are
explained under the methodology aspects in the subsequent paragraph in this part of
the thesis.
15
Need of the Study
Silk Industries in India has been confronted with an increasingly
competitive environment due to: liberalization of the investment regime in the
1990s, favouring foreign direct investment at the international level, particularly in
socialistic and develop in countries; the formation of the World Trade Organizations
(WTO) in 1995,forcingits member countries (including India) to drastically scale
down quantitative and non-quantitative restrictions on imports, and domestic
economic reforms. Tamil Nadu is a urban centric industrialized state so it is
imperative to examine the performance of silk industries in Tamil Nadu in order to
understand the changing dynamics of the industrial environment and to address the
issues pertains to challenges and the attainment of the silk industries in Tamil Nadu
in the recent past. The present study concentrate on co-operative silk producing units
in order to understand the performance of the silk producing units, challenges,
production process and socio-economic conditions of the weavers, thereby address
the performance of co-operative silk producing units since co-operative activities is
the nodal agency and ideal process for equitable development.
Hypotheses
Ho: Quality and customer care factors did not influence the
consumer to prefer silk products from the co-operatives silk
producers in the study area.
Ho: There is no influence of business environment, Government
policy and the finance on the performance of the silk producing
units in the study area

16
H0: Financial distress of the co-opertaive silk producing units have
not influenced the loan availability in the study area.
Research Methodology
Sources of Data
This study is of both descriptive and explorative. The empirical data have
been collected for analyzing performance of silk producing units from co-operative
societies by conducting a survey by using an interview schedule. Primary data from
these units were collected by using a pre- tested and pre-coded schedule by personal
interview with the wearers by the researcher. Secondary data were collected from
audited balance sheets of the silk producing co-operative societies, books,
magazines, journals, records. Reports and published documents of District Industries
Centre, Tamil Nadu Industrial Investment Corporation, Department of Statistics,
Government of Tamil Nadu, Ministry of Small Scale Industries and Agro Rural
Industries, Government of India, New Delhi, silk board of India and from website.
Tools for data collection
Two different sets of interview schedules were framed, one addressed to
the officials of co-operative silk produced societies and the other addressed to the
weaver respondents. The researcher itself personally interviewed the respondent and
collected the data. This study is based on primary as well as secondary data. The
primary data were used mainly for evaluating the performance of silk producing
units in Kumbakonam taluk. The interview schedule has been structured by the
researcher and to identifying the variables to be used in the interview schedule, the

17
researcher conducted a trial interview with 10 silk weavers under co-operatives
societies . A rough draft of the interview schedule was prepared and circulated
among fellow researchers for critical evaluation. The draft was revised in little after
their comments. The revised interview schedule was prepared and given to silk
producing units for a pre-test. Their suggestions were incorporated and the final
draft is prepared.
Sampling Design
The survey method was used for the study. Kumbakonam Taluk was
purposely selected for the study as it is a prominent silk producing place in
Thanjavur district of Tamil Nadu. All the 7 co-operative societies registered with
District industrial centre were selected by using simple random sampling method. 25
respondent were selected from each society constituting a total of sample respondent
were selected.
Tools for Analysis
Appropriate statistical tools were used for analyzing the data. To measure
the growth performance, compound growth rate has been applied for each society.
To test the consistency of growth performance, the Coefficient of Variation for each
component for each society has been used. To analyze the factors influencing the
impact of financial problems and the problem faced by the silk producing units
multiple regression analysis was adopted. Analysis of Variance (ANOVA) has been
applied to study the transition occurred during the study period of the co-

18
operatives silk producers, logistic regression utilized to understand the customer
choice of silk sarees procurement.
Limitations of the Study
The following are the limitations of the study
1. The study in confined to the silk producing units located in
Kumbakonam Taluk only.
2. The period of study is restricted for a period of seven years from
2006 to 2012.
3. The primary data collected about the opinion of weaver respondents
may vary according to the situation and time.
Chapter Design
The report of the study is arranged in six chapters as follows:
Chapter I : Design and Execution of the study deals with nature, scope,
objectives, statement of the problem, Need of the study, hypothesis, methodology.
Chapter II: Review of literature pertains to Co-operative societies and
handloom ,Studies pertains to silk industries ,Studies pertains to socio-economic
conditions of Handloom weavers.
Chapter III: illustrates the profile of silk societies and the production
process of silk products have been critically examined and stemmed in the chapter.

19
Chapter IV: Illustrates the capacity utilization of the various co-operative
societies based on plant level, capital investment level, sales level and purchasing
power.
Chapter V: Analysis of the Production, sales and profitability position,
functional expenditure on various overheads and the socio-economic conditions,
problems and challenges faced by weavers associated with co-operative silk
societies in the study area.
Chapter V: Exhibits the summary and conclusion, major findings and
policy suggestions.

20
CHAPTER II
REVIEW OF LITERATURE
This chapter depicts the Literature of review pertains to many studies in
India on the silk handloom industry and its problems. Some are dealing with the
handloom industry at the all India level, but some studies are based on state or
district level. The present research study is based on the importance of the handloom
industry, employment and income potentialities, socio-economic conditions and
welfare schemes as well as the problems of the handloom industry, the studies have
been categorized into various segments viz Studies pertains to Co-operative societies
and handloom ,Studies pertains to silk industries ,Studies pertains to socio-economic
conditions of Handloom weavers.
Studies pertains to Co-operative societies and handloom
Sanjay Sinha (1989)10 examines this proposition and suggests strategies
for strengthening the contribution of this activity to rural development through silk
production. The available information on the socio-economic and related technical
issues is far from comprehensive; the author found that a more systematic approach
10Sanjay Sinha “Development Impact of Silk Production: A Wealth of Opportunities” Economic and Political Weekly, Vol. 24, No. 3 (Jan. 21, 1989), pp. 157-163

21
is required to obtain the socio-economic information necessary to determine the
developmental impact of silk production. Nevertheless, the indications are that the
present production systems produce a significant positive impact. Though technical
change cannot be postponed indefinitely, it can at least be managed in the
foreseeable future to augment the contribution of silk production to development.
The potential is enormous; more professional and commercial long- term strategies
than those employed up to now could be instrumental in realizing the wealth of
opportunities that exists.
Simon Charsley (1992)11 analyzed the existing marketing mechanism for
silk industries in India, the author stemmed with some of the important questions
such as does experience in the silk industry support Bauer's case? It does show that
the problems, to which he points, on the basis primarily of very old evidence from
other countries, remain relevant in India. His anti-intervention line is perhaps
unreasonably doctrinaire, but it usefully emphasizes that efforts to interne in
marketing and particularly to set up related markets are full of pitfalls where they are
tried. There are number of standard re ns why they are felt to be needed, and there
are a number of standard ways in which things too often go wrong. There are
questions about prides which therefore ought always to be asked when these are
being drawn up. One clearly is, whenever middlemen seem ripe for elimination,
what exactly is it that they are doing. in and for the market? It may well be a lot
more than simply buying and selling the extent that it is, alternative ways of
performing necessary functions have to be provided. But sometimes, as the success
11Simon Charsley “Developing Market Mechanisms in Indian Silk Industry” Economic and Political Weekly, Vol. 27, No. 35 (Aug. 29, 1992), pp. M117-M121

22
of cocoon marketing shows and as can be hoped for from the current policy of sup-
porting small-scale reelers by local purchase, when the questions are asked and the
costs and benefits are w1 up, the answers are not necessarily going to be against
intervention in all its forms.At the outset the author implied that middle man
intervention is very high which inhibits the benefits to the both the end.
Bhuimali Anil (2003)12 discussed rural co-operatives and their impact on
the rural economy. Author explained that the Indian farmers needed credit for
agricultural purpose which was available from the private money-lenders, but the
credit supplied by them was at a very exorbitant rate of interest. Naturally it was
beyond the reach of agriculturists. Similarly, whatever Government loan was
available that was available only at a very limited extent. In order to meet the credit
demand of the farmers at a soft rate of interest, Indian Government passed the co-
operative societies act to overcome the problem. In various countries co-operation
has been used as an institution and instrument of economic development. The author
presented three case studies to explain the activities of co-operatives societies in the
rural India and their consequent impact on the economy. First case study explained
the impact of a limited liability society, second case described the impact of an
unlimited liability society and the third presented the impact of agricultural
marketing society on rural areas of West Bengal. Author stated that co-operatives
have played a significant role not only as instrument of economic growth, but also
influencing the people towards social and economic changes by way of adopting
12Bhuimali Anil (2003), “Rural Co-operative and Economic Development”, Sarup and Sons Pub., New Delhi, 2003

23
innovation and technology. Co-operatives, in fact, help one by contribution vast
possibilities for the individuals to participate combined in the economic activities.
Seemanthini Niranjana (2004)13 tried to analyze the numerous
dimensions within the handloom sector offers insights into how to address and
understand different forms of industrial activity in the country, particularly in realms
considered as being the peripheries of a dominant industrial core, the study found
that Conventional official perception relegates handlooms to a small, niche market
(either overseas or in India), and then goes on to suggest how this niche demand
should be catered to through further design innovation and variation. Both case
studies illustrated above contest this viewpoint. While the case of Koyyalagudem's
reliance on exports shows that it creates instabilities in demand, production and
work opportunities, the case of Tenali highlights the marketing possibilities in local
contexts as well. The formation of weaver cooperatives has been seen as the most
important strategy in reviving and supporting the handloom sector. Their
functioning, however, has not been uniformly successful. This has been influenced
by a number of factors such as local elites lobbying for power, political parties
seeking to consolidate their strengths, or sheer mismanagement of the cooperatives.
Given these differences, evaluating the performance of existing weavers'
cooperatives is not an easy task.
13SeemanthiniNiranjana “Thinking with Handlooms: Perspectives from Andhra Pradesh” Economic and Political Weekly, Vol. 39, No. 6 (Feb. 7-13, 2004), pp. 553-563

24
Dharmaraju P.(2006)14 made an attempt to explore the experiences of
weavers in handloom co-operatives and their marketing strategies, the author taken
up two handloom societies for the study purpose vizAngra and Koyyalgudem, the
study revealed that both the societies appear to have utilized existing marketing
channels, but exposure to design intervention and new markets seem sporadic.
Unlike Angara which banks on traditional product like sarees, Koyyalagudem,
perhaps due to its proximity to urban centres, specializes in dress materials. To
succeed in this, it is essential to have one's ear close to the ground - but this market
feedback is incidental in the case of Koyyalagudem. There are no institutional
channels by which this information transfer and market exploration could happen
effectively. During the picket boom and years of good export business,
Koyyalagudem used to attract a number of migrant weavers from other places in AP.
This has changed in the recent past, mainly due to a fall in exports. Since 1995,
export orders have not been as forthcoming as in the past. Several reasons have been
cited for this trend, some of which are: the ban on chemical dyes by European
markets. ( Azo-free dyes are used instead, but this renders the product expensive);
the drastic increase in prices of yarn and dyes. To cut costs, inferior materials are
used, and weavers lose out in the world market. The experience of Koyyalagudem
shows that though orienting production to exports may be beneficial in the short run,
a long-term reliance on exports of cloth alone creates instabilities in demand,
production and livelihoods that cannot be absorbed by the handloom sector. In
addition, it is also important for cooperatives to explore domestic markets much
more proactive. 14Dharmaraju P. “Marketing in Handloom Cooperatives” Economic and Political Weekly, Vol. 41, No. 31 Aug. .2006 P.3385-3387

25
Prabha and Kumara Kannan(2011)15 examined the consumer
behaviors and preferences towards different kinds of extensions in fast fashion
brands (FFBs). The major objectives are i) to identify the major attributes of a retail
brand recognized by the customers. ii) to examine whether the people’s trust on a
retail brand leads to their commitment and iii) How far the personality of the
customer soars the retail brand’s trust. The research used here is descriptive
research. The Secondary research was exploratory in nature and the various models
involved in the Brand Extension process were investigated. The Primary research
done was conclusive in nature and involved a pilot survey to check the
appropriateness of the questionnaire and determine the sample size (300) of the final
research. This study is an attempt to enhance the brand extensions based on the
customer’s personality. If the entire hypotheses are accepted, it implies the strength
of retail brand, its trust and commitment over extending through their own brands. It
also studies the risk of this kind of extension over established retail brand trust. The
consumer prefers this retail shop for the superior customer service and more
collections and variety of brands. At the same time customer have less awareness of
the own retail brand. Hence proper advertisements have to be given to bring out their
own retail brands. Even peoples personality plays an important role in preferring the
brand. Thus this study discloses the personality of the consumer having influence
over their buying behavior.
15Prabha and Kumara Kannan “An empirical study on Retail branding and brand extension strategies in the Chennai Silks,Tamil Nadu” IJEMR – December 2011-Vol 1 Issue 7 - Online - ISSN 2249 – 2585 - Print - ISSN 2249 – 8672

26
Studies pertains to handloom silk industries
Kapoor (1979)16 made an attempt to synthesis the historical significance
of silk industries in India, and role and importance of the silk industries embedded
with the life of the people in the earlier period, The author explains the past glory of
silk industry in India. He holds that the Indian silk with its artistic value has an
international market and has earned the valuable foreign exchange. He suggested
increasing the silk production, and exploring the possibilities of enhancing the silk
export.
Ghosh (1984)17 in his study on “Bengal handloom industry” mentioned
that Bengal weavers were continuously trying to maintain and upgrade their
traditional handloom products. This attempt was inspite of their limitations to obtain
superfine quality yarn, poor marketing facilities and weak financial status. Non-
availability and untimely supply of raw materials especially silk, hike in prices,
inadequate finance were the problems faced by Varanasi silk weavers. The
researcher also found another weaker link i.e. the dyeing and processing sector
connected to weaving unit. Lack of proper marketing system and changing fashion
trends were challenging for the weavers who were away from advanced technology,
and also found that the hike in prices of filature, charka silk and zari, inferior quality
of both types of silks, untimely supply of raw material, scarcity of zari and
marketing were the common problems faced by the weavers community
16Kapoor- Heritage of Indian silk (1979). 17Ghosh, T.K., 1984, Bengal handloom industry. Tex. Trends, 26: 41-47

27
NaganC.Das (1984)18 made a diachronic description of silk industries in
India, the author highlighted the traditional heritage associated with silk products
and importance of silk products in the life style of the people since the earlier period,
The author makes a brief review of history of the silk industry in India. According
the silk fabrics formed a major portion of handloom sectors export to foreign
countries especially E.E.C. and North America. He makes a comparison of the
marketing aspects of cotton fabrics with that of silk fabrics at the national level.
Paulraj (1984)19examined the ammapattei silk handloom weavers in
Tamil Nadu in order to understand the attainments and challenges of the co-
operatives and its impact on the development of the weavers associated with it. The
researcher advocates the discontinuation of rebate system. Instead of the members of
silk societies may be supplied with necessary raw materials regularly through the co-
operative silk societies . The rebate amounts should be reimbursed by the
Governments without undue delay, the working capital of the society is reduced and
the production and employment in the subsequent year is affected.
Chidambaram (1985)20 made an attempt to find out the production and
marketing constrains and challenges in Tamil Nadu, In his study the researcher
makes a scientific classification of silk societies in Tamil Nadu into three – large
,medium, small. He points out the major problems in the production and marketing
of silk societies face many problems in marketing the silk products. He suggests the 18NaganC.Das-Indian Heritage (1984) 19Paulraj – An Economic Analysis of the Ammapet Silk Hand loom weavers Co-operative Society Ltd. A Study with special reference in Amapet in Thanjavur District.1984. 20Chidambaram – production and marketing problems of silk industry in Tamil Nadu. [1985].

28
extention of special rebate scheme for longer period in the case of medium and small
silk societies. He evaluates the operational efficiency of the Silk Co-operative
societies by measuring the profitability of the society.
Ramana (1987)21made an attempt to explore the correlation between silk
industries and economic development, the author systematically made an empirical
analysis and revealed that silk industries are positively influence the economic
development in India through exports and also fulfill the domestic demand or the
same, He concludes that if proper marketing channel is available . Silk industry is
one of the highly profitable industry in India.
Elangovan (1988)22examine the Thirubuvanam silk handloom weavers
co-operatives in order to asses the production and sales of the societies, In his study
the researcher attempted to present an overall view of working condition of the
Thirubuvanam silk society. As a case study it covers the aspects of procurement of
raw –materials, production, marketing, pricing policy etc., The marketing function,
is one of the many aspects of the society studied. He strongly advocates the
continuous of the rebate on sales for the silk societies.
Solaiappan (1988)23depicted the comprehensive description of the
working of silk Industry in Co-operative and private sectors in Thanjavur District
in general. A comparative study of function of production and marketing of silk 21Ramana, “Economics of sericulture and silk Industry in India”. Deep &Deep Publication New Delhi., 1987, p.1. 22Elangovan ,R., in his study on the Thirubuvanam Silk Handloom Weavers’Co – operative production and sales society Ltd. In Thanjavur District . (1988.) 23Solaiappan – Production and Marketing of Silk Textiles Products, - A study with special reference to Thanjavur District, (1988).
29
textile products in both each these sectors is made tofindout the operational
efficiency of each sector . The problems faced by this industry in general and by the
silk weavers societies and private manufactures are discussed individually and
remedial measures to overcome the problems are given. Inshort, this study is the
most comprehensive and systematic study available at present on silk industry in
Thanjavur District.
Arunachalam (1989)24 made an analysis of handloom silk industries in
Tamil Nadu, the author made an attempt to highlight the problems pertains to
production and marketing of silk products in Tamil Nadu, It is comprehensive study
on the problems of marketing of silk cloth produced by both co-operative silk
societies and private masters’ weavers. One of the important findings of the study is
that the marketing channels adopted by co-operatives as well as the private silk
manufactures influence the operational efficiency and possibility of the silk industry
in Tamil Nadu.
Govindan Nair (1993)25focused its attention of the co – operation of both cotton
handloom industry and silk handloom industry in India . It is observed that
although silk had a wide variety of uses its importance in World Textiles has been
insignificant. i.e., only 0.17 percent. The study revealed that handloom exports had
been growing at the of around 70 percent in 1991 – 92 which was attributable to the
devaluation of Indian Rupee. The export earnings can further be increased by
24Arunachalam--- Handloom Silk Industry in TamilNad, A Study of problems relatring to production and marketing. (Ph.D Thesis submitted to University of Madras). 1989. 25Govindan Nair – Cotton Handloom Exports I n 1992 – 93 --- A Review – 1993.

30
diversification of the exports to many countries of the world as suggested by the
study.
Pathak et al. (1993)26 in the survey on “Varanasi silk industry” found
that, in Varanasi, silk weavers were generally known as ‘julahas’. In general, all
communities were involved but share of Muslims (Ansaris) were prominently high.
Silk weavers constitute 69.2% of the population of weavers in the state. The silk
industry was running by three levels of weavers; small independent weavers, master
weavers and wage weavers of cooperative societies further the study revealed that
the weavers are mostly from Mudaliar community and weaving was their traditional
art. The mater weaver was an entrepreneur, who owned a number of looms
employing weavers on wage contracts and spent long hours in dexterous labour.
Most of the weavers were poor with merge means of subsistence and therefore were
forced to take loans from master weavers. The wage weavers were controlled by the
master weavers and exploited both economically and socially.
Nadigar et al. (1995)27 reported that, the Kancheepuram silk sarees are
mainly used for wedding purpose. The local market is mainly confined to Southern
states of Andhra Pradesh, Karnataka and Tamil Nadu. Beside to some extent it used
to be sent to Delhi and Bombay. About 50 per cent of silk sarees were marketed in
local Co-operative societies, in turn co-opetex purchased from co-operative societies
and market at national level. Most of the progressive master weavers market the
26Pathak, S., Sambhulingappa, Nagabhushanaiah, Y.N. and Nadigar G.S., 1993, Varanasi silk industry - A survey. Indian Silk, 31(12): 6-10. 27Nadigar, G.S., Shmbhulingappa, H.H. and Krishnamurthy, B.T., 1995, Marvelous Kancheepuramsarees. Indian Silk, 35(8): 19-22.

31
saree through retailers further the study indicated that A blend of tradition and
modernity” and reported that these sarees are expensive and mainly used for
exclusive occasions like wedding and social rituals. The price ranged from Rs.1500-
2800 depending on the variety. It enjoyed a sound domestic market in the Southern
state of the country mainly through retail outlets. Limited quantities do travels to
overseas like New Work (USA) and Singapore.
Kannaghi (1995)28 concentrated on marketing of silk sarees by the
Thirubuvanam Silk Handloom Weaver,s Coperative production and sales society
Ltd. In Thanjavur District has held competition from private silk producers of silk
because of new varities and design at chief prices, problems in procuring Zari,
absence of credit sales, lack of sales complexes and branches in many places to be
responsible for slower rate of growth. Its further observes that sales through Co –
optex have increased from Rs. 16.81 lakhs in 1987-88 to Rs. 119.04 Lakhs (increase
of about 10 times. As for channels, direct sales to be of the most important channel
of marketing available to the society.
Jacob (1996)29 carried out a study on “Grandeur of Kancheepuram” and
reported that the Kancheepuram silk sarees are heavy in nature and woven with
charka raw silk. The 16/18 denier silk is generally used. While 13/15 denier raw silk
is preferred for zari work. Warp yarns of 18 tpi and weft of 8 tpi of fine, medium
and coarse charka silk is employed. Generally 2 ply yarns are used for body and 3
ply to 4 ply for border on both sides and pallu. Kancheepuramsarees are generally 28Kannaghi – Marketing of Silk sarees by the Thirubuvanam Silk Handloom the weavers ‘ co-operative production and sale society Limited. December 1995 29Jacob, M., 1996, Grandeur of Kancheepuram. The Indian Tex. J., 106(1): 52-55

32
weft prominent. Sarees have earned a name for their durability, thickness, quality,
drapes and low creasing tendency because of its typical fabric sett. The weaving of
Kumbhokonamsarees is a slow process because of its intricacies and elaborate
designs. The weaving is done on frame looms with jacquard for border and extra
warp designs. Commonly 2 ply filature warp of 18 tpi and denier 20/22, 20/24,
16/18 and 28/32 are employed as warp, while untwisted charka silk of 2 ply to 3 ply
or even 4 ply are used as weft. Two threads gold zari is used for warp and 3 or 4 for
weft. Reed is made of bamboo wire with reed count for body as 90-96s and border
70-90s, the study further indicated that blend of tradition and modernity”. Silk saree,
furnishing fabric, dhoti, turban, silk odhani and brocade fabric for dress material
were the main products of Banaras silk industry. Silk and/or zari used for extra weft
designs. The silk saree weaving involved skill and took lots of time because of its
elaborate intricate designs. Two weavers worked together for weaving one brocade
saree.
Munikrishnappa et al. (1996)30 conducted a study on “Silk fabric
marketing”. The findings of the study revealed that silk fabrics are marketed through
government and private houses in Mysore city. Price is the vital element in the
marketing philosophy, which is themost advantageous in terms of profit and volume
of sales. The analysis made with respect to pricing system followed in all silk
showrooms, revealed that all showrooms followed fixed price system. In
Government showrooms, the price is fixed by the respective head offices where in
private showrooms the price is fixed depending upon the profit margin expected,
30Munikrishnappa, H.M., Madhavarao, Y.R. and Mallikarjuna, B.M., 1996, Silk fabric marketing.The Indian Tex. J., 106(10): 48-49.

33
prevailing market demand, consumption and some time purchasing power of the
customers and further the study exemplified that weavers sold the goods to master
weavers followed by cooperative societies and relatively very few marketed either to
wholesalers or directly to the consumers
Mamatha (1997)31 in a study on “Socio-economic status of handloom
weavers and impact of weaving on their livelihood” concluded that 61 per cent of
weavers belonged to middle adulthood (41-60 years). More than 50 per cent of the
weavers were illiterates and had medium family size. Majority of the weavers
belonged to nuclear type family and middle income group. Women constituted 80
per cent of weavers in Assam. They were involved in silk weaving products like
mekhla, chadar, saree, riha and shirtings. On an average, about 24 mekhlas or 12
chadar or 6 sarees were woven on one loom per month and the weavers earned about
Rs.1200/- as piece wages further the study indicated that The traditional weavers
who produced Chanderi saree were Momin, Julah and Kori. However, in the recent
years, even Dhobi, Teli, Chamar, Yadav, Brahmins and Jains also have taken
weaving as profession. Weaving is done by men while reeling and spinning of yarn
is done by women.
Tondon (1997)32 highlighted that silk sarees are famous for their
exquisite beauty, splendid and ethnic designs. The marketing of these silk saree is as
complex and intricate as that of its production. The article deals with ‘Satti’- the
31Mamatha, A., 1997, Socio-economic status of handloom weavers and impact of weaving on their livelihood. M.H.Sc. Thesis, Univ. Agric. Sci., Dharwad 32Tandon, P., 1997, Marketing of Banarasi silk goods. Indian Silk, 35(10): 17.

34
traditional pattern and practice of buying and selling continuously is the backbone of
the merchandising silk sarees. Dharmavaramsarees are mainly used for special
occasions like wedding and festivals. These sarees sell like hot cake and are in great
demand all over Southern India, Tamil Nadu being the major market and the study
further revealed that majority of the silk weavers sold their products in local market.
About 20 per cent weavers sold their products in the state show rooms and only 8
per cent weaver to the neighboring states. Maximum number of weavers sold their
sarees during special occasions.
Muralidharan and Shanmugasundran (1999)33conducted a study on
“Dyeing of silk with acid dye involving Ammonium persulphate / Thio-urea Redox
system”. It was found that better dye uptake results could be achieved by using
Ammonium persulphate / Thiourea redox system during dyeing of silk with acid dye
than without it. The concentration of the redox system influenced the dye uptake.
Maximum dye uptake was observed at a concentration of 0.015 ml / litre redox
system; beyond which the dye uptake decreased with increase in redox system
concentration. The study further indicated that the use of redox system improved the
dye uptake and fastness properties of the dyed material. Maximum dye uptake was
observed at a concentration of 0.015 ml/redox system, beyond which the dye uptake
decreased with increase in the concentration of redox systems.
33Murlidharan, B. and Shanmugasundharan, M., 1999, A study on redox system assisted dyeing of silk with kemacid yellow-2G. The Tex. Ind. Trade J., 37(3-4): 107-109

35
Kannan Nair (2001)34 made a study on export performance of
Co–op Tex International have found that France accounted for the highest of total
European sales, followed by Netherland, Sweden, and Belgium. The major items
exported were table cloths, Napkins, Kitchen towels and tea towels. During 1996-97
it has exported handloom products worth Rs.362.24 lakhs. The authors have
recommended maintenance of agro free and eco-friendly dyeing in the export of
handloom products. Participation in and conduct of trade fairs inside the country and
abroad for exhibiting our innovative handloom products, exploring new export
market and undertaking detailed market research for improving export sales.
Kashi Ram (2001)35 insisted the need to concentrate on innovative
products, Keeping in mind the changes in fashion, colours, and designs in overseas
market. He further observed that in addition to the launch of Rs.25,000 crore
Technology Upgraditation Funds Scheme, a Comprehensive scheme for the
handloom sector under the Deen Dayal Hath Kargahprotsahan Yojana scheme has
been launched for taking care of the entire gamut of activities such as product
development, infrastructure support, institutional support, training to weavers,
supply of equipments and marketing support
Abdul Aziz and Hanummappa –H.G (2003)36examined the problems
and prospective of silk industries in India, The author identify the major problems of
34Kannan Nair , “Export performance of Co – optex International a study. “ TamilNadu Co-operation, November 2001. 35Kashi Ram Rana, in an address at the export Award function organized by the Handloom Export Promotion Council, Textile Magazine , March, 2001 36Abdul Aziz and Hanummappa –H.G. - “Silk Industry – problems and projects” 2003

36
silk industry as shortage of raw silk, high cost of Zari, and lack of goods marketing
policy on the part of silk societies. They strongly advocate the extension of the
rebate system for a longer period. They conclude that through a scientific
advertisement campaign in the international market silk export can be enhanced.
B. Bowonder, J.V. Sailesh (2005)37 examined the usage of ICT in silk
industries at Kancheepuram, the study highlighted that he silk industry in
Kancheepuram is one of the fastest growing industries in India. Thestudy found that
currently more than 30,000 weavers working for saree making. The industry had to
compete with the synthetic fibre industry in many aspects. One of the major
drawbacks of the silk industry in Kancheepuram was the lack of support from
technology. The industry was on the brink of extinction due to the obsolescence of
the designs and design making procedures. This is because design adds splendour to
a saree and forms an integral part of its exquisiteness. A recent development in the
designing field is the introduction of computerised Jacquard borders in the
Kancheepuram silk saree. The use of information and communications technology
(ICT) has not only helped in creating new and complex designs but has also reduced
the time involved in the process. There has been an increase in the exports. The
acceptance of these silk sarees by the consumers has also increased with the
automation of the designing process. Visualisation of saree designs ahead of its
production and the ability to create new colour combinations at the click of a mouse
has increased the flexibility and reduced the time for realising new designs. Though
the materials and the techniques are changing with the market demand, the motifs
37B. Bowonder, J.V. Sailesh “ICT for the renewal of a traditional industry: a case study of Kancheepuram silk sarees” Volume 6, Number 3-5/2005

37
are still conventional in accordance with the customs and traditions of the
Kancheepuram saree. The silk industry in Kancheepuram has been transformed into
a high growth industry by the opening up of new avenues for the traditional weavers.
Subbaraj, Dr.B.and Joseph Nelson (2004)38 made an empirical analysis
on the product strategies of handloom weavers’ co-operative societies made for the
period from 1992 to 1993 – 2001 to 2002 in Dindugal District, Tamil Nadu have
observed that the PWCSs under study have simply adaptive the design as specified
in the production orders of the co-optex and the initiative and the efforts of the
PWCSs on design developments to be very little. The study further discloses another
important finding that weavers tend to resist change in the production of certain
fabrics in which they lack skill although the fabrics have ready acceptance in the
market. The reason adduced by them is that they are unable to bear the cost of
change over from one design to another. They adovacte adoption of modern
marketing strategies in tune with market changes
Chakraborthy (2005)39 carried out study on “Effects of degumming and
bleaching”. The study revealed that, degumming with soap is best indeed; strength,
crease recovery and other properties are excellent. Feel of degummed sample is
superior because a negligible part of soap retained by the fiber, which provides
suppleness. However, to reduce the 9 cost, soap can be partially eliminated by
introducing sodium carbonate (Na2CO3). Degumming may be done using alkaline
38Subbaraj, Dr.B.and Joseph Nelson, “An empirical enquiry, Indian Co-operative review, Jan 2004, pp 166-172 39Chakraborty, J.N., Gupta, R., Rani, V. and Das, M., 2005, Chemical processing of silk. The Indian Tex. J., 116(3): 39-51.

38
non-ionic detergent solution for further reduction in the cost of degumming.
Bleaching, if required can be carried out by hydrogen peroxide/ammonia
(H2O2/NH3) to improve whiteness as well as other post-degumming properties. The
degumming with 25 per cent Marscicelles soap for 90 minutes at boil lead to a
weight loss of 20.5 per cent, the study further indicated that the The enzyme
treatment was carried out relatively at a lower temperature and therefore was more
economical than the conventional process. Processing of silk with enzyme under the
above conditions was likely to retain the luster and softness of silk. Thus,
considering the weight loss and properties of silk, fungal protease could be used as
an effective degumming agent.
Prem Kumar and M. Sadika Sultana (2010)40primarily aimed at
understanding the local market and secondly to develop a marketing strategy for
Handloom exporters in Puducherry. The respondents were customers & exporters in
Puducherry state. The data collection was carried out for a period of two months.
The sample size of retail customers and exporters were 80 & 9 respectively. Statistic
tools such as simple percentage, chi-square analysis, and time series were employed.
The study revealed that number of the exporters depends upon domestic market.
Retailing was found to be the best way to promote their products in domestic
market. It also revealed that domestic market occupies 30% of total business and a
number of exporters are dependent on domestic market in this financial downturn.
Based upon the results a few strategies were suggested to improve the sales of
handloom products. 40Prem Kumar and M. Sadika Sultana “STRATEGIES TO IMPROVE SALES OF HANDLOOM PRODUCTS WITH SPECIAL REFERENCE TO PONDICHERRY” TECNIA Journal of Management Studies, Vol. 4, No. 2, October 2009 – March 2010

39
Venkatesh Kumar R., SeemaChauhan (2010)41 examined the
participation of rural women in rural industries, empirical studies become
imperative. Withstanding all social and cultural suppressions, a rural woman in India
shares abundant responsibilities and performs a wide spectrum of duties in running
the family, maintaining the household, attending farm labour, tenting domestic
animals and extending a helping hand in rural artisanship and handicraft, relatively
high profitability of sericulture, its potential in generating additional employment,
etc. are widely acknowledged, it is also necessary to highlight the enormous
promises that sericulture holds for women’s development. Except for dairying, there
is probably no other off-farm activity which would promise as great a scope for
women’s development as sericulture, the study also found that Among different
components of sericulture i.e., from soil to silk, approximately 50-60 per cent of
different activities like mulberry cultivation, silkworm rearing, and reeling, twisting,
weaving and printing involvement of women need to be strengthened and
encouraged. Not only because women have have more than 60 had per cent of the
labour forced in sericulture, but also because sericulture offers a plethora of
opportunities for improving the social status of women.
Kuldeep Singh and Monica Bansal (2012)42analyzed the handloom
industries in India, the study highlighted that the handloom industry has developed a
lot over a period of time. It is spread throughout the country. Since most of the
handloom units are run either as sole-proprietors or on partnership basis and the 41Venkatesh Kumar R., SeemaChauhan, “Women Empowerment in Sericulture: A Current Scenario in Rural India” ASIA-PACIFIC JOURNAL OF RURAL DEVELOPMENT Volume XX July 2010 42Kuldeep Singh and Monica Bansal “AN ANALYTICAL STUDY OF HANDLOOM INDUSTRY IN INDIA” Volume 1, Issue 12(December 2012)

40
owners lack the needed professional outlook in the overall handing of their units,
many of them are not even aware of the modern techniques of marketing such as
product development brand promotion, packing, advertising market, surveys and
demand forecasts. To maximize their sales volume, it has become very important to
know how one can get maximum result/response by using different marketing
strategies. For increasing the export, to provide satisfaction to customers there is
need of the study of marketing practices.
Surjit Kumar Kar, (2012)43 Undertaken a case study of Sambalpuri
Bastralaya Handloom Co-operative Society Limited (SBHCSL), or “Bastralaya”, is
a rural community-based cooperative enterprise in the Western province of state
Odisha in India the purpose of this paper is to explain traditional knowledge
management process of the community, total of 40 respondents from among
enterprise employees, members of weaving and sales branches, members of
government/ non-government agencies were interviewed/ observed. A qualitative
research method called “narrative enquiry” was used to restory and interpret
respondents' data and stories gathered from the field study. Analysis of documents
was also a method used, the study found that for management of knowledge
processes, Bastralaya focuses on creating members' skills and knowledge, i.e.
creation of contextual skills and knowledge, in addition to existing generic tacit
knowledge; building members' competence and capturing new knowledge;
crystallizing new knowledge for customer-focused design and organizational 43Surjit Kumar Kar, (2012) "Knowledge process of rural handloom community enterprise: A narrative study of SambalpuriBastralaya in India", Society and Business Review, Vol. 7 Iss: 2, pp.114 – 133

41
learning; and finally, knowledge preservation and internalization. Community
weavers inherit traditional weaving knowledge across generations and learn
informally through interaction, observation, socialization, co-operation and
apprenticeships in the natural settings of the co-operative enterprise system
Bandana Mahan (2012)44made anattempt to introduce the silk industry
of Assam and its relation to the tourism sector. Problems related to the production,
spinning, weaving, selling and focusing of the products, economic upliftment,
modernization of the products, government and other organization efforts in this
connection is also mentioned in the study. The study is based on primary and
secondary data collection; the author found that various government programmes
provide avenues for the quality fabrics, modernization of loom, and motivation of
weavers for taking up the industry as commercial lines, intention of training
facilities to artisans etc. Government of India has initiated several development
measures through Central Silk Board to give impetus to the growth and development
of silk industries. The Central Silk Board has put a lot of efforts to promote muga
industry in the north- eastern region. Setting up of a Regional Muga Research
Station in Mirza (Assam) is a major step in this direction. The Central Silk Board
also set up a Muga Raw Material Bank at Sibsagarh with sub- depot at Dhakuakhana
in upper Assam in the year 1981, to give necessary price support to the commercial
muga cocoon producers. Tourists always attracts to the original object. These
societies can provide the silk items in a reasonable price. Government may arrange
some package tour to see the silk producing process in the rural areas. Extends to the
reeling, spinning and weaving centers too. To promote and sale of the silk of Assam
44

42
a web page can be set up also, because, abundance of local talents can come up with
many more ideas. Thus, the culture will be diversified and standardized. Then the
traditional silk industry can be metamorphosed into modern industry, what is
necessary to courage and enterprise, imagination and guidance.
G. Savithri, P. Sujathamma& CH. Ramanamma (2013)45 illustrated
that the Textile industry is a very important component of India s economy, and silk
forms a small, yet important part of it because it is a high value fibre. The size of the
silk industry in India presently, is about US $ 2.75 billion. Sericulture is spread all
over India, while it has a long standing tradition in states such as Karnataka, Andhra
Pradesh, Tamil Nadu, West Bengal and Jammu & Kashmir. Silk the very name itself
evokes delicate feelings. Silk is the most elegant textile in the world with
unparalleled grandeur, natural sheen and inherent affinity for dyes, high absorbance,
light weight, soft touch and high durability and is known as the queen of textile in
the world ever. Silk has a sacred place in the cultural heritage of Indians and
intermingled with the life and culture of the Indians; which no other country can
share. Silk saree is an important bridal wear while the traditional practice of wearing
silk clothing on all auspicious days has been the strength of the Indian silk in the
domestic market. No other fabric has fascinated man so continuously over millennia
as silk. Till today, no other fabric can match it in luster and elegance Silk has been
intermingled with the life and culture of the Indians. Though India is producing all
the varieties of silk garments i.e., dress materials, scarves/stoles, readymade
garments, etc., the silk sarees are unique. The saree is almost synonymous with the 45G. Savithri, P. Sujathamma& CH. Ramanamma “GLORY OF INDIAN TRADITIONAL SILK SAREES” International Journal of Textile and Fashion Technology (IJTFT), 3(2), 61 – 68. 2013
43
word silk. It is the traditional costume of Indian woman since time immemorial. The
silk sarees of India are among the living examples of the excellent craftsmanship of
the weavers of the country. The artistic and aesthetic sense of Indian weavers is not
content with striking colours they choose for the fabrics, but lies in their mastery
over the creation of floral designs, beautiful textures, fine geometry and the
durability of such work. The weaver not only weaves with yarn but with intense
feeling and emotion. Indian handloom silk sarees known for their unique features
like beautiful colour combinations, intricate designs and wonderful motifs, tops the
demand of the domestic market. In India, there are a number of silk weaving centers
spread all over the country, known for their distinct and typical style and products.
South India is the leading silk producing area of the country also known for its
famous silk weaving enclaves like Kancheepuram, Dharmavaram, Arni,
Pochampalli, Gadwal etc. The beauty of the silk is the key to having wonderful silk
sarees. Hence the paper made an attempt to enlighten the world famous Indian
traditional handloom silk sarees.
Studies pertains to socio-economic conditions of Handloom weavers
John D.K.Sunder Singh (1981)46examined the conditions of handloom
industries in Madurai, the author recalled the traditional significance of the silk
products in Madurai in earlier period of time, It is an exhaustive study of the
Handloom industry in southern parts of Tamilnadu in general and Madurai city in
particular. It is a pioneering work of silk industry at a city level. The author is of
opinion that through a better marketing strategy the handloom industries would
46John D.K.Sunder Singh- The Handloom Industry in Madurai City. (1981)

44
enrich its potentiality and unleash the number of benefits to the consumers as well as
the weavers who have been engaging in it.
Namasivayam (1989)47 made an attempt to analyze operational
efficiency of the handloom weavers of co-operatives in Salem district, 20 handloom
co-operatives societies have taken up for the study purpose, and the survey revealed
that Silk Handloom Societies were successful in marketing their products when
compared to cotton handloom societies of the District. The rebate scheme played a
vital role for the success of the handloom weaver co-operatives. The study suggests
more liberal rebate scheme than the one in operation for the betterment of the
handloom silk weavers in the study area.
K. Rama Mohan Raoand G. Subrahmanyam (1995)48 analyzed various
crises affecting the industry and evaluated several schemes of Central Government
provided to the sector. They found that the co-operatives could attract only 30 per
cent of the total weavers of the country and a majority of weavers were still working
under the middlemen. Inadequate or improper financial support to the co-operatives
was considered one of the main reasons for their failure. The weavers were found to
be following traditional methods of production and design due to lack of exposure,
awareness and knowledge over changing technologies. The shortages of raw
materials and marketing have been severe problems for several years to the industry
and competition over the years has increased in the textile sector particularly after
47Namasivayam – Operational Efficiency of Handloom weavers Co-operative Societies in salem District of TamilNadu(1989) 48Rama Mohan Rao K. &Subrahmanyam G, .Crisis in the Handloom Industry: Some Solutions., Kurukshetra, Vol. XLIII, No.12, September 1995, Pp. 36.38.
45
the introduction of powerlooms. They recommended that the weavers must be
oriented towards the betterment of their skills, knowledge and technology in order to
ensure better quality of life.
Satya Narayana Dash (1996)49 aimed at assessing the economies of
handloom weaving among different caste groups in order to identify the process of
decline at work and to evaluate the differential impact of competition on the
different components of handloom sector. The study found that the differences arose
primarily between handloom and non-handloom cloth because of specialization in
terms of income groups, occupational groups, yarn count categories and product
groups. The author further revealed that the handloom industry is facing the
problems of scarcity of yarn, raw material and lack of sufficient marketing facilities.
The weavers are also facing the problems of lack of proper financial facilities. The
weavers in the State of Andhra Pradesh required financial assistance from the
commercial banks but the commercial banks failed to extend their support regarding
loans and advantages. At the same time the weavers also required adequate supply
of yarn at reasonable prices.
K. Rama Mohana Rao (1997)50 made an attempt in the direction of
conducting district level studies. The main objective of the study is to measure the
impact of primary handloom weavers’ co-operative societies on the socio-economic
conditions of weavers in the Visakhapatnam district, by choosing 250 weavers who 49SatyaNarayana Dash, .Role and Working of Handloom Industry in Western Orissa. Finance India, Vol. X, No.1, March 1996, Pp. 108. 110. 50Rama MohanaRao. K., .Impact of Handloom Co-operatives on the Socio-Economic Conditions of Weavers in Visakhapatnam District., Indian Co-operative Review, Vol. XXXV, No.2, October 1997, Pp. 126.132.

46
are members of cooperative societies. The author analyzed the impact of the social
life of the weavers with the help of the factors such as improvement in social status,
better household facilities to children, ability to spend on family members,
entertainment, confidence in future and participation in local associations. He
suggested that the Government should review the functioning of various primary
weavers. co-operative societies to find out the real problems and take appropriate
measures to strengthen and develop the co-operatives in order to direct them to play
a key role in the development of weaving community. The major problems facing
the industry such as marketing, finance and supply of yarn were highlighted. In
addition, the study also evaluated the efficacy of various policies adopted by the
Government for the development of the handloom industry.
Venugopal Rao and Chandrasekhar (1998)51 made an attempt to
identify the problems faced by handloom weavers and examine the various schemes
designed for the promotion and development of the handloom sector such as yarn
supply, production of cloth in handloom sector at reasonable prices, marketing
assistance, welfare of weavers, research and development, publicity and exhibition,
enforcement of Handloom Reservation Act, technical and design support through
Weavers Service Centres, special package schemes for SC/ST weavers, area based
handloom development projects and processing facilities. The authors found that in
spite of the implementation of developmental and welfare schemes, the economic
conditions of handloom weavers did not improve and the co-operative coverage has
met with only a limited success. Weak organizational functions of co-operatives, 51VenugopalRao K. and Chandrasekhar M., .Problems of Handloom Industry., Kurukshetra, Vol. XLVI, No.6, March 1998, Pp. 24.26.

47
inadequate credit from financial institutions, inadequate marketing infrastructure,
steep increase in yarn prices, huge build-up of unsold stock and delayed payments to
primary societies by the Apex Society, competition from the organized mills and
decentralized powerlooms, etc. further deteriorated the weavers conditions. They
suggested that the Indian handloom products have the potential to attract foreign
buyers, if the industry adheres to the quality standards and innovations in the
designing of products.
Kanakalatha Mukund and Syamasundari (1999)52 carried out study to
examine the functioning of weavers. Co-operatives and analyse the problems of the
co-operatives both of internal management and of the external policy regimes. Their
study related to four co-operative societies, viz., Polavaram Co-operative Society of
Krishna district, Venkateswara Cooperative Society in Chirala of Prakasam district,
Yemmiganur Co-operative Society of Kurnool district and Koyyalagudem Co-
operative Society of Nalgonda district. The authors found that the
PolavaramSociety.s price structure was unable to meet its production costs and the
society did not have surplus funds for providing advances to the working weavers
and that this society was split into three societies. Weavers in Chirala suffered from
low wages due to several weavers migrating in from Cuddapah and East-Godavari
districts to work as job weavers in this region and co-operatives also suffered
because of the inordinate delay in releasing the amounts sanctioned under
Government schemes. The Yemmiganur co-operative society faced a major problem
of capital being locked up by the buying of too much land for setting up sales depots 52KanakalathaMukund and Syamasundari. B., .Doomed to Fail?.Handloom Weavers. Co-operatives in Andhra Pradesh., Economic and Political Weekly, Vol. XXXIII, No.52, Dec.26, 1998-Jan.1, 1999, Pp. 3323.3332.

48
in various places. Koyyalagudem society was unable to provide adequate work to
the weavers so that the weavers preferred to work for master weavers. They
suggested that the Government should extend support to the cooperatives for
strengthening the societies.
Prabhakara Sarma & Joglekar (2002)53 examined the existing working
pattern and performance of the two weavers. co-operative societies to identify the
socio-economic conditions of weavers families in the East Godavari district of
Andhra Pradesh. The authors found that the handloom industry has been surviving
on hereditary basis and the parents/elders of the family are not promoting entry of
their children. The basic input of yarn in the handloom industry is not available
timely to the weavers and marketing of handloom cloth is one of the problems. The
co-operative societies were wholly dependent on the Apex Society for marketing of
their products and making the timely payments. At present, weaving provides
income at the subsistence level only and savings of household is almost nil or
negligible. The use of outdated looms is resulting in low production capacity of the
looms. The authors suggested that the Government should authorize district
cooperative bank to grant loans to societies for adjustment of payments and make
alternative arrangements for marketing of their finished products, instead of
depending on Apex Society. The societies should take initiatives to expand and
strengthen the co-operative coverage of weavers and improve their welfare facilities.
They identified the need to upgrade primitive looms with modern structural
53PrabhakaraSarma&Joglekar P.V.N., .Upgradation of Handloom Cooperatives., Indian Co-operative Review, Vol. XXXIX, No: 3, January 2002, Pp. 234.243.

49
materials and providing training programmes to weave new designs and to enhance
the production capacity.
Noorbhasha Abdul and Badrinarayana (2002)54 analysed the crisis in
handloom industries, the author found that the crisis in the handloom industry had its
roots in the National Textile Policy 1985 which had allowed indiscriminate growth
in the number of power looms in the name of promoting the country’s fabric out put.
In their analysis they have concluded that failure to make available supply of
sufficient yarn at reasonable prices to the most important factor hitting the handloom
sector.
P. Karunakaran and Joseph Nelson (2002)55 have analyzed factors
responsible for the present plight of Handloom weavers. In their opinion frequent
price fluctuation of yarn and its shortage accentuated the crisis in handloom
industry. The quality of Yarn from private mills is said to be much superior to that it
procured from Co-operative spinning mills.The condition that weavers should get
only from Cooperative mills have driven the weavers to the wall. The study also
points out that inadequate flow of institutional credit, lack of marketing
infrastructure, increase in cotton yarn prices, delayed payment to primary societies ,
delayed payment to primary societies by the apex society all have been responsible
for the present condition of handloom industry. The growth of powerloom industry
posed the greatest danger to handloom weavers. It has sidelined the handloom
54Noorbhasha Abdul and Badrinarayana, S.V. “Role of A.P.C.O. in the promotion of Handloom co-operatives in Andra Pradesh “ Indian Co – operative review, July 2002. PP. 52 &53 55Karunaharan ,Dr. R. and Joseph Nelson Dr. D. “Plight of Handloom Weavers Need for vibrant action”, Tamil Nadu Journal of Co-Operation , April, 2002. PP. 26---29

50
industry in many parts of Tamilnadu. The Handloom weavers in Southern part of
Tamil Nadu have switched over to beedi industry.
Horindra Gogoi and A.K. Sharma (2003)56 made a study on impact of
Weavers co- Operatives on members in employment in Assam in1988, the study
revealed that employment from weaving as well as total employment of member
house holds was significantly higher than that of non-employment of member
weaver holds thereby showing the positive impact on the earnings of member
weaver households accentuated by weavers co-operatives. The study has also
conducted that apart from high price of yarn, its irregular supply and non-availability
of new design of weaving at low costs were the major marketing problems.
Gupta, Dr. p. and Mrs. Sudha Babel (2004)57 examined the problem of
handloom weavers in Rajasthan, the study found that non-availability of new
designs and modern tools were cited as problems by weavers working for middle
men. The economic conditions of handloom weaving unit does not depend merely
on the quantity and quality from private mills is said to be much superior to that
procured from cooperative spinning mills. The condition that weavers should get
only from cooperative mills, but it also influenced by the intelligent selling of the
product to get maximum profit. Hence they stress the needed for educating and
training weavers on production cloth to suit the changing fashion.
56HorindraGogoi and Sharma ,A.K.”Impact of weavers cooperatrives on members unemployment – a case study “ Indian Cooperative Review, January 2003 . PP. 51. 57Gupta, Dr. p. and MrsSudha Babel, “Problems of handloom weavers in Rajasthan” The Textile Magazine, 2004, pp 30-32.
51
Nagarajan (2004)58 made and analysis of marketing environment and
dynamics of textiles in Chitoor district, while analyzing marketing environment of
handloom products, advocates a strong case for middlemen as otherwise the weaver
has to cater to the needs of local consumers only. It is middlemen who carry the
clothes and arrange for bulk display as a measure of widening the market. In his
opinion, “the absence of proper and sufficient facilities to safeguard the interest of
weavers leads to the entrance and existence of middlemen and their inevitable
participation in the sales of handloom products.
Sameer Sharma (2004)59examined the entrepreneur development among
weaver clusters, the study found that the weavers were formed into consortia to help
themselves by mobilizing limited resources, providing avenues for collective action
and overcoming constraints associated with size, promoting technological
development and enhancing their ability to compete in local and global markets. He
explained the three kinds of networks operating in weaver clusters of Andhra
Pradesh: Co-operative and Government Traders, Master Weavers and Non-
Government Organizations. He traced out the major problems faced by weaver
clusters of Andhra Pradesh to design gap, weak institutional linkages, technological
gap, low value addition, lack of innovation, stagnant weaver skills and inadequate
working capital, low turnover and rising inventories. Finally, he drew important
lessons from the Pochampalli experiment. First, it is possible to assist traditional
58Nagarajan “Marketing dynamics of textiles, a case for handloom products in Chitoor District” paper presented at the Nationall seminar on marketing in the New Era – Sri Venkateswara University, Andra Pradesh, 2004 59Sameer Sharma (Commissioner of Industries, Government of Andhra Pradesh), .APCO . An Experience of Restructuring an Organisation in an Emerging Market Economy., Indian Co-operative Review, Vol.42, No.1, July 2004, Pp. 26.34.

52
producers like weavers to participate in an evolving market economy. They require
.total. Assistance covering all dimensions of their life, to reach the critical mass
necessary to assist the weavers to break out of the subsistence production cycle. In
Pochampalli, the interventions included health care by corporate hospitals,
construction of work-sheds and houses, and a complete menu of economic benefits.
Secondly, the interventions should be decided in close consultation with the
stakeholders and have the flexibility for mid-course corrections. Thirdly, inputs from
technical experts, like NIFT and continuous business mentoring is required to assist
the transition of such producer groups to a market economy.
Jyothi and Aruna (2006)60focused on the production, pricing and
organisational problems of handloom industry. For that purpose, a field survey was
conducted in Krishna District by taking into account 30 Handloom Weavers Co-
operative Societies and 70 Master Weavers as sample. In this study, the authors
pointed out the lapses of the Government in respect of non-compliance of the rule of
hank yarn to be produced by the spinning mills and the supply of yarn by the
NHDC. This was found to be the prominent reason for most of the weavers and
master weavers to buy the required yarn from the mills and there is no strict control
exercised on the regulation of prices of yarn, dyes and other chemicals. According to
this article, cotton yarn prices have thrown the handloom industry out of gear at a
time when stiff competition from the powerloom sector has made survival difficult,
particularly in Andhra Pradesh, Tamil Nadu and West Bengal. But most of the State
Governments appeared to be lukewarm in enforcing the reservations as the
60Jyothi and Aruna, .Problems and Prospects of Handloom Industry.,Indian Journal of Commerce, Vol. 59, No.1, January-March 2006, Pp.87.95.

53
powerlooms lobby is active and directing mills to produce hank yarn to the
stipulated requirement for distribution to handloom units. But many mills are not
fulfilling this obligation on the plea that they do not have adequate supply of reels to
produce hank yarn.
K.V. Rao and G. Naga Raju (2008)61 evaluated the various problems,
viz. production, marketing and organization faced by the handloom industry in
Andhra Pradesh. The major findings of the study are: the powerloom sector is able
to misuse the concessions given to handlooms and the former is able to produce the
reserved varieties of handloom sector. The spinning mills were unable to produce 50
per cent of yarn in the form of hank yarn. There was also inadequate supply of raw
materials and their high prices. Weavers are mostly using traditional type of pit
looms. Further, marketing of handloom products in Andhra Pradesh was one of the
most important problems. Existence of number of intermediaries between the
producer and the consumer is yet another significant issue. Various schemes have
been implementing by the Government for the promotion and development of
handloom industry and welfare of handloom weavers, which were also not able to
increase the living standards of the handloom weavers. The author suggested that the
APCO and NHDC should open number of yarn depots or yarn banks at the
prominent handloom centers of Andhra Pradesh to maintain stability in the prices of
yarn and other raw materials. Financial assistance shall be provided in collaboration
with the banks and financial institutions to enable weavers to acquire latest type of
61K. V. Rao& Naga Raju G, .Working of Handloom Industry in Andhra Pradesh., Indian Co-operative Review, Vol. 46, No. 1, July 2008, Pp. 1.21.

54
looms and to overcome the financial problems of both weavers and co-operative
societies.
Suresh Kumar and Ganesh (2008)62 analyzed the distribution of income
between member and non-member weavers, find out variations in the expenditure on
essentials and trace out difference in savings and investment pattern of members and
non-member weavers. The authors found that the income of member weavers was
very high over the income of non-member weavers; so that they were able to spend
their income on essential commodities of food, cloth, etc. and utilized marginal
savings for acquisition of required assets. They suggested that the non-member
weavers should become member weavers so that they would also get the benefits as
enjoyed by the member weavers and increase their social and economic status in the
society. The author particularly highlighted the issues such as poverty, low standard
of living, hunger, poor health, malnutrition, illiteracy, deceases, poor sanitary
housing conditions, lack of communication and infrastructure facilities. He found
that socio-economic conditions of the weavers were in poor state. Finally, he
suggested that the Government should take measures to provide food security and
wage employment programmes and implementation of labour welfare schemes.
NarasinghaBehera (2009)63 focused on economic impact of working of
Weavers. Co-operative Societies on member-weavers in Bargarh district of Western
62Suresh Kumar K.S. & Ganesh G., .Product Strategies of Handloom Weavers. Co-operative
Societies . An Empirical Enquiry. Kurukshetra, Vol. XLVI, No.5, Pp. 45.46. 2008
63NarasinghaBehera, .Economic Impact of Weavers. Co-operatives on Member . Weavers in Bargarh District, Orissa., Journal of Rural Development, Vol. 28, No. 2, April-June 2009, Pp. 159.168.

55
Orissa for the period from 1993-94 to 2000-01. For this study, 173 active members
and 45 not-active members from nine Weavers. Cooperative Societies were selected.
The study covered the aspects like age, education, experience, ownership of looms,
number of working days, family size, income, expenditure pattern, savings, dwelling
house, loom-shed, household properties and indebtedness of weaver members. He
found that the Weavers. Co-operative Societies were providing employment
opportunities to the members on an average for 252 days in a year. The member-
weavers were getting wages regularly from the weavers. Societies for weaving the
cloth. The primary weavers. Co-operative societies were able to help increase the
income of member-weavers. Thus, he suggested to the Government to take measures
to attract more non-active members towards societies, so that they also could draw
benefits from the societies.
L.P. Ramalingam (2010)64 assessed the socio-economic conditions of
handloom weavers in Madhurai district of Tamil Nadu. The study mainly analysed
the socio-economic factors of age, gender, marital and educational status,
occupational distribution, ownership of house property and occupational diseases.
The major findings of the study are: i) majority of the weavers are in the age group
of above 40 years; ii) educational status of the weavers is below 10th standard; iii)
system of occupation is hereditary in nature; iv) 88 per cent of the weavers lived in
rented houses and 91 per cent of the weavers were attacked by occupational
diseases. Finally, the author suggested some measures, viz. attracting young
generation in this field, conducting periodical medical camps, extending loan
64Ramalingam, .Socio-Economic Status of Handloom Weavers.,Kisan World, Vol. 38, No.1, 2010, Pp. 29.31.

56
facilities to the eligible weavers and providing minimum guaranteed wage, PF, etc.
to regain the glory of handloom industry. Further the study revealed that member
weavers of co-operatives did not gain anything so far as their exposure to mass
media is concerned; Weavers association with co-operative organization did not help
in improving organizational matters; Member weavers were aspiring for higher
education of their children and spent more money for the same purpose. They were
not interested to put their children in the traditional profession, because of lack of
scope for comfortable living.
I.M. Desai (1978)65 in his study clearly indicated its commitment to the
development of cottage and small scale industries including the 3.8million
handlooms which provide rural employment to over 10million weavers in this
industry. This revolution in rural India will not merely assure continuous
employment to the handloom weavers but also help in sustaining and reviving the
rich folk arts and crafts of our age and old culture which should be given rightful
place of dignity and prestige in the society, clothing occupies the second position
among the three absolute necessities of human life. His work concentrates on the
history of the industry which dates back to 5,800 years, its socio-economic
importance, the problems faced by this Industry and also reasons for its nation wide
popularity. His work also reveals the structure, organization and wage conditions in
the handloom industry. It also suggests the measures suitable for the improvement of
handloom industry in India.
65I.M.Desai, “Living with Indian Handlooms”, Journal of Industry and trade, Vol.XXVIII,No.9 &10,September & October 1978. p.13-15.
57
K. Bharathan, (1983)66 in his study, which looks into the change in the
relative share of workers of the cloth industry of Tamil Nadu, comes out with his
finding that the industry is losing ground on the basis of employment potentialities.
He ascribed it to the „inconsistency in the policies of the Central and State
Governments. He also states that the women constituted about one third of the total
workers in the industry in 1961 and were to be found relatively more in the
household than in the non-household sector. But in 1971, the share of the women
workers has increased to a little above the third of the total workers, the fabrics
produced in handlooms as could be expected would be costlier to produce as
compared to other sector, the extent of difference over powerloom sector being on
the average about 22 percent with cotton fabrics. This increased cost of handloom is
due to the higher conversion cost, consequent to the very low labour productivity.
The labour productivity in weaving alone is extremely low, handlooms requiring
more than 100 operative hours to produce 100metres of fabric, which is labour 12 to
15 times the operative hours employed in the other sectors
Jain L.C.(1983)67 in his study in his serious problems faced by the
handloom sector has observed that though banks were nationalized in the name of
poor producers like handloom weavers, the latter have not received even 10 per cent
of their requirements, while colossal sums of soft loans are being pumped into the
mills. If anything, there is a flow of credit in the reverse direction. (i.e) form the 66Bherathan “Cotton handloom industry in Tamil Nadu”, Working paper, Madras Institute of
Development studies Madras, June 1983, p.4. 67Jan.L.C, “Handlooms face liquidation”, Economic and Political weekly, Vol.18, No.35, August
1983, P.1521-1522

58
handloom weavers to the government due to inordinate delays in reimbursement of
rebate and subsidy,a majority of the weavers in the country are in fact illiterate albeit
being adepts in their own line of activity. Because of their inadequate earnings from
the profession, they are not financially sound enough to carry on the production as
well as marketing activities with their limited funds. New and again, they have to
depend invariably on master weavers both for business as well as for subsistence.
The performance of the existing institutional infrastructure both for financing and
marketing of handlooms is far from satisfactory. Co-operative movement in the
industry has also not developed on sound lines. Though there are a very few
societies contributing to the improvement of the socio-economic lot of the weavers,
a majority of the societies in the country are found to be in dormant shape. This is
further observed that in some handloom centres where the co-operative societies are
ineffective and dormant, the master weavers are more active in controlling the entire
business
A.K. Rajula Devi, (1983)68 states that on the marketing side, the apex
body of the primary societies popularly known as „co-optex markets about 50 per
cent of the fabrics produced in the co-operative sector. It has been directed to
procure the entire production of small primaries whose annual sales turnover does
not exceed Rs.5 lakhs and 50 per cent of the production of the remaining societies,
the author further ascribes this meagre response of the handloom industry to the co-
operative sector, to the ignorarce to the weavers towards their coming under the co-
operative fold. It is the task of government machinery to inculcate the advantages of
68Rajula Devi, “Plight of Handlooms”, Kurukshetra, Vol.XXXI, No.7, January 1, 1983, p.21.

59
co-operatives sector in the minds of handloom weavers so that better response can
be had in future. The following statement shows the progress of the Tamil nadu
Handloom weavers’ co-operative society Ltd., Madras. This society was established
in 1935 and it gives an impetus to the development of weaver s co-operative in
Tamilnadu
Ramesh M. Bhatt (1983)69 in his study estimated that a large number of
women engaged in handloom sector either as weavers or as supportive workers in
pre-weaving and post weaving activities. This study was conducted between
November 1981 and September 1982 in Mahesena district of Gujarat. About 1010
households were surveyed in 125 villages. The aim of this study was to analyse the
potential of women employment in the district. There were 1953 adult women
amongst the 1010 house holds. It is estimated that out of 1953 adult women 60
percent were in the age group of 15 to 35 years and about 42.8 percent women were
illiterate. Nearly 38.89 per cent of women were engaged in weaving as a subsidiary
occupation. The author states that the widespread participated of women in activities
pertaining to weaving clearly indicates that there is tremendous growth of
employment opportunities for women in the hand-loom industry. The author also
observed that at present they are not paid for any pre weaving operation. They do
but from weaving they could earn additional income. Besides the study reveals that
nearly 89 per cent of the women weavers are engaged in household activities. From
69Ramesh M.Bhatt, “Women should be Equal Partners in Handloom Sector”, Yojana, Vol.27, No.5
March 16-31, 1983, p.25.

60
this study it is clear that the employment of women in handloom industry is quickly
increasing with time.
K.Suyambulingam (1986)70 in his study “Handloom Exports in India”
reveals that in terms of employment, the handloom industry of the state is next
important to agriculture. This industry provides direct employment to nearly 20lakhs
people and livelihood to another 30lakhs people. This 50 lakhs associated with the
handloom industry is fairly big while compared to the total working population of
the decentralized sector of the state. Further, he states that the total working
population amounts to 35.69lakhs. So, the percentage of the weaving population to
that of the total working population of the district works out to be a flattering figure
of 31.88 per cent. This study clearly shows the significance and need of the
handloom industry terms of employment potentialities of the district in the days to
come and again makes oneself think of the extent to which employment opportunity
could be provided by them in handloom industry.
According to Nagen C. Das, (1986)71 the major obstacle that hinders
proper development of the handloom weaving industry despite its long traditional
background is its very low production. Though several factors are responsible for
this state of affairs, one aspect that has become more prominent is the presence of
large number of women weavers and that also, large majority of them are not
70K.Suyambulingam “Handloom Exports in India”, Co-operation, August 1986,p.116
71NagenC.Das, “Development of Handloom Industry”, Deep and Deep Publications, New Delhi,
1986,p.40-61.

61
professionalized which presents the absence of commercial weaving, the fruits of the
industry are actually grabbed by extortionate middlemen and as a consequence
majority of the weavers are not showing enthusiasm in this traditional profession.
However, they are continuing their present line of activity since they found no other
way to sustain themselves. The nation cannot afford to allow the handloom industry
to decay rapidly and die a violent death in struggle with the mills because of its
effects on unemployed segment of the rural population. Thus, the provision of
employment to the traditional weaving communities provides more a social
responsibility than an economic necessity.
B. Ramakrishna Rao and G.Subarahmanyam (1987)72 in their study
reveal, there is a necessity to safeguard the handloom weavers working from
middlemen. Strict enforcement of minimum wages for handloom weavers is highly
essential. A scheme similar to that of provident fund should be introduced in both
private and co-operative sectors, if necessary, by enacting legislation for the
purpose. The Government should come with heavy hand and should snub the
malpractices adopted by the master weavers. Further, it is also necessary on the part
of the Government to strengthen the co-operative societies financially and
administratively,organization of industrial weavers co-operation societies has been
one of the important schemes implemented by the state government for the welfare
of the loomless weavers. There are a large number of loomless weavers, struggling
72Ramakrishna Rao and G.Subarahmanyam, “Handloom industry in Coastal Andhra Pradesh: a
Survey”, Kurukshetra, Vol.XXXV, No.6, 1987, p. 14,15,16,21,22 & 34

62
hard under the master weavers, on whom they necessarily depend for their
livelihood.
Sahab Deen Maurya (1988)73 attempted a multidisciplinary approach to
the study of Indian Women. He studied histo-political, socio-economic and spatio-
cultural aspects of women in life. His study consists of two parts, ie., present nations
scene of women’s life and the current patterns of women’s status in different regions
of the country. In his study Maurya analysed the functional characteristics of women
in rural Uttar Pradesh. There are a number of obstacles and social restrictions that do
not allow women to adopt various occupations freely. Besides, some occupations
requiring hard physical and manual labour are not favourable for women. In the two
areas of Uttar Pradesh, Himalaya hills and Easter Utter Pradesh rural females are
more active and are engaged in agricultural activities. The author stated that the
cottage and rural industries like handloom industry provide ample opportunities and
such industries should be developed in such a way that they could provide more
employment to the rural women. He also observed that in the field of textiles,
handloom industry occupies a distinctive place in the state
V. Rajagopal (1990)74 in his study, examined the production and
marketing structure of handlooms in Kannur and Thiruvananthapuram Districts. He
says the location specific studies throw light on the structure and functioning of the
industry in particular regions and provide greater insights into the dynamics of the
industry. He found that the production in kannur is centralized. On the other hand,
73Maurya, S.D. “Women in India” Chugh publications, Allahabad 1988. p.2.
74Raja Gopalan.V. “The Handloom Industry in North and South Kerala: A study of production and Marketing structure” Centre for Development Studies, 1990
63
independent weaving household exist in Balaramapuram, which markets their goods
by having them in the daily evening markets or in the village fairs. He found that
there was marked decline in the number of persons engaged in the weaving. This
decline may be possibly have been on account of severe competition from machine
made goods. In the present century also, all types of mundu, neriathu and thorth
constitute the bulk of the product mix in South Travancore. The industry in this
region was traditionally differentiated in its product mix. While one sector of the
industry produced fine varieties the remaining section concentrated on the
production of coarse varieties of cloth. Also in this region the industry was
essentially oriented towards the domestic market. Also he found that most of the
primary co-operatives in Thiruvananthapuram districts do not have any particular
production strategy.
Subathra (1994)75 has pointed out in her study that, India adopted a
developmental model based on protection of domestic industry against foreign
competition; the creation of a public sector, and a degree of protection for the small-
scale, labour –intensive industrial production in the decentralised sector against
large-scale capital-intensive production in the domestic formal sector. This
development strategy was followed for thirty years since independence with the
variation in policy, although a major change in the direction of a more export-
oriented strategy emerged late in the 80s. While Nehru’s policy of mixed economy
aimed to protect traditional industries and bring up modern industries, Narashimha
75B.Subburaj, “A change in Approach for Sustainable Employment by Handloom co-operatives”, The Tamil Nadu journal of Co-operation, Vol.80, No.12, March 1995,p.29.

64
Rao’s government followed Rajiv Gandhi s policy of clearing the way for liberal
economy. This had meant curbing all restrictions over „Protected Interests
Aswini Kumar Mishra (1994)76 brought out the impact of handloom co-
operatives on social life-style of weavers in Western Orissa. The major findings of
the study were that: (i) member weavers did not gain any things of aras their
exposure to mass media is concerned; (ii)Weavers association with co-operative
organization did not help in improving organization almatters; (iii)Member weavers
were aspiring for higher education of their children and spent more money for the
same purpose. They were not interested to put their children in the traditional
profession, because of lack of scope for com for table living.
According to U.M. Shah, (1995)77 the handloom weavers, mostly
belonging to economically weaker section, have been brought into co-operative fold.
Though about 21 percent of the commercial looms are actively involved in the co-
operative sector, the co-operative coverage is about 58 per cent of the total
handlooms in the country estimated about 39lakhs. Progressive co-operatisation of
handlooms is a significant achievement of co-operative development in India, which
besides ensuring adequate and timely support of yarn and other raw materials has
helped in the marketing of finished textiles. To a considerable extent, the handloom
weavers have been saved from exploitation through a net work of 1,51,522 primary
handloom co-operatives working in different parts of the country The Journal on
76Aswini Kumar Mishra(1994)“Social Impact of Handloom Co-operatives on Weavers in Western Orissa: An Empirical Study”, Journal of Rural Development, Vol.13, No.2, April-June 1994, Pp. 259-267. 77Shah, “Co-operative Development, Progress and Trends”, The Tamil Nadu Journal of Co-operation, Vol.87, No.8, November 1995,p.23.

65
Tamil Nadu Journal of Co-operation gives the information that All India Handloom
Fabrics Marketing Co-operative Society Limited was set up by the Government of
India, at the national level in the year 1955 to organize and develop markets both
within the country and abroad for handloom fabrics, madeups, and garments. The
society has its retail outlets under the name and style of Handloom house in all State
capitals and cities within our country. The society also set up handloom houses in
Singapore and Mouritius while it exports promotion offices at New York and
Frankfurt. The society’s exports are increasing year after year.
T.R. Gurumoorthy (1995)78 in his article Market Development
Assistance to Handloom Co-operative Societies reveals that marketing of handloom
fabrics is an essential element in the overall administration of the handloom co-
operatives. Handloom co-operatives are not so strong financially to compete with
the mill sector in the textile market. In order to improve the marketing capabilities of
the handloom co-operatives, Central Government provides financial assistance to the
handloom co-operatives under “Market Development Assistance Scheme”. The
financial assistance extended under this scheme is meant for interest subsidy, rebate,
establishment and modernization of showrooms and construction of god owns, the
co-optex and the Government of Tamil Nadu organize exhibitions and primary
societies also participate in these exhibitions. It is noticed that the number of
exhibitions conducted during the October-December months, is the highest, which
78T.R.Gurumoorthy, “Market Development Assistance to Handloom Co-operative Societies”,
TamilNadu Journal of Co-operation, vol.87, No.5, August 1995, p.7

66
suggests the seasonality of demand for handloom fabrics influenced by festival
occasions
According to Noorbasha Abdul (1996)79 Handloom is one such
venerable industrial segment which has been severally affected under the reforms
regime and has culminated in large-scale de- employment of weavers and the
shrinking of real wages. The large-scale starvation deaths of handloom weavers in
Prakasam and Guntur districts of Andara Pradesh in the second half of 1991
triggered a spate of media reports that have focused on the plight of weavers,
Technological innovations have brought about several changes in the wearing
industry, which was flourishing in the region and other parts of India, The study also
revealed that handloom workers are aware of popular designs and modern
implements and accessories. Lack of training and finance are the two major factors
that limited the adoptions of modern implements in weaving. She pointed out that
the development of the industry through modernization will inject new vitality and
vigour in the rural and semi-urban areas of Kerala and thereby can reduce the
gravity of unemployment.
P.C. Mahapatro (1996)80 conducted in the state of Orissa. He examined
there levance of the handloom industry to the economy of the Orissa state and
scrutinized the general characteristics of the industry. Output and employment
79Noorbasha Abdul, “Handlooms in Distress” Economic and Political weekly, Vol.XXXI,No.23,
une,1996,p.1384-1386
80Mahapatro P. C (1996) “Economics of Cotton Handloom Industry in India”, Ashish Publishing House, New Delhi, 1996.

67
aspects of the industry, income of the weaving households and their economic
conditions have been analyzed. The major problems facing the industry such as
marketing, finance and supply of yarn were highlighted. In addition, Thestudy also
evaluated the efficacy of various policies ad opted by the Government for the
development of the handloom industry in Orissa.
Sailendra Narain (2000)81 pointed out that the handlooms sector forms a
part of India s rich heritage and exemplifies the richness and artistry of the weavers.
The Handloom (Reservation of Articles for production) Act 1985 aims at protecting
the interests of weavers. Under this act, 11 textile articles are presently reserved for
exclusive production by handlooms units. In order to help in formulation of effective
schemes for the benefit of handloom weavers, NCAER was assigned the task of
undertaking a census of Handlooms in 1995-96 by the ministry of Textiles, the study
further identifies some major developments that have shaped the evolution of
handloom silk weaving industry after independence, which applies to cotton
handloom weaving too. They are highly supportive state policy in terms of
restrictions on mill sector, reservation of a part of mills spindlage to produce
measures for handloom clothes and reorganization of production structure through
the creation of co-operatives.
G.V. Chalam (2001)82 madean attempt was made to examine the
financial performance of Handloom Weavers Co-operative Societies in Krishna
81SliendraNarain, “Traditional industries”, SIDBI Report on SSI Sector -2000, issue-2, 2000,pp.47-48. 82Chalam G. V. (2001) “Problems and Prospects of Handloom Industry in Co- operative Sector A Study of Handloom Weavers Co-operative Societies in Krishna District”, Indian Co-operative Review, Vol. XXXVIII, No. 3, January 2001, Pp. 137- 142 .

68
District during the period of 1994-2000 and also describe various problems faced
by the Handloom Weavers Co-operative Societies in respect of in adequate
activation of looms, political interference, high production cost, lack of adequate
marketing facilities, improper implementation of development schemes, misuse of
funds and heavy dues from the Apex Society(APCO).He suggested that the
Government should strictly implement the Reservation Act and extend 15per cent
of Market Development Assistance to relieve societies from the problem of
working capital. The State and Central Governments should take necessary steps for
the modernization of looms to increase the productivity of workers and take
measures to bring the large number of weaver sunder co-operative fold.
Babu (2001)83 observes, “Handloom is the largest industry in the
unorganized sector in terms of size, income and employment potential. Handloom
sector accounts for about 30percent of the total textile production and about 60
percent of the employment in the text industry”. According to him “Handloom
weavers in the country are mainly concentrated in seven states as in Assam. West
Bengal, TamilNadu, Manipur, Uttar Pradesh, Maharashtra and Andhra Pradesh,
Among the south Indian states, Tamil Nadu is the most important in terms of the
size of weaver population and share of total production,Handloom sector provides
direct and indirect employment to 6.5 million persons engaged in weaving and allied
activities. As a result of Government intervention through financial assistance and 83BabuP.Ramesh, “Organizational Structure, Labour Relations and Employment in Kancheepuram
Silk Weaving”, NLI Research Studies Series No. 021/2001, V.V. Giri National Labour Institute,
Noida,2001

69
implementation of various development and welfare schemes, this sector has been
able to withstand competition from the powerloom and Mill sectors production in
this sector has reached to 6792million sq.metres in 1998-99. This sector contributed
to 19 percent cloth produced in the country and contribution substantially to the
household weaver is generally lower when he worked as member of the cooperative
society and also as a weaver under the control of master weavers. The health hazards
are very high in the weaving industry and as a result, expenditure on healthcare
accounts for a considerable proportion of their income. The number of weavers in
the co-operatives has declined by 63 per cent and most often weavers continue to be
members on the rolls, but do not receive work from the societies for long periods of
time and weavers generally prefer not to work for Master Weavers in places where
the co-operatives were strong. The quantity of cloth produced in the co-operative
sector in the state declined by 77.3 per cent and co-operatives have failed to fulfill
their basic responsibility of promoting and assisting handloom weaving in the state
and the performance affected by various internal and external factors. Further, the
failure of APCO has led to piling up of stocks and heavy dues pending for long
periods of time has contributed to increasing sickness among co-operatives.
Amrita Singh Shailaja. D. Naik (2009)84 examined the socio-economic
conditions of the Banaras silk weavers, the study found that the Handloom weavers
in Banaras, who have inherited this occupation, are in pitiable condition owing to
the poor socioeconomic conditions. Majority of them are wage weavers who earn
84Amrita Singh Shailaja.D.Naik, “Status of Banaras weavers: A profile” Karnataka J. Agric. Sci.,
22(2) :(408-411) 2009
70
minimal wages in spite of working for more than ten hours a day. It is interesting to
note that the literacy rate among the weavers community is quite encouraging. The
two religions predominantly engaged in weaving are Muslim and Hindu; who lived
in urban locality. Almost fifty per cent of the community belonged to middle income
group; who were engaged with Master Weavers or in the Co-operative Societies.
The basic raw material required for the production of silk sarees were silk and zari
purchased largely from the local market but sometimes from Master Weavers or Co-
operative Societies, on credit, the respondents opined that Provision for raw
materials at reasonable price, special training to improve existing weaving
technology, knowledge about scientific and low cost techniques of weaving, dyeing
and finishing, financial assistance and other necessary inputs is the need of the
daythe country s export earnings
S. MahendraDev, S. Galab, Vinayan (2008)85 examined the problems
and prospects of the handloom sector in Andhra Pradesh. The major finding of the
study is that the monthly income of the household weaver is generally lower when
he worked as member of the cooperative society and also as a weaver under the
control of master weavers. The health hazards are very high in the weaving industry
and as a result, expenditure on healthcare accounts for a considerable proportion of
their income. The number of weavers in the co-operatives has declined by 63 per
cent and most often weavers continue to be members on the rolls, but do not receive
work from the societies for long periods of time and weavers generally prefer not to
work for Master Weavers in places where the co-operatives were strong. The 85MahendraDev, S. Galab, P. Prudhuikar Reddy and SoumyaVinayan,.Economics of Handloom Weaving; A Field Study in Andhra Pradesh.,Economic and Political Weekly, Vol. XLIII, No. 21, May 2008, Pp. 43.51.

71
quantity of cloth produced in the co-operative sector in the state declined by 77.3 per
cent and co-operatives have failed to fulfill their basic responsibility of promoting
and assisting handloom weaving in the state and the performance affected by
various internal and external factors. Further, the failure of APCO has led to piling
up of stocks and heavy dues pending for long periods of time has contributed to
increasing sickness among co-operatives.
Gundeti Ramesh (2009)86 made an attempt to high light the socio-
economic conditions of handloom weavers by selecting 180 handloom weavers
working in weaving co-operative society of Kothapally of Karimnagar District. The
author particularly highlighted the issues such as poverty, low standard of living,
hunger, poorhealth, malnutrition, illiteracy, deceases, poor sanitary housing
conditions, lack of communication and infrastructure facilities. He found that socio-
economic conditions of the weavers were in poor state. Finally, hesuggested that the
Government should take measures to provide food security and wageem ployment
programmes and implementation of labour welfare schemes.
Thirunarayanasamy and Paramasivam (2009)87 explained various
welfare schemes and programme simplemented by the Government of Tamil Nadu
and Government of India to enhance production, productivity and efficiency of the
handloom sector and enhance the income and socio-economic status of the weavers
by upgrading the weavers skills. The schemes covered included: Savings and 86Gundeti Ramesh (2009) “Some Issues of Handloom Weavers A Study in Karimnagar District of Andhra Pradesh”, Kurukshetra,Vol. 57, No. 8, June 2009, Pp. 33-37. 87Thirunarayanasamy M. &Paramasivam J. “Welfare Schemes for Handloom Weavers An Outline”Kisan World, Vol. 36, No. 10, October 2009, Pp. 18-22.
72
Security Scheme, Central Thrift Fund Scheme, Tamil Nadu Handloom Weavers
Family Pension Scheme, Co-operative Handloom Weavers Old Age Pension
Scheme, Weavers House-cum-work shed scheme, Mahatma Gandhi Bunkar Bima
Yojana Scheme, Health Insurance Scheme for Handloom Weavers, Dr.
M.G.R.Handloom Weavers Welfare Trust and Payment of Scholarship to Students
of Indian Institute of Handloom Technology. They have illustrated that the
welfare schemes implemented for handloom industry were very much helpful and
needful to the industry; they concluded that by the successful implementation of
these schemes, the handloom industry would be in a position to increase the
productivity and efficiency of the handloom weavers and enhance the income level
and socio- economic conditions of the weavers.
Gopinath (2010)88 explored the question of how far the Khadi
programme has had an impact on the livelihoods of the artisans. It is observed that
contrary to Gandhiji’s assumption of achieving the basic socio-economic and wider
objectives of the artisan’s well-being through the khadi programme, it is leading to
occupational interlocking, wherein moving to alternate occupations is highly
constrained due to the absence of alternate job prospects with the existing low skill
levels of the artisans. This further perpetuates or entraps artisans and their families
in a low-income situation with worse outcomes for their future generations. Further,
the presence of a large number of artisans from the marginalised sections (Scheduled
Castes or SCs in weaving and women in spinning) is a cause for concern as they are
88Gopinath, WAGES, WORKING CONDITIONS AND SOCIO-ECONOMIC MOBILITY OF
SPINNERS AND WEAVERS IN THE UNORGANISED KHADI INDUSTRY: FINDINGS FROM
A SURVEY IN INDIA,The Indian Journal of Labour Economics, Vol. 53, No. 2, 2010

73
the least empowered sections of the society. It is a clear case of institutional failure,
wherein the Khadi and Village Industries Commission (KVIC) and the associated
institutions entrusted with achieving the socio-economic well-being of the artisans
through the khadi programme have failed to realise the goals. The analysis raised
questions as to whether employment in the khadi sector can be termed as ‘decent
work’ with very low levels of wages and without much of social security. The only
area wherein there seems to be hope is in the innovation of higher spindle charkhas,
which would involve lesser drudgery and fetch more wages. In addition to this, the
training of weavers and innovation in the improvement of looms and designs of
products needs to be undertaken to encourage the production of highly value-added
products in order to improve the socio-economic conditions of the artisans. Further,
artisans should also be encouraged to unionise/organise to improve their working
conditions. However, it is heartening to know that some of the suggestions
mentioned in the report are being implemented by KVIC today after a decade of
implementation of different schemes.
Alin Borah Bortamuly and Kishor Goswami (2012)89 made an attempt
to analyse the factors influencing the wage structure of the handloom industry from
a gender perspective. It examines the wage differential with respect to gender as
well as type of work the workers are entrusted with. The study is based on primary
data collected from 300 respondents in 13 districts in Assam. Multiple regression
technique is used to analyses the data. The results show that in case of contractual
workers, there is no gender discrimination in wages, whereas it is found in case of
monthly rated workers. Productivity of the workers is found to be significant both
for monthly rated as well as contractual workers. Factors like education and
89Alin Borah Bortamuly and KishorGoswami “FACTORS INFLUENCING WAGE STRUCTURE OF HANDLOOM WORKERS IN ASSAM” Journal of Rural Development, Vol. 31, No. (2) pp. 139 – 150 April-june. 2012
74
experience do not have any significant influence on the wage structure of the
workers in the handloom industry in Assam. Thus, the government machinery
should address the gender wage discrimination for monthly rated weavers and
reelers, and back up support facilities for contractual workers of the industry in the
State. The present study greatly extends our understanding of the wage earnings
scenariin Assam’s handloom sector from gender perspective.
Review of the various studies related to handloom co-operative and
handloom silk co-operative societies were reviewed the review reveals the different
dimension on the broader area. the present study “A STUDY ON THE
PERFORMANCE OF CO-OPERATIVE SILK PRODUCERS IN
KUMBAKONAM TALUK OF TAMIL NADU” attempts to fill this research gap.
the results of the study are expected to provide a practical contribution in the study
area the performance and the socio economic conditions of the silk weavers in the
present scenario.

75
CHAPTER III
PROFILE AND OPERATIVE PRODUCTION PROCESS OF
CO-OPERATIVE SILK SOCIETIES IN KUMBAKONAM TALUK
Co-operative movement in India is one of the largest movements in
the world. Co-operative movement has made tremendous progress in every aspects
of the Indian economy. Co-operative act ivities occupy a major place in the sphere
of the Indian economy. Initially, the co-operative movement was started with a
limited scope of activities of rural credit but now it has entered in all fields of
economic activity with social essence. Now the movement which has covered 100
per cent villages and 75 per cent rural households and functioning over 5,45,000
Co-operatives of various levels with membership coverage of 236 million and
working capital of 34,00,555 million inclusive of credit and non-credit co-
operative societies. It has been playing a significant role in disbursing agricultural
credit, distribution of agricultural inputs, providing market support, processing, etc.
Co-operative movement has been recognized as an effective instrument for the
economic development of the rural masses and for improvement in the socio-
economic condition of the poor. The co-operative movement in India had its origin
elsewhere and was introduced to this region by foreign rule. But even after
independence, the movement continued in the planned economy. The movement
has been recognized as an effective instrument for the economic development of the
rural masses and for improvement in the socio- economic conditions of the

76
neglected. In India co-operation had become a part of national policy and hence the
Indian co-operative movement is sometimes ironically described not as a movement
but only as a product of government policy. It spread and diversified with the
encouragement and support of the government. The co-operative movement in India
was basically organized against the money lenders to rescue farmers from the
clutches of the poverty and indebtedness. The need for agricultural credit through
co-operatives felt because of rural indebtedness. The Indian co-operative movement
was initiated by the government; it spread and diversified with the encouragement
and support of the government. In this connection, observation made by
NABARD in its Annual Report, 2001-2002 is; “Co-operatives have contributed
significant growth to the government by the growth of industrial and the growth of
institutional infrastructure in the rural areas, private capital formation in the
agriculture sector and distribution of farm inputs like fert ilizers, seeds, etc., The
determination interest of Government in co-operatives and the importance
attached to them was reflected in the appointment of various committees
regarding to review their development and functioning”.
A Thematic note on Co-operatives and its Growth in India
Co- operatives works for the sustainable development of the overall
economy through various policies. Co-operative societies serve their members most
effectively and strengthen the co-operative movement by working together through
local, regional, national and international structure. The place of co-operatives in
Indian economy and its role in social and economic affairs has developed a new
dimension with the beginning of the planning. India emphasized the process of

77
planning stemmed partly from the urge of backwardness and partly from line which
gave an force to achieve social justice, equality and a decent livelihood for all
citizens, the promotion of co-operative thought of not merely as an extension of
state action but as a step towards the realization of the best of the co- operative
widespread prosperity.
India adopted a socialistic pattern and pursued the policy of a mixed
economy with features of both capitalism and socialism. The Planning Commission
which was established in 1950 set the social and economical targets based on
equity and justice. With the objective of self-sufficiency public sector recognized
key of development under the direct control of the State. The second sector of the
economy i.e. private sector came under the regulatory mechanism of the State. The
third sector of the Indian economy which would act as a balancing factor for the
limitations of the public and private sector was the co-operative sector. Co-
operative institutions recognized as an important agents of rural development,
social justice and equity. The co-operative movement must be financially strong,
organically integrated, professionally managed and forward looking. New
economic policy since 1991 brought into focus the important issues related to the
organizational and business restructuring, adoption of modern technology, new
ways of mobilization of resources and measures to upgrade the standards of
productivity. Co- operation is able to survive competition from private sector and
public sector rivals, particularly in areas of marketing, technological
innovations, and mobilization of resource and development. Strength and
flexibility of the co-operative movement tackle the various issues effectively which

78
opened up with globalization in matters of trade, agriculture production and
financial services
Conceptual illustration of Co-operatives
Man is a social animal imbued with desires and aspirations and which
can be fulfilled within society. Co-operation is basic to the development of
human beings and ultimately to the progress and prosperity of society at large.
Human body system is a good example of perfect co-ordination among the
different organs. Similarly, human beings have to co-operate for the happier and
healthier life. Co-operation is a joint or collective action of people directed
towards some specific goal in which there is common interest or hope of getting
some reward. Such co - operation may be voluntary or involuntary, direct or
indirect, formal and informal but there always is a combination of efforts
towards a specific end in which all the participants have a stake, real or
imagined.
From the most primitive sophisticated community throughout the world
we come across some or the other form of co-operation among the people living in a
particular area or region be it for some agricultural operations or of social, economic
or political activity. Co-operation has rightly been regarded as one of the least
noticed economic miracles of the last century. Co-operation is as old as humanity
and co-operation is older than the co-operative movement. The co-operative
movement is only one example of human co-operation among others. The meaning
of co-operation varied from thinker to thinker and from one sphere of human

79
activity to another. To the sociologists, it is a social economic movement, for
the socialists, it is a social order in which man is free frorm class struggle,
economists believe that, it is one of the form of business organization in which there
is no scope of being exploited by middlemen. The lawyers take to be an
organization in whose membership one enjoys the special privileges and
concessions conferred by law. Thus, co-operatives are better than private and public
enterprises to serve the common goal due to their commitments to the values and
principles in handling their business. After all, effective functioning of these co-
operatives depends on the effective utilization of their resource
The Role of Saurashtras in the Handloom Weaving Thiirubuvanam:
The industry of silk weaving was in the hands of private capitalists in the
period before the independence of India. In 1950, ” The Handloom weaver’s
society” was established in Thiribuvanam with a motive of sharing the income of the
industry enjoyed only by the capitalists among all the weavers involved in the
industry The association was united with the district AITUC. The workers in the
weaving organized many struggle under the leadership of AITUC, and received
higher wages only after picketing. The weavers were made the members of the co-
operative society. As a result, the Thirubuvanam silk co - operative society was
founded in 1955. Co-operative is a voluntary and organized association of a
number of individuals, dominated by a common need for the purpose of carrying
collectively and independently an economic function which will provide specific
economic benefit. It is one of the enterprise and not a charitable association. The
functions of co- operative organization is on the basis of equality. It is on the

80
principle of self - help policy as well as mutual help. It is an association of persons
and not of capital.
Progress of weavers Co-operative
The progress of Weavers and Non-Weavers Co-operatives in India
increased from 20,940 to 20,871 and non-weavers co-operatives from 49,142 to
48,841 during the year 2002-03 to 2011-12 with growth rate of 0.33 percent and
0.61 percent respectively. For the same period the membership increased from
19,177 thousand to 1, 91, 91 thousand and 22, 55,100 to 22, 56,543 thousand
whereas growth rate was 0.075 percent and 0.065 percent respectively. Share capital
of weavers increased from Rs.1608.78 to Rs.1611.38 million and on-weavers
increased from Rs.951 million to Rs.964 million during the period from 2011-12.
Government contribution in share capital of weavers co-operatives was 36.6 percent
in the year 2011 – 12. Working capital of weavers’ co-operatives decreased from
Rs.9113 million to Rs.9041.1 million and non- weavers’ working capital increased
from Rs.44, 00.5 million to Rs.4410.5 million during the same period.
Profile of the Silk Co-operatives in operation at Thirubuvanam Taluk .
The silk industry vested in the hands of private ownership fully before the
independence. In the year 1950 weavers’ handloom society was established in
Tirubuvanam. The weavers of this area people a were become the members of the
society mostly the members are belonging to the community of sourastra,they named
as ‘pattunool karargal’, they spread their survival with their own business at
kumbakonam, Thirubuvanam, Thiruvidaimaruthur, Thirunagaswaram, Patteeswaram,

81
Thuguli they lead their life by run the business on those areas. In these areas the silk
production were executed by both private silk weavers’ co- operative societies. The
welfare schemes for the weavers have been planned and put in action by this society.
Following this, in the year 1978 onwards various co-operative silk producers’
societies has been formed. They were named ” Thiruvalluvar co - operative silk
producers society, Thirubuvanam silk society, cholan silk society, kamarajar society,
Kalaivanar silk societies, Darasuram silk societies and “super co-operative society
had been formed. Along with these one more co-operative silk producers societies
formed by the women in the name of Chief Minister Dr. J. Jayalalitha but which is
not succeed as expected. Individual profile of every society were summarised in the
following headings.
Thirubuvanam Co-operative Silk Society z:322.
This society was started in 1955. The society, which had 129 members in
the beginning, has obtained a good growth. This society which was struggling to
have RS.1600/- of sales now is selling for 23 crores of rupees and has achieved the
name of the top society in India and received the gold medal and appreciation from
the central government of India. Now it has earned 4 crores of profit and received
the award from the government of Tamil Nadu. It garlanded the former president of
Russia Mr.Gaorchev with silk shawl, which had the design of late Rajiv Gandhi
become very famous in Mumbai.
In the world Tamil conference conducted in Thanjavur, the silk shawl
with the designs of Thanjavur temple. The figures of Raja Raja chozhan, and

82
Thiruvalluvar brought great wonders in the minds of our prime minister and
foreigners. In addition to it, the figures of Thandhai Periyar, Aringnar Anna,
Kalaignar Karunanithi and chief minister Dr. Jayalalitha were designed on the silk
shawl and earned a good of the society who skillfully designed, and appreciation.
The minds of our prime minister and foreigners. The central government called the
members awarded them with prizes to honor them. The government of Tamil Nadu
also gave them the first prize and congratulated them.
Thirubuvanam Tthiruvalluvar Handloom Silk Weavers’
Co-operative Society T. R(H)55
This society was registered on 28.2.1978. this society started functioning from
30.5.1978, with Mr. K.V. Thulasi Ramaiyyar as the first member and with 131
members. It introduced new designs with the artistic skill of expert weavers. It got
the first place in sales in the all India handloom exhibition in Trichy in the year
1986-87 and got the shield as the prize. Now there are more than 700 members in
this society. Now there are more than 200 looms functioning. The welfare schemes
for the weavers have been planned and put in action by this society.
Thirubuvanam Cholan Handloom Silk Weavers’ Co-oprative Society
T.R (H).85 This society was begun in 1980 with 100 members. Now it is
functioning in a good way with more than 1800 members. The designed silk sari of
Mrs. Bama, a member of this society had a great appreciation from the president of
India in 1993and was awarded the prize for the best design in India. This society
was selected as the best society in the Thanjavur district in 1994 and was awarded a

83
prize. The sari which was designed and woven by a member of the society
Mr.M.N.purusothaman won the second prize in 1995 for the best designing in Tamil
Nadu. The government of Tamil Nadu selected member of this society
Mr.Arivazhagan and sent him to china for 15 days of training.
This society had a good record of sales by having its own sales centers in
Chennai and Mannarkudi, and 24 units of agency in almost all the main towns of
Tamil Nadu. It has created a record in sales for 4 crores of rupees. In addition to
that, it has planned to increase the sales to 8 crores of rupees.
Thirbuvanam Kamarajar Co-operative Silk Society
This society was registered on 3.10.1981 in the beginning , there were 25
members and 5 looms. Now there are more than 400 members and 72 rooms. In the
all India silk sales competition in Trichy in the year 1996, this society got the second
place.
Thirubuvanam Super Co-operative Silk Society
This society was registered on 19.3.1984 in the name, ”Thirubuvanam
super handloom weavers’ co-operative silk society for production and sales”. This
society was inaugurated on 20.5.1984, under the president ship of public works
department minister Mrs.S.R.Radha and with the felicitation of milk products
welfare department minister Mr.K.Kalaimani by handling, over yarns to 5 member
of this society. Now this society is functioning skillfully with its 283 members and

84
100 looms. In addition to it, it is increasing its growth by starting sales centre’s in
many towns like Madurai, Salem, Nagarkoil and Pondicherry.
This society participates in ali the exhibition during festivals, and increase
its sales and gets achievements. It has received prizes for the same not only that, the
main success of this society is that it gives continuous work to the looms which are
under the control of this society. Mr. P. Gopalakrishnan. B.Sc., D. co-op has been
working as the manager of this society from its beginning. 9 members work as
assistants for him.
Chief Minister Dr.Puratchi Thalaivi J. Jeyalalitha Handloom women
weavers’ Co-operative Silk Society. C. d (h)12 This society was registered on
20.4.1995 with 110 women members. It started functioning from 10.5.1995 10
looms are continuously at work in this society. The manager of this society is Mrs.
D .Geetha. The co-operative society for women which is run by women in
Thirubuvanam is skillfully governed and it is to be appreciated.
The achievements of Co-operative silk societies
The societies in which these people are members have received national
awards for best workman ship. The silk fabrics created from their artistic skills have
been exhibited in the world wide exhibitions. Those silk fabrics throw a challenge to
the international quality in artistic skill and technology. It also shows the spirit of the
community. The technology in computer known as “wonder of knowledge” is
assessed by the expects in computer, as based on the traditional handloom weaving
technology. They have the traditional method of working by deciding on the type of
figures on the silk fabrics and drawing the figures prior to weaving. By calculating
correctly how many yarns to be had in the up and down to be pressed and how many

85
times the stripe (nada) have to be inserted. In computers, the “programming” is
based on this principle. When there was no modern convenience they used their
skills in weaving silk fabrics in handloom with such an artistic beauty to please the
people. The forefathers of these weavers who had the technical skill of this
wonderful weaving had been patronized by kings of olden times and there are
evidences in history to prove this.
PRODUCTION PROCESS OF THIRUBUVANAM SILK PRODUCTS
The silk sarees production is the multi- faceted work entails lot of
nebulous procedures such as given below.
Raw materials
Raw material plays a vital role in the production of any product or goods.
The essential raw materials required for the production of Thirubuvanam silk sarees
are silk and zari, but cotton is used exceptionally used for cutworks sarees for extra
weft designs. The details about the raw material viz., requirement per saree, source
of procurement, frequency of purchase, mode of payment and problems faced while
procuring are dealt under the following subheadings. The silk sarees are exclusive
and ethnic in nature as obvious silk sarees are unique in features, appearance,
texture, colour and design. Where in silk yarn and zari are the basic two raw
materials (Plate 1). These sarees are woven with two types of silk yarns, Bangalore
silk i.e. mulberry silk and China silk; and the popular denier are 14/16, 16/18 and
20/22. The Bangalore silk ranged from Rs.1800-2000 per kg and Chinese silk
Rs.1400-1600 per kg. The weavers purchased raw silk from Bangalore, Malta and
sometimes from local dealers; latter who in turn purchase silk from Bangalore,
86
Malda and sometimes from China. The gold and silver zari are used to create
glittering embossed extra weft pattern that gave a classic touch to the saree. The
popular zari numbers used are 1200, 1400, 1600 and 3700.
The four types of zari commonly used in Thirubuvanam silk sarees are:
a) Pure zari
b) Tested zari
c) Powder zari and d) Plastic zari
The composition of different varieties of zari is presented here under:
a) Pure zari: This is also known as real zari. The centre core of pure
zari is made up of degummed twisted red or yellow mulberry
silk yarn; over which silver lametta and badla (flatten wire) is
wound. The silver zari threads are electroplated with pure gold
solution, to produce gold zari.
b) Tested zari: It is also called imitation zari because it has the
external features of real zari and thus, resembles the real zari in
terms of shine. This variety is similar to real zari except copper
lametta used in place of silver and silver gilding is done on copper
wire. For gold zari, the tested zari is electroplated with gold
solution.

87
c) Powder zari: The manufacturing process of powder zari is similar to
tested zari, where in powder gilding is done on imitation zari in
place of gold gilding.
d) Plastic zari: The manufacturing process is more or less same as
other varieties. In this variety plastic thread is used as lametta
instead of copper or silver.
All Thirubuvanam sarees are either woven with pure zari and some
of them woven with other varieties of imitation, powder and plastic zari. Most of
the time zari thread is purchased from Surat and sometimes from the agent at the
Kumbakonam. The cost of pure zari ranged from Rs.10, 000 - 13,000 per kg,
imitation zari Rs.600-800/kg, powder zari Rs.200 kg and plastic zari is Rs 350-500
per kg. Silk and zari are the main raw materials used for extra weft designs in
Thirubuvanam silk sarees, but in Kora work sarees, cotton is used to create extra
weft patterns. The weavers generally purchase cotton from Salem (Tamil Nadu) or
local dealers. The cost of ranged from Rs.350 – 400 per kg.

88
ZARI PLATE 1. RAW MATERIALS
The various varieties of Thirubuvanam silk sarees are produced with the
help of zari korra. The name of few varieties are Brocade, Chiffon Jamdani, Jungla,
Resham buti, Satin border, Satin embossed, Tanchoi and Tissue saree are mainly
woven with silk and zari, whereas Kora cutwork have cotton designs on silk ground.
The technique of weaving these sarees is more or less same but each saree is
different in its composition. The requirement of raw materials for each saree
varied according to the intricacy of the designs woven.
Technology of weaving Thirubuvanam Silk sarees
The technology of weaving Thirubuvanam silks sarees encompasses
type of loom employed, various preparatory & loom processes involved and
several post loom processes consisted of Preparatory process or pre-loom processes.
The term preparatory signifies the number of stepwise processes carried out prior to
weaving. The silk weaving are subjected to the following preliminary processes:
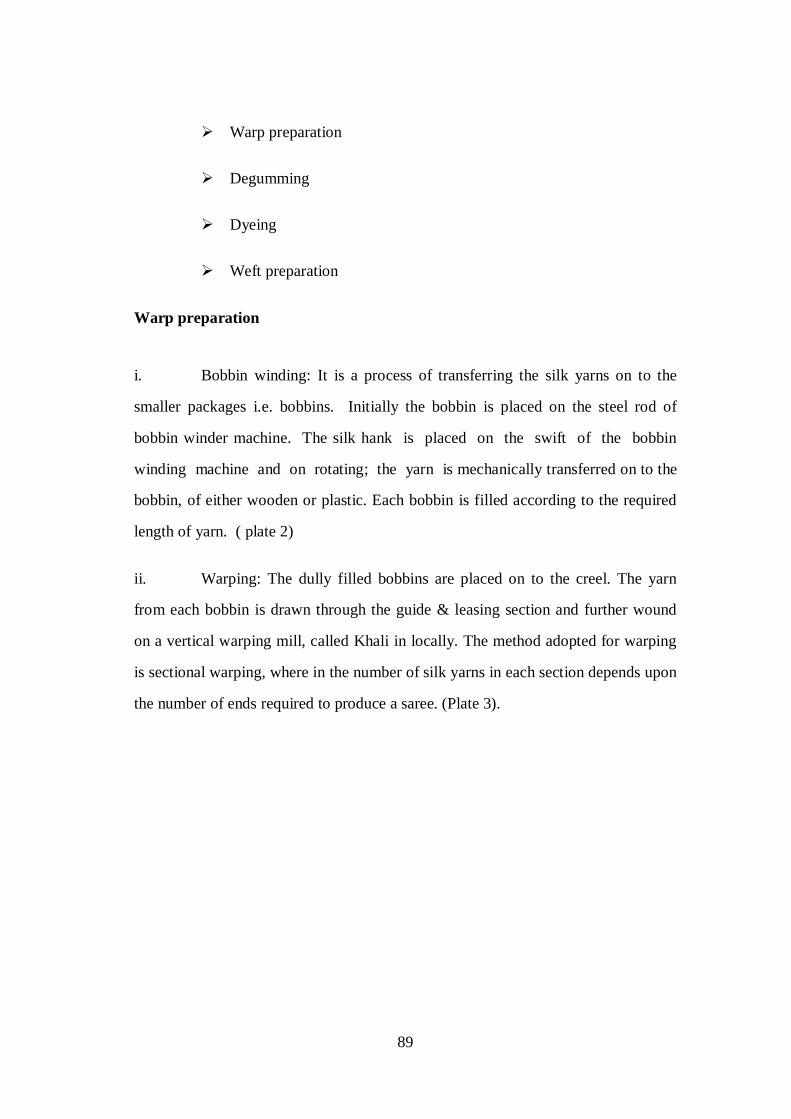
89
Warp preparation
Degumming
Dyeing
Weft preparation
Warp preparation
i. Bobbin winding: It is a process of transferring the silk yarns on to the
smaller packages i.e. bobbins. Initially the bobbin is placed on the steel rod of
bobbin winder machine. The silk hank is placed on the swift of the bobbin
winding machine and on rotating; the yarn is mechanically transferred on to the
bobbin, of either wooden or plastic. Each bobbin is filled according to the required
length of yarn. ( plate 2)
ii. Warping: The dully filled bobbins are placed on to the creel. The yarn
from each bobbin is drawn through the guide & leasing section and further wound
on a vertical warping mill, called Khali in locally. The method adopted for warping
is sectional warping, where in the number of silk yarns in each section depends upon
the number of ends required to produce a saree. (Plate 3).
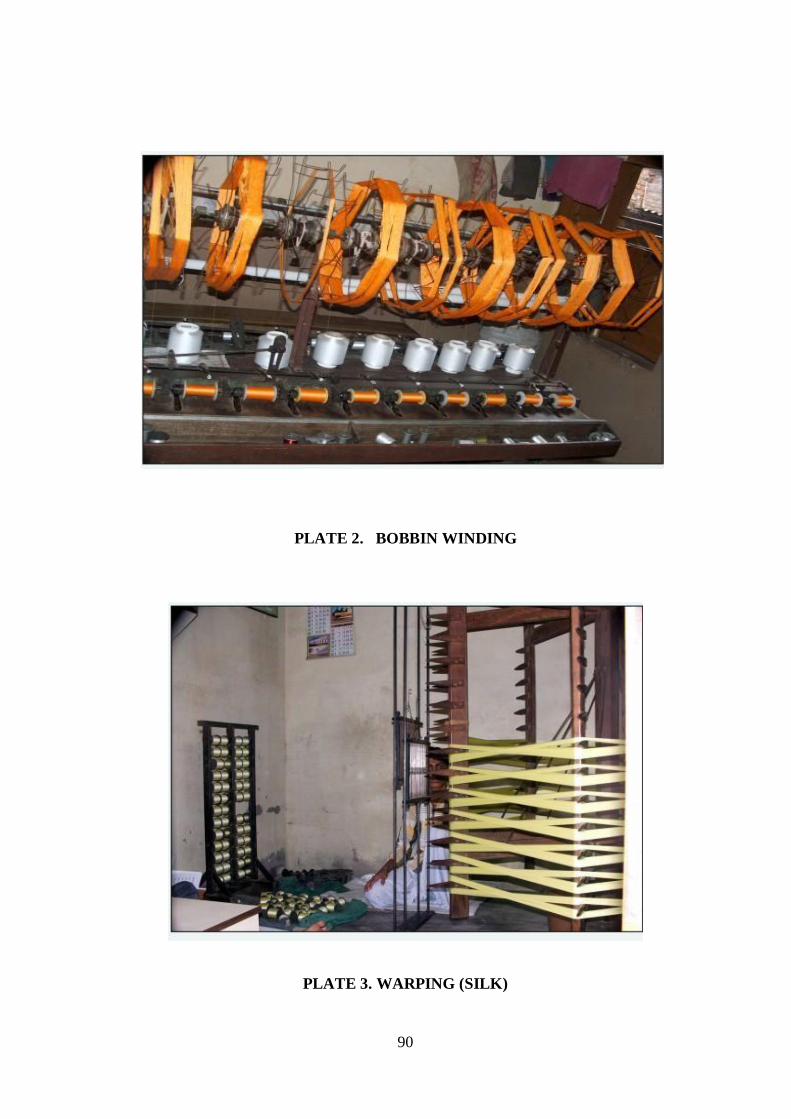
90
PLATE 2. BOBBIN WINDING
PLATE 3. WARPING (SILK)

91
Degumming
Raw silk contains silk gum (sericin) which constitutes about 20-30 per
cent of its total weight. The raw silk need to be purified before it takes any colour.
The silk is made soft by removing sericine (gum) and other impurities. This process
also imparts luster to the yarn.
Components of Degumming Process
The components required for degumming process are
1. Soap – 200 g/ kg silk yarn
2. Soda ash – 10-20 g/kg silk yarn
3. MLR – 1:30
These three components were get ready for the further process by the
temperature of Boiling point with in minimum 45 minutes to maximum one hour.
The degummed silk is washed thoroughly first with warm water and then in cold
water to remove the traces of soap liquor. About 25 per cent weight loss is
observed after degumming. Kharna is the term locally referred for degumming.
Dyeing
The process of colouring something by using a natural or synthetic
substance is known as dyeing. The usage of natural dyes in olden days obsolete in
present days. However Thirubuvanam silk industries have been utilizing the natural
dyes which won’t be harmful to the skin, the dyers depended on nature for the raw
materials and dyer to add colours to the fabrics. Generally the dyes were extracted

92
from vegetation, minerals and from animals. The use of natural dyes slowly
dwindled from 1886 after the establishment of synthetic dyes. The natural dyes were
in use for many hundred years in the past. Now the habit has been revived with the
ideas of pollution free hygiene and purity. The argument now is that the natural dye
is very suitable but no modern mechanism or an innovative mass production of
natural dyes has been invented. Hence there is a compulsion to use only the
synthetic dyes.
Dyeing
PLATE 4. DYEING OF SILK YARNS
Rangai is the term referred to dyeing in local language. The
degummed silk is dyed either in acid or direct or metal complex dyes to produce
variety of colour ways.

93
TABLE NO: III . 1
VARIOUS TYPES OF DYES
Sl.
No.
Acid dye Direct dye Metal complex dye
1 Acid colour Direct colour Metal complex colour
2 5-10 per cent glauber salt 30 per cent glauber
salt
Ammonium Sulphate
3 1-2 per cent Acetic acid 20 per cent Acetic
acid
1-2 per cent Aceticacid
4 MLR 1:30 MLR 1:30 MLR 1:30
5 Temperature 90-95°C Temperature 90°C Temperature 90°C
6 Time 30-45 minutes Time 45-60
minutes
Time 30 minutes
SUPPORTING ARGUMENTS FOR NATURAL DYES
The following are the supporting arguments for natural dyes.
Pollution in the atmosphere. For instance the changes took place in
the temperature of the world as a result of the hole formed in the
ozone layer.
Most of the synthetic dyes, particularly AZO dye is the cancer
instigating substance.
The synthetic dyes especially the petro synthetics are very hot. It is
poisonous, and it affects the environment and also the human
surroundings.

94
The reasons for the fall in the use of natural dyes
Natural dyes are not easily available.
The required color cannot be obtained.
The difficulty in the task of making dyes.
The troubles in using the dyes.
The less number of dyes.
The unsteady condition.
The absence of the capacity to prolong.
The benefits in using natural dyes
It is got from sources which can be revived.
It is not dangerous to health.
There is no chemical reaction in producing it.
The waste can be easily disposed.
It goes in harmony with nature.
Though there has been a talk about natural dyes for more than 150
years, the use of natural dyes cannot be seen because of the
absence scientific research in it.
The use of natural dyes is increasing in foreign countries like
Germany and America. As proper attention is not given to it in our

95
country, the importance of natural dyes has lost its hold here. In the
present day situation, more than twelve organizations are selling
natural dyes in small packets.
Some important natural dyes
The colours needed by us can be taken from all the vegetables. Dyes can
be obtained from animals. The basic colours like blue, red and yellow can be
produced from natural dyes. The factories to produce natural dyes have been started
in Rajasthan in India natural
Dyes have come to the market for sales some of the natural dyes are stated below:-
TABLE NO : III .2

96
CLASSIFICATION OF NATURAL DYES ON THE BASIS OF
APPLICATION PROPERTIES: SOURCE
S. No Botanical name/source Common Name Dye class
1 Indigofera tinctoria Indigo Vat
2 Rubia tinctorum Madder Mordant/disperse
3 Rubia cardifolia Manjeet Acid/mordant/disperse
4 Ceasalpinia sappan Sappanwood Mordant/disperse
5 Luccifer Lac dye Acid/mordant
6 Berberis aritata Berberine Basic
7 Bulea frondosa, monosperma Tesu Morda
8 Mailotus philippensis Kamala Modant/disperse
9 Rheum emodi Dolu Mordant/disperse
10 Quercus infectoria Gall nuts Acid/mordant
11 Acacia catechu Cutch Acid/mordant/discperse
Natural dyes are extracted from the following natural materials such as vegetation
and minerals. They are represented in the tabular column given below.
TABLE NO : III . 3

97
SOURCES OF NATURAL DYES
S.
No
Colours Sources
1 Lemon yellow Turmeric powder, myrobalan or harda, symplocus
laurina,woodfordia fruiticosa.
2 Gold colour Skin of pomegranate, modhukai poo
3 Orange Rubia cord folia(manjeet)
4 Light brown Acacia
5 Dark brown Acacia catechu, kais crystal, ficus microcarpa.
6 Grey Ventilago madrae, patina
7 Pink Red sandal
8 Red Madder(menjistha),alizarin red.
9 Blue Indict(indigo era tinctoria)
10 Black Iron, old japery
11 Olive Ventilago madras, rattan jothi.
These natural dyes should be oozed well in the alum solution before
dyeing. So that the dyes get fixed to the fabric or yarn.
Dyeing procedure
The dye bath is set at 40°-50°C with required amount water as per
MLR and added 5 to 10 per cent glauber salt, the crystal and 1-2 per cent glacial

98
acetic acid. The dye paste is then added to dye bath and the temperature is
gradually raised. The degummed silk hanks are suspended on smooth steel rods
and immersed in dye bath. The temperature is raised to 90- 95°C during 30
minutes and continued to dye for next 15 minutes (Plate 4). If the dye is not
exhausted within the stipulated period of dyeing time, 1-2 per cent glacial acetic
acid is added to the dye bath and dyeing is continued for another 10-15
minutes, totaling to one hour. Finally the hanks are rinsed thoroughly in cold
water, squeezed and shade dried. (Plate 5) The dyeing procedure for direct and
metal complex dyes is same. Instead of glauber salt, ammonium sulphate (5%) is
used as buffer in metal complex dye to enhance dye uptake.
PLATE 5. SHADE DRYING OF DYED SILK YARNS
The dyed silk hank is placed on swift or natawa, which is a bamboo
frame with a central axis. The natawa frame is round in shape and slightly
narrower in the middle than at the upper and lower ends. The silk hank is placed
on natawa, which is then transferred on to a yarns from two pareta are drawn

99
together and laid on to a third pareta. From pareta, the thread is transferred to a
small pirn, by means of hand driven charkha. The entire operation is manually
carried out and mainly performed by the women. The ready pirn, nari is the
package for picking. The pirn is placed in the shuttle, made of buffalo-horn with
a small glazed surface, enabling it to slide rapidly in the shed.
The ‘Kalabattun’ is the zari used as weft is wound on a well polished
simple bamboo stick called kandhi, made from superior quality bamboo,
imported from Upper Bengal. The zari, when used as extra weft is transferred
from bobbin to the small pirn with the help of simple charkha.
Winding
After shaded the yarns with various colour which the weavers requires its
dyed afterwards those yarn makes into dry for one or two days in shady place.
Dyed yarns put into other process like winding, the winding processed by two types
like swift winding and prin winding of silk yarn. This winding process works out
with the help of some properties which is made out of bamboo. (Plate 6 and plate 7)

100
PLATE 6. SWIFT WINDING PLATE 7. PIRN WINDING OF
SILK YARN
Pre-weaving processi
Beaming: Tana tanna, refers to arrangement of warp threads for
beaming locally and Tanihara, is the one who involves in arrangement of warp
threads. The dyed warp yarns are transferred on to a salai, a wooden tube on
one end that revolves freely round a long iron needle, on the other hand. The
ready salai is taken to an open area where a framework is setup for the
arrangement of warp threads. These warp threads are stretched in this open area,
called tana tanna (Plate 8). One end of each thread is attached to a wooden
cylinder, nothing but a four-faced beam, called tur and the other end of each yarn,
fully extended, is attached to a stick by means of ropes which is already tied to a
peg or clamp. The stick .kantia-ka-danda, has a number of iron hooks (called
Kantia) fixed at equidistance. The lease rods (Sakara), always in pairs, are
placed at different intervals throughout the length of warp sheet. Each pair of
lease rods is tied with cotton-twines (Banka-ka-tagla) to hold them together
and to keep lease intact. The ready warp sheet is spread uniformly, and checked
individual yarn for breakage, damage or defects; and if any are duly mended and

101
corrected. This operation is called sahi-karana. The lease rods, samaras are
removed from the warp sheet while the cotton twines are retained intact. The
hooked- stick is then released from the peg and the threads are vigorously
stretched manually. Simultaneously the roller at the other end is rotated
outwards for taut winding of warp threads. This is beaming, called as turai in
regional language, the process of transferring the warp sheet on to the warp
beam. The whole cylinder is then carefully packed and taken to the loom.
ii. Piece work: Saree weaving is always commences from pallav region.
Piece work is a process of joining new warp ends to the corresponding warp
thread of previous saree. Twisting is the technique employed to join the ends
together with the help of gum/glue.
iii. Gaiting the loom: The new warps are then gaited, known as dressing
the loom. In every loom the warp threads are not stretched to the full length of
the sari but it depends upon the longitudinal space available in the room. The
number of harness (Gathwa), reed (Hatha or Kanghi), warp beam (Bhanjni) and
cloth beam (Tur or Lapetan) are tied on to the respective positions. The warp
beam is secured in the middle with a rope which is tied to the peg, called agela
posted in the ground. Generally the warp beam, bhanjni should be at a distance
of 2 ½ to 3 yards and peg, agela at a distance of 4 to 4½ yards away from the
position of weavers. Between the warp beam and cloth beam, a set of lease rods
(Senthas) are placed alternately, in order to complete the loom preparation i.e.
gaiting and then the loom is set for weaving
Weaving of silk sarees

102
The Thirubuvanam silk sarees are woven on throw shuttle pit looms by
single person but for this processes needs a helper. Saree weaving is
accomplished by using one big throw shuttle carrying weft yarn for ground
fabric and many tiny shuttles or pirns carrying silk or zari thread for extra weft
designs. After every two ground picks a separate treadle (Paosar) is operated to
create third shed by jacquard mechanism to produce extra weft patterns of
either zari or silk thread. In other words the extra weft pattern is
produced by swivel technique. (Plate 9). During weaving process, the weaver
sprinkles water on warp sheet (Tana) occasionally with the help of abgir (a
broom-like instrument) to maintain its elasticity, failing which, it would lead to
yarn breakage due to dryness. Thus the Sari is woven with great care and
patience.
PLATE 8 . SAREE WEAVING WITH THROW – SHUTTLE
Taking up and letting off

103
The completion of sari is called reja pujna. The woven cloth (Than or
Reja) is taken up and wound on the cloth beam (Tur) and the process is called
taking up. The woven fabric, when taken off from the loom is called a kora than,
the pure fabric. During letting off, the warp yarns are released from warp
beam (Bhanjni) as and when the woven cloth is taken up.
Cutting and doffing the saree
After completion of each saree an extra length of approximately one
inch is woven and separated from the cloth beam with the help of knife. This
however, helps to prevent the slippage of yarns through the dents. Extra length of
eight to nine inches of warp sheet is left at the back of the harness to which warp
ends of new saree will be twisted, glued and joined. The weaver now begins to
weave the new saree.
Mounting of sarees (Post loom processes)
The saree, after taking out from the loom is carefully folded for
delivery. Formerly, the sarees were given special finish by exclusive workers
called, Kundigar. To add glaze and sheen, the saree is treated with sizing
material. The fabric is mounted on wooden beam (Tur, cloth beam) (Plate 10)

104
PLATE 9. MOUNTING OF SAREE ON BEAM FOR FINISHING
Sizing solution is gently sprayed manually over it with the help of
sprayer and then the saree is tightly wou
nd on the be a m.
Post weaving process
After mounting the silk saree, its ready to market. The woven saree is
dried with cloth beam (Tur) along and later separated from tur (Plate 11).

105
PLATE 10. POLISHING PROCESS
This finishing process is called ‘polishing’. The saree is examined for
flaws and then systematically folded, packed in polyethylene bags.

106
CHAPTER IV
PERFORMANCE OF CO-OPERATIVE SILK SOCIETIES IN
KUMBAKONAM TALUK
This chapter indicates productivity and potentiality of silk Co-operative in
Kumbakaonam Taluk. In a heterogeneous, complex and stratified society like ours,
the position, the dependence and disabilities of small scale enterprises stem from
their multiple restrictions, caused by a variety of economic and social factors, the
level of completion and policy of the state can generally be measured by the level of
oppression and exploitation of indigenous manufacturers in the society. The close
examination of the casual relationship of various economic variables and the
structure of the business, the changing scenario in the silk industries functions
especially after globalization lot of transformation embedded with the structural
changes in the production function as well, thus this section elaborately discussed
the empirical findings of functions, performance and constraints of Silk society in
Kumbakaonam Taluk. This chapter depicts the Co-operative silk society in the study
area, the information encompass capital, working capital and challenges confronted
to Co-operatives.

107
Capacity utilization of Thirubuvanam Co-operative silk society
This section depicts the Thirubuvanam Co-operative silk society which
encompass the operational issues and pecuniary issues pertains to the various
components via procurement of Raw materials, sales, marketing expenditure,
operational expenditure, sources of capital and outstanding loans, since the capacity
of the Co-operative is the manifestation of these elements operational efficiency.
TABLE N0: IV.1
NUMBER OF MEMBERS AND LOOMS
Name of the society
Members
Active Looms
Inactive Looms
Total Looms
Thiruvalluvar 1806
(26.5)
1744
(30.6)
643
(31)
2387
(30.7)
Cholan 1980
(29.1)
1955
(34.3)
294
(14.2)
2249
(28.9)
Darasuram 450
(6.6)
150
(2.6)
387
(18.6)
537
(6.9)
Kalaivanar 282
(4.1)
100
(1.8)
46
(2.2)
146
(1.9)
Super 262
(3.8)
74
(1.3)
23
(1.1)
97
(1.2)
Thirubuvanam 1800
(26.4)
1558
(27.3)
472
(22.7)
2030
(26.1)
Kamarajar 227
(3.3)
126
(2.2)
212
(10.2)
338
(4.3)
Total 6807
(100)
5707
(100)
2077 (100) 7784
(100)
Source : secondary data

108
Table No: IV.1 Explains the number of members, and the looms which
they operate to run their business. Out of seven societies the Cholan co-operative
society is having more in member with the active loom of 34.3 per cent like wise
inactive and its actetive loom accounted in the society were14.2 per cent . Next to
cholan both Thirubuvana and Thiruvalluvar society lies very near percentage. The
level of members in every society were depednds up the on the capacity of the
society. The members level I was not fluctuate for the stduy period.
TABLE NO : IV. 2
SOURCES OF CAPITAL OF THIRUBUVANAM
CO-OPERATIVE SILK SOCIETY
(Rs in Lakhs)
Year Share of members
Reserve Fund Total Capital
2006 200.53 (18.7)
871.40 (81.3)
1071.93
2007 217.53 (19)
925.77 (81)
1143.30 (6.7)
2008 234.99 (19.3)
984.22 (80.7) 1219.21 (6.6)
2009 253.85 (19.5)
1048.22 (80.5)
1302.07 (6.8)
2010 272.28 (19.5)
1125.27 (80.5)
1397.55 (7.3)
2011 286.60 (16.6)
1436.36 (83.4) 1722.96 (23.3)
2012 309.53 (16.9)
1516.79 (83.05)
1826.32 (6.0)
Overall Growth 2006 200.5 871.4 1071.9 2012 309.5
(54.4) 1516.7 (74.1)
1826.3 (70.4)
Source: Secondary data (Audited report of TSCS)

109
FIGURE IV.1
0.0
500.0
1000.0
1500.0
2000.0
2006 2007 2008 2009 2010 2011 2012
1071.9 1143.3 1219.2 1302.1 1397.6
1723.01826.3
Source of Capital
Table.4.2. depicts the sources of capital of Thirubuvanam co-operative
silk producer during the study period, as 18.7 percent of the capital generated
through share of members in 2006 which is declined to 16.9 percent in 2012, none of
the money received as share of capital during the study period, around 81.3 percent
of the fund generated through reserve fund in 2006 which was enhanced to 83.05
percent in 2012, with respect to overall growth performance around 2 crores and 53
thousand of fund raised through share of members which was increased to 3 crores 9
lakhs and 52 thousands in 2012 with the hike of 54.4 percent, none of the fund
raised from share from Government, nearly 8 crores and 71 lakhs have generated
through reserve fund in 2006 which enhanced to 15 crores 16 lakhs and 79
thousands in 2012 with the increase of 74.1 percent with regard to overall capital 10
crores 71 lakhs and 93 thousands have raised in 2006 which is enhanced to 18 crores
26 lakhs and 32 thousands in 2012 with the hike of 70.4 percent, as there had been a
positive trend found in capital generation through various sources, the financial

110
position of the Thirubuvabuvanam appears relatively sound to invest from their
reserve fund during the study period since the operational efficiency of the silk with
its own experience and the strategies to adopted in the functional arena enable them
to obtain the sound financial position which accentuated proportion of own reserve
contribution towards capital for the Thirubuvanam silk producers in the study area.
TABLE NO: IV.3
SALES OF THIRUBUVANAM CO-OPERATIVE SILK SOCIETY
(Rs in Lakhs)
Year Direct Sales Sales through
Exhibition
Sales through Agent
Sales through Co-operative
Total Sales
Amount Rs. Amount Rs. Amount Rs. Amount Rs. 2006 1649.98
(60.6) - 1063.46
(39) 11.11 (0.4)
2724.55
2007 1775.24 (65.9)
- 905.91 (33.6)
13.06 (0.5)
2694.21 (-1.1)
2008 2067.94 (66.3)
- 1033.38 (33.1)
16.63 (0.5)
3117.95 (15.7)
2009 2417.44 (71.3)
- 955.44 (28.2)
18.98 (0.6)
3391.86 (8.8)
2010 2596.79 (75.7)
- 797.15 (23.2)
38.53 (1.1)
3432.47 (1.2)
2011 2864.36 (77.1)
- 823.36 (22.2)
29.27 (0.8)
3716.9 (8.3)
2012 3150.79 (76.8)
- 922.16 (22.5)
31.61 (0.8)
4104.5 (10.4)
Overall Growth 2006 1649.98 1063.46 11.1 2724.5 2012 3150.79
(91) 922.16
320 (-13.3) 31.6
(184.5) 4104.5 (50.7)
Source: Secondary data (Audited report of TSPCS):

111
2724.6 2694.23118.0
3391.9 3432.53716.9
4104.5
0.0500.0
1000.01500.02000.02500.03000.03500.04000.04500.0
2006 2007 2008 2009 2010 2011 2012
Total Sales
Total Sales
FIGURE IV.2
Table No: IV.3. exemplifies the value of the sales of silk products through
various sources of Thirubuvanam Co-operative silk society in study period, with
regard to direct sales around 60.6 percent of the value of sales obtained in 2006
which is increased 76.8 percent in 2012, with regard to sales through exhibition
none of the sales taken place under this category, with respect to sales through age
around 39 percent of the sales made in 2006 and which was decline to 22.5 percent
in 2012,, in connection with the sales through Co-operative nearly 0.4 percent sales
made under this category and increased to 0.8 percent in 2012.with regard to overall
changes around 16 crores 49 lakhs and 98 thousands in 2006 which is increased to
31 crores 50 lakhs and 80 thousands in 2012 with the hike of 91 percent of direct
sales taken place during the period. They do not sold anything through exhibition
during the study period, 10 crores 63 lakhs and 46 thousands worth of silk products
sold through commission agents in 2006 which declined to 9 crores 22 lakhs and 16
thousands in 2012 with the decline of 13.3 percent, through Co-operative they sold
11 lakhs and 11 thousands in 2006 which increased to 31 lakhs and 61 thousands in
2012 with the hike of 184.5 percent, at the outset overall value of the silk product
sole were 27 crores 24lakhs and 55 thousands which is increased to 41 crores 4lakhs

112
and 57 thousand with the hike of 50.7 during the study period, it is apparent from
the empirical findings that Thirubuvanam Co-operative silk society witnessed
consistent and concurrent escalation from all the sources of sales during the study
period as the society got sound marketing strategies and traditional customers for a
long time it also obtained the large chunk of customers who have been traditionally
wanted to purchase from Thirubuvanam silk producers as it stand in the market for a
long period of time which enhance the confidence level of the customers in the same
line the silk producers adopting new innovative designs and marketing strategies
which keep the Thirubuvanam sales trend in positive trend over the period of time.
TABLE NO: IV.4
PURCHASE OF MATERIAL OF THIRUBUVANAM CO-OPERATIVE
SILK SOCIETY
(Rs in Lakhs)
Year Yarn Zari Chemicals Total Expenditure
Amount Amount Amount Amount 2006 28.65
(22.3) 93.05 (72.3)
6.96 (5.4) 128.65
2007 33.63 (19.6)
131.13 (76.4)
6.94 (4)
171.69 (33.5)
2008 33.86 (19.5)
133.84 (77.2)
5.57 (3.2)
173.27 (0.9)
2009 24.55 (12.4)
167.74 (84.4)
6.51 (3.3)
198.81 (14.7)
2010 38.78 (17.3)
181.25 (80.9)
4.10 (1.8)
224.14 (12.7)
2011 42.36 (18.1)
187.28 (80.1)
4.26 (1.8)
233.90 (4.4)
2012 45.75 (18.8)
202.26 (79.2)
4.60 (2)
252.61 (8)
Overall Growth 2006 28.6 93.0 6.9 128.6 2012 45.7
(47.8) 202.2
(117.4) 4.2
(-33.9) 233.9 (96.3)
Source: Secondary data (Audited reports of TSPCS)

113
Table No: IV. 4 depicts the value of the raw materials purchased by
Thirubuvanam Co-operative silk society during the study period, with respect to
yarn purchase about 22.3 percent of the total raw materials purchase incurred in
2006 and then onwards value of purchase slightly fluctuated and in 2012 it come
down to 18.1 percent with slight decline from 2006,with respect to zari purchase
nearly 72.3 percent of the total raw materials purchase incurred in 2006 and then
onwards value of purchase consistently increased and in 2012 it gone up to 79.2
percent with significant escalation from 2006,with regard to Chemical purchase
around 5.4 percent of the total raw materials purchase incurred in 2006 and then
onwards value of purchase consistently decreased and in 2012 it had decline to 2
percent with significant decline from 2006, with regard to total expenditure there
has been consistent increase during the period.
The overall growth of the various components witnessed steady hike, the
Co-operative silk society spent around 28 lakhs and 64 thousand in 2006 which is
increased during the study period, as the marketing expenditure is the prominent
expenditure with induce the sales and the production, the statistical evidence
indicated that Thirubuvanam Co-operative silk society have spent consistently
during the study period. In connection with zari procurement in 2006 the Co-
operative spent nearly 93 lakhs which is increased to nearly 2 crores and 2 lakhs
with the hike of 117.4 percent, for chemical purchase around 7 lakhs spent on 2006
and which is declined to 4 lakhs and 60 thousand with the decline of 33.9 percent at
the outset total raw material purchase for Thirubuvanam Co-operative silk society
was around 1 core and 30 lakhs which is increased 2 crores and 53 lakhs in 2012
with the hike of 96.3 percent, It could be inferred from the empirical findings that
consistent increase witnessed during study period as the sales and production
increased rapidly it is obvious that the marketing expenditure witnessed
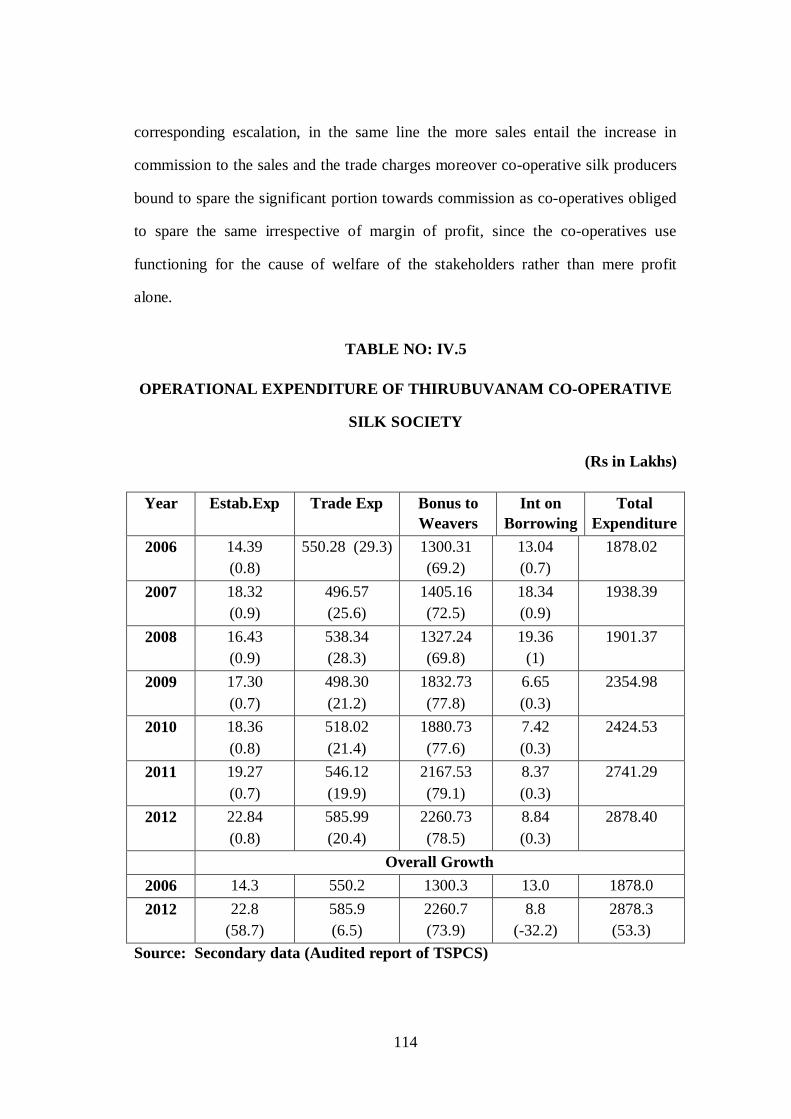
114
corresponding escalation, in the same line the more sales entail the increase in
commission to the sales and the trade charges moreover co-operative silk producers
bound to spare the significant portion towards commission as co-operatives obliged
to spare the same irrespective of margin of profit, since the co-operatives use
functioning for the cause of welfare of the stakeholders rather than mere profit
alone.
TABLE NO: IV.5
OPERATIONAL EXPENDITURE OF THIRUBUVANAM CO-OPERATIVE
SILK SOCIETY
(Rs in Lakhs)
Year Estab.Exp Trade Exp Bonus to Weavers
Int on Borrowing
Total Expenditure
2006 14.39 (0.8)
550.28 (29.3) 1300.31 (69.2)
13.04 (0.7)
1878.02
2007 18.32 (0.9)
496.57 (25.6)
1405.16 (72.5)
18.34 (0.9)
1938.39
2008 16.43 (0.9)
538.34 (28.3)
1327.24 (69.8)
19.36 (1)
1901.37
2009 17.30 (0.7)
498.30 (21.2)
1832.73 (77.8)
6.65 (0.3)
2354.98
2010 18.36 (0.8)
518.02 (21.4)
1880.73 (77.6)
7.42 (0.3)
2424.53
2011 19.27 (0.7)
546.12 (19.9)
2167.53 (79.1)
8.37 (0.3)
2741.29
2012 22.84 (0.8)
585.99 (20.4)
2260.73 (78.5)
8.84 (0.3)
2878.40
Overall Growth 2006 14.3 550.2 1300.3 13.0 1878.0 2012 22.8
(58.7) 585.9 (6.5)
2260.7 (73.9)
8.8 (-32.2)
2878.3 (53.3)
Source: Secondary data (Audited report of TSPCS)

115
Table No:. IV.5 depicts the operational expenditure of the Thirubuvanam
silk Co-operative silk society during the study period, with regard to establishment
expenditure around 0.8 percent of the expenditure made under this category and
remained same proportion in 2012, with respect to Trade expenditure around 29.3
percent of the expenditure made under this classification and declined to 20.4
percent in 2012, with regard to bonus to weavers around 69.2 percent of the
expenditure made out of the total expenditure in 2006 and increased 78.5 in 2012,
nearly 0.7 percent spent towards interest payment for the borrowing in 2006 and
which is declined to 0.3 percent in 2012, with respect to overall growth. Around 14
lakhs and 38 thousands in 2006 which is increased to 2 crores 22 lakhs and 83
thousands in 2012 with the hike of 58.7 percent of expenditure occurred on
establishment cost, around 5 crores 50 lakhs and 28 thousands in 2006 which is
increased to 5 crores 85 lakhs and 98 thousands in 2012 with the hike of 6.5
percent of expenditure occurred on trade charges during the study period, about
13 crores and 31 thousands in 2006 which is increased to 22 crores 60 lakhs and 73
thousands in 2012 with the hike of 73.9 percent of expenditure occurred on bonus
to weavers during the study period, with respect to interest payment towards
borrowing about 13 lakhs and 4 thousands in 2006 which is decreased to 8 lakhs
and 38 thousands in 2012 with the hike of 32.2 percent of expenditure occurred on
bonus to weavers during the study period, at the outset overall value of the
operational expenditure was 18 crores 78 lakhs and one thousand which is
increased to 28 crores 78 lakhs and 39 thousand with the hike of 53.3 during the
study period, as the Co-operatives had the standard norms on the expenditure pattern
irrespective of the sales and production since the Co-operatives are with the vested
interest to protect the weavers, thus, the operational expenditure have been

116
escalating even though there was not corresponding increase in sales and production
during the study period.
TABLE NO: IV.6
MARKETING EXPENDITURE INCURRED BY THIRUBUVANAM
CO-OPERATIVE SILK SOCIETY
(Rs in Lakhs)
Year Commission to consumer
Commission to selling
agent
Salary to sales
Person
Advertisement Total Expenditure
2006 214.73
(76.5)
54.72
(19.5)
1.76
(0.6)
9.31
(3.3)
280.52
2007 227.35
(81)
45.47
(16.2)
1.96
(0.7)
5.76
(2.1)
280.54
2008 444.26
(89)
43.75
(8.8)
2.25
(0.5)
8.87
(1.8)
499.13
2009 384.27
(83.5)
63.59
(13.8)
2.25
(0.5)
10.16
(2.2)
460.27
2010 400.03
(87.2)
46.70
(10.2)
2.70
(0.6)
9.07
(2)
458.50
2011 462.76
(86.7)
58.60
(11)
2.70
(0.5)
9.42
(1.8)
533.48
2012 534.95
(87.8)
61.71
(10.1)
2.81
(0.5)
10.01
(1.6)
609.48
Overall Growth
2006 214.73 54.72 1.7 9.3 280.5
2012 534.95
(149.1)
61.7
(12.8)
2.8
(59.9)
10.0
(7.6)
609.4
(117.3)
Source: Secondary data (Audited report of TSPCS)

117
Table.IV.6 Depicts the marketing expenditure of the Thirubuvanam silk
co-operative silk society during the study period, with regard to commission to
consumer around 76.5 percent of the expenditure made under this category and
increased to 87.8 percent in 2012, with respect to commission to selling agent
around 19.5 percent of the expenditure made under this classification and declined to
10.1 percent in 2012, with regard to salary to sales person around 0.6 percent of
the expenditure made out of the total expenditure in 2006 and slightly declined in
2012 with 0.5 percent,nearly 3.3 percent spent towards advertisement in 2006 and
which is declined to 1.6 percent in 2012, with respect to overall growth, around 2
crores 14 lakhs and 73 thousands in 2006 which is increased to 5 crores 34 lakhs
and 95 thousands in 2012 with the hike of 149.1 percent of expenditure occurred on
commission to consumer during the period, around 54 lakhs and 72 thousands in
2006 which is increased to 61 lakhs and 70 thousands in 2012 with the hike of 12.8
percent of expenditure incurred on commission to selling agent during the period,
around 1 lakh and 76 thousands in 2006 spent towards salary which is increased to 2
lakhs and 81 thousands in 2012 with the hike of 59.9 percent, around 9 lakh and 31
thousands in 2006 spent towards advertisement which is increased to 10 lakhs and
one thousand in 2012 with the hike of 7.6 percent, at the outset overall value of the
marketing expenditure was 2 crores 80 lakhs and 52 thousands which is increased to
6 crores 9 lakhs and 48 thousand with the hike of 117.3 during the study period,
as the marketing expenditure is the prominent expenditure with induce the sales and
the production, the statistical evidence indicated that Thirubuvanam Co-operative
silk society have spent consistently during the study period.
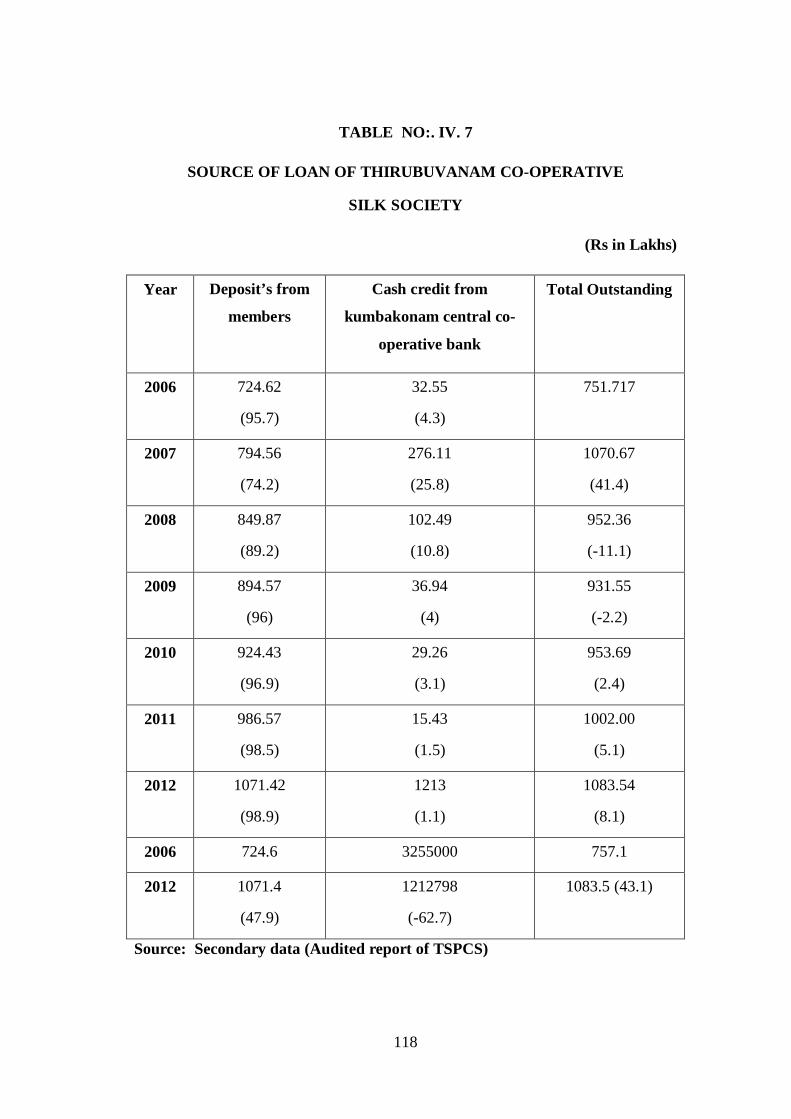
118
TABLE NO:. IV. 7
SOURCE OF LOAN OF THIRUBUVANAM CO-OPERATIVE
SILK SOCIETY
(Rs in Lakhs)
Year
Deposit’s from
members
Cash credit from
kumbakonam central co-
operative bank
Total Outstanding
2006 724.62
(95.7)
32.55
(4.3)
751.717
2007 794.56
(74.2)
276.11
(25.8)
1070.67
(41.4)
2008 849.87
(89.2)
102.49
(10.8)
952.36
(-11.1)
2009 894.57
(96)
36.94
(4)
931.55
(-2.2)
2010 924.43
(96.9)
29.26
(3.1)
953.69
(2.4)
2011 986.57
(98.5)
15.43
(1.5)
1002.00
(5.1)
2012 1071.42
(98.9)
1213
(1.1)
1083.54
(8.1)
2006 724.6 3255000 757.1
2012 1071.4
(47.9)
1212798
(-62.7)
1083.5 (43.1)
Source: Secondary data (Audited report of TSPCS)

119
Table No: IV.7 during the study period as the outstanding of loans would
revealed the financial distress of the organization, nearly 95.7 percent of the
outstanding loans owe to members of Co-operativeertaive society, around 4.3
percent borrowed from Kumbakonam Central Co-operative bank in 2006 which
Table No: No:. 4.6 depicts the outstanding of loans of the Thirubuvanam Co-
operative silk society was 98.9 percent and 1.1 percent from depositors and central
Co-operative silk societys in 2012 respectively, with regard to overall growth nearly
7 crores 24 lakhs and 62 thousands fund owe to depositors in 2006 and which
increased to 10 crores 71 lakhs and 41 thousands in 2012 with the hike of 47.9
percent, with regard to outstanding of loans from Kumbakonam central Co-operative
bank nearly 32 lakhs and 55 thousands owe to bank in 2006 which is declined to 12
lakhs and 12 thousands in 2012, as the institutional credit have declined during the
study period which connoted that the financial position of the Co-operative silk have
been sound and improved during the study period, it might because the
Thirubuvanam silk co-operative have sound financial as well as business structure
last for longer period of time.

120
TABLE NO: IV. 8
SOURCES OF CAPITAL OF CHOLAN CO-OPERATIVE SILK SOCIETY
(Rs in Lakhs)
Year Share from Govt Reserve Fund Total Capital
2006 42.15
(55.5)
33.81
(44.5)
76.0
2007 51.18
(58.9)
35.75
(41.1)
86.9
(14.4)
2008 49.77
(57)
37.52
(43)
87.3
(0.4)
2009 49.77
(57)
37.52
(43)
87.3
(0)
2010 53.32
(58.7)
37.52
(41.3)
90.8
(4.1)
2011 58.66
(61)
37.52
(39)
96.2
(5.9)
2012 62.29
(61.9)
38.39
(38.1)
10.1
(4.7)
Overall Growth
2006 42.14 33.81 75.9
2012 62.2 38.3
(13.5)
100.6
(32.5)
Source: Secondary data (Audited report of TSPCS)

121
0
20
40
60
80
100
2006 2007 2008 2009 2010 2011 2012
76.186.9 87.3 87.3 90.8
96.2
10.1
Source of Capital
Source of Capital
FIGURE IV.3
Table No:.IV.8 the sources of capital of Cholan Co-operative silk society
during the study period, as 55.5 percent of the capital generated through share of
members in 2006 which is increased to 61.9 percent in 2012, none of the money
received as share of capital during the study period, around 44.5 percent of the fund
generated through reserve fund in 2006 which was declined to 38.1 percent in 2012,
with respect to overall growth performance around 42 thousand of fund raised
through share of members which was increased to 62 lakhs and 29 thousands in
2012 with the hike of 47.8 percent, none of the fund raised from share from
Government, nearly 33 lakhs and 81 thousands have generated through reserve
fund in 2006 which enhanced to 38 lakhs and 38 thousands in 2012 with the increase
of 13.5 percent with regard to overall capital 75 lakhs and 96 thousands have raised
in 2006 which is enhanced to 1 crore and 68 thousands in 2012 with the hike of 32.5
percent, as there had been a positive trend found in capital generation through
various sources, the financial position of the Cholan appears relatively sound to
invest from their reserve fund as the larger co-operatives have got more members
and their contribution in terms of subscription would be more thus the financial

122
position of cholan co-operative appears to high in the same line their business also
relatively higher which accentuate the cholan co-operatives to rely largely on their
own funding for the working capital in the study period.
TABLE NO: IV.9
SALES OF CHOLAN CO-OPERATIVE SILK SOCIETY
(Rs. in Lakhs)
Year Direct Sales
Sales through
Exhibition
Sales through Agent
Sales through Co-operative
Total Sales
2006 2144.97 (60.6)
- 1382.49 (39.0)
14.44 (0.4)
3541.9
2007 1242.66 (65.9)
- 634.14 (33.6)
9.14 (0.5)
1885.94 (-46.8)
2008 1447.56 (66.3)
- 723.37 (33.1)
11.64 (0.5)
2182.56 (15.7)
2009 1450.46 (71.3)
- 573.26 (28.2)
11.39 (0.6)
2035.11 (-6.8)
2010 1558.07 (75.7)
- 478.29 (23.2)
23.12 (1.1)
2059.48 (1.2)
2011 1718.62 (77.1)
- 494.02 (22.2)
17.56 (0.8)
2230.19 (8.3)
2012 1856.11 (85.5)
- 540.95 (9.5)
18.62 (6)
2415.6 (8.3)
Overall Growth
2006 2144.9 1382.49 14.4 354.1
2012 1856.1 (-13.5)
540.9 (-60.9)
18.6 (28.9)
2415.6 (-31.8)
Source: Secondary data (Audited report of CSPCS)

123
3541.9
1885.942182.56 2035.11 2059.48 2230.19
2415.6
0
500
1000
1500
2000
2500
3000
3500
4000
2006 2007 2008 2009 2010 2011 2012
Total Sales
Total Sales
FIGURE IV.4
Table No: IV 9 demonstrates the value of the sales of silk products
through various sources of Cholan Co-operative silk society in study period, with
regard to direct sales around 60.6 percent of the value of sales obtained in 2006
which is decreased 39 percent in 2012, with regard to sales through exhibition none
of the sales taken place under this category, with respect to sales through agent
around 39 percent of the sales made in 2006 and which was decline to 33.6 percent
in 2012,, in connection with the sales through Co-operative nearly 0.4 percent sales
made under this category and increased to 6 percent in 2012,with regard to overall
changes around 21 crores 44 lakhs and 98 thousands in 2006 which is decreased to
18 crores 56 lakhs and 10 thousands in 2012 with the decline 13.5 of direct sales
taken place during the period, they didn’t sold anything through exhibition during
the study period, 13 crores 82 lakhs and 24 thousands worth of silk products sold
through commission agents in 2006 which declined to 5 crores 40 lakhs and 94
thousands in 2012 with the decline of 60.9 percent, through Co-operative they sold
14 lakhs and 44 thousands in 2006 which increased to 18 lakhs and 61 thousands in
2012 with the hike of 28.9 percent, at the outset overall value of the silk products

124
sole were 35 crores 41 lakhs and 91 thousands which is decreased to 24 crores 41
lakhs and 57 thousand with the decline of 31.8 during the study period, it is
apparent from the empirical findings that Cholan Co-operative silk society
witnessed constant and simultaneous decline in the sales throughout the study
period except the hike in Co-operative sales as it shown that the institutionalized
marketing facilities enabled them to enhance the sales in better way at the outset all
the sources of sales during the study period have been showing decline except Co-
operative during the study period.
TABLE NO:. IV. 10
COST OF RAW MATERIAL OF CHOLAN CO-OPERATIVE SILK SOCIETY
(Rs in Lakhs)
Year Yarn Zari Chemical Total
2006 52.22 (28.1)
132.33 (71.2)
1.41 (0.8)
185.96
2007 40.76 (19.6)
166.33 (79.9)
1.17 (0.6)
208.27 (12)
2008 54.46 (26.6)
149.34 (72.9)
1.14 (0.6)
204.94 (-1.6)
2009 35.40 (19.7)
143.32 (79.8)
0.79 (0.4)
179.49 (-12)
2010 44.39 (24.8)
133.76 (74.7)
0.98 (0.5)
179.12 (-0.2)
2011 48.75 (26) 137.86 (73.5)
0.89 (0.5)
187.51 (4.7)
2012 52.17 (24.0) 147.52 (0.5)
0.96 (0.5)
200.64 (7.0)
Overall Growth 2006 52.2 132.3 1.4 185.9 2012 52.1
(-0.08) 147.5 (11.5)
0.9 (-32.9)
200.6 (7.9)
Source: Secondary data( Audit report of CSPCS)

125
186.0
208.3204.9
179.5 179.1
187.5
200.6
160.0165.0170.0175.0180.0185.0190.0195.0200.0205.0210.0215.0
2006 2007 2008 2009 2010 2011 2012
Total sales
Total sales
FIGURE IV.5
Table No:. IV.10 illustrates the value of the raw materials purchased by
Cholan Co-operative silk society during the study period, with respect to yarn
purchase about 28.1 percent of the total raw materials purchase incurred in 2006
and then onwards value of purchase slightly fluctuated and in 2012 it come down to
24 percent with slight decline from 2006,with respect to zari purchase nearly 71.2
percent of the total raw materials procurement incurred in 2006 and then onwards
value of purchase constantly augmented and in 2011 it gone up to 75.5 percent
with significant acceleration from 2006,with regard to Chemical purchase around
0.8 percent of the total raw materials spent on chemicals purchase in 2006 and then
onwards value of purchase consistently decreased and in 2011 it had decline to 0.5
percent with mild decline from 2006, with regard to total expenditure there has been
consistent increase during the period.
The overall growth of the various components witnessed steady hike, the
Co-operative silk society spent around 52 lakhs and 20 thousand in 2006 which is
decreased to around 52 lakhs and 17 thousand in 2012 with the decline 0.08
percent, in connection with zari procurement in 2006 the Co-operative spent nearly
1 crore 32 lakhs which is increased to nearly 1 crores and 47 lakhs with the hike of
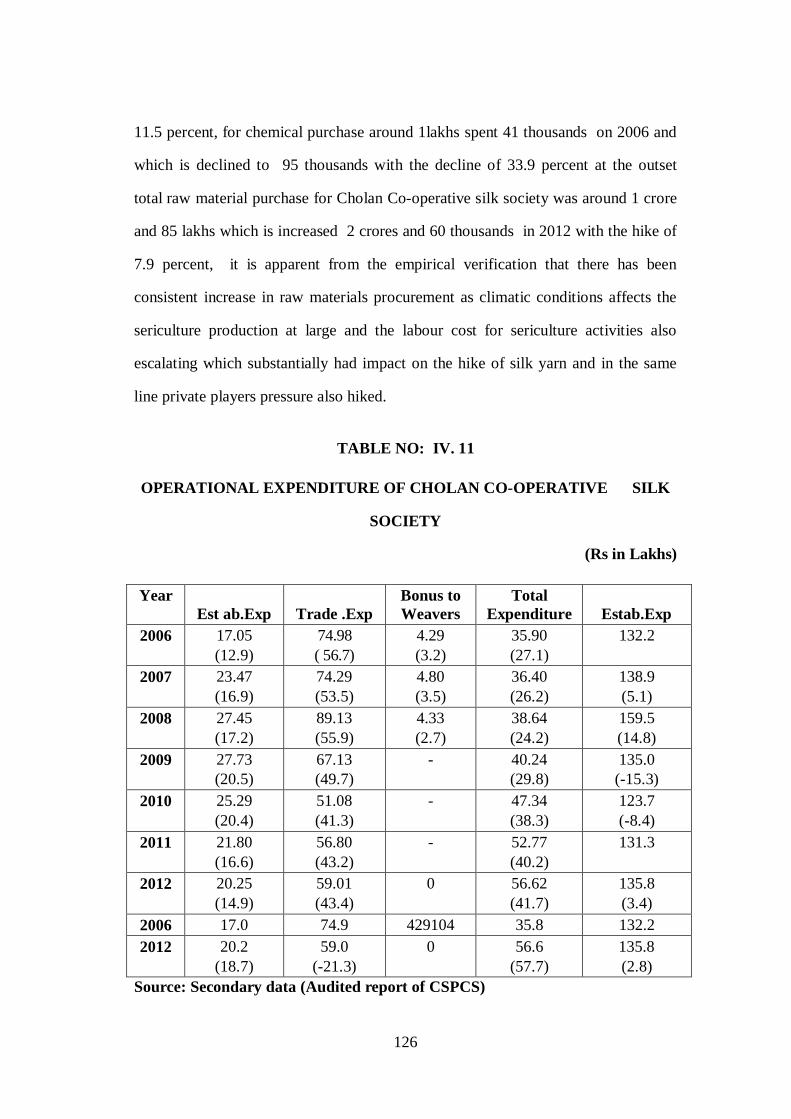
126
11.5 percent, for chemical purchase around 1lakhs spent 41 thousands on 2006 and
which is declined to 95 thousands with the decline of 33.9 percent at the outset
total raw material purchase for Cholan Co-operative silk society was around 1 crore
and 85 lakhs which is increased 2 crores and 60 thousands in 2012 with the hike of
7.9 percent, it is apparent from the empirical verification that there has been
consistent increase in raw materials procurement as climatic conditions affects the
sericulture production at large and the labour cost for sericulture activities also
escalating which substantially had impact on the hike of silk yarn and in the same
line private players pressure also hiked.
TABLE NO: IV. 11
OPERATIONAL EXPENDITURE OF CHOLAN CO-OPERATIVE SILK
SOCIETY
(Rs in Lakhs)
Year Est ab.Exp Trade .Exp
Bonus to Weavers
Total Expenditure Estab.Exp
2006 17.05 (12.9)
74.98 ( 56.7)
4.29 (3.2)
35.90 (27.1)
132.2
2007 23.47 (16.9)
74.29 (53.5)
4.80 (3.5)
36.40 (26.2)
138.9 (5.1)
2008 27.45 (17.2)
89.13 (55.9)
4.33 (2.7)
38.64 (24.2)
159.5 (14.8)
2009 27.73 (20.5)
67.13 (49.7)
- 40.24 (29.8)
135.0 (-15.3)
2010 25.29 (20.4)
51.08 (41.3)
- 47.34 (38.3)
123.7 (-8.4)
2011 21.80 (16.6)
56.80 (43.2)
- 52.77 (40.2)
131.3
2012 20.25 (14.9)
59.01 (43.4)
0 56.62 (41.7)
135.8 (3.4)
2006 17.0 74.9 429104 35.8 132.2 2012 20.2
(18.7) 59.0
(-21.3) 0 56.6
(57.7) 135.8 (2.8)
Source: Secondary data (Audited report of CSPCS)

127
Table No.IV.11 depicts the operational expenditure of the Cholan silk
Co-operative silk societysdurin g the study period,with regard to establishment
expenditure around 12.9 percent of the expenditure made under this category and
incarsed to 14.9 percent in 2012, with respect to Trade expenditure around 56.7
percent of the expenditure made under this classification and declined to 43.4
percent in 2012, with regard to bonus to weavers around 3.2 percent of the
expenditure made out of the total expenditure in 2006 and which was curtailed in
2012,nearly 27.1 percent spent towards interest payment for the borrowing in 2006
and which is increased to 41.7 percent in 2012, with respect to overall growth,
around 17 lakhs and 05 thousands in 2006 which is increased to 20 lakhs and 24
thousands in 2012 with the hike of 18.7 percent of expenditure occurred on
establishment cost, around 74 lakhs and 98 thousands in 2006 which is decreased to
59 lakhs and a thousand in 2012 with the decline of 21.3 percent of expenditure
occurred on trade charges during the study period, about 4 lakhs and 29 thousands
in 2006 which is curtailed in 2012 for expenditure on bonus to weavers during the
study period, with respect to interest payment towards borrowing about 35 lakhs
and 89 thousands in 2006 which is increased to 56 lakhs and 62 thousands in 2012
with the hike of 57.7 percent of expenditure occurred on bonus to weavers during
the study period, at the outset overall value of the operational expenditure was 1
crore 32 lakhs and one thousand which is increased to 1 crore 35 lakhs and 58
thousand with the hike of 2.8 during the study period, as the Co-operatives had
the standard norms on the expenditure pattern irrespective of the sales and
production since the Co-operatives are with the vested interest to protect the weavers
but the financial distress forced them to curtailed the bonus to the weavers during
the study period but the interest payment expenses more alarmingly, thus, the

128
operational expenditure have been escalating even though there was not
corresponding increase in sales and production during the study period.
TABLE NO: IV. 12
MARKETING EXPENDITURE INCURRED BY CHOLAN CO-
OPERATIVESILK SOCIETY
( Rs in Lakhs)
Year Commission to consumer
Commission to selling
agent
Salary to sales Person
Advertisement Total Expenditure
2006 171.78
(75.2)
46.51 (20.4)
1.60
(0.7)
8.47
(3.7)
228.3
2007 209.16
(81.4)
40.92
(15.9)
1.57
(0.6)
5.30
(2.1)
256.9
(12.5)
2008 386.51
(89.9)
33.69 (7.8)
1.94
(0.5)
7.63 (1.8)
429.75
(67.3)
2009 353.53
(84.1)
56.60
(13.5)
2.07
(0.5)
8.13
(1.9)
420.3
(-2.2)
2010 360.03
(87.4)
42.50
(10.3)
2.30
(0.6)
7.17
(1.7)
411.98
(-2)
2011 402.60
(86.9)
49.81
(10.7)
2.30
(0.5)
8.67
(1.9)
463.37
(12.5)
2012 457.35
(87.4)
53.99
(10.3)
2.46
(0.5)
9.21
(1.8)
523.0
(12.9)
Overall Growth
2006 171.7 46.51 1.6 8.4 228.36
2012 457.3
(166.2)
53.9
(16.09)
2.4
(53.8)
9.2
(8.7)
523.0
(129)
Source: Secondary data (Audited report of CSPCS)
129
Table No:. IV.12depicts the marketing expenditure of the Cholan silk Co-
operative silk societys during the study period,with regard to commission to
consumer around 75.2 percent of the expenditure made under this category and
increased to 87.4 percent in 2012, with respect to commission to selling agent
around 20.4 percent of the expenditure made under this classification and declined to
10.3 percent in 2012, with regard to salary to sales personnel around 0.7 percent
of the expenditure made out of the total expenditure in 2006 and slightly declined in
2012 with 0.5 percent, nearly 3.7 percent spent towards advertisement in 2006 and
which is declined to 1.8 percent in 2012, with respect to overall growth, around
1crores 71 lakhs and 78 thousands in 2006 which is increased to 4 crores 57 lakhs
and 35 thousands in 2012 with the hike of 166.2 percent of expenditure occurred on
commission to consumer during the period, around 46 lakhs and 51 thousands in
2006 which is increased to 53 lakhs and 99 thousands in 2012 with the hike of
16.09 percent of expenditure incurred on commission to selling agent during the
period.
Around 1 lakh and 60 thousands in 2006 spent towards salary which is
increased to 2 lakhs and 46 thousands in 2012 with the hike of 53.8 percent, around
8 lakh and 47 thousands in 2006 spent towards advertisement which is increased to 9
lakhs and 21 thousand in 2012 with the hike of 8.7 percent, at the outset overall
value of the marketing expenditure was 2 crores 28 lakhs and 83 thousands which is
increased to 5 crores 23 lakhs and 2 thousand with the hike of 129 percent during
the study period, as the marketing expenditure is the important component of the
expenditure structure of Cholan Co-operative silks which enables the sales
promotion, however, irrespective sales level societies bound to provide the entitled

130
privileges to the weavers so the expenditure appears escalating without concerning
the corresponding increases in sales level.
TABLE NO: IV.13
OUTSTANDING LOANS OF CHOLAN CO-OPERATIVE SILK SOCIETY
(Rs in Lakhs)
Year
Deposit’s from members Total Outstanding
2006 199.1
(100) 199.2
2007 222.5
(100)
222.5
(11.7)
2008 228.2
(100)
228.3
(2.5)
2009 228.2
(100)
228.3
(0)
2010 228.2
(100)
228.3
(0)
2011 197.5
(100)
197.5
(-13.4)
2012 184.6
(100)
184.7
(-6.5)
Overall Growth
2006 199.1 199.1
2012 184.6
(-7.3)
184.6
(-7.3)
Source: Secondary data (Audited report of CSPCS)
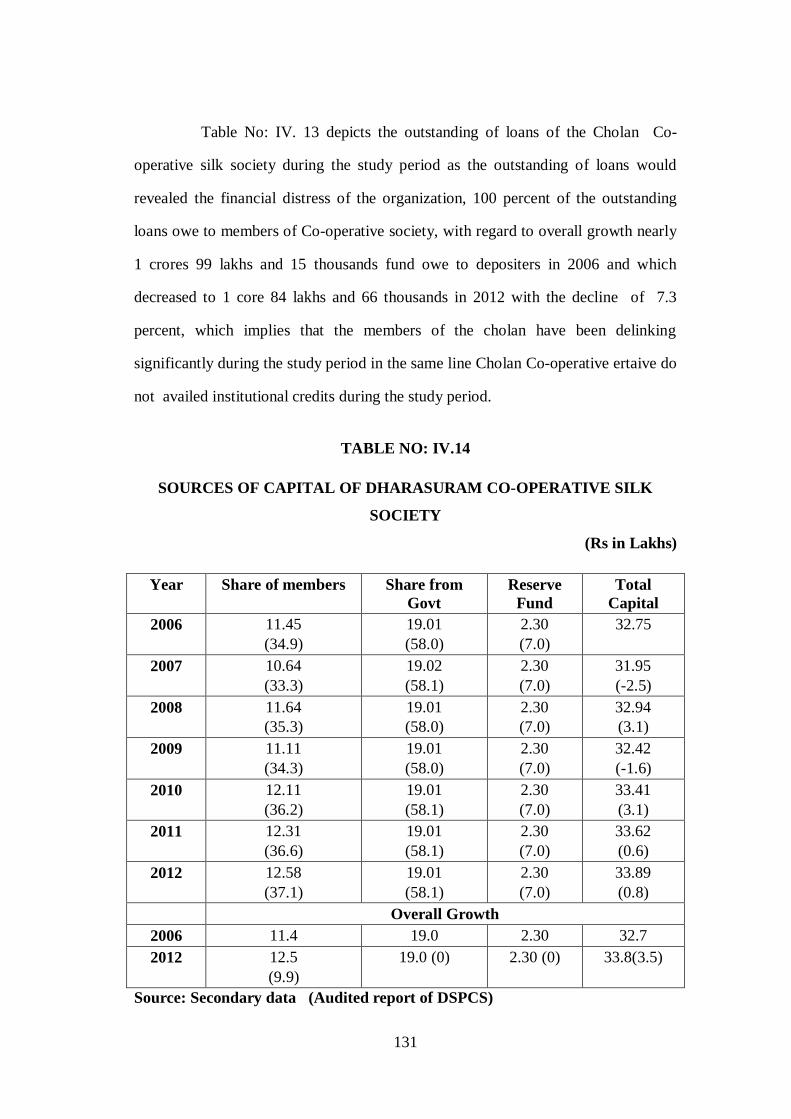
131
Table No: IV. 13 depicts the outstanding of loans of the Cholan Co-
operative silk society during the study period as the outstanding of loans would
revealed the financial distress of the organization, 100 percent of the outstanding
loans owe to members of Co-operative society, with regard to overall growth nearly
1 crores 99 lakhs and 15 thousands fund owe to depositers in 2006 and which
decreased to 1 core 84 lakhs and 66 thousands in 2012 with the decline of 7.3
percent, which implies that the members of the cholan have been delinking
significantly during the study period in the same line Cholan Co-operative ertaive do
not availed institutional credits during the study period.
TABLE NO: IV.14
SOURCES OF CAPITAL OF DHARASURAM CO-OPERATIVE SILK
SOCIETY
(Rs in Lakhs)
Year Share of members Share from Govt
Reserve Fund
Total Capital
2006 11.45 (34.9)
19.01 (58.0)
2.30 (7.0)
32.75
2007 10.64 (33.3)
19.02 (58.1)
2.30 (7.0)
31.95 (-2.5)
2008 11.64 (35.3)
19.01 (58.0)
2.30 (7.0)
32.94 (3.1)
2009 11.11 (34.3)
19.01 (58.0)
2.30 (7.0)
32.42 (-1.6)
2010 12.11 (36.2)
19.01 (58.1)
2.30 (7.0)
33.41 (3.1)
2011 12.31 (36.6)
19.01 (58.1)
2.30 (7.0)
33.62 (0.6)
2012 12.58 (37.1)
19.01 (58.1)
2.30 (7.0)
33.89 (0.8)
Overall Growth 2006 11.4 19.0 2.30 32.7 2012 12.5
(9.9) 19.0 (0) 2.30 (0) 33.8(3.5)
Source: Secondary data (Audited report of DSPCS)

132
30.5
31
31.5
32
32.5
33
33.5
34
2006 2007 2008 2009 2010 2011 2012
32.75
31.95
32.94
32.42
33.4133.62
33.89
Total Capital
Total Capital
FIGURE IV.6
Table No: IV.14 portrays the sources of capital of Dharasuram Co-
operative silk society during the study period, as 34.9 percent of the capital
generated through share of members in 2006 which is increased to 37.1 percent in
2012, around 58 percent of the capital generated through share from Government in
2006 which is declined to 56.1 percent in 2012, around 7 percent of the fund
generated through reserve fund in 2006 which was declined to 6.8 percent in 2012,
with respect to overall growth performance around 1 lakh 14 thousand of fund
raised through share of members which was increased to 1 lakh and 58 thousands in
2012 with the hike of 9.9 percent, around 1 lakh and 90 thousand raised from share
from Government and remained same in 2012 as well, nearly 2 lakhs and 29
thousands have generated through reserve fund in 2006 which also remained same
in 2012, with regard to overall capital 32 lakhs and 75 thousands have raised in 2006
which is enhanced to 33 lakhs and 88 thousands in 2012 with the hike of 3.5
percent, share of the government and reserve fund have neither increased nor

133
decreased during the study period but depositors portion witnessed moderate
escalation during the study period, the Co-operatives have got the institutionalized
support from the Government and got moderate support from own sources during
the study period.
TABLE NO: IV.15
SALES OF DHARASURAM CO-OPERATIVE SILK SOCIETY
(Rs in Lakhs)
Year Direct Sales Sales through Agent
Sales through Co-operative
Total Sales
2006 10.73
(60.6)
6.91
(39.1)
0.07
(0.4)
17.7
2007 6.21
(65.9)
3.17
(33.6)
0.05
(0.5)
9.4
(-46.8)
2008 7.24
(66.3)
3.61
(33.1)
0.06
(0.5)
10.9
(15.7)
2009 7.25
(71.3)
2.87
(28.2)
0.06
(0.6)
10.2
(-6.8)
2010 7.79
(75.7)
2.39
(23.2)
0.11
(1.1)
10.3
(1.2)
2011 8.59
(77.1)
2.47
(22.2)
0.08
(0.8)
11.2
(8.3)
2012 9.45
(77.2)
2.70
(22.1)
0.9
(0.9)
12.3
(9.9)
Overall Growth
2006 10.7 6.9 0.07 17.7
2012 9.4
(-11.9)
2.7
(-60.9)
0.9
(30.8)
12.2
(30.8)
Source : Secondary data (Audited report of DSCS)

134
17.7
9.410.9 10.2 10.3 11.2
12.3
02468
101214161820
2006 2007 2008 2009 2010 2011 2012
Total Sales
Total Sales
FIGURE IV.6
Table No: IV.14 demonstrates the value of the sales of silk products
through various sources of Dharasuram Co-operative silk society in study period,
with regard to direct sales around 60.6 percent of the value of sales obtained in 2006
which is increased 77.2 percent in 2012, with regard to sales through exhibition
none of the sales taken place under this category, with respect to sales through agent
around 39 percent of the sales made in 2006 and which was decline to 22.1 percent
in 2012,, in connection with the sales through Co-operative nearly 0.4 percent sales
made under this category and increased to 0.8 percent in 2012,with regard to overall
changes around 10 lakhs and 72 thousands in 2006 which is decreased to 9 lakhs
and 45 thousands in 2012 with the decline 11.9 of direct sales taken place during the
period, they didn’t sold anything through exhibition during the study period, 6 lakhs
and 91 thousands worth of silk products sold through commission agents in 2006
which declined to 2 lakhs and 70 thousands in 2012 with the decline of 60.9 percent,
through Co-operative they sold 7 thousands in 2006 which increased to 9 thousands
in 2012 with the hike of 30.8 percent, at the outset overall value of the silk products
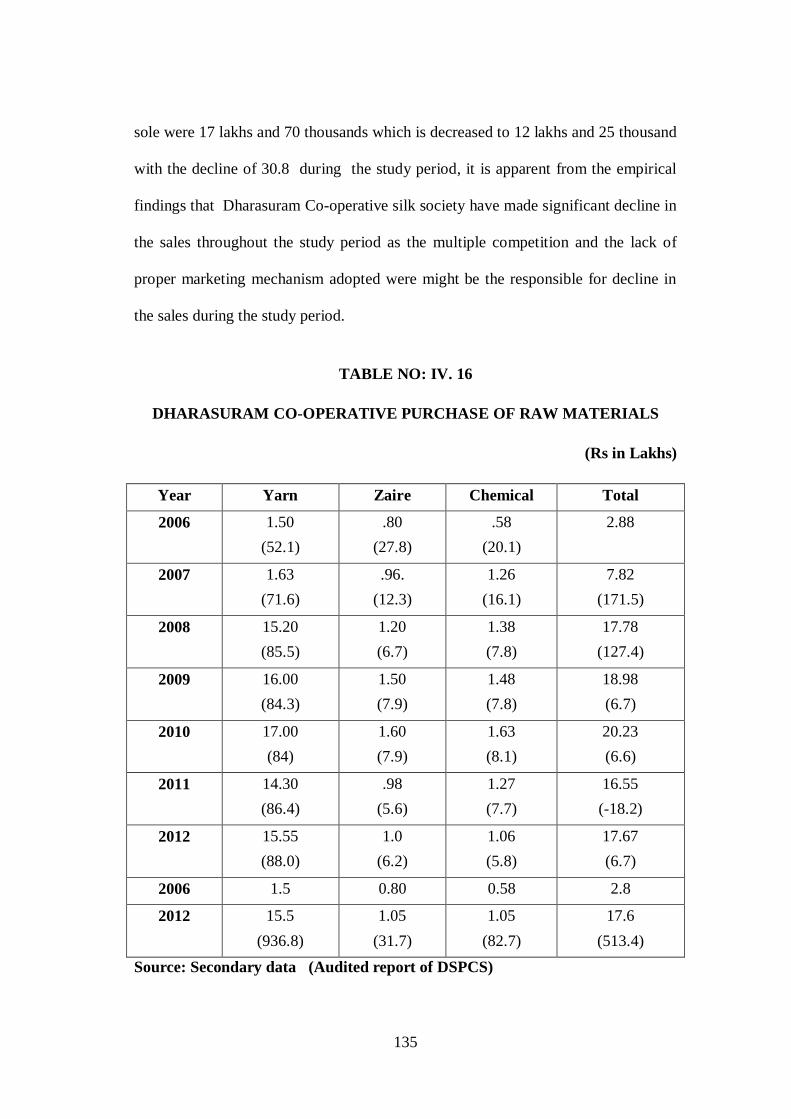
135
sole were 17 lakhs and 70 thousands which is decreased to 12 lakhs and 25 thousand
with the decline of 30.8 during the study period, it is apparent from the empirical
findings that Dharasuram Co-operative silk society have made significant decline in
the sales throughout the study period as the multiple competition and the lack of
proper marketing mechanism adopted were might be the responsible for decline in
the sales during the study period.
TABLE NO: IV. 16
DHARASURAM CO-OPERATIVE PURCHASE OF RAW MATERIALS
(Rs in Lakhs)
Year Yarn Zaire Chemical Total
2006 1.50 (52.1)
.80 (27.8)
.58 (20.1)
2.88
2007 1.63 (71.6)
.96. (12.3)
1.26 (16.1)
7.82 (171.5)
2008 15.20 (85.5)
1.20 (6.7)
1.38 (7.8)
17.78 (127.4)
2009 16.00 (84.3)
1.50 (7.9)
1.48 (7.8)
18.98 (6.7)
2010 17.00 (84)
1.60 (7.9)
1.63 (8.1)
20.23 (6.6)
2011 14.30 (86.4)
.98 (5.6)
1.27 (7.7)
16.55 (-18.2)
2012 15.55 (88.0)
1.0 (6.2)
1.06 (5.8)
17.67 (6.7)
2006 1.5 0.80 0.58 2.8
2012 15.5 (936.8)
1.05 (31.7)
1.05 (82.7)
17.6 (513.4)
Source: Secondary data (Audited report of DSPCS)
136
Table No: IV.16 illustrates the value of the raw materials purchased by
Dharasuram Co-operative silk society from 2006 to 2011, with regard to yarn
purchase about 52.1 percent of the total raw materials purchase incurred in 2006
and then onwards value of purchase consistently shown ascending tend and in 2012
it gone to 88.4 percent with significant escalation from 2006,with respect to zari
purchase nearly 27.8 percent of the total raw materials procurement incurred in
2006 and then onwards value of purchase constantly declined and in 2011 it come
down to 6.2 percent with significant deceleration from 2006,with regard to
Chemical purchase around 20.1 percent of the total raw materials spent on
chemicals purchase in 2006 and then onwards value of purchase consistently
decreased and in 2012 it had decline to 5.8 percent with substantial decline from
2006, with regard to total expenditure there has been consistent increase during the
period except consistent decline during 2012, the overall growth of the various
components witnessed firm hike.
Dharasuram Co-operative silk society spent around 1 lakh and 50
thousand in 2006 for yarn purchase which is increased to around 15 lakhs and 55
thousand in 2012 with the escalation of 936.8 percent, in connection with zari
procurement in 2006 the Co-operative spent nearly 80 thousands which is increased
to nearly 1 lakh and 5 thousands with the hike of 31.7 percent, for chemical
purchase around 58 thousands on 2006 and which is increased to 1 lakh and 5
thousands with the increase of 82.7 percent at the outset total raw material purchase
for Dharsaram Co-operative silk society was around 2 lakhs and 88 thousands
which is increased 17 lakhs and 66 thousands in 2012 with the hike of 513.4
percent it is apparent from the empirical verification that the expenditure proportion

137
is unlike to Cholan and Thirubuvanam as Darsuram spent less to zari procurement
than yarn, as Darausram Co-operative silk society might have opt for other fiber zari
rather than silver coated zari for their production, at the outset the overall
expenditure have witnessed steady increase upto 2010 but declined to 2012.
TABLE NO: IV. 17
OPERATIONAL EXPENDITURE OF DHARASURAM CO-OPERATIVE
SILK SOCIETY (Rs in Lakhs)
Year Estab. Expenses
Trade Expenses Bonus to Weavers
Interest on Borrowing
Total Expenditure
2006 12.79
(12.2)
60.74
(57.8)
3.22
(3.1)
28.36
(27)
105.0
2007 19.72
(17.4)
62.39
(55.1)
3.84
(3.4)
27.30
(24.1)
113.2
(7.7)
2008 23.60
(19.4)
64.18
(52.8)
2.81
(2.3)
30.91
(25.4)
121.5
(7.3)
2009 22.18
(23)
47.0
(48.7)
0 27.41
(28.3)
96.5
(-20.6)
2010 17.1
(20.2)
34.7
(41.0)
0 33.14
(39.0)
85.1
(-11.9)
2011 15.04
(16.8)
38.62
(43.1)
0 35.88
(40.1)
89.5
(5.3)
2012 14.54
(15.9)
40.24
(44.0)
0 36.67
(40.1)
91.5
(2.1)
Overall Growth
2006 12.7 60.7 3.2 28.3 105.1
2012 14.5
(13.7)
40.2
(-33.7)
0 36.6
(29.3)
91.4
(-12.9)
Source: Secondary data ( Audited report of DSPCS)

138
Table No: IV. 17 depicts the operational expenditure of the Dharasuram
silk Co-operative silk society during the study period, with regard to establishment
expenditure around 12.2 percent of the expenditure made under this category and
increased to 15.9 percent in 2012, with respect to Trade expenditure around 57.8
percent of the expenditure made under this classification and declined to 44 percent
in 2012, with regard to bonus to weavers around 3.1 percent of the expenditure
made out of the total expenditure in 2006 and which was curtailed in 2012,nearly 27
percent spent towards interest payment for the borrowing in 2006 and which is
increased to 40.1 percent in 2012, with respect to overall growth,around 12 lakhs
and 78 thousands in 2006 which is increased to 14 lakhs and 54 thousands in 2012
with the hike of 13.7 percent of expenditure occurred on establishment cost, around
60 lakhs and 73 thousands in 2006 which is decreased to 40 lakhs and 24 thousand
in 2012 with the decline of 33.7 percent of expenditure occurred on trade charges
during the study period, about 3 lakhs and 21 thousands in 2006 which is curtailed
in 2012 for expenditure on bonus to weavers .
During the study period, with respect to interest payment towards
borrowing about 28 lakhs and 35 thousands in 2006 which is increased to 36 lakhs
and 67 thousands in 2012 with the hike of 29.3 percent of expenditure occurred
during the study period, at the outset overall value of the operational expenditure
was 1 crore 5 lakhs and 10 thousand which is increased to 91 lakhs and 45
thousand with the decline of 12.9 percent during the study period, as the Co-
operatives had the standard norms on the expenditure pattern irrespective of the
sales and production since the Co-operatives are with the vested interest to protect
the weavers, however, the operational expenditure pattern shows that they couldn’t
spent on bonus towards weavers after 2008 which indicated the financial distress of

139
the Co-operative in the same line the indebtedness have been increased significantly
during the study period.
TABLE NO: IV.18
MARKETING EXPENDITURE INCURRED BY DHARASURAM
CO-OPERATIVE SILK SOCIET (Rs in Lakhs)
Year
Commission to consumer
Commission to selling
agent
Salary to sales
Person
Advertisement Total Expenditure
2006 60.12
(71.8)
19.88
(23.7)
0.69
(0.8)
3.09
(3.7)
83.8
2007 81.89
(82)
15.55
(15.6)
0.54
(0.5)
1.94
(1.9)
99.9 (19.3)
2008 122.14
(85.7)
15.38
(10.8)
0.57
(0.4)
4.36
(3.1)
142.5
(42.6)
2009 120.27
(81.1)
22.67
(15.3)
0.93
(0.6)
4.39
(3.0)
148.3
(4.1)
2010 175.41
(90.9)
13.60
(7.0)
0.79
(0.4)
3.14
(1.6)
192.9
(30.1)
2011 146.55
(86.4)
19.90
(11.7)
0.83
(0.5)
2.43
(1.4)
169.7
(-12)
2012 128.08
(83.1)
23.36
(15.2)
0.86
(0.6)
1.88 (1.2)
154.2
(-9.1)
Overall Growth
2006 60.1 19.8 0.68 3.0 83.7
2012 128.0
(113.0)
23.3
(17.5)
0.85
(24.5)
1.8
(-39.3)
154.1
(84.02)
Source: Secondary data (Audited report of DSPCS)

140
Table No: IV.18 depicts the marketing expenditure of the Dharasuram silk
Co-operative silk societysdurin g the study period, with regard to commission to
consumer around 71.8 percent of the expenditure made under this category and
increased to 83.1 percent in 2012, with respect to commission to to selling agent
around 23.7 percent of the expenditure made under this classification and declined to
15.2 percent in 2012, with regard to salary to sales personnel around 0.8 percent
of the expenditure made out of the total expenditure in 2006 and slightly declined in
2012 with 0.6 percent,nearly 3.7 percent spent towards advertisement in 2006 and
which is declined to 1.2 percent in 2012, with respect to overall growth,around 6
lakhs and a thousand in 2006 which is increased to 12 lakhs and 35 thousands in
2012 with the hike of 113.2 percent of expenditure occurred on commission to
consumer during the period, around 19 lakhs and 88 thousands in 2006 which is
increased to 23 lakhs and 36 thousands in 2012 with the hike of 17.5 percent of
expenditure incurred on commission to selling agent during the period, around 68
thousands in 2006 spent towards salary which is increased to 85 thousands in 2012
with the hike of 24.5 percent, around 3 lakh and 8 thousands in 2006 spent towards
advertisement which is decreased to 1 lakh and 85 thousand in 2012 with the
decline of 39.3 percent, at the outset overall value of the marketing expenditure
was 83 lakhs and 78 thousands which is increased to 1 crore 54 lakhs and 17
thousand with the hike of 84.02 percent during the study period, as the marketing
expenditure is the important component of the expenditure structure of Dharasuram
Co-operative silks which enables the sales promotion, however, irrespective sales
level societies und to pe the entitled privileges to the weavers so the expenditure
appears escalating without concerning the corresponding increases in sales level.

141
TABLE No: IV.18-A
OUTSTANDING LOANS OF DHARASURAM CO-OPERATIVSILK
SOCITEY (RS In Lakhs)
Year Deposit’s from
members
Cash credit from
kumbukonam central Co-
operative bank
Total
Outstanding
2006 289.85
(95.2)
14.65
(4.8)
30.44
2007 325.77
(75.6)
104.92
(24.4)
43.06
(41.1)
2008 399.44
(90.1)
44.07
(9.9)
44.35
(3.0)
2009 384.67
(96.1)
15.53
(3.9)
40.02
(-9.8)
2010 434.48
(97.4)
11.41
(2.6)
44.59
(11.4)
2011 394.63
(98.2)
7.25
(1.8)
40.19
(-9.9)
2012 342.14
(98.2)
6.29
(1.8)
348.43
(-13.3)
Overall Growth
2006 2898 14.6 30.4
2012 342.1
(18)
6.2
(-57.1)
348.4
(14)
Source: Secondary data (Audited report of DSPCS)
142
Table No:. 4.18 A depicts the outstanding of loans of the Dharasuram
Co-operative silk society during the study period as the outstanding of loans would
revealed the financial distress of the organization, 95.2 percent of the outstanding
loans owe to members of Co-operativeertaivesoceity in 2006 which is increased to
98.2 percent in 2012, nearly 4.8 percent of outstanding loans owe to Kumbakonam
central Co-operative bank in 2006 which is declined to 1.8 percent in 2012, with
regard to overall growth nearly 2 crores 89 lakhs and 84 thousands fund owe to
depositers in 2006 and which increased to 3 core 42 lakhs and 14 thousands in 2012
with the increase of 18 percent, with regard to outstanding owe to Kumbakonam
central Co-operative bank nearly 14 lakhs and 64 thousand have registered which is
declined to 6 lakhs and 28 thousand in 2012 with 57.1 percent decline, at the outset
total outstanding was 3 crores and 4 lakhs and 49 thousands which was increased to
3 crores 48 lakhs and 43 thousands in 2012 with the increase of 14.4 percent during
the study period. It is apparent from the empirical finings that outstanding have been
steadily increased from 2006 to 2012.

143
TABLE NO: IV.19
SOURCES OF CAPITAL OF THIRUV ALLUVAR CO-OPERATIV SILK
SOCIETY (Rs in Lakhs)
Year Share of
members
Share from
Govt
Reserve
Fund
Total Capital
2006 16.35
(31.3)
31.68
(60.7)
4.18
(8)
52.21
2007 16.37
(31.3)
31.68
(60.7)
4.18
(8)
52.21
(0)
2008 19.40
(35.1)
31.68
(60.7)
4.18
(7.6)
55.26
(5.8)
2009 19.84
(35.6)
31.68
(60.7)
4.18
(7.5)
55.70
(0.8)
2010 20.19
(36)
31.68
(60.7)
4.18
(7.5)
56.05
(0.6)
2011 20.52
(36.4)
31.68
(60.7)
4.18
(7.4)
56.38
(0.6)
2012 20.68
(36.6)
31.68
(60.7)
4.18
(7.4)
56.54
(0.3)
verall Growth
2006 16.3 31.6 4.18 52.2
2012 20.6
(26.5)
31.6
(0)
4.18
(0)
56.5
(8.3)
Source: Secondary data (Audited report of TVSPCS )

144
50
51
52
53
54
55
56
57
2006 2007 2008 2009 2010 2011 20 12
52.21 52.21
55.2655.7 56.05 56.38 56.54
Total Capital
Total Capital
FIGURE IV.7
Table No:.IV.19 portrays the sources of capital of Thiruvalluvar Co-
operative silk society during the study period, as 31.3 percent of the capital
generated through share of members in 2006 which is increased to 36.6 percent in
2012, around 60.7 percent of the capital generated through share from Government
which was declined to 56 percent in 2012, around 8 percent of the fund generated
through reserve fund in 2006 which was declined to 7.4 percent in 2012, with
respect to overall growth performance around 16 lakh 35 thousand of fund raised
through share of members which was increased to 20 lakhs and 68 thousands in
2012 with the hike of 26.5 percent, around 31 lakh and 68 thousand raised from
share from Government and remained same in 2012 as well, nearly 4 lakhs and 18
thousands have generated through reserve fund in 2006 which also remained same
in 2012, with regard to overall capital 52 lakhs and 21 thousands have raised in 2006
which is enhanced to 56 lakhs and 54 thousands in 2012 with the hike of 8.3
percent, share of the government and reserve fund have neither increased nor
decreased during the study period but depositors portion witnessed moderate

145
escalation during the study period, the Co-operatives have got the institutionalized
support from the Government and got moderate support from own sources during
the study period.
TABLE NO: IV.20
SALES OF THIRUVALLUVAR CO-OPERATIVE SILK SOCITEY
(Rs in Lakhs)
Year Direct Sales.z Sales through Agent. Total Sales
2006 32.68
(95)
1.71
(5)
34.3
2007 40.86
(97.8)
.90
(2.2)
41.7
(21.4)
2008 36.53
(99)
.38
(1)
36.9
(-11.6)
2009 56.62
(99)
.56
(1)
57.1
(54.9)
2010 77.01
(99.7)
.21
(0.3)
77.2
(35)
2011 86.62
(99.6)
.36
(0.4)
86.9
(12.6)
2012 101.95
(99.6)
.39
(0.4)
102.3
(17.7)
Overall Growth
2006 32.6 1.71 34.3
2012 101.9
(212)
0.3
(-77.0)
102.3
(197.6)
Source: Secondary data (Audited report of TVSPCS)

146
34.341.7 36.9
57.1
77.286.9
102.3
0
20
40
60
80
100
120
2006 2007 2008 2009 2010 2011 2012
Total Sales
Total Sales
FIGURE IV.8
Table No:.IV.20 demonstrates the value of the sales of silk products
through various sources of Thiruvalluvar Co-operative silk society in study period,
with regard to direct sales around 95 percent of the value of sales obtained in 2006
which is increased 99.6 percent in 2012, with regard to sales through exhibition
none of the sales taken place under this category, with respect to sales through agent
around 5 percent of the sales made in 2006 and which was decline to 0.4 percent in
2012, in connection with the sales through Co-operative none of sales made under
this category, with regard to overall changes around 32 lakhs and 68 thousands in
2006 which is decreased to 1 crore and 9 lakhs and 5 thousands in 2012 with the
escalation of 2.2 times from 2006 of direct sales taken place during the period, they
didn’t sold anything through exhibition during the study period, 1 lakh and 71
thousands worth of silk products sold through commission agents in 2006 which
declined to 39 thousands in 2012 with the decline of 77 percent, through
Co-operative they haven’t sold anything, at the outset overall value of the silk

147
products sole were 34 lakhs and 39 thousands which is decreased to 1 crore 2 lakhs
and 34 thousand with the increase of 197.6 during the study period, it is apparent
from the empirical findings that Thiruvalluvar Co-operative silk society have made
significant increase in direct sales and major proportion obtained from this source
only and unlike other Co-operative Thiruvalluvar haven’t made any significant sales
through other mode of sales during the study period.
TABLE NO: IV.21
THIRUVALLUVAR CO-OPERATIVE PURCHASE OF RAW MATERIALS
(Rs in Lakhs)
Year Yarn Zari Chemical Total Expenditure
2006 46.9 (28.1)
119.10 (71.2)
1.27 (0.8)
167.36
2007 36.69 (19.6)
149.70 (79.9)
1.05 (0.6)
187.44 (12)
2008 49.01 (26.6)
134.40 (72.9)
1.03 (0.6)
184.45 (-1.6)
2009 31.86 (19.7)
128.99 (79.8)
.69 (0.4)
161.55 (-12.4)
2010 39.95 (24.8)
120.38 (74.7)
.88 (0.5)
161.21 (-0.1)
2011 43.88 (26)
124.08 (73.5)
.80 (0.5)
168.76 (4.7)
2012 48.71 (26.2)
136.11 (73.3)
.86 (0.5)
185.69 (10.0)
Overall Growth
2006 46.9 119.0 1.2 167.3
2012 48.7 (3.7) 136.1 (14.3) 0.8 (-32.4) 185.6 (10.9) Source: Secondary data (Audited report of TVSPCS)

148
Table No: IV.21 illustrates the value of the raw materials purchased by
Thiruvalluvar Co-operative silk society from 2006 to 2011, with regard to yarn
purchase about 28.1 percent of the total raw materials purchase incurred in 2006
and then onwards value of purchase consistently shown descending trend and in
2012 it came down to 26.2 percent with significant decline from 2006,with respect
to zari purchase nearly 71.2 percent of the total raw materials procurement
incurred in 2006 and then onwards value of purchase constantly increased and in
2011 it gone to 73.3 percent with significant appreciation from 2006,with regard to
Chemical purchase around 0.8 percent of the total raw materials spent on
chemicals purchase in 2006 and then onwards value of purchase consistently
decreased and in 2012 it had decline to 0.5 percent with substantial decline from
2006, with regard to total expenditure there has been consistent increase during the
period except consistent decline during 2012, the overall growth of the various
components witnessed firm hike, the Thiruvalluvar Co-operative silk society spent
around 46 lakh and 99 thousand in 2006 for yarn purchase which is increased to
around 48 lakhs and 71 thousand in 2012 with the escalation of 3.7 percent, in
connection with zari procurement in 2006 the Co-operative spent nearly 1 crore
and 19 lakes 9 thousands which is increased to nearly 1 core 36 lakh and 11
thousands with the hike of 14.3 percent, for chemical purchase around 1 lakh and
72 thousands on 2006 and which is decreased to 86 thousands with the decrease
of 32.4 percent at the outset total raw material purchase for Thiruvalluvar
Co-operative silk society was around 16 lakhs and 73 thousands which is increased
18 lakhs and 56 thousands in 2012 with the hike of 10.9 percent it is clear from the
empirical verification that the expenditure on raw materials purchase were steadily
increased during the study period.

149
TABLE NO: IV.22
OPERATIONAL EXPENDITURE OF THIRUVALLUVAR
CO-OPERATIVE SILK SOCIETY
(Rs in Lakhs)
Year Estab. Expenses Trade .Expenses Interest on
Borrowing
2006
11.30
(52)
12.05
(48)
25.08
2007 1.40
(53.6)
12.17
(46.4)
26.21
(4.5)
2008 1.34
(52.2)
12.26
(47.8)
25.66
(-2.1)
2009 1.80
(42.9)
23.89
(57.1)
41.85
(63.1)
2010 18.22
(35.5)
33.11
(64.5)
51.33
(22.7)
2011 18.22
(33.4)
36.27
(66.6)
54.49
(6.2)
2012 18.62
(32.9)
37.94
(67.1)
56.56
(3.8)
Overall Growth
2006 11.30 12.0 25.0
2012 18.62
(42.9)
37.9
(214.8)
56.5
(125.5)
Source: Secondary data (Audited report of TVSPCS)

150
Table No. IV.212 depicts the operational expenditure of the
Thiruvalluvar silk Co-operative silk society during the study period, with regard to
establishment expenditure around 52 percent of the expenditure made under this
category and decreased to 32.9 percent in 2012, with respect to Trade expenditure
around 48 percent of the expenditure made under this classification and increased to
67.1 percent in 2012, with regard to bonus to weavers and interest payment none of
the expenditure were made during the study period, with respect to overall growth,
around 13 lakhs and 3 thousand in 2006 which is increased to 18 lakhs and 20
thousands in 2012 with the hike of 42.9 percent of expenditure occurred on
establishment cost, around 12 lakhs and 5 thousands in 2006 which is increased to
37 lakhs 93 thousand in 2012 with the increase of 214.8 percent of expenditure
occurred on trade charges during the study period, at the outset overall value of the
operational expenditure was 25 lakhs and 8 thousand which is increased to 56
lakhs and 55 thousand with the escalation of 125.5 percent during the study
period, unlike other societies Thiruvalluvar Co-operative have not spent on interest
payment and bonus to weavers during the study period, moreover, irrespective of the
sales and profit Thiruvallur co-operatives have been allocating funds towards trade
charges and other operational expenditure so these expenditure seems inelastic so
the operational expenditure have been escalating throughout the study period.

151
TABLE NO: IV. 23
MARKETING EXPENDITURE INCURRED BY THIRUVALLUVAR
CO-OPERATIVE SILK SOCIETY
(Rs in Lakhs)
Year Commission
to consumer
Commission
to selling
agent
Salary to
sales
Person
Advertisement
Total
Expenditure
2006 120.24
(69.7)
44.19
(25.6)
1.30
(0.8)
6.9
(4) 172.6
2007 181.97
(83.3)
31.10
(14.2)
1.18
(0.5)
4.1
(1.9)
218.4
(26.5)
2008 305.34
(89)
27.96
(8.1)
1.43
(0.4)
8.4
(2.4)
343.1
(57.1)
2009 286.36
(82.5)
50.37
(14.5)
1.6
(0.5)
8.8
(2.5)
347.2
(1.2)
2010 313.22
(88.2)
33.99
(9.6)
1.8
(0.5)
6.2
(1.7)
355.2
(2.3)
2011 366.37
(88)
42.34
(10.2)
1.7
(0.4)
6.1
(1.5)
416.5
(17.2)
2012 383.59
(88.1)
44.58
(10.2)
1.6
(0.4)
5.3
(1.2)
435.2
(4.5)
Overall Growth
2006 120.2 44.1 1.30 6.8 172.5
2012 383.5
(219)
44.5
(0.9)
1.6
(29.2)
5.3
(-22.5)
435.1
(152.1)
Source: Secondary data (Audited report of TVPCS)

152
Table No: IV.23 depicts the marketing expenditure of the Thiruvalluvar
silk Co-operative silk societysdurin g the study period, with regard to commission to
consumer around aro zund 69.7 percent of the expenditure made under this category
and increased to 88.1 percent in 2012, with respect to commission to selling agent
around 25.6 percent of the expenditure made under this classification and declined to
10.2 percent in 2012, with regard to salary to sales personnel around 0.8 percent
of the expenditure made out of the total expenditure in 2006 and slightly declined in
2012 with 0.4 percent,nearly 4 percent spent towards advertisement in 2006 and
which is declined to 1.2 percent in 2012, with respect to overall growth,around 1
core 20 lakhs and 24 thousand in 2006 which is increased to 3 crores 83 lakhs and
58 thousands in 2012 with the hike of 219.2 percent of expenditure occurred on
commission to consumer during the period, around 44 lakhs and 18 thousands in
2006 which is increased to 44 lakhs and 58 thousands in 2012 with the hike of 0.9
percent of expenditure incurred on commission to selling agent during the period,
around 1 lakh 29 thousands in 2006 spent towards salary which is increased to 1
lakh 67 thousands in 2012 with the hike of 29.2 percent, around 6 lakh and 86
thousands in 2006 spent towards advertisement which is decreased to 5 lakh and 32
thousand in 2012 with the decline of 22.5 percent, at the outset overall value of the
marketing expenditure was 1 crore 72 lakhs and 59 thousands which is increased to
4 crore 35 lakhs and 16 thousand with the hike of 152.1 percent during the study
period, as the marketing expenditure is the important component of the expenditure
structure of Thiruvalluvar Co-operative silks which enables the sales promotion,
however, irrespective sales level societies bound to provide the entitled privileges to
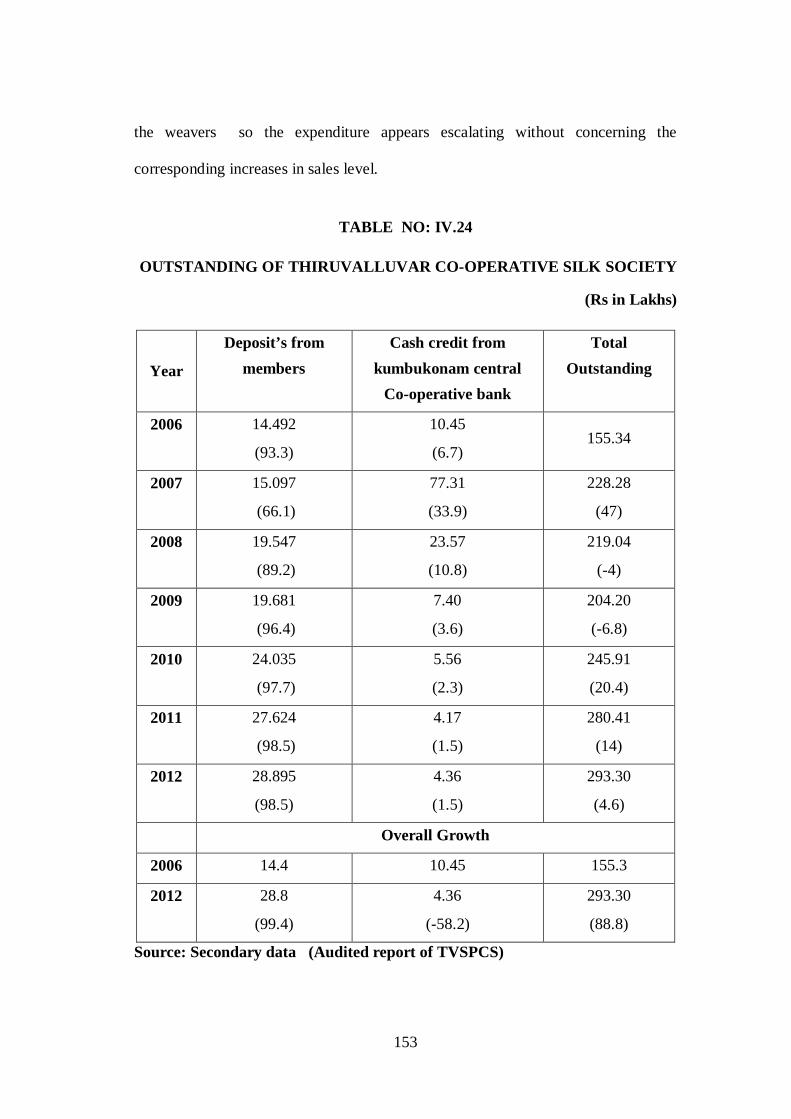
153
the weavers so the expenditure appears escalating without concerning the
corresponding increases in sales level.
TABLE NO: IV.24
OUTSTANDING OF THIRUVALLUVAR CO-OPERATIVE SILK SOCIETY
(Rs in Lakhs)
Year
Deposit’s from members
Cash credit from kumbukonam central
Co-operative bank
Total Outstanding
2006 14.492
(93.3)
10.45
(6.7) 155.34
2007 15.097
(66.1)
77.31
(33.9)
228.28
(47)
2008 19.547
(89.2)
23.57
(10.8)
219.04
(-4)
2009 19.681
(96.4)
7.40
(3.6)
204.20
(-6.8)
2010 24.035
(97.7)
5.56
(2.3)
245.91
(20.4)
2011 27.624
(98.5)
4.17
(1.5)
280.41
(14)
2012 28.895
(98.5)
4.36
(1.5)
293.30
(4.6)
Overall Growth
2006 14.4 10.45 155.3
2012 28.8
(99.4)
4.36
(-58.2)
293.30
(88.8)
Source: Secondary data (Audited report of TVSPCS)

154
Table No:. IV.24 depicts the outstanding of loans of the Thiruvalluvar
Co-operative silk society during the study period as the outstanding of loans would
reaveled the finacial distress of the organziation, 93.3 percent of the outstanding
loans owe to members of Co-operativeertaivesoceity in 2006 which is increased to
98.5 percent in 2012, nearly 6.7 percent of outstanding loans owe to Kumbakonam
central Co-operative bank in 2006 which is declined to 1.5 percent in 2012, with
reagrd to overall growth nearly 1crore 44 lakhs and 92 thousands fund owe to
depositers in 2006 and which increased to 2 crore 88 lakhs and 94 thousands in 2012
with the increase of 99.4 percent,with regard to outstanding owe to Kumbakonam
central Co-operative bank nearly 10 lakhs and 41 thousand have registered which is
declined to 4 lakhs and 35 thousand in 2012 with 57.1 percent decline, at the outset
total outstanding was 1 crore and 55 lakhs and 34 thousands which was increased to
2 crores 93 lakhs and 30 thousands in 2012 with the increase of 88.8 percent during
the study period.It is aparent from the empirical finings that outstanding have been
steadily increased from 2006 to 2012.

155
TABLE NO : IV.25
SOURCES OF CAPITAL OF KALAIVANAR CO-OPERATIVE SILK
SOCIETY
(Rs in Lakhs)
Share of members Share from Govt.
Reserve Fund Total Capital
2006 5.46
(67.6)
0.37
(4.6)
2.25
(27.8)
8.08
2007 5.13
(66.2)
0.37
(4.8)
2.25
(29.0)
7.75
(-4.1)
2008 3.56
(57.6)
0.37
(6.0)
2.25
(36.4)
6.18
(-20.3)
2009 3.64
(58.1)
0.37
(5.9)
2.25
(35.9)
6.26
(1.3)
2010 4.12
(61.1)
0.37
(5.5)
2.25
(33.4)
6.74
(7.7)
2011 4.46
(63.0)
0.37
(5.2)
2.25
(31.8)
7.08
(5.0)
2012 44.78
(64.6)
0.37
(5.0)
2.25
(30.4)
7.40
(4.5)
Overall Growth
2006 5.4 0.37 2.25 8.08
2012 4.7
(-12.4)
0.37
(0)
2.25
(0)
7.40
(-8.4)
Source: Secondary data (Audited report of KSPCS)

156
0123456789
2006 2007 2008 2009 2010 2011 2012
8.08 7.75
6.18 6.266.74 7.08 7.4
Total Capital
Total Capital
FIGURE IV.9
Table No: IV.25 Portrays the sources of capital of Kalaivanar Co-
operative silk society during the study period, as 67.6 percent of the capital
generated through share of members in 2006 which is decreased to 64.6 percent in
2012, around 4.6 percent of the capital generated through share from Government
which was increased to 5 percent in 2012, around 27.8 percent of the fund generated
through reserve fund in 2006 which was increased to 30.4 percent in 2012, with
respect to overall growth performance around 5 lakh 46 thousand of fund raised
through share of members which was decreased to 4 lakhs and 78 thousands in 2012
with the decline of 12.4 percent, around 37 thousand raised from share from
Government and remained same in 2012 as well, nearly 2 lakhs and 25 thousands
have generated through reserve fund in 2006 which also remained same in 2012,
with regard to overall capital 8 lakhs and 8 thousands have raised in 2006 which is
declined to 7 lakhs and 40 thousands in 2012 with the decline of 8.3 percent, share
of the government and reserve fund have neither increased nor decreased during the
study period but depositors portion witnessed moderate escalation during the study
period, the Co-operatives have got the institutionalized support from the
Government and got moderate support from own sources during the study period.

157
TABLE NO: IV.26
SALES OF KALAIVANAR CO-OPERATIVE SILK SOCIETY
(Rs. in Lakhs)
Year Direct Sales Sales
through
Exhibition
Sales
through
Agent
Sales through
Co-operative
Total Sales
2006 0.64
(10.0)
0.43
(6.7)
5.34
(83.3) _ 6.41
2007 0.86
(18.1)
0.26
(5.5)
3.65
(76.4) _
4.78
(25.4)
2008 1.02
(16.3)
0.32
(5.1)
4.19
(67)
0.73
(11.6)
5.23
(30.9)
2009 1.08
(18.8)
0.03
(0.6)
3.77
(65.5)
0.87
(15.2)
5.76
(-7.8)
2010 1.01
(22.6)
0.06
(1.5)
2.69
(60.1)
0.71
(15.8)
4.47
(-22.5)
2011 1.06
(18.0)
0.18
(3.1)
3.20
(54.4)
1.44
(24.5)
5.89
(31.8)
2012 1.15
(18.4)
0.20
(3.1)
3.47
(54.4)
12.17
(24.5)
6.39
(8.5)
Overall Growth
2006 0.64 0.43 5.3 0.73 6.4
2012 1.15
(79.4)
0.20
(-53.4) 3.4 (-34.9) 12.7 (115.5)
6.3
(-0.2)
Source: Secondary data (Audited report of KSPCS)

158
FIGURE IV.10
6.4
4.85.2
5.8
4.5
5.96.4
0.0
1.0
2.0
3.0
4.0
5.0
6.0
7.0
2006 2007 2008 2009 2010 2011 2012
Total Sales
Total Sales
Table No: IV.26 demonstrates the value of the sales of silk products
through various source of kalaivanar Co-operative silk society in study period, with
regard to direct sales around 10 percent of the value of sales obtained in 2006 which
is increased 18 percent in 2012, with regard to sales through exhibition 6.7 percent
in 2006 and declined to 3.1 percent in 2012, with respect to sales through agent
around 83.3 percent of the sales made in 2006 and which was decline to 54.4
percent in 2012, in connection with the sales through Co-operative none of sales
made under this category in 2006 and increase to 24.5,with regard to overall changes
around 63 thousands in 2006 which is increased to 1 lakh and 14 thousands in 2012
with the decrease of 79.4 percent from 2006 of direct sales taken place during the
period, they sold 42 thousands through exhibition in 2006 which was declined 19
thousands during the study period, 5 lakh and 37 thousands worth of silk products
sold through commission agents in 2006 which declined to 3 lakhs 47 thousands in
2012 with the decline of 34.9 percent, through Co-operative the Co-operative made

159
72 thousands in 2008 and increased to 1 lakh and 56 thousands in 2012, at the
outset overall value of the silk products sole were 6 lakhs and 40 thousands which is
decreased to 6 lakhs and 38 thousand with the decrease of 0.2 during the study
period, it is apparent from the empirical findings that Kalaivanar Co-operative silk
society have made significant increase in direct sales and decline in sales through
exhibition, sales through agent and increase in Co-operative, at the outset meager
proportion of the increase taken place during the study period.
TABLE NO. IV.27
KALAIVANAR CO-OPERATIVE PURCHASE OF RAW MATERIALS
(Rs in Lakhs)
Year Yarn Zari Chemical Total Expenditure
2006 0.22 (89.7)
0.02 (9.8)
0.00120 (0.5)
0.24
2007 0.88 (85.5)
0.14 (13.9)
656 (0.6)
1.03 (323.1)
2008 1.51 (84.3)
0.27 (14.9)
1345 (0.7)
1.79 (73.6)
2009 2.11 (88.4)
0.26 (14.9)
1390 (0.6)
2.39 (33.0)
2010 2.23 (86.5)
0.32 (12.7)
1865 (0.7)
2.58 (7.9)
2011 2.32 (86.4)
0.34 (12.9)
1824 (0.7)
2.68 (4.1)
2012 2.52 (86.2)
0.37 (13.0)
2053 (0.7)
2.92 (8.8)
Overall Growth 2006 0.21 0.024 0.0012 0.24 2012 2.5
(1049.0) 0.34
(1343.3) 0.018
(1420.2) 2.6
(997.2) Source: Secondary data (Audited Report of KSPCS)

160
Table No: IV..27 elucidates the value of the raw materials purchased by
Kalaivanar Co-operative silk materials purchase incurred in 2006 and then onwards
value of purchase consistently shown downward trend and in 2012 it came down to
86.2 percent with significant decline from 2006,with respect to zari purchase nearly
9.8 percent of the total raw materials procurement incurred in 2006 and then
onwards value of purchase constantly increased and in 2011 it gone to 13 percent
with significant increase from 2006,with regard to Chemical purchase around 0.5
percent of the total raw materials spent on chemicals purchase in 2006 and then
onwards value of purchase consistently increased and in 2012 it had increased to
0.7 percent with substantial hike from 2006, with regard to total expenditure there
has been consistent increase during the period except consistent decline during 2012,
the overall growth of the various components witnessed firm hike, the kalaivanar
Co-operative silk society spent around 21 thousand in 2006 for yarn purchase
which is increased to around 2 lakhs and 51 thousand in 2012 with the escalation of
1049 percent, in connection with zari procurement in 2006 the Co-operative spent
nearly 2 thousands which is increased to nearly 34 thousands with the hike of
1343.3 percent, for chemical purchase around 1hundred and twenty on 2006 and
which is increased to 1.8 thousand with the increase of 1420 percent at the outset
total raw material purchase for Kalaivanar Co-operative silk society was period.

161
TABLE NO: IV.28
OPERATIONAL EXPENDITURE OF KALAIVAN CO-OPERATIVE SILK
SOCIETY
(Rs in Lakhs)
Year Estab.
Expenses
Trade
Expenses
Bonus to
Weavers
Interest
on
Borrowing
Total
Expenditure
2006 1.88
(20.6)
1.09
(11.9)
6.15
(67.5)
6.15
(67.5)
9.12
2007 1.73
(15.2)
1.56(13.7) 8.09
(71.1)
8.09
(71.1)
11.39
(2.49)
2008 181
(15.2)
1.61(13.5) 8.53
(71.3)
8.53
(71.3)
11.96
(5)
2009 1.76
(15.3)
1.51(13.1) 8.23
(71.5)
8.23
(71.5)
11.51
(-3.8)
2010 1.82
(15.7)
2.38(20.5) 5.03
(57.2)
5.03
(63.9)
11.62
(1)
2011 1.76
(20.0)
2.01
(22.8)
4.82
(58.0)
4.82
(57.2)
8.81
(-24.9)
2012 165
(19.8)
1.84
(22.1)
_ 4.82
(58.0)
8.31
(-5.6)
Overall Growth
2006 1.88 1.09 _ 6.15 9.1
2012 1.64
(-12.4)
1.84
(69.2)
_ 4.8
(-21.6)
8.3
(-8.9)
Source: Secondary data (Audited report of KSPCS)

162
Table No: IV.28 depicts the operational expenditure of the Kalaivanar
silk Co-operative silk societys during the study period,with regard to establishment
expenditure around 20.6 percent of the expenditure made under this category and
decreased to 19.8 percent in 2012, with respect to Trade expenditure around 11.9
percent of the expenditure made under this classification and increased to 22.1
percent in 2012, with regard to bonus to weavers nothing have beeen spent by the
Co-operatives during the study period, with respect to interest payment none 67.5
percent spent in 2006 which get declined to 58 percent in 2012, with respect to
overall growth,around 1 lakh and 88 thousand in 2006 which is decreased to 1 lakh
and 64 thousand in 2012 with the decline of 12.4 percent of expenditure occurred
on establishment cost, around 1 lakh and 8 thousands in 2006 which is increased to
1 lakh 83 thousand in 2012 with the increase of 69.2 percent of expenditure
occurred on trade charges during the study period, with regard to interest for
payment 6 lakhs and 15 thousands spent in 2006 and which is increased to 4 lakhs
and 82 thousands, at the outset overall value of the operational expenditure was 9
lakhs and 11 thousand which is decreased to 8 lakhs and 30 thousand with the
decrease of 8.9 percent during the study period, as the Co-operatives bound to
make some payments irrespective of the sales level, thus, the operational
expenditure tend to hike persistently during the study period.

163
TABLE NO: IV.29
MARKETING EXPENDITURE INCURRED BY KALAIVANAR
CO-OPERATIVE SILK SOCIETY
(Rs in Lakhs)
Year Commission
to consumer
Commission
to selling
agent
Salary
to sales
Person
Advertisement Total
Expenditure
2006 1.21
(51.7)
0.10
(4.3)
1
(42.7)
0.03
(1.3) 2.3
2007 7.64
(85.4)
0.30
(3.4) 1(11.2)
0.01
(0.1)
9.0
(282.5)
2008 1.93
(59.8)
0.30
(9.3) 1(31.0) _
3.2
(-63.9)
2009 3.15
(71.1)
0.28
(6.3)
1
(22.6) _
4.4
(37.2)
2010 3.43
(72.8)
0.27
(5.7)
100
(21.2)
0.01
(0.2)
4.7
(6.3)
2011 3.13
(71.8)
0.22
(5.0)
1
(22.9)
0.01
(0.2)
4.4
(-7.4)
2012 2.89
(70.6)
0.20
(4.8)
1
(24.4)
0.01
(0.2)
4.1
(-6)
Overall Growth
2006 1.21 0.1 1 0.03 2..3
2012 2.8
(139)
0.20
(96.5)
1
(0)
0.01
(-68.3)
4.0
(75.1)
Source: Secondary data (Audited report of KSPCS)

164
Table No: IV.29 depicts the marketing expenditure of the Kalaivanar silk
Co-operative silk societysdurin g the study period,with regard to commision to
consumer around around 51.7 percent of the expenditure made under this category
and increased to 70.6 percent in 2012, with respect to commision to to selling agent
around 4.3 percent of the expenditure made under this classification and increased
to 4.8 percent in 2012, with regard to salaray to sales personnel around 42.7
percent of the expenditure made out of the total expenditure in 2006 and declined
in 2012 with 24.4 percent,nearly 1.3 percent spent towards advertisement in 2006
and which is declined to 0.2 percent in 2012, with respect to overall growth,around
1 lakh and 21 thousand in 2006 which is increased to 2 lakhs and 89 thousands in
2012 with the hike of 139 percent of expenditure occurred on commission to
consumer during the period, around 10 thousands in 2006 which is increased to 19
thousands in 2012 with the hike of 96.5 percent of expenditure incurred on
commission to selling agent during the period, around 1 lakh rupees in 2006 spent
towards salary which is remained same in 2012 as well, around 3 thousands in 2006
spent towards advertisement which is decreased to 950 in 2012 with the decline of
68.3 percent, at the outset overall value of the marketing expenditure was 2 lakhs
and 34 thousands which is increased to 4 lakhs and 9 thousand with the hike of
75.1 percent during the study period, as the marketing expenditure is the important
component of the expenditure structure of Kalaivanar Co-operative silks which
enables the sales promotion, however, irrespective sales level societies bound to
provide the entitled privileges to the weavers so the expenditure appears escalating
without concerning the corresponding increases in sales level.

165
TABLE NO: IV. 30
OUTSTANDING LOANS OF KALAIVANAR CO-OPERATIVE
SILK SOCIETY
(Rs in Lakhs)
Year Deposit’s from members
Cash credit from kumbukonam central Co-operative bank
Total Outstanding
2006 72.46
(95.7)
3.26
(4.3)
75.72
2007 71.51
(76.4)
22.09
(23.6)
93.60
(23.6)
2008 93.48
(89.7)
10.76
(10.3)
104.25
(11.4)
2009 93.93
(96.2)
3.70
(3.8)
97.65
(-6.3)
2010 78.58
(96.8)
2.63
(3.2)
81.21
(-16.8)
2011 80.90
(98.6)
1.19
(1.4)
82.09
(1.1)
2012 83.81
(98.6)
1.22
(1.4)
85.03
(3.6)
Overall growth
2006 72.4 3.2 75.7
2012 83.8
(15.7)
1.2
(-62.7)
85.02
(12.3) Source: Secondary data ( Audited report of KSPCS)
Table No: IV.30 depicts the outstanding of loans of the Kalaivanar Co-
operative silk society during the study period as the outstanding of loans would
revealed the financial distress of the organziation, 95.7 percent of the outstanding
loans owe to members of Co-operativeertaive soceity in 2006 which is increased to

166
98.6 percent in 2012, nearly 4.3 percent of outstanding loans owe to Kumbakonam
central Co-operative bank in 2006 which is declined to 1.4 percent in 2012, with
regard to overall growth nearly 72 lakhs and 46 thousands fund owe to depositors
in 2006 and which increased to 83 lakhs and 81 thousands in 2012 with the increase
of 15.7 percent, with regard to outstanding owe to Kumbakonam central Co-
operative bank nearly 3 lakhs and 25 thousand have registered which is declined to
1 lakhs and 21 thousand in 2012 with 62.7 percent decline, at the outset total
outstanding was 75 lakhs and 71 thousands which was increased to 85 lakhs and 2
thousands in 2012 with the increase of 12.3 percent during the study period.It is
clear that outstanding have been fluctauting and reapyment of debt from central Co-
operative bank decelerate the burden of debt of the Kalaivanar Co-operative silk
society during the study period.
TABLE NO: NO: IV.31
SOURCES OF CAPITAL OF SUPER SILK CO-OPERATIVE
SILK SOCIETY
(Rs in Lakhs)
Year Share of members Share from Govt Total Capital 2006 2.34
(79.6) 0.60
(20.4) 2.9
(100) 2007 2.34
(79.6) 0.60
(20.4) 2.9
(100) 2008 2.34
(79.6) 0.60
(20.4) 2.9
(100) 2009 2.34
(79.6) 0.60
(20.4) 2.9
(100) 2010 2.34
(79.6) 0.60
(20.4) 2.9
(100) 2011 2.34
(79.6) 0.60
(20.4) 2.9
(100) 2012 2.34
(79.6) 0.60
(20.4) 2.9
(100) Source: Secondary data (Audited report of KSPCS)

167
0
0.5
1
1.5
2
2.5
3
2006 2007 2008 2009 2010 2011 2012
2.9 2.9 2.9 2.9 2.9 2.9 2.9
Total Capital
Total Capital
FIGURE IV.11
Table No: IV.31 Portrays the sources of capital of Super Co-operative
silk society during the study period, as 79.6 percent of the capital generated through
share of members in 2006 which remained constant in 2012, around 20.4 percent of
the capital generated through share from Government which was remained same in
2012, none of the contribution acquired from reserve fund, with respect to overall
growth performance around 2 lakh 34 thousand of fund raised through share of
members which remain constant in 2012, around 60 thousand raised from share
from Government and remained same in 2012 as well, with regard to overall capital
2 lakhs and 94 thousands in 2006 as well as in 2012 share of the government and
depositors fund have neither increased nor decreased during the study period.

168
TABLE NO: IV. 32
SALES OF SUPER CO-OPERATIVE SILK SOCIETY
(RS in Lakhs)
Year Direct Sales Sales
through
Exhibition
Sales
through
agent
Co-
operative
Total
2006 0.79
(10.6)
0.05
(0.7)
6.59
(88.7)
_ 7.43
2007 1.20
(18.1)
0.36
(5.4)
5.07
(76.5)
_ 6.63
(-10.8)
2008 1.26
(16.6)
0.44
(5.8)
4.90
(64.4)
1.01
(13.3)
7.61
(14.8)
2009 1.28
(16.0)
0.04
(0.5)
5.59
(70.0)
1.08
(13.5)
7.99(5)
2010 1.32
(21.0)
0.12
(1.9)
3.73
(59.3)
1.12
(17.8)
6.29
(21.3)
2011 1.47
(15.5)
0.24
(2.5)
4.56
(48.1)
3.21
(33.9)
9.48
(50.7)
2012 1.65
(15.4)
0.26
(2.4)
5.33
(49.5)
3.52
(32.7)
10.76
(13.5)
Overall Growth
2006 0.79 0.05 6.59 _ 7.4
2012 1.65
(109.1)
0.26
(425.1)
5.3
(-19.2)
_ 10.7
(44.8)
Source: Secondary data (Audited report of KSPCS)
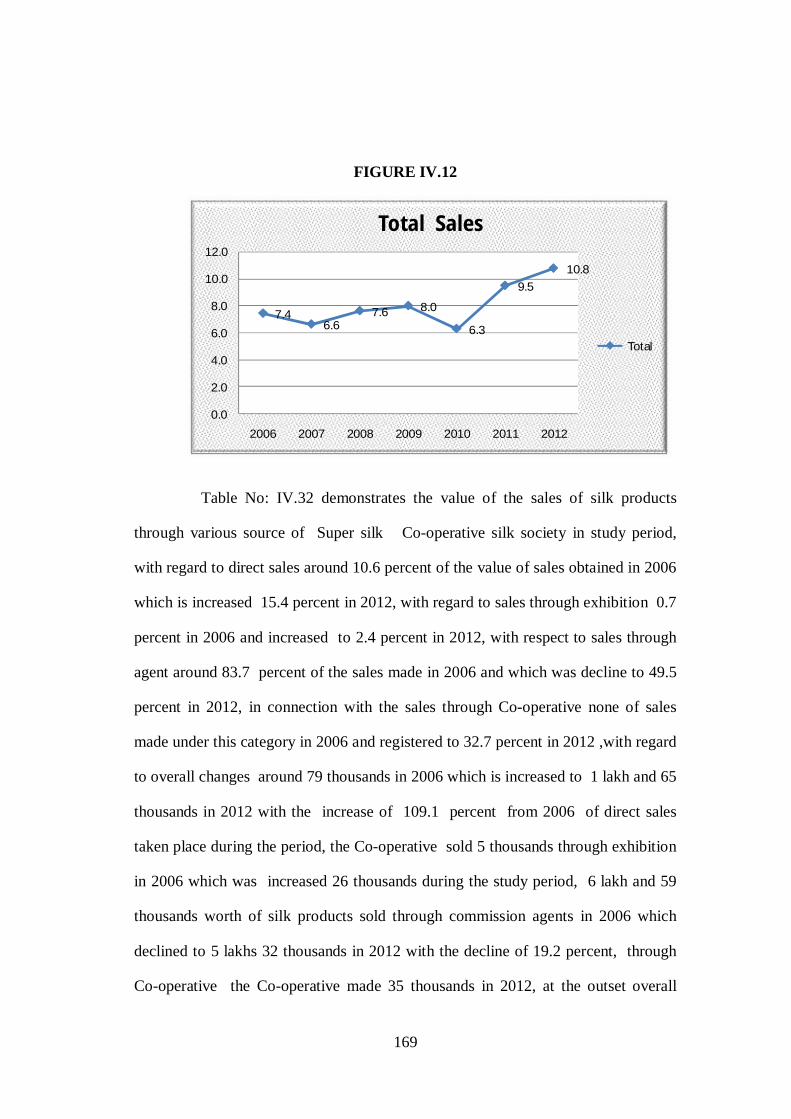
169
7.46.6
7.6 8.0
6.3
9.510.8
0.0
2.0
4.0
6.0
8.0
10.0
12.0
2006 2007 2008 2009 2010 2011 2012
Total Sales
Total
FIGURE IV.12
Table No: IV.32 demonstrates the value of the sales of silk products
through various source of Super silk Co-operative silk society in study period,
with regard to direct sales around 10.6 percent of the value of sales obtained in 2006
which is increased 15.4 percent in 2012, with regard to sales through exhibition 0.7
percent in 2006 and increased to 2.4 percent in 2012, with respect to sales through
agent around 83.7 percent of the sales made in 2006 and which was decline to 49.5
percent in 2012, in connection with the sales through Co-operative none of sales
made under this category in 2006 and registered to 32.7 percent in 2012 ,with regard
to overall changes around 79 thousands in 2006 which is increased to 1 lakh and 65
thousands in 2012 with the increase of 109.1 percent from 2006 of direct sales
taken place during the period, the Co-operative sold 5 thousands through exhibition
in 2006 which was increased 26 thousands during the study period, 6 lakh and 59
thousands worth of silk products sold through commission agents in 2006 which
declined to 5 lakhs 32 thousands in 2012 with the decline of 19.2 percent, through
Co-operative the Co-operative made 35 thousands in 2012, at the outset overall

170
value of the silk products sole were 7 lakhs and 43 thousands which is increased to
10 lakhs and 76 thousand with the increase of 44.8 during the study period, it is
apparent from the empirical findings that Super Co-operative silk society have
made significant increase in direct sales and decline in sales through exhibition,
sales through agent and increase in Co-operative, at the outset meager proportion of
the increase taken place during the study period.
TABLE NO: IV.33
SUPER SILKS CO-OPERATIVE PURCHASE OF RAW MATERIALS
(Rs in Lakhs)
Year Yarn Zari Chemical Total Expenditure
2006 1.30 (78)
0.33 (19.8)
0.04 (2.2)
1.67
2007 1.32 (79.9)
0.30 (18.2)
0.03 (1.9)
1.65 (-0.8)
2008 0.80 (77.7)
0.21 (20.4)
0.02 (1.9)
1.03 (-37.7)
2009 1.46 (81.3)
0.30 (16.7)
0.04 (2.0)
1.80 (74.4)
2010 1.82 (81.8)
0.36 (16.2)
0.05 (2.0)
2.23 (23.9)
2011 1.64 (82.1)
0.32 (16.0)
0.04 (1.9)
1.99 (-10.2)
2012 1.43 (80.9)
0.31 (17.5)
0.03 (1.6)
1.76 (-11.7)
Overall Growth
2006 1.30 0.33 0.40 1.67
2012 1.43 (9.8)
0.30 (-6.7)
0.03 (-20.5)
1.76 (5.8)
Source: Secondary data (Audited report of KSPCS)

171
Table No: IV.33 express the value of the raw materials purchased by
Super Co-operative silk society from 2006 to 2011, with regard to yarn purchase
about 78 percent of the total raw materials purchase incurred in 2006 and then
onwards value of purchase consistently shown upward trend and in 2012 it gone
upto 80.9 percent with significant increase from 2006,with respect to zari
purchase nearly 19.8 percent of the total raw materials procurement incurred in
2006 and then onwards value of purchase constantly fluctuated and in 2011 it
decline to 17.5 percent with significant decrease from 2006,with regard to
Chemical purchase around 2.2 percent of the total raw materials spent on
chemicals purchase in 2006 and then onwards value of purchase consistently
decreased and in 2012 it had decreased to 1.6 percent with substantial decline
from 2006, the overall growth of the various components witnessed consistent
fluctuation, the Super Co-operative silk society spent around 1 lakh and 30
thousand in 2006 for yarn purchase which is increased to around 1 lakh and 42
thousand in 2012 with the escalation of 9.8 percent, in connection with zari
procurement in 2006 the Co-operative spent nearly 33 thousands which is
decreased to nearly 30 thousands with the decline of 6.7 percent, for chemical
purchase around 3 thousand in 2006 and which is decreased to 2 thousand with the
decrease of 20.5 percent at the outset total raw material purchase for Super Co-
operative silk society was around 1 lakh and 66 thousand which is increased 1lakh
and 76 thousands in 2012 with the hike of 5.8 percent it is clear from the
empirical verification that the expenditure on raw materials purchase were steadily
increased during the study period.

172
TABLE NO: IV.34
OPERATIONAL EXPENDITURE OF SUPER CO-OPERATIVE SILK
SOCIETY
(Rs in Lakhs)
Year
Estab. Expense
Trade
Expenses
Intough on
Borrowing
Total
Expenditure
2006 2.65
(15.7)
2.01
(11.9)
12.25
(72.4) 16.9
2007 2.35
(18.7)
1.43
(11.4)
8.79
(69.9)
12.6
(-25.7)
2008 2.22
(14.4)
2.08
(13.5)
11.09
(72.1)
15.4
(22.4)
2009 2.11
(13.1)
2.41
(15)
11.53
(71.8)
16.1
(43)
2010 2.32
(14.3)
2.16
(13.3)
11.76
(72.4)
16.2
(1.2)
2011 2.46
(14.9)
3.17
(19.2)
10.92
(66)
16.6
(1.9)
2012 2.17
(13.4)
2.12
(12.5)
11.44
(67.8)
15.2
(1.1)
2006 2.6 2.01 12.2 16.9
2012 2.1
(-5.5)
2.12
(5.5)
11.4
(-6.6)
15.2
(-10.1)
Source: Secondary data (Audited report of KSPCS)

173
Table No: IV.34 depicts the operational expenditure of the Super silk
Co-operative silk society during the study period ,with regard to establishment
expenditure around 15.7 percent of the expenditure made under this category and
decreased to 13.4 percent in 2012, with respect to Trade expenditure around 11.9
percent of the expenditure made under this classification and increased to 12.5
percent in 2012, with regard to bonus to weavers nothing have beeen spent by the
Co-operatives during the study period, with respect to interest payment around 72.4
percent spent in 2006 which get declined to 67.8 percent in 2012, with respect to
overall growth,around 2 lakhs and 65 thousand in 2006 which is decreased to 2
lakhs and 17 thousand in 2012 with the decline of 18 percent of expenditure
occurred on establishment cost, around 2 lakhs and a thousand in 2006 which is
increased to 2 lakhs 12 thousand in 2012 with the increase of 5.5 percent of
expenditure occurred on trade charges during the study period, with regard to
interest for payment 12 lakhs and 25 thousands spent in 2006 and which is decreased
to 11 lakhs and 44 thousands, at the outset overall value of the operational
expenditure was 16 lakhs and 91 thousand which is decreased to 15 lakhs and 21
thousand with the decrease of 10.01 percent during the study period, as the Co-
operatives bound to make some payments irrespective of the sales level, thus, the
operational expenditure tend to hike persistently during the study period.

174
TABLE NO : IV.35
MARKETING EXPENDITURE INCURRED BY SUPER
CO-OPERATIVE SILK SOCIETY
(Rs in Lakhs)
Year Commission
to consumer
Commission to
selling agent
Salary to
sales
Person
Advertisement Total
Expenditure
2006 1.08
(52.7)
0.08
(3.9)
0.87
(42.1)
0.03
(1.263) 2.1
2007 6.49
(84.9)
0.22
(3.0)
0.92
(0.12)
0.01
(0.094)
7.6
(270.2)
2008 1.73
(59.4)
0.24
(8.4)
0.94
(32.2) _
2.9
(-61.8)
2009 2.39
(67.4)
0.22
(6.4)
0.93
(26.2) _
3.6
(21.5)
2010 2.77
(71.5)
0.21
(5.4)
0.89
(22.9)
0.01
(0.242)
3.9
(9.5)
2011 2.66
(69.5)
0.19
(5.2)
0.96
(25.1)
0.01
(0.248)
3.8
(-1.6)
2012 2.49
(67.8)
0.19
(5.3) 0.87
0.01
(0.3)
3.7
(-3.9)
Overall Growth
2006 1.08 0.081 87000 0.03 2.1
2012 2.4
(128.9)
0.19
(140)
87000
(0)
0.01
(-64.9)
3.6
(78.0)
Source: Secondary data (Audited report of KSPCS)

175
Table No: IV.35 depicts the marketing expenditure of the Super silk Co-
operative silk society during the study period,with regard to commision to consumer
around around 52.7 percent of the expenditure made under this category and
increased to 67.8 percent in 2012, with respect to commision to to selling agent
around 3.9 percent of the expenditure made under this classification and increased
to 5.3 percent in 2012, with regard to salaray to sales personnel around 42.1
percent of the expenditure made out of the total expenditure in 2006 and declined
in 2012 with 26.7 percent, nearly 1.3 percent spent towards advertisement in 2006
and which is declined to 0.3 percent in 2012, with respect to overall growth,around
1 lakh and 08 thousand in 2006 which is increased to 2 lakhs and 49 thousands in
2012 with the hike of 128.9 percent of expenditure occurred on commission to
consumer during the period, around 8 thousands in 2006 which is increased to 19
thousands in 2012 with the hike of 140 percent of expenditure incurred on
commission to selling agent during the period, around 1 lakh rupees in 2006 spent
towards salary which is remained same in 2012 as well, around 2.6 thousands in
2006 spent towards advertisement which is decreased to 924 in 2012 with the
decline of 64.6 percent, at the outset overall value of the marketing expenditure
was 2 lakhs and 6 thousands which is increased to 3 lakhs and 67 thousand with the
hike of 78 percent during the study period, as the marketing expenditure is the
important component of the expenditure structure of Super Co-operative silks which
enables the sales promotion, however, irrespective sales level societies bound to
provide the entitled privileges to the weavers so the expenditure appears escalating
without concerning the corresponding increases in sales level.
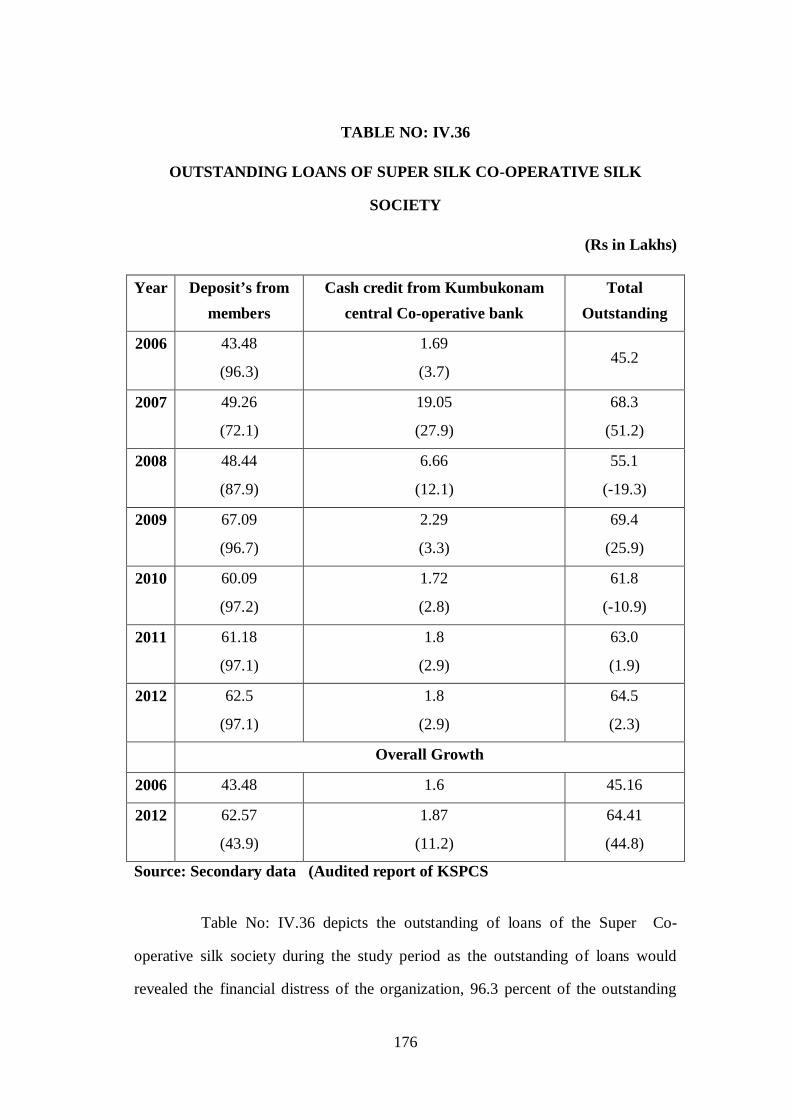
176
TABLE NO: IV.36
OUTSTANDING LOANS OF SUPER SILK CO-OPERATIVE SILK
SOCIETY
(Rs in Lakhs)
Year Deposit’s from members
Cash credit from Kumbukonam central Co-operative bank
Total Outstanding
2006 43.48
(96.3)
1.69
(3.7) 45.2
2007 49.26
(72.1)
19.05
(27.9)
68.3
(51.2)
2008 48.44
(87.9)
6.66
(12.1)
55.1
(-19.3)
2009 67.09
(96.7)
2.29
(3.3)
69.4
(25.9)
2010 60.09
(97.2)
1.72
(2.8)
61.8
(-10.9)
2011 61.18
(97.1)
1.8
(2.9)
63.0
(1.9)
2012 62.5
(97.1)
1.8
(2.9)
64.5
(2.3)
Overall Growth
2006 43.48 1.6 45.16
2012 62.57
(43.9)
1.87
(11.2)
64.41
(44.8)
Source: Secondary data (Audited report of KSPCS
Table No: IV.36 depicts the outstanding of loans of the Super Co-
operative silk society during the study period as the outstanding of loans would
revealed the financial distress of the organization, 96.3 percent of the outstanding

177
loans owe to members of Co-operative society in 2006 which is increased to 97.1
percent in 2012, nearly 3.7 percent of outstanding loans owe to Kumbakonam
central Co-operative bank in 2006 which is declined to 2.9 percent in 2012, with
regard to overall growth nearly 43 lakhs and 47 thousands fund owe to depositors
in 2006 and which increased to 1 lakh and 69 thousands in 2012 with the increase of
10.9 percent, with regard to outstanding owe to Kumbakonam central Co-operative
bank nearly 1 lakh and 69 thousand have registered which is increased to 1 lakh and
87 thousand in 2012 with 10.9 percent increase, at the outset total outstanding was
45 lakhs and 16 thousands which was increased to 64 Lakhs and 45 thousands in
2012 with the increase of 42.7 percent during the study periodIt is clear that
outstanding have been consistently escalating during the study period.
TABLE NO: IV.37
SOURCES OF CAPITAL OF KAMARAJAR CO-OPERATIVE
SILK SOCIETY
(Rs in Lakhs)
Year Share of members Share from Govt Total Capital
2006 2.45
(75.4) 0.8
(24.6) 3.25 (100)
2007 2.45
(75.4) 0.8
(24.6) 3.25 (100)
2008 2.45
(75.4) 0.8
(24.6) 3.25 (100)
2009 2.45
(75.4) 0.8
(24.6) 3.25 (100)
2010 2.45
(75.4) 0.8
(24.6) 3.25 (100)
2011 2.45
(75.4) 0.8
(24.6) 3.25 (100)
2012 2.45
(75.4) 0.8
(24.6) 3.25 (100)
Source: Secondary data (Audited report of KSPCS)

178
FIGURE IV.13
0
0.5
1
1.5
2
2.5
3
3.5
2006 2007 2008 2009 2010 2011 2012
3.25 3.25 3.25 3.25 3.25 3.25 3.25
Total Capital
Total Capital
Table No:IV.37 describes the sources of capital of Kamarajar Co-
operative silk society during the study period, as 75.4 percent of the capital
generated through share of members in 2006 which remained constant in 2012,
around 24.6 percent of the capital generated through share from Government which
was remained same in 2012, none of the contribution acquired from reserve fund,
with respect to overall growth performance around 2 lakh 45 thousand of fund
raised through share of members which remain constant in 2012, around 80
thousand raised from share from Government and remained same in 2012 as well,
with regard to overall capital 3 lakhs and 25 thousands in 2006 as well as in 2012
share of the government and depositors have neither increased nor decreased during
the study period.

179
TABLE NO: IV.38
SALES OF KAMARAJAR CO-OPERATIVE SILK SOCIETY
(Rs in Lakhs)
year Direct
Sales
Sales through
Exhibition
Sales
through
Agent
Sales through
Co-operative
Total
Sales
2006 0.71
(10.6)
0.05
(0.7)
5.9
(88.7) - 6.7
2007 1.1
(18.1)
0.32
(5.4)
4.6
(76.5) -
6.0
(-10.8)
2008 1.1
(16.6)
0.40
(5.8)
4.4
(64.4)
0.90
(13.3)
6.8
(14.8)
2009 1.2
(16)
0.04
(0.5)
5.0
(70)
0.97
(13.5)
7.2
(5)
2010 1.2
(21)
0.11
(1.9)
3.4
(59.3)
1.0
(17.8)
5.7
(-21.3)
2011 1.3
(15.5)
0.22
(2.5)
4.1
(48.1)
2.88
(33.9)
8.5
(50.7)
2012 1.6
(16.4)
0.25
(2.5)
4.7
(47.5)
3.35
(33.7)
10.0
(17.01)
Overall Growth
2006 0.7 0.045 5.93 - 6.6
2012 1.6
(130.4)
0.24
(446.2)
4.74
(-20.08)
- 9.98(49.3)
Source: Secondary data (Audited report of KSPCS)
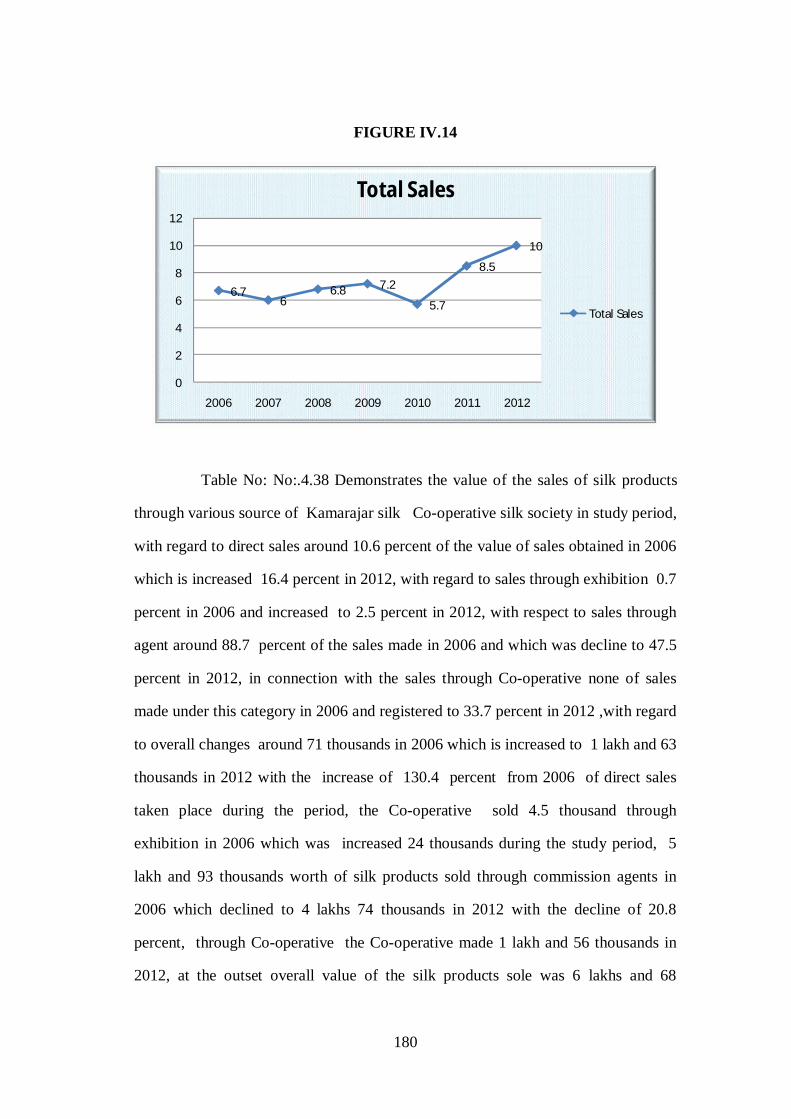
180
6.76
6.8 7.2
5.7
8.5
10
0
2
4
6
8
10
12
2006 2007 2008 2009 2010 2011 2012
Total Sales
Total Sales
FIGURE IV.14
Table No: No:.4.38 Demonstrates the value of the sales of silk products
through various source of Kamarajar silk Co-operative silk society in study period,
with regard to direct sales around 10.6 percent of the value of sales obtained in 2006
which is increased 16.4 percent in 2012, with regard to sales through exhibition 0.7
percent in 2006 and increased to 2.5 percent in 2012, with respect to sales through
agent around 88.7 percent of the sales made in 2006 and which was decline to 47.5
percent in 2012, in connection with the sales through Co-operative none of sales
made under this category in 2006 and registered to 33.7 percent in 2012 ,with regard
to overall changes around 71 thousands in 2006 which is increased to 1 lakh and 63
thousands in 2012 with the increase of 130.4 percent from 2006 of direct sales
taken place during the period, the Co-operative sold 4.5 thousand through
exhibition in 2006 which was increased 24 thousands during the study period, 5
lakh and 93 thousands worth of silk products sold through commission agents in
2006 which declined to 4 lakhs 74 thousands in 2012 with the decline of 20.8
percent, through Co-operative the Co-operative made 1 lakh and 56 thousands in
2012, at the outset overall value of the silk products sole was 6 lakhs and 68

181
thousands which is increased to 9 lakhs and 98 thousand with the increase of 49.3
during the study period, it is apparent from the empirical findings that Kamarajar
Co-operative silk society have made significant increase in direct sales, in sales
through exhibition, decline in sales through agent and increase in Co-operative,
which unlike picture from rest of the societies as sales through agent was declining,
at the outset meager proportion of the increase taken place during the study period.
TABLE NO: IV.39
KAMARAJAR CO-OPERATIVE PURCHASE OF RAW MATERIALS
(Rs in Lakhs)
Year Yarn Zari Chemical Total Expenditure
2006 0.3
(82.3) 0.05(15.8)
0.006
(1.9) 0.32
2007 0.3
(82.7) 0.07(15.5)
0.007
(1.8)
0.42
(32)
2008 0.6
(85) 0.10(13.9)
0.008
(1.1)
0.72
(127.2)
2009 0.7
(80.6) 0.15(17.3)
0.018
(2.1)
0.87
(20.9)
2010 0.9
(78.5) 0.22(20.1)
0.016
(1.5)
1.10
(26.3)
2011 0.9
(73.7) 0.31(24.8)
0.019
(1.5)
1.25
(14)
2012 1.0
(73.7) 0.33(24.8)
0.020
(1.5)
1.35
(7.8)
Overall Growth
2006 0.3 0.05 0.006 0.32
2012 1.0
(331.4)
0.33
(568.4)
0.020
(241.4)
1.35
(326.1) Source: Secondary data (Audited report of KSPCS

182
Table No:IV.39 exhibits the value of the raw materials purchased by
Kamarajar Co-operative silk society from 2006 to 2011, with regard to yarn
purchase about 82.3 percent of the total raw materials purchase incurred in 2006
and then onwards value of purchase consistently shown descending trend and in
2012 it came down to 73.7 percent with significant increase from 2006,with
respect to zari purchase nearly 15.8 percent of the total raw materials procurement
incurred in 2006 and then onwards value of purchase constantly fluctuated and in
2011 it increased to 24.8 percent with significant increase from 2006,with regard
to Chemical purchase around 1.9 percent of the total raw materials spent on
chemicals purchase in 2006 and then onwards value of purchase consistently
decreased and in 2012 it had decreased to 1.5 percent with substantial decline
from 2006, the overall growth of the various components witnessed consistent
escalation, the Kamarajar Co-operative silk society spent around 26 thousand in
2006 for yarn purchase which is increased to around 99 thousand in 2012 with the
escalation of 281.4 percent, in connection with zari procurement in 2006 the Co-
operative spent nearly 5+ thousands which is increased to nearly 33 thousands
with the increase of 568.4 percent, for chemical purchase around 6 hundred spent
in 2006 and which is increased to 2 thousand with the increase of 241.4 percent at
the outset total raw material purchase for Kamarajar Co-operative silk society was
around 31 thousand which is increased 1lakh and 34 thousands in 2012 with the
hike of 326.1 percent it is clear from the empirical verification that the expenditure
on raw materials purchase were steadily increased during the study period.

183
TABLE NO: IV.40
OPERATIONAL EXPENDITURE OF KAMARAJAR CO-OPERATIVE
SILK SOCIETY
(Rs in Lakhs)
Year Estab.Exp Trade .Exp Int on Borrowing Total Expenditure 2006 1.2
(4.6) 1.7
(6.5) 22.8
(88.9) 25.6
2007 1.1 (5.1)
0.5 (2.5)
19.4 (92.4)
21.0 (-18.1)
2008 1.2 (4.8)
0.9 (3.3)
23.9 (91.9)
26.0 (23.9)
2009 1.6 (5.7)
0.9 (3.3)
24.9 (91)
27.3 (5.4)
2010 0.9 (3.1)
1.0 (3.5)
26.0 (93.4)
27.8 (1.7)
2011 0.9 (3.4)
0.9 (3.2)
25.5 (93.4)
27.3 (-1.7)
2012 0.9 (3.1)
0.9 (3.0)
26.8 (93.9)
28.5 (4.4)
Overall Growth 2006 1.2 1.7 22.8 25.6 2012 0.9
(-25.3) 0.9
(-48.5) 26.8
(17.8) 28.5
(11.5) Source: Secondary data (Audited report of KSPCS)
Table No: IV.40 depicts the operational expenditure of the Kamarajar
silk Co-operative silk society during the study period, with regard to establishment
expenditure around 4.6 percent of the expenditure made under this category and
decreased to 3.1 percent in 2012, with respect to Trade expenditure around 6.5
percent of the expenditure made under this classification and decreased to 3 percent
in 2012, with regard to bonus to weavers nothing have beeen spent by the Co-
operatives during the study period, with respect to interest payment 88.9 percent
spent in 2006 which get increased to 93.9 percent in 2012, with respect to overall
growth,around 1lakh and 17 thousand in 2006 which is decreased to 87 thousand

184
in 2012 with the decline of 25.3 percent of expenditure occurred on establishment
cost, around 1 lakh and 66 thousand in 2006 which is increased to 85 thousand in
2012 with the decrease of 48.5 percent of expenditure occurred on trade charges
during the study period, with regard to interest for payment 22 lakhs and 76
thousands spent in 2006 and which is increased to 26 lakhs and 80 thousands, at the
outset overall value of the operational expenditure was 25 lakhs and 59 thousand
which is increased to 28 lakhs and 53 thousand with the increase of 11.5 percent
during the study period, as the Co-operatives bound to make some payments
irrespective of the sales level.
TABLE NO: IV.41
MARKETING EXPENDITURE INCURRED BY KAMARAJAR CO-
OPERATIVE SILK SOCIETY
(Rs in Lakhs)
Year Commission to selling agent
Salary to sales Person
Advertisement Total Expenditure
2006 0.07 (5.6)
1.06 (84.8)
0.12 (9.6) 1.25
2007 0.04 (3.1)
1.12 (88.2)
0.11 (8.7) 1.27(1.6)
2008 0.04 (3)
1.18 (90.8)
0.08 (6.2) 1.30(2.3)
2009 _ 1.40 (88.6)
0.18 (11.4) 1.58(21.5)
2010 0.03 (1.5)
1.80 (90.5)
0.16 (8) 1.99(25.9)
2011 0.03 (1.4)
1.96 (91.6)
0.15 (7)
2.14 (7.5)
2012 0.04 (1.76)
2.06 (92.1)
0.15 (6.6)
2.25 (4.9)
Overall Growth 2006 0.07 1.06 0.12 1.25 2012 0.04
(-50) 2.06
(94.3) 0.15 (25)
2.25 (79.6)
Source: Secondary data (Audited report of KSPCS)

185
Table No: IV.41 depicts the marketing expenditure of the Kamarajar silk
co-operative silk society during the study period, with regard to commission to
consumer nothing have been spent, with respect to commission to to selling agent
around 5.6 percent of the expenditure made under this classification and decreased
to 1.7 percent in 2012, with regard to salary to sales personnel around 84.8
percent of the expenditure made out of the total expenditure in 2006 and increased
in 2012 with 92.1 percent, nearly 9.6 percent spent towards advertisement in 2006
and which is declined to 6.6 percent in 2012, with respect to overall growth, around
7 thousands in 2006 which is increased to 3.5 thousands in 2012 with the decline of
50 percent of expenditure incurred on commission to selling agent during the
period, around 1 lakh and 6 thousand rupees in 2006 spent towards salary which was
increased to 2 lakhs and 6 thousands in 2012, around 12 thousands in 2006 spent
towards advertisement which is increased to 15 thousands in 2012 with the decline
of 25 percent, at the outset overall value of the marketing expenditure was 1lakh
and25 thousands which is increased to 2 Lakhs and 24 thousand with the hike of
79.6 percent during the study period, as the marketing expenditure is the important
component of the expenditure structure of Kamarajar Co-operative silks which
enables the sales promotion, unlike other Co-operatives Kamarajar Co-operatives
didn’t made any commission towards consumer through discount during the study
period.

186
TABLE NO: IV. 42
OUTSTANDING LOANS OF KAMARAJAR CO-OPERATIVE SILK
SOCIETY
(Rs in Lakhs)
Year
Deposit’s from
members
Cash credit from
kumbukonam central Co-
operative bank
Total
Outstanding
2006 22.5
(95.6)
1.04
(4.4) 23.5
2007 30.2
(73.7)
10.77
(26.3)
41.0
(74.3)
2008 22.9
(86.5)
3.59
(13.5)
26.5
(-35.2)
2009 22.4
(95)
1.18
(5.0)
23.5
(-11.3)
2010 52.7
(97.9)
1.14
(2.1)
53.8
(128.6)
2011 57.2
(98.1)
1.11
(1.9)
58.3
(8.4)
2012 59.6
(98.1) 1.13 (1.9)
60.8
(4.2)
2006 22.4 1.04 23.50
2012 59.6
(165.4)
1.13
(8.9)
60.7
(158.5)
Source: Secondary data (Audited report of KSPCS

187
Table No:IV.42 Portrays the outstanding of loans of the Kamarajar Co-
operative silk society during the study period as the outstanding of loans would
reaveled the finacial distress of the organziation, 95.6 percent of the outstanding
loans owe to members of Co-operativeertaivesoceity in 2006 which is increased to
98.1 percent in 2012, nearly 4.4 percent of outstanding loans owe to Kumbakonam
central Co-operative bank in 2006 which is declined to 1.9 percent in 2012, with
reagrd to overall growth nearly 22 lakhs and 46 thousands fund owe to depositers
in 2006 and which increased to 59 lakh and 62 thousands in 2012 with the increase
of 165.4 percent,with regard to outstanding owe to Kumbakonam central Co-
operative bank nearly 1 lakh and 04 thousand have registered which is increased to
1 lakh and 13 thousand in 2012 with 8.9 percent increase, at the outset total
outstanding was 23 lakhs and 50 thousands which was increased to 60 lakhs and 75
thousands in 2012 with the increase of 158.5 percent during the study period.It is
clear that outstanding have been consistently escalating during the study period.

188
TABLE NO: IV.43
COMPARATIVE PROFITABILITY ANALYSIS OF SEVEN SILK CO-
OPERATIVE SOCIETIES IN KUMBAKONAM TALUK GROSS PROFIT
Yea
r
Thir
ubuv
anam
Cho
lan
Dar
asur
am
Thir
uval
luva
r
Kal
aiva
nar
Supe
r
Kam
araj
ar
Tota
l Gro
ss
Prof
it
2006 489.89 40.59 2.86 5.72 0.53 1.92 1.09 542.6
2007 561.4
(14.6)
61.6
(52)
2.13
(-25.5)
14.6
(155.6)
0.14
(-73.6)
0.79
(-58.9)
0.6
(-45)
641.2
(18.2)
2008 413.3
(-26.4)
51.81
(-16)
1.99
(-6.7)
9.46
(-35.3)
0.33
(135.7)
0.13
(-83.5)
1.03
(71.7)
478.05
(-25.5)
2009 601.3
(45.5)
81.09
(56.5)
1.80
(-9.5)
16.4
(73.4)
0.38
(15.2)
1.03
(692.3)
1.47
(42.7)
703.47
(47.2)
2010 560.5
(-6.8)
84.0
(3.6)
1.61
(-10.7)
18.2
(11.4)
0.36
(-5.3)
0.78
(-24.3)
1.63
(10.9)
667.08
(-5.2)
2011 623.16
(11.2)
88.30
(5.1)
1.53
(-5)
19.42
(6.3)
0.52
(44.4)
0.62
(-20.5)
1.31
(-19.6)
734.86
(10.2)
2012 656.81
(5.4)
93.06
(5.4)
1.41
(-7.7)
20.72
(6.7)
0.61
(15.4)
0.68
(11.2)
1.39
(6.2)
774.68
(5.4)
Overall Growth
2006 489.9 40.6 2.9 5.7 0.5 1.9 1.1 542.6
2012 656.8
(34.1)
93.06
(129.3)
1.4
(-50.8)
20.7
(262.3)
0.61
(15.1)
0.68
(-64.8)
1.39
(27.5)
774.6
(42.8)
Source : Secondary data ( Audited reports Silk Co-operative societies)
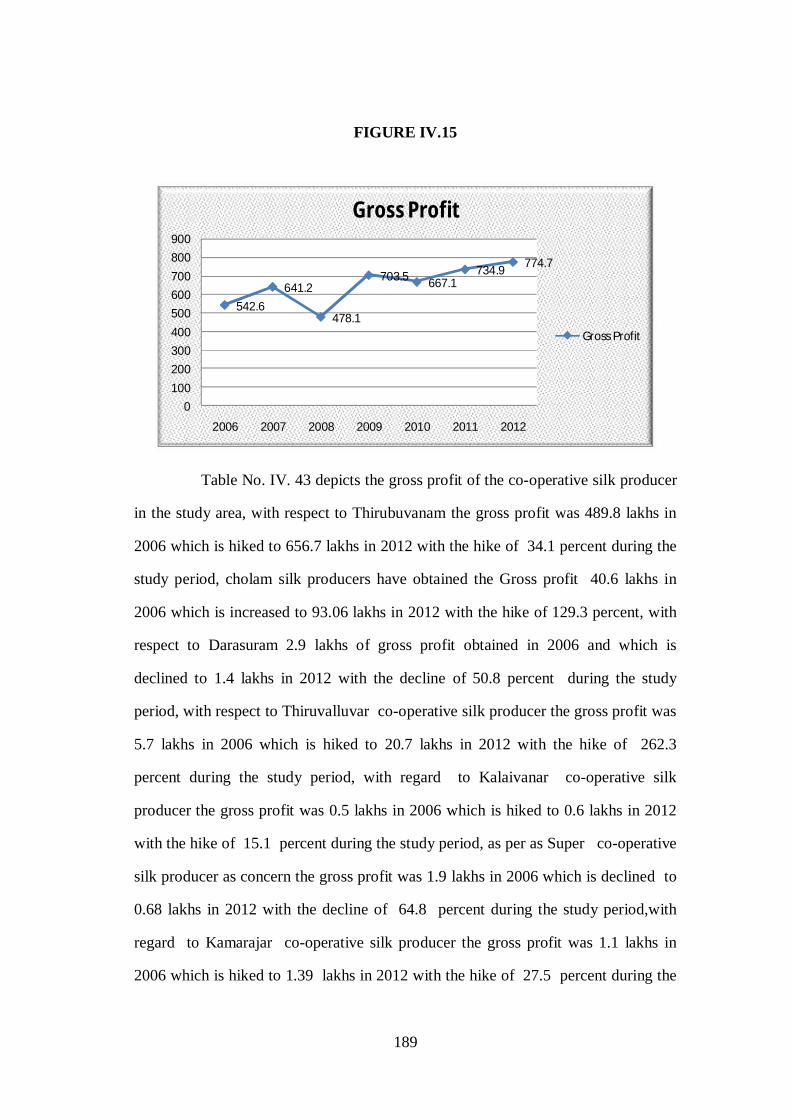
189
542.6641.2
478.1
703.5 667.1734.9 774.7
0100200300400500600700800900
2006 2007 2008 2009 2010 2011 2012
Gross Profit
Gross Profit
FIGURE IV.15
Table No. IV. 43 depicts the gross profit of the co-operative silk producer
in the study area, with respect to Thirubuvanam the gross profit was 489.8 lakhs in
2006 which is hiked to 656.7 lakhs in 2012 with the hike of 34.1 percent during the
study period, cholam silk producers have obtained the Gross profit 40.6 lakhs in
2006 which is increased to 93.06 lakhs in 2012 with the hike of 129.3 percent, with
respect to Darasuram 2.9 lakhs of gross profit obtained in 2006 and which is
declined to 1.4 lakhs in 2012 with the decline of 50.8 percent during the study
period, with respect to Thiruvalluvar co-operative silk producer the gross profit was
5.7 lakhs in 2006 which is hiked to 20.7 lakhs in 2012 with the hike of 262.3
percent during the study period, with regard to Kalaivanar co-operative silk
producer the gross profit was 0.5 lakhs in 2006 which is hiked to 0.6 lakhs in 2012
with the hike of 15.1 percent during the study period, as per as Super co-operative
silk producer as concern the gross profit was 1.9 lakhs in 2006 which is declined to
0.68 lakhs in 2012 with the decline of 64.8 percent during the study period,with
regard to Kamarajar co-operative silk producer the gross profit was 1.1 lakhs in
2006 which is hiked to 1.39 lakhs in 2012 with the hike of 27.5 percent during the

190
study period, it oculd be inferred from the empirical verification that except
Thirubuvanam , Cholan and Thiruvalluvar co-operative silk producer rest of the silk
producers have undergone fluctuation in gross profit during the study period and in
the same line the analysis also revealed that the proportion of the profit margin
between 15 percent to 26 percent for all the co-operatives in the study area, at the
outset the profit of the co-operative silk producers were relatively poor when
compare to the labourious activity involved in the silk sarees production in the study
area.
TABLE : NO. IV. 44
NET PROFIT
Yea
r
Thir
ubuv
anam
Cho
lan
Dar
asur
am
Thir
uval
luva
r
Kal
ivan
ar
Supe
r Si
lks
Kam
araj
ar
Tota
l Net
Pro
fit
2006 269.06 18.3 1.5 2.7 0.25 0.98 .69 293.5
2007 281.03 (4.4)
29.4 (61.5)
1.10 (-26.8)
11.7 (9.7)
0.06 (-74.8)
0.39 (-59.6)
0.6 (-45)
324.28 (10.5)
2008 193.93 (-31.0)
25.1 (-14.6)
0.9 (-11.7)
5.281 (-54.0)
0.14 (133.1)
0.06 (-82.4)
0.03 (71.7)
225.4 (-30.5)
2009 366.54
(89) 39.2
(55.9) 0.9
(-7.3) 9.39
(48.7) 0.17 (19)
0.58 (-22.1)
0.37 (42.7)
417.1 (85)
2010 376.14 (2.6)
40.6 (3.6)
0.7 (-12)
10.75 (40.1)
0.16 (-5.9)
0.42 (-27.6)
0.42 (10.9)
429.1 (2.9)
2011 392.56 (4.4)
41.9 (3.1)
0.78 (-2.3)
11.7 (70.8)
0.22 (37.5)
0.34 (-18.2)
0.31 (-19.6)
447.8 (4.3)
2012 429.0 (9.3)
43.8 (4.5)
0.7 (-3.8)
12.9 (11.1)
0.25 (11.8)
0.37 (9.3)
0.4 (9.3)
487.4 (8.8)
Overall Growth 2006 269.1 18.3 1.5 2.7 0.25 0.98 0.69 293.5
2012 429
(59.4) 43.8
(139.8) 0.7
(-53.8) 12.9
(339.8) 0.25
(-0.06) 0.37
(-62.2) 0.4
(-18.4) 487.42 (66.1)
Source : Secondary data ( Audited reports Silk Co-operative societies)

191
293.5324.3
225.4
417.2 429.2 447.8487.4
0.0
100.0
200.0
300.0
400.0
500.0
600.0
2006 2007 2008 2009 2010 2011 2012
Net Profit
Net Profit
FIGURE IV.16
Table No. IV. 44 depicts the net profit of the co-operative silk producer
in the study area, with regard to Thirubuvanam the net profit was 269.1lakhs in 2006
which is hiked to 429 lakhs in 2012 with the hike of 59.4 percent during the study
period, cholam silk producers have obtained the Net profit 18.3 lakhs in 2006 which
is increased to 43.8 lakhs in 2012 with the hike of 139.3 percent, with respect to
Darasuram 1.5 lakhs of net profit obtained in 2006 and which is declined to 0.7
lakhs in 2012 with the decline of 53.8 percent during the study period,with respect
to Thiruvalluvar co-operative silk producer the net profit was2.7 lakhs in 2006
which is hiked to 12.9 lakhs in 2012 with the hike of 339.3 percent during the study
period,with regard to Kalaivanar co-operative silk producer the net profit was 0.25
Lakhs in 2006 which is experienced mild decline to 0.24 Lakhs in 2012 with the
decline of 0.06 percent during the study period, as per as Super co-operative silk
producer as concern the net profit was 0.98 lakhs in 2006 which is declined to 0.37
Lakhs in 2012 with the decline of 62.2 percent during the study period,with regard

192
to Kamarajar co-operative silk producer the net profit was 0.69 Lakhs in 2006
which is hiked to 0.4 Lakhs in 2012 with the decline 18.4 percent during the study
period, it is apparent from the empirical verification that net profit of the co-
operative silk producers trend more or less corresponding to the to the gross profit
during the study period, however Super and Kamarajar silk producers have
undergone negative trend along with Darausram, at the outset it could be inferred
that the net profit of the co-operative silk producers were reladequate.
TABLE NO : IV.45
RETURN ON INVESTMENT OF TIRUBUVANUM CO-OPERATIVE SILK SOCIETIES
Year
Thir
uval
luva
r
Cho
lan
Dar
asur
am
Kal
aiva
nar
Supe
r
Thir
ubuv
anam
Kam
araj
ar
2006 0.05 0.26 0.04 0.03 0.33 0.26 0.21
2007 0.22 0.34 0.34 0.00 0.13 0.25 0.19
2008 0.09 0.03 0.03 0.02 0.02 0.16 0.02
2009 0.17 0.03 0.03 0.01 0.020 0.28 0.11
2010 0.19 0.45 0.04 0.02 0.15 0.27 0.12
2011 0.20 0.44 0.02 0.03 0.13 0.23 0.09
2012 0.23 0.43 0.02 0.03 0.15 0.24 0.12
Source: secondary data
193
The above table No IV.45 exhibits the result of return on investment for
the seven silk co-operative societies were functioning . return on investment lies
very high for the Thirubuvanam silk society due to high member and the society has
more active looms when compared with all other societies .Even though when
compared with previous seven years investment turn on inv year 2012 increased by
9,35 percent it seems to be an gradual increase in ROI. It clear that by way of
return on investment Thirubuvanam , Thiruvalluvar and Cholan co-operative silk
societies performed well , return on investment of the Super silk co-operative
societies and Kamaajar co-operative silk societies were fall on the next of the
leading societies., and the return on investment of kalaivanar and Darasuram silk
co-operative societies were very megare because of the demand of the product is
going to outdated due to high cost poor technology.

194
CHAPTER V
SOCIO-ECONOMIC CONDITIONS AND PERCEPTIONS OF
WEAVERS ON SILK CO-OPERATIVES
In this Chapter an attempt is made to analyze, various aspects of the socio
economic conditions and perceptions of silk weavers in Kumbakonam taluk. The
important tactors such as sex age, caste, education, marital status, economic states
and business profile, financial structure and of weavers were studied..
Gender
One significant universally accepted criterion of development is gender.
There is a clear distinction made in development literature between sex and gender.
Sex relates to the biological differences between male and female, whereas gender
relates to the roles assigned to male and female in the society. Thus, gender is a
socio-economic variable involving roles, responsibilities, constraints, opportunities
and needs of males and female in an economy.

195
TABLE NO: V. 1
GENDER WISE DISTRIBUTION OF THE RESPONDENTS
Response category Numbers Percentage
Male 122 69.7
Female 53 30.3
Total 175 100
Source: Primary data
Table No: V.1 gives the gender wise distribution of the respondents. In
the study 69.7 percent of the respondents were male and 30.3 percent of the
respondents were female, it could be inferred from the empirical verification that
more than 2/3 of the respondents were male even most of the weavers were male
and women were assisting them in the process.
Age wise distribution of the Respondents
TABLE NO: V.2
AGE WISE DISTRIBUTION OF THE RESPONDENTS
Age (years) Category Numbers of Respondents Percentage
Up to 30 20 11.3
31 to 40 29 16.3
41-50 60 34
51 to 60 44 25.3
above 60 23 13
Total 175 100 Source: Primary data

196
TABLE NO: V.3
EDUCATIONAL STATUS OF THE RESPONDENTS
Educational Level Numbers of Respondents Percent
Illiterate 18 10
Primary 64 37
S.S.L.C 46 2.2
H.Sc 33 19
Degree/ Diploma 14 8
Total 175 100
Source: Primary data
Table No:V.3 exhibits the educational status of the respondents in the
study area, out of 175 respondents 37% were belongs to the category of primary
education, 26% of weavers’ respondents were completed the school education, 19%
respondents were finished their HSC and higher education of degree and diploma
were completed by 14% respondents. Nearly 18% of the respondents has even
primary educational qualification.
Caste
Indian society stratified with the closed caste system which is the
operating element in accessing the social, economic and cultural privileges from the
society, Especially in the rural society caste the important identity to the individuals,
government has categorized the cluster of caste into major divisions for its

197
administrative purpose to implement the affirmative action, at the outset Indian
social system is caste bounded society.
TABLE NO: V.4
CASTE WISE DISTRIBUTION OF THE RESPONDENTS
Community Numbers Percent
FC 33 18.7
BC 124 70.7
MBC 12 7
SC 6 3.7
Total 175 100
Source: Primary data
Table No:V.4 depicts the caste wise classification of the respondents, 18.7
percent of the respondents belong to FC, 70.7 percent of the respondents belong to
BC, 7 percent hails from and 3.7 percent belongs to MBC and SC respectively. In
precise, majority of the respondents belonged to BC in the respondents groups in the
study area, especially the saurastra people largely engaging in these activities along
with rest of the communities in the study area.

198
Marital Status
TABLE NO: V.5
MARITAL STATUS OF THE RESPONDENTS
Marital Status Numbers Percent
Married 151 86
Unmarried 13 7.7
Divorced / Individual 6 3.7
Widows 5 2.7
Total 175 100
Source: Primary data
TABLE NOV.6
INCOME PATTERN OF RESPONDENTS
Income Grade (finance) Numbers Percent
Less than 20,000 88 50.3
20,001 to 30,000 71 40.7
30,001 to 40,000 11 6
40,001 and above 5 3
Total 175 100
Source: Primary data

199
0
10
20
30
40
50
60
Less than 20,000 20,001 to 30,000 30,001 to 40,000 40,001 and above
50.3
40.7
63
Income
FIGURE V.1
Table NoV.6 It can be seen from the table that more than 50per colves the
response annual income floss the Rs20,000. with regard to income of the respondent
50.3 percent of the respondents annual income is less than 60,000, nearly 41
percent of the respondents income range from 60001 to 90,000, 6 percent of the
respondents income constitutes from 90,001 to 1,20,000, and 3 percent of the
respondents annual income is above 120000 , nearly 91 % of the respondents annual
income were below 90,000 which implies that the women weavers were get less
income which had repercussions on poverty and purchasing power of the weavers
in the study area.
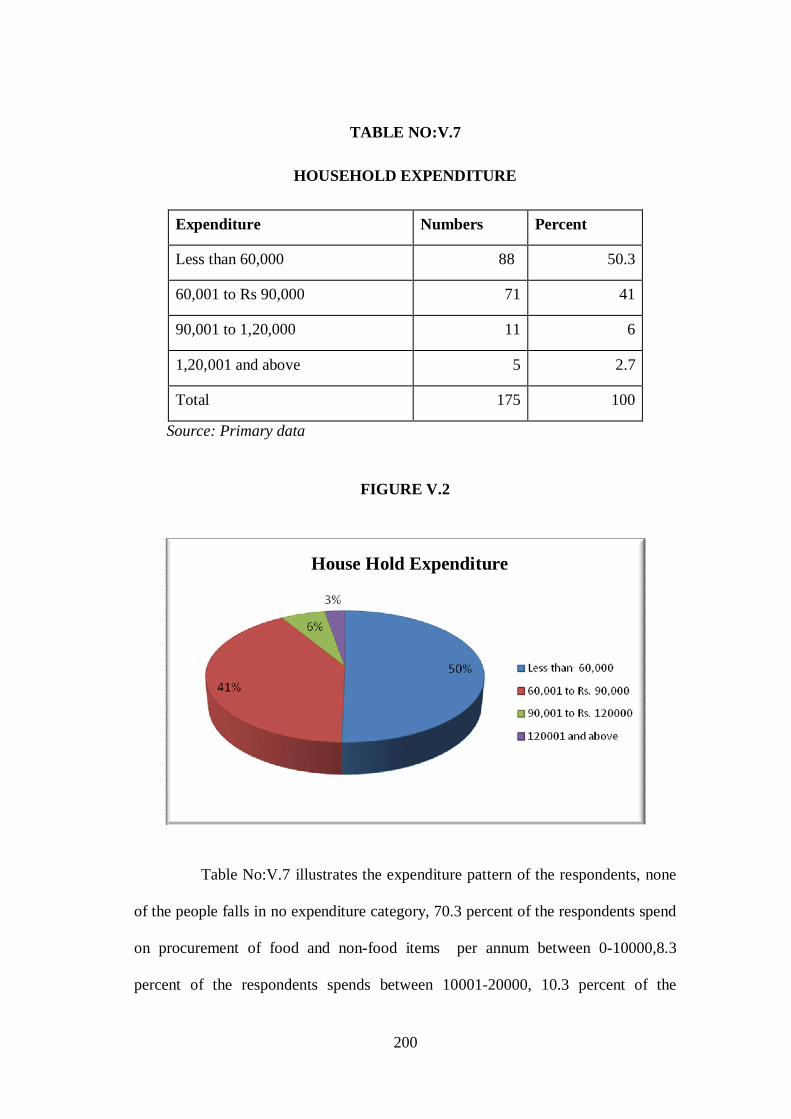
200
TABLE NO:V.7
HOUSEHOLD EXPENDITURE
Expenditure Numbers Percent
Less than 60,000 88 50.3
60,001 to Rs 90,000 71 41
90,001 to 1,20,000 11 6
1,20,001 and above 5 2.7
Total 175 100
Source: Primary data
FIGURE V.2
Table No:V.7 illustrates the expenditure pattern of the respondents, none
of the people falls in no expenditure category, 70.3 percent of the respondents spend
on procurement of food and non-food items per annum between 0-10000,8.3
percent of the respondents spends between 10001-20000, 10.3 percent of the
House Hold Expenditure

201
respondents spends from the slab between 20001-30000, 3 percent of the
respondents spend between 30001-40000, 2 percent of the of the respondents spends
from 40001-50000, 2 percent of the of the respondents spends from 50001-60000,
and 3 percent of the respondents spends 60,000 and above per annum, it could be
inferred from the analysis that low level of the expenditure is the result of low
income level, further the analysis revealed that persistence of poverty high among
the weavers in the study area.
TABLE NO:V.8
SAVINGS PATTERN OF RESPONDENTS
Annual savings Numbers Percent
Nil 65 37.3
Up to Rs 100 53 30
100-200 26 15
200-300 13 7.7
400-500 11 6.3
500 and above 6 3.7
Total 175 100
Source: Primary data

202
37%
30%
15%
8%6% 4%
Savings
No savings
0-100
100-200
200-300
400-500
500 and above
FIGURE V.3
Table No:.V.8 exemplifies the savings pattern of the respondents, around
37.3 percent of the people revealed that they haven’t made any savings, 30 percent
of the respondents were savings 0-100 per month, 15 percent of the respondents
were made saving 101-200 per month, 7.7 percent of the people saves between 200-
300 rupees per month,6.3 percent of the respondents were saves between 400-500
per month and 3.7 percent of respondents were made savings 500 and above per
month, Saving money is a mirage among the weavers households,. The SHG has
taken the responsibility of collecting some of the earnings of the weavers once in 15
days under chits. So also the weavers organized themselves in groups to collect
little money daily, weekly or fortnightly from each weaver who is willing to join the
association. The respondents who saved money at home revealed that it was difficult
for them to contribute regularly to the chits.

203
40%
30%4%
25%
1%
Source of Loan
Private Money lenders
Pawn Broker
Co-operative banks
SHGs
Commercial banks
TABLE NO:V.9
SOURCES OF LOAN TO THE RESPONDENTS
sources of loan Numbers Percent
Money lenders 71 40.3
Pawn broker 53 30
Co-operative banks 6 3.7
SHGs 44 25
Commercial banks 2 1
Source: Primary data
FIGURE V. 4
Table No: V.9 illustrates the source of loan of the respondents as loans
are the important component of the economic activity of the weavers in the study
area, around 40.3 percent of the respondents use to avail the loan from the private
moneylenders, 30 percent of the respondents revealed that they mortgage the jewels

204
in the nearby pawn broker shops for the credit requirement, 3.7 person availed loan
from co-operative banks, 25 percent of the respondents availed the loan from SHGs
and merely 1 percent of the respondents were got the loan from commercial loans, it
could be inferred from the empirical investigation that the institutionalized credit
facilities are not accessible to the respondents at the large.
TABLE NO:V.10
BUSINESS PROFILE OF DESPONDENCE
Business experience (year) Numbers Percent
Up to 5 yrs 23 13.3
6--10 yrs 46 26.3
11--15 yrs 60 34
16--20 yrs 24 13.7
Above 20 years 22 12.7
Total 175 100
Source: Primary data
Table No:V.10 illustrates the no of years of experience of the respondents
as weaver, 13.3 percent of the respondents had experience for last five years, 26.3
percent got experience between 6 yrs to 10 yrs, 34 percent run the company
between 11yrs to 15 yrs,13.7 percent got the between 16 yrs to 20 yrs,12.7 percent
of the respondents had experience for more than 20 years, majority of the
respondents have got experience more than 15years, around 60 percent of the
respondents falls in the category, it could be inferred from the analysis that major

205
3%
14%
77%
5% 1%
No of days of employment
0-1011--15
15-2021-25
26-30
chunk of the respondents were middle aged people and got more experience as
weaver.
TABLE NO :V.11
JOB AVAILABILITY PER MONTH
Days of Employment
in a month
Number of
respondents
Percentage
0-10 5 2.8
11--15 26 14.7
15-20 134 76.7
21-25 9 5.0
26-30 1 0.8
Total 175 100
Source: Primary data

206
Table No:V.11 represents the respondents statement on the number of
days of employment get per month, 2.8 percent of the respondents have opined that
they got the employment of 0-10 days per month, 14.7 percent of the respondents
have told that they could avail the employment between 11-15 days per month,76.7
percent of the respondents explained that they got 15-20 days of employment per
month,5 percent of the respondents got the employment between 21-25 days,merly
0.8 percent of the respondents got the employment between 26-30 days per month,
the majority of the respondents have got the employment between 15-20 days per
month which means that large segment of the respondents have got the job during
half of the month in the same line season wise employment is also palyed pivotal
role in determining the no days of employment in the study area.
TABLE NO:V.12:
OPINION ABOUT EMPLOYMENT AND COMPENSATION
Opinion Job adequacy Wage rate
Numbers Percent Numbers Percent
Yes 17 9.6 21 11.9
No 158 90.4 154 88.1
Total 175 100 175 100
Source: Primary data

207
FIGURE V.5
Table V.12 illustrates the respondents perception on getting adequate
employment and wage in the study area, 90.4 percent of the respondents have told
that they haven’t got the adequate employment to meet their minimum subsistence
level, only 9.6 workers have told that they use to get adequate employment, it could
be quite strange from the above table but people have told that the employment
given to them is not adequately support them to lead the minimum standard of
living, with regard to income the income level generated through the work, 88.1
percent of the respondents have told that they don’t get the adequate income out of
the weaving work, they are all very concern about the increasing prices for the
essential commodities and also felt regret that their income is not increase to that
level to meet the expenditure, 11.9 percent of the respondents have told that they got
the adequate income from the work, despite of the fact human won’t satisfied with

208
what they have but here the income pattern really grim and also the expenditure is
escalating on the other hand.
TABLEV.13
DIFFICULTIES OF WEAVERS IN KUMBAKONAMTALUK
Opinion Numbers Percentage
Underutilization capacity 11 6.3
Inadequate work place 21 12.0
Forced to work more time 15 8.6
Inability to adapt latest technology 14 8.0
All above five 114 65.1
Total 175 100
Source: Primary data
FIGURE V.6
6.3
12.0
8.6
8.065.1
Underutilization capacity
Inadequate work place
Forced to work more time
Inability to adapt latest technology
All above five

209
Table 5.15 explains the kind of difficulties weavers has been facing in the
study area, 6.3 percent of the respondents have told that their capacity have not been
optimally utilized, 12 percent of the respondents have opined that they haven’t got
the adequate space for working ,8.6 percent of the respondents have opined that they
had been forced to work more than the entitled time schedule,8 percent of the
respondents opined that they have inadequate potentiality to adopt the new
innovative skills and technology, 65.1 percent of the respondents have exemplified
that they had been facing all the above five problems, hence it is very apparent from
the empirical illustration that weavers working for wages are more vulnerable than
the weavers owning the looms and they have been undergoing lot of problems in the
working area.
TABLE V 14
OCCUPATIONAL DISEASES
Yes Percent No Percent
Causes eye sight 121 69.1 54 30.9
Causes Skin rashes 109 62.3 66 37.7
Causes back pain 111 63.4 64 36.6
Causes Asthma 116 66.3 60 34.3
Causes spin disorders 117 66.9 58 33.1
All the above 165 94.3 10 5.7
Source: Primary data

210
FIGURE V.7
0.010.020.030.040.050.060.070.080.090.0
100.0
Causes eye sight
Causes Skin
rashes
Casues back pain
Causes Asthma
Casuses spin
disorders
All the above
69.162.3 63.4 66.3 66.9
94.3
30.937.7 36.6 34.3 33.1
5.7
Occupational diseases
Yes
No
Table.V.14 depicts the opinion of the respondents whether work
environment is caused any diseases, 69.1 percent of the respondents opined that the
work environment caused eye sight problems ,30.9 percent of the respondents
opined no for the same,62.3 percent of the respondents opined that the work
environment caused Skin rashes,37.7 percent of the respondents revealed it didn’t
caused, 63.4 percent of the respondents opined that the work environment caused
back pain, 36.6 percent of the respondents opined no for the same,66.3 percent of
the respondents opined that the work environment caused asthma and respiration
,34.3 percent of the respondents didn’t accept the statement,61.7 percent of the
respondents opined that the work environment causes spin disorders,33.1 percent of
the respondents opined no for the same, 94.3 percent of the respondents opined that
the work environment causesall the above diseases, 5.7 percent revealed no for the
statement, hence at the outset working environment responsible for diseases of the

211
respondents. Generally the silk weaving activities use to have lot of process,
including dying, spinning, cleaning all these activities entails consequences which
unleash lot of externalities to the employees both positive and negative moreover
looms operators have not followed the adequate safety measures for their workers so
health deterioration is that the workers are working in the hazardous environment.
TABLE: V.15
OPINION OF RESPONDENTS FOR THE POOR PERFORMANCE OF SILK
CO-OPERATIVES
Opinion Strongly
agreed
Agreed No
opinion
Disagree
d
Strongly
Disagreed
Num
bers
Perc
ent
Num
bers
Perc
ent
Num
bers
Perc
ent
Num
bers
Perc
ent
Num
bers
Perc
ent
Improper
marketing
strategies
52 29.7 57 32.7 13 7.7 30 17 23 13
Delay in payment
creditor
60 34 69 39.7 12 6.7 20 11.3 15 8.3
Heavy
administrative cost
53 30.3 65 37.3 17 9.7 22 12.3 18 10.3
Delay in credit
collection of sales
32 18 37 21.3 9 5.3 53 30 44 25.3
Delay in getting
payments from
Govt
63 36 66 37.7 12 6.7 19 10.7 16 9
Source Primary data

212
Table: V.15 depicts the Opinion of respondents for the poor performance
of silk co-operatives in the study area, with regard to Improper marketing strategies
around 29.7 percent of the respondents strongly agree the statement, 32.7 percent
agreed, 7.7 percent didn’t have opinion, 17 percent didn’t agreed the statement and
13 percent strongly disagreed the statement, with regard to Delay in payment
creditor nearly 34 percent of the respondents strongly agree the statement, 39.7
percent agreed, 6.7 percent didn’t have opinion, 11.3 percent didn’t agreed the
statement and 8.3 percent strongly disagreed the statement, with respect to Heavy
administrative cost around 30.3 percent of the respondents strongly agree the
statement, 37.3 percent agreed, 9.7 percent didn’t have opinion, 12.3 percent didn’t
agreed the statement and 10.3 percent strongly disagreed the statement, with respect
to Delay in credit collection of sales 18 percent of the respondents strongly agree
the statement,21.3 percent agreed, 5.3 percent didn’t have opinion, 30 percent didn’t
agreed the statement and 25.3 percent strongly disagreed the statement, with respect
to Delay in getting payments from Govt around 36 percent of the respondents
strongly agree the statement, 37.7 percent agreed, 6.7 percent didn’t have opinion,
10.7 percent didn’t agreed the statement and 9 percent strongly disagreed the
statement, it could be inferred that improper financial management is the disaster for
the co-operatives poor performance and the various endogenous and exogenous
factors which accentuate the financial distress of the silk co-operatives in the study
area.

213
TABLE NO: V 16
PERCEPTIONS OF THE RESPONDENTS ON THE STRATEGY TO
IMPROVE THE FINANCIAL PERFORMANCE OF CO-OPERATIVES
Opinion Strongly agreed
Agreed No opinion Disagreed Strongly Disagreed
Num
ber
perc
ent
Num
ber
s pe
rcen
t
Num
ber
s pe
rcen
t
Num
ber
s pe
rcen
t
Num
ber
s pe
rcen
t
Avoid Frequent interruption in production and Non-Submission of data to bank
64 36.3 67 38.3 12 6.7 18 10.3 15 8.3
Maintain regular bank accounts
58 33.3 61 35 8 4.3 26 15 22 12.3
Optimum utilization of capacity
57 32.3 63 36 9 5.3 24 13.7 22 12.7
Required turnover of personal
62 35.7 79 45.3 12 6.7 12 6.7 10 5.7
Clear outstanding payments
64 36.7 74 42 13 7.7 12 7 12 6.7
Maintain good relationships with weavers
61 34.7 72 41 13 7.3 18 10 12 7

214
Opinion Strongly agreed
Agreed No opinion Disagreed Strongly Disagreed
Num
ber
perc
ent
Num
ber
s pe
rcen
t
Num
ber
s pe
rcen
t
Num
ber
s pe
rcen
t
Num
ber
s pe
rcen
t
Increase the technical efficiency of weavers
65 37.3 87 49.7 5 3 10 5.7 8 4.3
Enhance the operational ratios
58 33.3 76 43.3 13 7.3 16 9 12 7
Enhance the quality of product and services
64 36.7 85 48.7 6 3.7 12 6.7 8 4.3
Increases in the level of stock
53 30 59 33.7 11 6 32 18 22 12.3
Source: Primary data
Table No:V.16 Depicts the Perceptions of the respondents on the strategy
to improve the SSI productivity , with regard to the statement that Avoid Frequent
interruption in production and Non-Submission of data to bank 36.3 percent
strongly agreed the statement, 38.3 percent agreed, 6.7 percent didn’t have
opinion, 10.3 percent disagreed and 8.3 percent strongly disagreed the statement,
with regard to the statement Maintain regular bank accounts 33.3 percent strongly
agreed the statement, 35 percent agreed, 4.3 percent didn’t have opinion, 15
percent disagreed and 12.3 percent strongly disagreed the statement, with regard
to the statement Optimum utilization of capacity 32.3 percent strongly agreed the

215
statement, 36 percent agreed, 5.3 percent didn’t have opinion, 13.7 percent
disagreed and 12.7 percent strongly disagreed the statement, with regard to the
statement Required turnover of personal 35.7 percent strongly agreed the
statement, 45.3 percent agreed, 6.7 percent didn’t have opinion, 6.7 percent
disagreed and 5.7 percent strongly disagreed the statement, with regard to the
statement Clear outstanding payments, around 36.7 percent strongly agreed the
statement, 42 percent agreed, 7.7 percent didn’t have opinion, 7 percent disagreed
and 6.7 percent strongly disagreed the statement, with regard to the statement
Maintain good relations with weavers, around 34.7 percent strongly agreed the
statement, 41 percent agreed, 7.3 percent didn’t have opinion, 10 percent
disagreed and 7 percent strongly disagreed the statement, with regard to the
statement Increase the technical efficiency of weavers, around 37.3 percent
strongly agreed the statement, 49.7 percent agreed 3 percent didn’t have opinion,
5.7 percent disagreed and 4.3 percent strongly disagreed the statement, with
regard to the statement Enhance the operational ratios, around 33.3 percent
strongly agreed the statement, 43.3 percent agreed 7.3 percent didn’t have
opinion, 9 percent disagreed and 7 percent strongly disagreed the statement, with
regard to the statement Enhance the quality of product and services, around 36.7
percent strongly agreed the statement, 48.7 percent agreed 3.7 percent didn’t
have opinion, 6.7 percent disagreed and 4.3 percent strongly disagreed the
statement, with regard to the statement Increases in the level of stock, around 30
percent strongly agreed the statement, 33.7 percent agreed 6 percent didn’t have
opinion, 18 percent disagreed and 12.3 percent strongly disagreed the statement,

216
on the whole respondents have well aware about the financial distress of the co-
operatives.
TABLE NO: V.17`
PERCEPTIONS ON WEAVERS ON THE PERFORMANCE OF CO-
OPERATIVES
Opinion Highly
satisfied
Percent Satisfied Percent Not
Satisfied
satisfied
Percent
Clear
Transactions
26 15 29 16.7 120 68.3
Payment in time 30 17 32 18 114 65
Cordial function 23 13.3 27 15.3 125 71.3
Provision of
subsidies
19 10.7 22 12.7 134 76.7
Good Market
ambience
13 7.7 17 9.7 145 82.7
Loan
arrangements
18 10.3 22 12.3 135 77.4
Supply of Raw
materials
16 9 20 11.7 139 79.3
Political
Intervention
17 9.7 20 11.3 138 79
Source: Primary data

217
0
20
40
60
80
100
15 17 13.3 10.7 7.7 10.3 9 9.716.7 18 15.3 12.7 9.7 12.3 11.7 11.3
68.3 6571.3
76.782.7
77.4 79.3 79
Perceptions on weavers on the performance of Co-operatives
Highly satisfied
Satisfied
Not Satisfied satisfied
FIGURE 5.8
Table No: No: V.17 illustrates the perceptions of the respondents on silk
co-operatives performance, with respect Clear Transactions 15 percent of the
respondents highly satisfied with the transparency in truncations, 16.7 percent
satisfied and 68.3 percent of the respondents were not satisfied, with respect
Payment in time 17 percent of the respondents highly satisfied with the payment
process, 18 percent satisfied and 65 percent of the respondents were not satisfied,
with respect to Cordial function 13.3 percent of the respondents highly satisfied with
the cordial functional relationship among the co-operative members and officials,
15.3 percent satisfied and 71.3 percent of the respondents were not satisfied, with
regard to Provision of subsidies 10.7 percent of the respondents highly satisfied
with the provision of subsidies , 12.7 percent satisfied and 76.7 percent of the

218
respondents were not satisfied, with respect toGood Market ambience 7.7 percent of
the respondents highly satisfied with the marketing facility available in the co-
operative, 9.7 percent satisfied and 82.7 percent of the respondents were not
satisfied, with respect to Loan arrangements 10.3 percent of the respondents highly
satisfied with the institutional loan facilities made available through co-operatives,
12.3 percent satisfied and 77.4 percent of the respondents were not satisfied, in
connection withSupply of Raw materials the 9 percent were highly satisfied,11.7
percent have satisfied and 79.3 percent of the respondents were not satisfied, and in
regard to Political Intervention in co-operative around 9 percent highly satisfied,
11.3 percent were not satisfied and the 79 percent were not satisfied with the
facilities, it could be inferred from the empirical findings that majority of the
respondents have not satisfied with the various activities of the co-operative
societies ,however, co-operative societies use to give minimum guarantee to the
weavers when compare with the private players, thus, it was apparent from the study
that the amenities were inadequate in the study area.
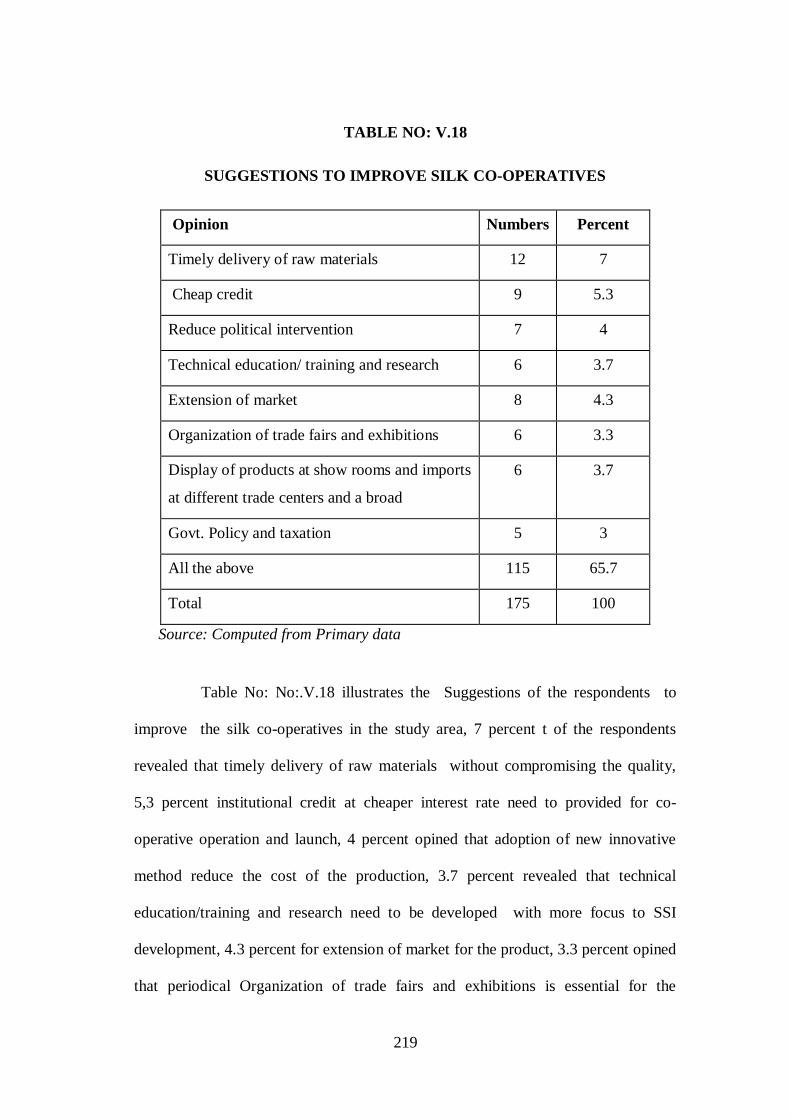
219
TABLE NO: V.18
SUGGESTIONS TO IMPROVE SILK CO-OPERATIVES
Opinion Numbers Percent
Timely delivery of raw materials 12 7
Cheap credit 9 5.3
Reduce political intervention 7 4
Technical education/ training and research 6 3.7
Extension of market 8 4.3
Organization of trade fairs and exhibitions 6 3.3
Display of products at show rooms and imports
at different trade centers and a broad
6 3.7
Govt. Policy and taxation 5 3
All the above 115 65.7
Total 175 100
Source: Computed from Primary data
Table No: No:.V.18 illustrates the Suggestions of the respondents to
improve the silk co-operatives in the study area, 7 percent t of the respondents
revealed that timely delivery of raw materials without compromising the quality,
5,3 percent institutional credit at cheaper interest rate need to provided for co-
operative operation and launch, 4 percent opined that adoption of new innovative
method reduce the cost of the production, 3.7 percent revealed that technical
education/training and research need to be developed with more focus to SSI
development, 4.3 percent for extension of market for the product, 3.3 percent opined
that periodical Organization of trade fairs and exhibitions is essential for the

220
development of silk co-operative, 3.7 percent opined that there is a need to Display
of products at show rooms and imports at different trade centers and a broader level,
3 percent of the respondents opined that Government taxation policy need to be
restructured in favour of silk co-operatives development,65.7 percent of the
respondents opined that all the above suggestions is essential for the development of
silk co-operatives , on the whole it could be inferred that the financial facilities,
marketing and the technical innovations need to be enhanced for the development
of silk co-operatives in the study area.
Hypotheses testing
Ho: There is no influence of business environment, Government policy
and the finance on the performance of the silk producing units output in the study
area.
TABLE NO: V. 19
MODEL SUMMARY
Model R R
Square
Adjusted
R Square
Std. Error
of the
Estimate
Durbin-
Watson
1 .678(a) 0.625 0.691 833.79 1.001
a. Predictors: (Constant)Business environment, Policy of the Govt,
Institutional Loan, Marketing
b. Dependent Variable: Output

221
TABLE NO: V. 20
ANOVA (B)
Mode Sum of
Squares
df Mean
Square
F Sig.
1 Regression 5663.8 167 1331.21 10.2 .002(a)
Residual 1211.1 133 675.4
Total 6874.9 300
a. Predictors: (Constant)Business environment, Policy of the Govt,
Institutional Loan, Marketing
b. Dependent Variable: Out
TABLE NO: V. 21
COEFFICIENTS(A)
Unstandardized
Coefficients
Standardized
Coefficients
t Sig.
B Std. Error Beta B Std. Error
Output 1.161 234.4 1.012 0.38
Business
environment
0.098 1.234 0.001 0.54 0.23
Policy of the
Govt
0.032 1.112 0.003 0.31 0.44
Institutional
Loan
0.083 0.871 0.012 0.61 0.55
Marketing 0.091 0.773 0.022 0.91 0.71

222
a. Predictors: (Constant)Business environment, ,Policy of the Govt,
Institutional Loan, Marketing
b. Dependent Variable: Output
Y= + x1+ x2+………….. xn
Output = 1.161 + (0.001-Busi-envion) + (0.003 - Policy of Govet) +
(0.012 - Ins loan) (0.23) (0.44) (0.55) + (0.022 - marketing) (0.71)
The Multivariate Regression was applied to find whether silk products
influenced by the business environment and government polices, The Regression
result shows that the calculated F value is 1.161 which is greater than the Table No:
No: value of 1.012 at 5 % level of significance. Since the calculated value is greater
than the Table No: No: value it is inferred that the business environment, govt policy
and financial variables have strong influence in determining the output of the silk
products in the study area. Hence the hypothesis is rejected
Ho: Quality and customer care factors didn’t influence the consumer
to prefer silk products from the co-operatives silk producers in the study area.
Logistic Regression is a technique used when the dependent variable is
dichotomous (0 or 1). Unlike OLS, the methods used to estimate the parameters
involve nonlinear approaches such as maximum likelihood. The logistic
specification is based on the Cumulative Normal Distribution. One of the more
useful aspects of logistic regression is that it outputs the probability of the event
which will fall between 0 and 1 (0% to 100%). Therefore, given a set of independent

223
variables, you could predict the probability of the event occurring using
specification. For this study, it has been attempted to study factors which might
influence the consumer preference The variable whether the Quality of work or
Customer care been identified as the outcome variable (dependent variable) where it
has been coded as 1 for ‘Yes’ and 0 ‘No’.
To study the factors which are likely to the following predictor variables
were identified and used in the logistic Regression Analysis:
TABLE NO :V. 22
MODEL FITTING
Model -2 Log Likelihood (-2LL) Chi-Square df Sig.
Intercept Only 59.02
Final 171.2 11.1 300 0
Source: Computed from primary data
The values given against ‘Intercept only’ and ‘Final’ are the initial and
final estimates of the log likelihood function of the model, which explains how well
the model fits the data. "Intercept Only" describes the initial estimates of the model
that does not control for any predictor variables and simply fits an intercept to
predict the outcome variable. The term "Final" describes the final estimates of the
model which includes the selected independent variables. This has been arrived at
through an iterative process that maximizes the log likelihood estimate outcome
variable. By including the predictor variables and maximizing the log likelihood of
the dependent variable, the "Final" model should improve upon the "Intercept Only"

224
model. This can be seen in the differences in the -2 Log Likelihood values
associated with the models. The difference between the ‘intial’ and ‘Final’
estimates of the -2LL show that there has been an improvement in the model. The
goodness of fit of the –2LL value is 186.62 which was used to test the goodness of
fit of the model using chi-square test. The chi-square value is 103.13, which is
significant at least at 1% level (given as 0.001 under the column ‘Sig.’). The ‘df’ is
the degrees of freedom of the Chi-Square distribution used to test the Chi-Sqare
statistic and is defined by the number of predictors in the model.
TABLE NO: V. 23
PSEUDO R-SQUARE
Cox and Snell .552
Nagelkerke .664
McFadden .541
Source: Computed from primary data
Link function: logit.
For binary logistic regressional data including eight explanatory variables
(silk quality, colour ,quality of zari, trendy, Cordial care of sales man, more display,
lower prices, discount,) the model prediction was done seven explanatory variables.
These variables were selected for model building and further validation of model.
Across-correlation matrix was prepare dinitially to see if the variables were highly
correlated to one another. Overall prediction efficiency of the variables was assessed
based on Nagelkerke - R2 and – Log Likelihood values. Influence of individual

225
variables including categorical variables was assessed using Wald statistics. Hosmer
and Leme show goodness-of-fittest (chisquaretest) and concordance analysis
(classification Table No: No:s) were done to understand the fit of the model
(Hosmer and Leme show, 1989).Sensitivity (percentage true positive or presence
correctly predicted) and specificity (percentage true negative or absence correctly
predicted) were calculated for each cut-off point (0.1to0.9) and best cut-off point
was chosen on the basis of optimum sensitivity and specificity. The cut-off level
would allow categorization of the probability value store present either below the
cut-off point or 1ifit is above the cut-off point. Logistic regression was done using
the selected variables and appropriate cut-off level and the probability of occurrence
was estimated for each of the species using the following formula.
Probability of event (or presence) =1/(1 –EXP–z)
where, Z= a + (b1 ´ X1)+ (b2 ´ X2)+ (b3 ´ X3)+ …….. (bk X k),
a =constant, b = coefficients and X = predictor variable.
There are several Pseudo R-Squares. It reveals the logit regression does
not have an R squared calculated in OLS regression. However, the Pseudo R-square
values are similar to the R square in OLS, but are not equivalent to OLS R squares.
These pseudo R squares are only rough estimates of how well the model fits the
data. From the above Table No: No: we can see that the R square values vary
between 0.541 to 0.664, which suggest that there is a moderate level of correlation
between the dependent and independent variables used in the study. The following
Table No: No: ---gives the estimates of the predictor variables used in the study.

226
• Silk Quality
• Colour ,
• Quality of zari
• Trendy
• Cordial care of sales man
• More display
• Lower prices
• Discount
TABLE NO: V. 24
LOGISTIC REGRESSION FOR CONSUMER PREFERENCE-
PARAMETER ESTIMATES
Variables Coefficient S.E. Wald df Sig. Exp(B)
Threshold
(Customer
Prefrence)
1.9269 9.0801 0.4509 1 0.007* 0.0009
Silk Quality 0.0054 0.0054 0.8586 1 0.002* 0.9054
Colour , 0.0036 0.0027 1.1484 1 0.003* 0.8964
Quality of zari 34.38 17.964 3.2967 1 0.005 0.0153
Trendy 9.1197 8.28 1.0917 1 0.071 1.3635
Cordial care of sales
man
41.3631 27.1665 2.0862 1 0.028 0.0729
More display 2.2536 0.8721 6.012 1 0.81 0.0738
Lower prices 0.0045 0.0036 0.6786 1 0.001** 0.0504
Discount 0.0036 0.0027 1.0539 1 0.004* 0.6624
(Link function: logistic)

227
* - Significant at 5% level
** - Significant at 1% level
NS :Not Significant
The results of the regression coefficients of the predictors are given under
the heading ‘Estimate’. The predicted probability of workers engagement can be
calculated using these coefficients (the first value under this column, the coefficient
for "Threshold" is the constant term in the model). For a given household, the
predicted probability of workers engagement be calculated as F (1.92+ 0.005*
Colour+0.003* Quality of Zari-1+………+0.004 ) Where F is the cumulative
distribution function of the standard normal. However, the coefficients cannot be
interpreted as we explain in OLS regression. It is explained in OLS that an unit
increase in predictor variable value will result in the corresponding the coefficient
times value increase in the dependent variable. But it is not so in Logistic
Regression. The increase in probability of outcome variable (here going for workers
engagement) for one-unit increase in a given predictor is dependent both on the
values of the other predictors and the starting value of the given predictors. For
example, if we hold all other predictors as constant at zero except age, then the
working hour one hour increase from say from 8 to 9 had a different effect than the
one year increase from 9 to 10. However, it could be understood from the regression
coefficients that, a positive coefficient will mean that an increase in the predictor
leads to an increase in the predicted probability. A negative coefficient means that
an increase in the predictor leads to a decrease in the predicted probability. Based on
this, from the above regression Table No: No: it could be seen that the predictors

228
silk quality, Colour, Quality of Zari, Lower price, More display, trendy and have
positive effect on dependent variable. That is, increase in these predictors will result
in increase in probability of going influence the work engagement through
enhancing the customer preference. Thus, the qualitative variables have strong
influence of customer preference.
H0: Financial distress of the co-operative silk producing units have not
influenced by the process of getting loan in the study area.
TABLE NO: V.25
MODEL SUMMARY
Model R R
Square
Adjusted
R Square
Std. Error of the
Estimate
Durbin-Watson
1 .991(a) .982 .968 1083.786 2.081
a. Predictors: (Constant),High loan outstanding , High interest, Loan
default, raw material price hike, wage hike
b. Dependent Variable: Loan availability

229
TABLE NO: V. 26
ANOVA (b)
Model Sum of Squares
Df Mean Square
F Sig.
1 Regression 5805.632 270 12571.954 18.78 .000(a)
Residual 1058.895 30 2104.889
Total 6864.527 300
a. Predictors: (Constant),High loan outstanding, High interest, Loan
default, raw material price hike, wage hike
b. Dependent Variable: Loan availability
TABLE NO: V. 27
COEFFICIENTS(C)
Unstandardized Coefficients
standardized Coefficients
t Sig.
B Std. Error Beta B Std. Error
Loan Availability
1.578 2475 1.008 0.073
High loan Outstanding
0.057 0.032 0.15 0.03 0.025
High interest 4.111 3.461 0.19 0.08 0.114
Loan default 1.836 0.682 0.76 0.56 0.023
Raw material price hike
3.058 4.26 0.41 0.42 0.071
Wage hike 7.707 60.02 0.31 0.81 0.26
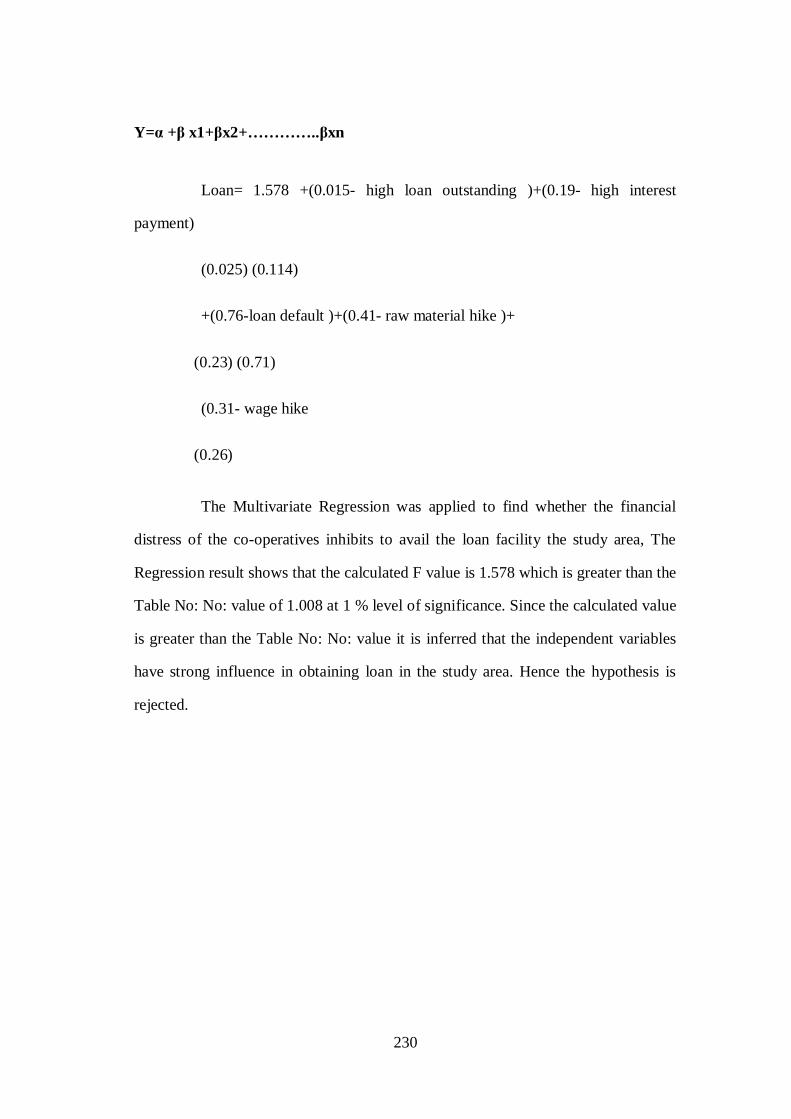
230
Y= + x1+ x2+………….. xn
Loan= 1.578 +(0.015- high loan outstanding )+(0.19- high interest
payment)
(0.025) (0.114)
+(0.76-loan default )+(0.41- raw material hike )+
(0.23) (0.71)
(0.31- wage hike
(0.26)
The Multivariate Regression was applied to find whether the financial
distress of the co-operatives inhibits to avail the loan facility the study area, The
Regression result shows that the calculated F value is 1.578 which is greater than the
Table No: No: value of 1.008 at 1 % level of significance. Since the calculated value
is greater than the Table No: No: value it is inferred that the independent variables
have strong influence in obtaining loan in the study area. Hence the hypothesis is
rejected.

231
CHAPTER VI
MAJOR FINDINGS, SUGGESTIONS AND CONCLUSION
Tamil Nadu has been occupying an important place in the silk handloom
industry in India and has been an integral element in the economic structure of the
state from time immemorial. The decline of co-operative silk handloom society due
to the non-availability of raw materials and competition from mill-made imported
textile products were among the other important factors that brought about the
decline of the industry. The study presents contemporary nuances of the industry
with a view to identifying the factors leading to its performance. So the study made
an attempt to make analysis of co-operatives silk producers in Kumbakonam since
the place is well known for Thirupuvanam silk sraees, It also attempts to focus on
aspects of the conditions of co-operative silk producers process, constraints and
challenges. The present study also gives broad indications of the likely consequence
of different policies implemented by the successive Governments. The findings of
this study have considerable relevance to run the industry on modern techniques at
all levels and improve the conditions of the handloom industries.

232
MAJOR FINDINGS OF THE STUDY
The findings of the study have been categorized into various segments viz
business profile, Overall performance of the co-operative silk producers,
disaggregated analysis of financial and sales of all the co-operative silk producers,
socio-economic conditions of the weavers of co-operative silk societies in the study
area.
OVERALL PERFORMANCE OF THE CO-OPERATIVES SILK
PRODUCERS IN KUMBAKONAM TALUK
No looms in silk producing
Around 39.8 percent of the looms owned and 60.2 percent were hired, it
could be inferred from the empirical verification that the no of looms hired was high
in co-operative silk producers.
Membership level of Silk co-operatives
During 2006 the average membership level were 1345 which has been
steadily declining gradually and in 2013 it was 812 with the decline of around 40
percent which implies that the membership position have been declined sharply, lack
of competence and the performance of silk weaving could be one of the important
criterion for the decline of membership but in the same line growth of private
players could be the important reasons for the membership deterioration in the study
period.

233
Average Cost of Production for piece
Around 55.6 percent of the respondents spent minimum of Rs.1600 and
58.9 percent of spent maximum 45000 per piece, around 11.3 percent of the
respondents spent minimum of Rs.400 and 35.3 percent of spent maximum 27000
per piece, with regards to Chemicals around 9.7 percent of the respondents spent
minimum of Rs.350 and 2.2 percent of spent maximum 2100 per piece, with regards
to Wages around 20.8 percent of the respondents spent minimum of Rs.750 and
2.7 percent of spent maximum 2100 per piece, with respect to other expenses
around 2.8 percent of the respondents spent minimum of Rs.600 and 0.8 percent of
spent maximum 600 per piece, with regard to total cost of production the co-
operatives spent minimum Rs.3600 and maximum Rs.76400.
Source for capital
Nearly 14.3 percent of silk producers put their deposit from members for
working capital in 2006 and same revealed for the year 2012 for the same category,
14.3 percent of the of the co-operatives silk producers borrowed reserve fund loan
from District central co-operative bank for the year 2006 and the same amount of
person borrowed for 2012 as well, 14.3 percent obtained trade credit from handloom
development corporation in 2006 whereas in 2012 they didn’t got the fund from the
said organization, 57.1 percent revealed that they utilized all the above sources for
their working capital and 71.4 percent for 2012
Average Profit margin silk producers acquire the margin of 10% for the
saree worth of Rs.3000, with respect to the worth between Rs 3001 to Rs 6000

234
private producers obtained the profit margin of 12% with respect to the saree worth
between Rs.6001 to Rs. 10,000 the silk producers obtained the profit margin of 15%
with regard to the worth between Rs.10001- Rs. 15000 the silk producers gained
20%, silk producers got 20% profit margin for the worth of the saree between
Rs.15000-Rs 20000, and with regard to the worth of the saree more than Rs.20000
the producers obtained the profit margin of 25%,
Value of sales
14.3 percent sold in the up to 10 lakhs and in 2012 around 42.9 percent
sold the products in the same category, during the year 2006 around 14.3 percent of
the silk producers sold between 10lakhs to 20lakhs whereas in 2012 around 14.3
percent were sold in same category with no variation, during the year 2006 around
42.9 percent of the silk producers sold between 21lakhs to 30lakhs whereas in 2012
around 28.6 percent were sold in same category with slight decline in the category,
during the year 2006 around 14.3 percent of the producers sold between 31lakhs to
40lakhs whereas in 2012 around 14.3 percent were sold in same category without
any changes, during the year 2006 silk producers sold more than 40 lakhs whereas
in 2012 none of them fall in this category
Profit pattern
None of the co-operative obtained gross profit were fall in category up to
2lakhs in 2006 which increased to 71.4 percent in 2012,with respect to net profit
28.6 percent fall in this category in 2006 which is increased to 85.7 percent in 2012,
around 14.3 percent of the gross profit and 42.9 percent of net profit of silk

235
producers were fall in category between 2lakhs to 3 lakhs in 2006 which decline
to 14.3 and 14.3 percent respectively in 2012, 42.9 percent of the gross profit and
14.3 percent of net profit of silk producers were fall in category between 3lakhs to
6 lakhs in 2006 which was declined to 14.3 and increased to 14.3 percent
respectively in 2012, around 28.6 percent of the gross profit and none net profit of
14.3 silk producers were fall in category between 6lakhs to 10 lakhs in 2006
which was deceased none for both gross and net profit in 2012.
Operational Expenditure
During the year 2006 around none of the silk producers spent up to
15k and 2012 remains the same status, during the year 2006 around 14.3 percent
of the producers spent between 15k to 25k whereas in 2012 nearly 14.3 percent
were spent in same category, during the year 2006 around 71.4 percent of the
producers spent between 15k to 25k whereas in 2012 nearly none spent in same
category, during the year 2006 around 14.3 percent of the producers spent
between 25k to 40k whereas in 2012 nearly 57.1 percent were spent in same
category, during the year 2006 none of the producers spent between 40k to 50k
whereas in 2012 nearly 28.6 percent were spent in same category.
Expenditure incurred for marketing
During the year 2006 around 14.3 percent of the silk producers spent
Rs.15,000 whereas in 2012 none spent in same category, during the year 2006
around 14.3 percent of the silk producers spent between 15,000 to 25,000
whereas in 2012 nearly 14.3 percent were spent in same category, during the year

236
2006 around 42.9 percent of the silk producers spent between 25k,000 to 30
whereas in 2012 nearly 14.3 percent were spent in same category, during the year
2006 around 28.6 percent of the silk producers spent between 35,00 to 50,book
whereas in 2012 nearly 42.9 percent were spent in same category, during the year
2006 none spent more than 50k whereas in 2012 around 28.6 percent were
spent in same category.
Cruxes of Disaggregated analysis of Co-operatives silk Producers
This section of the findings exemplifies the value of the Raw materials,
sales, sources of finance, operational and marketing expenditure and the
outstanding of loans of all the co-operative silk producers taken for the study.
Thirubuvabanm co-operative silk co-operative society
Sources of Capital
Nearly 10 crores 71 lakhs and 93 thousands have risen in 2006 which is
enhanced to 18 crores 26 lakhs and 32 thousands in 2012 with the hike of 70.4
percent.
Sales
Overall value of the silk products sole were 27 crores 24lakhs and 55
thousands which is increased to 41 crores 4lakhs and 57 thousand with the hike of
50.7 during the study period.

237
Value of Raw materials
Total raw material purchase for Thirubuvanam co-operative silk producer
was around 1 crore and 30 lakhs which is increased 2 crores and 53 lakhs in 2012
with the hike of 96.3 percent
Operational Expenditure
Value of the operational expenditure was 18 crores 78 lakhs and one
thousand which is increased to 28 crores 78 lakhs and 39 thousand with the hike of
53.3 during the study period.
Marketing Expenditure
Value of the marketing expenditure was 2 crores 80 lakhs and 52
thousands which is increased to 6 crores 9 lakhs and 48 thousand with the hike of
117.3 during the study period
Outstanding of Loans
Nearly 32 lakhs and 55 thousnads owe to bank in 2006 which is declined
to 12 lakhs and 12 thousands in 2012.
Cholan co-operative silk society
Sources of Capital
75 lakhs and 96 thousands have raised in 2006 which is enhanced to 1
crore and 68 thousands in 2012 with the hike of 32.5 percent.

238
Sales
Overall value of the silk products sole were 35 crores 41 lakhs and 91
thousands which is decreased to 24 crores 41 lakhs and 57 thousand with the
decline of 31.8 during the study period.
Value of Raw materials
Raw material purchase for Cholan co-operative silk producer was around
1 crore and 85 lakhs which is increased 2 crores and 60 thousands in 2012 with the
hike of 7.9 percent
Operational Expenditure
Value of the operational expenditure was 1 crore 32 lakhs and one
thousand which is increased to 1 crore 35 lakhs and 58 thousand with the hike of
2.8 during the study period
Marketing Expenditure
Value of the marketing expenditure was 2 crores 28 lakhs and 83
thousands which is increased to 5 crores 23 lakhs and 2 thousand with the hike of
129 percent during the study period
Outstanding of Loans
Nearly 1 crores 99 lakhs and 15 thousands fund owe to depositers in 2006
and which decreased to 1 crore 84 lakhs and 66 thousands in 2012 with the decline
of 7.3 percent.

239
Dharasuram Co-operative
Sources of Capital
Overall capital 32 lakhs and 75 thousands have raised in 2006 which is
enhanced to 33 lakhs and 88 thousands in 2012 with the hike of 3.5 percent.
Sales
Value of the silk products sole were 17 lakhs and 70 thousands which is
decreased to 12 lakhs and 25 thousand with the decline of 30.8 during the study
period.
Value of Raw materials
Total raw material purchase for Dharsaram co-operative silk producer was
around 2 lakhs and 88 thousands which is increased 17 lakhs and 66 thousands in
2012 with the hike of 513.4 percent.
Operational Expenditure
Value of the operational expenditure was 1 crore 5 lakhs and 10 thousand
which is increased to 91 lakhs and 45 thousand with the decline of 12.9 percent
during the study period.
Marketing Expenditure
Value of the marketing expenditure was 83 lakhs and 78 thousands which
is increased to 1 crore 54 lakhs and 17 thousand with the hike of 84.02 percent
during the study period.

240
Outstanding of Loans
Total outstanding was 3 crores and 4 lakhs and 49 thousands which was
increased to 3 crores 48 lakhs and 43 thousands in 2012 with the increase of 14.4
percent during the study period
Thiruvalluvar Co-operative Silk Societies
Sources of Capital
Overall capital 52 lakhs and 21 thousands have raised in 2006 which is
enhanced to 56 lakhs and 54 thousands in 2012 with the hike of 8.3 percent,
Sales
Value of the silk products sole were 34 lakhs and 39 thousands which is
decreased to 1 crore 2 lakhs and 34 thousand with the increase of 197.6 during the
study period
Value of Raw materials
Total raw material purchase for Thiruvalluvar co-operative silk producer
was around 16 lakhs and 73 thousands which is increased 18 lakhs and 56 thousands
in 2012 with the hike of 10.9 percent.
Operational Expenditure
Value of the operational expenditure was 25 lakhs and 8 thousand which
is increased to 56 lakhs and 55 thousand with the escalation of 125.5 percent
during the study period.

241
Marketing Expenditure
Value of the marketing expenditure was 1 crore 72 lakhs and 59
thousands which is increased to 4 crore 35 lakhs and 16 thousand with the hike of
152.1 percent during the study period.
Outstanding of Loans
Total outstanding was 1 crore and 55 lakhs and 34 thousands which was
increased to 2 crores 93 lakhs and 30 thousands in 2012 with the increase of 88.8
percent during the study period.
Kalaivanar co-operative silk society
Sources of Capital
Overall capital 8 lakhs and 8 thousands have raised in 2006 which is
declined to 7 lakhs and 40 thousands in 2012 with the decline of 8.3 percent.
Sales
Overall value of the silk products sole were 6 lakhs and 40 thousands
which is decreased to 6 lakhs and 38 thousand with the decrease of 0.2 during the
study period
Value of Raw materials
Outset total raw material purchase for Kalaivanar co-operative silk
producer was around 24 thousands which is increased 2 lakhs and 68 thousands in
2012 with the hike of 997.2 percent.

242
Operational Expenditure
Value of the operational expenditure was 9 lakhs and 11 thousand which
is decreased to 8 lakhs and 30 thousand with the decrease of 8.9 percent during
the study perio
Marketing Expenditure
Overall value of the marketing expenditure was 2 lakhs and 34 thousands
which is increased to 4 lakhs and 9 thousand with the hike of 75.1 percent during
the study period.
Outstanding of Loans
Total outstanding was 75 lakhs and 71 thousands which was increased to
85 lakhs and 2 thousands in 2012 with the increase of 12.3 percent during the study
period.
Super silk co-operative society
Sources of Capital
Overall capital 2 lakhs and 94 thousands in 2006 as well as in 2012 share
of the government and depositors fund have neither increased nor decreased during
the study period.

243
Sales
Overall value of the silk products sole were 7 lakhs and 43 thousands
which is increased to 10 lakhs and 76 thousand with the increase of 44.8 during the
study period.
Value of Raw materials
Total raw material purchase for Super co-operative silk producer was
around 1 lakh and 66 thousand which is increased 1lakh and 76 thousands in 2012
with the hike of 5.8 percent.
Marketing Expenditure
Value of the marketing expenditure was 2 lakhs and 6 thousands which is
increased to 3 lakhs and 67 thousand with the hike of 78 percent during the study
period.
Outstanding of Loans
Total outstanding was 45 lakhs and 16 thousands which was increased to
64 lakhs and 45 thousands in 2012 with the increase of 42.7 percent during the study
period.
Kamarajar co-operative silk society
Sources of Capital
To overall capital 3 lakhs and 25 thousands in 2006 as well as in 2012
share of the government and depositors fund have neither increased nor decreased
during the study period.

244
Value of Raw materials
Outset total raw material purchase for Kamarajar co-operative silk
producer was around 31 thousand which is increased 1lakh and 34 thousands in
2012 with the hike of 326.1 percent.
Sales
Overall value of the silk products sole was 6 lakhs and 68 thousands
which is increased to 9 lakhs and 98 thousand with the increase of 49.3 during the
study period.
Marketing Expenditure
Overall value of the marketing expenditure was 1lakh and 25 thousands
which is increased to 2 lakhs and 24 thousand with the hike of 79.6 percent during
the study period.
Operational Expenditure
Overall value of the operational expenditure was 25 lakhs and 59
thousand which is increased to 28 lakhs and 53 thousand with the increase of 11.5
percent during the study period.
Outstanding of Loans
Total outstanding was 23 lakhs and 50 thousands which was increased to
60 lakhs and 75 thousands in 2012 with the increase of 158.5 percent during the
study period.

245
Socio-economic conditions of Weavers
Gender wise distribution of the Respondents
In the study 69.7 percent of the respondents constitutes male and 30.3
percent of the respondents were female.
Age wise distribution of the Respondents
Nearly 11.3 percent of the respondents were the age group up to 30;
nearly 16.3 percent of them were in the age group between 31-40 years. 34 percent
of them were in the age group of 41-50 years, 25.3 percent of them were in the age
group of 51-60 years and 13 percent were lies in above 60 years category.
Educational status of the Respondents
Nearly 56 percent of the respondents were got the education up to primary
level, 32 percent of the respondents have completed high school education, 5.5
percent and 3 percent of the respondents have studied HSc and degree
respectively,3.5 got the diploma in various disciplines with regard to the education
pattern of the of the respondents it was observed that significantly major chunk of
the respondents has got education up to S.S.L.C around 86 percent of the
respondents were constitutes under this category.
Income Pattern of House holds
Around 50.3 percent of the respondents annual income is less than
60,000, nearly 41 percent of the respondents income range from 60001 to 90,000, 6

246
percent of the respondents income constitutes from 90,001 to 1,20,000, and 3
percent of the respondents annual income is above 120000 , nearly 91 % of the
respondents annual income were below 90,000 which implies that the women
weavers were get less income which had repercussions on poverty and purchasing
power of the weavers in the study area.
Household Expenditure
Nearly 70.3 percent of the respondents were spend on procurement of
food and non-food items up to 10000, 8.3 percent of the respondents spends between
10001-20000, 10.3 percent of the respondents spends from the slab between 20001-
30000, 3 percent of the respondents spend between 30001-40000, 2 percent of the of
the respondents spends from 40001-50000, 2 percent of the of the respondents
spends from 50001-60000, and 3 percent of the respondents spends 60,000 and
above per annum.
No of years of experience
Around 13.3 percent of the respondents had experience for last five years,
26.3 percent got experience between 6 yrs to 10 yrs, 34 percent run the company
between 11yrs to 15 yrs, 13.7 percent got the between 16 yrs to 20 yrs, 12.7 percent
of the respondents had experience for more than 20 years, majority of the
respondents have got experience more than 15years, around 60 percent of the
respondents falls in the category.
247
Opinion on employment and Wage
Around 90.4 percent of the respondents have told that they haven’t got the
adequate employment to meet their minimum subsistence level, only 9.6 workers
have told that they use to get adequate employment, it could be quite strange from
the above table but people have told that the employment given to them is not
adequately support them to lead the minimum standard of living, with regard to
income the income level generated through the work, 88.1 percent of the
respondents have told that they don’t get the adequate income out of the weaving
work, they are all very concern about the increasing prices for the essential
commodities and also felt regret that their income is not increase to that level to
meet the expenditure, 11.9 percent of the respondents have told that they got the
adequate income from the work.
Influence of work environment on disease
Around 69.3 percent of the respondents opined that the work environment
caused headache,30.7 percent of the respondents opined no for the same,62.3
percent of the respondents opined that the work environment caused anxiety
disorder,37.7 percent of the respondents revealed it didn’t caused, 66 percent of the
respondents opined that the work environment caused injuries, 34 percent of the
respondents opined no for the same,66.7 percent of the respondents opined that the
work environment caused skin rashes,33.3 percent of the respondents didn’t accept
the statement,61.7 percent of the respondents opined that the work environment
caused ulcers,38.3 percent of the respondents opined no for the same,70 percent of

248
the respondents opined that the work environment caused dust allergy problems,30
percent revealed no for the assertion.
Reasons for failure of funds management of co-operatives
With regard to deliberate diversion of funds 29.7 percent of the
respondents strongly agree the statement, 32.7 percent agreed, with regard to Poor
collections of funds 34 percent of the respondents strongly agree the statement,
39.7 percent agreed, with respect to Unplanned payments to creditors 30.3 percent
of the respondents strongly agree the statement, 37.3 percent agreed, with respect to
High Inventory 30 percent didn’t agreed the statement and 25.3 percent strongly
disagreed the statement, with respect to Unproductive expenditure 36 percent of
the respondents strongly agree the statement, 37.7 percent agreed, with respect to
Delay in Sanction of loans 38.3 percent of the respondents strongly agree the
statement, 43.7 percent agreed, with respect to Delay in sanction of working
capital limits by bank 36.3 percent of the respondents strongly agree the statement,
46.7 percent agreed, with regard to Delay in implementation of project 32.7
percent of the respondents strongly agree the statement, 40 percent agreed.
Perceptions on weavers on the performance of Co-operatives
With respect Clear Transactions 15 percent of the respondents highly
satisfied with the transparency in transactions, 16.7 percent satisfied and 68.3
percent of the respondents were not satisfied, with respect Payment in time 17
percent of the respondents highly satisfied with the payment process, 18 percent
satisfied and 65 percent of the respondents were not satisfied, with respect to

249
Cordial function 13.3 percent of the respondents highly satisfied with the cordial
functional relationship among the co-operative members and officials, 15.3 percent
satisfied and 71.3 percent of the respondents were not satisfied, with regard to
Provision of subsidies 10.7 percent of the respondents highly satisfied with the
provision of subsidies , 12.7 percent satisfied and 76.7 percent of the respondents
were not satisfied, with respect to Good Market ambience 7.7 percent of the
respondents highly satisfied with the marketing facility available in the co-operative,
9.7 percent satisfied and 82.7 percent of the respondents were not satisfied, with
respect to Loan arrangements 10.3 percent of the respondents highly satisfied with
the institutional loan facilities made available through co-operatives, 12.3 percent
satisfied and 77.4 percent of the respondents were not satisfied, in connection with
Supply of Raw materials the 9 percent were highly satisfied,11.7 percent have
satisfied and 79.3 percent of the respondents were not satisfied, and in regard to
Political Intervention in co-operative around 9 percent highly satisfied, 11.3 percent
were not satisfied and the 79 percent were not satisfied with the facilities, it could be
inferred from the empirical findings that majority of the respondents have not
satisfied with the various activities of the co-operative societies ,however, co-
operative societies use to give minimum guarantee to the weavers when compare
with the private players, thus, it was apparent from the study that the amenities were
inadequate in the study area.
Suggestions to improve silk co-operatives performance
7 percent of the weaver respondents revealed that timely delivery of raw
materials without compromising the quality, 5,3 percent institutional credit at

250
cheaper interest rate need to provided for co-operative operation and launch, 4
percent opined that adoption of new innovative method reduce the cost of the
production, 3.7 percent revealed that technical education/training and research need
to be developed with more focus to SSI development, 4.3 percent for extension of
market for the product, 3.3 percent opined that periodical Organization of trade fairs
and exhibitions is essential for the development of silk co-operative, 3.7 percent
opined that there is a need to Display of products at show rooms and imports at
different trade centers and a broader level, 3 percent of the respondents opined that
Government taxation policy need to be restructured in favour of silk co-operatives
development, 65.7 percent of the respondents opined that all the above suggestions
is essential for the development of silk co-operatives
Syntheses of constraints faced by the stakeholders in Silk handloom industries
in the study area
The Problem of Wages
The most crucial problem on labour wages raised due to lesser wage rate,
the silk producers are unable to maintain substantial business but it inevitable labour
need to be acknowledged with their work, it would be suggested that fixing the wage
rate may be increased by the societies for their betterment.
The Problem Lack of Credit Facilities
The most penetrating problem that is frequently experienced by silk
producers of the place of selected study area is the lack of credit facilities it is found
out from the analysis, it’s suggested that the seven co-operative silk societies at
kumbakonam Taluk may attempt tie-up with the bankers and arrange the credit
facilities.

251
Problem of Raw Material Shortage
Another important problem that is again met with the poor silk producers
is the shortage of raw-materials. It is found out that the regular employment and
production of silk handloom cloths are frequently affected with the shortage of raw-
materials such as yarn, dyes, chemicals and loom breakages. This creates actually a
very great lag to the silk producers not only in terms of discontinuing in production.
The Problem of Marketing of Handloom Products
This is very frequency expedience problem of silk producers in the study
area. This is because of the fact that the quality of the selected silk products is
always found to be relatively lower attraction in the cloth market when compared to
the rest of the cloth of Power Loom and the Mill Sector regain, it is also found out
that the marketing condition is very poor and highly in certain for the silk sarees
because of the factors such as high cost of production and low productivity which
are often hampering fair prices to the handloom products.
The Problem of Low Economic Status
A very important but serious handloom weaver problem that quite often
cited by this poor to silk producers is the low economic status which is often to these
people in the community. Even though few people are affluent but the in general the
sauratra people engaging in silk production engulfed with lot of indebtedness and
relatively lower economic status, When we talk in terms of a great social concept of
Economic Development with social principle, it is seen that the social status appears
sound but the Economic status is very poor and low in the study area. The usual yard
252
stick which is followed to measure out the economic status of any people in the
community, occupation and the community, occupation and the level of income that
is generally gained by a person when we measure the silk producers with the above
mentioned yardstick, it is clearly found out that by all means the silk producers have
certainly in lower economic status.
The Problem of Stock Piling of Handloom Products
Another long felt and yet another vital handloom weaver welfare problem
is stock piling problem of handloom products. The silk producers of the study area
are very often affected by the stock piling problem for fairly a long period of time.
Only now the Government of Tamil Nadu has taken effort to rectify this grave
problem to a very great extent. Therefore, this problem very seriously affects their
regular employment opportunities and income conditions, especially in the long
period. So, silk producers may be thrown out of job opportunities, even now and
then. This will aggravate their existing high degree of poverty and misery in the
study area.
The Problem of Political Intervention
The last but one identified problem by the silk producers of the study area
especially in the co-operatives is frequent intervention of political parties in the
regular functioning of handloom industry. This is often complained by the poor silk
producers that their ordinary political and economic conditions are very often
disturbed by the Statesmen in the study area. Any social or economic advancement
is made by these political people with great caution and political advantage.

253
Therefore many social and economic policies which will favour the weaving
population quite often seem to be in an uncompleted form. It is the fact to see in any
Government of „Eastern Block Countries that each and every „Economic and social
Policies of the Government are strictly based on „working the vote Banks
principle . But they do not know that this political policy very seriously affects the
real interest of poor communities and their participation in the co-operatives have
nullify the interest of the silk weavers and the industries in the study area.
Policy Suggestions
Silk industries is an age-old traditional industry beset with multi-furious
problems. The industry, thus, requires a multi-pronged approach to infuse life and
sustain its development. Industry is providing one of the most basic needs of people
and holds importance; maintaining sustained growth for improving living standards
of the weaver and customers. An attempt has been made in this section to offer a few
suggestions for improving the plight of silk industries encompassing the interest of
all the stakeholders involved in the silk production.
There is a need to increase the variety of products by focusing on
designs and modernize the dying and processing activities in the
sector to increase the share of cloth production by the sector in the
total cloth production of the country.
For protecting the silk producers from the encroachment on their
livelihood, the Government of India shall strictly implement the
Reservation Act 1985 by placing the reserved items of sector in the
IX Schedule of Indian Constitution. The Government shall innovate

254
some new product ranges which are so far untouched by power
looms. The Government also shall regulate the production of hank
yarn by the spinning mills meant to be supplied to sector.
Competition from power looms and mill sectors is obviously a
major threat. This can be countered if the sector produces high
value, and distinctive products for foreign market.
The supply of yarn is another chronic problem faced by the
industry. There is a necessity to ensure adequate and smooth
supply. Further, intermediaries present in the yarn trade should be
eliminated. There is also a requirement for expansion and
strengthening of the co-operative coverage and more spinning mills
should be set up in the state to reduce heavy dependence from other
States/Centres.
According to the Hank Yarn Obligation Order, the spinning mills
have to produce 50 per cent of yarn in the form of hanks for
ensuring adequate supply to sector. This order should be strictly
implemented.
In order to ensure adequate and regular supply of yarn, the
Government, Tamil Nadu shall establish yarn depots or yarn banks
at the prominent centers of Tamil Nadu or within clusters.
Increasing the productivity of the sector is also essential to bring
down the average cost of production. Mechanisms must be
developed for reducing the cost of activities. A Working Group
may be constituted by the Government of India/Tamil Nadu with
qualified Cost Accountants to examine the cost structure of
products and make suitable recommendations.

255
Weavers are using traditional type of pit looms that are designed to
produce only certain varieties of fabrics. Thus, there must be focus
on technology in favour of improved production methods. The
Government also should provide training to enable weavers to lean
to use modern looms and technology to produce quality products
and increase productivity per loom.
Weavers. Service Centres should conduct dyeing demonstration-
cum- Design Exhibitions with a view to bringing awareness among
weavers and dyers of that area on the importance of dyeing to
improve the quality of the product. These centers shall be directed
extend help to all types of weavers.
Co-operatives are facing the problem of periodical accumulation of
finished goods. The Government shall arrange for an organized and
assured marketing facility for the development of co-operatives.
For this purpose, the State Government may continue the policy of
financing Tamil Nadu Department to procure stocks from the
Primary Co-operative Societies on cash payment basis, than on
credit.
Instead of entirely depending on the apex society for marketing, the
primary co-operative societies may also adopt a multi-pronged
strategy for marketing their products through local sales,
participation in exhibitions and sales to be made through Non-
Government Organisations.
The Government shall take necessary measures to reorganize the
defunct co-operative societies. If necessary, it has to initiate
criminal proceedings against those responsible for mismanagement.

256
The industry till now depended mainly on private sources or
moneylenders for its credit requirements. A beginning was made to
make available credit facility to the industry on an institutional
basis. Through the introduction of the RBI schemes for financing
the weavers. Co-operative societies. This should be pursued
vigorously.
The Government should provide financial assistance to the silk
producers by way of loans through Artisan Credit Cards at nominal
rate of interest i.e. 3 per cent and recover the loans in flexible
installments.
Insurance, Gratuity and Pension schemes must be extended to the
silk weavers also.
The Government should also devise a mechanism to meet
consumption needs and social obligations of weavers. Lest, they
should fall into a debt trap of money-lenders.
The Government has been organizing textile parks so far. These
parks are meant to serve all types of mills. Instead, the government
may establish Parks. Exclusively for sector.
The Government deserves all appreciation for designing the scheme
of supplying yarn at the Mill Gate Price. But the supply is far short
of the requirement. There are also complaints that the cost of the
yarn supplied through this scheme is much higher than the
prevailing market price.
This needs to be corrected. Further, other inputs like dyes and
chemicals also need to be covered under the scheme, since price
fluctuations are considerable for these items also.

257
There is also a need for establishing more Weavers. Service Centres
country with a weaving population of 65 lakh persons, 25 WSCs is
too small a number. It would be in the fitness of things to recognize
Mandal Headquarters for establishing WSCs (one for each Mandal)
at least in those districts having high concentration of weaving
population.
Capacity Building in Sector through Training and Technology
Interventions need to be given, with an objective of increasing the
productivity and earning capacity of the weavers. All independent
weavers, weavers working for co-operative societies, SHGs, Master
Weavers, NGOs are eligible for availing benefits under this
scheme. It proved very helpful to all categories of workers.
All the more, it is evident from the study that the Central
Government only appears to be the sole initiator. Unless the State
Governments at the grassroots level take interest, it becomes
difficult to make programmes successful.
The Ministry of Textiles has initiated the development of Export
Zones (HEZ) at various clusters in India to create supply hubs for
the export market with an upgraded infrastructure and trained
weavers. This needs to gain further momentum.
From time to time, the Government of India has been formulating
various National Textile Policies. Instead of focusing on Textile
Policies, the Government of India should concentrate on the
formulation of National Policy to facilitate weavers to meet the
challenges of global environment.
258
The Government should also introduce separate women welfare
schemes. For women entrepreneurs, weavers/workers, since more
women were engaged in the sector.
Scope for further studies
Socio Economic conditions of the handloom weavers could be
important area need to be probed
Government Handloom policies in the new economic policy regime
is an another vital area need introspection
Transition of clothing pattern and the silk sarees consumption could
be an another area which deserved assessment